Embed Size (px)
Citation preview
THE PRIMARY STRUCTURE OF PROTEINS OF THE PENTAXIN FAMILY
by
Jacqueline Anne Taylor
A dissertation submitted to the University of London in candidature for the degree of Doctor of Philosophy
Department of Biochemistry Imperial College South Kensington
July 1983 London SW7 2AZ
(ii)
ABSTRACT
The primary structure of proteins of the 1 Pentaxin' family, namely the C-reactive protein (CRP) and the serum amyloid P component (SAP), were investigated to provide an insight into the evolutionary relationship between these closely related proteins and also to help understand the different ligand binding capacities observed for the CRPs and SAps; for phosphoryl choline and agarose respectively. Valuable experience in the induction and isolation of a pentaxin was obtained in the injection of 2% (w/v) AgNO^ solution into the animals and the subsequent-isolation of the protein from the acute phase serum using the protein's affinity for agarose. Laurell rocket Immunoelectrophoresis was used to characterise and quantify the isolated protein.
Preliminary characterisation of the pentaxins involved polyacrylamide gel electrophoresis, dansylation and amino acid analysis. It was found that an elevated temperature of 130° was essential to achieve efficient hydrolysis of the peptide bonds for amino acid analysis. The analysis of carbo hydrate moieties was also undertaken.
Specific chemical and enzymatic cleavages were used to generate peptides, the majority of which were separated using molecular exclusion and reverse-phase high performance liquid chromatography (HPLC). Time courses performed for each cleavage helped ascertain the best conditions for these reactions. The peptides generated from these cleavages were sequenced using an automated liquid phase sequenator. The phenylthiohydantoin derivatives of the amino acid residues obtained were characterised and quantified using reverse phase HPLC systems involving either acetonitrile or methanol..
During the preliminary investigations of the pentaxins
(ill)
it was observed that the majority of these molecules possessed a blocked amino terminal residue, thus rendering automated liquid phase sequencing of the protein impossible. To investigate the nature of the amino terminal blocking group of the murine SAP and the rat CRP electron impact mass spectrometry (MS) was used. MS was instrumental in determining the sequence of the N-terminal peptide of murine SAP and also in the elucidation of the carbohydrate moiety of murine SAP and the plaice pentaxins. A tryptic digest of murine SAP was subjected to fast atom bombardment MS to help confirm and also to resolve several discrepancies which arose during the auto-mated sequencing of this molecule.
(iv) Preface
I should like to take this opportunity to thank my supervisor, Dr. Chris Bruton of Imperial College, South Kensington, London SW7, for his guidance and helpful comments throughout this research study.
Sincere thanks are also due to Drs. Mark Pepys and Marilyn Baltz of the Immunological Medicine Unit, Department of Medicine, Royal Postgraduate Medical School, London W12, for the generous gifts of the pentaxins and for their encouragement and support.
Grateful thanks are extended to: Dr. Anne Dell of Imperial College, South Kensington,
London SW7, for her help and encouragement, and for teaching me techniques involved in peptide and protein sequencing and investigation into carbohydrate moieties using mass spectrometry.
Dr. Jacqueline Anderson and Professor John Mole, UMMC, Worcester, Ma. 01605, USA, for enabling me to gain valuable experience in automated amino acid sequencing.
Mr. Dave Featherbe for his expertise and help with amino acid analyses and Dr. Minnie Rangarajan, Mr. Kevin Cope, Mr. Ian Blench and Dr. Rudolph Shipolini for useful discussion; all of Imperial College, South Kensington, London SW7.
Professor John Clamp of Department of Medicine, Bristol Royal Infirmary, Bristol, for the analysis of carbohydrate. *
Mr. Glyn Millhouse of Imperial College, South Kensington, London SW7, for providing an excellent photographic service.
( v )
Abbreviations
A Absorbance reading at X nm x BSAP Bovine serum amyloid P-component CRP C-reactive protein DCRP Dog C-reactive protein DMSO Dimethyl sulphoxide DMSO/HBr Dimethyl sulphoxide/hydrobromic acid DNS-C1 Dansyl chloride DNS-NH2 Dansyl ammonia DNS-OH Dansyl sulphonic acid DNS-R Dansyl Arg DNS-RR Dansyl Arg-Arg EDTA Ethylenediaminetetra-acetic acid EIMS Electron impact mass spectrometry E:S Enzyme : substrate FABMS Fast atom bombardment mass spectrometry HCRP Human C-reactive protein HPLC High pressure liquid chromatography HSAP Human serum amyloid P-component LCRP Lumpsucker C-reactive protein Milli Q water Distilled water purified using the Super
TM Q system (Millipore, Harrow, Middx.)
MSAP Murine serum amyloid P-component PAGE Polyacrylaminde gel electrophoresis PAS Periodic acid - Schiffs reagent PCA Pyrrolidone carboxylic acid PCRP Plaice C-reactive protein POPOP 1,4,bis(2-(5-phenyloxazolylbenzene)) PPO 2,5,diphenyloxazole:- scintillator PSAP Plaice serum amyloid P-component PTH Phenylthiohydantoin
(vi)
RCRP Rat C-reactive protein SAP Serum amyloid P-component SDS-PAGE Sodium dodecyl sulphate - polyacrylamide gel
electrophoresis TEMED Tetramethyl-ethylene-diamine Tris Tris (hydroxymethyl) aminoethane TSC Tris/saline/calcium buffer; see Appendix B(ii) TSE Tris/saline/EDTA buffer; see Appendix B(iii) UMMC University of Massachusetts Medical Centre
All other abbreviations used have their usual meaning. The temperatures used refer to degrees centigrade.
Amino acid nomenclature The single letter code for amino acids is used throughout
(Dayhoff et al, 1976). These abbreviations conform to those suggested by the IUPAC-IUB Commission of biochemical nomenclature (1968) .
(vii)
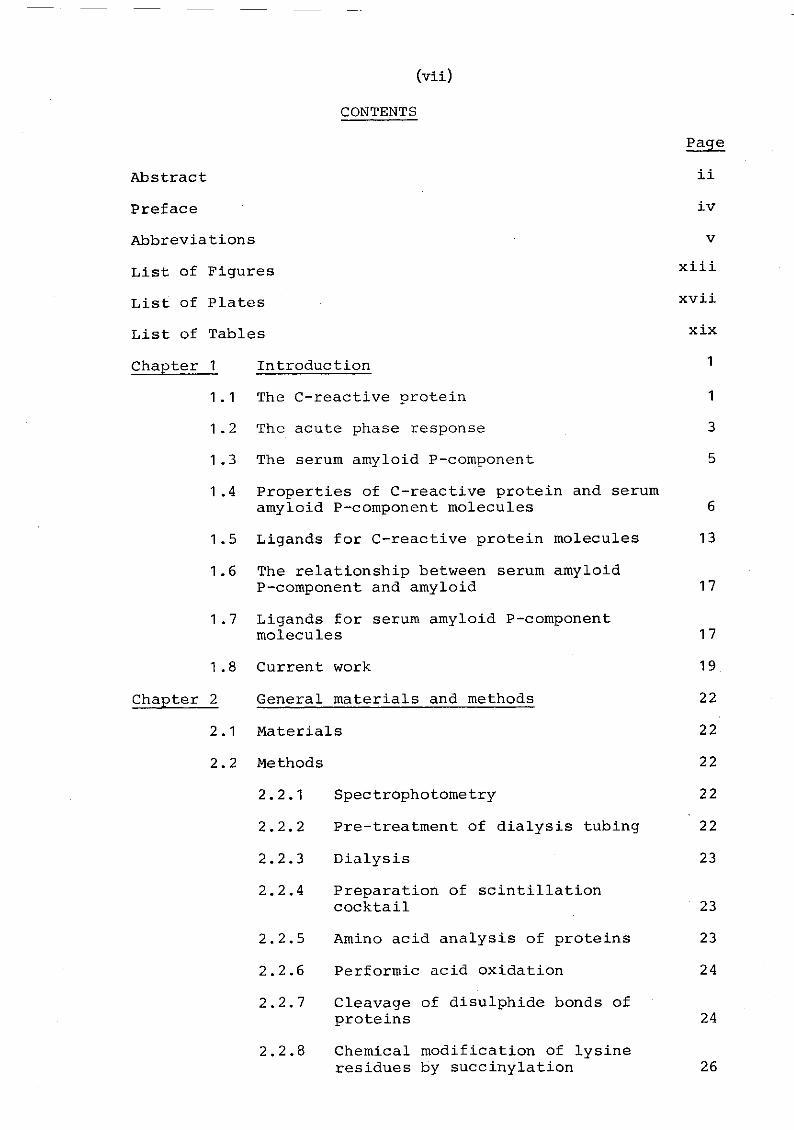
CONTENTS Page
Abstract ii Preface iv Abbreviations v List of Figures x n i List of Plates x v i i
List of Tables x i x
Chapter 1 Introduction 1 1.1 The C-reactive protein 1 1.2 The acute phase response 3 1.3 The serum amyloid P-component 5 1.4 Properties of C-reactive protein and serum
amyloid P-component molecules 6 1.5 Ligands for C-reactive protein molecules 13 1.6 The relationship between serum amyloid
P-component and amyloid 17 1.7 Ligands for serum amyloid P-component
molecules 17 1.8 Current work 19
Chapter 2 General materials and methods 22 2.1 Materials 22 2.2 Methods 22
2.2.1 Spectrophotometry 22 2.2.2 Pre-treatment of dialysis tubing 22 2.2.3 Dialysis 23 2.2.4 Preparation of scintillation
cocktail 23 2.2.5 Amino acid analysis of proteins 23 2.2.6 Performic acid oxidation 24 2.2.7 Cleavage of disulphide bonds of
proteins 24 2.2.8 Chemical modification of lysine
residues by succinylation 26
(viii) Page
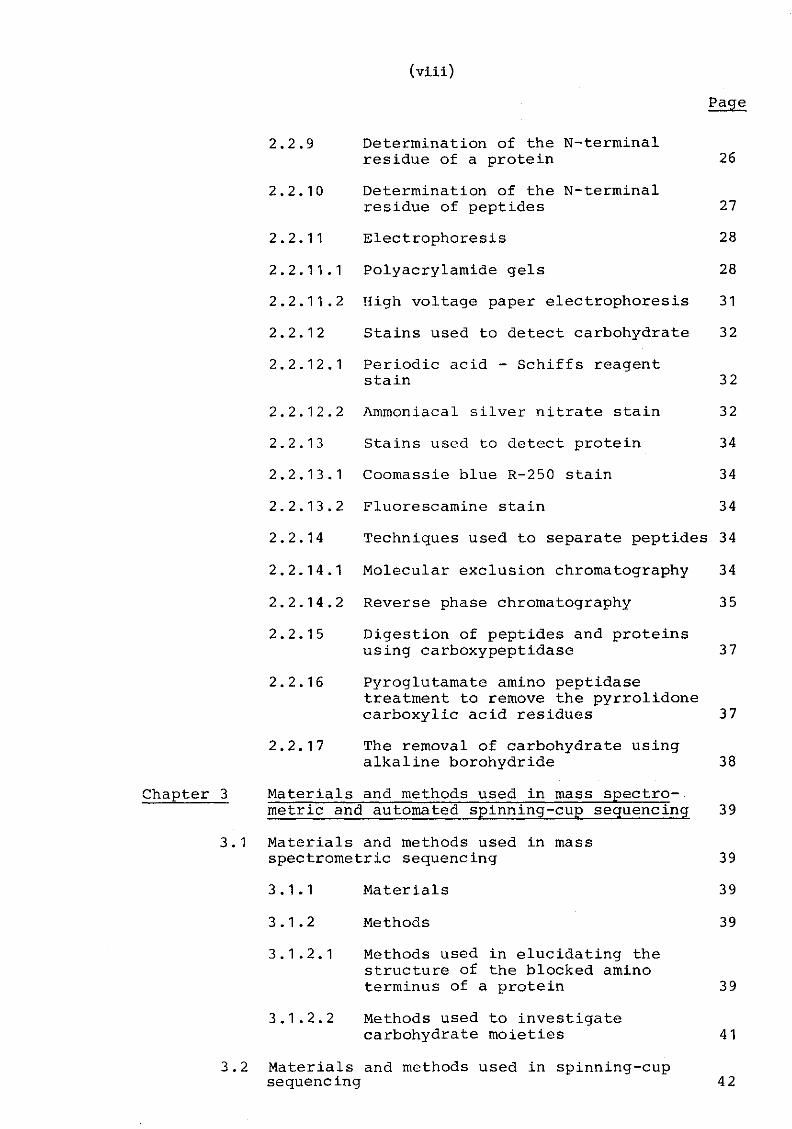
2.2.9 Determination of the N-terminal residue of a protein 26
2.2.10 Determination of the N-terminal residue of peptides 27
2.2.11 Electrophoresis 28 2.2.11.1 Polyacrylamide gels 28 2.2.11.2 High voltage paper electrophoresis 31 2.2.12 Stains used to detect carbohydrate 3 2 2.2.12.1 Periodic acid - Schiffs reagent
stain 32 2.2.12.2 Ammoniacal silver nitrate stain 32 2.2.13 Stains used to detect protein 34 2.2.13.1 Coomassie blue R-250 stain 34 2.2.13.2 Fluorescamine stain 34 2.2.14 Techniques used to separate peptides 34 2.2.14.1 Molecular exclusion chromatography 34 2.2.14.2 Reverse phase chromatography 3 5 2.2.15 Digestion of peptides and proteins
using carboxypeptidase 37 2.2.16 Pyroglutamate amino peptidase
treatment to remove the pyrrolidone carboxylic acid residues 37
2.2.17 The removal of carbohydrate using alkaline borohydride 38
Chapter 3 Materials and methods used in mass spectro-metric and automated spinning-cup sequencing 39
3.1 Materials and methods used in mass spectrometric sequencing 39 3.1.1 Materials 39 3.1.2 Methods 39 3.1.2.1 Methods used in elucidating the
structure of the blocked amino terminus of a protein 39
3.1.2.2 Methods used to investigate carbohydrate moieties 41
3.2 Materials and methods used in spinning-cup sequencing 4 2
(ix) Page
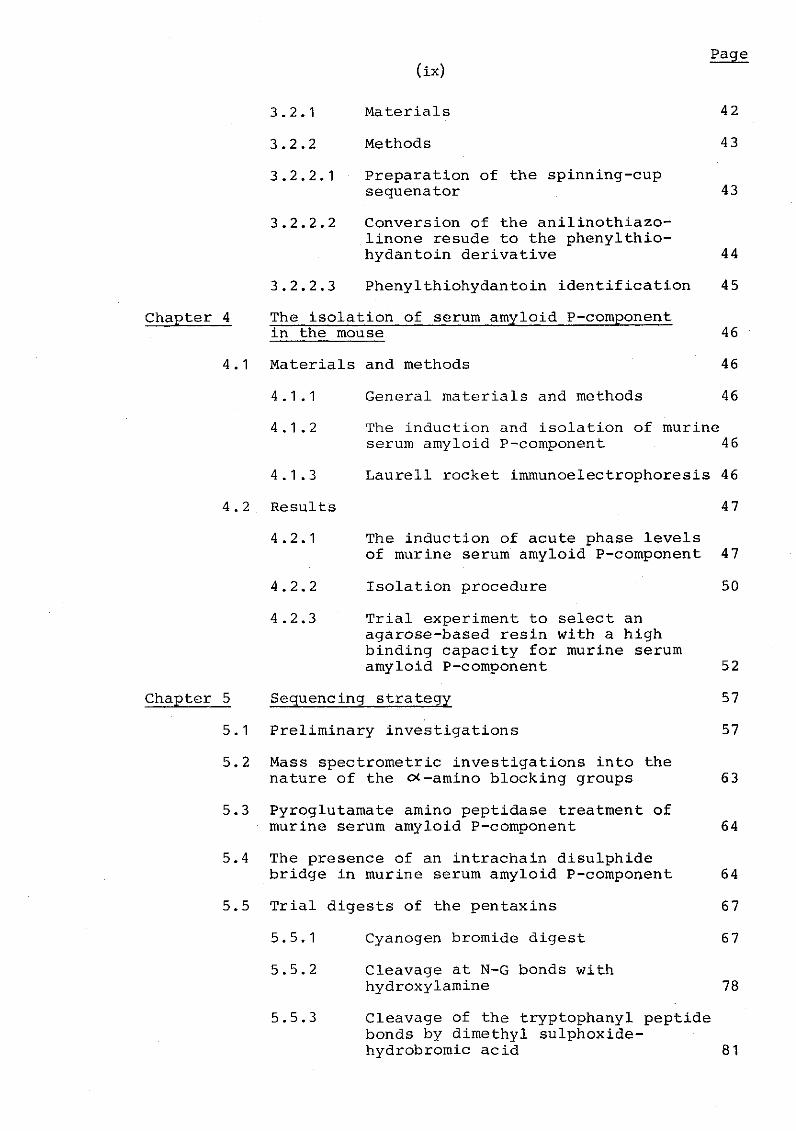
3.2.1 Materials 42 3.2.2 Methods 43 3.2.2.1 Preparation of the spinning-cup
sequenator 43 3.2.2.2 Conversion of the anilinothiazo-
linone resude to the phenylthio-hydantoin derivative 44
3.2.2.3 Phenylthiohydantoin identification 4 5 Chapter 4 The isolation of serum amyloid P-component
in the mouse 46 4.1 Materials and methods 46
4.1.1 General materials and methods 46 4.1.2 The induction and isolation of murine
serum amyloid P-component 46 4.1.3 Laurell rocket Immunoelectrophoresis 46
4.2 Results 47 4.2.1 The induction of acute phase levels
of murine serum amyloid P-component 4 7 4.2.2 Isolation procedure 50 4.2.3 Trial experiment to select an
agarose-based resin with a high binding capacity for murine serum amyloid P-component 52
Chapter 5 Sequencing strategy 57 5.1 Preliminary investigations 57 5.2 Mass spectrometric investigations into the
nature of the o<-amino blocking groups 63 5.3 Pyroglutamate amino peptidase treatment of
murine serum amyloid P-component 64 5.4 The presence of an intrachain disulphide
bridge in murine serum amyloid P-component 64 5.5 Trial digests of the pentaxins 67
5.5.1 Cyanogen bromide digest 67 5.5.2 Cleavage at N-G bonds with
hydroxylamine 78 5.5.3 Cleavage of the tryptophanyl peptide
bonds by dimethyl sulphoxide-hydrobromic acid 81
(x) Page
Chapter 6 6.1
5.5.4 Tryptic digest 5.5.5 Staphylococcus aureus (V8) protease
digest Cyanogen bromide fragments Preparative cyanogen bromide digest performed at Imperial College
6.2 Preparative cyanogen bromide digest performed at UMMC
6.3 Carboxypeptidase Y digest Chapter 7 Tryptic peptides
7.1 Preparative tryptic digest 7.1.1 Peptide nomenclature
7.2 Sequence determination of the amino terminus of murine serum amyloid P-component using mass spectrometry
81
83 85
85
87 93 97 97 97
100
Chapter 8 8.1
Staphylococcus aureus (V8) protease peptides 114
Chanter 9
9.1
Preparative digest of CBA murine serum amyloid P-component 8.1.1 Peptide nomenclature Investigations into the carbohydrate present in the murine serum amyloid P-component and the plaice pentaxins Analysis of the carbohydrate moiety of CBA murine serum amyloid P-component
114 114
1 2 2
1 2 2
9.2 Elucidation of the structure of the carbo-hydrate moiety of murine serum amyloid P-component and the plaice pentaxins by mass spectrometry 9.2.1 Investigation into the structure of
the carbohydrate present in murine serum amyloid P-component
9.2.2 Investigation into the structure of the carbohydrate present in the plaice pentaxins
Chapter 10 10.1
Amino acid sequence homology studies The primary structure of the murine serum amyloid P-component 10.1.1 Amino acid sequence confirmation
using FABMS
124
124
127
128
128
128
(xi) Page
10.1.2 Comparison of the primary structure of murine serum amyloid P-component and the human pentaxins 129
10.1.3 The primary structure of murine serum amyloid P-component 143
10.2 Comparison of the amino acid sequences of the plaice serum amyloid P-component and the human pentaxins 148
10.3 Comparison of the amino acid sequence of the rat C-reactive protein and the human pentaxins 148
Chapter 11 Discussion 152 11.1 General discussion 152 11.2 Murine serum amyloid P-component 153 11.3 Plaice serum amyloid P-component 157 11.4 Rat C-reactive protein 157 11.5 Sequencing strategy 158 11.6 Summary of conclusions 160
Appendix A Methods used in automated sequencing 161 A(i) 0.1M Quadrol-sequencing program 161 A(ii) 0.1M Quadrol-Polybrene pre-wash program 164 A(iii) Phenylthiohydantoins standard solution 167 A(iv) Buffers used in phenylthiohydantoin identifi-
cation 168 A(v) Details of the HPLC systems used to identify
and qualitate phenylthiohydantoin derivatives 169 Appendix B Buffers used in the isolation of murine serum
amyloid P-component 173 B(i) Electrophoresis buffer pH8.6 173 B(ii) TSC 173 B(iii) TSE 174
Appendix C The amino acid composition for sequenced cyanogen bromide fragments and detailed sequenator yields 175
C(i) Amino acid composition of cyanogen bromide fragments of murine and plaice serum amyloid P-components and rat C-reactive protein 175
C(ii) Sequenator yields of cyanogen bromide fragments 176
(xii) Page
a) Murine serum amyloid P-component 176 b) Plaice serum amyloid P-component 179 c) Rat C-reactive protein 180
Appendix D Amino terminal sequenator analysis of plaice serum amyloid P-component 181
References 182
(xiii) LIST OF FIGURES
Page
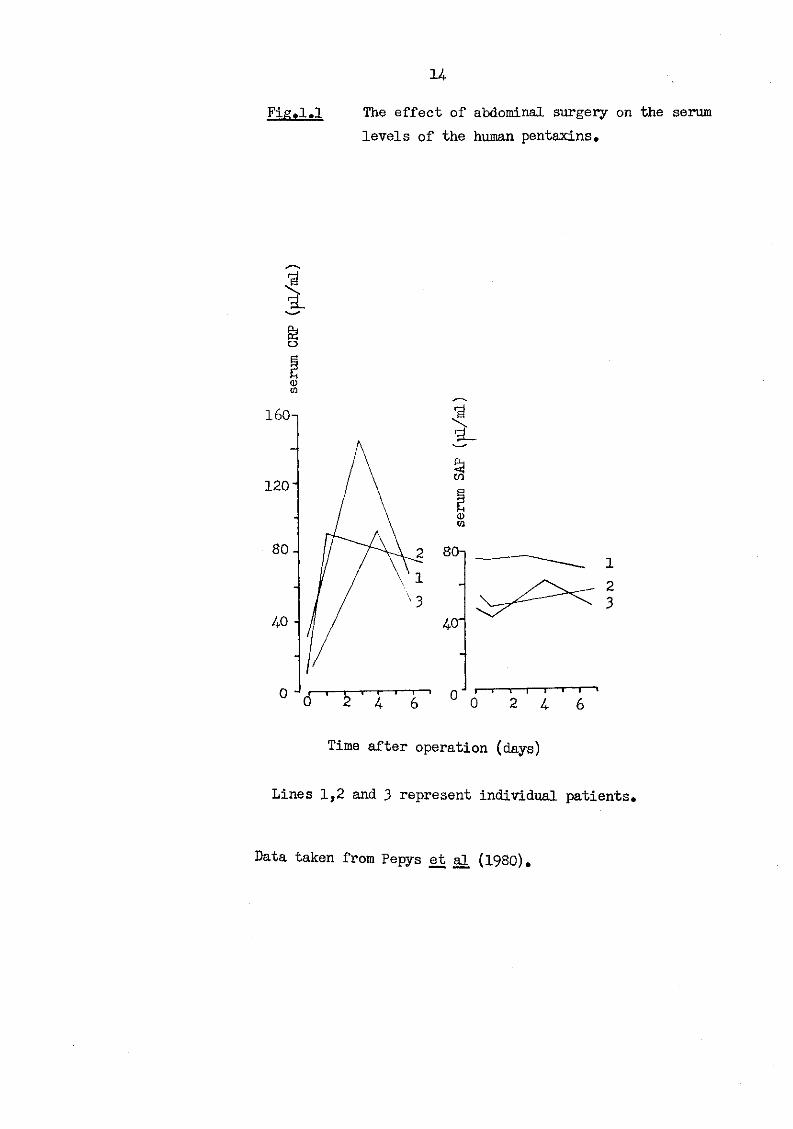
1.1 The effect of abdominal surgery on the serum levels of the human pentaxins 14
1.2 Comparison of the amino acid sequences of the human pentaxins 20
2.1 A loaded high voltage paper electrophoresis tank 33 4.1 Templates used in Laurell rocket Immunoelectro-
phoresis 48 4.2 Laurell rocket Immunoelectrophoresis apparatus 49 4.3 Gel filtration on Sephacryl S-300 of murine serum
amyloid P-component eluted from Ultrogel ACA 44 53 5.1 Bio-gel P60 separation of a cyanogen bromide digest
of murine serum amyloid P-component 70 5.2 HPLC separation of cyanogen bromide fragments of
murine serum amyloid P-component 71 5.3 HPLC separation of cyanogen bromide fragments of
carboxymethylated Balb/c murine serum amyloid P-component 76
5.4 HPLC separation of cyanogen bromide fragments of carboxymethylated and native Balb/c murine serum amyloid P-component 77
5.5 HPLC separation of hydroxylamine cleavage products of carboxymethylated Balb/c murine serum amyloid P-component 80
6.1 Separation of cyanogen bromide fragments of carboxy-methylated murine serum amyloid P-component using Bio-gel P60 equilibrated in 5% (v/v) formic acid 86
6.2 The amino acid sequence "of cyanogen bromide fragments of murine serum amyloid P-component 88
(xiv)
Page
6.3 HPLC separation of cyanogen bromide fragments of carboxymethylated Balb/c murine serum amyloid P-component 89
6.4 HPLC separation of cyanogen bromide fragments of carboxymethylated CBA murine serum amyloid P-component 90
6.5 HPLC separation of cyanogen bromide fragments of carboxymethylated plaice serum amyloid P-component 91
6.6 HPLC separation of cyanogen bromide fragments of carboxymethylated rat C-reactive protein 92
6.7 The partial amino acid sequence of murine serum amyloid P-component obtained from cyanogen bromide fragments 94
6.8 The partial amino acid sequence of plaice serum amyloid P-component obtained from cyanogen bromide fragments 95
6.9 The partial amino acid sequence of rat C-reactive protein obtained from cyanogen bromide fragments 96
7.1 HPLC separation of tryptic peptides of carboxy-methylated-succinylated murine serum amyloid P-component 98
7.2 HPLC separation of tryptic peptides of carboxy-methylated-succinylated plaice serum amyloid P-component 99
7.3 ( + ) FAB mass spectrum of the N-terminal peptide of murine serum amyloid P-component; T Su PM 15-A 112
7.4 (+) FAB mass spectrum of the N-terminal peptide of murine serum amyloid P-component; T Su PM 15-A, following esterification 112
(xv) Page
7.5 FAB mass spectra of the N-terminal peptide of murine serum amyloid P-component; T Su PM 15-A, following treatment with carboxypeptidase B 113
8.1 HPLC separation of Staphylococcus aureus (V8) protease peptides of carboxymethylated-succinylated CBA murine serum amyloid P-component 115
9.1 FAB mass spectra of carbohydrate fragments produced from murine serum amyloid P-component following O-acetolysis 126
10.1 (+) FAB mass spectrum of a tryptic digest of carboxymethylated CBA murine serum amyloid P-component 130
10.2 (+) FAB mass spectrum of a tryptic digest of car-boxymethylated CBA murine serum amyloid P-component; see Fig. 10.1, subsequently digested with carboxy-peptidase B 131
10.3 The amino acid sequence of murine serum amyloid P-component 133
10.4 Amino acid composition of murine serum amyloid P-component as determined from the sequence shown in Fig. 10.3 144
10.5 The amino acid sequence of murine serum amyloid P-component 145
10.6 Comparison of the primary structure of murine serum amyloid P-component and the human pentaxins 146
10.7 Comparison of the partial amino acid sequence of plaice serum amyloid P-component and the human pentaxins 149
10.8 Comparison of the N-terminal region of plaice serum amyloid P-component and the human pentaxins 150
Page (xvi)
10.9 Comparison of the partial amino acid sequence of rat C-reactive protein and the human pentaxins 151
11.1 Comparison of the 26 amino terminal amino acids of murine serum amyloid P-component and the hamster female protein 154
11.2 The sequence distribution of amino acid side chain character of murine serum amyloid P-component 156
11.3 An example of sequence confirmation from a tryptic digest of murine serum amyloid P-component examined, without purification, by FABMS 159
A(i) HPLC separation of phenylthiohydantoin derivatives; acetonitrile system 170
A(ii) HPLC separation of phenylthiohydantoin derivatives; methanol system 172
(xvii) LIST OF PLATES Page
1.1 The electron microscope appearance of human serum amyloid P-component 7
1.2 The electron microscope appearance of human C-reactive protein 7
1.3 The electron microscope appearance of some members of the Pentaxin family 12
4.1 Determination of the amount of murine serum amyloid P-component contained in the acute phase serum using Immunoelectrophoresis 51
4.2 Investigations into the relative binding capacities of agarose based resins for murine serum amyloid P-component 56
5.1 SDS 12.5% (w/v) PAGE of bovine and murine serum amyloid P-components and rat C-reactive protein stained with periodic acid - Schiffs reagent 6 2
5.2 SDS 5-20% (w/v) gradient PAGE of pyroglutamate amino peptidase 6 5
5.3 SDS 12.5% (w/v) PAGE of reduced and non-reduced murine serum amyloid P-component 66
5.4 SDS 15% (w/v) PAGE of a time course following the digestion of carboxymethylated murine serum amyloid P-component with cyanogen bromide 68
5.5 SDS 5-20% (w/v) gradient PAGE of a time course following the digestion of native Balb/c murine serum amyloid P-component with cyanogen bromide 73
5.6 SDS 5-20% (w/v) gradient PAGE of a time course following the digestion of native plaice serum amyloid P-component with cyanogen bromide 74
5.7 SDS 5-20% (w/v) gradient PAGE of a time course following the digestion of native lumpsucker C-reactive protein with cyanogen bromide 75
(xviii)
Page
5.8 SDS 5-20% (w/v) gradient PAGE of a time course following the cleavage of carboxymethylated Balb/c murine serum amyloid P-component with hydroxylamine 79
5.9 SDS 15% (w/v) PAGE of a time course following the cleavage of carboxymethylated Balb/c murine serum amyloid P-component with dimethyl sulphoxide-hydrobromic acid 8 2
(xix) L I S T OF TABLES
Page
1.1 A selection of acute phase reactants 2 1.2 Plasma protein profile in the acute phase response 4 1.3 Characteristics of human C-reactive protein and
serum amyloid P-component molecules 8 1.4 Autoimmune and related diseases with concomitant
alteration in the level of human C-reactive protein 10
1.5 Classification of amyloidosis 18 4.1 Determination of the amount of murine amyloid
P-component contained in the acute phase serum using Immunoelectrophoresis 51
4.2 A summary of the purification of murine serum amyloid P-component 54
4.3 Investigations into the relative binding capacities of agarose based resins for murine serum amyloid P-component 56
5.1 Molecular weight of pentaxins as estimated using SDS 12.5% (w/v) PAGE 58
5.2 Amino acid composition of C-reactive protein and serum amyloid P-component in different species 59
5.3 N-terminal residues of pentaxins as revealed by the dansylation technique 60
7.1 Tryptic peptides of CBA murine serum amyloid P-component 101
7.2 Tryptic peptides of plaice serum amyloid P-component 107
8.1 Staphylococcus aureus (V8) peptides of CBA murine serum amyloid P-component 116
9.1 Carbohydrate composition of the plaice pentaxins and rat C-reactive protein 123
(xx) Page
9.2 Carbohydrate fragments produced from murine serum amyloid P-component following O-acetolysis 125
X
CHAPTER 1
INTRODUCTION
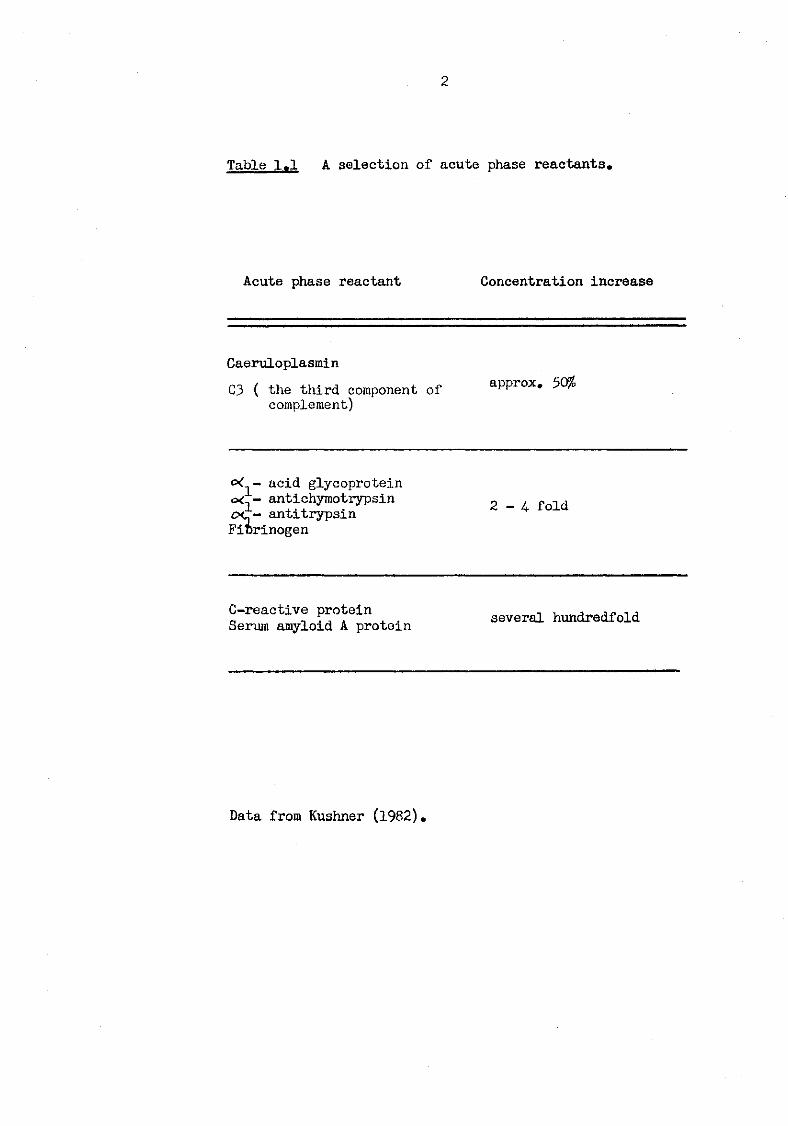
In man, following most forms of tissue injury, infection and inflammation, the concentration of many plasma proteins increases, returning to their normal physiological levels as healing and recovery proceeds (Koj, 19 74; Gordon, 1976; Kindmark, 19 76; Kushner, 1982) . For examples of these proteins see Table 1.1. In individuals with chronic active inflammation, e.g. rheumatoid arthritis, or malignancy, high levels of some proteins may exist.
1.1 The C-reactive protein The first protein found to behave in such a manner was
revealed by the investigations of Tillet and Francis (1930) into the immune response of patients suffering from acute pneumonia. Their experiments showed that the addition of the C-polysaccharide of pneumococcal bacillus to the serum from acutely ill subjects caused precipitation of the polysaccharide, whilst the reaction was lacking amongst patients past the illness crisis. Further work reported by Abernethy and Avery (1941) and Macleod and Avery (1941) confirmed these observations and described the existence of a protein responsible. This protein was subsequently referred to as the CRP, a name derived from its precipitation properties (reviewed by McCarty, 1982). Independent research by Lofstrom (1943) reported that serum from patients suffering from pneumonia and other respiratory infections contained a substance capable of causing capsular swelling of several types of pneumococci. This material was later identified with CRP (Lofstrom, 1944) . Sensitive techniques available today, for example Immunoelectrophoresis, have shown
2
Table 1.1 A selection of acute phase reactants.
Acute phase reactant Concentration increase
Caeruloplasmin C3 ( the third component of approx. 50$
complement)
c< - acid glycoprotein <x. - antichymotrypsin 2 - L fold oc- antitrypsin Fibrinogen
C-reactive protein several hundredfold Serum amyloid A protein
Data from Kushner (1982).
3
that CRP is present in normal serum, at levels considerably lower than observed under acute disease conditions. (For details see later in this chapter).
1.2 The acute phase response The term acute phase response was introduced by Avery
and his colleagues in referring to serum obtained from acutely sick people. Consequently, CRP, and substances of a similar nature more recently discovered (Table 1.1) are collectively known as acute phase reactants.
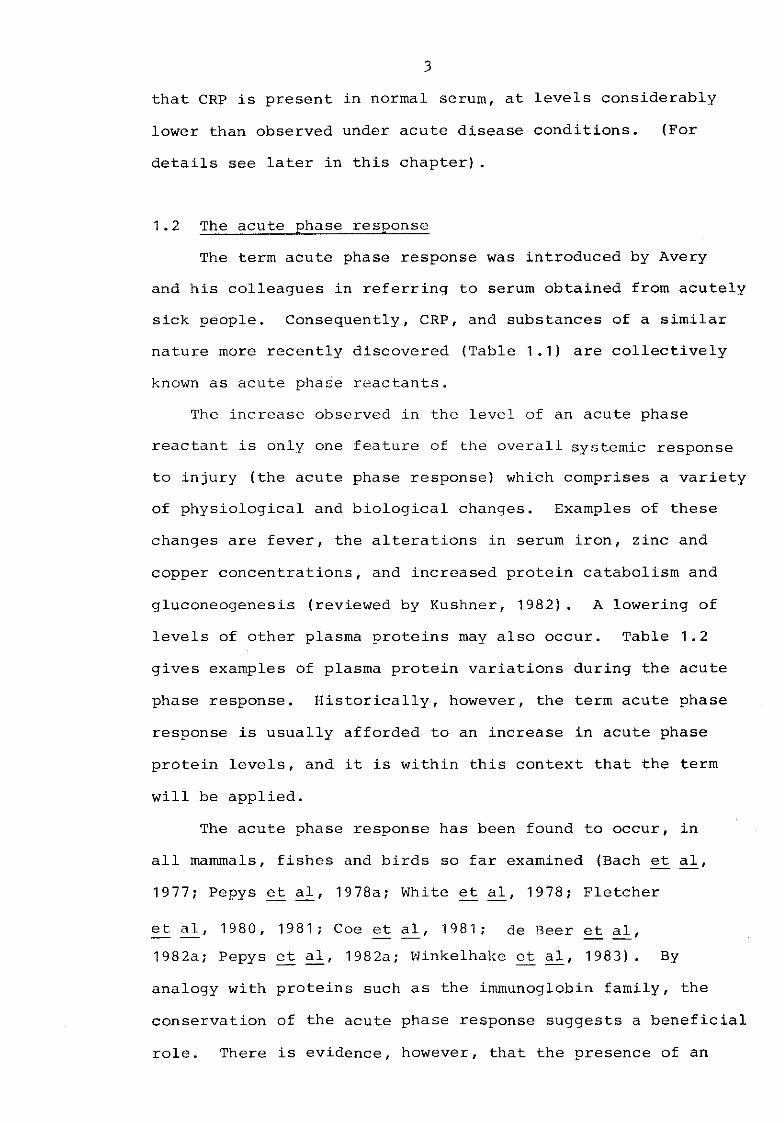
The increase observed in the level of an acute phase reactant is only one feature of the overall systemic response to injury (the acute phase response) which comprises a variety of physiological and biological changes. Examples of these changes are fever, the alterations in serum iron, zinc and copper concentrations, and increased protein catabolism and gluconeogenesis (reviewed by Kushner, 1982). A lowering of levels of other plasma proteins may also occur. Table 1.2 gives examples of plasma protein variations during the acute phase response. Historically, however, the term acute phase response is usually afforded to an increase in acute phase protein levels, and it is within this context that the term will be applied.
The acute phase response has been found to occur, in all mammals, fishes and birds so far examined (Bach et al, 19 77; Pepys et al, 1978a; White et al, 1978; Fletcher
et al, 1980, 1981; Coe et al, 1981; de Beer et al, 198 2a; Pepys et al, 198 2a; Winkelhake et al, 1983) . By analogy with proteins such as the immunoglobin family, the conservation of the acute phase response suggests a beneficial role. There is evidence, however, that the presence of an
Table 1.2 Plasma protein profile in the acute phase response.
Protein Increased Decreased
Coagulation proteins
Complement proteins
Fibrinogen, prothrombin, factor VIII, plasminogen.
Cls, C2, factor B, C3, OA, 05s C6. Properdin
Protease inhibitors o( - antitrypsin c* - antichymotrypsin
Inter-o<- antitrypsin
Transport proteins Haptoglobin Caeruloplasmin
Transferrin
Miscellaneous C-reactive protein, acid glycoprotein, serum amyloid A protein
Albumin and prealbumin
Data from Pepys (l9Bla)e
5
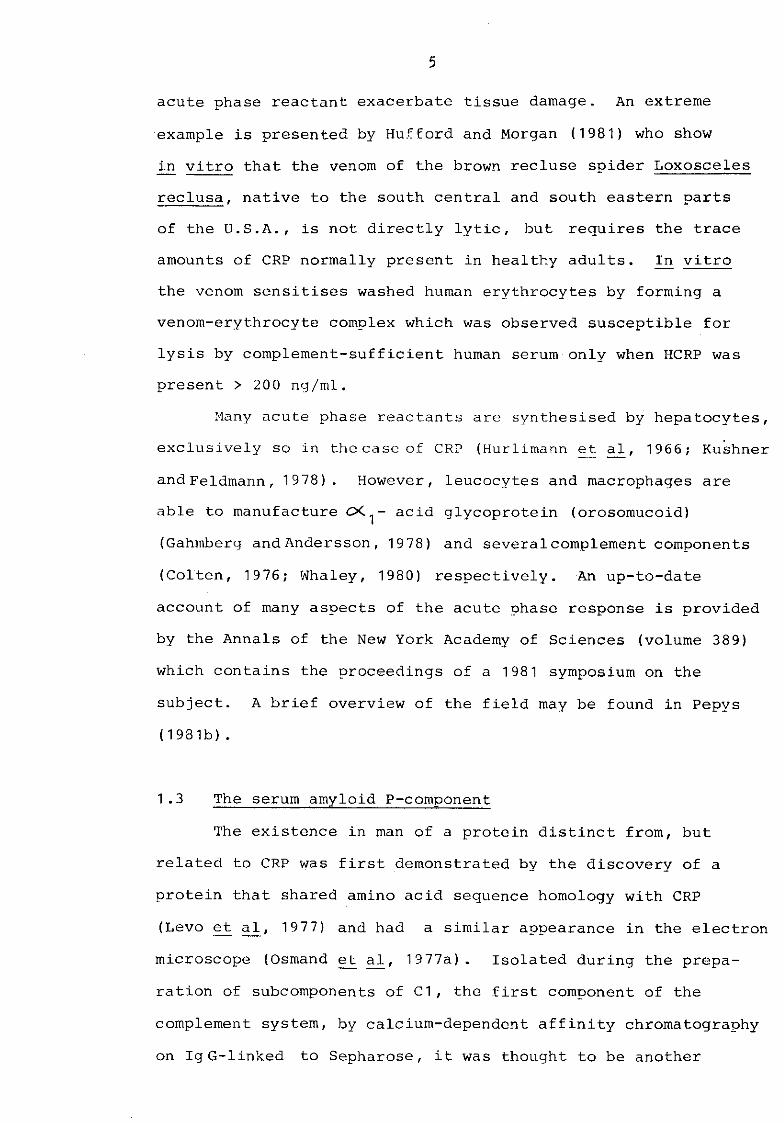
acute phase reactant exacerbate tissue damage. An extreme example is presented by Hufford and Morgan (1981) who show in vitro that the venom of the brown recluse spider Loxosceles reclusa, native to the south central and south eastern parts of the U.S.A., is not directly lytic, but requires the trace amounts of CRP normally present in healthy adults. In vitro the venom sensitises washed human erythrocytes by forming a venom-erythrocvte complex which was observed susceptible for lysis by complement-sufficient human serum only when HCRP was present > 200 ng/ml.
Many acute phase reactants are synthesised by hepatocytes, exclusively so in the case of CRP (Hurlimann et al, 1966 ; Kushner andFeldmann, 1978). However, leucocytes and macrophages are able to manufacture acid glycoprotein (orosomucoid) (Gahmberg and Andersson, 19 78) and several complement components (Colten, 19 76; Whaley, 1980) respectively. An up-to-date account of many aspects of the acute phase response is provided by the Annals of the New York Academy of Sciences (volume 389) which contains the proceedings of a 1981 symposium on the subject. A brief overview of the field may be found in Pepvs (1981b).
1.3 The serum amyloid P-component The existence in man of a protein distinct from, but
related to CRP was first demonstrated by the discovery of a protein that shared amino acid sequence homology with CRP (Levo et al, 1977) and had a similar appearance in the electron microscope (Osmand et al, 1977a). Isolated during the prepa-ration of subcomponents of C1, the first component of the complement system, by calcium-dependent affinity chromatography on IgG-linked to Sepharose, it was thought to be another
6
component of C1 and was named C1t accordingly (Assimeh and Painter, 1975). The C1t fraction was shown by Pepys et al (1977a, 1977b) to result from calcium-dependent binding to the agarose, of which Sepharose beads are comprised. This binding ability was used in revealing that C1t was not involved in C1 either structurally or functionally (Painter, 1977; Cooper and Ziccardi, 1979) and in fact C1t was shown to be identical to a known serum protein (Pinteric et al, 1976; Pepys et al, 1977b) . This protein was called 9.5 S oCj -glycoprotein on the basis of its biophysical properties (Haupt et al, 1972) and SAP (Cathcart et al, 1965; Bladen et al, 1966) because of the pentagonal appearance of its molecules in the electron microscope (See Plate 1.1.) and because it was first identified as a constituent of amyloid deposits - to be discussed later in this chapter.
1.4 Properties of C-reactive protein and serum amyloid P-component molecules Human CRP and SAP resemble each other in a) their capacity
for calcium-dependent binding to particular, albeit different, ligands, b) having subunits which are arranged in an annular disc-like configuration with cyclic pentameric symmetry (Plates 1.1 and 1.2) and c) having homologous amino acid sequences (Osmand et al, 1977b; Oliveira et al, 1977, 1979; Anderson and Mole, 1982). A summary of some of the characteristics of HCRP and HSAP is shown in Table 1.3.
HCRP was initially detected and assayed by its reaction with C-polysaccharide, producing either precipitation of poly-saccharide or capsular swelling of the whole pneumococci (Hedlund, 1947). These methods have been replaced by immuno-electrophoretic techniques (Kindmark, 1969; Laurell, 1972).
7
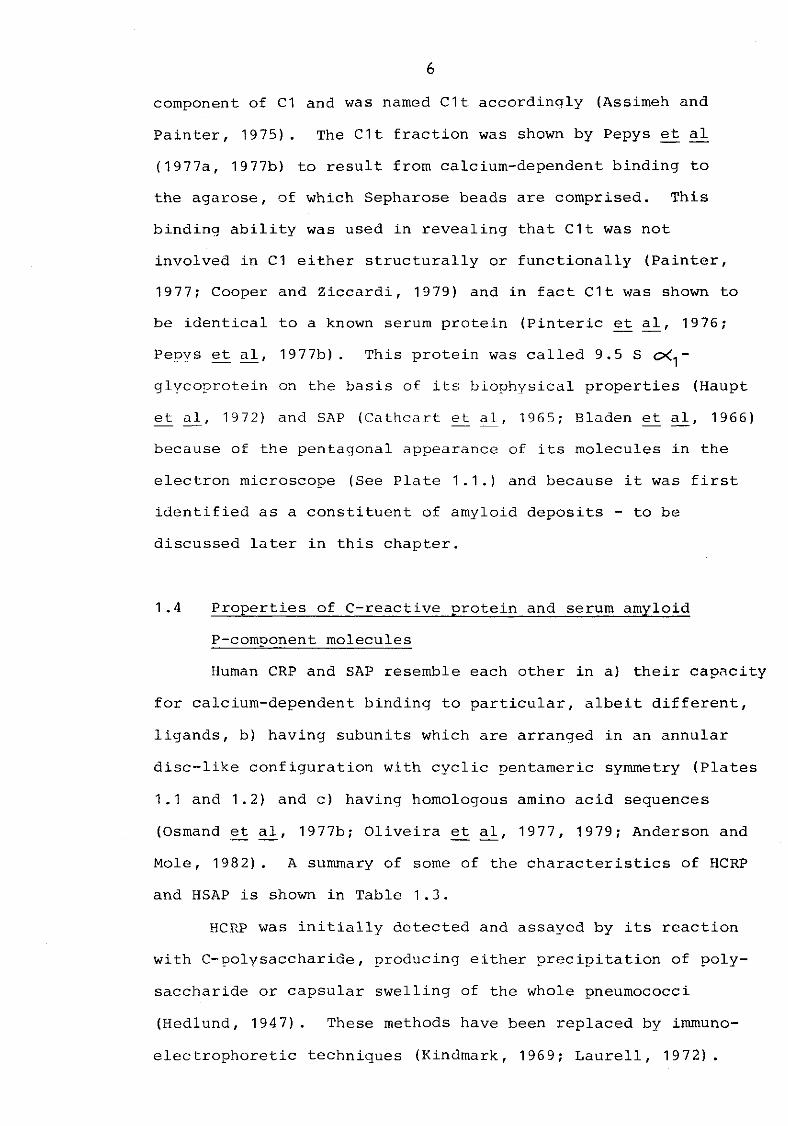
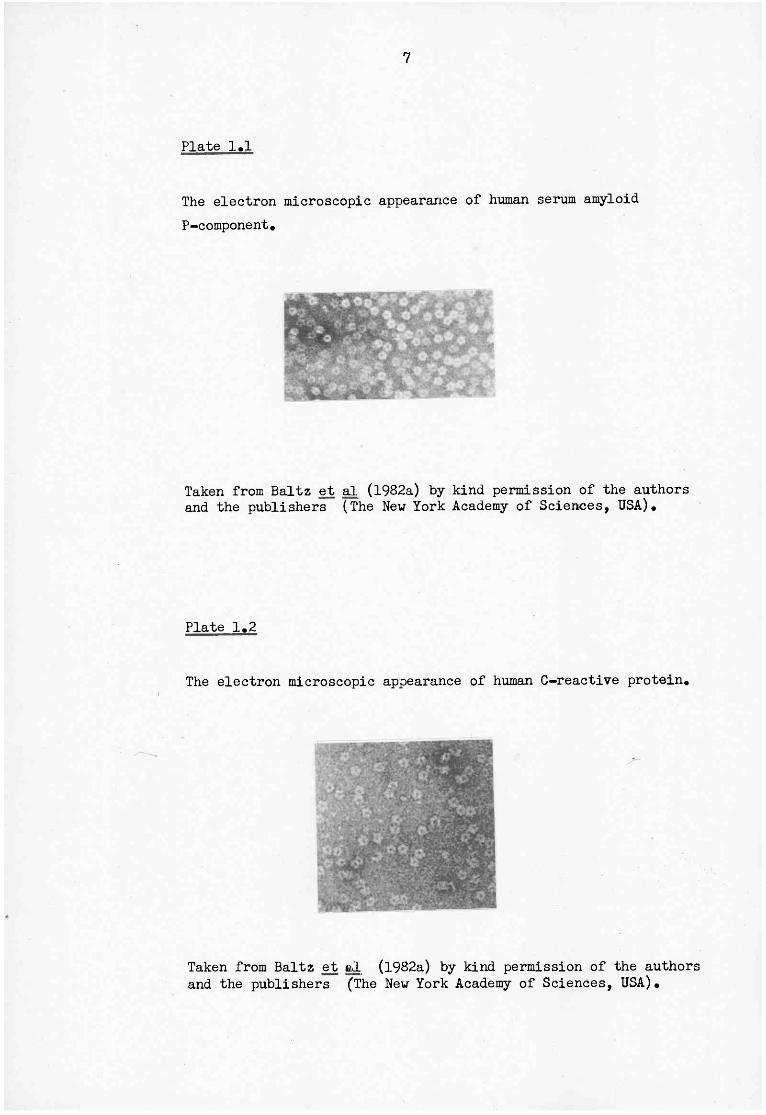
Plate 1.1
The electron microscopic appearance of human serum amyloid P-component.
Taken from Baltz et al (1982a) by kind permission of the authors and the publishers (The New York Academy of Sciences, USA).
Plate 1.2
The electron microscopic appearance of human C-reactive protein.
Taken from Baltz et tkL (1982a) by kind permission of the authors and the publishers (The New York Academy of Sciences, USA).
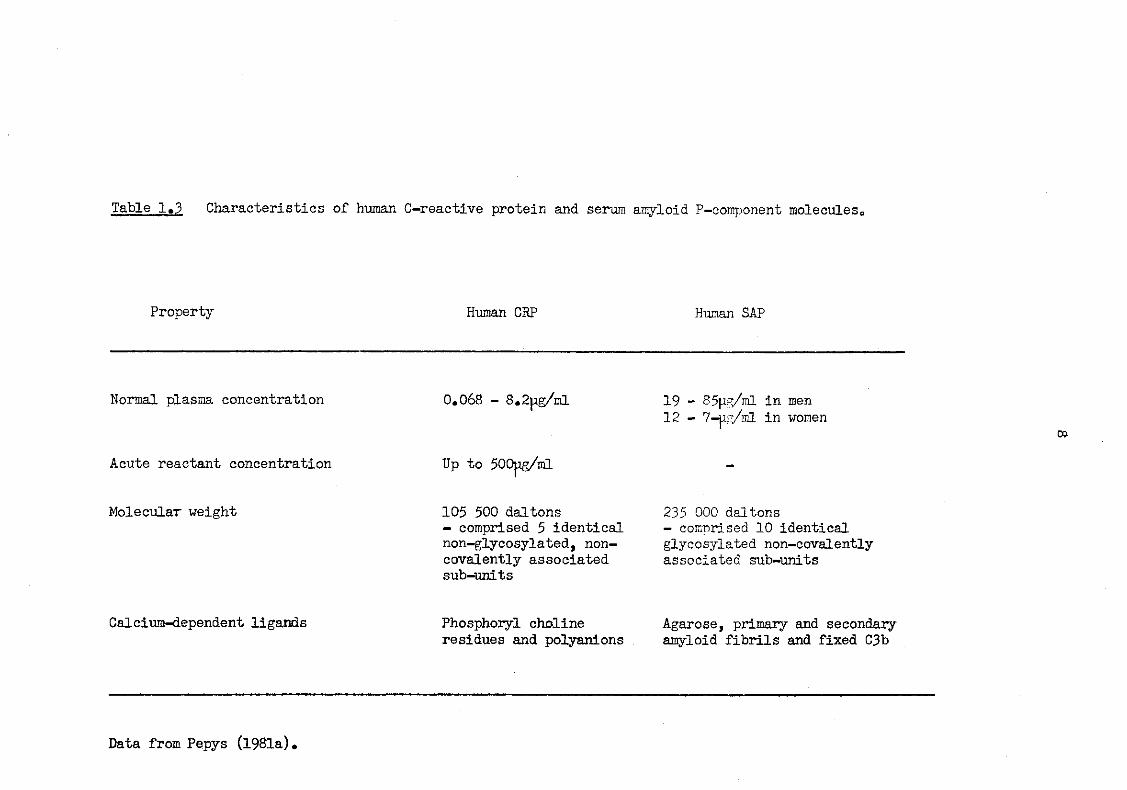
Table 1,3 Characteristics of human C-reactive protein and serum amyloid P-component molecules0
Property Human CRP Human SAP
Normal plasma concentration
Acute reactant concentration
0.068 - 8.2pg/ml
Up to 500pg/ml
19 - 85pg/ml in men 12 - 7-jig/ml in women
00
Molecular weight 105 500 daltons - comprised 5 identical non-glycosylated, non-covalently associated sub-units
235 000 daltons - comprised 10 identical glycosylated non-covalently associated sub-units
Calcium-dependent ligaixds Phosphoryl choline residues and polyanions
Agarose, primary and secondary amyloid fibrils and fixed C3b
Data from Pepys (1981a) •
9
Clinically 1-200 |ig/ml can be detected whilst high concentrations can be determined using diluted serum (Pepys, 1981a).
The CRP response is a non-specific one, the result of a variety of stimuli. Hence a value for the level of CRP in human serum is not considered of diagnostic value, although when interpreted in conjunction with clinical investigations it may be useful (Morley and Kushner, 1982; Peltola, 1982; Williams £t a_l, 1982) . A list of diseases which result in alterations in CRP levels is given in Table 1.4.
As discussed earlier, CRP derived its name from its calcium-dependent reactivity with pneumococcal C-polysaccharide, hence the proteins which can be isolated from sera of other animals on the basis of the same reactivity are designated CRP s (Bach et al, 1977; de Beer et al, 1982a; Pepys et al, 1982a). The different CRP species investigated so far usually resemble HCRP in molecular appearance, subunit composition, amino acid composition and, where available, amino acid sequence, and all possess one intrachain disulphide bridge per subunit (Baltz et al, 1982a). An exception has been observed in Limulin, a calcium-dependent phosphoryl choline binding protein from the horse-shoe crab (Limulus polyphenols) which has been proposed as an invertebrate CRP. The electron microscope appearance of Limulin differs from that of vertebrate molecules in consisting of 12 subunits arranged as a double-stacked hexagonal annular structure (Fernandez-Moran et al, 1968; Robey and Liu, 1981; Liu et al, 1982). Baltz et al (1982a) have suggested from observations of non-reduced RCRP using SDS-PAGE that it is unique amongst these proteins in possessing an interchain disulphide bridge between some, but not all subunits.
HSAP undergoes calcium-dependent binding to agarose, with
10
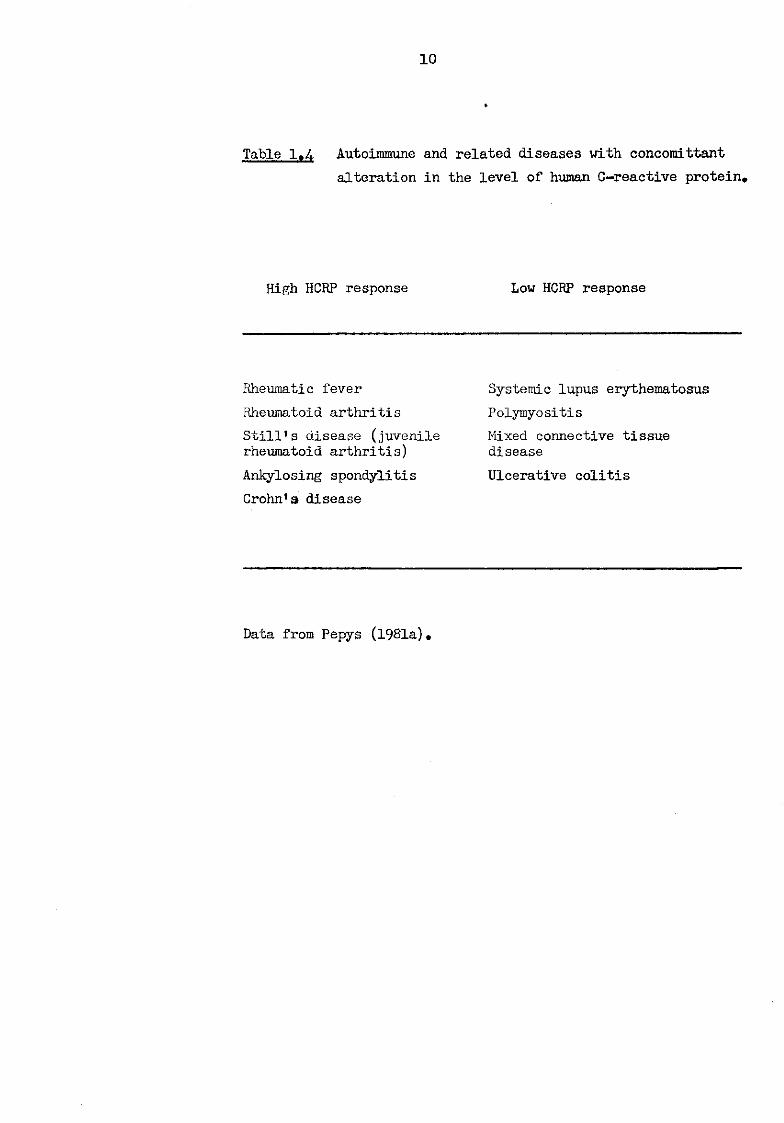
Table 1.4. Autoimmune and related diseases with concomittant alteration in the level of human C-reactive protein*
High HCRP response Low HCRP response
Rheumatic fever Rheumatoid arthritis Still's disease (juvenile rheumatoid arthritis) Ankylosing spondylitis Crohn's disease
Systemic lupus erythematosus Polymyositis Mixed connective tissue disease Ulcerative colitis
Data from Pepys (1981a).
an affinity which varies with the commercial source, but not to C-polysaccharide. Consequently HSAP may be isolated from whole serum on the basis of this affinity (de Beer and Pepys, 1982). Serum proteins in lower animals which also share an affinity for agarose but not C-polysaccharide have been designated as SAPs (Pepys et al, 1978a, 1980; de Beer et al, 1982a) . It should be mentioned that weak binding to agarose is also characteristic of human, rabbit and rat CRPs, the order of the affinity being human CRP < rabbit CRP < rat CRP. Baltz et al (1982a) comment that this species difference in binding creates the possibility that CRP-like molecules in some animals may remain undetected. However, since SAPs, with the exception of the related Syrian Hamster Female Protein (Coe et al, 1981; Coe, 1982) shows no reactivity with C-polysaccharide it is generally possible to separate, purify and hence define CRP and SAP on the basis of their dominant calcium-dependent ligand affinity.
Osmand et al (1977a) proposed the name "Pentraxin family" on the basis of the common structural feature of the CRP and SAP molecules (i.e. a pentameric disc appearance in the electron microscope (Plate 1.3)), although the arrangement may take the form of either a single disc or two discs interacting face to face. The more correct derivation from the Greek is actually "pentaxin" (Pepys and Baltz, 1983), and I propose to use this nomenclature.
Despite the evolutionary conservation of the overall molecular structure and the similar binding properties, there are several differences within the Pentaxin family which will now be discussed.
The SAP of all species investigated so far are glycosylated (Baltz et al, 1982a), whilst among CRPs this is not the case.
12
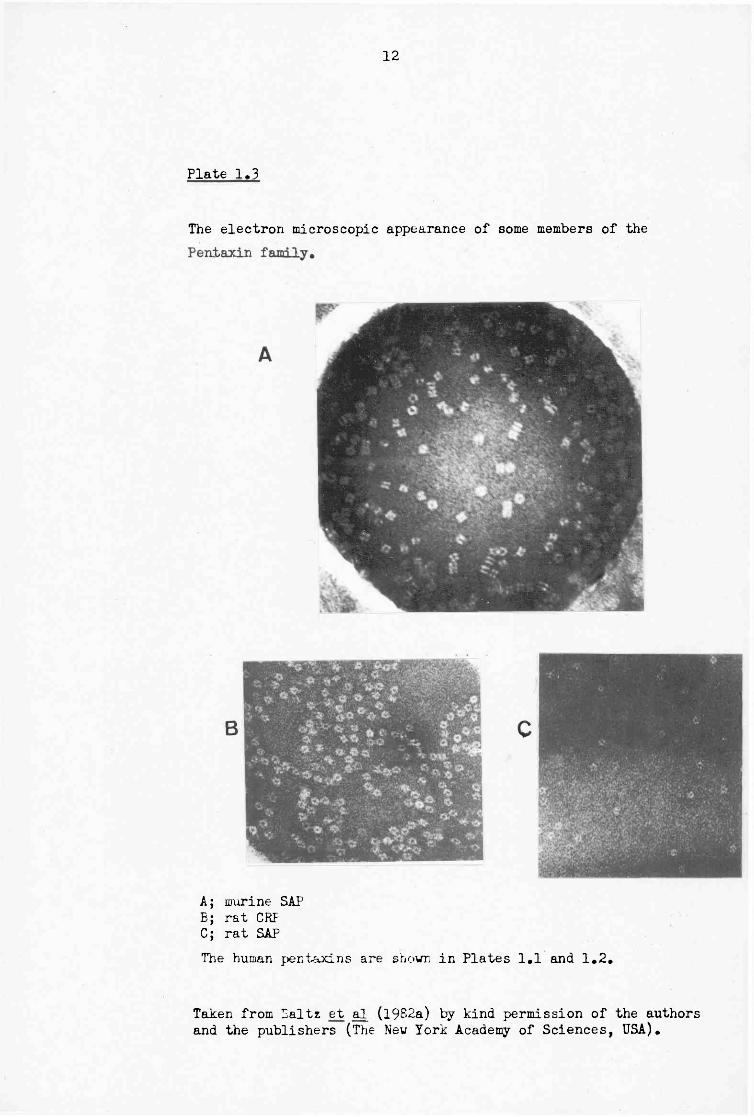
Plate 1.3
The electron microscopic appearance of some members of the
A; nruri ne SAP B; rat CRF C; rat SAP The human pentaxins are shown in Plates 1.1 and 1.2.
Taken from Baltz et al (1982a) by kind permission of the authors and the publishers (The Nev York Academy of Sciences, USA).
13
HCRP and rabbit CRP are non-glycosylated, unlike the other CRP molecules studied (Baltz et al, 1982a). An interesting pro-tein is PCRP which is seen by PAGE as two bands, one being a glycosylated form of the other (Pepys et al, 1982a).
The HCRP, a classical acute phase reactant, shows levels rising from normal (< 1 |j,g/ml) (Shine et al_, 1981) to as much as 300 |ig/ml or more within 24-48 hours of an acute phase stimulus
(Kushner and Feldmann, 1973). The normal circulating concentration of HSAP is relatively stable at 30-40 u,g/ml (Pepys et al, 1978b) and changes little with acute stimuli. However, in chronic inflammation, where CRP levels increase the overall range of SAP may rise to 90 |ig/ml. The effect of major abdominal surgery on the serum levels of CRP and SAP is shown in Fig. 1.1.
In mice, CRP is a trace protein (< 50 ng/ml), rising to not more than 2 iig/ml during an acute phase response (Siboo and Kulisek, 19 78; Pepys, 1979) , whilst MSAP, unlike its human counterpart, behaves as an acute phase reactant and levels can rise from a normal range of 5-100 |ig/ml in different inbred strains to over 600 |ig/ml on acute stimulation (Pepys et al, 1979a; Baltz et al, 1980; M.L. Baltz and M.B. Pepys, unpublished observations). In rats the SAP concentration correspond closely to that observed in man, whilst RCRP is normally present at about 300 [ig/ml, even in pathogen-free animals, and can rise to 1000 iig/ml (de Beer et al, 1982a).
1.5 Ligands for C-reactive protein molecules
The conservation of the ligand binding specificity of
CRPs seems to indicate an important biological role as yet
not elucidated. The secondary effects of ligand binding
observed in man, namely precipitation (Tillet and Francis,
H
Pig.1.1 The effect of abdominal surgery on the serum levels of the human pentaxins.
o
160-1
120
Time after operation (days)
Lines 1,2 and 3 represent individual patients.
Data taken from Pepys et al (1980).
15
1930), agglutination (Patterson and Higginbotham, 1965) and complement activation (Kaplan and Volanakis, 19 74) vary amongst the animal species. For example, RCRP does not precipitate or agglutinate its phosphoryl choline ligands despite binding to them, and neither rat nor rabbit CRPs activate their isologous complement (de Beer et al, 1982a) . Simpson et al (198 2) have shown that heat aggregated HCRPis capable of stimulating platelet activation, and work by James et al (1982) and Baum et al (1983) have observed interaction between CRP and peripheral blood lymphocytes, de Beer et al (1982b) discuss the ability of isolated HCRP when aggregated to selectively bind low density lipoprotein and very low density lipoprotein from whole human serum. This interaction may play an important role in the clearance and metabolism of low density lipoprotein, which, if deposited in arterial walls, results in artherosclerosis. The interaction of very low density lipoprotein with CRP has been observed in rabbits by Cabana et al ( 198 2) .
If indeed the function of CRP is the same, or similar, in different species, then it would appear that these secondary effects may not be essential for its activity. The discovery of a secondary effect of ligand binding common to CRP of all species would, however, be of considerable importance.
C-polysaccharide is a heteropolymer consisting of N-acetyl galactosamine phosphate, murein, ribitol phosphate, choline and diaminotrideoxyhexose (Liu and Gotschlich, 1963; Gotschlich and Liu, 1967; Brundish and Baddiley, 1968). The precise moiety in the complex material to which CRP binds is not known. The interaction can be inhibited most specifically by phosphoryl choline (Volanakis and Kaplan, 1971). HCRP is
16
capable of binding free phosphoryl choline with an affinity constant of 1-2 x 10 M (Anderson et al, 1978) , however calcium-dependent binding and precipitation with pneumococcal polysaccharide which lack phosphoryl choline residues has been observed by Heidelberger et al_ (1972). In addition, at low ionic strength CRP is able to undergo calcium-dependent binding to polyanions such as heparin, nucleic acids and dextran sulphate (Gotschlich and Edelman, 1967). Evidence for non-calcium-dependent binding specificity for some polycations, e.g. poly-L-lysine and poly-L-arginine, and histones has been presented by Siegel et al (1974, 1975). This evidence suggests that CRP may have two binding sites, one of which is calcium-dependent and recognises phosphoryl choline with great specificity and another which is non-calcium-dependent and binds polycations (Oliveira et al, 1980).
The various binding reactions are of considerable interest since in addition to being present in bacteria, C-polysaccharide-like molecules are widely distributed in nature, occurring in extracts of many parasites and fungi (Pepys and Longbottom, 1971).
CRP in some species of teleost fish resembles HCRP in causing immediate reddening of the skin on C-polysaccharide injection (Francis and Abernethy, 19 34; Finland and Dowling, 1935). An example is the plaice (Pleuronectes platessa) (Baldo and Fletcher, 1973) . This ability to mediate an inflammatory response is not observed in the flounder serum (Platichthys flesus) (Fletcher and Baldo, 1974) , which is understandable since this fish lacks CRP. Passive transfer of CRP-rich plaice serum into the flounder can confer the reactivity.
Like CRP, the function of SAP is not totally understood.
17
In addition to the discussed binding capacity for galactans, particularly agarose, SAP has been shown to bind fibronectin and C 4 binding protein (de Beer et al, 1981; Pepys et al, 1982b) and fixed complement C3b component (Hutchcraft et al, 1981).
1.6 The relationship between serum amyloid P-component and amyloid HSAP is a normal plasma protein which is apparently
identical to a protein present in amyloid deposits, where it may be up to 140 mg/1 g of amyloid fibril (Skinner et al, 1980). Isolated HSAP shows calcium-dependent binding to isolated primary and secondary amyloid fibrils in vitro (Pepys et al, 1979b). In studies investigating amyloidosis in mice, in which MSAP is an acute phase reactant, there is a close relationship between persistently raised SAP levels and the deposition of amyloid (Baltz et al, 1980). The term amyloidosis is used to designate a diverse collection of diseases that are defined by the presence of extracellular deposits of insoluble fibrillar protein amyloid (Cohen et al, 1 983) . An account of amyloid colitus is discussed by Vernon (1982). Amyloid fibrils are defined by their ability to take up Congo red stain, and also to give an apple green birefringence on polarisation microscopy. The fibrils are composed of polypeptide fragments of normal serum proteins, namely immunoglobulins, serum amyloid A protein, prealbumin and precalcitonin (Table 1.5). The fibrils are arranged in antiparallel ^ -pleated sheets folded back on themselves by y^-turns (Glenner 1980a, 1980b).
1.7 Ligands for serum amyloid P-component molecules
Dyck et al (1980a, 1980b) have shown the HSAP, or at
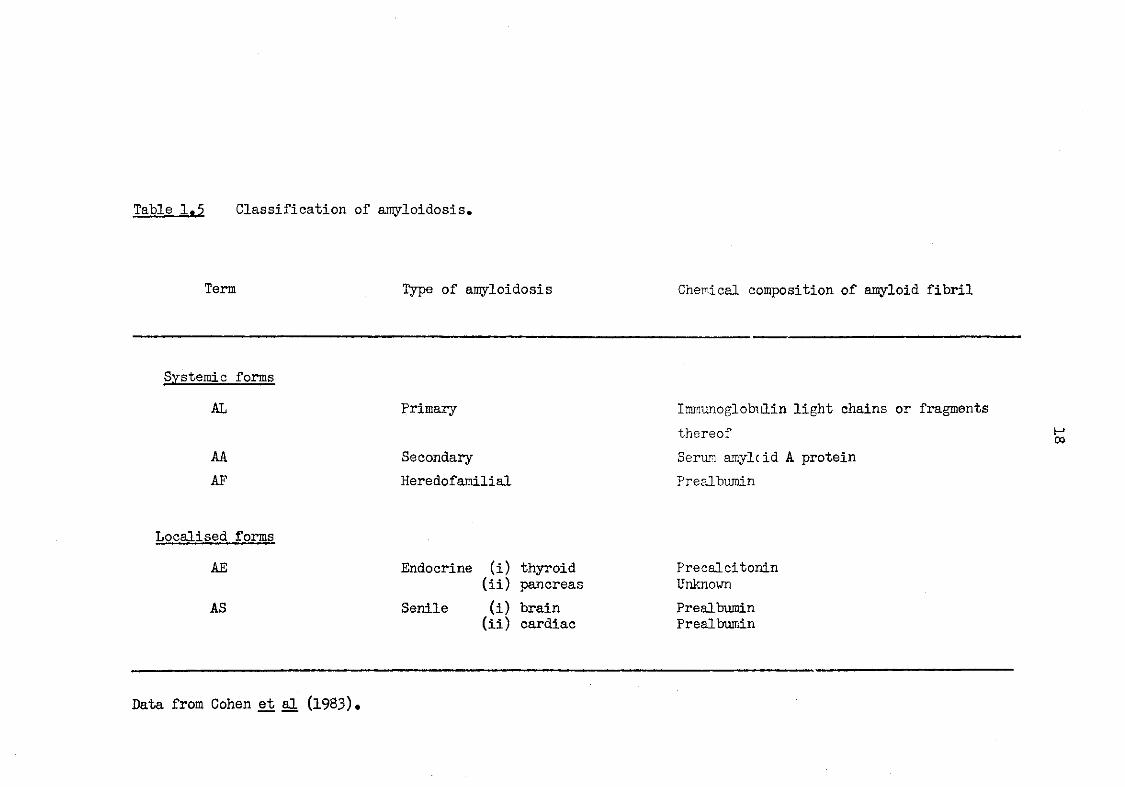
Table 1*5 Classification of amyloidosis*
Term Type of amyloidosis
Systemic forms AL Primary
AA AF
Secondary Heredofamilial
Localised forms AE
AS
Endocrine (i) thyroid (ii) pancreas
Senile (i) brain (ii) cardiac
Data from Cohen et al (1983)
Chemical composition of amyloid fibril
Immunoglobulin light chains or fragments thereof Serum amyloid A protein Prealbumin
Precalcitonin Unknown Prealbumin Prealbumin
19
least a protein which cross reacts with it immunochemically, is a normal constituent of the glomerular basement membrane. Breathnach et aJL (1981) have shown a similar protein is present in elastic tissue. The precise chemical nature of the ligand(s) for SAP is not known. Investigations by Pepys et al (1979b) have shown a marked difference between commercially available agaroses, whether in beaded or powdered form, in their capacity for binding SAP. Such observations suggest that a minor and variable constituent of the polymer provides the ligand. The pyruvate content of the agarose is considered a likely candidate for this role with the amount present reflected in the resins' ability to bind SAP (M.B. Pepys, unpublished observations). Pepys and Baltz (1983) propose that in view of the possibility that the pyruvate residues in agarose are a ligand for SAP, exposed carbonyl groups might be a feature common to the diverse ligands of SAP, namely amyloid fibrils (Pepys et al, 1979b), elastic tissues (Breathnach et al, 1981) and the two normal plasma proteins, fibronectin and C4 binding protein (de Beer et al, 1981; Pepys et al, 1982b). An understanding of the ligand(s) for SAP may prove beneficial in the treatment of amyloidosis.
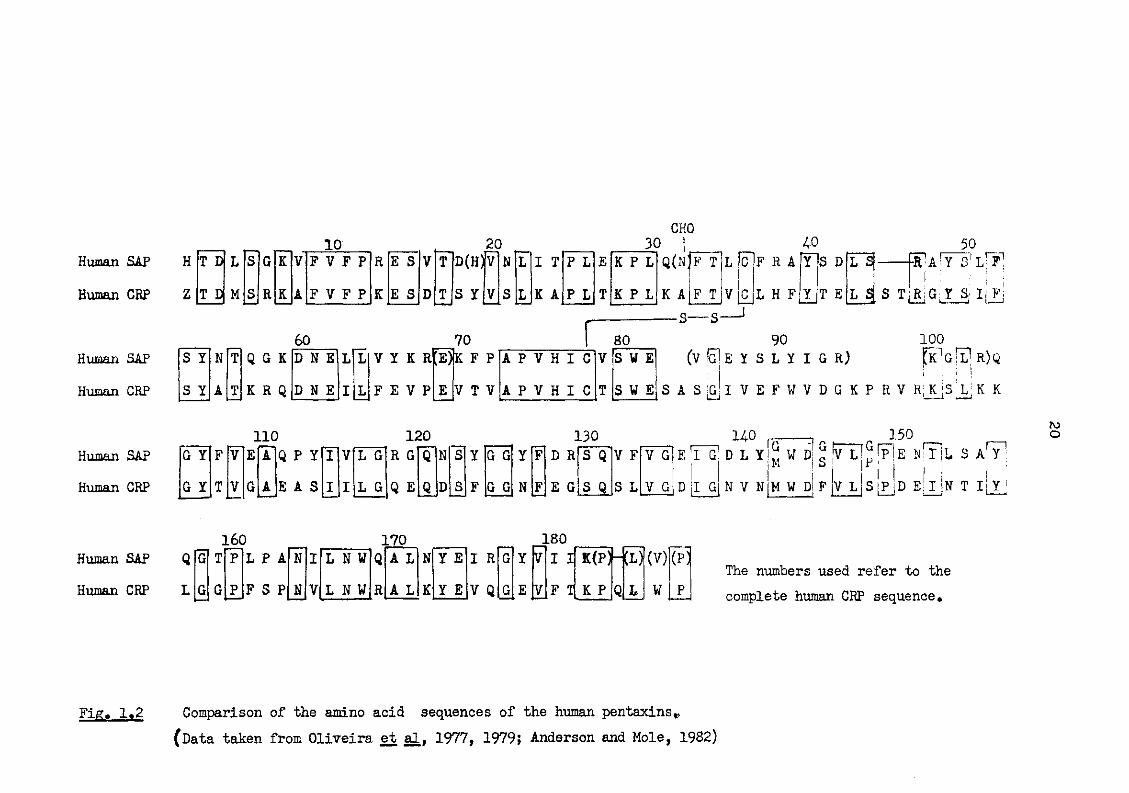
1.8 Current Work The almost complete amino acid sequence of HSAP which
is available (Thompson and Enfield, 19 78; Anderson and Mole, 1982) shows 50% strict residue for residue identity with HCRP (Oliveira et al, 1977, 1979) (Fig. 1.2). Anderson and Mole (1982) propose that the substitution of aspartic acid in HSAP for glutamic acid residue at position 42 in HCRP sequence in the putative phosphoryl choline binding site (Phe-Tyr-Thr-Glu) (Young and Williams, 1978) may partially explain the failure of
Human SAP Human CRP
Human SAP Human CRP
CHO 10 20 30 AO
Human SAP H T D L S G K V F V F P R E S V T 0(H) V N L I T P L E K P L q(n|f t L c F R A YlS D
Human CRP Z T D M S R K A F V F P K E S D T S Y V S L K A P L T K P L K a|f T V c L H F 1 YJT E
50 Fabry's1 L L~Sj-
I j s TjRjG.T S,I
rsn
60 s y
S Y
Q G K K R Q
110
D N £ D N E
V Y K R F E V P
120
m
E
70 K F P V T V
80 90 100 R1G!L|R)Q A P V H I C V S V E (v (g1 E Y S L Y I G R)
A P V H I C T S W E SAS[GJI V E F W V D G K P R V
130 G Y F V E A Q P Y I V L G R G Q N s Y G G Y F D R CO JO
V F V G E I G G Y T V G A E A S I I L G Q E Q D s F G G N F E G S Q S L V G D I G
HO ( _ DLYlRwDefvL iM S
150 Gf;;nrTGFp!E Jlflll s aHt p 1
N V N|M W Pi F V L S [PjD EjJyN T I[Y_
M O
160 170 Human SAP Q G T P L P A N I L N V Human CRP L G G P F S P N V L N W
180 A L A L
Y E Y E
I R V Q
I I F T
K(P)-(L)(V) K P W
(Pi P
The numbers used refer to the complete human CRP sequence.
Pig* 1*2 Comparison of the amino acid sequences of the human pentaxins* (Data taken from Oliveira et al, 1977, 1979; Anderson and Mole, 1982)
21
SAP to bind phosphoryl choline or C-polvsaccharide.
Through the determination of the amino acid sequences of other pentaxin molecules it was hoped to extend our under-standing of these ligand specificities and give further insight into the evolutionary relationship of these closely related molecules.
22 CHAPTER 2
GENERAL MATERIALS AND METHODS
The materials and methods to be discussed here relate to the techniques involved in the initial characterisation of the proteins and the separation of peptides for sequencing. Methods only pertinent to the mass spectrometric and the automated sequencing work can be found in Chapter 3. Details of techniques used in the isolation of MSAP are discussed in Chapter 4.
2.1 Materials
All chemicals used were Analar grade unless otherwise stated. The solvents used in the HPLC separation of peptides were HPLC grade. These solutions were routinely filtered prior to use, with the appropriate aqueous or organic filter; Metricel or Teflon respectively, supplied by Gelman Instruments Company, Northampton, England.
2.2 Methods 2.2.1 Spectrophotometry Optical densities of the protein solutions were measured
in 1 ml quartz cuvettes using a Cary 210 UV/visible spectro-photometer (Varian Associates). The pentaxins, with the exception of MSAP, were assumed to have an extinction coefficient 6] %
m = 10. For MSAP £ ]% =17.6 was used 1cm ^ 1cm (Pepys, 1979).
2.2.2 Pre-treatment of dialysis tubing Dialysis tubing was prepared by sequential boiling in:
(i) 5% (w/v) NaHC03/5mm EDTA (ii) distilled water (iii) 5mm EDTA
23
followed by several washes with distilled water. The tubing was stored in distilled water at 4°C with a
few drops of CHCl^. This treatment was not applicable to "Spectrophor" membrane tubing; Fischer Scientific Co., Pittsburgh, USA, which only required soaking for one hour in distilled water before being used.
2.2.3 Dialysis The pentaxins were supplied frozen in TSE (Appendix B (iii)) .
They were exhaustively dialysed at 4° against 0.05M ammonium acetate using a dialysate volume greater than one hundred times the protein solution volume. After dialysis the A QQ
was measured to ensure no protein had been lost. The dialysed solution was then lyophilised.
2.2.4 Preparation of scintillation cocktail 0.25g POPOP and 5g PPO were dissolved in 660ml toluene
and mixed with 330ml Triton X-100 by gentle stirring. 10-20ml of this prepared scintillant was used for counting 0.5-1.0nCi 14 C radioactivity. Radioactive samples were counted using an
Intertechnique SL30 liquid scintillation counter. 2.2.5 Amino acid analysis of proteins Duplicate samples contained in heat treated 7.5mm (i,d) x
50mm borosilicate tubes were dissolved with 6 NHC1 (Aristar grade to which a crystal of phenol had been added to protect tyrosine side chains against oxidation (Li and Yanofsky, 19 72). The acid contained norleucine as an internal standard (Walsh and Brown, 1962; Riordan and Giese, 1977) at 2nmol norleucine/50iil 6N HC1. The tubes were evacuated, heat sealed and then heated at either 110° or 130° for between 16 and 108 hours. Hydro-lysates were analysed using a Beckman Model 121MB amino acid analyser in conjunction with a Beckman Model 126 data system
(Spackman et al, 1958; Hamilton, 1963). Values for the number of serine and threonine residues contained were extrapolated to zero time, whilst those for leucine, isoleucine and valine were derived from 1/t — • O (Smith et ad, 19 54 ; Smith and Stockwell, 1954; Hill, 1965). All values were corrected for the observed recovery of norleucine. Performic acid oxidation (see 2.2.6) and incorporation of radioactivity by carboxy-
1 4 methylation using ( C) iodoacetic acid (see 2.2.7) were the methods used to determine the cysteine content. Tryptophan is completely hydrolysed by the conditions discussed above and was therefore quantified spectrophotometrically (Goodwin and Morton, 1946; Beaven and Holiday, 1952).
2.2.6 Performic acid oxidation The method used was based on the techniques developed
by Sanger (1949) and Moore (1963). 95|il of 98% formic acid and 5(il 20vol. w e r e m:"-xed
and incubated at 4° for 2 hours (Hirs, 1967) to generate performic acid in situ.
20|il of the performic acid solution was added to approximately 4nmol of protein dissolved in 100|il formic acid/ methanol solution (4:1(v/v)). The solution was incubated for 2 hours at -10° using a propan-2-ol/cardice bath. At the end of the incubation period the solution was lyophilised, ready for acid hydrolysis (2.2.5).
2.2.7 Cleavage of disulphide bonds of proteins The reduction of the cyst ines to cysteine residues and
14 3 the subsequent S-carboxymethylation using either ( C) or ( H) labelled iodoacetic acid was based on Hirs (1967).
1 4 (a) Method using ( C) labelled iodoacetic acid
1-2|imol protein contained in a 25ml Quickfit flask was dissolved in 3-5ml 0.3M tris/6M guanidine-HCl buffer adjusted
25
to pH8.5 with glacial acetic acid. The flask contents were allowed to stand under nitrogen at room temperature for 30 minutes, then dithiothreitol (4mol/mol disulphide bridge anticipated) was added, and the protein solution incubated for 4 hours at room temperature under nitrogen. Radioactive iodoacetic acid (specific activity of 2|iCi/|imol) was added to give a 5-fold molar excess over the dithiothreitol used. The solution was allowed to stand under nitrogen at room temperature in the dark for 30 minutes before 0.1ml -mercaptoethanol was added. After 15 minutes the reduced S-carboxymethylated protein was separated from the reactants by extensive dialysis at 4° against 5%(v/v) glacial acetic acid. To avoid iodination of the tyrosine side residues, aluminium foil was used to cover the vessel used for dialysis. Duplicate 10-50|il aliquots, containing 0.5-1.0nCi, were removed for counting.
The remainder of the S-carboxymethylated material was lyophilised.
3 (b) Method using ( H) labelled iodoacetic acid
The technique was based upon the method used by Anderson and Mole (1982).
The protein, contained in a 10ml glass screw-capped vial, was dissolved at 2-5mg/ml in 0.01M dithiothreitol/0.5M tris/7.5M guanidine-HCl adjusted to pH8.0 with HC1. The dithiothreitol was added to the 0.5M.tris/7.5M guanidine-HCl immediately prior to use. Flushed with nitrogen and capped, the vial was left for one hour at room temperature. Subsequently, the cysteine residues were alkylated for 30 minutes at room temperature under nitrogen by the addition of radioactive iodoacetic acid (2|iCi/(imol) . Following exhaustive dialysis at 4° against 1%(w/v) NH.HCO~, 10-20|il aliquots containing 0.5-1.0nCi were
26
taken for counting in 10ml ACS Amersham aqueous scintillant using a Beckman LS7500 microprocessor controlled scintillation counter. The remainder of the S-carboxymethylated sample was lyophilised.
2.2.8 Chemical modification of lysine residues by succinylation
3 ( H) S-carboxymethylated material was succinylated in 5M
guanidine-HCl pH8.0 by the slow addition of solid succinic anhydride to a final concentration of 50nmol/mol NH2 groups (Klotz, 1967; Anderson and Mole, 1982). The pH was rigidly maintained using small additions of 1M NaOH. The reduced, alkylated and succinylated sample was dialysed at 4° against 1%(w/v) NH^HCO^ using "Spectrophor" membrane tubing.
2.2.9 Determination of the N-terminal residue of a protein The technique used was based on the dansylation procedure
described by Gray (1967; 1972) , Hartley (1970) and Bruton and Hartley (1970).
Approximately 8nmol of S-carboxymethylated protein contained in a heat-treated glass tube (11mm (i.d.) x 50mm) was dissolved in 10 0|il 8M urea containing 0 . 5M NaHCC>3 . 10 0p,l of 5mg/ml DNS-C1 in acetone was added. The tube was covered with clingfilm and incubated at 45° until all the yellow colour had disappeared; this usually took 4 5-60 minutes. To remove excess reagent, urea, DNS-OH and DNS-NH2 from the dansylated protein the solution was extensively dialysed at 4° against 0.05M NH4HC03. The dialysed material was lyophilised. The dansylated protein was dissolved in 150|il/triethylamine, transferred to a heat-treated glass tube (4mm (i.d.) x 30mm) and then dried in vacuo over NaOH. 20|il 6NHC1 (Aristar grade) was added, the tube heat sealed and heated at 110° for 6 hours. After hydrolysis the tube was opened and its contents dried in vacuo over NaOH.
27
5|il 9 5% ethanol was added to the tube. After vortexing briefly, equal amounts were carefully applied to the origin spot on each side of a 7.5cm x 7.5cm polyamide sheet (Cheng Chin Trading Co. Ltd., Taiwan). A standard mixture of dansylated amino acids (2mg/ml in ethanol), namely P,I,F,G,D, H,K2, c K and S was applied to the origin on just one side of the plate. Two dimensional thin layer chromatography, as described by Woods and Wang ( 196 7) and Gray ( 1972) , was performed using the following solutions :-
Solvent 1 : 1.5%(v/v) formic acid Solvent 2 : benzene/glacial acetic acid, 9/1(v/v) Solvent 3 : ethylacetate/methanol/glacial acetic
acid, 20/1/1(v/v) Solvent 4 : glacial acetic acid/pyridine/water/
ethanol, 16/9/1000/3 75(v/v) Solvent 5 : acetone/water/ammonia solution, 20/20/1
(v/v) (used to wash plates). The plates were run until the front reached 1.5cm from
the top. The separated DNS-amino acids were examined using long wavelength ultraviolet irradiation (Woods and Wang, 1967; Hartley, 1970; Gray, 1972) .
2.2.10 Determination of the N-terminal residue of peptides 10111 0.2M NaHC03 and 10nl 2.5mg/ml DNS-C1 in acetone was
added to 1-2nmole peptide contained in a heat-treated glass tube (4mm (i.d.) x 30mm). The tube was left at 45° for approxi-mately one hour, as described in 2.2.9, then dried over NaOH in vacuo. 10|il 6NHC1 (Aristar grade) was used to hydrolyse the peptide for 6 hours, as described in 2.2.9. The tube was opened and its contents dried over NaOH in vacuo. Examination of the dansylated material was carried out as discussed in 2.2.9.
28
2.2.11 Electrophoresis 2.2.11.1 Polyacrylamide gels
The slab gels were prepared using the tris/HCl buffer systems as described bv Margolis and Kenrick (1968), Gabriel (1970),
Laemmli (1970) and Weber and Osborn (1975). The gels prepared between two glass plates (20cm x 16.5cm x 0.3cm) were run vertically using slab gel electrophoresis apparatus which was either made by the workshop of Imperial College, London SW7 or, for work carried out at UMMC, Worcester, Ma. 016 05, USA, the apparatus was obtained from Bio-Rad Laboratories. The plates were always scrupulously cleaned; washed with detergent, rinsed in distilled water and wiped with an ethanol soaked tissue. SDS-polyacrylamide gel electrophoresis
A 1.5mm thick gel capable of visualising 5-15|ig of protein was prepared as described below.
Prepared as a stock solution with bis-acrylamide (acrylamide: bis-acrylamide, 30:0.8), the acrylamide was used at final con-centrations of 12.5 or 15% (w/v) and 3% (w/v) for the resolving and stacking gel respectively. The resolving gel, prepared in 0.04M tris-HCl pH8.8 buffer, consisted of acrylamide and bis-acrylamide, 0.1% (w/v) SDS, 0.12% (v/v) TEMED, and freshly prepared 0.01% (w/v) ammonium persulphate. The latter three ingredients were omitted until the remainder on mixing were degassed with stirring in a Buchner flask under vacuum. Polymer-isation was initiated by the addition of TEMED to the other gel constituents and so required the immediate transfer of the poly-merising gel solution into the gel template using a Pasteur pipette. The template consisted of the two glass plates separated by 1.5mm thick perspex spacer strips, sealed and held together along 3 sides by paraffin wax and "Bull-dog" clips.
29
A 1-2mm film of butan-1-ol was layered over the resolving gel, and the gel allowed to solidify; a process which took 4 5-6 0 minutes. Copious amounts of distilled water were used to rinse away the butan-1-ol. A 1.5mm thick perspex comb was inserted in position over the resolving gel. The stacking gel prepared in this manner as described for the resolving matrix, comprised 3% (w/v/) acrylamide, 0.08% (w/v) bis-acrylamide, 0.1% (w/v) SDS, 0.1% (v/v) TEMED and 0.1% (w/v) ammonium persulphate in 0.128M tris-HCl pH6.5 buffer. On the addition of TEMED to the other components, the stacking was immediately introduced around the sides of the comb; care was taken to avoid the formation of bubbles directly beneath the teeth of the comb. Before running, the spacer along the lower edge of the template was removed and the assembly mounted in the electrophoresis tower. 400ml of electrode buffer (0.025M tris, 0.19M glycine and 0.01% (w/v) SDS) was poured into both buffer chambers; care was taken to remove any air bubbles from the lower edge of the gel. The comb was gently removed beneath the buffer surface and the wells immediately flushed with electrode buffer to expel any unpolymerised acrylamide solution.
Using 5(j,l glass micropipettes, the samples were loaded in 10-20|il of sample buffer (0.015M tris-HCl pH6.5 buffer containing 4.9M urea, 0.1% (v/v) jg -mercaptoethanol, 0.5% (w/v) SDS and 0.05% (w/v) bromophenol blue). Prior to loading the prepared samples were completely dissociated in the sample buffer by heating at 110° for 2 minutes. Electrophoresis was performed either at 20V, or at 100-150V for a rapid, though less well defined, daytime separation. The run was terminated when the bromophenol blue marker dye had migrated to within 1-2cm of the lower edge of the gel. Once the wax and the spacers had been removed, the glass plates were gently prised
30
apart whilst submerged in a container full of water. Before the released gel floated free, the top right hand corner was sliced off to enable recognition of the protein tracks. The protein bands were fixed by immersing the gel in 25% (w/v) trichloroacetic acid for 15-20 minutes. The gel was then rinsed with distilled water and left to stain in a freshly prepared 1:1 (v/v) solution of 0.6% (w/v) Coomassie blue R250 (Sigma Chemicals Ltd.) in methanol: 20% (v/v) glacial acetic acid either overnight at room temperature or for 2 hours at 45°. The gel destained at either room temperature or 45° using 10% (v/v) glacial acetic acid/20% (v/v) methanol solution was examined on a light box. SDS Gradient polyacrylamide electrophoresis
The technique used to prepare a 0.75mm thick SDS 5-20% (w/v) acrylamide gradient system was similar to that described for SDS-PAGE (see above). The SDS 5-20% (w/v) acrylamide resolving gel was prepared with a gradient maker, from two separate resolving gels solutions containing either 5 or 20% (w/v) acrylamide. The acrylamide used was prepared as a stock solution with bis-acrylamide (acrylamide : bis-acrylamide, 30 : 0.8). Distilled water replaced the butan-1-ol used above and electrophoresis was always performed at 3 5V overnight.
The resolving gels included 0.1% (w/v) SDS, 0.05% (w/v) ammonium persulphate and 0.03% (v/v) TEMED in 0. 4M tris-HCl pH8.8 buffer. The 20% (w/v) acrylamide resolving gel also contained 7.4% (w/v) sucrose. The stacking gel solution in 0.06M tris-HCl pH6.8 buffer comprised 3% (w/v) acrylamide, 0.08% (w/v) bis-acrylamide, 0.1% (w/v) SDS, 0.1% (w/v) ammonium persulphate and 0.075% (v/v) TEMED. The sample buffer consisted of 1.98% (w/v) SDS, 9.9% (v/v) glycerol and 5% (w/v) bromophenol blue in 0.062M tris-HCl pH6.8 buffer. The electrode
31
buffer was prepared as 0.05M tris/0.01% (w/v) SDS/0.38M glycine.
The gels were softer and more fragile than those discussed above, consequently extra care was needed when prising the plates apart following electrophoresis.
Staining was carried out at 37° for 3 0-6 0 minutes using a solution of 0.2% (w/v) Coomassie blue R-250 (Sigma Chemicals Ltd.) in 5% (v/v) methanol/7.5% (v/v) glacial acetic acid. The stained gel was rinsed with distilled water and then destained at 37° using 5% (v/v) methanolfl.5% )v/v) glacial acetic acid. During both incubations the gel was gently agitated.
2.2.11.2 High voltage paper electrophoresis Separation of peptides at pH6.5 The method used was based on Michl (1951). The pH6 .5
electrophoresis buffer used comprised pyridine:glacial acetic acidrdistilled water (10:0.3:89.7 (v/v)). All the surfaces liable to be in contact with the electrophoresis paper were cleaned with the pH6.5 buffer, and disposable gloves were worn at all times.
The sample to be resolved was dissolved in 50-500 |il of the electrophoresis buffer and loaded on to a sheet of Whatman No. 1 chromatography paper in a narrow band, parallel to, and 30 cm from, the edge of the paper to be placed closest to the anode. The sample was applied in 2-5 M- 1 aliquots. Each ali-quot was dried before the addition of the next. Electrophoresis markers, DNS-RR, DNS-R and DNS-OH were also applied to the paper in a similar manner. Throughout the sample application, to avoid contamination, the origin was held away from the bench surface by two glass rods placed beneath the paper.
The "wetting up" process using the electrophoresis buffer
32
was begun at the upper and lower edges of the paper and gradually proceeded towards the centre, thus enabling the opposing buffer fronts to meet at the described sample origin. Excess buffer on the periphery was blotted, using Post-slip chromatography paper.
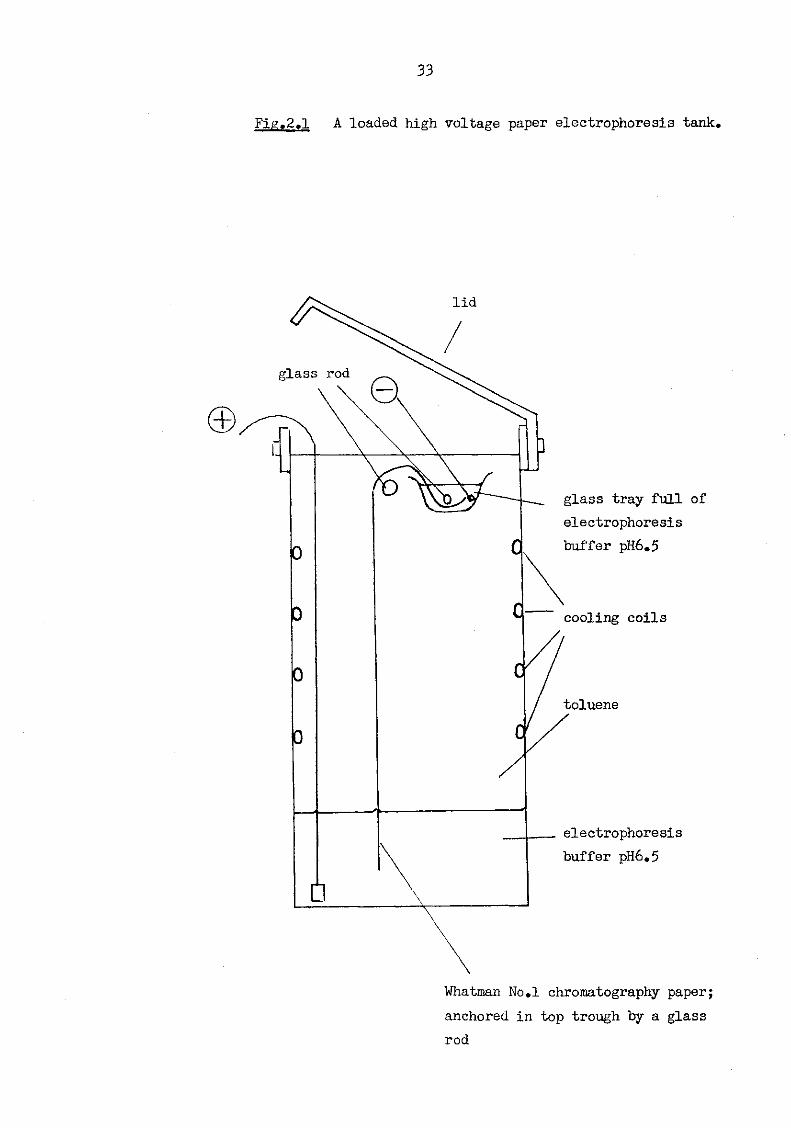
The paper was then gently placed in an electrophoresis tank (Fig. 2.1) containing toluene as the coolant, and run at 3kV for one hour. During electrophoresis the tank was cooled by coils through which glycerol solution flowed. Finally, the electrophoresis paper was air-dried in a fume cupboard before being stained (see 2.2.12.2 and 2.2.13.2).
2.2.12 Stains used to detect carbohydrate 2.2.12.1 Periodic acid - Schiffs reagent stain The stain used to visualize glycoproteins following PAGE
was based upon Grossman and Neville (1971) . Following an overnight incubation at room temperature in
40% (v/v) methanol/7% (v/v) glacial acetic acid, the gel was incubated at 4° for 6 0 minutes in the dark with 1% (w/v) periodic acid in 7% (v/v) glacial acetic acid. After several washes with 7% (v/v) glacial acetic acid the gel was immersed in Schiffs reagent, left at 4° in the dark for 60 minutes and finally washed with 1% (w/v) Na2S205 in 0.1N HC1. Carbohydrate stained a rose-pink colour. To independently locate protein bands by fluorescence under longwave ultraviolet irradiation, the PAS-stained gel was incubated for 60 minutes at room temperature with magnesium salt of 8-anilinonaphthalene sulphonic acid (10 mg anilinonaphthalene sulphonic acid/100 ml
1% (w/v) Na^So0j- in 0 . 1N HC1) . 2 2 b
2.2.12.2 Ammoniacal silver nitrate stain
The method used (C. Bruton - personal communication) to
visualise carbohydrate was present in peptides separated by
33
Fig.2.1 A loaded high voltage paper electrophoresis tank.
lid
glass rod
glass tray full of electrophoresis buffer pH6.5
cooling coils
toluene
electrophoresis buffer pH6.5
Whatman No.l chromatography paper; anchored in top trough by a glass rod
34 high voltage paper electrophoresis, required the electrophoresis paper to be sprayed with 50 mM potassium periodate, dried and then sprayed with 5% (w/v) ammoniacal silver nitrate solution. The carbohydrate was seen as a white area which, on standing, turned brown/black against a brown background. This stain could follow the fluorescamine stain used to visualise peptides after high voltage paper electrophoresis.
2.2.13 Stains used to detect protein 2.2.13.1 Coomassie blue R250 stain See 2.2.11.1 for details. 2.2.13.2 Fluorescamine stain (Udenfriend et al, 1972)
Used to detect peptide following high voltage paper
electrophoresis, the fluorescamine was prepared in 1% (v/v)
pyridine. The amount of fluorescamine present was initially
2% (w/v), an amount which was gradually increased until the
peptides could just be detected under longwave ultraviolet
irradiation.
2.2.14 Techniques used to separate peptides
2.2.14.1 Molecular exclusion chromatography
Bio-gel P60
The system used to separate large molecular weight
fragments produced by cyanogen bromide treatment was Bio-gel
P60 (Bio-Rad Chemicals Ltd.) equilibrated in either 3.5% (v/v)
formic acid in 8M urea, or 5% (v/v) formic acid. Eluted
peptides were collected using a LKB Model 7000 fraction
collector.
0.01M ammonium acetate pH6.4
The Model LC5000 HPLC system (Varian Associates), equipped
with a Rheodyne injection system, was used to maintain an
isocratic system in 0.01M ammonium acetate adjusted to pH6.4
with glacial acetic acid. The separation used a 0.75 cm (i.d.)
x 50 cm preparative TSK 20 00SW column supplied by Varian Associates (Rokushika et al, 1979). The sample, contained in an eppendorf tube, was dissolved in the equilibrating solution at a concentration of 1-2 mg/ml, vortexed, and then centrifuged for 4 minutes in an eppendorf centrifuge Model 5412. The supernatant produced was used for injection. Monitored at 280 nm, the eluted material was collected using the LKB Model 7000 fraction collector.
15% (v/v) propan-1-ol/20% (v/v) glacial acetic acid Four 1-125 columns, each 0.78 cm (i.d.) x 30 cm (Waters
Associates) were connected in series onto a Model 440 HPLC system containing a U6I< injection system (Waters Associates). Peptide resolution was achieved using an isocratic system of 15% (v/v) propan-1-ol /20% (v/v) glacial acetic acid (Anderson and Mole, 198 2) . The sample was prepared as described for the 0.01M ammonium acetate pH6.4 system. The eluted peptides were monitored at 280 nm and were manually collected in accordance with the A 2 Q Q profile.
2.2.14.2 Reverse phase chromatography 0.01M ammonium acetate/acetonitrile pH3.5 system The HPLC system described for the molecular exclusion
system using 0.01M ammonium acetate pH6.4 was used in connection to an analytical C^g MCH-5 (0.4 cm (i.d.) x 15 cm) supplied by Varian Associates to separate peptides using the following gradient program :-
A 15 minute isocratic period in Solvent A, followed by a linear gradient over 10 minutes to 98% solvent A/2% Solvent B and then a linear gradient over 10 minutes to 70% Solvent A/ 30% Solvent B, such that;
Solvent A :- 0.01M ammonium acetate adjusted to pH3.5 with glacial acetic acid
36 Solvent B :- acetonitrile.
The eluted peptides were collected using the LKB Model 7000 fraction collector.
Trifluoroacetic acid/propan-1-ol pH2.5 and glacial acetic acid/acetonitrile pH6.0 systems.
These systems used either an analytical or preparative C^g |i-Bondapak column (0.38 cm (i.d.) x 30 cm and 0.78 cm (i.d.) x 30 cm respectively; Waters Associates). The column was con-nected to a Model 440 HPLC system equipped with two Model M6000 pumps, a U6K injection system and a Model 660 solvent programmer (Water Associates). The eluted peptides were usually monitored at two wavelengths of 206 nm and 280 nm. The &2Q6 detection was achieved by incorporating a LKB Uvicord detector system in series after the 280 nm ultraviolet filter system (Anderson et aT, 1981). A Fischer recorder series 5000 was used to record the ultraviolet profile. Eluted peptides were manually collected in accordance with the ^206 Pr°file* Samples were prepared for injection as described for the HPLC molecular exclusion systems.
Trifluoroacetic acid/propan-2-ol pH2.5 system Used: Solvent A :- 0.1% (v/v) trifluoroacetic acid
Solvent B :- 0.1% (v/v) trifluoroacetic acid/ 40% (v/v) propan-1-ol
Glacial acetic acid/acetonitrile pH6.0 system Used: Solvent A :- 0.1% (v/v) glacial acetic acid adjusted
to pH6.0 with ammonia solution Solvent B :- 0.125% (v/v) glacial acetic acid/60%
(v/v) acetonitrile adjusted to pH6.0 with ammonia solution.
Peptide separation using these systems was achieved by using a 10 minute isocratic period in Solvent A, followed by a linear
gradient over a 6 0 minute period from Solvent A to Solvent B.
2.2.15 Digestion of peptides and proteins using carboxypeptidase Y
The method used was based on Ambler ( 1967) , Hayashi (1977) and Margolis et al (1978). The protein substrate (5-60 nmol) was digested with carboxypeptidase Y from bakers' yeast (Sigma Chemicals Ltd.) at E:S (w/w) of either 1:20 or 1:100. The reaction was carried out at 37° in 100-500 pi of 0.05M pyridine acetate adjusted to pH5.5 with glacial acetic acid, which contained an internal standard of norleucine (2 nmol/20 pi). Aliquots removed at appropriate time points, e.g. 0, 5, 10, 25, 50 etc., were acidified with 4 pi glacial acetic acid and then lyophilised. The amino acids released were quantified using the Beckman Model 126 data system (Spackman et aJL, 19 58; Hamilton, 1963). An enzyme blank was examined in the same manner.
2.2.16 Pyroglutamate amino peptidase treatment to remove the pyrrolidone carboxylic acid residues
The PCA peptidase from calf liver (Boehringer-Mannheim :-EC 3.4.11.8) was used as described by Podell and Abraham (1978).
2-3 mg of reduced and carboxymethylated protein, dissolved at 1 mg/ml in 0.1M Na2HPC>4 adusted to pH8.0 with 0.1M NaH2PC>4, containing 0.005M dithiothreitol, 0.01M EDTA and 5% (v/v) glycerol, was dialysed overnight in the same solution. The dialysed protein solution was transferred to a 5 ml glass screw capped vial and then 0.1 mg of PCA peptidase, containing approxi-mately 0.005 mg of active enzyme, was added. The vial was flushed with nitrogen, capped and left at 4° for 9 hours. A further 0.1 mg of PCA peptidase was added in a similar manner, and the vial contents were then stirred for 10 hours at room temperature. Finally, the treated protein sample was extensively dialysed at 4° against 0.05M glacial acetic acid,
38
and then lyophilised ready for automated sequencing, using
a Beckman Model 89 0C automated sequenator. 2.2.17 The removal of carbohydrate using alkaline
borohydride The protein, dissolved at 1-2 mg/ml in 0.05M K0H/1M sodium
borohydride, was incubated at 45° for 24 hours (Carlson, 1968) . Following acidification to pH5.0 using glacial acetic acid, the carbohydrate-free protein was separated from the sugar by molecular exclusion HPLC using 0.05M ammonium bicarbonate. The HPLC system used was as described for the 0.01M ammonium acetate pH6.4 system discussed in 2.2.14.1. The eluted protein was lyophilised ready for use.
39 CHAPTER 3
MATERIALS AND METHODS USED IN MASS SPECTROMETRIC AND AUTOMATED
SPINNING-CUP SEQUENCING
3.1 Materials and methods used in mass spectrometric sequencing 3.1.1 Materials The chemicals used were reagent grade unless otherwise
stated. All glassware was scrupulously cleaned with detergent, rinsed well with distilled water and finally acetone, before being left to dry.
Samples were analysed using either EIMS or FABMS, on the
Kratos high field MS50 or the VG Analytical high field ZAB mass spectrometers respectively. Both instruments were operated at 8KV accelerating voltage. Spectra were recorded on ultraviolet oscillographic paper and were manually counted.
The samples were loaded for EIMS and FABMS in the follow-ing ways :-EIMS. The derivatised sample, dissolved in CHCl^, was loaded on to a quartz tip and inserted into the ion source and volatilized using a temperature gradient from 150°-350°. FABMS. The sample was dissolved in 5% (v/v) glacial acetic acid (1-2 nmol/|il) and 1-2 pi was added to 1-2 pi of glycerol on the metallic target ready for bombardment by accelerating xenon atoms. The atom gun was operated at 8-10KV.
3.1.2 Methods 3.1.2.1 Methods used in elucidating the structure of
the blocked amino-terminus of a protein
(i) The following three steps were sequentially performed on 50-100 nmol of protein :-
(a) formylation
(b) enzymatic digestion
40
(c) permethylation (Morris et al, 1971, 1973;
Morris and Dell, 19 75).
(a) Formylation procedure The protein was dissolved in 1 vol. of 98% formic acid.
0.5 vol. of glacial acetic acid was then added. This reaction mixture was left for 30 minutes at room temperature and then lyophilised. (b) Enzymatic digests
(i) Elastase Formylated protein was digested with elastase in 0.05M ammonium bicarbonate for two hours at 37°. (E:S = 1:100 (w/w) ) .
(ii) Chymotrypsin As for the elastase digest, except that the incubation time was 4 hours and E:S = 1.50 (w/w).
(c) Permethylation procedure A DMSO base was freshly prepared by heating sodium
hydride in DMSO (approximately 50 mg/ml) at 90° for 15 minutes. A colour change of grey turning to brown should be observed. The solution was spun in a MSE Super Minor centrifuge at 3000 rpm for 2-3 minutes; this produces a honey brown supernatant.
Using a Pasteur pipette, 15-20 drops of the DMSO base were added to the digested-formylated protein contained in 2 drops of DMSO, and gently mixed. After 6 0 seconds, an excess of methyl iodide (approximately 0.5 ml); either CH^I or CD^I, was introduced. The reaction was allowed to proceed for exactly 70 seconds when it was quenched with 1-2 ml of distilled water. The blocked permethylated amino terminal peptide was then extracted with 1 ml of CHC13. The CHCl^ layer was washed twice with distilled water and then evaporated in a stream of
a
nitrogen. The isolated blocked peptide was analysed by EIMS. (ii) Derivatization procedures for peptides to be
examined by FABMS (a) Esterification procedure The peptide was dissolved in a solution of methanol :
deuteromethanol (1:1 (v/v)) acidified to approximately pH1.0 with dry HC1 gas, vortexed, and then left at room temperature for 2 hours. The solution was evaporated to dryness under a stream of nitrogen (Hunt and Morris, 1973) .
(b) Acetylation procedure Acetylation was performed by dissolving the dry peptide
in one drop of distilled water and then adding 0.5 ml of a solution of acetic anhydride/methanol (1:3 (v/v)) (Thomas et al, 1968) . The reaction proceeded at room temperature for 3 hours. Nitrogen was used to evaporate off the solution.
In some experiments the acetylation reaction was performed whilst the sample was on the MS target, using a 1:1 (v/v) mixture of acetic anhydride : deuteroacetic anhydride,
(iii) Carboxypeptidase B digestion DFP-treated carboxypeptidase B (Sigma Chemicals Ltd.) was
used at an E : S - 1 : 100 (w/w). The sample, dissoved in 50mM
ammonium bicarbonate, was incubated at 25° for 2 hours. The
reaction was terminated by lyophilisation. The digest was H.R.Morris and M.Panico
examined without further purification by FABMS^personaI c o m m U n i c a t i o n )
3.1.2.2 Methods used to investigate carbohydrate moieties (i) O-acetolysis procedure (Stewart et al, 1968) 25-50 nmol of the protein was dissolved in 1 vol. glacial
acetic acid. 1 vol. acetic anhydride and 0.1 vol. conc. H2SC>4 were then introduced. The mixture was incubated at 40°. Aliquots containing approximately 5 nmol, removed at appropriate time points, were quenched by 1 ml distilled water. The
42
acetylated carbohydrate fragments were isolated by extraction into 1 ml of CHClg. The extract was washed twice with distilled water and then dried under a stream of nitrogen. The samples were analysed by FABMS.
(ii) De-O-acetylation procedure Acetolysed samples were dissolved in 1 vol. of HPLC grade
methanol. 0.25 vol. of 28% aqueous ammonia solution was added and the solution left at room temperature for 24 hours (Nilsson and Zopf, 1982) . Finally, the mixture was dried under a stream of nitrogen and analysed by FABMS.
3.2 Materials and methods used in spinning cup sequencing 3.2.1 Materials Sequencer grades of Quadrol, phenylisothiocyanate and
anhydrous heptafluorobutyric acid were purchased from Beckman Instruments, California, USA, whilst heptane and chloro-1-butane were obtained from Burdick and Jackson Laboratories Inc., Muskegan, Michigan, USA.
The propan-1-ol used was OMNO-SOLV (glass distilled) HPLC grade supplied by MCB Manufacturing Chemicals Inc., Cincinatti, Ohio, USA.
Polybrene was bought from Aldrich Chemicals Co.
All solvents used in the HPLC system for the quantitation of PTIl derivatives were HPLC grade. The buffers used in this separation were filtered using Metrical membrane filters available from Gelman Instrument Co., Ann Arbor, Michigan, USA. Milli Q water was used throughout.
A Beckman Model 890C sequenator equipped with a cold trap was used for sequencing.
4 3
3.2.2 Methods (Allen, 1981; Bhown et al, 1982; J.K. Anderson, personal communication)
The sample to be sequenced was combined with the polybrene film in the rotating spinning cup and subjected to a series of solvent washes before it was dried as a thin film. The sequencing program (see Appendix A(i)) then applied, can be summarised as follows :-
The coupling reaction achieved by the introduction of 5% (v/v) phenylisothiocyanate in heptane followed by 0.1M Quadrol in 75% (v/v) propan-1-ol is allowed to proceed for 20 minutes at approximately 53-55°. Excess reagent and solvents are removed in vacuo. Quadrol and by-products are then extracted with benzene and ethyl acetate. The film of phenylthiocarbamyl-protein is dried, and heptaf luorobutyric acid introduced to initiate a 2 minute cleavage reaction. The heptafluorobutyric acid is removed in vacuo and the cleaved anilinothia zolinone is extracted with chloro-1-butane and subsequently collected in a chilled fraction collector tube.
By repeating the cycle of events discussed above, the sequential removal of amino acids from the N-terminal end of the sample, as their anilinothiazolinone derivatives is achieved. The unstable anilinothiazolinone derivatives are quickly converted to their respective PTH derivative form and are then identified using HPLC systems.
Details of the procedures involved here will now be described.
3.2.2.1 Preparation of the spinning cup seguenator The head of the cup, containing the ports which introduce
solvents and reagents, and the "scoop", was sequentially washed with glacial acetic acid, Milli Q water and finally acetone. All "0" ring vacuum seals were wiped with a tissue and lightly
u
greased with silicone grease.
The glass spinning cup was sequentially cleaned with 3
washes of each of the following :-
(i) 0.2M NaOH
(ii) Milli Q water
(iii) glacial acetic acid
(iv) Milli Q water
(v) acetone
2 mg of Polybrene was then added to the cleaned, rotating
cup as a 400 pi aliquot of a 5 mg/ml aqueous solution. A
Polybrene pre-wash program was run (see Appendix A(ii)). This
program served to eliminate any groups introduced with the
Polybrene which might interfere with the coupling reaction.
The lyophilised sample was dissolved in 200 pi 88% formic
acid. 200 pi Milli Q water was added and the solution vortexed
briefly. The desired amount of the prepared sample; 50-90%
(v/v), was then carefully pipetted from a Gilson pipette into
the rotating cup.
2 nmol of norleucine, added as a 20 pi aliquot of a 1 nmol
norleucine/10 pi aqueous solution, was pipetted into each tube
used for the collection of fractions from the sequenator.
3.2.2.2 Conversion of the anilinothiazolinone residue to
the phenylthiohydantoin derivative
The tubes containing the anilinothiazolinone samples were
removed from the sequenator and dried under a stream of nitrogen
if not completely dry. After adding 200 pi 25% (v/v) trifluoro-
acetic acid to each tube, the tubes were flushed with nitrogen,
capped, vortexed briefly and placed in a covered water bath at
55° for 30 minutes. Finally, the samples were either dried
under a stream of nitrogen or lyophilised to remove the tri-
fluoroacetic acid.
45
3.2.2.3 Phenylthiohydantoin identification The PTH1s were identified and quantitated by HPLC on a
Waters Associates Model 440 HPLC in conjuction with a Waters Associates Model 720 system controller and Model 71 OB Intelligent Sample Processor, and an integrator system.
The Hewlett Packard integrator and on-line programmable desk calculator used a calibration mixture of PTHs (see Appendix A(iii)) to set time windows for each peak to be quantified. Two buffer systems of pH4.74 and pH3.85 in acetonitrile and methanol respectively (see Appendix A(iv)) were run to quantitate the PTH. For details of these HPLC systems and the separations achieved see Appendix A(v).
4 6
CHAPTER 3
THE ISOLATION OF SERUM AMYLOID P-COMPONENT IN THE MOUSE
4.1 Materials and Methods 4.1.1 General materials and methods
Analytical grade chemicals were used throughout. A280 readings of the protein solutions were measured in 1 ml quartz cuvettes using a Model CE292 digital UV spectrophotometer (Cecil
f 1 % Instruments, Cambridge). The extinction coefficient c. ° = 17.6 ^ 1cm for MSAP was used (Pepys, 1 9 79 ) . All column separations used during the isolation procedure were performed at 4°.
4.1.2 The induction and isolation of murine serum amyloid P-component
MSAP is a normal plasma protein with resting levels varying amongst strains. In MF1 mice the resting level is 80-100 |ig/ml and during an acute phase response this can rise to 400 pg/ml or higher (M.L. Baltz - personal communication). To increase SAP amounts to acute phase levels eight week old male MF1 outbred mice, obtained from OLAC Ltd., Bicester, Oxon., were subcutaneously injected with 2% (w/v) AgNO^, a potent inflammatory agent (Kisilevsky et al, 1977). The MSAP was isolated from the acute phase serum by its calcium-dependent affinity for agarose (Pepys et al, 1977b; Pepys, 1979 ).
4.1.3 Laurell rocket Immunoelectrophoresis (Laurel1, 19 72) Routinely used monospecific sheep anti-MSAP serum denoted
N474/3 (obtained by repeated immunisation of sheep with pure MSAP in complete adjuvant (Pepys, 1 979 )) was included at 3% (v/v) in 1% (w/v) agarose (Indubiose A37, Industrie Biologique Francaise SA, Gennevilliers, France) prepared in 0.075M barbitone buffer/0.01M EDTA/0.1% (w/v) NaN pH8.6 (Appendix B(i)). The
agarose solution was heated in a boiling waterbath and allowed to cool to 56° before the addition of 3% (v/v) N474/3. Immediately the gel was poured using one of the templates shown in Fig. 4.1. Heated glass pipettes and vials were used during the gel preparation to avoid premature gelation. Wells capable of holding 2 |il of antigen were punched side by side at one end of the gel. Once loaded, electrophoresis was per-formed at 200V (6-8 V/cm) for 6 hours using the apparatus illustrated in Fig. 4.2. After electrophoresis, non-precipitated protein was removed from the gel by a 2 hour immersion at 37° in 5% (w/v) NaCl containing 0.02v (w/v) NaN^; during this period the "film-bound" gel separated from the supporting plate. The s,ample wells were filled with the barbitone/agarose mixture described earlier; this was allowed to solidify. The gel, covered with tissues spread over a layer of Whatman 3MM filter paper, was pressed for one hour beneath a 1-2 kg weight and then dried with a warm air drier. A staining solution of 0.2% (w/v) Coomassie blue R-250 (Sigma Chemicals Ltd.) in 20% (v/v) methanol/12.5% (v/v) glacial acetic acid (Laemmli, 1970) was employed to visualise the rockets. The gel was destained in 20% (v/v) methanol/12.5% (v/v) glacial acetic acid.
4.2 Results
4.2.1 The induction of acute phase levels of murine serum
amyloid P-component
The mice were subcutaneously injected with 0.5 ml of 2%
(w/v) AgNO^• 24-48 hours after injection, acute phase serum
was collected from anaesthetised animals by bleeding from the
brachial artery. The blood was pooled, allowed to clot and
centrifuged at 4° for 15 minutes. Laurell rocket immunoelectro-
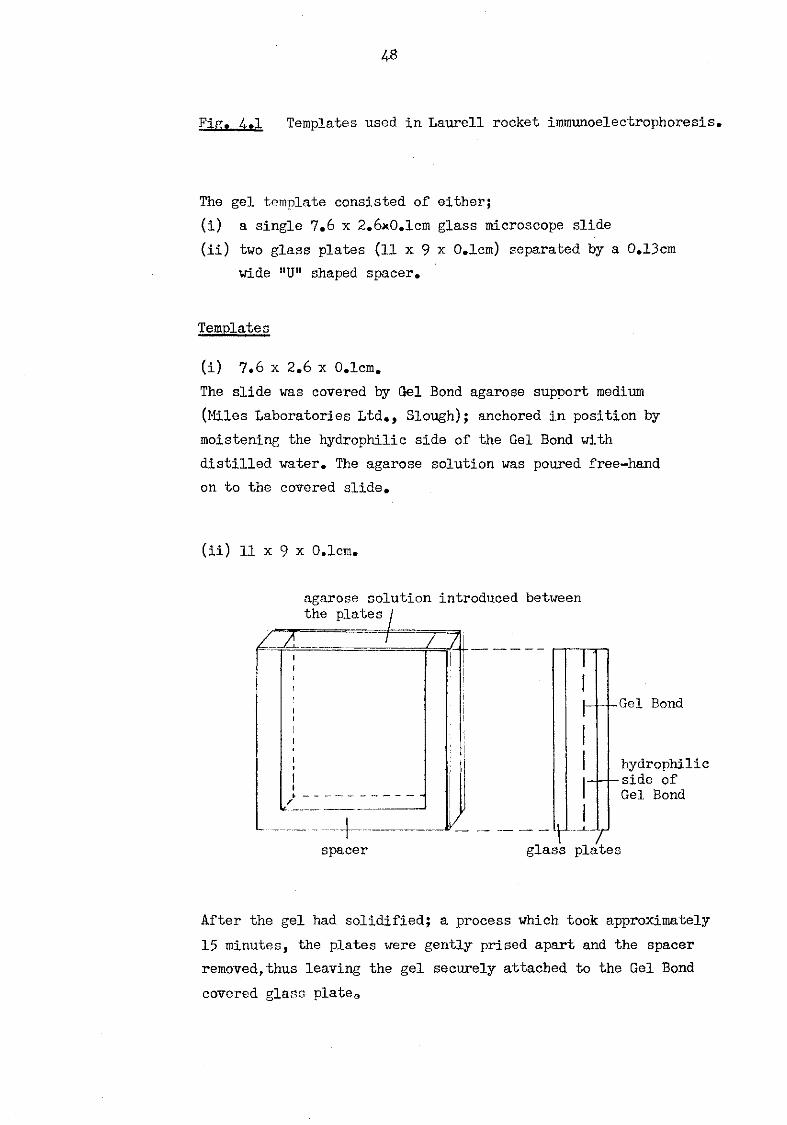
I&
Fjg. 4..1 Templates used in Laurell rocket immunoelectrophoresis.
The gel template consisted of either; (i) a single 7.6 x 2.6x0.lcm glass microscope slide (ii) two glass plates (11 x 9 x 0.1cm) separated by a 0.13cm
wide "UM shaped spacer.
Templates
(i) 7.6 x 2.6 x 0.1cm. The slide was covered by del Bond agarose support medium (Miles Laboratories Ltd., Slough); anchored in position by moistening the hydrophilic side of the Gel Bond with distilled water. The agarose solution was poured free-hand on to the covered slide.
(ii) 11 x 9 x 0.1cm.
agarose solution introduced between the plates
•Gel Bond
hydrophilic side of Gel Bond
spacer glass plates
After the gel had solidified; a process which took approximately 15 minutes, the plates were gently prised apart and the spacer removed,thus leaving the gel securely attached to the Gel Bond covered glass plate©
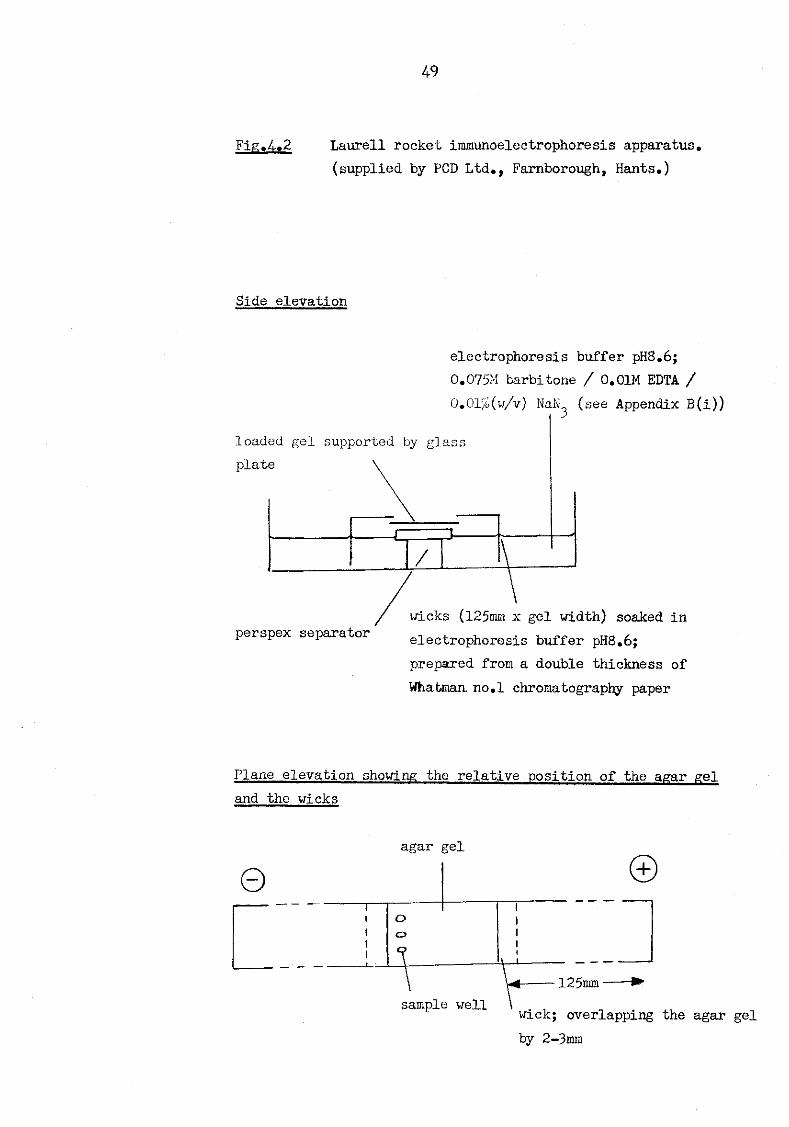
49
Fig.4»2 Laurell rocket Immunoelectrophoresis apparatus. (supplied by PCD Ltd., Farnborough, Hants.)
Side elevation
loaded gel supported by gla: plate
electrophoresis buffer pHS.6; 0.075M barbitone / 0.01M EDTA / 0.01%(w/v) NaN (see Appendix B(i))
perspex separator wicks (125mm x gel width) soaked in electrophoresis buffer pH8.6; prepared from a double thickness of Whatman no.l chromatography paper
Plane elevation showing the relative position of the agar gel and the wicks
0 agar gel
1 1 t 1 1 1
o o
1 1 1 1 1
\ 1
©
125mm sample well wick; overlapping the agar gel
by 2-3 mm
50
phoresis (4.1.3) was used to determine that approximately 50 mg of MSAP was present (Plate 4.1 and Table 4.1).
4.2.2 Isolation procedure The MSAP was isolated from the acute phase serum by its
calcium-dependent affinity for agarose (Pepys et al, 1977b; Pepys, 1979 ) using Sepharose 4B (Pharmacia Chemicals, Poole, Dorset) in a 5 cm x 200 cm (i.d. x ht.) K50 column (Pharmacia). The resin was equilibrated in TSC (see Appendix B(ii)). After loading the acute phase serum, the column was run at 100 ml/hr in TSC until no further material absorbing at 280 nm was observed. The non-adsorbed serum was stored at -20° for later investigations to evaluate the amount of MSAP remaining.
The bound material was eluted using TSE (see Appendix B(iii)). Elution was stopped when the &280 reading returned to zero. The eluted material (9.69 mg, as determined from A 2 Q Q ) was concentrated by ultra-filtration on an Amicon PM30 membrane (Amicon Ltd., Woking, Surrey) to yield 6.7 mg pure material as determined using SDS-PAGE. This loss of MSAP could be partially explained by the non-specific binding to the membrane. However, the major loss was probably due to dissociation of MSAP into its individual subunits, each approximately 25 000 daltons, which would pass easily through the PM30 membrane (retentivity range > 30 000 daltons). The relatively poor binding of MSAP to the Sepharose 4B column was disappointing. Possible explanations considered were:
a) insufficient calcium in TSC b) the binding site(s) for MSAP (still to be elucidated)
on the resin had been destroyed. The latter theory appeared to be more likely when it was
subsequently discovered that the Sepharose 4B column had been used in other studies which incorporated a cleaning step
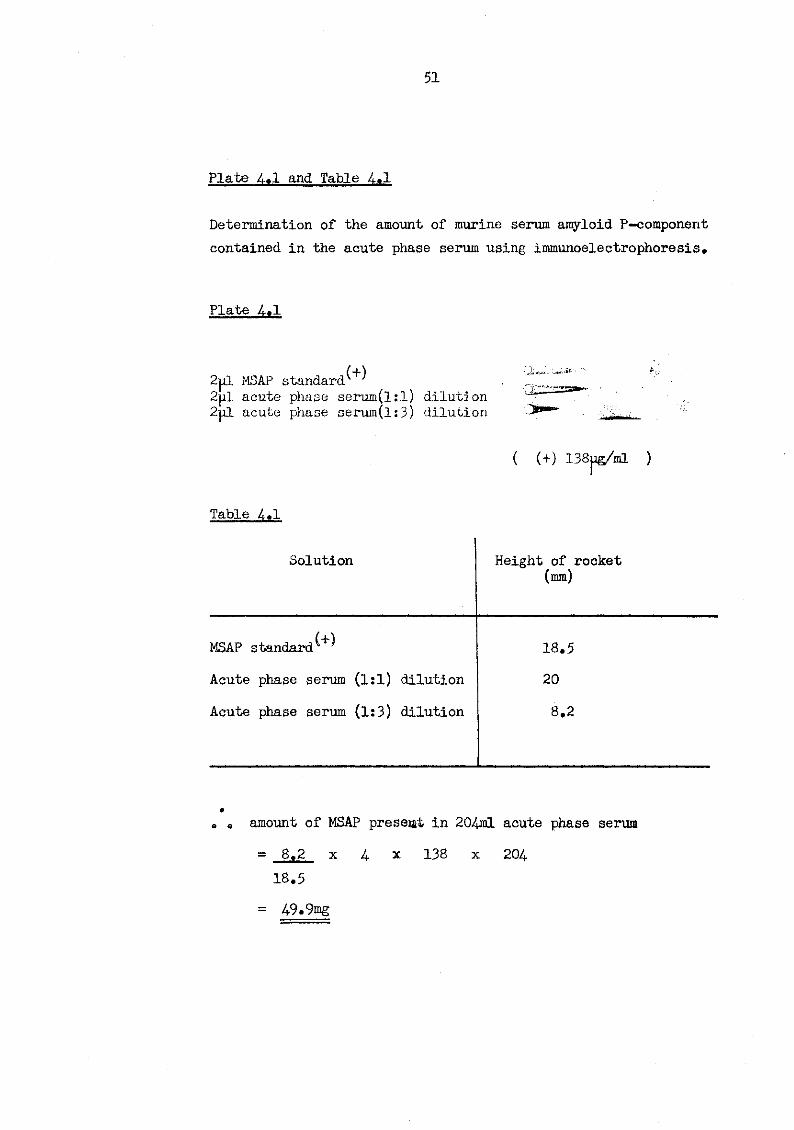
51
Plate 1 and Table 4.1
Determination of the amount of murine serum amyloid P-component contained in the acute phase serum using Immunoelectrophoresis.
Plate 4.1
2jpl MSAP standard^ 2|il acute phase serum(l:l) dilution 2pl acute phase serura(l:3) dilution
Table 4-«l
Solution Height of rocket (mm)
MSAP standard^ 18.5 Acute phase serum (1:1) dilution 20 Acute phase serum (1:3) dilution 8.2
. . amount of MSAP present in 204ml acute phase serum
- 8*2 x U * 138 x 204. 18.5
= 49.9mg
( (+) 138ug/ml )
52
involving 0.2M glycine-HCl pH2.2. The trial experiment discussed in 4.2.3 was undertaken to investigate this theory and also to evaluate, from the agarose-based resins available, the resin best suited to replace the Sepharose 4B material. The results appeared to substantiate the destruction of the binding site(s) since "fresh" Sepharose 4B from the same batch used in the column had the better binding capacity for MSAP (Table 4.1). However, the only resin available in sufficient quantity to prepare a column of similar dimensions to the Sepha-rose 4B column was Ultrogel ACA 44. This resin differs from the Ultrogel ACA 34 material examined in 4.2.3 only in its agarose: acrylamide ratio and was therefore expected to have a similar binding affinity for MSAP. Hence, the non-adsorbed serum fraction obtained from the Sepharose 4B stage was passed over an Ultrogel ACA 44 column in the same manner as described for the Sepharose 4B column.
The MSAP fraction was further purified by gel filtration using Sephacryl S-300 equilibrated in TSE (see Fig. 4.3).
The purification of MSAP is summarised in Table 4.2. 4.2.3 Trial experiment to select an agarose-based resin
with a high binding capacity for murine serum P-component
The resins investigated were:
A: A mixture of Ultrogel ACA 34 resin and several new
batches of Sepharose 4B resin B: Miles Low electroendosmosis agarose C: "Fresh" Sepharose 4B resin from the same batch as
used (4.2.2) .
Each resin was subjected to the following treatment:-10ml of the non-adsorbed serum (4.2.2) still containing
MSAP was added to approximately 1 ml of the resin equilibrated
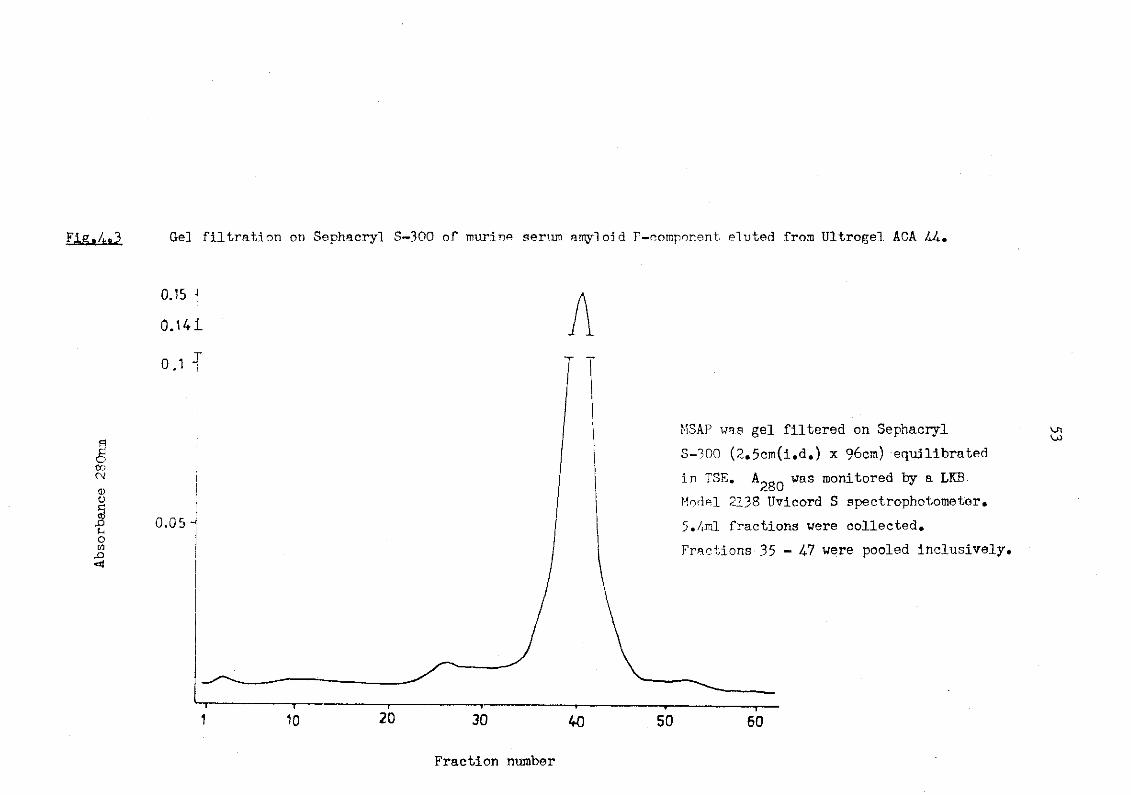
Gel filtration on Sephacryl S-300 of murine serum amyloid P-component eluted from Ultrogel ACA 44*
0 . 1 5 J i 0.141
0 .1
00 OJ
u o to xQ <tj
0 . 0 5 4
~T— 10
—,— 20 30
MSAP was gel filtered on Sephacryl S-300 (2.5cm(i.d.) x 96cm) equilibrated in TSE. A 0 was monitored by a LKB 280 Model 2138 Uvicord S spectrophotometer. 5./ml fractions were collected. Fractions 35 - 47 were pooled inclusively.
40 50 60
Fraction number
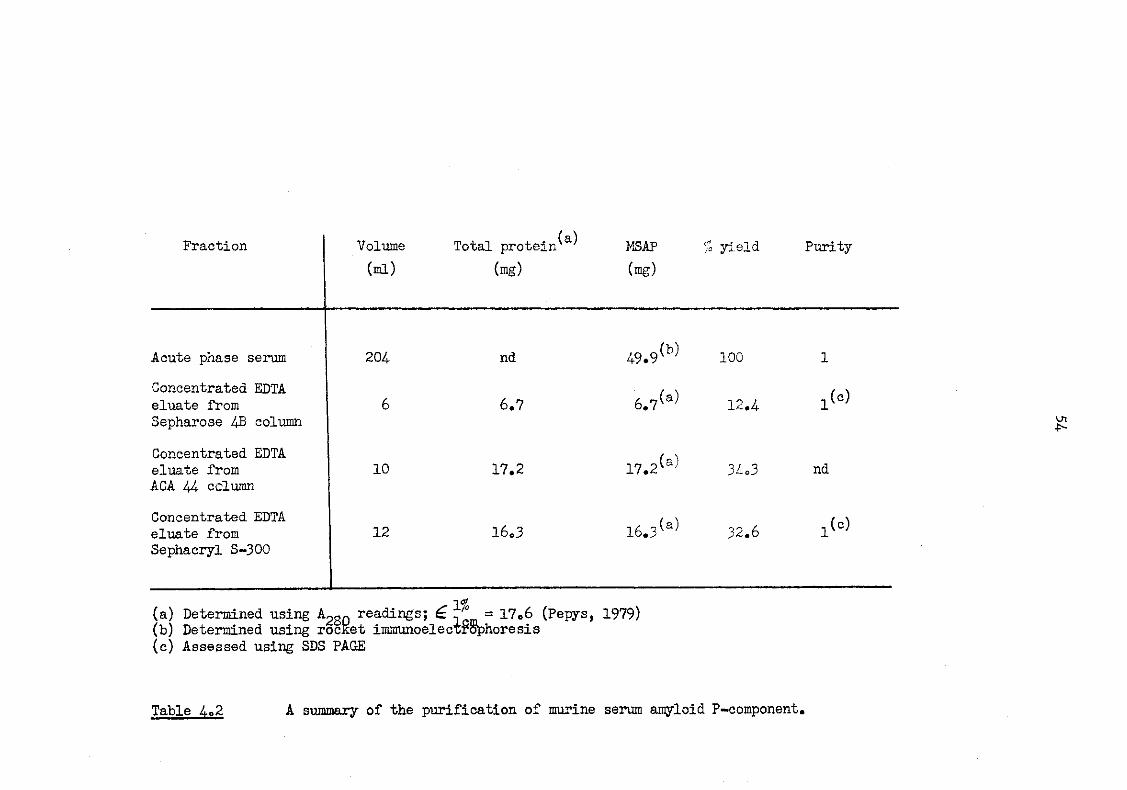
Fraction Volume (ml)
Total protein ' (mg)
MSAP (mg)
% yield Purity
Acute phase serum 204 nd 49.9(b) 100 1 Concentrated EDTA eluate from Sepharose 43 column
6 6.7 6.7(a) 12.4 l ( c )
Concentrated EDTA eluate from ACA 44- column
10 17.2 17.2(a) 3 4 o 3 nd
Concentrated EDTA eluate from Sephacryl S-300
12 16.3 I6.3(a) 32.6 y e )
1y (a) Determined using A ™ readings; £ J° = 1706 (Pepys, 1979) (b) Determined using rocket immunoelecurophoresis (c) Assessed using SDS PAGE
Table 4.2 A summary of the purification of murine serum amyloid P-component
55
in TSC. The resin-serum mixture was gently swirled for 20 minutes. After centrifugating at 200 x g (1000 rpm) for one minute the supernatant was removed and stored at -20°. Supernatants obtained from 3 sequential TSC washes of the resin pellet were pooled with the initial supernatant and stored at -20°. Bound material was eluted over a period of 10 minutes by gently mixing the resin in 2 ml of TSE. This supernatant was removed and stored at -20°. The amounts of MSAP present in the supernatants and hence the relative binding capacities of the resins were determined using Laurell rocket Immunoelectrophoresis (4.1.3) (see Plate 4.2 and Table 4.3). The results show that the best binding of MSAP was obtained for the "fresh" Sepharose 4B resin. This finding appeared to substantiate the proposed destruction of the binding site(s) for MSAP by the harsh cleaning procedure.
The experiment also suggested that, as found by Pepys et al, 1979b, there is a considerable difference between the commercially available agarose-based resins used here, in their capacity to bind MSAP.
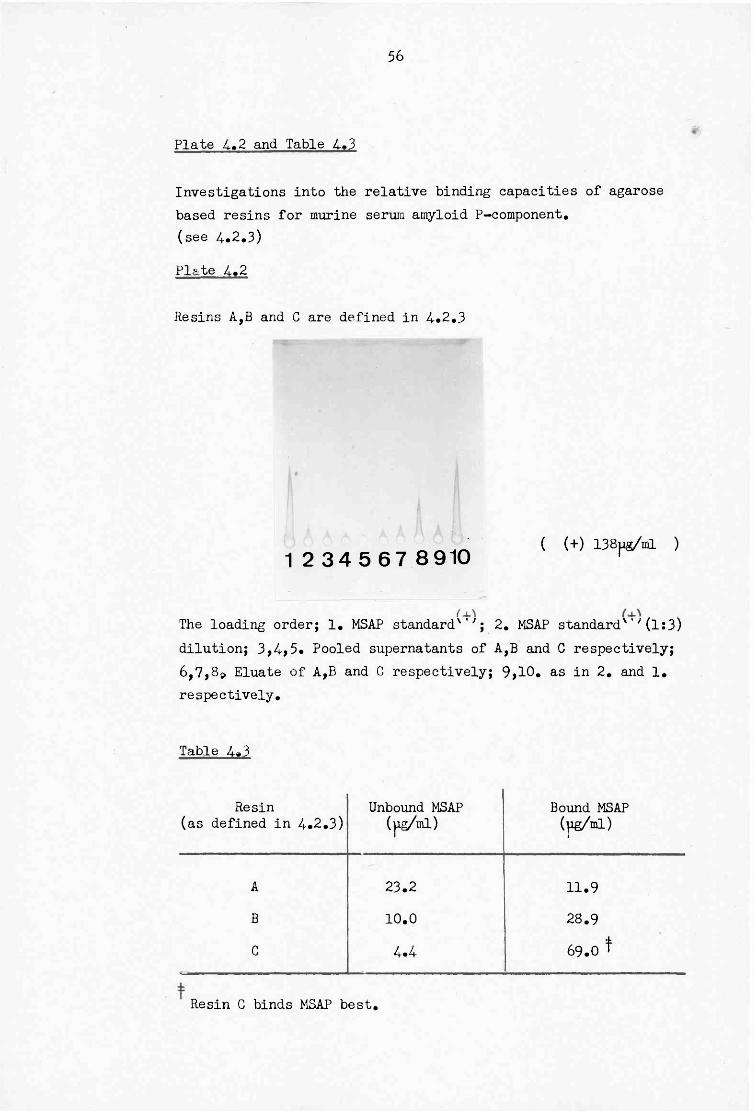
56
Plate 4.,2 and Table 4.3
Investigations into the relative binding capacities of agarose based resins for murine serum amyloid P-component. (see 4.2.3)
Plate 4.2
Resins A,B and C are defined in 4.2,3
-
1 2 34 5 67 8910 ( (+) 138pg/ml )
The loading order; 1. MSAP standardxw; 2. MSAP standardx'' (1:3) dilution; 3,4,5. Pooled supernatants of A,B and C respectively; 6,7,8* Eluate of A,B and C respectively; 9,10. as in 2, and 1, respectively.
Table 4*3
Resin Unbound MSAP Bound MSAP (as defined in 4.2.3) (jig/ml) (jig/ml)
A 23.2 11.9
B 10.0 28.9
G 4.4- 69.0 f
Resin C binds MSAP best.
57 CHAPTER 5
SEQUENCING STRATEGY
Throughout this research study, the availability of the individual pentaxins determined the extent of the investigations undertaken. Consequently, BSAP, DCRP,.LCRP and PCRP have been superficially characterised whilst others, namely MSAP, RCRP and PSAP have been sequenced; extensively so in the case of the
most readily available pentaxins, MSAP and PSAP. Specific cleavages capable of generating large peptides,
which could be sequenced using an automated cup sequenator, were investigated. The results of the initial characterisation and trial digests of the pentaxins will now be discussed.
5.1 Preliminary investigations The pentaxins, with the exception of the MSAP discussed
in Chapter 4, were prepared by colleagues at the Royal Post-graduate Medical School, Hammersmith Hospital, London W12. On receipt of the proteins, usually dissolved in TSE (see Appendix B(iii)), they were exhaustively dialysed against 50mM ammonium acetate and then lyophilised.
10-20 pg portions of the lyophilised protein were taken for molecular weight determination using SDS-PAGE. Indirect estimations of the molecular weight of the pentaxins under reducing conditions were obtained by adjusting calibration curves for the anomalous behaviour of HCRP (Pepys et al, 1978a; Baltz et al, 198 2a). The molecular weight of HCRP is known from the full amino acid sequence (Oliveira et al, 1977; 1979). The molecular weights of the pentaxins are shown in Table 5.1. The results of the amino acid analysis and amino terminal determi-nation of BSAP, DCRP, LCRP, MSAP, RCRP, PCRP and PSAP are shown in Tables 5.2 and 5.3 respectively.
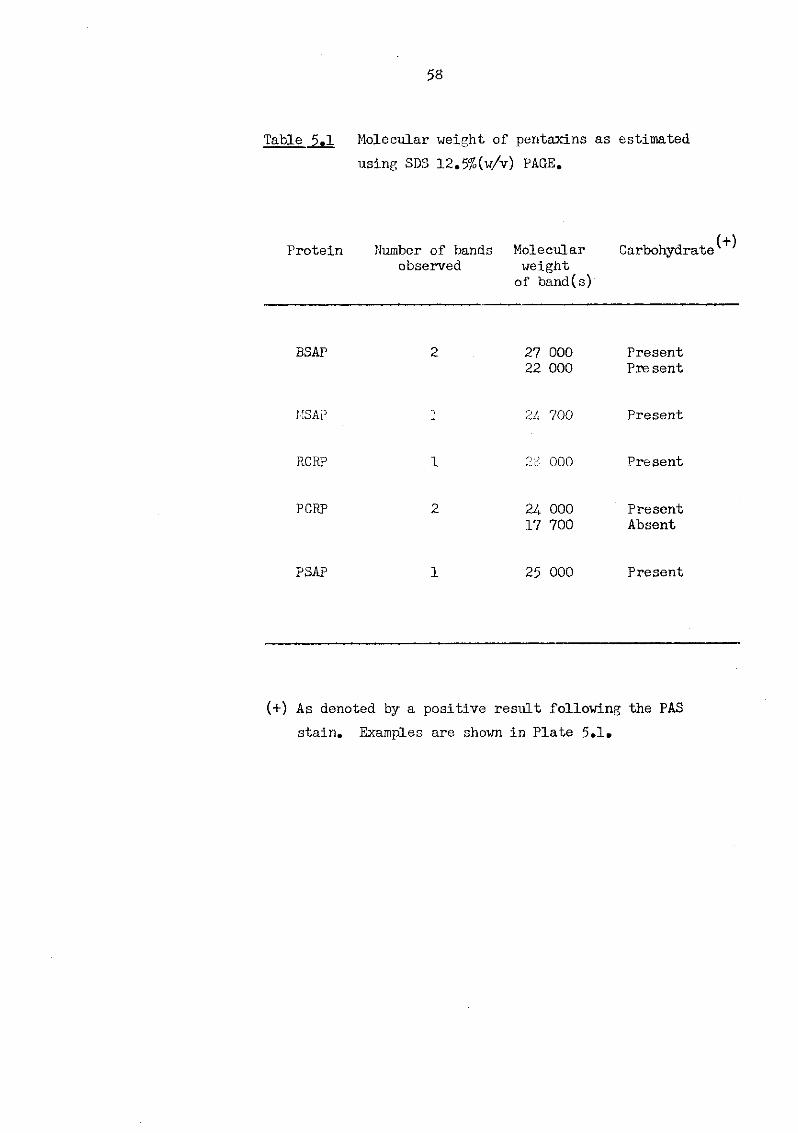
58
Table 5»1 Molecular weight of pentaxins as estimated using SDS 12.5%(w/v) PAGE.
Protein Number of bands Molecular observed weight
of band(s)
Carbohydrate
BSAP 27 000 22 000
Present Pre sent
MSAP
RCRP
21, 700
28 000
Present
Pre sent
PCRP 24 000 17 700
Present Absent
PSAP 25 000 Present
(+) As denoted by a positive result following the PAS stain. Examples are shown in Plate 5.1»
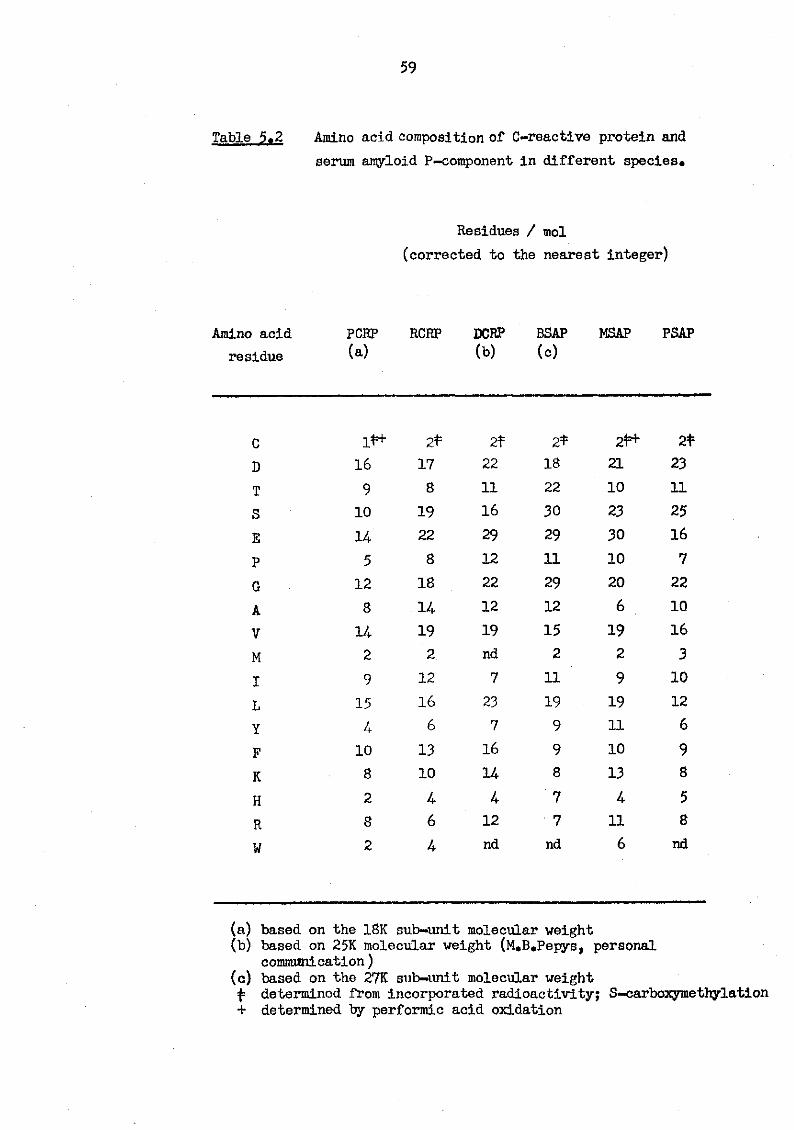
59
Table 5.2 Amino acid composition of C-reactive protein and serum amyloid P-component in different species.
Residues / mol (corrected to the nearest integer)
Amino acid PCRP RCRP DCRP BSAP MSAP PSAP residue (a) to (<0
c 1*+ 2* 2f 2* 21=+ 21 D 16 17 22 18 21 23 T 9 8 11 22 10 11 S 10 19 16 30 23 25 E U 22 29 29 30 16 P 5 8 12 11 10 7 G 12 18 22 29 20 22 A 8 H 12 12 6 10 V H 19 19 15 19 16 M 2 2 nd 2 2 3 I 9 12 7 11 9 10 L 15 16 23 19 19 12 Y A 6 7 9 11 6 F 10 13 16 9 10 9 K 8 10 M 8 13 8 H 2 A A 7 A 5 R 8 6 12 7 11 8 W 2 A nd nd 6 nd
(a) based on the 18K sub-unit molecular weight (b) based on 25K molecular weight (M.B.Pepys, personal
communication) (c) based on the 27K sub-unit molecular weight
determined from incorporated radioactivity; S-carboxymethylation + determined by performic acid oxidation
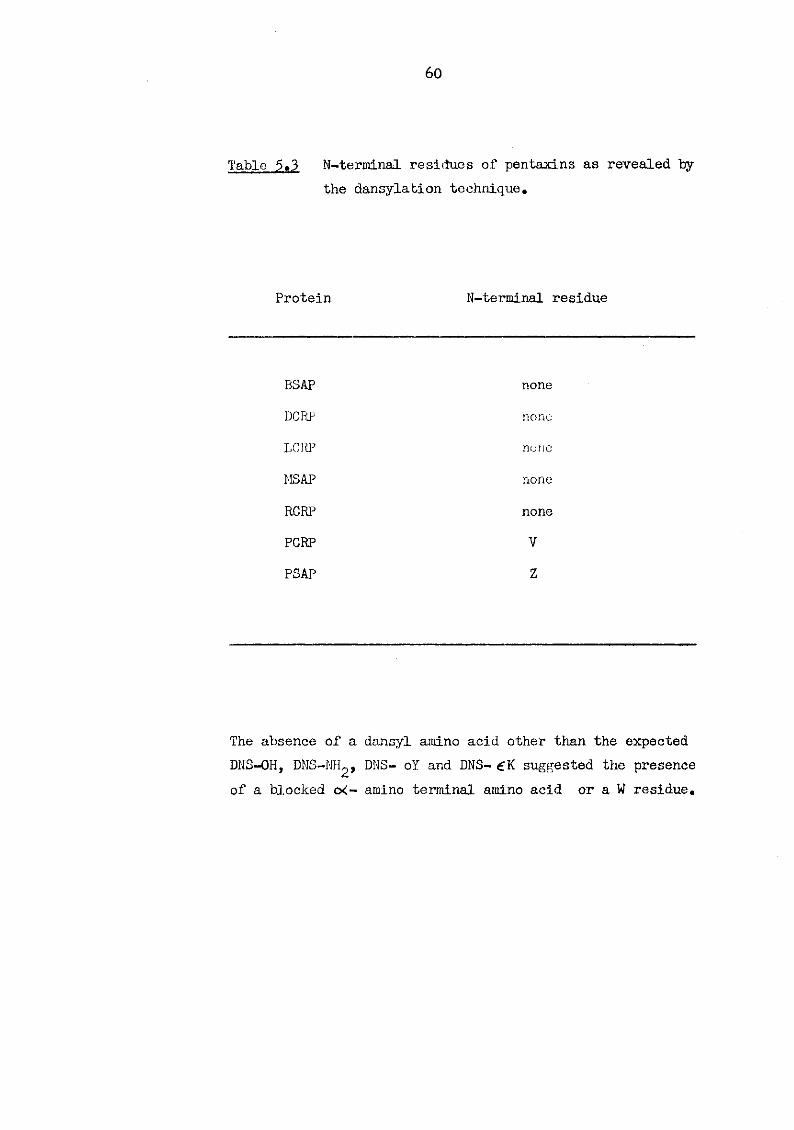
60
Table 5.3 N-terminal residues of pentaxins as revealed by the dansylation technique.
Protein N-terminal residue
BSAP DCRP
LCRP
MSAP RCRP PGRP PSAP
none none
none
none
none V Z
The absence of a dansyl amino acid other than the expected DNS-OH, DNS-NH2, DNS- oY and DNS- £K suggested the presence of a blocked o<- amino terminal amino acid or a W residue.
61
Based on the estimated molecular weight, an efficiency for acid hydrolysis at 110° was only 25-30%. An elevated temperature of 130° was found in all cases except DCRP and BSAP, to greatly improve the overall yield, but with a concomitant increase in the destruction of S and T residues. Hence the values given in Table 5.2 reflect the analyses achieved at 130° with the exception of the extrapolated S and T values, which were adjusted from 110° hydrolyses. This observation was difficult to explain.
The subsequent discovery, using the PAS stain, that these proteins, unlike the human and rabbit CRPs , were glycosylated led to speculation that the sugar complex might be hindering the peptide bond hydrolysis. However, this concept was felt unlikely unless a vast amount of carbohydrate was present; say 80-90% (w/w), although the resistance of carbohydrate to hydrolysis has been observed by A.G. Dickerson (personal communication). Analyses of the carbohydrate, as discussed in Chapter 9, show that for several of the pentaxins, a range of 6-8% (w/w) (with respect to the proteins' molecular weight) was observed. Consequently, a satisfactory explanation for this observation was never formulated.
The realisation that these proteins, unlike the HCRP, were glycosylated suggested that the corrections used to estimate their molecular weight may not have been perfectly appropriate (Leach et al, 1980) . However, as a first approximation these values were considered adequate. An example of the glycosylated pentaxins as detected by the PAS stain is shown in Plate 5.1.
Repeated attempts to sequence the C-terminal region of MSAP using carboxypeptidase Y proved unsuccessful. The same amino acids were seen to be released in the MSAP sample and in the control system, thus making the assignment of amino
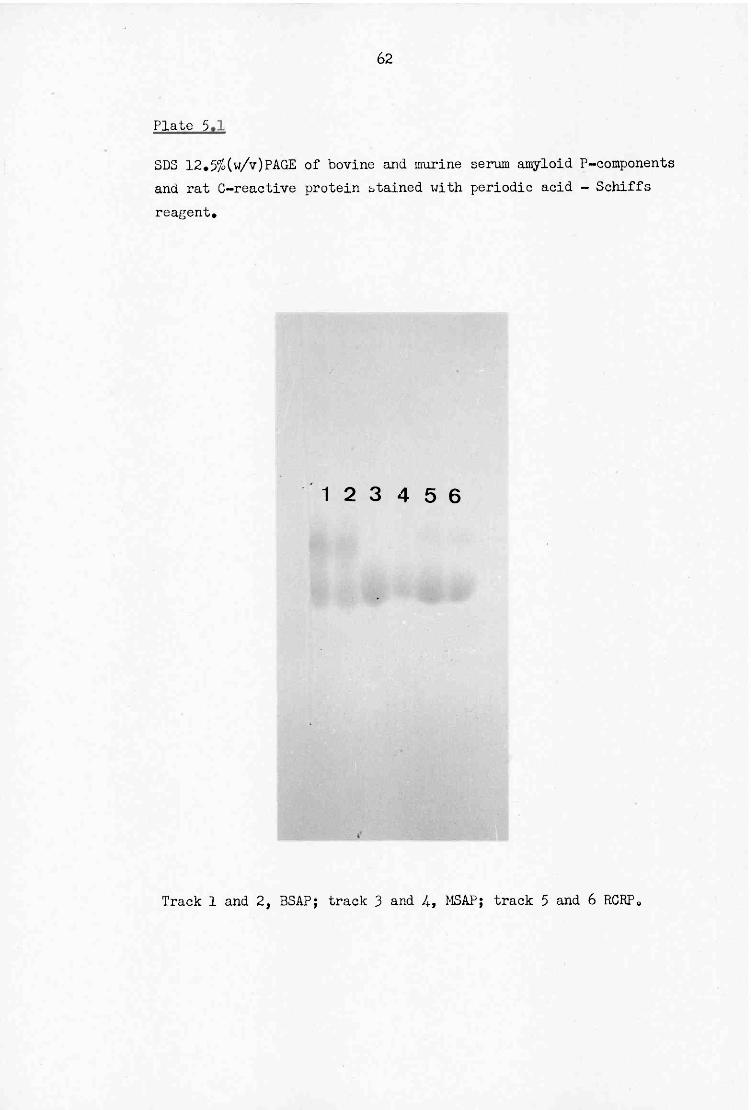
62
Plate 5*4-
SDS 12.%(w/v)PAGE of bovine and murine serum amyloid P-components and rat C-reactive protein stained with periodic acid - Schiffs reagent.
1 2 3 4 5 6
Track 1 and 2, BSAP; track 3 and A, MSAP; track 5 and 6 RCRP.
63
acid residues impossible.
5.2 Mass spectrometric investigations into the nature of
the o( -amino blocking groups As shown in Table 5.3, with the exception of the plaice
pentaxins, the proteins failed to give a positive result on dansylation, thus indicating either amino-terminal W or the presence of a blocking group such as formyl, acetyl or PCA ; the result of amino-terminal glutamine cyclisation (Smyth et al, 1963) .
Blocked groups prohibit automated sequencing of the intact protein, therefore EIMS was employed to investigate the nature of the amino terminus of the more readily available MSAP and RCRP.
The mass spectra of chloroform extracts of a permethylated elastase or chymotrypic digest of chemically formylated protein, showed the predominant peaks over the 98-255 m/z range, derived from permethylation with CH^I or CD^I for, (i) MSAP and (ii) RCRP to be:
(i) 98 m/z or 101 m/z respectively, corresponding to PCA (ii) 114 m/z or 117 m/z respectively, corresponding to
either formyl alanine or acetyl glycine, and, 128 m/z or 131 m/z respectively, corresponding to acetyl alanine.
Hence this preliminary evidence indicated the blocking groups present in MSAP and RCRP were PCA and either an acetyl or a formyl group respectively.
These spectra were complicated by the presence of sugars. Hence, MSAP was subjected to alkaline borohydride treatment followed by molecular exclusion HPLC before being treated as discussed. Unfortunately, the resulting spectra were now
64.
complicated by silica, presumed to originate from the HPLC column packing material.
5.3 Pyroglutamate amino peptidase treatment of murine serum amyloid P-component Following treatment of 2-3 mg of MSAP with PCA peptidase,
the protein was subjected to several steps of the automated Edman degradation. Many PTH derivatives were observed for each sequential step carried out, suggesting that the enzyme contained protease impurities. The PCA peptidase appeared on using SDS 5-20% (w/v) PAGE as a collection of components of widely differing molecular weights; see Plate 5.2. At this stage of the research it was considered unwise to devote time to purifying the peptidase.
5.4 The presence of an intrachain disulphide bridge in murine amyloid P-component Four 25 ng portions of MSAP were observed using SDS 12.5%
(w/v) PAGE. Two of the samples were loaded in the usual sample buffer (see 2.2.11.1) , whilst the remaining two were loaded in the same sample buffer with the omission of the jg -mercaptoethanol i.e. producing reduced and non-reduced samples respectively.
The gel shown in Plate 5.3 clearly shows the non-reduced material travelled faster, implying a more compact structure due to the maintenance of an intrachain disulphide bridge.
By analogy with HCRP (Oliveira et al, 1977; 19 79) , and since 2 cysteine residues were indicated from amino acid analysis, the existence of a bridge was proposed. Hence all protein to be sequenced was reduced and radioactively carboxy-methylated. In addition to removing the possibility of
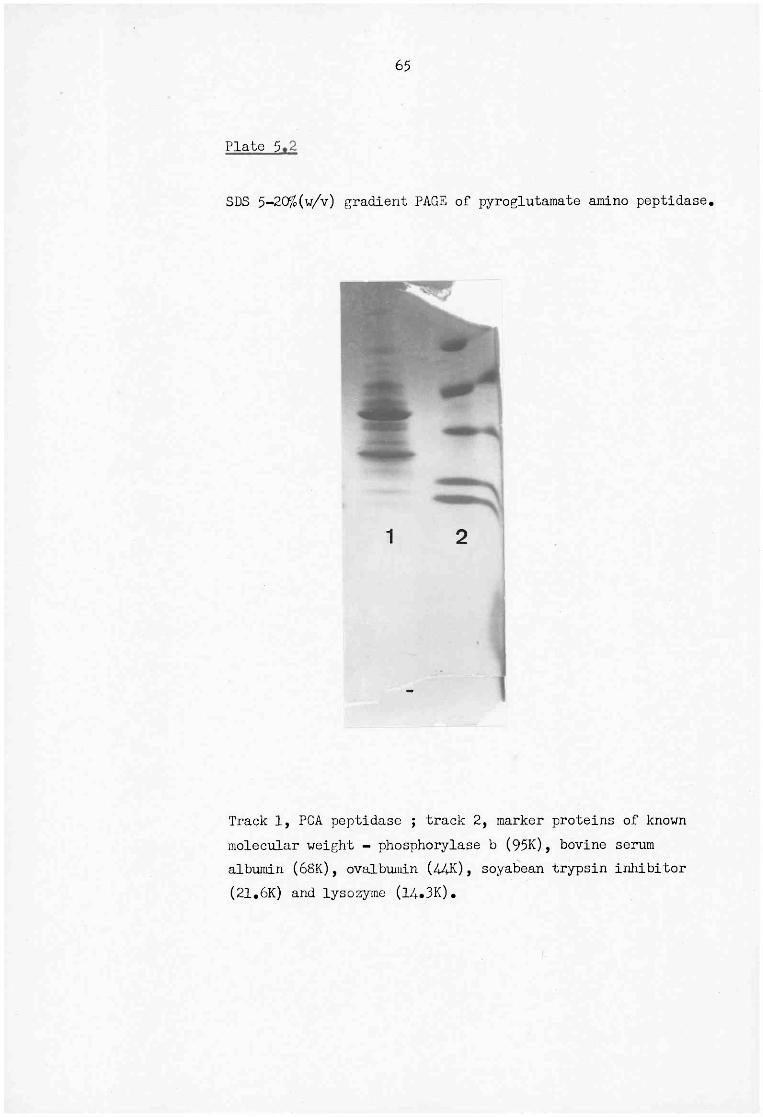
65
P l a t e 5*4-
SDS 5-20%(w/v) gradient PAGE of pyroglutamate amino peptidase.
Track 1, PCA peptidase ; track 2, marker proteins of known molecular weight - phosphorylase b (95K), bovine serum albumin (68K), ovalbumin (44K), soyabean trypsin inhibitor (21.6K) and lysozyme (14.3K).
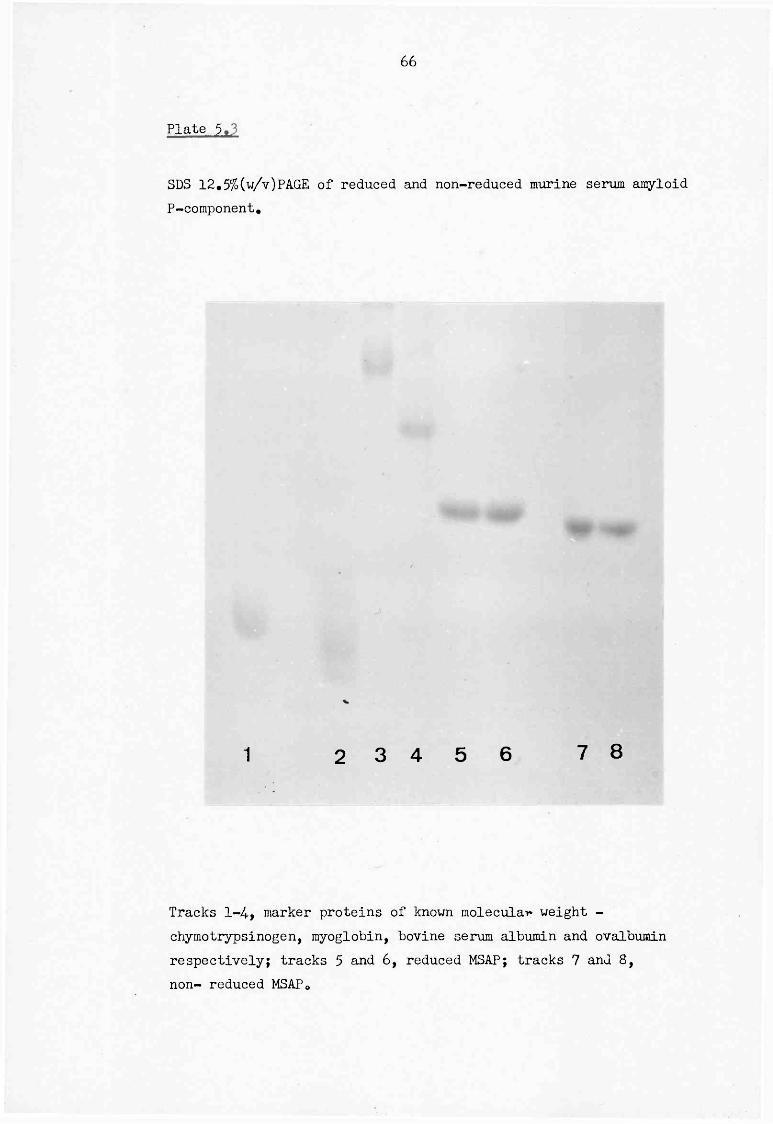
66
Plate 5*4-
SDS 12.5%(w/v)PAGE of reduced and non-reduced murine serum amyloid P-component.
1 2 3 4 5 6 7 8
Tracks 1-4, marker proteins of known molecular weight -chymotrypsinogen, myoglobin, bovine serum albumin and ovalbumin respectively; tracks 5 and 6, reduced MSAP; tracks 7 and 8, non- reduced MSAP.
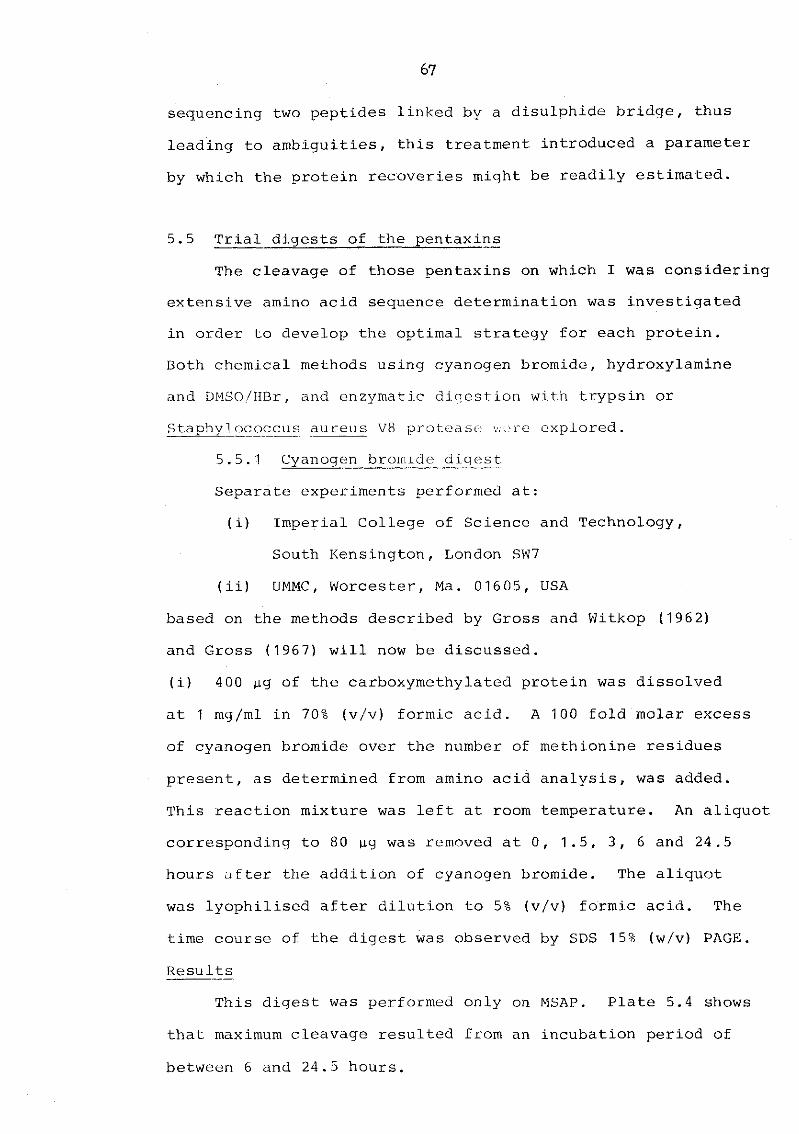
67
sequencing two peptides linked by a disulphide bridge, thus
leading to ambiguities, this treatment introduced a parameter
by which the protein recoveries might be readily estimated.
5.5 Trial digests of the pentaxins
The cleavage of those pentaxins on which I was considering
extensive amino acid sequence determination was investigated
in order to develop the optimal strategy for each protein.
Both chemical methods using cyanogen bromide, hydroxylamine
and DMSO/HBr, and enzymatic digestion with trypsin or
Staphylococcus aureus V8 protease v,ore explored.
5.5.1 Cyanogen bromide digest
Separate experiments performed at:
(i) Imperial College of Science and Technology,
South Kensington, London SW7
(ii) UMMC, Worcester, Ma. 01605, USA
based on the methods described by Gross and Witkop (196 2)
and Gross (1967) will now be discussed.
(i) 4 00 \xg of the carboxymethylated protein was dissolved
at 1 mg/ml in 70% (v/v) formic acid. A 100 fold molar excess
of cyanogen bromide over the number of methionine residues
present, as determined from amino acid analysis, was added.
This reaction mixture was left at room temperature. An aliquot
corresponding to 80 ug was removed at 0, 1.5, 3, 6 and 24.5
hours after the addition of cyanogen bromide. The aliquot
was lyophilised after dilution to 5% (v/v) formic acid. The
time course of the digest was observed by SDS 15% (w/v) PAGE.
Results
This digest was performed only on MSAP. Plate 5.4 shows
that maximum cleavage resulted from an incubation period of
between 6 and 24.5 hours.
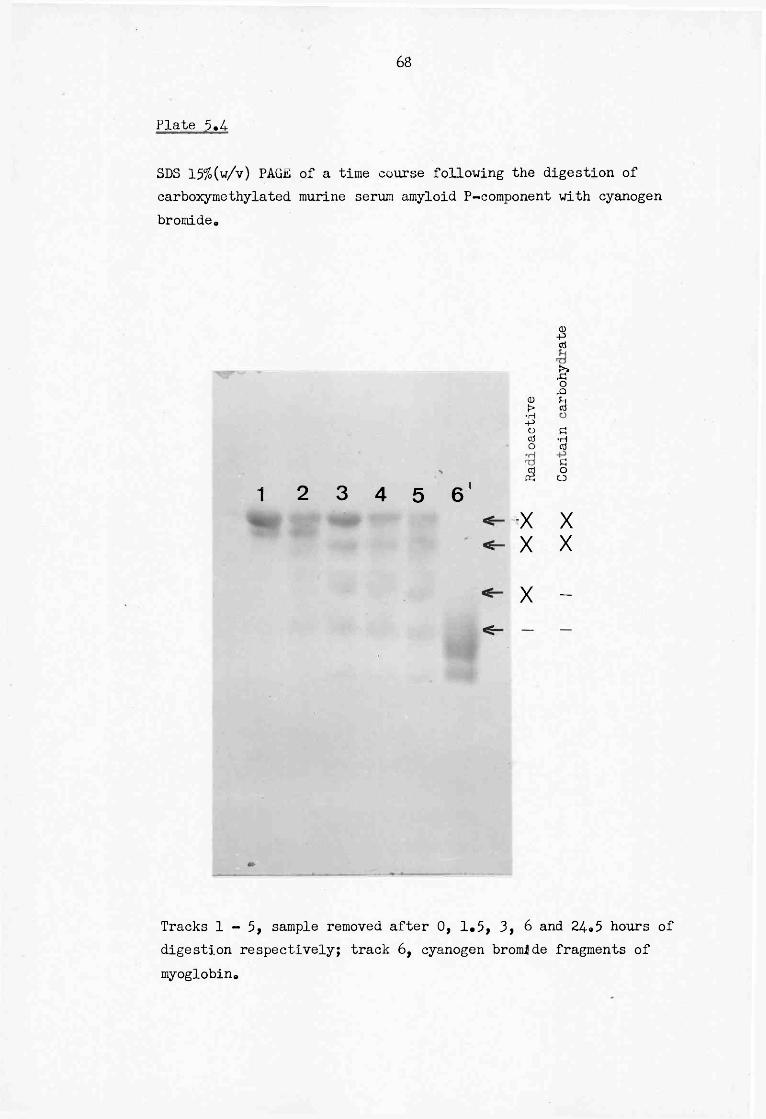
68
Plate 5*4-
SDS 15%(w/v) PAGE of a time course following the digestion of carboxymethylated murine serum amyloid P-component with cyanogen bromide.
(D -P a
1 2 3 4 5 6
<D > •H -P O cd o &
& o rO
(3 £ •d c O o
-X X X X
X -
Tracks 1 - 5 , sample removed after 0, 1.5, 3, 6 and 24-.5 hours of digestion respectively; track 6, cyanogen bromide fragments of myoglobin.
The possibilities of separating the undigested protein and the cleavage products of a 24 hour digest, performed under the conditions described above, using either Bio-gel P60 equilibrated in 3.5% (v/v) formic acid in 8M urea, or, by molecular exclusion HPLC using the 0.01M ammonium acetate pH6.4 system were examined; see Figs. 5.1 and 5.2 respectively. Both methods of separation seemed satisfactory, although a dramatic shift in the expected void volume of the Bio-gel P60 column was seen; 21 ml instead of 4 5 ml. This alteration was considered to be the result of the urea distorting the resin beads.
The relative ratios of the peaks separated using the Bio-gel P60 column, indicating that undigested or partially digested material predominated, were vastly different from those observed from the HPLC separation. Separate portions of the peaks from the Bio-gel P6 0 column examined using
SDS 15% (w/v) PAGE or the HPLC separation described, revealed that each peak comprised a mixture of the undigested protein and the digest products. Bead distortion, caused by the urea, was felt to be responsible for this poor separation. Therefore it was decided that the products of a preparative 24 hour digest, performed as above, should be separated using the 0.01M ammonium acetate pH6.4 HPLC separation. (ii) Separate 50 |ig portions of the protein were digested with cyanogen bromide using combinations of either a 50 or 100 fold molar excess of cyanogen bromide over the number of methionine residues, as predicted from amino acid analysis, and a reaction time of 6 or 24 hours. All reactions were conducted at room temperature using a protein concentration of 1 mg/ml in 70% (v/v) formic acid. Reaction termination was achieved as in (i). Each sample was divided equally, thus enabling examination
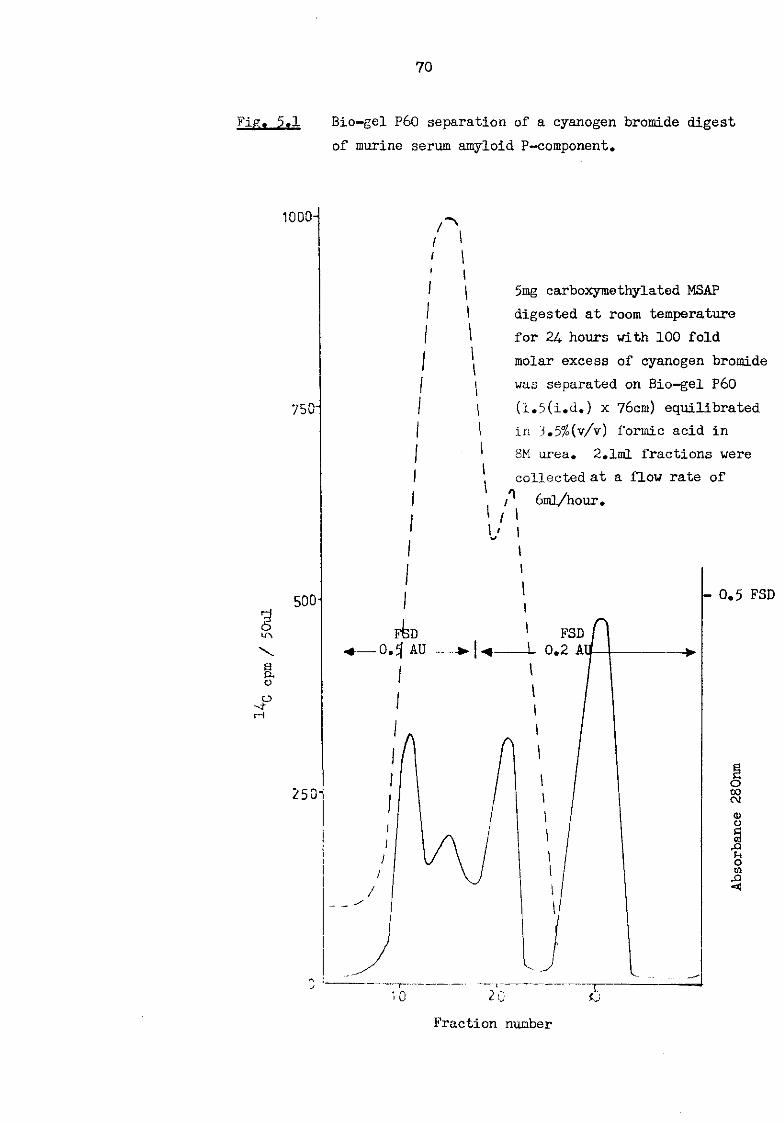
70
Fig. 5.1 Bio-gel P60 separation of a cyanogen bromide digest of murine serum amyloid P-component.
1000-
I l
750"
a CL o o rH
5mg carboxymethylated MSAP digested at room temperature for 24- hours with 100 fold molar excess of cyanogen bromide was separated on Bio-gel P60 (1.5(i.d.) x 76cm) equilibrated in 3.5%(v/v) formic acid in 8M urea. 2.1ml fractions were collected at a flow rate of
6ml/hour.
10 2 0
Fraction number
- 0.5 FSD
o 00 CM <D o § U O m &
<
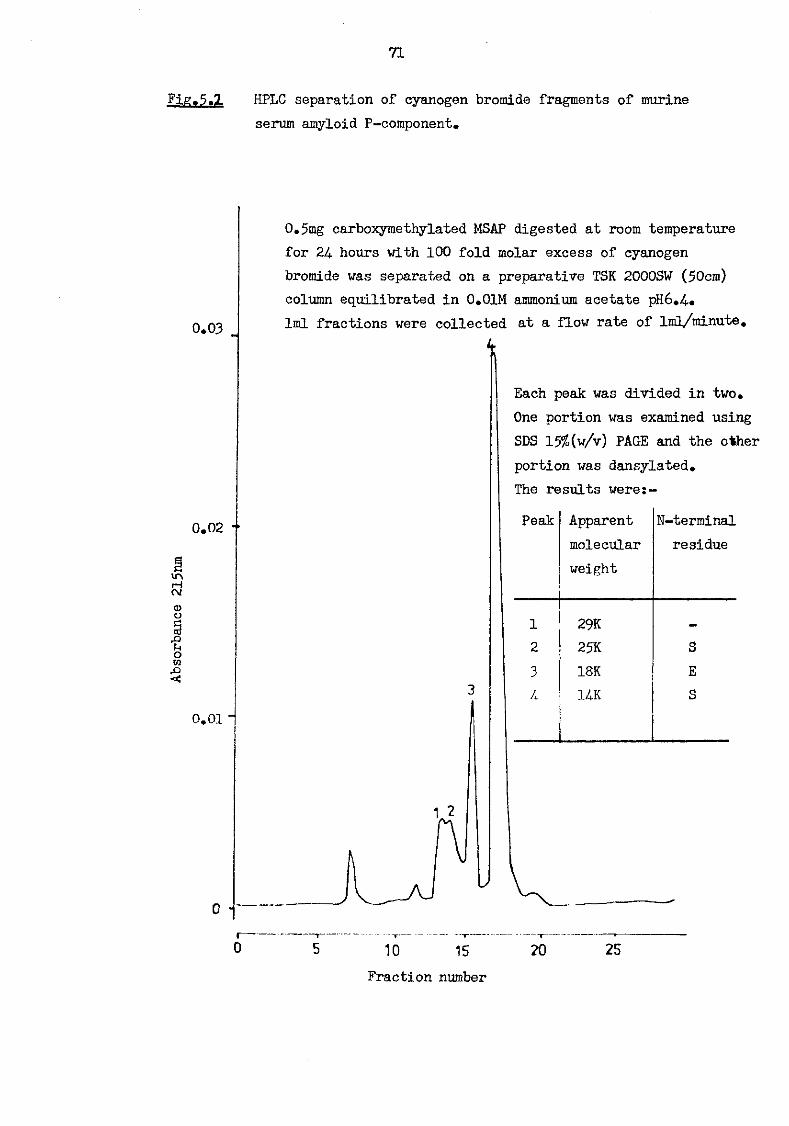
71
HPLC separation of cyanogen bromide fragments of murine serum amyloid P-component.
0.5mg carboxymethylated MSAP digested at room temperature for 24. hours with 100 fold molar excess of cyanogen bromide was separated on a preparative TSK 2000SW (50cm) column equilibrated in 0.01M ammonium acetate pH6.4-« lml fractions were collected at a flow rate of lml/minute.
<t
Each peak was divided in two. One portion was examined using SDS 15%(w/v) PAGE and the other portion was dansylated. The results were:-Peak Apparent N-terminal
molecular residue weight
1 29K _
2 25K S 3 18K E U UK S
10 15
Fraction number 20 25
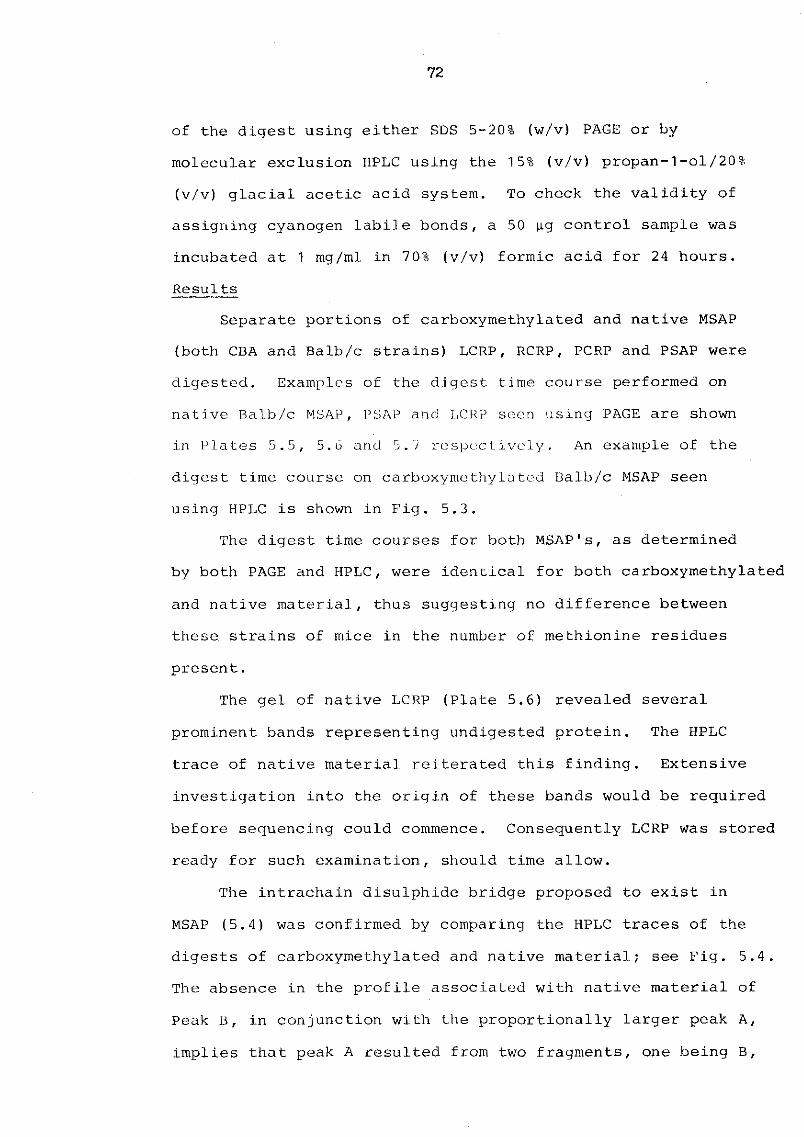
72
of the digest using either SDS 5-20% (w/v) PAGE or by molecular exclusion HPLC using the 15% (v/v) propan-1-ol/20% (v/v) glacial acetic acid system. To check the validity of assigning cyanogen labile bonds, a 50 |ig control sample was incubated at 1 mg/ml in 70% (v/v) formic acid for 24 hours. Results
Separate portions of carboxymethylated and native MSAP (both CBA and Balb/c strains) LCRP, RCRP, PCRP and PSAP were digested. Examples of the digest time course performed on native Balb/c MSAP, PSAP and LCRP seen using PAGE are shown in Plates 5.5, 5.6 and 5.7 respectively. An example of the digest time course on carboxymethylated Balb/c MSAP seen using HPLC is shown in Fig. 5.3.
The digest time courses for both MSAP1s, as determined by both PAGE and HPLC, were identical for both carboxymethylated and native material, thus suggesting no difference between these strains of mice in the number of methionine residues present.
The gel of native LCRP (Plate 5.6) revealed several prominent bands representing undigested protein. The HPLC trace of native material reiterated this finding. Extensive investigation into the origin of these bands would be required before sequencing could commence. Consequently LCRP was stored ready for such examination, should time allow.
The intrachain disulphide bridge proposed to exist in MSAP (5.4) was confirmed by comparing the HPLC traces of the digests of carboxymethylated and native material; see Fig. 5.4. The absence in the profile associated with native material of Peak B, in conjunction with the proportionally larger peak A, implies that peak A resulted from two fragments, one being B,
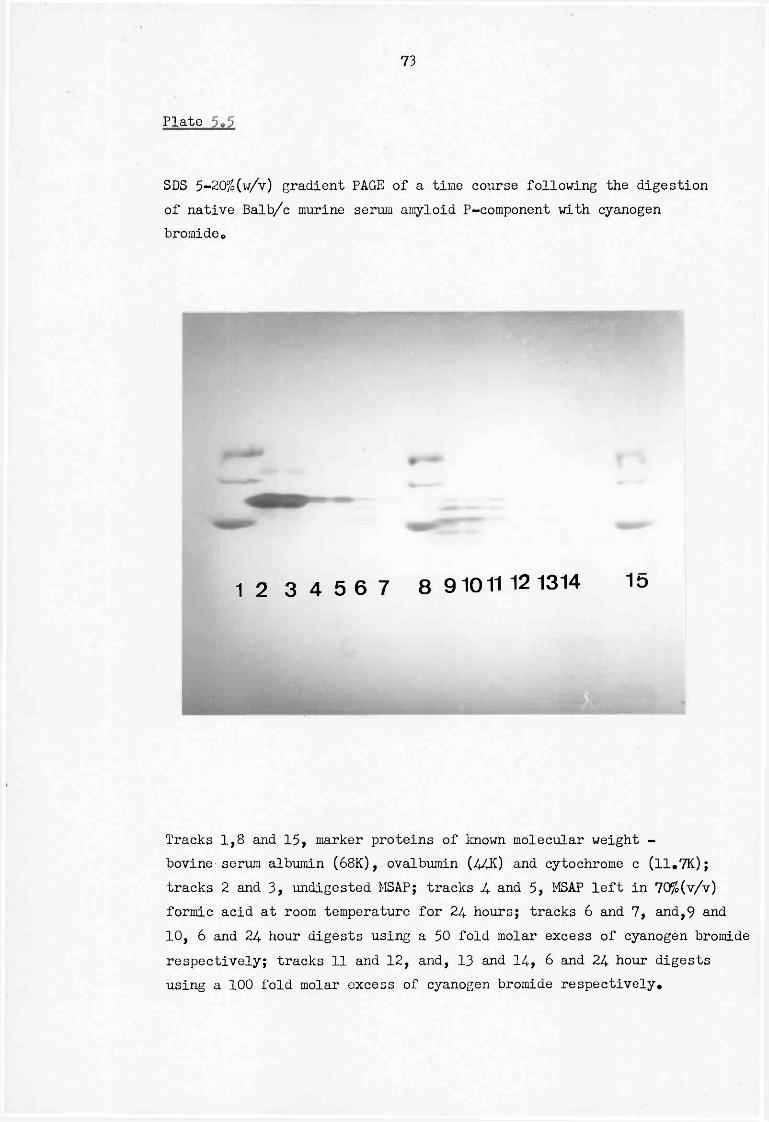
73
Plate
SDS 5-20%(w/v) gradient PAGE of a time course following the digestion of native Balb/c murine serum amyloid P-component with cyanogen bromide.
1 2 3 4 5 6 7 8 91011 121314 10
Tracks 1,8 and 15, marker proteins of known molecular weight -bovine serum albumin (68K), ovalbumin (44K) and cytochrome c (11.7K); tracks 2 and 3, undigested MSAP; tracks 4 and 5, MSAP left in 70%(v/v) formic acid at room temperature for 24 hours; tracks 6 and 7, and,9 and 10, 6 and 24 hour digests using a 50 fold molar excess of cyanogen bromide respectively; tracks 11 and 12, and, 13 and 14, 6 and 24 hour digests using a 100 fold molar excess of cyanogen bromide respectively.
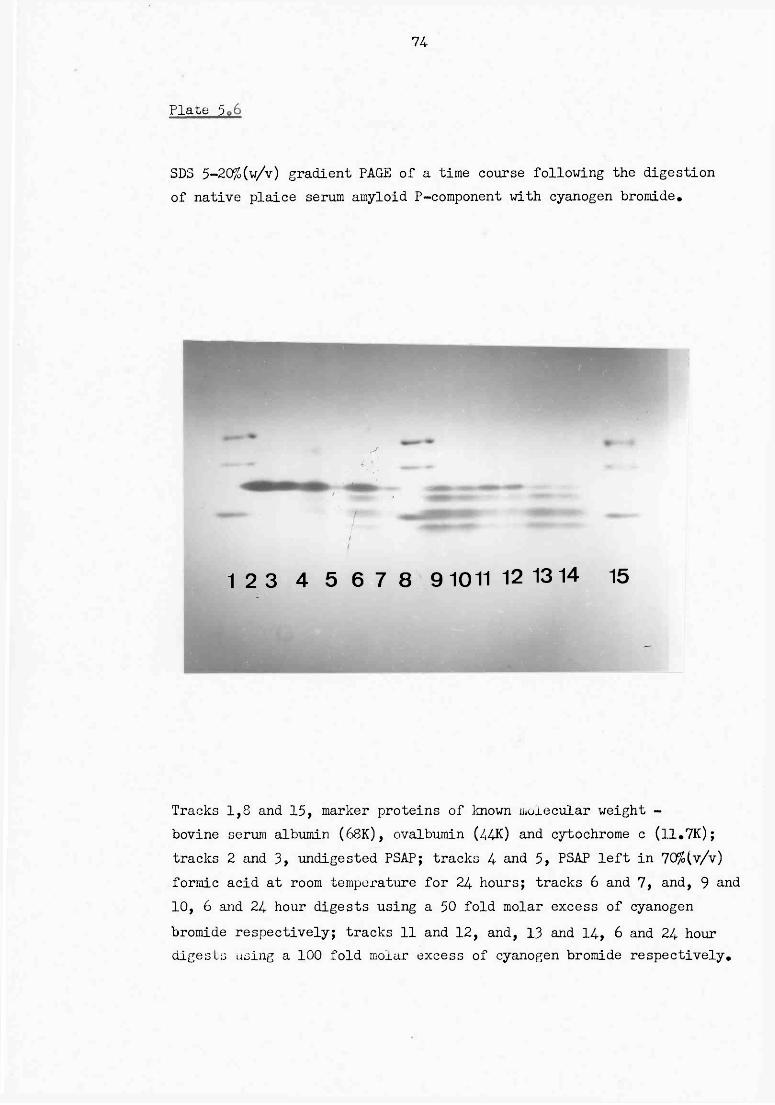
74
Plate 5*4-
SDS 5-20%(w/v) gradient PAGE of a time course following the digestion of native plaice serum amyloid P-component with cyanogen bromide.
123 4 5 6 7 8 9 1011 12 13 14 15
Tracks 1,8 and 15, marker proteins of known molecular weight -bovine serum albumin (68K), ovalbumin (44K) and cytochrome c (11.7K); tracks 2 and 3, undigested PSAP; tracks 4 and 5, PSAP left in 70%(v/v) formic acid at room temperature for 24 hours; tracks 6 and 7, and, 9 and 10, 6 and 24 hour digests using a 50 fold molar excess of cyanogen bromide respectively; tracks 11 and 12, and, 13 and 14, 6 and 24 hour digests using a 100 fold molar excess of cyanogen bromide respectively.
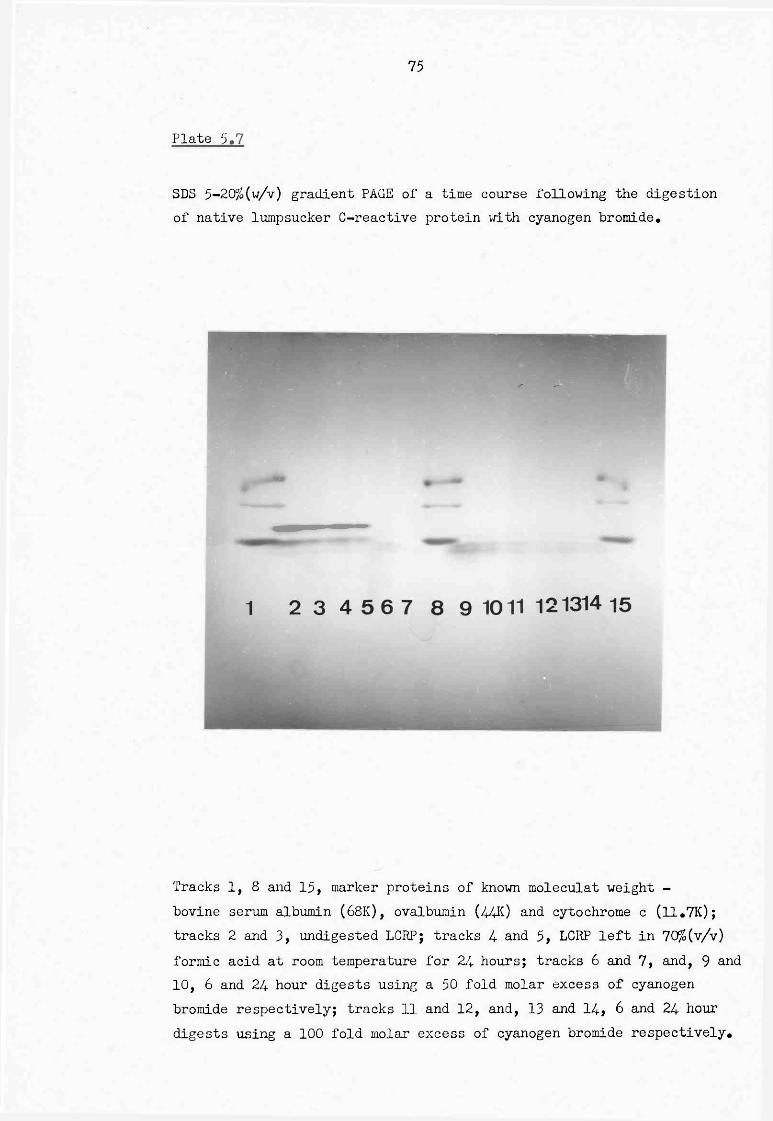
75
Plate 5*4-
SDS 5-20%(w/v) gradient PAGE of a time course following the digestion of native lumpsucker C-reactive protein with cyanogen bromide.
Tracks 1, 8 and 15, marker proteins of known moleculat weight -bovine serum albumin (68K), ovalbumin (44^0 and cytochrome c (11.7K); tracks 2 and 3, undigested LCRP; tracks 4 and 5, LCRP left in 70%(v/v) formic acid at room temperature for 24 hours; tracks 6 and 7, and, 9 and 10, 6 and 24 hour digests using a 50 fold molar excess of cyanogen bromide respectively; tracks 11 and 12, and, 13 and 14, 6 and 24 hour digests using a 100 fold molar excess of cyanogen bromide respectively.
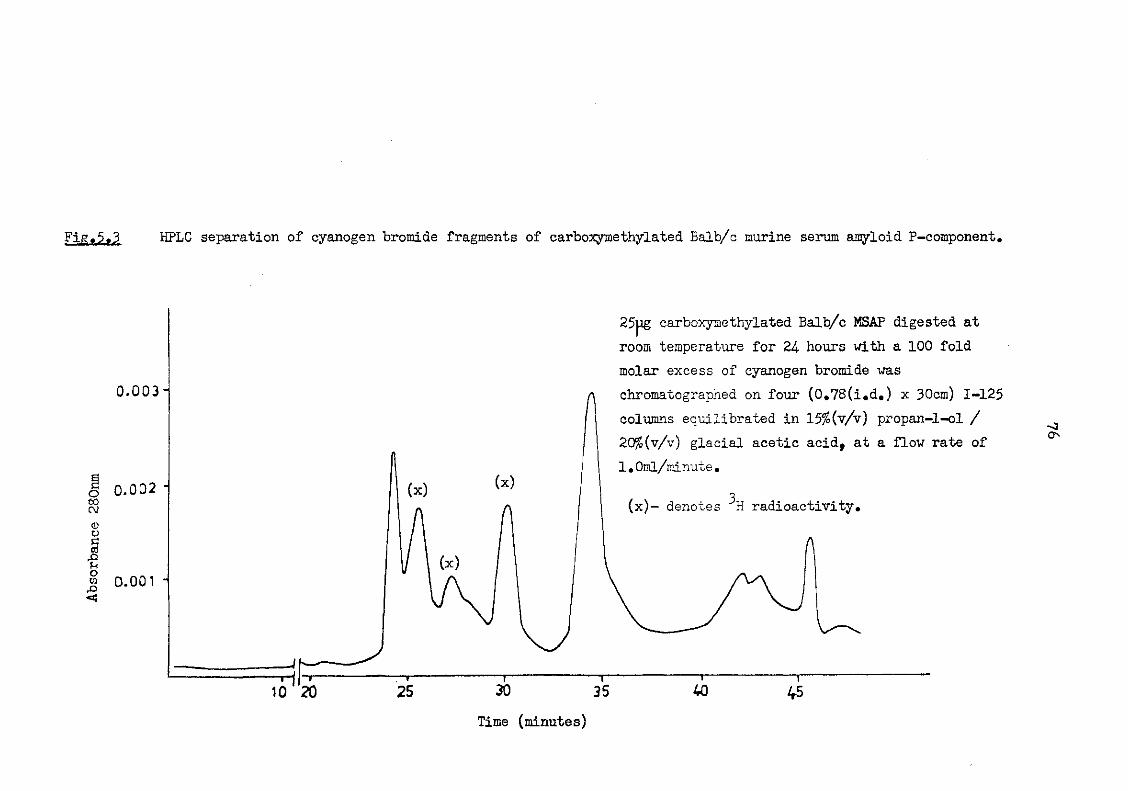
Fifi.Et? HPLC separation of cyanogen bromide fragments of carboxymethylated Balb/c murine serum amyloid P-component.
0.003-
8 0.002 to cv
0.001 -
25pg carboxymethylated Balb/c MSAP digested at room temperature for 24 hours with a 100 fold molar excess of cyanogen bromide was chromatographed on four (0.78(i.d.) x 30cm) 1-125 columns equilibrated in 15%(v/v) propan-l-ol / 20%(v/v) glacial acetic acid, at a flow rate of l.Oml/iranute.
•2 (x)- denotes H radioactivity.
10 20 40 — r 45
Time (minutes)
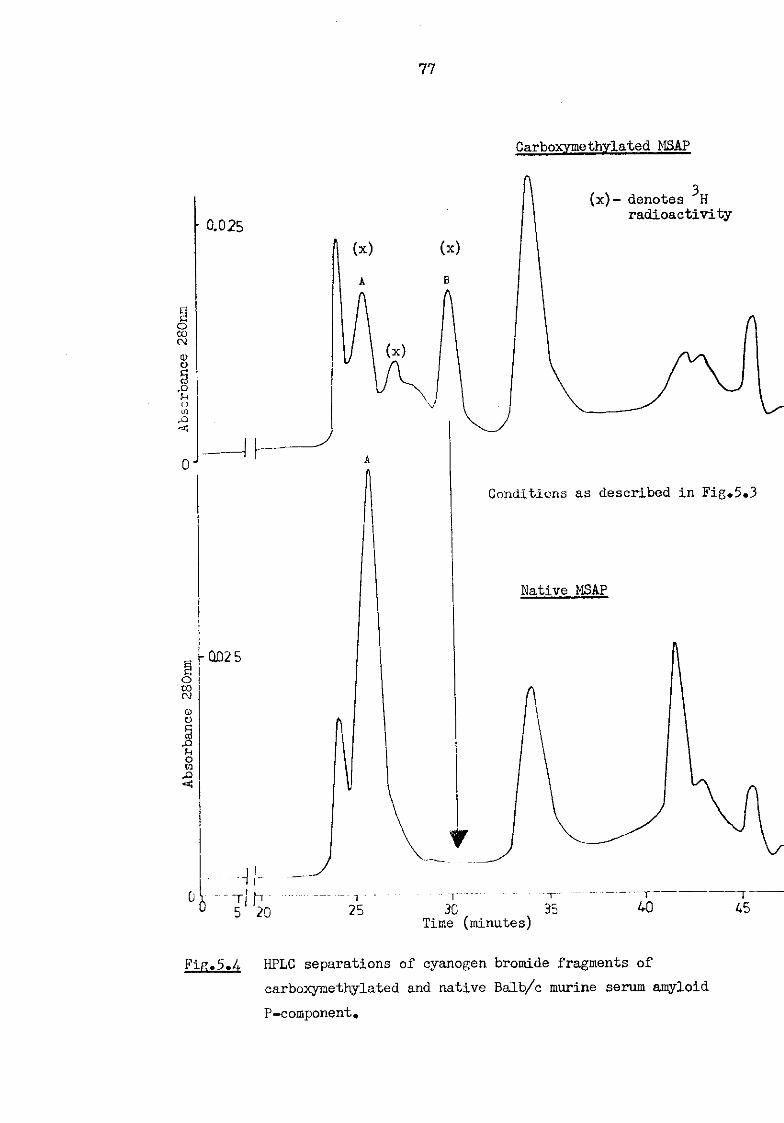
77
Carboxymethylated MSAP
II&sSJA HPLG separations of cyanogen bromide fragments of carboxymethylated and native Balb/c murine serum amyloid P-component.
78
joined via a disulphide bridge.
The results of the time course discussed above showed
that a 24 hour digest at room temperature using a 100 fold
molar excess of cyanogen bromide over the expected number
of methionine residues was best for all the pentaxins
investigated, excluding LCRP, as discussed above.
5.5.2 Cleavage at N-G bonds with hydroxylamine
The cleavage of 250 pg carboxymethylated Balb/c MSAP,
prepared at 1 mg/ml, in a solution of 5M guanidine-HCl, 2M
hydroxylamine and 0.2M i^CO^ adjusted to pH10.5 with NaOH,
was allowed to proceed at room temperature (Bornstein and
Balian, 1977). Aliquots containing 50 pg of protein were
removed when 0, 2, 4, 8 and 24 hours had lapsed. Reaction
termination by lowering the pH to pH2-3 with 6N HC1 preceded
exhaustive dialysis at 4° against 1% (v/v) glacial acetic acid
and lyophilisation of the sample. Each time point was divided
into two and examined using either SDS 5-20% (w/v) PAGE or by
molecular exclusion HPLC using the 15% (v/v) propan-1 ol
20% (v/v) glacial acetic acid system. See Plate 5.8 and
Fig. 5.5.
The three fragments revealed by the gel appeared to travel
with significantly higher molecular weights than was suggested
from the HPLC separation. Dialysis would have removed peptides
of less than 6-8K daltons; the size suggested by the HPLC
trace, therefore the molecular weights suggested by the gel are
more likely to be reliable.
Earlier observations that an extremely basic protein,
the sweet protein Thaumatin 1, a gift from M. Rangarajan,
gave an elution profile on a molecular exclusion column which
corresponded to a molecular weight of 5K rather than its true
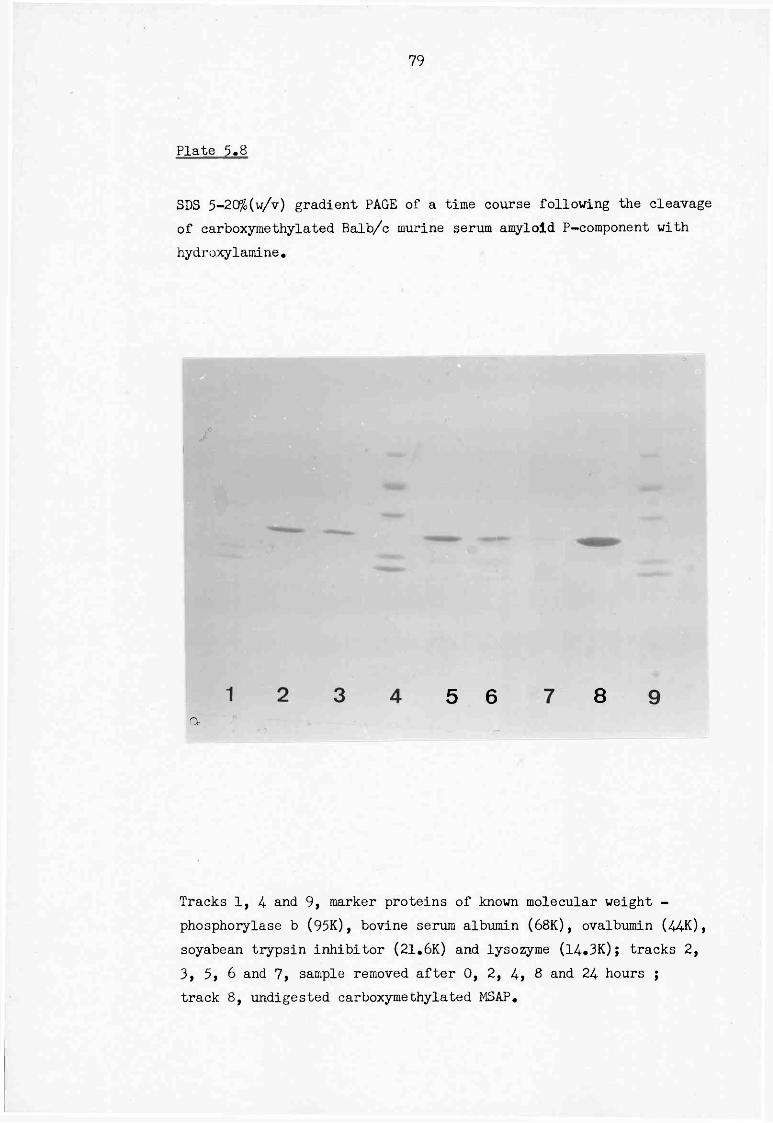
79
Plate 5.8
SDS 5-20%(w/v) gradient PAGE of a time course following the cleavage of carboxymethylated Balb/c murine serum amyloid P-component with hydroxylamine.
5 6 8 a
Tracks 1, 4 and 9, marker proteins of known molecular weight -phosphorylase b (95K), bovine serum albumin (68K), ovalbumin (44K), soyabean trypsin inhibitor (21,6K) and lysozyme (14.3K); tracks 2, 3, 5, 6 and 7, sample removed after 0, 2, 4, 8 and 24 hours ; track 8, undigested carboxymethylated MSAP.
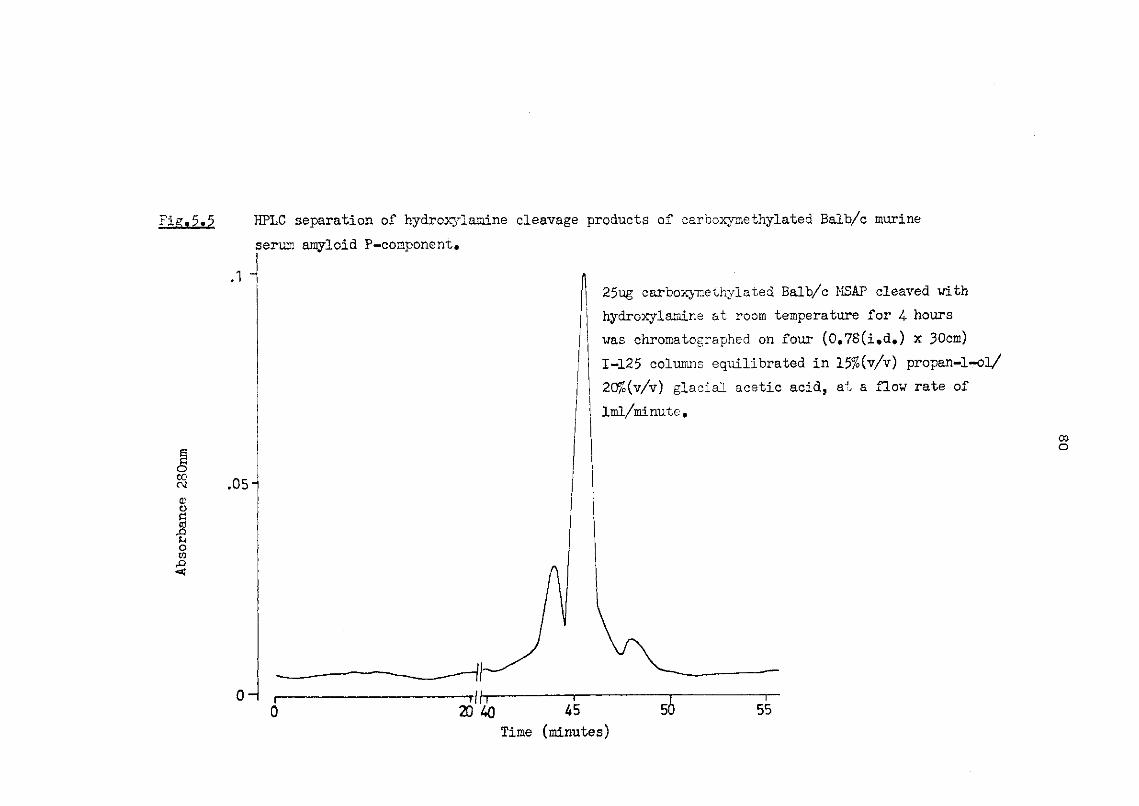
HPLC separation of hydroxylamine cleavage products of carboxymethylated Balb/c murine serum amyloid P-component.
. 1 "
CO (V CD o § •8 o to 3
,05-
0H — r l t v 20 AO
25ug carboxymethylated Balb/c MSAP cleaved with hydroxylamine at room temperature for 4 hours was chromatographed on four (0.78(i,d.) x 30cm) 1-125 columns equilibrated in 15%(v/v) propan-l-ol/ 20%(v/v) glacial acetic acid, at a flow rate of lml/minute.
00 o
—r~ AS
—r~ 55
Time (minutes)
81
20.8K daltons value, suggested that the anomalous behaviour
of these peptides was possibly the result of their basicity.
The HPLC technique was limited by its inability to
separate preparative amounts of digest.
5.5.3 Cleavage of the tryptophanyl peptide bonds by
dimethyl sulphoxide - hydrobromic acid
The method of Savige and Fontana (1977) was used. 200pg car-
boxymethylated Ba.lb/c MSAP dissolved in a mixture comprising 12 pi
glacial acetic acid, 8 pi 12N HC1 and 1 pi DMSO was vortexed
and left at room temperature for 30 minutes. A 3 pi aliquot
of 48% hydrobromine solution, a further 1 pi DMSO and 20 pi
distilled water were added. The pH of this reaction mixture
was adjusted to approximately pH2 with 8 pi pyridine and then
made to a final volume of 80 pi with distilled water. A 20
hour incubation at either room temperature or 60° followed.
Finally the sample was divided into two equal portions and
lyophilised. The resulting cleavage fragments were studied
using SDS 15% (w/v) PAGE or by molecular exclusion HPLC
using the 15% (v/v) propan-1-ol/20% (v/v) glacial acetic acid
system; see Plate 5.9. The HPLC traces for the cleavage time
points were complicated by the strong absorption of DMSO at
A280*
Dialysing the reaction mixture would have removed the DMSO
with the inevitable loss of low molecular weight peptides. At
this stage in the investigations this cleavage was rejected
since other cleavages discussed in this chapter appeared to
be more promising.
5.5.4 Tryptic digest
TPCK treated trypsin was used to digest 200 pg carboxy-
methylated protein. The digestion carried out at 37° in
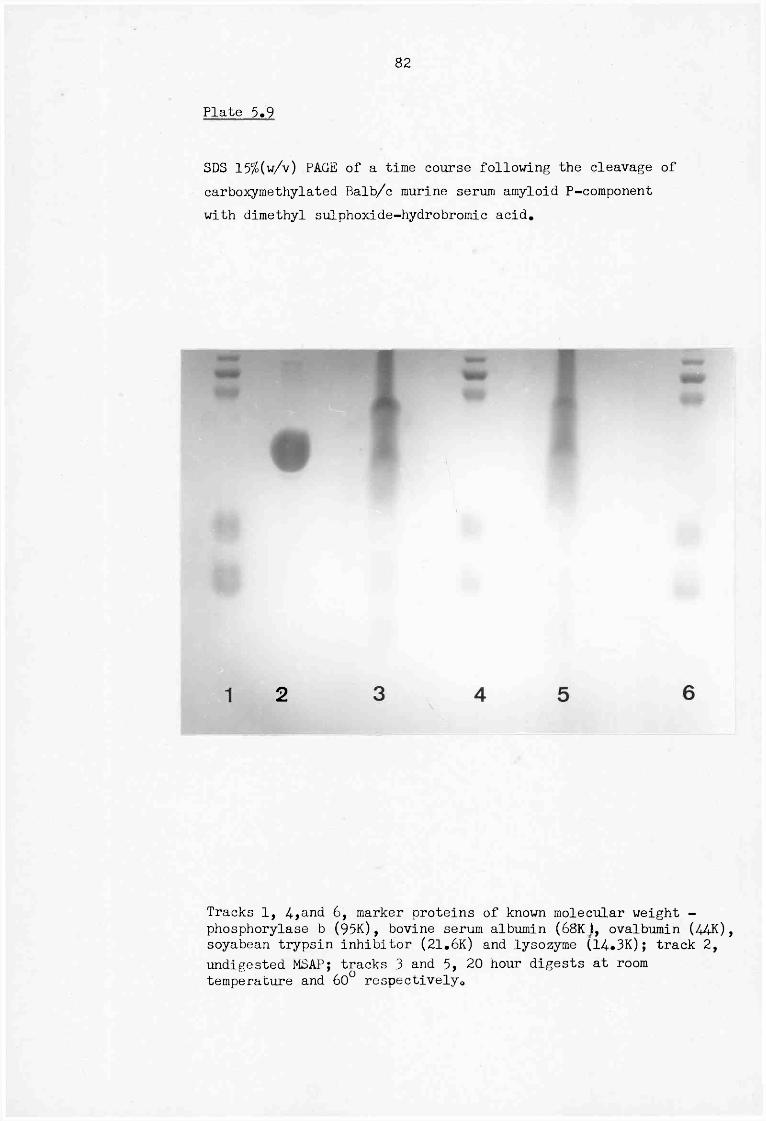
82
Plate 5.9
SDS 15%(w/v) PAGE of a time course following the cleavage of carboxymethylated Balb/c murine serum amyloid P-component with dimethyl sulphoxide-hydrobromic acid.
2
Tracks 1, 4,and 6, marker proteins of known molecular weight -phosphorylase b (95K), bovine serum albumin (68K1, ovalbumin (44K), soyabean trypsin inhibitor (21.6K) and lysozyme (14.3K); track 2, undigested MSAP; tracks 3 and 5, 20 hour digests at room temperature and 60° respectively.
1% (w/v) ammonium bicarbonate used an E:S (w/w) ratio of 1:50.
Aliquots containing 25 \xg of protein were removed after 0, 10,
30, 60 and 90 minutes digestion. 5 |jl 88% formic acid was
added to each aliquot followed by 500 |il distilled water.
These diluted samples were lyophilised. The progress of the
digestion was examined by reverse phase HPLC using the tri-
fluoroacetic acid/propan-2-ol pH2.5 system. Succinylated
carboxymethylated protein digested in a similar manner was
examined by reverse phase HPLC using the glacial acetic acid/
acetonitrile pH6.0 system because of the insolubility of the
succinylated material under acidic conditions.
Results
Both Balb/c MSAP and PSAP were digested as described above.
By analysing the movement of the radioactive peptides and the
relative ratios of the peptides at each time point, it was seen
that the best digestion time for both pentaxins, both succiny-
lated and non-succinylated material, was achieved after a 60
minute incubation. Succinylated material was to be used in a
preparative digestion in order to provide large peptides for
automated sequencing.
5.5.5 Staphylococcus aureus V8 protease digest
To limit hydrolysis to glutamyl bonds, carboxymethylated
protein was digested with Staphylococcus aureus V8 protease
under the conditions described for trypsin; 5.5.4. Time
points of 0, 8, 16, 24 and hours were chosen to evaluate
the progress of the digest. The progress of the digestion
was followed by reverse phase HPLC using the trifluoroacetic
acid/propan-2-ol pH2.5 system.
Results
Both Balb/c MSAP and PSAP were digested as described.
84.
The HPLC traces representing the time points were disappointing
with very few peptides observed for the digested Balb/c MSAP
and none at all for the PSAP. There appeared to be a problem
in solubilising the digested sample for injection on to the
HPLC column. Succinylating the carboxymethylated material
prior to digestion removed the problem for the Balb/c MSAP
but not for the PSAP. As discussed in the tryptic digest,
the peptides from succinylated material were examined by
reverse phase HPLC using the glacial acetic acid/acetonitrile
pH6.0 system.
Analysis of the HPLC traces of the succinylated material,
as explained in 5.5.4, suggested that a 24 hour incubation of
succinylated, carboxymethylated Balb/c MSAP with Staphylococcus
aureus V8 protease, under the conditions discussed in 5.5.4,
was best.
85
CHAPTER 6
CYANOGEN BROMIDE FRAGMENTS
The separate trial experiments described in Chapter 5,
performed at
(i) Imperial College of Science and Technology, South
Kensington, London SW7
(ii) UMMC, Worcester, Ma. 01605, USA
both indicated that conditions for the optimum cleavage were
a 24 hour incubation at room temperature using a 100 fold
molar excess of cyanogen bromide over the number of expected
methionine residues.
6.1 Preparative cyanogen bromide digest performed at Imperial
College; see above
20 mg of carboxymethylated Balb/c MSAP dissolved at 1 mg/ml
in 70% (v/v) formic acid was digested as described above.
Attempts to separate the digestion products by molecular
exclusion HPLC using the 0.01M ammonium acetate pH6.4 system
showed that, at the protein concentration required to enable
this technique to be viable in terms of the number of injections
needed, the desired separation shown in Fig. 5.2 was absent.
Ultimately Bio-gel P60 equilibrated in 5% (v/v) formic acid
was used; see Fig. 6.1. Examination of the bands denoted A,
B and C using molecular weight species which corresponded to
the bands 1 and 2, 3 and 4 respectively, as characterised in
Fig. 5.2. The identity of bands B and C was confirmed using
the dansylation technique, which showed DNS-E and DNS-S
respectively. The peptides represented by bands B and C,
to be referred to as CNBr I and CNBr II respectively, were
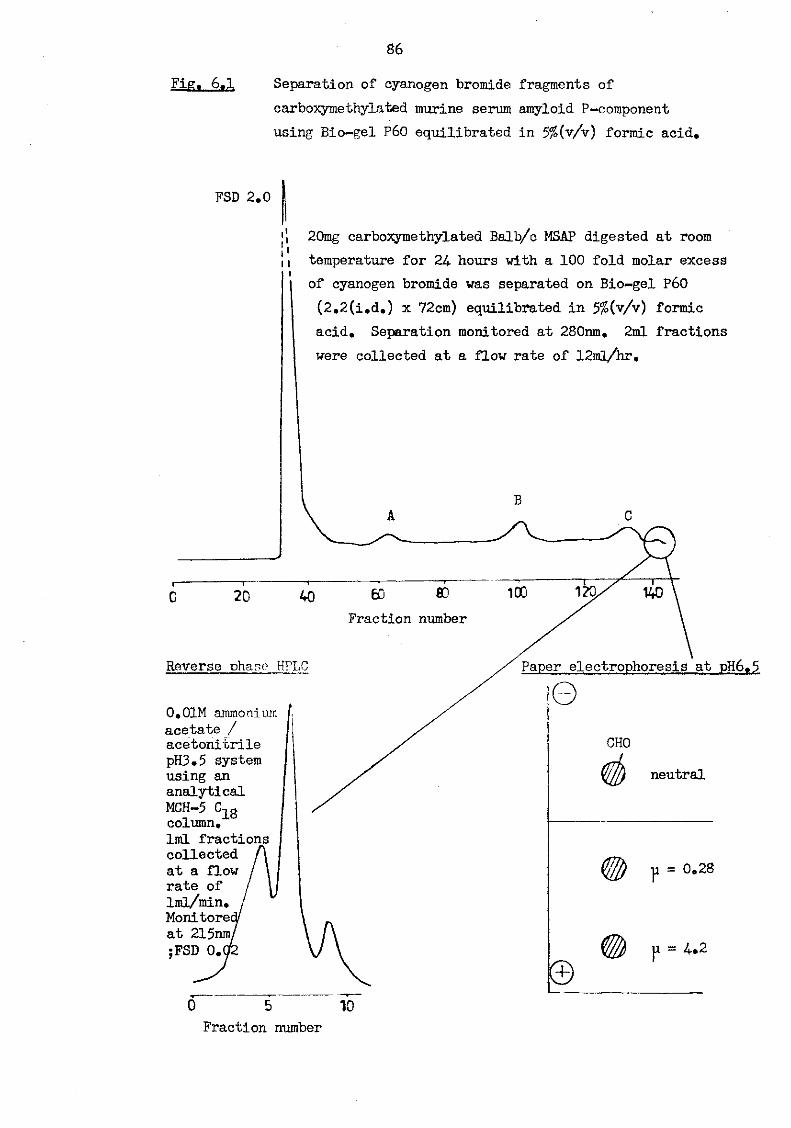
86
Fig. 6.1 Separation of cyanogen bromide fragments of carboxymethylated murine serum amyloid P-component using Bio-gel P60 equilibrated in 5%(v/v) formic acid.
FSD 2.0
20mg carboxymethylated Balb/c MSAP digested at room temperature for 24 hours with a 100 fold molar excess of cyanogen bromide was separated on Bio-gel P60 (2.2(i.d.) x 72cm) equilibrated in 5%(v/v) formic acid. Separation monitored at 280nm. 2ml fractions were collected at a flow rate of 12ml/hr.
Paper electrophoresis at pH6.5
0.01M ammonium acetate / acetonitrile pH3*5 system using an analytical MCH-5 C column, lml fractions collected at a flow rate of lml/min. Monitore at 215nm ;FSD O.G/2
0 5 10 Fraction number
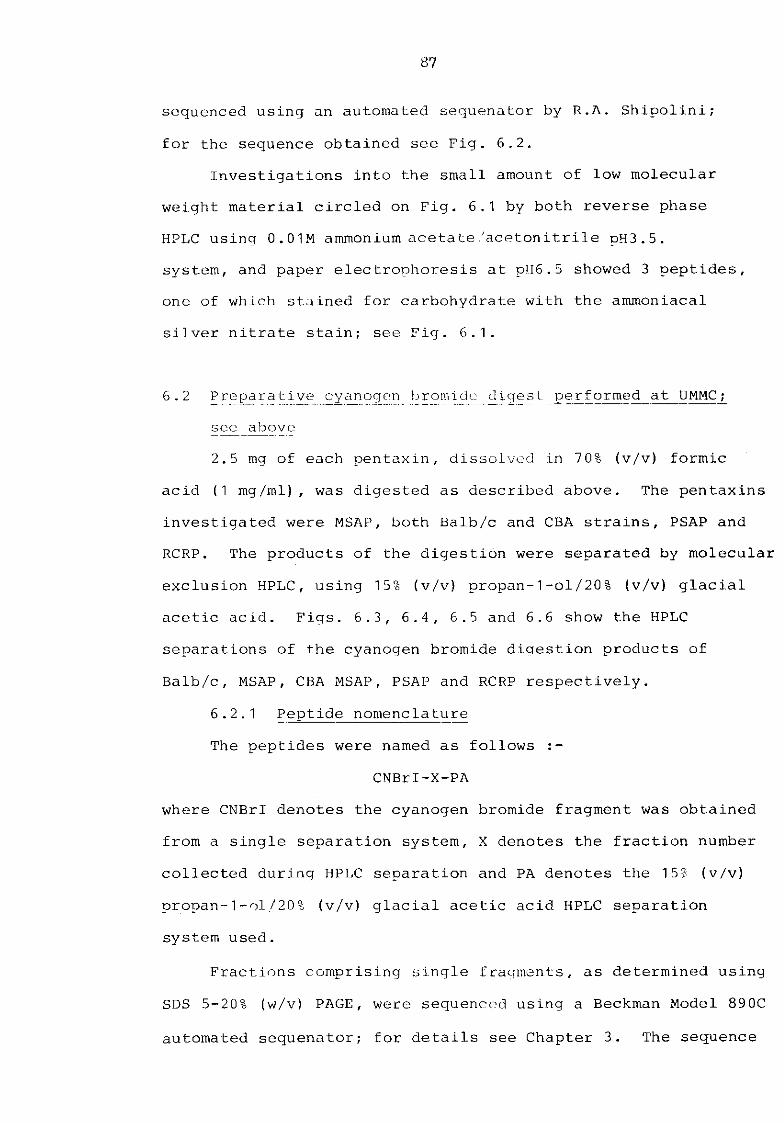
87
sequenced using an automated sequenator by R.A. Shipolini;
for the sequence obtained see Fig. 6.2.
Investigations into the small amount of low molecular
weight material circled on Fig. 6.1 by both reverse phase
HPLC using 0.01M ammonium acetate /acetonitrile pH3.5.
system, and paper electrophoresis at pH6.5 showed 3 peptides,
one of which stained for carbohydrate with the ammoniacal
silver nitrate stain; see Fig. 6.1.
6.2 Preparative cyanogen bromide digest performed at UMMC;
see above
2.5 mg of each pentaxin, dissolved in 70% (v/v) formic
acid (1 mg/ml), was digested as described above. The pentaxins
investigated were MSAP, both Balb/c and CBA strains, PSAP and
RCRP. The products of the digestion were separated by molecular
exclusion HPLC, using 15% (v/v) propan-1-ol/20% (v/v) glacial
acetic acid. Figs. 6.3, 6.4, 6.5 and 6.6 show the HPLC
separations of the cyanogen bromide digestion products of
Balb/c, MSAP, CBA MSAP, PSAP and RCRP respectively.
6.2.1 Peptide nomenclature
The peptides were named as follows :-
CNBrl-X-PA
where CNBrI denotes the cyanogen bromide fragment was obtained
from a single separation system, X denotes the fraction number
collected during HPLC separation and PA denotes the 15% (v/v)
propan-1-ol/20% (v/v) glacial acetic acid HPLC separation
system used.
Fractions comprising single fragments, as determined using
SDS 5-20% (w/v) PAGE, were sequenced using a Beckman Model 890C
automated sequenator; for details see Chapter 3. The sequence
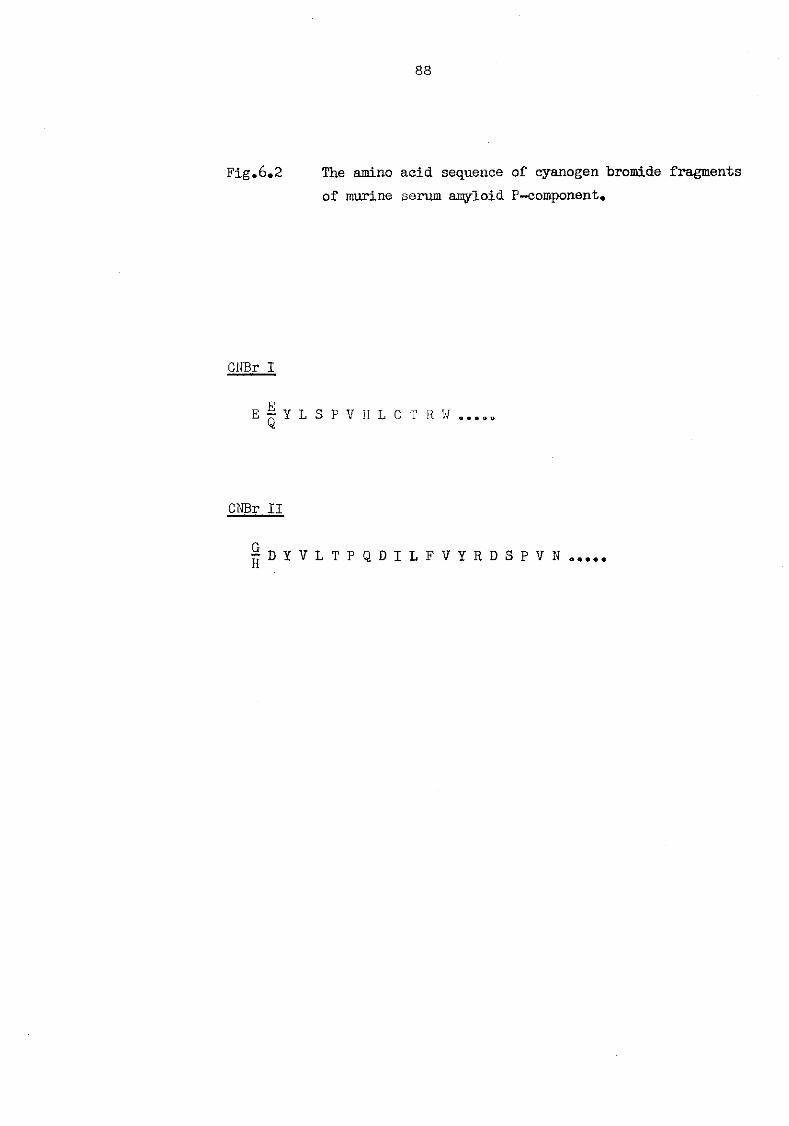
88
Fig.6.2 The amino acid sequence of cyanogen bromide fragments of murine serum amyloid P-component.
CNBr I
E | Y L S P V H L C T R W .....
CNBr II
- D Y V L T P Q D I L F V Y R D S P V N
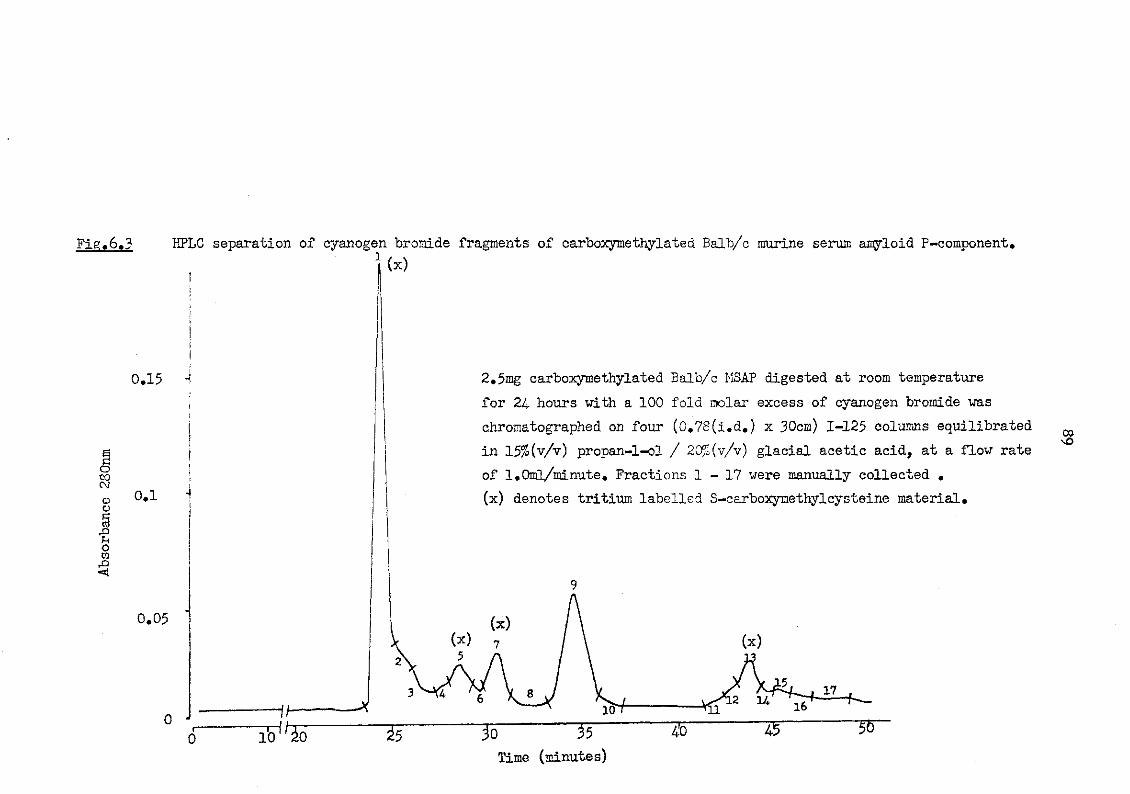
Fig.6.3 HPLC separation of cyanogen bromide fragments of carboxymethylated Balb/c murine serum amyloid P-component. l(x)
o to cv CD o U o w
<
0.15 i
0.1
0.05
0
2.5mg carboxymethylated Balb/c MSAP digested at room temperature for 24 hours with a 100 fold molar excess of cyanogen bromide was chromatographed on four (0.78(i.d.) x 30cm) 1-125 columns equilibrated in 15%(v/v) propan-l-ol / 20% (v/v) glacial acetic acid, at a flow rate of l.Oml/minute. Fractions 1 - 1 7 were manually collected . (x) denotes tritium labelled S-carboxymethylcysteine material.
1h —K 10 "25 To 5T"
Time (minutes) 40
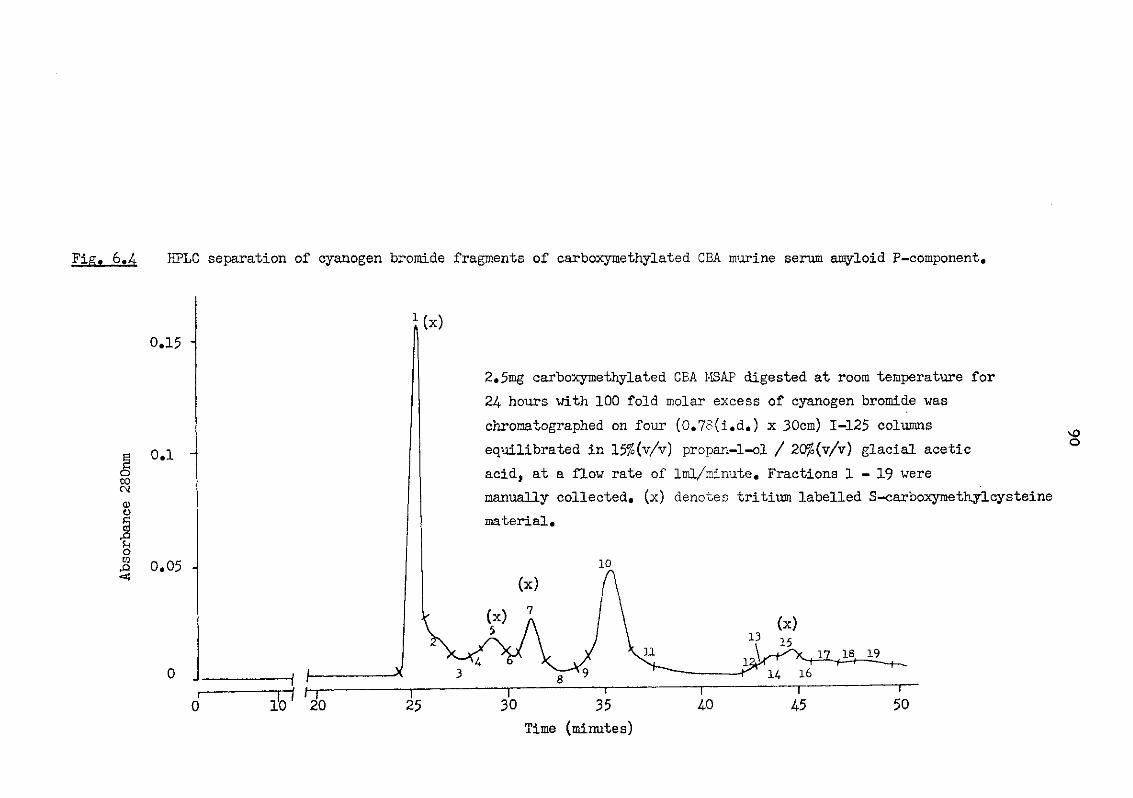
HPLC separation of cyanogen bromide fragments of carboxymethylated CBA murine serum amyloid P-component.
0.15 "
0.1 -
0.05 -
Ito
A 10 20
1 25
2.5mg carboxymethylated CBA MSAP digested at room temperature for 24 hours with 100 fold molar excess of cyanogen bromide was chromatographed on four (0.78(i.d.) x 30cm) 1-125 columns equilibrated in 15%(v/v) propan-l-ol / 20%(v/v) glacial acetic acid, at a flow rate of lml/minute. Fractions 1 - 1 9 were manually collected, (x) denotes tritium labelled S-carboxymethylcysteine material.
vO o
30 35 Time (minutes)
40 45 50
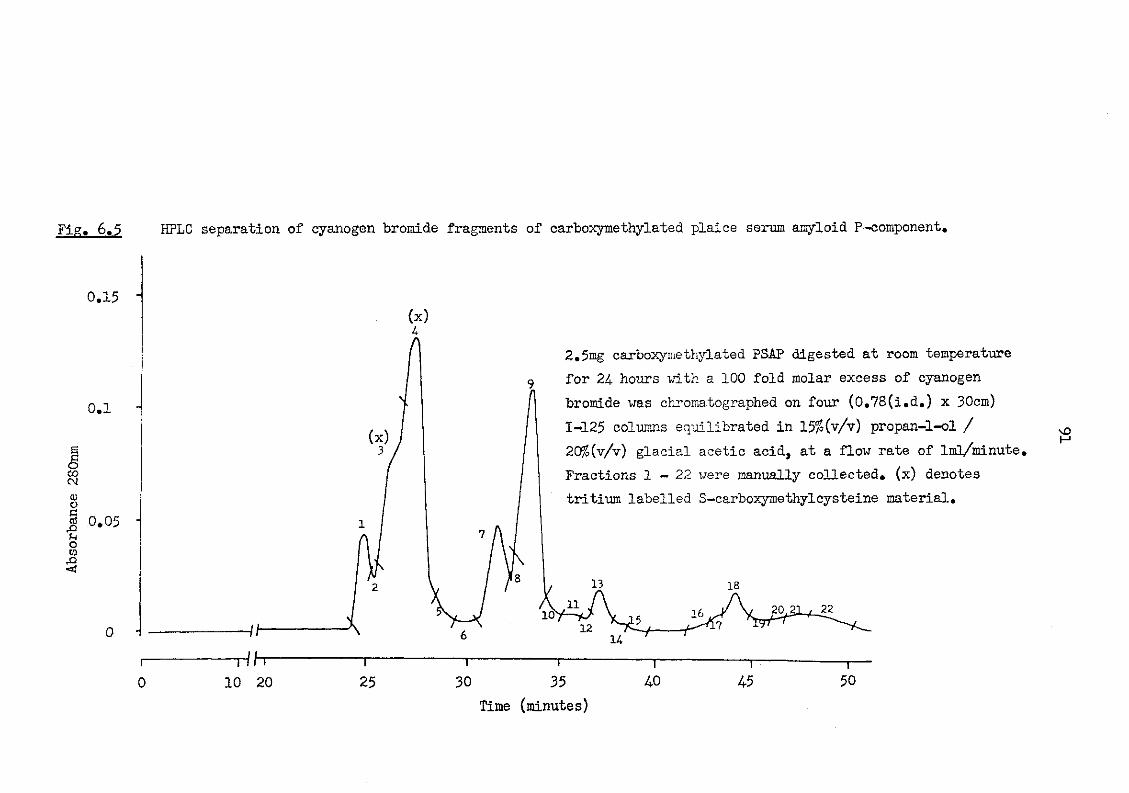
Fig. 6.5 HPLC separation of cyanogen bromide fragments of carboxymethylated plaice serum amyloid P-component,
0.15
0.1
c o to CM 0) o PI ctf rQ o CO
rO <*t
0.05
0
- r l h r
10 20 25
2.5mg carboxymethylated PSAP digested at room temperature for 24. hours with a 100 fold molar excess of cyanogen bromide was chromatographed on four (0.78(i.d.) x 30cm) 1-125 columns equilibrated in 15%(v/v) propan-l-ol / 20%(v/v) glacial acetic acid, at a flow rate of lnO/minute, Fractions 1 - 2 2 were manually collected, (x) denotes tritium labelled S-carboxymethylcysteine material.
30 35 Time (minutes)
T~ 40 4-5
1 50
sO H
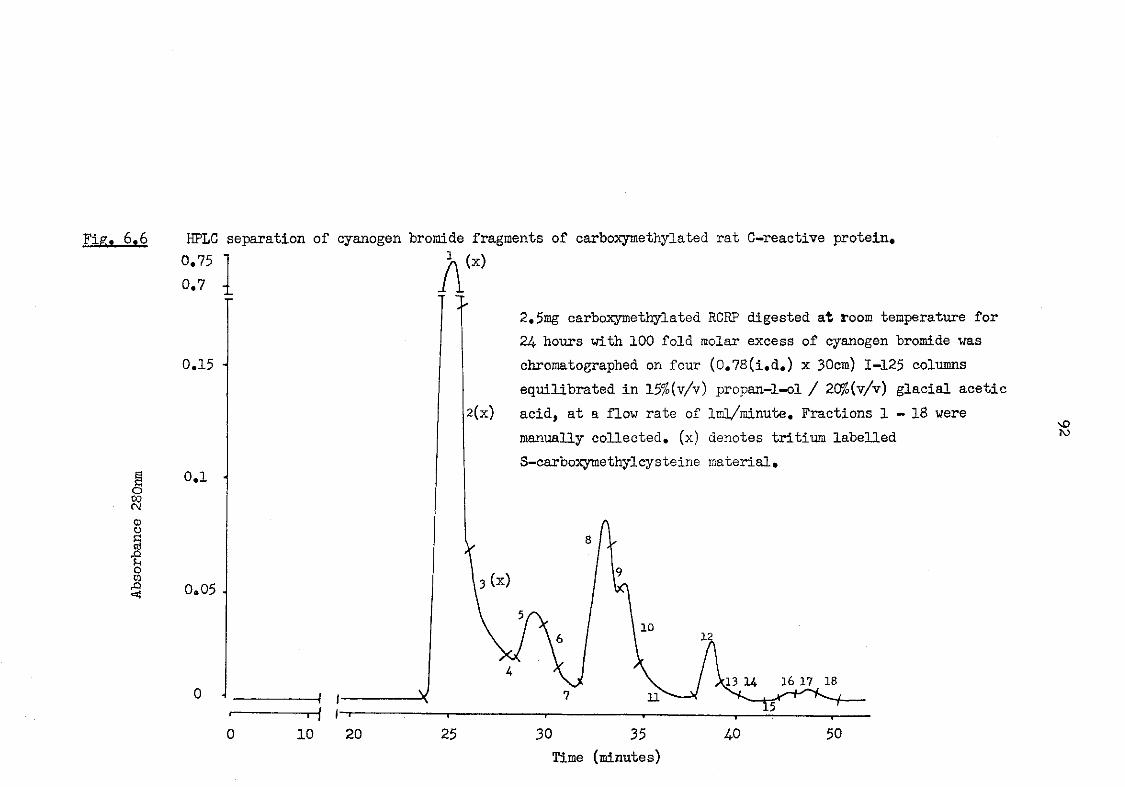
Fig. 6.6
o 00 CM!
<D O G rt jn u o ca rQ <4
HPLC 0.75 0.7
separation of cyanogen bromide fragments of carboxymethylated rat C-reactive protein.
0.15
0.1
0.05 -
-/ I-•f I'
10 20
A (x)
2(x)
2.5mg carboxymethylated RCRP digested at room temperature for 24 hours with 100 fold molar excess of cyanogen bromide was chromatographed on four (0.78(i.d.) x 30cm) 1-125 columns equilibrated in 15%(v/v) propan-l-ol / 20%(v/v) glacial acetic acid, at a flow rate of Iml/minute. Fractions 1 - 1 8 were manually collected, (x) denotes tritium labelled S-carboxymethylcysteine material.
sO TO
M
25 30 35 Time (minutes)
AO 50
93
determined for the cyanogen bromide fragments of MSAP, PSAP
and RCRP is summarised in Figs. 6.7, 6.8 and 6.9 respectively.
The amino acid composition for the sequenced fragments and
detailed sequenator yields may be found in Appendix C.
6.2.2 Carboxypeptidase Y digest
By analogy with the amino acid sequence of the human
pentaxins, the cyanogen bromide fragments from Balb/c and
CBA strains of mice, CNBrI-9-PA and CNBrI-10-PA respectively,
were considered to contain the C-terminus of MSAP. In an
effort to sequence the C-terminal region, approximately 5 nmol
CBA MSAP CNBrI-10-PA; all that remained following amino acid
analysis and sequencing studies, was digested with carboxy-
peptidase Y. The same amino acids were seen to be released
from the sample and from the control system, thus making
assignment of any amino acid residues impossible. Lack of
sample prevented further investigations.
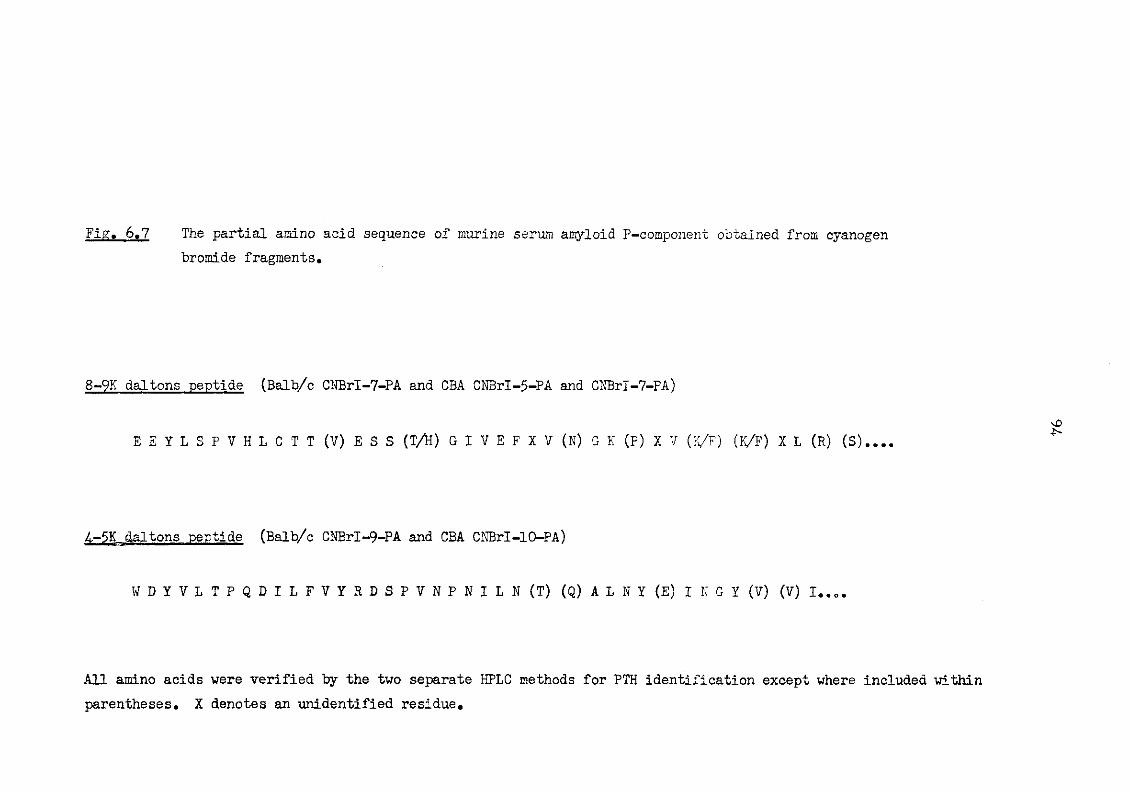
Fig. 6.7 The partial amino acid sequence of murine serum amyloid P-component obtained from cyanogen bromide fragments.
8-9K daltons peptide (Balb/c CNBrI-7-PA and CBA CNBrI-5-PA and CNBrI-7-PA)
E E Y L S P V H L C T T (V) E S S (T/H) G I V E F X V (N) G K (P) X V (K/F) (K/F) X L (R) (S)....
4.-5K daltons peptide (Balb/c CNBrI-9-PA and CBA CNBrI-10-PA)
W D Y V L T P Q D I L F V Y R D S P V N P N I L N (T) (Q) A L N Y (E) I N G Y (V) (V) I..0.
All amino acids were verified by the two separate HPLC methods for PTH identification except where included within parentheses. X denotes an unidentified residue.
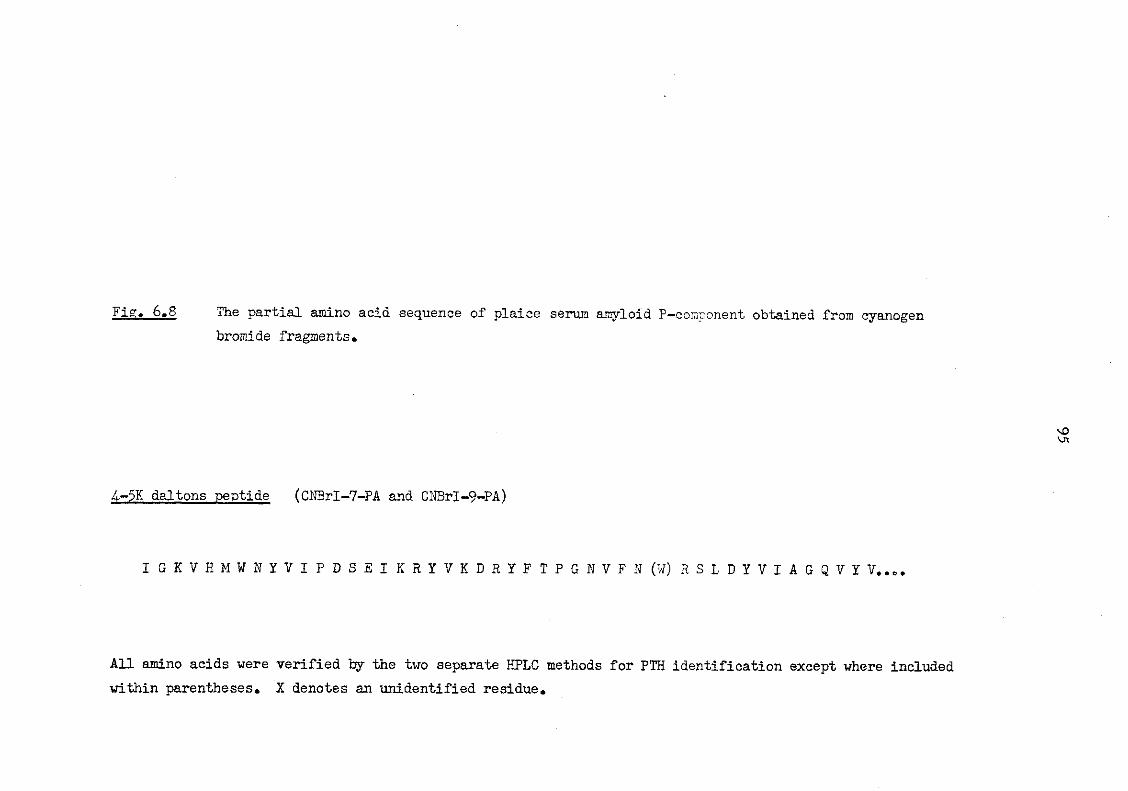
Fig. 6.8 The partial amino acid sequence of plaice serum amyloid P-component obtained from cyanogen bromide fragments.
4-5K daltons peptide (CNBrI-7-PA and GNBrI-9-PA)
I G K V H M W N Y V I P D S E I K R Y V K D R Y F T P G N V F N (W) R S L D Y V I A G Q V Y V..e.
All amino acids were verified by the two separate HPLC methods for PTH identification except where included within parentheses. X denotes an unidentified residue.
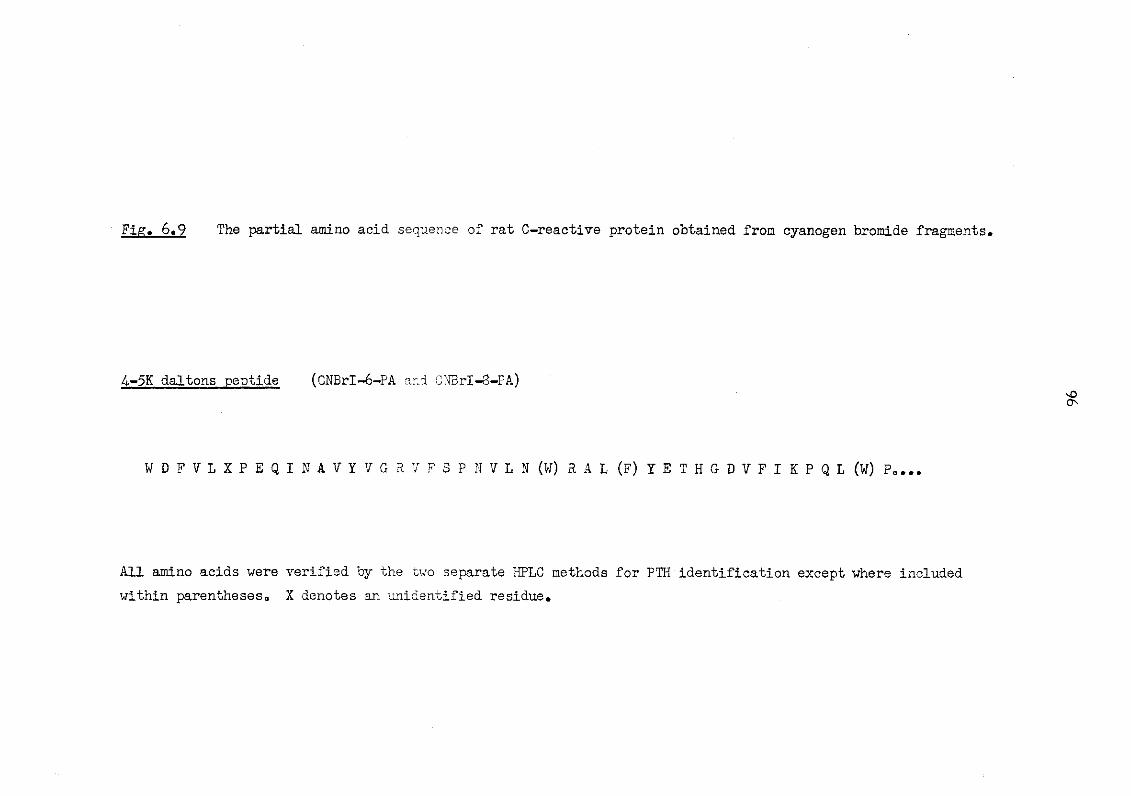
Fig. 6*9 The partial amino acid sequence of rat C-reactive protein obtained from cyanogen bromide fragments.
4-5K daltons peptide (CNBrI-6-PA and CNBrI-3-PA)
W D F V L X P E Q I N A V Y V G R V F S P N V L N (W) R A L (F) Y E T H G D V F I K P Q L (W) P....
All amino acids were verified by the two separate HPLC methods for PTH identification except where included within parentheses. X denotes an unidentified residue.
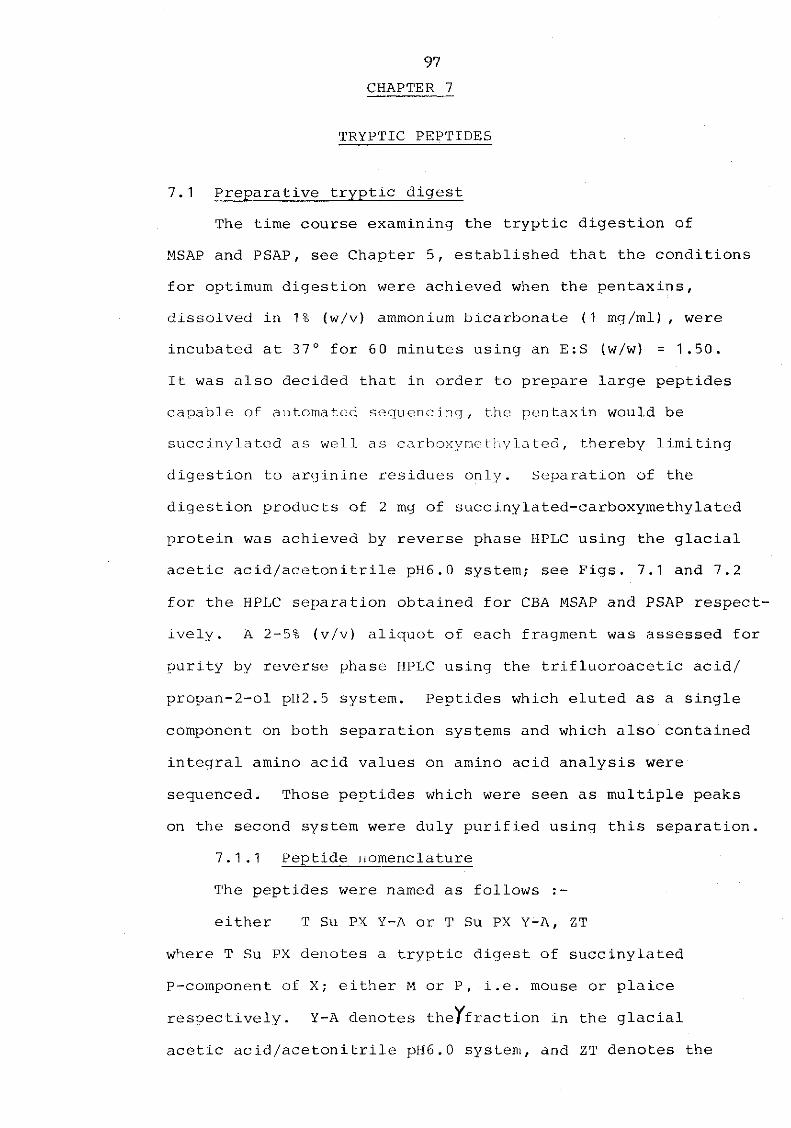
97 CHAPTER 10
TRYPTIC PEPTIDES
7.1 Preparative tryptic digest
The time course examining the tryptic digestion of
MSAP and PSAP, see Chapter 5, established that the conditions
for optimum digestion were achieved when the pentaxins,
dissolved in 1% (w/v) ammonium bicarbonate (1 mg/ml), were
incubated at 37° for 60 minutes using an E:S (w/w) = 1.50.
It was also decided that in order to prepare large peptides
capable of automated sequencing, the pentaxin would be
succinylated as well as carboxymethylated, thereby limiting
digestion to arginine residues only. Separation of the
digestion products of 2 mg of succinylated-carboxymethylated
protein was achieved by reverse phase HPLC using the glacial
acetic acid/acetonitrile pH6.0 system; see Figs. 7.1 and 7.2
for the HPLC separation obtained for CBA MSAP and PSAP respect-
ively. A 2-5% (v/v) aliquot of each fragment was assessed for
purity by reverse phase HPLC using the trifluoroacetic acid/
propan-2-ol pH2.5 system. Peptides which eluted as a single
component on both separation systems and which also contained
integral amino acid values on amino acid analysis were
sequenced. Those peptides which were seen as multiple peaks
on the second system were duly purified using this separation.
7.1.1 Peptide nomenclature
The peptides were named as follows :-
either T Su PX Y-A or T Su PX Y-A, ZT
where T Su PX denotes a tryptic digest of succinylated
P-component of X; either M or P, i.e. mouse or plaice
respectively. Y-A denotes the/fraction in the glacial
acetic acid/acetonitrile pH6.0 system, and ZT denotes the
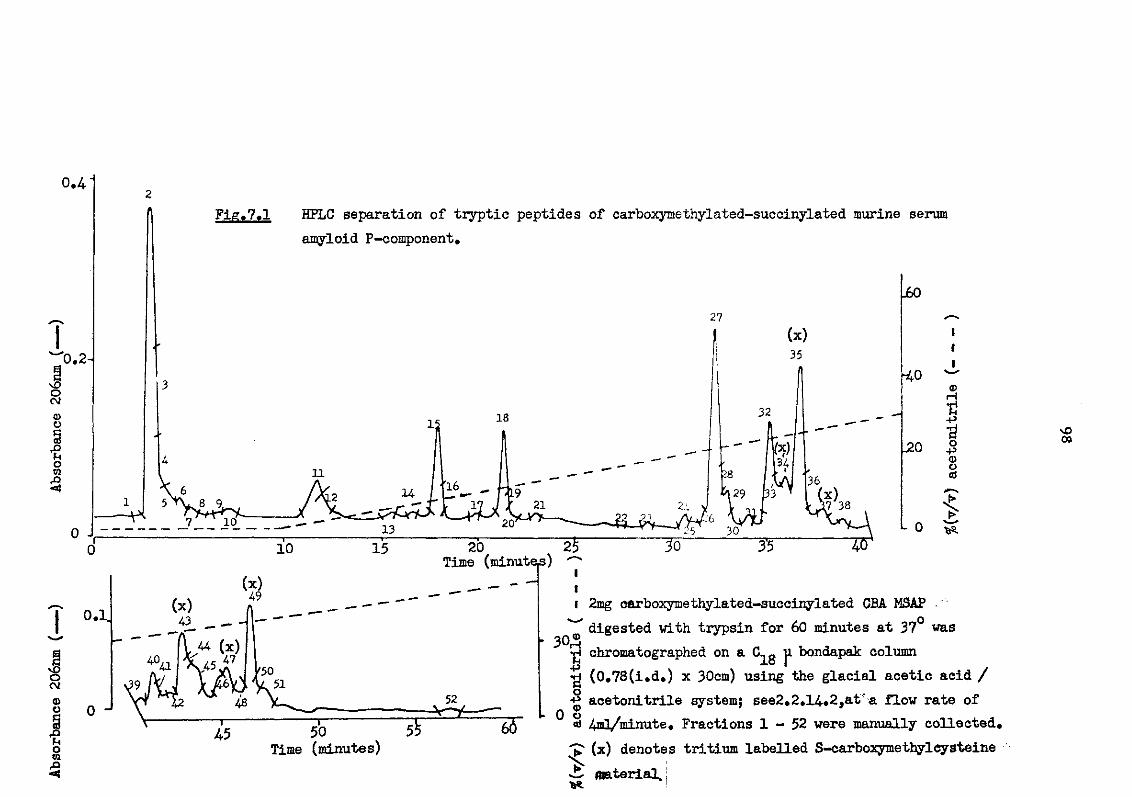
F i g . 7 . 1 HFLC separation of tryptic peptides of carboxymethylated-succinylated murine serum amyloid P-component.
j60
-40
-20
L 0 20
Time (minuteo)
0.1.
0 J -V 52
50 5? Time (minutes)
i 2mg earboxymethylated-succinylated GBA MSAP
I I I © H -P
O •P © O d
1
' 303 digested with trypsin for 60 minutes at 37 was
•h chromatographed on a G^g ji bondapak column (0.78(i.d.) x 30cm) using the glacial acetic acid /
-g acetonitrile system; see2.2.14.2,at?a flow rate of ® § 4ml/minute. Fractions 1 - 5 2 were manually collected,
(x) denotes tritium labelled S-carboxymethylcysteine vb material. ** !
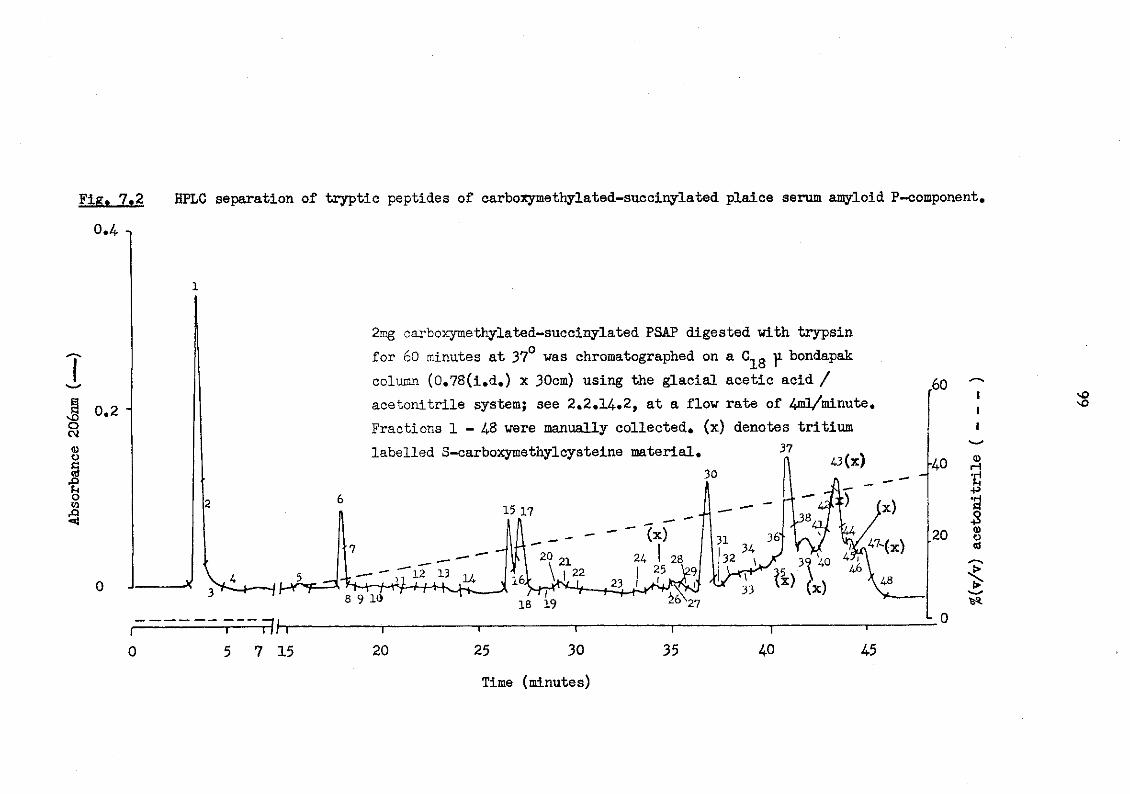
as«JZi2 HPLC separation of tryptic peptides of carboxymethylated-succinylated plaice serum amyloid P-component.
0 . 4 i
0.2
0
2mg carboxymethylated-succinylated PSAP digested with trypsin for 60 minutes at 37° was chromatographed on a C^g y bondapak column (0.78(i.d.) x 30cm) using the glacial acetic acid / acetonitrile system; see 2.2.14»2, at a flow rate of 4ml/minute. Fractions 1 - 4 8 were manually collected, (x) denotes tritium labelled S-carboxymethylcysteine material.
,60
^ r - H ^ H - 1 3
8 9 10
-40
20
18 19
0 —rlhr
7 15
L 0
20 25 30
Time (minutes)
35 r
40 45
<D H
O <D O rt
i
vO sO
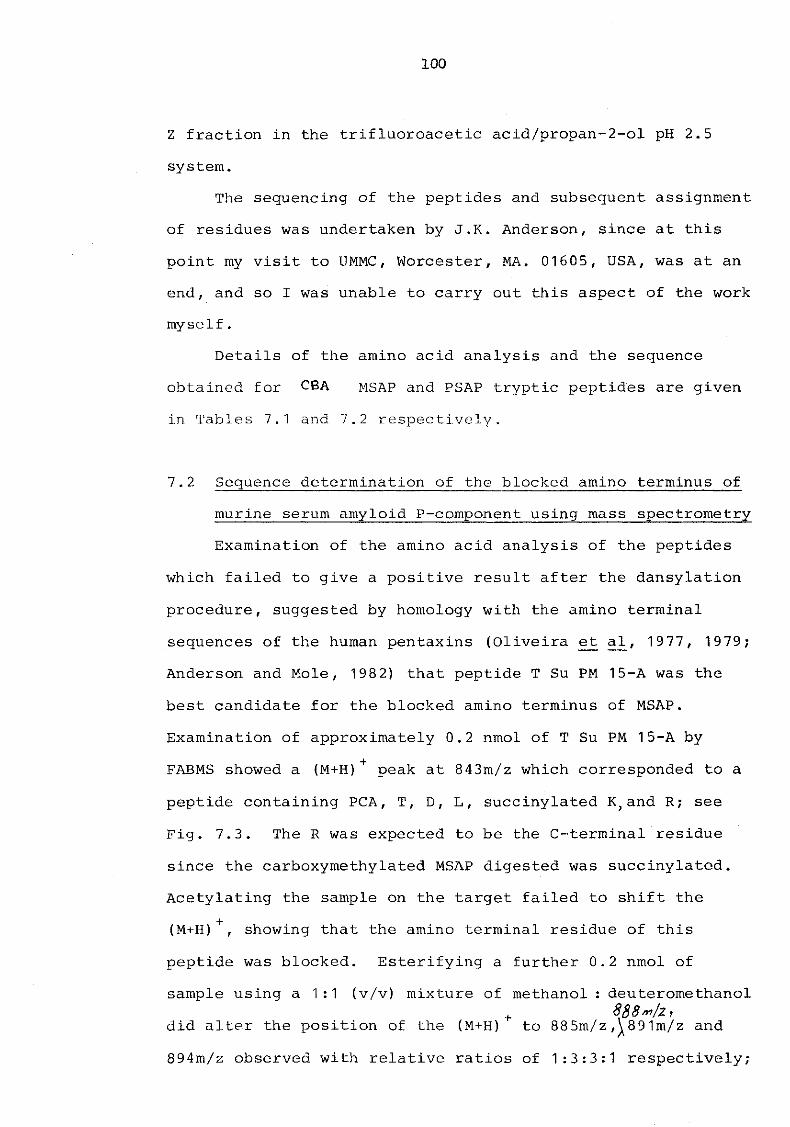
100
Z fraction in the trifluoroacetic acid/propan-2-ol pH 2.5
system.
The sequencing of the peptides and subsequent assignment
of residues was undertaken by J.K. Anderson, since at this
point my visit to UMMC, Worcester, MA. 01605, USA, was at an
end, and so I was unable to carry out this aspect of the work
myself.
Details of the amino acid analysis and the sequence
obtained for CBA MSAP and PSAP tryptic peptides are given
in Tables 7.1 and 7.2 respectively.
7.2 Sequence determination of the blocked amino terminus of
murine serum amyloid P-component using mass spectrometry
Examination of the amino acid analysis of the peptides
which failed to give a positive result after the dansylation
procedure, suggested by homology with the amino terminal
sequences of the human pentaxins (Oliveira et al, 1977, 1979;
Anderson and Mole, 1982) that peptide T Su PM 15-A was the
best candidate for the blocked amino terminus of MSAP.
Examination of approximately 0.2 nmol of T Su PM 15-A by
FABMS showed a (M+H) + peak at 843m/z which corresponded to a
peptide containing PCA, T, D, L, succinylated K ; a n d R; see
Fig. 7.3. The R was expected to be the C-terminal residue
since the carboxymethylated MSAP digested was succinylated.
Acetylating the sample on the target failed to shift the
(M+H) +, showing that the amino terminal residue of this
peptide was blocked. Esterifying a further 0.2 nmol of
sample using a 1:1 (v/v) mixture of methanol : deuteromethanol + 8 8 8 W z i
did alter the position of the (M+H) to 8 8 5 m / z 8 9 1 m / z and
894m/z observed with relative ratios of 1:3:3:1 respectively;
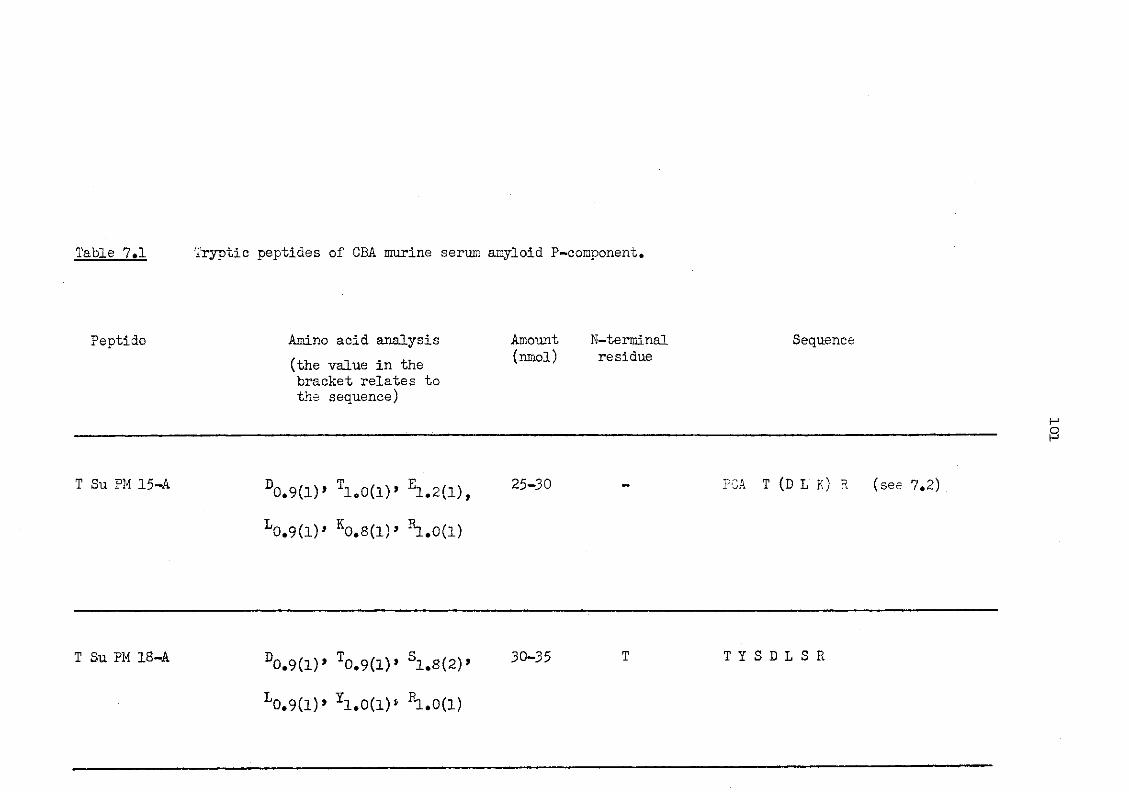
Table 7.1 Tryptic peptides of CBA murine serum amyloid P-component
Peptide Amino acid analysis Amount N-terminal Sequence /,, _ (nmol) residue (the value m the bracket relates to the sequence)
T Su PM 15-A D0.9(l)' T1c0(1)' E1.2(l), 2 5 - 3 0
L0.9(1)' K0.8( 1)> ^L.Od)
PGA T (D L K) R (see 7.2)
T Su PM 18-A D0.9(l)' T0.9(l)' S1.8(2)' 3 0 " 3 5
L0.9(l)» Y1.0(l)* ^.0(1)
T Y S D L S R
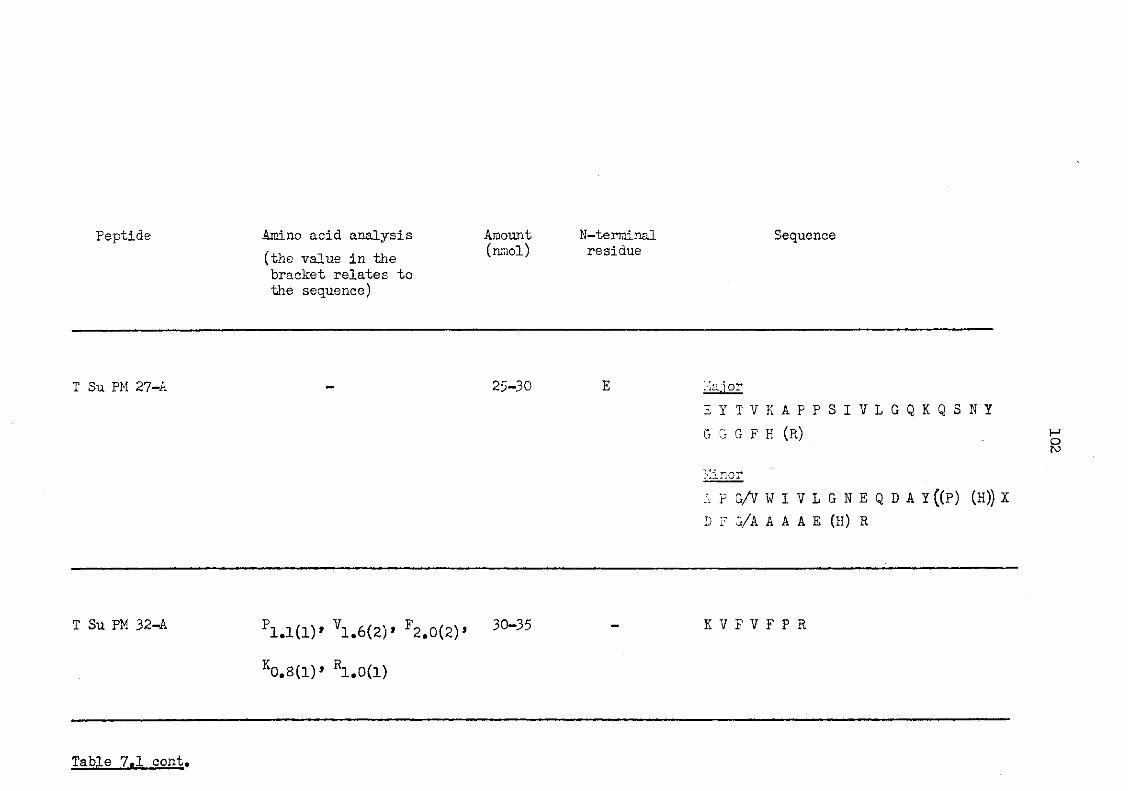
Peptide Amino acid analysis (the value in the bracket relates to the sequence)
Amount (nmol)
N-terminal residue
Sequence
T Su PM 27-A 25-30 E ia.j or E Y T V K A P P S I V L G Q K Q S N X G G G F H (R)
Minor A P G A W I V L G N E Q D A Y ((P) (H)) X D F G/A A A A E (H) R
T Su PM 32-A Pl.l(l)f V1.6(2)» F2.0(2)
K0.8(l)> ^l.O(l)
V. 30-35 K V F V F P R
Table 7*1 cont,
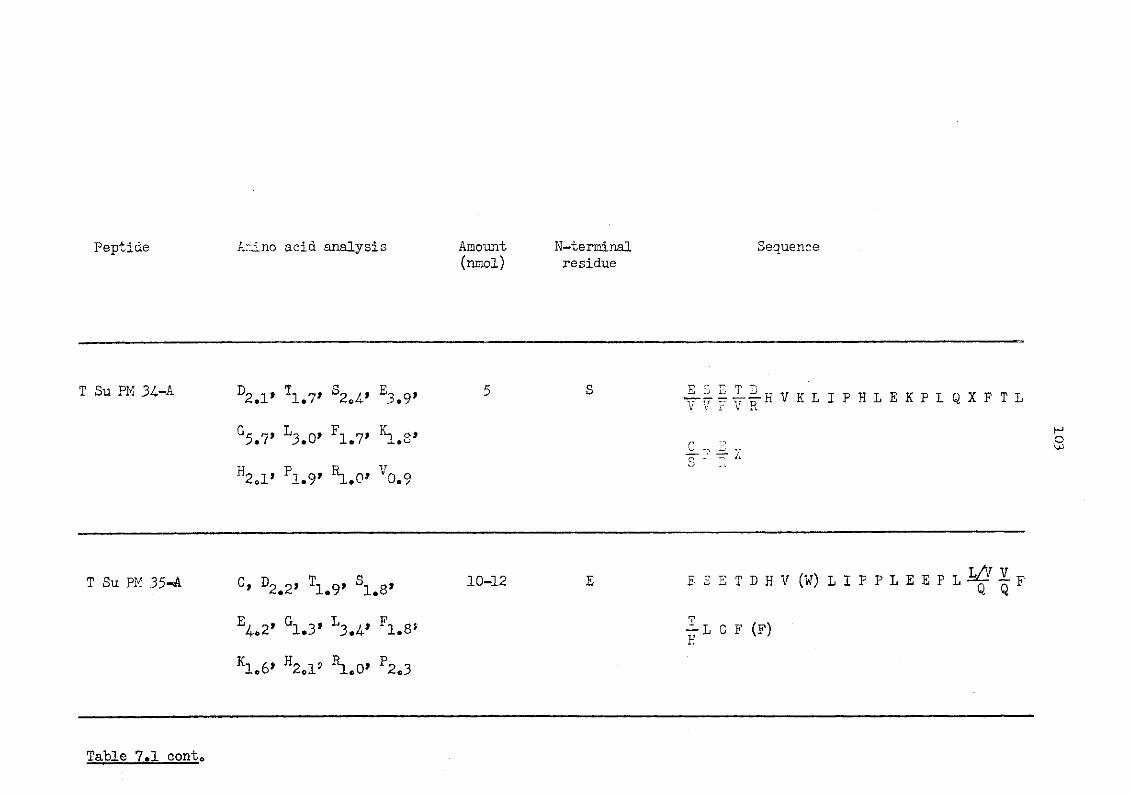
Peptide Amino acid analysis Amount N-terminal Sequence (nmol) residue
2.1» 1.7* 2.4' 3.9* -S-.T b ^ H V K L I P H L E K P L Q X F T L V V r V K
T Su PM 34-A D 2 a , ^ ? f S ^ , E ^ , 5 S E T D
G5.7' L3.0» F1.7> A . S *
B2ol' P1.9' V0.9
T Su PM 35-A C, D 2 # 2, T 1 # 9, S 1 # 8, 10-12 E
E4o2' G1.3' L3.4» F1.S5
T D H V M L I P P L E E P L ^ F
L C F (F)
K. 1.6» H2ol5 ^UO' P2o3
Table 7.1 cont.
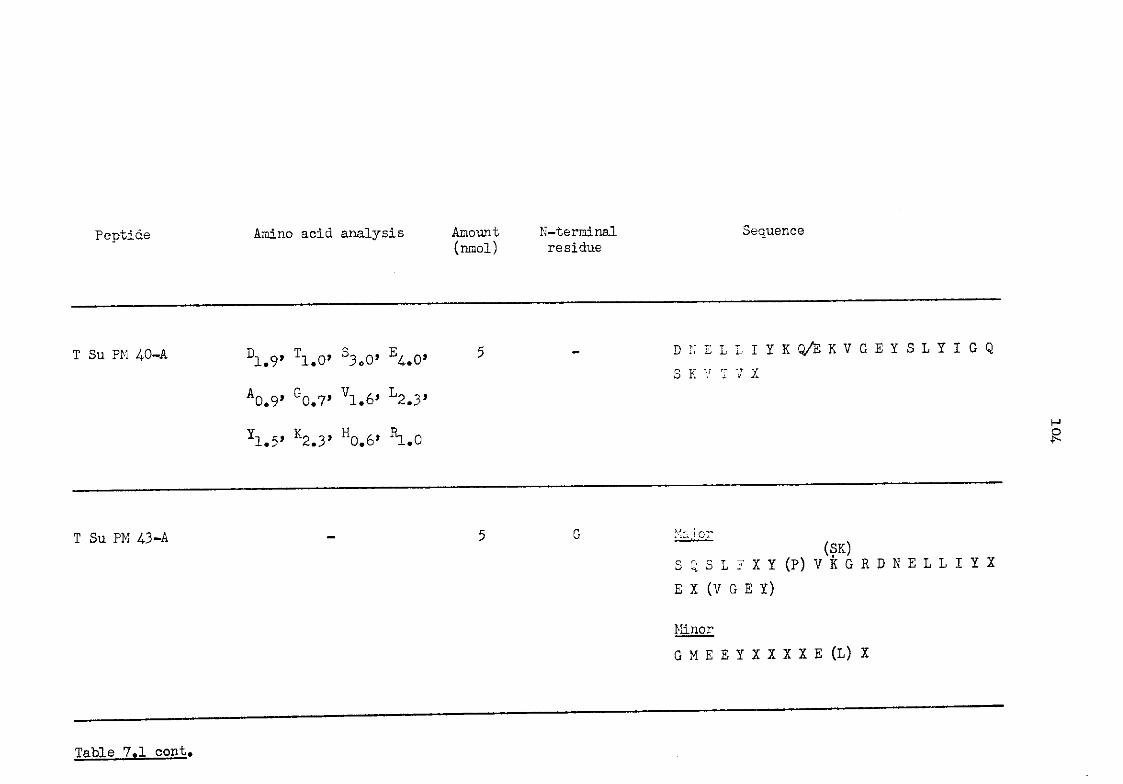
Peptide Amino acid analysis Amount (nmol)
N-terminal residue
sequence
T Su PM 4-0-A D1.9' T1.0> S3o0'
A0.9» G0.7» V1.6' L2.3'
Y1.5> K2.3' H0.6> L.O
D N E L L I Y K Q / E K V G E Y S L Y I G Q
T Su PM 43-A - 5 G Major S Q S L F X Y ( P ) V K G R D N E L L I Y X E X (V G E Y)
Minor G M E E Y X X X X E (L) X
Table 7.1 eont.
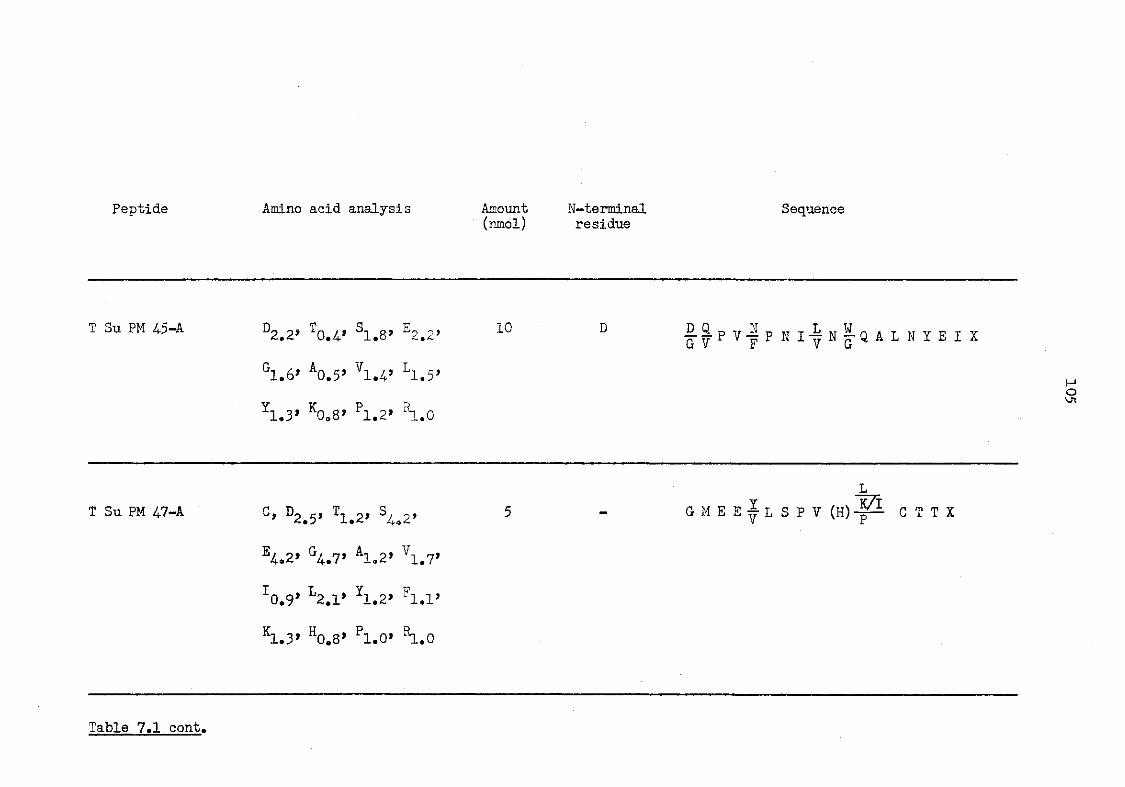
Peptide Amino acid analysis Amount N-terminal (nmol) residue
Sequence
T Su PM 45-A D2.2S T0.4' S1.8> E2.2>
G1.6> A0.5' V1.4' L1.5>
10 D | | P V | P N I | N | Q A L N Y E I X
Y1.3> K0o8> P1.2> ?T.O
L G M E E | L S P V ( H ) G T T X T Su PM 47-A p n T q
2.5' a1.2» 4o2'
Table 7.1 cont.
E4a2» G4.7» A1.2» VI #7'
L2.1j Y1.2> Fl.l»
K1.3> H0.8> P1.0> ^.0
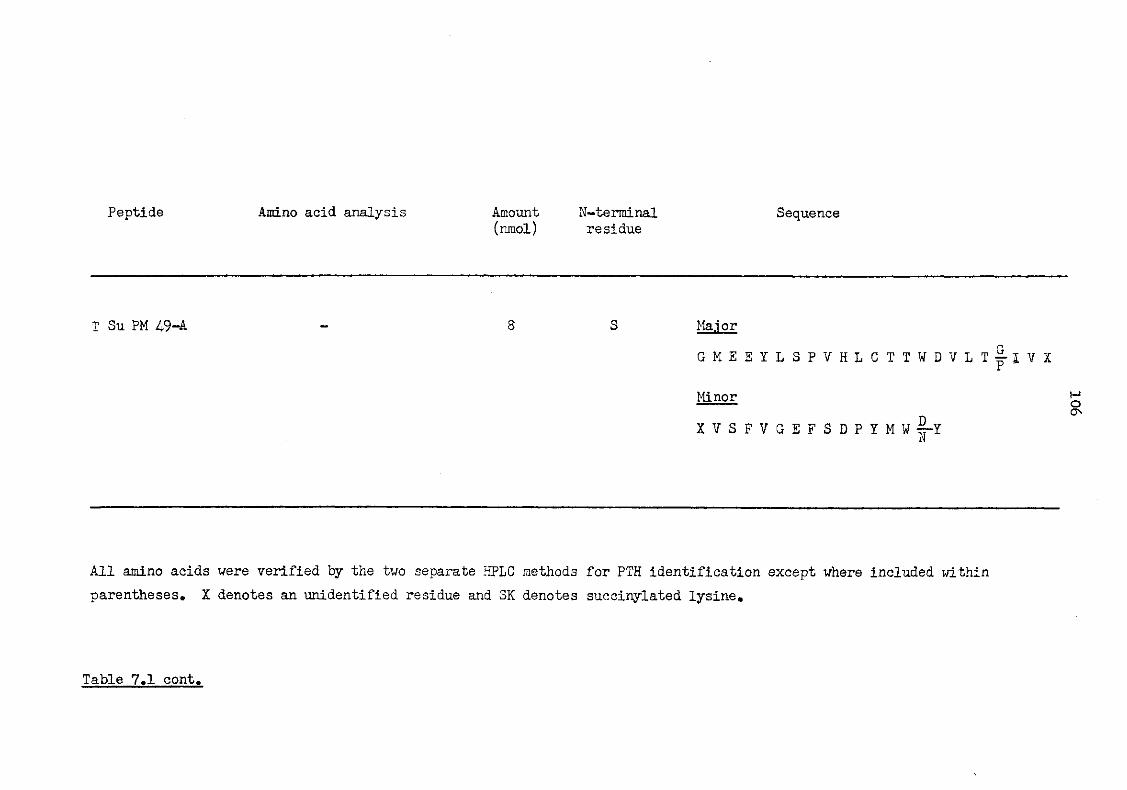
Peptide Amino acid analysis Amount N-terminal (nmol) residue
Sequence
T Su PM 4.9-A Major
G M E E Y L S P V H L C T T W D V L T — I V X
Minor D X V S F V G E F S D P Y M W J - Y
All amino acids were verified by the two separate HPLC methods for PTH identification except where included within parentheses. X denotes an unidentified residue and SK denotes succinylated lysine.
Table 7.1 cont.
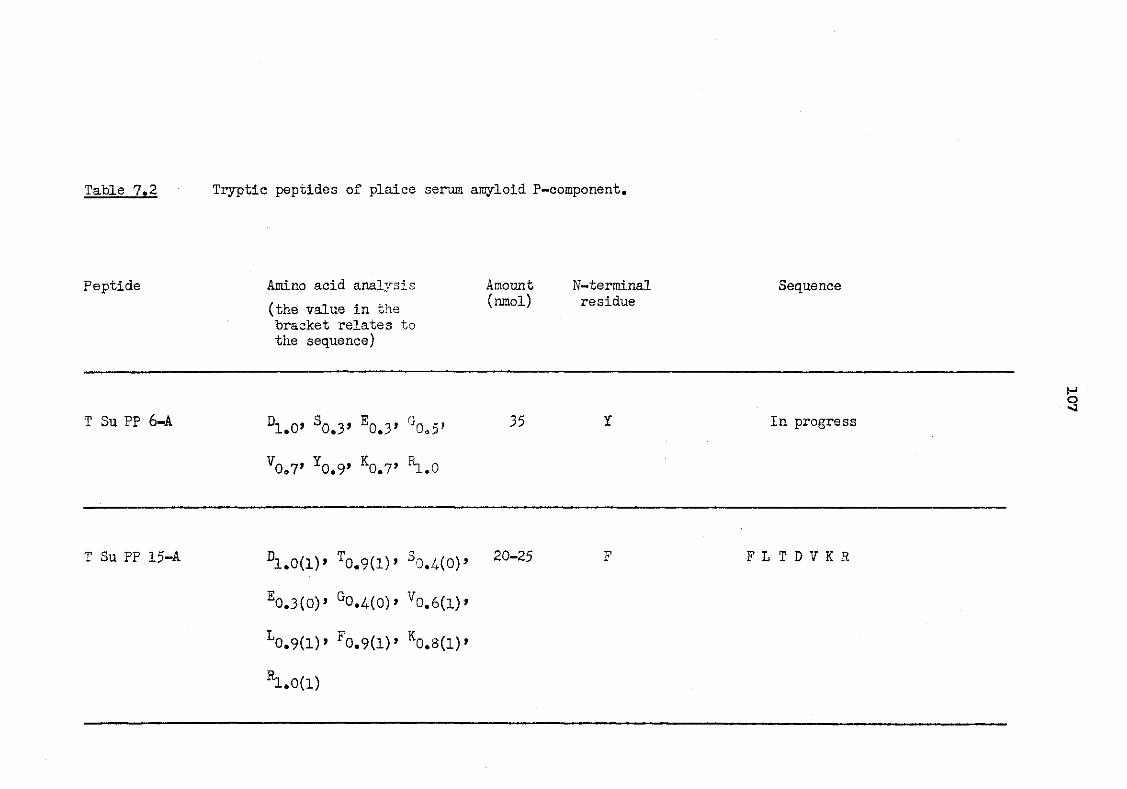
Table 7»2 Tryptic peptides of plaice serum amyloid P-component.
Peptide Amino acid analysis (the value in the bracket relates to the sequence)
Amount (nmol)
N-terminal residue
Sequence
T Su PP 6-A D1.0> S0.3> E0.3» G0o5j
V0o7» T0,9* K0.7' ^L.O
H O •J 35 In progress
T Su PP 15-A ^l.O(l)9 T0.9(l)> 30.4(0)9 2 0 " 2 5
E0.3(0)> G0.4(0)> V0.6(l)>
E0.9(l)9 F0.9(l)' E0.S(l)9
h.o{D
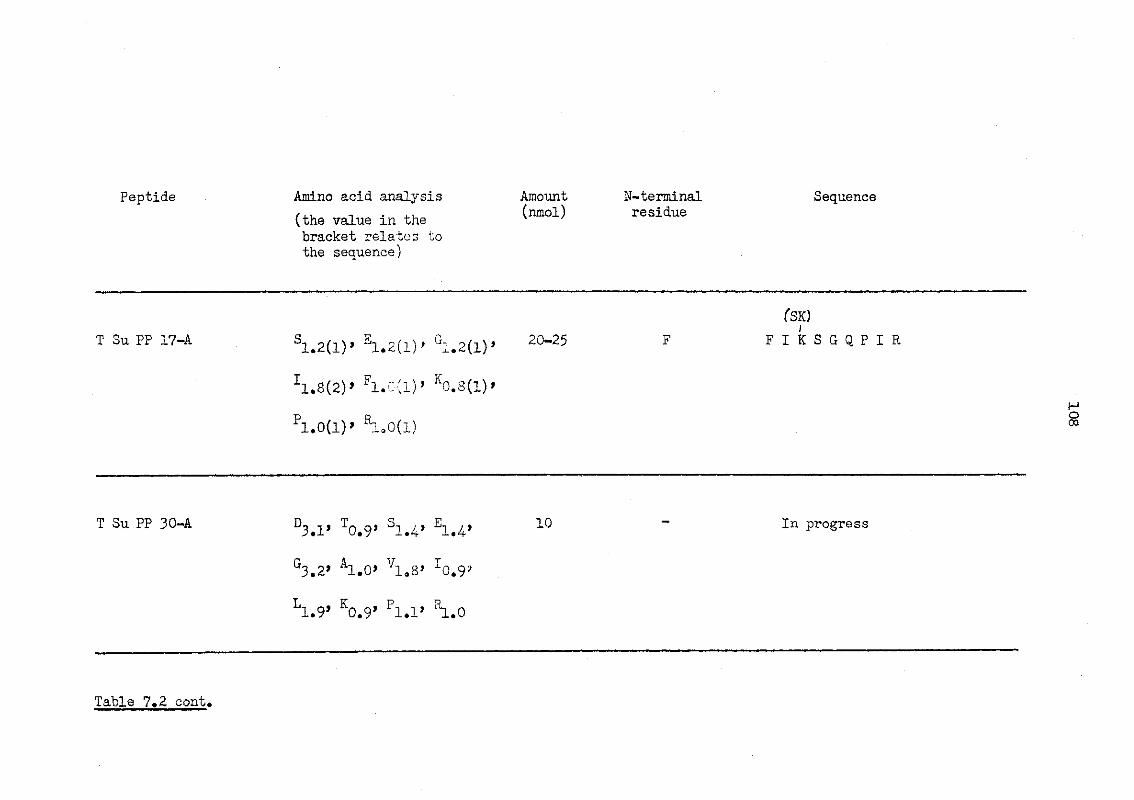
Peptide Amino acid analysis Amount N-terminal Sequence /., , (nmol) residue (the value m the x ' bracket relates to the sequence)
(SK)
T Su PP 17-A S 1 Ei.2(l)' G1.2(l)' 2 0 - 2 5 F F I K S G Q P I R
h.S(2)' Fl.C{l)> K0.8(l)>
P1.0(l)> ^1.0(1)
T Su PP 30-A D. T q S^ 10 - In progress
°3.2» A1.0> V1.8> I0.93
L r , 9 ' K 0.9 ' p I . I » ^1.0
Table 7.2 cont.
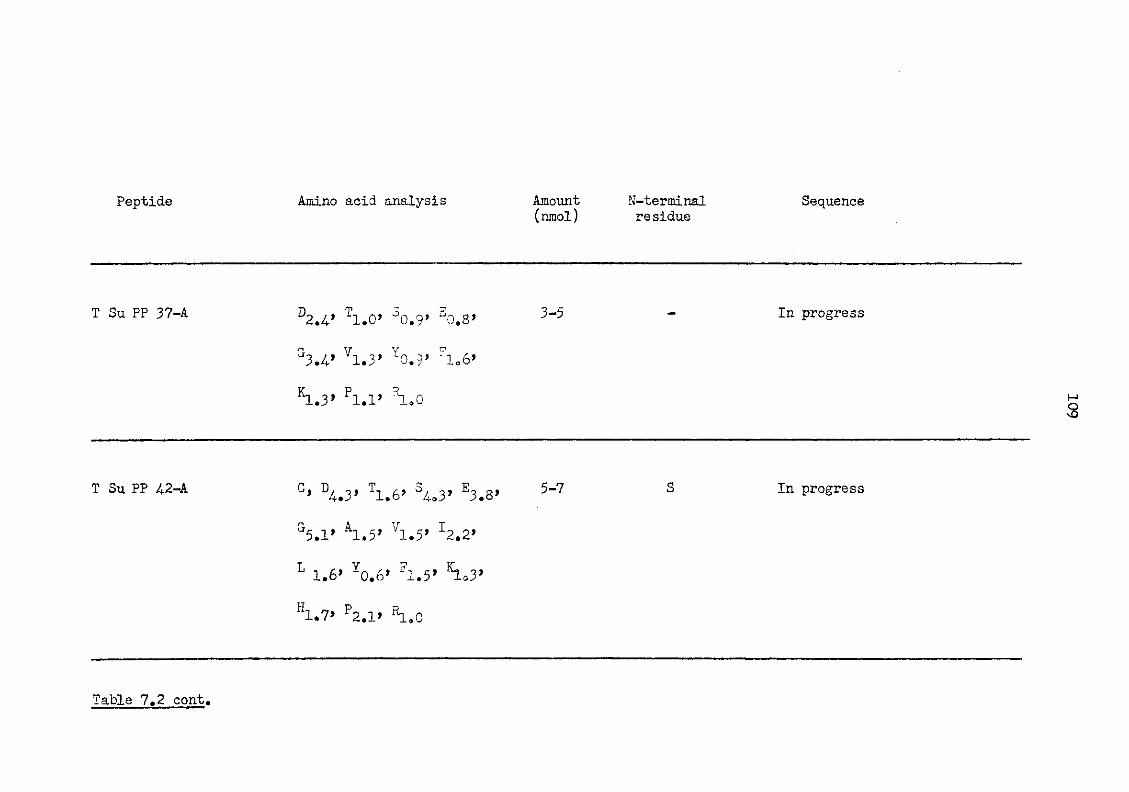
Peptide Amino acid analysis Amount N-terminal (nmol) residue
Sequence
T Su PP 37-A T^q, 3q^9, a^g, 3-5 - In progress
G3.4' V1.3J Y0.9» ?1o6»
h.3* Pl.l' "loO
T Su PP 42-A D4.3> T1.6> S4-O3' E3.8> 5-7 S In progress
G 5 . 1 » kl.5> V 1 . 5 » h.2>
L 1.6> Y0.6' F1.5' ho3'
H1.7> P2.1> ^1.0
Table 7.2 cont.
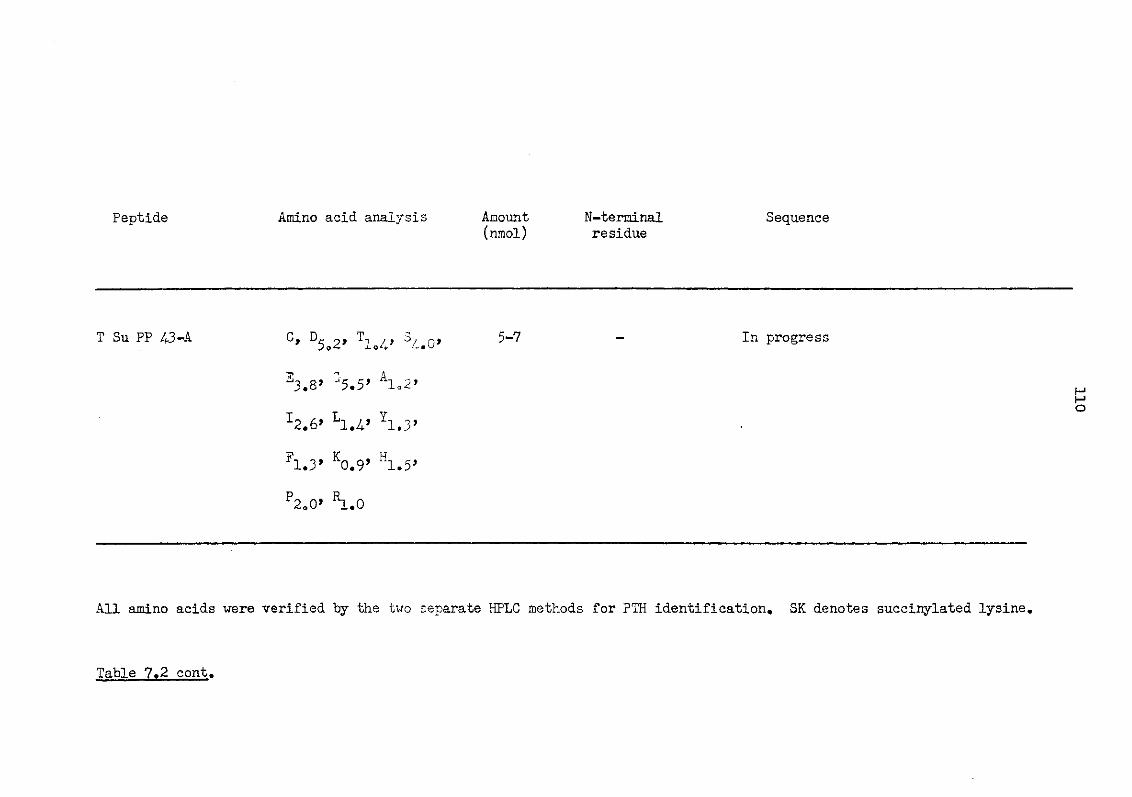
Peptide Amino acid analysis Amount N-terminal Sequence (nmol) residue
T Su PP 43-A C, D^ 2, T l o /, 5-7 - In progress
E3.8> A1o2»
h m 6 9 h . A ' Y1.3'
F1.3' K0.9' H1.5>
P2.0»
All amino acids were verified by the two separate HPLC methods for PTH identification. SK denotes succinylated lysine
Table 7.2 cont.
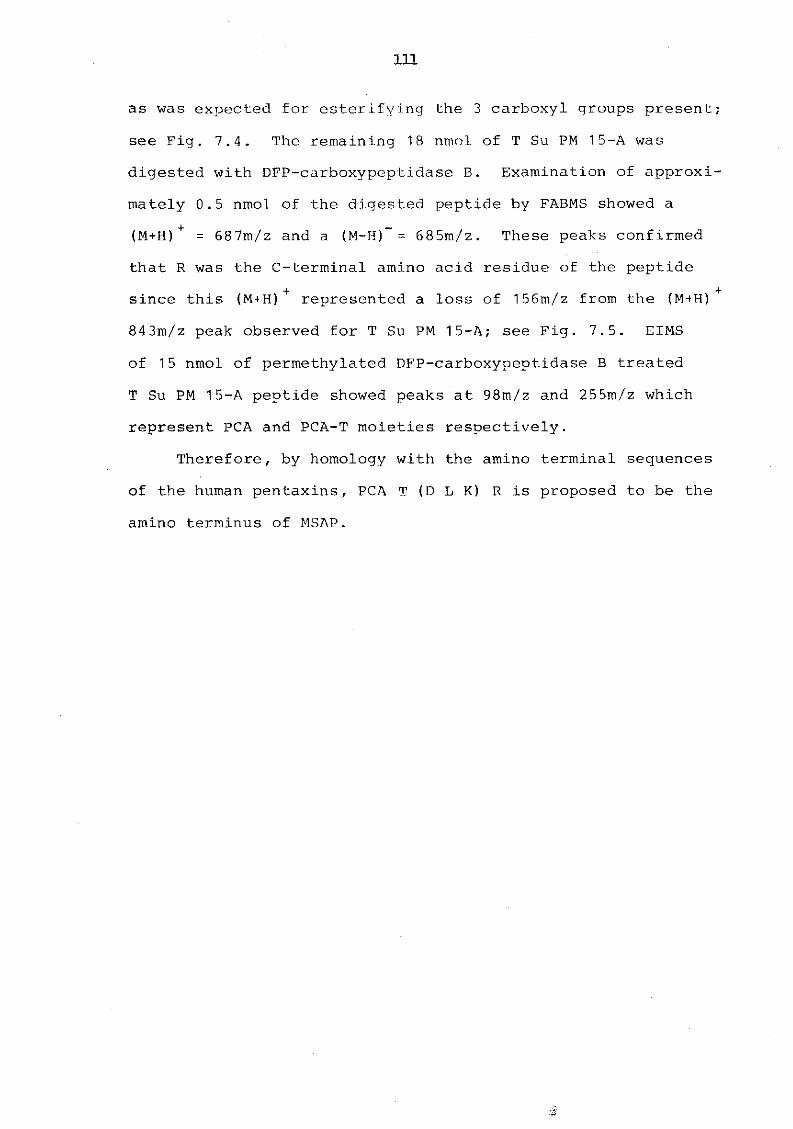
Ill
as was expected for esterifving the 3 carboxyl groups present;
see Fig. 7.4. The remaining 18 nmol of T Su PM 15-A was
digested with DFP-carboxypeptidase B. Examination of approxi-
mately 0.5 nmol of the digested peptide by FABMS showed a
(M+H) + = 687m/z and a (M-H)~= 685m/z. These peaks confirmed
that R was the C-terminal amino acid residue of the peptide + +
since this (M+H) represented a loss of 156m/z from the (M+H)
843m/z peak observed for T Su PM 15-A; see Fig. 7.5. EIMS
of 15 nmol of permethylated DFP-carboxypeptidase B treated
T Su PM 15-A peptide showed peaks at 98m/z and 255m/z which
represent PCA and PCA-T moieties respectively.
Therefore, by homology with the amino terminal sequences
of the human pentaxins, PCA T (D L K) R is proposed to be the
amino terminus of MSAP.
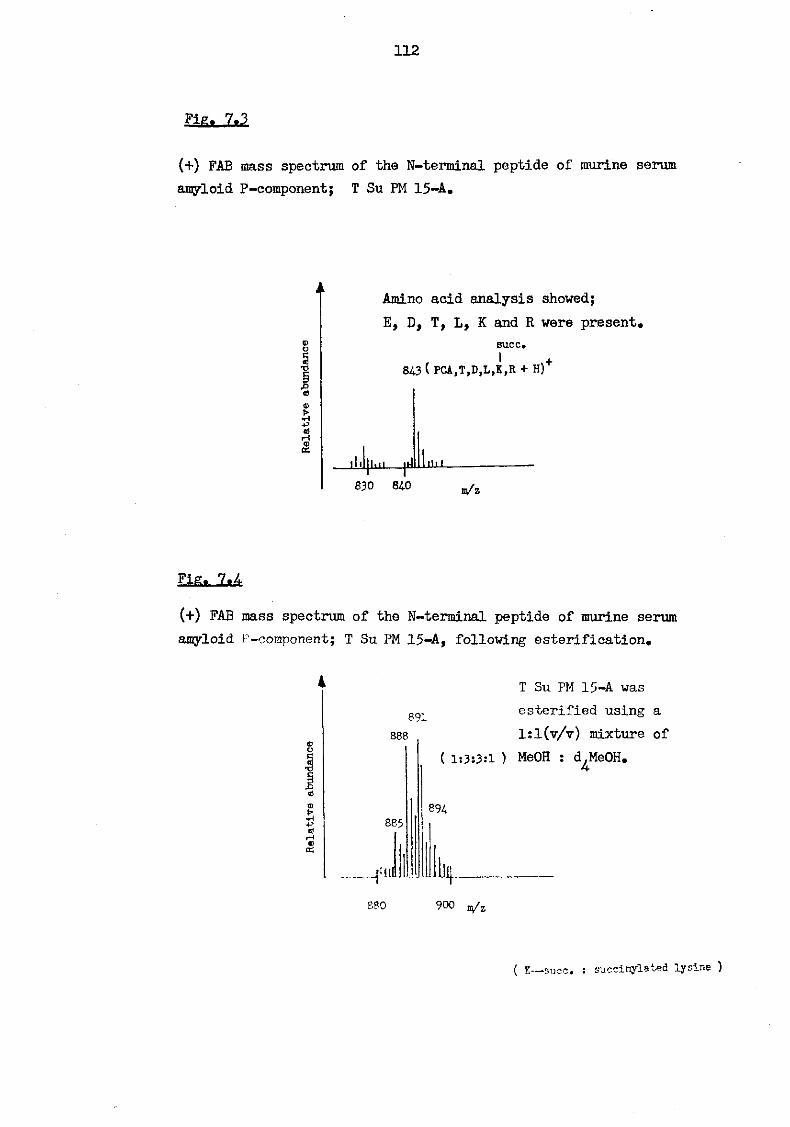
112
glfit 7t?
(+) FAB mass spectrum of the N-terminal peptide of murine serum amyloid P-component; T Su PM 15-A.
Amino acid analysis showed; E, D, T, L, K and R were present,
succ* 843 ( PCA,T,D,L,K,R + H)+
il»l[l.»i [dlllilil 830 840 n/z
Fifit 7t4
(+) FAB mass spectrum of the N-terminal peptide of murine serum amyloid P-component; T Su PM 15-A, following esterification.
-p as rH IS 06
891 888
885
T Su PM 15-A was esterified using a 1:1(v/v) mixture of
( 1:3:3:1 ) MeOH : d^MeOH.
894
14
880 900 n/z
( K—succ. : succinylated lysine )
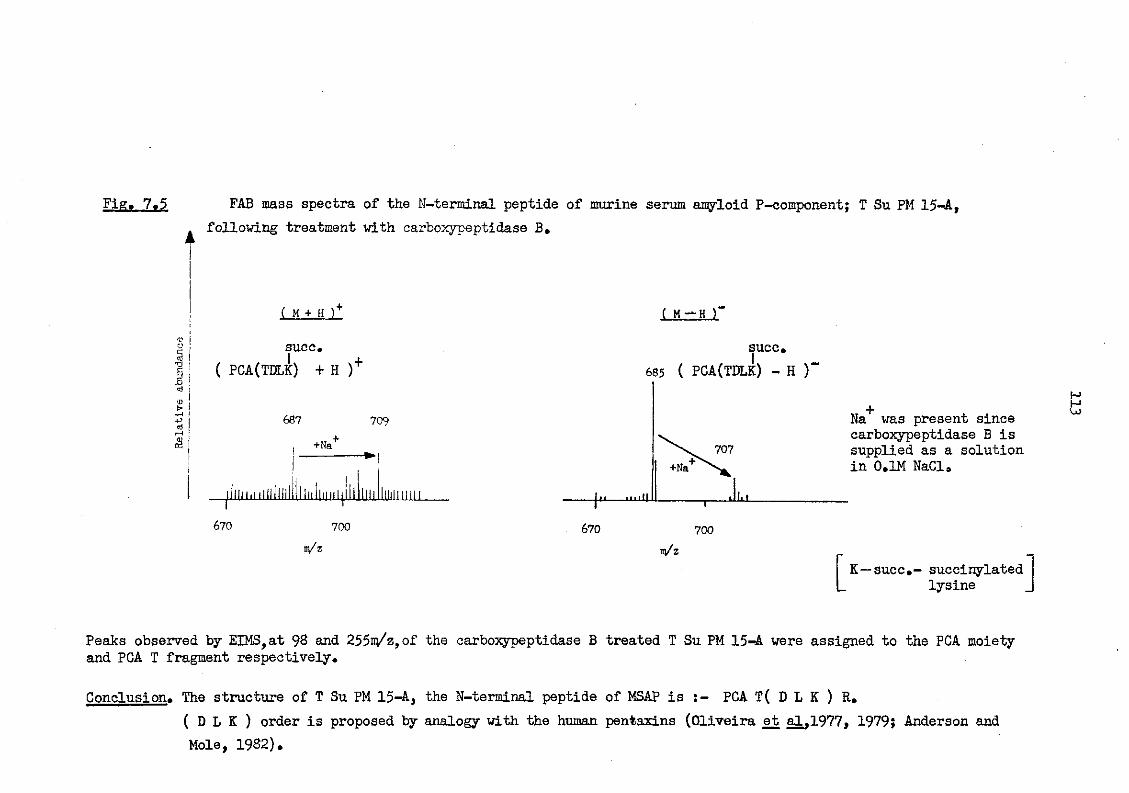
Fig. 7.5 FAB mass spectra of the N-terminal peptide of murine serum amyloid P-component; T Su PM 15-A, A following treatment with carboxypeptidase B.
( M + H )+ ( M-H )'
3 V ! a) | OJ t> I —I j n5 <§!
succ. ( PCA(TDLK) + H ) +
687 709
+Na+
jliiiiiiiiiiinillliiiiliiiiiijililiiiiliiiiiiiiiii 670 700
m/z
670
SUCC. 685 ( PCA(TDLK) - H )'
^ v . 707 x S . +Na
Lu— .inill Jl.i
700 n/z
Na was present since carboxypeptidase B is supplied as a solution in O.IM NaCl.
K—succ.- succinylated lysine
Peaks observed by EIMS,at 98 and 255n/z,of the carboxypeptidase B treated T Su PM 15-A were assigned to the PCA moiety and PCA T fragment respectively.
Conclusion. The structure of T Su PM 15-A, the N-terminal peptide of MSAP is :- PCA T( D L K ) R. ( D L K ) order is proposed by analogy with the human pentaxins (Oliveira et al,1977, 1979; Anderson and Mole, 1982).
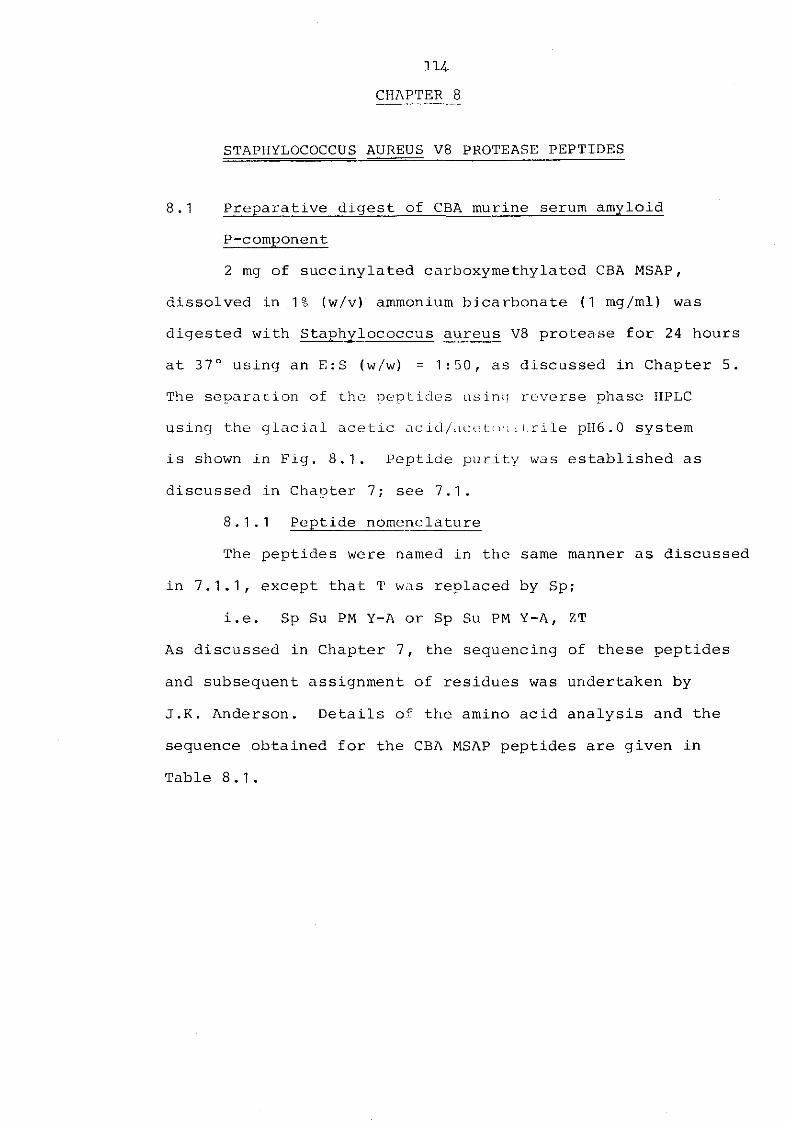
114 CHAPTER 10
STAPHYLOCOCCUS AUREUS V8 PROTEASE PEPTIDES
8.1 Preparative digest of CBA murine serum amyloid
P-component
2 mg of succinylated carboxymethylated CBA MSAP,
dissolved in 1 % (w/v) ammonium bicarbonate (1 mg/ml) was
digested with Staphylococcus aureus V8 protease for 24 hours
at 37° using an E:S (w/w) = 1:50, as discussed in Chapter 5.
The separation of the peptides using reverse phase HPLC
using the glacial acetic acid/acetonitrile pH6.0 system
is shown in Fig. 8.1. Peptide purity was established as
discussed in Chapter 7; see 7.1.
8.1.1 Peptide nomenclature
The peptides were named in the same manner as discussed
in 7.1.1, except that T was replaced by Sp;
i.e. Sp Su PM Y-A or Sp Su PM Y-A, ZT
As discussed in Chapter 7, the sequencing of these peptides
and subsequent assignment of residues was undertaken by
J.K. Anderson. Details of the amino acid analysis and the
sequence obtained for the CBA MSAP peptides are given in
Table 8.1.
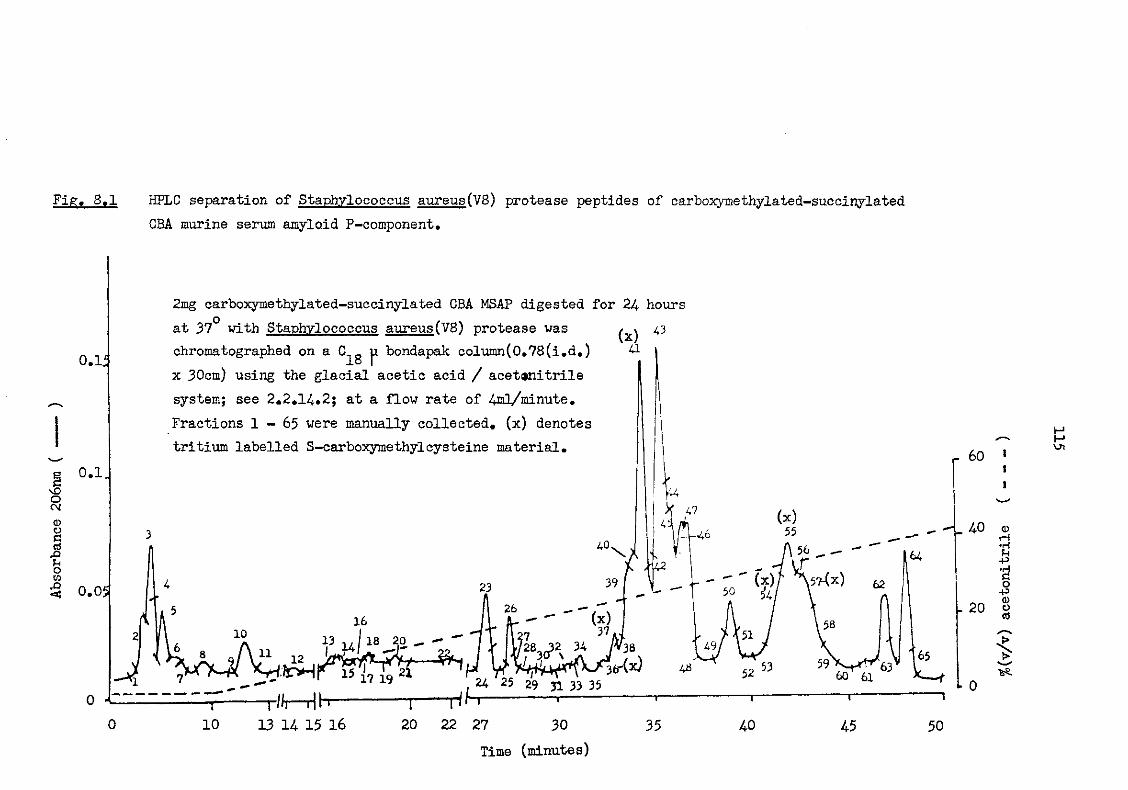
Fig. 8. ,1 HPLC separation of Staphylococcus aureus(V8) protease peptides of carboxymethylated-succinylated CBA murine serum amyloid P-component.
O.li
0.1,
0.0$
2mg carboxymethylated-succinylated CBA MSAP digested for 24 hours .o at 37 with Staphylococcus aureus(V8) protease was
chromatographed on a C^g ji bondapak column(0.78(i.d.) x 30cm) using the glacial acetic acid / acetanitrile system; see 2.2.14.2; at a flow rate of 4ml/minute. Fractions 1 - 6 5 were manually collected, (x) denotes tritium labelled S-carboxymethylcysteine material.
-43
i 5 \ 1 0
16
— Z I f . p/fj—pjh 1 f T
10 T 13 14 15 16
_ 60
- 40
- 20
T 20 22 27 30
Time (minutes) 35 40 45 50
<D H •H U •P O P CD O 05
i
H H UY
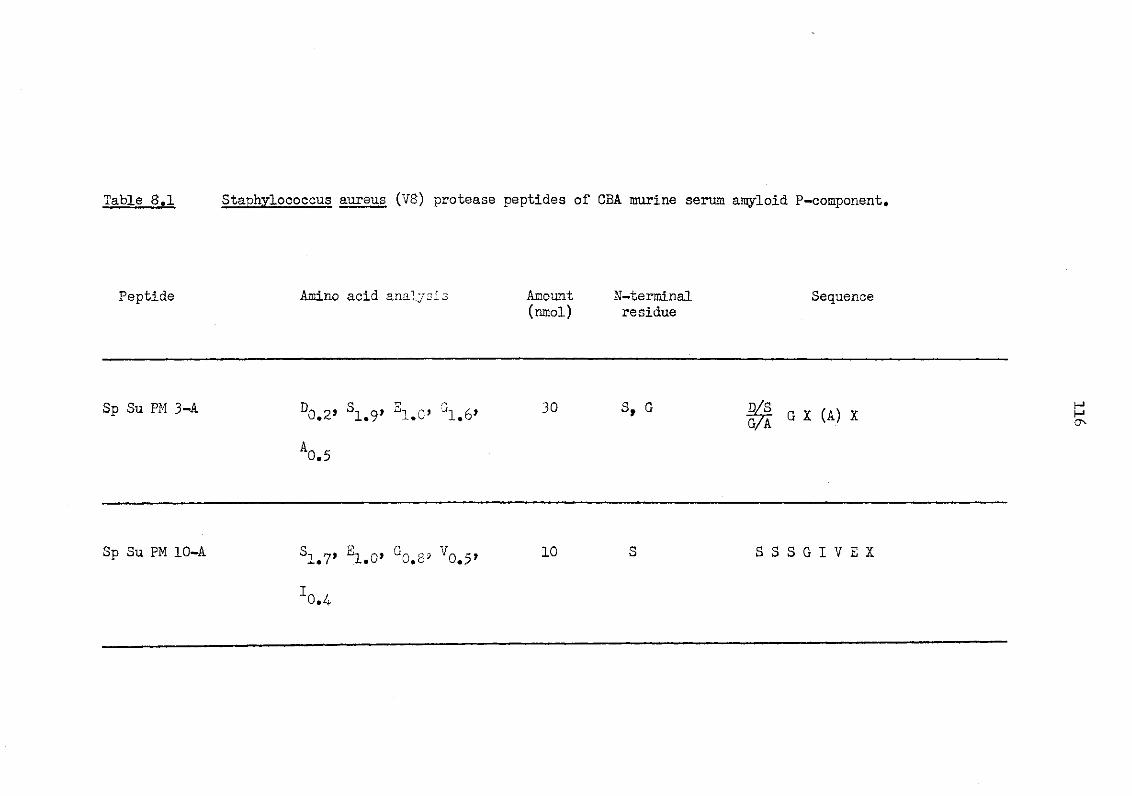
Table 8.1 Staphylococcus aureus (V8) protease peptides of CBA murine serum amyloid P-component.
Peptide Amino acid analysis Amount N-terminal Sequence (nmol) residue
Sp Su PH 3-A D 0 > 2, S 1 > 9, S u o , G 1 > 6, 30 S, G G X (A) X
A0.5
Sp Su PM 10-A G 0 V Q 10 S S S S G I V E X
Z0.A
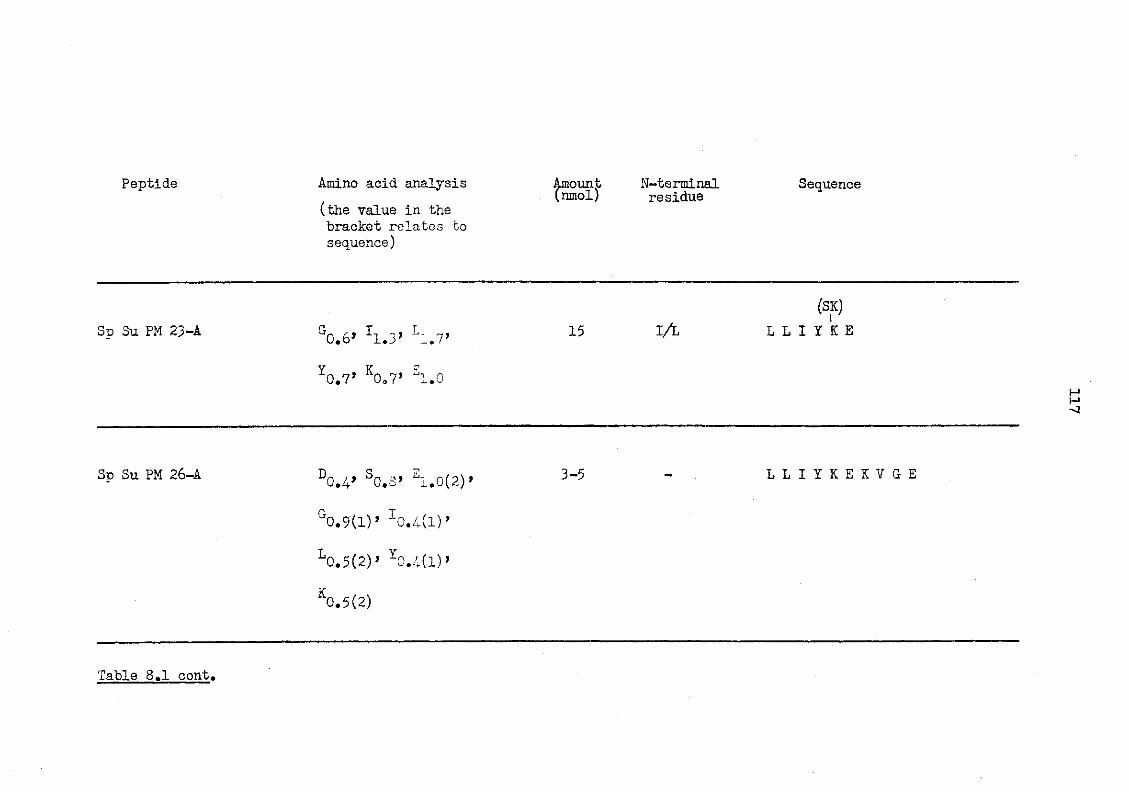
Peptide Amino acid analysis Amount N-terminal Sequence (nmol) residue
(the value in the bracket relates to sequence)
Sp Su PM 23-A G0.6> h.3' L1.7> 15 iA (SK)
L L I Y K E
Y 0 . 7 ' K0o7' h . O
Sp Su PM 26-A Sc^s, 3-5 - L L I Y K E K V G E
G0.9(l)' I 0 . l ( l ) f
L0.5(2)> Y 0 M D '
K0.5(2)
Table 8,1 cont.
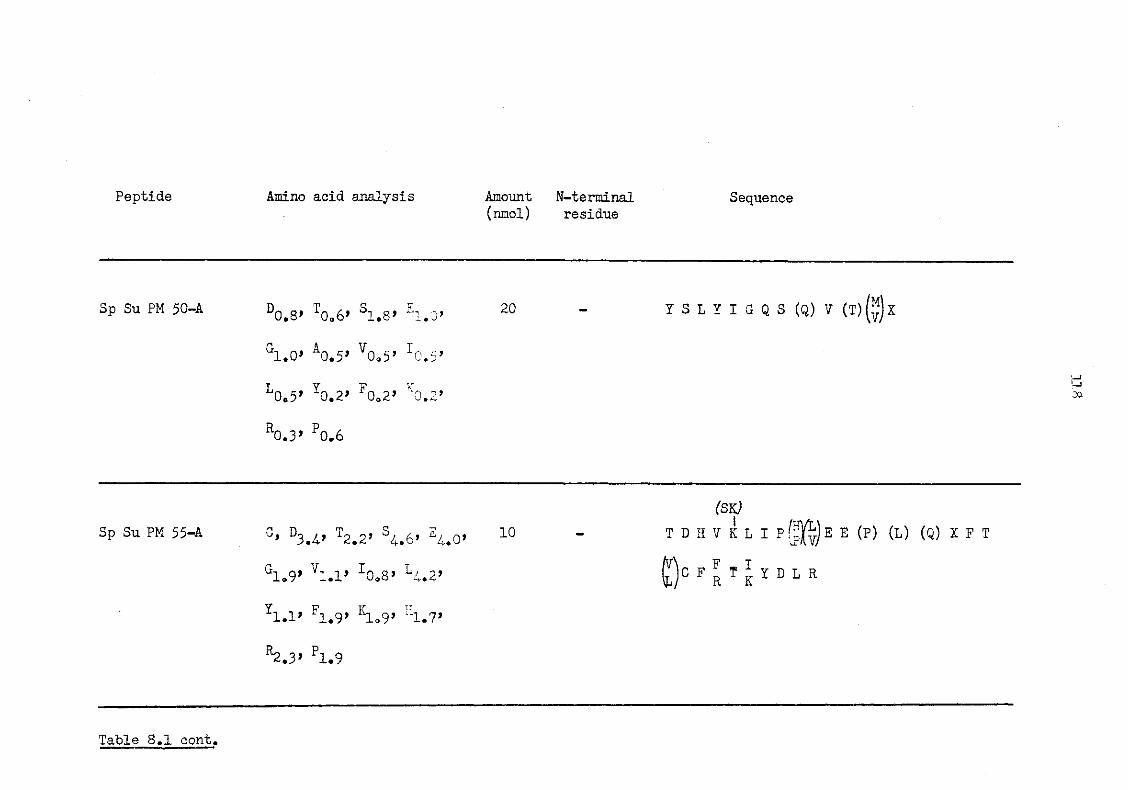
Peptide Amino acid analysis Amount N-terminal Sequence (nmol) residue
Sp Su PM 50-A D q > 8, T Q o 6, S^g, E u q , 20 - Y S L Y I G Q S (Q) V (T) X
G 1 . 0 > k 0 . 5 ' YOo59 I 0 . 5 ,
L0o5' Y0.2' F0o2'
P0.3' P0.6
(SK)
Sp Su PM 55-A C, T 2 w 2, 10 - T D H V K L I p( J)$E E (P) (L) (Q) X F T
G1.9> Vl.l» ^ o S ' L/.2> E ) C F F Y P Y D L R
Yl.l> F1.9' ICLa9' ri1.7>
P1.9
Table 8.1 cont.
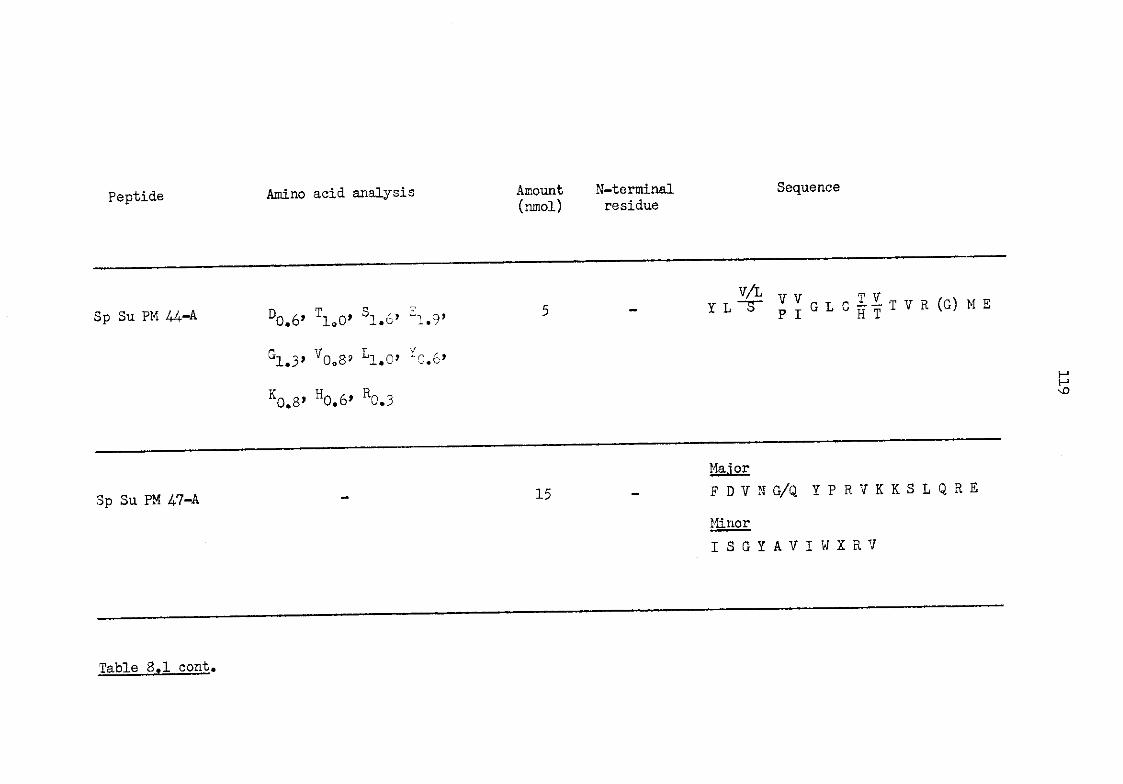
Peptide Amino acid analysis Amount N-terminal Sequence (nmol) residue
Sp Su PM 44-A D0.6> T1o0> S1.6' E1.9> I L T J J G L G | | T V R ( G ) M E
G1.3> V0oB7 L1.0> f0.6> K 0.8' H0.6> R0.3
H H sO
Sp Su PM 47-A 15
Major
F D V N G / Q Y P R V K K S L Q R E
Minor I S G Y A V I W X R V
Table 8.1 cont.
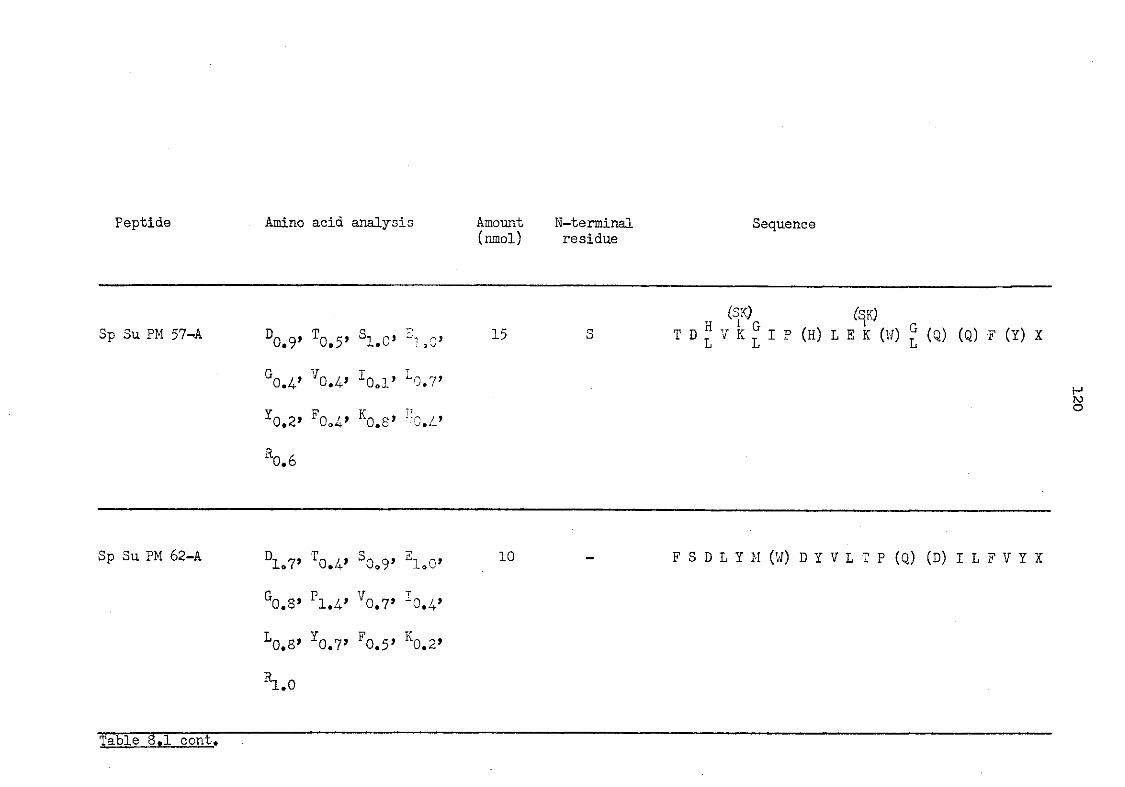
Peptide Amino acid analysis Amount N-te rminal (nmol) residue
Sequence
(Sp (SK) Sp Su PM 57-A D q # 9, Tq^5, S 1 # q, S ^ , 15 S T D R V K G I P (H) L E K (W) G (Q) (Q) F (l) X
V0.4' W E0.7' Y0.2> F0o4' K0.8> R0.6
Sp Su PM 62-A D ^ , Sg^, 10 - F S D L I M (W) D I V L T P (Q) (D) I L F V Y X
G0.8> P1.V 0.7*
L0.8> Y0.7> F0.5j K0.2'
h.O
Table 8.1 cont.
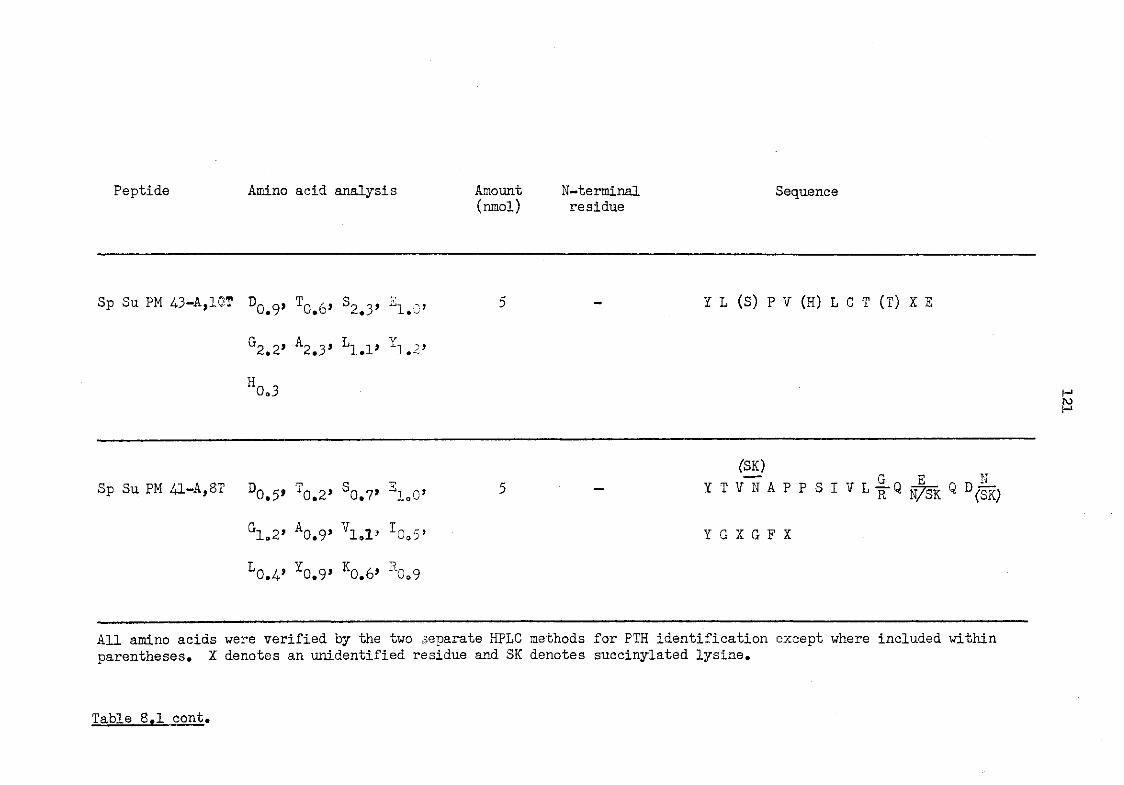
Peptide Amino acid analysis Amount N-terminal (nmol) residue
Sequence
Sp Su PM 43-A,Id? Dq^9, Tq^6, E^Q, 5 - Y L (S) P V (H) L C T (T) X E
G2.2> A2.35 Ll.l» Y1.2»
Sp Su PM 41-A,8T D 0 # 5, T q # 2, S 0 # ?, E ^ ,
Gl 02' A0.9» Vl.l> 10o5>
L0.4? Y0.9> K0.6> R0o9
CSK) Y T V N A P P S I V L | Q ^ K Q D ( | }
Y G X G F X
All amino acids were verified by the two separate HPLC methods for PTH identification except where included within parentheses. X denotes an unidentified residue and SK denotes succinylated lysine.
Table 8.1 cont.
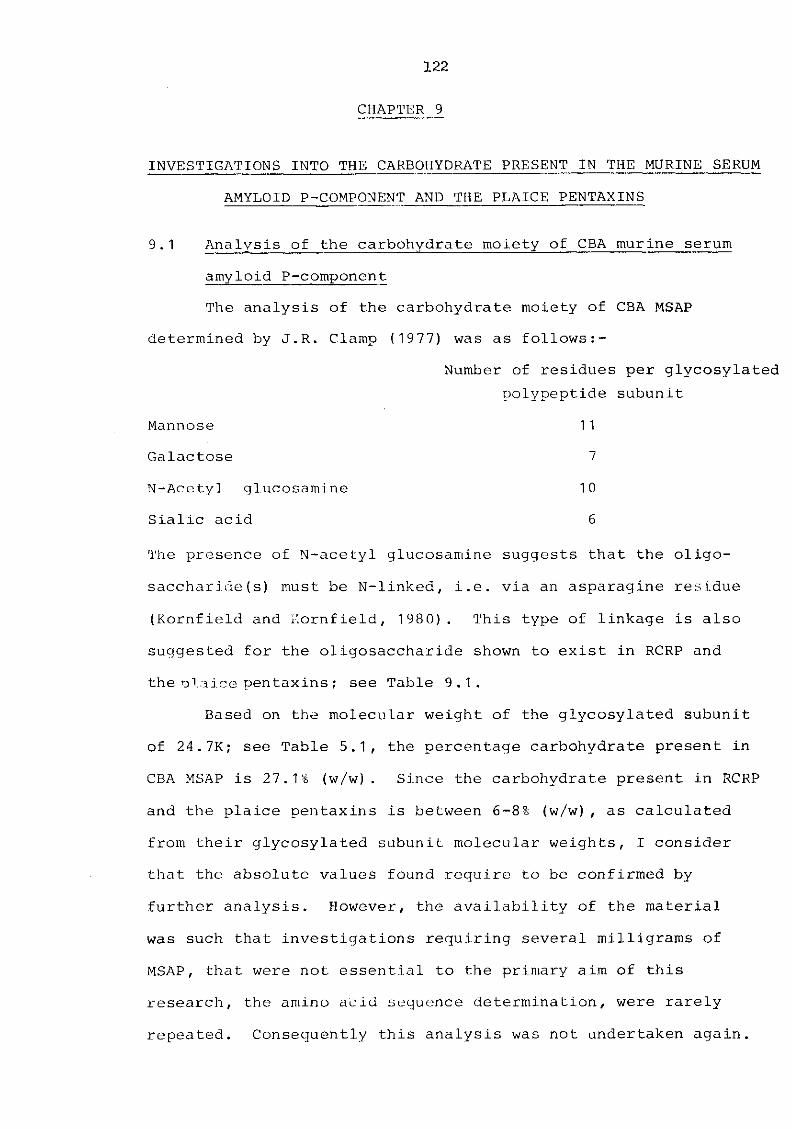
122
CHAPTER 10
INVESTIGATIONS INTO THE CARBOHYDRATE PRESENT IN THE MURINE SERUM
AMYLOID P-COMPONENT AND THE PLAICE PENTAXINS
9.1 Analysis of the carbohydrate moiety of CBA murine serum
amyloid P-component
The analysis of the carbohydrate moiety of CBA MSAP
determined by J.R. Clamp (1977) was as follows:-
Number of residues per glycosylated
polypeptide subunit
Mannose 1 1
Galactose 7
N-Acetyl glucosamine 10
Sialic acid 6
The presence of N-acetyl glucosamine suggests that the oligo-
saccharide ( s) must be N-linked, i.e. via an asparagine residue
(Kornfield and Kornfield, 1980). This type of linkage is also
suggested for the oligosaccharide shown to exist in RCRP and
the ol.aice pentaxins; see Table 9.1.
Based on the molecular weight of the glycosylated subunit
of 24.7K; see Table 5.1, the percentage carbohydrate present in
CBA MSAP is 27.1% (w/w). Since the carbohydrate present in RCRP
and the plaice pentaxins is between 6-8% (w/w), as calculated
from their glycosylated subunit molecular weights, I consider
that the absolute values found require to be confirmed by
further analysis. However, the availability of the material
was such that investigations requiring several milligrams of
MSAP, that were not essential to the primary aim of this
research, the amino acid sequence determination, were rarely
repeated. Consequently this analysis was not undertaken again.
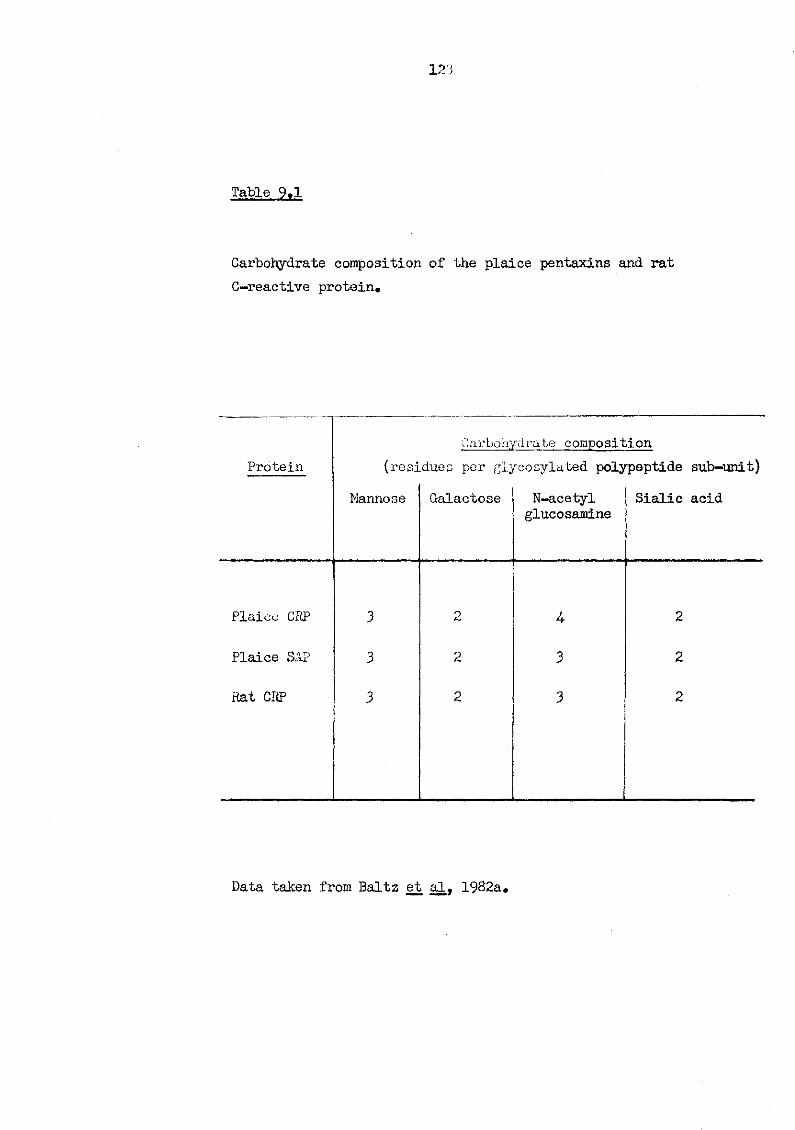
123
Table 9.1
Carbohydrate composition of the plaice pentaxins and rat C-reactive protein.
Carbohydrate composition Protein (residues per glycosylated polypeptide sub-unit)
Mannose Galactose N-acetyl glucosamine
Sialic acid
Plaice CRP 3 2 U 2
Plaice SAP 3 2 3 2
Rat CRP 3 2 3 2
Data taken from Baltz et al, 1982a.
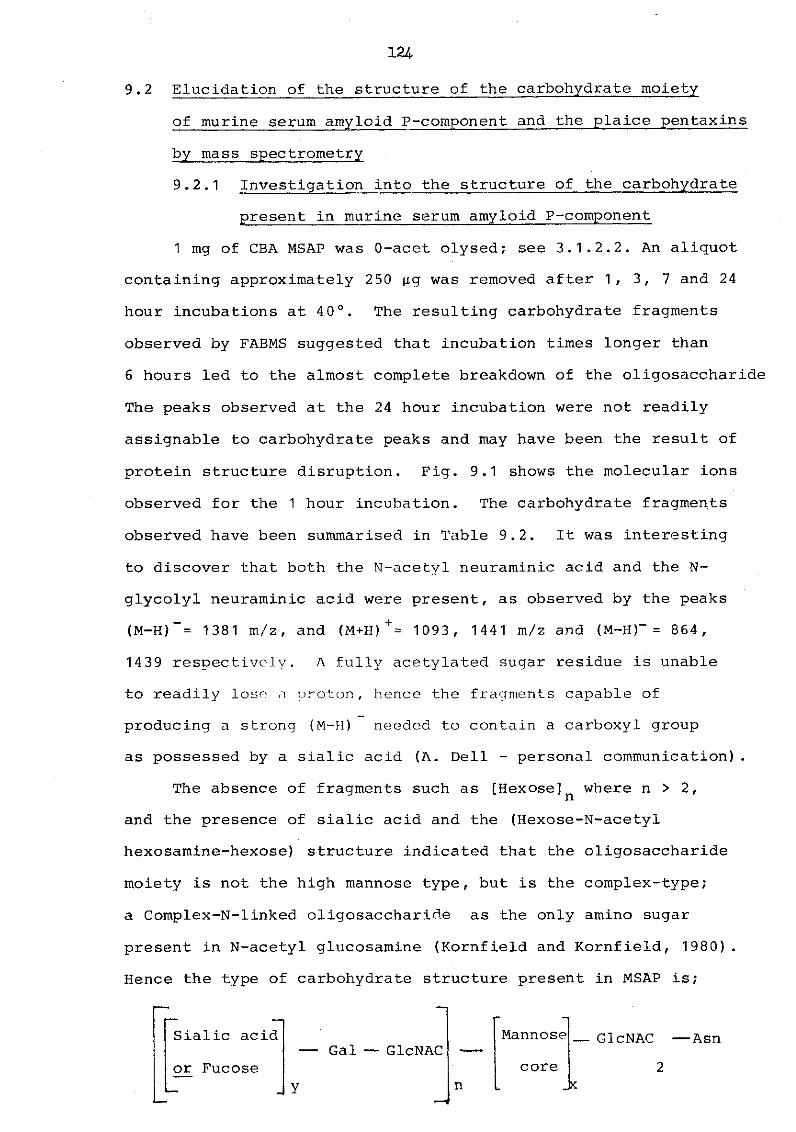
124
9.2 Elucidation of the structure of the carbohydrate moiety
of murine serum amyloid P-component and the plaice pentaxins
by mass spectrometry
9.2.1 Investigation into the structure of the carbohydrate
present in murine serum amyloid P-component
1 mg of CBA MSAP was 0-acet olysed; see 3.1.2.2. An aliquot
containing approximately 250 |ig was removed after 1, 3, 7 and 24
hour incubations at 40°. The resulting carbohydrate fragments
observed by FABMS suggested that incubation times longer than
6 hours led to the almost complete breakdown of the oligosaccharide
The peaks observed at the 24 hour incubation were not readily
assignable to carbohydrate peaks and may have been the result of
protein structure disruption. Fig. 9.1 shows the molecular ions
observed for the 1 hour incubation. The carbohydrate fragments
observed have been summarised in Table 9.2. It was interesting
to discover that both the N-acetyl neuraminic acid and the N-
glycolyl neuraminic acid were present, as observed by the peaks
(M-H)~= 1381 m/z, and (M+H)+= 1093 , 1441 m/z and (M-H)~ = 864 , 1439 respectively. A fully acetylated sugar residue is unable
to readily lose a proton, hence the fragments capable of
producing a strong (M-H) needed to contain a carboxyl group
as possessed by a sialic acid (A. Dell - personal communication).
The absence of fragments such as [Hexose] n where n > 2,
and the presence of sialic acid and the (Hexose-N-acetyl
hexosamine-hexose) structure indicated that the oligosaccharide
moiety is not the high mannose type, but is the complex-type;
a Complex-N-linked oligosaccharide as the only amino sugar
present in N-acetyl glucosamine (Kornfield and Kornfield, 1980).
Hence the type of carbohydrate structure present in MSAP is;
Sialic acid
or Fucose Gal — GlcNAC
n
Mannose
core
GlcNAC — A s n
2
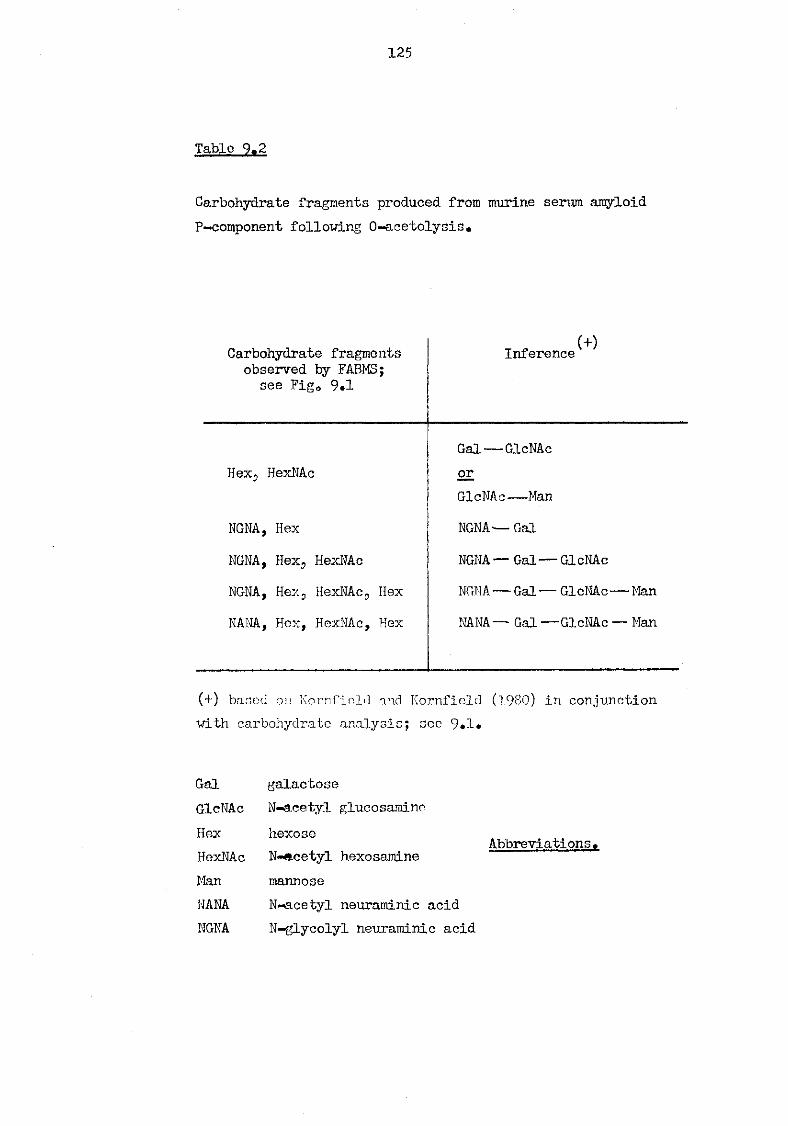
125
Table 9.2
Carbohydrate fragments produced from murine serum amyloid P-coraponent following O-acetolysis.
Carbohydrate fragments observed by FABMS;
see Fig0 9*1
Hex, HexNAc Gal — GlcNAc or GlcNAc—Man
NGNA, Hex NGNA-— Gal
NGNA, Hex, HexNAc NGNA — Gal — GlcNAc
NGNA, Hex, HexNAc, Hex NONA — Gal — GlcNAc— — Man
NANA, Hex, HexNAc, Hex NANA — Gal — •GlcNAc -- Man
(+) based on Kornficld and Kornfield (1980) in conjunction with carbohydrate analysis; see 9*1•
(+) Inference
Gal galactose GlcNAc N-acetyl glucosamine Hex hexose HexNAc N-nacetyl hexosamine Man mannose NANA N-acetyl neuraminic acid NGNA N-glycolyl neuraminic acid
Abbreviations,
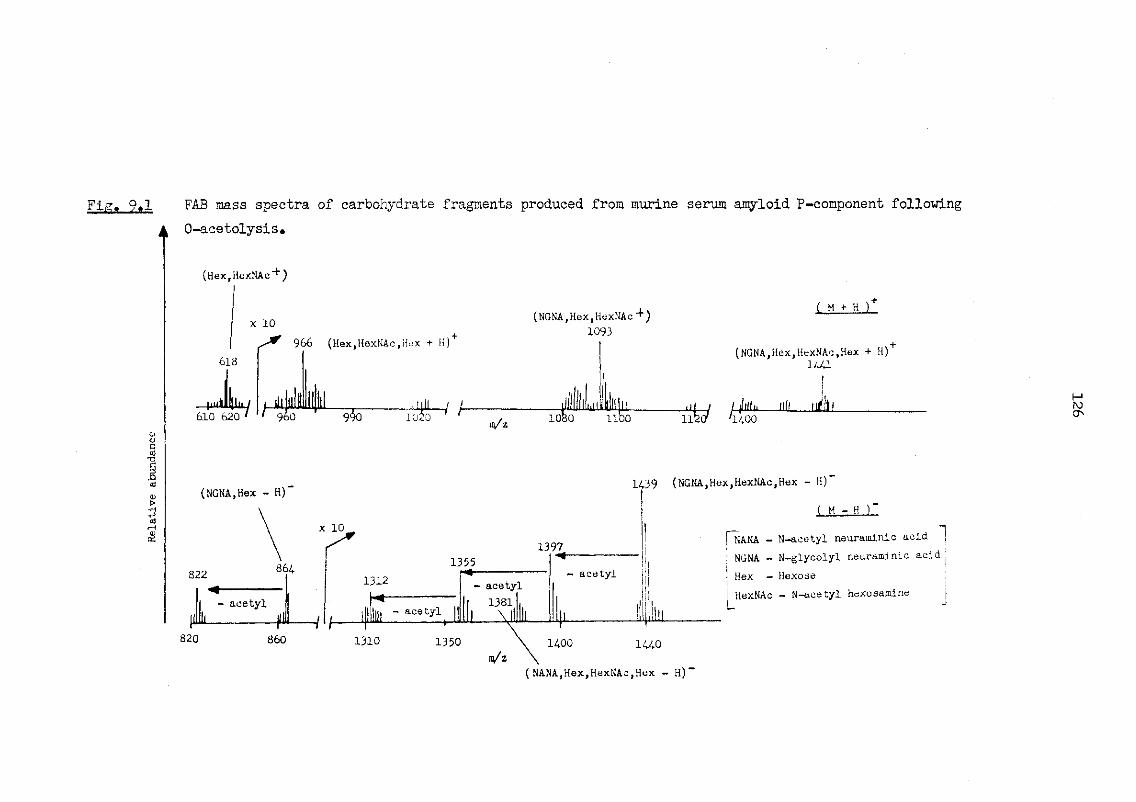
Fig. 9.1 FAB mass spectra of carbohydrate fragments produced from murine serum amyloid P-component following
a O-acetolysis.
(Hex,HexNAc
x 10 966 (Hex,HexNAc,Hex + H) +
618
i.ulil|iii,y n A9H / 610 620
i di pill 111 ' 9 6 0 9 0 -if-/
1020 ny'z
(NGNA,Hex - H)'
x 10
822 864.
- acetyl f t — /
820 860
1 3 1 2
r 1 3 1 0
1355
(NGNA, Hex, HexNAc +) 1093
I
JL2L±JL
; NGNA,Hex,HexNAc,Hex + H)" 1 4 1 1
liiil 1080 1100 lju ill-/ /-M- nil till
1 0 0 1 1 2 G T ' 1 4 - 0 0
- acetyl 1381' .. I 1381 Ii
4UI.ll Mill
U39 (NGNA,Hex,HexNAc,Hex - H)~
( M - H )' pNANA - N-acetyl neuraminic acid i NGNA - N-glycolyl neuraminic acid | Hex - Hexoae i HexNAc - N-acetyl hexosamirie
1
1 3 5 0
n/z 1400 1440
(NANA,Hex,HexNAc,Hex - H)'
H
127
where n > 2, x > 3, y = 0 or 1,
and Gal - galactose,
GlnNAC - N-acetyl glucosamine.
9.2.2 Investigation into the structure of the carbohydrate
present in the plaice pentaxins
0.5 mg of each plaice pentaxin was 0-acetolysed; see 3.1.2.2.
As discussed above, an incubation period of 6 hours or less was
seen to produce the best fragmentation of the carbohydrate of
MSAP, therefore an aliquot containing approximately 250 |ig was
removed after 1 and 6 hour incubations. Unlike the MSAP experiment
these incubation periods did not produce optimum fragmentation as
hoped. The only molecular ion present was the (M-H) = 1381m/z
in the PCRP FABMS spectrum. This ion was seen for MSAP; see Fig.
9.9.2, and indicated that N-acetyl neuraminic acid was present.
Further investigations were not possible due to lack of material.
128 CHAPTER 10
AMINO ACID SEQUENCE HOMOLOGY STUDIES
10.1 The primary structure of the murine serum amyloid
P-component
The data obtained from sequencing cyanogen bromide
fragments, tryptic peptides and Staphylococcus aureus V8
protease peptides, discussed in Chapters 6, 7 and 8
respectively, on examination and by analogy with the primary
structure of I-ICRP (Oliveira al , 1 9 77; 1 979) and the almost
complete sequence of the 1ISAP (Anderson and Mole, 1982) ,
yielded the almost entire primary structure of MSAP. In
order to confirm the sequence determined by automated
sequencing and also to help ascertain the identity of other
residues FABMS was used; see 10.1.1.
10.1.1 Amino acid sequence confirmation using FABMS (Morris si J-L 1981).
1 mg carboxymethylated CBA MSAP was digested with either
TPCK-trypsin in the manner described in 7.1, or Staphylococcus
aureus V8 protease in a similar manner, as described in 8.1,
except that to prepare peptides of sizes which can be detected
by FABMS; <3000 m/z, cleavage at both the aspartyl and glutamyl
bonds was undertaken, which required the reaction to be
performed in 0.05M sodium phosphate pH7.8; Drapeau, 19 77 .
Both reactions were terminated by the addition of 98% formic
acid to 2% (v/v). The sample digested with TPCK-trypsin was
then lyophilised, ready for examination by FABMS. The use of
0.05M sodium phosphate in the Staphylococcus aureus V8 digest
introduced the need to remove these salts before FABMS; otherwise
the only molecular ions detected would be predominately associatec
with this solution. Therefore, the acidified sample was loaded
129
on a Sep-pak cartridge; C^g material - Waters Associates, washed with 10 ml 5% (v/v) glacial acetic acid, to remove the salts, and then sequentially eluted with 10 ml of 20% and then 40% (v/v) propan-2-ol prepared in 5% (v/v) glacial acetic acid. The eluates of these three stages were collected separately and then lyophilised. The digested sample appeared to have eluted in the 40% (v/v) propan-2-ol stage, and so this sample was analysed by FABMS. The Sep-pak cartridge was prepared for use by sequential washes with 10 ml of (i) 5% (v/v) glacial acetic acid, (ii) 5% (v/v) glacial acetic acid/40% (v/v) propan-2-ol and then (iii) as in (i). The 40% (v/v) propan-2-ol stage was included in order to remove material present in the cartridge that might have eluted with the sample. (H.R.Morris, G.W.Taylor and M.Panico, personal'communication).
Approximately one third of the sample digested with TPCK-trypsin was analysed using FABMS. Fig. 10.1 shows the results obtained. The remaining sample was digested with DFP-carboxypeptidase B for 2 hours, and then analysed by FABMS. The results obtained are shown in Fig. 10.2.
Analysis of approximately one third of the sample digested with Staphy1ococcus aureus V8 protease by FABMS was disappointing since it showed that salt was still present despite the Sep-pak treatment discussed above.
10.1.2 Comparison of the primary structure of murine serum amyloid P-component and the humans pentaxins
The amino acid sequence of MSAP presented in Fig. 10.3 has been derived from the peptides shown. The assignment of the majority of the sequence is self-evident.
The proposed existence of a D or N at position 32 is justified by the following arguments.
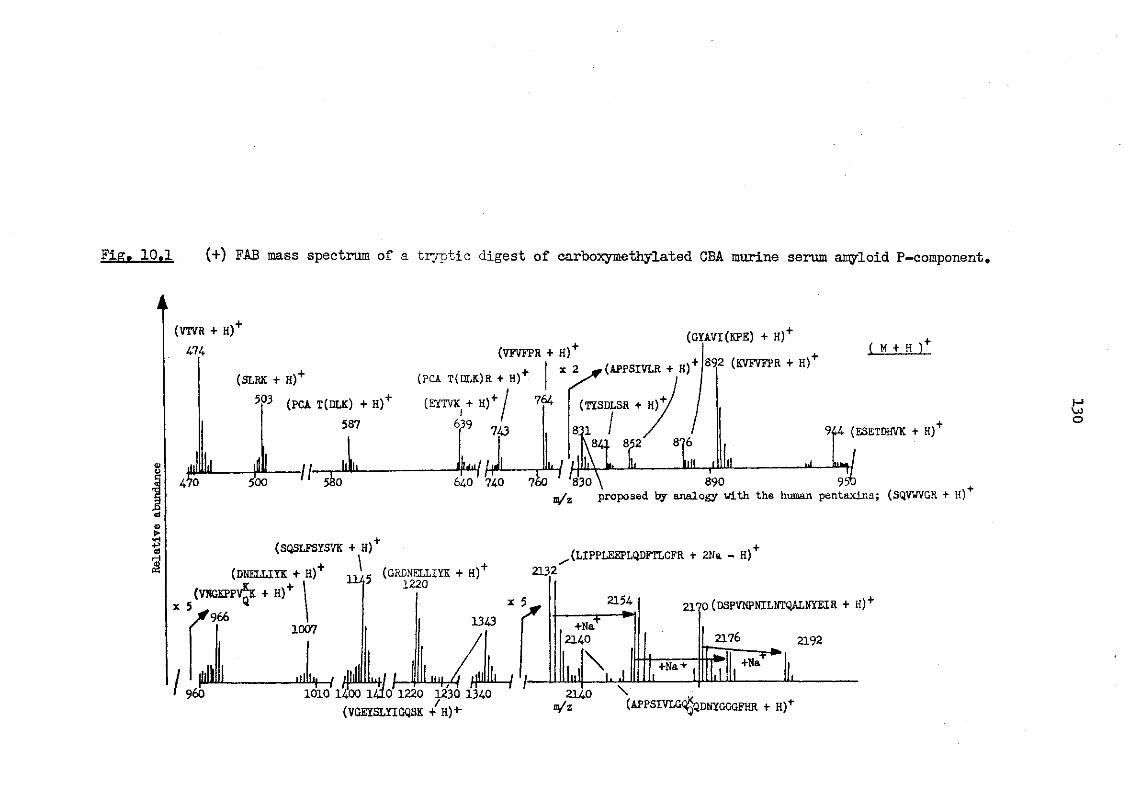
Fig. 10.1 (+) FAB mass spectrum of a tryptic digest of carboxymethylated CBA murine serum amyloid P-component.
(VTVR + H)+ 174.
4*
(SLRK + H)+ (PCA T(DLK)R + H)+ 533 (PCA T(DLK) + H)+ (EYTVK + H j
(GYAVl(KPE) + H)+ (VFVFPR + H)+ I + .( M + H )
2 jm (APPSIVLR + H)+ 892 (K™** + H>
I |4 ) 500
587 639
-II-Ho Ilk
713
H h 610 710 760 u
(TYSDLSR + H)* 831 I 811 852' 876
. . . I , fll I liL 914 (ESETDHVK + H)"
_ul Sui 830 890
xa^z proposed by analogy with the human pentaxina; (SQVWVGR + H) +
© > •H rH &
x 5
(SQSLFSYSVK + H)+ (DNELLIYK + H)+ -.Ac (GRDNELLIYK + H) + noon (VRGKPPY K + H)
V966
. (LIPPLEEPLQDFTLCFR + 2Na - H)" 2132
1007
960
2170 (DSPVNPNILNTQALNYEIR + H)+
2192
1010 1100 1410 1220 1230 1310 (VGEYSLYIGQSK + H)* (APPSIVLG QDNYQGGFHR + H)1"
H vo o
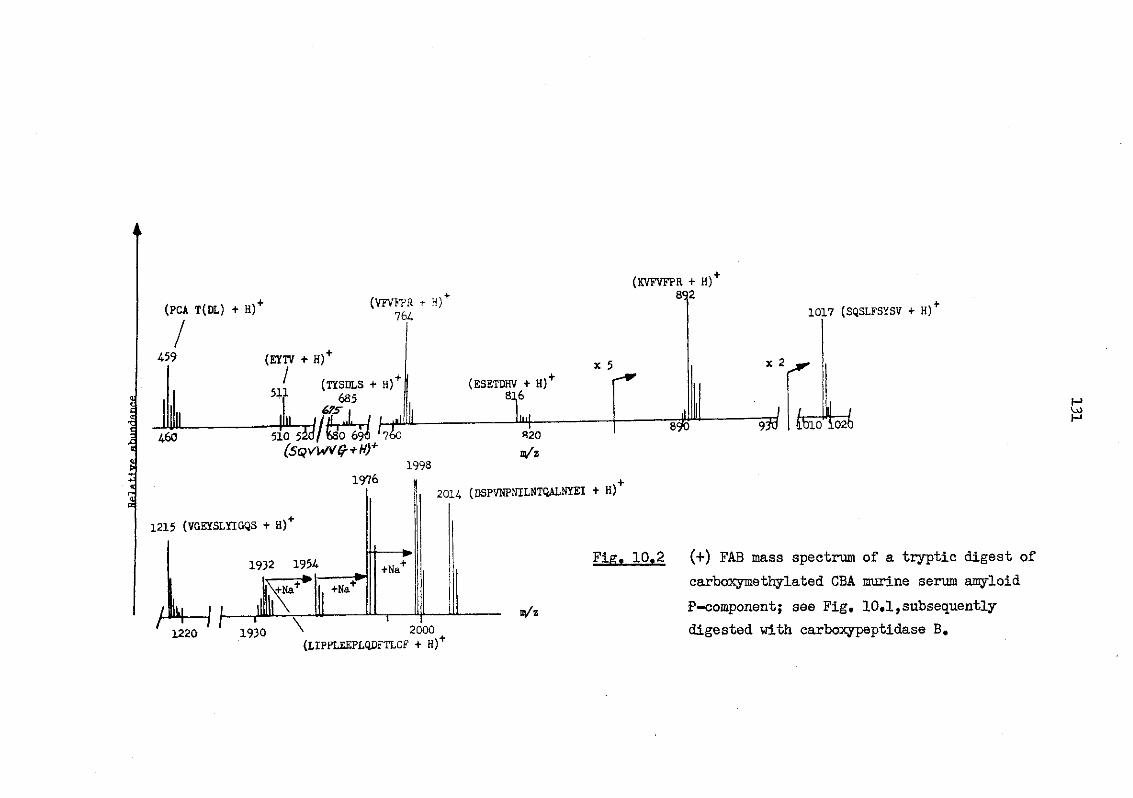
4
(PCA T(DL) + H)+
/
(VFVFPR + H)' 764
(KVFVFPR + H)+ 892
459
T
(EYTV + H)+ J. (TYSDLS + H) + 511 685
_|l J l L ^ / f X / U ^ 460 510 5201 680 690 '760
(ESETDHV + H) + 816
lliil
x 5
510 (sqvwv?+h)+
1 9 9 8
1976
1215 (VGEYSLYIGQS + H)+
P H f
820
n/z
2014 (DSPVNPNILNTQALNYEI + H)*
3 0
1017 (SQSLFSYSV + H)+
x 2
id feo 102&
1220 1930 \ 2000 (LIPPLEEPLQOFTLCF + H)+
n/z
Fig. 10.2 (+) FAB mass spectrum of a tryptic digest of carboxymethylated CBA murine serum amyloid P-component; see Fig. 10.1,subsequently digested with earboxypeptidase B.
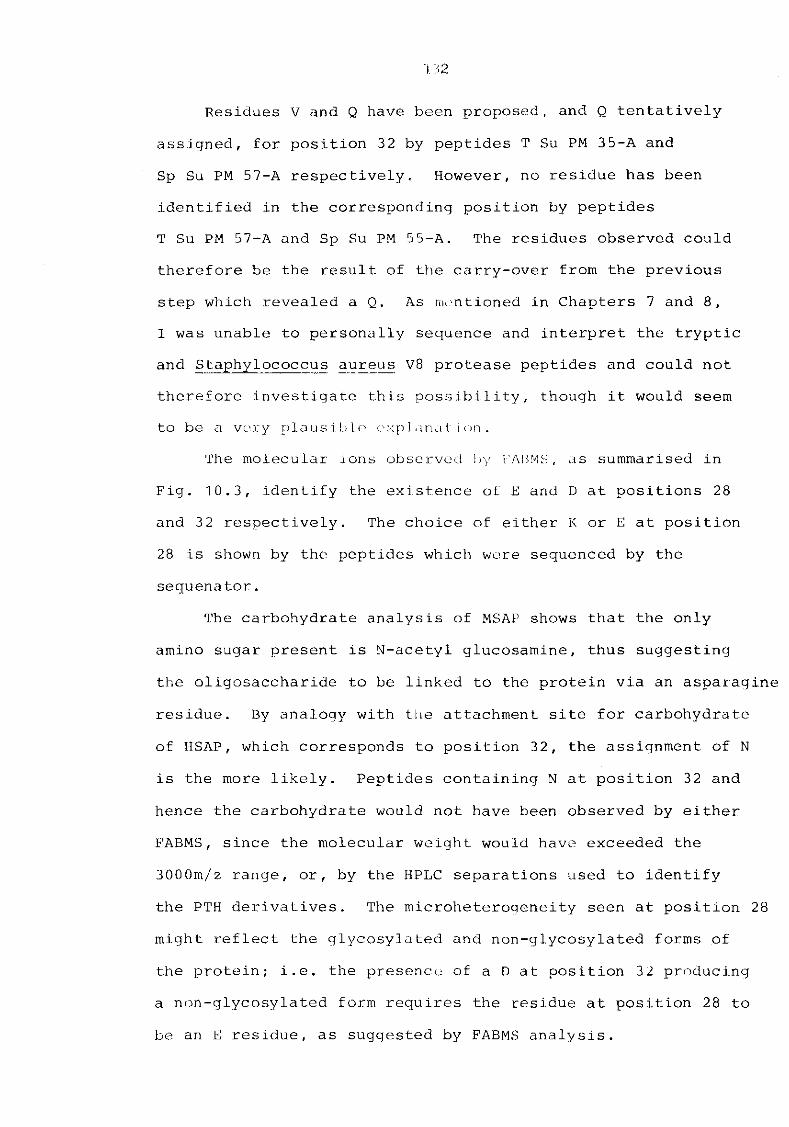
Residues V and Q have been proposed, and Q tentatively
assigned, for position 32 by peptides T Su PM 3 5-A and
Sp Su PM 57-A respectively. However, no residue has been
identified in the corresponding position by peptides
T Su PM 57-A and Sp Su PM 55-A. The residues observed could
therefore be the result of the carry-over from the previous
step which revealed a Q. As mentioned in Chapters 7 and 8,
I was unable to personally sequence and interpret the tryptic
and Staphylococcus aureus V8 protease peptides and could not
therefore investigate this possibility, though it would seem
to be a very plausible explanation.
The molecular ions observed by FABMS, as summarised in
Fig. 10.3, identify the existence of E and D at positions 28
and 3 2 respectively. The choice of either K or E at position
28 is shown by the peptides which were sequenced by the
sequenator.
The carbohydrate analysis of MSAP shows that the only
amino sugar present is N-acetyl glucosamine, thus suggesting
the oligosaccharide to be linked to the protein via an asparagine
residue. By analogy with the attachment site for carbohydrate
of HSAP, which corresponds to position 32, the assignment of N
is the more likely. Peptides containing N at position 32 and
hence the carbohydrate would not have been observed by either
FABMS, since the molecular weight would have exceeded the
3000m/z range, or, by the HPLC separations used to identify
the PTH derivatives. The microheterogeneity seen at position 28
might reflect the glycosylated and non-glycosylated forms of
the protein; i.e. the presence of a D at position 32 producing
a non-glycosylated form requires the residue at position 28 to
be an E residue, as suggested by FABMS analysis.
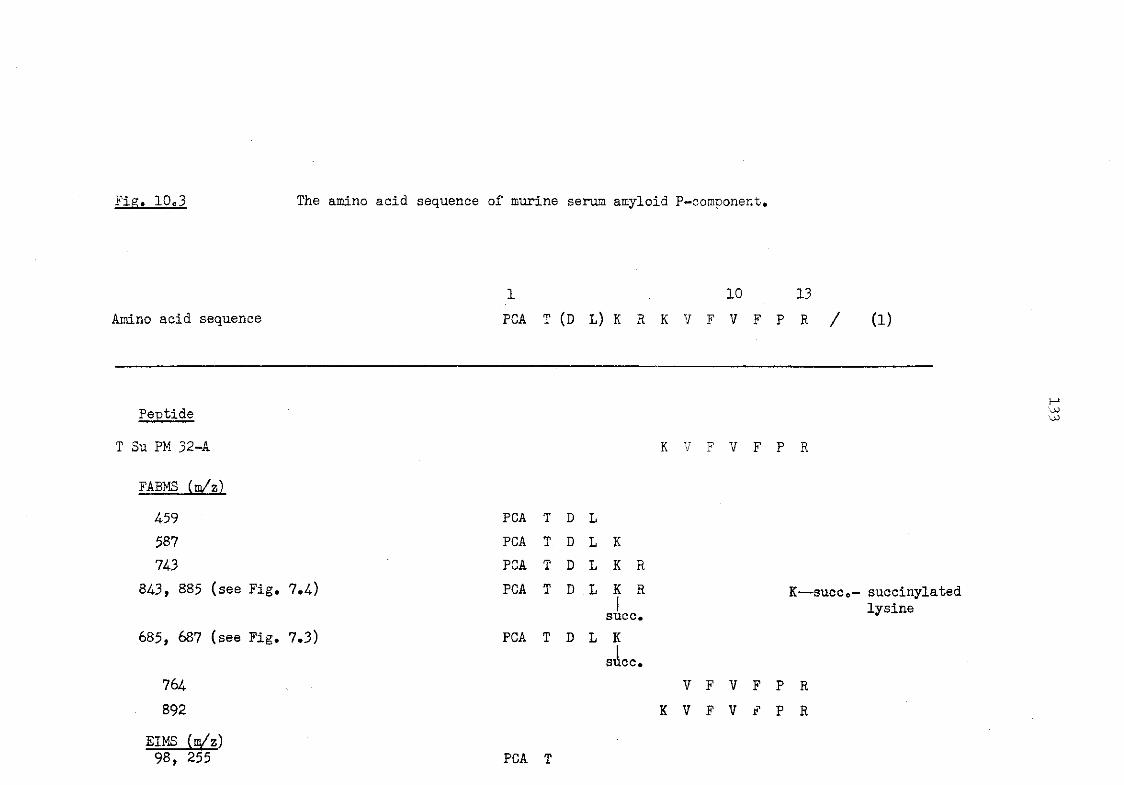
Fig. 10o3 The amino acid sequence of murine serum amyloid P-component.
1 10 13 Amino acid sequence PCA T (D L) K R K V F V F P R / (l)
Peptide
T Su PM 32-A K V F V F P R
FABMS (m/z)
459 PCA T D L 587 PCA T D L K 743 PCA T D L K :
84-3, 885 (see Fig. 7.4) PCA T D L K : 1 succ
685, 687 (see Fig. 7.3) PCA T D L K succ
764 892
EIMS (m/z) 98, 255 PCA T
V K V
V V
K—succo- succinylated lysine
P R P R
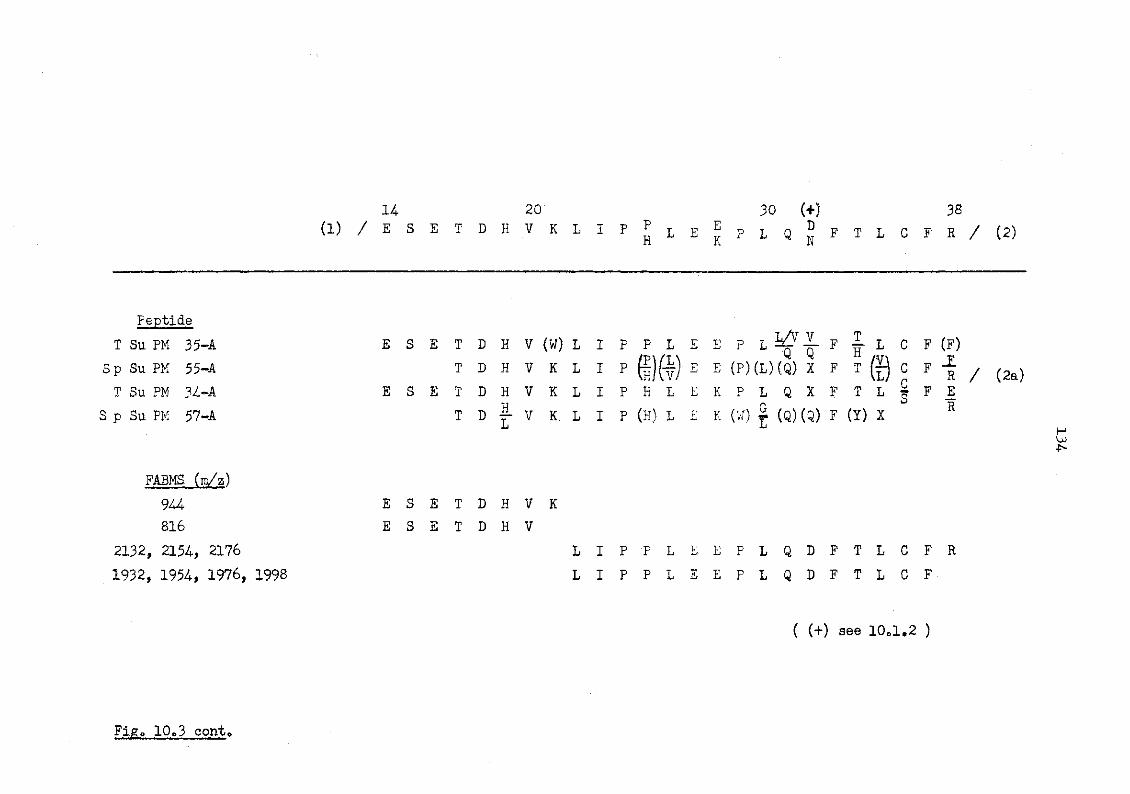
14 20 (L) / E S E T D H V K L
Peptide T Su PM 35-A
S p Su PM 55-A T Su PM 34-A
S p Su PM 57-A
FABMS. (is/z) 944 816
2132, 2154, 2176 1932, 1954, 1976, 1998
Fig. 10e3 conto
E S E T D H V (W) L T D H V K L
E s E T D H V K L T D H
L V K L
E s E T D H V K E s E T D H V
L
30 (+) 38 I p F L E E P L Q ° F T L C F R / ( 2 )
I P P L E E P L ^ — F I P
I P I P H L E K P L Q X F
L L E K (VI) | (Q) (Q) F
£ L C F (F) £ L r> F T ILJ U n
F R T L U
s F E (Y) X
R H
I P P L E E P L Q D F T L C F R I P P L E E . P L Q D F T L C F
( (+) see 10©1.2 )
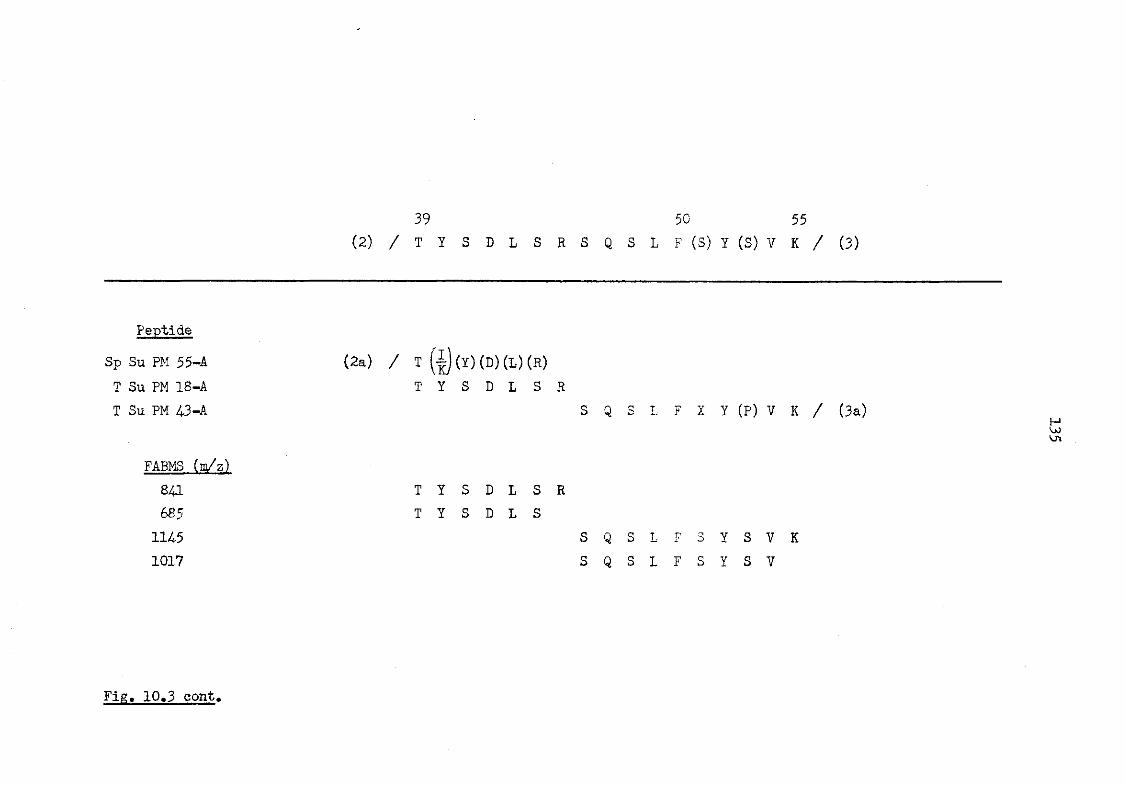
39 (2) / T Y S D L S R
Peptide
Sp Su PM 55-A T Su PM 18-A T Su PM 43-A
FABMS (m/z) 841 685
1145 1017
(2a) / T (|](Y)(D)(L)(R) T Y S D L S R
T Y S D L S R T Y S D L S
Fig. 10e3 conto
50 55 S Q S L F (S) Y (S) V K / (3)
S Q S L F X Y ( P ) V K / (3a) H VjJ
S Q S L F 3 Y S V K S Q S L F S Y S V
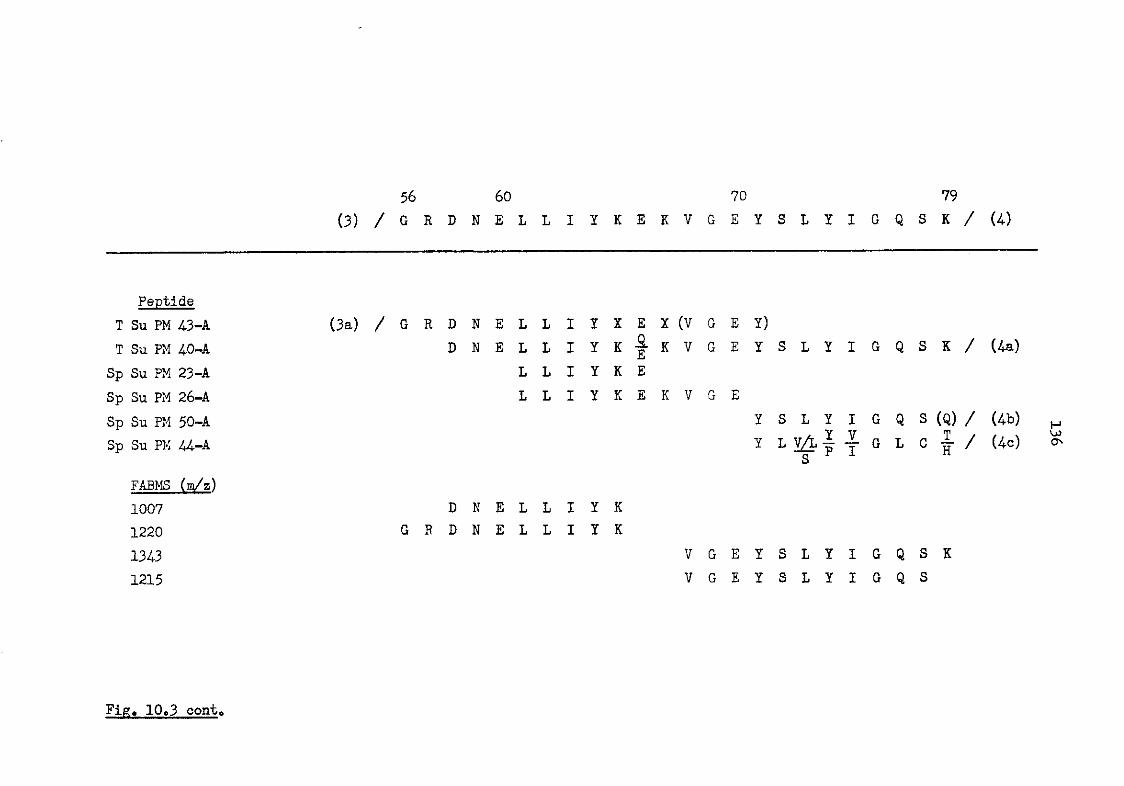
56 60 70 79 ( 3 ) / G R D N E L L I Y K E K V G E Y S L Y I G Q S K / ( 4 )
Peptide T Su PM 43-A (3a) / G R D N E L L I Y X E X ( V G E Y ) T Su PM 40-A D N E L L I Y K | - K V G E Y S L Y I G Q S K / ( 4 a )
Sp Su PM 23-A L L I Y K E Sp Su PM 26-A L L I Y K E K V G E Sp Su PM 50-A Y S L Y I G Q S (Q) / (4b) H
Sp Su PM 44-A I G L C | / (4c) & S
FABMS (m/z) 1007 D N E L L I Y K 1220 G R D N E L L I Y K 1343 V G E Y S L Y I G Q S K 1215 V G E Y S L Y I G Q S
Fig. 10e3 conto
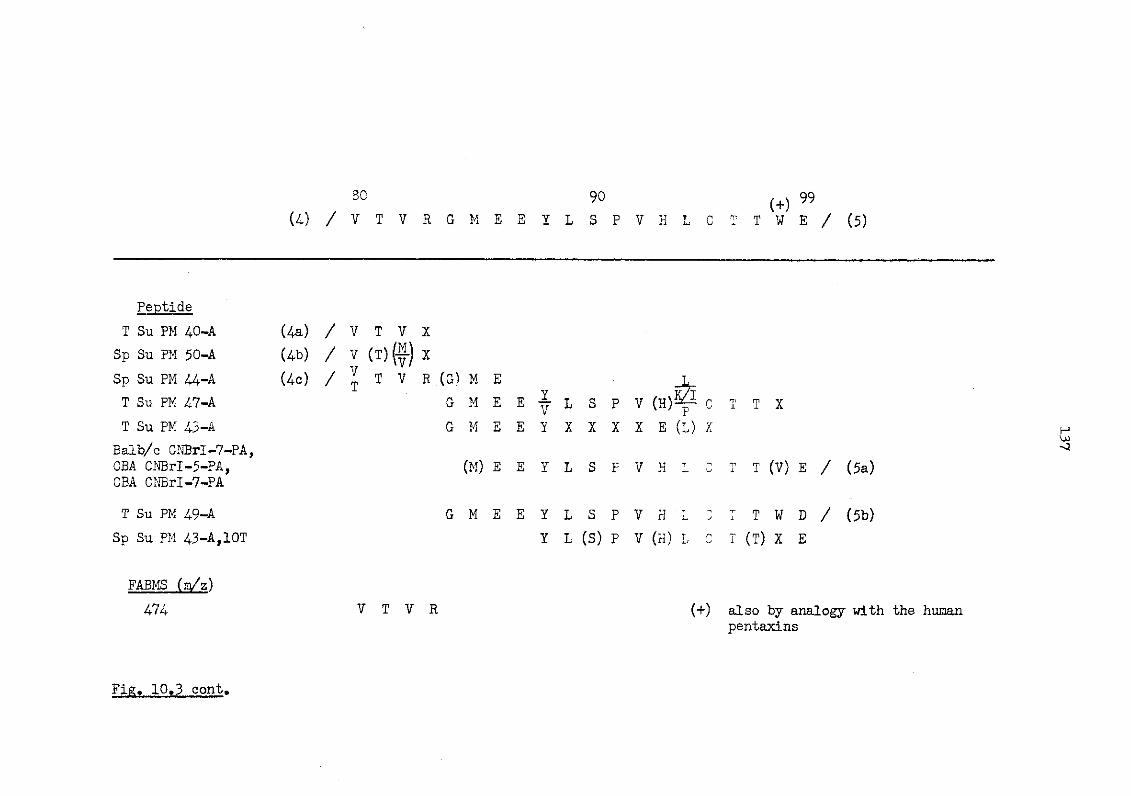
so (4) / V T V R G M E E Y
Peptide T Su PM 40-A
Sp Su PM 50-A Sp Su PM 44-A T Su PM 47-A T Su PM 43-A
Baib/c CNBrI-7-PA, GBA CNBrI-5-PA, CBA CNBrI-7-PA
T Su PM 49-A Sp Su PM 43-A,10T
FABMS (m/z) 474
(4a) / V T V (4b) / V (T)(f) (4c) / I T V
X X R (G) M E
G M E E J G M E E Y
(M) E E Y
G M E E Y Y
V T V R
Fig. 10.3 cont.
90 ( + ) 99 L S P V H L C T T W E / (5)
L S P X X X
L S P V H L C
L S P V H L C L (S) P V (H) L C
V (H) X
P " E (L) X
T T X H -J
T T (V) E / (5a)
T T W D / (5b) T (T) X E
also by analogy with the human pentaxins
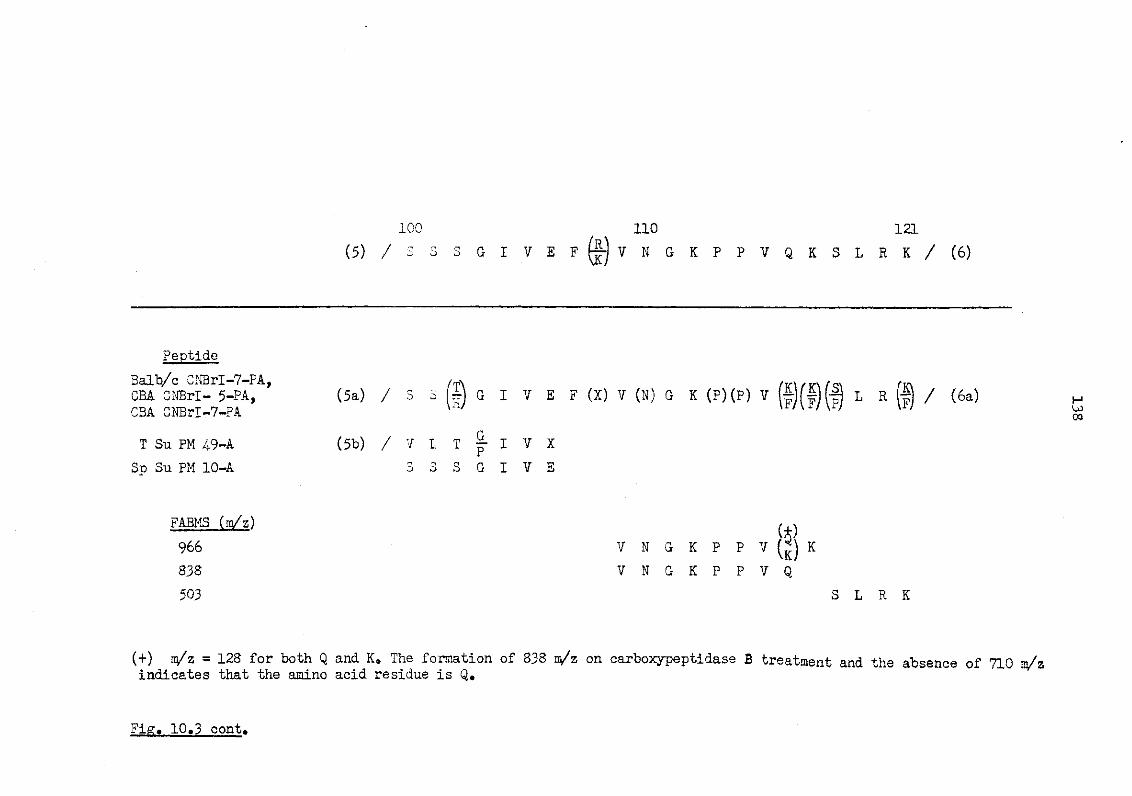
.GO 110 121 (5) / G I V E F r~j V N G K P P V Q K S L R K / (6)
Peptide Balb/c CNBrI-7-PA, GBA CNBrI- 5-PA, (5a) / S 3 [~] G I V E F (X) V (N) G K (P)(P) V f ( | ^ L R | / (6a) CBA CNBrI-7-PA W vr/\r/\r; \r;
T Su PM 49-A (5b) / V L T ^ - I V X Sp Su PM 10-A 3 3 S G I V E
FABMS (n/z) ( }
966 V N G K P P V ( j * ) K 838 V N G K P P V Q 503 S L R K
(+) n/z = 128 for both Q and K0 The formation of 838 n/z on carboxypeptidase B treatment and the absence of 710 m/i indicates that the amino acid residue is Q.
Fig. 10.3 cont.
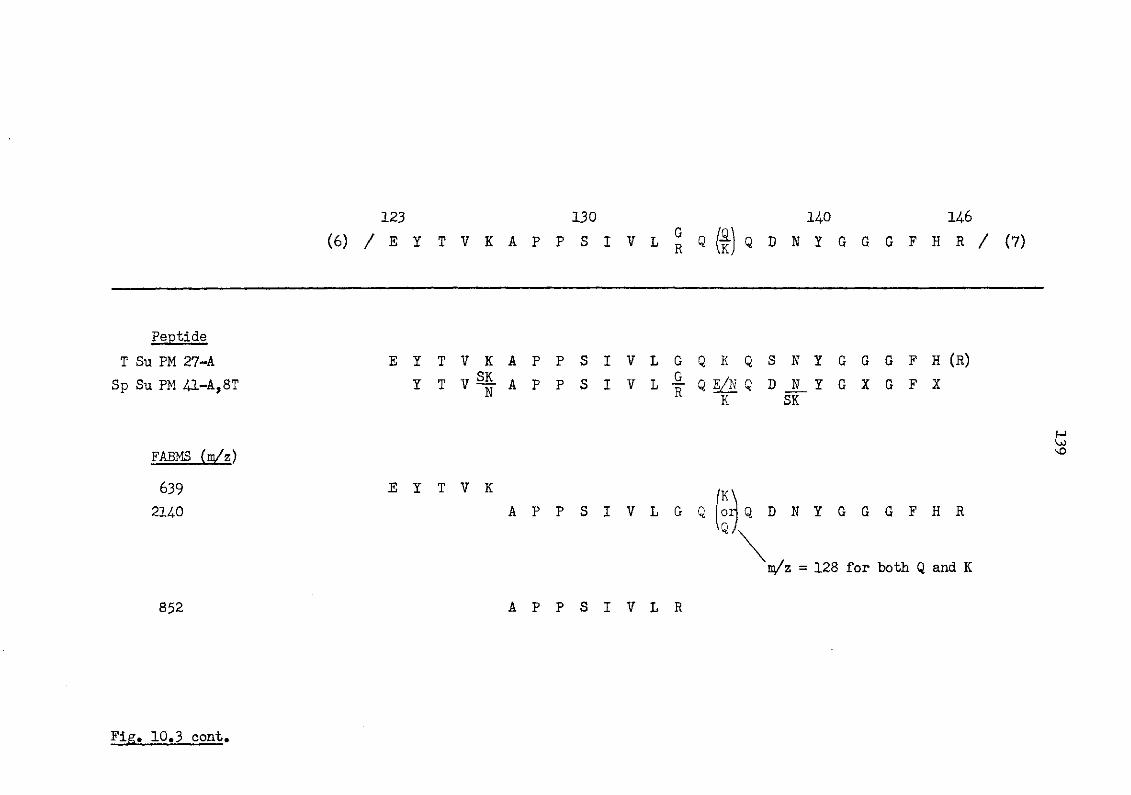
123 (6 ) / E Y T V K
130 A P P S I
140 146 V L I Q Q D N Y G G G F H R / ( 7 )
Peptide T Su PM 27-A E Y T V K A P P S I V L G Q K Q S N Y G G G F H ( R )
Sp Su PM 4 1 - A , 8 T Y T V A P P S I V L - j - Q E/N Q D N Y G X G F X
FABMS (m/z)
639 E Y T V K
2140
K SK
n/z = 128 for both Q and K
852 A P P S I V L R
Fig. 10.3 cont.
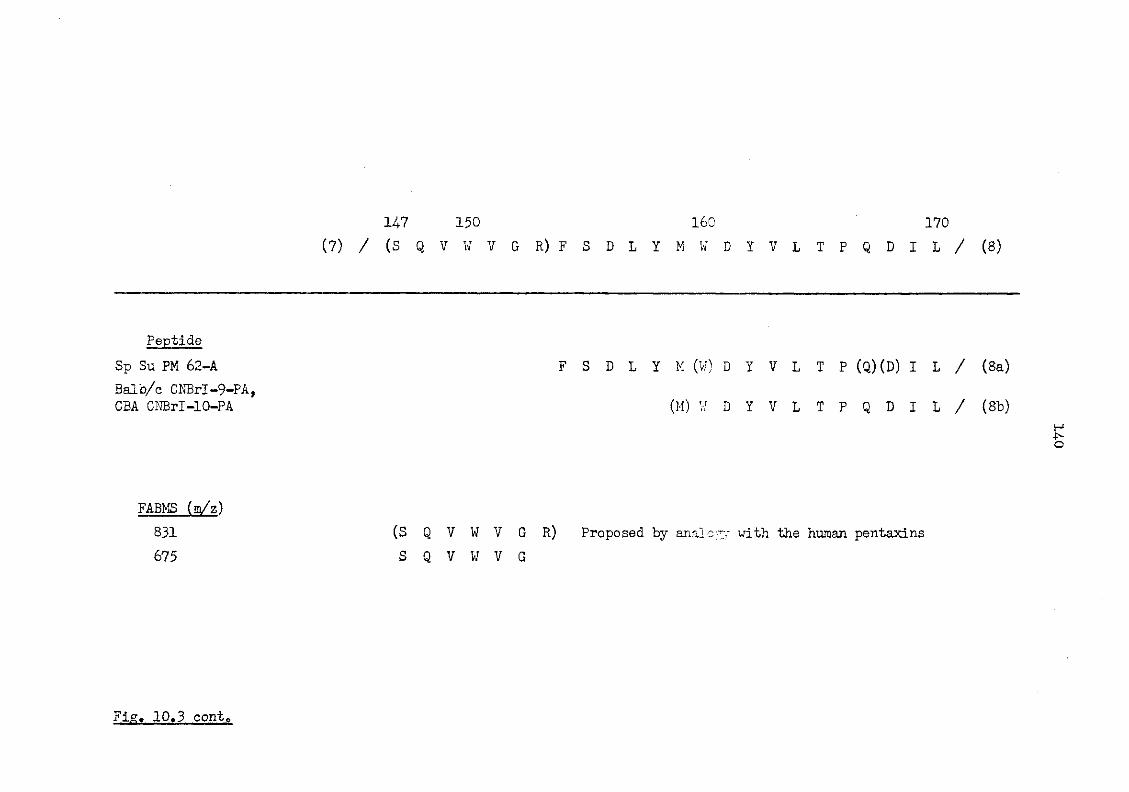
147 150 (7) / (S Q V W V G R) F
Peptide Sp Su PM 62-A Balb/c CNBrI-9-PA, CBA CNBrI-10-PA
FABMS (m/z) 831 (S Q V W V G R) 675 S Q V W V G
Fig. 10.3 cont.
160 170 S D L Y M W D Y V L T P Q D I L / (8)
S D L Y M ( W ) D Y V L T P (Q) (D) I L / (8a)
(M) W D Y V L T P Q D I L / (8b)
Proposed by analogy with the human pentaxins
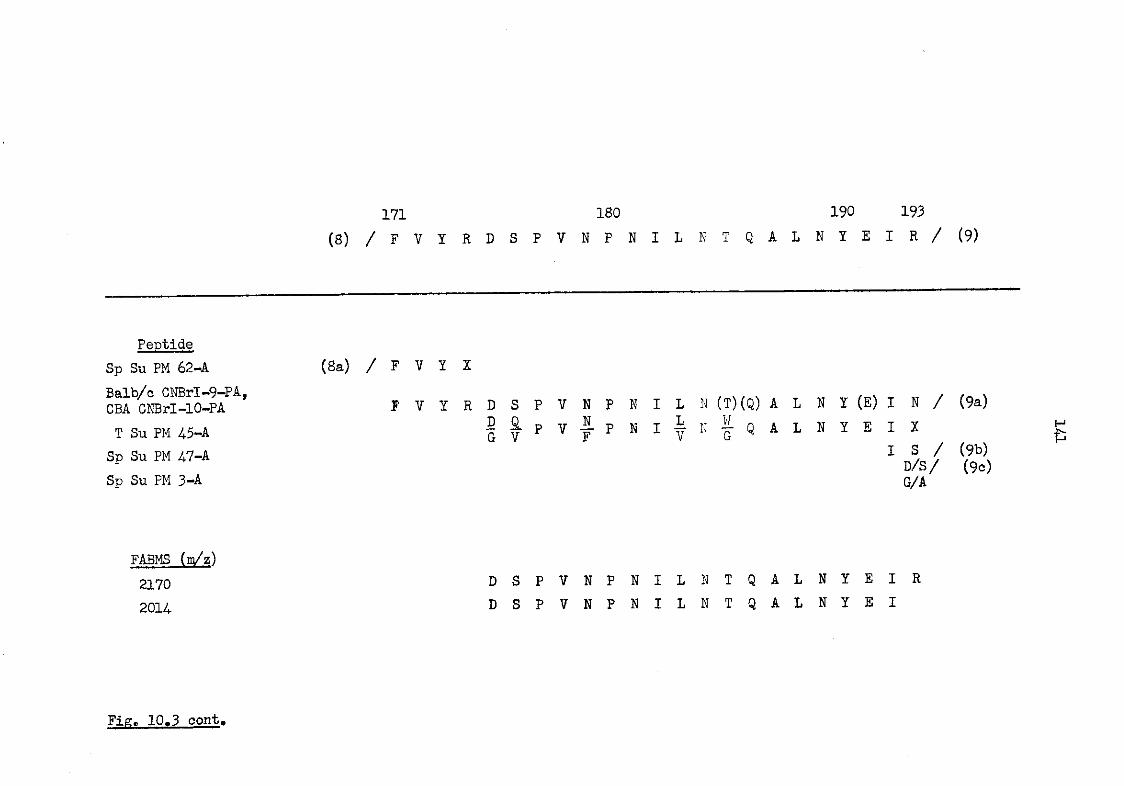
171 180 190 193 (8) / F V Y R D S P V N P N I L N T Q A L N Y E I R / ( 9 )
Peptide Sp Su PM 62-A (8a) / F V Y X Balb/c CNBrI-9-PA, CBA CNBrI-10-PA
FABMS (n/z) 2170 2014
T V Y R D S P V N P N I L N (T)(Q) A L N Y (E) I N / (9a) T Su PM 45-A I f P V J- P N I i N f Q A L N Y E I X
Sp Su PM 47-A 1
Sp Su PM 3-A G/A
D S P V N P N I L N T Q A L N Y E I R D S P V N P N I L N T Q A L N Y E I
Fig. 10.3 cont.
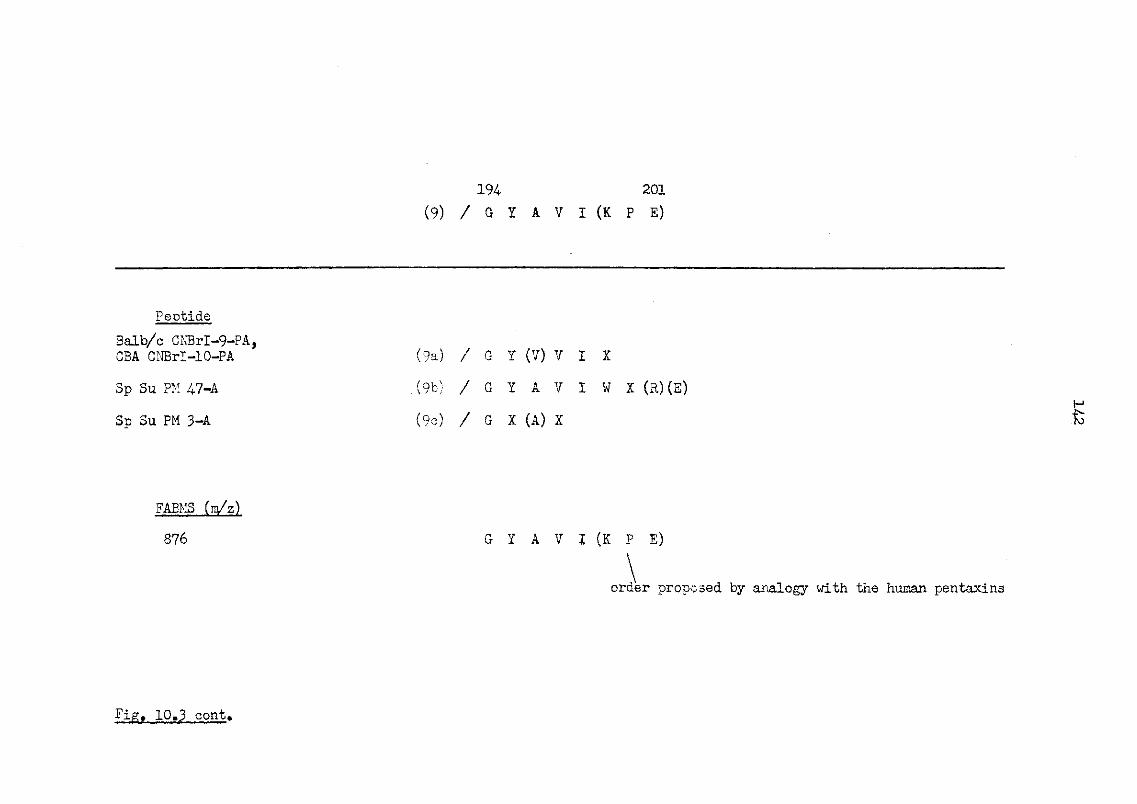
Peptide Balb/c CNBrI-9-PA, CBA CNBrI-10-PA
Sp Su PM 47-A
Sp Su PM 3-A
FABMS (m/z)
876
194 201 (9) / G Y A V I (K P E)
(9a) / G Y (V) V I X
(9b) / G Y A V I W X (R)(E)
(9c) / G X (A) X
G Y A V I (K P E)
order proposed by analogy with the human pentaxins
Fig. 10.3 cont.
143
10.1.3 The primary structure of murine serum amyloid
P-component
The ability to assign all the molecular ions observed by
FABMS, see 10.1.1, suggested that the molecule was indeed 201
amino acid residues, as shown in Fig. 10.3. However, since the
carboxypeptidase Y digests performed on MSAP, see 5.1, and the
C-terminal cyanogen bromide fragment, CNBrI-10-PA, see 6.2.2,
failed to work satisfactorily, the C-terminal region was
equivocally assigned.
The amino acid composition of the proposed primary structure
for MSAP is shown in Fig. 10.4. The molecular weight of this
structure is 23. 1K. The molecular weight determined in
Chapter 5 was 24.7K. The difference between these two values
correlates to 6.5% (w/w) based on the glycosylated molecular
weight; a value which is analogous to carbohydrate content
observed for RCRP and the plaice pentaxins, as discussed in
Chapter 9. Assuming the above mentioned hypothesis to be
valid, the structure shown in Fig. 10.5 might reasonably be
assumed to be the complete sequence. Percentage identities
calculated for the comparison of MSAP and the human pentaxins,
shown in Fig. 10.6, have been based on the proposed 201 amino
acid residues.
An outstanding feature, which will be discussed in
Chapter 11, is insertions of 13 and 7 amino acids residues
between positions 69 to 70, and either 72 to 73, or 73 to 74
respectively; the numbers corresponding to the HCRP sequence
(Oliveira et al, 1977; 1979) .
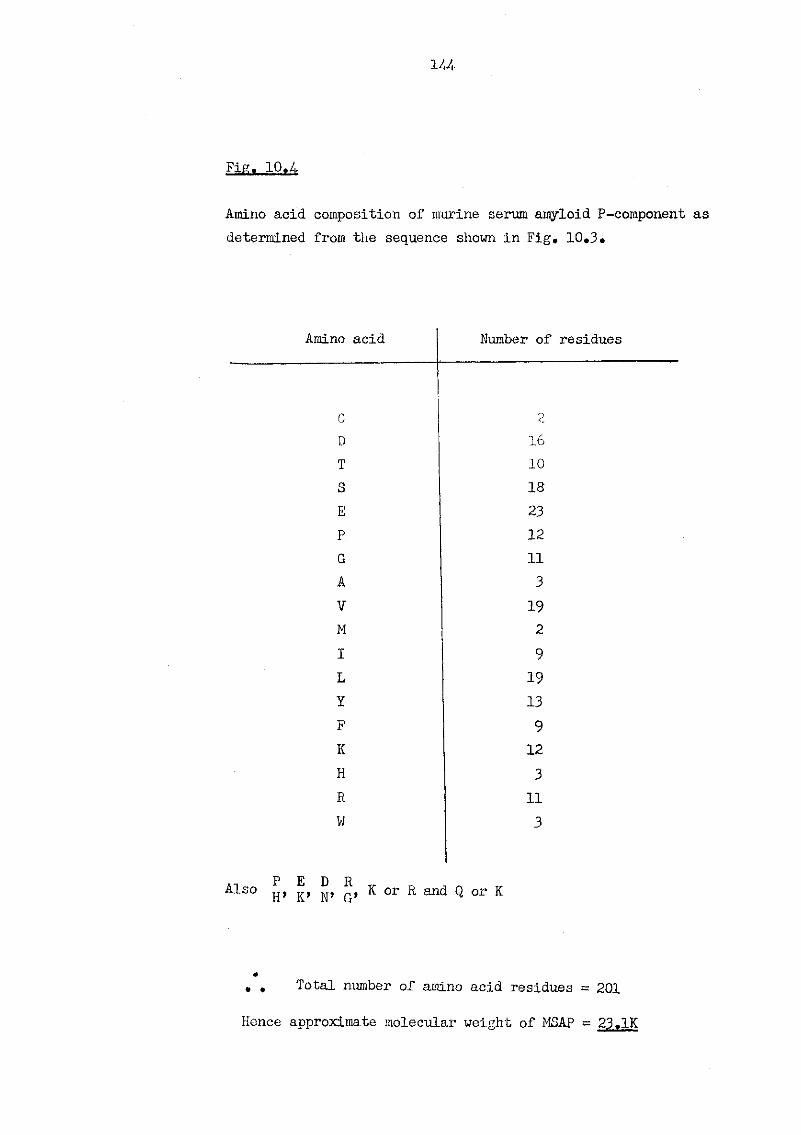
4
Fiftt I0t4
Amino acid composition of murine serum amyloid P-component determined from the sequence shown in Fig. 10.3.
Amino acid Number of residues
C
D 16
T 10
S 18 E 23
P 12
G 11
A 3
V 19 M 2
I 9
L 19 Y 13
F 9 K 12
H 3 R 11
P E D R Also H, , K or R and Q or K
„ . Total number of amino acid residues = 201
Hence approximate molecular weight of MSAP = 23.IK
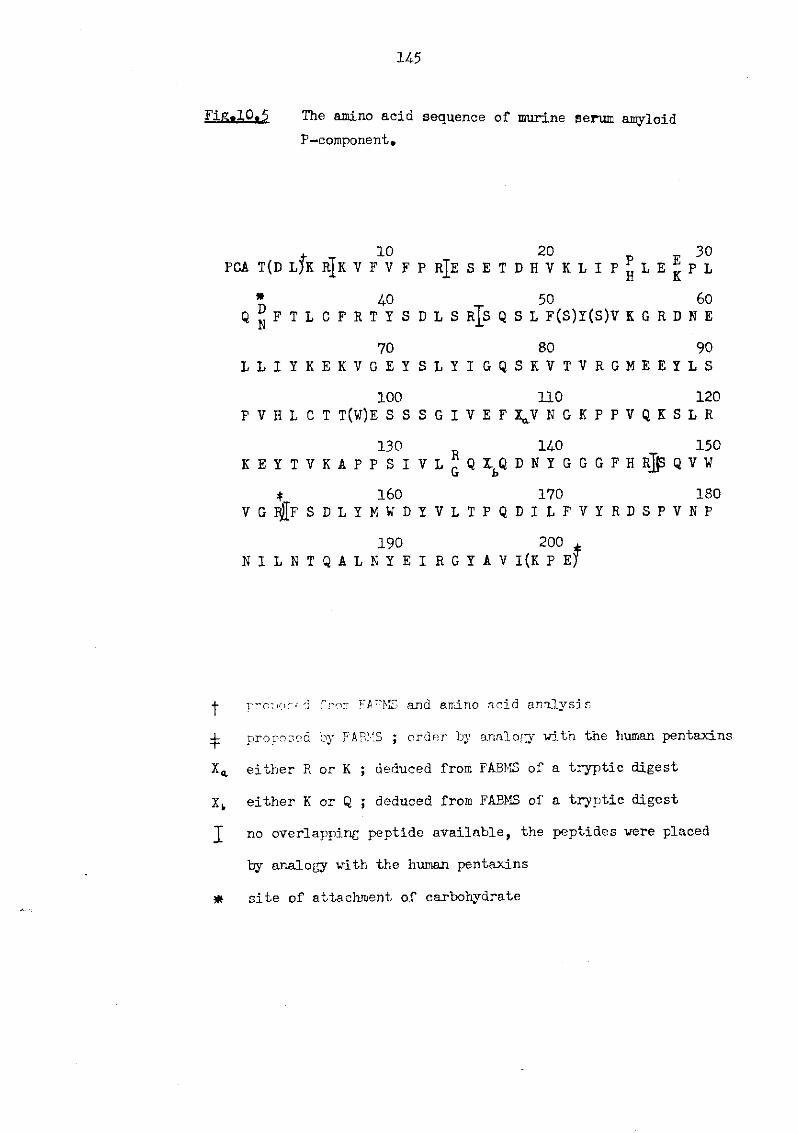
145
Fjg.10.5 The amino acid sequence of murine serum amyloid P-component.
& t 1 0 2 0 p f 3 0 fca t(d l)k r|k v f v f p rje s e t d h v k l i p jj l e j p l
* 40 50 60 q ^ f t l c f r t i s d l s r [ s q s l f(s)y(s)v k g r d n e
70 80 90 l l i y k e k v g e y s l y i g q s k v t v r g m e e y l s
100 110 120 p v h l c t t(w)e s s s g i v e f y n g k p p v q k s l r
130 140 150 k e y t v k a p p s i v l q q lbq d n ! g g g f h r|s q v w
* 160 170 180 v g l f f s d l y m w d y v l t p q d i l f v y r d s p v n p
190 200 . n i l n t q a l n y e i r g y a v l(k p ej
«(• proposed from FARMS and amino acid analysis
-j- proposed by FABMS ; order by analogy with the human pentaxins
Xa either R or k ; deduced from fabms of a tryptic digest
xfc either k or q ; deduced from fabms of a tryptic digest
J no overlapping peptide available, the peptides were placed
by analogy vrith the human pentaxins
* site of attachment of carbohydrate
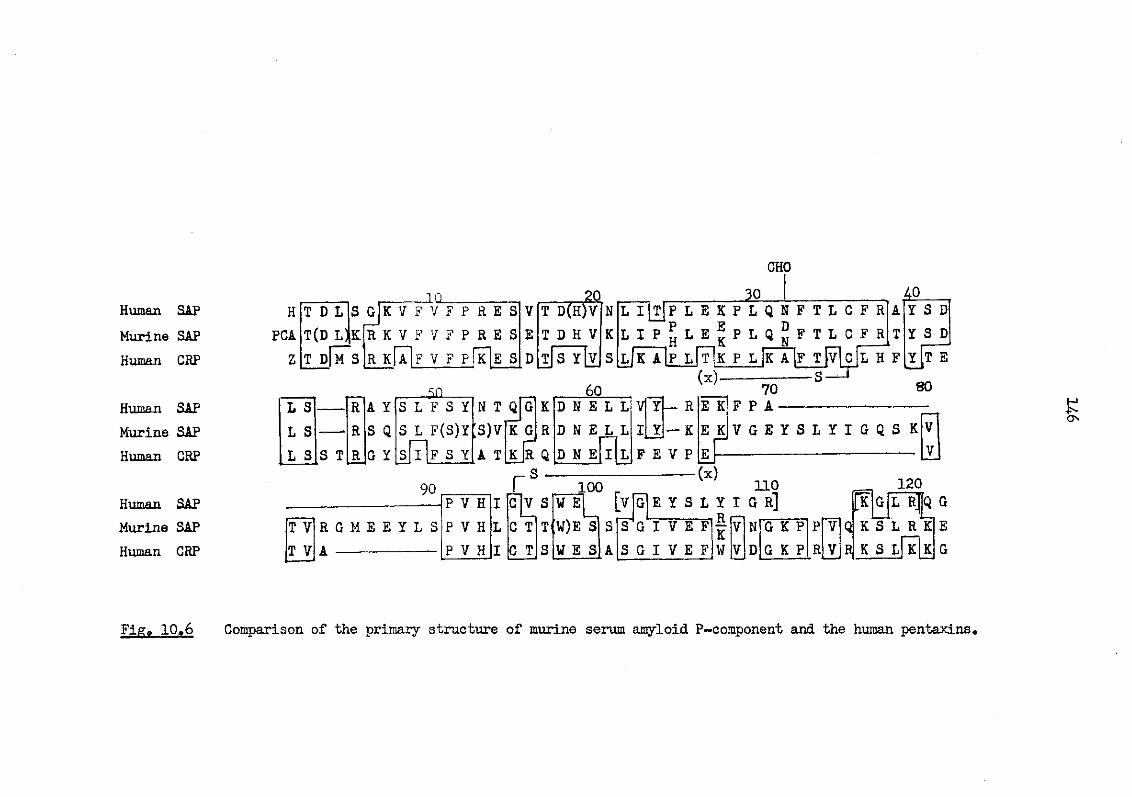
CHO
Human SAP Murine SAP Human CRP
Human SAP Murine SAP Human CRP
H PCA
z
t d l t(d l)|k t d[m~s
10 s g k v f v f p r e s r k v f v f p r e s
e s r k a F V F P k
20 v t d(h)v n e t d h v k d t|s y[v s
1 l i [tJp l e k p l q n f t l c f r L I P L e ! P L Q D
kAtp l1t1k p l |k A |f t
Human SAP L S R A y Murine SAP L S R S Q Human CRP L S S t R g y
s l F s y s l F(s)y
F s y
n t q t3)V A t
k g kjr Q
s -
60 d n e L L v y — r e k d n e L L i y — k e k d n e i L f e v p
70 f p a-
s - J l H f
AQ y s d y s d i f T i
80
v g e y s l y i g q s k
90 r t v t v
r g m e e y l s A —
p v h c]v s p v h l c t ti p v h i c t s
100 w e w)e s W E S
(x) 110 g I e y s l y i g r ] g i v e f
s g i v e f
r k — v n g k p p v
w v d g k p r v
120 [k g|l r|q g
q k s l r kle r k s litik
H ON
Figa 10.6 Comparison of the primary structure of murine serum amyloid P-component and the human pentaxins.
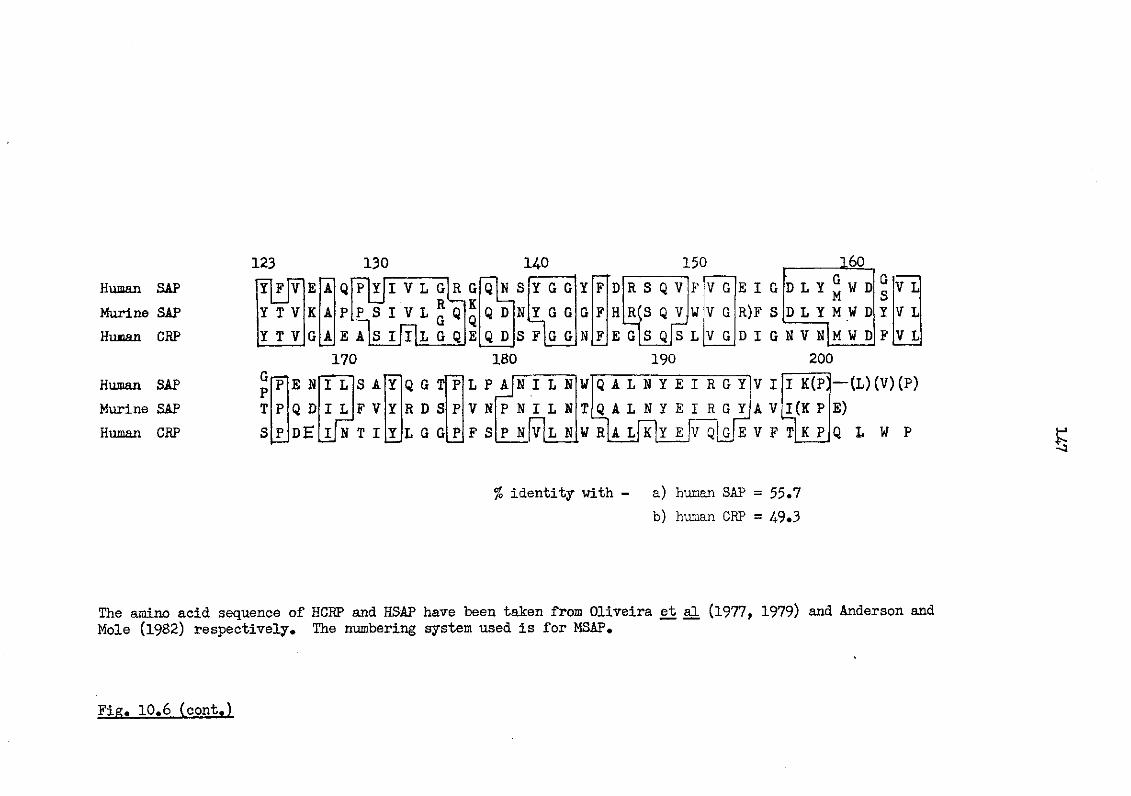
Human SAP Murine SAP Hunan CRP
123 130 140 I F V E A Y T V K A Y T V G A
QtjYjI V L G P P S I V L R
R G K
E 170
S I G ^
L G Q Q D Q D
N S N S F
Y G G Y G G G G
Y F G F N F
150 F
E G
R S Q V R(S Q vjw S Q S L
V G V G V G
E I G R)F S
160 D L Y ? W D JM D L Y M W D
M W D 180 190
D I G N V N 200
G V L S V L Y V L F V L
Human SAP G P P E N I L S A Y Q G T P L P A N I L N W Q A L N Y E I R G Y V I I K(P) — (L) (V) (P)
Murine SAP T P Q D I L F V Y R D S P V N P N I L N T Q A L N Y E I R G Y A V I (K P E) Human CRP S P D E I N T I Y L G G P F S P N V L N W R A L K Y E jv q|g|e V F T K P Q L W P
% identity with - a) human SAP = 55.7 b) human CRP = 49.3
The amino acid sequence of HCRP and HSAP have been taken from Oliveira et al (1977, 1979) and Anderson and Mole (1982) respectively. The numbering system used is for MSAP.
Fig. 10.6 (cont.)
148
10.2 Comparison of the amino acid sequences of the plaice
serum amyloid P-component and the human pentaxins
See Figs. 10.7 and 10.8.
10.3 Comparison of the amino acid sequence of the rat
C-reactive protein and the human pentaxins
See Fig. 10.9.
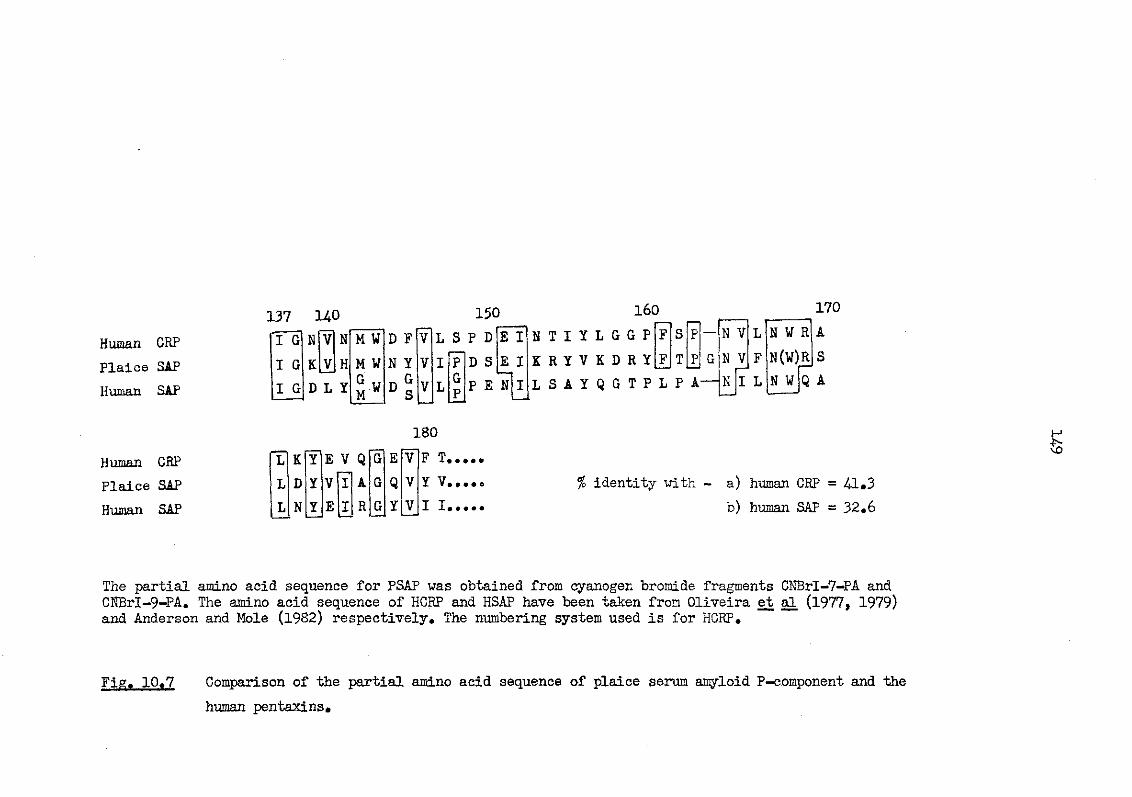
137 140 150 160 170
Human CRP I G N V N M W D F V L S P D E I N T I Y L G G P F S
Plaice SAP I G K V H M W N Y V I P D S E I K R Y V K D R Y F T
Human SAP I G D L Y G V M w < V L G P P E N I L S A Y Q G T P L P
N V N V N I L
N W R N(W)R N W
A S
Q A
180 Human CRP T K Y' E V Q G E ¥ F Plaice SAP L D Y V I A G Q V Y V. ...o % identity with - a) human CRP = 41*3 Human SAP L N Y E I R G Y V X b) human SAP = 32.6
The partial amino acid sequence for PSAP was obtained from cyanogen bromide fragments CNBrI-7-PA and CNBrI-9-PA. The amino acid sequence of HCRP and HSAP have been taken from Oliveira et al (1977, 1979) and Anderson and Mole (1982) respectively. The numbering system used is for HCRP.
Fig. 10.7 Comparison of the partial amino acid sequence of plaice serum amyloid P-component and the human pentaxins*
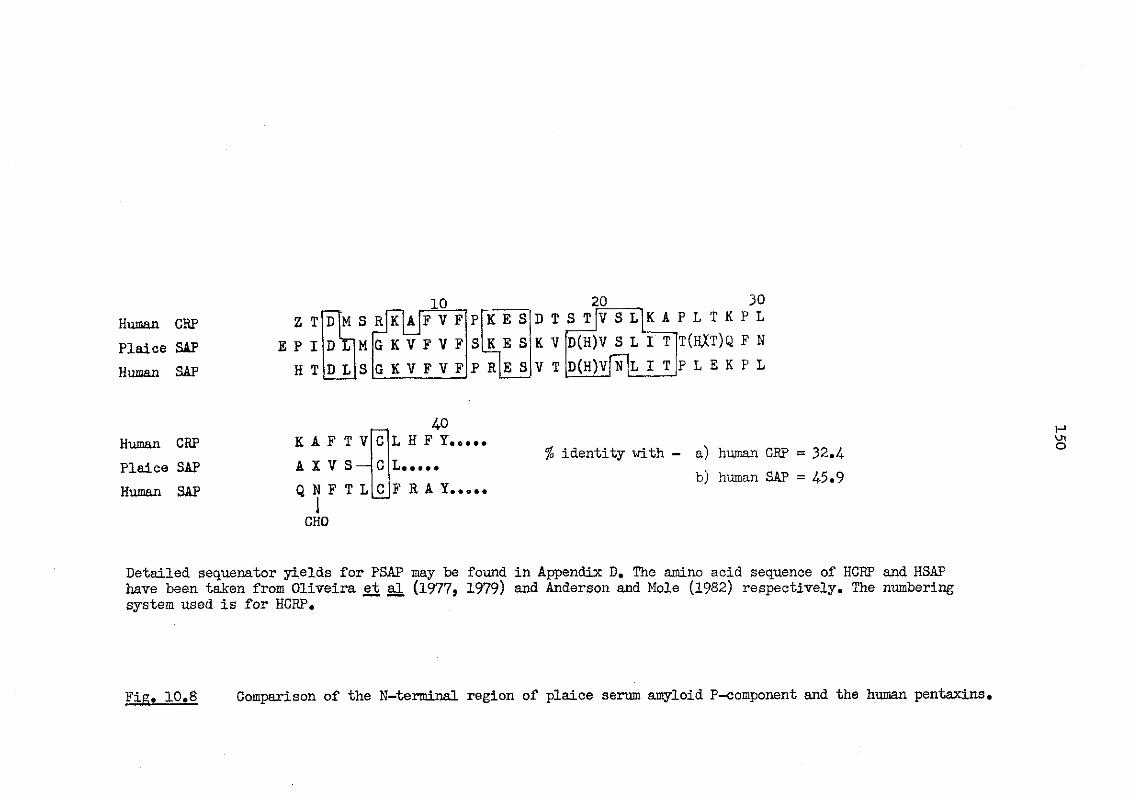
Human CRP Plaice SAP Human SAP
10 f v f
G K V F V F g k v f v f
20
P R
k e s k e s e s
d t s t k v v t
V S L d(h)v s l i t d(h)vfNlL i t
30 k a p l t k p l
t(h,xt)q f n p l e k p l
Human CRP Plaice SAP Human SAP
k A f t v A x v s — q n f t L CHO
40 L H F Y. o••# L. .««« F R A Y
% identity with - a) human CRP = 32.4 b) human SAP = 45.9
Detailed sequenator yields for PSAP may be found in Appendix D. The amino acid sequence of HCRP and HSAP have been taken from Oliveira et al (1977, 1979) and Anderson and Mole (1982) respectively. The numbering system used is for HCRP.
Fig. 10.8 Comparison of the N-terminal region of plaice serum amyloid P-component and the human pentaxins.
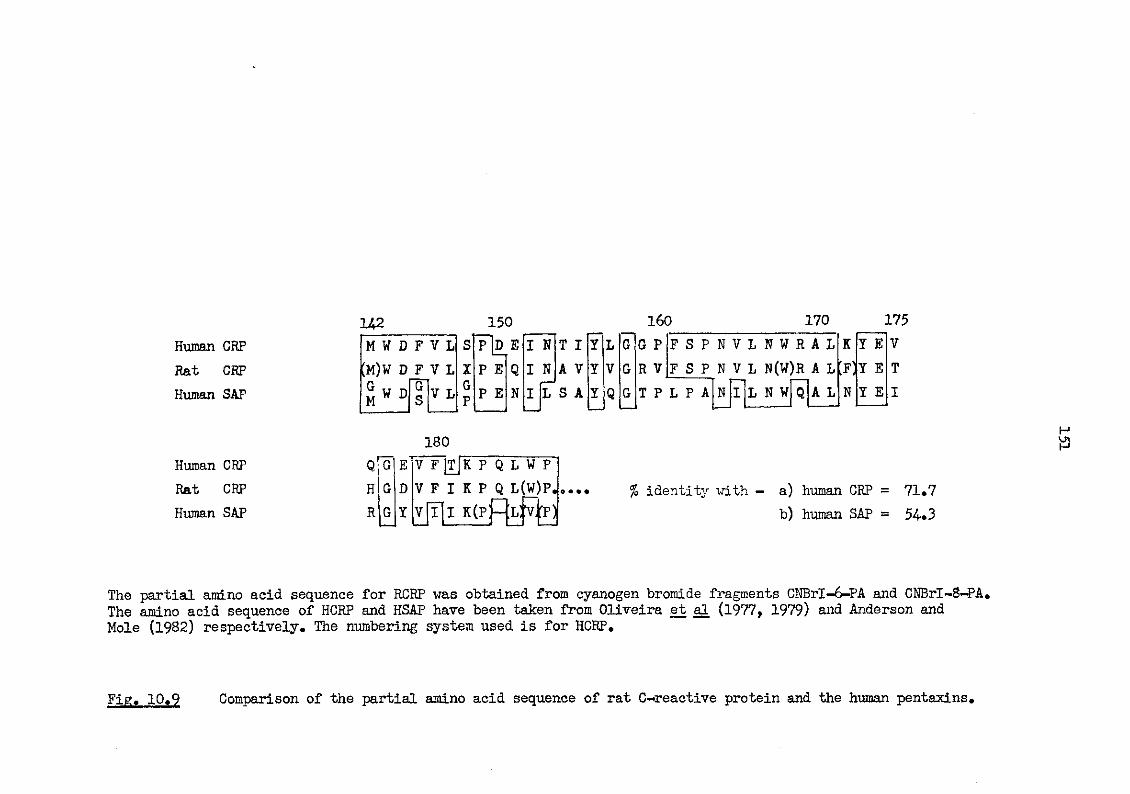
Human CRP Rat CRP Human SAP
142 H W D F V L (M)W D F V L
W DiSlV L M
150 E Q P E
P E
I N I N
T I A V
N L S A
Y I I
160 170 175 G G P F S P N V L N W R A L K Y E G R V F S P N V L N(W)R A L 'F)
I » Y E
G T P L P A N I L N W Q A L N Y E
Human CRP Rat CRP Human SAP
qjg h r
180 V F [TjK P Q L W P V F I K P Q L(W)P,
j u p f t f t j % identity with - a) human CRP = 71.7
b) human SAP = 54.3
The partial amino acid sequence for RCRP was obtained from cyanogen bromide fragments CNBrI-6-PA and CNBrI-8-PA. The amino acid sequence of HCRP and HSAP have been taken from Oliveira et al (1977, 1979) and Anderson and Mole (1982) respectively. The numbering system used is for HCRP.
Fig. 10.9 Comparison of the partial amino acid sequence of rat C-reactive protein and the human pentaxins
152
CHAPTER 11
DISCUSSION
11.1 General Discussion
The extent of some of the experiments undertaken on the
individual pentaxin molecules was largely dependent upon the
amount of material available. Nevertheless, it was possible
to characterise all of the proteins available, namely, BSAP,
DCRP, LCRP, MSAP, the plaice pentaxins and RCRP.
Examination using SDS-PAGE and amino acid analysis
revealed how homologous the members of the Pentaxin family are
with respect to molecular weight and their constituent amino
acids. The dansylation technique failed to give N-termini for
BSAP, DCRP, LCRP, MSAP and RCRP, whereas it did confirm the
known N-termini of V and Z for PCRP and PSAP respectively (Pepys
et al, 1982a) . The nature of the blocking groups of the two
more readily available pentaxins, MSAP and RCRP, were examined
by EIMS. The mass spectra suggested that the blocking group
of MSAP was PCA, whilst RCRP possessed either an acetyl or a
formyl group. In the case of MSAP, the proposed PCA blocking
group was confirmed as a result of examining a tryptic peptide
from carboxymethylated-succinylated MSAP by FABMS; T Su PM 15-A
(see Figs. 7.3 and 7.4).
All the pentaxins mentioned above with the exception of
LCRP, gave a positive result when stained with periodic acid-
Schiffs reagent in polyacrylcimide gels, showing that, unlike
HCRP and rabbit CRP, these molecules are glycosylated. In SDS-
PAGE PCRP is seen as two separate bands, the larger species
being glycosylated (Baltz et al, 1982a). In the case of BSAP,
which also yields two bands, both stained for carbohydrate.
These bands could represent two heterogeneous proteins, in
153
which the amount and/or type of glycosylation varies. Lack of
material prohibited further investigation.
11.2 Murine serum amyloid P-component
MSAP was the pentaxin investigated most extensively. The
amino acid sequence proposed in Fig. 10.5 shows substantial
homology to both the human pentaxins, see Fig. 10.6. Indeed,
49.3% of the residues are identical to those of HCRP and 55.7%
are identical to HSAP. 37.3% of residues are identical in all
three molecules. At the DNA level the minimum number of nucleo-
tide changes required to alter the HCRP or HSAP amino acid
sequences into the sequence proposed for MSAP is 104 or 79
respectively. Fig. 11.1 shows that MSAP is homologous to the
26 amino terminal residues of the hamster female protein, a
CRP/SAP homologue, as determined by Coe et al (1981). The
identity is 65.4%, a value similar to the 73% identity reported
between HSAP and hamster female protein (Anderson and Mole, 1982) .
When compared to the sequences of the human pentaxins, the
amino acid sequence proposed for MSAP shows several interesting
features (see Fig. 10.6), the most striking feature being the
presence of two insertions of 13 and 7 amino acid residues at
positions 69 and either 72 or 73. (These numbers refer to the
HCRP sequence, Oliveira et al, 1977 , 1979). Although the mouse
protein behaves as an acute phase reactant, this ability is not
reflected in the amino acid sequence, which more closely resembles
that of HSAP. It would be interesting to speculate that those
amino acid residues which differ in some way confer the ability
to behave as an acute phase reactant, perhaps by leading to a
conformation better suited to this role. However, since the
exact function of an acute phase reactant is not understood,
the concept of any conformational change must remain pure
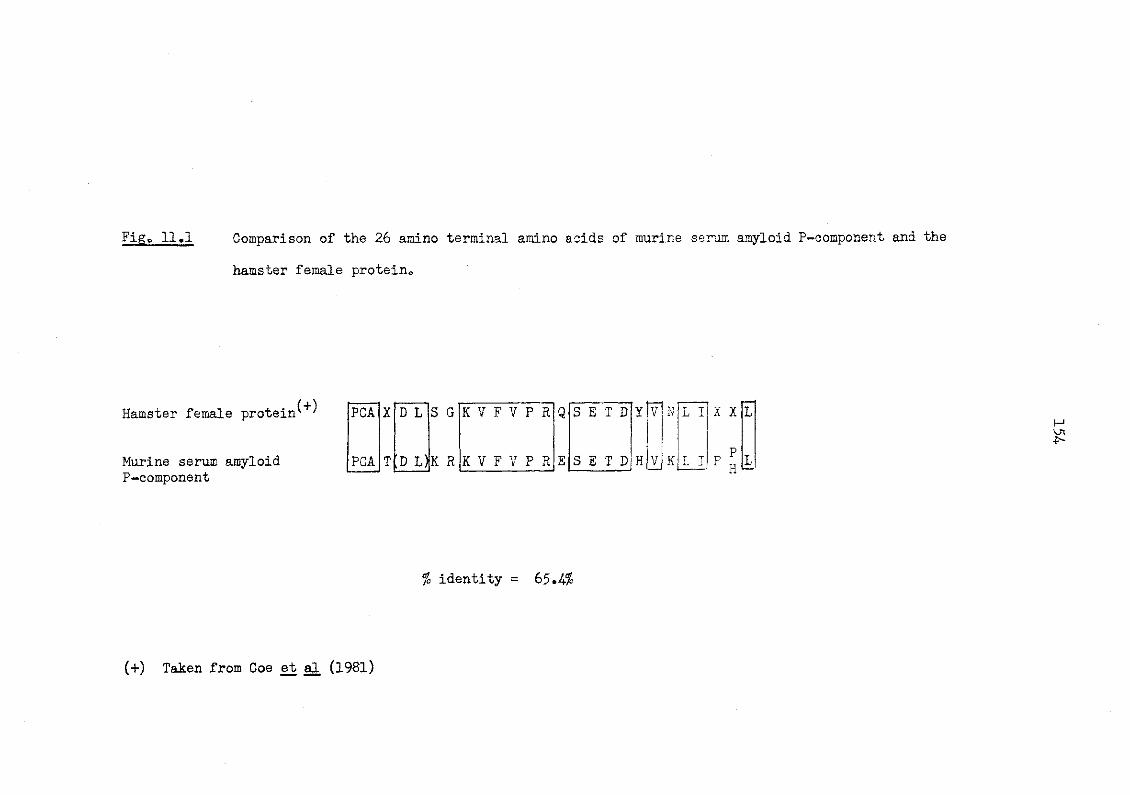
Figo 1 1 . 1 Comparison of the 26 amino terminal amino acids of murine serum amyloid P-component and the
hamster female protein.
Murine serum amyloid P-component
PCA D L)K R
Hamster female protein^ PCA X D L S G K V F V P R Q S E T D Y
K V F V P R
V
V
N L I! X X
L I P
M UX
% identity = 65.4%
(+) Taken from Coe et al (1981)
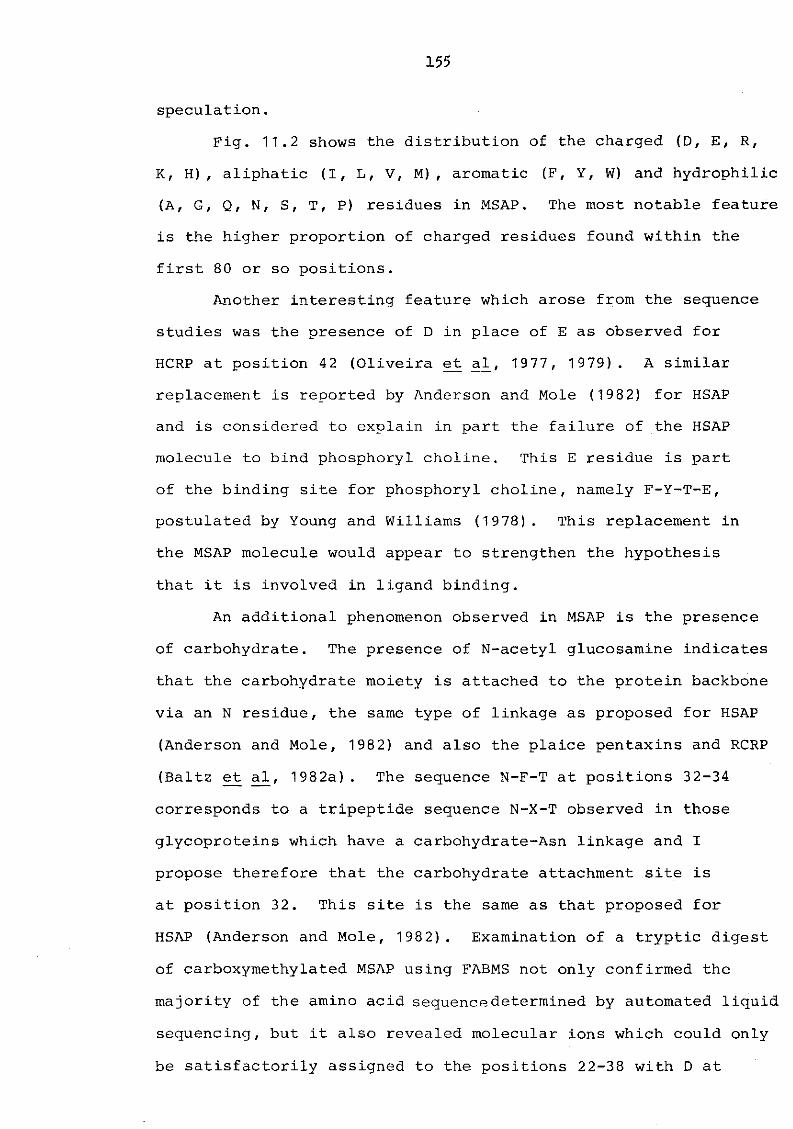
155
speculation.
Fig. 11.2 shows the distribution of the charged (D, E, R,
K, H), aliphatic (I, L, V, M) , aromatic (F, Y, W) and hydrophilic
(A, G, Q, N, S, T, P) residues in MSAP. The most notable feature
is the higher proportion of charged residues found within the
first 80 or so positions.
Another interesting feature which arose from the sequence
studies was the presence of D in place of E as observed for
HCRP at position 42 (Oliveira et al, 1977, 1979). A similar
replacement is reported by Anderson and Mole (1982) for HSAP
and is considered to explain in part the failure of the HSAP
molecule to bind phosphoryl choline. This E residue is part
of the binding site for phosphoryl choline, namely F-Y-T-E,
postulated by Young and Williams (1978). This replacement in
the MSAP molecule would appear to strengthen the hypothesis
that it is involved in ligand binding.
An additional phenomenon observed in MSAP is the presence
of carbohydrate. The presence of N-acetyl glucosamine indicates
that the carbohydrate moiety is attached to the protein backbone
via an N residue, the same type of linkage as proposed for HSAP
(Anderson and Mole, 1982) and also the plaice pentaxins and RCRP
(Baltz et al, 1982a) . The sequence N-F-T at positions 32-34
corresponds to a tripeptide sequence N-X-T observed in those
glycoproteins which have a carbohydrate-Asn linkage and I
propose therefore that the carbohydrate attachment site is
at position 32. This site is the same as that proposed for
HSAP (Anderson and Mole, 1982). Examination of a tryptic digest
of carboxymethylated MSAP using FABMS not only confirmed the
majority of the amino acid sequence determined by automated liquid
sequencing, but it also revealed molecular ions which could only
be satisfactorily assigned to the positions 22-38 with D at
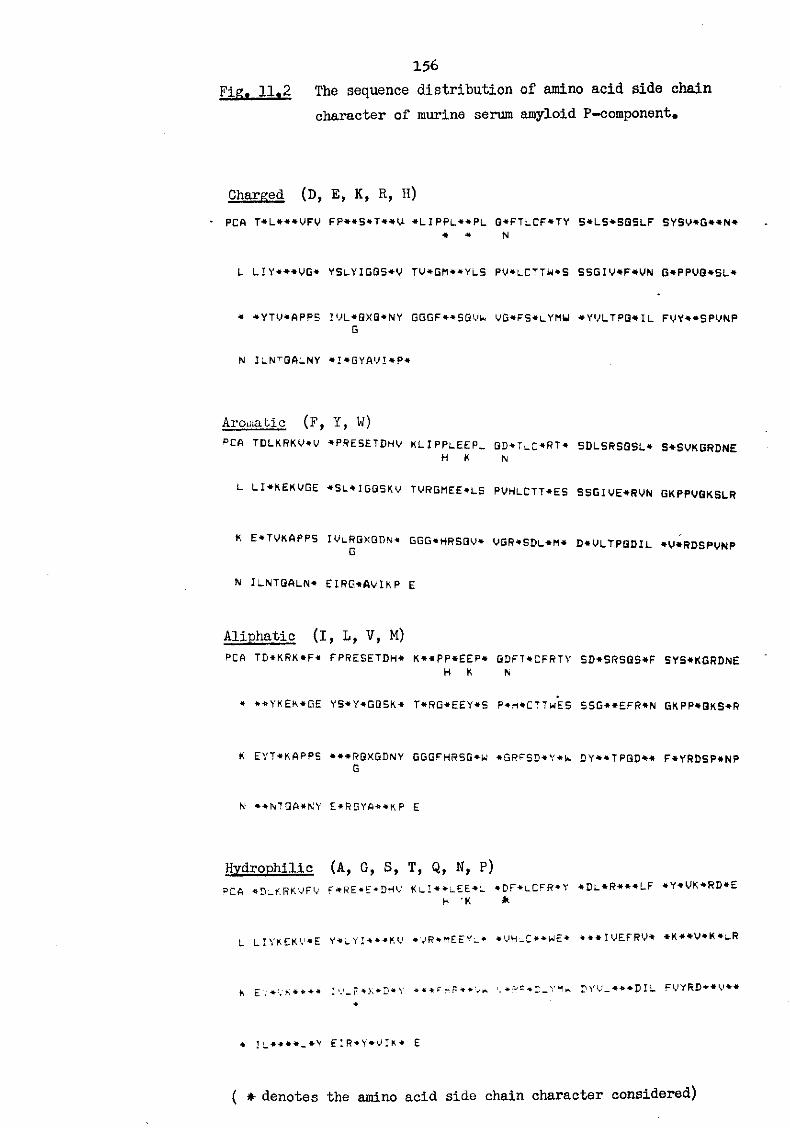
Flfit Hf 2
156 The sequence distribution of amino acid side chain character of murine serum amyloid P-component.
Charged (D, E, K, R, H) - P C A T * L * * » V F V » L I P P L * * P L G * F T L C F » T Y S » L S * S Q S L F S Y S V * G « » N *
• * N
L L I Y * * * V G « Y S L Y I G G S * U T O * G M * » Y L S P V » L C T T W * S S S G I U * F » V N G * P P V G » S L *
* * Y T M * A P P S I U L * Q X G * N Y G G G F » « S G V f c V G » F S * L Y M W * Y V L T P Q * I L F U Y * » S P V N P G
N I L N T Q A L N Y • I » G Y A V I » P *
Aromatic (F, Y, W) P C A T D L K R K U * V * P R E S E T D H V K L I P P L E E P L G D « T L C * R T * S D L S R S G S L » S « S V K G R D N E
H K N
L L I * K E K V G E « S L * I G G S K V T O R G M E E * L S P V H L C T T ^ E S S S G I V E * R V N G K P P V Q K S L R
K E * T V K A P P S I V i _ R G X G D N * G G G * H R S Q O ^ P G R * S D L « M * D « V L T P G D I L * V » R D S P V N P G
N I L N T Q A L N * E I R G * A V I K P E
Aliphatic (I, L, V, M) P C A T D * K R K * F « F P R E S E T D H - * K * * P P « E E P » G D F T * C F R T Y S D * S R S G S * F S Y S ^ K G R D N E
H K N
* • • Y K E K # G E Y S * Y * G G S K * T « R G » E E Y * S P * r t * C T T w E S S S G » * £ F R * N G K P P * Q K S * R
K E Y T * K A P P S • • • R G X G D N Y G G G F H R S G ^ W • G R F S D « Y * W D Y * * T P Q D * « F - » Y R D S P * N P G
N • * N T G A * N Y E * R G Y A * * K P E
Hydrophilic (A, G, S, T, Q, N, P) P C A * D ' K R K V F V F * R E * E « D H V K L I * * L E E * L * D F + L C F R « Y • D L * R * * * L F * Y « V K » R D « E
H 'K *
L L I Y K £ K < . ' * E Y * L Y I * * + K V * V R * n £ E Y _ * • V H i _ C * * W E * • • • I O E F R O * * K » * V * K » i _ R
K £ Y * V K * * * « I _ R * X • D * Y * « * F r i R * » V * * R c - * D _ Y ! 1 K D Y I L F V Y R D » « V * «
• I L » * * » - » Y E I R + Y ^ V I K * E
( denotes the amino acid side chain character considered)
157
position 32. Such assignment suggests that not all sub-units
of MSAP are glycosylated. Occasionally when examining MSAP
using SDS-PAGE it was possible to identify two distinct bands,
approximately 2-4K daltons apart. This separation was not
always seen when a heavier loading of material was used. In
the light of other data this observation was probably due to
the glycosylated and non-glycosylated forms of MSAP, the
separation of which may be obscured by overloading.
11.3 Plaice serum amyloid P-component
Pepys et al_ ( 198 2a) have reported the first 20 amino
terminal residues of PSAP. PSAP, unlike MSAP, is not an acute
phase reactant. My own studies have enabled this amino terminal
sequence to be extended to 3 7 residues; see Fig. 10.8. The amino
terminal region shows 3 2.4% and 45.9% identity with HCRP and HSAP
respectively. Data obtained from sequencing PSAP cyanogen bromide
fragments has been matched to the C-terminal regions of the human
pentaxins; see Fig. 10.7. Over this stretch of sequence the
identity with HCRP and HSAP is 41.3% and 32.6% respectively.
11.4 Rat C-reactive protein
Pontet et al (1981) and Nagpurker and Mookerjea (1981)
have each independently isolated a rat serum protein which
they called rat SAP and a "Phosphoryl choline-binding protein"
respectively. This protein has been shown to be immunochemically
indistinguishable from that isolated by de Beer et al (198 2a) and
called RCRP on the basis of its calcium-dependent binding
properties (Pepys and Baltz, 1983). Sequence data obtained from
cyanogen bromide fragments of RCRP has been aligned with the
C-terminal region of the human pentaxins (Fig. 10.9) . The
identity with HCRP and HSAP is 71.7% and 54.3% respectively.
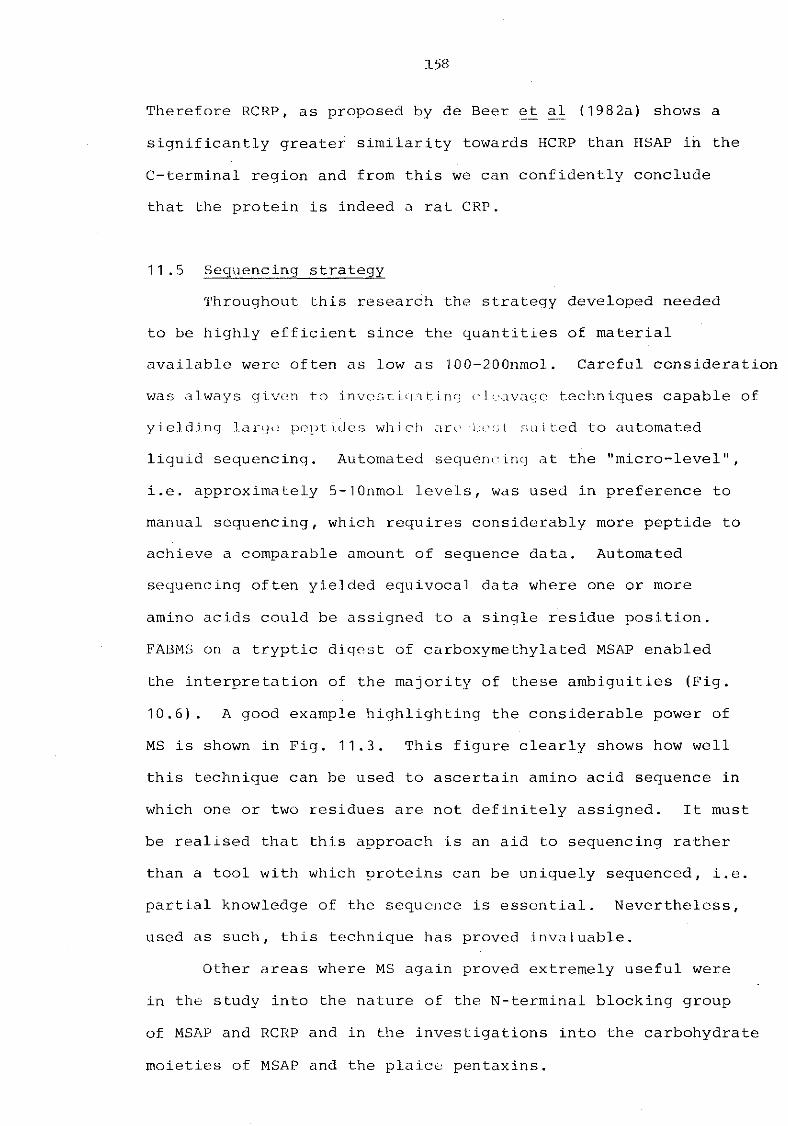
158
Therefore RCRP, as proposed by de Beer et al (1982a) shows a
significantly greater similarity towards HCRP than HSAP in the
C-terminal region and from this we can confidently conclude
that the protein is indeed a rat CRP.
11.5 Sequencing strategy
Throughout this research the strategy developed needed
to be highly efficient since the quantities of material
available were often as low as 100-200nmol. Careful consideration
was always given to investigatinq cleavage techniques capable of
yielding large peptides which are best suited to automated
liquid sequencing. Automated sequencing at the "micro-level",
i.e. approximately 5-10nmol levels, was used in preference to
manual sequencing, which requires considerably more peptide to
achieve a comparable amount of sequence data. Automated
sequencing often yielded equivocal data where one or more
amino acids could be assigned to a single residue position.
FABMS on a tryptic digest of carboxymethylated MSAP enabled
the interpretation of the majority of these ambiguities (Fig.
10.6). A good example highlighting the considerable power of
MS is shown in Fig. 11.3. This figure clearly shows how well
this technique can be used to ascertain amino acid sequence in
which one or two residues are not definitely assigned. It must
be realised that this approach is an aid to sequencing rather
than a tool with which proteins can be uniquely sequenced, i.e.
partial knowledge of the sequence is essential. Nevertheless,
used as such, this technique has proved invaluable.
Other areas where MS again proved extremely useful were
in the study into the nature of the N-terminal blocking group
of MSAP and RCRP and in the investigations into the carbohydrate
moieties of MSAP and the plaice pentaxins.
T? rQ rt 0 > •H -P rt H 0 Pi
S K Proposed sequence; p L R p » r o m automated sequencing.
503 (S L R K)
513 522
500 510 520
n/z
Possible sequence
532
530
(M+H)'
s L R K 503 s L R F 522 p L R K 513 p L R F 532
H vx vO
Fig. 11.3 An example of sequence confirmation from a tryptic digest of murine serum amyloid P-component examined, without purification, by FABMS.
160
11.6 Summary of conclusions
The amino acid sequence of MSAP has been determined.
It is 49.3% identical to HCRP.
It is 55.7% identical with HSAP.
It has two striking insertions compared to the human
pentaxins.
The site of attachment for the carbohydrate moiety is
proposed.
PSAP has been further characterised.
The "Phosphoryl choline-binding protein from the rat" has
been shown to be a true rat CRP.
161
Appendix A
Methods used in automated seguencing
A(i) 0.1M Quadrol-Sequencing program; a modification of
Beckman program no. 121078 by courtesy of J.E. Mole
Reagents and solvents used
R1 5% (v/v) phenylisothiocyanate in heptane
R 2 0.1M Quadrol in 75% (v/v) propan' -1-ol
R 3 Heptafluorobutyric acid
S1 Benzene
S 2 Ethyl acetate
S 3 Empty
S 4 Chloro-1-butane.
High speed, H - 1800 rpm
Low speed, L - 120 0 rpm
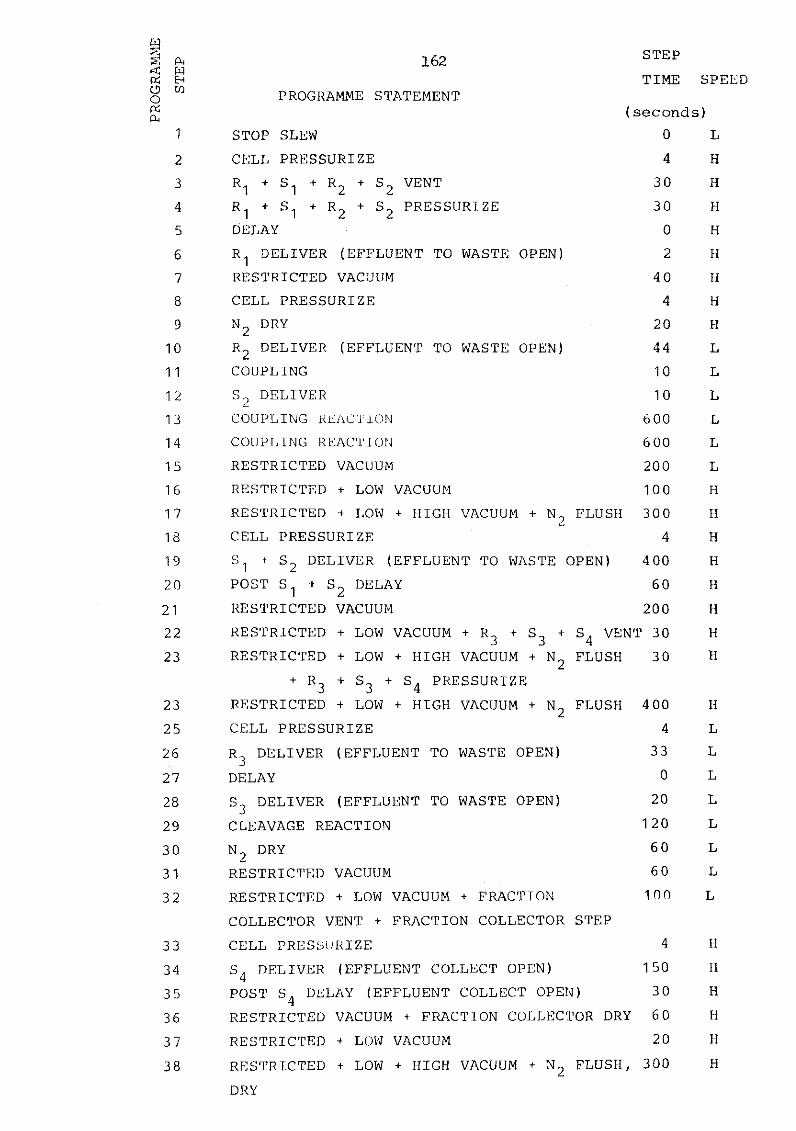
fL w Eh W
1
2
3 4 5 6
7 8
9 10
11 12
13 14 15 16
17 18
19 20 21 22
23
23 25 26
27 28
29 30 31 32
33 34 35 36 37 38
162
PROGRAMME STATEMENT
STOP SLEW CELL PRESSURIZE R„ + S
STEP TIME SPEED
1 ' R 1 +
DELAY
+ R 2 + S 2 VENT
L + R 2 + S 2 PRESSURIZE
R 1 DELIVER (EFFLUENT TO WASTE OPEN) RESTRICTED VACUUM CELL PRESSURIZE N 2 DRY R 2 DELIVER (EFFLUENT TO WASTE OPEN) COUPLING S 2 DELIVER COUPLING REACTION COUPLING REACTION RESTRICTED VACUUM RESTRICTED + LOW VACUUM RESTRICTED + LOW + HIGH VACUUM + CELL PRESSURIZE S
N 9 FLUSH
1 + S 2 DELIVER (EFFLUENT TO WASTE OPEN POST S + S 2 DELAY RESTRICTED VACUUM RESTRICTED + LOW VACUUM + R. + S. + S
2
4 FLUSH
"3 3 RESTRICTED + LOW + HIGH VACUUM + N
+ R 3 + S 3 + S 4 PRESSURIZE RESTRICTED + LOW + HIGH VACUUM + N 0 FLUSH
(seconds) 0 4
30 30 0 2
40 4
20
44 10
10
600 600 200
100
300 4
400 60
200
VENT 30 30
400 z CELL PRESSURIZE 4 R 3 DELIVER (EFFLUENT TO WASTE OPEN) 3 3 DELAY 0 S 3 DELIVER (EFFLUENT TO WASTE OPEN) 20 CLEAVAGE REACTION 120 N 2 DRY 6 0 RESTRICTED VACUUM 6 0 RESTRICTED + LOW VACUUM + FRACTION 100 COLLECTOR VENT + FRACTION COLLECTOR STEP CELL PRESSURIZE 4 S„ DELIVER (EFFLUENT COLLECT OPEN) 150 POST S 4 DELAY (EFFLUENT COLLECT OPEN) 3 0 RESTRICTED VACUUM + FRACTION COLLECTOR DRY 6 0 RESTRICTED + LOW VACUUM 20 RESTRICTED + LOW + HIGH VACUUM + N 2 FLUSH, 300 DRY
L H H H H H H H H L L L L L L II
H H H II
H H H
H L L L L L L L L
H H H H H H
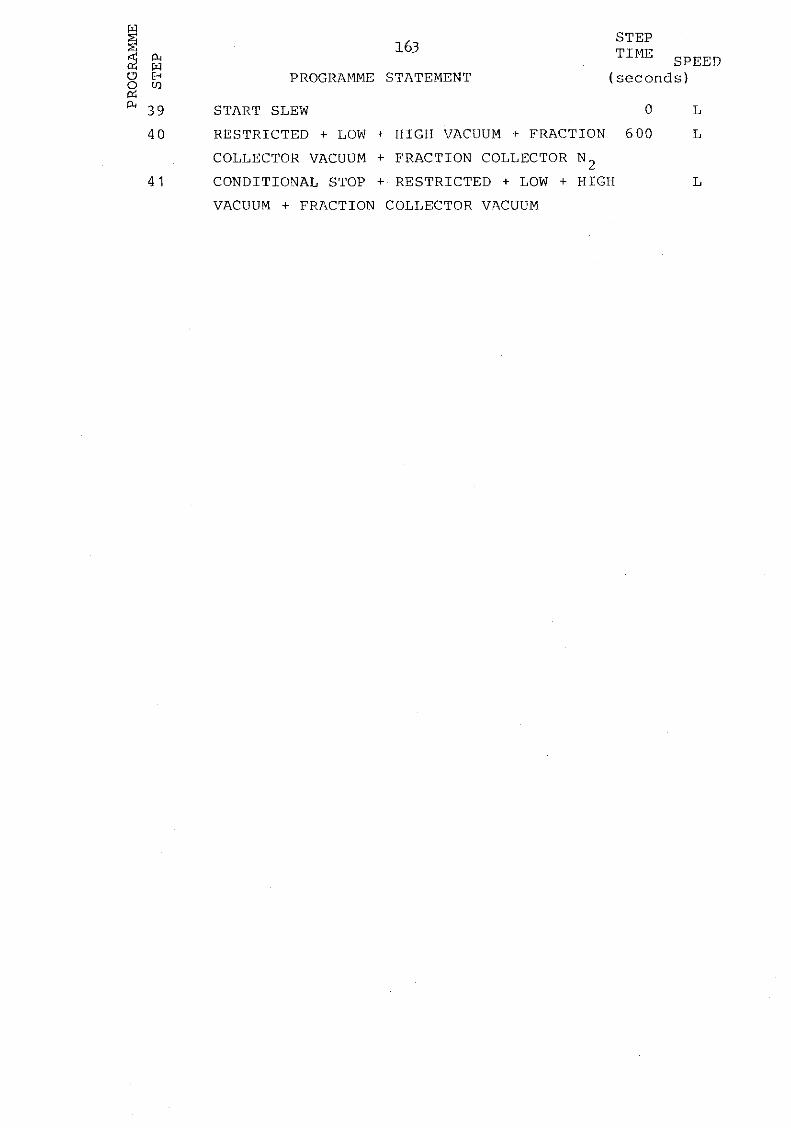
STEP J-Oj? TTMF SPEED
PROGRAMME STATEMENT (seconds)
START SLEW 0 L RESTRICTED + LOW + HIGH VACUUM + FRACTION 6 00 L COLLECTOR VACUUM + FRACTION COLLECTOR N 2
CONDITIONAL STOP + RESTRICTED + LOW + HIGH L VACUUM + FRACTION COLLECTOR VACUUM
164.
A(ii) 0.1M Quadrol - Polybrene pre-wash program; by courtesy
J.E. Mole.
For details of reagents, solvents and abbreviations used see A(i).
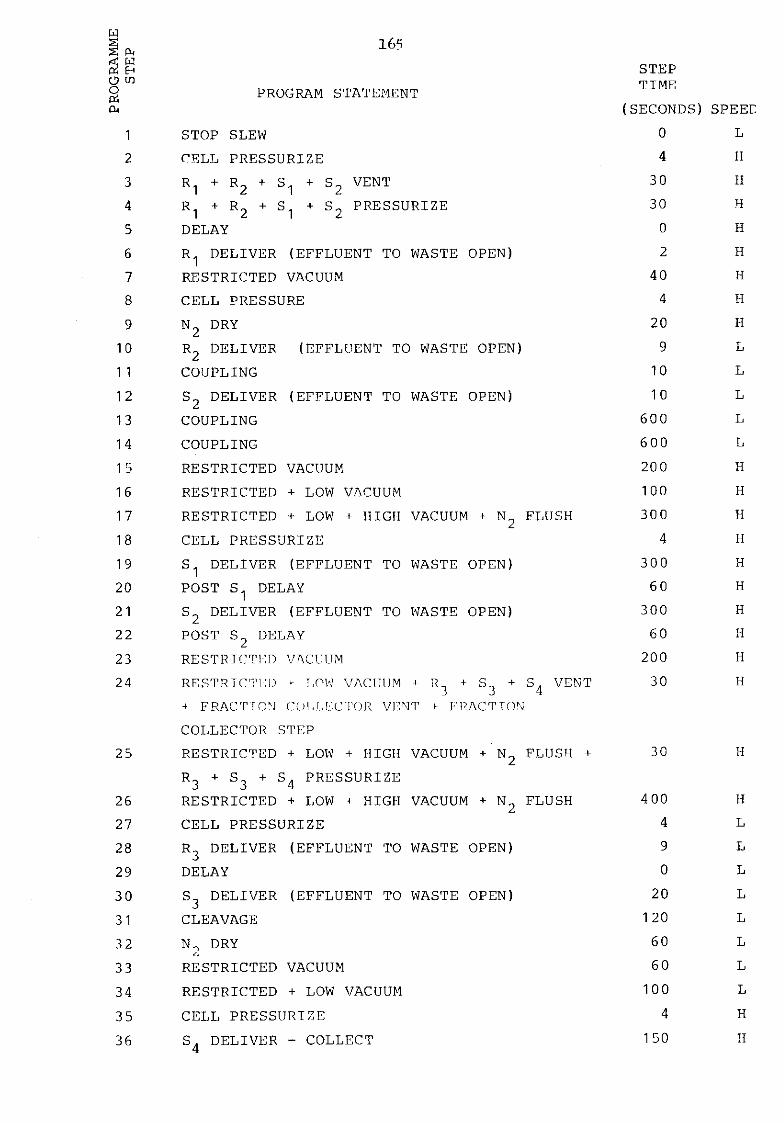
w s fa w fa H O W O fa fa
1
2
3
5 6
7 8
9 10
1 1
12
13 14 15 16
17 18
19 20
21
22
23 24
25
26
27 28
29 30 31 3 2 33 34 35 36
165
PROGRAM STATEMENT
STOP SLEW CELL PRESSURIZE R 1 + R 2 + S 1 + S 2 VENT R 1 + R 2 + S 1 + S 2 PRESSURIZE DELAY R 1 DELIVER (EFFLUENT TO WASTE OPEN) RESTRICTED VACUUM CELL PRESSURE N 2 DRY R 2 DELIVER (EFFLUENT TO WASTE OPEN) COUPLING S 2 DELIVER (EFFLUENT TO WASTE OPEN) COUPLING COUPLING RESTRICTED VACUUM RESTRICTED + LOW VACUUM RESTRICTED + LOW + HIGH VACUUM + N 2 FLUSH CELL PRESSURIZE 5 1 DELIVER (EFFLUENT TO WASTE OPEN) POST S 1 DELAY 5 2 DELIVER (EFFLUENT TO WASTE OPEN) POST S 2 DELAY RESTRICTED VACUUM RESTRICTED + LOW VACUUM + R.
STEP TIME
SECONDS) SPEED
+ + S, VENT '3 3 + FRACTION COLLECTOR VENT + FRACTION COLLECTOR STEP RESTRICTED + LOW + HIGH VACUUM + N 2 FLUSH + R 3 + S 3 + S 4 PRESSURIZE RESTRICTED + LOW + HIGH VACUUM + N 2 FLUSH CELL PRESSURIZE R 3 DELIVER (EFFLUENT TO WASTE OPEN) DELAY S 3 DELIVER (EFFLUENT TO WASTE OPEN) CLEAVAGE N 0 DRY RESTRICTED VACUUM RESTRICTED + LOW VACUUM CELL PRESSURIZE S 4 DELIVER COLLECT
0 4
30 30 0 2
40 4
20
9 10
10
600 600 200
100
300 4
300 60
300 60
200
30
30
400 4 9 0
20
1 20
60
60
100
4 150
L H H H H H H H H L L L L L H H H H H H H H H H
H
H L L L L L L L L H H
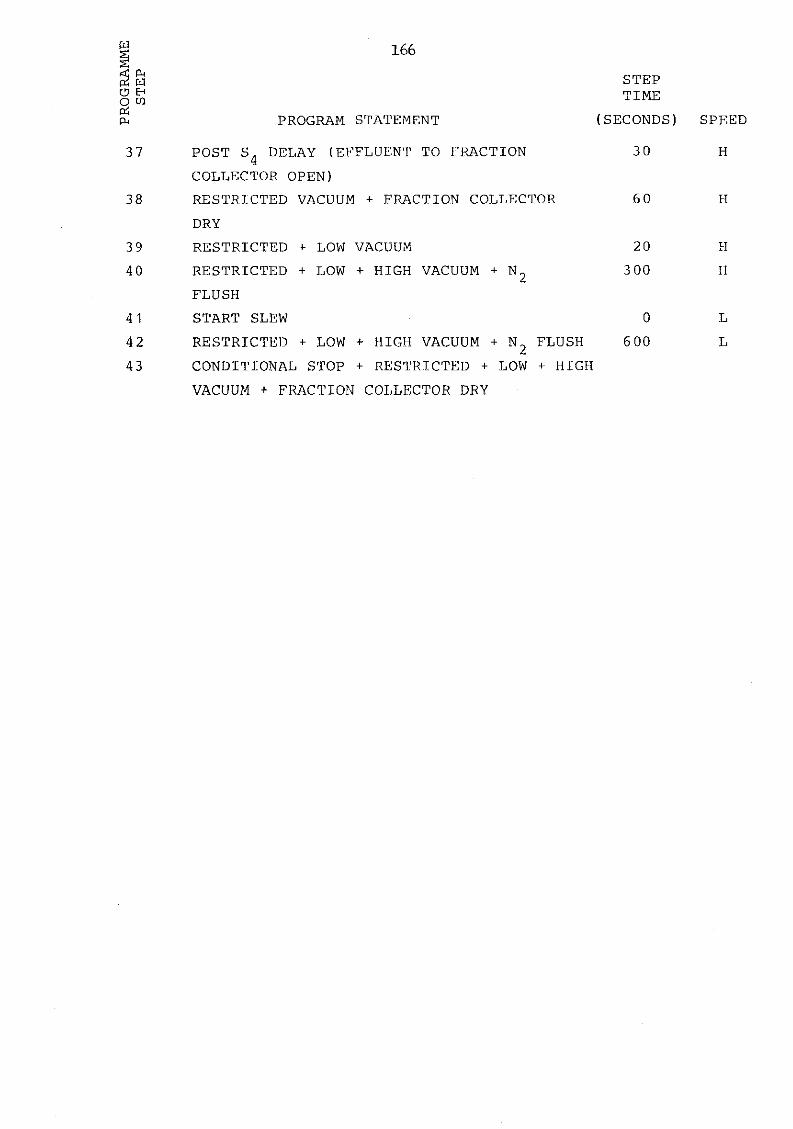
w 166 <c ft ft W O Eh O W ft ft 37
38
39 40
41 42 43
PROGRAM STATEMENT
POST S 4 DELAY (EFFLUENT TO FRACTION COLLECTOR OPEN) RESTRICTED VACUUM + FRACTION COLLECTOR DRY RESTRICTED + LOW VACUUM RESTRICTED + LOW + HIGH VACUUM + N 2
FLUSH START SLEW RESTRICTED + LOW + HIGH VACUUM + N 2 FLUSH CONDITIONAL STOP + RESTRICTED + LOW + HIGH VACUUM + FRACTION COLLECTOR DRY
STEP TIME
(SECONDS
30
60
20 300
0 600
SPEED
H
II
H H
L L
167
A (iii) Phenylthiohydantoins standard solution
The solution containing 0.4 nirtol of each PTH derivative
of the following;
D, E, N, S, T, Q, G, A, Y, M, V, P, W, K, F, I, L and norleucine,
was used for calibrating the HPLC systems used to identify PTH
derivatives; see Appendices A(iv) and A(v).
The PTH derivatives of R and H elute in close proximity
to other derivatives, hence to avoid mis-calibration, a solution
containing these two derivatives was examined, but not calibrated
for, thus enabling their elution positions to be ascertained.
168
A (i v) Buffers _u s ed. in phenyl thiohydantoin identification
a) pH 4.75 buffer Acetonitrile system
The buffer, prepared in M i l l i Q water, comprised ( * )
0.05 - 0.1% (v/v) triethylamine and 0.05% (v/v) glacial
acetic acid. Approximately 20% (w/v) NaOH was used for pH
adjustment. ( * )
Histidine is retained on an ageing column, hence the
amount of triethylamine was increased.
b) pH 3.85 buffer Methanol system
The buffer, prepared in Milli Q water, comprised
0.05% (v/v) triethylamine and 0.25% (v/v) glacial acetic
acid. Approximately 20% (w/v) NaOH was used for pH adjustment.
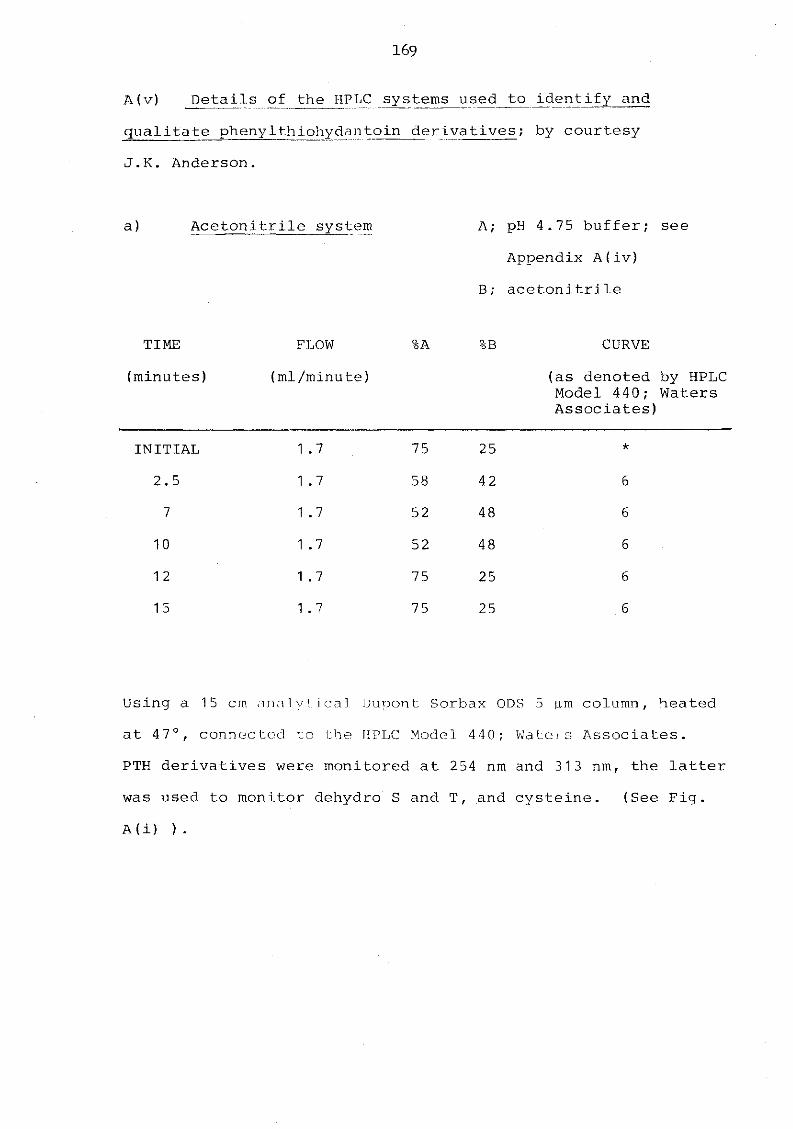
169
A(v) Details of the HPLC systems used to identify and
qualitate phenylthiohydantoin derivatives; by courtesy
J.K. Anderson.
a) Acetonitrile system A; pH 4.75 buffer; see
Appendix A(iv)
B; acetonitrile
TIME FLOW %A
(minutes) (ml/minute)
INITIAL 1.7 75
2.5 1.7 58
7 1.7 52
10 1.7 52
12 1.7 75
15 1.7 75
%B CURVE
(as denoted by HPLC Model 4 40; Waters Associates)
25 *
42 6
48 6
48 6
25 6
25 6
Using a 15 cm analytical Dupont Sorbax ODS 5 \im column, heated
at 4 7°, connected to the HPLC Model 4 40; Waters Associates.
PTH derivatives were monitored at 254 nm and 313 nm, the latter
was used to monitor dehydro S and T, and cysteine. (See Fig.
A(i) ).
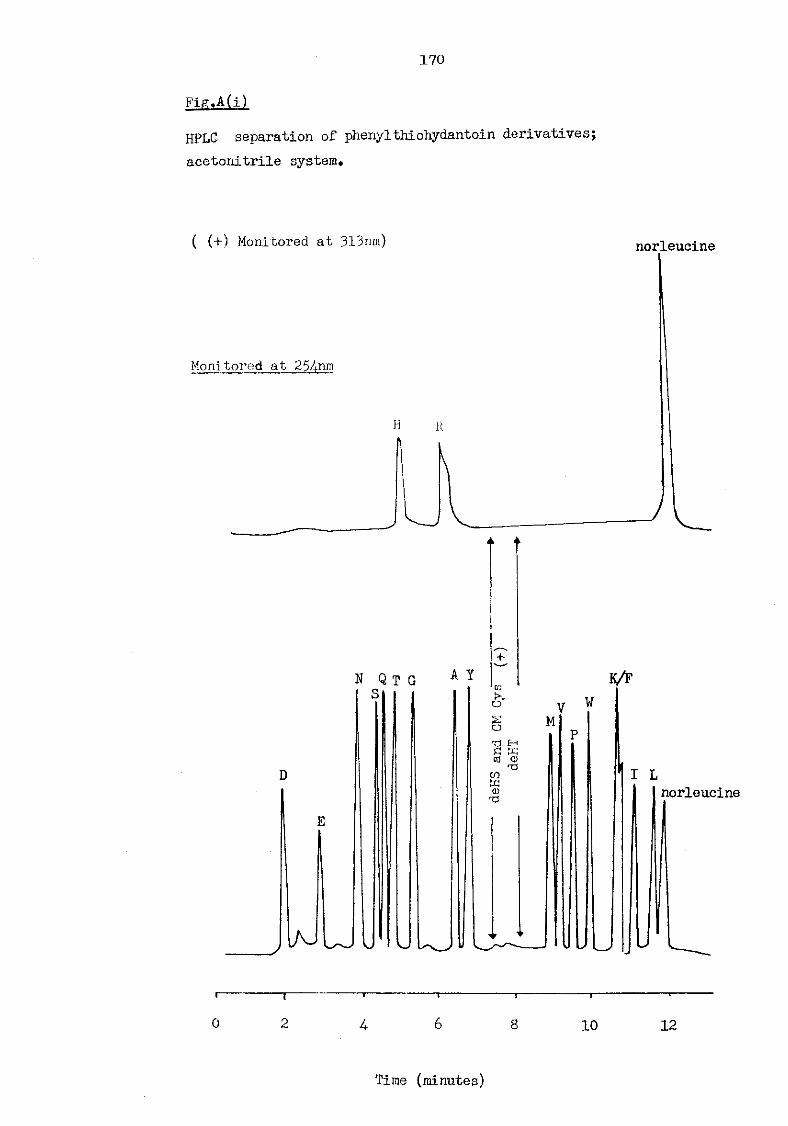
170
Fig.A(i)
HPLC separation of phenylthiohydantoin derivatives; acetonitrile system.
( (+) Monitored at 313nm) norleucine
Monitored at 254-nm
H R
N Q T G S
A Y
D
lAJ vj \J
to
o o ft c w cti 0) ft co ft <D ft
K/F V W
M
I L norleucine
t r
A 10 12
Time (minutes)
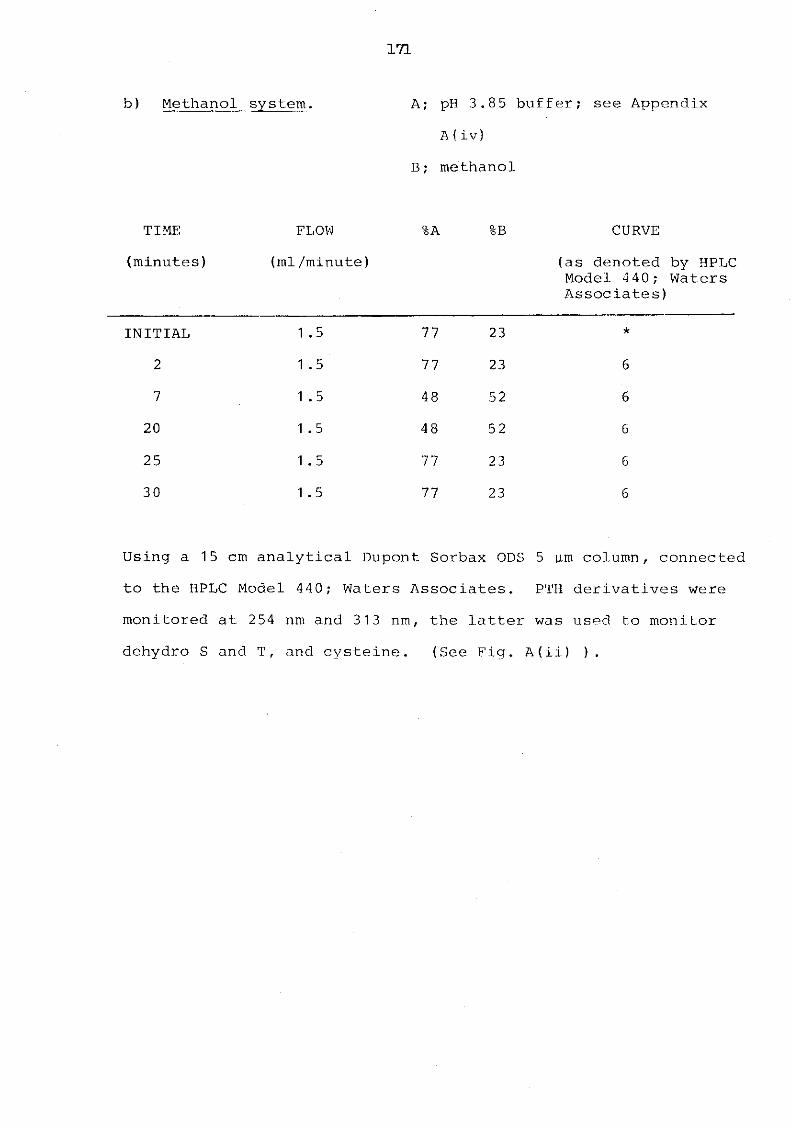
171
b) Methanol system. A; pH 3.8 5 buffer; see Appendix
A ( iv)
B; methanol
TIME (minutes'
FLOW
(ml/minute)
%A %B CURVE
(as denoted by HPLC Model 4 40; Waters Associates)
INITIAL
2
7
20
25
30
1 .5
1 .5
1 .5
1 .5
1 .5
1 .5
77
77
48
48
77
77
23
23
52
52
23
23
Using a 15 cm analytical Dupont Sorbax ODS 5 -jj.m column, connected
to the HPLC Model 440; Waters Associates. PTH derivatives were
monitored at 254 nm and 313 nm, the latter was used to monitor
dehydro S and T, and cysteine. (See Fig. A(ii) ).
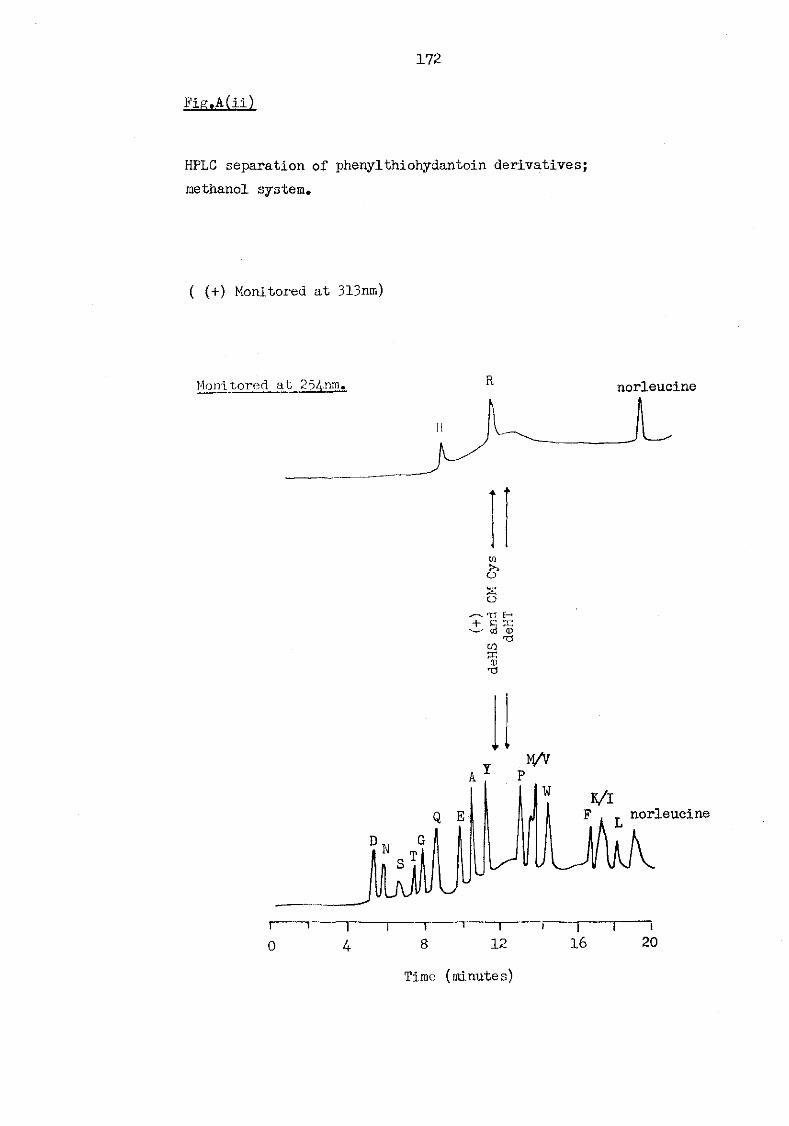
172
FigtA(ii)
HPLC separation of phenylthiohydantoin derivatives; methanol system.
( (+) Monitored at 313nm)
Monitored at 254nm, R
CO X o s O
^ T3 + £ ffi -—" ccs (D TJ CO K ©
norleucine
v * A Y P
M/V
Q E
w
F , _ norleucine L
1 1 1 1 1 ' 1 i 1 i i 0 4 8 12 16 20
Time (minutes)
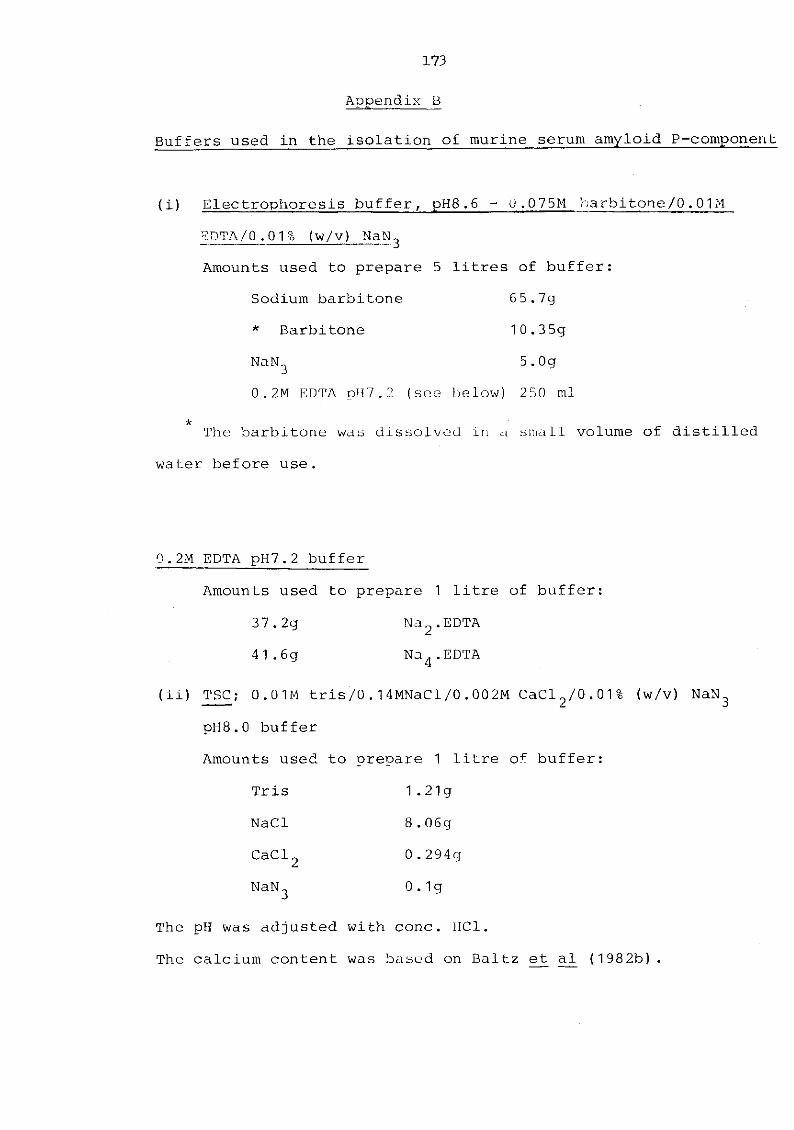
173
Appendix A
Buffers used in the isolation of murine serum amyloid P-component
(i) Electrophoresis buffer, pH8.6 - 0.075M barbitone/O.01M
EDTA/0.01% (w/v) N a N 3
Amounts used to prepare 5 litres of buffer:
Sodium barbitone 6 5.7g
* Barbitone 10.3 5g
NaN 3 5.Og
0.2M EOTA pH7.2 (see below) 250 ml
The barbitone was dissolved in a small volume of distilled
water before use.
0.2M EDTA pH7.2 buffer
Amounts used to prepare 1 litre of buffer:
37.2g Na 2.EDTA
41.6g Na 4.EDTA
(ii) TSC; 0.01M tris/0.14MNaCl/0.002M CaCl 2/0.01% (w/v) N a N 3
pH8.0 buffer
Amounts used to orepare 1 litre of buffer:
1 . 21 g
8 . 06g
0.294g
0 . 1g
The pH was adjusted with conc. HC1.
The calcium content was based on Baltz et al ( 1982b) .
Tris
NaCl
CaCl
NalSU
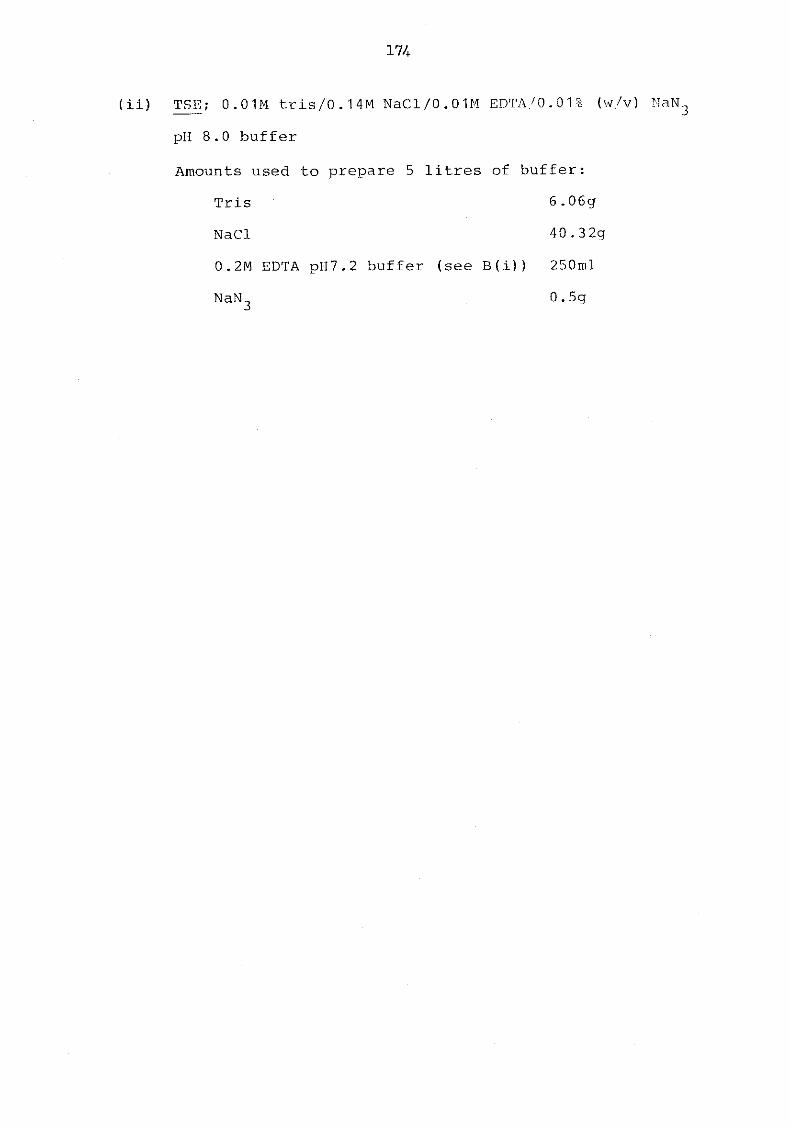
174
(ii) TSE; 0.01M tris/0.14M NaCl/0.01M EDTA/0.01% (w/v) NaN^
pH 8.0 buffer
Amounts used to prepare 5 litres of buffer:
Tris 6.06g
NaCl 40.3 2g
0.2M EDTA pH7.2 buffer (see B(i)) 250ml
NaN 3 0. 5g
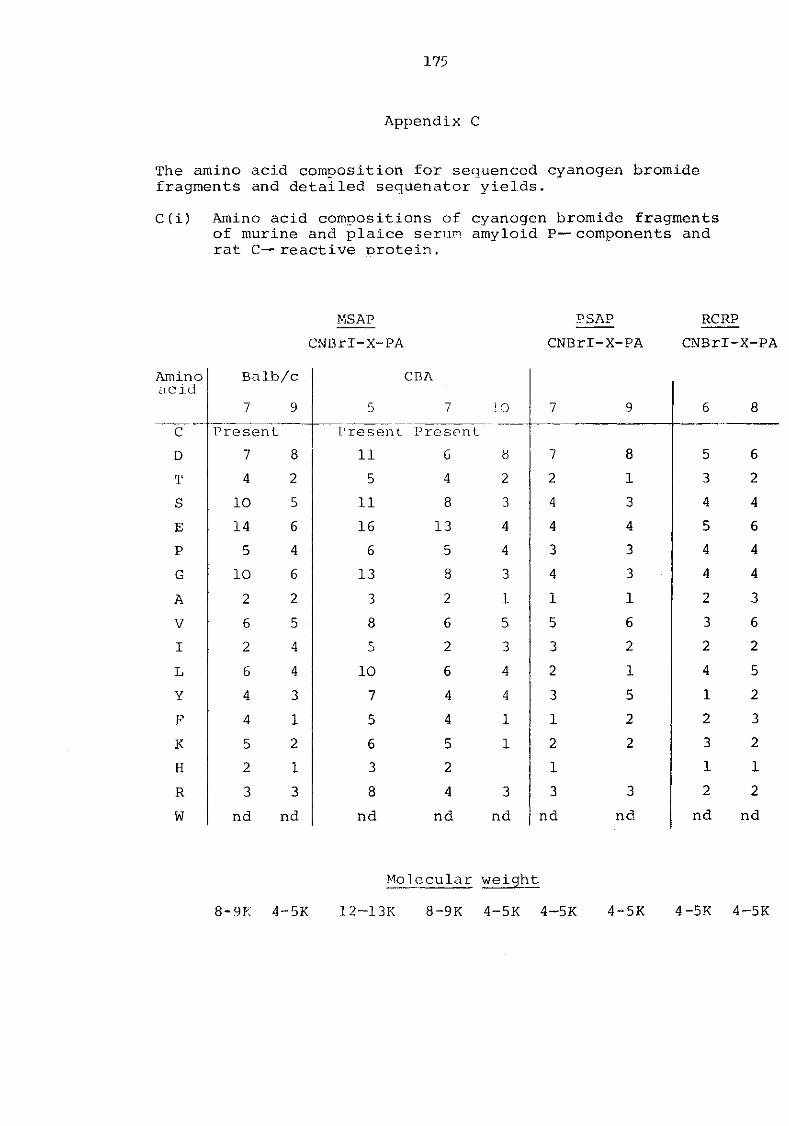
175
Appendix A
The amino acid composition for sequenced cyanogen bromide fragments and detailed sequenator yields.
C(i) Amino acid compositions of cyanogen bromide fragments of murine and plaice serum, amyloid P — components and rat C — reactive protein.
MSAP PSAP RCRP CNBrl-X-PA CNBrl-X-PA CNBrl-X-PA
Amino acid
Balb/c
7 9 5
CBA
7 LO 7 9 6 8 c Present Present Present D 7 8 11 6 8 7 8 5 6 T 4 2 5 4 2 2 1 3 2 S 10 5 11 8 3 4 3 4 4 E 14 6 16 13 4 4 4 5 6 P 5 4 6 5 4 3 3 4 4 G 10 6 13 8 3 4 3 4 4 A 2 2 3 2 1 1 1 2 3 V 6 5 8 6 5 5 6 3 6 I 2 4 5 2 3 3 2 2 2 L 6 4 10 6 4 2 1 4 5 Y 4 3 7 4 4 3 5 1 2 F 4 1 5 4 1 1 2 2 3 K 5 2 6 5 1 2 2 3 2 H 2 1 3 2 1 1 1 R 3 3 8 4 3 3 3 2 2 W nd nd nd nd nd nd nd nd nd
Mo lecular weight
8-9K 4 -5K 12-13K 8-9K 4-5K 4-5K 4-5K 4-5K 4-51
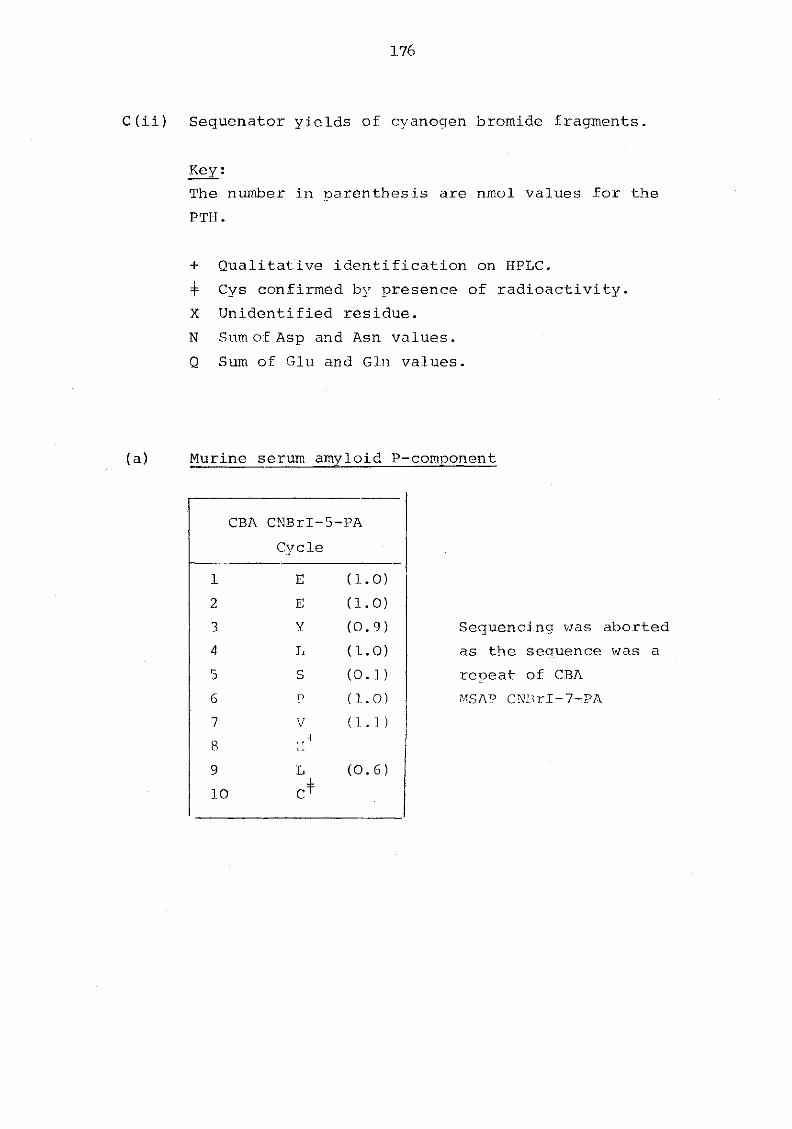
176
C(ii) Sequenator yields of cyanogen bromide fragments.
Key: The number in parenthesis are nmol values for the PTH.
+ Qualitative identification on HPLC. 4= Cys confirmed by presence of radioactivity. X Unidentified residue. N Sum of Asp and Asn values. Q Sum of Glu and Gin values.
(a) Murine serum amyloid P-component
CBA CNBrI-5-PA Cycle
2
6
1
4
7
3
E (1.0) E (1.0) Y (0.9) L (1.0) S (0.1) P (1.0) V (1.1)
Sequencing was aborted as the secruence was a repeat of CBA MSAP CNBrI-7-PA
8 9 L (0.6) 10
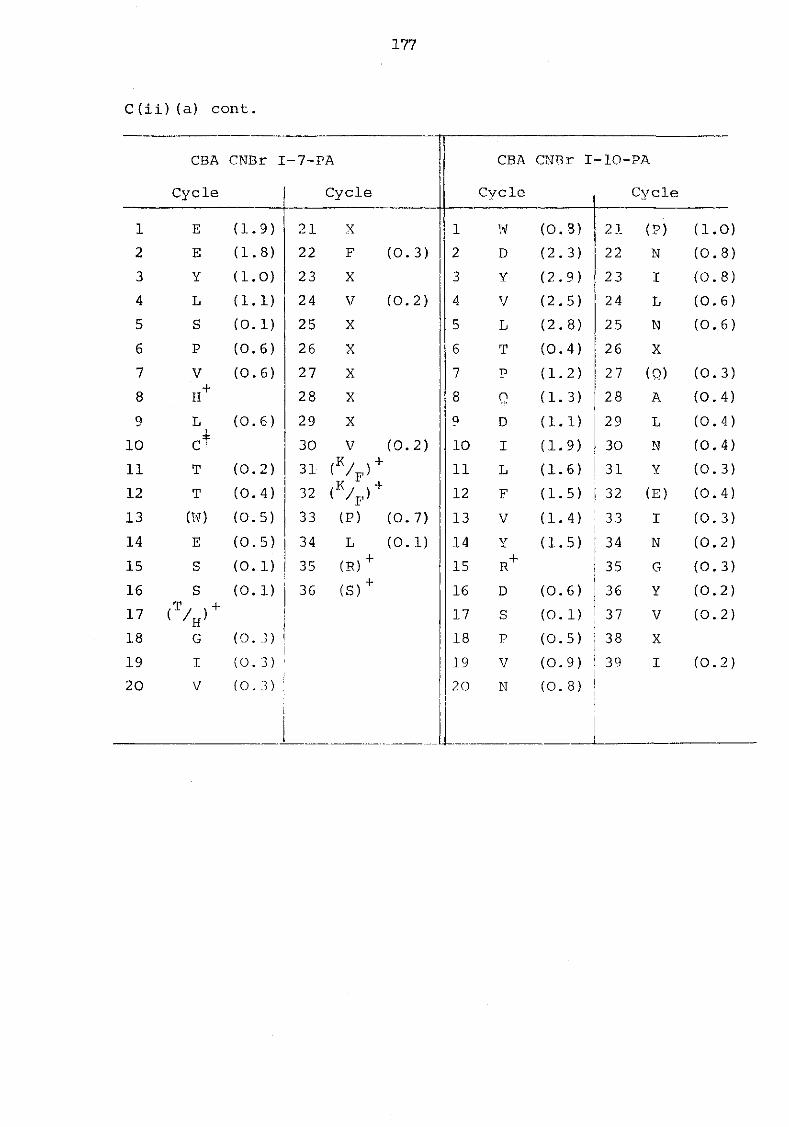
177
C(ii)(a) cont.
CBA
Cycle
CNBr I - 7-PA
Cycle
CBA
Cycle
CNBr I -10--PA
Cycle
1 E (1.9) 21 X 1 W (0.3) 21 ( ? ) (1. 0) 2 E (1.8) 22 F (0. 3) 2 D (2.3) 22 N (0. 8) 3 Y (1.0) 23 X 3 Y (2.9) 23 I (0. 8) 4 L (1.1) 24 V (0. 2) 4 V (2.5) 24 L (0. 6) 5 S (0.1) 25 X 5 L (2.8) 25 N (0. 6) 6 P (0.6) 26 X 6 T (0.4) 26 X 7 V (0.6) 27 X 7 p (1.2) 27 (Q) (0. 3) 8 H + 28 X 8 0 (1.3) 28 A (0. 4) 9 L (0.6) 29 X 9 D (1.1) 29 L (0. 4)
10 c* 30 V (0. 2) 10 I (1.9) 30 N (0. 4) 11 T (0.2) 31 ( V F ) + 11 L (1.6) 31 Y (0. 3) 12 T (0.4) 32 ( K / f ) + 12 F (1.5) 32 (E) (0. 4) 13 (W) (0.5) 33 (P) (0. 7) 13 V (1.4) 33 I (0. 3) 14 E (0.5) 34 L (0. 1) 14 Y (1.5) 34 N (0. 2) 15 S (0.1) 35 + (R) 15 R + 35 G (0. 3) 16 S (0.1) 36 4- 16 D (0.6) 36 Y (0. 2) 17 ( T / ) + 17 S (0. 1) 37 V (0. 2) 18 G (0. 3) 18 P (0.5) 38 X 19 I (0. 3) 19 V (0.9) 39 I (0. 2) 20 V (0.3) 20 N (0. 8)
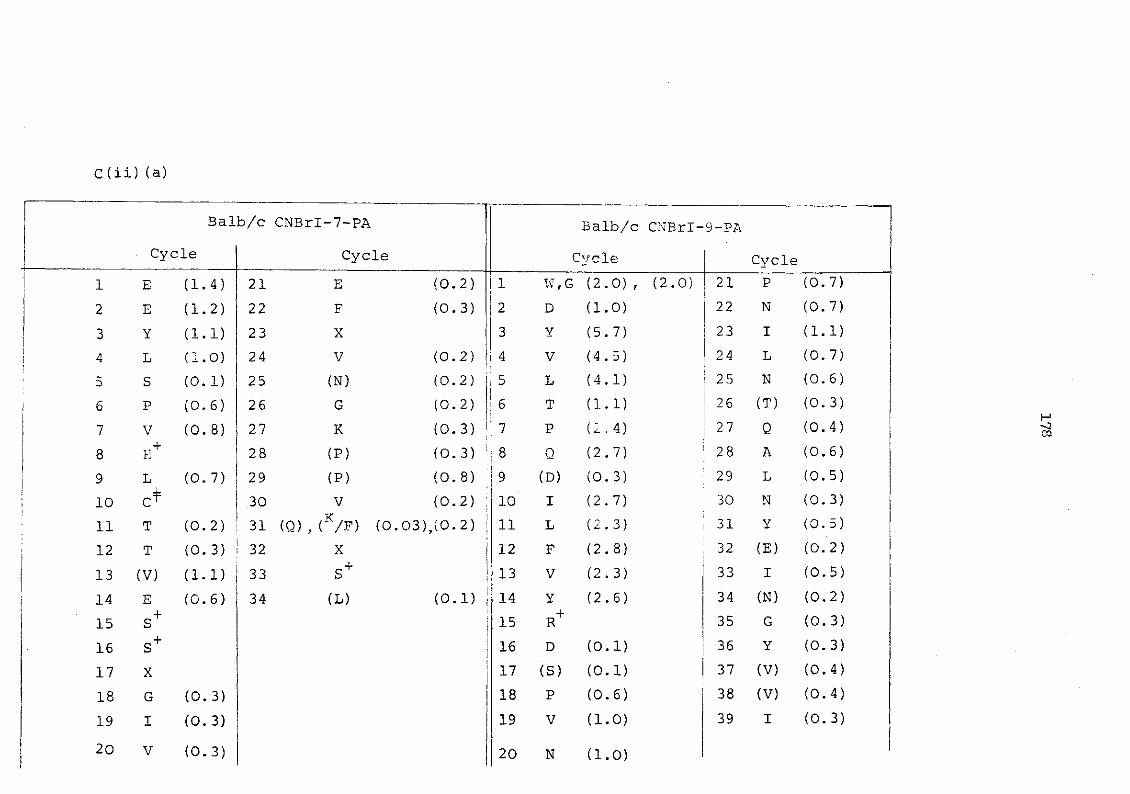
C(ii)(a)
Cycle
Bal b/c CNBrI -7-PA
Cycle Balb/c
Cycle
CNBrl- 9-PA
Cycle 1 E (1. 4) 21 E (0. 2) 1 w, G (2. 0) , (2.0) 21 P (0. 7) 2 E (1. 2) 22 F (0. 3) 2 D (1. 0) 22 N (0. 7) 3 Y (1. 1) 23 X 3 Y (5. 7) 23 I (1. 1) 4 L (1. 0) 24 V (0. 2) 4 V (4. 5) 24 L (0. 7) 5 S (0. 1) 25 (N) (0. 2) 5 L (4. 1) 25 N (0. 6)
| 6 P (0. 6) 26 G (0. 2) 6 T (1. 1) 26 (T) (0. 3) 7 V (0. 8) 27 K (0. 3) | 7 P (2. 4) 27 Q (0. 4) 8 K + 28 (P) (0. 3) ; | 8 Q (2. 7) 28 A (0. 6)
| 9 L (0. 7) 29 (P) (0. 8) ; 9 (D) (0. 3) 29 L (0. 5) 10 C+ 30 V (0. 2) ; 10 I (2. 7) 30 N (0. 3) 11 T (0. 2) 31 (Q) , ( K/F) (0 .03),(0. 2) 11 L (2. 3) 31 Y (0. 5) 12 T (0. 3) 32 X j 12 F (2. 8) 32 (E) (0. 2) 13 (V) (1. 1) 33 s + 1 i i 13 V (2. 3) 33 I (0. 5) 14 E (0. 6) 34 (L) (0. i) 14 Y (2 6) 34 (N) (0. 2) 15 + S i I i 15 R + 35 G (0. 3) 16 + s i ! | 16 D (0 1) 36 Y (0. 3) 17 X 1 17 (S) (0 .1) 37 (V) (0. 4) 18 G (0. 3) 18 P (0 .6) 38 (V) (0. 4) 19 I (0. 3) 19 V (1 .0) 39 I (0. 3)
20 V (0. 3) 20 N (1 .0)
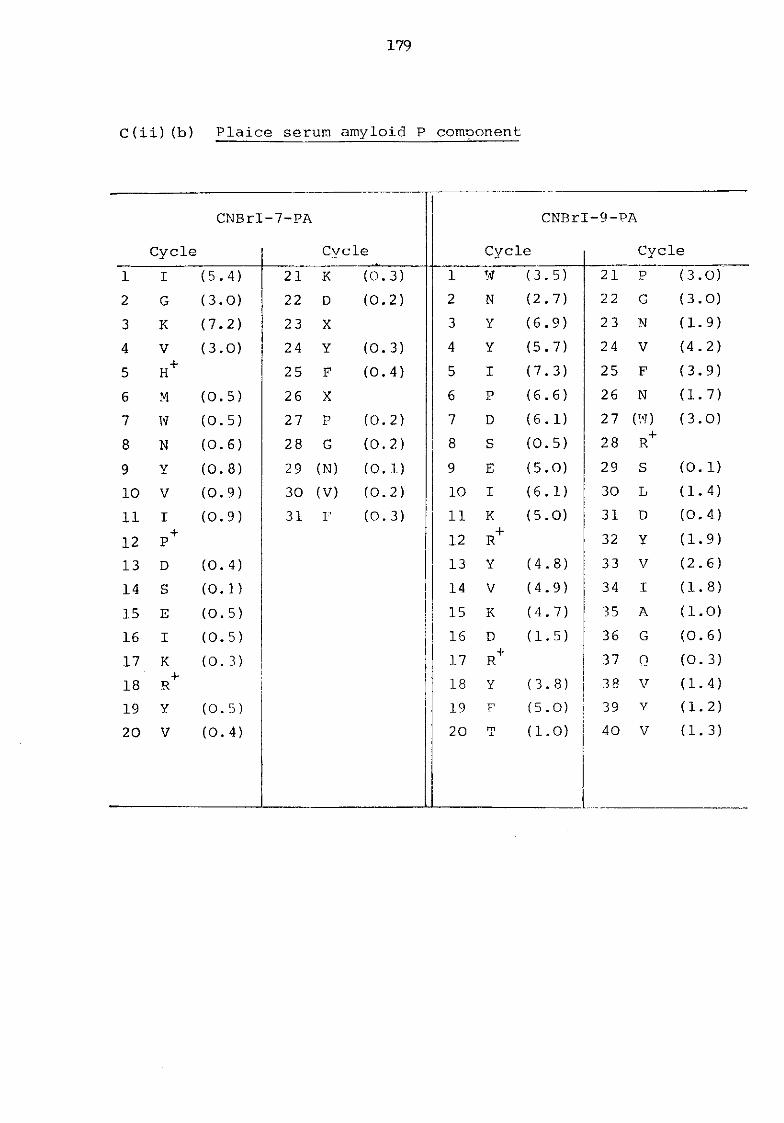
179
C(ii)(b) Plaice serum amyloid P component
CNBrI-7-PA
Cycle Cvcle
CNBrI-9-PA
Cycle Cycle 1 2
3 4 5 6
7 8
9 10 11 12 13 14 15 16 17 18 19 20
+
+
(5.4 (3.0 (7.2 (3.0
(0.5 (0.5 (0.6 (0.8 (0.9 (0.9
(0.4 (0. 1 (0.5 (0.5 (0.3
(0. 5 (0.4
21 22
23 24 25 26
27 28
K D X Y F X P G
29 (N) 30 (V) 31 F
(0.3) (0.2)
(0.3) (0.4)
(0.2)
(0.2)
(0.1)
(0.2)
(0.3)
1 2
3 4 5 6
7 8
9 10
11 12 13 14 15 16 17 18
19 20
+
+
3.5) 2.7) 6.9) 5.7) 7.3) 6 . 6 )
6.1) 0.5) 5.0) 6.1) 5.0)
4.8) 4.9) 4 . 7) 1.5)
3.8) 5.0) 1.0)
21 22
23 24 25 26
28
29 30 31 32 33 34 35 36 37 38 39 40
P G N V F N
2 7 (W) + R S L D V V I A G Q
V V V
3.0) 3.0) 1.9) 4.2) 3.9) 1.7) 3.0)
0. 1) 1.4) 0.4) 1.9) 2.6)
1.8)
1.0) 0.6) 0. 3) 1.4) 1.2) 1.3)
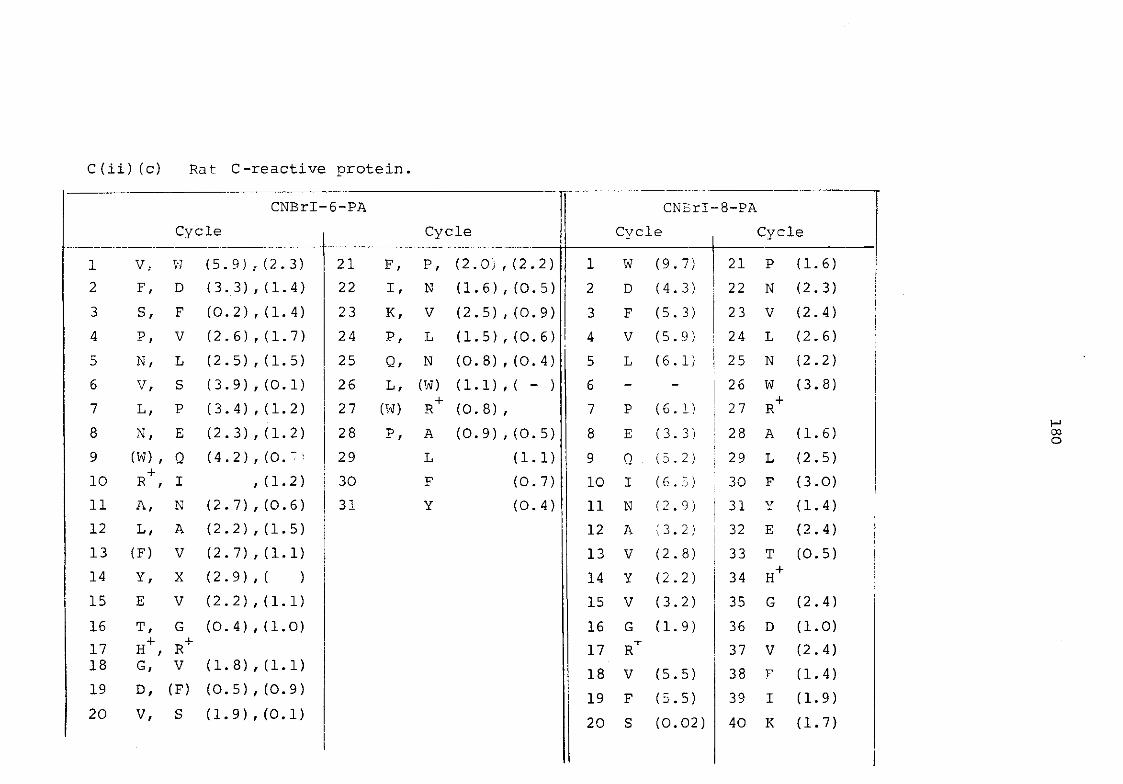
C(ii)(c) Rat C-reactive protein.
CNBrI-6-PA Cycle Cycle
1 V, w (5. 9) (2. 3) 21 F, p, (2. 0) , (2. 2) 2 F, D (3. 3) (1. 4) 22 I r N (1. 6) , (0. 5) 3 s. F (0. 2) (1. 4) 23 K, V (2. 5) , (0. 9) 4 P, V (2. 6) (1. 7) 24 P, L (1. 5) , (0. 6) 5 N, L (2. 5) (1. 5) 25 Qr N (0. 8) , (0. 4) 6 V, S (3. 9) (0. 1) 26 L, (W) (1. 1) ,( - ) 7 L, P (3. 4) (1. 2) 27 (W) R + (0. 8) r
8 N, E (2. 3) (1. 2) 28 p, A (0. 9) , (0. 5) 9 (W) , 0 (4. 2) (0. — 29 L (1. 1) 10 + R , I (1. 2) 30 F (0. 7) 11 A, N (2. 7) (0. 6) 31 Y (0. 4) 12 L, A (2. 2) (1. 5) 13 (F) V (2. 7) (1. 1) 14 Y, X (2. 9) ( ) 15 E V (2. 2) (1. 1) 16 17 18
T, H \ G,
G R +
V
(0.
(1.
4)
8)
(1.
(1.
0)
1) 19 D, (F) (0. 5) (0. 9) 20 v, S (1. 9) (0. 1)
CNBrI-8-PA Cvcle Cycle
1 2
3 4 5 6 7 8
9 10
11 12 13 14 15 16 17 18 19 20
W D F V L
P E 0 I N A V V V G R V F S
+
(9.7) (4.3) (5.3) (5.9) ( 6 . 1 )
( 6 . 1 )
(3.3) (5.2) (6.5) (2.9) (3.2) ( 2 . 8 )
(2.2)
(3.2) (1.9)
(5.5) (5.5) (0.02)
21 22
23 24 25 26 27
30 31 32 33 34 35 36 37 38 39
P N V L N W R" +
28 A 29 L
F V
E T H~ G D V F I
40 K
(1.6) (2.3) (2.4) (2.6)
(2.2)
(3.8)
(1.6)
(2.5) (3.0) (1.4) (2.4) (0.5)
(2.4) (1.0) (2.4) (1.4) (1.9) (1.7)
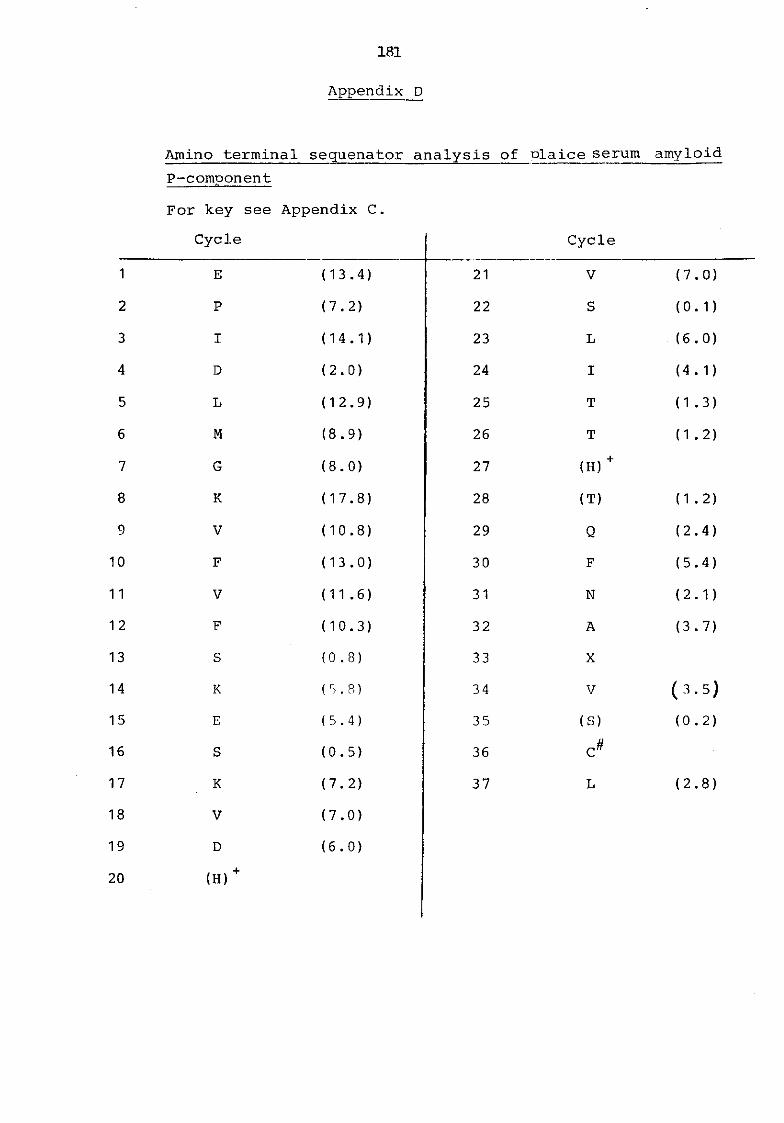
181
Appendix A
Amino terminal sequenator analysis of Plaice serum amyloid P-component For key see Appendix C.
Cycle Cycle
1 E (13.4) 21 V (7.0)
2 P (7.2) 22 S (0.1)
3 I (14.1) 23 L (6.0)
4 D (2.0) 24 I (4.1)
5 L (12.9) 25 T (1.3)
6 M (8.9) 26 T (1.2)
7 G (8.0) 27 (H) +
8 K (17.8) 28 (T) (1.2)
9 V (10.8) 29 Q (2.4)
10 F (13.0) 30 F (5.4)
11 V (11 .6) 31 N (2.1)
12 F (10.3) 32 A (3.7)
13 S (0.8) 33 X
14 K (5.8) 34 V ( 3 . 5 )
15 E (5.4) 35 (S) (0.2)
16 S (0.5) 36
17 K (7.2) 37 L (2.8)
18 V (7.0)
19 D (6.0)
20 (H) +
182
REFERENCES
Abernethy, T.J.,and Avery, O.T. (1941) J. Exp. Med. 73,
173-182
Allen, G. (1981) in Sequencing of Proteins and Peptides.
(Ed. T.S. Work and R.H. Burdon) 199-205. North
Holland Publishing Company
Ambler, R.P. (1967) in Methods in Enzymology Vol. XI
(Ed. C.H.W. Hirs) , 155-166 . Academic Press
Anderson, J.K., Stroud, R.M., and Volanakis, J.E. (1978)
Fed. Proc. 3_7 , 14 95 (Abstract)
Anderson, J.K., Hollaway, W.L.,and Mole, J.E. (1981)
Journal of High Resolution Chromatography and
Chromatography Communications <4, 417-418
Anderson, J.K., and Mole, J.E. ( 1982) Ann. N.Y. Acad.
Sci. 389, 216-234
Assimeh, S . N v a n d Painter, R.H. (1975) J. Immunology 115,
482-487
Bach, B.A., Gewurz, H., and Osmand, A.P. (1 977) Immuno-
chemis t ry J_4 , 215-219
Baldo, B.A., and Fletcher, T.C. ( 1 973) Nature 246 , 145-146
Baltz, M.L., Gomel/, K., Davies, A.J.S., Evans, D.J.,
Klauss, G.G.B., and Pepys, M.B. (1 980) Clin. Exp.
Immunol. 39_, 355-360
Baltz, M.L., de Beer, F.C., Feinstein, A., Munn, E.A.,
Milstein, C.P., Fletcher, T.C., March, J.F., Taylor, J.
Bruton, C., Clamp, J.R., Davies, A . J . S v a n d Pepys, M.B.
(1982a) Ann. N.Y. Acad. Sci. 389, 49-75
Baltz, M.L. , de Beer, F.C., Feistein, A., and Pepys, M.B.
(1982b) Biochim. Biophys. Acta 701, 229-236
Baum, L.L., James, K .I<. , Glaviano, R . R V and Gewurz, H.
(1983) J. Exp. Med. 157, 301-311
Beaven, G.H., and Holiday, E.R. (1952) Advances in Pro-
tein Chemistry 7, 319-386
Bhown, A.S., Mole, J.E., and Bennett, J.C. ( 1982) in
Methods in Protein Sequence Analysis ("Ed. M. Elzinga)
119-130. Humana
Bladen, H.A., Nylen, M.U.,and Glenner, G.G. (1966)
J. Ultrastruct. Res. 1_4, 449-459
Bornstein, P., and Balian, G. ( 1977) in Methods in
Enzymology Vol. XLVII (Ed. C.H.W. Hirs and
S.N. Timasheff) 132-145, Academic Press
Breathnach, S.M., Melrose, S.M., Bhogal, B., de Beer, F.C.
Dyck , R. F . , Tennent, G., Black, M.M., and Pepys, M.B.
(1981) Nature, 293/ 652-654
Brundish, D.E.,and Baddiley, J. (1968) Biochem. J. 1_10,
573-582
Bruton, C.J.; and Hartley, B.S. (1970) J. Mol. Biol. 52,
165-178
Cabana, V.G., Gewurz, H.,and Siegel , S.N. (1982)
J. Immunol. 128, 2342-2348
Carlson, D.M. (1968) J. Biol. Chem. 243, 616-626
Cathcart, E.S., Comorford, F.R., and Cohen, A.S. (1965)
New Engl. J. Med. 273, 143-146
Clamp, J.R. ( 1977) Biochemical Society Transactions 5_,
1693-1695
Coe, J.E., Margossian, S.S., Slayter, M.S.,and Sogn, J.A.
(1981) J. Exp. Med. 153/ 977-991
Coe, J.E. (198 2) Ann. N.Y. Acad. Sci. 389, 299-30 7
Cohen, A.S., Shirahama, T., Sipe, J.D., and Skinner, M.
(1983) Laboratory Investigation 48, 1-4
Colten, H.R. (1976) Advances in Immunology 22, 6 7-118
Cooper, N.R., and Ziccardi, J.R. ( 1979) Molec. Immunol. 16,
821-827
Das, B.C., Gero, S.D., and Lederer, E. (1967) Biochem. Biophys.
Res. Comms. 29, 211-215
Dayhoff, M.O., Eck, R'.V. , and Park, C.M. (1 976) in Atlas of Pro-
tein Structure 5, 22 (Ed. M.O. Dayhoff, The National
Biomedical Research Foundation)
de Beer, F.C., Baltz, M.L., Holford, S., Feinstein, A., and
Pepys, M.B. (1981) J. Exp. Med. 1_54 , 1 1 34-1 149
de Beer, F.C. and Pepys, M.B. (1982) J. Immunol. Methods 5£, 17-31
de Beer, F.C., Baltz, M.L., Munn, E.A., Feinstein, A., Taylor, J.,
Bruton, C., Clamp, J.R., and Pepys, M.B. (198 2a) Immunology
45, 55-70
de Beer, F.C. Soutar, A.K., Baltz, M.L., Trayner, I.M., Feinstein,
A., and Pepys, M.B. (1982b) J. Exp. Med. 156, 230-242
Drapeau, G.R. (1977) Methods in Enzymology Vol. VLVII (Eds.
C.H.W. Ilirs and S.N. Timasheff) 189-191. Academic Press
Dyck, R.F., Kershaw, M. , McHugh, N., and Pepys, M.B. ( 1980a) in
Amyloid and Amyloidosis (Eds. G.G. Glenner, P. Pinho,
E. Costa and F. Do Freitas) , 50-54. Excerpta Medica,
Amsterdam
Dyck, R.F., Lockwood, C.M., Turner, D., Evans, D.J., Rees, A.J.,
and Pepys, M.B. ( 1980b) Lancet ijl, 606-609
Fernandez-Moran, H., Marchalonis, J.J., and Edelman, G.M. (1968)
J. Mol. Biol. 32, 467-469
Finland, M., and Dowling, H.F. (1935) J. Immunol. 29, 238-289
Fletcher, T.C., and Baldo, B.A. (1974) Science 185, 360-361
Fletcher, T.C., White, A., and Baldo, B.A. (1980) Parasite
Immunology 2, 237-248
Fletcher, T.C., White, A., Youngson, A., Pusztai, A., and
Baldo, B.A. (1981) Biochim. Biophys. Acta 671, 44-49
185
Francis, T., and Abernethy, T.J. (1934) J. Clin. Invest.
13, 692
Gabriel, O. (1970) in Methods in Enzymology Vol. XXII
(Ed. W.B. Jakoby) , 565-578 , Academic Press
Gahmberg, G.G.,and Andersson, L.C. (1978) J. Exp. Med.
148, 50 7-5 21
Glenner, G.G. (1980a) New Engl. J. Med. 302, 1283-1292
Gleaner, G.G. ( 1980b) New Engl. J. Med. 302, 1333-1343
Goodwin, T.W., and Morton, R.A. (1 946 ) Biochem. J. 40,
628-632
Gordon, A.H. (1976) in "Plasma Protein Turnover" (Eds.
R. Bianchi, G. Mariani and A.S. MacFarlane), 381-394,
Macmillan Press Ltd., London
Gotschlich , E . C a n d Edelman, G.M. ( 1 967) Proc. Nat.
Acad. Sci. 57, 706-712
Gotschlich, E.C.^and Liu, T.Y. (1967) J. Biol. Chem. 242,
463-470
Gray, W.R. (1967) in Methods in Enzymology Vol. XI (Ed.
C.H.W. Kirs), 139-151. Academic Press
Gray, W.R. (1972) in Methods in Enzymology Vol. XXV
(Ed. C.H.W. Hirs and S.N. Timasheff), 121-138.
Academic Press
Gross, E. (1967) in Methods in Enzymology Vol. XI
(Ed. C.H.W. Hirs) , 238-255 . Academic Press
Gross, E a n d Witkop, B. ( 1962) J. Biol. Chem. 23 7 ,
1856-1860
Grossmann, H.,and Neville, D.M. (1971) J. Biol. Chem. 246,
6339-6346
Hamilton, P.B. (1963) Analyt. Chem. 35, 2055-2064
186
Hartley, B.S. (1970) Biochem. J. 1V9, 805-822
Haupt, H., Heimburger, N., Kranz, T.,and Baudner, S. (1972)
Hoppe-Seyler's Z. Physiol. Chem. 353, 1841-1849
Hayashi, R. (1977) in Methods in Enzymology Vol. VLVII
(Eds. C.H.W. Hirs and S.N. Timasheff), 84-93.
Academic Press
Hedlund, P. ( 1947) Acta. Med. Scand. 128 (Supp. 196) ,
579-601
Heidelberger, M. , Gotschlich, E.C.^and Higginbotham, J.D.
(1972) Carbohydr. Res. 22, 1-4
Hill, R.L. (1965) Adv. in Protein Chemistry 20 , 37-107
Hirs, C.H.W. (1967) in Methods in Enzymology Vol. XI
(Ed. C.H.W. Hirs), 197-199. Academic Press
Hufford, D.C., and Morgan, P.N. (1981) Proc. Soc. Exp.
Biol. Med. 1_67 , 493-497
Hunt, E a n d Morris, H.R. ( 1973) Biochem. J. 13J3, 833-843
Hurlimann, J., Thorbecke, G v a n d Hochwald, G. (1 966)
J. Exp. Med. J_23 , 365-378
Hutchcraft, C., Gewurz, H., Hansen, B., Dyck, R.F. and
Pepys, M.B. (1981) J. Immunology E2 6 , 1217-1219
IUPAC-IUB (1968) J. Biol. Chem. 243, 3557-3559
James, K., Baum, L.L., Vetter, M.L. ?and Gewurz, H. (198 2)
Ann. N.Y. Acad. Sci. 389, 274-285
Kaplan, M.H.,and Volanakis, J.E. ( 1 974) J. Immunol. 1_12,
2135-2147
Kindmark, C.O. ( 1 969) Clinica Chemica Acta 26_, 95-98
Kindmark, C.O. (1976) in "Plasma Protein Turnover" (Eds.
R. Bianchi, G. Mariani and A.S. MacFarlane), 395-402
Macmillan Press, London
Kisilevskv, R. , Axelrad, ii. , Corbett, W. , Brunet, S. and
Scott, F. ( 1977) Laboratory Investigation 37 , 544-553
187
Klotz, I.M. (1967) in Methods in Enzymology Vol. XI
(Ed. C.H.W. Hirs) , 576-580. Academic Press
Koj, A. (1974) in "Structure and Function of Plasma
Proteins" (Ed. A.C. Allison) 73-125. Plenum Press,
London
Kornfield, R.^and Kornfield, S. (1980) in The Biochemistry
of Glycoproteins and Proteoglycans (Ed. W.J. Lennarz)
1-34, Plenum Press
Kushner, I., and Feldmann, G. (1978) J. Exp. Med. 148,
466-477
Kushner, I. (1982) Ann. N.Y. Acad. Sci. 389, 39-48
Laemmli, U.K. (1970) Nature 227, 680-685
Laurell, C.B. (1972) Scandinavian Journal of Clinical
and Laboratory Investigation _29 (Supp. 124) , 21-37
Leach, B.S., Collawn, J.F.^and Fish, W.W. (1980)
Biochemistry J_9 , 5734-5741
Levo, Y., Frangione, B.,and Franklin, E.C. (1977) Nature
268, 56-57
Li, S . L v a n d Yanof sky, C. (1972) J. Biol. Chem. 247 ,
10 3 1-10 3 7
Liu, T. Y .,and Gotschlich, E.C. (1963) J. Biol. Chem.
238 , 1928-1934
Liu, T.Y., Robey, R.A., and Wang, C-M. (1982) Ann. N.Y.
Acad. Sci. 389, 151-162
Lofstrom, G. ( 1943) Acta. Med. Scand. , Suppl. 141, 98
Lofstr&n, G. (1944) Br. J. Exp. Path. 25, 21-26
Macleod, C.M.^and Avery, O.T. (1941) J. Exp. Med. 73,
183-190
Margolis, J., and Kenrick, K.G. (1968) Analyt. Biochem.
25, 347-362
Margolis, H.C., Nakagawa, Y., Douglas, K.T.^and Kaiser,
E.T. (1978) J. Biol. Chem. 253, 7891-7897
188
McCarty, M. (1982) Ann. N.Y. Acad. Sci. 389, 1-10
Michl, H. (1951) Monatsch. Chem. ^2, 489-493
Moore, S. (1963) Biochem. J. 238, 235-237
Morley, J.J. 9 and Kushner, I. (198 2) Ann. N.Y. Acad. Sci.
389, 406-418
Morris, H.R.^and Dell, A. ( 1972) in Instrumentation in
Amino Acid Sequence Analysis (Ed. R.N. Perham),
147-191. Academic Press
Morris, H.R., Williams, D.H., and Ambler, R.P. (1971)
Biochem. J. 125, 189-201
Morris, H.R., Dickinson, R.J.^and Williams, D.H. (1973)
Biochem. Biophys. Res. Comm. 5J_, 24 7-255
Nagpurkar, A., and Mookerjea, S. (1981) J. Biol. Chem.
256 , 7440-7448
Nilsson, B.,and Zopf, D. (1982) in Methods in Enzymology
Vol. 8_3 (Ed. V. Ginsberg), 46-58. Academic Press
Oliveira, E.B., Gotschlich, E.C.,and Liu, T.Y. (1977)
Proc. Nat. Acad. Sci. (USA) 74, 3148-3151
Oliveira, E.B., Gotschlich, E.C.,and Liu, T.Y. (1979)
J. Biol. Chem. 25±, 489-502
Oliveira, E.B., Gotschlich, E.C.,and Liu, T.Y. (1980)
J. Immunol. 124, 1396-1402
Osmand, A.P., Friendenson, B., Gewurz, A., Painter, R.H.,
Hoffmann, T.,and Shelton, E. (1977a) Proc. Nat.
Acad. Sci. (USA) 74, 739-743
Osmand, A.P., Gewurz, H v and Friendenson, B. (1977b)
Proc. Nat. Acad. Sci. (USA) 7_4 , 1214-1218
Painter, R.H. (1977) J. Immunol. 119, 2203-2205
Patterson, L.T.,and Higginbotham, R.D. (1965) J. Bacteriol.
90, 1520-1524
189
Peltola, H. 0. (1982) Lancet i, 980-983
Pepys, M.3. (1979) Immunology 37, 637-641
Pepys, M.B. (1981a) Clinics in Immunology and Allergy 77-101
Pepys, M.B. (1981b) Lancet i, 653-657
Pepys, M.B., and Baltz, M.L. (1983) Adv. in Immunol. In press
Pepys, X ./ and Longbottom, J.L. (1971) International Archives
of Allergy and Applied Immunology 219-221
Pepys, M.B.,- Dash, A.C., and Ashley, J. (1977a) Clin. Exp.
Immunol. 3_0, 3 2-3 7
Pepys, M.B., Dash, A.C., Munn, E.A., Feinstein, A., Skinner, M. ,
Cohen, A.S., Gewurz, H., Osmand, A.P., and Painter, R.H.
(1977b) Lancet i, 1029-1031
Pepys, M.B., Dash, A.C., Fletcher, T.C., Richardson, N.,
Munn, E.A., and Feinstein, A. (1978a) Nature 273,
168-170
Pepys, M.B. , Dash, A.C., Markham, R.E., Thomas, H.C., Williams,
B.D., and Potrie, A. (1978b) Clin. Exp. Immunol. 32,
119-124
Pepys, M.B., Baltz, M.L., Gomer, K., Davies, A.J.S., and
Doenhoff, M. ( 1979a) Nature 278 , 259-261
Pepys, M.B., Dyck , R.F., de Beer, F.C., Skinner, M. , and
Cohen, A.S. (1979b) Clin. Exp. Immunol. 3<8, 2RA-293
Pepys, M.B., Baltz, M.L., Dyck, R.F., de Beer, F.C.,
Evans, D.J., Feinstein, A., Milstein, C.P., Munn, E.A.,
Richardson, N., March, J., Fletcher, T.C., Davies, A.J.S.,
Gomer, K., Cohen, A.S., Skinner, M. , and Klaus, G.G.B.
(1980) in "Amyloid and Amyloidosis", (Eds. G.G. Glenner,
190
P. Pinho e Costa, and F. de Freistas), 373-383.
Excerpta 24edica, Amsterdam
Pepys, M.B., de Beer, F.C., Milstein, C.P., March, J.F.,
Feinstein, A., Buttress, N., Clamp, J.R., Taylor, J.,
Bruton, C and Fletcher, T.C. (1982a) Biochim.
Biophys. Acta 704 , 1 23-1 33
Pepys, M.B., de Beer, F.C., Dyck, R.F., Baltz, M.L.,
Holford, S., Breathnach, S.M., Black, M.M., Tribe,
C.R., Evans, D.J.^and Feinstein, A. (1982b) Anal.
N.Y. Acad. Sci. 3_89, 286-298
Pinteric , L. , Assimeh, S.N., Kells, D.I.C.^and Painter,
R.H. (1976) J. Immunol. VT7, 79-83
Podell, D.N. 9 and Abraham, G.N. (1978). Biochem. Biophys.
Res. Comm. 8 1 7 6 - 1 8 5
Pontet, M. , D'Asnieres, M.D., Cache, D., Escaig, J v a n d
Engler, R. (1981) Biochim. Biophys. Acta 671 ,
2 0 2 - 2 1 0
Riordan, J.F.^and Giese, R.W. (1977) in Methods in
Enzymology Vol. XLVII (Ed. by C.H.W. Hirs and S.N.
Timasheff), 31-40. Academic Press
Robey, F.A. ;and Liu, T.Y. (1981) J. Biol. Chem. 256,
969-975
Rokushika, S., Ohkawa, T.,and Hatano, H. (1979)
J. Chromatog. 176 , 456-461
Sanger, F. (1949) Biochem. J. 44_, 126-128
Savige, W.E.,and Fontana, A. ( 1 977) in Methods in
Enzymology Vol. XLVII (Eds. C.H.W. Hirs and S.N.
Timasheff), 459-469. Academic Press
Shine, B. , de Beer, F.C. ?and Pepys, M.B. (1981)
Clinica Chimica Acta 117, 13-23
191
Siboo, R. and Kulisek, E. (1978) J. Immunol. Methods 23,
59-67
Siegel, J., Rent, R v a n d Gewurz, H. ( 1974) J. Exp.
Med. V40, 631-647
Siegel, J., Osmand, A.P., Wilson, M.F.,and Gewurz, H.
(197 5) J. Exp. Med. V42, 709-721
Simpson, R.M. Prancan, A., Izzi, J.M.^and Friedel, B.A.
(1982) Immunology 47, 193-202
Skinner, M., Pepys, M.B., Cohen, A.S., Heller, L.M.
and Lian, J.B. (1980) in "Amyloid and Amyloidosis"
(Eds. G.G. Glenner, P. Pinho e Costa and F. de Freitas)
384-391 . Excerpta Medica , Amsterdam
Smith, E.L.jand Stockwell, A. (1954) J. Bioch. Chem.
207 , 501 -51 4
Smith, E.L., Stockwell, A.^and Kimmel, J.R. (1954)
J. Bioch. Chem. 202, 551-556
Smyth, D.G., Stein, W.H. ?and Moore, S. (1963) J. Biol.
Chem. 238, 227-234
Spackman, D.H., Stein, W.H.,and Moore, S. (1958)
Analyt. Chem. 30, 1190-1206
Stewart, T.S., Mendershausen, P.B.,and Ballou, C.E.
(1968) Biochemistry 7, 1843-1854
Thomas, D.W., Das, B.C., Gero, S.D.,and Lederer, E.
(1968) Biochem. Biophys. Res. Comm. 32, 519-525
Thompson, A.R.,and Enfield, D.L. (1978) Biochemistry
27, 4304-4311
Tillet, W.S.,and Francis, Jr., T. (1930) J. Exp. Med.
52, 561-571
Udenfriend, S., Stein, S., Bohlen, P., Dairman, W.,
Leimgruber, W.; and Weigele, M. (1 972) Science 178,
871-872
192:
Vernon, S.E. (1982) Diseases of the Colon and Rectum
25, 728-730
Vol anakis » J.E.^and Kaplan, M.H. (1971) Proc. Soc.
Exp. Biol. Med. 1 3 6, 612-614
Walsh, K. A a n d Brown, J.R. ( 1962) Biochim. Biophys.
Acta 58, 596-598
Weber, K. and Osborn, M. (1975) in The Proteins Vol. I
(Ed. H. Neurath and R.L. Hill) ,179-223. Academic
Press
Whaley, K. (1980) J. Exp. Med. 151, 501-516
White, A., Fletcher, T.C., Towler , C.M.^and Baldo, B.A.
(1978) Comp. Biochem. Phys.iol.6lC, 331-3 36
Williams, M., McCallum, J.^and Dick, H.M. (1982)
J. of Infection 4, 139-147
Winkelhake, J.L., Vodicnik, M.J and Taylor, J.L. ( 1983)
Comp. Biochem. Physiol. 74C , 55-58
Woods, K.R.,and Wang, K. (1967) Biochim. Biophys.
Acta 211, 366-370
Young, N.M.^and Williams, R.E. (1978) J. Immunol. 121,
1893-1898 .
Morris, H.R., Panico, RL » Barber, M., Bordoli, R.S, Sedgwick, R.D., and Tyler, A.N. (1981) Biochem. Biophys. Res. Comm. 101, 623-631.