Embed Size (px)
Citation preview
The Princeton Shape Benchmark
Philip Shilane, Patrick Min, Michael Kazhdan, and Thomas Funkhouser
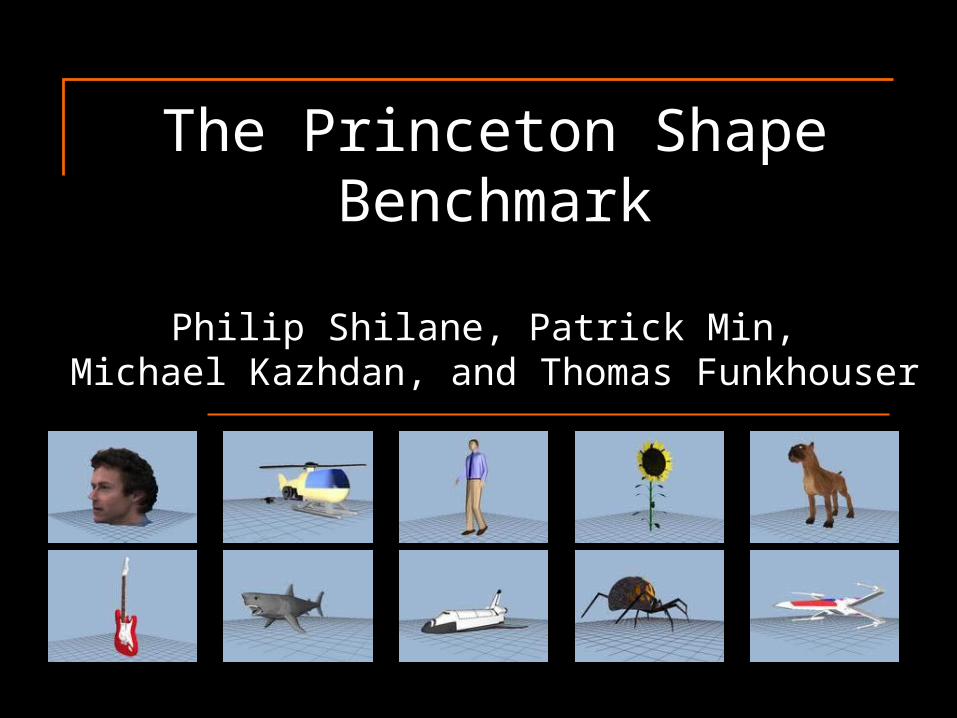
Shape Retrieval Problem
3D Model ShapeDescript
orModel
Database
BestMatche
s
Example Shape Descriptors• D2 Shape Distributions
• Extended Gaussian Image• Shape Histograms• Spherical Extent Function• Spherical Harmonic Descriptor • Light Field Descriptor • etc.

Example Shape Descriptors• D2 Shape Distributions
• Extended Gaussian Image• Shape Histograms• Spherical Extent Function• Spherical Harmonic Descriptor • Light Field Descriptor • etc.
How do we know which is best?
Typical Retrieval Experiment
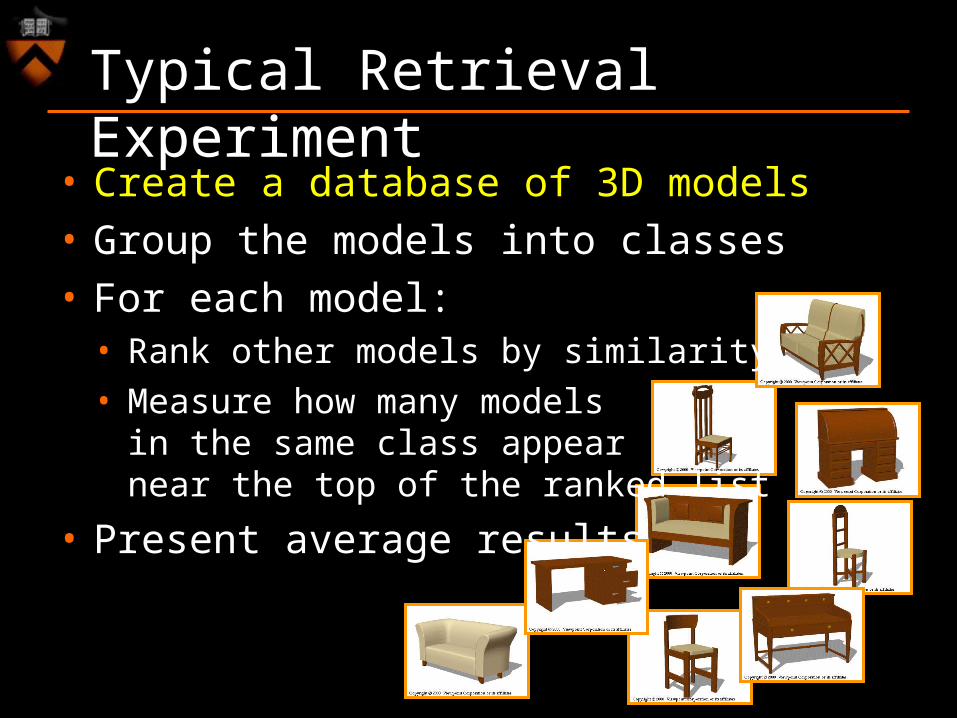
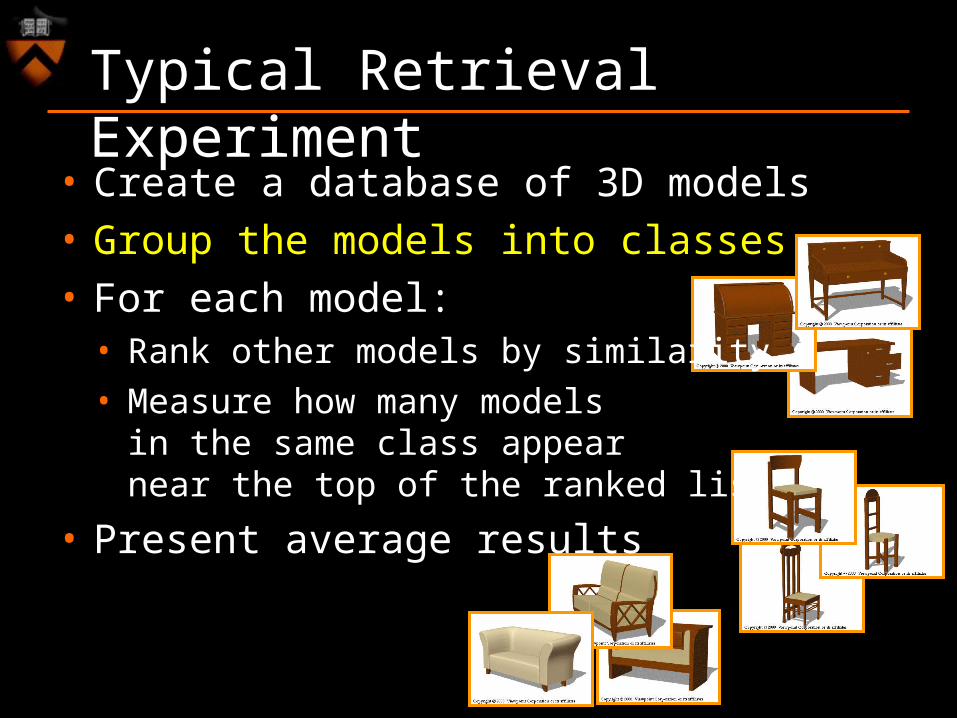
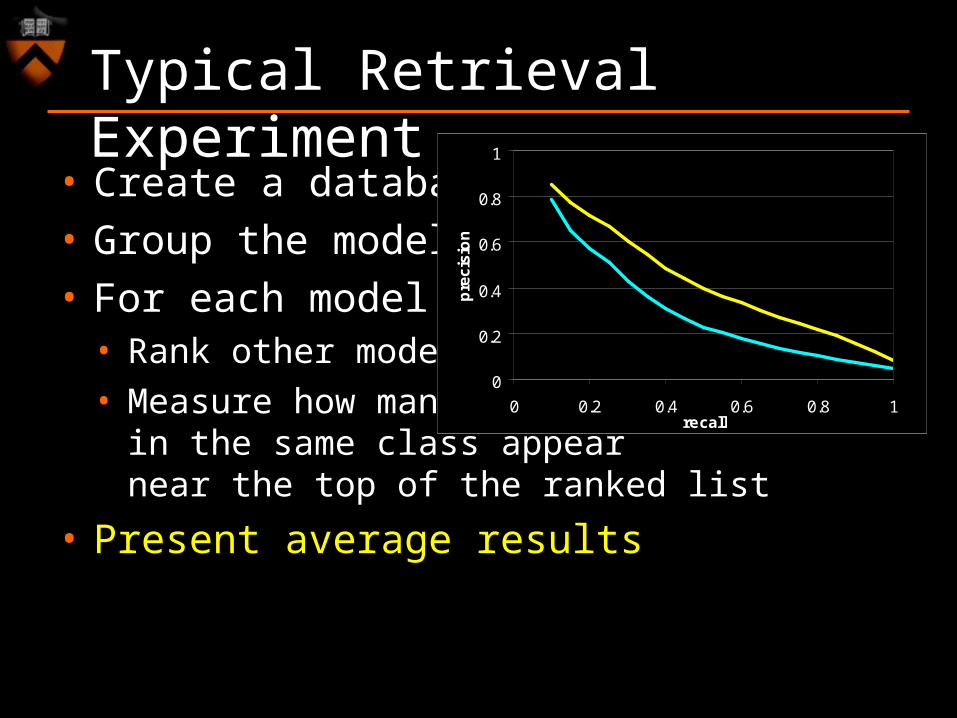
• Create a database of 3D models• Group the models into classes• For each model:
• Rank other models by similarity• Measure how many models
in the same class appear near the top of the ranked list
• Present average results
Typical Retrieval Experiment
• Create a database of 3D models• Group the models into classes• For each model:
• Rank other models by similarity• Measure how many models
in the same class appear near the top of the ranked list
• Present average results
Typical Retrieval Experiment
• Create a database of 3D models• Group the models into classes• For each model:
• Rank other models by similarity• Measure how many models
in the same class appear near the top of the ranked list
• Present average results
Typical Retrieval Experiment
• Create a database of 3D models• Group the models into classes• For each model:
• Rank other models by similarity• Measure how many models
in the same class appear near the top of the ranked list
• Present average resultsQuer
y
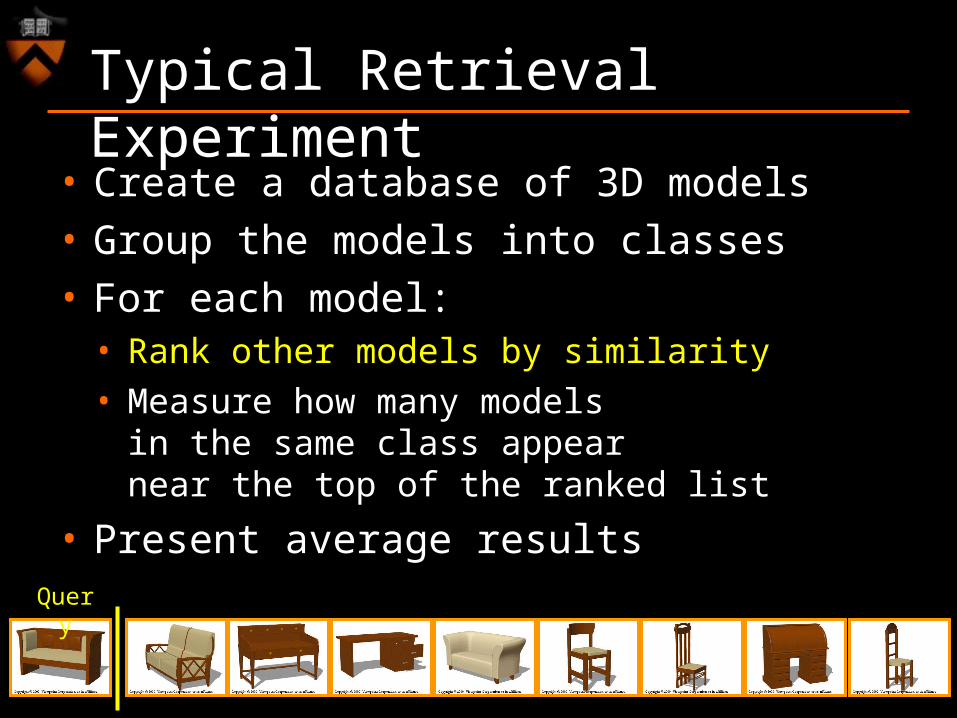
Typical Retrieval Experiment
Query
• Create a database of 3D models• Group the models into classes• For each model:
• Rank other models by similarity• Measure how many models
in the same class appear near the top of the ranked list
• Present average results
0
0.2
0.4
0.6
0.8
1
0 0.2 0.4 0.6 0.8 1recall
pre
cis
ion
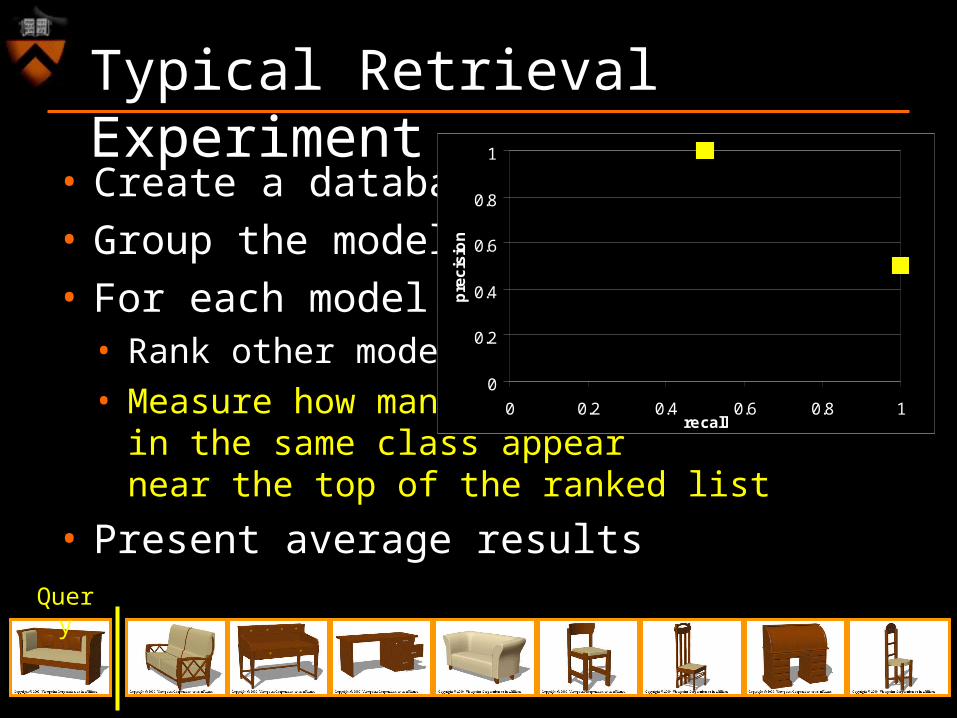
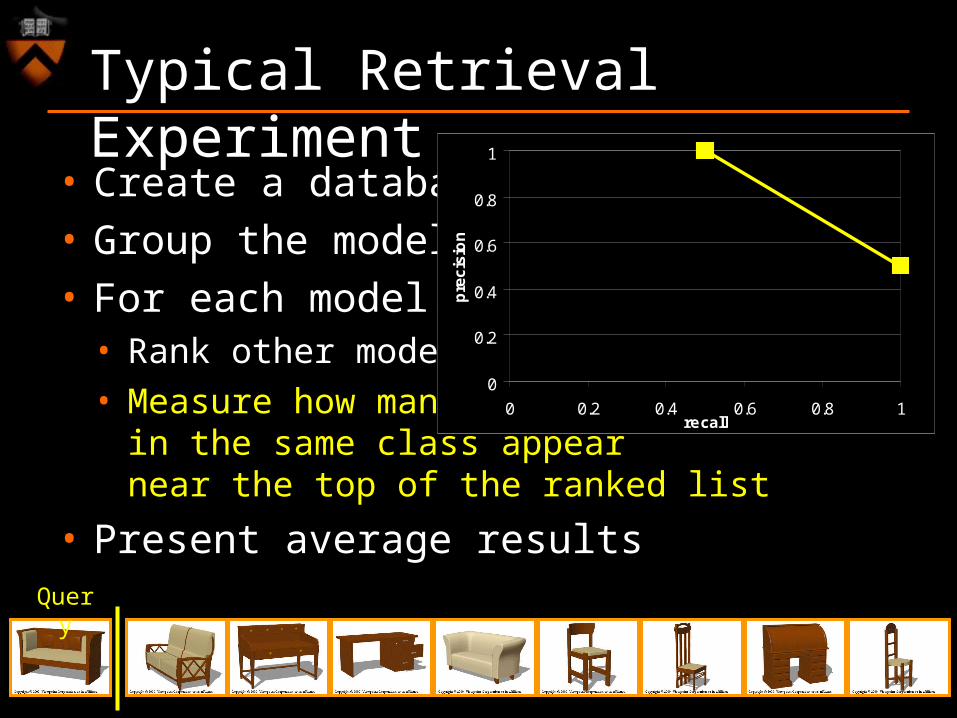
Typical Retrieval Experiment
• Create a database of 3D models• Group the models into classes• For each model:
• Rank other models by similarity• Measure how many models
in the same class appear near the top of the ranked list
• Present average results
0
0.2
0.4
0.6
0.8
1
0 0.2 0.4 0.6 0.8 1recall
pre
cis
ion
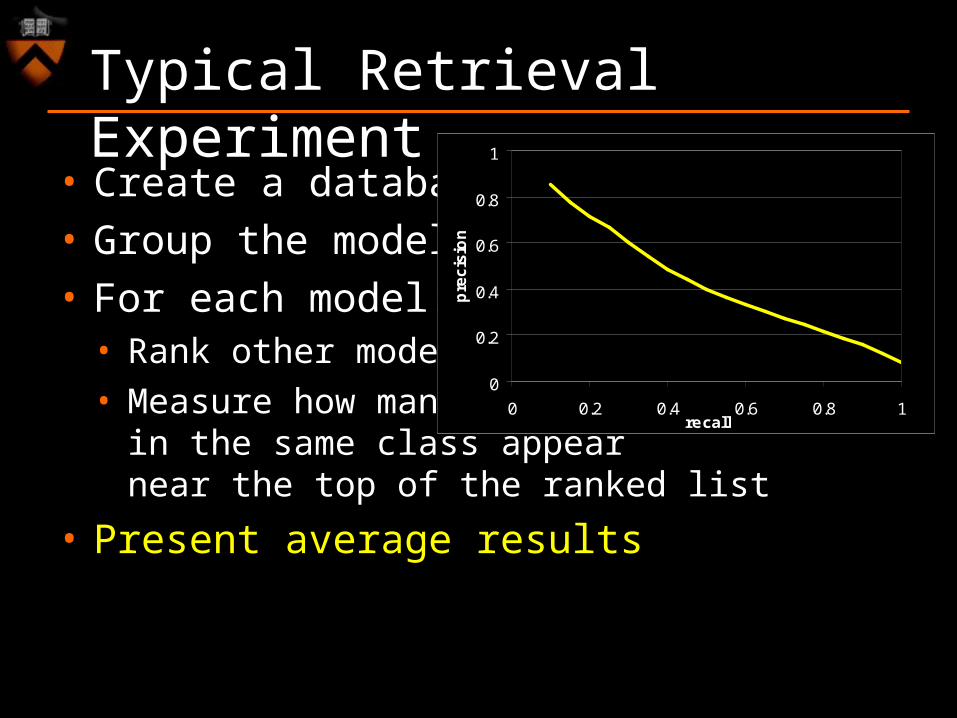
Typical Retrieval Experiment
• Create a database of 3D models• Group the models into classes• For each model:
• Rank other models by similarity• Measure how many models
in the same class appear near the top of the ranked list
• Present average results
0
0.2
0.4
0.6
0.8
1
0 0.2 0.4 0.6 0.8 1recall
pre
cis
ion
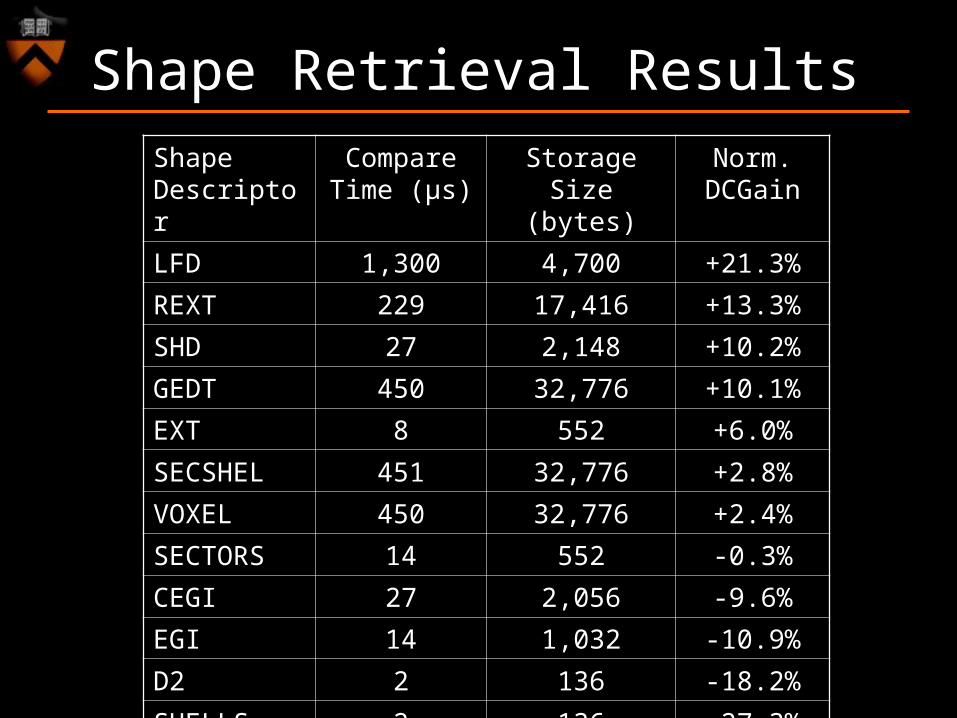
Shape Retrieval ResultsShape Descriptor
CompareTime (µs)
StorageSize (bytes)
Norm.DCGain
LFD 1,300 4,700 +21.3%
REXT 229 17,416 +13.3%
SHD 27 2,148 +10.2%
GEDT 450 32,776 +10.1%
EXT 8 552 +6.0%
SECSHEL 451 32,776 +2.8%
VOXEL 450 32,776 +2.4%
SECTORS 14 552 -0.3%
CEGI 27 2,056 -9.6%
EGI 14 1,032 -10.9%
D2 2 136 -18.2%
SHELLS 2 136 -27.3%
Outline
• Introduction• Related work• Princeton Shape Benchmark• Comparison of 12 descriptors• Evaluation techniques• Results• Conclusion
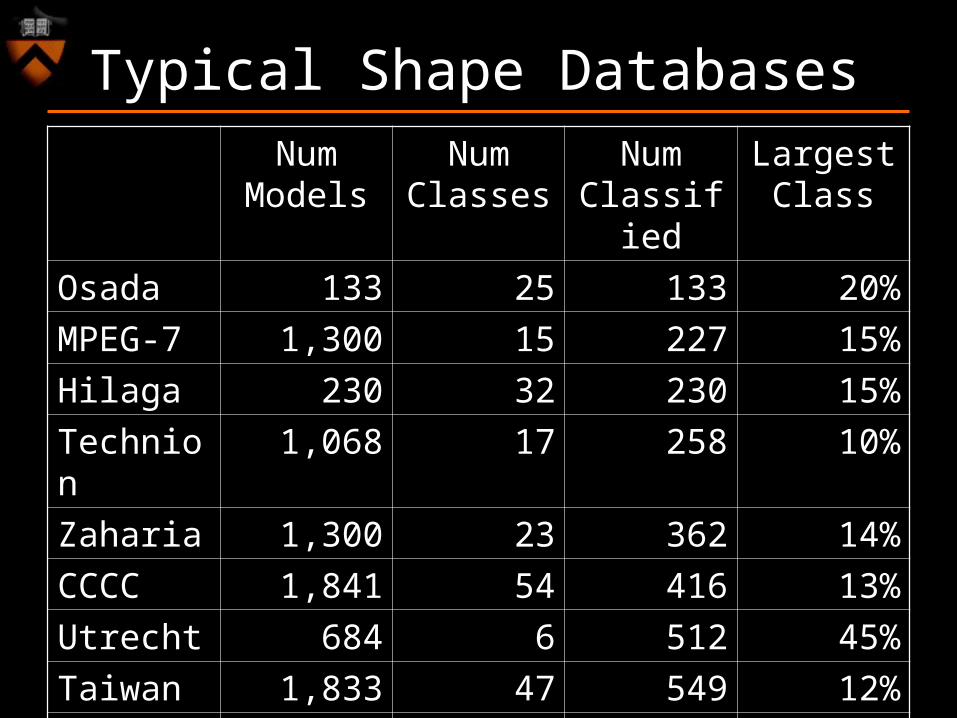
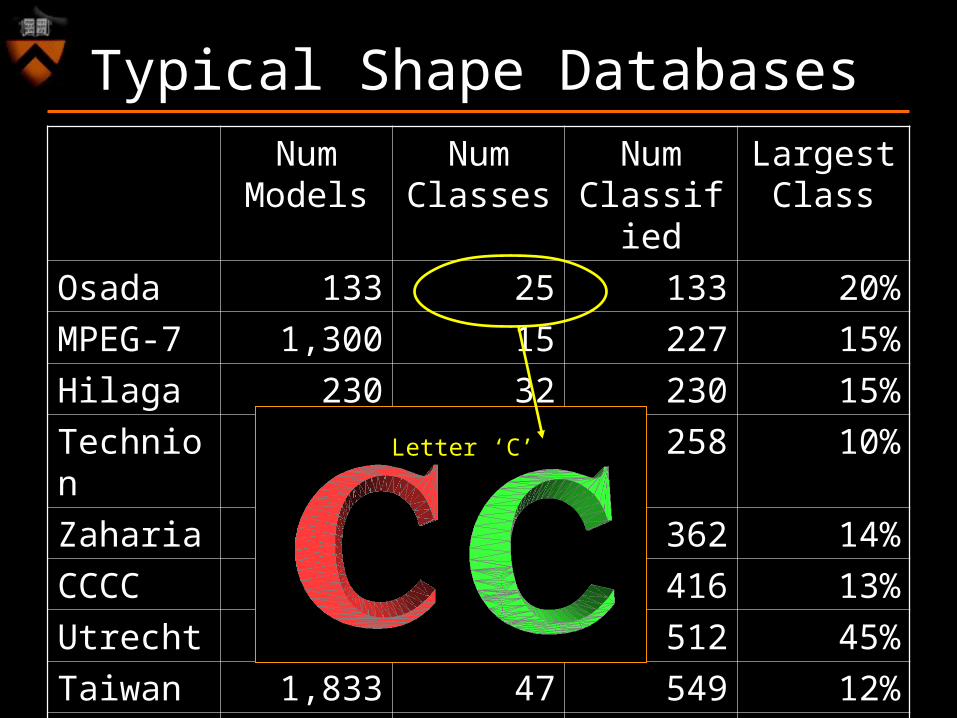
Typical Shape DatabasesNum
ModelsNum
ClassesNum
Classified
Largest Class
Osada 133 25 133 20%
MPEG-7 1,300 15 227 15%
Hilaga 230 32 230 15%
Technion
1,068 17 258 10%
Zaharia 1,300 23 362 14%
CCCC 1,841 54 416 13%
Utrecht 684 6 512 45%
Taiwan 1,833 47 549 12%
Viewpoint
1,890 85 1,280 12%

Typical Shape DatabasesNum
ModelsNum
ClassesNum
Classified
Largest Class
Osada 133 25 133 20%
MPEG-7 1,300 15 227 15%
Hilaga 230 32 230 15%
Technion
1,068 17 258 10%
Zaharia 1,300 23 362 14%
CCCC 1,841 54 416 13%
Utrecht 684 6 512 45%
Taiwan 1,833 47 549 12%
Viewpoint
1,890 85 1,280 12%

Typical Shape DatabasesNum
ModelsNum
ClassesNum
Classified
Largest Class
Osada 133 25 133 20%
MPEG-7 1,300 15 227 15%
Hilaga 230 32 230 15%
Technion
1,068 17 258 10%
Zaharia 1,300 23 362 14%
CCCC 1,841 54 416 13%
Utrecht 684 6 512 45%
Taiwan 1,833 47 549 12%
Viewpoint
1,890 85 1,280 12%
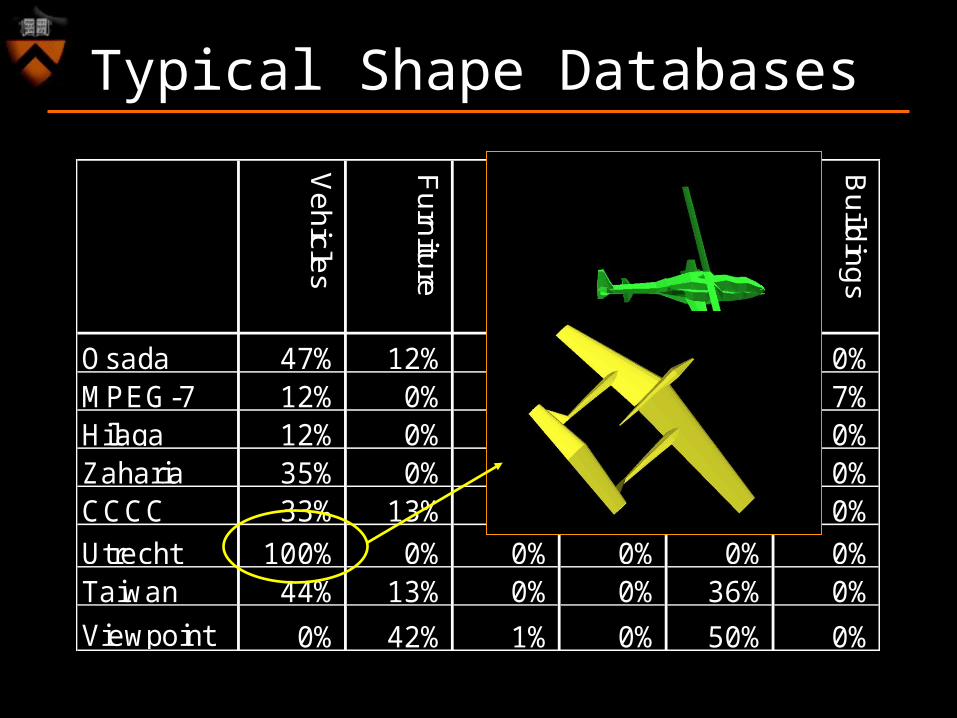
Aerodynamic
Typical Shape DatabasesNum
ModelsNum
ClassesNum
Classified
Largest Class
Osada 133 25 133 20%
MPEG-7 1,300 15 227 15%
Hilaga 230 32 230 15%
Technion
1,068 17 258 10%
Zaharia 1,300 23 362 14%
CCCC 1,841 54 416 13%
Utrecht 684 6 512 45%
Taiwan 1,833 47 549 12%
Viewpoint
1,890 85 1,280 12%
Letter ‘C’

Ve
hicle
s
Fu
rnitu
re
An
ima
ls
Pla
nts
Ho
use
ho
ld
Bu
ildin
gs
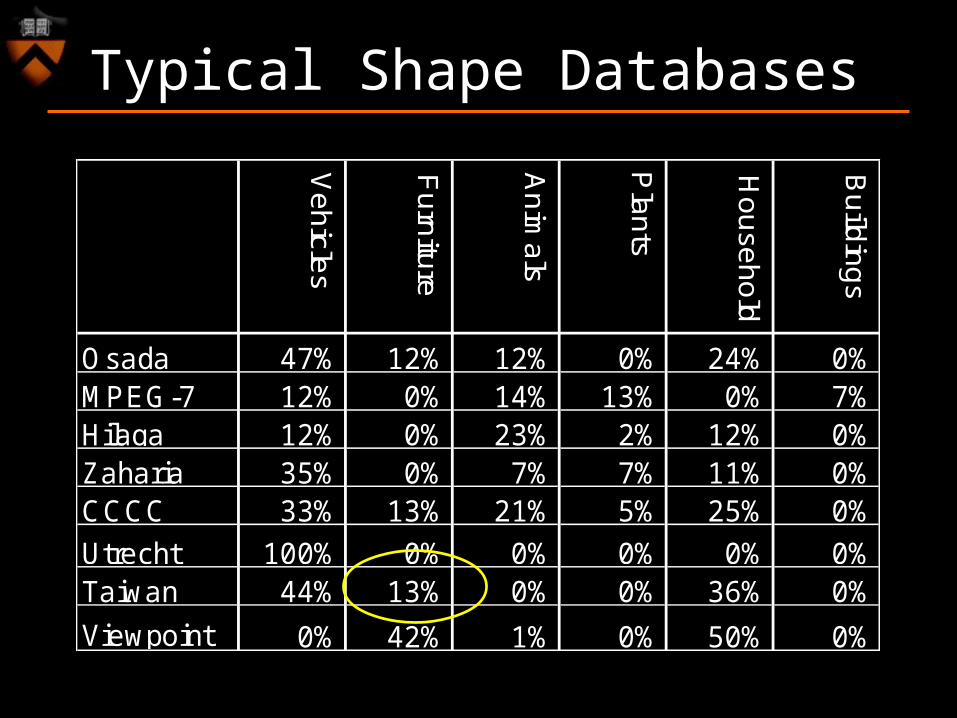
Osada 47% 12% 12% 0% 24% 0%MPEG-7 12% 0% 14% 13% 0% 7%Hilaga 12% 0% 23% 2% 12% 0%Zaharia 35% 0% 7% 7% 11% 0%CCCC 33% 13% 21% 5% 25% 0%
Utrecht 100% 0% 0% 0% 0% 0%Taiwan 44% 13% 0% 0% 36% 0%
Viewpoint 0% 42% 1% 0% 50% 0%
Typical Shape Databases
Ve
hicle
s
Fu
rnitu
re
An
ima
ls
Pla
nts
Ho
use
ho
ld
Bu
ildin
gs
Osada 47% 12% 12% 0% 24% 0%MPEG-7 12% 0% 14% 13% 0% 7%Hilaga 12% 0% 23% 2% 12% 0%Zaharia 35% 0% 7% 7% 11% 0%CCCC 33% 13% 21% 5% 25% 0%
Utrecht 100% 0% 0% 0% 0% 0%Taiwan 44% 13% 0% 0% 36% 0%
Viewpoint 0% 42% 1% 0% 50% 0%
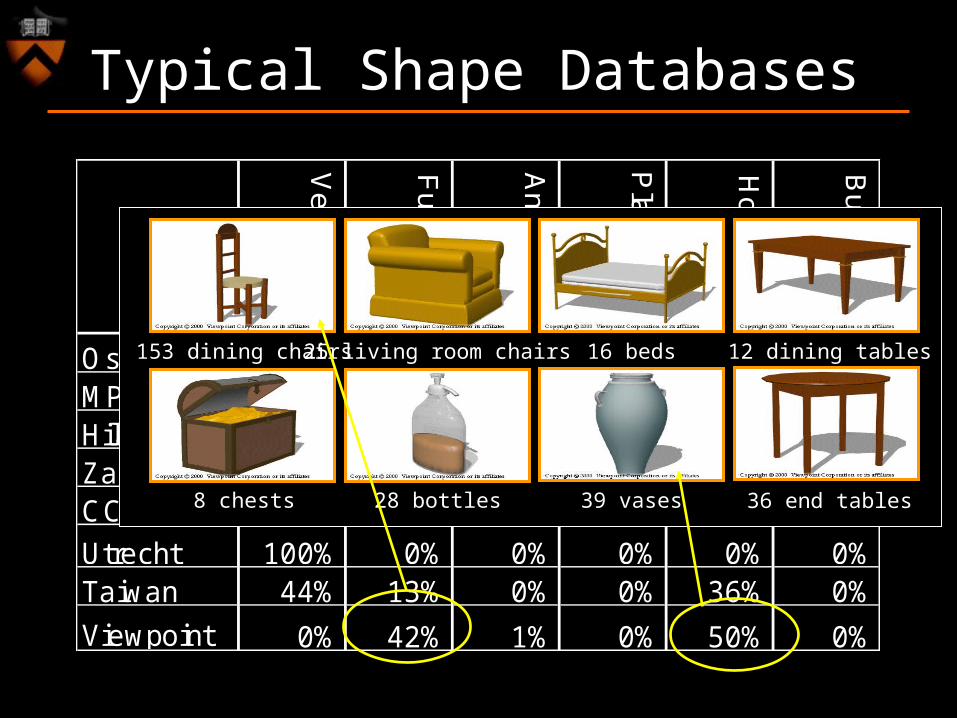
153 dining chairs 25 living room chairs 16 beds 12 dining tables
8 chests 28 bottles 39 vases 36 end tables
Typical Shape Databases
Ve
hicle
s
Fu
rnitu
re
An
ima
ls
Pla
nts
Ho
use
ho
ld
Bu
ildin
gs
Osada 47% 12% 12% 0% 24% 0%MPEG-7 12% 0% 14% 13% 0% 7%Hilaga 12% 0% 23% 2% 12% 0%Zaharia 35% 0% 7% 7% 11% 0%CCCC 33% 13% 21% 5% 25% 0%
Utrecht 100% 0% 0% 0% 0% 0%Taiwan 44% 13% 0% 0% 36% 0%
Viewpoint 0% 42% 1% 0% 50% 0%
Typical Shape Databases
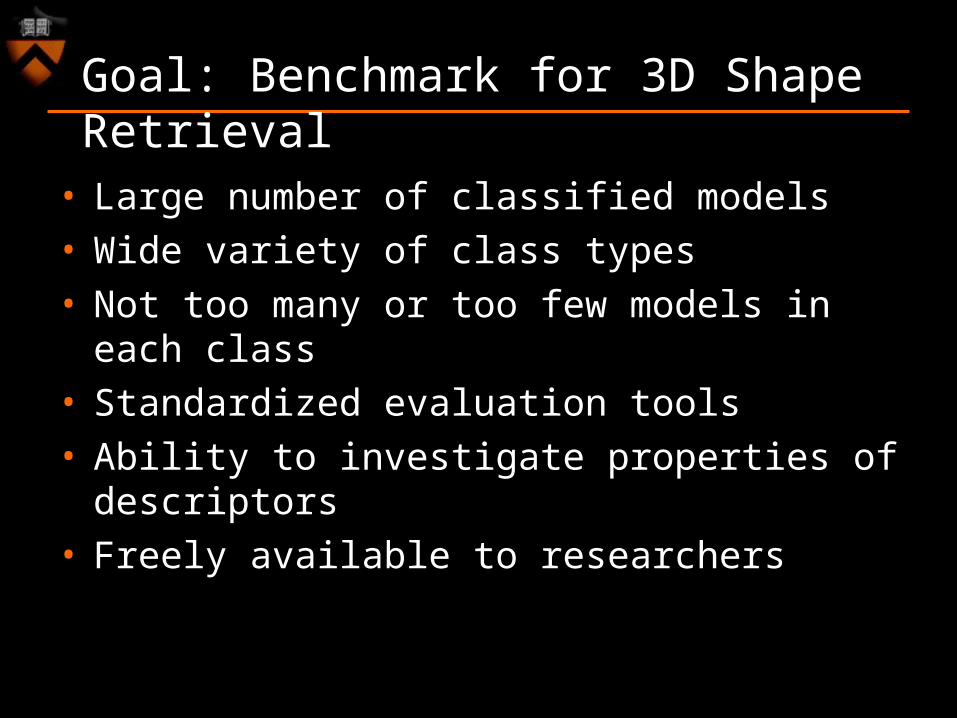
Goal: Benchmark for 3D Shape Retrieval
• Large number of classified models• Wide variety of class types• Not too many or too few models in each
class• Standardized evaluation tools• Ability to investigate properties of
descriptors• Freely available to researchers
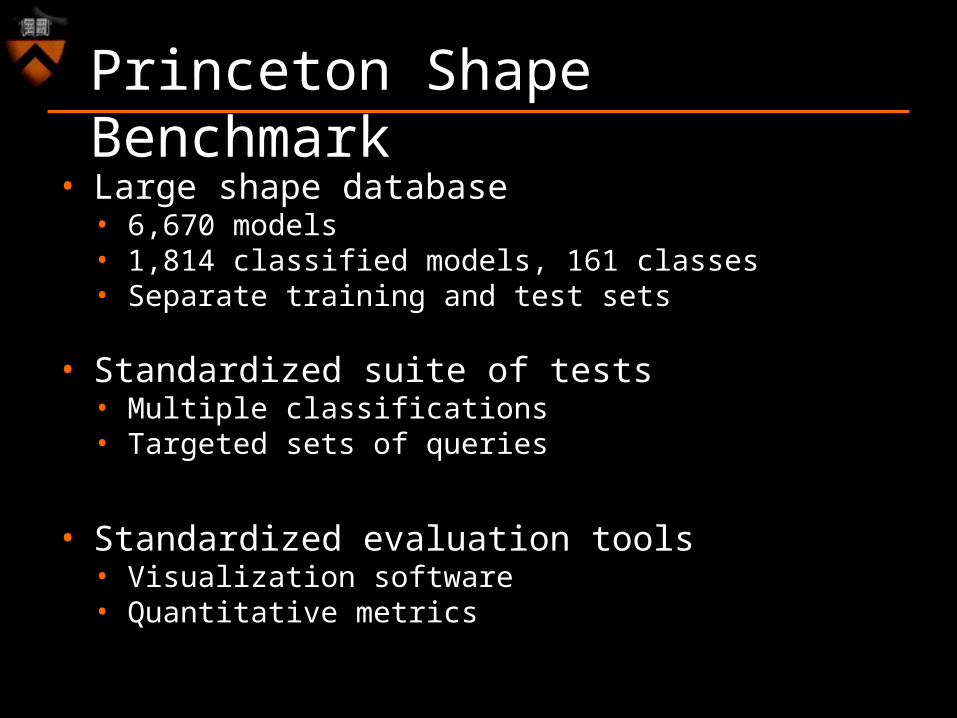
Princeton Shape Benchmark
• Large shape database• 6,670 models• 1,814 classified models, 161 classes• Separate training and test sets
• Standardized suite of tests• Multiple classifications• Targeted sets of queries
• Standardized evaluation tools • Visualization software• Quantitative metrics
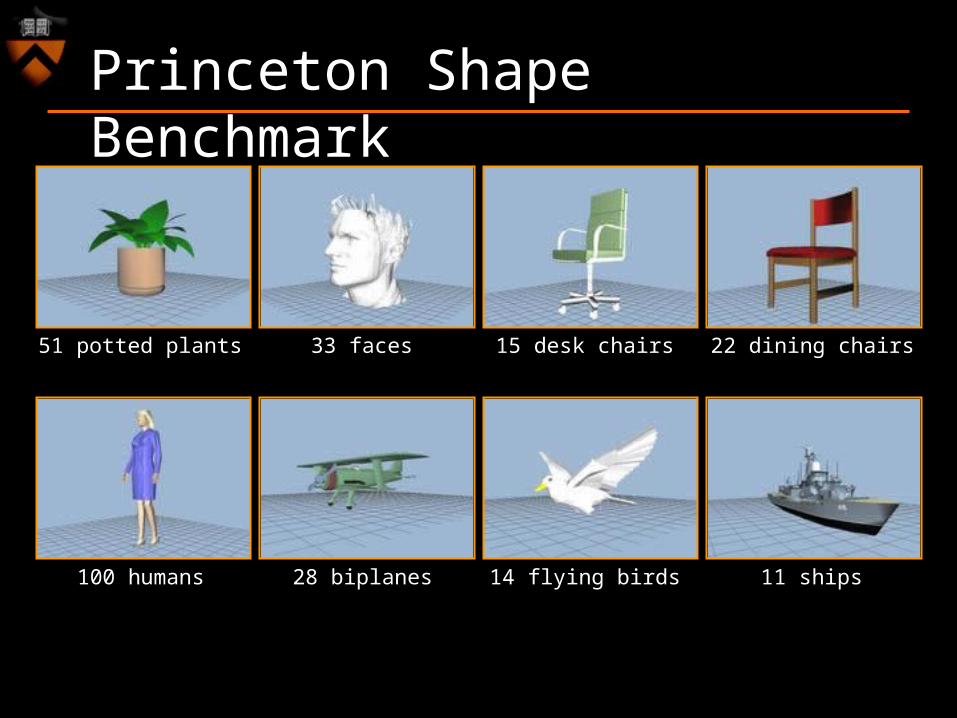
Princeton Shape Benchmark
51 potted plants 33 faces 15 desk chairs 22 dining chairs
100 humans 28 biplanes 14 flying birds 11 ships
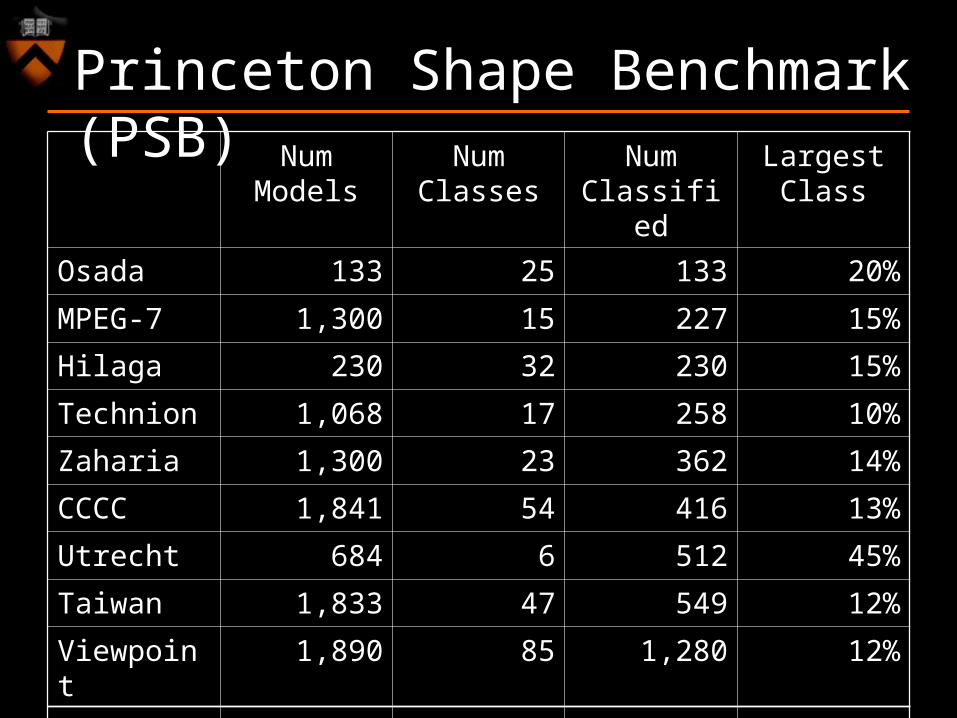
Num Models
Num Classes
Num Classified
Largest Class
Osada 133 25 133 20%
MPEG-7 1,300 15 227 15%
Hilaga 230 32 230 15%
Technion 1,068 17 258 10%
Zaharia 1,300 23 362 14%
CCCC 1,841 54 416 13%
Utrecht 684 6 512 45%
Taiwan 1,833 47 549 12%
Viewpoint 1,890 85 1,280 12%
PSB 6,670 161 1,814 6%
Princeton Shape Benchmark (PSB)
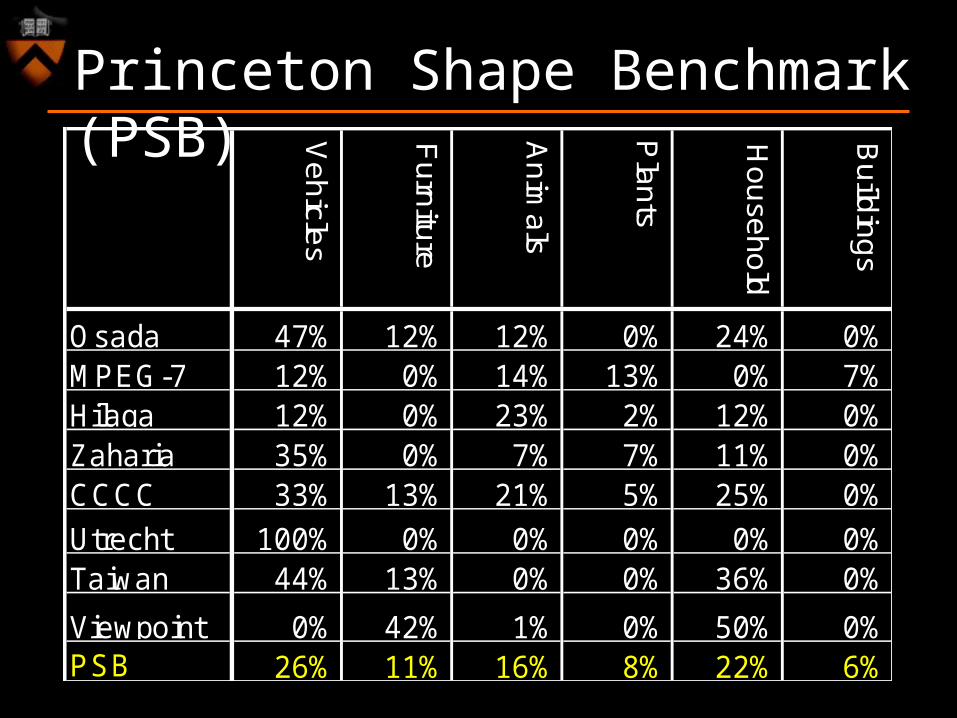
Ve
hicle
s
Fu
rnitu
re
An
ima
ls
Pla
nts
Ho
use
ho
ld
Bu
ildin
gs
Osada 47% 12% 12% 0% 24% 0%MPEG-7 12% 0% 14% 13% 0% 7%Hilaga 12% 0% 23% 2% 12% 0%Zaharia 35% 0% 7% 7% 11% 0%CCCC 33% 13% 21% 5% 25% 0%
Utrecht 100% 0% 0% 0% 0% 0%Taiwan 44% 13% 0% 0% 36% 0%
Viewpoint 0% 42% 1% 0% 50% 0%PSB 26% 11% 16% 8% 22% 6%
Princeton Shape Benchmark (PSB)
Outline
• Introduction• Related work• Princeton Shape Benchmark• Comparison of 12 descriptors• Evaluation techniques• Results• Conclusion
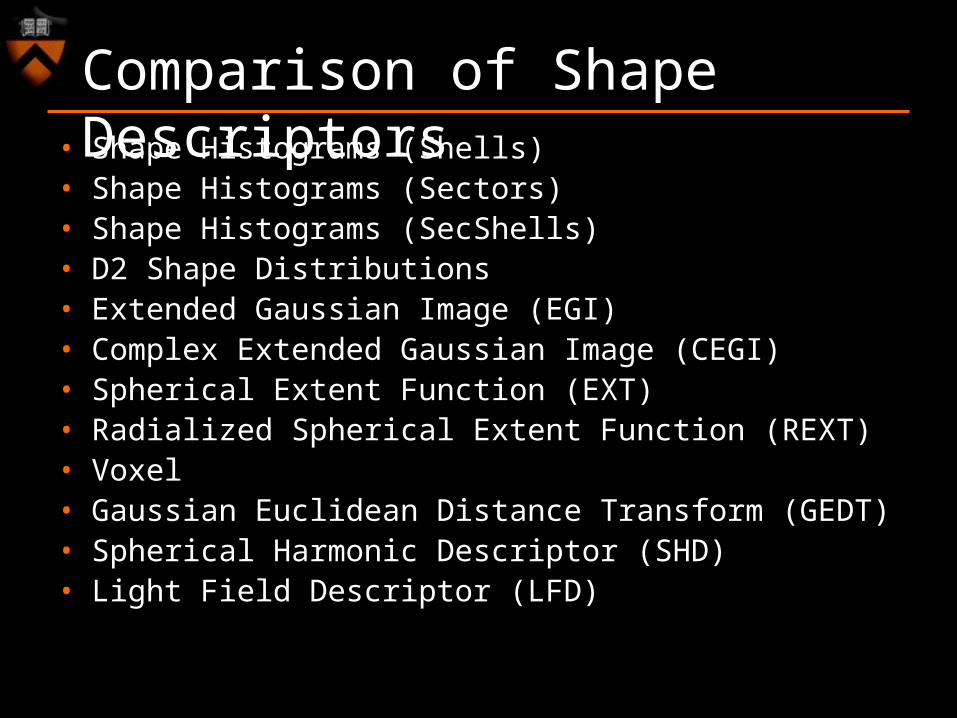
Comparison of Shape Descriptors• Shape Histograms (Shells)
• Shape Histograms (Sectors)• Shape Histograms (SecShells)• D2 Shape Distributions• Extended Gaussian Image (EGI)• Complex Extended Gaussian Image (CEGI)• Spherical Extent Function (EXT)• Radialized Spherical Extent Function (REXT)• Voxel• Gaussian Euclidean Distance Transform (GEDT)• Spherical Harmonic Descriptor (SHD)• Light Field Descriptor (LFD)
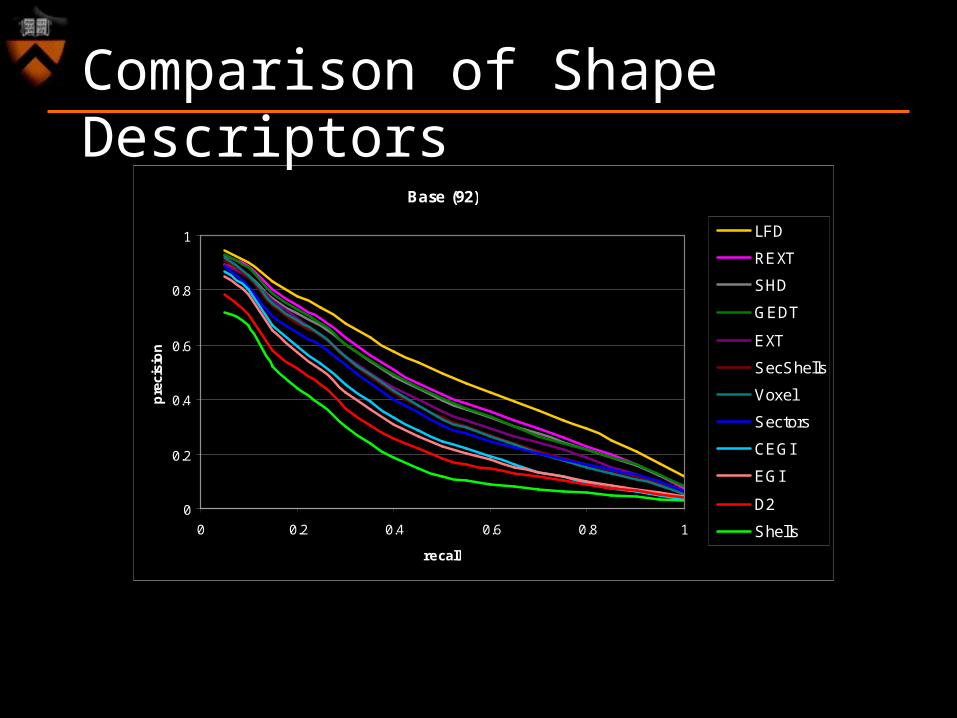
Base (92)
0
0.2
0.4
0.6
0.8
1
0 0.2 0.4 0.6 0.8 1
recall
pre
cisi
on
LFD
REXT
SHD
GEDT
EXT
SecShells
Voxel
Sectors
CEGI
EGI
D2
Shells
l
Comparison of Shape Descriptors
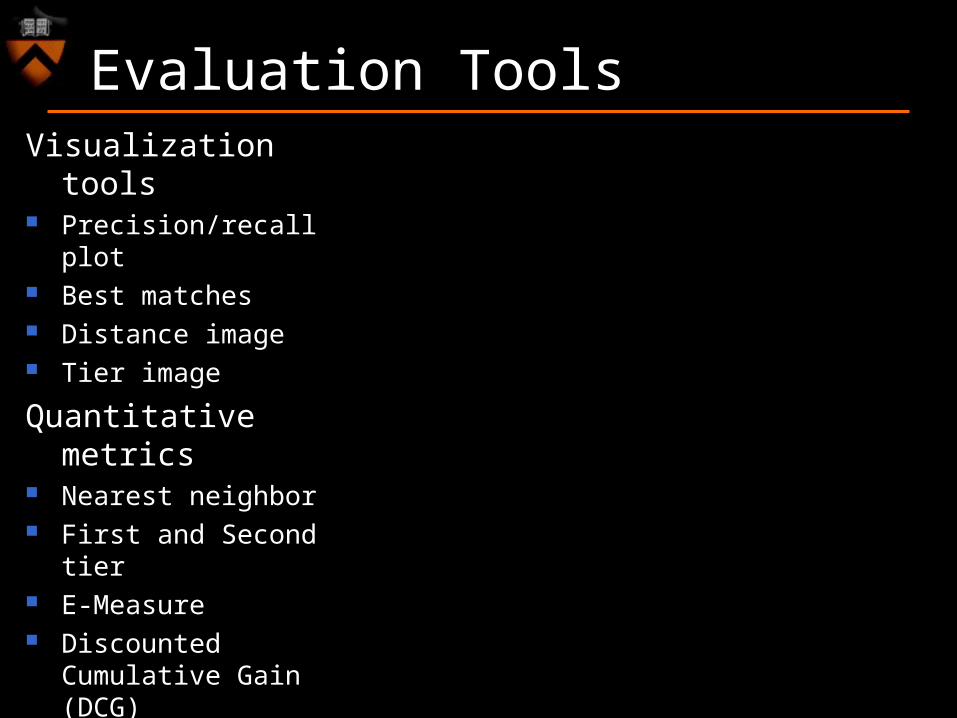
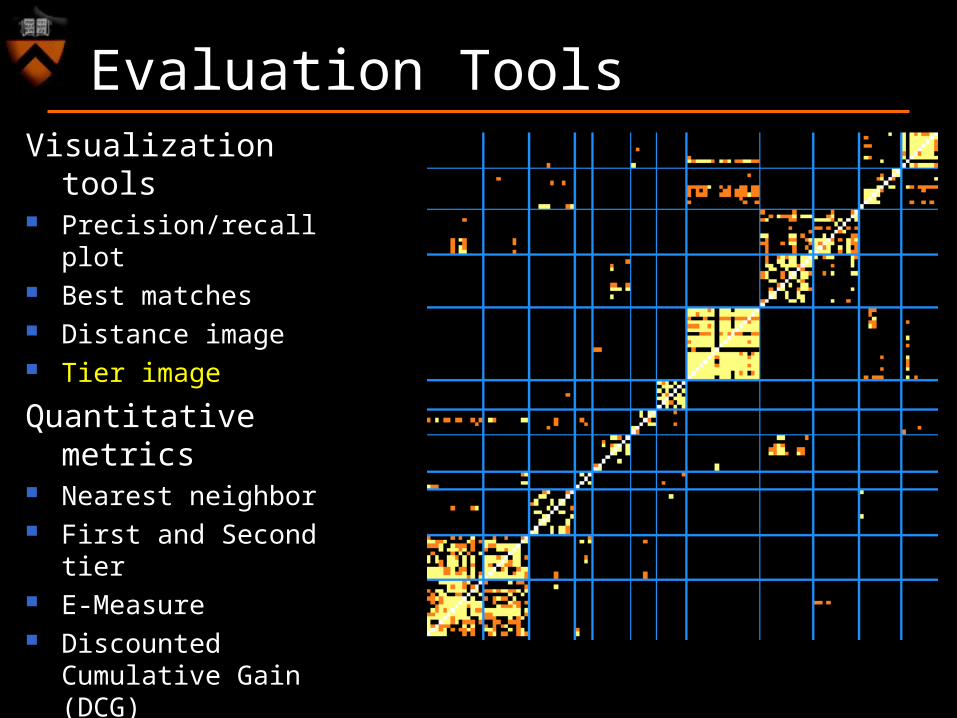
Evaluation ToolsVisualization tools Precision/recall plot Best matches Distance image Tier image
Quantitative metrics Nearest neighbor First and Second tier E-Measure Discounted Cumulative
Gain (DCG)
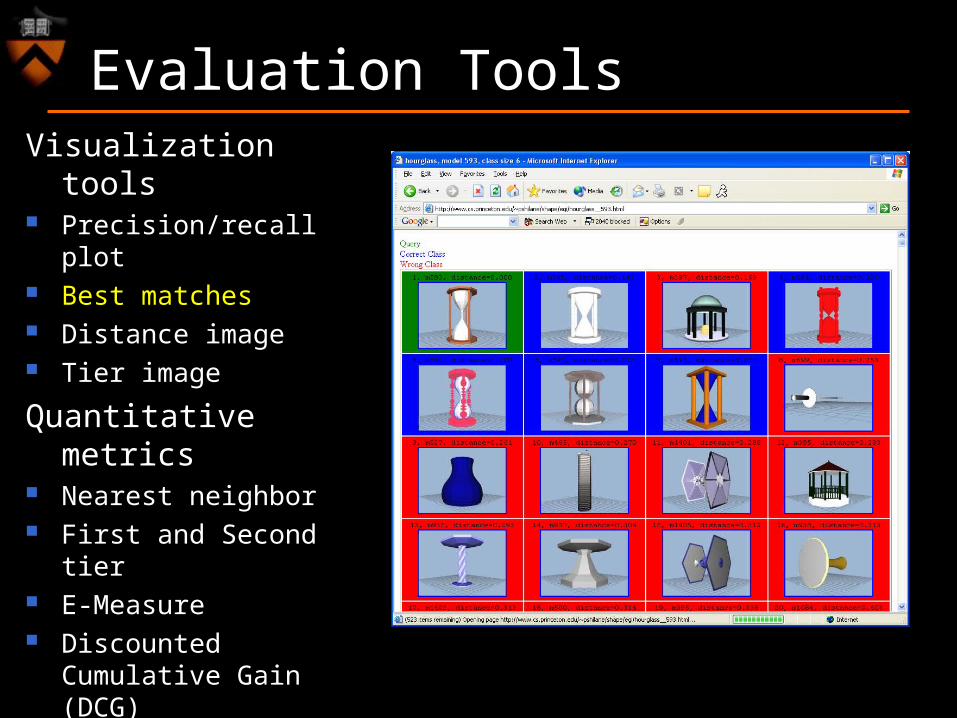
Evaluation ToolsVisualization tools Precision/recall plot Best matches Distance image Tier image
Quantitative metrics Nearest neighbor First and Second tier E-Measure Discounted Cumulative
Gain (DCG)
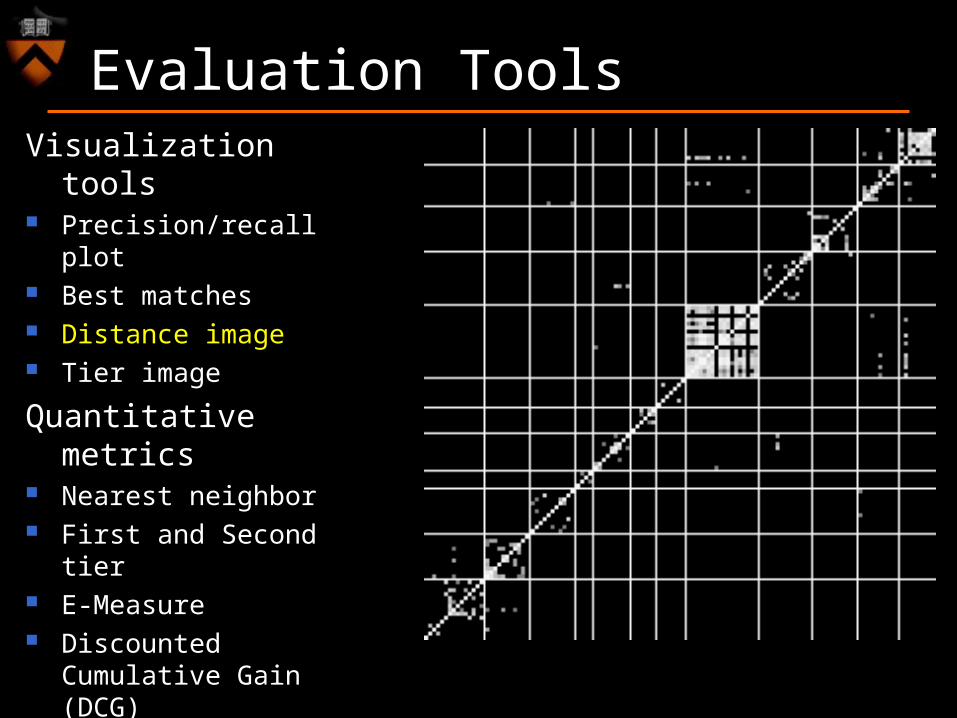
Evaluation ToolsVisualization tools Precision/recall plot Best matches Distance image Tier image
Quantitative metrics Nearest neighbor First and Second tier E-Measure Discounted Cumulative
Gain (DCG)
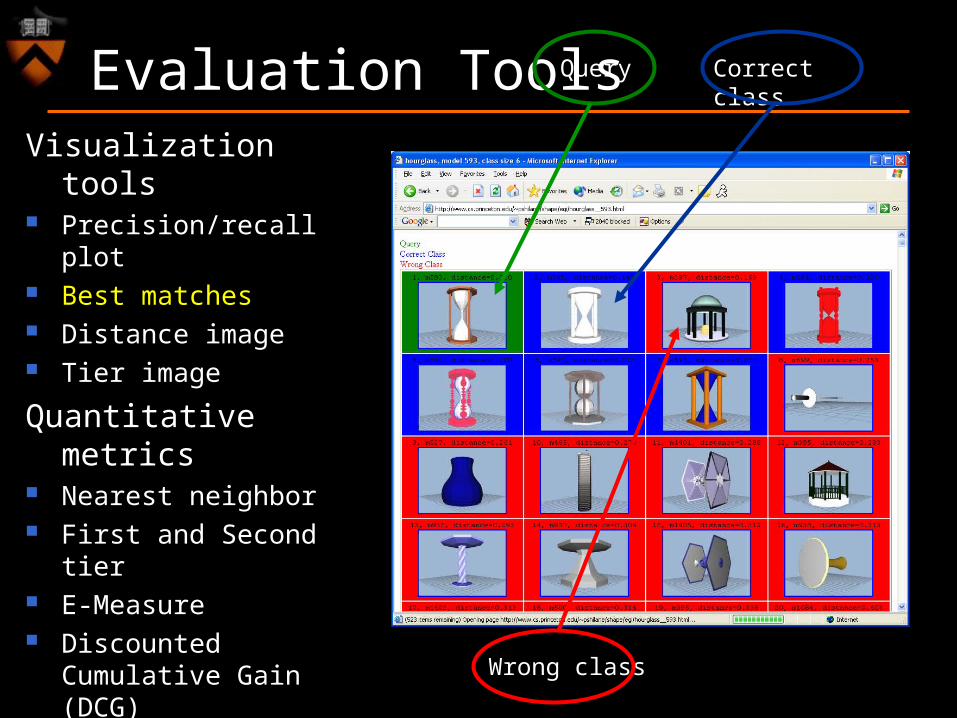
Query Correct class
Wrong class
Evaluation ToolsVisualization tools Precision/recall plot Best matches Distance image Tier image
Quantitative metrics Nearest neighbor First and Second tier E-Measure Discounted Cumulative
Gain (DCG)
Evaluation ToolsVisualization tools Precision/recall plot Best matches Distance image Tier image
Quantitative metrics Nearest neighbor First and Second tier E-Measure Discounted Cumulative
Gain (DCG)
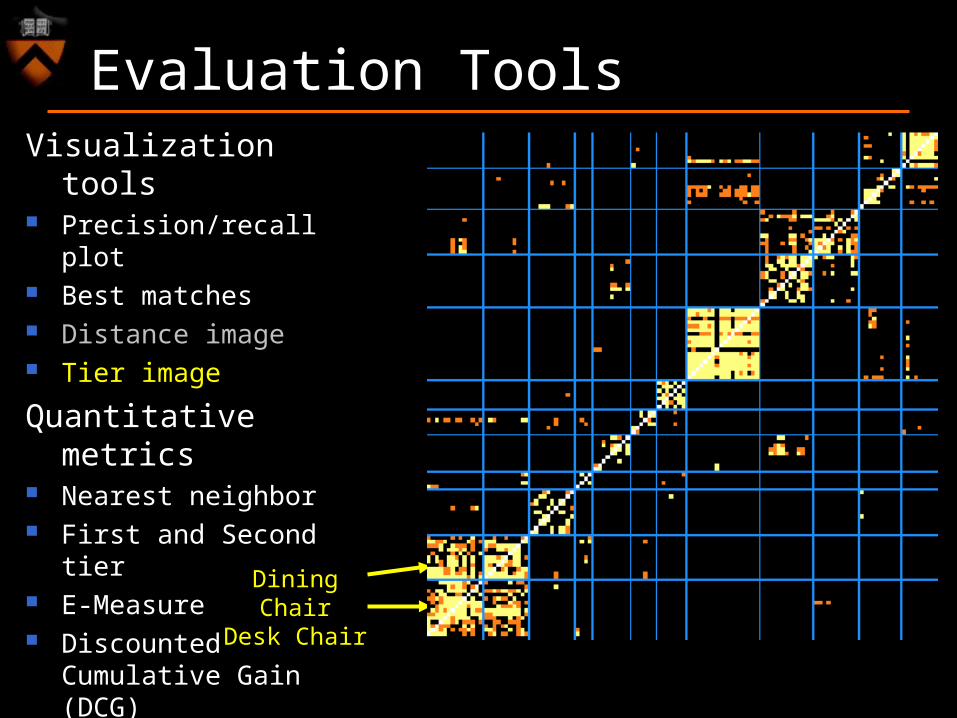
Dining ChairDesk Chair
Evaluation ToolsVisualization tools Precision/recall plot Best matches Distance image Tier image
Quantitative metrics Nearest neighbor First and Second tier E-Measure Discounted Cumulative
Gain (DCG)
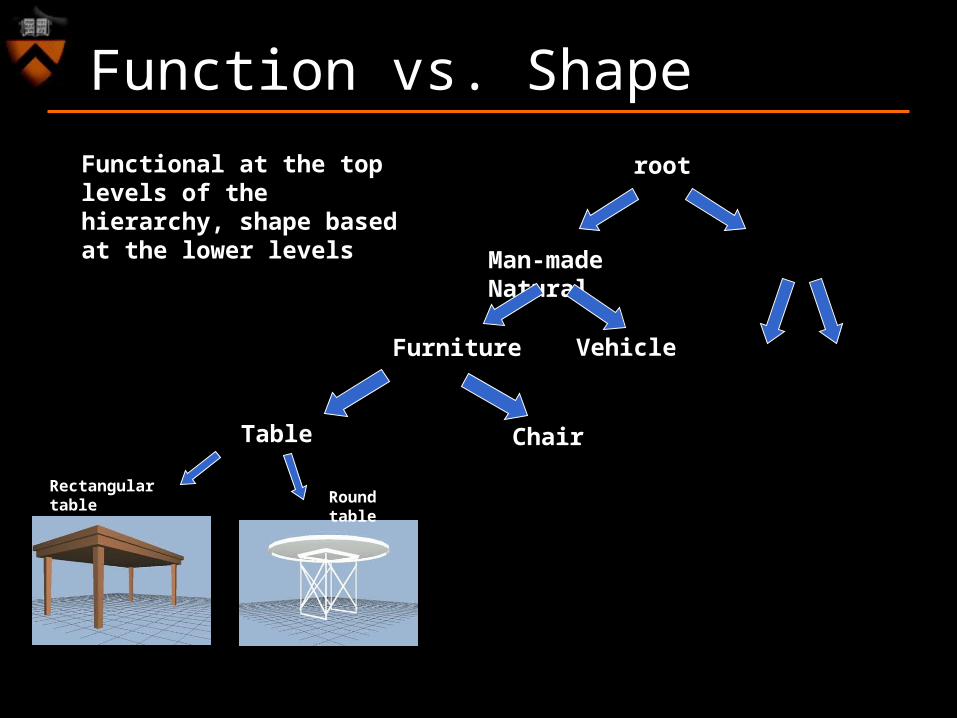
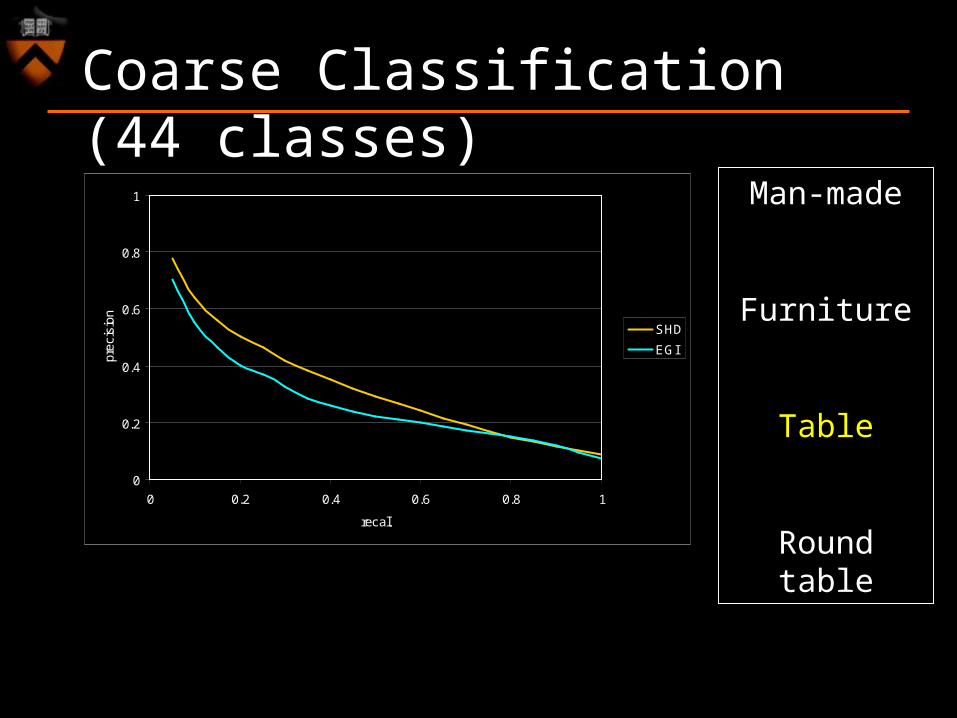
Function vs. Shape
Functional at the top levels of the hierarchy, shape based at the lower levels
Rectangular table Round
table
Furniture
Table
Man-made Natural
root
Vehicle
Chair
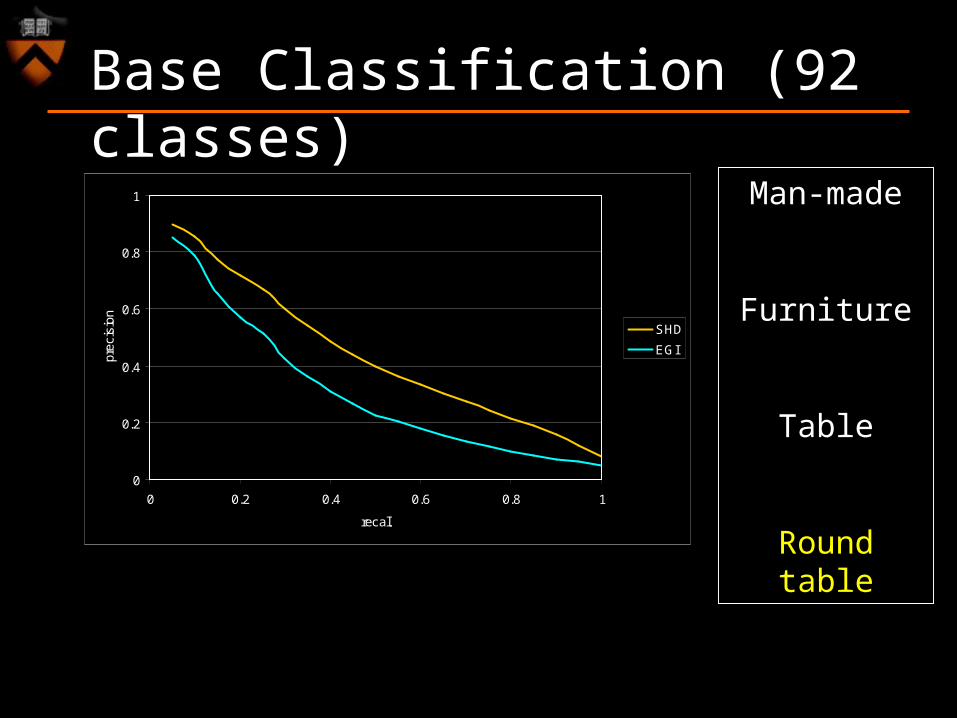
Base Classification (92 classes)
Man-made
Furniture
Table
Round table
0
0.2
0.4
0.6
0.8
1
0 0.2 0.4 0.6 0.8 1
recall
prec
isio
n
SHD
EGI
0
0.2
0.4
0.6
0.8
1
0 0.2 0.4 0.6 0.8 1
recall
prec
isio
n
SHD
EGI
Coarse Classification (44 classes)
Man-made
Furniture
Table
Round table
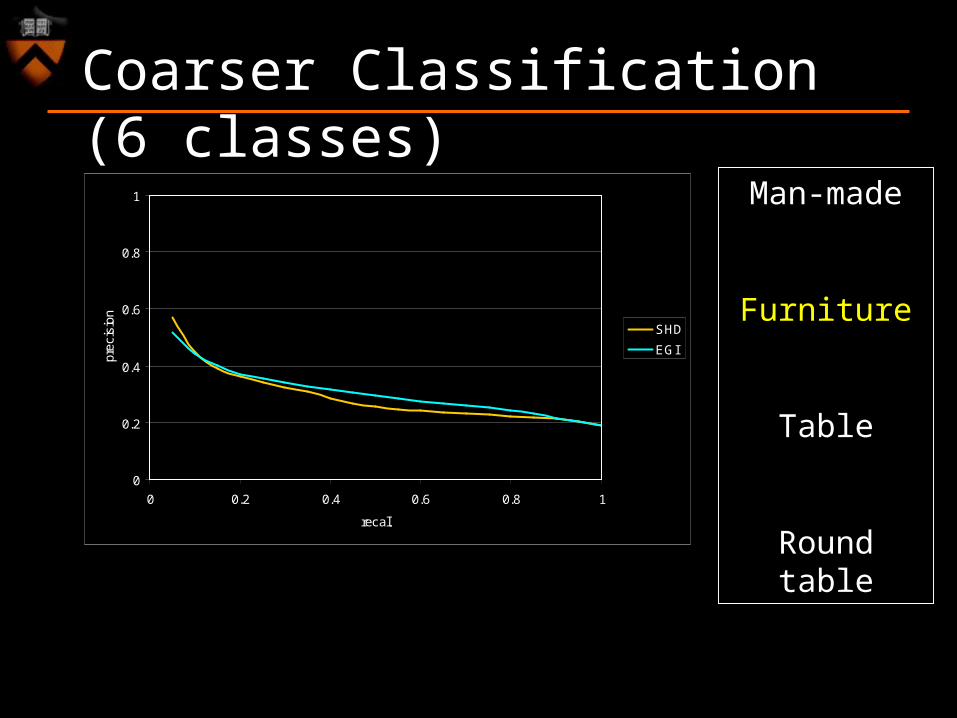
Coarser Classification (6 classes)
Man-made
Furniture
Table
Round table
0
0.2
0.4
0.6
0.8
1
0 0.2 0.4 0.6 0.8 1
recall
prec
isio
n
SHD
EGI
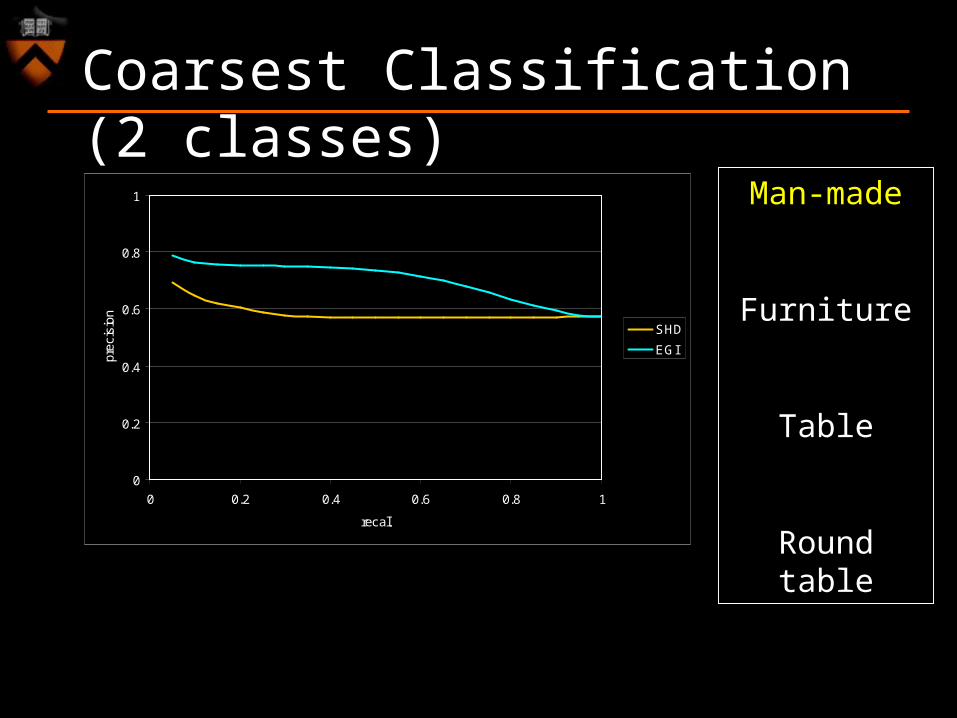
Coarsest Classification (2 classes)
Man-made
Furniture
Table
Round table
0
0.2
0.4
0.6
0.8
1
0 0.2 0.4 0.6 0.8 1
recall
prec
isio
n
SHD
EGI
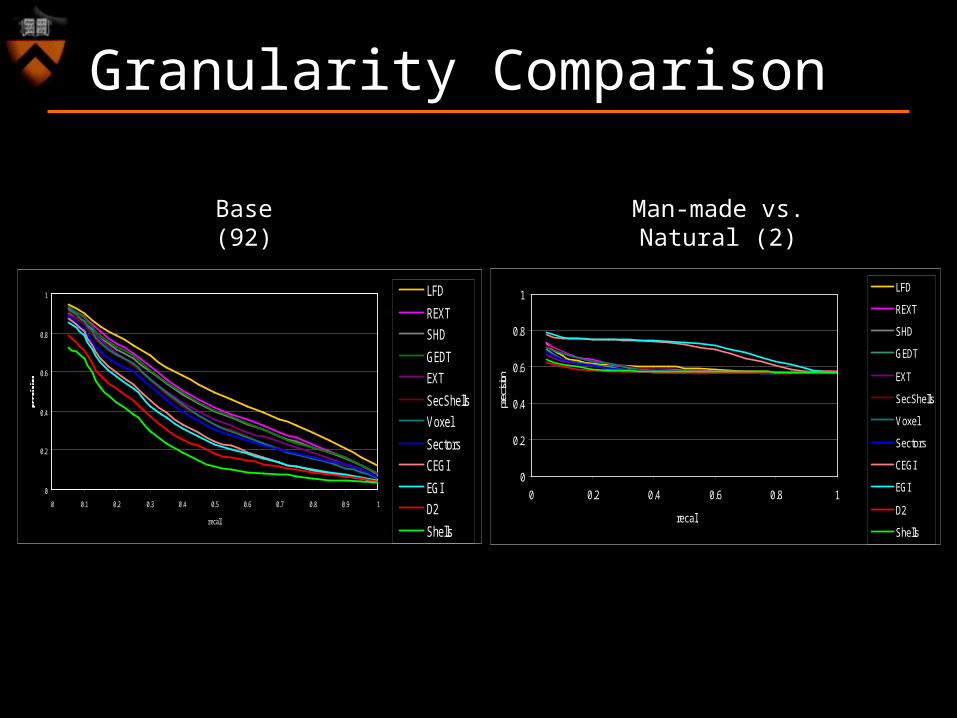
Granularity Comparison
0
0.2
0.4
0.6
0.8
1
0 0.2 0.4 0.6 0.8 1
recallpr
ecisi
on
LFD
REXT
SHD
GEDT
EXT
SecShells
Voxel
Sectors
CEGI
EGI
D2
Shells
0
0.2
0.4
0.6
0.8
1
0 0.1 0.2 0.3 0.4 0.5 0.6 0.7 0.8 0.9 1
recall
LFD
REXT
SHD
GEDT
EXT
SecShells
Voxel
Sectors
CEGI
EGI
D2
Shells
Base(92)
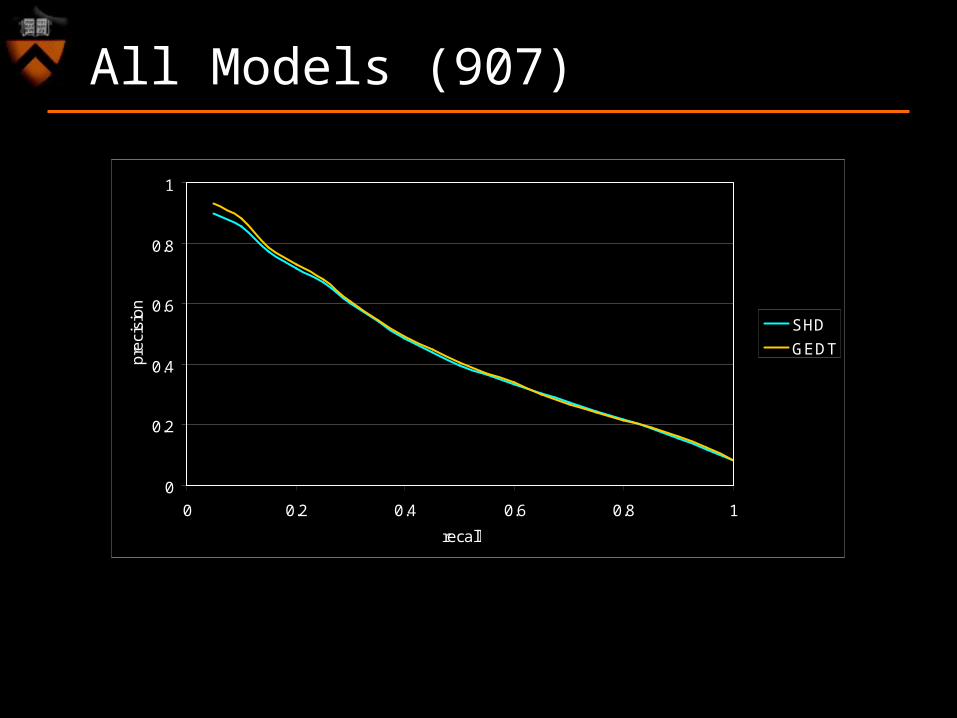
Man-made vs. Natural (2)

Rotationally Aligned Models (650)
0
0.2
0.4
0.6
0.8
1
0 0.2 0.4 0.6 0.8 1
recall
pre
cisi
on
SHD
GEDT
0
0.2
0.4
0.6
0.8
1
0 0.2 0.4 0.6 0.8 1
recall
pre
cisi
on
SHD
GEDT
All Models (907)
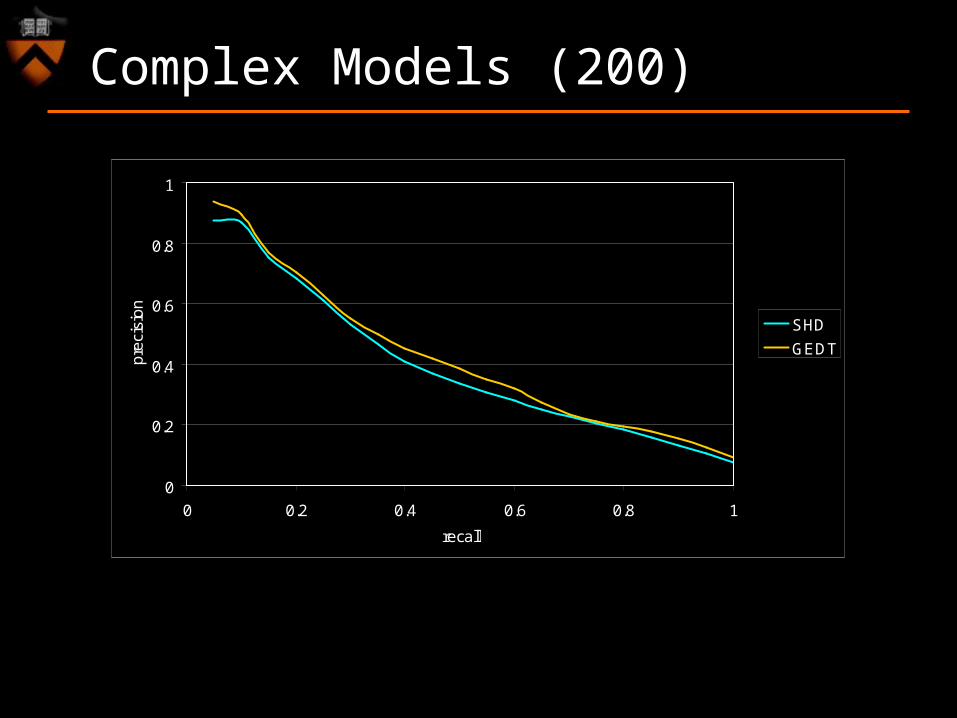
Complex Models (200)
0
0.2
0.4
0.6
0.8
1
0 0.2 0.4 0.6 0.8 1
recall
pre
cisi
on
SHD
GEDT
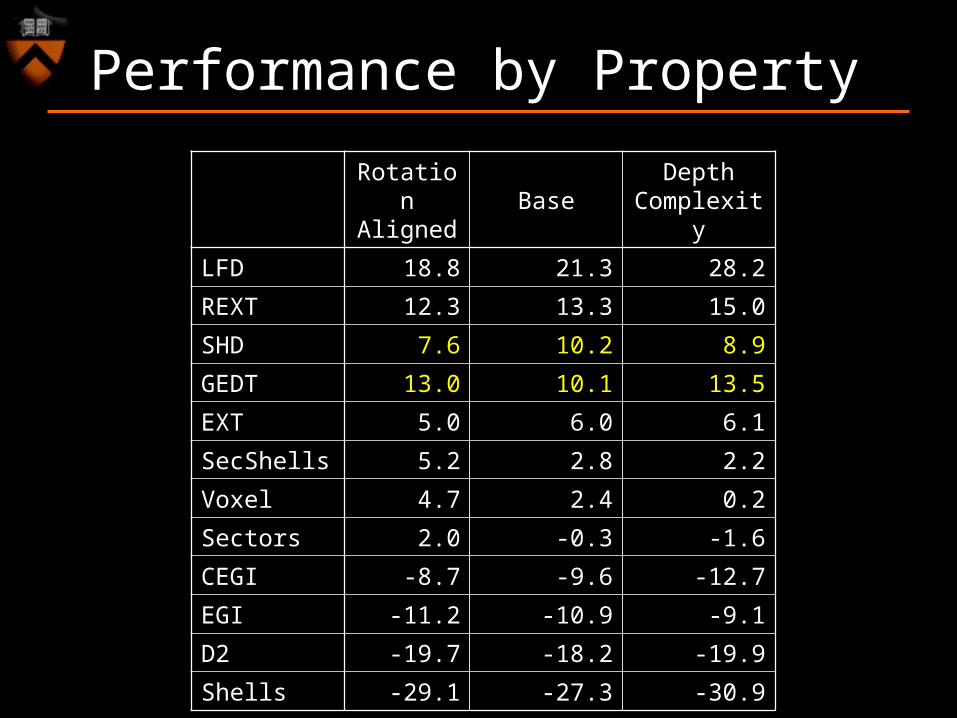
Performance by Property
Rotation Aligned
BaseDepth
Complexity
LFD 18.8 21.3 28.2
REXT 12.3 13.3 15.0
SHD 7.6 10.2 8.9
GEDT 13.0 10.1 13.5
EXT 5.0 6.0 6.1
SecShells 5.2 2.8 2.2
Voxel 4.7 2.4 0.2
Sectors 2.0 -0.3 -1.6
CEGI -8.7 -9.6 -12.7
EGI -11.2 -10.9 -9.1
D2 -19.7 -18.2 -19.9
Shells -29.1 -27.3 -30.9
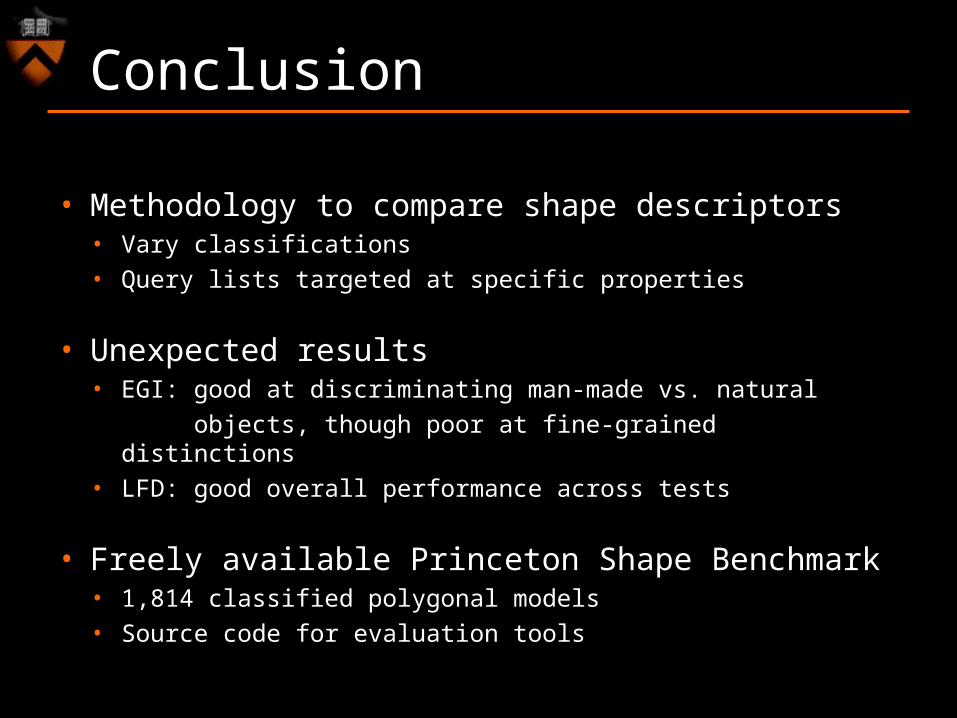
• Methodology to compare shape descriptors• Vary classifications• Query lists targeted at specific properties
• Unexpected results• EGI: good at discriminating man-made vs. natural
objects, though poor at fine-grained distinctions• LFD: good overall performance across tests
• Freely available Princeton Shape Benchmark• 1,814 classified polygonal models• Source code for evaluation tools
Conclusion
Future Work
• Multi-classifiers• Evaluate statistical significance of results• Application of techniques to other
domains• Text retrieval• Image retrieval• Protein classification
Acknowledgements
David Bengali partitioned thousands of models.Ming Ouhyoung and his students provided the light field
descriptor. Dejan Vranic provided the CCCC and MPEG-7 databases.Viewpoint Data Labs donated the Viewpoint database.Remco Veltkamp and Hans Tangelder provided the Utrecht
database.
Funding: The National Science Foundation grants CCR-0093343 and 11S-0121446.
The End
http://shape.cs.princeton.edu/benchmark

![3D Scanning Instruments - Banterle...[Kazhdan et al., SGP 06] Poisson Surface Reconstruction 1. Compute the divergence 𝑉𝑞 ∇⋅ [Kazhdan et al., SGP 06] Poisson Surface Reconstruction](https://img.pdfslide.net/doc/110x75/600bb8d23ddeb84c4910c2d2/3d-scanning-instruments-kazhdan-et-al-sgp-06-poisson-surface-reconstruction.jpg)


![RELATIVE KAZHDAN–LUSZTIG CELLS arXiv:math/0504216v2 … · arXiv:math/0504216v2 [math.RT] 28 Apr 2005 RELATIVE KAZHDAN–LUSZTIG CELLS MEINOLF GECK Abstract. In this paper, we study](https://img.pdfslide.net/doc/110x75/5fd1461b2cdd905f146cc78f/relative-kazhdanalusztig-cells-arxivmath0504216v2-arxivmath0504216v2-mathrt.jpg)