Embed Size (px)
Citation preview

Empirical Musicology Review Vol. 1, No. 4, 2006
185
The Processing of Pitch and Scale: An ERP Study of
Musicians Trained Outside of the Western Musical System
LAURA BISCHOFF RENNINGER [1]
Shepherd University
MICHAEL P. WILSON
University of Illinois
EMANUEL DONCHIN
University of South Florida
ABSTRACT: The current study extends the efforts of Bischoff Renninger, Granot and
Donchin (2003) to non-Western musical systems and focuses specifically on Event-
Related Potential (ERP) responses to scalar deviations within the Javanese pélog scale by
groups of musicians trained within the Western and Javanese systems. The principal aim
is to ascertain whether results found in previous experiments may be obtained cross-
culturally. Participants include five subjects trained in the Western system only (control
group) and five subjects trained in both the Western and Javanese systems (experimental
group). Tasks include identifying scalar deviations within the Western diatonic scale,
identifying scalar deviations within the Javanese pèlog scale, and identifying target letters
in a visual control task. ERP and overt behavioral responses are recorded. Results show
significant differences between group responses to diatonic and Javanese scale
conditions. Interesting results also arise in terms of how tones and intervals in the
different scales are conceptualized by subjects in both groups. Control subjects
especially tend to assimilate pélog scale intervals to intervals in the Western equal-
tempered scale.
Submitted 2006 June 21; accepted 2006 June 26.
KEYWORDS: music, scale, ERP, event-related potential, tuning, interval, enculturation
INTRODUCTION
IN human culture, music is as far-reaching a phenomenon as language. And, like language, learning
another culture’s music can be both complicated and challenging. Even so, researchers have documented
various musical elements (i.e. the division of the octave into discrete rather than continuous pitch levels, the
use of 5-7 pitches per scale, the hierarchical arrangement of pitches within the scale) that appear to be
shared among various cultures (Dowling & Harwood, 1986). In the current study we were very interested
to know if there were also cross-cultural similarities in music cognition. The vast majority of music
cognition studies focuses on Western music and tends to disregard other musical systems. According to
Dowling and Harwood (1986, p. 238) “cross-cultural comparisons provide a means of deciding which of
the psychological constraints on musical scale construction are truly general and which are peculiar to
European scale structures.” Hence, before we can make any effective generalizations about the processing
of specific musical structures, it is imperative that we explore a variety of musical systems.
We decided to begin our study by comparing the processing of the Western major diatonic scale
with the Javanese pélog scale by musicians trained within the Western and Javanese musical systems. The
Western major diatonic scale is a seven-tone scale formed by intervals or distances consisting of major and
minor seconds. The Javanese pélog scale is also a seven-tone scale, however it typically uses intervals or
distances that fall between minor and major seconds. Our interest in comparing the processing of these
Empirical Musicology Review Vol. 1, No. 4, 2006
186
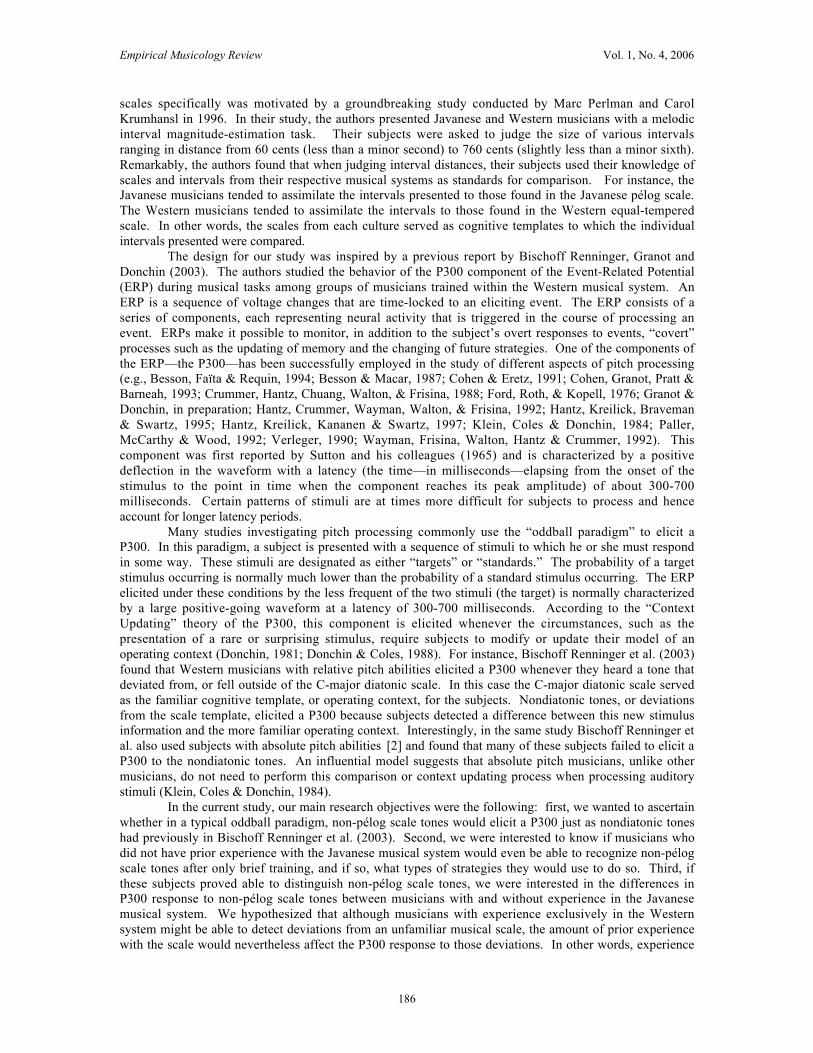
scales specifically was motivated by a groundbreaking study conducted by Marc Perlman and Carol
Krumhansl in 1996. In their study, the authors presented Javanese and Western musicians with a melodic
interval magnitude-estimation task. Their subjects were asked to judge the size of various intervals
ranging in distance from 60 cents (less than a minor second) to 760 cents (slightly less than a minor sixth).
Remarkably, the authors found that when judging interval distances, their subjects used their knowledge of
scales and intervals from their respective musical systems as standards for comparison. For instance, the
Javanese musicians tended to assimilate the intervals presented to those found in the Javanese pélog scale.
The Western musicians tended to assimilate the intervals to those found in the Western equal-tempered
scale. In other words, the scales from each culture served as cognitive templates to which the individual
intervals presented were compared.
The design for our study was inspired by a previous report by Bischoff Renninger, Granot and
Donchin (2003). The authors studied the behavior of the P300 component of the Event-Related Potential
(ERP) during musical tasks among groups of musicians trained within the Western musical system. An
ERP is a sequence of voltage changes that are time-locked to an eliciting event. The ERP consists of a
series of components, each representing neural activity that is triggered in the course of processing an
event. ERPs make it possible to monitor, in addition to the subject’s overt responses to events, “covert”
processes such as the updating of memory and the changing of future strategies. One of the components of
the ERP—the P300—has been successfully employed in the study of different aspects of pitch processing
(e.g., Besson, Faïta & Requin, 1994; Besson & Macar, 1987; Cohen & Eretz, 1991; Cohen, Granot, Pratt &
Barneah, 1993; Crummer, Hantz, Chuang, Walton, & Frisina, 1988; Ford, Roth, & Kopell, 1976; Granot &
Donchin, in preparation; Hantz, Crummer, Wayman, Walton, & Frisina, 1992; Hantz, Kreilick, Braveman
& Swartz, 1995; Hantz, Kreilick, Kananen & Swartz, 1997; Klein, Coles & Donchin, 1984; Paller,
McCarthy & Wood, 1992; Verleger, 1990; Wayman, Frisina, Walton, Hantz & Crummer, 1992). This
component was first reported by Sutton and his colleagues (1965) and is characterized by a positive
deflection in the waveform with a latency (the time—in milliseconds—elapsing from the onset of the
stimulus to the point in time when the component reaches its peak amplitude) of about 300-700
milliseconds. Certain patterns of stimuli are at times more difficult for subjects to process and hence
account for longer latency periods.
Many studies investigating pitch processing commonly use the “oddball paradigm” to elicit a
P300. In this paradigm, a subject is presented with a sequence of stimuli to which he or she must respond
in some way. These stimuli are designated as either “targets” or “standards.” The probability of a target
stimulus occurring is normally much lower than the probability of a standard stimulus occurring. The ERP
elicited under these conditions by the less frequent of the two stimuli (the target) is normally characterized
by a large positive-going waveform at a latency of 300-700 milliseconds. According to the “Context
Updating” theory of the P300, this component is elicited whenever the circumstances, such as the
presentation of a rare or surprising stimulus, require subjects to modify or update their model of an
operating context (Donchin, 1981; Donchin & Coles, 1988). For instance, Bischoff Renninger et al. (2003)
found that Western musicians with relative pitch abilities elicited a P300 whenever they heard a tone that
deviated from, or fell outside of the C-major diatonic scale. In this case the C-major diatonic scale served
as the familiar cognitive template, or operating context, for the subjects. Nondiatonic tones, or deviations
from the scale template, elicited a P300 because subjects detected a difference between this new stimulus
information and the more familiar operating context. Interestingly, in the same study Bischoff Renninger et
al. also used subjects with absolute pitch abilities [2] and found that many of these subjects failed to elicit a
P300 to the nondiatonic tones. An influential model suggests that absolute pitch musicians, unlike other
musicians, do not need to perform this comparison or context updating process when processing auditory
stimuli (Klein, Coles & Donchin, 1984).
In the current study, our main research objectives were the following: first, we wanted to ascertain
whether in a typical oddball paradigm, non-pélog scale tones would elicit a P300 just as nondiatonic tones
had previously in Bischoff Renninger et al. (2003). Second, we were interested to know if musicians who
did not have prior experience with the Javanese musical system would even be able to recognize non-pélog
scale tones after only brief training, and if so, what types of strategies they would use to do so. Third, if
these subjects proved able to distinguish non-pélog scale tones, we were interested in the differences in
P300 response to non-pélog scale tones between musicians with and without experience in the Javanese
musical system. We hypothesized that although musicians with experience exclusively in the Western
system might be able to detect deviations from an unfamiliar musical scale, the amount of prior experience
with the scale would nevertheless affect the P300 response to those deviations. In other words, experience

Empirical Musicology Review Vol. 1, No. 4, 2006
187
matters, and musicians without experience in the Javanese system might show a smaller P300 due to
unfamiliarity with the pélog scale.
METHOD
Ten musically trained subjects, aged 19-39, participated in this study. The experimental group
was composed of five (four females, one male) participants in the University of Illinois Javanese Gamelan,
who were trained within this musical system. The control group was composed of five (four females, one
male) musicians who were not participants in the Gamelan and who had no experience with this musical
system. Mean age of the control group was 27.8 (SD = 6.09) and mean age of the experimental group was
24.8 (SD = 8.07). All subjects were drawn from the School of Music at the University of Illinois at
Urbana-Champaign.
Each of the subjects sang or played at least one instrument. Mean years of training for the control
subject group was 12.6 (SD = 4.56) years and mean years of training for the experimental subject group
was 10.8 (SD = 5.40) years. In addition, all subjects had taken at least one college course in aural skills and
music theory. The mean number of years the experimental group subjects participated in the UIUC
Javanese Gamelan was 1.2 (SD = 1.17). The majority of these subjects had also spent several weeks
studying music in Indonesia. Experimental subjects played a variety of Javanese instruments within the
UIUC Gamelan. All subjects were first issued an extensive questionnaire in order to obtain more
information regarding their musical ability, training, and family background. All subjects were also
questioned in a post-experimental debriefing session. At this debriefing session, subjects were asked the
following questions:
1. Which of the aural conditions was the most difficult for you?
2. What strategy did you use to effectively complete each of the conditions?
If the subject was from the control group, he or she was questioned about what strategy was used
to effectively complete the pélog scale condition.
Stimuli
Subjects were presented with two auditory oddball tasks and one visual oddball task that served as
a control. Stimuli for each of the auditory tasks included 300 sine tones generated by a Gateway 386
computer using a program called InstEP. The tones were presented binaurally to the subject via Radio
Shack "Pro-90" earphones. The duration of each tone and each stimulus in the visual control condition
was 350 milliseconds (including rise/fall times). The time interval between the onset of two successive
tones or visual stimuli in the visual condition (ITI) was 1600 milliseconds. The intensity of the tones was
73-75 dBA as measured by a "General Radio 1565B” sound level meter. All overt responses were given
with the right and left hand thumbs on a 3-button "Logitech” mouse.
DIATONIC CONDITION
This condition tested the subjects’ ability to identify deviations from the C-major diatonic scale.
Tones between and including C4 and C5 were presented in three blocks of 100 tones each. The frequencies
of these tones were equal to those of the Western equal-tempered scale. Twenty percent of the tones were
nondiatonic (falling outside of the C-major diatonic scale), and hence labeled “targets”, and eighty percent
of the tones were diatonic (falling within the C-major diatonic scale), and hence labeled “standards.” The
overall task fit the typical oddball format. There were never more than two consecutive nondiatonic tones.
Each block began with the C-major triad tones (C, E, G) in order to establish the key and hence establish
the subject’s cognitive framework for the C-major scale. Subjects were told the identity of these three
tones.
Subjects were instructed to press the left button on the mouse if a tone was diatonic, and to press

Empirical Musicology Review Vol. 1, No. 4, 2006
188
the right button on the mouse if a tone was nondiatonic. The frequencies for the C-major diatonic tones
(standards) were as follows:
1. 262 Hz “C4”
2. 294 Hz “D4”
3. 330 Hz “E4”
4. 349 Hz “F4”
5. 392 Hz “G4”
6. 440 Hz “A4”
7. 494 Hz “B4”
(Use the following links to download the sound files for the seven tones listed above:)
https://kb.osu.edu/dspace/bitstream/1811/24117/1/EMR000015a-262Hz_C4.ogg
https://kb.osu.edu/dspace/bitstream/1811/24117/3/EMR000015a-294Hz_D4.ogg
https://kb.osu.edu/dspace/bitstream/1811/24117/5/EMR000015a-330Hz_E4.ogg
https://kb.osu.edu/dspace/bitstream/1811/24117/6/EMR000015a-349Hz_F4.ogg
https://kb.osu.edu/dspace/bitstream/1811/24117/8/EMR000015a-392Hz_G4.ogg
https://kb.osu.edu/dspace/bitstream/1811/24117/10/EMR000015a-440Hz_A4.ogg
https://kb.osu.edu/dspace/bitstream/1811/24117/12/EMR000015a-494Hz_B4.ogg
The frequencies for the nondiatonic tones (targets) were as follows:
1. 277 Hz “C#4”
2. 311 Hz “D#4”
3. 370 Hz “F#4”
4. 415 Hz “G#4”
5. 466 Hz “A#4”
(Use the following links to download the sound files for the five tones listed above:)
https://kb.osu.edu/dspace/bitstream/1811/24117/2/EMR000015a-277Hz_Cs4.ogg
https://kb.osu.edu/dspace/bitstream/1811/24117/4/EMR000015a-311Hz_Ds4.ogg
https://kb.osu.edu/dspace/bitstream/1811/24117/7/EMR000015a-370Hz_Fs4.ogg
https://kb.osu.edu/dspace/bitstream/1811/24117/9/EMR000015a-415Hz_Gs4.ogg
https://kb.osu.edu/dspace/bitstream/1811/24117/11/EMR000015a-466Hz_As4.ogg
JAVA CONDITION
This condition was similar in structure to the diatonic condition. This condition tested the
subjects’ ability to identify deviations from the Javanese pélog scale. This scale contains seven tones that
are actually divided into the following two sets: a core set of five tones (scale degrees 1, 2, 3, 5, and 6) that
are used frequently in Javanese pieces, and a remaining set of non-core tones (scale degrees 4 and 7) rarely
used in pieces. Since each Javanese ensemble uses a slightly different tuning for the pélog scale, the scale
used in this experiment was identical to the University of Illinois Javanese Gamelan pélog tuning. Tuning
was measured with a Seiko ST-747 chromatic tuner during the simultaneous playing of the pélog scale on
several of the Gamelan’s fixed-pitch instruments (including the sarons, pekings and barungs). Several
readings were taken to ensure accuracy. Once these tunings were transferred to the InstEP program,
members of the University of Illinois Gamelan were invited to listen to the tones and verify whether they
matched the pélog scale used by their ensemble. The measurements obtained for the five core tones of the
University of Illinois Gamelan’s pélog scale were as follows:
1. 289 Hz
2. 326 Hz
3. 340 Hz
4. 426 Hz
5. 445 Hz

Empirical Musicology Review Vol. 1, No. 4, 2006
189
(Use the following links to download the sound files for the five tones listed above:)
https://kb.osu.edu/dspace/bitstream/1811/24117/13/EMR000015a-Pelog1_289Hz.ogg
https://kb.osu.edu/dspace/bitstream/1811/24117/14/EMR000015a-Pelog2_326Hz.ogg
https://kb.osu.edu/dspace/bitstream/1811/24117/15/EMR000015a-Pelog3_340Hz.ogg
https://kb.osu.edu/dspace/bitstream/1811/24117/16/EMR000015a-Pelog5_426Hz.ogg
https://kb.osu.edu/dspace/bitstream/1811/24117/18/EMR000015a-Pelog6_445Hz.ogg
The subject was instructed to click the left mouse button when hearing any of these tones. The
measurements for the two non-core tones of the University of Illinois Gamelan’s pélog scale were as
follows:
1. 400 Hz
2. 504 Hz
(Use the following links to download the sound files for the two tones listed above:)
https://kb.osu.edu/dspace/bitstream/1811/24117/17/EMR000015a-Pelog4_400Hz.ogg
https://kb.osu.edu/dspace/bitstream/1811/24117/19/EMR000015a-Pelog7_504Hz.ogg
The subject was instructed to click the right mouse button when hearing either of these tones. The subject
was presented with the five core tones before beginning the task. As in the diatonic condition, the five
core tones (standards) were presented eighty percent of the time. The remaining non-core tones, or targets
(like the nondiatonic tones in the previous condition) were presented only twenty percent of the time.
VISUAL CONTROL CONDITION
This task served as a control or standard to which the auditory oddballs were compared. The
letters “H” and “S” appeared on the computer screen. The subject was again asked to press one button on
the mouse if an “S” appeared and another button if “H” appeared. These letters were presented for 350
milliseconds and the inter-stimulus-interval was 1600 milliseconds. The characters subtended a visual
angle of 1.3°. The frequency of H:S was 80% to 20%.
DATA ACQUISITION
Data were acquired from each subject in one session of approximately two hours including the
time required for filling out forms, application of electrodes, administration of instructions, completion of
the task, and debriefing. Subjects sat in a sound attenuating room and were instructed to fixate their eyes
on a "+" sign presented on a computer screen located in front of them at an approximate distance of 120
cm. Subjects listened to the tones over Radio Shack "Pro-90" headphones and were instructed to respond
as quickly and as accurately as possible. Subjects were told that they would hear a series of tones and that
after each tone they would have to make a decision as to whether or not the tone was inside the scale or
outside the scale presented before the task at hand. They were informed of the inter-stimulus-interval (ITI)
and of the identity of the first three tones in each block, but they were not told anything about the
probability of the occurrence of tones.
The Electroencephalogram (EEG) was recorded with silver-silver chloride (Ag-AgCl) electrodes
attached to nine scalp sites: Fz, Cz, Pz, F3, C3, P3, F4, C4, P4, and referred to the left mastoid. The
electrooculogram (EOG) was recorded from four electrodes placed supraorbitally and laterally around the
right eye. Two electrodes were placed above the nasion and served as the grounds. The electrode
impedance was kept below 10 kiloohms The EEG and EOG were amplified with Van Gogh model
amplifiers with a 10 second time constant and a half amplitude 35 Hz filter. The signals were recorded
continuously and digitized every 10 milliseconds. They were stored on zip disks for off line analysis. All
overt responses were given with the right and left hand thumbs on a 3-button "Logitech” mouse.

Empirical Musicology Review Vol. 1, No. 4, 2006
190
DATA ANALYSIS
The data segments for analysis were extracted from the continuously recorded EEG data. The data
was corrected for eye movement artifact using the Eye Movement Correction Procedure (EMCP) (Gratton
et al., 1983; Miller et al., 1988). Eye movements that could not be corrected were discarded (resulting in a
loss of approximately 15% of trials). The EEG was then digitally filtered from 0-82 Hz using the Cook and
Miller (1992) filter. [3] For each of the tasks, the EEG data were averaged separately for the rare and
frequent stimuli at the nine electrode sites. The ERPs were then quantified by a base-to-peak amplitude
measurement. The baseline was taken as 100 milliseconds prior to stimulus onset. Peaks were measured
within a time window corresponding to the P300 (300-800 msec). Each of the data sets was subjected to an
ANOVA for the Pz site, which is the site where the P300 component is largest. Results were reported as
significant at p <.05.
RESULTS
Overt Behavioral Responses
Figures 1 and 2 show the grand averages for the accuracy levels and reaction times for each
subject group in each of the three conditions.
Figure 1: Accuracy
0.82
0.84
0.86
0.88
0.9
0.92
0.94
0.96
0.98
1
Diatonic Java Visual
Condition
perc
en
t
Control
Experimental
Fig. 1. Grand averages for the accuracy levels for each subject group in each of the three conditions.

Empirical Musicology Review Vol. 1, No. 4, 2006
191
Figure 2: Reaction Time Data
0
100
200
300
400
500
600
700
800
900
Diatonic Java Visual
Condition
mil
lis
ec
on
ds
Control
Experimental
Fig. 2. Grand averages for the reaction times for each subject group in each of the three conditions.
As can be seen from these figures, the control subjects were faster and more accurate than the
experimental subjects in all three conditions. All differences were statistically significant between groups
except for the difference in visual accuracy. [4]
ERP Results
As seen in Figure 3, both subject groups showed a P300 response to the target events in all
conditions.
Fig. 3. Both subject groups show a P300 response to the target events in all conditions. Hence, it appears
that deviations from the standard or core set of tones in the Javanese pélog scale do elicit a P300, just as

Empirical Musicology Review Vol. 1, No. 4, 2006
192
deviations from the C major diatonic scale do (Bischoff Renninger, et al., 2003). Musicians without prior
experience with the Javanese system (control subjects) show less of a P300 response to the pélog scale
condition. The average P300 amplitude of the control group to the targets in both the diatonic and java
conditions respectively is significantly smaller than that of the experimental subjects who have had more
experience with the pélog scale, F(1,100) = 89.641, p < .05, F(1,100) = 8.08, p < .05.
Hence, it appears that deviations from the standard or core set of tones in the Javanese pélog scale
do elicit a P300, just as deviations from the C major diatonic scale do (Bischoff Renninger, et al., 2003).
As can also be seen in Figure 3, musicians without prior experience with the Javanese system (the control
subjects) showed less of a P300 response to the pélog scale condition. The average P300 amplitude of the
control group to the targets in both the diatonic and java conditions respectively was significantly smaller
than that of the experimental subjects who had had more experience with the pélog scale, F(1,100) =
89.641, p < .05, F(1,100) = 8.08, p < .05. Interestingly, however, the control subjects also showed a
significantly faster P300 latency with respect to the auditory conditions, F(1,2) = .10, p < .05. The slower
and less accurate overt responses, as well as the longer P300 latencies of the experimental subjects ran
counter to our initial hypotheses. Possible reasons for these data are discussed below.
DISCUSSION
We began this experiment with three key questions: first, whether or not non-pélog scale tones
would elicit a P300 just as nondiatonic tones had (Bischoff Renninger, et al., 2003); second, if and how
musicians who were not familiar with the Javanese musical system would even be able to recognize non-
pélog scale tones after only brief training; and third, if there were differences in the P300 response to non-
pélog scale tones between musicians with and without experience in the Javanese musical system. In
regards to our first question, deviations from the standard set of tones in a Javanese pélog scale do elicit a
P300 just like deviations from the C-major diatonic scale in Bischoff Renninger et al. (2003). In regard to
our second question, the post-experimental debriefing session was particularly enlightening. Since our
control subjects were unfamiliar with the sound of the pélog scale used in this experiment, many claimed
that upon first hearing the scale presented, they simply assimilated the intervals to those in the Western
equal-tempered scale similar to the way subjects did in the Perlman and Krumhansl (1996) study. In order
to determine deviations from the pélog scale, they also focused on cues such as pitch height. For instance,
many control subjects remarked that the 504 Hz non-standard tone (seventh scale degree) of the pélog scale
sounded “too high” to fit into the group of core pélog tones. Many even claimed that this listening strategy
made the Java condition easier than the diatonic condition. They also claimed that the fewer non-standard
scale tones in the Java condition compared to the nondiatonic condition made the Java condition easier.
The experimental subjects, on the other hand, claimed that the Java condition was difficult for them, not
because they were unfamiliar with the interval relationships of the scale, but because the timbral cues were
missing from the sine tones. They had become accustomed to hearing the overtones from the various
instruments in the gamelan and they claimed that these cues always helped them to detect scalar deviations.
Hence, another reason for their slower responses may be that they compared the sine tones they heard in the
experiment to their internal framework of the pélog scale. When these frameworks did not exactly
correspond due to the lack of timbral cues, their processing time was delayed.
In regards to our third question, prior experience does seem to matter. Even after training,
musicians without prior experience in the Javanese system show a smaller P300 response to the pélog scale.
However, it was still puzzling why the control subjects collectively showed a smaller P300 response when
both the latency and overt response data indicated that they were faster and more accurate than the
experimental group in every condition. In order to explore this further, we decided to take closer look at
the individual subject data (see Figures 4 and 5).

Empirical Musicology Review Vol. 1, No. 4, 2006
193
Fig. 4. Individual Subject Data – Diatonic Condition.

Empirical Musicology Review Vol. 1, No. 4, 2006
194
Fig. 5. Individual Subject Data – Java Condition
Grand averages often hide individual processes, so an analysis of each subject’s data has proven to
be a useful tool, especially in P300 research (Klein et al., 1984; Bischoff Renninger et al., 2003). A closer
look at the initial subject surveys revealed that although none of the subjects were tested for absolute pitch,
the pitch naming abilities of the control subjects were very acute. For example, subject 3c claimed that she
can “often identify and produce the pitches of middle-C (C4), A4 and Bb4.” However, her ability is
weakened when the pitches are very high or very low. Subject 1c claimed that he can “sometimes produce
an E or an F above middle C (E5 and F5),” and subject 5c claimed that she can “sometimes produce a
middle-C (C4) or a G below middle C (G3).” These characteristics are all indications of possible quasi-
absolute pitch abilities [5] in these subjects. These subjects individually showed reduced P300s (see Figure
4). This finding correlates with several studies that have indicated a reduced P300 component in absolute
pitch subjects during aural tasks (Klein et al., 1984; Hantz et al., 1992; Wayman et al., 1992; Crummer et
al., 1994; Bischoff Renninger et al., 1995 -- unpublished data; Johnston, 1994; Hantz et al., 1992; Wayman
et al., 1992; Crummer et al., 1994; Bischoff Renninger et al., 2003). This may explain why the grand
average of the P300 in the control group was smaller than the grand average of the P300 in the

Empirical Musicology Review Vol. 1, No. 4, 2006
195
experimental group, even though the control subjects performed better overtly.
CONCLUSION
In summary, our study has yielded several interesting findings. First, our results demonstrate that
responses to scalar deviations found in earlier experiments do appear, at least so far, to carry over to non-
Western musical systems. Current results also corroborate earlier evidence by Perlman and Krumhansl
(1996) that suggest listeners assimilate intervals in unfamiliar scales to a familiar internal scalar context.
We believe that this assimilation process was one of the primary reasons our subjects responded to the
same tones in very different ways. Finally, we have found that a closer look at individual ERP data, as well
as reaction time and accuracy data, has helped shed greater light on processing strategies. For instance,
subjects with evidence of quasi-absolute pitch abilities showed smaller P300 amplitudes to the target tones.
Their responses certainly had an effect on the control group grand average and helped to clarify some of the
results.
Overall, ERPs have proven to be a highly useful tool in testing models of information processing
within the context of music perception. It is indeed our hope that more extensive ERP studies of non-
Western musical systems will be forthcoming.
NOTES
[1] Address correspondence to Laura Bischoff Renninger, Interim Dean of Teaching and Learning,
Shepherd University, Shepherdstown, West Virginia 25443 (email: [email protected]).
[2] Absolute Pitch is generally defined as the ability to name and/or produce a pitch without being provided
with a reference pitch.
[3] There is considerable evidence that the P300 resides at the low end of the spectrum (see, e.g., Duncan-
Johnson & Donchin, 1977). They report substantial effects on P300 amplitude when there is a change in
the low pass from 0.01 to 0.1, but little effect of expanding the high pass beyond 8-10 Hz. Our specific
choice of bandwidth reflected our interest in the P300 and our preference to avoid contamination of the
results by alpha activity and other sources of noise.
[4] Statistics for the overt behavioral responses: Diatonic Accuracy: F (1,8) = 0.193, p < .05; Java
Accuracy: F (1, 8) = 0.774, p < .05; Visual Accuracy: F (1,8) = 0.002, p < .05; Diatonic Reaction Time: F
(1,8) = 1.108, p < .05; Java Reaction Time: F (1,8) = 2.274, p < .05; Visual Reaction Time: F (1,8) =
2.705, p < .05.
[5] Quasi-Absolute Pitch means that subjects can identify one or two pitches (usually A=440 Hz or middle
C) and then relate others to them (Bachem, 1955).
REFERENCES
Bachem, A. (1955). Absolute pitch. Journal of the Acoustical Society of America, Vol. 27, pp. 1180-1185.
Besson, M., Faïta, F., & Requin, J. (1994). Brain waves associated with musical incongruities differ for
musicians and non-musicians. Neuroscience Letters, Vol. 168, pp. 101-105.
Besson, M., & Macar, F. (1987). An event-related potential analysis of incongruity in music and other non-
linguistic contexts. Psychophysiology, Vol. 24, pp. 14-25.

Empirical Musicology Review Vol. 1, No. 4, 2006
196
Bischoff Renninger, L.A., Granot, R., & Donchin, E. (2003) Absolute pitch and the P300 component of
the event-related potential: An exploration of variables that may account for individual differences. Music
Perception, Vol. 20, No. 4, pp. 357-382.
Cohen, D., & Erez, A. (1991). Event-related potential measurements of cognitive components in response
to pitch patterns. Music Perception, Vol. 8, pp. 405-430.
Cohen, D., Granot, R., Pratt, H., & Barneah, A. (1993). Cognitive meanings of musical elements as
disclosed by event-related potential (ERP) and verbal experiments. Music Perception, Vol. 11, No. 2, pp.
153-184.
Cook, E.W., & Miller, G. (1992). Digital filtering: Background and tutorial for psychophysiologists.
Psychophysiology, Vol. 29, No. 3, pp. 350-367.
Crummer, G.C., Walton, J.P., Wayman, J., Hantz, E.C., & Frisina, R.D. (1994). Neural processing of
musical timbre by musicians, nonmusicians, and musicians possessing absolute pitch. Journal of the
Acoustical Society of America, Vol. 95, No. 5, pp. 2720-2727.
Donchin, E. (1981). Surprise!. . . Surprise? Psychophysiology, Vol. 18, No. 5, pp. 493-513.
Donchin, E., & Coles, M. G. H. (1988). Precommentary: Is the P300 Component a manifestation of
context updating? Behavioral and Brain Sciences, Vol. 11, No. 3, pp. 357-374.
Dowling, W. J. (1978). Scale and contour: Two components of a theory of memory for melodies.
Psychological Review, Vol. 85, pp. 341-354.
Dowling, W. J., & Harwood, D. L. (1986). Music Cognition. Orlando: Academic Press, Inc.
Ford, J., Roth, W., & Kopell, B. (1976). Auditory evoked potentials to unpredictable shifts in pitch.
Psychophysiology, Vol. 13, No. 1, pp. 32-39.
Gratton, G., Coles, M.G.H., & Donchin, E. (1983). A new method for off-line removal of ocular artifact.
Electroencephalography and Clinical Neurophysiology, Vol. 55, pp. 468-484.
Hantz, E.C., Crummer, G.C., Wayman, J.W., Walton, J.P., & Frisina, R.D. (1992). Effects of musical
training and absolute pitch on the neural processing of melodic intervals: A P3 event-related potential
study. Music Perception, Vol. 10, No. 1, pp. 25-42.
Hantz, E.C., Kreilick, K.G., Braveman, A.L., & Swartz, Kenneth P. (1995). Effects of musical training and
absolute pitch on a pitch memory task: An event-related potential study. Pyschomusicology, Vol. 14, pp.
53-76.
Hantz, E.C., Kreilick, K.G., Kananen, W., & Swartz, K.P. (1997). Neural responses to melodic and
harmonic closure: An event-related-potential study. Music Perception, Vol. 15, No. 1, pp. 69-98.
Klein, M., Coles, M.G.H., & Donchin, E. (1984). People with absolute pitch process tones without
producing a P300. Science, Vol. 223, pp. 1306-1309.
Krumhansl, C. L. (1990). Cognitive Foundations of Musical Pitch. New York: Oxford University Press.
Paller, K.A., McCarthy, G., & Wood, C.C. (1992). Event-related potentials elicited by deviant endings to
melodies. Psychophysiology, Vol. 29, No. 2, pp. 202-206.
Perlman, M., & Krumhansl, C. (1996). An experimental study of internal interval standards in Javanese and
Western musicians. Music Perception, Vol. 14, No. 2, pp. 95-116.

Empirical Musicology Review Vol. 1, No. 4, 2006
197
Sutton, S., Tueting, P., Zubin, J., & John, E.R. (1965). Information delivery and the sensory evoked
potential. Science, Vol. 155, pp. 1436-1439.
Takeuchi, A.H., & Hulse, S.H. (1993). Absolute pitch. Psychological Bulletin, Vol. 113, No. 2, pp. 345-
361.
Wayman, J.W., Frisina, R.D., Walton, J.P., Hantz, E.C. & Crummer, G.C. (1992). Effects of musical
training and absolute pitch ability on event-Related activity in response to sine tones. Journal of the
Acoustical Society of America, Vol. 91, No. 6, pp. 3527-3531.


![Untitled-3 [content.alfred.com] · 2017-10-03 · LESSON I Pitch 2 Pitch 3 Pitch 4 Pitch 5 Pitch 6 Pitch 7 Pitch 8 Pitch 10 Pit h 11 Pitch 12 Pitch 13 Pitch 14 Pitch 15 Pitch 16 Pitch](https://img.pdfslide.net/doc/110x75/5f1f182654507e355339a7ee/untitled-3-2017-10-03-lesson-i-pitch-2-pitch-3-pitch-4-pitch-5-pitch-6-pitch.jpg)