Embed Size (px)
Citation preview

0
Gretta Fitzgerald Researcher Dept. of Food Business & Development University College Cork March 2015
Part 1 The Production of Ready to Use Therapeutic Food in Malawi:
Smallholder farmers’ experience with groundnut production
Results from a four year livelihoods analysis in Malawi’s Central Region

0

i
Table of Contents
List of Tables ............................................................................................................... iii
List of Figures ............................................................................................................... iv
List of Acronyms ........................................................................................................... v
Glossary ........................................................................................................................ vi
Acknowledgements ..................................................................................................... vii
Executive Summary ................................................................................................... viii
Section 1: Introduction ................................................................................................... 1
Report Structure ............................................................................................................. 2
The Intervention ......................................................................................................... 2
Country Context ......................................................................................................... 4
Section 2: Methodology ................................................................................................. 7
Household Questionnaire ........................................................................................... 8
Focus Group Discussions ........................................................................................... 9
Semi-Structured Interviews ....................................................................................... 9
Market Visits and Trader Interviews ......................................................................... 9
Direct Observation ................................................................................................... 10
Study Ethics ............................................................................................................. 10
Statistical Analysis ................................................................................................... 10
Section 3: Study Sample .............................................................................................. 10
Section 4: Study Areas ................................................................................................. 12
Lilongwe .................................................................................................................. 12
Mchinji ..................................................................................................................... 12
Salima ...................................................................................................................... 12
Section 5: Livelihood Status of Households ................................................................ 14
Wealth Groups ......................................................................................................... 14
Food Security ........................................................................................................... 15
Household Food Insecurity Access Scale (HFIAS) ............................................. 16
Household Diet Diversity Score (HDDS) ............................................................ 20
Hunger Gap .......................................................................................................... 21
Human Capital: Health Status .................................................................................. 21
Financial Capital: Access to Saving & Credit 2013 ................................................ 24
Natural Capital: Livestock Ownership..................................................................... 26
Section 6: Crop Production as a Livelihood Strategy .................................................. 28
Land Ownership & Cultivation ................................................................................ 28
ii
Rainfed Cultivation .................................................................................................. 31
Maize Cultivation................................................................................................. 32
Groundnut Cultivation ......................................................................................... 35
Soya Bean Cultivation ......................................................................................... 43
Tobacco Cultivation ............................................................................................. 46
Cotton Cultivation ................................................................................................ 47
Dry Season/Wetland (Dimba) Cultivation ............................................................... 48
Summary .................................................................................................................. 49
Section 7: Non- and Off-Farm Livelihood Strategies .................................................. 50
Paid Employment ..................................................................................................... 51
Migration & Remittances ......................................................................................... 53
Non-Agricultural Enterprises ................................................................................... 53
Section 8: Social Protection and Supports ................................................................... 56
Farm Input Subsidy Programme (FISP) .................................................................. 56
Extension Services ................................................................................................... 57
Section 9: Livelihood Change over Time .................................................................... 60
Main Income Sources .............................................................................................. 60
Limiting factors for Change in Livelihoods............................................................. 61
Section 10: Groundnut Value Chain participation ....................................................... 63
Association participation (2012-13) ........................................................................ 64
Aflatoxin Awareness ................................................................................................ 65
Emerging Quality Groundnuts in Shell (NIS) Markets ........................................... 67
Observations from the 2013 NIS Market ................................................................. 70
Section 11: Conclusions ............................................................................................... 72
Households Hanging On .......................................................................................... 72
Smallholder Farmers: High Quality Groundnut Producers ..................................... 72
Bibliography ................................................................................................................ 73
Annex 1: Description of Variables .............................................................................. 82
Annex 2: Statistical Tables .......................................................................................... 84
Annex 3: Consumer Price Index .................................................................................. 85
iii
List of Tables
Table 1: Distribution of Sample 11 Table 2: Wealth Ranking Criteria 15 Table 3: Distribution of Households by Wealth Ranking 15 Table 4: Maize Consumption from Own Production (kg/per capita) 16 Table 5: Mean HDDS of Wealth Groups by Year 20 Table 6: Percentage Distribution of Household Hunger Gap 21 Table 7: Frequency of Actions Taken to Treat Illness Reported by Year 23 Table 8: Households Accessing Financial Services 2010 - 2013 24 Table 9: Location of Households Savings 2010 - 2013 24 Table 10: Source of Household Credit 2010 - 2013 25 Table 11: Reasons for Households Obtaining Credit 2010 - 2013 25 Table 12: Mean Number of Livestock Owned by Households 2010 - 2013 26 Table 13: Data Collected by Survey 28 Table 14: Land Ownership 2010 & 2013 (ha) 29 Table 15: Land Rented Out by Households (2010-2013) 30 Table 16: Land Rented In by Households (2010-2013) 30 Table 17: Household Maize Production by Variety 32 Table 18: Improved Maize Gross Margins for FISP and Non-FISP Beneficiaries (2011-12) 33 Table 19: Distribution of Fertiliser Sources by Maize Variety 33 Table 20: Distribution of Local Maize Fertiliser Type Applied by Season 34 Table 21: Distribution of Improved Maize Fertiliser Type Applied by Season 34 Table 22: Maize Sales by Household 34 Table 23: No. of HHs Cultivating Groundnut (n) & Area Cultivated (ha) by Year 35 Table 24: Household Groundnut Quantity Harvested (kg) & Yield (kg/ha) by Season 36 Table 25: Groundnut Yield (kg/ha) by Season & Association Membership 36 Table 26: Source of Purchased Seed 37 Table 27: Household Groundnut Sales 38 Table 28: Groundnut Sale Prices Received by Households 42 Table 29: No. of HHs Cultivating Soya Bean (n) & Area Cultivated (ha) by Year 43 Table 30: Quantity of Soya Bean Harvested (kg) & Yield (kg/ha) 44 Table 31: Soya Bean Sales per Household by Season 44 Table 32: No. of HHs Cultivating Tobacco (n) & Area Cultivated (ha) by Year 46 Table 33: Quantity of Tobacco Harvested & Yield 47 Table 34: Tobacco Sales by Season 47 Table 35: Cotton Production by Season 47 Table 36: Cotton Sales by Season 48 Table 37: Households Cultivating Dimba Crops (% of all households) 48 Table 38: Household Crop Combinations by Season 49 Table 39: Household Crop Combinations by Wealth Group 50 Table 40: HHs with Members Carrying out Paid Work in the Last 7 Days 51 Table 41: Frequency Distribution of Types of Paid Work 53 Table 42: HHs with Non-Agricultural Enterprises 54 Table 43: Distribution of Types of Non-agricultural Enterprises 54 Table 44: Annual Net Income from Non-Agricultural Enterprise 54 Table 45: % Distribution of FISP Beneficiaries Overall and by Wealth Group 56 Table 46: Number of Extension Visits Received by Households in the Last 12 Months 58 Table 47: Household Income Matrix 60 Table 48: Household Real Income from Main Sources (MK) (2010 and 2013) 61 Table 49: Groundnut Gross Margins, Mchinji Demonstration Plots (2012-13) 63 Table 50: Percentage Distribution of Household 64 Table 51: Percentage Distribution of Respondents Reporting Awareness of Aflatoxin 65 Table 52: No. of Respondents Correctly Reporting an Aflatoxin Effect on Health 65
iv
List of Figures
Figure 1: RUTF Value Chain 3 Figure 2: Sustainable Livelihoods Framework (DFID, 1999) 7 Figure 3: Map of Malawi 13 Figure 4: HFIAS Score Percentage Distribution Overall Sample 18 Figure 5: HFIAS Score Percentage Distribution by Wealth Groups in 2010 19 Figure 6: HFIAS Score Percentage Distribution by Wealth Groups in 2013 19 Figure 7: Seasonal Calendar % Critical Event Timeline (FEWSNET, 2011) 21 Figure 8: Number of Case Reported by Illness(2010-2013) 22 Figure 9: Mean Illness Scores by Wealth Groups 23 Figure 10: Mean Monetary Value of Livestock Owned by Households (MK) 2010-13 27 Figure 11: Mean Monetary Earnings From Livestock Sold by Households (MK) 2010-13 27 Figure 12: Distribution of Land Cultivated (ha) 2010 - 2013 29 Figure 13: Nominal and Real Rentals Paid/Received by Households (2010-2013) 30 Figure 14: Reason Attributed to Leaving Land Uncultivated by Household (2010-2013) 31 Figure 15: Seasonal Calendar & Critical Events Timeline (FEWSNET, 2011) 31 Figure 16: Groundnut Yield (kg/ha) by Season & Association Membership 37 Figure 17: Proportion of Groundnut Sales by Gender 39 Figure 18: Proportionate Share of Buyers for NIS sold (2010-11) 40 Figure 19: Proportionate Share of Buyers for NIS sold (2011-12) 40 Figure 20: NIS Sales (2010-11) Percentage Breakdown of Reason for Selling to First Buyer 41 Figure 21: NIS Sales (2011-12) Percentage Breakdown of Reasons for Selling to First Buyer 41 Figure 22: Groundnut Sale Prices Adjusted to Real Prices 42 Figure 23: Proportionate Share of Buyers for Soya Bean by Season 45 Figure 24: Proportionate Share of Reasons for Selling Soya Bean to First Buyer by Season 46 Figure 25: Median Income Received by Households 52 Figure 26: Median Hourly Rate by Gender of Household Head (MK/hr) 52 Figure 27: Distribution of FISP Beneficiaries by Wealth Group 57 Figure 28: % No. of Coupons Received for the 2012-13 Season 57 Figure 30: Percentage Breakdown of Types of Extension Advice Given to Households 59 Figure 30: Types of Training Attended in 2013 65 Figure 31: No. of Households Aware of up to Three Techniques to Combat Aflatoxin 66 Figure 32: Groundnut Markets Available and Key Stakeholders 69
v
List of Acronyms
ACE Agricultural Commodity Exchange
ADMARC Agricultural Development and Marketing Corporation Malawi
ASWAP Agriculture Sector Wide Approach
AHCX Auctions Holdings Commodity Exchange
CTC Community-based Therapeutic Care
DFID Department for International Development
EAA ExAgris Africa
FANTA Food and Nutrition Technical Assistance, USAID
FGD Focus Group Discussion
FHH Female Headed Household
FISP Farm Input Subsidy Programme
HEA Household Economy Approach
HFIAS Household Food Insecurity Access Scale
MGD Malawi Growth and Development Policy
MHH Male Headed Household
MoAFS Ministry of Agricultural and Food Security (Malawi)
NASFAM National Smallholder Farmers’ Association of Malawi
NIS Nuts in Shell (refers to unshelled groundnuts)
RUTF Ready-to-Use Therapeutic Food
SAM Severe Acute Malnutrition
SLF Sustainable Livelihoods Framework
VN Valid Nutrition
WASAA Women in Agri-Business in Sub Saharan Africa
vi
Glossary
Chichewa The predominant language of Malawi, spoke by approximately 90%
of the population
Dambo Naturally occurring marshland used in the irrigation of dimba
gardens
Dimba Dry-Season cultivation
Ganyu Casual Labour usually of an agricultural nature, which may be paid
in cash or food.
Likuni Phala Maize/soya porridge
Nsima Maize porridge
vii
Acknowledgements1
This research project was developed with support from many individuals and
organisations. Several individuals deserve special mention. Howard Dalzell, Mike
FitzGibbon and Nick Chisholm who in collaboration with Jim Goodman of ExAgris
Africa and Happy Botha of Valid Nutrition developed the research concept and
provided technical oversight throughout the project. Michael Magee, who developed
the baseline methodology and conducted the data collection in 2010, along with
Michael, Emmanuel Eze who followed up on the 2011 data collection. Also, special
mention should be given to Liam Kavanagh who played an important role in the
transformation of the household survey into digital format. Richard Kachule supported
in the sourcing of experienced enumerators and contributed to the overall research
project with valuable insights and analysis of the macro-economic context. The
ExAgris Africa extension offices, namely Mr. Neba, Stella Kachoka and Nelson
Msebezi, who facilitated the data collection activities. Dalitsio Odella and the Valid
Nutrition Malawi team for their logistical support. Finally, Irish Aid who without their
budgetary support this project would have not been possible.
Disclaimer
The opinions and recommendations are those of the author, and do not necessarily
reflect the views of the organizations/stakeholders or its individual members.
1 Cover Photo: Staff member from Exagris Africa at a Groundnut Quality Training Course 2013, taken by Gretta
Fitzgerald.

viii
Executive Summary
This report provides a comprehensive analysis of the impact on farming household
livelihoods of a specific market-led intervention – a guaranteed groundnut purchasing
scheme for smallholder farmers. This intervention is part of an overall aim to develop
a locally-based value chain to produce Ready-to-Use Therapeutic Foods (RUTF).
Between 2010 and 2013 the same 200 (±) farmers were surveyed annually to collect
information about their groundnut production and livelihoods. Most of the farmers
involved in the research received agricultural extension services provided through their
local associations facilitated by one of the research partners. A control group did not
receive such support.
The Sustainable Livelihoods Framework was used as a conceptual tool resulting in the
investigation of various household assets that fall under the human, social, physical,
financial and natural capital categories. Given the context food security was looked at
through a number of established indicators. For each of the food security indicators
there was always a significant proportion of the sample that fell into categories that
would class them as being food insecure, be it through limited access or quality of food.
Households’ access to finance increased considerably over the study period through
Village Savings and Loans (VSLA) groups. Participation in such groups was
predominantly by women and the amounts saved and borrowed were very small, only
covering some basic household needs. Access to credit at the scale whereby farmers
can invest in agricultural inputs remains limited, if not non-existent in many of the study
areas covered.
In terms of livelihood strategies results show how households continue to rely on crop
production, livestock and casual labour for their livelihoods. However, significant
changes occurred in which crops farmers are choosing to cultivate. Tobacco cultivation
has declined but there have been considerable increases in the production of
groundnuts, soya and other food crops. Increases in productivity can be seen through
the increased yields in both groundnuts and soya. Disaggregation by association
membership shows that those who participate in training and receive extension visits
have significantly higher yields and sell more produce to the market. However, the
majority of crop sales over the study period were at farm gate, where prices are at their
lowest. This shows the immaturity of the output markets.
A key barrier to local production of RUTF is aflatoxin contamination, largely caused
by post-harvest handling; the studied intervention has a strong focus on building the
capacity of farmers to be able to produce export quality groundnuts suitable for RUTF
manufacture. This was complemented with attempts to develop the high value
groundnut markets in the study areas through a number of Nut in Shell (NIS) markets,
whereby groundnuts were bought sorted and in their shell. The presence of this market
ix
created a more diversified market place for groundnuts. Previously the main option for
farmers was traditional informal buyers whereby nuts are typically bought shelled and
at the farm gate. The NIS market saw farmers gaining premium prices, a reduction in
labour required for post-harvest handling (i.e. families no longer have to shell
groundnuts) and reduced health risks from aflatoxin contamination.
Cumulatively, key results show that despite significant improvements in productivity
of the focus cash crop, groundnuts, the livelihood status of households in terms of
livelihood capital assets (e.g. human, social, financial, natural, and physical) appears to
have remained stagnant over the study period. This highlights the need for integrated
policy and large scale interventions that address gaps that are limiting positive returns
from projects such as the studied market-led intervention. A prime example of this
would be to address the absence of a functioning and appropriate financial market for
smallholder farmers. Other promising interventions include addressing long term
deficiencies in input/output market development, the provision of extension services,
investment in road infrastructure, and the support of associations/cooperatives.
1
Section 1: Introduction
This report is part of a four-year research project carried out by University College
Cork on behalf of Valid Nutrition. The purpose of the study was to establish a
comprehensive analysis of the impact on farming household livelihoods of a specific
market-led intervention – a guaranteed groundnut purchasing scheme for smallholder
farmers2 - as part of an overall aim to develop a locally-based value chain to produce
Ready-to-Use Therapeutic Foods (RUTF). The study, and the guaranteed groundnut
purchasing scheme, was undertaken in collaboration with ExAgris Africa (EAA)3.
The groundnut purchasing scheme has the economic objective of transforming
smallholder farmers into reliable suppliers of groundnuts who can adhere to stringent
export standards. As many of the stakeholder organisations have a strong social ethos,
the intervention was designed with the higher level objectives of reducing poverty and
food insecurity levels of the rural economy in which the groundnut value chain is being
developed - in this case Malawi’s Central Region.
This report examines change in the livelihood status of a cross-sectional sample of rural
farming households between the 2009 and 2012 cropping seasons in Malawi. Farmers
involved in the research were either beneficiaries of the mentioned market-led
intervention for the duration of the investigation, whereby agricultural extension
services were provided to local associations (i.e. beneficiary or treatment group), or did
not receive such support for its duration (i.e. control group). Other components of the
study (not discussed here) investigated the main institutional factors influencing the
effectiveness of the market led intervention on the targeted households.
The specific research objectives were as follows:
1. Identify the food security and livelihood situation of the selected households,
including the agricultural production, physical assets, health, and household
food consumption.
2. Identify the current on-farm and off-farm income generating activities of
households.
3. Identify constraining factors on the efforts to improve livelihoods.
4. Determine the coping strategies employed by households and the existing
formal and informal social support systems available.
5. Determine the level of uptake by households of groundnuts as a reliable food
and cash crop.
2 A smallholder farmer from herein will be defined as a farming household with a low asset base and cultivating
approximately two hectares and less (Okidegbe, 2001; Nagayets 2005; World Bank 2003). 3 ExAgris Africa is a private agricultural company with a strong emphasis on social responsibility.
2
Report Structure
The structure of the report is based around the Sustainable Livelihoods Framework and
uses some of its main components. Sections 1 to 4 describe the overall livelihoods
status; the welfare of households is investigated in Section 5 in terms of the food
security, human, financial and natural capital of households; in addition the wealth
status of households is also determined. The main livelihood strategy, crop production,
is looked at in detail in Section 6, where the main crops cultivated by households are
presented. Other non- and off-farm livelihood strategies are explored in Section 7.
Social protection is then looked at in brief using data collection around the national
Farm Input Subsidy Programme (FISP) and the provision of extension services. A
narrative overview of the overall livelihood changes over the study period is given in
section 9. This then leads to Section 10, which takes a more in-depth look at the studied
intervention and its impact. Finally, conclusions are drawn in Section 11, where the two
main conclusions are discussed: how households remain highly vulnerable due to lack
of assets or returns on assets and other key issues, and how the intervention and
households’ participation in the RUTF value chain development has potential. However
the vulnerabilities of households and the lack of adequate infrastructure and institutions
at the meso and macro levels are impeding developments.
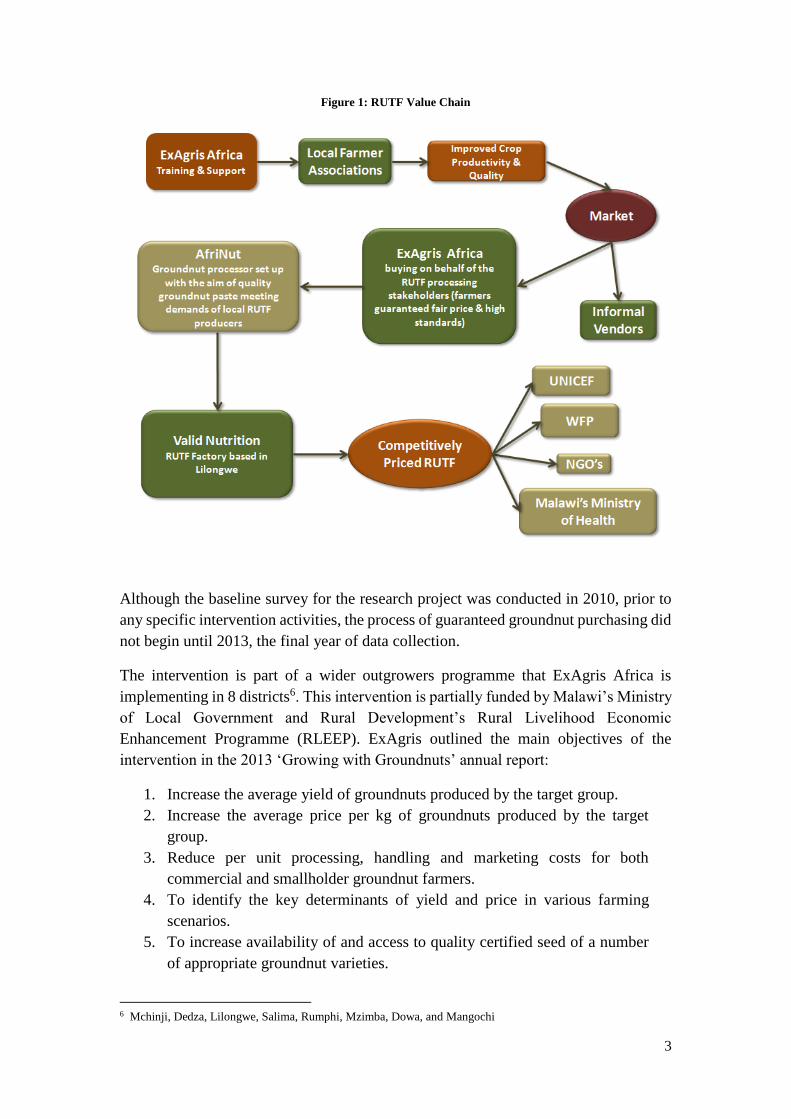
The Intervention
Farmers involved in the research were either beneficiaries of the mentioned market-led
intervention for the duration of the investigation, whereby agricultural extension
services were provided to local agricultural associations, or did not receive such support
for its duration. It was envisaged that the targeted smallholders would sell their
groundnuts graded and in their shell to ExAgris. At the buying station these groundnuts
would be bulked, further graded and packaged before being sold onto AfriNut4. AfriNut
would then process the nuts into peanut paste and supply to Valid Nutrition to process
into RUTF5, thus, in the broadest sense, creating a sustainable value chain (Figure 1).
4 AfriNut is a ‘pro-poor peanut processor’, whose shareholders include: Twin, NASFAM, ExAgris Africa Ltd.,
Cordaid, and the Waterloo Foundation. 5 Ready-to-Use Therapeutic Food (RUTF) is a highly nutritional groundnut based paste that is used in the
treatment of Severe Acute Malnutrition in young children.
3
Figure 1: RUTF Value Chain
Although the baseline survey for the research project was conducted in 2010, prior to
any specific intervention activities, the process of guaranteed groundnut purchasing did
not begin until 2013, the final year of data collection.
The intervention is part of a wider outgrowers programme that ExAgris Africa is
implementing in 8 districts6. This intervention is partially funded by Malawi’s Ministry
of Local Government and Rural Development’s Rural Livelihood Economic
Enhancement Programme (RLEEP). ExAgris outlined the main objectives of the
intervention in the 2013 ‘Growing with Groundnuts’ annual report:
1. Increase the average yield of groundnuts produced by the target group.
2. Increase the average price per kg of groundnuts produced by the target
group.
3. Reduce per unit processing, handling and marketing costs for both
commercial and smallholder groundnut farmers.
4. To identify the key determinants of yield and price in various farming
scenarios.
5. To increase availability of and access to quality certified seed of a number
of appropriate groundnut varieties.
6 Mchinji, Dedza, Lilongwe, Salima, Rumphi, Mzimba, Dowa, and Mangochi
4
Through the provision of agricultural extension services good progress has been made
towards these objectives. Farmer associations and groups are supported by the
extension advisors in the set-up of sustainable seed systems, and train famers in
agronomic practices through the use of demonstration plots, field visits and other
activities. There are several agronomic practices that ExAgris is promoting through the
groundnut out-growers scheme. These include: early planting, use of improved seed,
increased plant population, scouting for pests and diseases and control where
economically viable for the small holder, fertilizer application and improved harvesting
and drying. Associations and groups are also trained in the calculation of gross margins
to enable them to estimate financial benefits of additional costs, and to enable them to
make comparisons between crops with the aim of them being able to make more
informed planting decisions in the future (ExAgris Africa, 2013).
Country Context
Malawi has an agrarian-based economy with 85 percent of households engaged in
various agricultural activities (National Statistical Office, 2012). Rural employment is
predominantly made up of smallholder farmers cultivating plots of on average 1.4
hectares (National Statistical Office, 2012). Development of Malawi’s agricultural
sector has been one of the country’s main priorities since independence in 1964, yet the
country still faces annual national food deficits. Agricultural development is seen to be
the solution for food insecurity, rural poverty, vulnerability, and stagnant GDP growth.
Since independence in 1964 the government, multilateral organisations, non-
governmental organisations, and the estate sector, have predominantly led agricultural
development policy and initiatives in Malawi. However, the private sector is now
playing an increasing role in the implementation of agricultural development initiatives
in the country. Out-grower schemes, contract farming and provision of off-farm
employment on plantations/estates are a few examples of such initiatives. However, at
household level, many farmers still employ cultivation practices and cropping strategies
that prioritise food security over income. Through the ‘commercialisation’ of
smallholder farmers it is thought that increased incomes will enable households to meet
basic needs, build up productive assets, and reduce their own vulnerability. However,
commercialisation in the form of market integration is argued to increase uncertainty
and risk because subsistence is replaced with the insecurity of unstable markets and
volatile prices (Ellis, 1988).
With regard to groundnuts, in 2012, the FAO ranked Malawi as the thirteenth highest
producer of groundnut (with shell) in the world. This is no mean feat for a small land-
locked country whose mainly agrarian economy has limited resources and is over-
reliant on rainfed production, which is increasingly vulnerable to droughts and floods.
Along with the staple crop maize, groundnut is a key crop grown in Malawi with
approximately 368,081 hectares allocated to it in 2012 (MoAFS, 2012).
5
In Malawi groundnuts were once a popular export crop with 64 percent of the total
produce being exported in the 1980s; this declined to 0.2 percent in the 1990s (Diaz
Rois, et al., 2013). The decline is attributed to several factors: structural adjustment
programme and liberalisation of the agricultural sector; deterioration of prices; a fall-
off in the use of improved seed; land pressure; changes in international demand; and
the introduction of stringent maximum allowable levels (MALs) for aflatoxin
contamination by importers, in particular the EU (Diaz Rois, et al., 2013).
Following the drop off in production in the 1990s, groundnuts have made a significant
comeback with production growing at an average annual rate of 8 percent since 2000,
this growth coming largely from the smallholder sector (Diaz Rois, et al., 2013). For
smallholder farmers, groundnuts are seen as an increasingly attractive crop to grow, as
there is improved awareness around the nutritional benefits for producing households
and the nitrogen fixing properties for farmers’ soil. With regard to the economic
benefits, farmers see groundnuts as having relatively good gross margins, especially
since prices for the traditional cash crop tobacco have become unpredictable and
vulnerable to anti-tobacco campaigns and increased cost of inputs. However, for
groundnuts, the problem of aflatoxin contamination has not been overcome. Currently,
it is estimated that only 15 percent of groundnuts produced are exported7; 25% are for
local retail and wholesale markets; and 60% for informal local markets and
consumption (CYE Consult, 2009, Diaz Rois, et al., 2013).
Malawi’s agricultural markets tend to be inefficient, lacking adequate infrastructure and
institutions. A culture of non-compliance to grades and standards throughout supply
chain systems limits opportunities for farmers by creating barriers to high value agro-
processing and export markets. The majority of the estimated 80 percent of groundnuts
that stay within Malawi’s borders are traded with minimal grading and sold at one set
price (Sangole, et al., 2010). This was not always the case: prior to the liberalisation of
agricultural markets the monopoly parastatal ADMARC (Agricultural Development
and Marketing Corporation) enforced strict grades and standards for groundnuts. These
established grades and standards still exist today, however since liberalisation weak
enforcement mechanisms have led to the development of the current low-value, low-
quality groundnut sector.
This culture of non-compliance to established grades and standards is changing. Recent
developments in the private sector, such as the intervention being studied here, have
created increased local demand for high value aflatoxin-free groundnuts. This demand
can be linked with the emergence of a number of private sector actors; Valid Nutrition
and Project Peanut Butter, both local producers of the groundnut based Ready-to-Use
Therapeutic Food (RUTF); TWIN and NASFAM (National Association of Smallholder
Farmers) who have been buying nuts for the UK fairtrade market since the early 2000s;
and the more recent establishment of AfriNut Ltd - a groundnut processing company
7 Mainly regionally to eastern and southern Africa with poor regulation; the best quality sent to EU via processing in South
Africa.
6
set up to target EU markets. It is envisaged that such demand will have wider social
and economic impacts for smallholder groundnut producers and consumers in Malawi.
7
Section 2: Methodology
The studied intervention targets approximately 3,000 smallholder-farming households
in three districts – Mchinji, Lilongwe and Salima - across the central region in Malawi.
The longitudinal study captured data from the 2008-2009 cropping season through to
the 2012-2013 cropping season. A mixed method approach was taken for each year of
the study by combining qualitative approaches and quantitative approaches.
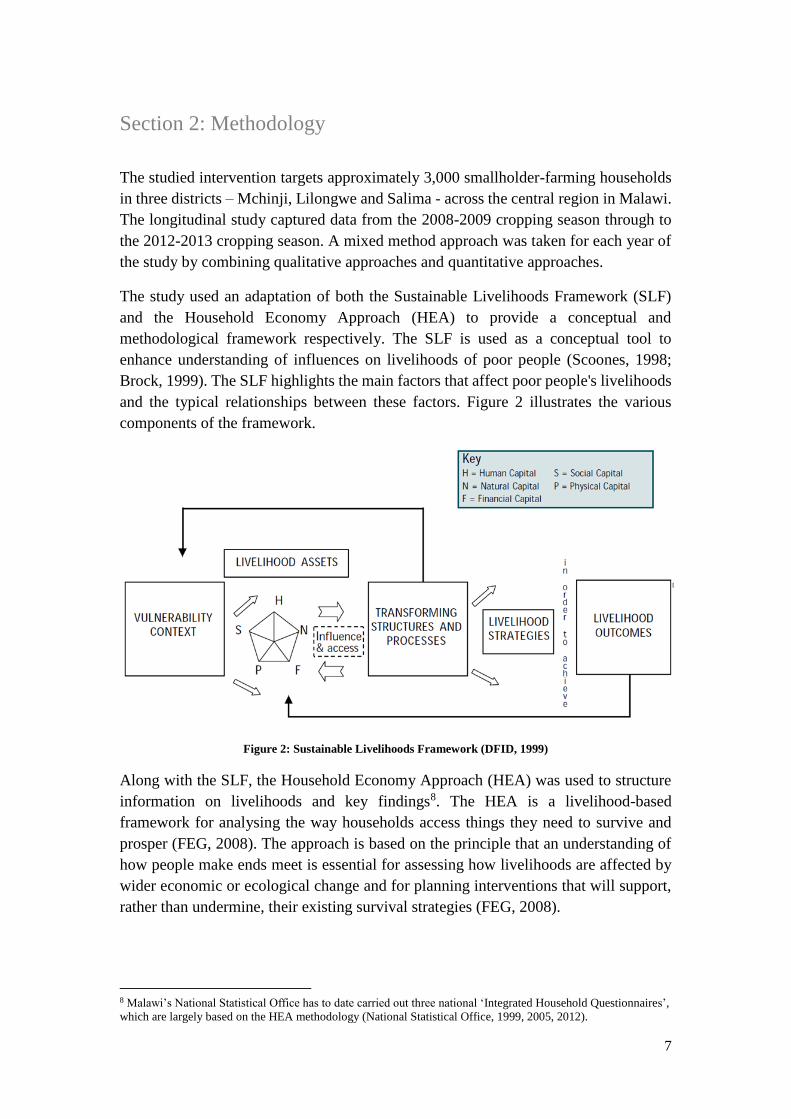
The study used an adaptation of both the Sustainable Livelihoods Framework (SLF)
and the Household Economy Approach (HEA) to provide a conceptual and
methodological framework respectively. The SLF is used as a conceptual tool to
enhance understanding of influences on livelihoods of poor people (Scoones, 1998;
Brock, 1999). The SLF highlights the main factors that affect poor people's livelihoods
and the typical relationships between these factors. Figure 2 illustrates the various
components of the framework.
Figure 2: Sustainable Livelihoods Framework (DFID, 1999)
Along with the SLF, the Household Economy Approach (HEA) was used to structure
information on livelihoods and key findings8. The HEA is a livelihood-based
framework for analysing the way households access things they need to survive and
prosper (FEG, 2008). The approach is based on the principle that an understanding of
how people make ends meet is essential for assessing how livelihoods are affected by
wider economic or ecological change and for planning interventions that will support,
rather than undermine, their existing survival strategies (FEG, 2008).
8 Malawi’s National Statistical Office has to date carried out three national ‘Integrated Household Questionnaires’,
which are largely based on the HEA methodology (National Statistical Office, 1999, 2005, 2012).
8
The HEA therefore involves the analysis of the connections amongst different groups
and different areas, providing a picture of how assets are distributed within a
community and who gets what from whom (FEG, 2008). To do this spatial, social and
methodological triangulation was employed in the annual analysis (Gosling, 2003;
Brock, 1999; Vanclay, 2012).
A mixed method approach was employed for the study. Mixed methods were employed
in an attempt to overcome intrinsic biases that come from using single methods. Using
both qualitative and quantitative methods allowed for the strengths and weaknesses of
both to be compensated by each other. However, more specifically, through using a
combination of multiple observers, theories, methods and data sources, greater
accuracy and validity are achieved (Greene, 1989; Rocco, 2003; Collins, 2006). This
provides a more complete picture of the context in which the intervention is being
implemented. Data collection methods included annual household questionnaires,
focus group discussions, semi-structured interviews, market visits and trader
interviews, and direct observation. The details of each are as follows:
Household Questionnaire
The baseline household questionnaire was undertaken in the three study areas in the
first quarter of 2010 capturing data for the 2008/2009 cropping season. 238 farming
households were originally selected for the questionnaire through stratified random
sampling. 43 of these original houses either relocated, or were unavailable for interview
in subsequent years.
The questionnaire consisted of both closed and open questions to investigate key
households characteristics and livelihood influences, including:
- Household assets (i.e. human, natural, financial, physical and social)
- Household income and expenditure
- Shocks and supports
- Annual food balance (i.e. consumption and access)
- Crop production and sales
During the 2010 baseline the researcher initially validated the questionnaire with key
stakeholders and a local translator. A two-day pre-testing was carried out with
randomly selected households; any anomalies or issues that arose were corrected.
Following this four enumerators were trained over three days. Data collection took
approximately 5 weeks. This was carried out using the traditional paper based data
collection approach. Data were then entered into Excel and imported into SPSS for
further analysis.
9
The 2011, 2012 and 2013 household questionnaires largely replicated the 2010
baseline. The time of data collection changed to June/July, as opposed to March to mid-
May, to enable real-time information to be generated on groundnut yields and prices
immediately post-harvest. However, the timing of data collection also meant that data
collected on food security status and consumption levels tended to reflect the more
favourable situation prevailing in the post-harvest period, rather than the inferior
conditions likely to prevail during the lean season (which were captured in the baseline
data). This seasonal effect needs to be kept in mind when considering the survey results.
These questionnaires were conducted using digital data gathering devices that allowed
for automatic data entry, which increased validity, and reduced data-collection and data
processing times.9 Each year, four enumerators were recruited with the assistance of
the Centre for Agricultural Research and Development (CARD) in Lilongwe. Training
and piloting of the digital survey took approximately 5 days each year. The same
enumerators were employed for the 2012 and 2013 data collection rounds.
Focus Group Discussions
Each year focus group discussions (FGDs) were conducted to provide a more
comprehensive contextual picture of the communities that the studied households
resided in. Groups were made up of 6 to 12 members in all three study areas. Group
discussions were held with different sub-groups depending on the topic for discussion,
for example village heads, female, association members, and non-association members.
Participatory rural appraisal exercises (PRA) including wealth ranking, seasonal
calendars, income and expenditure matrixes, and institutional mapping were conducted
in specific FGDs. The FGDs gave insight into community and individual perceptions
of what strengths, weakness, opportunities and threats households face in terms of
achieving a sustainable livelihood and what influences each of these.
Semi-Structured Interviews
Household representatives and key informants were interviewed with the aim of getting
individuals’ perspectives and experiences. Households targeted were association
members who were considered as case studies with one female and one male farmer
interviewed in each study area. Key-informant interviews were conducted with
agricultural extension advisors, government officials at national and district level, NGO
and CSO representatives, and other key stakeholders in the groundnut supply chain and
the RUTF value chain.
Market Visits and Trader Interviews
9 For further information around the digital data collection process see appendix for Fitzgerald and FitzGibbon
(2013) ‘The Evolution of Digital Collection in the Monitoring and Evaluation of Projects in Developing Country
Contexts’
10
Each year the researchers visited the commodity markets in the three areas. Both the
nearest small markets were visited and the medium to large markets, also known as
trading centres that are located further away from the study sites, were also visited.
Observations of the markets were made as well as interviews with agricultural
commodity traders.
Direct Observation
The researchers recorded events, structures, processes, institutions, behaviour,
relationships, social differences, and enumerator’s notes and personal observations
from household interviews. This was done to inform the survey data collection
processes and also to triangulate the other methods employed.
Study Ethics
For all of the data collection activities oral consent was obtained from all participants.
For the household questionnaire a standardised introduction was read out by the
enumerator, this introduction gave a background to the intervention, the purpose of the
study, how the information would be used and how all information would be treated
confidentially. This was also done in FGDs and semi-structured interviews. Participants
were also informed that they were entitled to ask any question, and if at anytime they
wanted to terminate the interview they could do so, or if they wished, decline to
participate.
Statistical Analysis
Results from the four household questionnaires were combined into one dataset and
analysed using SPSS version 20. Basic exploratory analysis was conducted which
found that a lot of data were skewed or not normally distributed (see Annex 2 for
example of a skewed variable). This occurrence is typical, as most social and economic
data are not normally distributed (Mukherjee, 2013). It is important to acknowledge
this when reporting measures of centrality (i.e. the mean, median, and mode) because
the measure needs to give the value that most accurately represents the study sample
and in the case of skewed data this is the median as opposed to the mean (Keding et al,
2012, Roberto and Samuel, 1989, Schinka and Velicer 2003, Nicolaisen, 2002, Bakker
and Gravemeijer, 2006, Brashares, 1993, Mukherjee, 2013, Tittonell and Giller, 2013).
Therefore where data were skewed the median was reported.
Section 3: Study Sample
11
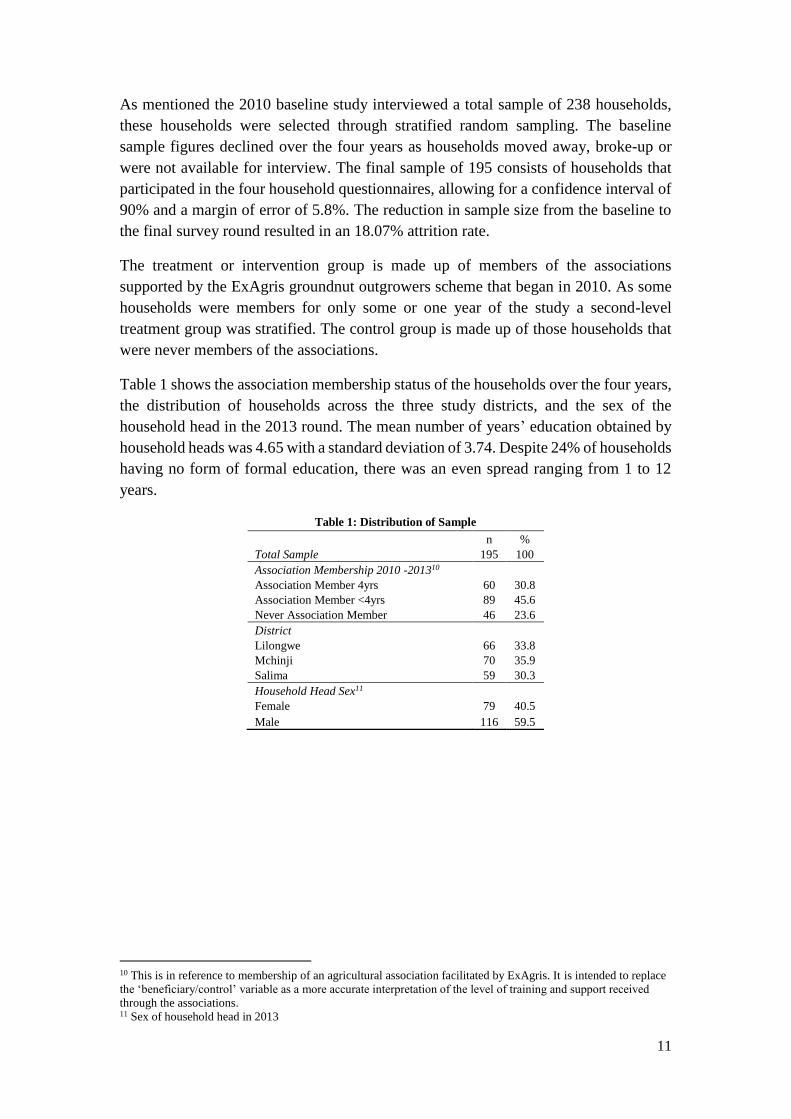
As mentioned the 2010 baseline study interviewed a total sample of 238 households,
these households were selected through stratified random sampling. The baseline
sample figures declined over the four years as households moved away, broke-up or
were not available for interview. The final sample of 195 consists of households that
participated in the four household questionnaires, allowing for a confidence interval of
90% and a margin of error of 5.8%. The reduction in sample size from the baseline to
the final survey round resulted in an 18.07% attrition rate.
The treatment or intervention group is made up of members of the associations
supported by the ExAgris groundnut outgrowers scheme that began in 2010. As some
households were members for only some or one year of the study a second-level
treatment group was stratified. The control group is made up of those households that
were never members of the associations.
Table 1 shows the association membership status of the households over the four years,
the distribution of households across the three study districts, and the sex of the
household head in the 2013 round. The mean number of years’ education obtained by
household heads was 4.65 with a standard deviation of 3.74. Despite 24% of households
having no form of formal education, there was an even spread ranging from 1 to 12
years.
Table 1: Distribution of Sample
n %
Total Sample 195 100
Association Membership 2010 -201310
Association Member 4yrs 60 30.8
Association Member <4yrs 89 45.6
Never Association Member 46 23.6
District
Lilongwe 66 33.8
Mchinji 70 35.9
Salima 59 30.3
Household Head Sex11
Female 79 40.5
Male 116 59.5
10 This is in reference to membership of an agricultural association facilitated by ExAgris. It is intended to replace
the ‘beneficiary/control’ variable as a more accurate interpretation of the level of training and support received
through the associations. 11 Sex of household head in 2013
12
Section 4: Study Areas
The study areas were selected on the criterion that they were areas where the partner
organisation ExAgris Africa Ltd. (EAA), which is implementing the intervention being
investigated, is operational. Thus EAA served as the entry point in the study.
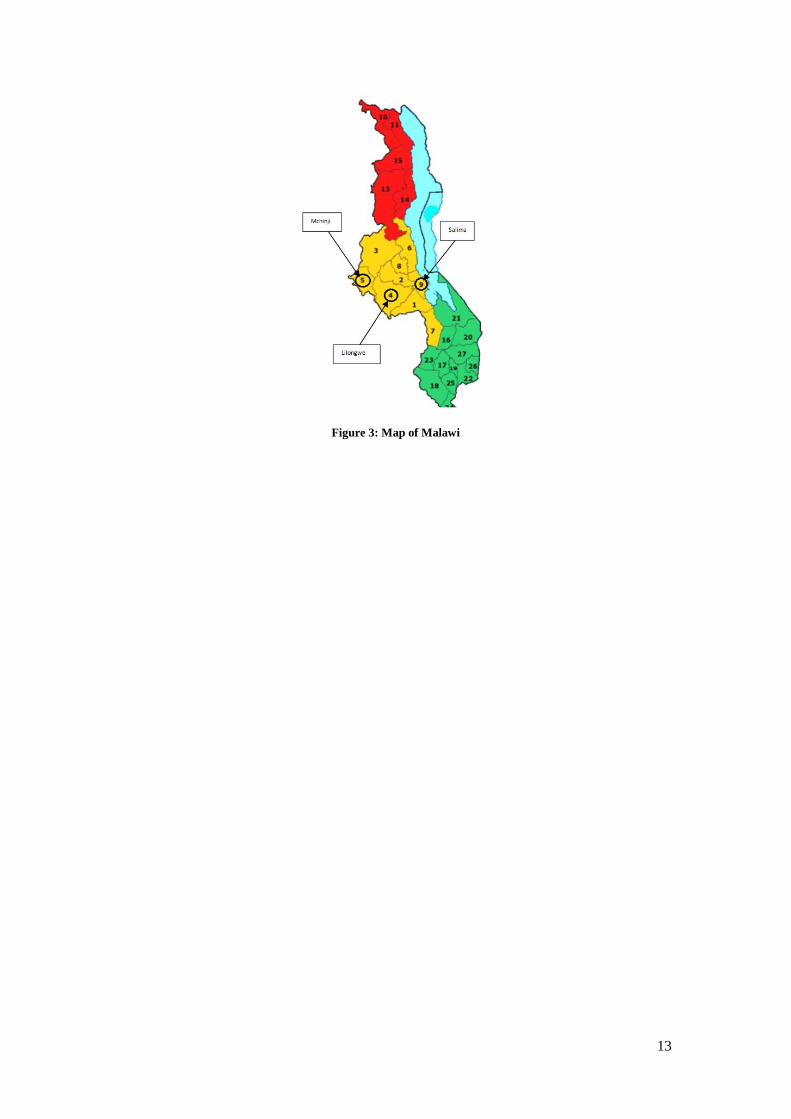
Lilongwe
Villages surrounding the ExAgris Lisungwi Estate were selected. The Lisungwi estate
is approximately 100km south of the capital city Lilongwe and 20km from Mitundu
trading centre, one the main trading centres for the Lilongwe district. The selected
villages fall under the Mitundu EPA12. Households were drawn from 28 different
villages.
Mchinji
Villages adjacent to the ExAgris Mchaisi Estate were selected. This estate is
approximately 50km east of Mchinji town, and 5km from the Kapiri trading centre. The
selected villages fall under the Chioshya and Kalulu EPAs. A total of 6 villages were
represented in the sample.
Salima
Villages surrounding the ExAgris Mphatsana Njoka Estate were selected. The estate is
approximately 5km outside of Salima town. The selected villages fall under the
Tembwe EPA. Households were drawn from 12 different villages.
12 Extension Planning Area is the lowest government planning level in Malawi.
13
Figure 3: Map of Malawi
14
Section 5: Livelihood Status of Households
In this section the SLF is used to conceptually frame the discussion of findings. Using
a combination of three of the five livelihood assets (also known as capitals); physical
(i.e. main dwelling structure), financial (i.e. livestock) and natural (i.e. land and
livestock) the study sample were classified and disaggregated in to wealth groups. A
number of proxy indicators were used to measure various aspects of food security, as
food security can not only be seen as a livelihood outcome but also as an element of
human capital. Health was also looked at as another component of human capital. In
terms of financial capital household cash savings and credit were considered; livestock
were categorised more as natural capital, but for many households they act also as
financial capital. Each category will be analyzed in detail in the following sections.
Wealth Groups
Households differ in their ownership of assets. These differences indicate variations in
wealth status and also give an indication of the potential of households to meet
livelihood needs. Data on key assets were collected in each survey round, and were
used to categorize households into different wealth groups.
The wealth groups variable is a composite index of household wealth. Table 2 below
represents the results of a stratification procedure undertaken for all the households
over the four years, which was in line with Participatory Rural Appraisal (PRA) and
the Household Economy Approach (HEA) methodologies.
These wealth groups were determined during the baseline data collection in 2010. Key-
informant interviews were conducted in each of the study areas to establish the various
groups and what differentiated them from each other. Descriptions of the key defining
characteristics and resources of the poorest households in the village were listed. This
was then repeated for the wealthiest households in the village and then for the middle
group. Once the descriptions of each group were established the community was
divided into the wealth groups according to these criteria. This information was
triangulated with focus group discussions with community and household
representatives. These steps were repeated for each of the annual data collections in
2011, 2012, and 2013.

15
Table 2: Wealth Ranking Criteria
Low Middle High
Livestock
Owned
0 - 8 chickens only Chickens,
1 - 3 goats, and/or 1 - 3 pigs
Any cattle/oxen. Or chickens,
3+ goats, & 3+ pigs.
Land Owned 0 - 0.61 hectares 0.61 - 1.68 hectares 1.68 hectares and above
House Structure Mud bricks
(unfired/compacted) &
grass roof
Burnt bricks & grass roof Burnt bricks & iron sheet roof
The results from the wealth ranking exercise are presented in Table 3. It appeared that
the number of households in the high wealth group was increasing over time; however
the final data round in 2013 showed the number declined to close to the baseline figure.
This trend is almost mirrored with the proportion of households moving out of and back
into the low wealth group. Only the number of households in the middle group appeared
constant. A chi-square goodness-of-fit test was conducted; this indicated no statistically
significant difference in the proportion of households in each wealth group in the 2013
sample compared with the 2010 sample (p < 0.05, see appendix for statistical tables).
Table 3: Distribution of Households by Wealth Ranking
2010 2011 2012 2013
n % n % n % n %
Low 83 42.6 74 37.9 71 36.4 79 40.5
Middle 95 48.7 96 49.2 96 49.2 95 48.7
High 17 8.7 25 12.8 28 14.4 21 10.8
Food Security
“Food security exists when all people, at all times, have physical and economic access to
sufficient, safe and nutritious food to meet their dietary needs and food preferences for an
active and healthy life.…” (World Food Summit Plan of Action, Para. 1, FAO, 1998)
Maize, Malawi’s staple crop is commonly used as a measure of food security at national
and household level. Maize consumed at household level predominantly comes from
the household’s own production. However, many households fail to produce enough
maize to last through to the next harvest. Those who do produce enough maize rarely
have the storage capacity to keep the maize until needed; those who do store their
surplus can face serious food waste due to spoilage caused by poor storage conditions
and pests. Trends in the consumption of maize from own production was investigated
over the study period (Table 4). Annual per capita maize consumption from own
production was calculated, this was disaggregated by the wealth groups. The Kruskal-
Wallis test was conducted for each data round to establish if there was a difference in
per capita maize consumption from own production across the three wealth groups.
Except for the baseline, each year showed consumption to be significantly different
with p values of less than 0.05 (p < 0.05).
16
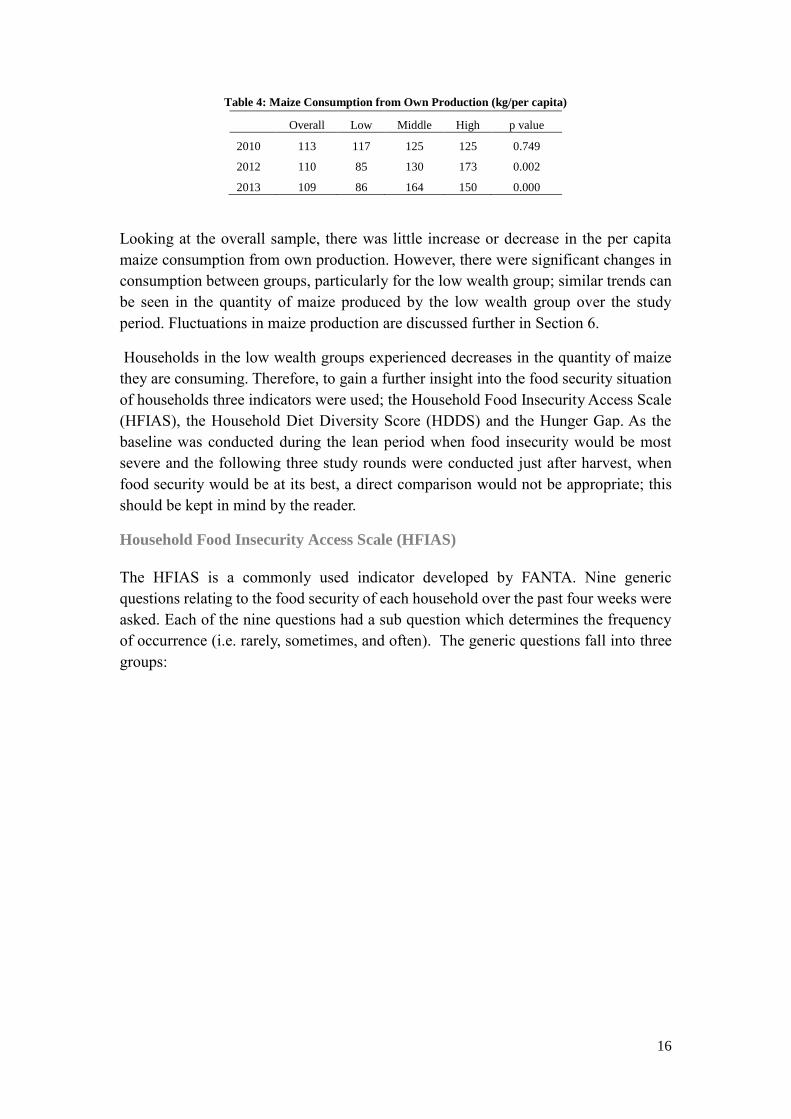
Table 4: Maize Consumption from Own Production (kg/per capita)
Overall Low Middle High p value
2010 113 117 125 125 0.749
2012 110 85 130 173 0.002
2013 109 86 164 150 0.000
Looking at the overall sample, there was little increase or decrease in the per capita
maize consumption from own production. However, there were significant changes in
consumption between groups, particularly for the low wealth group; similar trends can
be seen in the quantity of maize produced by the low wealth group over the study
period. Fluctuations in maize production are discussed further in Section 6.
Households in the low wealth groups experienced decreases in the quantity of maize
they are consuming. Therefore, to gain a further insight into the food security situation
of households three indicators were used; the Household Food Insecurity Access Scale
(HFIAS), the Household Diet Diversity Score (HDDS) and the Hunger Gap. As the
baseline was conducted during the lean period when food insecurity would be most
severe and the following three study rounds were conducted just after harvest, when
food security would be at its best, a direct comparison would not be appropriate; this
should be kept in mind by the reader.
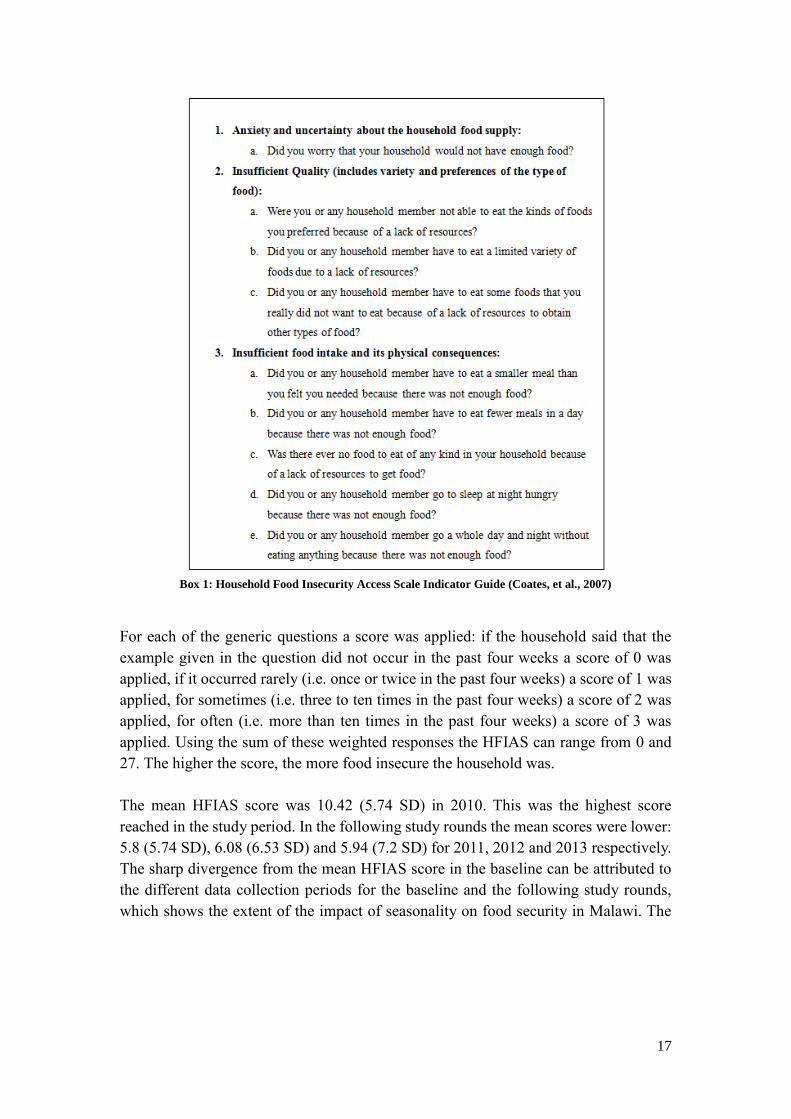
Household Food Insecurity Access Scale (HFIAS)
The HFIAS is a commonly used indicator developed by FANTA. Nine generic
questions relating to the food security of each household over the past four weeks were
asked. Each of the nine questions had a sub question which determines the frequency
of occurrence (i.e. rarely, sometimes, and often). The generic questions fall into three
groups:
17
Box 1: Household Food Insecurity Access Scale Indicator Guide (Coates, et al., 2007)
For each of the generic questions a score was applied: if the household said that the
example given in the question did not occur in the past four weeks a score of 0 was
applied, if it occurred rarely (i.e. once or twice in the past four weeks) a score of 1 was
applied, for sometimes (i.e. three to ten times in the past four weeks) a score of 2 was
applied, for often (i.e. more than ten times in the past four weeks) a score of 3 was
applied. Using the sum of these weighted responses the HFIAS can range from 0 and
27. The higher the score, the more food insecure the household was.
The mean HFIAS score was 10.42 (5.74 SD) in 2010. This was the highest score
reached in the study period. In the following study rounds the mean scores were lower:
5.8 (5.74 SD), 6.08 (6.53 SD) and 5.94 (7.2 SD) for 2011, 2012 and 2013 respectively.
The sharp divergence from the mean HFIAS score in the baseline can be attributed to
the different data collection periods for the baseline and the following study rounds,
which shows the extent of the impact of seasonality on food security in Malawi. The

18
scores were divided into four quartiles; Figure 4 shows the percentage distribution of
households across the four quartiles.
Figure 4: HFIAS Score Percentage Distribution Overall Sample
For the 2011, 2012 and 2013 study rounds the majority of households appear to be
relatively food secure with little change between the three years. The 2010 HFIAS
results show much higher levels of food insecurity and are likely to be more
representative of the general food security status of households in the lean season.
When disaggregated by wealth groupings, results show that the majority of the high
wealth group was in the 1st and 2nd quartiles in 2010, and in the 1st and 3rd in the final
survey round in 2013 (Figure 5 and 6). In comparison, the low wealth group had
households who were in the most food insecure HFIAS quartile with scores ranging
from 21-27. Although the impact of seasonality and the data collection time is evident
0%
10%
20%
30%
40%
50%
60%
70%
80%
90%
100%
2010 2011 2012 2013
4th Quartile (21-27)
3rd Quartile (14-20)
2nd Quartile (7-13)
1st Quartile (0-6)
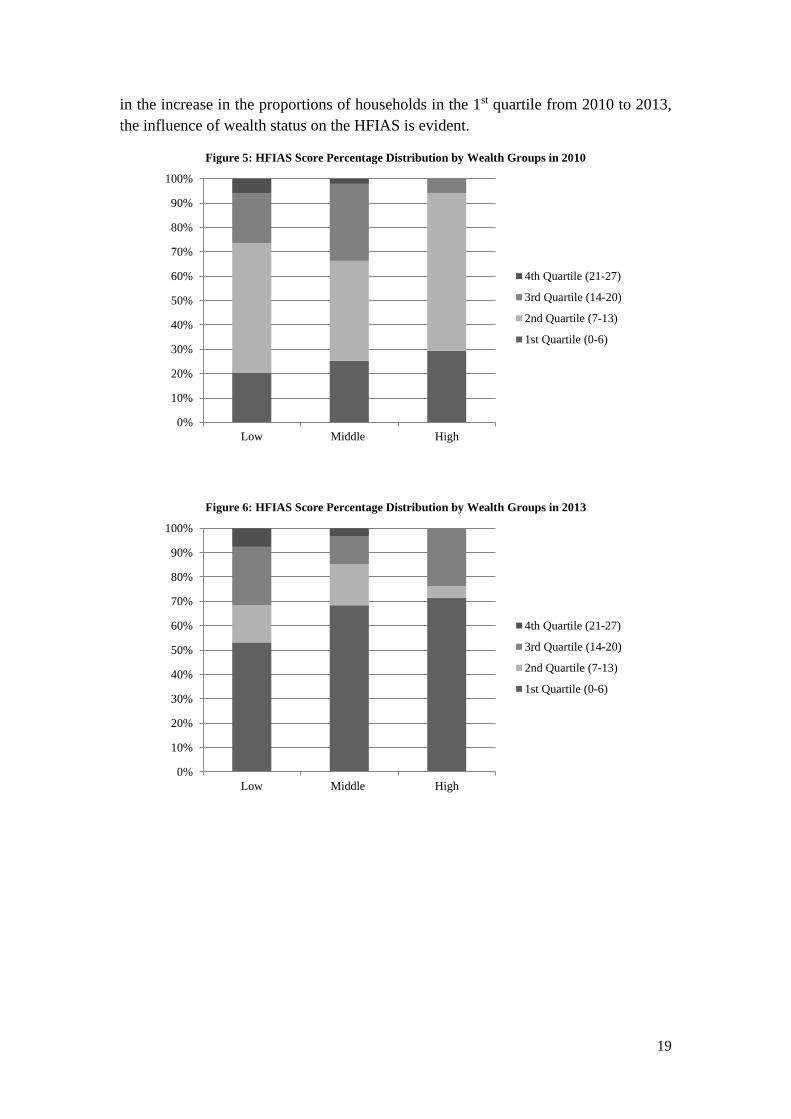
19
in the increase in the proportions of households in the 1st quartile from 2010 to 2013,
the influence of wealth status on the HFIAS is evident.
Figure 5: HFIAS Score Percentage Distribution by Wealth Groups in 2010
Figure 6: HFIAS Score Percentage Distribution by Wealth Groups in 2013
0%
10%
20%
30%
40%
50%
60%
70%
80%
90%
100%
Low Middle High
4th Quartile (21-27)
3rd Quartile (14-20)
2nd Quartile (7-13)
1st Quartile (0-6)
0%
10%
20%
30%
40%
50%
60%
70%
80%
90%
100%
Low Middle High
4th Quartile (21-27)
3rd Quartile (14-20)
2nd Quartile (7-13)
1st Quartile (0-6)
20
Household Diet Diversity Score (HDDS)
The Household Diet Diversity Score (HDDS) is a measure of dietary diversity: the
higher the score the more diverse the diet of the household members. Greater diet
diversity generally indicates better nutritional status at household level. The HDDS
used was the modified indicator employed by the national Integrated Household Survey
III (HIS III) whereby the recall period of 7 days is used and a total of 113 food items
are investigated by asking, “In the past 7 days, have you or any household member
eaten...” The sum of the following food groups gives the score; cereals, roots and
tubers; vegetables; fruits; meat; eggs; fish; pulses; legumes and nuts; milk and milk
products; oils and fats; sweets; spices, condiments and beverages (National Statistics
Office, 2012).
Using the sum of these weighted responses the HDDS can range from 0 and 12; the
higher the score the more diverse the diet diversity. Thus, better nutritional status at
household level.
The 2011, 2012 and 2013 study rounds show that diet diversity is moderate to high with
mean scores of 8.24 (SD = 2.09), 8.48 (SD = 1.85) and 8.29 (SD = 2.14). Jones et al.
(2014) reported similar findings from the HIS III data with the Rural Central Region
having a score of 8.17 (SD = 2.48) and 8.37 (SD = 2.38) for all regions (Jones et al,
2014). This high scoring is likely to have been influenced by seasonality. Not only
would the quantity of food be greater at household level at harvest time, but there is
also increased cash availability due to crop sales and increased demand for casual
labour. In terms of diet diversity, this allows for households to purchase more and a
wider variety of foods.
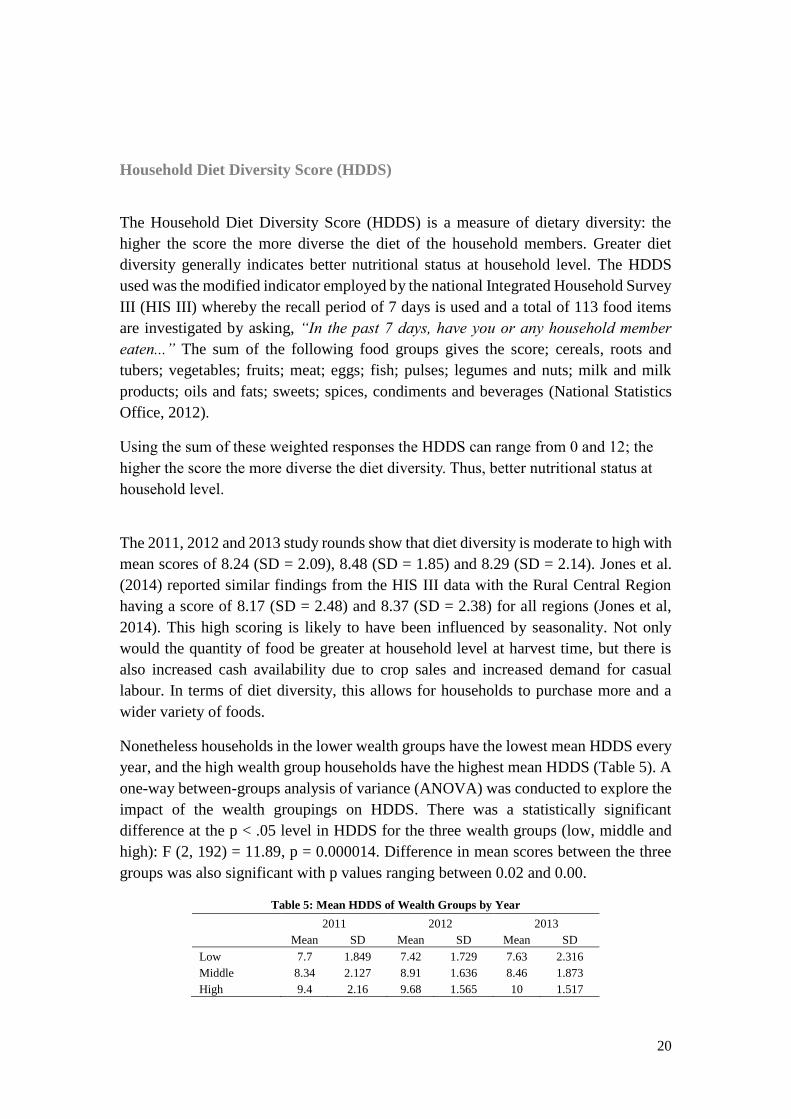
Nonetheless households in the lower wealth groups have the lowest mean HDDS every
year, and the high wealth group households have the highest mean HDDS (Table 5). A
one-way between-groups analysis of variance (ANOVA) was conducted to explore the
impact of the wealth groupings on HDDS. There was a statistically significant
difference at the p < .05 level in HDDS for the three wealth groups (low, middle and
high): F (2, 192) = 11.89, p = 0.000014. Difference in mean scores between the three
groups was also significant with p values ranging between 0.02 and 0.00.
Table 5: Mean HDDS of Wealth Groups by Year
2011 2012 2013
Mean SD Mean SD Mean SD
Low 7.7 1.849 7.42 1.729 7.63 2.316
Middle 8.34 2.127 8.91 1.636 8.46 1.873
High 9.4 2.16 9.68 1.565 10 1.517
21
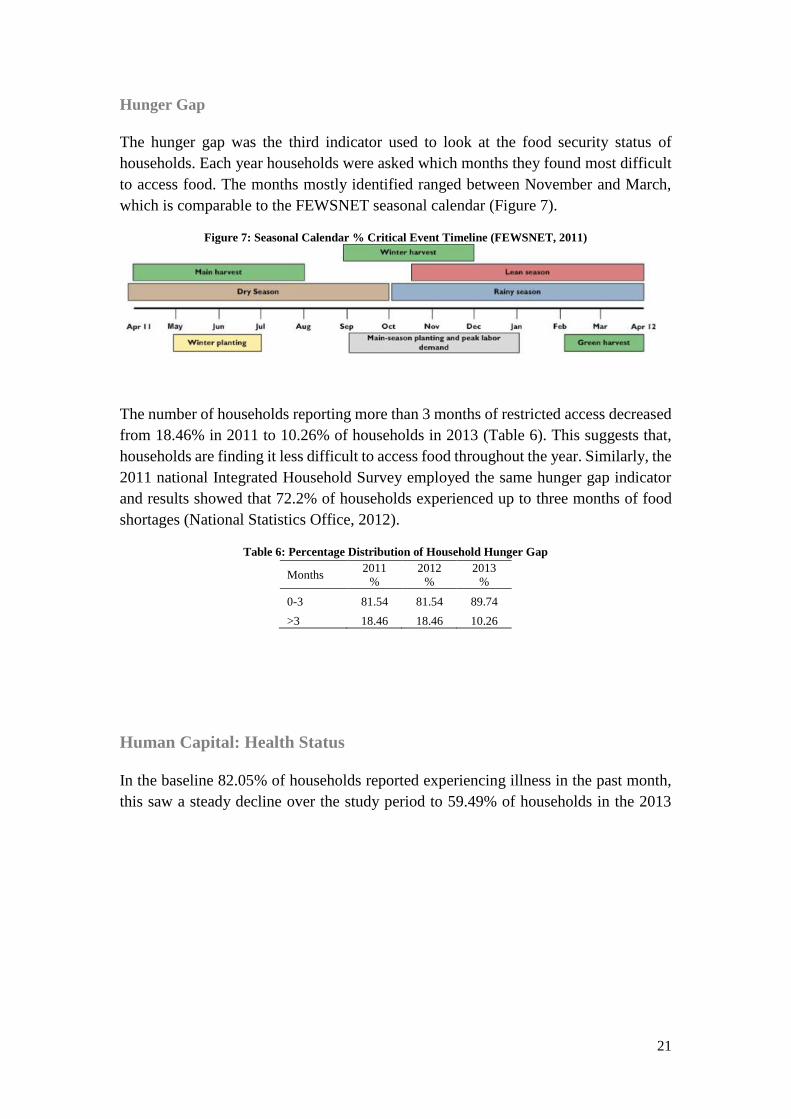
Hunger Gap
The hunger gap was the third indicator used to look at the food security status of
households. Each year households were asked which months they found most difficult
to access food. The months mostly identified ranged between November and March,
which is comparable to the FEWSNET seasonal calendar (Figure 7).
Figure 7: Seasonal Calendar % Critical Event Timeline (FEWSNET, 2011)
The number of households reporting more than 3 months of restricted access decreased
from 18.46% in 2011 to 10.26% of households in 2013 (Table 6). This suggests that,
households are finding it less difficult to access food throughout the year. Similarly, the
2011 national Integrated Household Survey employed the same hunger gap indicator
and results showed that 72.2% of households experienced up to three months of food
shortages (National Statistics Office, 2012).
Table 6: Percentage Distribution of Household Hunger Gap
Months 2011
%
2012
%
2013
%
0-3 81.54 81.54 89.74
>3 18.46 18.46 10.26
Human Capital: Health Status
In the baseline 82.05% of households reported experiencing illness in the past month,
this saw a steady decline over the study period to 59.49% of households in the 2013

22
survey round. The number of household members experiencing illness in the past
month was similar for all four years ranging from 1 to 8 days (median = 1).
Figure 8: Number of Case Reported by Illness(2010-2013)
Figure 8 shows particularly the impact of the peak in malaria in 2012 on the reported
number of households reporting illness; of the 149 cases reported 44.96% were in
Salima. The lakeshore district Salima is one of the districts in Malawi where the
prevalence rate of malaria is at its highest (Kazembe et al., 2006). However for this
particular year, during data collection and follow-up investigations in 2013, study
participants spoke of a spike in the occurrence of malaria in 2012. Key informants and
focus group discussions confirmed this observation and village headmen discussed how
this type of malaria was proving more severe than normal and was making people
extremely sick.
The main preventative measure employed by households for malaria is the use of
mosquito nets. Questionnaire respondents were asked “Do any members of the
household sleep under a bed net to protect against mosquitoes?” They were also asked;
“Has/have the bed net(s) ever been treated with insecticides against mosquitoes in the
past six months?” Results show an increase in the number of households reporting
ownership of a bed net with 85.6% in 2013 in comparison to 70.8% in 2010. However,
there was a decline in the number who treated their nets in the last six months, from
45.1% in 2010 to 32.8% in 2013; the proportion of households who may have
purchased/received their nets within the last six months is not known.
An illness score was calculated for each household for the four years. This represents
the sum total of the number of days household members were unable to perform their
normal duties/tasks divided by the number of households members, to generate an
average household illness score (i.e. days missed due to illness per capita). The mean
illness scores over the four years are presented in Figure 9. A paired-samples t-test was
0
50
100
150
200
250
2010 2011 2012 2013
No.
of
Case
Rep
ort
ed
Other
Stomach illness
(ache/vomiting/diarrhoea)
Lower respiratory illness
Upper respiratory illness
Fever/Malaria
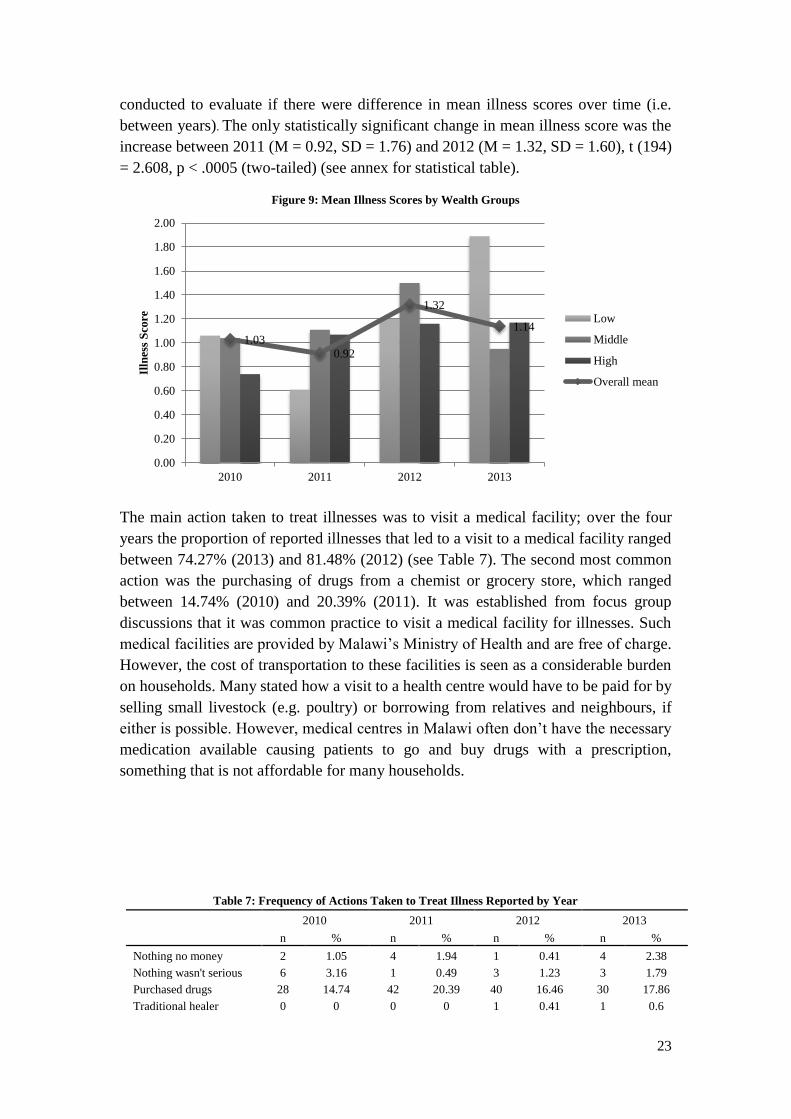
23
conducted to evaluate if there were difference in mean illness scores over time (i.e.
between years). The only statistically significant change in mean illness score was the
increase between 2011 (M = 0.92, SD = 1.76) and 2012 (M = 1.32, SD = 1.60), t (194)
= 2.608, p < .0005 (two-tailed) (see annex for statistical table).
Figure 9: Mean Illness Scores by Wealth Groups
The main action taken to treat illnesses was to visit a medical facility; over the four
years the proportion of reported illnesses that led to a visit to a medical facility ranged
between 74.27% (2013) and 81.48% (2012) (see Table 7). The second most common
action was the purchasing of drugs from a chemist or grocery store, which ranged
between 14.74% (2010) and 20.39% (2011). It was established from focus group
discussions that it was common practice to visit a medical facility for illnesses. Such
medical facilities are provided by Malawi’s Ministry of Health and are free of charge.
However, the cost of transportation to these facilities is seen as a considerable burden
on households. Many stated how a visit to a health centre would have to be paid for by
selling small livestock (e.g. poultry) or borrowing from relatives and neighbours, if
either is possible. However, medical centres in Malawi often don’t have the necessary
medication available causing patients to go and buy drugs with a prescription,
something that is not affordable for many households.
Table 7: Frequency of Actions Taken to Treat Illness Reported by Year
2010 2011 2012 2013
n % n % n % n %
Nothing no money 2 1.05 4 1.94 1 0.41 4 2.38
Nothing wasn't serious 6 3.16 1 0.49 3 1.23 3 1.79
Purchased drugs 28 14.74 42 20.39 40 16.46 30 17.86
Traditional healer 0 0 0 0 1 0.41 1 0.6
1.03
0.92
1.32
1.14
0.00
0.20
0.40
0.60
0.80
1.00
1.20
1.40
1.60
1.80
2.00
2010 2011 2012 2013
Illn
ess
Sco
re Low
Middle
High
Overall mean

24
Visited medical facility 153 80.53 153 74.27 198 81.48 130 77.38
Used own remedy 1 0.53 3 1.46 0 0 0 0
190 100 203* 98.54 243 100 168 100
With regard to chronic illnesses13 23 households in 2013 reported having member(s)
that were suffering from a chronic illness, of which 19 households had one member
suffering from a chronic illness, 2 households had two members and 1 household had
three members.
Financial Capital: Access to Saving & Credit 2013
There was a 350% increase in the number of households saving in 2013 compared to
the 2010 baseline figure, and a 28% increase in the number of households accessing
credit over the same period (see Table 8).
Table 8: Households Accessing Financial Services 2010 - 2013
Savings Credit
n % n %
2010 22 11.28 64 32.82
2011 44 22.56 53 27.18
2012 53 27.18 29 14.87
2013 99 50.77 82 42.05
The cause of such increases is linked to the emergence of the ‘Village Savings and
Loans’ clubs between the 2012 and 2013 data collection, as shown in Tables 9 and 10.
During focus group discussions participants referred to the appointment of the first
female president Joyce Banda and her political party who encouraged people, in
particular women, to set up their own village savings and loans groups. Discussions
around this topic often included how many women now want to start up their own small
business; mandazi (local deep fried doughnut) selling was a very popular choice of
business.
Table 9: Location of Households Savings 2010 - 2013
2010 2011 2012 2013
n n n n
Bank (commercial) 10 15 17 20
Club/Village Savings & Loans 2 2 15 60
Home 8 19 10 10
13 Chronic diseases are diseases of long duration and generally slow progression. Examples of chronic diseases
include heart disease, stroke, cancer, chronic respiratory diseases, diabetes and HIV/AIDS.
25
Lent-out 1 0 0 0
Micro-finance Institution 0 1 1 1
Women’s Club 1 6 9 8
Other 0 1 1 0
Total 22 44 53 99
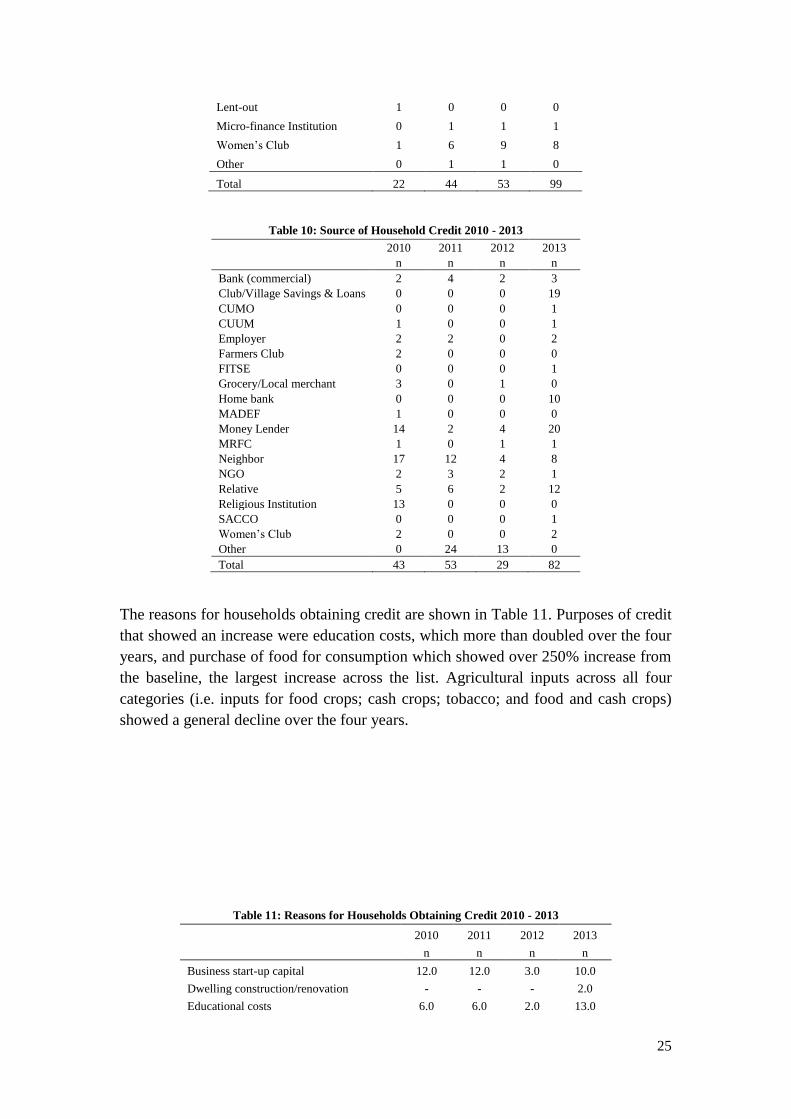
Table 10: Source of Household Credit 2010 - 2013
2010 2011 2012 2013
n n n n
Bank (commercial) 2 4 2 3
Club/Village Savings & Loans 0 0 0 19
CUMO 0 0 0 1
CUUM 1 0 0 1
Employer 2 2 0 2
Farmers Club 2 0 0 0
FITSE 0 0 0 1
Grocery/Local merchant 3 0 1 0
Home bank 0 0 0 10
MADEF 1 0 0 0
Money Lender 14 2 4 20
MRFC 1 0 1 1
Neighbor 17 12 4 8
NGO 2 3 2 1
Relative 5 6 2 12
Religious Institution 13 0 0 0
SACCO 0 0 0 1
Women’s Club 2 0 0 2
Other 0 24 13 0
Total 43 53 29 82
The reasons for households obtaining credit are shown in Table 11. Purposes of credit
that showed an increase were education costs, which more than doubled over the four
years, and purchase of food for consumption which showed over 250% increase from
the baseline, the largest increase across the list. Agricultural inputs across all four
categories (i.e. inputs for food crops; cash crops; tobacco; and food and cash crops)
showed a general decline over the four years.
Table 11: Reasons for Households Obtaining Credit 2010 - 2013
2010 2011 2012 2013
n n n n
Business start-up capital 12.0 12.0 3.0 10.0
Dwelling construction/renovation - - - 2.0
Educational costs 6.0 6.0 2.0 13.0
26
Funeral costs 4.0 1.0 - 1.0
Invest in enterprise - 2.0 2.0 2.0
Legal costs 2.0 - - -
Medical costs 11.0 8.0 5.0 7.0
Pay for maize milling - - 1.0 -
Purchase food for consumption 7.0 8.0 7.0 25.0
Purchase inputs for cash crop - 1.0 1.0 3.0
Purchase inputs for food & cash crops - 1.0 - 4.0
Purchase inputs for food crop 7.0 8.0 7.0 2.0
Purchase inputs for tobacco 2.0 1.0 - -
Purchase land - 3.0 - 1.0
Purchase non-farm inputs - - 1.0 9.0
Purchase non-food household items 7.0 1.0 - 2.0
Transport costs 4.0 1.0 - 1.0
Other 2.0 - - -
Total 64.0 53.0 29.0 82.0
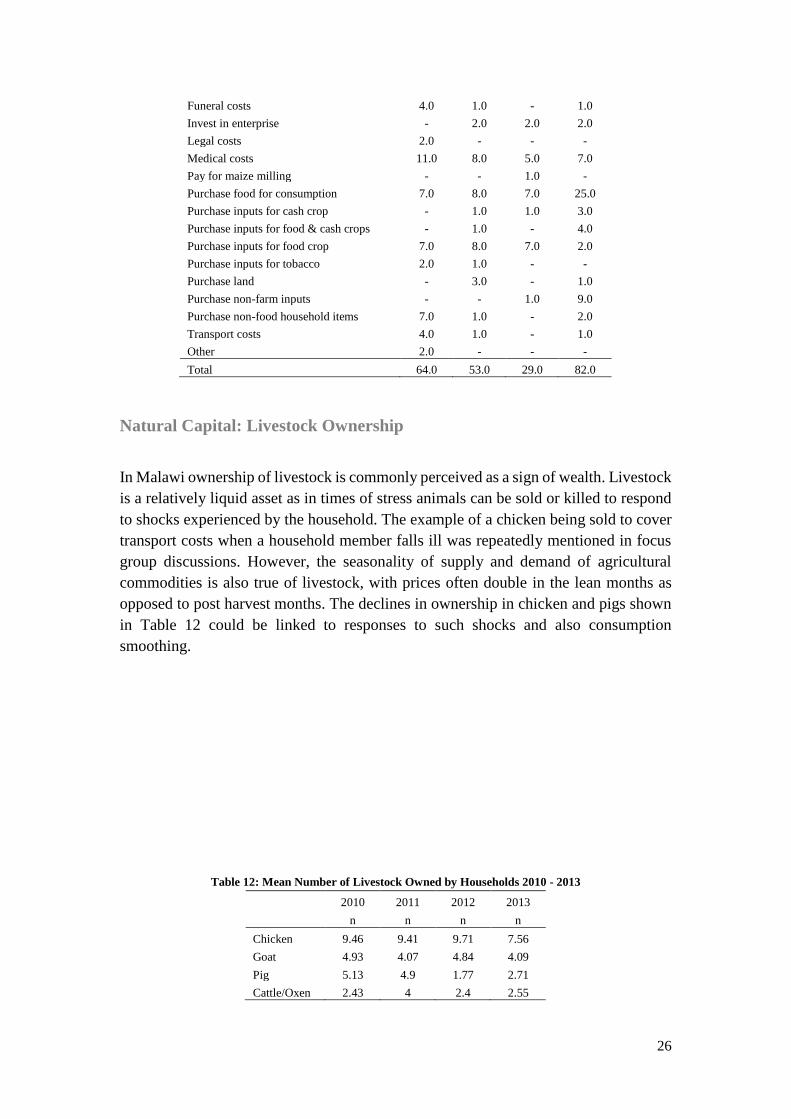
Natural Capital: Livestock Ownership
In Malawi ownership of livestock is commonly perceived as a sign of wealth. Livestock
is a relatively liquid asset as in times of stress animals can be sold or killed to respond
to shocks experienced by the household. The example of a chicken being sold to cover
transport costs when a household member falls ill was repeatedly mentioned in focus
group discussions. However, the seasonality of supply and demand of agricultural
commodities is also true of livestock, with prices often double in the lean months as
opposed to post harvest months. The declines in ownership in chicken and pigs shown
in Table 12 could be linked to responses to such shocks and also consumption
smoothing.
Table 12: Mean Number of Livestock Owned by Households 2010 - 2013
2010 2011 2012 2013
n n n n
Chicken 9.46 9.41 9.71 7.56
Goat 4.93 4.07 4.84 4.09
Pig 5.13 4.9 1.77 2.71
Cattle/Oxen 2.43 4 2.4 2.55

27
The monetary value (real and nominal values14) of livestock owned by households over
the study period is shown in Figure 10, while Figure 11 depicts the mean earnings from
livestock sales. There were significant increases in the unit value of livestock. The
decreases in the mean numbers of livestock owned could be attributed to two main
reasons, households destocking and the prevalence of Newcastle disease (especially for
pigs).
Figure 10: Mean Monetary Value of Livestock Owned by Households (MK) 2010-13
Figure 11: Mean Monetary Earnings From Livestock Sold by Households (MK) 2010-13
14 Nominal values were converted to real values using the CPI with 2010 value as the base index.
33,069
56,029
76,518
33,069 35,218
44,26348,429
0
10,000
20,000
30,000
40,000
50,000
60,000
70,000
80,000
90,000
2010 2011 2012 2013
MW
K
Nominal value
Real value
8,020
19,103
25,814
8,020 7,390
15,09216,338
0
5,000
10,000
15,000
20,000
25,000
30,000
2010 2011 2012 2013
MW
K
Nominal value
Real value
28
Section 6: Crop Production as a Livelihood Strategy
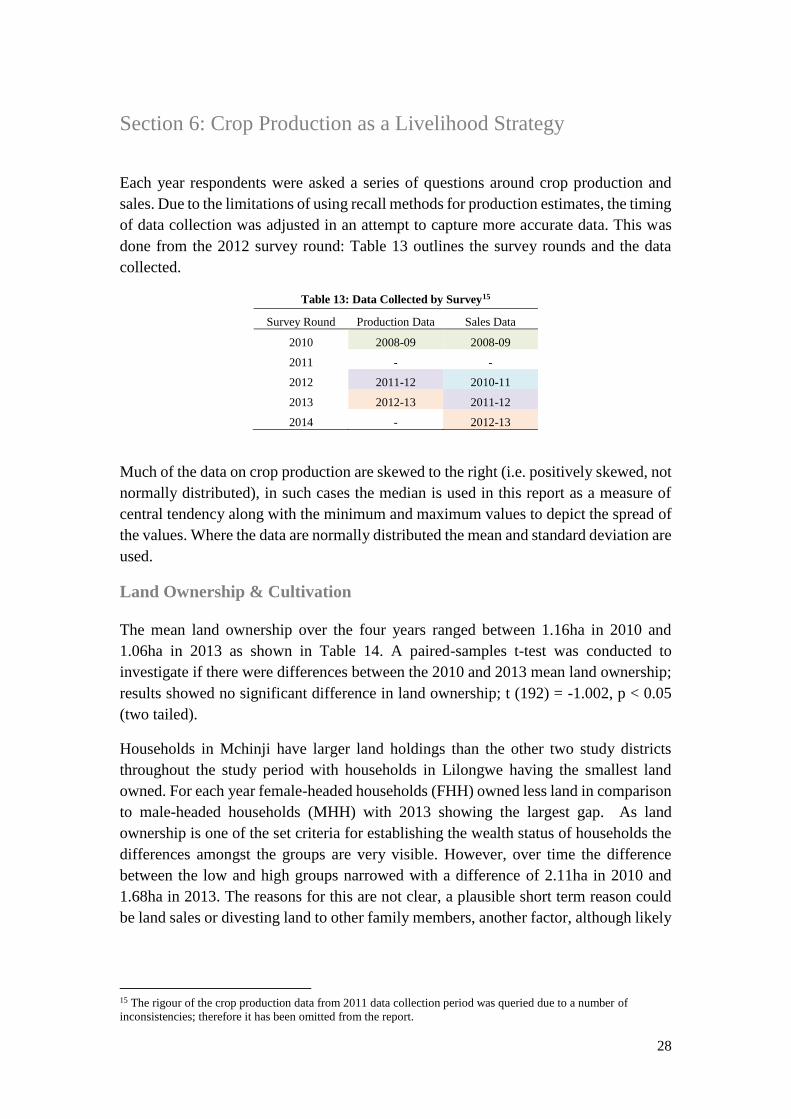
Each year respondents were asked a series of questions around crop production and
sales. Due to the limitations of using recall methods for production estimates, the timing
of data collection was adjusted in an attempt to capture more accurate data. This was
done from the 2012 survey round: Table 13 outlines the survey rounds and the data
collected.
Table 13: Data Collected by Survey15
Survey Round Production Data Sales Data
2010 2008-09 2008-09
2011 - -
2012 2011-12 2010-11
2013 2012-13 2011-12
2014 - 2012-13
Much of the data on crop production are skewed to the right (i.e. positively skewed, not
normally distributed), in such cases the median is used in this report as a measure of
central tendency along with the minimum and maximum values to depict the spread of
the values. Where the data are normally distributed the mean and standard deviation are
used.
Land Ownership & Cultivation
The mean land ownership over the four years ranged between 1.16ha in 2010 and
1.06ha in 2013 as shown in Table 14. A paired-samples t-test was conducted to
investigate if there were differences between the 2010 and 2013 mean land ownership;
results showed no significant difference in land ownership; t (192) = -1.002, p < 0.05
(two tailed).
Households in Mchinji have larger land holdings than the other two study districts
throughout the study period with households in Lilongwe having the smallest land
owned. For each year female-headed households (FHH) owned less land in comparison
to male-headed households (MHH) with 2013 showing the largest gap. As land
ownership is one of the set criteria for establishing the wealth status of households the
differences amongst the groups are very visible. However, over time the difference
between the low and high groups narrowed with a difference of 2.11ha in 2010 and
1.68ha in 2013. The reasons for this are not clear, a plausible short term reason could
be land sales or divesting land to other family members, another factor, although likely
15 The rigour of the crop production data from 2011 data collection period was queried due to a number of
inconsistencies; therefore it has been omitted from the report.
29
to be more long term is population growth, something which is predicted to be one of
the major challenges for Malawi in the coming years.
Table 14: Land Ownership 2010 & 2013 (ha)
2010 2013
Mean SD Mean SD
Total Sample 1.16 1.16 1.06 0.75
District
Lilongwe 0.88 0.73 0.83 0.53
Mchinji 1.55 1.28 1.28 0.78
Salima 1 1.29 1.06 0.86
Household Head Sex
Female Headed HH 1.06 1.02 0.9 0.7
Male Headed HH 1.22 1.23 1.17 0.77
Wealth Groups
Low 0.66 0.74 0.60 0.44
Middle 1.35 1.01 1.18 0.59
High 2.77 1.96 2.28 0.82
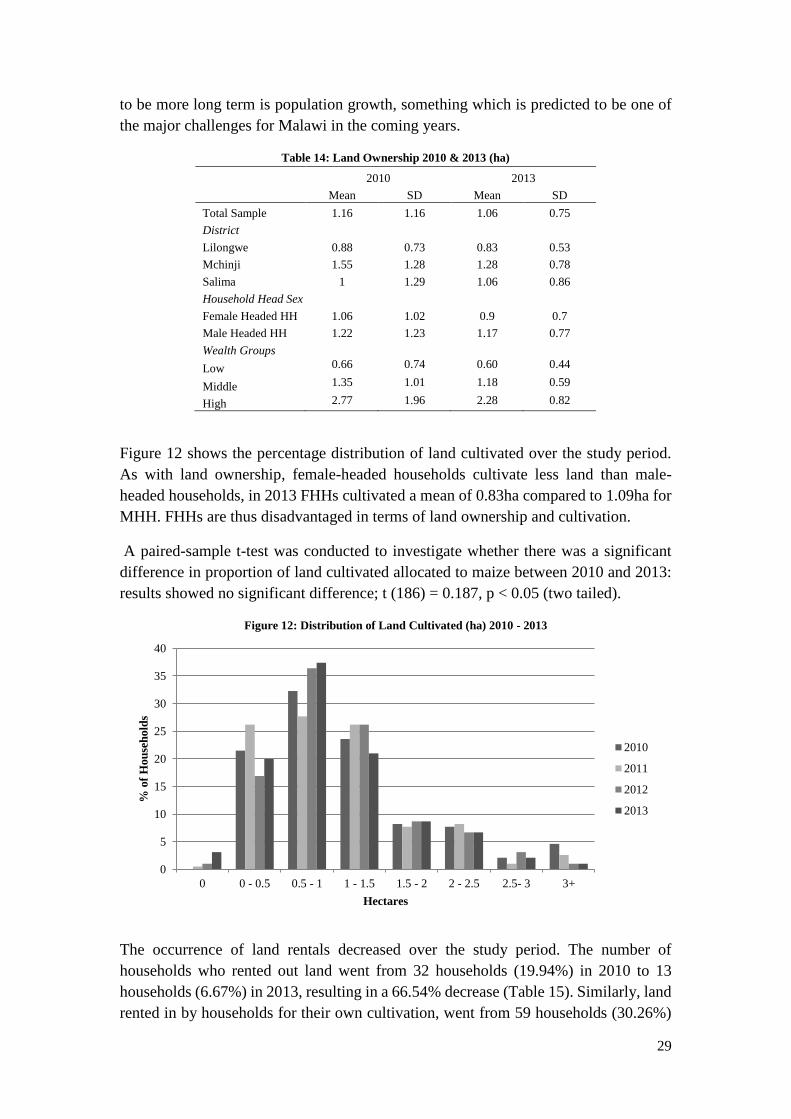
Figure 12 shows the percentage distribution of land cultivated over the study period.
As with land ownership, female-headed households cultivate less land than male-
headed households, in 2013 FHHs cultivated a mean of 0.83ha compared to 1.09ha for
MHH. FHHs are thus disadvantaged in terms of land ownership and cultivation.
A paired-sample t-test was conducted to investigate whether there was a significant
difference in proportion of land cultivated allocated to maize between 2010 and 2013:
results showed no significant difference; t (186) = 0.187, p < 0.05 (two tailed).
Figure 12: Distribution of Land Cultivated (ha) 2010 - 2013
The occurrence of land rentals decreased over the study period. The number of
households who rented out land went from 32 households (19.94%) in 2010 to 13
households (6.67%) in 2013, resulting in a 66.54% decrease (Table 15). Similarly, land
rented in by households for their own cultivation, went from 59 households (30.26%)
0
5
10
15
20
25
30
35
40
0 0 - 0.5 0.5 - 1 1 - 1.5 1.5 - 2 2 - 2.5 2.5- 3 3+
% o
f H
ou
seh
old
s
Hectares
2010
2011
2012
2013
30
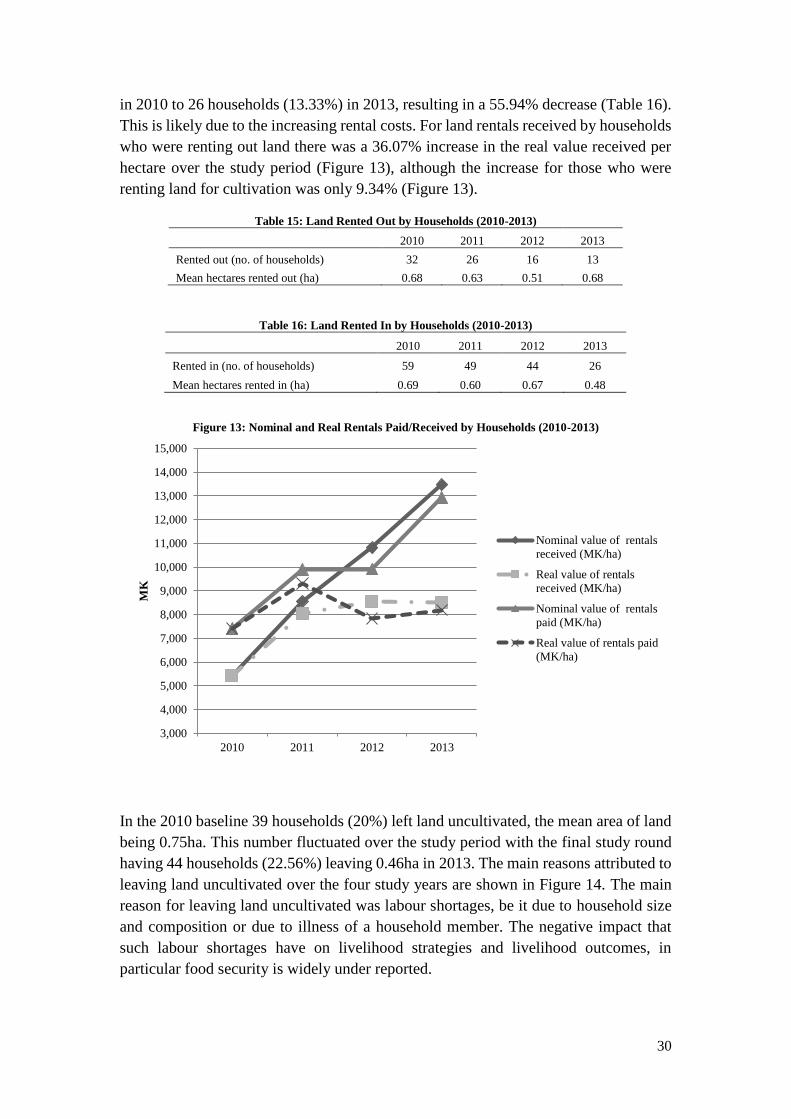
in 2010 to 26 households (13.33%) in 2013, resulting in a 55.94% decrease (Table 16).
This is likely due to the increasing rental costs. For land rentals received by households
who were renting out land there was a 36.07% increase in the real value received per
hectare over the study period (Figure 13), although the increase for those who were
renting land for cultivation was only 9.34% (Figure 13).
Table 15: Land Rented Out by Households (2010-2013)
2010 2011 2012 2013
Rented out (no. of households) 32 26 16 13
Mean hectares rented out (ha) 0.68 0.63 0.51 0.68
Table 16: Land Rented In by Households (2010-2013)
2010 2011 2012 2013
Rented in (no. of households) 59 49 44 26
Mean hectares rented in (ha) 0.69 0.60 0.67 0.48
Figure 13: Nominal and Real Rentals Paid/Received by Households (2010-2013)
In the 2010 baseline 39 households (20%) left land uncultivated, the mean area of land
being 0.75ha. This number fluctuated over the study period with the final study round
having 44 households (22.56%) leaving 0.46ha in 2013. The main reasons attributed to
leaving land uncultivated over the four study years are shown in Figure 14. The main
reason for leaving land uncultivated was labour shortages, be it due to household size
and composition or due to illness of a household member. The negative impact that
such labour shortages have on livelihood strategies and livelihood outcomes, in
particular food security is widely under reported.
3,000
4,000
5,000
6,000
7,000
8,000
9,000
10,000
11,000
12,000
13,000
14,000
15,000
2010 2011 2012 2013
MK
Nominal value of rentals
received (MK/ha)
Real value of rentals
received (MK/ha)
Nominal value of rentals
paid (MK/ha)
Real value of rentals paid
(MK/ha)
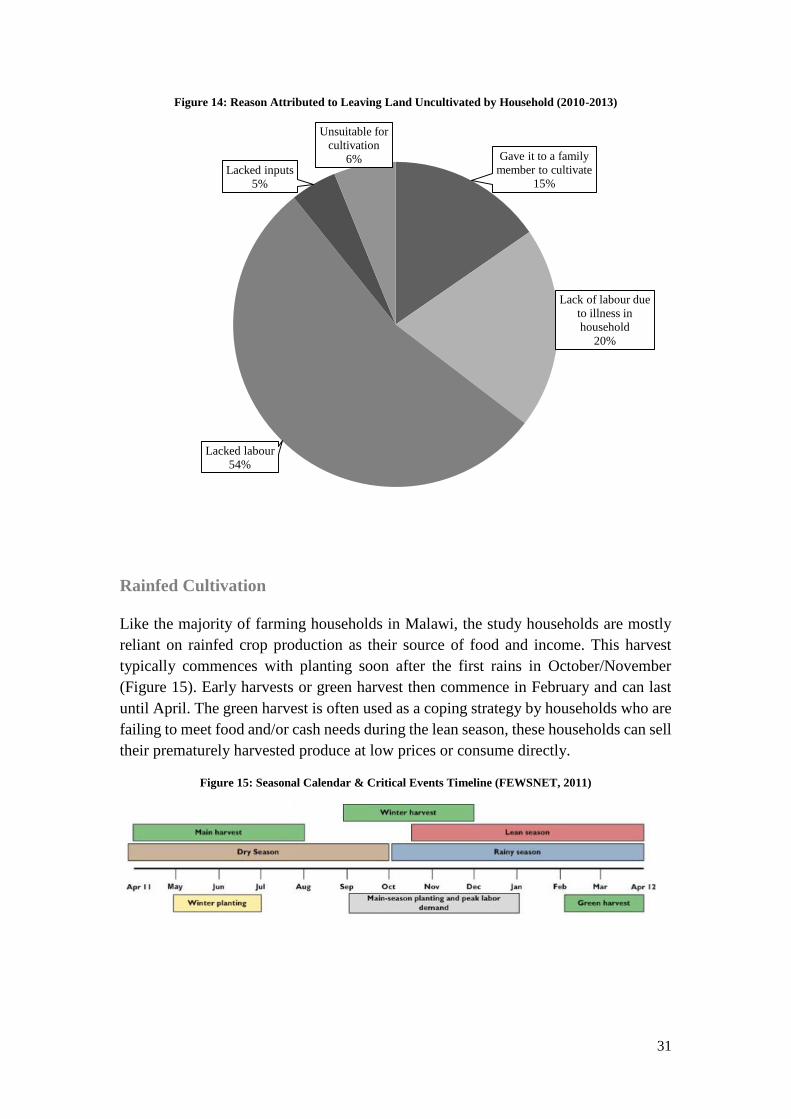
31
Figure 14: Reason Attributed to Leaving Land Uncultivated by Household (2010-2013)
Rainfed Cultivation
Like the majority of farming households in Malawi, the study households are mostly
reliant on rainfed crop production as their source of food and income. This harvest
typically commences with planting soon after the first rains in October/November
(Figure 15). Early harvests or green harvest then commence in February and can last
until April. The green harvest is often used as a coping strategy by households who are
failing to meet food and/or cash needs during the lean season, these households can sell
their prematurely harvested produce at low prices or consume directly.
Figure 15: Seasonal Calendar & Critical Events Timeline (FEWSNET, 2011)
Gave it to a family
member to cultivate
15%
Lack of labour due
to illness in
household
20%
Lacked labour
54%
Lacked inputs
5%
Unsuitable for
cultivation
6%
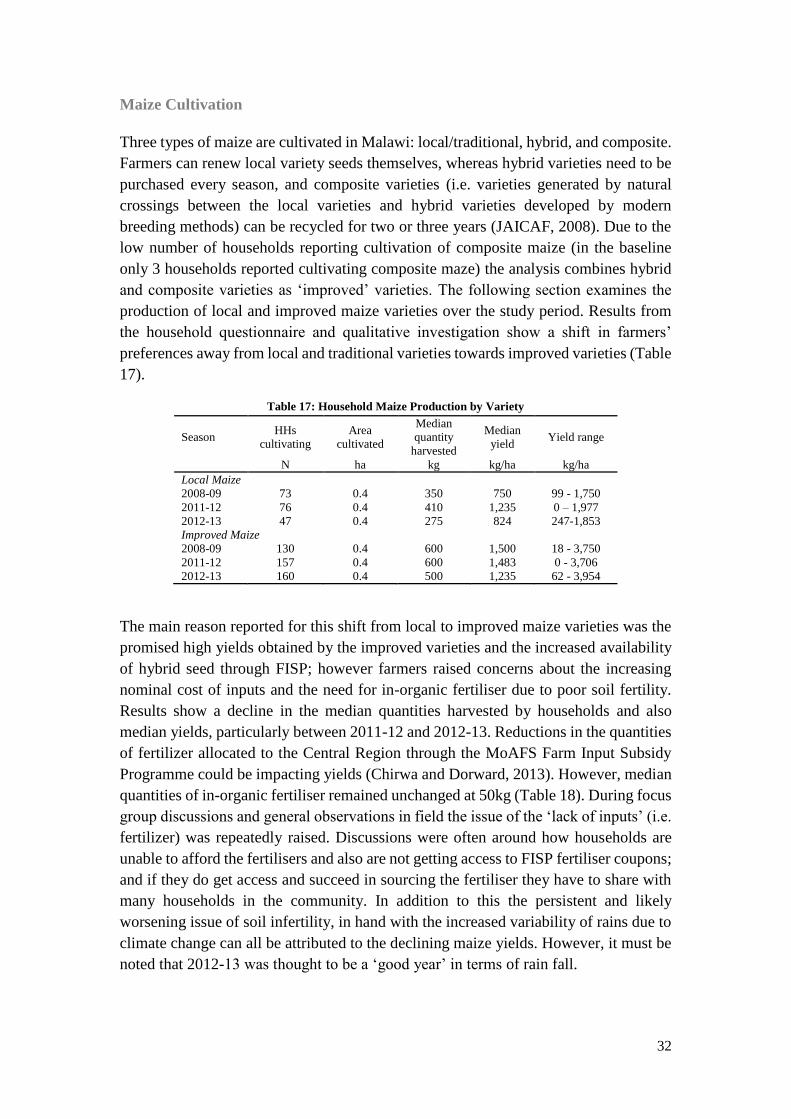
32
Maize Cultivation
Three types of maize are cultivated in Malawi: local/traditional, hybrid, and composite.
Farmers can renew local variety seeds themselves, whereas hybrid varieties need to be
purchased every season, and composite varieties (i.e. varieties generated by natural
crossings between the local varieties and hybrid varieties developed by modern
breeding methods) can be recycled for two or three years (JAICAF, 2008). Due to the
low number of households reporting cultivation of composite maize (in the baseline
only 3 households reported cultivating composite maze) the analysis combines hybrid
and composite varieties as ‘improved’ varieties. The following section examines the
production of local and improved maize varieties over the study period. Results from
the household questionnaire and qualitative investigation show a shift in farmers’
preferences away from local and traditional varieties towards improved varieties (Table
17).
Table 17: Household Maize Production by Variety
Season HHs
cultivating
Area
cultivated
Median
quantity
harvested
Median
yield Yield range
N ha kg kg/ha kg/ha
Local Maize
2008-09 73 0.4 350 750 99 - 1,750
2011-12 76 0.4 410 1,235 0 – 1,977
2012-13 47 0.4 275 824 247-1,853
Improved Maize
2008-09 130 0.4 600 1,500 18 - 3,750
2011-12 157 0.4 600 1,483 0 - 3,706
2012-13 160 0.4 500 1,235 62 - 3,954
The main reason reported for this shift from local to improved maize varieties was the
promised high yields obtained by the improved varieties and the increased availability
of hybrid seed through FISP; however farmers raised concerns about the increasing
nominal cost of inputs and the need for in-organic fertiliser due to poor soil fertility.
Results show a decline in the median quantities harvested by households and also
median yields, particularly between 2011-12 and 2012-13. Reductions in the quantities
of fertilizer allocated to the Central Region through the MoAFS Farm Input Subsidy
Programme could be impacting yields (Chirwa and Dorward, 2013). However, median
quantities of in-organic fertiliser remained unchanged at 50kg (Table 18). During focus
group discussions and general observations in field the issue of the ‘lack of inputs’ (i.e.
fertilizer) was repeatedly raised. Discussions were often around how households are
unable to afford the fertilisers and also are not getting access to FISP fertiliser coupons;
and if they do get access and succeed in sourcing the fertiliser they have to share with
many households in the community. In addition to this the persistent and likely
worsening issue of soil infertility, in hand with the increased variability of rains due to
climate change can all be attributed to the declining maize yields. However, it must be
noted that 2012-13 was thought to be a ‘good year’ in terms of rain fall.
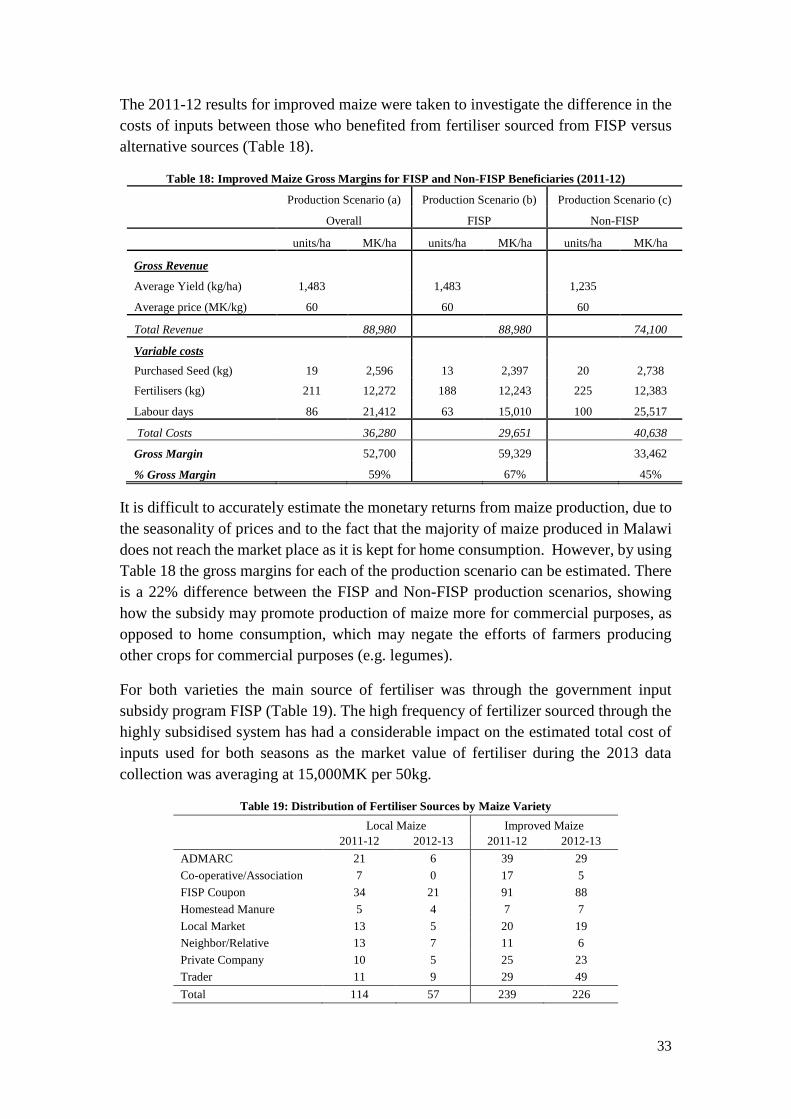
33
The 2011-12 results for improved maize were taken to investigate the difference in the
costs of inputs between those who benefited from fertiliser sourced from FISP versus
alternative sources (Table 18).
Table 18: Improved Maize Gross Margins for FISP and Non-FISP Beneficiaries (2011-12)
Production Scenario (a) Production Scenario (b) Production Scenario (c)
Overall FISP Non-FISP
units/ha MK/ha units/ha MK/ha units/ha MK/ha
Gross Revenue
Average Yield (kg/ha) 1,483 1,483 1,235
Average price (MK/kg) 60 60 60
Total Revenue 88,980 88,980 74,100
Variable costs
Purchased Seed (kg) 19 2,596 13 2,397 20 2,738
Fertilisers (kg) 211 12,272 188 12,243 225 12,383
Labour days 86 21,412 63 15,010 100 25,517
Total Costs 36,280 29,651 40,638
Gross Margin 52,700 59,329 33,462
% Gross Margin 59% 67% 45%
It is difficult to accurately estimate the monetary returns from maize production, due to
the seasonality of prices and to the fact that the majority of maize produced in Malawi
does not reach the market place as it is kept for home consumption. However, by using
Table 18 the gross margins for each of the production scenario can be estimated. There
is a 22% difference between the FISP and Non-FISP production scenarios, showing
how the subsidy may promote production of maize more for commercial purposes, as
opposed to home consumption, which may negate the efforts of farmers producing
other crops for commercial purposes (e.g. legumes).
For both varieties the main source of fertiliser was through the government input
subsidy program FISP (Table 19). The high frequency of fertilizer sourced through the
highly subsidised system has had a considerable impact on the estimated total cost of
inputs used for both seasons as the market value of fertiliser during the 2013 data
collection was averaging at 15,000MK per 50kg.
Table 19: Distribution of Fertiliser Sources by Maize Variety
Local Maize Improved Maize
2011-12 2012-13 2011-12 2012-13
ADMARC 21 6 39 29
Co-operative/Association 7 0 17 5
FISP Coupon 34 21 91 88
Homestead Manure 5 4 7 7
Local Market 13 5 20 19
Neighbor/Relative 13 7 11 6
Private Company 10 5 25 23
Trader 11 9 29 49
Total 114 57 239 226
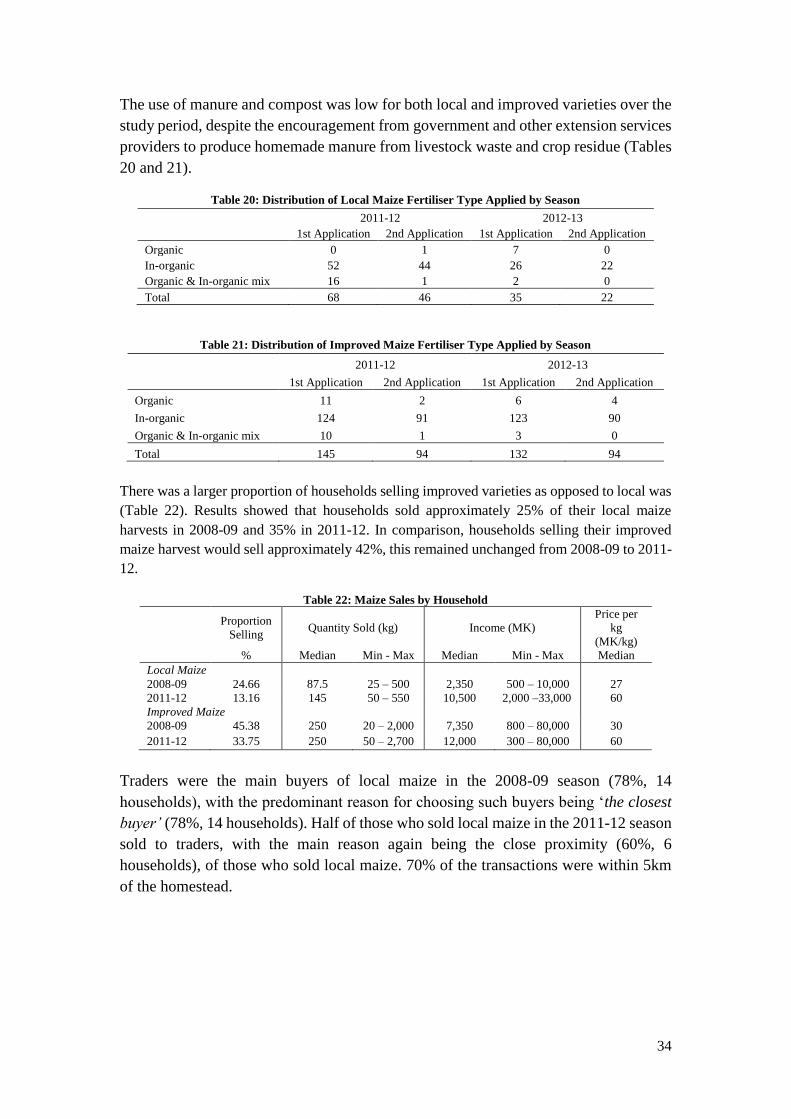
34
The use of manure and compost was low for both local and improved varieties over the
study period, despite the encouragement from government and other extension services
providers to produce homemade manure from livestock waste and crop residue (Tables
20 and 21).
Table 20: Distribution of Local Maize Fertiliser Type Applied by Season
2011-12 2012-13
1st Application 2nd Application 1st Application 2nd Application
Organic 0 1 7 0
In-organic 52 44 26 22
Organic & In-organic mix 16 1 2 0
Total 68 46 35 22
Table 21: Distribution of Improved Maize Fertiliser Type Applied by Season
2011-12 2012-13
1st Application 2nd Application 1st Application 2nd Application
Organic 11 2 6 4
In-organic 124 91 123 90
Organic & In-organic mix 10 1 3 0
Total 145 94 132 94
There was a larger proportion of households selling improved varieties as opposed to local was
(Table 22). Results showed that households sold approximately 25% of their local maize
harvests in 2008-09 and 35% in 2011-12. In comparison, households selling their improved
maize harvest would sell approximately 42%, this remained unchanged from 2008-09 to 2011-
12.
Table 22: Maize Sales by Household
Proportion
Selling Quantity Sold (kg) Income (MK)
Price per
kg
(MK/kg)
% Median Min - Max Median Min - Max Median
Local Maize
2008-09 24.66 87.5 25 – 500 2,350 500 – 10,000 27
2011-12 13.16 145 50 – 550 10,500 2,000 –33,000 60
Improved Maize
2008-09 45.38 250 20 – 2,000 7,350 800 – 80,000 30
2011-12 33.75 250 50 – 2,700 12,000 300 – 80,000 60
Traders were the main buyers of local maize in the 2008-09 season (78%, 14
households), with the predominant reason for choosing such buyers being ‘the closest
buyer’ (78%, 14 households). Half of those who sold local maize in the 2011-12 season
sold to traders, with the main reason again being the close proximity (60%, 6
households), of those who sold local maize. 70% of the transactions were within 5km
of the homestead.
35
As with local maize, the main buyers for improved maize were traders (69.5%, 41
households), and again the main reason for choosing such buyers was ‘the closest
buyer’ (71.2%, 42 households). 58.5% (31 households) of those who sold improved
maize in the 2011-13 season sold to traders, with the main reason again being the close
proximity (53%, 28 households): of those who sold local maize 68% (36 households)
of the transactions were within 5km of the homestead.
Producing enough maize to meet household consumption needs is the main objective
of households that cultivate maize; therefore the production of maize for commercial
purposes is rare. The majority of those who do sell maize are for reasons such as
meeting immediate or urgent cash needs or due to lack of storage facilities.
Groundnut Cultivation16
There was a 6% increase in the total number of households cultivating groundnuts from
the baseline season (2008-09) to the final season (2012-13). There was no significant
change between mean area cultivated over the study period, however those who were
members of the intervention associations for the four years had the highest area of land
allocated to groundnut cultivation for each season analysed (Table 23).
Table 23: No. of HHs Cultivating Groundnut (n) & Area Cultivated (ha) by Year
Number of HHs Cultivating (n) Area Cultivated (ha)
2008-09 2011-12 2012-13 2008-09 2011-12 2012-13
Overall 146 161 156 0.34 0.35 0.36
Association Membership
Association Member 4yrs 45 53 67 0.42 0.41 0.42
Association Member <4yrs 68 74 52 0.31 0.33 0.35
Never Association Member 33 34 37 0.31 0.3 0.31
Wealth Group
Low 52 48 54 0.20 0.20 0.20
Middle 77 89 82 0.40 0.34 0.40
High 17 24 20 0.40 0.51 0.40
The mean yield for the overall sample in 2012-13 was 876kg/ha (SD = 637kg/ha); this
is in line with national yield estimates (Simtowe et al, 2009, ICRISAT, 2013). However,
as the data for quantities harvested is positively skewed, hereafter the median and range
will be used. Trends show that there was an increase in the quantities harvested and in
yields for groundnuts (Table 24).
16 Unless stated otherwise, groundnut quantities reported represent nuts in shell (NIS) as opposed to shelled.
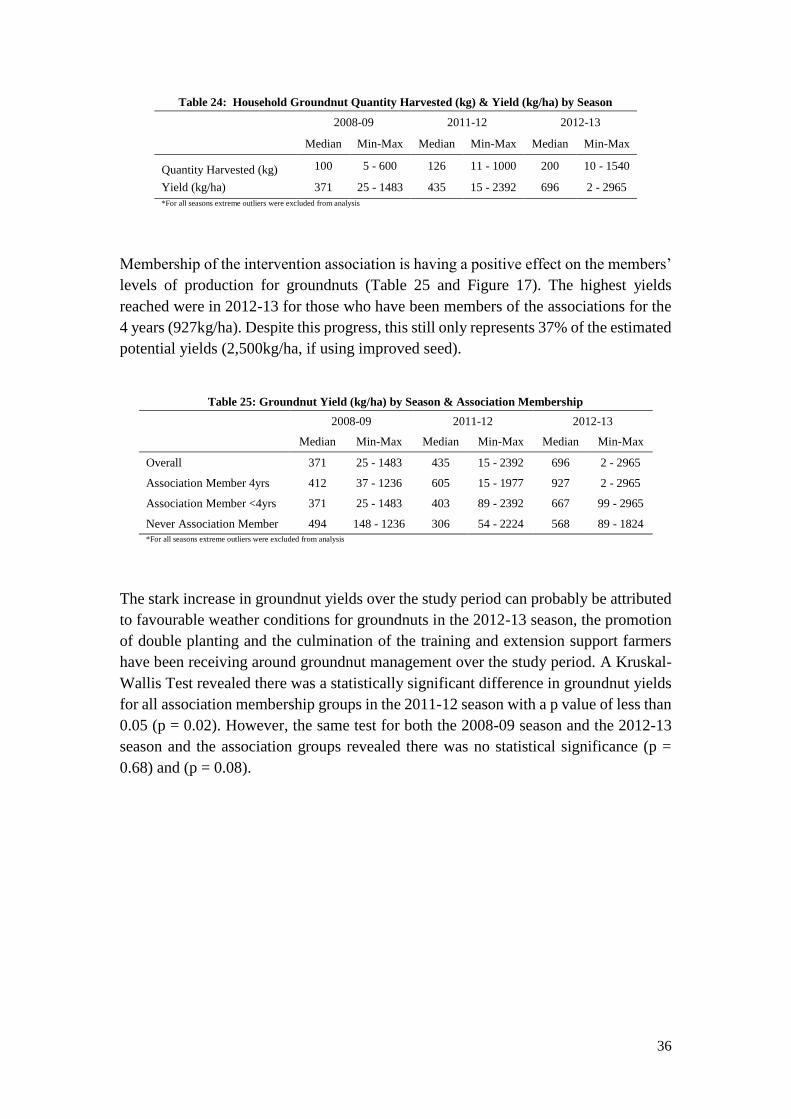
36
Table 24: Household Groundnut Quantity Harvested (kg) & Yield (kg/ha) by Season
2008-09 2011-12 2012-13
Median Min-Max Median Min-Max Median Min-Max
Quantity Harvested (kg) 100 5 - 600 126 11 - 1000 200 10 - 1540
Yield (kg/ha) 371 25 - 1483 435 15 - 2392 696 2 - 2965
*For all seasons extreme outliers were excluded from analysis
Membership of the intervention association is having a positive effect on the members’
levels of production for groundnuts (Table 25 and Figure 17). The highest yields
reached were in 2012-13 for those who have been members of the associations for the
4 years (927kg/ha). Despite this progress, this still only represents 37% of the estimated
potential yields (2,500kg/ha, if using improved seed).
Table 25: Groundnut Yield (kg/ha) by Season & Association Membership
2008-09 2011-12 2012-13
Median Min-Max Median Min-Max Median Min-Max
Overall 371 25 - 1483 435 15 - 2392 696 2 - 2965
Association Member 4yrs 412 37 - 1236 605 15 - 1977 927 2 - 2965
Association Member <4yrs 371 25 - 1483 403 89 - 2392 667 99 - 2965
Never Association Member 494 148 - 1236 306 54 - 2224 568 89 - 1824
*For all seasons extreme outliers were excluded from analysis
The stark increase in groundnut yields over the study period can probably be attributed
to favourable weather conditions for groundnuts in the 2012-13 season, the promotion
of double planting and the culmination of the training and extension support farmers
have been receiving around groundnut management over the study period. A Kruskal-
Wallis Test revealed there was a statistically significant difference in groundnut yields
for all association membership groups in the 2011-12 season with a p value of less than
0.05 (p = 0.02). However, the same test for both the 2008-09 season and the 2012-13
season and the association groups revealed there was no statistical significance (p =
0.68) and (p = 0.08).

37
Figure 16: Groundnut Yield (kg/ha) by Season & Association Membership
Despite this increase over the study period, as noted earlier, the yields remain
persistently low: this can be attributed to the recycling of seed and use of low-yielding
varieties, infertile soils, pest and disease attack, competition for labour with other crops,
increased variability of rains, and low levels of knowledge and skills.
With regard to the recycling of seed and use of low-yielding varieties, the number of
households using improved groundnut seed remains low with 26% of households using
some type of improved seed in the baseline season, 37% in the 2011-12 season and
23% in the 2012-13 season. For those who used new seed, as opposed to recycling,
availing of groundnut seed on credit was the most common source of improved
groundnut seed, however levels of seed on credit remained low with only 14 (9%)
households that cultivated groundnuts in the 2012-13 season using seed on credit (Table
26).
Table 26: Source of Purchased Seed
2011-12 2012-13
FISP Coupon 0 3
Local Market 10 6
Neighbor/Relative 13 7
NGO 2 0
Private Company 3 0
Seed on Credit 25 14
Trader 7 3
Total 60 33
In addition to the recycling of seed and use of low-yielding varieties, the use of
fertiliser, both organic and in-organic, is not practiced by farmers. In the 2012-13
season no households cultivating groundnut reported using fertiliser in comparison to
the 2011-12 season when two households reported use of fertiliser.
0
100
200
300
400
500
600
700
800
900
1,000
2008-09 2011-12 2012-13
Overall
Association Member
4yrs
Association Member
<4yrs
Never Association
Member
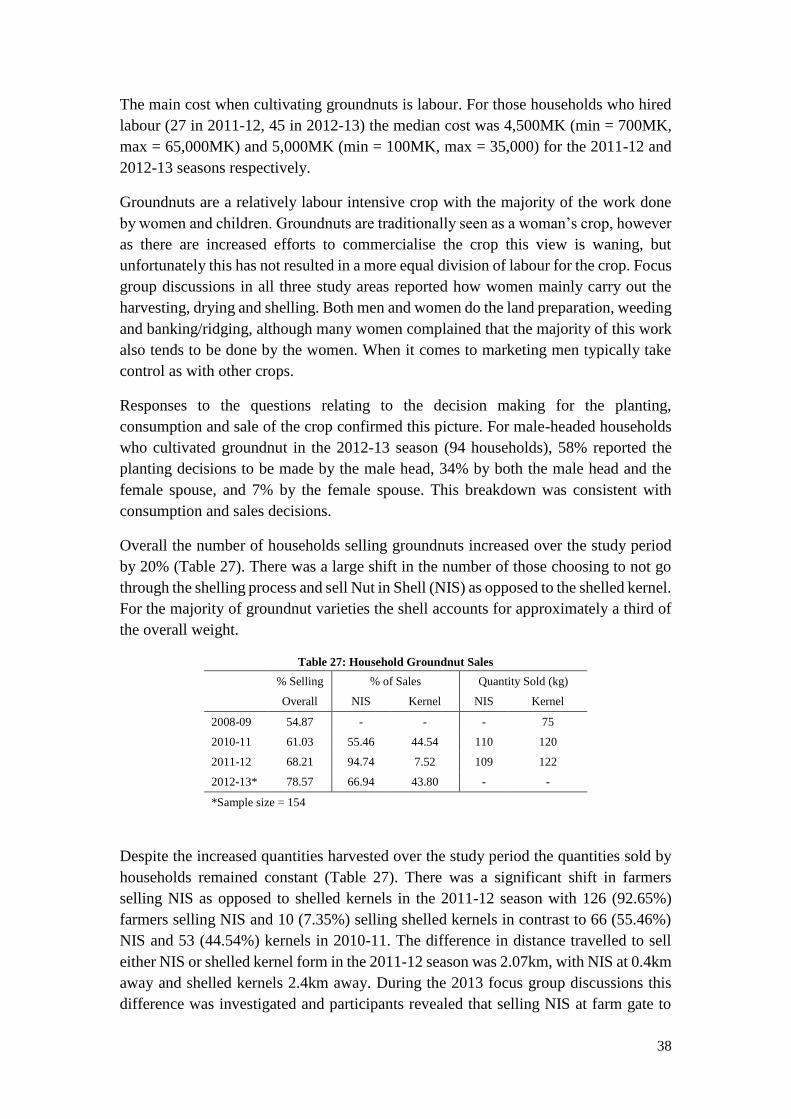
38
The main cost when cultivating groundnuts is labour. For those households who hired
labour (27 in 2011-12, 45 in 2012-13) the median cost was 4,500MK (min = 700MK,
max = 65,000MK) and 5,000MK (min = 100MK, max = 35,000) for the 2011-12 and
2012-13 seasons respectively.
Groundnuts are a relatively labour intensive crop with the majority of the work done
by women and children. Groundnuts are traditionally seen as a woman’s crop, however
as there are increased efforts to commercialise the crop this view is waning, but
unfortunately this has not resulted in a more equal division of labour for the crop. Focus
group discussions in all three study areas reported how women mainly carry out the
harvesting, drying and shelling. Both men and women do the land preparation, weeding
and banking/ridging, although many women complained that the majority of this work
also tends to be done by the women. When it comes to marketing men typically take
control as with other crops.
Responses to the questions relating to the decision making for the planting,
consumption and sale of the crop confirmed this picture. For male-headed households
who cultivated groundnut in the 2012-13 season (94 households), 58% reported the
planting decisions to be made by the male head, 34% by both the male head and the
female spouse, and 7% by the female spouse. This breakdown was consistent with
consumption and sales decisions.
Overall the number of households selling groundnuts increased over the study period
by 20% (Table 27). There was a large shift in the number of those choosing to not go
through the shelling process and sell Nut in Shell (NIS) as opposed to the shelled kernel.
For the majority of groundnut varieties the shell accounts for approximately a third of
the overall weight.
Table 27: Household Groundnut Sales
% Selling % of Sales Quantity Sold (kg)
Overall NIS Kernel NIS Kernel
2008-09 54.87 - - - 75
2010-11 61.03 55.46 44.54 110 120
2011-12 68.21 94.74 7.52 109 122
2012-13* 78.57 66.94 43.80 - -
*Sample size = 154
Despite the increased quantities harvested over the study period the quantities sold by
households remained constant (Table 27). There was a significant shift in farmers
selling NIS as opposed to shelled kernels in the 2011-12 season with 126 (92.65%)
farmers selling NIS and 10 (7.35%) selling shelled kernels in contrast to 66 (55.46%)
NIS and 53 (44.54%) kernels in 2010-11. The difference in distance travelled to sell
either NIS or shelled kernel form in the 2011-12 season was 2.07km, with NIS at 0.4km
away and shelled kernels 2.4km away. During the 2013 focus group discussions this
difference was investigated and participants revealed that selling NIS at farm gate to
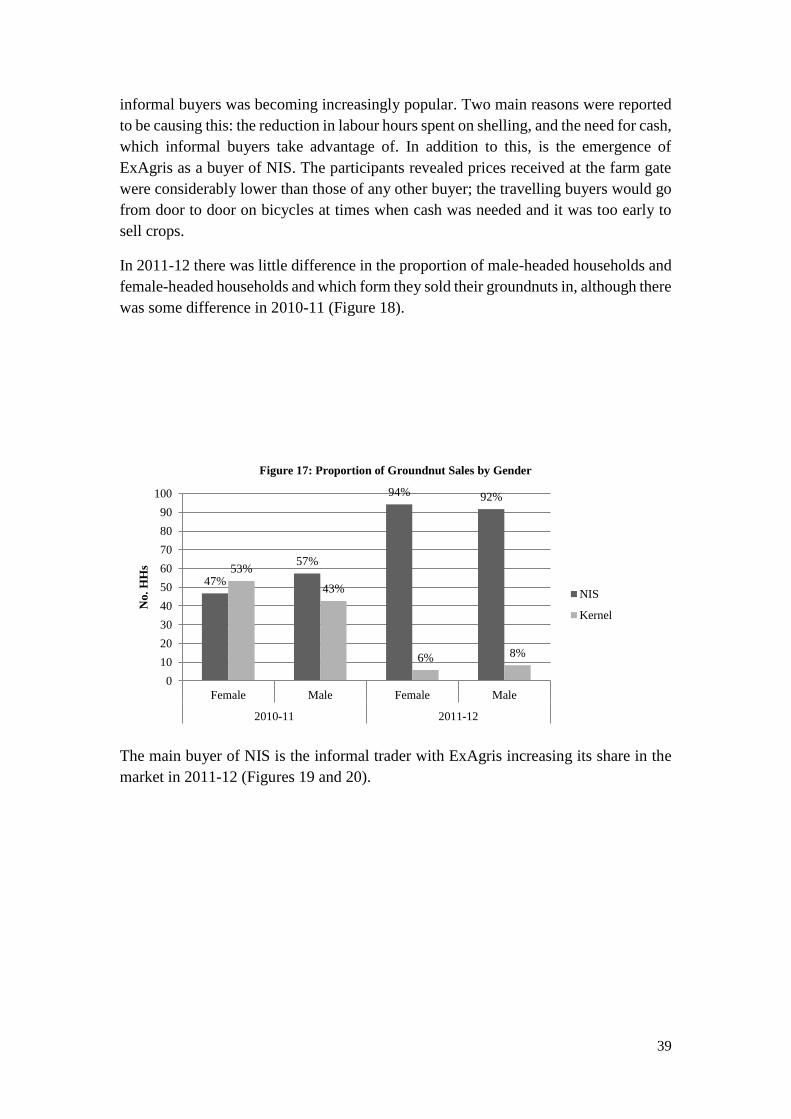
39
informal buyers was becoming increasingly popular. Two main reasons were reported
to be causing this: the reduction in labour hours spent on shelling, and the need for cash,
which informal buyers take advantage of. In addition to this, is the emergence of
ExAgris as a buyer of NIS. The participants revealed prices received at the farm gate
were considerably lower than those of any other buyer; the travelling buyers would go
from door to door on bicycles at times when cash was needed and it was too early to
sell crops.
In 2011-12 there was little difference in the proportion of male-headed households and
female-headed households and which form they sold their groundnuts in, although there
was some difference in 2010-11 (Figure 18).
Figure 17: Proportion of Groundnut Sales by Gender
The main buyer of NIS is the informal trader with ExAgris increasing its share in the
market in 2011-12 (Figures 19 and 20).
47%
57%
94% 92%
53%
43%
6% 8%
0
10
20
30
40
50
60
70
80
90
100
Female Male Female Male
2010-11 2011-12
No.
HH
s
NIS
Kernel
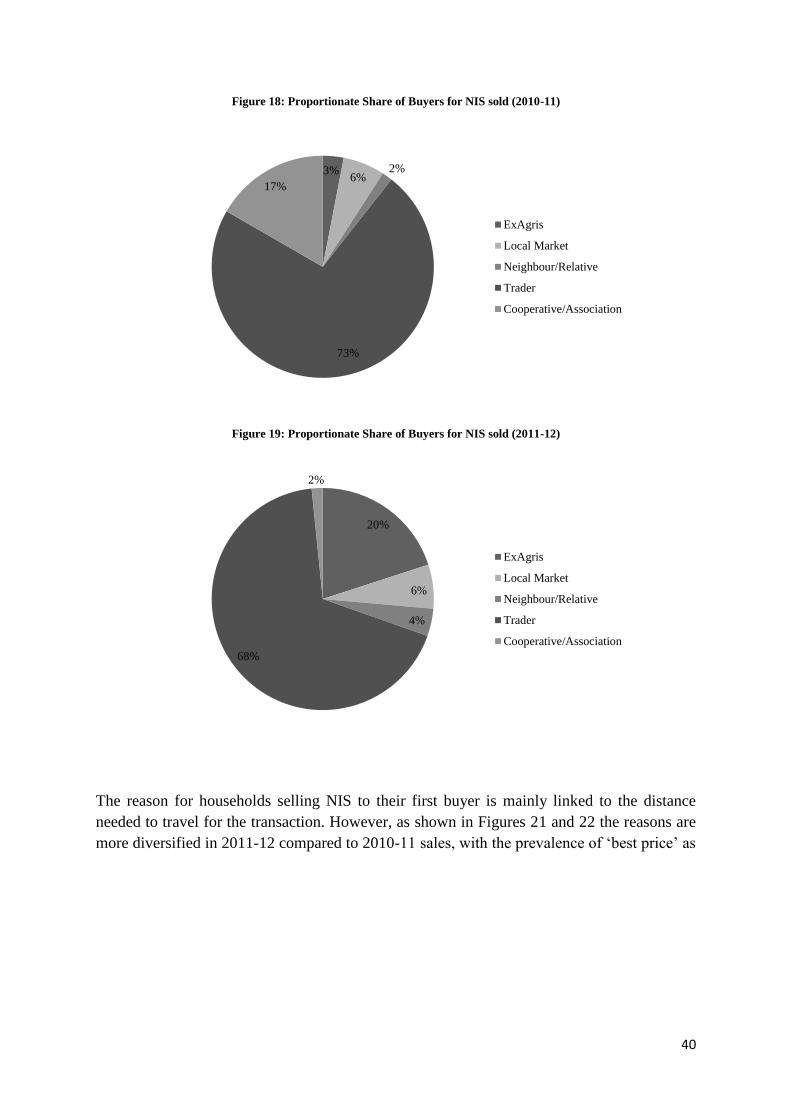
40
Figure 18: Proportionate Share of Buyers for NIS sold (2010-11)
Figure 19: Proportionate Share of Buyers for NIS sold (2011-12)
The reason for households selling NIS to their first buyer is mainly linked to the distance
needed to travel for the transaction. However, as shown in Figures 21 and 22 the reasons are
more diversified in 2011-12 compared to 2010-11 sales, with the prevalence of ‘best price’ as
3%6%
2%
73%
17%
ExAgris
Local Market
Neighbour/Relative
Trader
Cooperative/Association
20%
6%
4%
68%
2%
ExAgris
Local Market
Neighbour/Relative
Trader
Cooperative/Association
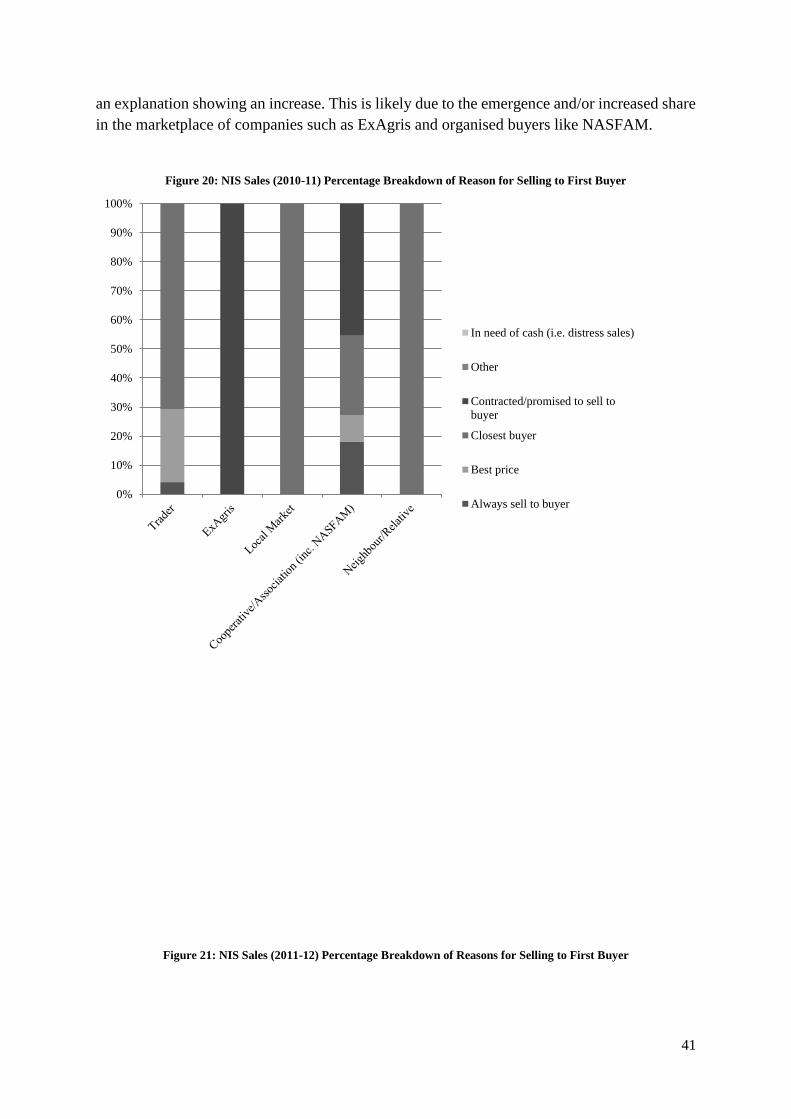
41
an explanation showing an increase. This is likely due to the emergence and/or increased share
in the marketplace of companies such as ExAgris and organised buyers like NASFAM.
Figure 20: NIS Sales (2010-11) Percentage Breakdown of Reason for Selling to First Buyer
Figure 21: NIS Sales (2011-12) Percentage Breakdown of Reasons for Selling to First Buyer
0%
10%
20%
30%
40%
50%
60%
70%
80%
90%
100%
In need of cash (i.e. distress sales)
Other
Contracted/promised to sell to
buyer
Closest buyer
Best price
Always sell to buyer
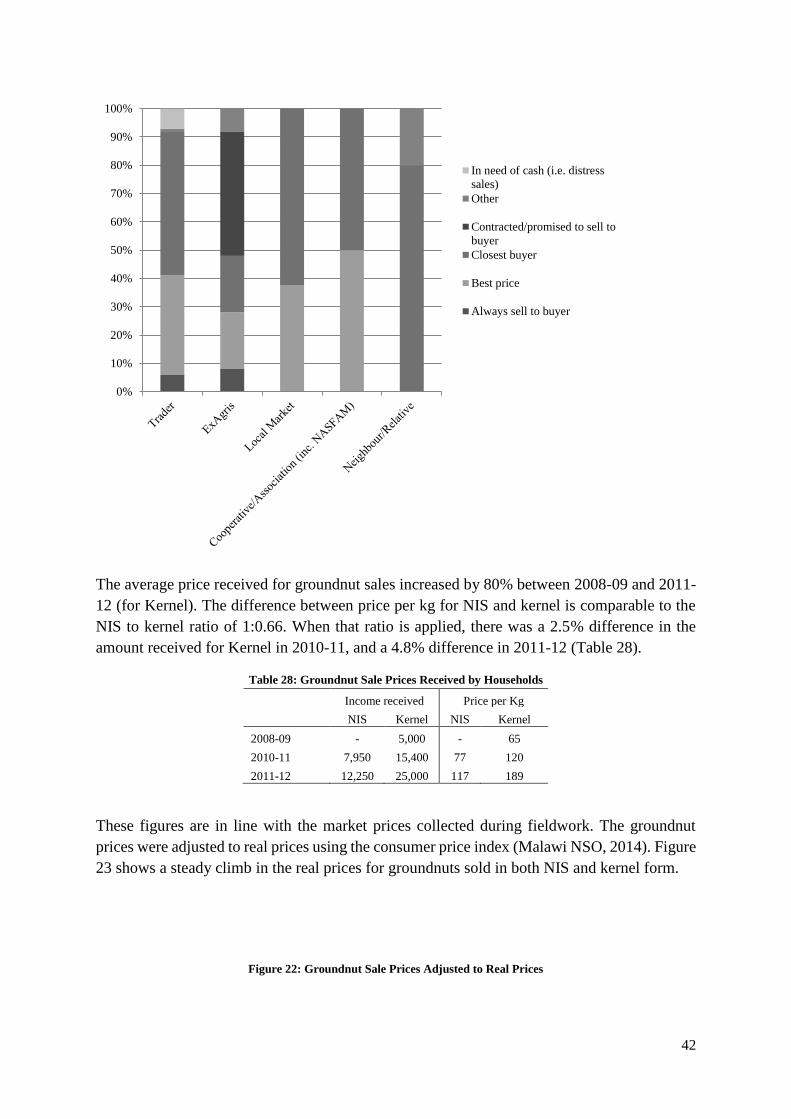
42
The average price received for groundnut sales increased by 80% between 2008-09 and 2011-
12 (for Kernel). The difference between price per kg for NIS and kernel is comparable to the
NIS to kernel ratio of 1:0.66. When that ratio is applied, there was a 2.5% difference in the
amount received for Kernel in 2010-11, and a 4.8% difference in 2011-12 (Table 28).
Table 28: Groundnut Sale Prices Received by Households
Income received Price per Kg
NIS Kernel NIS Kernel
2008-09 - 5,000 - 65
2010-11 7,950 15,400 77 120
2011-12 12,250 25,000 117 189
These figures are in line with the market prices collected during fieldwork. The groundnut
prices were adjusted to real prices using the consumer price index (Malawi NSO, 2014). Figure
23 shows a steady climb in the real prices for groundnuts sold in both NIS and kernel form.
Figure 22: Groundnut Sale Prices Adjusted to Real Prices
0%
10%
20%
30%
40%
50%
60%
70%
80%
90%
100%
In need of cash (i.e. distress
sales)
Other
Contracted/promised to sell to
buyer
Closest buyer
Best price
Always sell to buyer
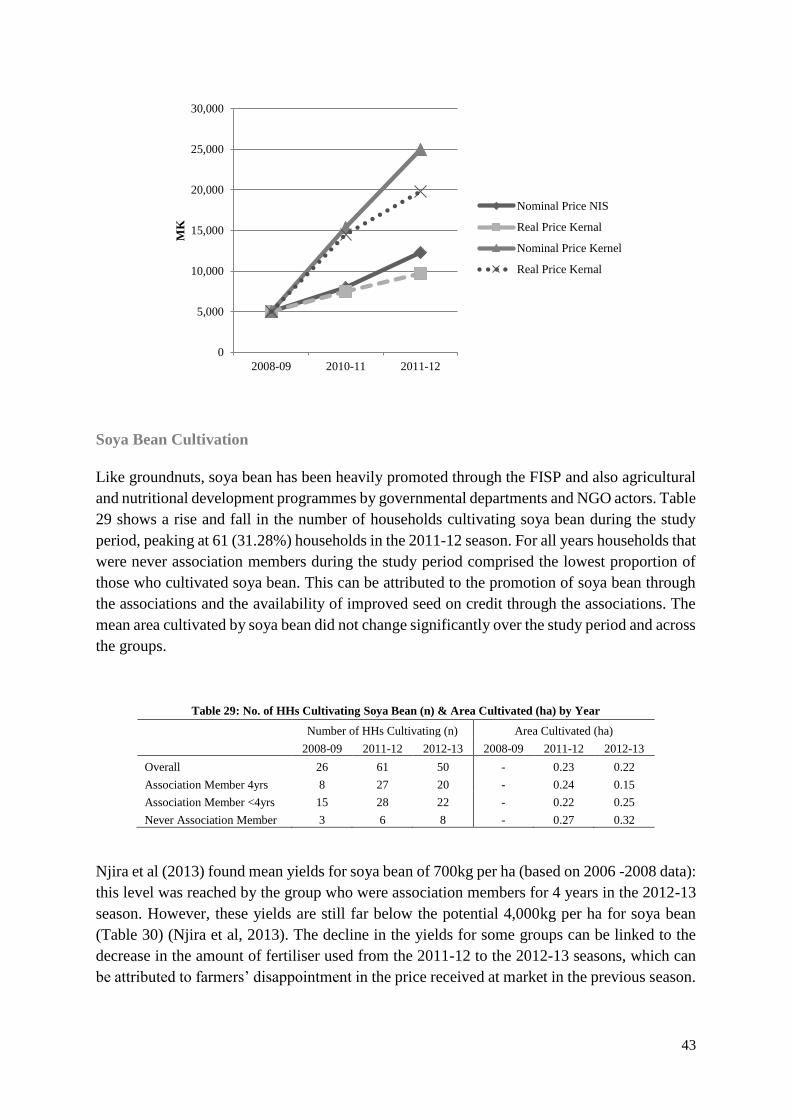
43
Soya Bean Cultivation
Like groundnuts, soya bean has been heavily promoted through the FISP and also agricultural
and nutritional development programmes by governmental departments and NGO actors. Table
29 shows a rise and fall in the number of households cultivating soya bean during the study
period, peaking at 61 (31.28%) households in the 2011-12 season. For all years households that
were never association members during the study period comprised the lowest proportion of
those who cultivated soya bean. This can be attributed to the promotion of soya bean through
the associations and the availability of improved seed on credit through the associations. The
mean area cultivated by soya bean did not change significantly over the study period and across
the groups.
Table 29: No. of HHs Cultivating Soya Bean (n) & Area Cultivated (ha) by Year
Number of HHs Cultivating (n) Area Cultivated (ha)
2008-09 2011-12 2012-13 2008-09 2011-12 2012-13
Overall 26 61 50 - 0.23 0.22
Association Member 4yrs 8 27 20 - 0.24 0.15
Association Member <4yrs 15 28 22 - 0.22 0.25
Never Association Member 3 6 8 - 0.27 0.32
Njira et al (2013) found mean yields for soya bean of 700kg per ha (based on 2006 -2008 data):
this level was reached by the group who were association members for 4 years in the 2012-13
season. However, these yields are still far below the potential 4,000kg per ha for soya bean
(Table 30) (Njira et al, 2013). The decline in the yields for some groups can be linked to the
decrease in the amount of fertiliser used from the 2011-12 to the 2012-13 seasons, which can
be attributed to farmers’ disappointment in the price received at market in the previous season.
0
5,000
10,000
15,000
20,000
25,000
30,000
2008-09 2010-11 2011-12
MK
Nominal Price NIS
Real Price Kernal
Nominal Price Kernel
Real Price Kernal
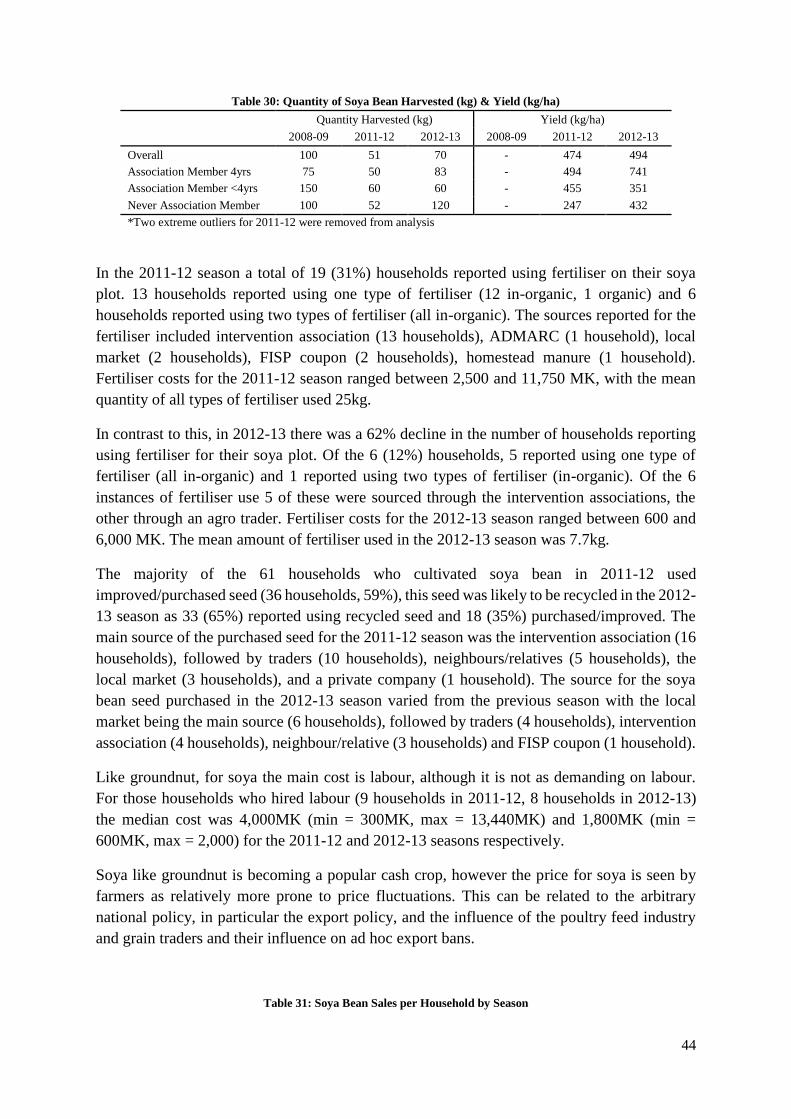
44
Table 30: Quantity of Soya Bean Harvested (kg) & Yield (kg/ha)
Quantity Harvested (kg) Yield (kg/ha)
2008-09 2011-12 2012-13 2008-09 2011-12 2012-13
Overall 100 51 70 - 474 494
Association Member 4yrs 75 50 83 - 494 741
Association Member <4yrs 150 60 60 - 455 351
Never Association Member 100 52 120 - 247 432
*Two extreme outliers for 2011-12 were removed from analysis
In the 2011-12 season a total of 19 (31%) households reported using fertiliser on their soya
plot. 13 households reported using one type of fertiliser (12 in-organic, 1 organic) and 6
households reported using two types of fertiliser (all in-organic). The sources reported for the
fertiliser included intervention association (13 households), ADMARC (1 household), local
market (2 households), FISP coupon (2 households), homestead manure (1 household).
Fertiliser costs for the 2011-12 season ranged between 2,500 and 11,750 MK, with the mean
quantity of all types of fertiliser used 25kg.
In contrast to this, in 2012-13 there was a 62% decline in the number of households reporting
using fertiliser for their soya plot. Of the 6 (12%) households, 5 reported using one type of
fertiliser (all in-organic) and 1 reported using two types of fertiliser (in-organic). Of the 6
instances of fertiliser use 5 of these were sourced through the intervention associations, the
other through an agro trader. Fertiliser costs for the 2012-13 season ranged between 600 and
6,000 MK. The mean amount of fertiliser used in the 2012-13 season was 7.7kg.
The majority of the 61 households who cultivated soya bean in 2011-12 used
improved/purchased seed (36 households, 59%), this seed was likely to be recycled in the 2012-
13 season as 33 (65%) reported using recycled seed and 18 (35%) purchased/improved. The
main source of the purchased seed for the 2011-12 season was the intervention association (16
households), followed by traders (10 households), neighbours/relatives (5 households), the
local market (3 households), and a private company (1 household). The source for the soya
bean seed purchased in the 2012-13 season varied from the previous season with the local
market being the main source (6 households), followed by traders (4 households), intervention
association (4 households), neighbour/relative (3 households) and FISP coupon (1 household).
Like groundnut, for soya the main cost is labour, although it is not as demanding on labour.
For those households who hired labour (9 households in 2011-12, 8 households in 2012-13)
the median cost was 4,000MK (min = 300MK, max = 13,440MK) and 1,800MK (min =
600MK, max = 2,000) for the 2011-12 and 2012-13 seasons respectively.
Soya like groundnut is becoming a popular cash crop, however the price for soya is seen by
farmers as relatively more prone to price fluctuations. This can be related to the arbitrary
national policy, in particular the export policy, and the influence of the poultry feed industry
and grain traders and their influence on ad hoc export bans.
Table 31: Soya Bean Sales per Household by Season
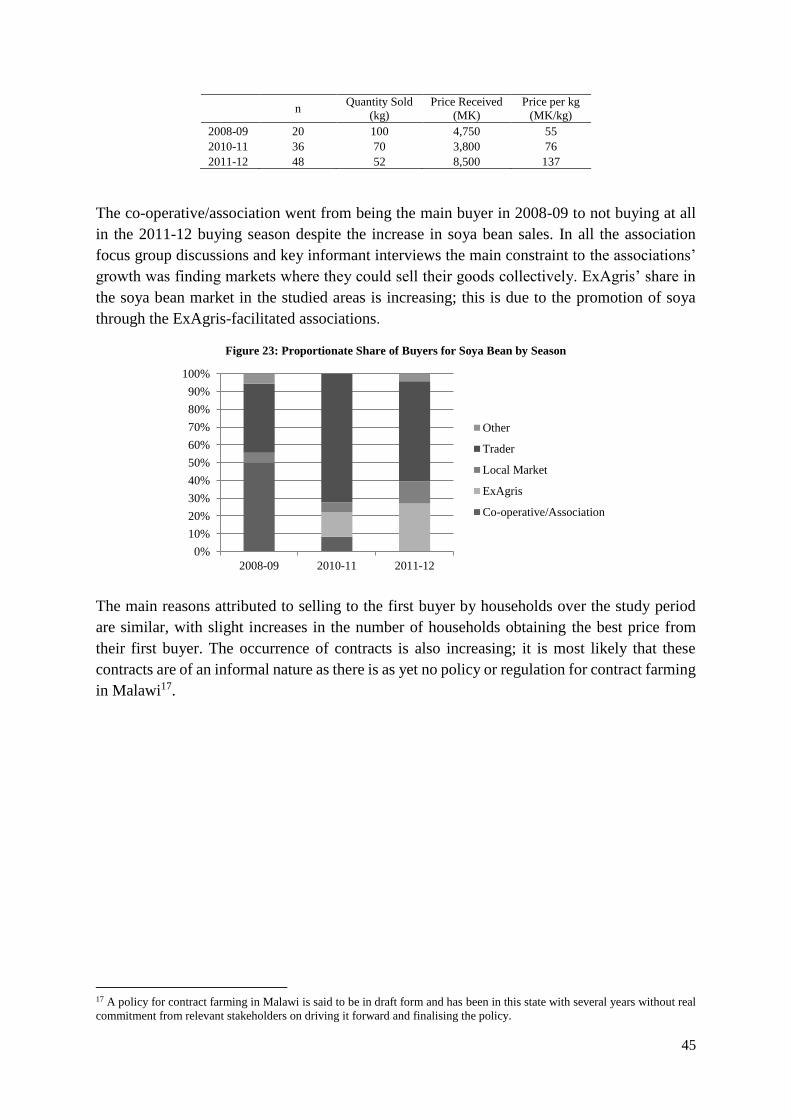
45
n
Quantity Sold
(kg)
Price Received
(MK)
Price per kg
(MK/kg)
2008-09 20 100 4,750 55
2010-11 36 70 3,800 76
2011-12 48 52 8,500 137
The co-operative/association went from being the main buyer in 2008-09 to not buying at all
in the 2011-12 buying season despite the increase in soya bean sales. In all the association
focus group discussions and key informant interviews the main constraint to the associations’
growth was finding markets where they could sell their goods collectively. ExAgris’ share in
the soya bean market in the studied areas is increasing; this is due to the promotion of soya
through the ExAgris-facilitated associations.
Figure 23: Proportionate Share of Buyers for Soya Bean by Season
The main reasons attributed to selling to the first buyer by households over the study period
are similar, with slight increases in the number of households obtaining the best price from
their first buyer. The occurrence of contracts is also increasing; it is most likely that these
contracts are of an informal nature as there is as yet no policy or regulation for contract farming
in Malawi17.
17 A policy for contract farming in Malawi is said to be in draft form and has been in this state with several years without real
commitment from relevant stakeholders on driving it forward and finalising the policy.
0%
10%
20%
30%
40%
50%
60%
70%
80%
90%
100%
2008-09 2010-11 2011-12
Other
Trader
Local Market
ExAgris
Co-operative/Association
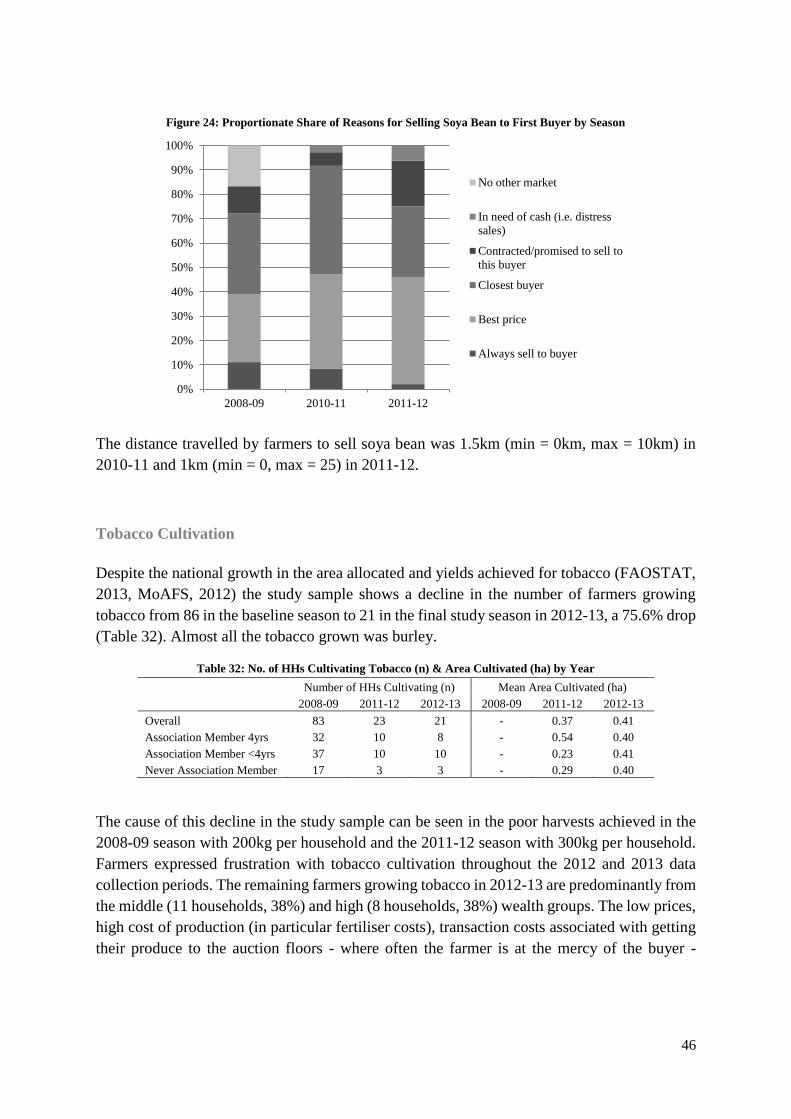
46
Figure 24: Proportionate Share of Reasons for Selling Soya Bean to First Buyer by Season
The distance travelled by farmers to sell soya bean was 1.5km (min = 0km, max = 10km) in
2010-11 and 1km (min = 0, max = 25) in 2011-12.
Tobacco Cultivation
Despite the national growth in the area allocated and yields achieved for tobacco (FAOSTAT,
2013, MoAFS, 2012) the study sample shows a decline in the number of farmers growing
tobacco from 86 in the baseline season to 21 in the final study season in 2012-13, a 75.6% drop
(Table 32). Almost all the tobacco grown was burley.
Table 32: No. of HHs Cultivating Tobacco (n) & Area Cultivated (ha) by Year
Number of HHs Cultivating (n) Mean Area Cultivated (ha)
2008-09 2011-12 2012-13 2008-09 2011-12 2012-13
Overall 83 23 21 - 0.37 0.41
Association Member 4yrs 32 10 8 - 0.54 0.40
Association Member <4yrs 37 10 10 - 0.23 0.41
Never Association Member 17 3 3 - 0.29 0.40
The cause of this decline in the study sample can be seen in the poor harvests achieved in the
2008-09 season with 200kg per household and the 2011-12 season with 300kg per household.
Farmers expressed frustration with tobacco cultivation throughout the 2012 and 2013 data
collection periods. The remaining farmers growing tobacco in 2012-13 are predominantly from
the middle (11 households, 38%) and high (8 households, 38%) wealth groups. The low prices,
high cost of production (in particular fertiliser costs), transaction costs associated with getting
their produce to the auction floors - where often the farmer is at the mercy of the buyer -
0%
10%
20%
30%
40%
50%
60%
70%
80%
90%
100%
2008-09 2010-11 2011-12
No other market
In need of cash (i.e. distress
sales)
Contracted/promised to sell to
this buyer
Closest buyer
Best price
Always sell to buyer
47
increasing variability of rains, and the growth of alternative cash crops (e.g. legumes) are
putting farmers off cultivating tobacco.
Table 33: Quantity of Tobacco Harvested & Yield
2008-09 2011-12 2012-13
Quantity Harvested (kg) 200 300 400
Yield (kg/ha) - 741 988
Fertiliser use for tobacco declined between the 2011-12 and 2012-13 seasons with 74% (17
households) applying one or more fertilisers in 2011-12, in comparison to 67% (14 households)
in the 2012-13 season. Almost all farmers using fertiliser applied in-organic fertiliser.
However, there was a sharp increase in the price of tobacco in the 2011-12 but this still did not
meet the average prices reported by the Tobacco Association of Malawi which for 2012 was
US$2.45 per kg of all types of tobacco (790.78MK/kg) (Table 34). This price increase can be
attributed to some of the economic reforms (e.g. devaluation and the return of major donors)
that occurred mid-2012 and/or the low national production levels which led to a supply/demand
imbalance in favour of the farmers that produced.
Table 34: Tobacco Sales by Season
Quantity Sold
(kg)
Price Received
(MK)
Price per kg
(MK/kg)
2008-09 200 27,000 145
2010-11 300 30,000 102
2011-12 300 120,000 448
*Two extreme outliers not included in 2008-09 analysis
As tobacco is sold through auction floors the main buyers reported were ‘auction floors’, with
90% and 92% selling to the auction floors for the 2010-11 and 2011-12 season respectively,
the only other buyers reported were traders. Farmers in Lilongwe face the lowest transport
costs as the median distance to point of sale was 30km, in comparison to Mchinji which was
150km and Salima 137km.
Cotton Cultivation
The number of households cultivating cotton over the study period ranged between 21 and 25
(11% - 15%) (Table 35). Cotton cultivation is predominantly in the lakeshore district, Salima
in particular: of all the instances of cotton being cultivated in the study sample over the three
seasons investigated (75 households), all were from Salima, apart from one who was from
Mchinji.
Table 35: Cotton Production by Season
2008-09 2011-12 2012-13
Number of HHs Cultivating (n) 21 29 25
Mean Area Cultivated (ha) - 0.37 0.33
Quantity Harvested (kg) 200 130 86
48
Yield (kg/ha) - 643 494
Figures for cotton sales are difficult to interpret as the sample size for those cultivating is quite
small (Table 36). Like tobacco, the cotton market is relatively more organised than that of
consumption cash crops (e.g. groundnut and soya bean). The majority of cotton sales over the
study period were to private companies on the basis of contracts with farmers through cotton
cooperatives or associations.
Table 36: Cotton Sales by Season
Quantity Sold
(kg)
Price Received
(MK)
Price per kg
(MK/kg)
2008-09 200 5,215 26.07
2010-11 230 27,000 117.39
2011-12 200 27,350 136.75
Dry Season/Wetland (Dimba) Cultivation
It is common practice for Malawian smallholders to cultivate small gardens during the dry
season; they typically cultivate vegetables and small amounts of maize to help alleviate the
hunger gap. It was reported by the baseline researcher that the Village Elders in Mchinji said
that prior to 2001 maize was almost never grown in Dimba gardens but as a result of the famine
of 2001 NGOs working in Malawi as well as the Malawian government began promoting the
Dimba cultivation of maize. Yields are generally higher in Dimba soil, as the heavy rains
(associated with the rainy season) have not yet washed the nutrients from the soil. As rainfall
is almost zero during Malawi’s dry season, Dimba crops must be irrigated in some way. Dimba
cultivation was almost non-existent in the villages in the Salima study areas. Reasons for this
include a shortage of dambos (naturally occurring marshland) in the region, or where they do
occur they often coincide with sandy soils, which are not good for dimba cultivation.
Dimba cultivation of vegetables is generally for household consumption and meeting basic
cash needs. Table 37 shows the main types of dimba crops grown by households in the 2008-
09 season and the 2011-12 season. The median area of maize crops (both improved and local)
cultivated on dimba land in the 2011-12 season was 0.20ha, with the median area for other
crops 0.10ha.
Table 37: Households Cultivating Dimba Crops (% of all households)
2008-09 2011-12
n % n %
Local Maize 12 6.15 17 8.72
Hybrid Maize 80 41.03 86 44.10
Green Veg 68 34.87 44 22.56
Beans (inc. Soya Bean) 31 15.90 14 7.18
Potato 8 4.10 14 7.18
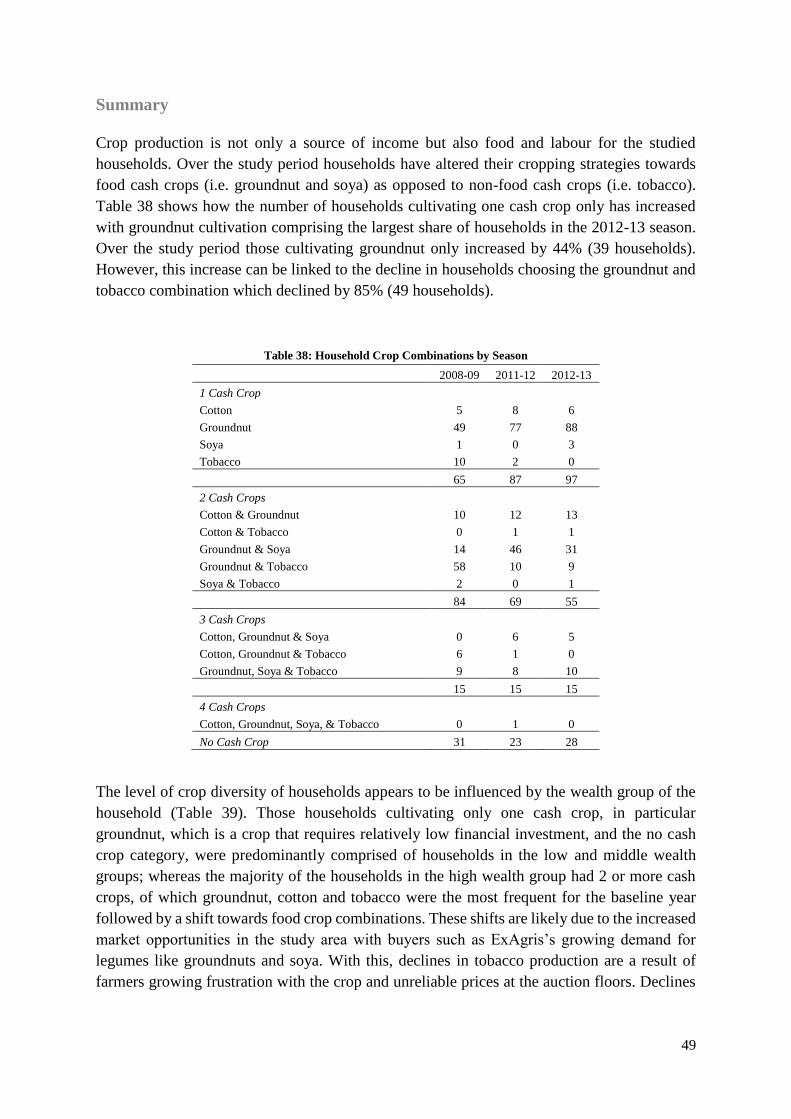
49
Summary
Crop production is not only a source of income but also food and labour for the studied
households. Over the study period households have altered their cropping strategies towards
food cash crops (i.e. groundnut and soya) as opposed to non-food cash crops (i.e. tobacco).
Table 38 shows how the number of households cultivating one cash crop only has increased
with groundnut cultivation comprising the largest share of households in the 2012-13 season.
Over the study period those cultivating groundnut only increased by 44% (39 households).
However, this increase can be linked to the decline in households choosing the groundnut and
tobacco combination which declined by 85% (49 households).
Table 38: Household Crop Combinations by Season
2008-09 2011-12 2012-13
1 Cash Crop
Cotton 5 8 6
Groundnut 49 77 88
Soya 1 0 3
Tobacco 10 2 0
65 87 97
2 Cash Crops
Cotton & Groundnut 10 12 13
Cotton & Tobacco 0 1 1
Groundnut & Soya 14 46 31
Groundnut & Tobacco 58 10 9
Soya & Tobacco 2 0 1
84 69 55
3 Cash Crops
Cotton, Groundnut & Soya 0 6 5
Cotton, Groundnut & Tobacco 6 1 0
Groundnut, Soya & Tobacco 9 8 10
15 15 15
4 Cash Crops
Cotton, Groundnut, Soya, & Tobacco 0 1 0
No Cash Crop 31 23 28
The level of crop diversity of households appears to be influenced by the wealth group of the
household (Table 39). Those households cultivating only one cash crop, in particular
groundnut, which is a crop that requires relatively low financial investment, and the no cash
crop category, were predominantly comprised of households in the low and middle wealth
groups; whereas the majority of the households in the high wealth group had 2 or more cash
crops, of which groundnut, cotton and tobacco were the most frequent for the baseline year
followed by a shift towards food crop combinations. These shifts are likely due to the increased
market opportunities in the study area with buyers such as ExAgris’s growing demand for
legumes like groundnuts and soya. With this, declines in tobacco production are a result of
farmers growing frustration with the crop and unreliable prices at the auction floors. Declines
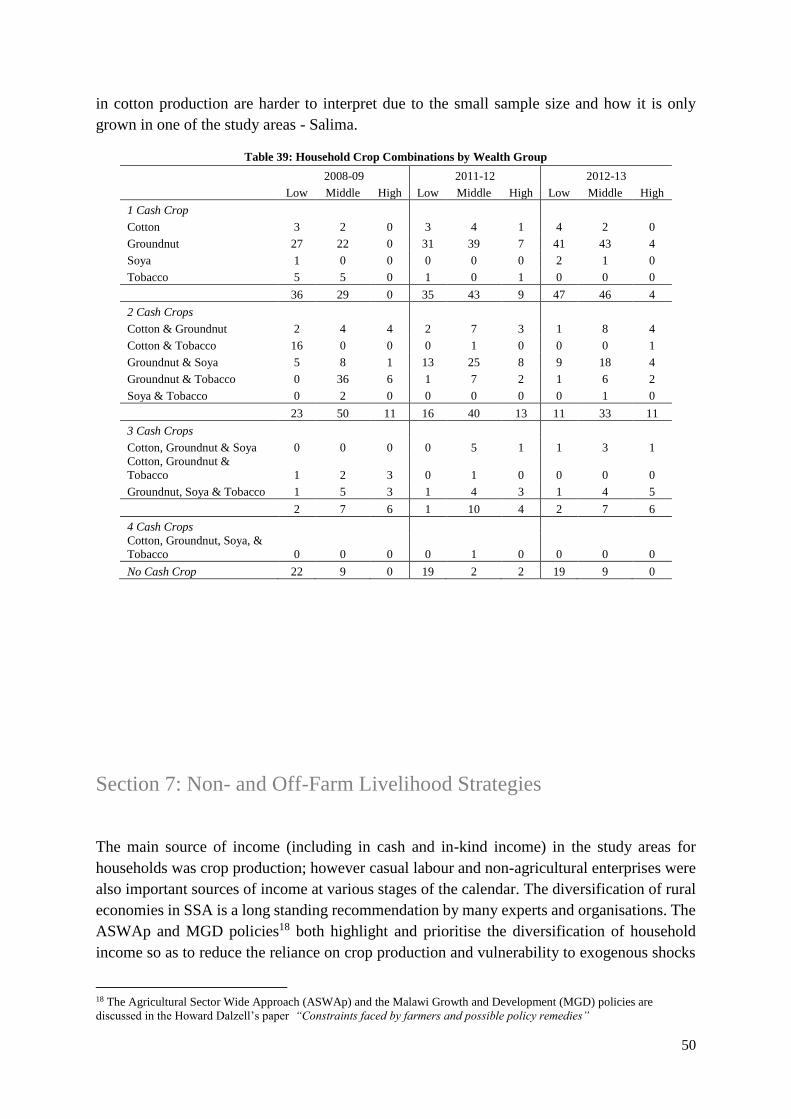
50
in cotton production are harder to interpret due to the small sample size and how it is only
grown in one of the study areas - Salima.
Table 39: Household Crop Combinations by Wealth Group
2008-09 2011-12 2012-13
Low Middle High Low Middle High Low Middle High
1 Cash Crop
Cotton 3 2 0 3 4 1 4 2 0
Groundnut 27 22 0 31 39 7 41 43 4
Soya 1 0 0 0 0 0 2 1 0
Tobacco 5 5 0 1 0 1 0 0 0
36 29 0 35 43 9 47 46 4
2 Cash Crops
Cotton & Groundnut 2 4 4 2 7 3 1 8 4
Cotton & Tobacco 16 0 0 0 1 0 0 0 1
Groundnut & Soya 5 8 1 13 25 8 9 18 4
Groundnut & Tobacco 0 36 6 1 7 2 1 6 2
Soya & Tobacco 0 2 0 0 0 0 0 1 0
23 50 11 16 40 13 11 33 11
3 Cash Crops
Cotton, Groundnut & Soya 0 0 0 0 5 1 1 3 1
Cotton, Groundnut &
Tobacco 1 2 3 0 1 0 0 0 0
Groundnut, Soya & Tobacco 1 5 3 1 4 3 1 4 5
2 7 6 1 10 4 2 7 6
4 Cash Crops
Cotton, Groundnut, Soya, &
Tobacco 0 0 0 0 1 0 0 0 0
No Cash Crop 22 9 0 19 2 2 19 9 0
Section 7: Non- and Off-Farm Livelihood Strategies
The main source of income (including in cash and in-kind income) in the study areas for
households was crop production; however casual labour and non-agricultural enterprises were
also important sources of income at various stages of the calendar. The diversification of rural
economies in SSA is a long standing recommendation by many experts and organisations. The
ASWAp and MGD policies18 both highlight and prioritise the diversification of household
income so as to reduce the reliance on crop production and vulnerability to exogenous shocks
18 The Agricultural Sector Wide Approach (ASWAp) and the Malawi Growth and Development (MGD) policies are
discussed in the Howard Dalzell’s paper “Constraints faced by farmers and possible policy remedies”
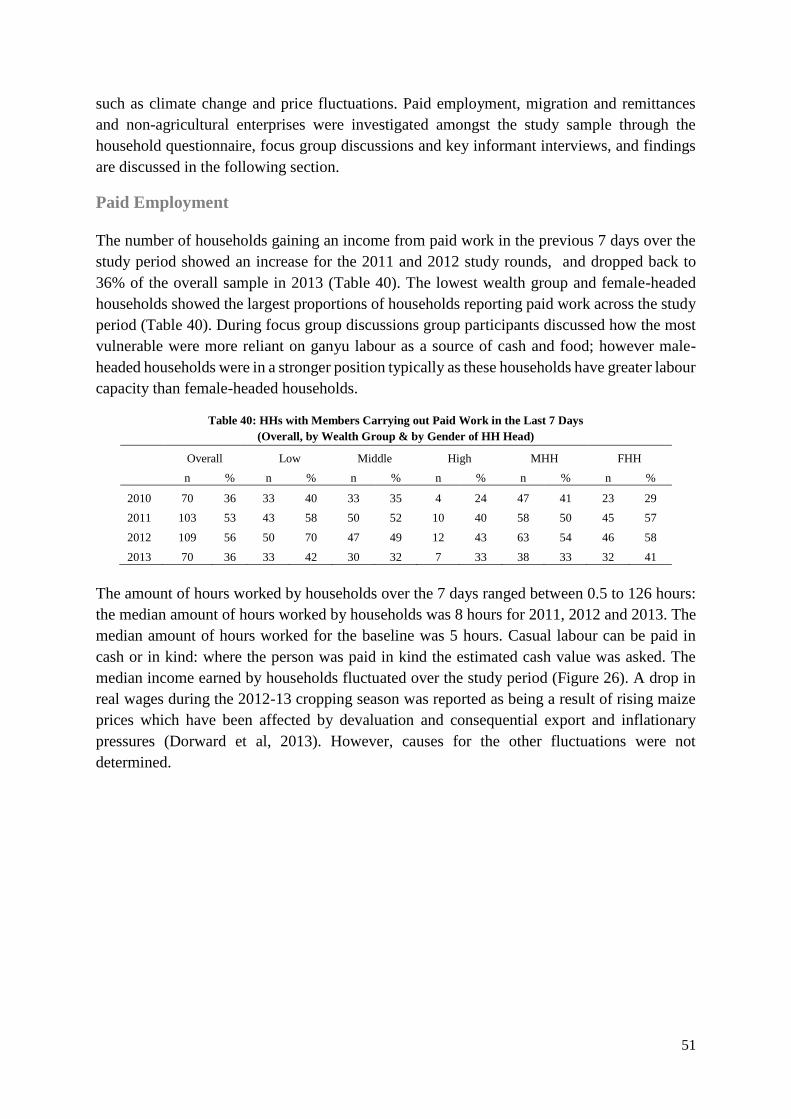
51
such as climate change and price fluctuations. Paid employment, migration and remittances
and non-agricultural enterprises were investigated amongst the study sample through the
household questionnaire, focus group discussions and key informant interviews, and findings
are discussed in the following section.
Paid Employment
The number of households gaining an income from paid work in the previous 7 days over the
study period showed an increase for the 2011 and 2012 study rounds, and dropped back to
36% of the overall sample in 2013 (Table 40). The lowest wealth group and female-headed
households showed the largest proportions of households reporting paid work across the study
period (Table 40). During focus group discussions group participants discussed how the most
vulnerable were more reliant on ganyu labour as a source of cash and food; however male-
headed households were in a stronger position typically as these households have greater labour
capacity than female-headed households.
Table 40: HHs with Members Carrying out Paid Work in the Last 7 Days
(Overall, by Wealth Group & by Gender of HH Head)
Overall Low Middle High MHH FHH
n % n % n % n % n % n %
2010 70 36 33 40 33 35 4 24 47 41 23 29
2011 103 53 43 58 50 52 10 40 58 50 45 57
2012 109 56 50 70 47 49 12 43 63 54 46 58
2013 70 36 33 42 30 32 7 33 38 33 32 41
The amount of hours worked by households over the 7 days ranged between 0.5 to 126 hours:
the median amount of hours worked by households was 8 hours for 2011, 2012 and 2013. The
median amount of hours worked for the baseline was 5 hours. Casual labour can be paid in
cash or in kind: where the person was paid in kind the estimated cash value was asked. The
median income earned by households fluctuated over the study period (Figure 26). A drop in
real wages during the 2012-13 cropping season was reported as being a result of rising maize
prices which have been affected by devaluation and consequential export and inflationary
pressures (Dorward et al, 2013). However, causes for the other fluctuations were not
determined.
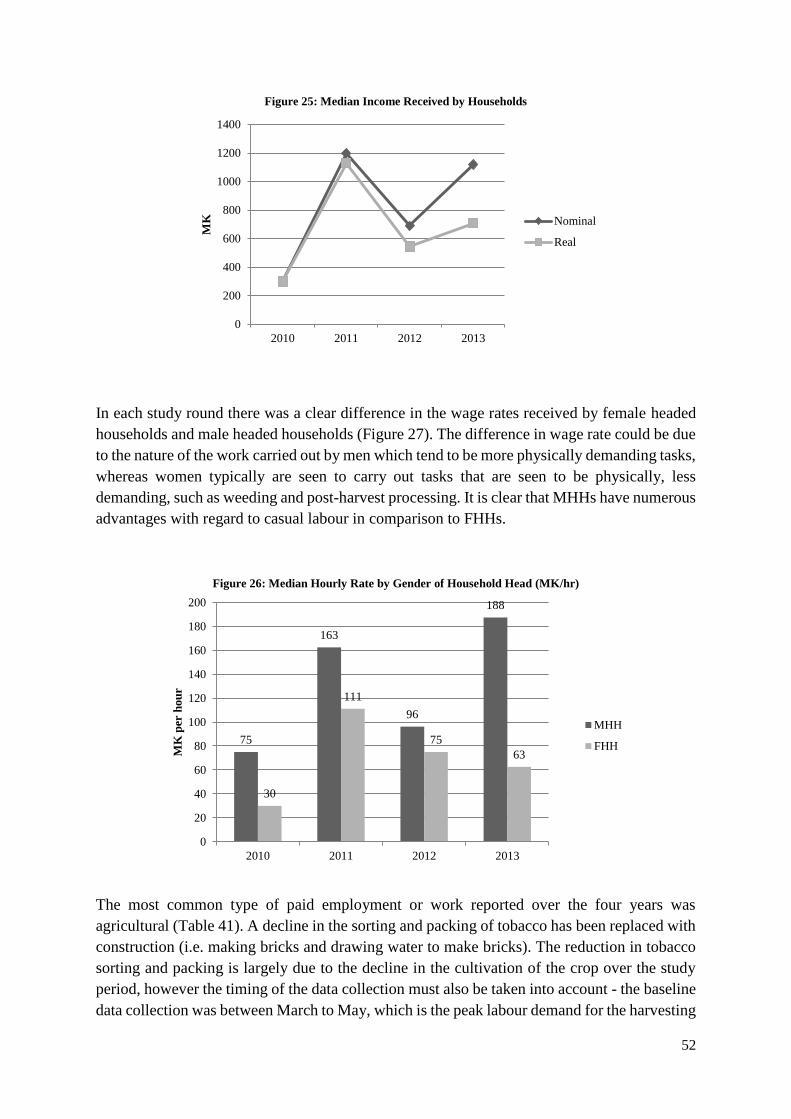
52
Figure 25: Median Income Received by Households
In each study round there was a clear difference in the wage rates received by female headed
households and male headed households (Figure 27). The difference in wage rate could be due
to the nature of the work carried out by men which tend to be more physically demanding tasks,
whereas women typically are seen to carry out tasks that are seen to be physically, less
demanding, such as weeding and post-harvest processing. It is clear that MHHs have numerous
advantages with regard to casual labour in comparison to FHHs.
Figure 26: Median Hourly Rate by Gender of Household Head (MK/hr)
The most common type of paid employment or work reported over the four years was
agricultural (Table 41). A decline in the sorting and packing of tobacco has been replaced with
construction (i.e. making bricks and drawing water to make bricks). The reduction in tobacco
sorting and packing is largely due to the decline in the cultivation of the crop over the study
period, however the timing of the data collection must also be taken into account - the baseline
data collection was between March to May, which is the peak labour demand for the harvesting
0
200
400
600
800
1000
1200
1400
2010 2011 2012 2013
MK Nominal
Real
75
163
96
188
30
111
75
63
0
20
40
60
80
100
120
140
160
180
200
2010 2011 2012 2013
MK
per
hou
r
MHH
FHH
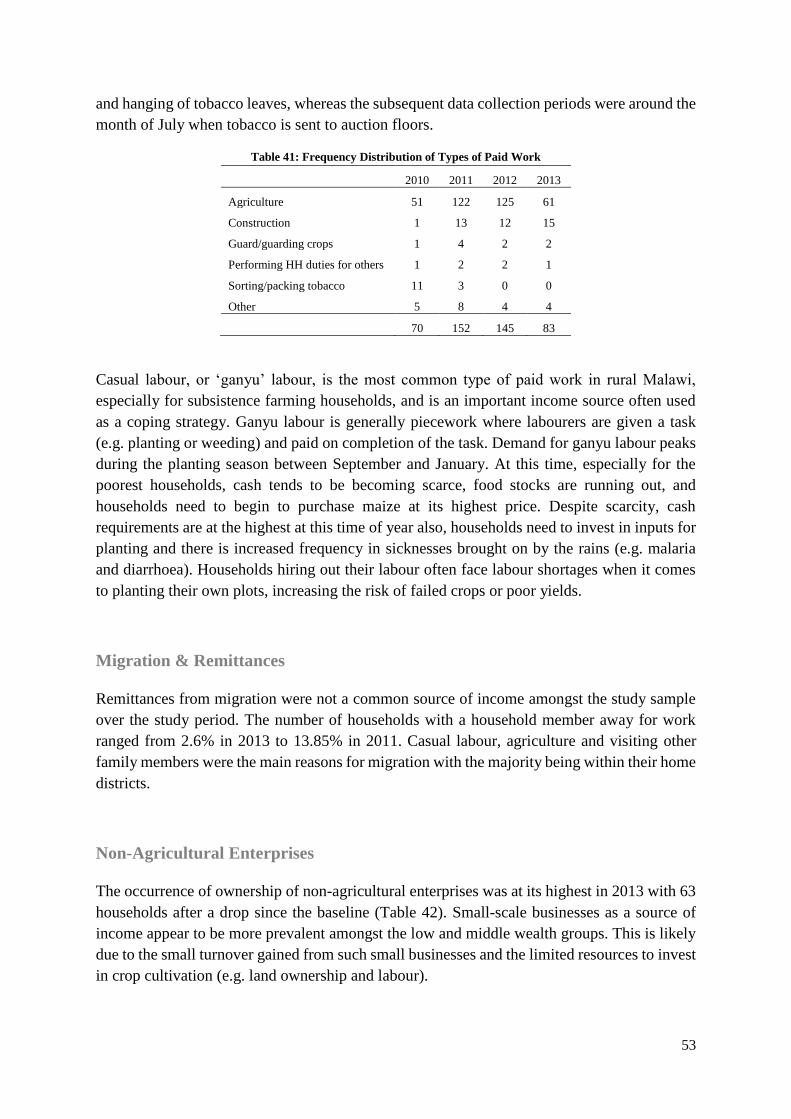
53
and hanging of tobacco leaves, whereas the subsequent data collection periods were around the
month of July when tobacco is sent to auction floors.
Table 41: Frequency Distribution of Types of Paid Work
2010 2011 2012 2013
Agriculture 51 122 125 61
Construction 1 13 12 15
Guard/guarding crops 1 4 2 2
Performing HH duties for others 1 2 2 1
Sorting/packing tobacco 11 3 0 0
Other 5 8 4 4
70 152 145 83
Casual labour, or ‘ganyu’ labour, is the most common type of paid work in rural Malawi,
especially for subsistence farming households, and is an important income source often used
as a coping strategy. Ganyu labour is generally piecework where labourers are given a task
(e.g. planting or weeding) and paid on completion of the task. Demand for ganyu labour peaks
during the planting season between September and January. At this time, especially for the
poorest households, cash tends to be becoming scarce, food stocks are running out, and
households need to begin to purchase maize at its highest price. Despite scarcity, cash
requirements are at the highest at this time of year also, households need to invest in inputs for
planting and there is increased frequency in sicknesses brought on by the rains (e.g. malaria
and diarrhoea). Households hiring out their labour often face labour shortages when it comes
to planting their own plots, increasing the risk of failed crops or poor yields.
Migration & Remittances
Remittances from migration were not a common source of income amongst the study sample
over the study period. The number of households with a household member away for work
ranged from 2.6% in 2013 to 13.85% in 2011. Casual labour, agriculture and visiting other
family members were the main reasons for migration with the majority being within their home
districts.
Non-Agricultural Enterprises
The occurrence of ownership of non-agricultural enterprises was at its highest in 2013 with 63
households after a drop since the baseline (Table 42). Small-scale businesses as a source of
income appear to be more prevalent amongst the low and middle wealth groups. This is likely
due to the small turnover gained from such small businesses and the limited resources to invest
in crop cultivation (e.g. land ownership and labour).
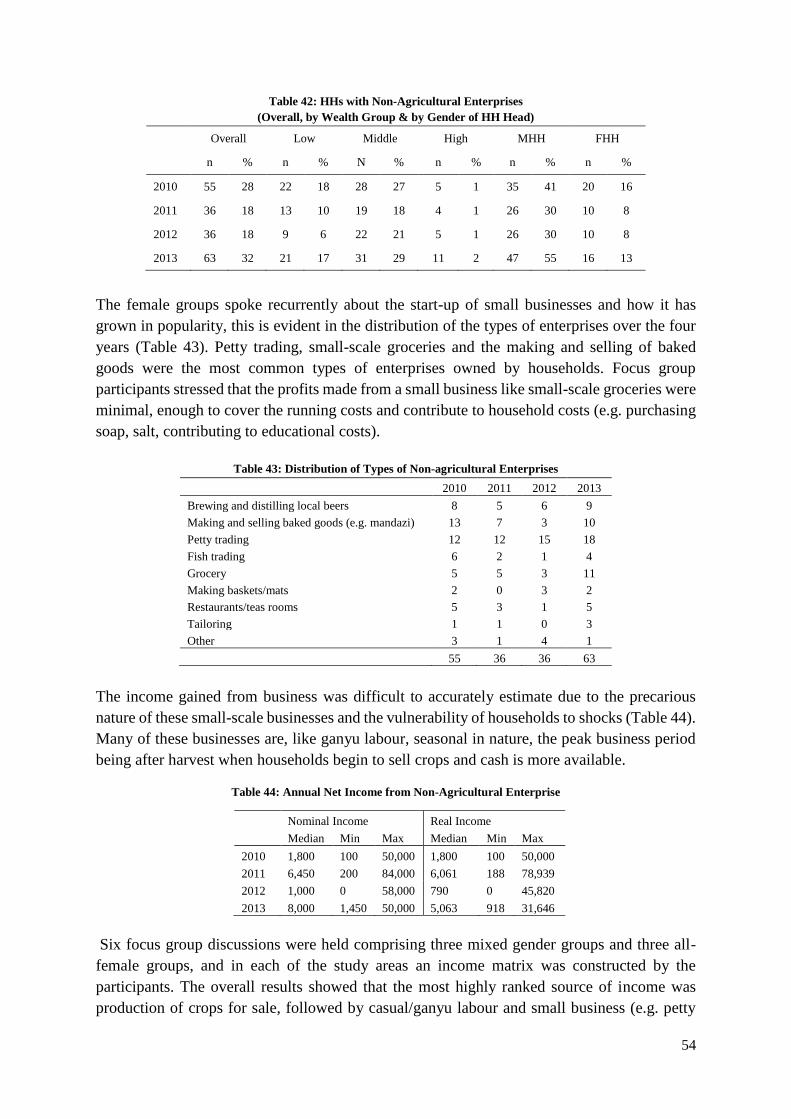
54
Table 42: HHs with Non-Agricultural Enterprises
(Overall, by Wealth Group & by Gender of HH Head)
Overall Low Middle High MHH FHH
n % n % N % n % n % n %
2010 55 28 22 18 28 27 5 1 35 41 20 16
2011 36 18 13 10 19 18 4 1 26 30 10 8
2012 36 18 9 6 22 21 5 1 26 30 10 8
2013 63 32 21 17 31 29 11 2 47 55 16 13
The female groups spoke recurrently about the start-up of small businesses and how it has
grown in popularity, this is evident in the distribution of the types of enterprises over the four
years (Table 43). Petty trading, small-scale groceries and the making and selling of baked
goods were the most common types of enterprises owned by households. Focus group
participants stressed that the profits made from a small business like small-scale groceries were
minimal, enough to cover the running costs and contribute to household costs (e.g. purchasing
soap, salt, contributing to educational costs).
Table 43: Distribution of Types of Non-agricultural Enterprises
2010 2011 2012 2013
Brewing and distilling local beers 8 5 6 9
Making and selling baked goods (e.g. mandazi) 13 7 3 10
Petty trading 12 12 15 18
Fish trading 6 2 1 4
Grocery 5 5 3 11
Making baskets/mats 2 0 3 2
Restaurants/teas rooms 5 3 1 5
Tailoring 1 1 0 3
Other 3 1 4 1
55 36 36 63
The income gained from business was difficult to accurately estimate due to the precarious
nature of these small-scale businesses and the vulnerability of households to shocks (Table 44).
Many of these businesses are, like ganyu labour, seasonal in nature, the peak business period
being after harvest when households begin to sell crops and cash is more available.
Table 44: Annual Net Income from Non-Agricultural Enterprise
Six focus group discussions were held comprising three mixed gender groups and three all-
female groups, and in each of the study areas an income matrix was constructed by the
participants. The overall results showed that the most highly ranked source of income was
production of crops for sale, followed by casual/ganyu labour and small business (e.g. petty
Nominal Income Real Income
Median Min Max Median Min Max
2010 1,800 100 50,000 1,800 100 50,000
2011 6,450 200 84,000 6,061 188 78,939
2012 1,000 0 58,000 790 0 45,820
2013 8,000 1,450 50,000 5,063 918 31,646
55
trading, grocery, mandazi selling, beer brewing and selling). In response to the question of how
this has changed over the last five years, group participants discussed how crop production is
less profitable as inputs are more expensive and the prices received at market are poor. The
growing popularity of non-agricultural enterprises shows how households who are capable are
beginning to diversify their income portfolios; although the reliability and impact of these small
scale businesses and casual labour is questionable due to the precarious and seasonal nature of
such activities.
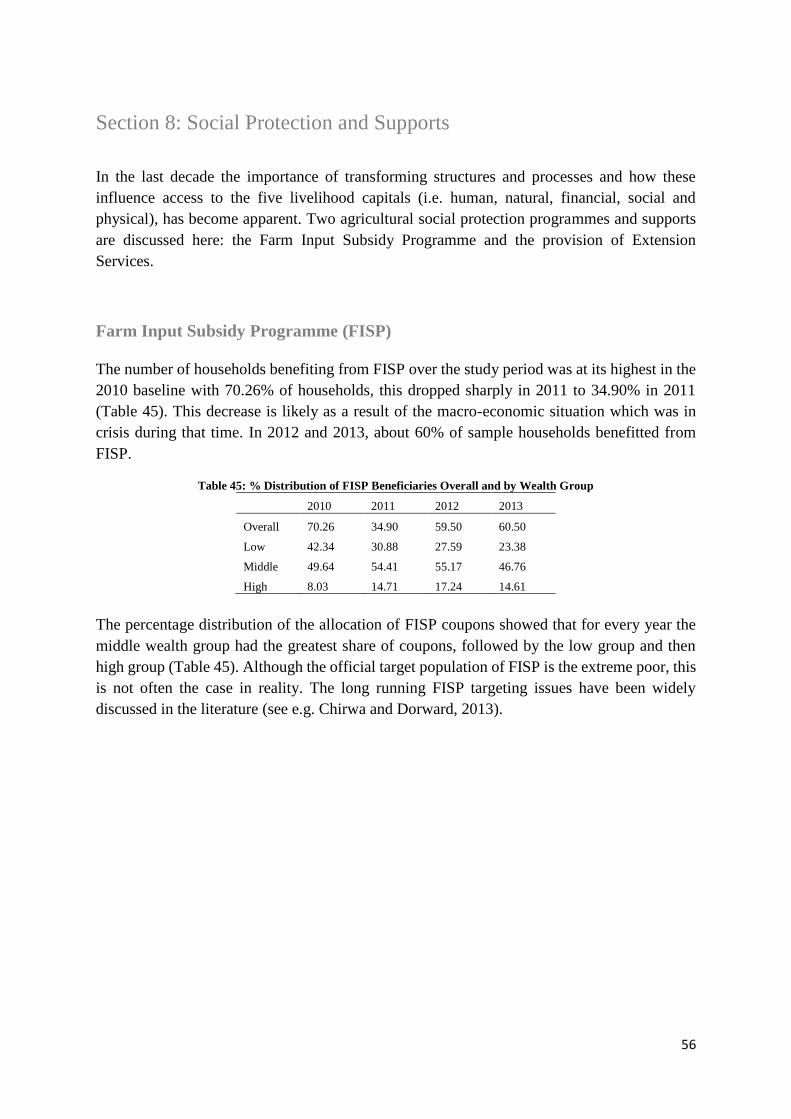
56
Section 8: Social Protection and Supports
In the last decade the importance of transforming structures and processes and how these
influence access to the five livelihood capitals (i.e. human, natural, financial, social and
physical), has become apparent. Two agricultural social protection programmes and supports
are discussed here: the Farm Input Subsidy Programme and the provision of Extension
Services.
Farm Input Subsidy Programme (FISP)
The number of households benefiting from FISP over the study period was at its highest in the
2010 baseline with 70.26% of households, this dropped sharply in 2011 to 34.90% in 2011
(Table 45). This decrease is likely as a result of the macro-economic situation which was in
crisis during that time. In 2012 and 2013, about 60% of sample households benefitted from
FISP.
Table 45: % Distribution of FISP Beneficiaries Overall and by Wealth Group
2010 2011 2012 2013
Overall 70.26 34.90 59.50 60.50
Low 42.34 30.88 27.59 23.38
Middle 49.64 54.41 55.17 46.76
High 8.03 14.71 17.24 14.61
The percentage distribution of the allocation of FISP coupons showed that for every year the
middle wealth group had the greatest share of coupons, followed by the low group and then
high group (Table 45). Although the official target population of FISP is the extreme poor, this
is not often the case in reality. The long running FISP targeting issues have been widely
discussed in the literature (see e.g. Chirwa and Dorward, 2013).
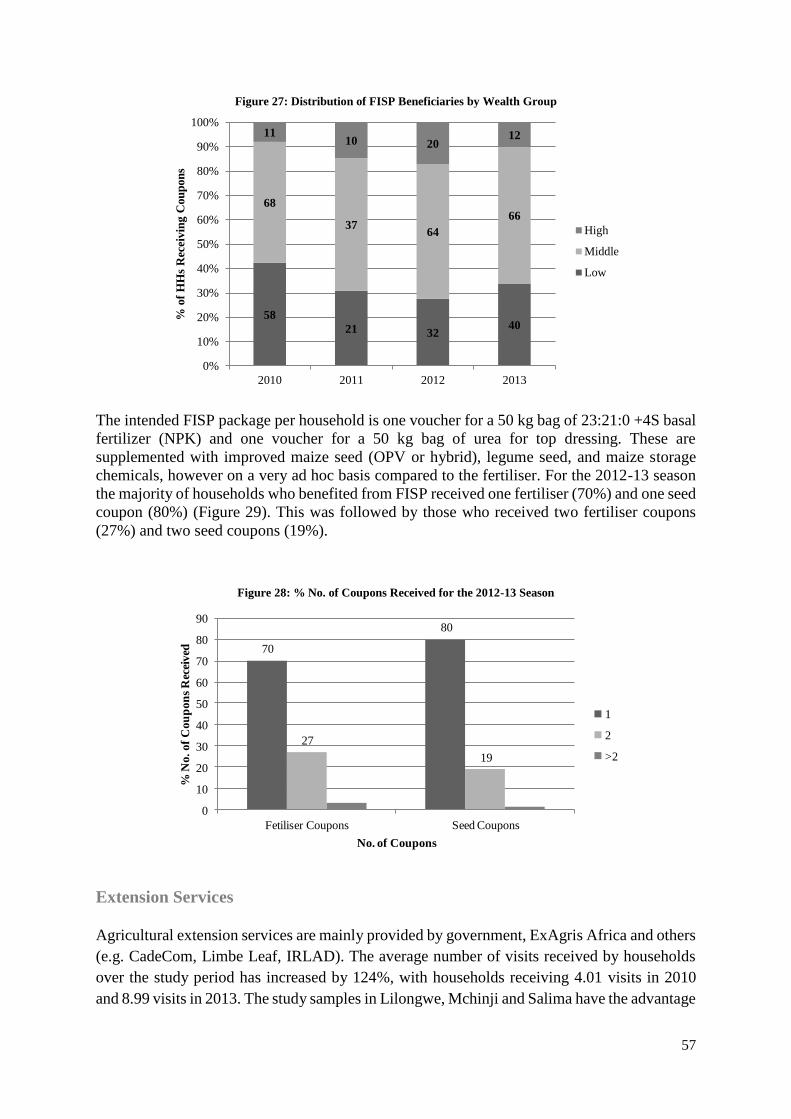
57
Figure 27: Distribution of FISP Beneficiaries by Wealth Group
The intended FISP package per household is one voucher for a 50 kg bag of 23:21:0 +4S basal
fertilizer (NPK) and one voucher for a 50 kg bag of urea for top dressing. These are
supplemented with improved maize seed (OPV or hybrid), legume seed, and maize storage
chemicals, however on a very ad hoc basis compared to the fertiliser. For the 2012-13 season
the majority of households who benefited from FISP received one fertiliser (70%) and one seed
coupon (80%) (Figure 29). This was followed by those who received two fertiliser coupons
(27%) and two seed coupons (19%).
Figure 28: % No. of Coupons Received for the 2012-13 Season
70
80
27
19
0
10
20
30
40
50
60
70
80
90
Fetiliser Coupons Seed Coupons
% N
o.
of
Co
up
on
s R
ecei
ved
No. of Coupons
1
2
>2
Extension Services
Agricultural extension services are mainly provided by government, ExAgris Africa and others
(e.g. CadeCom, Limbe Leaf, IRLAD). The average number of visits received by households
over the study period has increased by 124%, with households receiving 4.01 visits in 2010
and 8.99 visits in 2013. The study samples in Lilongwe, Mchinji and Salima have the advantage
58
21 3240
68
3764
66
1110 20
12
0%
10%
20%
30%
40%
50%
60%
70%
80%
90%
100%
2010 2011 2012 2013
% o
f H
Hs
Rec
eivin
g C
ou
pon
s
High
Middle
Low
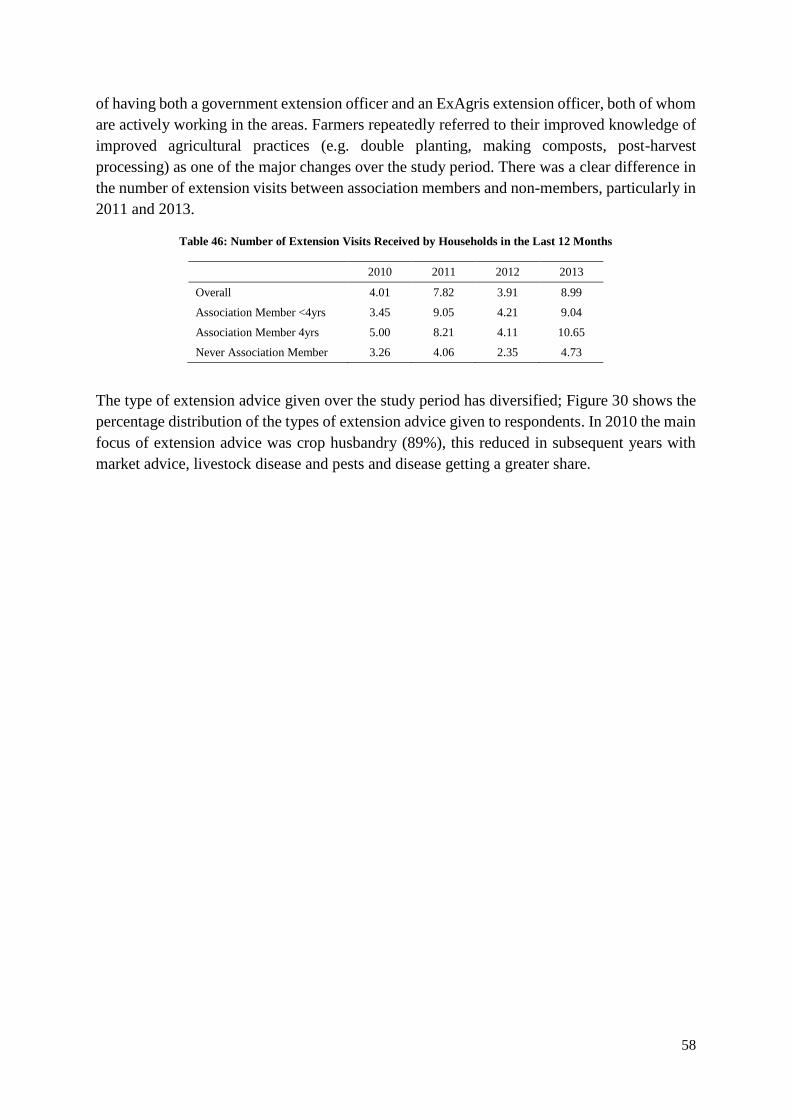
58
of having both a government extension officer and an ExAgris extension officer, both of whom
are actively working in the areas. Farmers repeatedly referred to their improved knowledge of
improved agricultural practices (e.g. double planting, making composts, post-harvest
processing) as one of the major changes over the study period. There was a clear difference in
the number of extension visits between association members and non-members, particularly in
2011 and 2013.
Table 46: Number of Extension Visits Received by Households in the Last 12 Months
2010 2011 2012 2013
Overall 4.01 7.82 3.91 8.99
Association Member <4yrs 3.45 9.05 4.21 9.04
Association Member 4yrs 5.00 8.21 4.11 10.65
Never Association Member 3.26 4.06 2.35 4.73
The type of extension advice given over the study period has diversified; Figure 30 shows the
percentage distribution of the types of extension advice given to respondents. In 2010 the main
focus of extension advice was crop husbandry (89%), this reduced in subsequent years with
market advice, livestock disease and pests and disease getting a greater share.
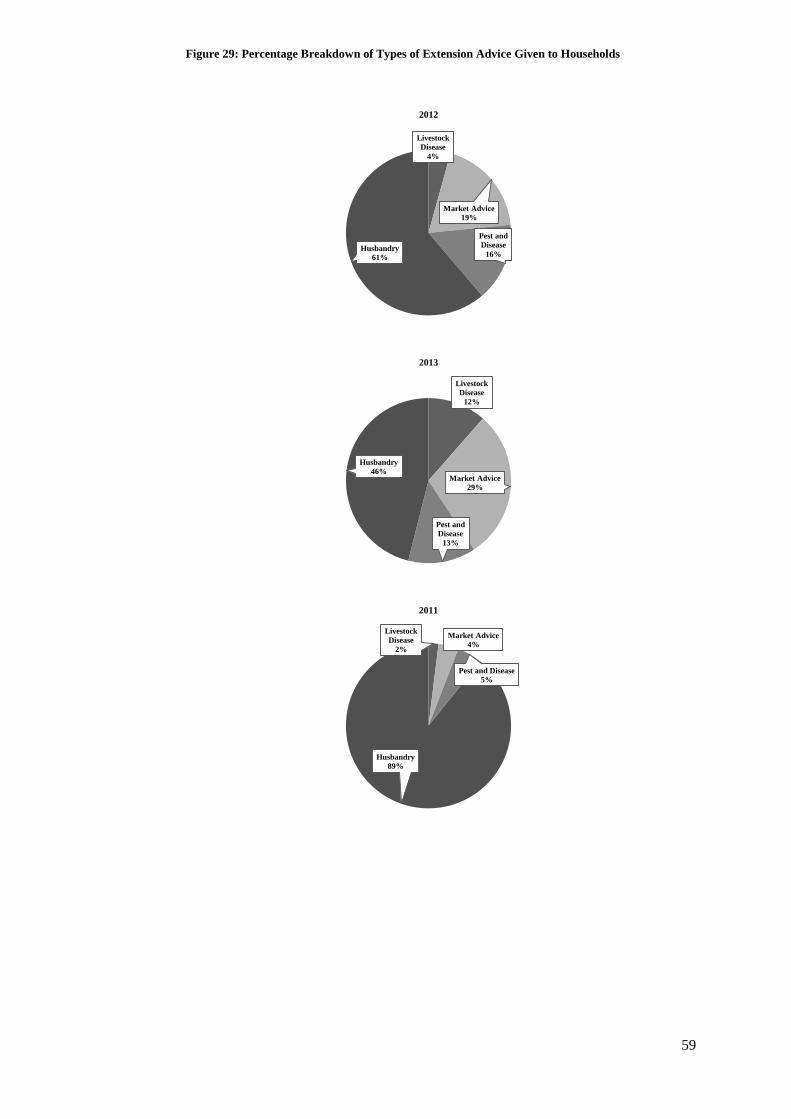
59
Livestock
Disease
4%
Market Advice
19%
Pest and
Disease
16%Husbandry
61%
2012
Livestock
Disease
12%
Market Advice
29%
Pest and
Disease
13%
Husbandry
46%
2013
Livestock
Disease
2%
Market Advice
4%
Pest and Disease
5%
Husbandry
89%
2011
Figure 29: Percentage Breakdown of Types of Extension Advice Given to Households

60
Section 9: Livelihood Change over Time
It is discussed extensively in the literature that when looking cumulatively at livelihood
strategies of households, such as the study sample here, it is difficult to get a comprehensive
and true picture of the real monetary income households have. This is due to many factors; a
diverse range of income sources, difficulty in estimating non-monetary sources of income,
seasonality, under/over reporting by survey respondents, low literacy/numeracy skill levels,
inappropriate recall periods, etc. It is important to acknowledge that many of these challenges
were faced in this study and throughout the study attempts were made to overcome these
limitations whilst maintaining comparability across the four study years.
This section presents the results from the 2010 and 2013 household survey on the estimated
total income from the identified sources. An attempt to triangulate this with results from a FGD
income ranking is also presented. This is followed by a discussion around the limiting factors
for change in livelihoods.
Main Income Sources
During focus group discussions the main items of household income and expenditure were
established through the development of a matrix which showed the typical income of a
household (Table 47). Interestingly livestock sales were not mentioned as a source of income
despite results from the HH survey showing significant increases in livestock sales.
Table 47: Household Income Matrix
Level of
Importance Source
Peak
Months
1 Crop sales May -Aug
2 Ganyu Nov-Dec
3 Small scale business April-June
When the main income sources are ranked in terms of amounts, the quantitative household
survey results are similar to those of the qualitative results from the focus group discussions
(Table 48). For the baseline, casual labour is the biggest earner, followed by crop sales,
livestock sales and small scale businesses. In 2013 casual labour was again the biggest earner,
followed by small scale business, crop sales and lastly livestock sales. In real monetary terms,
the estimated total median income showed a percentage change of 10% over the study period.

61
Table 48: Household Real Income from Main Sources (MK) (2010 and 2013)
2010 2013
Median Min - Max Median Min - Max
Crop sales 7,600 200 - 67,800 14,582 190 - 113,924
Livestock sales 4,500 300 - 54,500 8,228 316 - 75,316
Casual labour 15,600 50 - 3,864 34,886 20 - 6,329
Small scale business 1,801 101 - 50,000 14,873 7,595 - 50,633
Estimated Total Income 16,880 1,600 - 109,200 18,576 633 - 91,898
Limiting factors for Change in Livelihoods
Looking at welfare indicators (e.g. wealth ranking, illness score, HFIAS, HDDS, etc.) there
appears to have been little change in terms of overall livelihood status and asset endowment,
over the study period. However, the findings presented show significant changes in the way in
which households earn their income from crop cultivation. This was evident in the shifts in the
cropping combinations of households (Table 38 and 39). There is an obvious shift away from
local maize towards hybrid maize varieties, which is unsurprising given the level of promotion
through programmes like FISP and also the potential increase in yield. However maize remains
a crop for household consumption, very few households grow maize commercially, although
many end up selling some of their harvest, typically in response to a shock to the household, to
meet immediate cash needs or due to lack of suitable storage. Maize yields also appear to be
stagnant or declining. The combinations of crops grown for income have also changed
significantly with pure cash crops like tobacco which can’t be consumed seeing significant
reductions in all areas, amongst all groups. These crops are being largely replaced with legume
crops like groundnuts and soya bean which are relatively less input intensive, can be consumed
at household level and also can be sold for income.
With regard to marketing of crops a lot remained the same, the majority of households sell
early and at farm gate, with little value addition to produce. When households sell at farm gate,
especially female headed and the more vulnerable households, it is to informal buyers or
‘vendors’. These vendors are small scale intermediaries who offer very low prices and target
entire villages soon after harvest when households are cash poor. However one change was the
emergence of selling groundnut in shell (NIS), as opposed to soaking in water and hand shelling
and just selling the kernel. For those who sold NIS to buyers such as ExAgris who were offering
a competitive price for well graded NIS this can be seen as a positive change. However, for
those selling NIS to informal buyers at farm gate this can be seen as the worst possible market
for their groundnuts as the vendors would be buying at very low prices and then employing
casual labourers to conduct the hand shelling. Households selling NIS to the informal buyer
could see this as saving time and labour, and are in need of cash fast and thus opt for the low
price. However, this highlights the dis-functionality of product markets in the study areas and
all across Malawi.
Throughout the field work for the research it was evident that there are serious gaps and
weaknesses in the market. This is also widely reported in the literature where the problems
62
brought by thin markets are often discussed (Chirwa and Dorward, 2013, Dorward and Kydd,
2005, Dorward, et al, 2008, Wiggins and Keats, 2013). Access to market information,
particularly price information, is a problem, as is the lack of storage facilities at household and
association levels, and lack of organised buying and selling. Strengthening famers and
associations through addressing these problems could support smallholder farmers’ move from
subsistence production systems to a more commercial orientation. Examples of how this could
be done with associations include the development of warehouse receipts systems,
complemented with information flows with the use of ICTs, such as the current system being
developed by Agricultural Commodity Holdings Africa (ACE) and Auction Holdings Ltd.
Commodities Exchange (AHCX).
Findings around the importance of training and extension support were presented (see section
‘Extension Services and Association Participation’). Farmers identified their increased
knowledge and capacity to adopt improved agricultural practices as the most significant change
in terms of their farming over the last five years. Repeatedly during data collection farmers
spoke of how they now know how to get ‘bumper yields’ by using the new techniques they had
learned. However, exposure to risks such as climate change, worsening soil fertility and price
volatility, in particular for maize, is reducing the impact of their newly acquired skills.
From the farmers’ perspective, interventions such as ExAgris’ Growing with Groundnuts can
help alleviate these challenges. Evidence of this can be seen in the increased groundnut yields
and awareness and management of aflatoxin. However, interventions such as this need not only
focus on the production of crops, but also on the economics of production and how farmers can
grow crops successfully to meet household consumption and income needs. Additionally,
assisting associations to build their organisational and management capacity should be
incorporated into such interventions. Such support to the development of social capital should
contribute to the improvement of the roll out of association activities, and also strengthen the
leadership and team relations so as to build trust amongst the groups. It would be envisaged
that from social capital formation, when it comes to collective buying or selling, deals are less
likely to fall through; as it is assumed that the stronger the group the better the price that can
negotiated. This also applies to cooperatives and other groups/clubs like Village Savings and
Loans groups.
Wiggins and Keats (2013) highlight some of the benefits of buying/selling collectively for both
the farmer and the commodity traders. However, for the phenomenon of collective buying, or
other such initiatives aimed at improving the market situation, the private sector needs to make
efforts to facilitate the buying/selling. This could be done by providing transport (and
incorporating the cost in the agreed price), ensuring they are buying in a timely manner so
famers don’t lose patience and begin side selling; and the provision of price incentives for
grading and value addition where appropriate. The development of the ExAgris Growing with
Groundnuts NIS market is one such example of some of these initiatives. Such models are
gaining momentum, with similar models being implemented in Malawi by organisations such
as NASFAM, Concern Universal and Women in Agri-business in Sub-Saharan Africa
(WASAA).

63
Section 10: Groundnut Value Chain participation
In the 2012-13 ExAgris Growing with Groundnuts annual report, yield and gross margin results
were reported for three different production scenarios, which were carried out on demonstration
plots on ExAgris estates across Malawi. The three scenarios are (a) double row planting with
fertilisers, (b) double row planting without fertilisers, (c) single row planting without fertilisers.
Findings from the Mchinji demonstration plots show that increasing plant population is one of
the easiest ways of increasing yields in groundnuts with double the amount harvested; the
addition of fertiliser sees further production increases. Table 49 shows the yield obtained by
each plot and uses the average price for NIS at the beginning of the sales period for groundnuts
in 2013. Certified seeds and seed treatment were used in each of the plots; for the study sample
the frequency of such use was low with 22% of households growing groundnuts in 2012-13
using improved seed.
Table 49: Groundnut Gross Margins, Mchinji Demonstration Plots (2012-13)
Production Scenario (a) Production Scenario (b) Production Scenario (c)
Double Row Planting
with Fertilisers
Double Row Planting
without Fertilisers
Single Row Planting
without Fertilisers
kg/ha MK/ha kg/ha MK/ha kg/ha MK/ha
Gross Revenue
Average Yield
(kg/ha) 4,200 2,100 930
Average price
NIS (MK/kg) 200 200 200
Total Revenue 840,000 420,000 186,000
Variable costs
Certified Seed 140 56,000 140 56,000 85 34,000
Seed treatment 3 liters 19,278 3 liters 19,278 1.5 liters 9,639
Fertilisers:
Compound D 200 64,600 0 0 0 0
Gypsum 200 10,880 0 0 0 0
Man days 150 48,000 150 48,000 150 48,000
Storage (Sacks) 110 13,200 55 6,600 24 2,880
Total Variable Costs 211,958
129,878
94,519
Gross Margin 628,042 290,122 91,481
% Gross Margin 74.77% 69.1% 50.82%
In comparison, the study sample falls more into Production Scenario (c) whereby they would
typically plant single rows and not use inputs, however what differs is the majority of
smallholders would use recycled seed, whereas here certified seed was used (37% used
purchased seed in 2011-12 season which would likely be a certified/improved variety).
Production Scenario (c) resulted in average yields of 930kg/ha, whilst the median yields for
the same cropping season 2011-12, were 435kg/ha per household for the study sample (Table
24), the only group that achieved comparable yields was those who were in the ‘Association
Members for 4 years’ who reported 927kg/ha in the 2011/12 season.
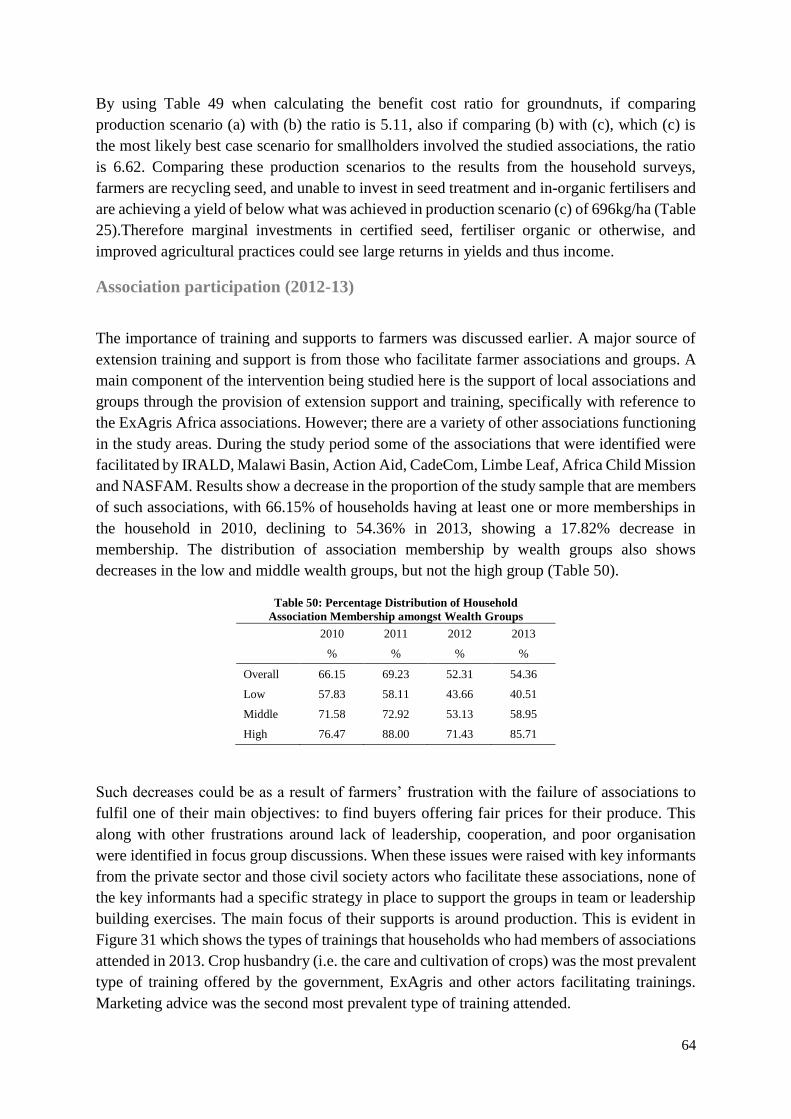
64
By using Table 49 when calculating the benefit cost ratio for groundnuts, if comparing
production scenario (a) with (b) the ratio is 5.11, also if comparing (b) with (c), which (c) is
the most likely best case scenario for smallholders involved the studied associations, the ratio
is 6.62. Comparing these production scenarios to the results from the household surveys,
farmers are recycling seed, and unable to invest in seed treatment and in-organic fertilisers and
are achieving a yield of below what was achieved in production scenario (c) of 696kg/ha (Table
25).Therefore marginal investments in certified seed, fertiliser organic or otherwise, and
improved agricultural practices could see large returns in yields and thus income.
Association participation (2012-13)
The importance of training and supports to farmers was discussed earlier. A major source of
extension training and support is from those who facilitate farmer associations and groups. A
main component of the intervention being studied here is the support of local associations and
groups through the provision of extension support and training, specifically with reference to
the ExAgris Africa associations. However; there are a variety of other associations functioning
in the study areas. During the study period some of the associations that were identified were
facilitated by IRALD, Malawi Basin, Action Aid, CadeCom, Limbe Leaf, Africa Child Mission
and NASFAM. Results show a decrease in the proportion of the study sample that are members
of such associations, with 66.15% of households having at least one or more memberships in
the household in 2010, declining to 54.36% in 2013, showing a 17.82% decrease in
membership. The distribution of association membership by wealth groups also shows
decreases in the low and middle wealth groups, but not the high group (Table 50).
Table 50: Percentage Distribution of Household
Association Membership amongst Wealth Groups
2010 2011 2012 2013
% % % %
Overall 66.15 69.23 52.31 54.36
Low 57.83 58.11 43.66 40.51
Middle 71.58 72.92 53.13 58.95
High 76.47 88.00 71.43 85.71
Such decreases could be as a result of farmers’ frustration with the failure of associations to
fulfil one of their main objectives: to find buyers offering fair prices for their produce. This
along with other frustrations around lack of leadership, cooperation, and poor organisation
were identified in focus group discussions. When these issues were raised with key informants
from the private sector and those civil society actors who facilitate these associations, none of
the key informants had a specific strategy in place to support the groups in team or leadership
building exercises. The main focus of their supports is around production. This is evident in
Figure 31 which shows the types of trainings that households who had members of associations
attended in 2013. Crop husbandry (i.e. the care and cultivation of crops) was the most prevalent
type of training offered by the government, ExAgris and other actors facilitating trainings.
Marketing advice was the second most prevalent type of training attended.
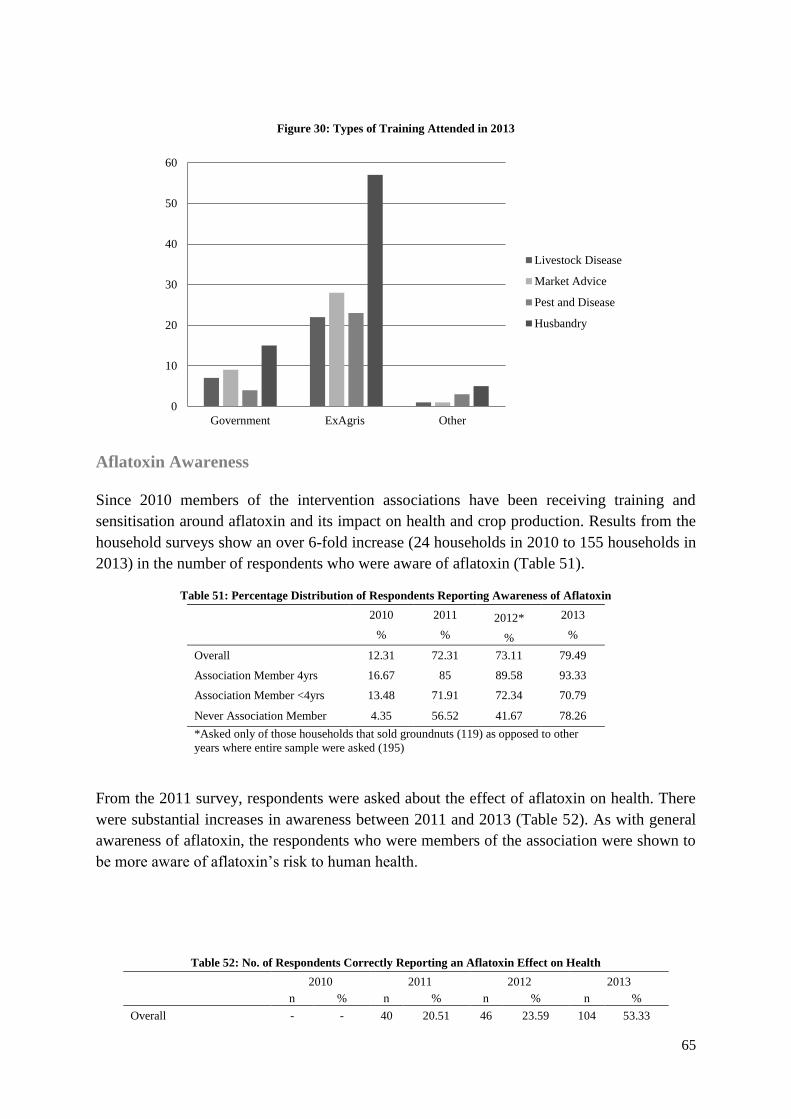
65
Figure 30: Types of Training Attended in 2013
Aflatoxin Awareness
Since 2010 members of the intervention associations have been receiving training and
sensitisation around aflatoxin and its impact on health and crop production. Results from the
household surveys show an over 6-fold increase (24 households in 2010 to 155 households in
2013) in the number of respondents who were aware of aflatoxin (Table 51).
Table 51: Percentage Distribution of Respondents Reporting Awareness of Aflatoxin
2010 2011 2012* 2013
% % % %
Overall 12.31 72.31 73.11 79.49
Association Member 4yrs 16.67 85 89.58 93.33
Association Member <4yrs 13.48 71.91 72.34 70.79
Never Association Member 4.35 56.52 41.67 78.26
*Asked only of those households that sold groundnuts (119) as opposed to other
years where entire sample were asked (195)
From the 2011 survey, respondents were asked about the effect of aflatoxin on health. There
were substantial increases in awareness between 2011 and 2013 (Table 52). As with general
awareness of aflatoxin, the respondents who were members of the association were shown to
be more aware of aflatoxin’s risk to human health.
Table 52: No. of Respondents Correctly Reporting an Aflatoxin Effect on Health 2010 2011 2012 2013
n % n % n % n %
Overall - - 40 20.51 46 23.59 104 53.33
0
10
20
30
40
50
60
Government ExAgris Other
Livestock Disease
Market Advice
Pest and Disease
Husbandry
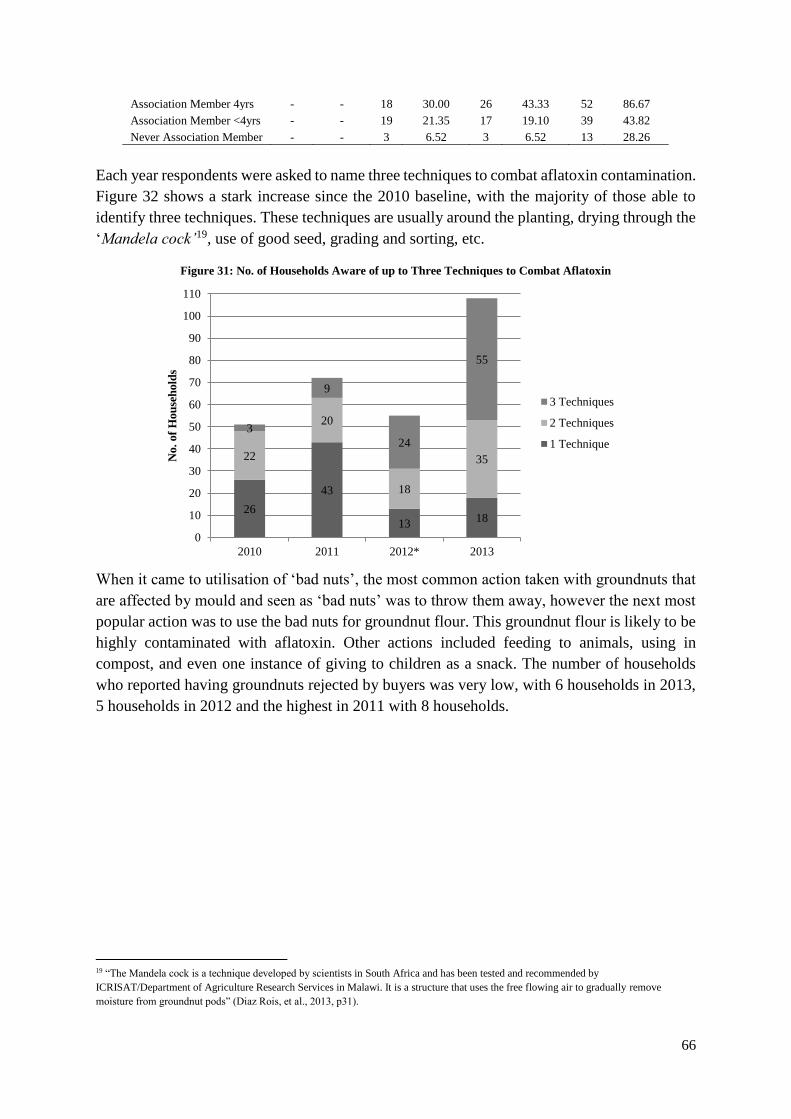
66
Association Member 4yrs - - 18 30.00 26 43.33 52 86.67
Association Member <4yrs - - 19 21.35 17 19.10 39 43.82
Never Association Member - - 3 6.52 3 6.52 13 28.26
Each year respondents were asked to name three techniques to combat aflatoxin contamination.
Figure 32 shows a stark increase since the 2010 baseline, with the majority of those able to
identify three techniques. These techniques are usually around the planting, drying through the
‘Mandela cock’19, use of good seed, grading and sorting, etc.
Figure 31: No. of Households Aware of up to Three Techniques to Combat Aflatoxin
When it came to utilisation of ‘bad nuts’, the most common action taken with groundnuts that
are affected by mould and seen as ‘bad nuts’ was to throw them away, however the next most
popular action was to use the bad nuts for groundnut flour. This groundnut flour is likely to be
highly contaminated with aflatoxin. Other actions included feeding to animals, using in
compost, and even one instance of giving to children as a snack. The number of households
who reported having groundnuts rejected by buyers was very low, with 6 households in 2013,
5 households in 2012 and the highest in 2011 with 8 households.
19 “The Mandela cock is a technique developed by scientists in South Africa and has been tested and recommended by
ICRISAT/Department of Agriculture Research Services in Malawi. It is a structure that uses the free flowing air to gradually remove
moisture from groundnut pods” (Diaz Rois, et al., 2013, p31).
26
43
1318
22
20
18
35
3
9
24
55
0
10
20
30
40
50
60
70
80
90
100
110
2010 2011 2012* 2013
No.
of
Hou
seh
old
s
3 Techniques
2 Techniques
1 Technique

67
Emerging Quality Groundnuts in Shell (NIS) Markets
The selling of nuts in shell has been already referred to in the Groundnut Production section,
where the increased prevalence of households selling NIS was investigated. For the 2012-13
season ExAgris Africa launched their NIS buying stations in earnest.
By buying NIS soon after harvest the stages in the supply chain where groundnuts are most at
risk of aflatoxin contamination are reduced if not removed (i.e. storage and shelling at
household level) (Emmott and Stephens, 2012). The intervention outlined earlier provided
extension support, training, and agricultural inputs on credit for groundnuts and a number of
other crops. It is envisaged that with these inputs and services farmers have the potential for
significant increases in their crop productivity and in particular will produce groundnuts with
lower levels of aflatoxin contamination. The incentive for following the recommended best
practices would be to receive a premium price for their high quality produce from ExAgris who
would be buying on behalf of their partners AfriNut and Valid Nutrition. This premium price
would have a direct positive impact on farmers’ livelihood status but also indirectly impact on
the nutrition of the farmers’ household as the increased yields with reduced aflatoxin levels
mean the home consumption of clean high quality groundnuts will probably increase. Also, as
groundnut has nitrogen fixing properties the soil fertility of farmers’ plots will benefit from
practices such as crop rotation.
It took several seasons for the farmers to be convinced of the benefits of the improved
agronomic practices being promoted, such as early planting, use of improved seeds, increased
plant population, treatment and prevention of pests and diseases, fertilizer application (where
economically viable), and improved harvesting and drying techniques. In the studied areas
farmers and extension officers report how farmers participating in the association and their
neighbours are moving away from unproductive traditional practices such as lower plant
population, recycling old seed, and drying nuts on the flat as opposed to the now widely
recommended drying system using the Mandela cock.
The Mandela cock technique is reported to be increasing in popularity in the studied areas.
However, as the intervention to buy NIS only began in 2013 many farmers would have still
employed one traditional practice that is a significant contributor to aflatoxin contamination,
whereby nuts in shell are soaked with water to aid with the hand shelling - a long arduous
process, mainly carried out by women (Diaz Rois, et al., 2013, Emmott and Stephens, 2012,
Emmott, 2012, GoM, et al., 2012, Simtowe, et al., 2009).
The prices offered in the 2013 NIS were 200MWK (US$0.62)20 per kg for nuts in shell; this
was in comparison to approximately 240MWK (US$0.74) per kg for shelled kernels at the
trading centres in the studied areas. Taking away the weight of the shell (typically a third of
total weight) that gives the NIS a premium of 55MWK per kg (US$0.17) or 25 percent in
comparison to what a farmer would receive if they were to shell all their nuts and transport to
the trading centres, which can range from 0.5 kilometres (i.e. farm gate) to seven kilometres
20 Currency exchange as of July 2013 US$1 = MWK322.77 (Reserve Bank of Malawi, 2013)
68
away. The flow diagram in Figure 33 gives a basic overview of the possible markets available
to farmers in the study area in 2013, the left hand side showing the high value nutrition sensitive
value chain targeting the RUTF and export markets. The right hand side of the flow shows the
informal market which mainly targets local consumption and informal regional exports with
minimal processing.

69
Figure 32: Groundnut Markets Available and Key Stakeholders
70
As discussed earlier, prior to the 2013 NIS pilot market groundnut farmers in the studied areas
mainly sold shelled nuts to small scale traders and intermediaries, who then sold onto larger
scale buyers and assemblers, who then sold onto exporters or local processors (Sangole, et al.,
2010). Farmers selling to these small-scale traders or intermediaries typically transport the
produce to the next trading centre by bicycle and receive one set price per kg of produce. The
traders in the three study areas reported the only requirements they impose on farmers selling
groundnuts is that the nuts are dry and free from ‘trash’ (i.e. non-nut material). Traders often
complained that they had to turn away farmers who brought nuts that were not dried to an
acceptable level - such a level being determined by the buyer - and traders believed that farmers
soak the nuts in shell in water so as to increase the weight. In response, farmers stated in focus
group discussions that they do sprinkle the nuts with water to aid with shelling as mentioned
previously, but also to increase the weight so as to circumvent losing out from the traders’
tampered scales. This lack of trust between farmers and buyers is a persistent problem in the
agricultural sector in Malawi.
Small-scale informal buyers are seen as the biggest competition to the NIS initiative and the
overall development of the groundnut sector (Emmott and Stephens, 2012). These buyers enter
the market early; some even enter villages and go from door to door offering very low prices
for immature groundnuts, something that is evident from the results above. Such offers can be
tempting for farmers who, at that stage of the season, are very cash-poor due to the lack of
alternatives or supplementary income generating activities for households (Emmott and
Stephens, 2012).
Observations from the 2013 NIS Market
In comparison to the informal trading centres the NIS buying stations appeared more organised
in 2013 as prices were published in the local area and word was spread of the new market place
for groundnuts. The message disseminated by ExAgris extension staff and association leaders
was that a price of 200MWK per kg of NIS would be offered, however the nut must be dried
as per recommendations and well sorted prior to coming to the buying station (i.e. shrivelled,
cracked, mouldy, and non-nut material must be removed). Electronic scales were used at the
buying stations which farmers reported to have more confidence in. Details of each sale were
recorded, including the tagging of each bag of NIS bought by ExAgris.
Despite the reported success of the first NIS market many challenges remain that will take time
to address through behaviour changing activities and the continued commitment to develop a
clean groundnut sector. One of the biggest challenges already touched on is the competition
from the informal sector. For the NIS scheme buyers like ExAgris need to come in as early as
possible with competitive prices to secure a sufficient supply to meet the RUTF and other
markets adhering to international restrictions. Emmott and Stephens (2012) recommended that
practical demonstrations with smallholders on the kernel to shell ratio of groundnuts (shells
typically comprise a third of total weight as mentioned earlier) are needed to ensure farmers
are aware of the actual differences in the prices.
71
A major issue that arose from the piloted NIS initiative in 2013 was that ExAgris was only
accepting the best quality groundnuts at first. Therefore the grade outs, which could be up to
30 percent of total produce, would likely have high aflatoxin contamination and would go back
into the community to be consumed at household level or sold on the local market, thereby
worsening the aflatoxin problem at community level. It is proposed that future NIS markets
should buy all grades of groundnuts at differential prices, and the grade outs that are purchased
would be used for cold pressed groundnut oil – a venture AfriNut and its partners are trying to
develop. This would remove the aflatoxin-contaminated groundnuts from the community and
by processing the grade outs, transform once toxic and costly grade outs into a safe and more
profitable product. However, a major challenge will be to decontaminate or blend the meal or
be able to ensure it is used in livestock production systems that can cope with higher aflatoxin
levels (e.g. beef)21. What remains is the price offered for grade outs: if it is lower than what the
farmers would receive on the informal market, then farmers could sell their grade outs on the
local market or keep for home consumption. This will test how effective the aflatoxin
awareness messages have been.
Initial acceptance of the NIS market initiative was reliant on a number of factors: farmers
employing the recommended agricultural practices; awareness of the multiple opportunity
costs of selling NIS as opposed to shelled kernels on the informal market; and full and
transparent participation of the private sector actors. These factors will need to be maintained
if such groundnut value chains are to succeed. In the 2014 buying season it is envisaged
groundnuts will be bought based on the results of on-site moisture testing, the optimal moisture
level being >9 percent (Emmott and Stephens, 2012). This will increase the efficiency of the
grading system for both farmer and buyer.
21 Correspondence with Andrew Emmott of TWIN
72
Section 11: Conclusions
This report has analysed the results of the research in terms of households and their livelihoods
and then has more specifically focussed on farmers as groundnut producers. In terms of the
overall livelihood and food security situation of the households, the results showed little change
in their welfare over the four year period. However, results for groundnut production and the
sale of groundnuts show quite positive outcomes at household level.
Households Hanging On
Households have low asset endowment and lack of returns on what assets they do have and
remain highly vulnerable to shocks. From this we can say that households are ‘hanging on’22.
As mentioned, the food security and livelihood situation of the selected households remained
relatively unchanged, despite the majority of the households benefitting from FISP,
government extension support and the ExAgris groundnut intervention.
Wider meso/macro-economic and political economy issues such as increased land availability,
access to affordable finance, appropriate and sustainable social protection polices for the most
vulnerable, basic market infrastructure and institutions (e.g. roads, information flows,
regulation of standards, etc.) are areas that are identified in this study (and in many other
studies) that need to be improved if real and long lasting change is to be seen at household
level.
Smallholder Farmers: High Quality Groundnut Producers
Despite these challenges, in the long run it is possible that more smallholder farmers will be
able to meet the standards and participate in high-value groundnut markets; however this
cannot be achieved without the provision of multi-sector support to smallholders, all buyers,
extension service staff and input providers (Narrod, et al., 2008). The past experiences of
sanitary and phyto-sanitary standards acting as a barrier for the poorer and resource constrained
farmers, most often women farmers, need to be appreciated and used to inform schemes such
as the development of the RUTF value chain and the broader groundnut value chain (Maertens
and Swinnen, 2006, Wiggens and Keats, 2013). Continued efforts to increase, not only
awareness, but also appreciation of aflatoxin and the health risks it poses will be needed to
achieve this. From fieldwork observations it appeared that those mainly targeted by aflatoxin
awareness messages were the farmers. Other key actors who need to be targeted include the
small scale traders, processors and peri-urban and urban dwellers.
If leveraged successfully by the relevant stakeholders – which includes the governmental
departments (health, agriculture, trade), the Partnership for Aflatoxin Control in Africa
(PACA), the Malawi Programme for Aflatoxin Control (MAPAC), civil society organisations,
micro-finance institutions, etc. - the renewed efforts for setting standards for the development
22 A term coined by Chirwa and Dorward (2013) in reference to households relying on FISP for food security.
73
of sustainable groundnut value chains can act as a catalyst for wider agricultural and economic
growth.
All in all, this research shows that the short to medium term objectives of the RUTF value chain
are being progressively met year on year, and this is likely to continue with time and the
strengthening of stakeholders individually and collectively. However, it is important to note
that there is clearly much more to do to establish a reliable, inclusive, cost-effective value chain
based on smallholder supply of groundnuts – and, even if that is achieved, it will likely
improve, but will not transform livelihoods.
Bibliography

74
Conroy, A., et al. 2006. Poverty, Aids and Hunger- Breaking the Poverty Trap in Malawi
BAMBERGER, M. 2000. Integrating quantitative and qualitative research in development
projects, World Bank Publications.
BAZELY, P. 2002. Issues in mixing qualitative and quantitative approaches to research.
Brock, K. 1999. Implementing a sustainable livelihoods framework for policy-directed
research: reflections from practice in Mali, Institute of Development Studies.
Carney, D. 1999. Approaches to Sustainable Livelihoods for the Rural Poor. Poverty Briefing
No. 2, Overseas Development Institute, London.
Carney, D., et al. 1999. Livelihood Approaches Compared. Department for International
Development (DIFID), London, November.
Pazderka, C., and Emmott A. 2010. Groundnuts Case Study: available at
http://www.chathamhouse.org/sites/default/files/public/Research/Energy,%20Environment%
20and%20Development/0610casestudy_groundnuts.pdf.
CFS, 2012. Coming to Terms with Food Security, Nutrition Security, Food Security and
Nutrition, Food and Nutrition Security. Available at:
http://www.fao.org/docrep/meeting/026/MD776E.pdf
Chambers, R. and Conway, G. 1992. Sustainable Rural Livelihoods: Practical Concepts for
the 21st Century. IDS Discussion Paper 296, Institute of Development Studies, Brighton.
Chidanti-Malunga, J.F. 2009. WETLAND FARMING AND SMALL-SCALE INFORMAL
IRRIGATION IN MALAWI: THE CASE OF SHIRE VALLEY. Doctor of Philosophy,
Cranfield University.
Chilowa, W. 1998. The impact of agricultural liberalisation on food security in Malawi. Food
Policy, 23, 553-569.
Chirwa, E. & Dorward, A. 2013. Agricultural Input Subsidies: The Recent Malawi
Experience, United Kingdom, Oxford University Press.
Chirwa, E., Kydd, J. & Dorward, A., 2006. Future scenarios for agriculture in Malawi:
challenges and dilemmas. Available at: http://www.future-
agricultures.org/component/content/article/74-policy-briefs/248-future-scenarios-for-
agriculture-in-malawi-challenges-and-dilemmas-#.Up-AtxlgN7M
Christiansen, R.E. & Stackhouse, L.A. 1989. The privatization of agricultural trading in
Malawi. World Development, 17, 729-740.
75
Cotes, J., Swindale, A. and Bilinsky, P. 2007. Household Food Insecurity Access Scale
(HFIAS) for measurement of food access: indicator guide. Washington, DC: Food and
Nutrition Technical Assistance Project, Academy for Educational Development.
Collins, K.M., Onwuegbuzie, A.J. & Sutton, I.L. 2006. A model incorporating the rationale
and purpose for conducting mixed methods research in special education and beyond.
Learning Disabilities: A Contemporary Journal, 4, 67-100.
Conroy, A., Blackie, M.J., Whiteside, A., Malewezi, J.C. & Sachs, J.D. 2006. Poverty, AIDS
and Hunger: Breaking the Poverty Trap in Malawi, New York, Palgrave Macmillian.
Corbett, J. 1988. Famine and household coping strategies. World Development, 16, 1099-
1112.
CYE Consult, 2009. Value Chain Analysis of Selected Commodities Institutional
Development across the Agri-Food Sector [online]: Available at:
http://www.moafsmw.org/ocean/docs/Agricultural Marketing/D Value ch
ain%20Final%20Report%20Revised%2001.08.09.pdf
Dar, W.D. 2012. Include Smallholders in Market-Oriented Development. What ICRISAT
Thinks The Director General's Blog [Online] Available from:
http://witblog.icrisat.org/?p=711 2013].
DeLange, Swanepoel, F., Silaula. And Mugabe, P. (eds) 2001. Contributions towards the
Knowledge of Rural Development. Edited Proceedings of the Conceptualisation Workshop
on the Integrated Rural Development Initiative of the W.K. Kellogg Foundation in Southern
Africa, University of Pretoria.
Denning, G., Kabambe, P., Sanchez, P., Malik, A., Flor, R., Harawa, R., Nkhoma, P., Zamba,
C., Banda, C. & Magombo, C. 2009. Input subsidies to improve smallholder maize
productivity in Malawi: Toward an African Green Revolution. PLoS biology, 7, e1000023.
Devereux, S. 1999. Making less last longer: Informal safety nets in Malawi, Institute of
Development Studies.
Devereux, S. 2001. Sen's entitlement approach: critiques and counter-critiques. Oxford
Development Studies, 29, 245-263.
Devereux, S. 2013. Trajectories of social protection in Africa. Development Southern Africa,
30, 13-23.
Devereux, S., 1997. Household Food Security in Malawi. Institute of Development Studies,
Discussion Paper 362.
Devereux, S., Baulch, B., Hussein, K., Shoham, J. & Wilcock, D. 2004. Improving the
analysis of food insecurity. Food insecurity measurement, livelihoods approaches and policy:
applications in FIVIMS.

76
Devereux, S., Baulch, B., Macauslan, I., Phiri, A. & Sabates-Wheeler, R. 2006. Vulnerability
and Social Protection in Malawi. IDS DISCUSSION PAPER 387. UK: Institute of
Development Studies University of Sussex Brighton
DFID, 1999. ‘Sustainable Livelihood Guidance Sheets’
http://www.ennonline.net/resources/667
DFID 2006. The Role of Smallstock in Development and Poverty Reduction. Available at
http://www.smallstock.info/issues/development.htm.
Diaz Rios, L. 2008. Barrier, catalyst, or distraction? Standards, competitiveness, and Africa's
groundnut exports to Europe.
Diaz Rios, L., Gokah Isaac B. , Kauma Bridget Chifundo, Njoroge Samuel & Aubrey, C.,
2013. Advancing Collaboration for Effective Aflatoxin Control in Malawi.
Dorward et al, 2013 Evaluation of the 2012/13 Farm Input Subsidy Programme Malawi
Dorward, A. and Kydd, J. 2004. The Malawi 2002 food crisis: the rural development
challenge. The Journal of Modern African Studies, 42, 343-361.
Dorward, A. & Kydd, J. 2004. The Malawi 2002 food crisis: the rural development challenge.
Journal of Modern African Studies, 42, 343-362.
Dorward, A. & Kydd, J. 2005. Making agricultural market systems work for the poor:
Promoting effective, efficient and accessible coordination and exchange. Imperial College
London.
Dorward, A., Chirwa, E. & Poulton, C., 2008. Improving Access to Input & Output Markets.
Available at: http://www.future-agricultures.org/component/docman/doc_details/167-
improving-access-to-input-a-output-markets#.Up-CdhlgN7M
Dorward, A., Chirwa, E., Kelly, V.A., Jayne, T.S., Slater, R. & Boughton, D., 2008a.
Evaluation of the 2006/7 agricultural input subsidy programme, Malawi. Final Report.
Available at: http://purl.umn.edu/97143
Dorward, A.a.C., Ephraim 2011a. Evaluation of the 2010/2011 farm input subsidy
programme, Malawi: report on programme implementation. . London: Centre for
Development, Environment and Policy, SOAS, University of London, and Wadonda Consult.
Dorward, A.a.C., Ephraim 2011b. The Malawi Agricultural Input Subsidy Programme: 2005-
6 to 2008-9. International Journal of Agricultural Sustainability, 9.
Ellis, F. and Allison, E. 2004. Livelihood diversification and natural resource access. Report
produced for FAO Livelihood Support Programme (LSP), Overseas Development Group, and
University of East Anglia, UK.
77
Ellis, F. & Manda, E. 2012. Seasonal Food Crises and Policy Responses: A Narrative
Account of Three Food Security Crises in Malawi. World Development, 40, 1407-1417.
Ellis, F. 2000. Rural Livelihoods and Diversity in Developing Countries, New York, Oxford
University Press Inc.
Ellis, F. 2013. Fertiliser Subsidies and Social Cash Transfers as Complementary or
Competing Instruments for Reducing Vulnerability to Hunger: The Case of Malawi.
Development Policy Review, 31, 575-596.
Ellis, F., Kutengule, M. & Nyasulu, A. 2003. Livelihoods and Rural Poverty Reduction in
Malawi. World Development, 31, 1495-1510.
Emmott, A. & Stephens, A. 2012. Scoping economically viable mechanisms that deliberately
pull aflatoxin out of human food chains. London: Twin.
Emmott, A. 2012. “Value Chain Approach – Aflatoxin (Groundnuts) Final Report, Twin
Trading. Available from www.satradehub.org
Emmott, A. 2013. Market-led aflatoxin interventions Smallholder groundnut value chains in
Malawi. Aflatoxin Briefs: Finding Solutions for Food Safety [Online].
Ephraim W. Chirwa, 2013. Thinking about ‘Graduation’ from the Farm Input Subsidy
Programme in Malawi. Futures Agricultures.
FANPRAN Report 2007/004. Input Voucher Study in Malawi, Mozambique and Zambia.
FEG, S. 2008. RHVP. 2008. The Practitioner’s Guide to the Household Economy Approach.
FEG Consulting, Save the Children-UK and Regional Hunger and Vulnerability Programme:
www. feg-consulting. com/resource/practitionersguide-to-hea (eg boreholes or shallow wells
with fees).
FEWS MALAWI Food Security Outlook Update – August 2010 available online at
http://www.fews.net/docs/Publications/ Malawi_FSOU_2010_08_final.pdf
FEWS/NET 2011. MALAWI Food Security Outlook Update, available at:
http://www.fews.net/docs/Publications/Malawi_FSOU_2011_05_final.pdf.
FEWSNET, 2012. ‘Malawi Food Security Outlook: October 2012 – March 2013’
Gillespie, S., Haddad, L., and Jackson, R. 2001. “HIV/AIDS, Food Security and Nutrition
Security: Impacts and Actions.” In Nutrition and HIV/AIDS. UN ACC SCN Nutrition Policy
Paper #20, Report of the 28th Symposium, April 2001, Nairobi.
GOM (Government of Malawi), 2002. ‘Malawi National Land Policy’. Lilongwe: Ministry of
Lands, Physical Planning and Surveys.

78
GOM, 2006a. Malawi Growth and Development Strategy 2006 - 2011.
GOM, 2006b. Malawi Poverty and Vulnerability Assessment Investing in Our Future.
Gosling, L. & Edwards, M. 2003. Toolkits: A practical guide to planning, monitoring,
evaluation and impact assessment, Save the Children UK.
Government of Malawi, 2010. “The Agriculture Sector Wide Approach; Malawi’s prioritised
and harmonised Agricultural Development Agenda”, Ministry of Agriculture and Food
Security, Republic of Malawi.
Government of Malawi, 2012. The Malawi Growth and Development Strategy II. 2011-2016.
In: MALAWI, G. O. (ed.).
Greene, J.C., Caracelli, V.J. & Graham, W.F. 1989. Toward a conceptual framework for
mixed-method evaluation designs. Educational evaluation and policy analysis, 11, 255-274.
Haddad, L., Kennedy, E. & Sullivan, J. 1994. Choice of indicators for food security and
nutrition monitoring. Food Policy, 19, 329-343.
Haughton, J. & Khandker, S.R. 2009. Handbook on poverty and inequality, World Bank-free
PDF.
ICRISAT, 2009. “Socioeconomic Assessment of Baseline Pigeon pea and Groundnut
Production Constraints, Farmer Technology Choice, Market Linkages, Institutions and
Poverty in Rural Malawi”
ICRISAT, 2013. http://www.icrisat.org/crop-groundnut.htm
IFAD, 2002. IFAD Strategy for Rural Poverty Reduction in Western and Central Africa,
IFAD.
IFPRI, 2011. “The Impacts of Agricultural Input Subsidies in Malawi” Malawi Strategy
Support Program, Policy Note 5, March 2011
JAICAF 2008. The Maize in Zambia and Malawi, available at:
http://www.jaicaf.or.jp/publications/Zambia.pdf.
Jones, A. D., Shrinivas, A. and Bezner-Kerr, R. 2014. Farm production diversity is associated
with greater household dietary diversity in Malawi: Findings from nationally representative
data. Food Policy 46 (2014) 1-12
Kennedy, G., Ballard, T., and Dop, M. 2006. Guidelines for Measuring Household and
Individual Dietary Diversity. Food and Agricultural Organisation (FAO)
79
Kerr, R.B., Snapp, S., Chirwa, M., Shumba, L. & Msachi, R. 2007. Participatory research on
legume diversification with Malawian smallholder farmers for improved human nutrition and
soil fertility. Experimental Agriculture, 43, 437-454.
Kutengule, M. 2000. Farm and Non-Farm Sources of Income: Rural Livelihood
Diversification in Malawi. Doctor of Philosophy, University of East Anglia,.
Laws, S., Harper, C., Jones, N. & Marcus, R. 2013. Research for development: A practical
guide, Sage.
Maertens, M. & Swinnen, J. Standards as barriers and catalysts for trade and poverty
reduction. IAAE Conference Papers, 2006. 1-34.
Malawi Government, 2006. Malawi Poverty and Vulnerability Assessment. Jointly published
as a World Bank Report 36546-MW available online at www.agirn.org/documents/malawi.
Maliro, D.D. 2011. Comparison of Agricultural Input Subsidies and Social Cash Transfers as
Policies for Reducing Vulnerability to Hunger in Malawi. Doctor of Philosophy., University
of East Anglia.
Matumba, L., Monjerezi, M., Biswick, T., Mwatseteza, J., Makumba, W., Kamangira, D. &
Mtukuso, A. 2014. A survey of the incidence and level of aflatoxin contamination in a range
of locally and imported processed foods on Malawian retail market. Food Control, 39, 87-91.
Maxwell, S. & Frankenberger, R.T., 1992. Household Food Security: Concepts, indicators,
Measurements A Technical Review. Available at:
http://www.ifad.org/hfs/tools/hfs/hfspub/index.htm [12 December 2013]
Ministry of Industry and Trade., 2012. Malawi National Export Strategy 2013-2018 In:
TRADE, M. O. I. A. (ed.). Lilongwe, Malawi.
MNVAC 2005. Malawi National Vulnerability Assessment Committee - Malawi Baseline
Livelihood Profiles, available at: http://pdf.usaid.gov/pdf_docs/PNADG538.pdf.
Modi, P. 2012. Rural Marketing: Marketing to the Rural, Poor or Disadvantaged Consumers.
International Journal of Rural Management, 8.
Modi, V., McDade, S., Lallement, D. & Saghir, J. 2006. Energy services for the Millennium
Development goals. New York: Energy Sector Management Assistance Programme, United
Nations Development Programme. UN Millennium Project, and World Bank.
NASFAM 2011. National Smallholder Farmers Association of Malawi; available at:
http://www.nasfam.org/index.php?option=com_content&task=view&id=69&Itemid=79.
National Statistical Office, N.S. 2012. Third Integrated Household Survey 2010-11:
Household Socio-Economic Characteristics Report. Zomba: National Statistical Office.

80
Ngwira A.R., et al. 2012. “Scaling out best fit legume technologies for soil fertility
enhancement among smallholder farmers in Malawi”, African Journal of Agricultural
Research, Vol. 7(6), pp 918-928, February 2012.
Njuki, J., Kaaria, S., Sanginga, P., Kaganzi, E. & Magombo, T. 2007. Empowering
communities through market led development: Community agro-enterprise experiences from
Uganda and Malawi. Futures Agricultures–Farmer First Revisited.
Orr, A. & Mwale, B. 2001. Adapting to Adjustment: Smallholder Livelihood Strategies in
Southern Malawi. World Development, 29, 1325-1343.
PRETTY, J. 1998. Social capital and sustainable livelihoods. Rural Livelihoods,
Empowerment, and the Environment: Going Beyond the Farm Boundary, 11-21.
Rao, V. and Woolcock, M. 2003. Integrating qualitative and quantitative approaches in
program evaluation. The impact of economic policies on poverty and income distribution:
Evaluation techniques and tools, 165-190.
Rocco, T.S.R.T.S., Bliss, L.a.B.L.A., Gallagher, S.G.S., Pérez, A.P.A. & Prado, P. 2003.
Taking the Next Step: Mixed Methods Taking the Next Step: Mixed Methods Research in
Organizational Systems Research in Organizational Systems. Information Technology,
Learning, and Performance Journal, 21, 19.
Sangole, N., Magombo, T. & Kalima, D. 2010. Groundnut Value Chain Analysis Report.
Lilongwe, Malawi: African Institute of Corporate Citizenship (AICC).
Scoones, I., 1998. Sustainable Rural Livelihoods: A Framework for Analysis. Working
Paper. Brighton, UK.
Sen, A., 1981. Poverty and Famines: an Essay on Entitlement and Famines. Oxford
Sen, K. & Chinkunda, A., 2002. Economic Reforms and Rural Livelihoods in Malawi.
Siambi, M., Estrada, J. & Jones, R., 2008. Overcoming Market challenges for smallholder
farmers: the case of groundnuts in Malawi.
Simtowe et al, 2009. Assessment of the Current Situation and Future Outlooks for the
groundnut Sub-Sector in Malawi
Simtowe, F., Shiferaw, B., Abate, T., Kassie, M., Monyo, E., Madzonga, O.,Silim, S. &
Muricho, G. 2009. Assessment of the Current Situation and Future Outlooks for the
groundnut Sub-Sector in Malawi. [online], available from: http://www.icrisat.org/what-we-
do/impi/projects/tl2-publications/regional-situation-outlook-reports/rso-gn-malawi.pdf
[accessed 2/9/2011]
Simtowe, F., Shiferaw, B., Asfaw, S., Tsedeke, A., Monyo, E., Siambi, M. and Muricho, G.
2009. Socioeconomic Assessment of Baseline Pigeon pea and Groundnut Production
81
Conditions, Farmer Technology Choice, Market Linkages, Institutions and Poverty in Rural
Malawi.
Stephenson, I. 2004. “Rural Household and Community Level Responses to the Impact of
HIV/AIDS and Livelihood Security in Zimbabwe and Botswana”. Ph.D. Thesis, University
College Cork, Ireland.
Stokes, C. S. 2003. Measuring impacts of HIV/AIDS on rural livelihoods and food security,
Food and Agriculture Organization.
Swindale, A., Bilinsky, P., 2006. Household Dietary Diversity Score (HDDS) for
Measurement of Household Food Access: Indicator Guide. Food and Nutrition Technical
Assistance Project (FANTA), Academy for Educational Development, Washington, DC.
Sylvia Chant. 2009. Dangerous Equations? How Female-headed Households Became the
Poorest of the Poor: Causes, Consequences and Cautions.
T.S. Jayne, Nicholas Sikto, Jacob Ricker-Gilbert, and Julius Mangisoni.(2010)Malawi’s
Maize Marketing System.
UNDP, 2010. What Will It Take to Achieve the Millennium Development Goals: An
International Assessment. New York:
UNIDO, 2012. Capacity Building for Aflatoxin Management and Control in Groundnuts
Independent Evaluation of the UNIDO project. Vienna.
UNSCN 2008. Dietary Diversity (DD); available at:
http://www.unscn.org/files/Task_Forces/Assessment_Monitoring_and_Evaluation/Dietary_D
iversity.pdf.
Valid Nutrition. 2013 [Online]. Available: http://www.validnutrition.org/ [Accessed January
2013.
Vanclay, F. & Esteves, A.M. 2012. New Directions in Social Impact Assessment: Conceptual
and Methodological Advances, Cheltenham/GB, Edward Elgar Publishing Ltd.
Verduzco-Gallo, I., Ecker, O. and Pauw, K. 2014). Changes in Food and Nutrition Security in
Malawi. IFPRI Working Paper 06, June 2014
Wiggins, S. & Keats, S., 2013. Leaping and Learning Linking Smallholders to Markets.
Imperial College London.
Worldbank 2011. Social Analysis: Wealth Ranking. Available at:
http://go.worldbank.org/MJAIMU88Q1.
WorlddataBank, 2012 http://data.worldbank.org/country/malawi
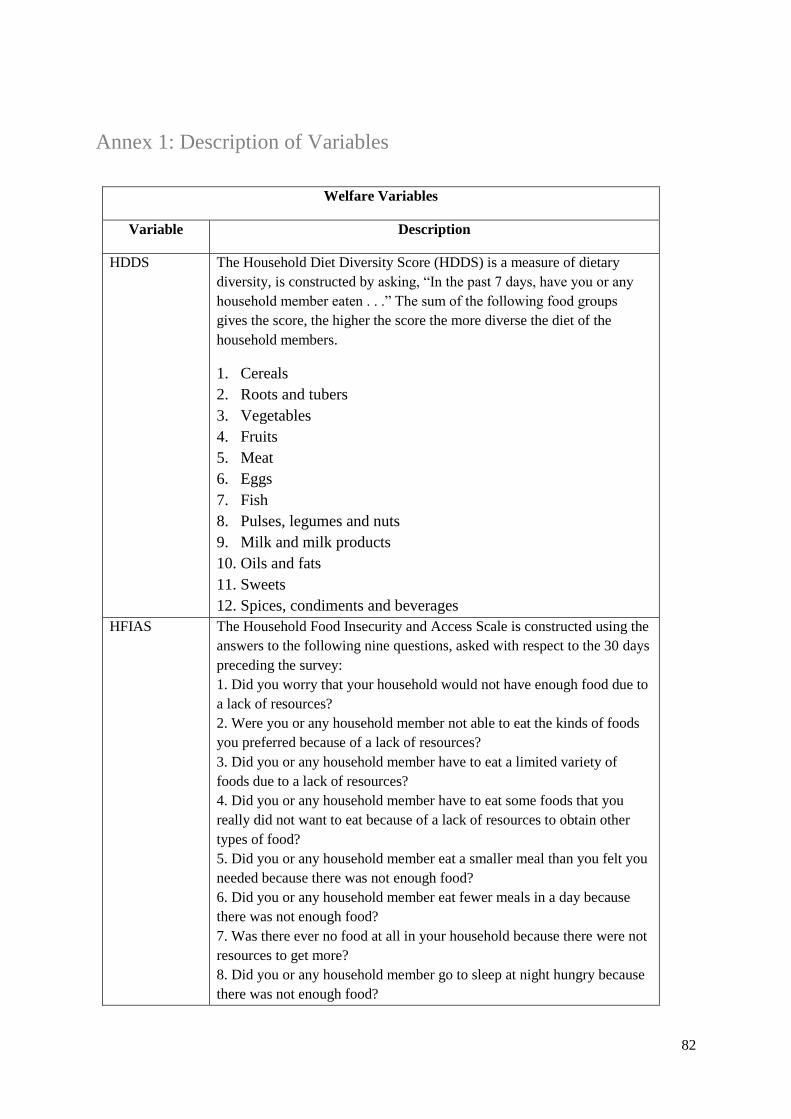
82
Annex 1: Description of Variables
Welfare Variables
Variable Description
HDDS The Household Diet Diversity Score (HDDS) is a measure of dietary
diversity, is constructed by asking, “In the past 7 days, have you or any
household member eaten . . .” The sum of the following food groups
gives the score, the higher the score the more diverse the diet of the
household members.
1. Cereals
2. Roots and tubers
3. Vegetables
4. Fruits
5. Meat
6. Eggs
7. Fish
8. Pulses, legumes and nuts
9. Milk and milk products
10. Oils and fats
11. Sweets
12. Spices, condiments and beverages
HFIAS The Household Food Insecurity and Access Scale is constructed using the
answers to the following nine questions, asked with respect to the 30 days
preceding the survey:
1. Did you worry that your household would not have enough food due to
a lack of resources?
2. Were you or any household member not able to eat the kinds of foods
you preferred because of a lack of resources?
3. Did you or any household member have to eat a limited variety of
foods due to a lack of resources?
4. Did you or any household member have to eat some foods that you
really did not want to eat because of a lack of resources to obtain other
types of food?
5. Did you or any household member eat a smaller meal than you felt you
needed because there was not enough food?
6. Did you or any household member eat fewer meals in a day because
there was not enough food?
7. Was there ever no food at all in your household because there were not
resources to get more?
8. Did you or any household member go to sleep at night hungry because
there was not enough food?
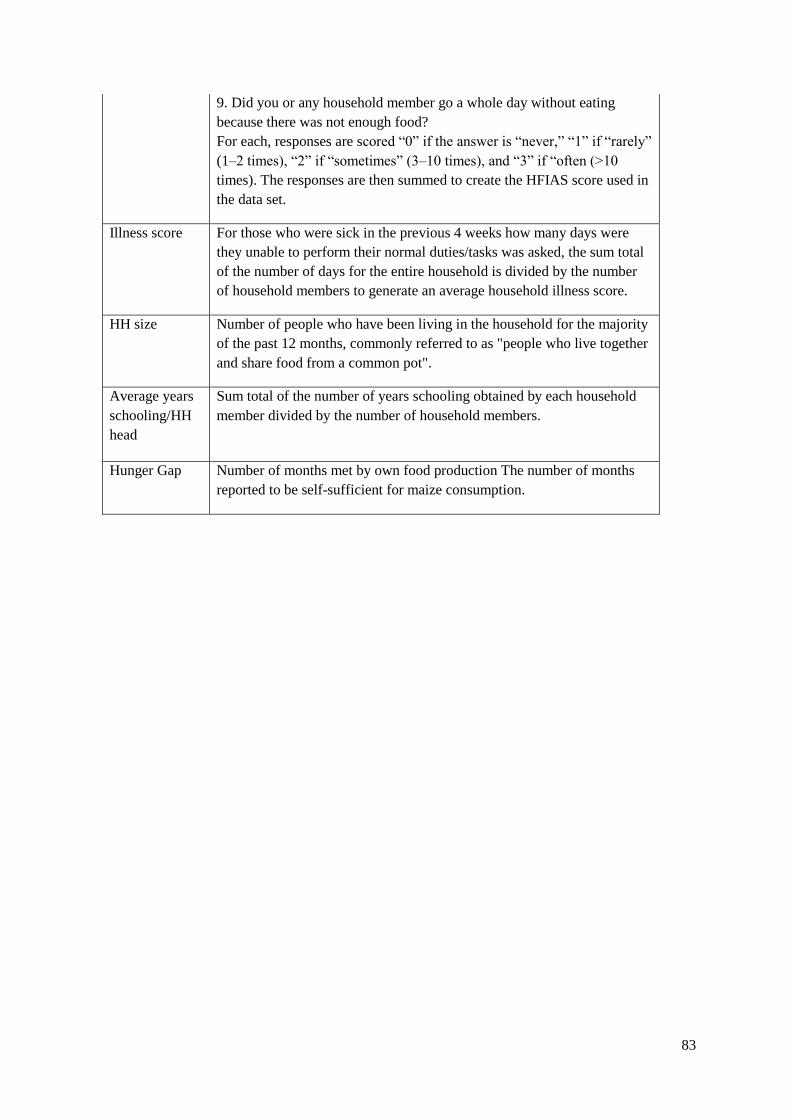
83
9. Did you or any household member go a whole day without eating
because there was not enough food?
For each, responses are scored “0” if the answer is “never,” “1” if “rarely”
(1–2 times), “2” if “sometimes” (3–10 times), and “3” if “often (>10
times). The responses are then summed to create the HFIAS score used in
the data set.
Illness score For those who were sick in the previous 4 weeks how many days were
they unable to perform their normal duties/tasks was asked, the sum total
of the number of days for the entire household is divided by the number
of household members to generate an average household illness score.
HH size Number of people who have been living in the household for the majority
of the past 12 months, commonly referred to as "people who live together
and share food from a common pot".
Average years
schooling/HH
head
Sum total of the number of years schooling obtained by each household
member divided by the number of household members.
Hunger Gap Number of months met by own food production The number of months
reported to be self-sufficient for maize consumption.
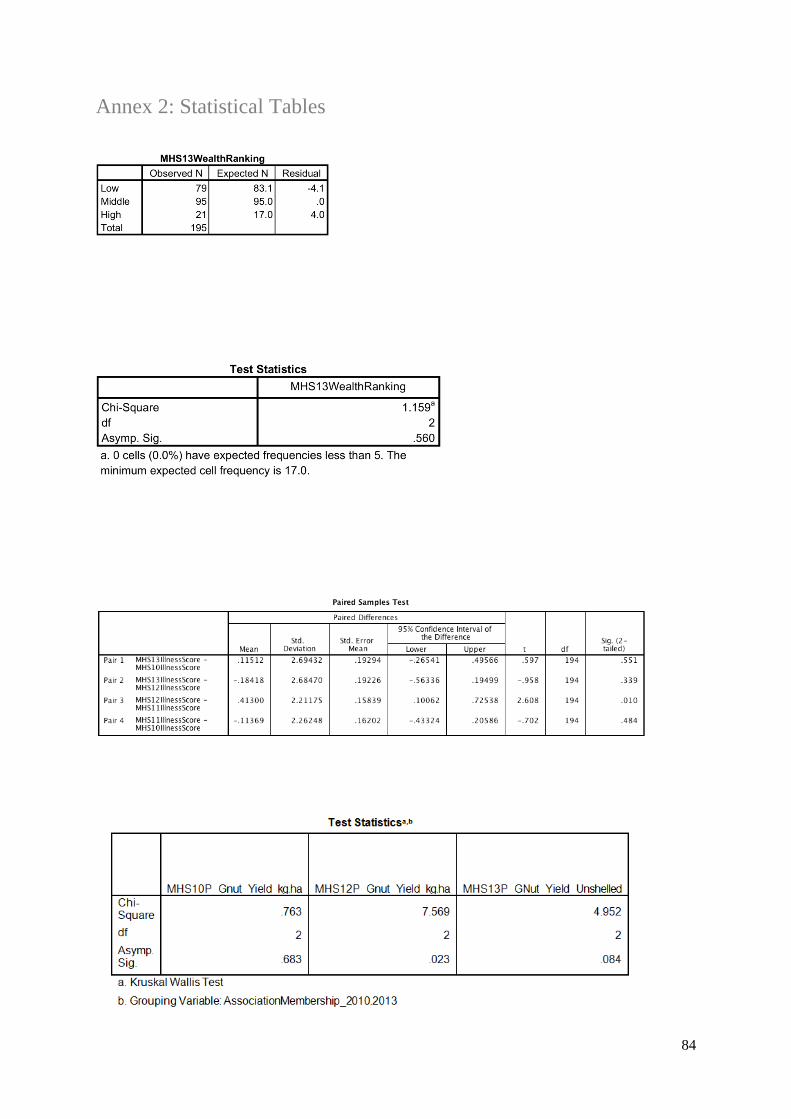
84
Annex 2: Statistical Tables

85
Annex 3: Consumer Price Index
Deflating Nominal Values to Real Values using
Malawi's National Statistical Office Annual
Consumer Price Index
Price
Index
Re-indexed to
2010
Decimal
form
2010 281.9 100.00 1.00
2011 300.0 106.41 1.06
2012 356.8 126.58 1.27
2013 446.2 158.28 1.58