Embed Size (px)
Citation preview
CPHR
Centre for Performance-led HR
The Productivity Challenge Broadening the HR Debate
White Paper 16/01 June 2016
Professor Paul Sparrow and Dr. Lilian Otaye - Ebede

2
Contents
1. Introduction and Purpose of the Paper 4
2. Engaging with National and Organisational Productivity 7
2.1. National Productivity: The UK Productivity Conundrum 7
2.2. Organisational Productivity 12
2.3. Linking the National and Organisational Context 15
3. Unraveling your Sector or Organisational Recipe for Productivity 17
3.1. When Productivity is Embedded in Service Formats and Offerings 18
3.2 When Productivity is Dominated by Return on Capital Employed 22
3.3. When Productivity is Dependent on The Surrounding Industrial
and Institutional Structure 23
3.4. When Productivity Targets are Beyond any Historical Precedent 26
3.5. When Productivity Requires a Shift in Thinking About the Best
Form of Flexibility 26
3.6. When Productivity Depends on Transfer of Costs Between
Organisation and Consumer 28
3.7. When Productivity Depends on Transfer of Costs Between
Organisation and Society 28
4. Emerging Productivity Challenges 30
4.1. Disruptive Technologies 30
4.2. Machine Intelligence and the Automation of Knowledge Work 31
4.3. The Democratisation of Manufacturing 33
4.4. Consequences: Changes in the Economics and Scale of Production 33
5. Conclusions 35
6. Notes 37
Page
4
In our White Paper series we have shown in many areas – such as dealing with performance challenges including innovation, customer centricity, lean management, and now in this paper the issue of productivity – the demand-pattern for professional knowledge inside organisations is changing. Organisations are seeking more sustainable and substantive gains in performance, and they are aware that they have not been as effective as they might in delivering these gains. Piecemeal solutions – driven from within one or two management functions - cannot go on for long.
Managing the performance drivers noted above, and their enablers, is a “horizontal” problem.
The solution often sits “above” the traditional management functions. The challenges
can only be properly understood and solved by cross-functional action and focus inside
the organisation, but also connections to, and co-ordination across, people beyond the
organisation (partners, supply chain, governments). In solving these challenges we need
to create new breeds of professionals educated and equipped with more holistic skillsets
and networks. Organisations are pushing more resource into important horizontal and non-
functional strategic priorities, redistributing resources both from one function to another, and
from these traditional functions into the new horizontal strategic units and activity streams.
We know that in the next few years a lot of attention is going to be given to productivity. But
traditionally the HR function, except in perhaps the sectors such as manufacturing, has not
been directly involved in helping the organisation think through the best ways to respond to
this productivity challenge. It also itself thinks in relatively narrow terms – looking to individual-
level productivity activities such as building workforce skills, managing employee engagement
to keep skilled employees delivering, and designing performance management systems
and incentives systems such as performance-related pay to maintain control over the
implementation of work.
Yet to solve the challenge of productivity – the focus of this White Paper - we need coordinated
investments at national and institutional levels, coupled with changes inside organisations that
combine technology, space and design, knowledge and people in new ways. This knowledge
draws upon know-how from a range of disciplines, such as technology management, R&D,
economics and organisation behaviour.
There is the opportunity and need for strategic upskilling to take place, whereby the necessary
professional or functional knowledge is pooled in organisational effectiveness units and built up
into cross-functional insight. Productivity may be thought of as one form of resilience.
In order to be able to hold their own as a function, HR need to build the topic of productivity
into their educational syllabus, and they need to skill themselves up in order to be able to
demonstrate the complex people and organisational issues that will need to be resolved if firms
and nations are to deal with the productivity challenge.
What does the White Paper do? It begins by asking why all the concern again with productivity,
and argues that in part it is because we face multiple risk events, which together bring the
economic health, productivity and resilience of an organisation or a nation to the fore.
1. Introduction and Purpose of the Paper
5
The paper outlines two challenges - developments in national and organisational level
productivity. It places the UK national productivity in international context and examines some
of the debates behind what is called the UK productivity conundrum.
It is intended to raise concern amongst HR Directors around the issue, and to make it clear
that they will be tasked with contributing to fundamental workforce and business model
transformations aimed at reversing what is now a serious productivity problem.
It highlights some emerging risks in which the actions of HR Directors on behalf of their
organisations can at the same serve to create major difficulties at national level, or for future
generations. It asks whether UK organisations are becoming more inclined to use labour-
intensive forms of production - because employing staff has been cheap – rather than investing
in new efficiency-enhancing technology - and whether there is now a tendency over time for
employment to be concentrated in sectors where future productivity gains will be difficult to
secure or measure.
It explains some of the main factors involved in organisation level productivity and links the
national and organisational agendas by drawing attention to areas such as the role of skills
in improving productivity – which is mainly seen in terms of the intangible benefits it has on
knowledge transfer and innovation – and the challenge that future skills scenarios might present
for HR functions.
It argues that at the level of the organisation, understanding the true drivers of productivity is
a major challenge. Even with today’s improvements in business analytics, often only a handful
of internal managers can grasp productivity in its totality, and the idiosyncratic nature of each
business model generally means that even within an industrial sector recipe, each organisation
often finds bespoke ways of delivering improved productivity
It raises the key questions that HR Directors should now be able to answer about their
organisation’s productivity by looking at a range of different productivity challenges across
several UK sectors – such as supermarkets, fast food, gaming and leisure services, oil and
energy, aerospace, nuclear sector, the NHS, postal services and on-demand business models
- and reveals seven important complexities that HR Directors must engage with. What happens
when productivity:
• Is embedded in service formats and offerings?
• Is dominated by return on capital employed?
• Is dependent on the surrounding industrial and institutional structure?
• Targets are beyond any historical precedent?
• Requires a shift in thinking about the best form of flexibility?
• Depends on transfer of costs between organisation and consumer?
• Depends on transfer of costs between organisation and society?
6
By explaining just how nuanced, complex and multi-faceted the productivity challenge is across
these different industrial settings, we wish to make two central points:
First, it should become clear why it is difficult to “notch up” productivity at national level.
Improvements at national level can only be made on the back of sophisticated strategies
across numerous organisations. Shared actions and understanding of these challenges has to
first be created, and then acted upon, across institutions and organisations. HR Directors have
an important role to play here.
Second, when trying to value human capital, common metrics applied across organisations
at an industry or national level can at best only provide a gross indication of an organisation’s
health and effectiveness. Top teams will always need to develop their unique metrics and
equations where it comes to understanding their organisation’s core productivity, and find ways
of explaining why their chosen metrics make the most strategic sense.
It then looks at a number of emerging productivity levers already at hand – disruptive
technologies such as machine intelligence and the automation of knowledge work and the
democratisation of manufacturing through 3D printing.
Finally, it argues that given the highly idiosyncratic nature of productivity strategies that are
typically needed, we need much better use of human capital metrics and HR analytics so that
organisations, and important stakeholders such as the financial community, can get a better
fix on the true health and future value of an organisation. We need a more balanced set of data
and set of metrics that help assess some of the fundamental performance capabilities of an
organisation. Metrics that capture an organisation’s productivity potential coming from a total
factor productivity perspective – whether used from the inside out by Chief Executives to
demonstrate the deep capabilities of their organisation or more critical perspective from the
outside in from investors and governments - can help build such confidence.
7
Why all the concern again with productivity? In part it is because we know that the global
economy remains extremely fragile and open to disruption, if not even collapse, depending
on which commentators you read. This becomes a problem for organisations because
financial crises are now associated with larger output losses, and slower recoveries, than more
‘conventional’ recessions1.
The Bank of England classifies events in three ways: world demand shocks, world supply or
price shocks and world financial shocks2. It sees three channels for the transmission of these
world shocks:
• trade linkages (demand for exports and import prices);
• financial linkages (tighter supply of credit and more volatile asset prices); and
• spillovers into general uncertainty.
Organisations find themselves operating in financial markets that may act irrationally (or is it
rationally?) depending on the flavour of the day. Since the global financial crisis we have seen
tumults over Grexit and the potential demise of the Euro, the inability of US Federal Reserve
to wean markets off free money, debt bubbles in China - by mid-2014 China’s total debt had
quadrupled from $7 trillion in 2007 to $28 trillion (which at 282% of GDP was larger than that of
the USA or Germany) – and now we see the debate around Brexit.
Regardless of eventual outcomes of these risk events, they bring the economic health and
resilience of an organisation or a nation to the fore.
Productivity can be thought about, analysed, and managed in the organisation, at very different
levels:
• a single operation,
• a department,
• a facility,
• an organisation, or
• an entire country or economic block.
2.1. National Productivity: The UK Productivity Conundrum
The sorts of factors driving productivity – which we outline later – tend to be linked to studies
that have been conducted at different levels of analysis:
• National, or macro level
• Organisational, or meso level
• Task or business process, or micro level.
We now summarise some important developments in the first two of these, beginning with the
national level.
2. Engaging with National and Organisational Productivity
8
Economies are seen as systems which convert work into the output of goods and services. For
the Office for National Statistics (ONS), productivity measures what this rate of conversion is. It
uses economic productivity measures, such as output per hour, output per job and output per
worker, for the whole economy and for a range of industries. Higher productivity as measured by
output per hour worked is seen as the key to rising living standards in advanced economies.
Productivity is one of two key factors determining the trend growth rate of an economy:
1. the pace at which a country can expand without pushing up prices
2. population growth
In addition to this general fragility of economies, the last few years has seen a return to the
debate about UK productivity. UK productivity has increased far more slowly than expected
since the financial crisis, contributing to lacklustre wage growth. By 2012 the Bank of England’s
International Economic Analysis Division signalled that UK labour productivity stood out as
being weak relative to historic episodes and was also weak compared to other countries in
the recent crisis3. The tendency for firms to retain labour, which few would see as a bad thing,
had a downside in that companies have been operating with a margin of spare capacity. Spain,
the USA and France were by then at or above their pre-crisis productivity levels, but labour
productivity in the UK, Germany, Italy and Norway remained below its level at the beginning of the
crisis.
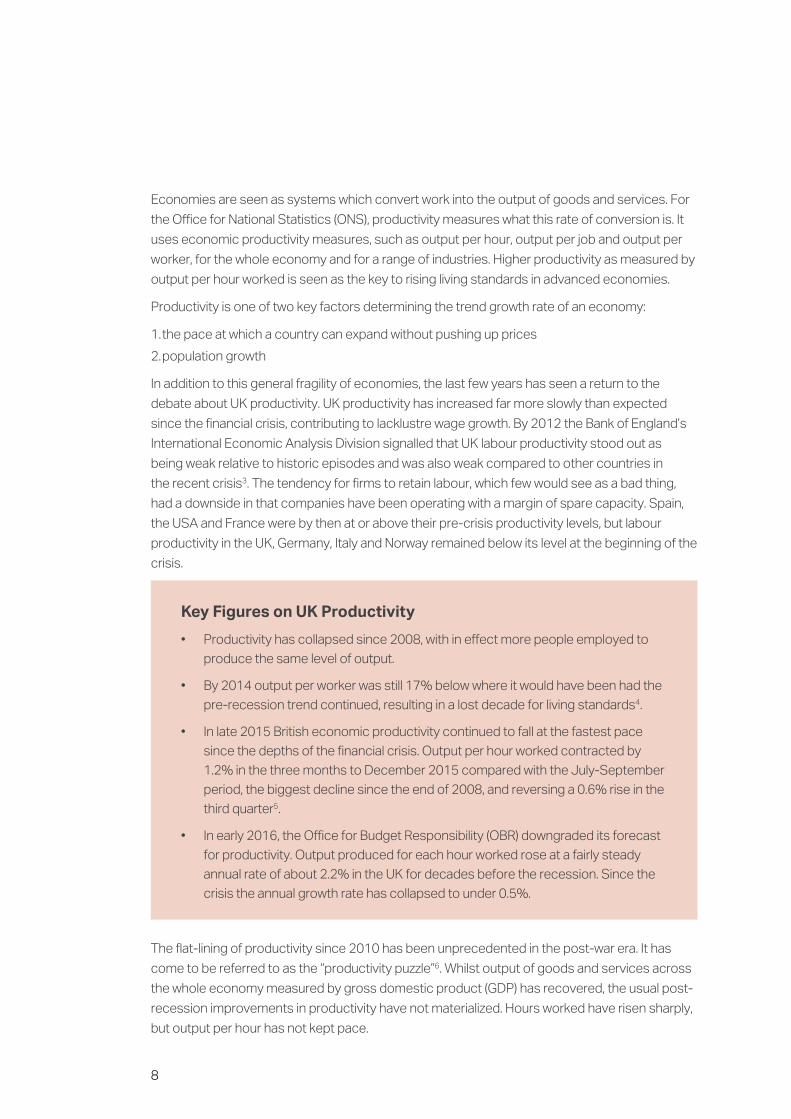
Key Figures on UK Productivity
• Productivity has collapsed since 2008, with in effect more people employed to
produce the same level of output.
• By 2014 output per worker was still 17% below where it would have been had the
pre-recession trend continued, resulting in a lost decade for living standards4.
• In late 2015 British economic productivity continued to fall at the fastest pace
since the depths of the financial crisis. Output per hour worked contracted by
1.2% in the three months to December 2015 compared with the July-September
period, the biggest decline since the end of 2008, and reversing a 0.6% rise in the
third quarter5.
• In early 2016, the Office for Budget Responsibility (OBR) downgraded its forecast
for productivity. Output produced for each hour worked rose at a fairly steady
annual rate of about 2.2% in the UK for decades before the recession. Since the
crisis the annual growth rate has collapsed to under 0.5%.
The flat-lining of productivity since 2010 has been unprecedented in the post-war era. It has
come to be referred to as the “productivity puzzle”6. Whilst output of goods and services across
the whole economy measured by gross domestic product (GDP) has recovered, the usual post-
recession improvements in productivity have not materialized. Hours worked have risen sharply,
but output per hour has not kept pace.
9
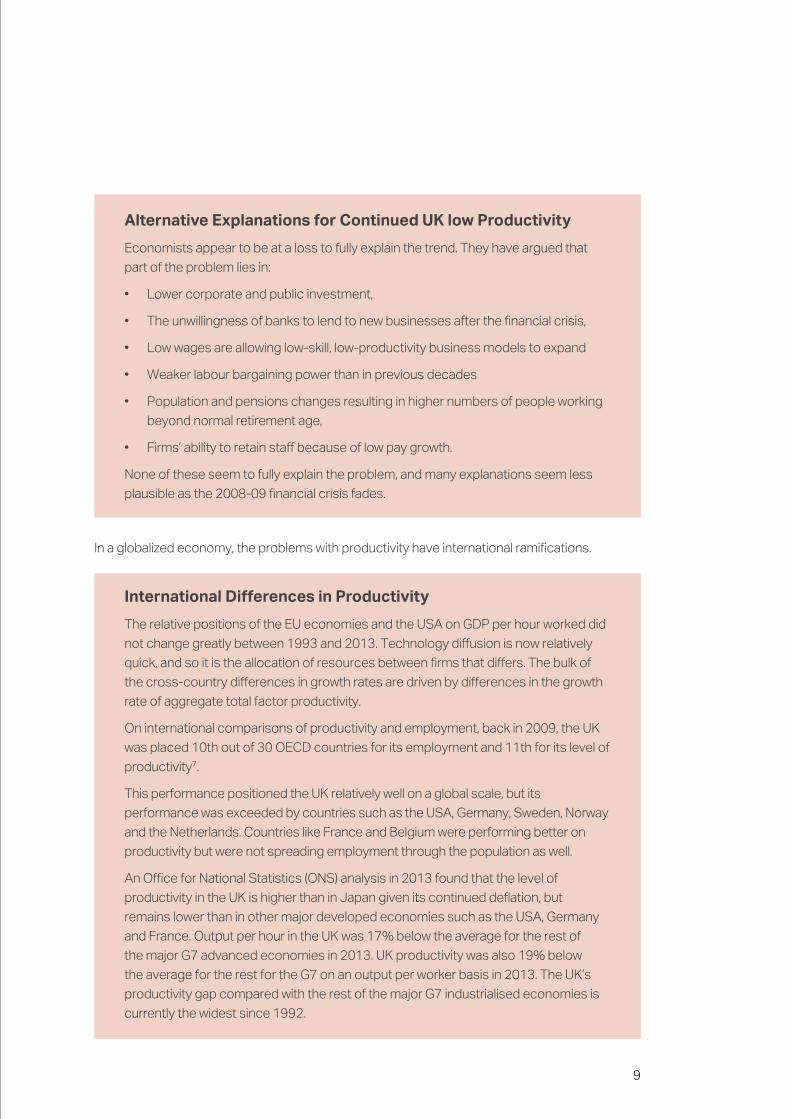
Alternative Explanations for Continued UK low Productivity
Economists appear to be at a loss to fully explain the trend. They have argued that
part of the problem lies in:
• Lower corporate and public investment,
• The unwillingness of banks to lend to new businesses after the financial crisis,
• Low wages are allowing low-skill, low-productivity business models to expand
• Weaker labour bargaining power than in previous decades
• Population and pensions changes resulting in higher numbers of people working
beyond normal retirement age,
• Firms’ ability to retain staff because of low pay growth.
None of these seem to fully explain the problem, and many explanations seem less
plausible as the 2008-09 financial crisis fades.
In a globalized economy, the problems with productivity have international ramifications.
International Differences in Productivity
The relative positions of the EU economies and the USA on GDP per hour worked did
not change greatly between 1993 and 2013. Technology diffusion is now relatively
quick, and so it is the allocation of resources between firms that differs. The bulk of
the cross-country differences in growth rates are driven by differences in the growth
rate of aggregate total factor productivity.
On international comparisons of productivity and employment, back in 2009, the UK
was placed 10th out of 30 OECD countries for its employment and 11th for its level of
productivity7.
This performance positioned the UK relatively well on a global scale, but its
performance was exceeded by countries such as the USA, Germany, Sweden, Norway
and the Netherlands. Countries like France and Belgium were performing better on
productivity but were not spreading employment through the population as well.
An Office for National Statistics (ONS) analysis in 2013 found that the level of
productivity in the UK is higher than in Japan given its continued deflation, but
remains lower than in other major developed economies such as the USA, Germany
and France. Output per hour in the UK was 17% below the average for the rest of
the major G7 advanced economies in 2013. UK productivity was also 19% below
the average for the rest for the G7 on an output per worker basis in 2013. The UK’s
productivity gap compared with the rest of the major G7 industrialised economies is
currently the widest since 1992.
10
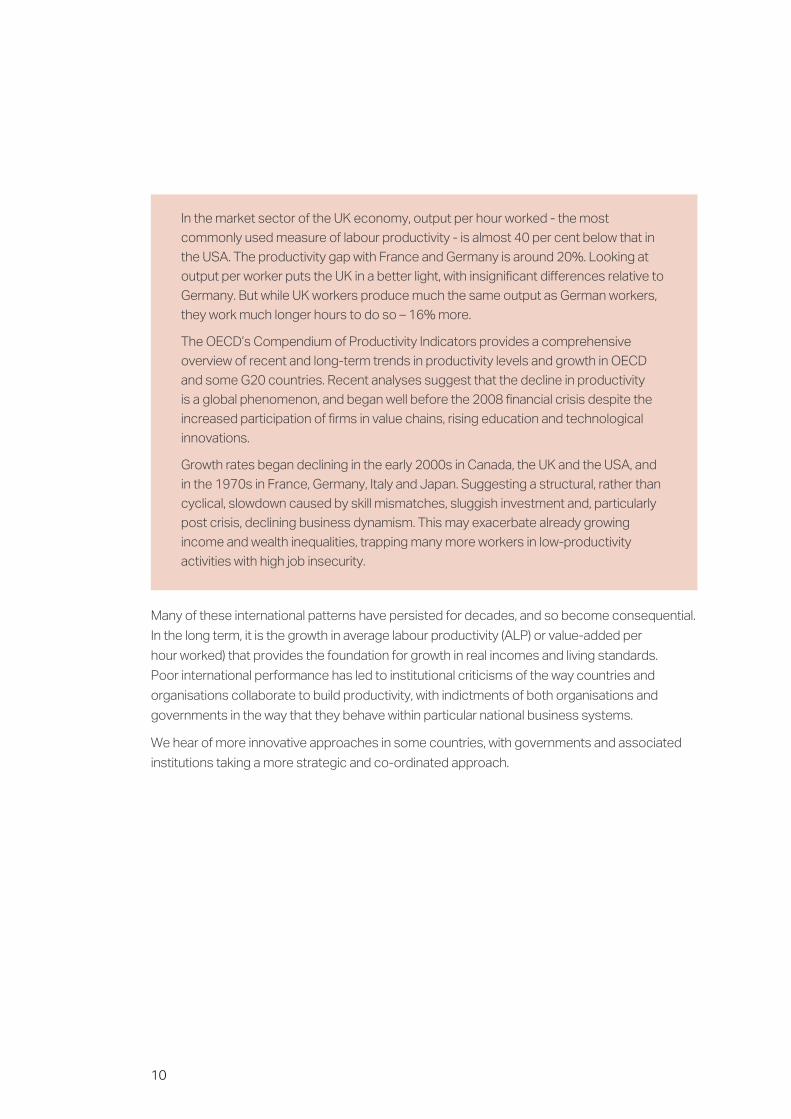
In the market sector of the UK economy, output per hour worked - the most
commonly used measure of labour productivity - is almost 40 per cent below that in
the USA. The productivity gap with France and Germany is around 20%. Looking at
output per worker puts the UK in a better light, with insignificant differences relative to
Germany. But while UK workers produce much the same output as German workers,
they work much longer hours to do so – 16% more.
The OECD’s Compendium of Productivity Indicators provides a comprehensive
overview of recent and long-term trends in productivity levels and growth in OECD
and some G20 countries. Recent analyses suggest that the decline in productivity
is a global phenomenon, and began well before the 2008 financial crisis despite the
increased participation of firms in value chains, rising education and technological
innovations.
Growth rates began declining in the early 2000s in Canada, the UK and the USA, and
in the 1970s in France, Germany, Italy and Japan. Suggesting a structural, rather than
cyclical, slowdown caused by skill mismatches, sluggish investment and, particularly
post crisis, declining business dynamism. This may exacerbate already growing
income and wealth inequalities, trapping many more workers in low-productivity
activities with high job insecurity.
Many of these international patterns have persisted for decades, and so become consequential.
In the long term, it is the growth in average labour productivity (ALP) or value-added per
hour worked) that provides the foundation for growth in real incomes and living standards.
Poor international performance has led to institutional criticisms of the way countries and
organisations collaborate to build productivity, with indictments of both organisations and
governments in the way that they behave within particular national business systems.
We hear of more innovative approaches in some countries, with governments and associated
institutions taking a more strategic and co-ordinated approach.
11
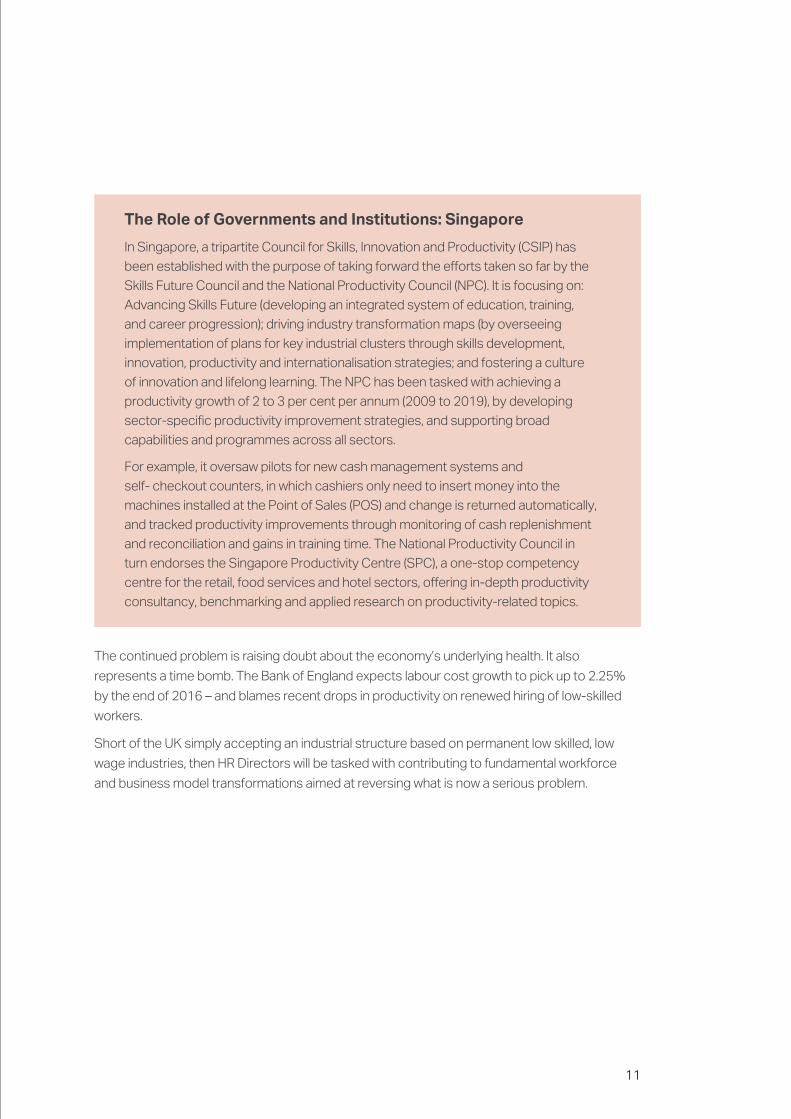
The Role of Governments and Institutions: Singapore
In Singapore, a tripartite Council for Skills, Innovation and Productivity (CSIP) has
been established with the purpose of taking forward the efforts taken so far by the
Skills Future Council and the National Productivity Council (NPC). It is focusing on:
Advancing Skills Future (developing an integrated system of education, training,
and career progression); driving industry transformation maps (by overseeing
implementation of plans for key industrial clusters through skills development,
innovation, productivity and internationalisation strategies; and fostering a culture
of innovation and lifelong learning. The NPC has been tasked with achieving a
productivity growth of 2 to 3 per cent per annum (2009 to 2019), by developing
sector-specific productivity improvement strategies, and supporting broad
capabilities and programmes across all sectors.
For example, it oversaw pilots for new cash management systems and
self- checkout counters, in which cashiers only need to insert money into the
machines installed at the Point of Sales (POS) and change is returned automatically,
and tracked productivity improvements through monitoring of cash replenishment
and reconciliation and gains in training time. The National Productivity Council in
turn endorses the Singapore Productivity Centre (SPC), a one-stop competency
centre for the retail, food services and hotel sectors, offering in-depth productivity
consultancy, benchmarking and applied research on productivity-related topics.
The continued problem is raising doubt about the economy’s underlying health. It also
represents a time bomb. The Bank of England expects labour cost growth to pick up to 2.25%
by the end of 2016 – and blames recent drops in productivity on renewed hiring of low-skilled
workers.
Short of the UK simply accepting an industrial structure based on permanent low skilled, low
wage industries, then HR Directors will be tasked with contributing to fundamental workforce
and business model transformations aimed at reversing what is now a serious problem.
12
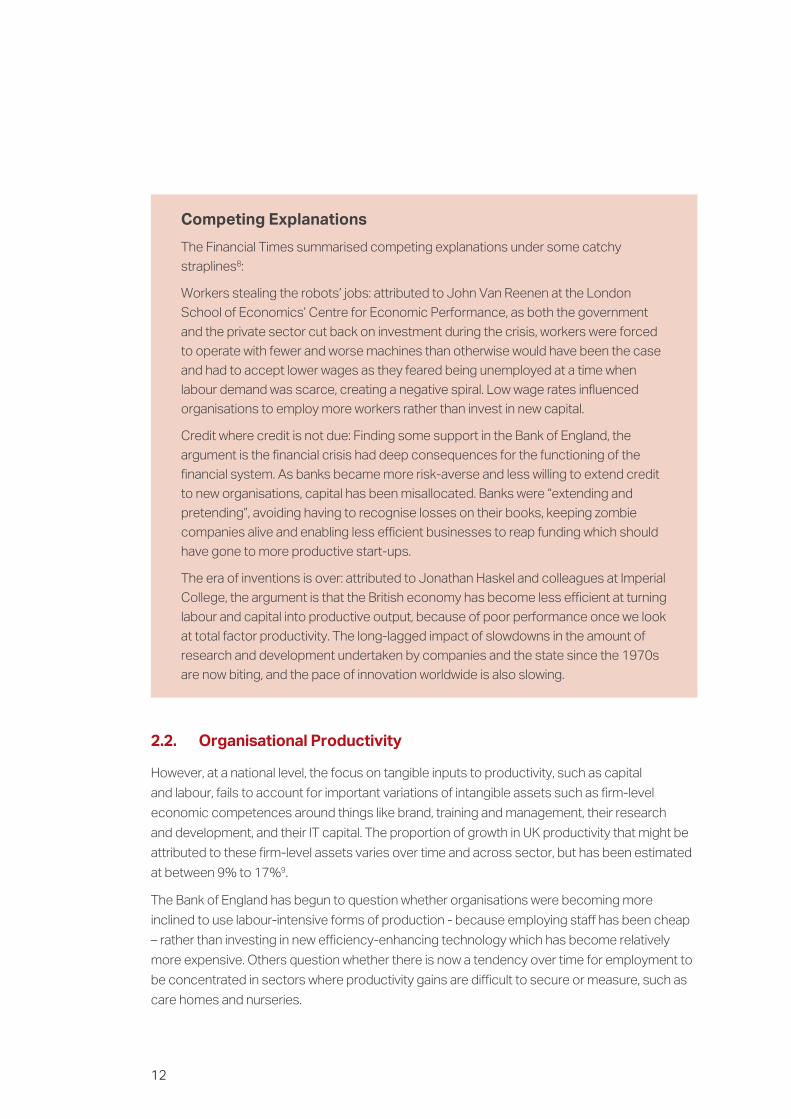
Competing Explanations
The Financial Times summarised competing explanations under some catchy
straplines8:
Workers stealing the robots’ jobs: attributed to John Van Reenen at the London
School of Economics’ Centre for Economic Performance, as both the government
and the private sector cut back on investment during the crisis, workers were forced
to operate with fewer and worse machines than otherwise would have been the case
and had to accept lower wages as they feared being unemployed at a time when
labour demand was scarce, creating a negative spiral. Low wage rates influenced
organisations to employ more workers rather than invest in new capital.
Credit where credit is not due: Finding some support in the Bank of England, the
argument is the financial crisis had deep consequences for the functioning of the
financial system. As banks became more risk-averse and less willing to extend credit
to new organisations, capital has been misallocated. Banks were “extending and
pretending”, avoiding having to recognise losses on their books, keeping zombie
companies alive and enabling less efficient businesses to reap funding which should
have gone to more productive start-ups.
The era of inventions is over: attributed to Jonathan Haskel and colleagues at Imperial
College, the argument is that the British economy has become less efficient at turning
labour and capital into productive output, because of poor performance once we look
at total factor productivity. The long-lagged impact of slowdowns in the amount of
research and development undertaken by companies and the state since the 1970s
are now biting, and the pace of innovation worldwide is also slowing.
2.2. Organisational Productivity
However, at a national level, the focus on tangible inputs to productivity, such as capital
and labour, fails to account for important variations of intangible assets such as firm-level
economic competences around things like brand, training and management, their research
and development, and their IT capital. The proportion of growth in UK productivity that might be
attributed to these firm-level assets varies over time and across sector, but has been estimated
at between 9% to 17%9.
The Bank of England has begun to question whether organisations were becoming more
inclined to use labour-intensive forms of production - because employing staff has been cheap
– rather than investing in new efficiency-enhancing technology which has become relatively
more expensive. Others question whether there is now a tendency over time for employment to
be concentrated in sectors where productivity gains are difficult to secure or measure, such as
care homes and nurseries.
13
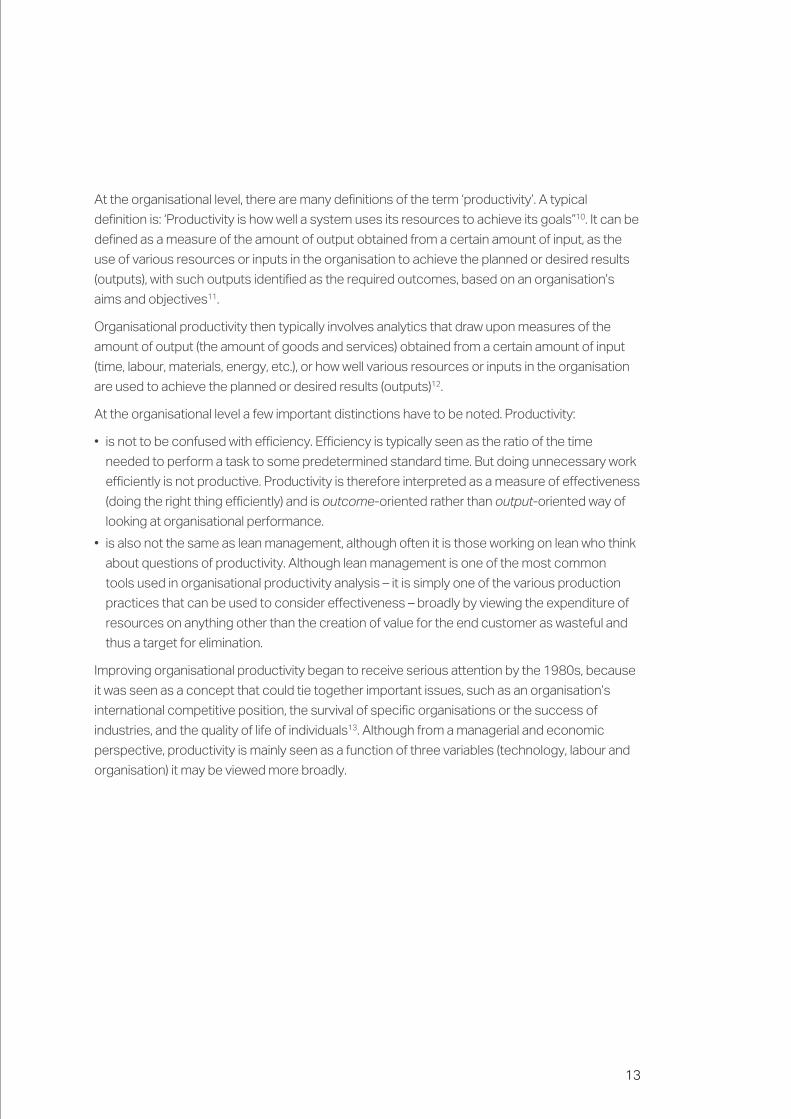
At the organisational level, there are many definitions of the term ‘productivity’. A typical
definition is: ‘Productivity is how well a system uses its resources to achieve its goals”10. It can be
defined as a measure of the amount of output obtained from a certain amount of input, as the
use of various resources or inputs in the organisation to achieve the planned or desired results
(outputs), with such outputs identified as the required outcomes, based on an organisation’s
aims and objectives11.
Organisational productivity then typically involves analytics that draw upon measures of the
amount of output (the amount of goods and services) obtained from a certain amount of input
(time, labour, materials, energy, etc.), or how well various resources or inputs in the organisation
are used to achieve the planned or desired results (outputs)12.
At the organisational level a few important distinctions have to be noted. Productivity:
• is not to be confused with efficiency. Efficiency is typically seen as the ratio of the time
needed to perform a task to some predetermined standard time. But doing unnecessary work
efficiently is not productive. Productivity is therefore interpreted as a measure of effectiveness
(doing the right thing efficiently) and is outcome-oriented rather than output-oriented way of
looking at organisational performance.
• is also not the same as lean management, although often it is those working on lean who think
about questions of productivity. Although lean management is one of the most common
tools used in organisational productivity analysis – it is simply one of the various production
practices that can be used to consider effectiveness – broadly by viewing the expenditure of
resources on anything other than the creation of value for the end customer as wasteful and
thus a target for elimination.
Improving organisational productivity began to receive serious attention by the 1980s, because
it was seen as a concept that could tie together important issues, such as an organisation’s
international competitive position, the survival of specific organisations or the success of
industries, and the quality of life of individuals13. Although from a managerial and economic
perspective, productivity is mainly seen as a function of three variables (technology, labour and
organisation) it may be viewed more broadly.
14
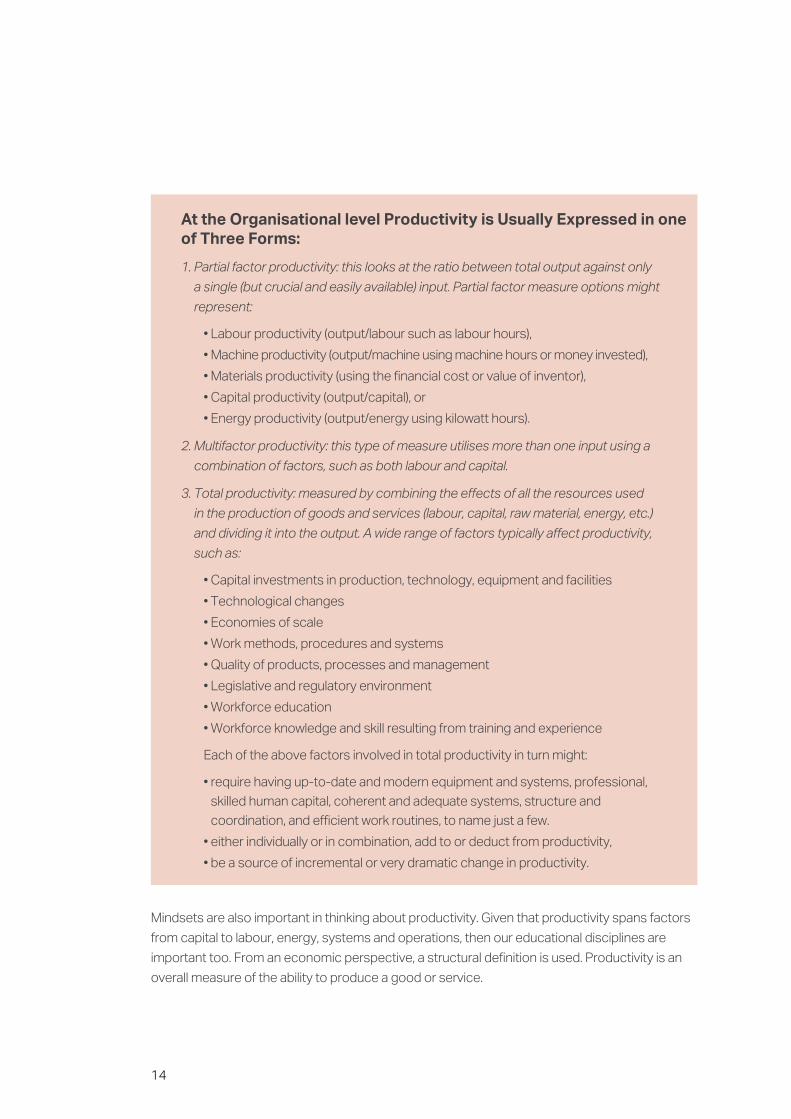
At the Organisational level Productivity is Usually Expressed in one of Three Forms:
1. Partial factor productivity: this looks at the ratio between total output against only
a single (but crucial and easily available) input. Partial factor measure options might
represent:
• Labour productivity (output/labour such as labour hours),
• Machine productivity (output/machine using machine hours or money invested),
• Materials productivity (using the financial cost or value of inventor),
• Capital productivity (output/capital), or
• Energy productivity (output/energy using kilowatt hours).
2. Multifactor productivity: this type of measure utilises more than one input using a
combination of factors, such as both labour and capital.
3. Total productivity: measured by combining the effects of all the resources used
in the production of goods and services (labour, capital, raw material, energy, etc.)
and dividing it into the output. A wide range of factors typically affect productivity,
such as:
• Capital investments in production, technology, equipment and facilities
• Technological changes
• Economies of scale
• Work methods, procedures and systems
• Quality of products, processes and management
• Legislative and regulatory environment
• Workforce education
• Workforce knowledge and skill resulting from training and experience
Each of the above factors involved in total productivity in turn might:
• require having up-to-date and modern equipment and systems, professional,
skilled human capital, coherent and adequate systems, structure and
coordination, and efficient work routines, to name just a few.
• either individually or in combination, add to or deduct from productivity,
• be a source of incremental or very dramatic change in productivity.
Mindsets are also important in thinking about productivity. Given that productivity spans factors
from capital to labour, energy, systems and operations, then our educational disciplines are
important too. From an economic perspective, a structural definition is used. Productivity is an
overall measure of the ability to produce a good or service.
15
2.3. Linking the National and Organisational Context
It is easy to reduce the management of productivity to simple strategies – for example seeing
two quick ways to increase productivity i.e. increase the numerator (output) or decrease
the denominator (input). Many a survey will show that CEOs and politicians alike often put
“productivity gains” at the top of their list of priorities – and closely associated with this list
will also be items such as new technology or cost reduction. What we link in our minds with
productivity tells us much about national cultures, our education, dominant management
functions, and the quality of our analyses.
In these days of human capital management, the various forms of human capital that become
important may in turn be broken down into different elements, such as human, social or
intellectual capital14.
HR Directors naturally focus on improving their organisation’s internal productivity, but the ability
of an organisation to improve its internal productivity is invariably dependent on external and
institutional developments.
It is not surprising that the HR function can find it hard to see how it can engage with the
business around this performance challenge.
A decade ago the Leitch Report demonstrated that productivity gains are largely associated
with the ability to increase intermediate and especially high level skills, and also being able to
improve skills at the lower level . At around the same time a Bank of England analysis determined
that around one fifth of the annual growth in the UK economy was due to improvements in
workforce skills, but gaps in productivity with other countries were more down to physical capital
stocks per hour worked, total factor productivity dimensions, rather than workforce skills levels16.
The role of skills in improving productivity is mainly seen in terms of the intangible benefits it has
on knowledge transfer and innovation, particularly :
• transfer of knowledge between firms, sectors and countries, whether through collaboration on
R&D or technical-problem solving by firms involved in supply-chains
• mobility of highly-qualified talent between firms, such as engineers and scientists.
• effective use of knowledge, whereby ideas and technologies generated elsewhere can be
enabled through an ‘absorptive capacity’.
As with markets, we can also see alternative ways in which the link between skills and
productivity might also develop. In an innovative piece of work for the former UK Commission for
Employment and Skills, an analysis by the German Foresight Company identified four potential
scenarios for the UK18.
16
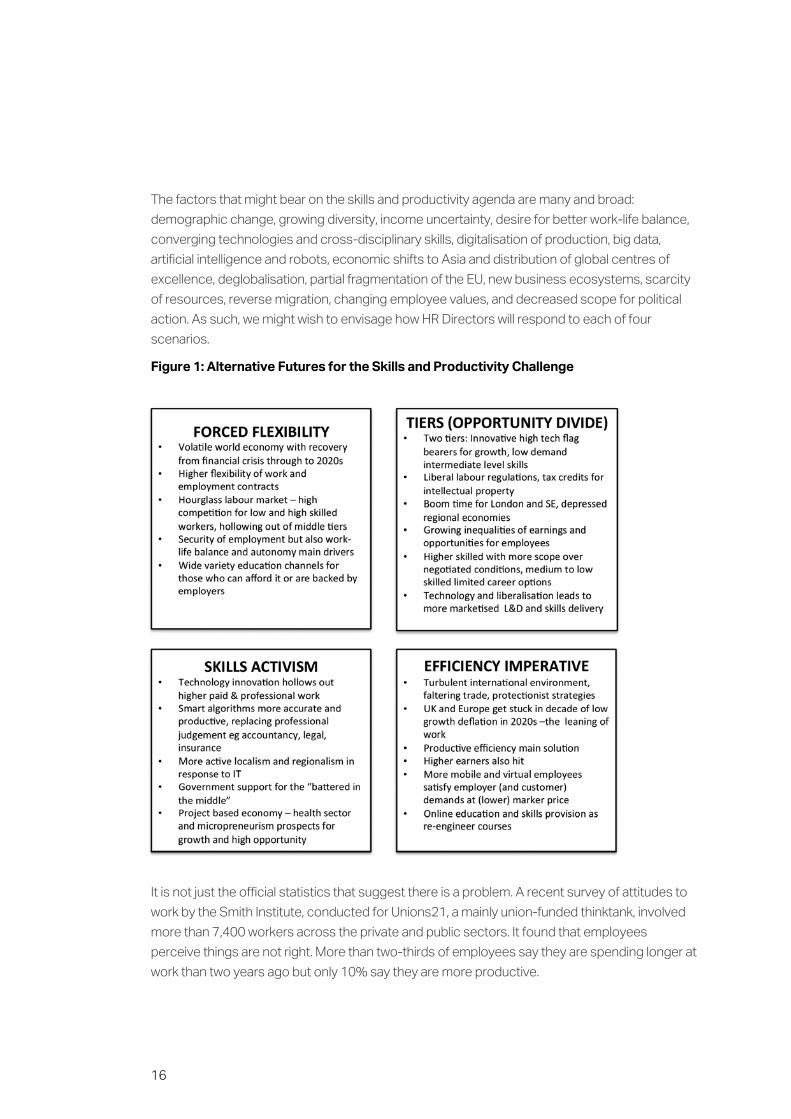
The factors that might bear on the skills and productivity agenda are many and broad:
demographic change, growing diversity, income uncertainty, desire for better work-life balance,
converging technologies and cross-disciplinary skills, digitalisation of production, big data,
artificial intelligence and robots, economic shifts to Asia and distribution of global centres of
excellence, deglobalisation, partial fragmentation of the EU, new business ecosystems, scarcity
of resources, reverse migration, changing employee values, and decreased scope for political
action. As such, we might wish to envisage how HR Directors will respond to each of four
scenarios.
Figure 1: Alternative Futures for the Skills and Productivity Challenge
It is not just the official statistics that suggest there is a problem. A recent survey of attitudes to
work by the Smith Institute, conducted for Unions21, a mainly union-funded thinktank, involved
more than 7,400 workers across the private and public sectors. It found that employees
perceive things are not right. More than two-thirds of employees say they are spending longer at
work than two years ago but only 10% say they are more productive.
17
The previous section makes it clear that in terms of total factor productivity:
• At the level of the organisation, understanding the true drivers of productivity can be a major
challenge. Even with today’s improvements in business analytics, often only a handful of
internal managers can grasp productivity in its totality.
• The idiosyncratic nature of each business model generally means that even within an
industrial sector recipe, each organisation often finds bespoke ways of delivering improved
productivity.
HR Directors, and their HR staff, therefore have to very quickly build their insight into the
business challenge, and the relative contribution that might be made by solutions that are
dependent upon people management and organisational behaviour.
As an HR Director, imagine a journalist, a CEO, a politician, or an employee was interviewing you
about your organisation’s future prospects in terms of productivity. How would you answer the
following questions?
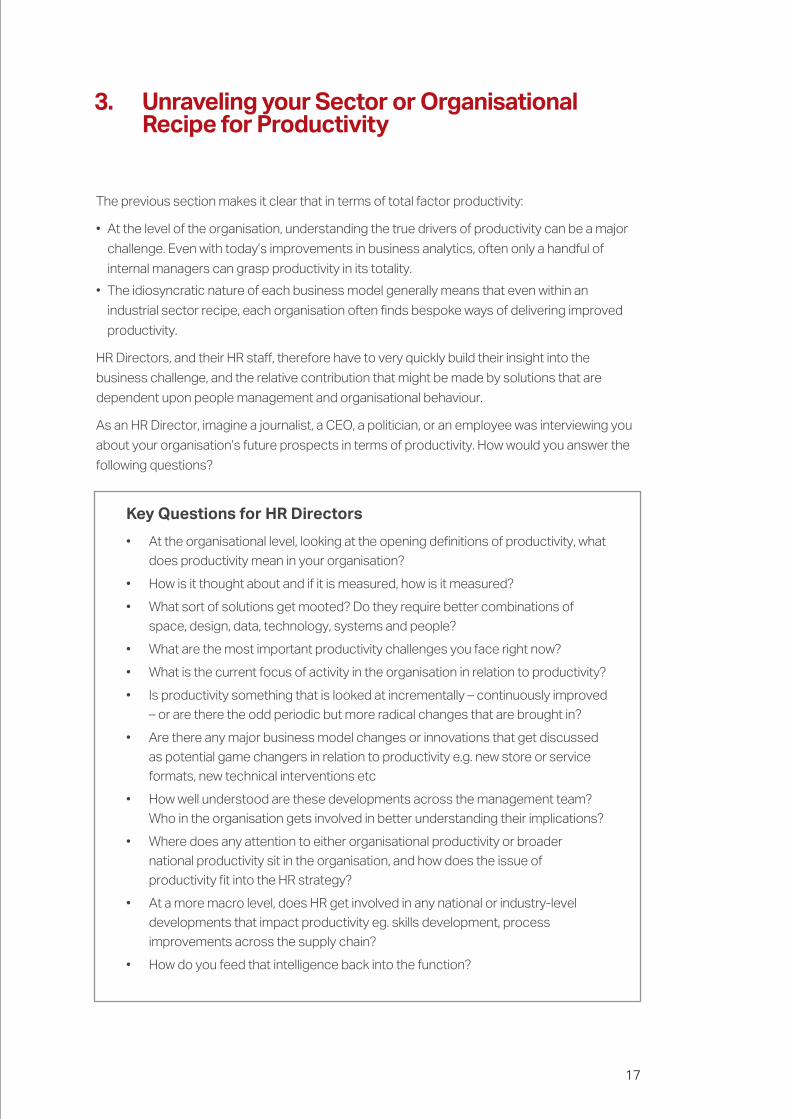
Key Questions for HR Directors
• At the organisational level, looking at the opening definitions of productivity, what
does productivity mean in your organisation?
• How is it thought about and if it is measured, how is it measured?
• What sort of solutions get mooted? Do they require better combinations of
space, design, data, technology, systems and people?
• What are the most important productivity challenges you face right now?
• What is the current focus of activity in the organisation in relation to productivity?
• Is productivity something that is looked at incrementally – continuously improved
– or are there the odd periodic but more radical changes that are brought in?
• Are there any major business model changes or innovations that get discussed
as potential game changers in relation to productivity e.g. new store or service
formats, new technical interventions etc
• How well understood are these developments across the management team?
Who in the organisation gets involved in better understanding their implications?
• Where does any attention to either organisational productivity or broader
national productivity sit in the organisation, and how does the issue of
productivity fit into the HR strategy?
• At a more macro level, does HR get involved in any national or industry-level
developments that impact productivity eg. skills development, process
improvements across the supply chain?
• How do you feed that intelligence back into the function?
3. Unraveling your Sector or Organisational Recipe for Productivity
18
• What type of expertise does HR wield in this debate e.g. into organisation design,
job design, motivation and skills development and resourcing?
• Who in HR deals with questions of productivity – the HRBPs? Which Centres of
Expertise? Project lead resource?
• What organisational and HR policy agendas will productivity trigger? Skills and
careers? Engagement? Performance Management?
• Are these agendas helpful agendas or counter-productive?
How must HR Directors engage with this problem? They must help unravel the productivity
recipe as it applies to their firm or sector.
We know that at the level of the firm, understanding the true drivers of productivity can be a
major challenge. Even with today’s improvements in business analytics, often only a handful of
internal managers can grasp productivity in its totality.
We signal the need for HR Directors to be able to articulate the unique complexity of their
organisation’s challenge – or strategic solution - by giving some examples of the productivity
challenge when productivity:
• Is Embedded In Service Formats and Offerings
• Is Dominated By Return On Capital Employed
• Is Dependent On The Surrounding Industrial and Institutional Structure
• Targets Are Beyond Any Historical Precedent
• Requires A Shift In Thinking About The Best Form Of Flexibility
• Depends On Transfer Of Costs Between Organisation and Consumer
• Depends On Transfer Of Costs Between Organisation and Society
3.1. When Productivity is Embedded in Service Formats and Offerings
We use the example of retail and the supermarket sector. By the mid-2000s attention was
being given to the general impacts of larger supermarkets and retail formats, changing
industry structure, operating practices and trading-partner relationships based on information
technology, but relatively little was known about how these changes affected productivity at
the store level. Studies began to show that productivity advantages could be traced to store
format, service offerings, and disruptions associated with remodeling, as did the possession of
warehouse, super warehouse, and super-centre stores, and stores without a full-service. But
developments continue apace, and supermarkets now face a different productivity equation19.
19
When concern over poor levels of UK service productivity were growing in the early 2000s,
research by the Institute for Fiscal Studies (IFS), University College London (UCL) and Advanced
Institute for Management (AIM) began to explore the wealth of data in the supermarket sector
at the firm and establishment level. It showed the complexity of factors at play. To the extent
that price is felt to accurately reflect the quality and cost of producing a good, retail productivity
is thought of in terms of sales or value added per worker or per hour worked, but also factors
in land and capital usage. Sales are calculated on the quantity sold times the price at which
it was sold. Value added is output minus the cost of the goods sold and other ‘intermediate
inputs’ such as electricity. If labour markets function well, then wages paid to workers are
assumed to accurately reflect an employee’s contribution to each additional pound of sales.
If property markets function well, then the rental value of a piece of land reflects its marginal
revenue product, again will be heavily influenced by the quality and location of the land. In reality
productivity was found to be driven by a complex mix of urban characteristics, consumer
preferences and market hegemony versus competitive rivalries20.
Moving this debate forward to today, even with the advantage now of improved analytics and
store-level data, the need to understand complex trade-offs remains. Developments in digital
technologies - spanning e-commerce, mobile-commerce, web analysis, testing, development
and maintenance, social media, smart phones and apps, use of geo-locational social networks,
and in-store digital ordering - have impacted many retailing and service business models.
Growth of what is called the “packaged internet” – where the fragmentation of digital channels
across apps, smart TVs, tablets, e-readers, gaming devices and other emerging platforms are
both eroding the dominance of websites but also requiring co-ordinated management of these
touch points, is creating the opportunity for new service models. They need business models
that not only offer multi-channel shopping, but a system of distributed commerce across
multiple touch points.
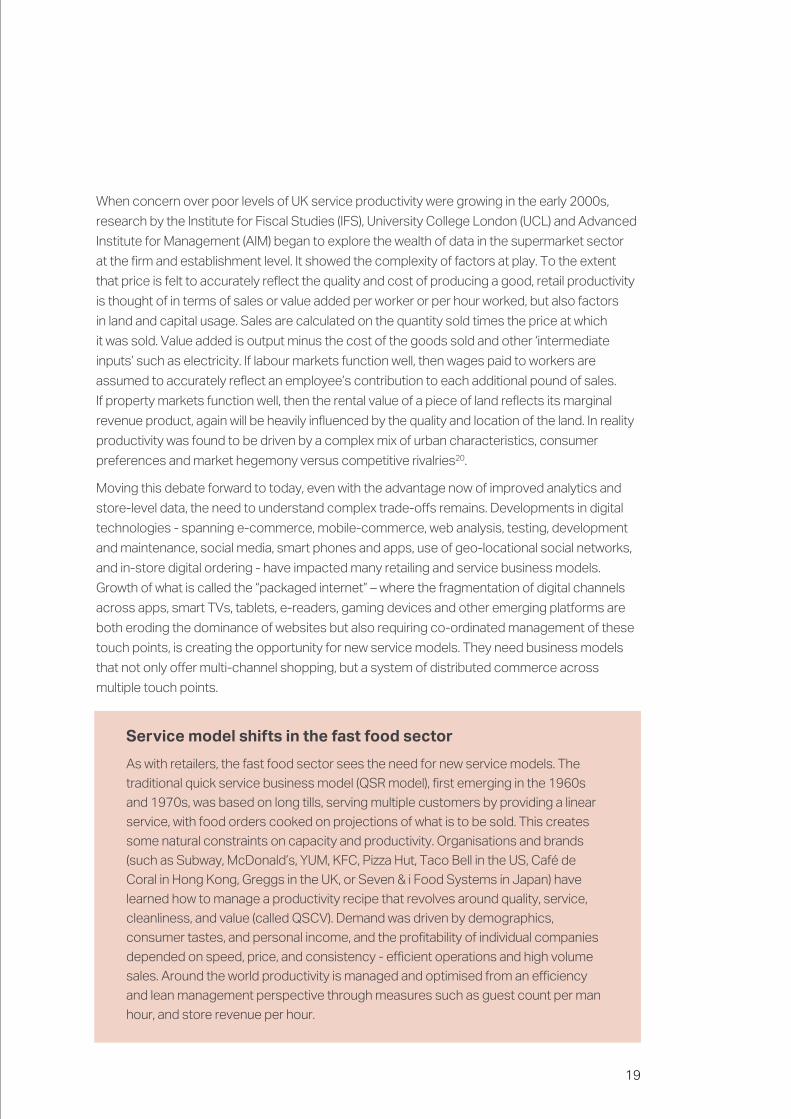
Service model shifts in the fast food sector
As with retailers, the fast food sector sees the need for new service models. The
traditional quick service business model (QSR model), first emerging in the 1960s
and 1970s, was based on long tills, serving multiple customers by providing a linear
service, with food orders cooked on projections of what is to be sold. This creates
some natural constraints on capacity and productivity. Organisations and brands
(such as Subway, McDonald’s, YUM, KFC, Pizza Hut, Taco Bell in the US, Café de
Coral in Hong Kong, Greggs in the UK, or Seven & i Food Systems in Japan) have
learned how to manage a productivity recipe that revolves around quality, service,
cleanliness, and value (called QSCV). Demand was driven by demographics,
consumer tastes, and personal income, and the profitability of individual companies
depended on speed, price, and consistency - efficient operations and high volume
sales. Around the world productivity is managed and optimised from an efficiency
and lean management perspective through measures such as guest count per man
hour, and store revenue per hour.
20
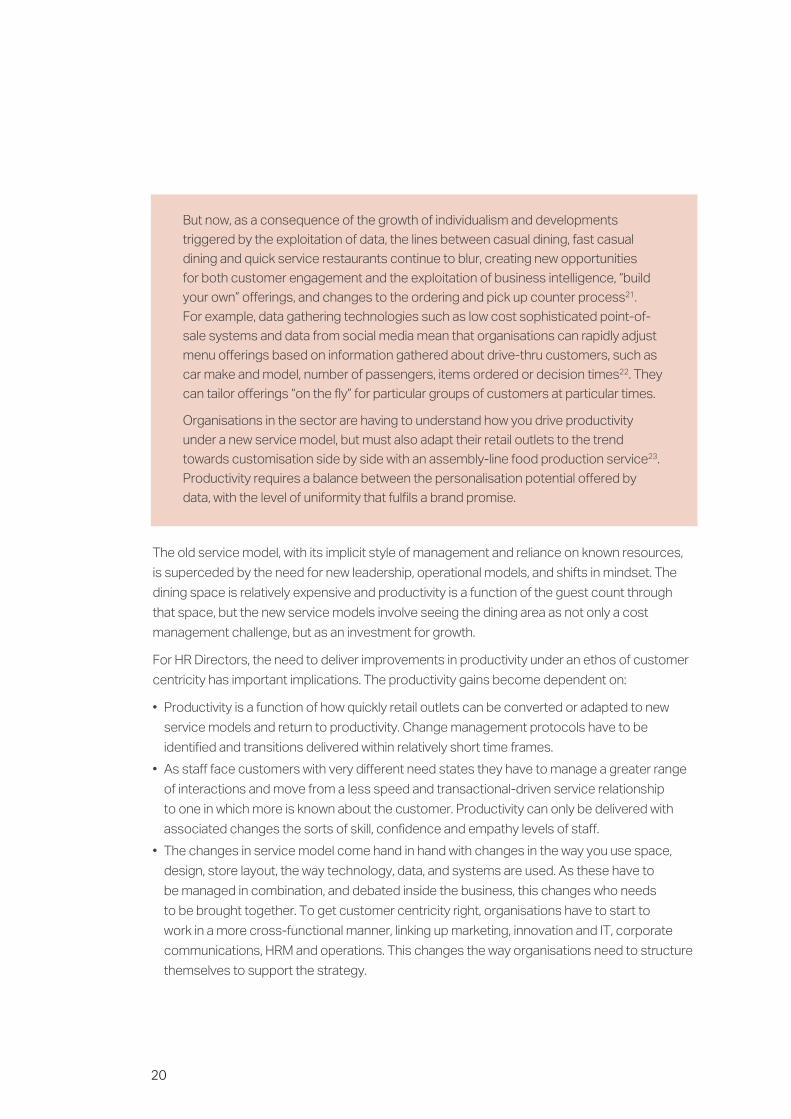
But now, as a consequence of the growth of individualism and developments
triggered by the exploitation of data, the lines between casual dining, fast casual
dining and quick service restaurants continue to blur, creating new opportunities
for both customer engagement and the exploitation of business intelligence, “build
your own” offerings, and changes to the ordering and pick up counter process21.
For example, data gathering technologies such as low cost sophisticated point-of-
sale systems and data from social media mean that organisations can rapidly adjust
menu offerings based on information gathered about drive-thru customers, such as
car make and model, number of passengers, items ordered or decision times22. They
can tailor offerings “on the fly” for particular groups of customers at particular times.
Organisations in the sector are having to understand how you drive productivity
under a new service model, but must also adapt their retail outlets to the trend
towards customisation side by side with an assembly-line food production service23.
Productivity requires a balance between the personalisation potential offered by
data, with the level of uniformity that fulfils a brand promise.
The old service model, with its implicit style of management and reliance on known resources,
is superceded by the need for new leadership, operational models, and shifts in mindset. The
dining space is relatively expensive and productivity is a function of the guest count through
that space, but the new service models involve seeing the dining area as not only a cost
management challenge, but as an investment for growth.
For HR Directors, the need to deliver improvements in productivity under an ethos of customer
centricity has important implications. The productivity gains become dependent on:
• Productivity is a function of how quickly retail outlets can be converted or adapted to new
service models and return to productivity. Change management protocols have to be
identified and transitions delivered within relatively short time frames.
• As staff face customers with very different need states they have to manage a greater range
of interactions and move from a less speed and transactional-driven service relationship
to one in which more is known about the customer. Productivity can only be delivered with
associated changes the sorts of skill, confidence and empathy levels of staff.
• The changes in service model come hand in hand with changes in the way you use space,
design, store layout, the way technology, data, and systems are used. As these have to
be managed in combination, and debated inside the business, this changes who needs
to be brought together. To get customer centricity right, organisations have to start to
work in a more cross-functional manner, linking up marketing, innovation and IT, corporate
communications, HRM and operations. This changes the way organisations need to structure
themselves to support the strategy.
21
• Customer centricity changes the relationship between the store environment and its service
platforms, staff behaviours, the way customers arte treated, the way in which teams should be
organized to ensure customer service is delivered, and even staffing patterns.
• The new multi-role staff models and the new ways of working impact the staff employee value
proposition.
In the adult gaming and leisure industry the experience is similar to that of supermarkets, with
organisations finding themselves operating across multiple businesses and retail channels.
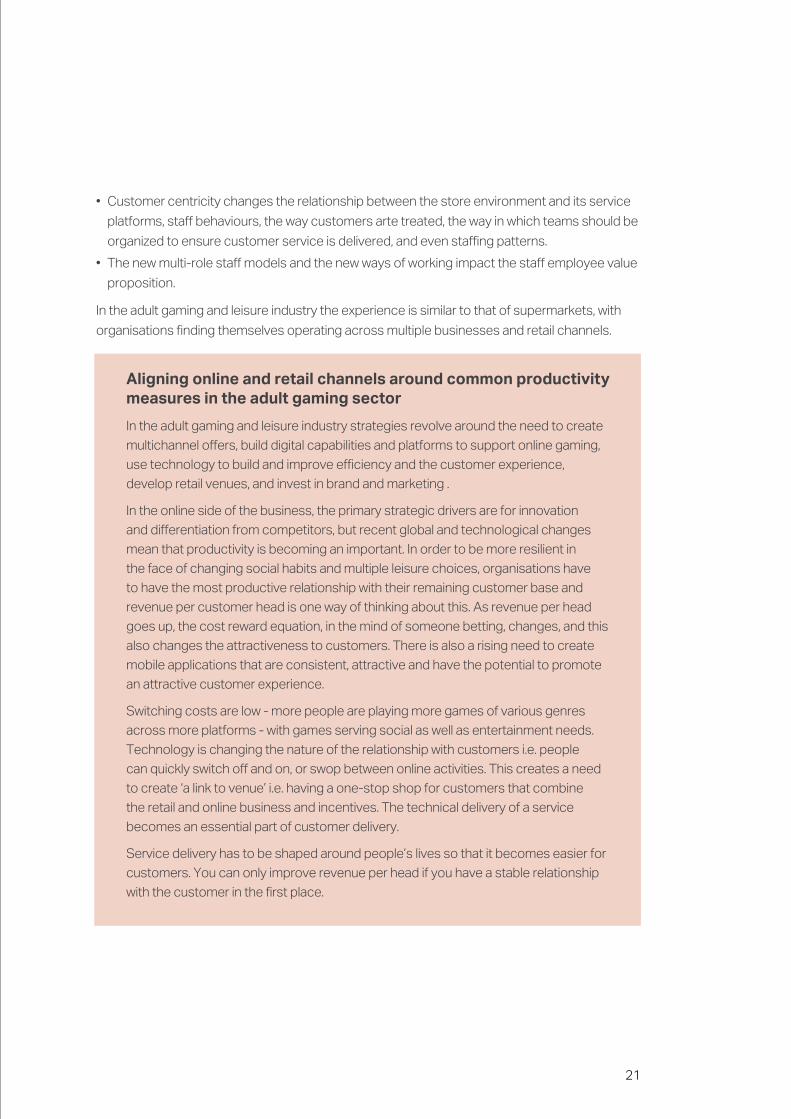
Aligning online and retail channels around common productivity measures in the adult gaming sector
In the adult gaming and leisure industry strategies revolve around the need to create
multichannel offers, build digital capabilities and platforms to support online gaming,
use technology to build and improve efficiency and the customer experience,
develop retail venues, and invest in brand and marketing .
In the online side of the business, the primary strategic drivers are for innovation
and differentiation from competitors, but recent global and technological changes
mean that productivity is becoming an important. In order to be more resilient in
the face of changing social habits and multiple leisure choices, organisations have
to have the most productive relationship with their remaining customer base and
revenue per customer head is one way of thinking about this. As revenue per head
goes up, the cost reward equation, in the mind of someone betting, changes, and this
also changes the attractiveness to customers. There is also a rising need to create
mobile applications that are consistent, attractive and have the potential to promote
an attractive customer experience.
Switching costs are low - more people are playing more games of various genres
across more platforms - with games serving social as well as entertainment needs.
Technology is changing the nature of the relationship with customers i.e. people
can quickly switch off and on, or swop between online activities. This creates a need
to create ‘a link to venue’ i.e. having a one-stop shop for customers that combine
the retail and online business and incentives. The technical delivery of a service
becomes an essential part of customer delivery.
Service delivery has to be shaped around people’s lives so that it becomes easier for
customers. You can only improve revenue per head if you have a stable relationship
with the customer in the first place.
22
In the physical retail outlets, however, there are a different set of productivity
drivers. There is a move towards cashless delivery, taking out the physical demands
of working with coinage, which in turn creates the opportunity to improve the
experience and intensity of gaming activity, and open up new uses of space and
design, and new business offerings around food and service, that also serve to
increase revenue per customer head.
These shifts impact the HR function. Not only does it need the change management
skills to carry out the business transformations, and assess if the organisation has
the managers with the skills to deliver these changes, but it must train and upskill
technical staff, look at the performance management systems and processes with
an eye to linking objectives to productivity outcomes, and enable collaboration
internally with other departments.
3.2 When Productivity is Dominated by Return on Capital Employed
The Oil and Gas sector now faces an environment that combines considerable opportunity
combined with a high degree of volatility and risk. Competitive pressures are forcing
management to explore options for fundamental change to improve the overall productivity and
efficiency of the businesses under their control24. The capital intensity of the industry naturally
focuses attention away from labour productivity to return on capital employed (ROCE).
Productivity in the Oil Sector25
There are strong links between productivity, innovation and growth. But because of
the high capital costs in some industries, and the increasingly collaborative nature of
many operations, there are often now mutual gains from productivity.
We use the example of the oil sector. The sector includes exploration, extraction,
refining, transporting, marketing and retailing.
There are many connections between the various end-to-end participants within
the oil and gas value chain across upstream and downstream activities, as well as
between service providers such as construction, logistics, material, engineering and
drilling. There is pressure to lift productivity on megaprojects, across operations, and
in the back office. On megaprojects, productivity can be improved through better
flexibility, problem-solving, risk management, and use of lessons learned. Innovation
and productivity in design and production processes are important.
Given the high levels of investment in the industry, capital productivity – and return on
capital employed (ROCE) – is important. Separate to ROCE, there are traditional gains
in labour productivity.
23
In recent times the industry has focused on increasing shareholder returns via
throughput gains and increased production volumes. However, the collapse in oil
price, coupled with the operation of increasingly complex projects, is leading to a
broader set of actions to address the issue of productivity.
Since 2010, investments have grown by approximately 10% a year, mainly in the
exploration and production area. However, ROCE has declined steadily for most
organisations, ranging from 5 to 10% across the various component activities of
the value chain, and the recent drop in oil prices will compound the productivity
challenge. The challenge, especially for those with integrated business model,
refiners, and upstream companies, is to maximise production whilst minimising risks.
This requires a complex balance between:
1. increasing oil and gas throughput, tracking and aligning this with macroeconomic
changes and changes in demand more closely
2. efficiency gains in project execution, through better selection criteria and use
of gate posts, and alterations in the project economic model, spurring greater
productivity from subcontractors
3. portfolio management (how they decide on future projects, and how they
manage existing operations depending on their performance i.e. stopping or
selling unprofitable operations)
4. managing and reducing operational costs
5. building an internal culture that focuses on efficiency and productivity
3.3. When Productivity is Dependent on the Surrounding Industrial and Institutional Structure
In some other industrial sectors – such as the aerospace industry - a long-held pre-eminence of
the UK is now seen to be under threat. The good news is that more than 29,000 new passenger
and freight aircraft valued at nearly $4.4tn are expected to be built, but this is set against a
reality of an increasing backlog of commercial fixed wing aircraft. The aerospace industry faces
the challenge of building more aircraft and bringing them to market within a shorter time. New
planes have to be lighter, faster and more efficient. There needs to be dramatic increases in the
complexity of aircraft and the volume of data during the whole product life cycle. This creates
demands for productivity across the whole value chain, from the application of industrial
software and automation technologies and shared development work in product design, to
increases in production rates and improvements in production planning reorganising product
development in order to synchronise it with manufacturing at an early stage on a global scale,
by extending capacities, improving processes in engineering and execution, and through to
services. There are also different priorities built into the strategy, with drives for productivity
balanced with other considerations such as innovation, more customer centric design, and
collaborative working.
24
Productivity Demands on Supply Chain in the Aerospace Sector
Demands on productivity are being ramped up by the leading manufacturers Airbus,
Boeing, GE-Pratt & Whitney and Rolls-Royce, even before they in turn have to cope
with new competitors from China. In the UK Airbus has increased production rates
for A320 wing sets from 35 a few years ago to 42 per month with a target of 50 per
month by 2018. In a recent sector study, although many UK aerospace engineers
have regarded UK aerospace manufacturers as ‘best in class’ in terms of productivity
in the past, 62% now believe that their companies face productivity issues that
threaten the UK’s position as a global aerospace superpower26. Critical mass in the
supply chain is a major element of productivity, along with skills. 53% of companies
experience difficulty with recruiting people trained in the disciplines they need.
The production rate ramp-up on some new aircraft platforms threatens the ability
of many forms to cope. Only 13% of aerospace engineers believe that the UK’s
SMEs are sufficiently capable of coping with the growing demands of global prime
contractors such as Airbus and Rolls-Royce.
Another setting in which productivity becomes highly dependent on surrounding institutions
and industrial sector is the nuclear industry. The Nuclear Energy Institute notes that 30
countries worldwide are operating 444 nuclear reactors for electricity generation, and 63 new
nuclear plants are under construction in 15 countries.
Productivity in the Nuclear Industry: Transferring and Learning from Different Productivity Mindsets
In a major nuclear plant there are typically two sides of the business - the project
decommissioning side (i.e. project managing and engineering and operational
plant elements) – and the project management side. These two elements look at
productivity differently. This is important, because as the balance of activity shifts
from decommissioning activities to new build activities, so too does the mindset
used to think about productivity.
In general terms productivity can be thought of in terms of the amount of nuclear
material that can be reprocessed (i.e. the conversion rate). It can also be thought of
in terms of time - the industry must constantly search for ways in which it can safely
decommission at a faster rate as currently a 150 year span of activity is likely to be
needed.
25
At plant level in the decommissioning businesses, safety is the first priority activity,
but this must be closely followed by productivity. In order to have efficient steady
running of the plants, there has to be downtime (outages) during which things have
to be done to maintain the health of the systems. If the health of the systems is
not maintained, this impacts productivity significantly. There are counterbalancing
drivers in the industry to ensure safety, and so productivity gains are always going
to be incremental. The HR function becomes involved in the management of
organisational culture and incentive systems and exposing people to experiences
from other industries and sectors. so that both managers and staff ensure that things
are done safely, but are also focused on efficiency and productivity. Given high levels
of unionisation, they have to manage generic messages around the IR/ER context in
order to change working practices.
In contrast, the need for major plant developments and business transitions is
driven from a different mindset, more in terms of schedule and cost targets. Under
competitive pressure, and from experience in other civil projects, contractors have
learned how to improve working standards and better construct on time and on
budget. But it is also clear that the skillset for collaborative working across partners
and projects, and driving productivity across partners, is a major contributor to
productivity.
The productivity debate, and the pace at which gains can be made, will be very
dependent on the development of new learning and new skillsets:
• Learning from lean manufacturing techniques in the project management
industry as they apply to productivity in production and engineering
• Understanding the links and trade-offs between innovation and productivity
• The skills and competence of HR – most productivity discussion takes place
within the operations sphere, so the HR function must now have the ability
to operate across the operations interface, meaning more people in the HR
function who have the necessary capability or skills
• Other skillsets become important for the HR function to enable this cross-
functional working, such as organisational design, intelligent customer skills, and
relationship management.
26
3.4. When Productivity Targets are Beyond any Historical Precedent
Similar productivity pressures are seen in the public sector. In the UK, in order to close the gap
between need for services and available funding, the National Health Service (NHS) is having to
pursue the most ambitious programme of productivity improvement since its foundation27. The
productivity gains have to be achieved at a time of major reorganisation of the NHS. It must also
resolve conflicts between the need to deliver services with smaller budgets whilst responding
to a range of quality recommendations from various recent public enquiries. From 1997 to
2009 spending on the NHS, as a percentage of gross domestic product (GDP) rose from
around 5.2% to just over 8% - the highest proportion since 1948. Since then, marginal 0.1% real
increases per year have not matched growth in service demand.
The Productivity Challenge in the National Health Service
Current planning assumptions foresee a continued squeeze on resources until
2021/2, with NHS spending falling from its peak of 8% of GDP (GDP in 2009 to
just over 6% by 2021, equivalent to spending in 2003. Under a scenario of no real
funding growth, meeting the growing demands and expectations on the service
requires productivity improvements of up to 6% per year, whilst also coping with
future increases in pay, the extra costs of capital to improve the estate, and the
costs of significant reductions in waiting times. The Quality, Innovation, Productivity
and Prevention (QIPP) initiative identified the need for £20 billion efficiency savings.
Closing the ‘income–expenditure gap’ at local level also requires significant efforts to
increase income (rather than just reduce costs). Since then a funding gap of £30bn
between 2013/14 and 2020/21 has been signalled, on top of the £20bn of efficiency
savings already being met. Historically, productivity across the UK NHS, as measured
by the Office for National Statistics (ONS), has averaged around 0.4% a year between
1995 and 2010. The traditional productivity policy levers and internal cost-reduction
efforts - such as freezing pay, salami slicing of budgets and bearing down on the tariff
– are not seen as sustainable over the next few years, and local health economies are
being asked to think more collectively about how to provide services within budget.
3.5. When Productivity Requires a Shift in Thinking About the Best Form of Flexibility
It is also evident that in order for many productivity initiatives to stand a chance of working,
organisations will have to put employee engagement at the heart of the issue. This entails using
Employee-centric flexibility, rather than Employer-centric ways of thinking about flexibility.
27
Building a Productivity Culture in Postal Services: What Price Flexibility?
A recent study of the productivity challenge for the postal and logistics sector28
shows how the sector faces the need for changes in product mix. In postal services
productivity is driven mainly through:
• improvements in quality and service standards;
• adoption of sorting automation;
• network rationalisation of sorting centres, delivery offices and transport links; and
• efforts at organisation development and the development of a productivity
culture.
However, the potential for productivity growth from technology and network
consolidation has lessened and the opportunity for further big productivity gains
from technology is slowing.
Flexibility lies at the heart of any future productivity culture (defined as an
understanding in the workforce that higher productivity is the key to sustainable
real term wage rises) in the B2C parcels market. Employer-centric flexibility, where
flexibility is defined in the context of workload variability and labour costs and
input, has become increasingly common, with growth of short term (though often
renewable) work contracts, and the introduction of greater sub-contracting, and zero
hour contracts.
The problem is that productivity gains fall foul not only of the short-term gains over
poorer long-term returns problem, but even the short-term gains may produce only
temporary productivity effects.
In an environment in which there is erosion of employment security, meaningful
progress on productivity can also only be made if related improvements can be
made in the industrial relations environment, as well as understanding how job
design, financial participation, formal labour contracts can be linked to productivity.
Attention is turning again to the need to develop the organisation by managing
residual labour practices and building a productivity culture. The pursuit of
productivity means that HR needs to think about flexibility in different ways – shifting
from an employer-centric to a more employee-centric analysis. In practice, this
means looking at the employment ‘deal’ that workers should be entitled to expect
(the psychological contract) alongside the output contract.
It also suggests that within any framework that enables businesses to be efficient, profitable,
and with growing productivity, employee-centric flexibility requires an equitable distribution of
benefits, contractual forms and remuneration incentives that recognise work life balance and
different life stage ambitions.
28
3.6. When Productivity Depends on Transfer of Costs Between Organisation and Consumer
The supermarket sector is also a good example to remind us that productivity gains can be
deceptive, as gains in one part of the system may simply transfer inefficiencies to another part
of the system.
The Transfer of Costs Issue: Who Wins with Supermarkets?29
Sector-level productivity data show that supermarkets are facing a significant fall
in productivity in order to keep their online customers happy. In supermarkets, if
customers scan their shopping, this is a productivity gain as they need to employ
fewer people for the same amount of goods passing through the checkouts. But it
is a productivity loss for the customer, as they waste time performing the task less
efficiently than a full-time member of staff. At the same time, online retail results
in staff trundling up and down aisles filling trolleys and preparing the orders for
customers, who shop online and have their groceries delivered. Filling somebody
else’s shopping order is not a skilled task. This represents a productivity gain for
customers, who spend 15 minutes on the internet rather than an hour or so in the
store, but a productivity loss for the supermarket, as they have to employ more
people to process the same revenue. The real economic cost of selecting food from
the aisles, bagging it, loading it on a van and delivering it is far higher than £1 charged,
and this feeds into both profit and measured revenue picked up in GDP. Whilst
the net efficiency gain (or loss) for the supermarkets from the combination of self-
service checkouts and online shopping shows up in government productivity figures,
the net gains or losses to customers tend not to, as the economic advantages or
disadvantages of their time usage are not recorded.
3.7. When Productivity Depends on Transfer of Costs Between Organisation and Society
Consider your drive down any UK motorway. You drive through tracts of motorway, sometimes with lanes blocked off 15 miles in length, and a handful of sporadic vehicles and teams, if any at any one time. The model is designed to enable construction firms to switch activity and labour on and off at times that suits a portfolio of projects on the go. Within the construction firm, and at the level of the contract price, it might look like productive use of assets, but the productivity impact is on every commuter, and firm, that has to absorb the increased travel time. The solution is simply a slight of hand that creates fundamental inefficiency once we cross the boundaries between an organisation and the national impact.
Another way of thinking about the implicit transfers of cost between an organisation and society is to understand how productivity gains are really being made. We use the example of the competitive impact of on demand business models30.
29
These include firms like Uber offering chauffeur and ride-sharing services, Freelancer.com and Elance-oDesk brokering links between freelancers and organisations, Handy supplying cleaners, SpoonRocket offering restaurant meals, Medicast supplying doctors, and Axiom supplying lawyers. By 2013 venture capitalists had invested $1.6 billion in 117 organisations: 80% originated in the USA, but most are operating in global cities. In effect such models allow two types of people to trade (those who have money but little time, trading with those who have time but little money). Techno-optimists and entrepreneurs eulogize the models, whilst those providing the services or whose own employment is impacted by them, observe more profound implications.
An analysis by The Economist demonstrated that such examples illustrate that in the game of productivity trade-offs, the social and risk consequences can be immense.
On demand business systems: I have an app for that31
On-demand business owners survive by their ability to arrange connections and oversee the quality of work, but do not need to employ people full-time nor guarantee pay and benefits, and regulatory concerns such as health and safety become a matter for debate. Productivity gains are made through transfers of risk. For example, the financing of social benefits such as pensions and healthcare is pushed back from the global employer to the individual. The potential beneficiaries beyond the techno-entrepreneurs responsible for the global start-ups are consumers, taxpayers (to the extent that the efficiency of public resources used can be improved) and those employee segments who value flexibility of work over security. The potential losers include: those employee segments that value security over flexibility; and taxpayers that might have to provide financial support to contract workers who do not or cannot source their own pensions. The transfer of risks is almost totally from the organisation (the broker) to the individual, and also from the organisation to the state. Unless significant changes occur in regulatory regimes, then the model requires that individuals have to assume all welfare responsibilities, become responsible for becoming multi-skilled technically and keeping such skills up-to-date, and develop selling, networking, social media, and personal branding skills. On-demand business services also imply the need to shift a range of government measurement systems for employment and wages. Most welfare systems are delivered through employers but on demand business service models imply that they might need to be tied to the individual instead, and also be made more portable. Skill development systems also shift from employers to individuals (or to nation states that wish to create vocational education systems that enable individuals). National taxation models would also presumably need to change in order to recoup the costs for this re-distribution.
HR functions will face many business developments that call upon their advice in such matters. They need not work for such businesses to be responsible for dealing with the trade-offs – given e-enablement simple innovations in customer processes or the opening of new channels to business to sit alongside existing channels may invoke business model developments productivity improvements that trigger significant risks or costs to be borne elsewhere.
30
In the previous section we showed how deep and fundamental the impact of even existing
changes at the organisation level have to be. But we are on the cusp of even more fundamental
changes, and HR Directors need to have a clear view of the likely impact in the near-term of
some new challenges.
4.1. Disruptive Technologies
We need to unravel the hype but also potential for radical change coming with a range of
disruptive technologies. However, it is already evident that disruptive technologies - especially
the automation of knowledge work – are beginning to impact wages and skills.
Disruptive Technologies with the Potential to Transform Productivity
The McKinsey Global Institute has identified a range of disruptive technologies,
including32:
1. Mobile internet
2. Automation of knowledge work
3. Internet of things (machinery, shipments, infrastructure, and devices equipped with
networked sensors and actuators can monitor their environment, report status,
receive instructions, and take actions based on the information they receive)
4. Cloud technology
5. Advanced robotics
6. Near autonomous vehicles
7. Energy storage
8. 3D printing
9. Advanced materials
10. Advanced oil & gas exploration and recovery
11. Renewable energy.
The price of the fastest supercomputer in 1975 was $5 million, but by 2013 an iPhone 4 with
equal performance only cost $400. There has been an 85% drop in cost per watt of a solar
photovoltaic cell between 2000 and 2011.
We choose automation of knowledge work and 3D printing as two near-term impacts that have
transformational potential (in the context of the recent slowdown in productivity gains).
4. Emerging Productivity Challenges
31
4.2. Machine Intelligence and the Automation of Knowledge Work
In the opening section we used the catchphrase ‘the workers are stealing the robots’ jobs’ to
capture one of the explanations for the pursuit of low skill job strategies and business models.
Are we about to see the reverse of this?
Disruption is now expected much more widely as the rise of machine intelligence threatens
more jobs further up the skills ladder, as many previously sacrosanct professions find their
information work can be automated. A wide range of technical capabilities are now making
it economic to automate much previously sacrosanct knowledge work including: advances
in computational speed, machine learning, natural user interfaces, advanced interfaces and
artificial intelligence software that can understand and interpret human speech, actions, and
intentions from ambiguous commands, and the ability to sift through massive amounts of
information to discern patterns and relationships:
‘…knowledge work automaton tools and systems could take on tasks that would
be equal to the output of 110 million to 140 million full-time equivalents (FTEs). It is
possible that this incremental productivity - which does not include any estimate
of the value of higher quality output due to better knowledge tools - could have as
much as $5.2 trillion to $6.7 trillion in economic impact annually by 2025’ 33
To date the impact of a range of digital technologies has been felt the most by low- and mid-
skilled workers in rich countries, and in rich countries where employment has been growing
such as the UK and Germany, wages have been squeezed the most. But the effects are
spreading - in half of all OECD countries real median wages have stagnated since 2000. As a
consequence, The Economist calls this the Wealth without workers, workers without wealth
problem:
‘…Vast wealth is now being created without many workers and for all but an elite few,
work no longer guarantees a rising income’ .34
The automation debate has featured in discussion of both the recent phenomenon of jobless
growth, and that technological unemployment, which Keynes felt would come once (or if ever):
“our discovery of means of economising the use of labour outrunning the pace at which we
can find new uses for labour”35. When ATMs were introduced into the USA the savings enable
money to be used to open more branches and the number of bank cashiers actually increased.
International differences will also still persist around automation. Nissan uses robots much more
intensively in its Japanese plants than in the lower waged Indian ones36.
32
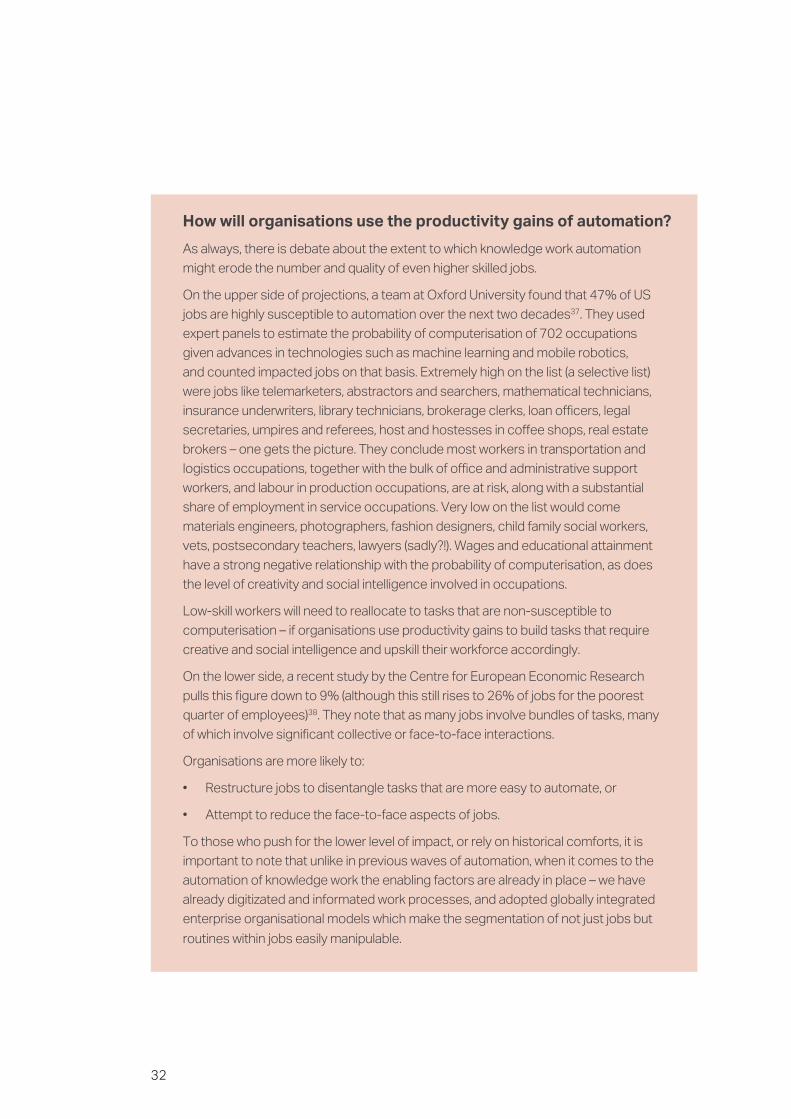
How will organisations use the productivity gains of automation?
As always, there is debate about the extent to which knowledge work automation
might erode the number and quality of even higher skilled jobs.
On the upper side of projections, a team at Oxford University found that 47% of US
jobs are highly susceptible to automation over the next two decades37. They used
expert panels to estimate the probability of computerisation of 702 occupations
given advances in technologies such as machine learning and mobile robotics,
and counted impacted jobs on that basis. Extremely high on the list (a selective list)
were jobs like telemarketers, abstractors and searchers, mathematical technicians,
insurance underwriters, library technicians, brokerage clerks, loan officers, legal
secretaries, umpires and referees, host and hostesses in coffee shops, real estate
brokers – one gets the picture. They conclude most workers in transportation and
logistics occupations, together with the bulk of office and administrative support
workers, and labour in production occupations, are at risk, along with a substantial
share of employment in service occupations. Very low on the list would come
materials engineers, photographers, fashion designers, child family social workers,
vets, postsecondary teachers, lawyers (sadly?!). Wages and educational attainment
have a strong negative relationship with the probability of computerisation, as does
the level of creativity and social intelligence involved in occupations.
Low-skill workers will need to reallocate to tasks that are non-susceptible to
computerisation – if organisations use productivity gains to build tasks that require
creative and social intelligence and upskill their workforce accordingly.
On the lower side, a recent study by the Centre for European Economic Research
pulls this figure down to 9% (although this still rises to 26% of jobs for the poorest
quarter of employees)38. They note that as many jobs involve bundles of tasks, many
of which involve significant collective or face-to-face interactions.
Organisations are more likely to:
• Restructure jobs to disentangle tasks that are more easy to automate, or
• Attempt to reduce the face-to-face aspects of jobs.
To those who push for the lower level of impact, or rely on historical comforts, it is
important to note that unlike in previous waves of automation, when it comes to the
automation of knowledge work the enabling factors are already in place – we have
already digitizated and informated work processes, and adopted globally integrated
enterprise organisational models which make the segmentation of not just jobs but
routines within jobs easily manipulable.
33
4.3. The Democratisation of Manufacturing
Another disruptive technology is 3D printing technology (machines that use additive
manufacturing technologies to print objects layer by layer to create objects from a variety of
materials such as plastic, metal, ceramics, glass, paper, and “living cells”. Boeing currently prints
200 different parts for ten aircraft platforms.
It is being heralded by some as the next industrial revolution, because of the opportunities it
creates for rapid prototyping, mass customisation, shrinking and less-costly supply chains,
and the ‘democratisation’ of manufacturing – it has the potential to disrupt many businesses,
consumers and the global economy. It might assist firms in their sustainability goals through
lower waste and carbon footprint than traditional manufacturing, reductions in levels of
transport, the localisation of production and assembly, and increases in the lifespan of products
as parts can be reproduced and replaced more easily. It offers the potential to link undeveloped
markets to global supply chains.
Whilst new technical developments, such as 3D scanning and additive manufacturing are
not yet good enough to make cars or iPhones, they are changing the economies of scale in
production. Advances in the USA around robotics, 3D printing, mass customerisation and other
trends are already putting pressure on the Asian factory model.
4.4. Consequences: Changes in the Economics and Scale of Production.
What are the consequences of some of these new developments? Whilst shifts in trading
patterns can happen very quickly, we do seem to now be entering a different set of competitive
dynamics39. New production strategies, manufacturing techniques and materials are making
it cheaper and easier to respond to local market tastes. Coupled with falling labour costs as a
proportion of total costs, this is driving new locational factors and organisational models. The
trend of factories to be moved to low wage countries to curb labour costs is being replaced
by models that are based on more complex assumptions. Of the $499 first generation iPad,
only about $33 of cost was attributed to manufacturing labour, of which final assembly in
China represented $8. Manufacturing wages in China rose by 364% between 2004 and 2014,
although from a much lower base than in Europe. There has been a particularly large narrowing
of the wage gap in the USA. Boston Consulting Group estimates that whilst manufacturing
costs were 14% lower in China in 2004 they are now only 4% below those in the USA.
34
New production strategies, manufacturing techniques and materials impacting the global division of labour
Volkswagon’s new production strategy (Modularer Querbaukasten) is based on
standardisation of parameters for components such as engine mounting points.
This allows all cars to be manufactured on the same production line, thereby allowing
factories in America, Europe and China to produce whatever vehicle the local market
requires40. Almost 60% of EuroZone non-financial companies had reshored some
operations by 2014, mainly production, in the previous year (notably in Italy, Ireland,
Germany and Spain). In Italy ‘reshoring’ was taking place in clothing, footwear and
electronics companies, partly as firms rediscover the cachet of a ‘Made in Europe’
label. Many Italian firms have reduced or overhauled their production lines because
of falling demand, concentrating their remaining manufacturing closer to target
markets41. However, Italian wages rose steadily in the last decade, despite periodic
recessions, and overall manufacturing costs remain almost 30% higher than in China.
In 2014 salaries of Italian factory workers are five times that of Chinese level, but in
2008 they were 16 times higher, and executive pay is now the same in both countries
Such examples do not mark a reversal of the ‘off-shoring’ phenomenon that has shaped global
business for many years now. Rather, they reflect a series of micro-level trends such as demand
for local production in home markets, increasing manufacturing costs abroad, difficulties of
overseeing production overseas, and the costs and risks inherent in global supply chains.
The recent phenomenon of ‘reshoring’ makes it evident that in addition to shifts in the location
of R&D, firms are making complex risk-based decisions about productivity and labour arbitrage.
There are other issues than lower wage costs to be considered in deciding upon operational
location. Apart from issues of markets, transport costs and legitimacy that are outside the
labour market, within the labor market issues like skills and capabilities may be paramount. Given
the very different education coverage and standards around the world firms in certain industries
that require high levels of competence in certain subjects may find their scope to relocate
severely restricted. They may choose to locate where the skills are.
35
HR functions have made limited inroads into the topic of productivity. Their focus,
understandably, has been on individual level interventions. From a control perspective this sees
debates around workforce skills, performance management, and performance-related pay.
From a commitment perspective the attention has been on employee engagement. Each of
these areas of practice comes with their own debates and challenges as to their effectiveness,
and it is notoriously difficult to link them to strategic performance outcomes.
In trying to understand how such people factors are linked to productivity, we have to
disentangle their potential direct predictive effects – where they directly create value for the
organisation and explain unique variance in the performance outcome – from more likely
indirect (but nonetheless still important) impacts. Many of these individual level interventions
such as threshold factors – in motivational terms they can be rather like hygiene factors –if
you do not have them, then the positive benefits of other productivity investments in capital
or systems and so forth will fail to materialise. Or they act as important mediators – again, if not
present, they will devalue the other production factors such as capital, or technology.
Recently there has been call for much better use of human capital metrics and HR analytics
so that organisations, and important stakeholders such as the financial community, can get a
better fix on the true health and future value of an organisation. What this White Paper shows
is that we need a more balanced set of data and set of metrics that help assess some of the
fundamental performance capabilities of an organisation. Metrics that capture an organisation’s
productivity potential coming from a total factor productivity perspective – whether used from
the inside out by Chief Executives to demonstrate the deep capabilities of their organisation or
more critical perspective from the outside in from investors and governments - can help build
such confidence. However, we are a long way from being able to demonstrate such detailed
HR analytics.
Moreover, as our different examples of productivity context make clear, on the one hand there
can be hidden importance of the HR strategy once we begin to analyse the business model
in more detail – and these contributions are for HR Directors to identify and sell within the top
team - but also the level of human asset intensity and the links between people factors and total
factor productivity clearly differ across industrial setting.
5. Conclusions

36
The White Paper also makes it clear that if HR functions are to demonstrate their worth
they need to work much more closely with the functions that make the major interventions
– be this with operations over skills issues, or with customer management over service models.
We have shown how the pursuit of productivity has to be a multi-functional responsibility, and it
also needs internal management functions to work much more closely with major institutions.
Both of these needs place pressure on the formal HR structure and raise questions as to where
functions that adopt a broader organisational effectiveness should be placed.
Finally, as we try to navigate our way through what must be done to solve the national
productivity challenge, and what might be done under the guise of organisational productivity,
it is clear that a number of recent assumptions may need to be challenged. `In some sense,
as with the actions that organisations might take around flexibility, the HR function can
be part of the problem. Enforced flexibility is actually a poor strategy for productivity. The
function’s fixation with flexible work and certain employee segments may in some instances
be condemning future generations to a low skill future. The HR function should expect that it
will once more have to deal with split loyalties, balancing what might be seen to please the top
team or other powerful functions with what it considers to be ineffective and unproductive. We
hope that this White Paper helps in making these arguments easier where tensions exist, whilst
making existing and future interventions more rounded where people are open to persuasion.
37
6. End Notes
1 Reinhart, C & Rogoff, K (2009). This time is different: eight centuries of financial folly,
Princeton University Press.
2 Chowla, S., Quaglietti, L. & Rachel, L. (2014). How have world shocks affected the UK
economy? Bank of England Quarterly Bulletin, 54 (2): 167-179.
3 Hughes, A., & Saleheen, J. (2012). UK labour productivity since the onset of the crisis - an
international and historical perspective. Quarterly Bulletin, 138-146.
4 BBC News (2014). http://www.bbc.co.uk/news/business-32143552
5 Office for National Statistics (2015) http://www.ons.gov.uk/employmentandlabourmarket/
peopleinwork/labourproductivity/bulletins/labourproductivity/octtodec2015
6 Office for National Statistics (2015) http://visual.ons.gov.uk/productivity-puzzle/
7 Spilsbury, M. & Campbell, M. (2009). Ambition 2020: World class skills and Jobs for the UK.
Wath-Upon-Dearne: UK Commission for Employment and Skills.
8 Financial Times (2015) Weighing up four theories on the UK’s productivity gap.
http://www.ft.com/cms/s/0/2f7f42e8-e2b2-11e4-aa1d-00144feab7de.html
9 Riley, R., Robinson, C., & Davison, S. (2011). Skills and economic performance: the impact
of intangible assets on UK productivity. Evidence report 39. Wath-Upon-Dearne: UK
Commission for Employment and Skills.
10 Pritchard, R. D. (1990). Measuring and improving organisational productivity:
A practical guide. New York: Praeger, pp. 248.
11 March, J.G. & Sutton, R.I. (1997). Organisational performance as a dependent variable,
Organisation Science, 8 (6): 698-706.
12 Madrick, J. (1997). The End Of Affluence: The Causes and Consequences of America’s
Economic Dilemma. New York: Random House.
13 See for example: Campbell, J. P., & Campbell, R. J. (Eds.) (1988). Productivity in
organisations. San Francisco: Jossey-Bass; Kopelman, R. E. (1986). Managing productivity
in organisations: A practical, people-oriented perspective. New York: McGraw-Hill;
Pritchard, R. D., Jones, S. D., Roth, P. L., Stuebing, K. K., & Ekeberg, S. E. (1989). The
evaluation of an integrated approach to measuring organisational productivity.
Personnel Psychology, 42(1), 69-115.
14 Greve, A., Benassi, M., Sti, A.D. (2010). Exploring the contributions of human and social
capital to productivity. International Review of Sociology, 20 (1): 35–58.
15 Leitch Review of Skills (2006) Prosperity for all in the global economy: Final report: World
class skills. HM Treasury, London
16 Bell, V., Burriel-Llombart, P. & Jones, J. (2005) A quality adjusted labour input series for the
United Kingdom (1974-2002). Bank of England Working Paper no. 280. London, Bank of
England
38
17 Garrett, R., Campbell, M. & Mason, G. (2010). The value of skills: an evidence review.
Evidence report 22. Wath-Upon-Dearne: UK Commission for Employment and Skills.
18 Störmer, E., Patscha, C., Prendergast, J. & Daheim, C. (2014). The future of work: jobs and
skills by 2030. Evidence report 84. London: UKCES.
19 King, R.P & Park, T.A. (2004). Modeling productivity in supermarket operations:
incorporating the impacts of store characteristics and information technologies.
Journal of Food Distribution Research, 35 (2): 42-55.
20 Griffeth, R. & Harmgart, H. (2005). Retail productivity, International Review of Retail,
Distribution and Consumer Research, 15 (3): 281-290.
21 Meredith, R., Remington, S., O’Donnell, P. & Sharma, N. (2012) Organisational transformation
through Business Intelligence: theory, the vendor perspective and a research agenda,
Journal of Decision Systems, 31(3): 187-201.
22 http://blog.kobie.com/2013/07/qsrs-turning-the-data-deluge-into-actionable-insights/
Accessed 10th May 2014.
23 http://www.takepart.com/article/2014/03/04/what-mcdonalds-future-looks. Accessed
10th May 2014.
24 KPMG (2013). Driving value in upstream Oil & Gas: Lessons from the Energy industry’s
top performing companies. http://download.pwc.com/ie/pubs/2013_driving_value_in_
upstream_oil_and_gas.pdf
25 Alix Partners (2015). Capital Productivity In The Oil And Gas Industry. www.alixpartners.com
26 Institute of Mechanical Engineers/ BDO (2015). The Aerospace Report. http://www.imeche.
org/docs/default-source/reports/the-aerospace-report-2015.pdf?sfvrsn=2
27 Appleby, J., Galea, A., & Murray, R. (2014). The NHS productivity challenge: Experience
from the front line. The Kings Fund. http://www.kingsfund.org.uk/sites/files/kf/field/field_
publication_file/the-nhs-productivity-challenge-kingsfund-may14.pdf
28 Bevan, S., King, A. & Toime, E. (2015). The Productivity Imperative: Towards a 21st Century
Model of Postal Services. London: The Work Foundation.
29 The Guardian (2014). http://www.theguardian.com/money/2014/aug/17/britain-
productivity-collapse-recession
30 Brewster, C., Houldsworth, L., Sparrow, P.R., & Vernon, C. (2016). International Human
Resource Management. 4th Edition. London: Chartered Institute of Personnel and
Development.
31 The Economist (2015). The future of work: there’s an app for that, and Workers on tap.
The Economist, 414 (8919): 13-16.
39
32 Manyika, J., Chui, M., Bughin, J., Dobbs, R., Bisson, P., & Marrs, A. (2013). Disruptive
technologies: Advances that will transform life, business, and the global economy.
McKinsey Global Institute. London: McKinsey & Co.
33 Manyika et al (2013). Ibid, p. 40.
34 Economist (2014). Wealth without workers, workers without wealth,
Economist, 413 (8907): 16.
35 Keynes, J.M. (1933). Economic possibilities for our grandchildren (1930). p.3 Essays in
persuasion, pp. 358–73. Op cite Frey & Osborne (2013)
36 The Economist (2016) Automation: I’m afraid I can’t do that. The Economist, 419 (8992):
73-74.
37 Frey, C.B., & Osborne, M.A. (2013). The Future Of Employment: How Susceptible Are
Jobs To Compuertisation? Working Paper for Oxford University Engineering Sciences
Department and the Oxford Martin Programme on the Impacts of Future Technology.
Oxford University.
38 Arntz, M., Gregory, T. & Zierahn, U. (2016). The Risk of Automation for Jobs in OECD
Countries: A Comparative Analysis, OECD Social, Employment and Migration Working
Papers, No. 189, OECD Publishing, Paris.
39 McKinsey Global Institute (2015). Playing to win: the new global competition for corporate
profits. London: McKinsey & Co.
40 Markillie, P. (2012). Special report on manufacturing and Innovation: A third industrial
revolution. Economist, 403 (8781): 1-16
41 Za, C., Sheahan, M., Jones, G., Ognibene, S., Galloni, A., & Stamps, D. (2014). Euro zone
companies come home as Asian costs rise, Reuters News, http://uk.reuters.com/
article/2014/12/01/uk-eurozone-reshoring-idUKKCN0JF21620141201 Accessed 3rd
January 2015.

40
Notes

41

For further information, please contact:
Centre Administrator
Email: [email protected]
Telephone: +44 (0)1524 510906
Centre for Performance-led HR
Lancaster University Management School
Bailrigg
Lancaster
LA1 4YX
United Kingdom
© CPHR, 2016
The author hereby grants permission to CPHR participants a free worldwide right and
licence to copy and disseminate and otherwise use in their business activities this
White Paper. Any such dissemination activities must not be designed to bring the
Centre for Performance-led HR or Lancaster University into disrepute.
ISBN: 978-1-86220-329-7
www.lums.lancs.ac.uk/cphr
CPHR
Centre for Performance-led


![[Global HR Forum 2014] Aging Workforce and Productivity](https://img.pdfslide.net/doc/110x75/558cd9c5d8b42a885e8b46ad/global-hr-forum-2014-aging-workforce-and-productivity.jpg)