Embed Size (px)
Citation preview
The prospective and retrospective memoryquestionnaire (PRMQ): Latent structure,normative data and discrepancy analysisfor proxy-ratings
John R. Crawford1*, Julie D. Henry2, Aileen L. Ward1
and John Blake1
1School of Psychology, King’s College, UK2University of New South Wales, School of Psychology, Australia
Objectives. To evaluate the proxy-rating version of the Prospective andRetrospective Memory Questionnaire (PRMQ) and provide norms and methods forscore interpretation.
Design. Cross-sectional and correlational.
Methods. The PRMQ was administered to a large sample drawn from the generaladult population (N ¼ 570). Confirmatory factor analysis (CFA) was used to testcompeting models of its latent structure. Various psychometric methods were appliedto provide clinicians with tools for score interpretation.
Results. The CFA model with optimal fit specified a general memory factor togetherwith additional prospective and retrospective factors. The reliabilities of the PRMQwere acceptable (.83 to .92), and demographic variables did not influence ratings. Tablesare presented for conversion of raw scores on the Total scale and Prospective andRetrospective scales to t scores. In addition, tables are provided to allow users to assessthe reliability and abnormality of differences between proxy ratings on the Prospectiveand Retrospective scales. Finally, tables are also provided to compare proxy-ratingswith self-ratings (using data from the present sample and self-rating data from a previousstudy).
Conclusions. The proxy-rating version of the PRMQ provides a useful measure ofeveryday memory for use in clinical research and practice.
In contrast to retrospective memory (RM), which refers to our recollection of past
events, prospective memory (PM) is concerned with our memory for future intentions.
Our ability to remember to do things in the future has important implications for our
* Correspondence should be addressed to Professor John R. Crawford, School of Psychology, King’s College, Universityof Aberdeen, Aberdeen AB24 2UB, UK (e-mail: [email protected]).
TheBritishPsychologicalSociety
1
British Journal of Clinical Psychology (2005), 44, 1–23
q 2005 The British Psychological Society
www.bpsjournals.co.uk
DOI:10.1348/014466505X28748
BJCP 34—22/11/2005—RAJADURAI—133708
everyday functioning, for instance, failing to remember to take medication or attend a
medical appointment could potentially have very serious consequences. As Salthouse,
Berish, and Siedlecki (2004) point out, PM may be a more important determinant of our
ability to live independently than RM. It is also of note that, according to Baddeley
(1990), when someone complains of having a poor memory, they are most often
referring to a failure in this aspect of cognition. It is, therefore, surprising that PM hasbeen relatively neglected in the literature relating to memory, with most research
instead concentrating on memory for retrospective events. This omission at least
partially reflects the fact that successfully performing a PM task requires not only recall
of something that is to be done in the future, but also retrieval of what it is that needs to
be done, and this latter component clearly implicates RM. Thus, many researchers
contend that the two types of memory do not represent independent constructs
(Burgess & Shallice, 1997).
Nevertheless, although there is clearly some overlap between the two constructs, it
is increasingly recognized that there is also an important distinction to be made. Forinstance, Henry, Macleod, Phillips, and Crawford (2004) found in a meta-analytic review
of healthy ageing that, relative to their younger counterparts, older participants were
significantly more impaired on tests of RM than on measures of PM, suggesting that the
two types of memory are differentially affected by adult ageing. Wilkins and Baddeley
(1978) also found that deficits on the two types of memory are dissociable, reporting
that participants who displayed superior RM were less accurate on the PM task than
those who had demonstrated poor RM. Thus, increased recognition of the
distinctiveness of the two constructs coupled with the importance of certain PM
failures, and their frequent occurrence in the healthy population (Dobbs & Reeves,1996), has led to a growing interest in the systematic study of PM (see Ellis &
Kvavilashvili, 2000).
When measuring psychological constructs, it is important to use multiple indicators
because of the potential unreliability of a single indicator, and the possibility that any
observed effects are due to method variance. Thus, in psychological assessment,
memory should be measured using a diverse range of methodologies. In addition to
objective measures of memory, rating scales, in both self- and proxy-rating formats,
provide a very useful method of assessment. However, Smith, Della Sala, Logie, and
Maylor (2000) note that the coverage of PM abilities in most memory rating scales is verymeagre. Thus, Smith et al. developed the Prospective and Retrospective Memory
Questionnaire (PRMQ). The PRMQ is a public domain, 16-item, self-report measure of
prospective and retrospective failures in everyday life.
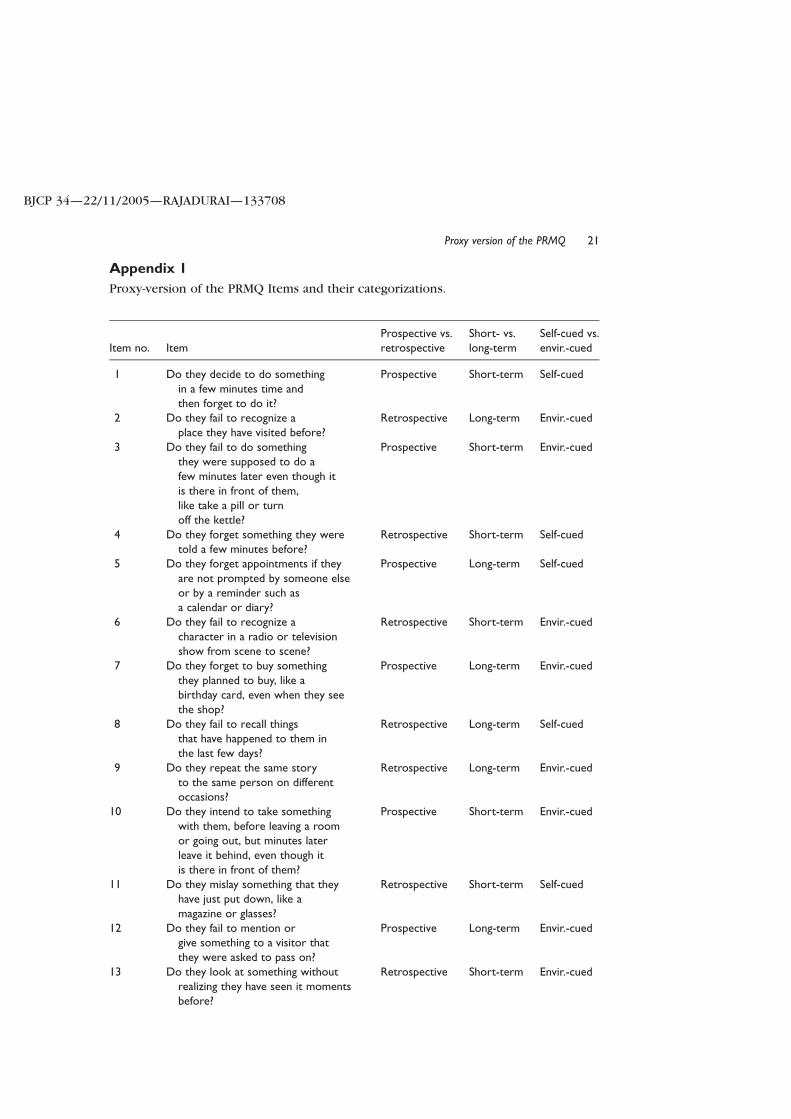
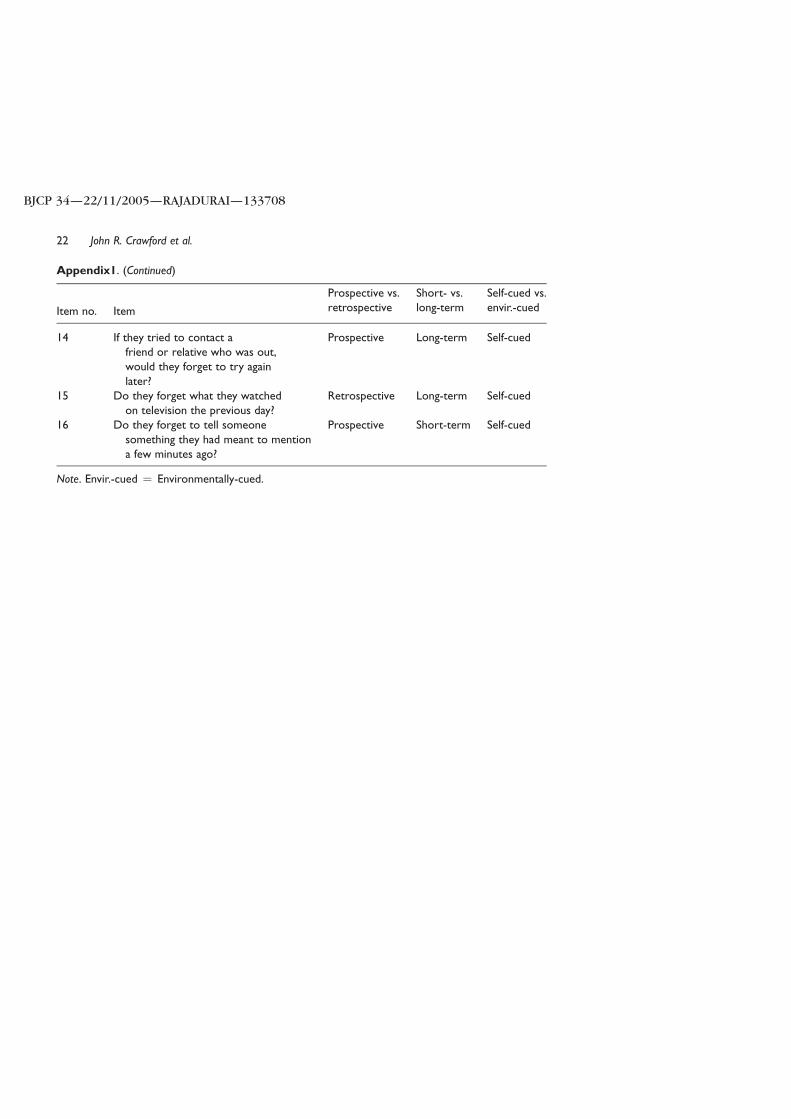
Of the PRMQ items, 8 enquire about PM and 8 enquire about RM. The items were
also designed to contain an-equal number of items concerned with either self-cued
memory or environmentally-cued memory, and with short-term versus long-term
memory. Thus, although the primary aim was to develop a self-report scale that would
systematically measure PM and RM, each item can be categorized along three
dimensions. For example, item 14 (‘If you tried to contact a friend or relative who wasout, would you forget to try later?’) is categorized as measuring prospective, long-term,
self-cued memory (see Appendix 1 for a full list of items and their categorization). Thus,
the PRMQ has a potential advantage over other self-report scales in that it balances
prospective and retrospective items, and measures these constructs systematically over
a range of contexts.
To test the construct validity of the self-report version of the PRMQ, Crawford, Smith,
Maylor, Della Sala, and Logie (2003) compared the fit of 10 competing models of the
John R. Crawford et al.2
BJCP 34—22/11/2005—RAJADURAI—133708
PRMQ’s latent structure on data collected from the general adult population (N ¼ 551),
using confirmatory factor analysis (CFA). The model with best fit had a tripartite latent
structure; that is, in addition to a general factor of self-rated memory, it also measured
specific, orthogonal factors corresponding to PM and RM. Furthermore, Crawford et al.
(2003) found that the reliabilities of the Total, Prospective, and Retrospective scales
were high (rs ¼ .89, .84 and .80, respectively). Crawford et al. (2003) also providednorms for each of the PRMQ scales in the form of t scores, and supplemented this by
providing methods for determining whether an individual exhibited reliable and/or
abnormal differences between their prospective and retrospective ratings. Therefore,
the self-report version of the PRMQ has been shown to have the reliability and construct
validity necessary to be applied in a clinical setting. In addition, interpretation of PRMQ
scores are facilitated by the provision of norms and methods for both quantifying the
confidence to be placed in ratings and for analysing discrepancies.
However, it is important to emphasize that our knowledge of the structure of the
PRMQ and the existing normative data are limited to the self-rated version of themeasure. A proxy-rating version of the PRMQ was also constructed and used by
Smith et al. (2000) in their initial research and, as Crawford et al. (2003) themselves
acknowledge, this version of the scale is potentially more useful in research and clinical
practice than the self-rated version.
Although self-report instruments have consistently been shown to have high
reliability, metamemory (i.e. individuals’ beliefs about their own memory ability), does
not always correlate highly with their actual memory performance as assessed by
objective memory tests and clinical observations (Craik, Anderson, Kerr, & Li, 1995;
Morris, 1984). Various explanations have been advanced to account for this lowcorrelation, but the most common is that people with memory problems often have
limited insight into their problem (Herrmann, 1984), particularly those whose memory
deficits arise as a consequence of brain injury. Moreover, this lack of insight may be
compounded by the fact that people with memory failure are also prone to forgetting
about any errors in their memory, and therefore do not accurately report the frequency
of these errors (Cohen, 1996).
Given these problems, it is particularly useful for clinicians or researchers to have the
patient’s carer, or someone who knows them well, report instances of memory failure
that the patient may be unaware of, as they may be in a better position to estimate theirmemory ability (Hickox & Sunderland, 1992; Sunderland, Harris, & Baddeley, 1988).
Therefore, memory questionnaires are frequently converted so that they are suitable for
completion by another person. The utility of these proxy-rating versions is given further
weight by the fact that they have been shown to have more substantial correlations with
formal objective measures than do self-rating versions (Sunderland, Harris, & Baddeley,
1984; Sunderland et al. 1988).
The present study had four principal aims. The first aim was to determine whether,
in the general adult population, the age and gender of the rater and ratee influence
proxy PRMQ ratings. The second aim was to provide normative data for the proxy-ratingversion of the PRMQ, including normative data on the magnitude of discrepancies
between proxy-rated PM and RM (i.e. the latter data will allow an assessment of the
rarity or abnormality of the discrepancy between an individual’s ratings on the two
scales). The third aim was to obtain estimates of the reliability of the proxy-rating
version of the PRMQ. Establishing the reliability of an instrument is a fundamental step
in evaluating its potential utility. However, the reliability data can also be used (a) to
provide confidence limits on individuals’ ratings, and (b) to test for reliable differences
Proxy version of the PRMQ 3
BJCP 34—22/11/2005—RAJADURAI—133708
between individuals’ ratings on the Prospective and Retrospective scales. Finally, if use
of the PRMQ in research and practice is to be optimal, then it is necessary to have
knowledge of the underlying structure of the instrument. Therefore, the fourth aim was
to evaluate competing models of the latent structure of the proxy-rating version of the
PRMQ, using confirmatory factor analysis (CFA). The parameterization of CFA models
operationalize hypotheses about the structure of the instrument (i.e. the parameteriza-tion is a formal statement concerning relationships between the measured variables).
Therefore, to avoid undue repetition, the theoretical and methodological considerations
that guided selection of these models are covered in the following section.
Method
ParticipantsComplete data from the proxy-rating version of the PRMQ were collected from 570
members of the general adult population (females ¼ 53.1%, males ¼ 46.9%); an
additional 13 questionnaires were discarded because of missing data. The aim inrecruitment was to obtain a sample that was broadly representative of the general adult
population in terms of the distribution of age, gender, and educational level. Participants
were recruited from a wide variety of sources in and around three UK cities; these
included commercial and public service organizations, community centres, and
recreational clubs. Potential participants were approached in person and, if they agreed
to consider participating, were given a questionnaire pack (see below). These were
returned in a pre-addressed envelope provided by the researcher. The combined refusal
and non-return rate was approximately 26%.There was a mix of urban and rural residents but, reflecting the distribution in the
general population, the participants were predominantly urban dwellers. The mean age
of the raters was 40.7 years (SD ¼ 16:68), and ranged from 18 to 87 years; the mean age
of the ratees was 42.6 years (SD ¼ 17:02) and ranged from 18 to 93 years. The education
level of the participants was as follows: no qualifications (16.2%), standard grades or
GCSE level qualifications and/or vocational qualifications (32.6%), Highers or A-levels at
secondary school (15.3%), qualifications not of degree standard, but more advanced
than secondary school (10.5%), and a ‘degree’ level education (25.3%). Thecorresponding percentage for each educational band in the general adult population
census was 25, 41, 16, 8, and 10%, respectively. Thus, while the sample is broadly
representative, there is an over representation of individuals with degree level
education. There were various relationships between the rater and the ratee, the most
common being partner (42.9%) and friend (29.0%).
Materials and procedureEach participant received an introductory letter, a proxy-rating version of the PRMQ,
and a form for recording demographic variables. The aims of the study were outlined
and the PRMQ was described as a set of questions about minor memory mistakes that
everyone makes from time to time. In selecting someone to rate, participants were
asked to choose someone they knew well and saw for long periods every day, or nearlyevery day. The participants were asked to record their estimate of how often each type
of memory failure happened to the ratee on a 5-point scale (very often, quite often,
sometimes, rarely, never). Following Smith et al. (2000), ratings were assigned
numerical values of 1 (never) to 5 (very often), resulting in minimum and maximum
possible total scores of 16 and 80, respectively.
John R. Crawford et al.4
BJCP 34—22/11/2005—RAJADURAI—133708
Confirmatory factor analysisBasic statistical analyses were conducted using SPSS Version 8. CFA (robust maximum
likelihood) was performed on the variance-covariance matrix of the PRMQ items using
EQS for Windows Version 5.4 (Bentler, 1995). The fit of CFA models was assessed using
the Satorra–Bentler scaled chi-squared statistic (S–Bx2), the robust comparative fit index
(RCFI), the standardized root-mean-squared residual (SRMR), and the root mean squared
error of approximation (RMSEA; see Bentler, 1995; Steiger, 2000). Values for the RCFI
can range from zero to unity; this index expresses the fit of a model relative to what is
termed the null model (the null model posits no relationship between any of the
manifest variables). There is general agreement that a model with a RCFI of less than
0.95 should not be viewed as providing a satisfactory fit to the data (Hu & Bentler, 1999).
The RMSEA is particularly sensitive to misspecified factor loadings, the SRMR to
misspecified factor covariances (Hu & Bentler, 1999). Hu and Bentler (1998, 1999)
demonstrated using Monte Carlo analyses that the combination of the SRMR and RMSEA
minimizes rejection of good fitting models, yet possesses optimal sensitivity to model
misspecification. A cut-off value close to 0.08 or below is recommended for the SRMR
(Hu & Bentler, 1999), while an RMSEA of ,0.10 is considered good, and ,0.05 very
good (Loehlin, 1998). The scaled difference chi-squared test (Satorra & Bentler, 2001)Q1
was used to test for differences in the fit of nested models (a model is considered to be
nested within another model if it differs only in imposing additional constraints on the
relationships between variables specified in the initial model).1
The first model (Model 1) to be evaluated was a single factor model. This model
expressed the hypothesis that the variance in the proxy-rating version of the PRMQ can
be partitioned into one general factor plus error variance associated with each
individual item (here, error variance refers to the combination of true variance in the
item that is independent of the factor, plus random error). It is standard practice to test
the fit of a one-factor model because it is the most parsimonious of all possible models.
Model 2 expressed the hypothesis that the proxy-rating version of the PRMQ
measures two independent (i.e. orthogonal) factors, PM and RM. Therefore, in this
model all prospective and retrospective items were constrained to load only on their
respective factors. Model 3 tests the hypothesis that two factors, PM and RM, explain the
covariance among items but that these factors are not independent (i.e. orthogonal).
Models 4a–c represented variations on the hypothesis that the proxy-rating version
of the PRMQ has a tripartite structure. The basic tripartite model (Model 4a) was
parameterized so that all 16 items were indicators of a common factor (representing
general self-rated memory). In addition, the 8 prospective items were also indicators of a
factor reflecting the variance specific to PM and the 8 retrospective items were
indicators of a specific RM factor. The specific factors were constrained to be orthogonal
to each other and to the common factor. Two more constrained variants on the basic
tripartite model were also constructed. In Model 4b, the retrospective factor was
omitted entirely. This model posits that all PRMQ items tap general memory, but only the
prospective items tap an additional specific factor. Model 4c was the reverse of Model
4b, consisting of a general memory factor and specific retrospective factor (i.e. the
prospective factor was omitted). It will be appreciated that, if both specific factors were
omitted, this would recreate the single-factor model (Model 1).
1A computer programme for PCs (sbdiff.exe.) that carries out this test is available. It can be downloaded from http://www.abdn.ac.uk/,psy086/dept/psychom.htm
Proxy version of the PRMQ 5
BJCP 34—22/11/2005—RAJADURAI—133708
As noted, the PRMQ items can also be categorized as to whether they are concerned
with short- or long-term memory, and self-cued memory or environmentally-cued
memory. As these distinctions may be an important source of covariance among PRMQ
items, tripartite models representing them were also constructed. Thus, in Model 5a, all
16 items were indicators of a common factor. In addition, the short-term prospective
memory items were also indicators of a factor reflecting the variance specific to short-
term memory and the 8 long-term memory items were indicators of a specific long-term
memory factor. In Model 5b all 16 items were indicators of a common factor, while the
self-cued prospective memory items were also indicators of a factor reflecting the
variance specific to self-cued memory and the 8 environmentally-cued memory items
were indicators of a specific environmentally-cued memory factor.
Normative dataIn presenting normative data for the PRMQ, it was considered desirable that scores on
the Prospective, Retrospective, and Total scales should be expressed as a common
metric. Therefore, tables were constructed to convert raw scores on the proxy-rating
version of the PRMQ to t scores (t scores have a mean of 50 and a SD of 10). We chose t
scores because they are in widespread use, their meaning is easy to convey, and they
permit users of the scale to rapidly assimilate an individual’s or group’s standing
(Crawford, 2004). For example, if an individual obtained t scores of 40 and 35 on the
Prospective and Retrospective scales, respectively, it can immediately be seen that he or
she is 1 SD below the estimated population mean on the Prospective scale and 1.5 SDs
below the mean on the Retrospective scale.
When working with individuals’ scores, it is important that test users are aware that
all psychological test scores are fallible. For this reason, and in order to quantify the
extent of this fallibility, it is widely recommended that scores should be accompanied by
confidence limits (Nunnally & Bernstein, 1994). Confidence limits on scores for each of
the three PRMQ scales were formed by obtaining the standard error of measurement for
true scores (Glutting, Mcdermott, & Stanley, 1987; Stanley, 1971) using the following
formula:
SEMxt ¼ rxx Sxffiffiffiffiffiffiffiffiffiffiffiffiffiffiffi1 2 rxx
p� �ð1Þ
where Sx is the standard deviation of the scale (10 in the present case as raw scores are
converted to t scores) and rxx is the reliability of the scale (normally estimated using
Cronbach’s alpha). Confidence limits are formed by multiplying the SEMxt by a value of z
(a standard normal deviate) corresponding to the desired confidence limits. For 95%
limits (the most commonly used), the SEM is multiplied by 1.96. These confidence limits
are not symmetrical around individuals’ obtained scores but around their estimated true
scores (Nunnally & Bernstein, 1994; Silverstein, 1989a; Stanley, 1971). The estimated
true score is obtained by multiplying the obtained score, in deviation form, by the
reliability of the test. It can be seen then that estimated true scores are regressed towards
the mean, the extent of this regression varying inversely with the reliability of the scale.
The formula is as follows:
True score ¼ rxxðX 2 �XÞ þ �X ð2Þ
where X is the obtained score and �X is the mean for the scale. Thus, for example, if an
individual obtained a score of 40 on a scale that had a mean of 50 and a reliability of 0.8,
then individual’s estimated true score would be 42.
John R. Crawford et al.6
BJCP 34—22/11/2005—RAJADURAI—133708
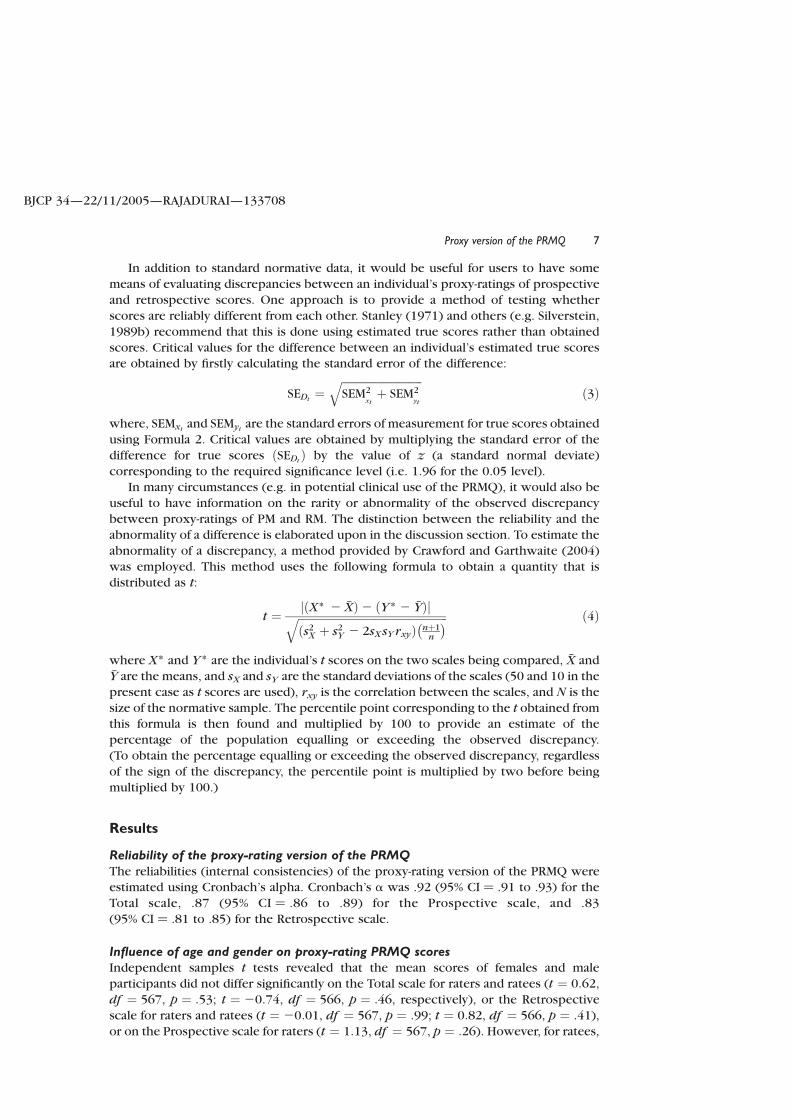
In addition to standard normative data, it would be useful for users to have some
means of evaluating discrepancies between an individual’s proxy-ratings of prospective
and retrospective scores. One approach is to provide a method of testing whether
scores are reliably different from each other. Stanley (1971) and others (e.g. Silverstein,
1989b) recommend that this is done using estimated true scores rather than obtained
scores. Critical values for the difference between an individual’s estimated true scoresare obtained by firstly calculating the standard error of the difference:
SEDt¼
ffiffiffiffiffiffiffiffiffiffiffiffiffiffiffiffiffiffiffiffiffiffiffiffiffiffiffiffiffiSEM2
xtþ SEM2
yt
qð3Þ
where, SEMxt and SEMyt are the standard errors of measurement for true scores obtained
using Formula 2. Critical values are obtained by multiplying the standard error of the
difference for true scores SEDtð Þ by the value of z (a standard normal deviate)
corresponding to the required significance level (i.e. 1.96 for the 0.05 level).In many circumstances (e.g. in potential clinical use of the PRMQ), it would also be
useful to have information on the rarity or abnormality of the observed discrepancy
between proxy-ratings of PM and RM. The distinction between the reliability and the
abnormality of a difference is elaborated upon in the discussion section. To estimate the
abnormality of a discrepancy, a method provided by Crawford and Garthwaite (2004)
was employed. This method uses the following formula to obtain a quantity that is
distributed as t:
t ¼ jðX* 2 �XÞ2 ðY * 2 �YÞjffiffiffiffiffiffiffiffiffiffiffiffiffiffiffiffiffiffiffiffiffiffiffiffiffiffiffiffiffiffiffiffiffiffiffiffiffiffiffiffiffiffiffiffiffiffiffiffiffiffiffiffiffiffiðs2
X þ s2Y 2 2sXsY rxyÞ nþ1
n
� �q ð4Þ
where X* and Y * are the individual’s t scores on the two scales being compared, �X and�Y are the means, and sX and sY are the standard deviations of the scales (50 and 10 in the
present case as t scores are used), rxy is the correlation between the scales, and N is the
size of the normative sample. The percentile point corresponding to the t obtained fromthis formula is then found and multiplied by 100 to provide an estimate of the
percentage of the population equalling or exceeding the observed discrepancy.
(To obtain the percentage equalling or exceeding the observed discrepancy, regardless
of the sign of the discrepancy, the percentile point is multiplied by two before being
multiplied by 100.)
Results
Reliability of the proxy-rating version of the PRMQThe reliabilities (internal consistencies) of the proxy-rating version of the PRMQ wereestimated using Cronbach’s alpha. Cronbach’s a was .92 (95% CI ¼ .91 to .93) for the
Total scale, .87 (95% CI ¼ .86 to .89) for the Prospective scale, and .83
(95% CI ¼ .81 to .85) for the Retrospective scale.
Influence of age and gender on proxy-rating PRMQ scoresIndependent samples t tests revealed that the mean scores of females and male
participants did not differ significantly on the Total scale for raters and ratees (t ¼ 0:62,
df ¼ 567, p ¼ :53; t ¼ 20:74, df ¼ 566, p ¼ :46, respectively), or the Retrospective
scale for raters and ratees (t ¼ 20:01, df ¼ 567, p ¼ :99; t ¼ 0:82, df ¼ 566, p ¼ :41),
or on the Prospective scale for raters (t ¼ 1:13, df ¼ 567, p ¼ :26). However, for ratees,
Proxy version of the PRMQ 7
BJCP 34—22/11/2005—RAJADURAI—133708
there was slight tendency for male participants to score more highly than female
participants (t ¼ 22:10, df ¼ 566, p ¼ :04).
For raters and ratees, the Pearson correlations between age and scores on the Total
scale (r ¼ 2:10; r ¼ 2:03), Prospective scale (r ¼ 2:11; r ¼ 2:06), and Retrospective
scale (r ¼ 2:08; r ¼ :01) were all small or negligible in magnitude, according to Cohen’s
(1977) criteria. Thus, for all practical purposes, these demographic variables do notinfluence scores. This simplifies the presentation of normative data, as there is no need
for stratification by these variables.
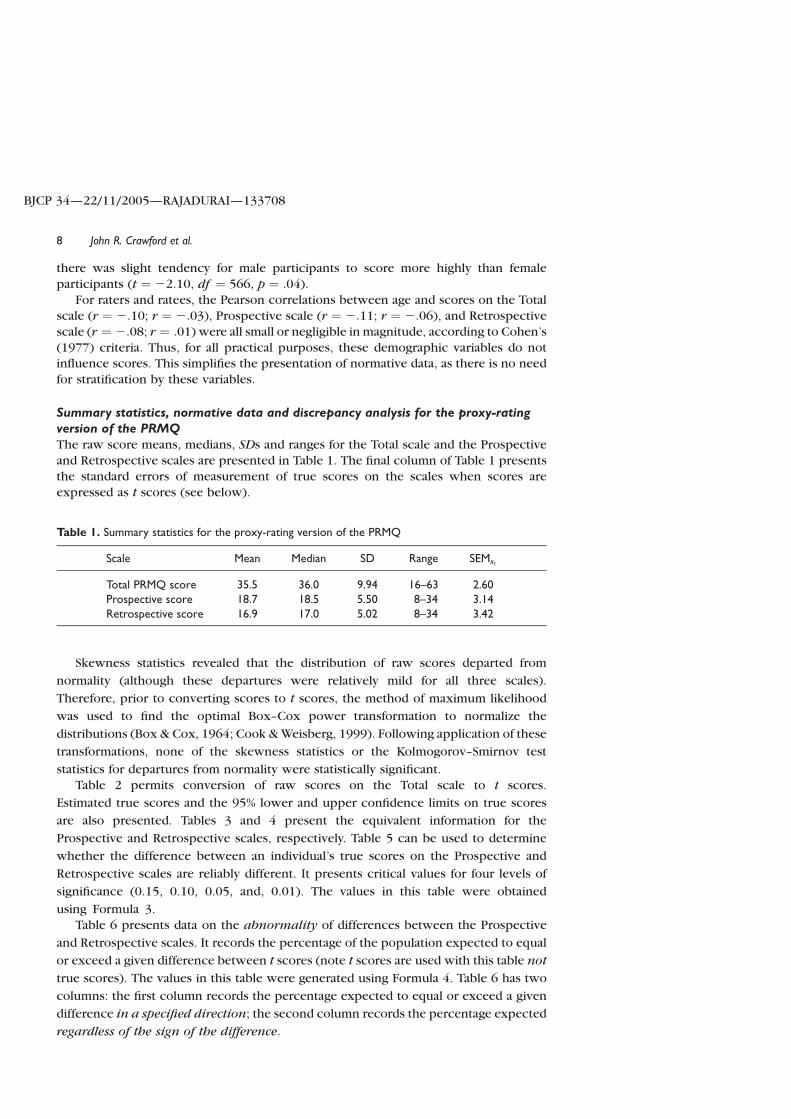
Summary statistics, normative data and discrepancy analysis for the proxy-ratingversion of the PRMQThe raw score means, medians, SDs and ranges for the Total scale and the Prospective
and Retrospective scales are presented in Table 1. The final column of Table 1 presents
the standard errors of measurement of true scores on the scales when scores are
expressed as t scores (see below).
Skewness statistics revealed that the distribution of raw scores departed from
normality (although these departures were relatively mild for all three scales).
Therefore, prior to converting scores to t scores, the method of maximum likelihood
was used to find the optimal Box–Cox power transformation to normalize the
distributions (Box & Cox, 1964; Cook & Weisberg, 1999). Following application of these
transformations, none of the skewness statistics or the Kolmogorov–Smirnov test
statistics for departures from normality were statistically significant.
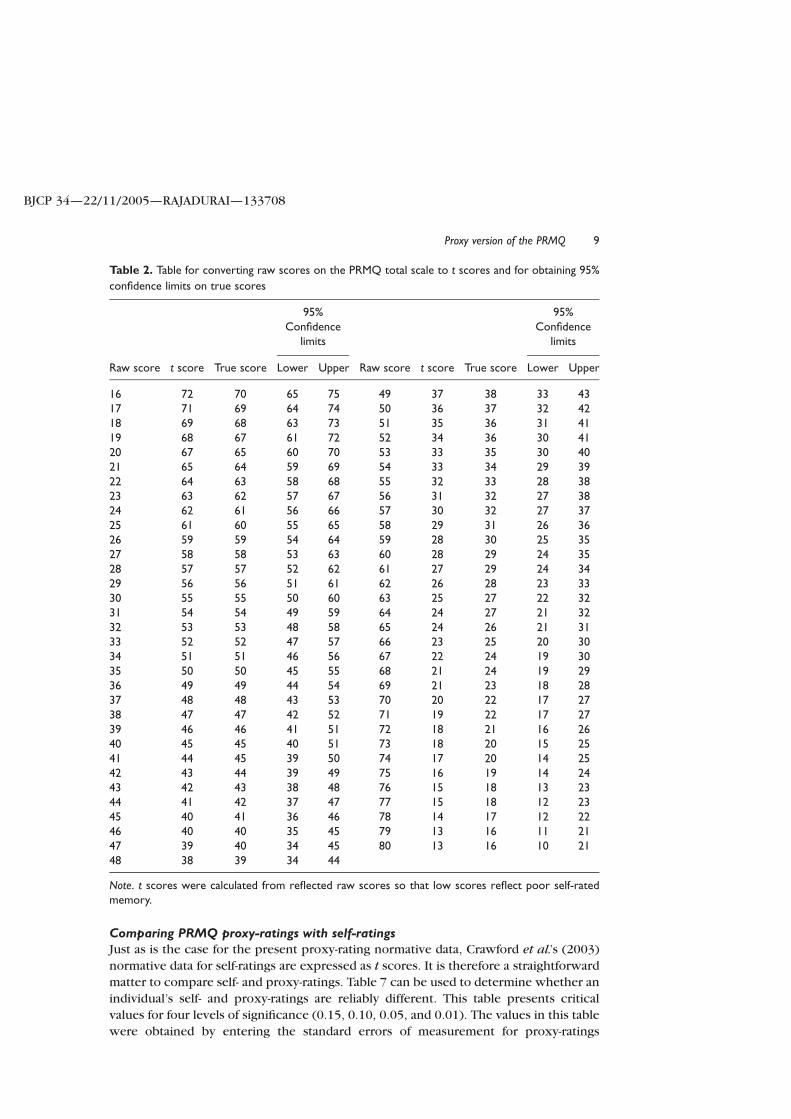
Table 2 permits conversion of raw scores on the Total scale to t scores.
Estimated true scores and the 95% lower and upper confidence limits on true scores
are also presented. Tables 3 and 4 present the equivalent information for the
Prospective and Retrospective scales, respectively. Table 5 can be used to determine
whether the difference between an individual’s true scores on the Prospective and
Retrospective scales are reliably different. It presents critical values for four levels of
significance (0.15, 0.10, 0.05, and, 0.01). The values in this table were obtained
using Formula 3.
Table 6 presents data on the abnormality of differences between the Prospective
and Retrospective scales. It records the percentage of the population expected to equal
or exceed a given difference between t scores (note t scores are used with this table not
true scores). The values in this table were generated using Formula 4. Table 6 has two
columns: the first column records the percentage expected to equal or exceed a given
difference in a specified direction; the second column records the percentage expected
regardless of the sign of the difference.
Table 1. Summary statistics for the proxy-rating version of the PRMQ
Scale Mean Median SD Range SEMxt
Total PRMQ score 35.5 36.0 9.94 16–63 2.60Prospective score 18.7 18.5 5.50 8–34 3.14Retrospective score 16.9 17.0 5.02 8–34 3.42
John R. Crawford et al.8
BJCP 34—22/11/2005—RAJADURAI—133708
Comparing PRMQ proxy-ratings with self-ratingsJust as is the case for the present proxy-rating normative data, Crawford et al.’s (2003)
normative data for self-ratings are expressed as t scores. It is therefore a straightforward
matter to compare self- and proxy-ratings. Table 7 can be used to determine whether an
individual’s self- and proxy-ratings are reliably different. This table presents critical
values for four levels of significance (0.15, 0.10, 0.05, and 0.01). The values in this table
were obtained by entering the standard errors of measurement for proxy-ratings
Table 2. Table for converting raw scores on the PRMQ total scale to t scores and for obtaining 95%
confidence limits on true scores
95%Confidence
limits
95%Confidence
limits
Raw score t score True score Lower Upper Raw score t score True score Lower Upper
16 72 70 65 75 49 37 38 33 4317 71 69 64 74 50 36 37 32 4218 69 68 63 73 51 35 36 31 4119 68 67 61 72 52 34 36 30 4120 67 65 60 70 53 33 35 30 4021 65 64 59 69 54 33 34 29 3922 64 63 58 68 55 32 33 28 3823 63 62 57 67 56 31 32 27 3824 62 61 56 66 57 30 32 27 3725 61 60 55 65 58 29 31 26 3626 59 59 54 64 59 28 30 25 3527 58 58 53 63 60 28 29 24 3528 57 57 52 62 61 27 29 24 3429 56 56 51 61 62 26 28 23 3330 55 55 50 60 63 25 27 22 3231 54 54 49 59 64 24 27 21 3232 53 53 48 58 65 24 26 21 3133 52 52 47 57 66 23 25 20 3034 51 51 46 56 67 22 24 19 3035 50 50 45 55 68 21 24 19 2936 49 49 44 54 69 21 23 18 2837 48 48 43 53 70 20 22 17 2738 47 47 42 52 71 19 22 17 2739 46 46 41 51 72 18 21 16 2640 45 45 40 51 73 18 20 15 2541 44 45 39 50 74 17 20 14 2542 43 44 39 49 75 16 19 14 2443 42 43 38 48 76 15 18 13 2344 41 42 37 47 77 15 18 12 2345 40 41 36 46 78 14 17 12 2246 40 40 35 45 79 13 16 11 2147 39 40 34 45 80 13 16 10 2148 38 39 34 44
Note. t scores were calculated from reflected raw scores so that low scores reflect poor self-ratedmemory.
Proxy version of the PRMQ 9
BJCP 34—22/11/2005—RAJADURAI—133708

(see Table 1) and the equivalent standard errors for self-ratings (Crawford et al. 2003)
into Formula 3. Note that it is the individual’s estimated true scores that should be
compared using this table.
Competing confirmatory factor analytic models of the proxy-rating versionof the PRMQThe fit statistics for all of the CFA models are presented in Table 8. It can be seen that the
general factor model (Model 1) had poor fit; the model’s x2 is large and the CFI is low.
However, the item loadings on this factor were high; the averaged loading was 0.64.
Table 3. Table for converting raw scores on the PRMQ prospective scale to t scores and for obtaining
95% confidence limits on true scores
95% Confidencelimits on true score
Raw score t score True score Lower Upper
8 72 69 63 759 69 67 61 73
10 67 65 59 7111 65 63 57 6912 62 61 55 6713 60 59 53 6514 58 57 51 6315 56 55 49 6216 54 54 48 6017 52 52 46 5818 51 50 44 5719 49 49 43 5520 47 47 41 5421 45 46 40 5222 44 44 38 5123 42 43 37 4924 40 42 35 4825 39 40 34 4626 37 39 33 4527 36 37 31 4428 34 36 30 4229 32 35 29 4130 31 33 27 4031 30 32 26 3832 28 31 25 3733 27 30 24 3634 25 28 22 3535 24 27 21 3336 22 26 20 3237 21 25 19 3138 20 24 18 3039 18 23 16 2940 17 21 15 28
John R. Crawford et al.10
BJCP 34—22/11/2005—RAJADURAI—133708
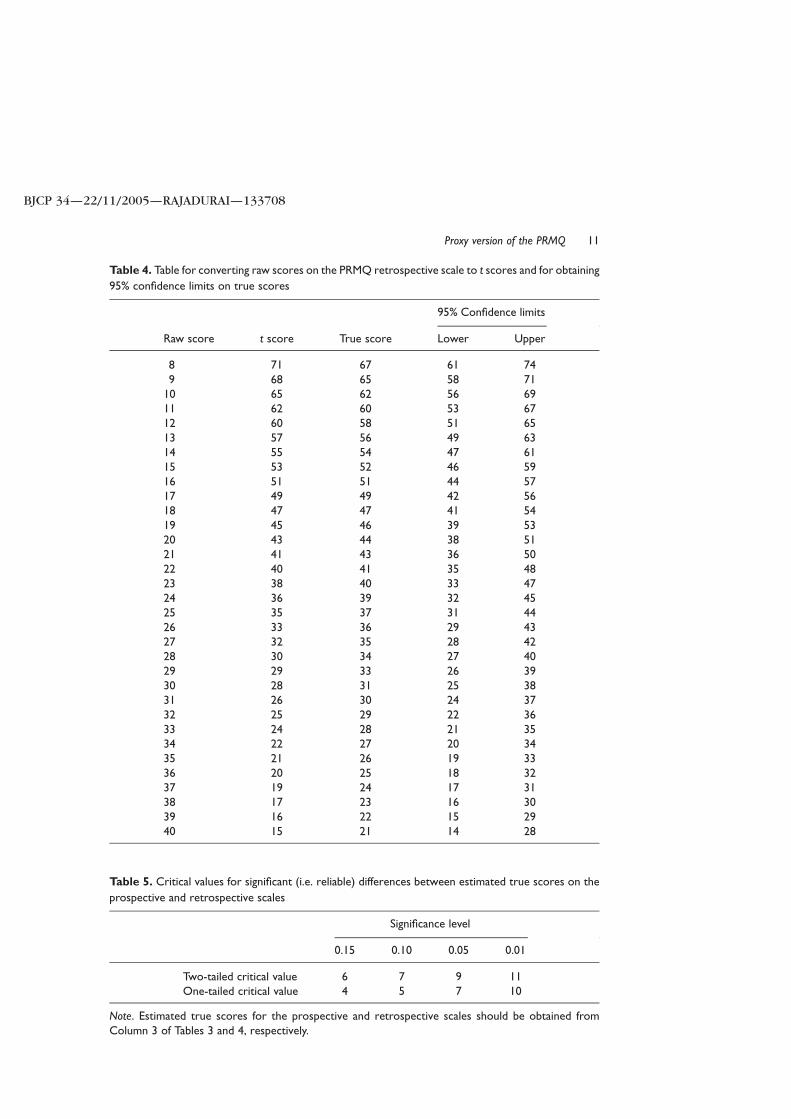
Table 4. Table for converting raw scores on the PRMQ retrospective scale to t scores and for obtaining
95% confidence limits on true scores
95% Confidence limits
Raw score t score True score Lower Upper
8 71 67 61 749 68 65 58 71
10 65 62 56 6911 62 60 53 6712 60 58 51 6513 57 56 49 6314 55 54 47 6115 53 52 46 5916 51 51 44 5717 49 49 42 5618 47 47 41 5419 45 46 39 5320 43 44 38 5121 41 43 36 5022 40 41 35 4823 38 40 33 4724 36 39 32 4525 35 37 31 4426 33 36 29 4327 32 35 28 4228 30 34 27 4029 29 33 26 3930 28 31 25 3831 26 30 24 3732 25 29 22 3633 24 28 21 3534 22 27 20 3435 21 26 19 3336 20 25 18 3237 19 24 17 3138 17 23 16 3039 16 22 15 2940 15 21 14 28
Table 5. Critical values for significant (i.e. reliable) differences between estimated true scores on the
prospective and retrospective scales
Significance level
0.15 0.10 0.05 0.01
Two-tailed critical value 6 7 9 11One-tailed critical value 4 5 7 10
Note. Estimated true scores for the prospective and retrospective scales should be obtained fromColumn 3 of Tables 3 and 4, respectively.
Proxy version of the PRMQ 11
BJCP 34—22/11/2005—RAJADURAI—133708
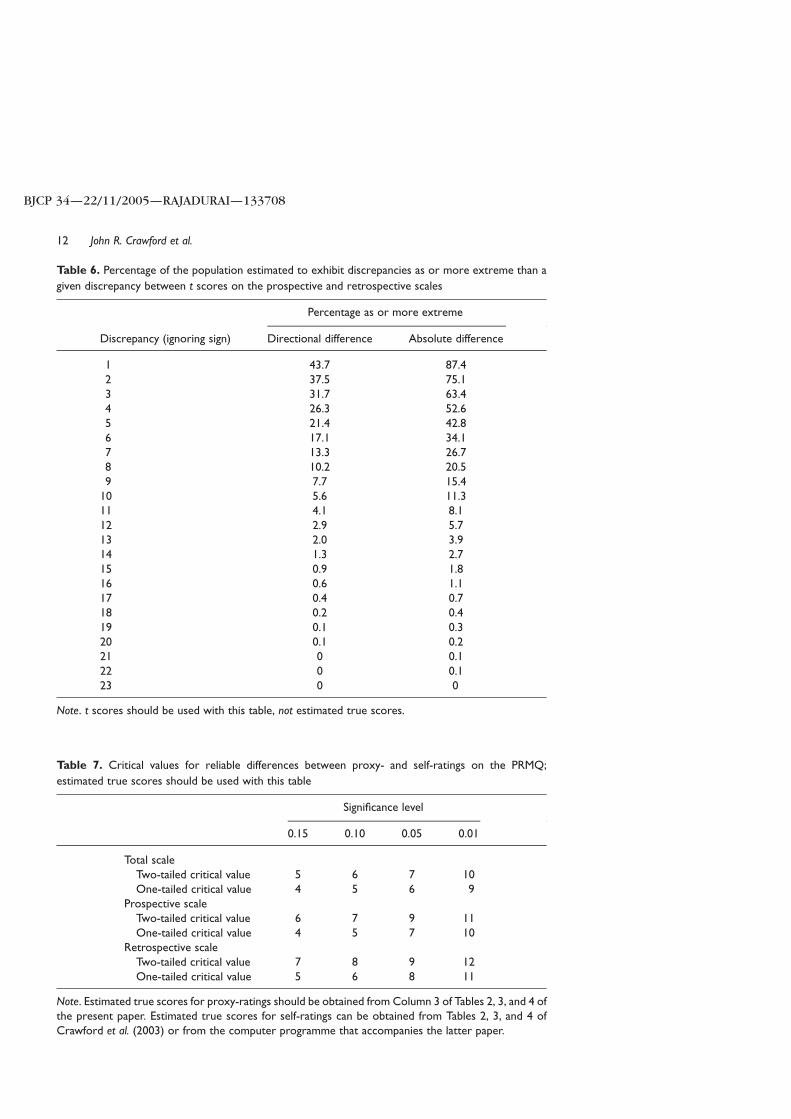
Table 6. Percentage of the population estimated to exhibit discrepancies as or more extreme than a
given discrepancy between t scores on the prospective and retrospective scales
Percentage as or more extreme
Discrepancy (ignoring sign) Directional difference Absolute difference
1 43.7 87.42 37.5 75.13 31.7 63.44 26.3 52.65 21.4 42.86 17.1 34.17 13.3 26.78 10.2 20.59 7.7 15.4
10 5.6 11.311 4.1 8.112 2.9 5.713 2.0 3.914 1.3 2.715 0.9 1.816 0.6 1.117 0.4 0.718 0.2 0.419 0.1 0.320 0.1 0.221 0 0.122 0 0.123 0 0
Note. t scores should be used with this table, not estimated true scores.
Table 7. Critical values for reliable differences between proxy- and self-ratings on the PRMQ;
estimated true scores should be used with this table
Significance level
0.15 0.10 0.05 0.01
Total scaleTwo-tailed critical value 5 6 7 10One-tailed critical value 4 5 6 9
Prospective scaleTwo-tailed critical value 6 7 9 11One-tailed critical value 4 5 7 10
Retrospective scaleTwo-tailed critical value 7 8 9 12One-tailed critical value 5 6 8 11
Note. Estimated true scores for proxy-ratings should be obtained from Column 3 of Tables 2, 3, and 4 ofthe present paper. Estimated true scores for self-ratings can be obtained from Tables 2, 3, and 4 ofCrawford et al. (2003) or from the computer programme that accompanies the latter paper.
John R. Crawford et al.12
BJCP 34—22/11/2005—RAJADURAI—133708
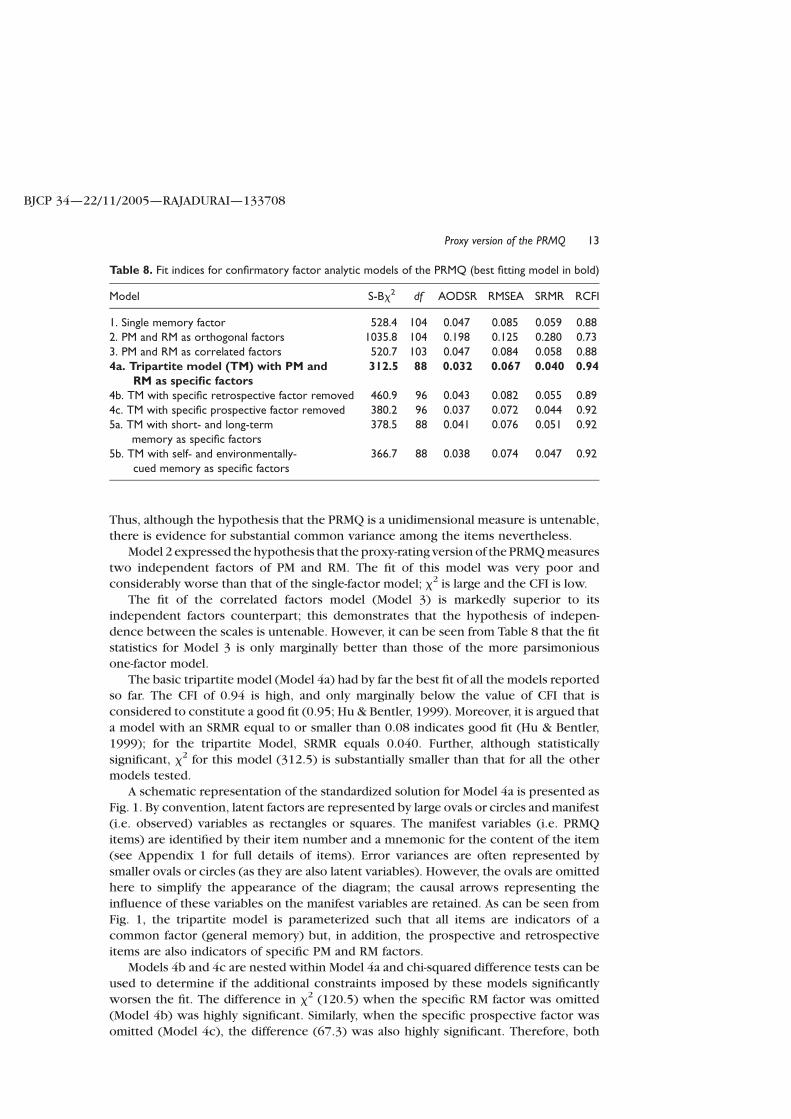
Thus, although the hypothesis that the PRMQ is a unidimensional measure is untenable,
there is evidence for substantial common variance among the items nevertheless.
Model 2 expressed the hypothesis that the proxy-rating version of the PRMQ measures
two independent factors of PM and RM. The fit of this model was very poor and
considerably worse than that of the single-factor model; x2 is large and the CFI is low.
The fit of the correlated factors model (Model 3) is markedly superior to its
independent factors counterpart; this demonstrates that the hypothesis of indepen-
dence between the scales is untenable. However, it can be seen from Table 8 that the fit
statistics for Model 3 is only marginally better than those of the more parsimonious
one-factor model.
The basic tripartite model (Model 4a) had by far the best fit of all the models reported
so far. The CFI of 0.94 is high, and only marginally below the value of CFI that is
considered to constitute a good fit (0.95; Hu & Bentler, 1999). Moreover, it is argued that
a model with an SRMR equal to or smaller than 0.08 indicates good fit (Hu & Bentler,
1999); for the tripartite Model, SRMR equals 0.040. Further, although statistically
significant, x2 for this model (312.5) is substantially smaller than that for all the other
models tested.
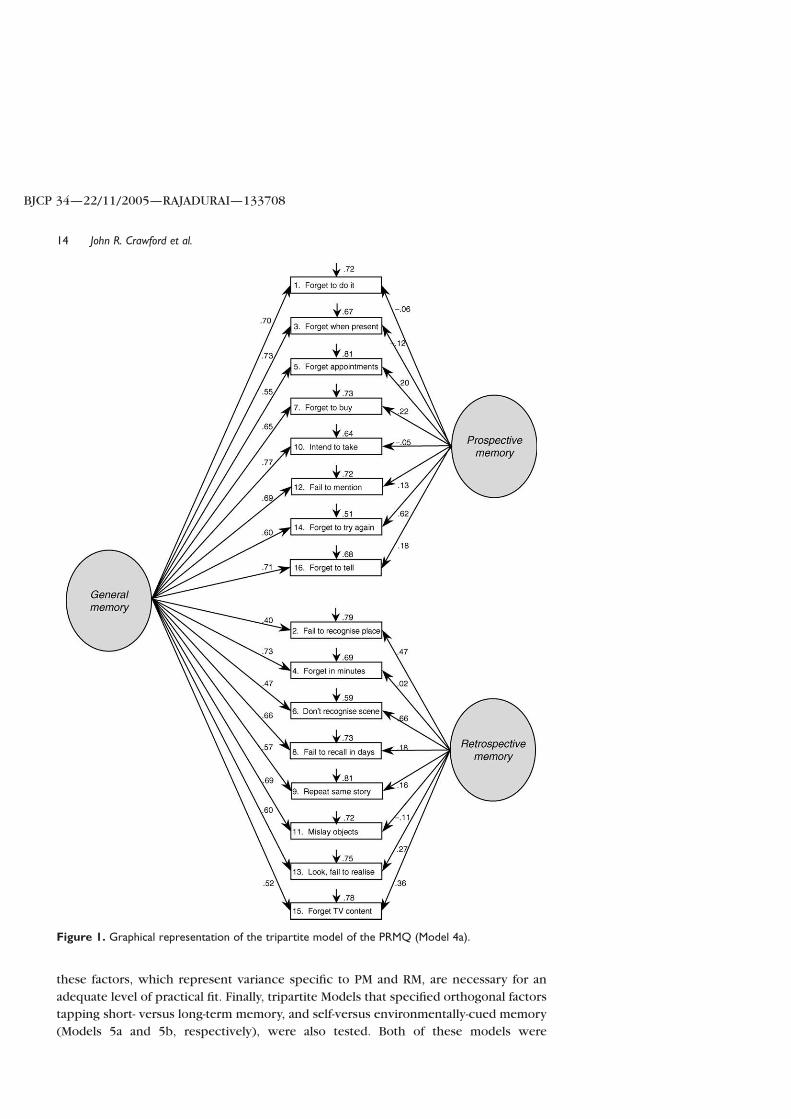
A schematic representation of the standardized solution for Model 4a is presented as
Fig. 1. By convention, latent factors are represented by large ovals or circles and manifest
(i.e. observed) variables as rectangles or squares. The manifest variables (i.e. PRMQ
items) are identified by their item number and a mnemonic for the content of the item
(see Appendix 1 for full details of items). Error variances are often represented by
smaller ovals or circles (as they are also latent variables). However, the ovals are omitted
here to simplify the appearance of the diagram; the causal arrows representing the
influence of these variables on the manifest variables are retained. As can be seen from
Fig. 1, the tripartite model is parameterized such that all items are indicators of a
common factor (general memory) but, in addition, the prospective and retrospective
items are also indicators of specific PM and RM factors.
Models 4b and 4c are nested within Model 4a and chi-squared difference tests can be
used to determine if the additional constraints imposed by these models significantly
worsen the fit. The difference in x2 (120.5) when the specific RM factor was omitted
(Model 4b) was highly significant. Similarly, when the specific prospective factor was
omitted (Model 4c), the difference (67.3) was also highly significant. Therefore, both
Table 8. Fit indices for confirmatory factor analytic models of the PRMQ (best fitting model in bold)
Model S-Bx2 df AODSR RMSEA SRMR RCFI
1. Single memory factor 528.4 104 0.047 0.085 0.059 0.882. PM and RM as orthogonal factors 1035.8 104 0.198 0.125 0.280 0.733. PM and RM as correlated factors 520.7 103 0.047 0.084 0.058 0.884a. Tripartite model (TM) with PM and
RM as specific factors312.5 88 0.032 0.067 0.040 0.94
4b. TM with specific retrospective factor removed 460.9 96 0.043 0.082 0.055 0.894c. TM with specific prospective factor removed 380.2 96 0.037 0.072 0.044 0.925a. TM with short- and long-term
memory as specific factors378.5 88 0.041 0.076 0.051 0.92
5b. TM with self- and environmentally-cued memory as specific factors
366.7 88 0.038 0.074 0.047 0.92
Proxy version of the PRMQ 13
BJCP 34—22/11/2005—RAJADURAI—133708
these factors, which represent variance specific to PM and RM, are necessary for an
adequate level of practical fit. Finally, tripartite Models that specified orthogonal factors
tapping short- versus long-term memory, and self-versus environmentally-cued memory
(Models 5a and 5b, respectively), were also tested. Both of these models were
Figure 1. Graphical representation of the tripartite model of the PRMQ (Model 4a).
John R. Crawford et al.14
BJCP 34—22/11/2005—RAJADURAI—133708
a substantially worse fit according to all criteria than the basic tripartite model that
allowed for specific retrospective and prospective components (Model 4a).
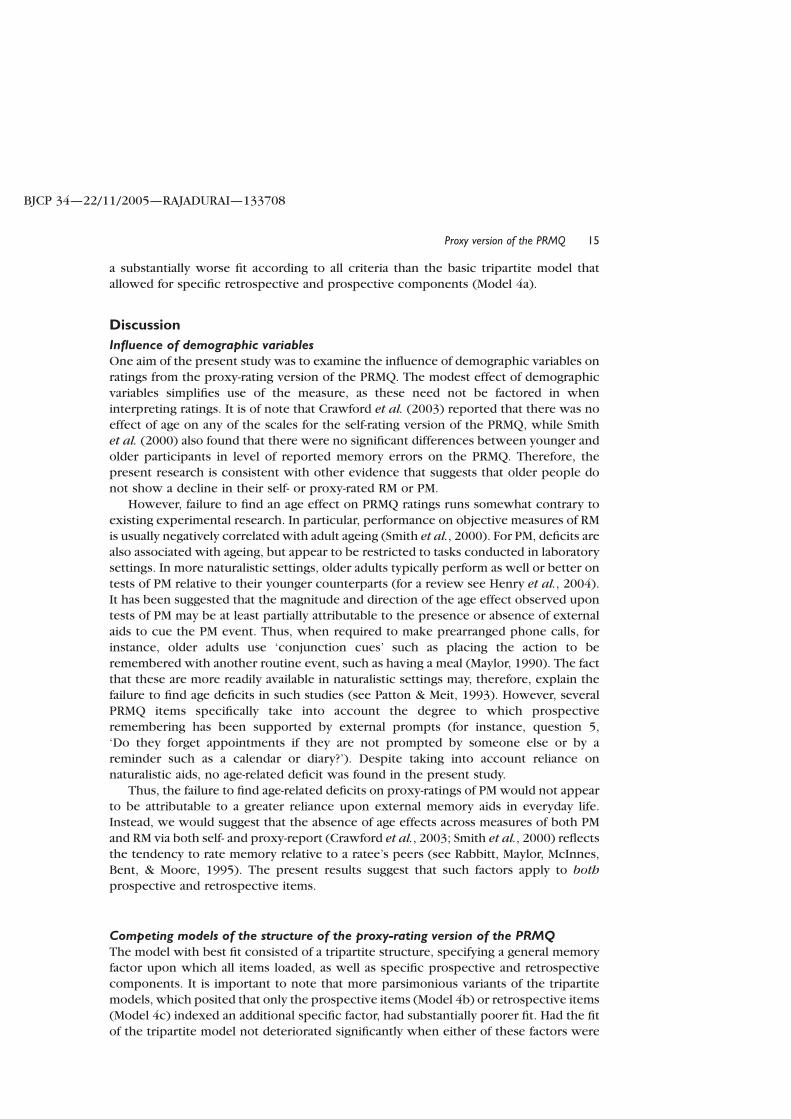
Discussion
Influence of demographic variablesOne aim of the present study was to examine the influence of demographic variables on
ratings from the proxy-rating version of the PRMQ. The modest effect of demographic
variables simplifies use of the measure, as these need not be factored in when
interpreting ratings. It is of note that Crawford et al. (2003) reported that there was no
effect of age on any of the scales for the self-rating version of the PRMQ, while Smithet al. (2000) also found that there were no significant differences between younger and
older participants in level of reported memory errors on the PRMQ. Therefore, the
present research is consistent with other evidence that suggests that older people do
not show a decline in their self- or proxy-rated RM or PM.
However, failure to find an age effect on PRMQ ratings runs somewhat contrary to
existing experimental research. In particular, performance on objective measures of RM
is usually negatively correlated with adult ageing (Smith et al., 2000). For PM, deficits are
also associated with ageing, but appear to be restricted to tasks conducted in laboratorysettings. In more naturalistic settings, older adults typically perform as well or better on
tests of PM relative to their younger counterparts (for a review see Henry et al., 2004).
It has been suggested that the magnitude and direction of the age effect observed upon
tests of PM may be at least partially attributable to the presence or absence of external
aids to cue the PM event. Thus, when required to make prearranged phone calls, for
instance, older adults use ‘conjunction cues’ such as placing the action to be
remembered with another routine event, such as having a meal (Maylor, 1990). The fact
that these are more readily available in naturalistic settings may, therefore, explain thefailure to find age deficits in such studies (see Patton & Meit, 1993). However, several
PRMQ items specifically take into account the degree to which prospective
remembering has been supported by external prompts (for instance, question 5,
‘Do they forget appointments if they are not prompted by someone else or by a
reminder such as a calendar or diary?’). Despite taking into account reliance on
naturalistic aids, no age-related deficit was found in the present study.
Thus, the failure to find age-related deficits on proxy-ratings of PM would not appear
to be attributable to a greater reliance upon external memory aids in everyday life.Instead, we would suggest that the absence of age effects across measures of both PM
and RM via both self- and proxy-report (Crawford et al., 2003; Smith et al., 2000) reflects
the tendency to rate memory relative to a ratee’s peers (see Rabbitt, Maylor, McInnes,
Bent, & Moore, 1995). The present results suggest that such factors apply to both
prospective and retrospective items.
Competing models of the structure of the proxy-rating version of the PRMQThe model with best fit consisted of a tripartite structure, specifying a general memoryfactor upon which all items loaded, as well as specific prospective and retrospective
components. It is important to note that more parsimonious variants of the tripartite
models, which posited that only the prospective items (Model 4b) or retrospective items
(Model 4c) indexed an additional specific factor, had substantially poorer fit. Had the fit
of the tripartite model not deteriorated significantly when either of these factors were
Proxy version of the PRMQ 15
BJCP 34—22/11/2005—RAJADURAI—133708
omitted, it would have indicated that either the theory that inspired the model was
flawed, or that the PRMQ items were inadequate indicators of the constructs, or both.
However, chi-squared difference tests revealed that both specific components were
necessary. The deterioration in fit when either was removed was significant. Moreover,
the tripartite model that specified specific PM and RM components was a substantially
better fit than the two competing tripartite models that specified short- versus long-termmemory factors, and self- versus environmentally-cued memory factors, respectively.
Therefore, the present results indicate that while there is evidence of a common factor,
the Prospective and Retrospective scales also represent legitimate constructs in their
own right.
However, although Crawford et al. (2003) found that, for the self-rating version of
the PRMQ, most items loaded highly on their respective specific factors, this was not
the case in the present study. Items were found to load more highly on the general
memory factor than upon the specific PM and RM factors. Thus, when the ratees aredrawn from the general (i.e. unimpaired) population, the proxy-rating PRMQ items
appear to be predominantly measuring a shared memory dimension. In particular,
the PM items loaded far more highly upon the general dimension than upon the
specific PM factor. This suggests that when ratees are drawn from the general
population, proxy-raters may not be as sensitive to differences between PM and RM
as self-raters.
The practical implications for clinicians of the results for the CFA models are as
follows. First, the evidence for a strong general memory factor indicates that it isacceptable to use the total score of the PRMQ as a measure of a proxy’s general rating of
a ratee’s memory. A strength of this general rating is that it is obtained from items that
systematically cover both prospective and retrospective memory in a variety of contexts
(i.e. the items also cover self- versus environmentally-cued memory, and short- versus
long-term memory).
Second, although the prospective and retrospective factors were not as prominent
for proxy-ratings as for self-ratings, these factors were required for a practical level of fit
(i.e. they did account for a significant proportion of the covariance among the PRMQitems). Therefore, there is value in also examining and comparing the PM and RM
subscales. Moreover, PM and RM can be dissociated in clinical populations (see Wilkins
& Baddeley, 1978) and, in such populations, the differences between these two types of
memory are likely to be more apparent to raters (i.e. PM and RM errors are likely to be of
a more gross nature). Indeed, given that the proxy-rated PM and RM scales index a very
substantial shared component in the general (i.e. unimpaired) population, even
relatively minor differences between the two measures may be regarded as abnormal.
Thus, this measure may be particularly sensitive to dissociations in the two types ofmemory. We would encourage empirical examination of this issue.
Reliabilities and normative dataThe reliabilities of the proxy-rating version of the PRMQ scales, as measured by
Cronbach’s a, were .92, .87, and .83 for the Total, Prospective, and Retrospective scales,
respectively. The narrowness of the confidence limits associated with these coefficientsindicate that they can be regarded as providing very accurate estimates of the internal
consistency of the PRMQ in the general adult population. The magnitude of these
coefficients demonstrates that the reliability of the PRMQ is very acceptable for use in
group studies or work with individuals.
John R. Crawford et al.16
BJCP 34—22/11/2005—RAJADURAI—133708
The conversion tables (Tables 2–4) can be used to convert raw scores to t scores and
obtain confidence limits. As noted, conversion of raw scores on the scales to a common
metric facilitates comparison of an individual’s scores. A practical example of the use of
the tables is presented in the next section. Although we view the conversion tables
primarily as an aid to interpretation of scores in work with individuals (i.e. in
neurological, neurosurgical, general medical, or mental health services), they could also
be usefully employed to set inclusion or exclusion criteria for research purposes.
Furthermore, as age and gender did not influence PRMQ ratings, the summary statistics
presented in Table 1 (i.e. means and SDs) could also be used as comparison standards for
studies of clinical populations in which a control sample is unavailable.
Illustrative example of scoring and interpreting the PRMQThe meaning and use of the conversion tables and tabled data on the reliability and
abnormality (i.e. rarity) of discrepancies between the Prospective and Retrospective
scales are best illustrated by an example. Suppose a patient is referred to a memory
clinic with a suspected early stage frontal lobe dementia, and that their spouse
completed the proxy-rating version of the PRMQ. The patient’s proxy-rated raw scores
on the Prospective and Retrospective scales were 32 and 21, respectively. Consulting
Table 3, the t score on the Prospective scale is 28; this score is, therefore, over 2 SDs
below the mean of the normative sample. It can also be seen from Table 3 that the 95%
confidence limits on the true score are from 25 to 37; there is a 95% probability that
the patient’s true score lies between these limits. Consulting Table 4, the t score on the
Retrospective scale is 41 (approximately one SD below the normative mean), and
the 95% limits are 36 and 50.
From Tables 3 and 4, it can also be seen that the estimated true scores on the
Prospective and Retrospective scales were 31 and 43, respectively, yielding a
discrepancy between true scores of 12 points. Referring to Table 5, it can be seen that
this discrepancy exceeds the critical value (11) for significance at the 0.01 level
(two-tailed). Therefore, the discrepancy between the patient’s prospective and
retrospective scores are taken to reflect a genuine difference in proxy-rated memory
rather than the effect of measurement error; that is, it is a reliable difference. One-tailed
values for assessing the reliability of the difference are also presented in Table 5, as it
would be legitimate to use these if the researcher or clinician wished to test a directional
hypothesis.
To assess the rarity or abnormality of the discrepancy between proxy-rated memory
on the Prospective and Retrospective scales, we use t scores, not estimated true scores.
The discrepancy between the t scores of 41 and 28 is 13 points. Referring to Table 6,
it can be seen that only 2.0% of the population would be expected to show a
discrepancy in favour of RM as extreme as that obtained.
The distinction between the reliability of a difference and the abnormality (or rarity)
of a difference is an important one in assessment, and the two concepts are often
confused (Crawford, 2004; Crawford, Venneri, & O’Carroll, 1998). As noted above, a
reliable difference between the Prospective and Retrospective scales indicates that
there is a genuine difference in proxy-rated memory (i.e. the difference does not simply
reflect measurement error). However, many raters may score an individual’s PM as
higher than their RM and vice-versa. Therefore, a reliable difference need not be unusual
or rare (and, in clinical settings, a reliable difference need not necessarily be a cause for
concern). As a result, information on the reliability of a difference should be
Proxy version of the PRMQ 17
BJCP 34—22/11/2005—RAJADURAI—133708
complemented with information on the rarity of the difference. Note that, in the present
example, the difference between PM and RM was both reliable and rare (although this
need not always be the case).
Although the labour involved in scoring the PRMQ using the tabulated data
presented here is relatively modest, we have prepared a simple computer programme
(for PCs) to automate scoring and analysis of an individual’s proxy-rated PRMQ data. This
programme (PRMQPROXY.EXE) can be downloaded at: http://www.abdn.ac.uk/ ,Q2
psy086/dept/PRMQ_proxy.htm.
Finally, suppose that the patient had completed the self-rating version of the PRMQ
and that their estimated true scores on the Prospective scale was 47 (the patient rated
themselves only slightly lower than average). The difference between the patient’s
estimated true score and the estimated true score for the equivalent proxy-rating (31)
is 16. Referring to Table 7, it can be seen that this difference exceeds the critical value
(11) for a reliable difference at the 0.01 level (two-tailed). Thus, the difference
between the patient’s rating and the spouse’s rating is highly reliable (i.e. the
difference is very unlikely to have arisen from measurement error). Such a pattern
suggests that the patient has poor insight into their deficit (Hickox & Sunderland,
1992).
Use of the proxy-rated version of the PRMQ in clinical practiceAs discussed previously, it is recognized that the use of proxy-rated measures may be
useful for the assessment of patients with suspected memory deficits, particularly when
these have arisen from of brain injury. Moreover, proxy-rating versions of instruments
often correlate more highly with objective measures of assessment than with self-rating
versions of instruments (Sunderland et al., 1984, 1988).
Nevertheless, it is important to stress that the PRMQ is not a direct test of memory
and should not be interpreted in isolation. Rather, PRMQ results should be integrated
with the results from formal tests and clinical interviews. However, there is an
increasing recognition that, where possible, we should employ multiple indicators of
the constructs we assess. Therefore, the use of formal tests of cognitive functioning
should be supplemented with proxy- and/or self-reports, as well as by naturalistic
observations. Moreover, it is particularly beneficial as a means of identifying and
assessing changes in the severity of everyday memory problems (Cohen, 1996).
Future research on the PRMQThe normative data for self-rating and proxy-ratings were obtained from different
samples. As a result, it was possible only to examine the reliability of differences
between self- and proxy-ratings. However, it would be useful to extend this so that the
abnormality of the difference between self- and proxy-ratings could be quantified. This
would require ratings to be obtained from a sample in which self- and proxy-ratings
were collected for the same individuals. In addition, future research could study the
utility of the PRMQ in clinical practice by examining the ability of the self- and proxy-
rating version to identify memory difficulties in neurological or psychiatric populations
and also to examine the relationship between formal tests of memory and self- and
proxy-ratings. Moreover, it would be useful to examine whether discrepancies between
self- and proxy-ratings are associated with independent evidence of diminished insight
or dysexecutive problems.
John R. Crawford et al.18
BJCP 34—22/11/2005—RAJADURAI—133708
Conclusions
The present study indicates that the proxy-rating version of the PRMQ has a tripartite
latent structure; that is, in addition to measuring general proxy-rated memory, it also
measures specific components corresponding to PM and RM. The PRMQ has a potential
advantage over other proxy- and self-report scales in that it balances prospective and
retrospective items, and measures these constructs systematically over a range of
contexts. The provision of norms means that proxy-rated memory can be readily
quantified (as can the degree of confidence attached to the ratings). The utility of the
scale is increased by the provision of methods that allow evaluation of discrepancies
between the prospective and retrospective ratings and between proxy- and self-ratings.
References
Baddeley, A. D. (1990). Human memory; Theory and practice. Hove: Erlbaum.
Bentler, P. M. (1995). EQS structural equations program manual. Encino, CA: Multivariate
Software.
Box, G. E. P., & Cox, D. R. (1964). An analysis of transformations. Journal of the Royal Statistical
Society, Series B, 26, 211–246.
Burgess, P. W., & Shallice, T. (1997). The relationship between prospective and retrospective
memory: Neuropsychological evidence. In M. A. Conway (Ed.), Cognitive models of memory
(pp. 247–272). Hove, East Sussex: Psychology Press.
Cohen, G. (1996). Memory in the real world (2nd ed.). Hove, East Sussex: Psychology Press.
Cohen, J. (1977). Statistical power analysis for the behavioral sciences (Rev. ed.). New York:
Academic Press.
Cook, R. D., & Weisberg, S. (1999). Applied regression, including computing and graphics.
New York: Wiley.
Craik, F. I. M., Anderson, N. D., Kerr, S. A., & Li, K. Z. H. (1995). Memory changes in normal ageing.
In A. D. Baddeley, B. A. Wilson & F. N. Watts (Eds.), Handbook of memory disorders
(pp. 211–241). Chichester: Wiley.
Crawford, J. R. (2004). Psychometric foundations of neuropsychological assessment.
In L. H. Goldstein & J. E. McNeil (Eds.), Clinical neuropsychology: A practical guide to
assessment and management for clinicians (pp. 121–140). Chichester: Wiley.
Crawford, J. R., Garthwaite, P. H. (2004). Testing for suspected impairments and dissociations in
single-case studies in neuropsychology: Evaluation of alternatives using Monte Carlo
simulations and revised tests for dissociations. Neuropsychology.Q3
Crawford, J. R., Smith, G., Maylor, E. A., Della Sala, S., & Logie, R. H. (2003). The prospective and
retrospective memory questionnaire (PRMQ): Normative data and latent structure in a large
non-clinical sample. Memory, 11, 261–275.
Crawford, J. R., Venneri, A., & O’Carroll, R. E. (1998). Neuropsychological assessment of the
elderly. In A. S. Bellack & M. Hersen (Eds.), Comprehensive clinical psychology, Vol. 7:
Clinical geropsychology (pp. 133–169). Oxford, UK: Pergamon.
Dobbs, A. R., & Reeves, M. B. (1996). Prospective memory: More than memory.
In M. A. Brandimonte, G. O. Einstein & M. A. McDaniel (Eds.), Prospective memory: Theory
and applications. Mahwah, NJ: Erlbaum.
Ellis, J., & Kvavilashvili, L. (2000). Prospective memory in 2000: Past, present and future
directions. Applied Cognitive Psychology, 14, S1–S9.
Glutting, J. J., Mcdermott, P. A., & Stanley, J. C. (1987). Resolving differences among methods of
establishing confidence limits for test scores. Educational and Psychological Measurement,
1987, 607–614.Q4
Henry, J. D., MacLeod, M., Phillips, L. H., & Crawford, J. R. (2004). Meta-analytic review of
prospective memory and aging. Psychology and Aging, 19, 27–39.
Proxy version of the PRMQ 19
BJCP 34—22/11/2005—RAJADURAI—133708
Herrmann, D. J. (1984). Questionnaires about memory. In J. E. Harris & P. E. Morris (Eds.),
Everyday memory, actions and absent-mindedness (pp. 133–151). London: Academic Press.
Hickox, A., & Sunderland, A. (1992). Questionnaire and checklist approaches to assessment of
everyday memory problems. In J. R. Crawford, D. M. Parker & W. W. McKinlay (Eds.),
A handbook of neuropsychological assessment (pp. 103–113). Hove: Erlbaum.
Hu, L., & Bentler, P. M. (1998). Fit indices in covariance structure modeling: Sensitivity to
underparmaterized model misspecification. Psychological Methods, 3, 424–425.
Hu, L., & Bentler, P. M. (1999). Cutoff criteria for fit indexes in covariance structure analysis:
Conventional criteria versus new alternatives. Structural Equation Modeling, 6(1), 55.
Loehlin, J. C. (1998). Latent variable models. Hillsdale, NJ: Erlbaum.
Maylor, E. A. (1990). Age and prospective memory. Quarterly Journal of Experimental
Psychology, 42A, 471–493.
Morris, P. E. (1984). The validity of subjective reports on memory. In J. E. Harris & P. E. Morris
(Eds.), Everyday memory, actions and absent-mindedness (pp. 153–172). London: Academic
Press.
Nunnally, J. C., & Bernstein, I. H. (1994). Psychometric theory (3rd ed.). New York: McGraw-Hill.
Patton, G. W., & Meit, M. (1993). Effect of aging on prospective and incidental memory.
Experimental Aging Research, 19, 165–176.
Rabbitt, P., Maylor, E. A., McInnes, L., Bent, N., & Moore, B. (1995). What goods can self-assessment
questionnaires deliver for cognitive gerontology. Applied Cognitive Psychology, 9, S127–S152.
Salthouse, T. A., Berish, D. E., & Siedlecki, K. L. (2004). Construct validity and age sensitivity of
prospective memory. Memory and Cognition.Q5
Silverstein, A. B. (1989a). Reliability and abnormality of scaled score ranges. Journal of Clinical
Psychology, 45(6), 926–929.
Silverstein, A. B. (1989b). Reliability and abnormality of scaled-score ranges. Journal of Clinical
Psychology, 45, 926–929.
Smith, G., Della Sala, S., Logie, R. H., & Maylor, E. A. (2000). Prospective and retrospective memory
in normal ageing and dementia: A questionnaire study. Memory, 8, 311–321.
Stanley, J. C. (1971). Reliability. In R. L. Thorndike (Ed.), Educational measurement (2nd ed.).
Washington, DC: American Council on Education.
Steiger, J. H. (2000). Point estimation, hypothesis testing, and interval estimation using the RMSEA:
Some comments and a reply to Hayduk and Glaser. Structural Equation Modeling, 7,
149–162.
Sunderland, A., Harris, J. E., & Baddeley, A. D. (1984). Assessing everyday memory after severe
head injury. In J. E. Harris & P. E. Morris (Eds.), Everyday memory, actions and absent-
mindedness (pp. 191–206). London: Academic Press.
Sunderland, A., Harris, J. E., & Baddeley, A. D. (1988). Do laboratory tests predict everyday
memory? A neuropsychological study. Journal of Verbal Learning and Verbal Behaviour, 22,
341–357.
Wilkins, A. J., & Baddeley, A. D. (1978). Remembering to recall in everyday life: An approach to
absentmindedness. In M. M. Gruneberg, P. E. Morris & R. N. Sykes (Eds.), Practical aspects of
memory. London: Academic Press.
Received 28 May 2004; revised version received 22 September 2004
John R. Crawford et al.20
BJCP 34—22/11/2005—RAJADURAI—133708
Appendix 1
Proxy-version of the PRMQ Items and their categorizations.
Item no. ItemProspective vs.retrospective
Short- vs.long-term
Self-cued vs.envir.-cued
1 Do they decide to do somethingin a few minutes time andthen forget to do it?
Prospective Short-term Self-cued
2 Do they fail to recognize aplace they have visited before?
Retrospective Long-term Envir.-cued
3 Do they fail to do somethingthey were supposed to do afew minutes later even though itis there in front of them,like take a pill or turnoff the kettle?
Prospective Short-term Envir.-cued
4 Do they forget something they weretold a few minutes before?
Retrospective Short-term Self-cued
5 Do they forget appointments if theyare not prompted by someone elseor by a reminder such asa calendar or diary?
Prospective Long-term Self-cued
6 Do they fail to recognize acharacter in a radio or televisionshow from scene to scene?
Retrospective Short-term Envir.-cued
7 Do they forget to buy somethingthey planned to buy, like abirthday card, even when they seethe shop?
Prospective Long-term Envir.-cued
8 Do they fail to recall thingsthat have happened to them inthe last few days?
Retrospective Long-term Self-cued
9 Do they repeat the same storyto the same person on differentoccasions?
Retrospective Long-term Envir.-cued
10 Do they intend to take somethingwith them, before leaving a roomor going out, but minutes laterleave it behind, even though itis there in front of them?
Prospective Short-term Envir.-cued
11 Do they mislay something that theyhave just put down, like amagazine or glasses?
Retrospective Short-term Self-cued
12 Do they fail to mention orgive something to a visitor thatthey were asked to pass on?
Prospective Long-term Envir.-cued
13 Do they look at something withoutrealizing they have seen it momentsbefore?
Retrospective Short-term Envir.-cued
Proxy version of the PRMQ 21
BJCP 34—22/11/2005—RAJADURAI—133708
Appendix1. (Continued)
Item no. Item
Prospective vs.retrospective
Short- vs.long-term
Self-cued vs.envir.-cued
14 If they tried to contact afriend or relative who was out,would they forget to try againlater?
Prospective Long-term Self-cued
15 Do they forget what they watchedon television the previous day?
Retrospective Long-term Self-cued
16 Do they forget to tell someonesomething they had meant to mentiona few minutes ago?
Prospective Short-term Self-cued
Note. Envir.-cued ¼ Environmentally-cued.
John R. Crawford et al.22
BJCP 34—22/11/2005—RAJADURAI—133708
Author QueriesJOB NUMBER: 34
JOURNAL: BJCP
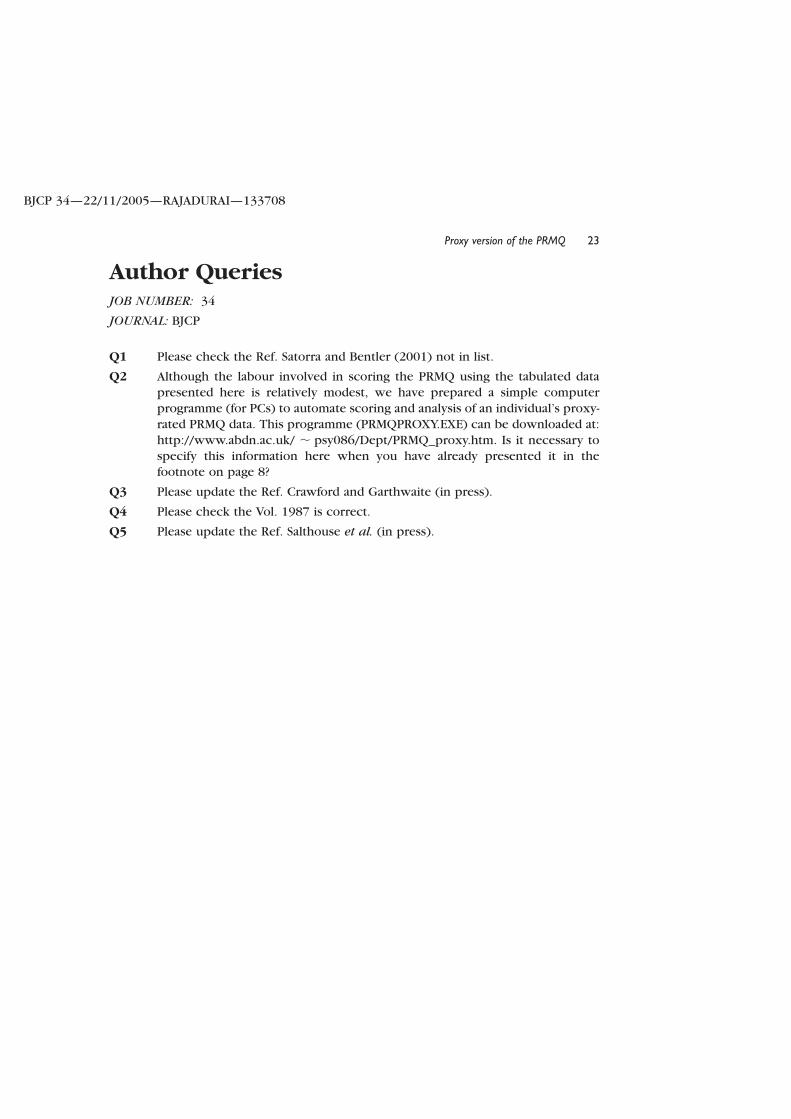
Q1 Please check the Ref. Satorra and Bentler (2001) not in list.
Q2 Although the labour involved in scoring the PRMQ using the tabulated data
presented here is relatively modest, we have prepared a simple computer
programme (for PCs) to automate scoring and analysis of an individual’s proxy-
rated PRMQ data. This programme (PRMQPROXY.EXE) can be downloaded at:
http://www.abdn.ac.uk/ , psy086/Dept/PRMQ_proxy.htm. Is it necessary to
specify this information here when you have already presented it in thefootnote on page 8?
Q3 Please update the Ref. Crawford and Garthwaite (in press).
Q4 Please check the Vol. 1987 is correct.
Q5 Please update the Ref. Salthouse et al. (in press).
Proxy version of the PRMQ 23
BJCP 34—22/11/2005—RAJADURAI—133708