Embed Size (px)
Citation preview

1
The PSETA Sector Skills Plan
Update for 2015-2016
Public Service Sector Education and Training Authority (PSETA)
09/30/2014

2
SIGNING OFF OF THE PSETA SECTOR SKILLS PLAN 2015/16 We, the undersigned, hereby endorse and approve, on behalf of the Public Service Sector Education and Training Authority (PSETA) and Management, the contents of the Sector Skills Plan Update for the year 2015–2016. Signature ………………………….. Date: …………………………. PSETA CEO Signature ………………………….. Date: …………………………. PSETA CHAIRPERSON Signature: ...................................... Date: ...................................... NEHAWU Signature: ....................................... Date: ...................................... PSA Signature: ....................................... Date: ...................................... POPCRU Signature ………………………….. Date: …………………………. DEPARTMENT OF PUBLIC SERVICE AND ADMINISTRATION

3
Contents
List of figures ........................................................................................................................ 5
List of tables .......................................................................................................................... 5
Acronyms .............................................................................................................................. 7
Executive summary ............................................................................................................... 9
Introduction and policy environment ...................................................................................... 9
High level profile of public service personnel ......................................................................... 9
Framework for demand analysis ......................................................................................... 10
Demand side analysis ......................................................................................................... 11
Supply side analysis ........................................................................................................... 14
Priority scrace and critical skills for the public service ......................................................... 19
Sector Skills Strategy for the Public Service ........................................................................ 20
Chapter 1: Introduction and framework ............................................................................... 24
1.1. Introduction ............................................................................................................... 24
1.2. PSETA’s mandate and coverage ............................................................................... 24
1.3. Roleplayers ............................................................................................................... 28
1.4. Policy environment .................................................................................................... 29
1.5. Changes in the skills development landscape ........................................................... 34
1.6. A framework for skills development in the public service ........................................... 36
1.6.1. Understanding the uneven capacity of the South African state ............................... 39
1.6.2. Research on the drivers of organsational performance: critical skills for
organisational development ................................................................................................ 41
1.7. Conclusion: skills to support organsational development ........................................... 43
Chapter 2: Demand for skills and training in the public service ............................................ 45
2.1. Introduction ............................................................................................................... 45
2.2. Note on data sources ................................................................................................ 45
2.3. Current profile of the Public service ........................................................................... 47
2.4. Growth and replacement demand ............................................................................. 56
2.5. Occupations in which there is a scarcity of skill ......................................................... 60
2.6. Competency gaps of current public servants ............................................................. 70
2.7. Conclusion: priority skills for building a ‘capable’ public service ................................. 73
Chapter Three: Supply of skills and training for the public service ....................................... 76
3.1. Introduction ............................................................................................................... 76
3.2. Skills formation through the formal education system ................................................ 78
3.2.1. National Senior Certificate (Matriculation) ............................................................... 78
3.2.2. Higher education .................................................................................................... 81

4
3.2.3. FET Colleges ......................................................................................................... 85
3.3. Training and development in the workplace............................................................... 89
3.3.1. Learnerships, skills programmes and internships ................................................... 89
3.3.2. Improving workplace trianing .................................................................................. 90
3.4. Public service training institutions .............................................................................. 92
3.5. Supply side focus for building a capable state ........................................................... 94
Chapter Four: Priority Scarce and Critical Skills for the Public Service ................................ 96
4.1. Introduction ............................................................................................................... 96
4.2. A “capacity-building” approach to priority skills development ..................................... 96
4.3. Overview of PSETA’s 2014/2015 priority scarce and critical skills ........................... 101
4.4. Priority 1: Rebuilding the Professional and Technical Capabilities of the Public
4.5. Priority 2: Procurement and Contract Management Skills ........................................ 111
4.6. Priority 3: Building Operationally Focused Management Skills ............................... 118
4.7. Priority 4: Generic Skills ........................................................................................ 122
4.8. Priority 4: Human Resource Management, Development and Planning Skills ........ 124
4.9. Priority 6: ‘Bridging into Work’ – leaning from the Green Skills sector ..................... 128
4.10. OFO Codes, Qualifications and Estimated Shortages for the Priority Scarce and
Critical Skills ..................................................................................................................... 130
4.10.1. OFO Codes, Qualifications and Estimated Numbers for the Scarce and Critical
Skills Priorities................................................................................................................... 132
Chapter Five: Sector Skills Strategy for the Public Service ............................................... 137
5.1. Introduction ............................................................................................................. 137
5.2. Strategic and policy environment ............................................................................. 137
5.3. A strategic approach ............................................................................................... 140
5.4. Integrated approach for building the public service skills development system ........ 143
5.5. Strategies for Delivering the Priority Skills area ....................................................... 154
5.6. Strategic Overview .................................................................................................. 159
References ....................................................................................................................... 167
Appendix One: PSETA Scope of Coverage ...................................................................... 173
Appendix Two: Excerpts from the Public Administration Management Act of 2014 ........... 179
Appendix Thee: Description of the Major Occupational Classification / Groups used in Persal
......................................................................................................................................... 181

5
List of figures
Figure 1: Diagram summarising the Strategic Framework ................................................... 34
Figure 2: PSETA approach to identifying priority skills for the public service ....................... 38
Figure 3: Graduations from all public higher education institutions, 2008-2012 ................... 83
Figure 4: The integrated capacity development framework ................................................. 98
Figure 5: Overview of the IDMS skills plan ........................................................................ 109
Figure 6: The PSETA Sector Skills Strategy ..................................................................... 143
List of tables
Table 1: National departments reporting only to PSETA ..................................................... 26
Table 2: PSETA Sources of Revenue in the 2012/13 financial year .................................... 36
Table 3: Formal employement by the public, private and non-profit sectors, 2014 .............. 47
Table 4: Number of people employed in the South African public service, 2014.................. 48
Table 5: Number of people employed in the public service under the Public Service Act,
2014 .................................................................................................................................... 48
Table 6: Employment in the public service under the Public Service Act by gender, 2014 .. 49
Table 7: Employment in the public service under the Public Service Act by race, 2014 ....... 49
Table 8: Years of service for those employed under the Public Service Act, 2014 .............. 50
Table 9: Years of service for those employed under the Public Service Act by race, 2014 .. 50
Table 10: Age of employees employed under the Public Service Act, 2014 ........................ 51
Table 11: Public service employment by Persal Major Occupational Category, 2014 .......... 51
Table 12: Public service employment by Persal Major Occupational Category, for Public
Servants employed under the Public Service Act, 2014 ...................................................... 52
Table 13: Persal major occupational category by race for the public service, 2014 ............. 54
Table 14: Public service employment by disablity status and Persal Major Occupational
Category, for Public Servants employed under the Public Service Act, 2014 ...................... 55
Table 15: Qualification levels of personnel employed in local, provincial and national
government, 2014 ............................................................................................................... 55
Table 16: Change in number of people employed in the Public service, 2012 to 2014 ........ 57
Table 17: Change in number of people employed under the Public Service Act, 2012 to 2014
........................................................................................................................................... 57
Table 18: Formal employment by the public, private and non-profit sectors, 2013 and 201457
Table 19: Reasons for officials leaving the Public service over the 2013 to 2014 period ..... 58
Table 20: Vacancy rates per province, 2014 ....................................................................... 61
Table 21: Vacancy rates and numbers in the public service per Persal Major Occupational
Category, 2013 and 2014 .................................................................................................... 63
Table 22: Vacancy rates and numbers per Persal Unit Occupational Category, 2014 ......... 64
Table 23: SMS comptency assessment results for salary level (SMS level), 2011 to 2013 . 72

6
Table 24: HR Connect results for Public Servants ‘Knowledge Proficiency’ shown per Minor
OFO Group, 2012 ............................................................................................................... 72
Table 25: National Senior Certificate examination results, 2012 .......................................... 79
Table 26: Headcount enrolments at all public higher education institutions in South Africa,
2012 .................................................................................................................................... 82
Table 27: Graduations at all Higher Education Institutions in South Africa, 2012 ................. 84
Table 28: Number of NC(V) Level 4 students registered, wrote and passed, per course, 2011
........................................................................................................................................... 87
Table 29: Number of Report 191 N3 students registered, wrote and passed, per course,
2011 .................................................................................................................................... 87
Table 30: Number of Report 191 N6 students registered, wrote and passed, per course,
2011 .................................................................................................................................... 88
Table 31: Functions and capabilities involved in effective procurement and contract
management ..................................................................................................................... 112
Table 32: HR Connect data on generic skills training required by public servants ............. 122
Table 33: The PSETA Scope of Coverage ....................................................................... 165

7
Acronyms
ANC African National Congress
ATR Annual Training Report
CBO Community Based Organisation
CESM Classification of Educational Subject Matter
CETA Construction Education and Training Authority
CHE Council for Higher Education
CIP Compulsory Induction Programme
DHA Department of Home Affairs
DHET Department of Higher Education and Training
DIRCO Department of International Relations and Cooperation
DPME Department of Performance Monitoring and Evaluation
DPSA Department of Public Service and Administration
DTI Department of Trade and Industry
EPWP Extended Public Works Programme
ETQA Education and Training Quality Assurance Body
FET Further Education and Training
GSETA Government Sector Education and Training Authority Forum
HEMIS Higher Education Information Management System
HEI Higher Education Institution
HR Human resource
HRD Human resource development
HRDSA Human Resource Development Council of South Africa
IDMS Infrastructure Delivery Management System
MPAT Management Performance Assessment Tool
MTSF Medium Term Strategic Framework
NC(V) National Certificate (Vocational)
NDP National Development Plan
NGO Non-governmental organisation
NPC National Planning Commission
NQF National Qualifications Framework
NSC National Senior Certificate
NSDS National Skills Development Strategy
OCPO Office of the Chief Procurement Officer
OD Organisational Development
OFO Organising Framework for Occupations
PALAMA Public Administration Leadership and Management Academy
PARI Public Affairs Research Institute
PDP Personal Development Plan
PIVOTAL Professional, vocational, technical and academic learning programmes
PSC Public Service Commission
8
PSETA Public Service Sector Education and Training Authority
QCTO Quality Council for Trades and Occupations
RPL Recognition of Prior Learning
SARS South African Revenue Service
SADC Southern African Development Community
SAQA South African Qualifications Authority
SCM Supply chain management
SDF Skills Development Facilitator
SETA Sector Education and Training Authorities
SIPs Strategic Integrated Projects
SMS Senior Management Service
SSP Sector Skills Plan
StatsSA Statistics South Africa
TAU Technical Assistance Unit
TVET Technical and Vocational Education and Training
WSP Workplace Skills Plan

9
Executive summary
Introduction and policy environment
1. PSETA is responsible for skills development in the public service, and specifically for the
development of “transversal” skills across the public service as well as for skills
development in functions undertaken exclusively by the public service (such diplomacy).
Transversal functions include administration, management, planning, legislation and
policy development.
2. The National Development Plan (NDP) calls for the building of a “capable state” –
underpinned by “effectively coordinated state institutions with skilled public servants who
are committed to the public good and capable of delivering consistently high-quality
services, while prioritising the nation’s developmental objectives” (NDP, 2012). The PSSC
has integrated Ministerial Outcomes 5 and 12 as the goal for the PSSC work, i.e.
developing the “skilled and capable workforce required to achieve a more efficient,
effective, professional and development-oriented state.” (DPSA, 2013b). In March this
year the HRD Council published the ‘National Integrated Human Resource Development
Plan 2014-2018’ (HRD Council, 2014). The Plan identifies a number of focus areas for
meeting the goal of developing a, “Capable Public Sector with Effective and Efficient
Planning and Implementation Capabilities”.
3. There are a number of changes in the skills development landscape with relevance for
PSETA’s work. The relevance of these changes for PSETA’s work are discussed in the
body of the report. These changes include: the establishment of the School of
Government; the finalisation of the agreement on the funding model for PSETA; the
development of new stakeholder forums for supporting skills development – specifically
the provincial HRD Councils; and the establishment of the Labour Market Intelligence
Project (LMIP), which is developing centralised skills forecasting capabilities for the South
African labour market.
High level profile of public service personnel
4. According to the Persal database, there are 1.3 million people employed in the Public
Service. The number of personnel employed under the Public Service Act is 509 905.
There are more women than men employed in all provincial governments across the
provinces and in national government (58%). Eighty percent of those employed under the
Public Service are black African, 9% are Coloured, 8% white and just over 2% are Indian.
Just less than 1% of those employed under the Public Service Act have some form of
disability.

10
5. School educators make up nearly a third of those employed in national and provincial
government. In terms of the officials employed under the Public Service Act: a third are
classified under the Persal category ‘administrative office workers and 25% under the
category ‘Professionals and managers’ (note that Persal does not use the OFO occupation
categories).
6. A 2011 estimate of growth demand in the public service, i.e. the estimation of the growth
in the public service as a result of new jobs (for those employees to be employed under
the Public Service Act) was 4.4% on average over the 2012 to 2016 period (given historical
trends) (DPSA, 2013b). The majority of personnel who exited the public service over the
last year did so due to resignations (46% of terminations), with 38% of terminations due to
retirement. The biggest reason for staff turnover was created by mobility within the public
service rather exits from the Public Service.
Framework for demand analysis
7. This year’s SSP Update builds on the foundations established in the 2014/15 SSP: an
approach was developed for directing the identification of priority skills and training needs
for the public service. This approach is intended to guide the work of the Public Service
Sector Education and Training Authority (PSETA), as well as the work of skills
development practitioners and senior managers in the public service.
8. Demand analysis has involved triangulating a range of data sources on skills needs in the
public service, including Persal data on vacancy rates, qualitative studies on scarce skills
and vacancy rates, and studies that have identified the drivers of organisational
performance in the public service. It should be noted that there are a number of limitations
to the quantitative datasets on the public service: 1) Persal data is not reliable in all
departments for providing data on the exact occupations in which there is a scarcity of
personnel; it is only reliable at a very high level of categorization 2) Workplace Skills Plans
(WSP) data (developed from aggregating officials individual personal development plans)
is very uneven and not reliable for demand analysis. This is partly because data capture
is poor. 3) It is also because aggregating individual development plans is an indicator of
the preference for training by personnel – it does not tell is if this is the most appropriate
focus for developing the capacity of the department to deliver on its mandate.
9. Skills are developed (or the development of skills is constrained) within a broader
organisational and institutional context. The identification of priority skills and training
initiatives should thus be shaped by an analysis of the major drivers / inhibitors of
public sector organisations’ performance in South Africa. The approach PSETA has
adopted for identifying priority skills and training for the public service is summarised in the
figure below.

11
PSETA approach to identifying priority skills for the public service
Demand side analysis
Research on the drivers of organsational performance: critical skills for developing
organisational capacity
10. There are a number of departments in the public service are well functioning organisations
able to deliver on their organisational mandate and staffed by personnel who have a strong
professional ethos.
11. Recent studies of the turn-around strategy in the Department of Home Affairs have
highlighted how successes of the department have come through stabilising the
management echelon. Stable senior leadership has been key to organisational
performance in SARs too.
12. Improved performance has also been lined to giving attention to the administrative and
managerial challenges of service delivery, and developing effective training in this regard.
State capabilities needed to implement the National Development Plan
Skills implications emerging out of other policies
Link the identification of recruitment and training needs to
organisational goals and drivers of organisational performance
Identification of the priority skills for organisational development
Understand the nature of the South African state
• Understanding the uneven capacity of organisations across the public service
• Understanding the drivers of organisational performance in the post-apartheid period
Learning from successful organisation based training approaches in the public
service (local and international lessons) to assist in identifying appropriate training
approaches
Check again data from quantitative datasets such as
Persal and against identification of scarce skills in
the broader economy

12
What drove institutional performance was a management cadre focused on operational
and administrative details. In the Department of Home Affairs for example, the Department
used coaches to work with frontline managers to design, assess and review their practices
on a daily basis.
13. Improved departmental performance has been linked to the strategic positioning of HR
and HRD. Analysis of the latest MPAT data shows that of the four management areas, the
HR component of MPAT has the largest and most direct influence on departments
receiving higher performance ratings on external assessments such as the Auditor-
General’s findings (Department of Performance Monitoring and Evaluation, 2013). An
effective and autonomous HR function is important for stabilising administrations and
developing clear and attractive career paths for officials. Well functioning organisations
require strong technical capacity – and this in turn requires effective capacity to recruit the
appropriate staff (given the mandate and functions of the organisation) and an ability to
effectively train and retain staff.
14. Successful approaches to training and recruitment of new officials has been shaped by a
strategic prioritisation of the skills needs of the department (Interviews with HRD in DPSA,
June 2013). Success in these departments also appears to have been tied to departments
building partnerships with education institutions that help shape the most appropriate form
of sector specific training for new and existing staff.
15. Effective supply chain management (SCM) is also central to departments being able to
effectively deliver on their mandate. The quality of service delivery often depends on how
well contracts with service providers are negotiated and enforced (Brunette et al, 2014).
Effective and transparent SCM has been fundamental to organisational performance given
the current model of public administration.
16. Research on training therefore suggests that: 1) Individual training needs to be linked to
organisational contexts, goals and capacity needs 2) Skills development plans must attend
to the need for basic organisation building in the public service 3) Skills development
initiatives of the PSETA should therefore prioritise training that supports organisational
13
development (OD).
Data on scarce skills and competency gaps
17. Persal data shows that vacancy rates are highest in the technical and professional
occupations which require either specialist training in higher education institutions (in the
case of the professions) or training in colleges and appropriate artisanships (in the case
of artisans and other technical occupations); and highest in terms of absolute numbers in
the administrative and managerial occupations.
18. The National Planning Commission mentions acute shortages of technical and
administrative skill within departments and a reliance on outsourcing for professional and
technical services (NPC, 2011 and NPC, 2012). Engineers, technicians and artisans
dominate the DHET’s list of “top 100 occupations in demand” in the South African economy
(DHET, 2014). Persal data shows that vacancy rates for engineers in the public service sit
at 31% (and higher for specific engineering occupations).
19. A 2013 PSSC report notes that, “The trades remain a key skills shortage in the country as
a whole” and that forecasts show that even with the increased focus on training new
artisans, the increase will not be sufficient to respond to demand over the next five years.”
(DPSA, 2013b).
20. The increase in infrastructure development as a result of the funding provided for the
Strategic Integrated Projects (SIPs) will see increased demand for built environment
specialists, and for personnel in infrastructure procurement and management (interviews
with National Treasury, August 2013). The demand for all skills across the construction
sector will increase with the roll out of SIP. The DHET’s list of Top 100 occupations in
demand includes quantity surveyors (21% vacancy according to the Persal data),
construction project managers, and land surveyors. In the built environment sector, urban
planners are also mentioned as scarce skills.
21. The DPSA’s HR Connect results suggest large shortfalls in public servants’ skills and
content knowledge across all OFO Groups. The DPSA’s ‘competency’ assessments of
capacity of the SMS (DPSA, 2013c) found that (on average across the sample of the SMS)
none of the management levels scored at the level of “proficient” or above. Many managers
in the public service did not have the relevant expertise to turn high level plans into detailed
operational plans – or to develop systems to support this.
22. Studies have pointed to weaknesses in administrative functions such as record keeping
(TAU, 2012). Unless basic administration capacity is improved, the IDMS system
developed to support infrastructure development will not function properly unless
administrative competency is improved (National Treasury interviews, 2013).

14
23. Based on the Auditor-General findings (Auditor General, 2013) there is a real need to
improve the state of financial management in the South African public service, especially
as it affects procurement. There are vacancies in occupations such as contract
management and procurement officers, yet the main challenge in this function is that many
existing staff do not have experience and training needed to ensure specifications are
appropriately developed, service provider are appropriately contracted and the standard
of work appropriately monitored.
24. According to the Persal data, vacancies in the occupations classified as HR sit at 14% -
amongst the lowest across occupations, though arguably too high given the centrality of
the HR function in departments. There a shortage of personnel in HR and HRD specifically
qualified for work in HR.
25. There have also been concerns raised about the level of competency of staff in the artisan
and trades occupations. Planned support for the roll out of the SIPS includes a series of
interventions to increase the resources dedicated by state employers to in-house training
of young artisans.
Conclusion to demand analysis: priority skills for building a ‘capable’ public service
26. Based on the demand side data presented above, significant state policies, and an
analysis of the research on the drivers of organisational performance in the Public Sector,
areas of priority support for PSETA are therefore: 1) Support to the development
and recruitment of technical and professional skills 2) Skills development initiatives
that support organisational development (OD). These OD competencies are: 1)
developing HR and HRD capacity 2) Developing operationally focused managers i.e. a
focus on developing competency in detailed programme planning, project management
and designing processes to support delivery 3) Improving basic administration capacity
across many departments in the public service (such as record keeping, data collection,
database management 4) Strengthening competencies in SCM.
Supply side analysis
Skills formation through the formal education system
27. Of those learners who make it through the system to sit for the National Senior Certificate
(NSC) exam, 74% passed in 2012. Thirty six percent of those qualified for entry into a
degree programme at a university (136 047). Over the last five years there has been a
slight upward trend in the number of candidates obtaining sufficient credits for entry into a
bachelor degree.

15
28. Forty four per cent of the NSC candidates wrote the Maths exam. Of these, 36% passed
with a pass of 40% or more. There is a wealth of research on the poor levels of numeracy,
mathematical achievement and literacy of South African school leavers affecting the ability
of school levers to master certain elementary tasks in the workplace and to qualify for, and
complete, FET and Higher education qualifications (especially in professional and
technical occupations). (CHE, 2013).
29. It is estimated that there will be an increased demand for personnel with post-Matric
qualifications in the public service over the next five years, and in particular, those with
degrees. South Africa is producing too few well-trained and educated graduates to meet
the demands of the labour market in general, with the public sector having to compete with
the private sector for graduates. There has been an average increase in the number of
students completing undergraduate and postgraduate qualifications over the five-year
period, 2008 to 2012, of 5.4% and 5.1% respectively. Graduation numbers increased in all
subjects, with the exception of architecture and the build environment, education, and
mathematics.
30. Throughput rates from HEIs are very low. In 2012, one hundred and fifty three thousand
people graduated with an undergraduate degree, diploma or certificate, and 12 210 with a
postgraduate qualification. Black African graduates represented 64% of total
undergraduate passes in 2012, but only 42% of the postgraduate passes.
31. The CESM categories with the highest number of graduates are, ‘Business, economics
and management studies’ (28% of total graduations), followed by education, engineering
and health. Almost all public higher education institutions in South Africa offer degrees or
diplomas in public administration. However, increasing the supply of effective ‘managers’
to the public service is not an issue that can simply be addressed by increasing the number
of people with managerial qualifications – it requires strong organisation based training
and mentoring, and good management skill often requires depth of sector specific
knowledge and technical training in the area in which the manager is working.
32. FET / TVET colleges enrol substantially fewer students than higher education. The Green
Paper on Post School Education and Training (2012) has set ambitious gaols for improving
the number of people entering and completing FET courses. At present a very low
percentage of those who enrol, sit for the final exam. In 2011, just under half of the 17
836 candidates who wrote the NC(V) Level 4 exam passed, and just under half of the 2900
or so students who wrote N3 report 191 examinations passed. The pass rate for the N6
Report courses was higher at 60%. (DHET, 2013).
33. The poor learning outcomes of the FET / TVET college system has also been documented,
even for many of those students who have passed. There needs to be a greater focus on

16
increasing the throughput of FET / TVET students and the quality of the passes, over the
expansion of enrolments. The recently established Quality Council for Trades and
Occupations (QCTO) is tasked with improving the availability, relevance and quality of
occupational qualifications to meet industry needs.
34. Most FET / TVET college programmes will require placement in a workplace and the
completion of a period of work experience in order to qualify for their certificate or diploma.
Many FET colleague learners struggle to find appropriate work placement and the quality
of training for artisans in the public sector is an issue of concern for a number of
stakeholders.
Training and development in the workplace
35. Persal data shows that in 2014 there are 3 681 people in the Public Service on
learnerships. PSETA has registered and quality assured learnerships in general public
administration, record keeping, inspection and enforcement, management, human
resources, purchasing and stores management, business administration, programmes
aimed specifically at personnel in Home Affairs, amongst others. One hundred and sixty
seven learners were registered for qualification-linked programmes under PSETA in the
2012/13. Learnerships and skills programmes registered with PSETA that have had the
highest take-up are those that have been “demand-led” – those courses which were
established for their staff by departments – such as DIRCO’s courses – and which speak
to a very specific training need.
36. Just over five thousand (5176) interns are recorded on the Persal database this year, up
from the 4 943 recorded last year.
37. According to a 2012 directive part of departments’ budgets should be used for the training
and development of unemployed individuals (through internships, supporting learnerships,
and providing bursaries). The directive has lead to an increase in the provision of spaces
for unemployed individuals in the departments directly reporting to PSETA in the last year.
Five hundred and sixty eight internships were provided to previously unemployed
graduates for departments falling under PSETA in 2011/12.
38. PSETA has provided a number of departments with assistance over the last year with
interviewing and placing unemployed graduates and learners in departments; providing
training on workplace coaching for managers; and played a facilitation role for departments
wanting to support the recognition of prior learning (RPL).
39. Not all departments and public entities currently have the capacity to effectively train those
learners and interns placed in their organisations. Reviews have shown that in some
departments, interns have not been appropriately placed in units / functions that build on

17
their formal skills training and that they have not been effectively supported to improve
their skills. Capacity to take on interns needs to be developed over time.
Public service training institutions
40. There are a number of public service training institutions undertaking training and
development within the public service. Academies exist at national government and
provincial level, as well as within specific government sectors. A number of the provincial
academies do not appear to be working very effectively. The academy of the Western
Cape has started to develop strong in-house capacity for training.
41. The National School of Government has been established – partly out of the structure of
PALAMA. The new school will offer a range of qualifications to public servants, which aim
to provide for career advancement and professional development to overcome the current
misalignment between departmental strategies and skills. The National School of
Government plans to reduce the current reliance on external providers and develop strong
in-house teaching body and curriculum content.
Supply side focus for building a capable state
42. Departments need to be supported to be able to identify their staff’s competency gaps and
what kinds of training is best suited to address these. This highlights the importance of the
focus on building HRD skills.
43. The capacity for the public service to act as a training space is highly uneven and that
departments should be encouraged to build this capacity over time, rather than pushing to
take on as many interns and learnerships as possible to meet annual targets. PSETA can
play an expanded role in this space.
44. Where skills gaps are simply related to lack of knowledge of a very specific task, such as
how to operate a computer programme, staff could take part in cost-effective e-learning
courses. Where these gaps are more profound, they need to include mentoring and or
coaching, possibly supplemented by longer-term classroom based training.
45. The importance of workplace based capacity building is outlined in the body of the report.
PSETA will focus on drawings lessons and experience from departments who are
developing successful and innovative approaches to workplace based training.
46. There has been much discussion in the public domain about the lack of service-orientated
culture amongst many public servants. Changes in values and norms are generally not
affected by time spent in short courses on values and ethics. Three is great value in
training cohorts of public servants through long-term training (building skills, but also a

18
common sense of purpose and commitment to the public service). The new National
School of Government has the potential to play a fundamental role here if curriculum and
delivery models are carefully piloted, and a strong faculty of teachers developed.
19
Priority scrace and critical skills for the public service
47. There has been much discussion in the public domain about the lack of service-orientated
culture amongst many public servants. Changes in values and norms are generally not
affected by time spent in short courses on values and ethics. Three is great value in
training cohorts of public servants through long-term training (building skills, but also a
common sense of purpose and commitment to the public service). The new National
School of Government has the potential to play a fundamental role here if curriculum and
delivery models are carefully piloted, and a strong faculty of teachers developed.
48. The priorities skills detailed here were confirmed and agreed by stakeholders attending
the 2014 PSETA Workshop on Priority Skills for the Public Service (held in July 2014).
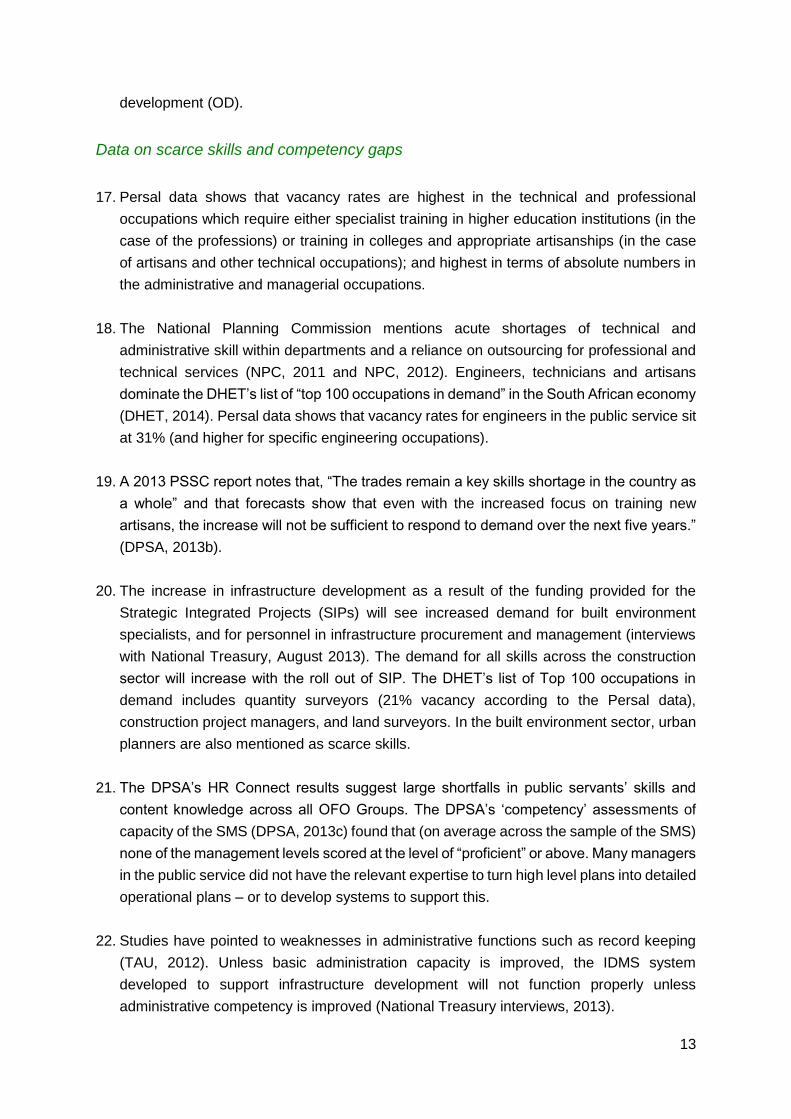
49. Based on the analysis of demand side data, significant state policies, and the analysis of
the drivers of organisational performance in the public service, areas of priority support for
PSETA are: 1) skills development initiatives that support organisational development and
the development of capacity in the skills system itself (such as HR and HRD) 2) developing
management skill and supporting the development of professionals and technical skills
through support to SIPs.
The priority skills are as follows:
44. PSETA has an important rolel to play in developing the management skills
of professionals and technicians through support to SIPs.
45. 1 46. Supporting the development of professional and technical
skills through SIPs.
47. 2 48. Improving SCM skills, including contract management.
49. 3 50. Support to the development of operationally inclined
managers.
51. 4 52. Supporting the delivery of training on generic skills (computer
training, administrative, data analysis training etc).
53. Skills development initiatives that support organisational development
and the development of capacity in the skills system itself
54. 5 55. HR and HRD development and professionalisation.
56. 6 57. Improving capacity to deliver training through e-learning.
58. 7 59. Building capacity in the area of “bridging into work” (training of
interns, and unemployed graduates for example) by drawing on
innovations in the green skills sector.

20
Sector Skills Strategy for the Public Service
50. PSETA’s SSP has provided a framework for identifying priority skills in the public service
based on an understanding of the specific historical context of the South African public
service. Demand analysis outlined the importance of focusing on skills and competencies
that have been most essential to developing organisations, as apposed simply to
developing individual skills. Supply side analysis emphasised the importance of training
approaches that attend to training in an organisational setting.
51. The priorities skills detailed here were confirmed and agreed by stakeholders attending
the 2014 PSETA Workshop on Priority Skills for the Public Service (held in July 2014).
52. This approach resonates strongly with the National Treasury’s recently developed strategy
for building capacity in public financial management, which DPSA is considering adopting
for the development of a range of skills across the public service.
53. In 2012, PSETA developed a strategy for building public service skills, which outlines four
major areas of focus: 1) defining impact i.e. defining precisely what outcomes the public
service skills sector wishes to achieve and how these will be measured 2) building the
Demand-Side Capacity i.e. building capacity to appropriately identify skills and training
needs and building the workplace as a place of training 3) building the Supply-Side
Capacity i.e. developing the capacity of training institutions to deliver the skills needed by
the public service, including higher education institutions and public service training
institutions; and 4) bridging the Supply-Demand Mismatch (the reasons supply of skills
does not respond adequately to demand). This SSP Update outlines a range of
interventions to be undertaken or supported by PSETA for building both demand-side and
supply-side capacity.
54. With regards to PSETA’s support for developing capacity in the priority “scarce and critical
skills” outlined above: support to the professional and technical skills will be delivered
through targeted support to SIPs. Here PSETA will promote the public service as a career
of choice to professionals identified as important for improving infrastructure development
and management. PSETA will also provide support to the Infrastructure Delivery
Management System (IDMS) training programme. PSETA is already driving the
development of technical skills through the G-SETA forum on artisan development, in
partnership with Indlela. This strategy is proving successful, and should continue.
55. SCM skills will be delivered by PSETA partnering with the National Treasury project on
building capacity in the financial management occupations. PSETA will review the SCM
qualifications during 2014 to ensure that they reflect the new sets of competencies
suggested for SCM practitioners under the Chief Procurement Officer (OCPO). PSETA
will collaborate with DPSA, Treasury and DHET to support training on the IDMS (see

21
above). In addition, the OCPO has noted that improved HR and HRD capacity is vital for
a more effective procurement system, and have noted that PSETA can play a role in
‘advocating for HRD in the public sector’. This is included as part of PSETA’s focus (see
22
below).
56. The management skills interventions aim to strengthen the “administrative” and
“operational” competencies of managers (i.e. the ability to turn high-level strategy into
detailed plans and processes for delivery). First, the plan for rolling out IDMS training will
strengthen the managerial competencies of those responsible for managing the SIPs.
Second, PSETA will support training to develop a range of generic skills for managers
(focusing on, for example, administrative skills, data analysis, writing). Third, PSETA is in
discussion with departments who have developed successful programmes for developing
the operational capacity of managers, on sharing with other departments the lessons and
resources used in improving the capacity of managers. This can take place through, for
example, workshops, study tours and the development of resource materials.
57. The generic skills interventions will be provided through e-learning, against the liof
generic skills needs identified by HR Connect. PSETA intends to partner with the National
School of Government to lead the State Academies Forum in adapting some of the best
existing programmes to e-learning. These e-learning programmes will then be made
available to all state academies under the National School of Government, as well as to
departments that have already established the infrastructure for e-learning delivery.
PSETA intends to collaborate with other Government SETAs on this project, with each
SETA funding a small number of programmes that are then shared with all other SETAs.
58. The HRM/D skills aim at building the “demand-side capacity” for planning,
implementation, monitoring and evaluation and reporting. The intervention also aims to
take forward the professionalization of HRM/D, which in turn will support the
professionalization agenda more widely. PSETA will partner with the HRD Chief
Directorate in DPSA and the National School of Government, in a project aimed at
professionalising the HRM/D sector in the Public Service. This project envisioned will
conduct a sector-wide recognition of prior learning (RPL) of HRM/D practitioners in the
Public Service; provide relevant formal qualifications to practitioners and bring HRM/D
under professional regulation, with a code of practice and standards of practice that are
legally regulated.
59. The e-learning focus aims at building the “supply-side capacity”, enabling more efficient
provision at scale. The National School of Government will start providing e-learning at
scale in 2015. PSETA will review all policies and practices to ensure that quality assurance
of e-learning is aligned to best practices for the quality assurance of e-learning and
blended learning internationally.
60. The most important reason for choosing the green skills sector as a priority in the public
service is to improve the mechanisms and processes through which departments
bridge unemployed graduates into work placement opportunities in the public

23
service and train interns. The green skills sector is arguably doing the most innovative
work in this area. PSETA is exploring a partnership with the Bridging into Work workstream
led by WWF project (under the National Environmental Skills Planning Forum) with the
intention of sharing the resources and lessons learned more widely across the public
service.

24
Chapter 1
Introduction and framework
1.1. Introduction
The South African state now employs a quarter of the working population across national,
provincial and local government, and state owned companies.1 Given the size of the public
service and the wide range of occupations is comprises, developing a clear framework for
guiding skills development in the sector is particularly important. The following Sector Skills
Plan (SSP) Update builds on the foundations established in the last SSP (2014/15): last year
an approach was developed for directing the identification of priority skills and training needs
for the public service. This approach is intended to guide the work of the Public service Sector
Education and Training Authority (PSETA), as well as the work of skills development
practitioners and senior managers in the public service.
Chapter One outlines PSETA’s scope of work and mandate; provides an overview of the skills
development landscape for the public service, including a brief mention of new policies and
strategies; and outlines the framework guiding PSETA’s approach to skills planning and
development. Chapter One also provides background to the recent history of the public service
in South Africa, and summarises important research on the competencies associated with
improved organisational performance in the public service.
Chapter Two analyses the current profile of the public service, growth and replacement
demand, scarce skills in the public service, the competency gaps of current public servants,
and outlines a focus for training based on both demand-side data and the framework outlined
in Chapter One. Chapter Three focuses on labour supply and training for the public service,
and identifies priority areas for PSETA in supporting capacity building for the public service.
Building on Chapters One to Three, Chapter Four focuses on the priority scarce and critical
skills identified by PSETA. Chapter Five outlines PSETA’s plans to support the development
of these priority skills.
1.2. PSETA’s mandate and coverage
PSETA is responsible for skills development in the public service, that is, at national and
provincial level. The Local Government SETA is responsible for skills development in local
government. PSETA is responsible for the development of “transversal” skills across the public
service as well as for skills development in functions undertaken exclusively by the public
1 The exact figure is 24.1% Source: Quarterly Labour Force Survey, 1st Quarter 2014, Statistics South Africa.
25
service (such diplomacy) (PSETA, 2011) 2 . Transversal functions include, for example,
administration, management, planning, legislation and policy development. PSETA therefore
includes in its scope the development of skills in areas that overlap with the focus of other
“line-function” SETAs. For example, whilst FASSET 3 is the SETA responsible for skills
development in the area of financial management generally, PSETA also has a mandate to
develop skills in public sector financial management. The same principle applies to artisans
employed in the public service. For departments for whom there is dual reporting to both
PSETA and another line-function SETA, PSETA’s work concentrates on skills development
2 The DPSA’s Senior Management Service competency framework differentiates between technical or
professional skills on the one hand and “generic managerial competencies referred to as Core Management
Criteria (CMC)” on the other (DPSA, undated). 3 The SETA for Finance, Accounting, Management Consulting and other Financial Services.

26
amongst the Senior Management Service (SMS)4.
All government departments are viewed as indirect members of the PSETA, since PSETA is
responsible for facilitating skills development and training, quality assurance and promotion of
transversal functions and qualifications across all government departments (PSETA, 2011).
Some departments, such as education and health, have ‘dual reporting’, reporting to PSETA
and a line-function SETA, such as the Health and Welfare SETA. PSETA’s scope of coverage
only includes state employees employed in terms of the Public Service Act.
The table below shows the national departments reporting only to PSETA (see departments
highlighted in grey).
Table 1: National departments reporting only to PSETA
4 The SMS refers to all Directors, Chief Directors, Deputy Directors-Generals and Directors-Generals in the
public service.

27
National Department
Agriculture, Forestry & Fisheries
Arts & Culture
Basic Education
Civilian Secretariat for Police
Telecommunications and Postal Services
Cooperative Governance
Correctional Services
Defence
Economic Development
Energy
Environmental Affairs
Communications
Health
Higher Education & Training
Home Affairs
Human Settlements
Independent Police Investigative Directorate
International Relations & Cooperation
Justice & Constitutional Development
Labour
Military Veterans
Mineral Resources
National Planning Commission
National School of Government (previously Palama)
National Treasury
Office of the Chief Justice
Planning, Monitoring and Evaluation
Public Enterprises
Public Service & Administration
Public Service Commission
Public Works
Rural Development & Land Reform
Science & Technology
Social Development
SA Police Service
SA Revenue Service
Small Business Development
State Security Agency
Sport & Recreation South Africa
Statistics South Africa
Tourism
Trade & Industry
Traditional Affairs

28
Transport
Water and Sanitation
Women, children and people with disabilities
The Presidency
Details of the departments and other public sector bodies falling within PSETA’s scope of
coverage are provided in Appendix One.
1.3. Roleplayers
Apart from PSETA and the relevant line-function SETAs, there are a range of statutory bodies
mandated to play a role in skills development for public servants. The Department of Higher
Education and Training (DHET) provides the overall policy framework for skills development,
primarily through the National Skills Development Strategy III (DHET, undated), and regulates
SETAs.
The Department of Public Service and Administration (DPSA) develops the human resource
development (HRD) strategies for the public service and supports and monitors
implementation. The GSETA Forum (Government SETA Forum) comprises representatives
of PSETA and 11 other SETAs of whom public sector bodies are members, and co-ordinates
skills development for government employees.
Until recently, the Public Administration Leadership and Management Academy (PALAMA),
was a national body that provided education and training for public servants. Much of
PALAMA’s work involved facilitating and managing training provision, as much of the training
was outsourced to third party providers. PALAMA has recently been replaced by the National
School of Government.5 The organisational form that the School will take is still being decided,
although it appears that a central difference between PALAMA and the new School is that the
latter intends to provide far more of the training ‘in-house’ i.e. developing the state’s capacity
to directly train its public servants.
Some provinces have provincial academies, which range in their capacity to effectively train
officials (we return to this issue in Chapter 3). A number of departments within the public
service also have their own training academies (for example, the Department of Home Affairs
(DHA) and the Department of International Relations and Cooperation (DIRCO)).
The Public Service Commission (PSC) monitors and evaluates the performance of national
5 Established in terms of the Public Administration Management Act. No. 11 of 2014. See Appendix two for
excerpts from the Act.
29
and provincial departments, including providing commentary on public service capacity. 6
The Human Resource Development Council of South Africa (HRD Council) is a multi-
stakeholder body comprising representatives from government, business, civil society, labour
and the training and education sector. It was established in 2010 to “create an enabling,
coordinated and integrated environment to focus on improving the human resource
development base and skills of the South African people” (HRD Council website, 2013).
In November 2012, the Council requested the Minister for Public Service and Administration
to coordinate an approach to skills development across the public service and local
government aimed at the development of a more capable state (DPSA, 2013b). The forum
established to take this forward was the Public Service Skills Committee (PSSC), which
includes representatives from the DHET, DPSA, PSETA, PALAMA, and the Department of
Cooperative Governance.
Each organ of state is responsible for identifying its skills gaps and training requirements. All
organs of state submit Workplace Skills Plans (WSPs) to one or more of the SETAs and
Human Resource (HR) Plans to the DPSA. The Skills Development Act of 1998 compels “each
public service employer in the national and provincial spheres of government” to “budget for
at least 1% of its payroll for the training and education of its employees” (Republic of South
Africa, 1998).
1.4. Policy environment
A wide range of public sector plans and strategy documents have commented on the need to
6 See the Public Service Commission website: www.psc.gov.za

30
substantially improve the skills of public servants and the general capacity of the South African
state (NPC, 2011; NPC, 2012, MTSF, 2009; DPSA, 2013b; HRD Council, 2014 for example).
The National Development Plan (NDP) calls for the building of a “capable state” – underpinned
by “effectively coordinated state institutions with skilled public servants who are committed to
the public good and capable of delivering consistently high-quality services, while prioritising
the nation’s developmental objectives” (NDP, 2012). The NDP outlines both an analysis of
current challenges to the effective functioning of the state, and proposes a range of

31
interventions at a political and administrative level.
According to the National Planning Commission (NPC) the state is capable to the extent “that
it has the capacity to formulate and implement policies that serve the national interest” (NPC,
2012). It is developmental when “these policies focus on overcoming the root causes of
poverty and inequality, and building the state’s capacity to fulfil this role” (NPC, 2012). A
capable and developmental state is one that has the means to identify and deal with the
causes of poverty and inequality in South Africa.
The NDP identifies seven major challenges facing the South African state: tensions in the
political-administrative interface, instability of the administrative leadership, skills deficits,
inappropriate staffing, the erosion of accountability and authority, poor organisational design
and low staff morale (NPC, 2012). The Plan elaborates further on these issues. It discusses
eight areas where immediate action is required:
1. Stabilising the political-administrative interface by creating a public service sufficiently
insulated from political interference. This requires clearly distinguishing between the
political and administrative head of department.
2. Making the public service and local government administration careers of choice by
building a skilled and professional public service from the top and the bottom.
3. Developing technical and specialist professional skills and creating career paths for
technical specialists.
4. Strengthening delegation, accountability and oversight by promoting greater and more
consistent delegation. Making it easier for citizens to hold public servants and
politicians to account and ensuring effective parliamentary oversight of government.
5. Improving inter-departmental coordination by adopting a less hierarchical approach
and by strengthening the cluster system and the role of the Presidency in resolving
strategic issues.
6. Taking a proactive approach to improving relations between national, provincial and
local government by devolving greater responsibilities where capacity exists.
7. Strengthening local government by developing an enabling framework with active
support and oversight from national and provincial government.
8. Clarifying the governance of the State-Owned-Enterprises by clarifying their public-
interest mandates and giving them straightforward governance structures that enable
them to balance and reconcile their economic and social objectives.
Many of these challenges are outside of the scope of the PSETA, though not all of them. In
particular points 2 and 3 above pertain directly to skills training viz. building a skilled and
professional public service and developing technical and specialist skills for the public service.
Within the 12 ‘Outcomes Framework’ identified by government and monitored by the
Department of Performance Monitoring and Evaluation (DPME) relevant outcomes include

32
Outcome 5: ‘A skilled and capable workforce to support an inclusive growth path’, and
Outcome 12A: ‘An efficient, effective and development oriented public service’.
Commitment 7 of the Human Resources Development Strategy is “ensuring that the public
sector has the capability to meet the strategic priorities of the South African Developmental
State” (HRD Council, 2009) – reiterated in the National Skills Development Strategy III (DHET,
undated).
The PSSC has integrated Ministerial Outcomes 5 and 12 as the goal for the PSSC work, i.e.
developing the “skilled and capable workforce required to achieve a more efficient, effective,
professional and development-oriented state.” (DPSA, 2013b).
In March this year, the HRD Council published the ‘National Integrated Human Resource
Development Plan 2014-2018’ (HRD Council, 2014). The Plan outlines a set of high-level
goals, focus areas and indicators for developing human resources in South Africa. These
range from improving foundation learning in schools and Early Childhood Development
Centres, to improving vocational education, higher education and facilitating increased levels
of entrepreneurship in the country. The goal most relevant to PSETA’s work is a “Capable
Public Sector with Effective and Efficient Planning and Implementation Capabilities.” (HRD
Council, 2014).
The Plan identifies two focus areas for meeting this goal:
1. “Revise the public service Human Resource Development (HRD) strategies and plans
in line with the vision of the NDP for a professional and capable public service.” (HRD
Council, 2014: 38).
2. “Turn the public sector into a training space.” Here the envisioned focus is on
developing departments’ and public entities’ ability to take on young graduates and
those in technical and vocational training in order to provide workplace based training.
(HRD Council, 2014: 38).7
The DPSA is identified as the ‘lead’ department for implementing these goals, with support to
7 Rationale provided for this focus: “there is a need to create & open up public sector workplaces for
placement of especially TVET and university of technology students & graduates so that they can get
workplace experience.” (HRDSA, 2014: 38).

33
be provided by PSETA and a range of other institutions.
The indicators for these two goals are (respectively):
Plans to professionalise the public service are developed by end 2014/15, and
implemented over the period 2015 to 2018.
By end 2014/14, 20 000 apprenticeship, learnership and internship opportunities have
been created in the public sector; and between 2015 and 2018, a further 100 000 such
opportunities are created. (HRD Council, 2014: 38).
In “opening up the public sector to act as a training space”, the public sector becomes a
mechanism for capacity building rather than being the direct target of interventions to improve
capacity. PSETA notes that a clearer articulation of the mechanisms for improving
departments’ abilities to act as a training space is needed. The following SSP provides some
recommendations, as well as providing recommendations on how to “professionalise the
public service”.
PSETA has developed a framework for identifying priority skills (demand) and for
identifying the focus for training and capacity building (supply side) in the public
service (see last year’s PSETA SSP Update, outlined again in the following chapters).
We suggest that these training priorities identified by PSETA should form in important
component of the plans to “professionalise” the public service.
This framework is proposed within the broader PSETA strategy for skills development. This
strategy identified a number of broad priorities to improve the skills development system for
the public service. It outlines a set of ‘demand side priorities’, which include supporting
departments to better identify their training needs, and ‘supply side priorities’, including
improved investment in public sector providers, and better coordination between role-players
in the skills development sector in the Public service. A summary of the Strategy is shown in
the figure below.

34
Figure 1: Diagram summarising the Strategic Framework
1.5. Changes in the skills development landscape
There are a number of changes in the skills development landscape with relevance for
PSETA’s work, some of which have already been outlined above. These include:
The establishment of the School of Government. The school is discussed in Chapter
Three (the chapter on supply side issues).
The policy directive to open up the public sector as a training space for learners in
technical and vocational training, and for unemployed graduates. This is also
discussed further in Chapters Three and Four.
The finalisation of the agreement on the funding model for PSETA.
The development of new stakeholder forums for supporting skills development –
specifically the provincial HRD Councils.
The establishment of the Labour Market Intelligence Project (LMIP) that is developing
centralised skills forecasting capabilities for the South African labour market.
Until recently, state employers in the public service did not have to pay a levy to PSETA. A
recent policy directive issued by the DPSA has set more stringent parameters for the spending
of training budgets. All departments are still required to “set aside a minimum of 1% of the
total department’s annual personnel budget for training and development of its personnel and

35
potential employees”, but 30% is to be paid to the departments’ respective SETA(s). (DPSA,
36
2013c).
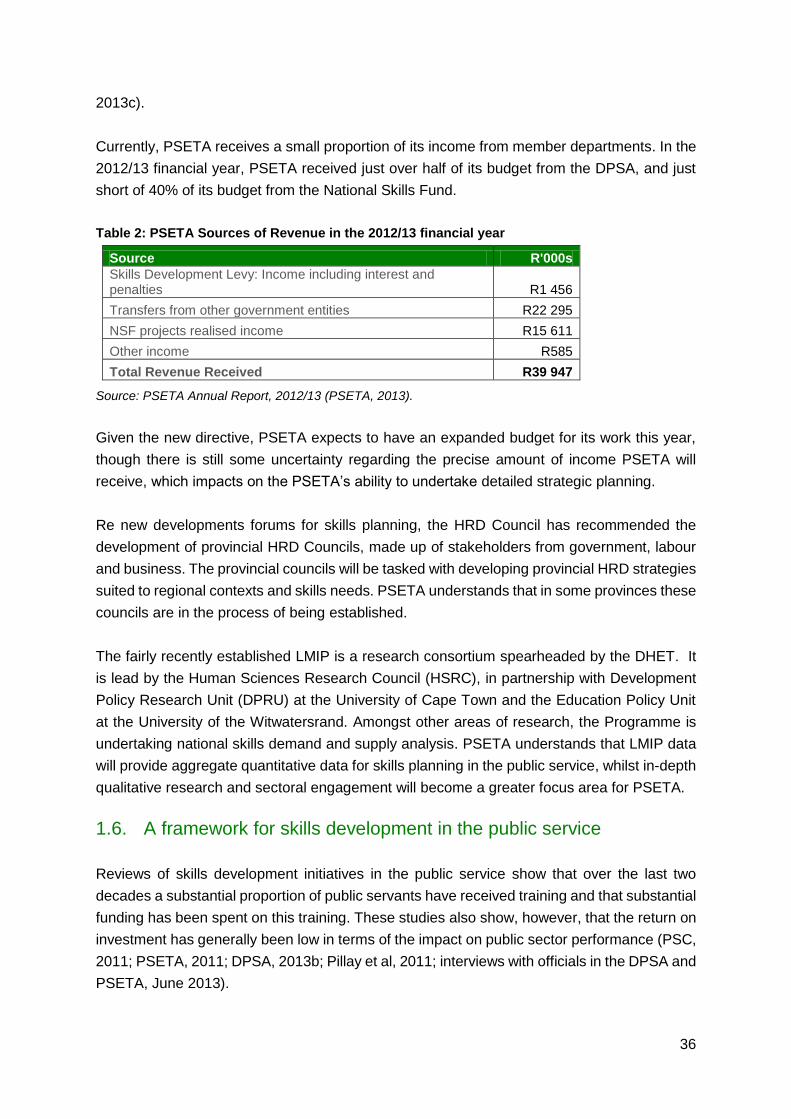
Currently, PSETA receives a small proportion of its income from member departments. In the
2012/13 financial year, PSETA received just over half of its budget from the DPSA, and just
short of 40% of its budget from the National Skills Fund.
Table 2: PSETA Sources of Revenue in the 2012/13 financial year
Source R'000s
Skills Development Levy: Income including interest and penalties R1 456
Transfers from other government entities R22 295
NSF projects realised income R15 611
Other income R585
Total Revenue Received R39 947
Source: PSETA Annual Report, 2012/13 (PSETA, 2013).
Given the new directive, PSETA expects to have an expanded budget for its work this year,
though there is still some uncertainty regarding the precise amount of income PSETA will
receive, which impacts on the PSETA’s ability to undertake detailed strategic planning.
Re new developments forums for skills planning, the HRD Council has recommended the
development of provincial HRD Councils, made up of stakeholders from government, labour
and business. The provincial councils will be tasked with developing provincial HRD strategies
suited to regional contexts and skills needs. PSETA understands that in some provinces these
councils are in the process of being established.
The fairly recently established LMIP is a research consortium spearheaded by the DHET. It
is lead by the Human Sciences Research Council (HSRC), in partnership with Development
Policy Research Unit (DPRU) at the University of Cape Town and the Education Policy Unit
at the University of the Witwatersrand. Amongst other areas of research, the Programme is
undertaking national skills demand and supply analysis. PSETA understands that LMIP data
will provide aggregate quantitative data for skills planning in the public service, whilst in-depth
qualitative research and sectoral engagement will become a greater focus area for PSETA.
1.6. A framework for skills development in the public service
Reviews of skills development initiatives in the public service show that over the last two
decades a substantial proportion of public servants have received training and that substantial
funding has been spent on this training. These studies also show, however, that the return on
investment has generally been low in terms of the impact on public sector performance (PSC,
2011; PSETA, 2011; DPSA, 2013b; Pillay et al, 2011; interviews with officials in the DPSA and
PSETA, June 2013).

37
Much of the training has been in the form of short courses by private providers (Huluman,
2011), which appears not to have substantially altered the skills profile of officials, even where
the stated outcome of the training is in line with the skills requirements of the officials’ job. The
NPC has noted that the “management” or “leadership” training undertaken by public servants
has not had the intended impact on improving performance (NPC, 2012). The PSC (2011) has
found that departments do not use the skills budgets effectively or efficiently. Interviews with
the DPSA suggest that in many cases departments have not shaped their training initiatives
strategically, and many staff have attended training in areas unrelated to their work (personal
communication, Chief Director in the DPSA, June 2013).
Further, the PSSC has noted that, “Skills development in isolation will not yield a more capable
state”; skills development must be integrated with wider organisational development initiatives
if it is to be effective (DPSA, 2013b).
As we noted in last years SSP Update, skills are developed (or the development of skills is
constrained) within a broader organisational and institutional context.
The identification of priority skills and training needs should thus be shaped by
an analysis of the major drivers / inhibitors of public sector organisations’
performance in South Africa.
This analysis should then be coupled with:
An identification of the skills implications emerging out of new policies (increased
spending on infrastructure for example) and broader anticipated changes in the nature
of the state.
Analysis of datasets showing where organsations exprience the greatest shortage of
staff, where they predict an increased future demand for staff and where they feel staff
require the most capacity building.
As we will show further below, the quality of this data in South Africa has been impacted on
by uneven capacity in the HRD function in many public service departments and entities. The
2011 PSC Assessment of HRD Practices in the Public service noted that while 53% of
surveyed departments claimed to have an HRD Strategy in place; only 63% of these (i.e. 33%
of departments) met the basic requirements for this strategy (DPSA, 2013b). Workplace skills
planning and human resource planning are often separate functions in departments, and
strategic capacity in both areas is often lacking. This, amongst other things, has affected the
quality of data provided by departments in WSPs.
For this reason, in preparation for this SSP Update, PSETA has undertaken a series of
stakeholder engagements and case studies in a small sample of departments to triangulate
the findings from the quantitative data analysis and the findings from an engagement with the
literature on the drivers of public sector performance in South Africa.
38
It should also be noted that in the context of uneven capacity in the HR and HRD
functions in many organs of state, it is not simply the case that the quality of data
provided in reporting templates such as the WSPs are poor: the very ability to identify
where scarce skills and training is most needed is compromised. As we will show in
the following section of this chapter, not all capacity constraints are as a result of a
‘skills issue’ (vacancies or insufficiently trained staff). Problems identified by senior
management as ‘an insufficient number of people to do the job’ may, for example, mask
deeper problems of the macro-organisation or structure of the department or of how to
effectively motivate and control employees. In this context, it becomes even more
important to draw on independent research on the capabilities that have driven
organisational performance in the South African public sector.
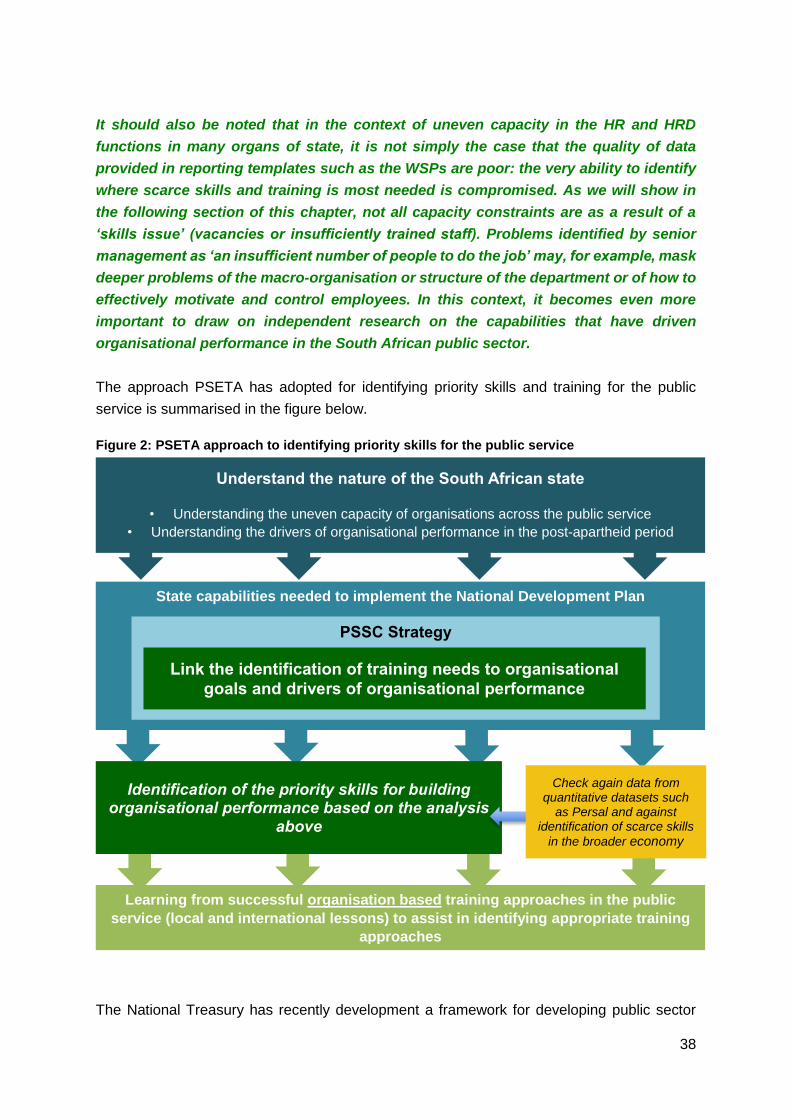
The approach PSETA has adopted for identifying priority skills and training for the public
service is summarised in the figure below.
Figure 2: PSETA approach to identifying priority skills for the public service
The National Treasury has recently development a framework for developing public sector
State capabilities needed to implement the National Development Plan
PSSC Strategy
Link the identification of training needs to organisational
goals and drivers of organisational performance
Identification of the priority skills for building organisational performance based on the analysis
above
Understand the nature of the South African state
• Understanding the uneven capacity of organisations across the public service
• Understanding the drivers of organisational performance in the post-apartheid period
Learning from successful organisation based training approaches in the public
service (local and international lessons) to assist in identifying appropriate training
approaches
Check again data from quantitative datasets such
as Persal and against identification of scarce skills
in the broader economy

39
capacity (i.e. supply side framework) in the area of public financial management, which the
DPSA is considering adopting for developing a range of others skill sets across the public
service. Like the demand side framework above, the Treasury framework also highlights the
importance of the organisational environment for skills training, noting that skills development
needs to be embedded in organisational development initiatives. We return to this framework
in Chapter Four. The Treasury framework provides a ‘supply side’ compliment to the demand
side framework (above) that PSETA uses to identify priority scarce and critical skills.
As the demand side framework above suggests, an analysis of organisational performance
requires strong contextual understanding of the history and nature of the public service. This
provides clues to the uneven performance of the state, and points to areas where attention is
needed with regards to skills development strategies. We turn to a brief overview of this history
in the following section.
1.6.1. Understanding the uneven capacity of the South African state
By the end of apartheid, the South African state consisted of a complex mix of administrations,
parastatals, agencies and legislatures across the central apartheid state, and the homeland
administrations (Picard, 2005: 293). The bureaucracy was organised along race and ethnic
lines, with career advancement for black officials outside the homeland administrations
severely limited, and women occupying primarily clerical positions.
In 1994 the democratic government inherited a public sector suffering from decades of
underinvestment and deliberate neglect of systems in many parts of the state that had been
responsible for providing services to black South Africans. The provinces that incorporated
the homeland administrations faced particular challenges in administrative capacity. The
Transkei, for example, had not had its government accounts audited from 1988 to 1994. Most
provincial governments lacked complete asset registers or inventories (Lodge, 2005: 739).
And the provinces inherited systems and databases that had long since been fraudulently
administered. Territories administered by the homeland administrations had for decades been
ruled through ‘clientelistic’ and patrimonial networks that extended from the central apartheid
state to local chiefs and bureaucrats (see for example Peires, 1992).
Further, under apartheid there had been underinvestment in training and skills development
for homeland officials. White Senior managers seconded to homeland administrations were,
in some cases, drawn from candidates who were had limited prospects in other parts of the
public service. Other senior and middle-ranking officials were recruited from the ranks of
traditional political system, including chiefs and indunas (Picard, 2005).
In this context, a strong professional ethos failed to emerge in many of the departments. The
history of the integration of the former homeland administrations goes some way to explain
the unevenness in the performance of the provincial governments as noted by the NDP. As a

40
rule of thumb, we can say that those provinces that had to integrate former homeland
administrations (Eastern Cape, Limpopo, North West, Mpumalanga, Free State) have tended
to perform worse than those that did not (Western Cape and Gauteng). This did not mean that
central apartheid state administrations were organisationally effective. The picture at this level
is tremendously uneven. From the 1980s the South African public service as a whole was
showing signs of patrimonialism. The introduction of the National Security Management
System under P.W. Botha and the influence of the ‘Broederbond’ saw the creation of dual
lines of accountability (to senior bureaucrats on the one hand, on security personnel on the
other), weakening administrative systems.
The Public Service Act of 1994 formally unified these separate administrations. In the first two
years of the African National Congress’s (ANC) first term of office it focused on the task of
integration, (Kuye, 2006: 294-295) designing new administrative models, developing policies,
incorporating staff, processes and systems. The pace of change in government organisations
was extremely rapid, and in many instances organisations were set up from scratch. This was
done at the same time as government was beginning to rapidly expand the provision of
services to black South Africans. Stable and effective operational routines often did not have
time to establish in this context.
Much of the hope for establishing these effective operational routines was placed on the newly
established Senior Management Service (SMS). The SMS has grown from an initial staff
component of about 1 500 people in the late 1990s to just over 9 000 today. The SMS,
however, has struggled in two related areas: to fill key positions and to retain its staff. (PSC,
2011; Chipkin, 2011). Given the responsibility of the SMS for translating strategies and visions
into operational and logistical plans, the instability created by high vacancy and turnover rates
in the SMS has far-reaching consequences. Organisational instability has impacted on
organisations’ capacity to train and develop operational and technical skill. Hence, when it
comes to service delivery or the implementation of plans and strategies, departments are often
found wanting. Often basic operational and administrative processes are poor, non-existent
and/or not well designed in relation to the mandated outcomes, whatever the specific area.8
This has affected other functions – most especially in the area of public procurement. National
Treasury data shows that 42% of the South African government’s budget is now spent through
the procurement / supply chain management (SCM) system (a figure which is relatively high
by international standards) (Brunette et al, 2014). From the late 1990s responsibility for the
procurement of goods and services was decentralised to all government departments and
entities in the country. There are now thousands and thousands of procurement points across
the public service. Partly because the procurement system is now so decentralised it is difficult
to coordinate activities between departments and tiers of government. Research has also
8 This instability has also been enabled by what the National Planning Commission has referred to as
‘instability in the political-administrative interface’. In a politicised bureacracy, it not clear whether appointees
are responsible to the imperatives of the department or of the political party.

41
shown that the state has struggled to exercise oversight over the system as a whole (Brunette
et al, 2014). We can see evidence of the high levels of non-compliance with SCM regulations
in the findings of the Auditor-General. The legacy of administrative and operational weakness
in government departments was not always adequately understood and catered for in the
post-apartheid period. In a context in which compliance with rules and regulations had been
uneven, technical and administrative capacity uneven, and in which there has been a high
degree of instability in leadership, the introduction of massive decentralisation in functions
such as procurement has had unintended consequences for both the delivery of services and
the ability of the state to hold officials accountable. The extent of outsourcing itself has been
both a consequence and driver of uneven performance – the development of technical and
managerial skill is hollowed out where core functions of the departments have been
outsourced (NPC, 2012).
1.6.2. Research on the drivers of organsational performance: critical skills for
42
organisational development
Despite the challenges outlined above, many departments in the public service are well
functioning organisations able to deliver on their organisational mandate and staffed by
personnel who have a strong professional ethos. What has been key to developing this
organisational capacity?
Recent studies of the turn-around strategy in the DHA have highlighted how successes of the
department have come through stabilising the management echelon.
Further, the attention was also paid to the administrative and managerial challenges of service
delivery, and developing effective training in this regard. What drove institutional performance,
in other words, was a management cadre focused on operational and administrative details.
In order to improve day-to-day operations, for example, the department produced a pocket
handbook, the ‘Office Manager’. This book provided simple standard operating procedure
guidelines for frontline office managers and supervisors for daily, weekly, monthly, quarterly
and annual activities. A Presidency study from 2010 notes: “This most useful document
provided one of the first concrete standardised lists of ‘what we are supposed to do’ for
frontline offices” (Konstant, Obery and Setshwaelo, 2010). In a further innovation, Home
Affairs used coaches to work with frontline managers to design, assess and review their
practices on a daily basis. Many of the Home Affairs improvements followed from attention to
the design, engineering and management of frontline processes.
Likewise in SARS there has been significant investment in process design and engineering.
The major achievements of SARS in integrating and consolidating diverse administrations and
then in rolling-out innovative new services, including e-filing, rests on the ability of the agency
to design and engineer processes effectively.
Improved departmental performance has been linked to the strategic positioning of HR and
HRD. The DPME’s Management Performance Assessment Tool (MPAT) “assesses the
quality of management practices”, with a focus on compliance measures in four areas:
Strategic Management; Governance and Accountability; Human Resource and Systems
Management; and Financial Management (DPME, 2013). Departments are measured on a
scale of 1 to 4; a score of 1 signals “non-compliance with legal/regulatory requirements” and
a score of 4 signals that there is “Full compliance” and that a department is “doing things
smartly” (such as meeting performance targets and using compliance to improve delivery)
smartly”. Assessments were first carried out in 2011/2012 and again in 2013. DPME’s 2012
report on MPAT noted that, “the overall picture presented on the compliance of national and
provincial departments with the minimum requirements stipulated in the legislation, regulations
and guidelines is not a positive one . There are areas where departments appear to be
achieving reasonable levels of compliance, namely, in Strategic Management and to some
extent in annual reporting compliance. Compliance levels in certain elements of Human

43
Resource and Systems Management and Supply Chain Management are below what is
required for a well functioning and capable public service.” (DPME, 2013). Recent analysis of
the latest MPAT data shows that of the four management areas, the HR component of MPAT
has the largest and most direct influence on departments receiving higher performance ratings
on external assessments such as the Auditor-General’s findings (DPME, 2013).
An effective and autonomous HR function is important for stabilising administrations and
developing clear and attractive career paths for officials. Well functioning organisations require
strong technical capacity – and this in turn requires effective capacity to recruit the appropriate
staff (given the mandate and functions of the organisation) and an ability to effectively train
and retain staff. There are a number of departments who are developing strong strategies to
support training and capacity building in their organisations. Training and recruitment of new
officials has been shaped by a strategic prioritisation of the skills needs of the department
(Interviews with HRD in DPSA, June 2013). These include the DTI, the DHA and the National
Treasury. Success in these departments also appears to have been tied to departments
building partnerships with education institutions that help shape the most appropriate form of
sector specific training for new and existing staff – this includes training aimed at developing
both technical and generic skills.
Effective SCM is also central to departments being able to effectively deliver on their mandate.
A recent report by the Public Affairs Research Institute (PARI) notes that, “Service delivery in
South Africa is decreasingly performed directly by government administrations and
increasingly performed by private companies which tender for this role. The role of public
servants has changed from that of administration to that of managing contracts.” (Brunette et
al, 2014). The quality of service delivery often depends on how well contracts with service
providers are negotiated and enforced (Brunette et al, 2014). Effective and transparent SCM
has been fundamental to organisational performance given the current model of public
administration.
1.7. Conclusion: skills to support organsational development
Taken together the recent history of public sector reform and transformation suggests that the
capacities of government departments are uneven. In some places relatively effective
administrations are in place. In many other places, however, the machinery of government is
weak or has not been properly established. In such cases performance is contingent on the
often tedious work of organisation building: creating organisational stability, putting in place a
reliable and effective administration (record keeping, filing, minute-taking etc.), ensuring HR
plays a central role in the department (which can drive appropriate recruitment, link training to
organisational priorities, assist in stabilising departments), and linking strategy and vision to
careful and realistic operational planning. Particular skill has been developed in public
procurement – especially in specifications development and contract management. One of
the key drivers of institutional performance is a management cadre that is operationally

44
inclined, that is, able to translate policy into carefully designed operational plans and
implementation networks.
The analysis above thus suggests the following:
Individual training needs to be linked to organisational contexts, goals and capacity
needs.
Skills development plans must attend to the need for basic organisation building in the
public service.
Skills development initiatives of the PSETA should therefore prioritise training that
supports organisational development (OD).
Skills training has to be considered in relationship to building the capacity of
departments and agencies to improve their ability to perform in terms of their mandates
i.e. skills involved in organisational development. This focus is particularly relevant for
PSETA given its focus on the developing “transversal skills”.

45
Chapter 2
Demand for skills and training in the public service
2.1. Introduction
The following chapter focuses on the demand for different skills and categories of occupations
in the public service (i.e. labour demand) and on identifying the areas in which training of
existing public servants is most required. This analysis is guided by the analysis and
framework outlined in Chapter One.
Specifically, Chapter Two covers the following:
The projected growth of the public service over the next five year period; including an
estimation of growth and replacement demand of the public service.
Based on available evidence, it identifies the areas in which there is a scarcity of skill,
and a need for training of current public servants.
It provides an overview of the drivers of the skills demand in the public service.
Drawing on the framework outlined in Chapter One, it proposes a strategic focus for
skills development in the context of generally high demand for training and capacity
building across the public service.
2.2. Note on data sources
Projecting the demand and supply of labour and skill in any sector is a difficult task, but
particularly so in the case of the public service. This is partly because of the breadth of
functions it performs. It is also because traditional indicators of scarce skill used in the private
sector (such as vacancy rates in particular occupations, or relatively high salaries) do not
always ‘signal’ scarce skills as effectively in the case of the public sector. For example, salaries
in the public sector are ‘graded’, with limited room for negotiation on salaries between an
employer and employee. High vacancy rates in a particular occupation in a department can
point to the fact that the department has not adjusted its formal organisational structure to
reflect the fact that it is no longer hiring personnel in that occupational category, or it could
reflect that the department has used its budget on other line items and cannot afford to hire
more staff in a particular occupation.
The second challenge relates to the quality of the current data on the public service in South
Africa. According to the DPSA, a recent project aimed at improving the quality of data
capturing into the Persal system has improved the reliability of Persal data (interview with the
DPSA, July 2013), though more work still needs to be done to improve the Persal database.
Old occupational categories no longer used by HR should be removed from the system (some

46
occupations are included in a different category, or the occupational category is obsolete), the
data on public servants’ qualifications still needs improvement, as does data used to compute
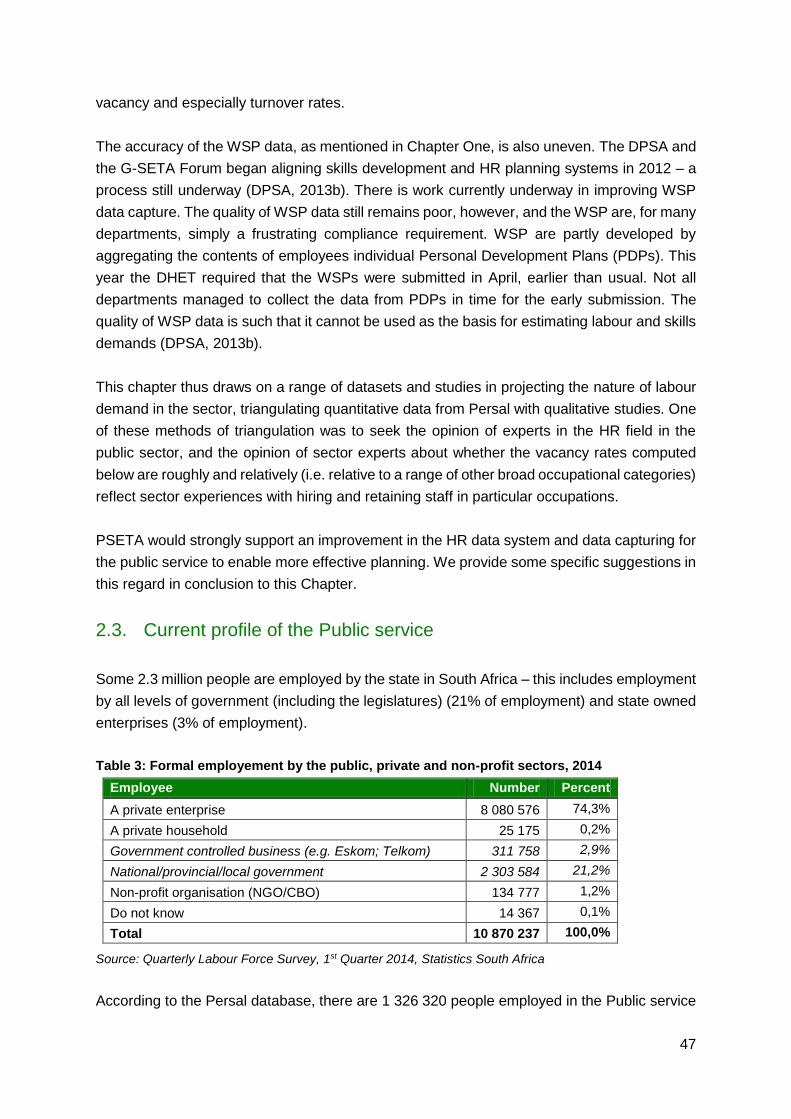
47
vacancy and especially turnover rates.
The accuracy of the WSP data, as mentioned in Chapter One, is also uneven. The DPSA and
the G-SETA Forum began aligning skills development and HR planning systems in 2012 – a
process still underway (DPSA, 2013b). There is work currently underway in improving WSP
data capture. The quality of WSP data still remains poor, however, and the WSP are, for many
departments, simply a frustrating compliance requirement. WSP are partly developed by
aggregating the contents of employees individual Personal Development Plans (PDPs). This
year the DHET required that the WSPs were submitted in April, earlier than usual. Not all
departments managed to collect the data from PDPs in time for the early submission. The
quality of WSP data is such that it cannot be used as the basis for estimating labour and skills
demands (DPSA, 2013b).
This chapter thus draws on a range of datasets and studies in projecting the nature of labour
demand in the sector, triangulating quantitative data from Persal with qualitative studies. One
of these methods of triangulation was to seek the opinion of experts in the HR field in the
public sector, and the opinion of sector experts about whether the vacancy rates computed
below are roughly and relatively (i.e. relative to a range of other broad occupational categories)
reflect sector experiences with hiring and retaining staff in particular occupations.
PSETA would strongly support an improvement in the HR data system and data capturing for
the public service to enable more effective planning. We provide some specific suggestions in
this regard in conclusion to this Chapter.
2.3. Current profile of the Public service
Some 2.3 million people are employed by the state in South Africa – this includes employment
by all levels of government (including the legislatures) (21% of employment) and state owned
enterprises (3% of employment).
Table 3: Formal employement by the public, private and non-profit sectors, 2014
Employee Number Percent
A private enterprise 8 080 576 74,3%
A private household 25 175 0,2%
Government controlled business (e.g. Eskom; Telkom) 311 758 2,9%
National/provincial/local government 2 303 584 21,2%
Non-profit organisation (NGO/CBO) 134 777 1,2%
Do not know 14 367 0,1%
Total 10 870 237 100,0%
Source: Quarterly Labour Force Survey, 1st Quarter 2014, Statistics South Africa
According to the Persal database, there are 1 326 320 people employed in the Public service

48
i.e. the number of people employed in national and provincial departments and national and
provincial public entities (irrespective of whether they are employed under the Public Service
Act or not). Employment data per province is shown below.
Table 4: Number of people employed in the South African public service, 2014
Province / national government Employees Per cent
National Departments 410 309 30.9%
Kwazulu-Natal 199 614 15.1%
Gauteng 160 207 12.1%
Eastern Cape 135 249 10.2%
Limpopo 117 743 8.9%
Western Cape 81 832 6.2%
Mpumalanga 74 349 5.6%
Free State 61 781 4.7%
North West 61 380 4.6%
Northern Cape 23 856 1.8%
Total 1 326 320 100%
Source: Persal, June 2014.
The number of personnel employed under the Public Service Act is shown below –
approximately half a million people.
Table 5: Number of people employed in the public service under the Public Service Act, 2014
Province / national government Number of employees Percent
National Department 155 914 30.6%
Kwazulu-Natal 68 549 13.4%
Gauteng 61 939 12.1%
Eastern Cape 53 396 10.5%
Limpopo 40 301 7.9%
Western Cape 34 699 6.8%
Free State 29 090 5.7%
Mpumalanga 28 690 5.6%
North West 25 826 5.1%
Northern Cape 11 501 2.3%
Total 509 905 100%
Source: Persal, June 2014.
There has been a slight reduction in the number of personnel employed in the national and
provincial government – from 1.33 million last year to 1.32 million this year, and likewise,
employment under the Public Service Act has decreased very marginally (from 516 195 to 509
905).
Employment data by race and gender in the public service are provided below, showing only

49
those employed under the Public Service Act. More women than men are employed in all
provincial governments across the provinces and in national government (58%). Employment
by race varies quite widely across the provincial governments.
Table 6: Employment in the public service under the Public Service Act by gender, 2014
Province / national government Percent Female Percent Male
National Department 56.5% 43.5%
Eastern Cape 64.3% 35.7%
Free State 58.9% 41.1%
Gauteng 60.0% 40.0%
Kwazulu-Natal 56.7% 43.3%
Limpopo 51.7% 48.3%
Mpumalanga 55.9% 44.1%
North West 57.2% 42.8%
Northern Cape 56.0% 44.0%
Western Cape 57.5% 42.5%
Total 57.6% 42.4%
Source: Persal, June 2014.
Table 7: Employment in the public service under the Public Service Act by race, 2014
Province / national government African Indian Coloured White
National Department 74.8% 2.8% 9.0% 13.4%
Eastern Cape 89.8% 0.3% 6.3% 3.7%
Free State 85.9% 0.1% 3.5% 10.5%
Gauteng 88.4% 1.4% 2.6% 7.6%
Kwazulu-Natal 86.6% 8.9% 1.4% 3.0%
Limpopo 98.4% 0.1% 0.2% 1.3%
Mpumalanga 95.3% 0.3% 0.5% 3.9%
North West 93.1% 0.4% 1.8% 4.7%
Northern Cape 52.8% 0.7% 39.7% 6.8%
Western Cape 23.3% 1.0% 62.5% 13.2%
Total 80.2% 2.4% 9.4% 8.0%
Source: Persal, June 2014.
Less than 1% (0.92%) of those employed under the Public Service Act have some form of
disability.9 National government employs a slightly higher proportion of people with disabilities
than any of the provinces (1.4%).10
As noted in Chapter One, PSETA support for skills development focuses on all occupations
in those departments reporting only to PSETA (i.e., those departments that do not also report
to a sector SETA such as education or health). In the case of those departments with dual
9 n= 508 833. Source: Persal, June 2014. 10 n= 508 833. Source: Persal, June 2014.

50
reporting, the focus is primarily on the SMS. As of June 2014, just under 2% of the public
service was employed in the SMS – 9 340 (1.8% of those employed under the Public Service
Act). Seventy one per cent of the SMS is black (a one percent increase from last year), 6%
are Indian, 8% are Coloured and 14% are White. Just over 60% of the SMS is male, and 1.1%
of the SMS has some form of disability.
The average length of service of employees in the public service is 11.5 years, with one fifth
having joined the public service less than three years ago.
Table 8: Years of service for those employed under the Public Service Act, 2014
Years of service Number of employees Percent
2 years and less 99 556 20%
3 to 5 years 91 071 18%
6 to 10 years 109 991 22%
11 to 20 years 87 427 17%
More than 20 years 120 788 24%
Total 508 833 100%
Source: Persal, June 2014.
Data on years of service by race is shown below. Just under half of white employees, and a
fifth of black employees employed under the Public Service Act were employed in the Public
service prior to democracy in 1994.
Table 9: Years of service for those employed under the Public Service Act by race, 2014
Years of service African Indian Coloured White
2 Years and less 20.3% 16.8% 19.4% 12.8%
3 to 5 years 19.4% 11.1% 15.2% 8.2%
6 to 10 years 23.3% 17.9% 18.5% 9.2%
11 to 20 years 16.1% 25.0% 20.9% 20.9%
More than 20 years 20.8% 29.2% 26.0% 48.9%
Total 100% 100% 100% 100%
n = 508 833. Source: Persal, June 2014.
The average age of employees in the public service is 41, with the average age of white
employees slightly older than that of African, Indian, and Coloured employees (46%, 41%,
41% and 42% respectively).
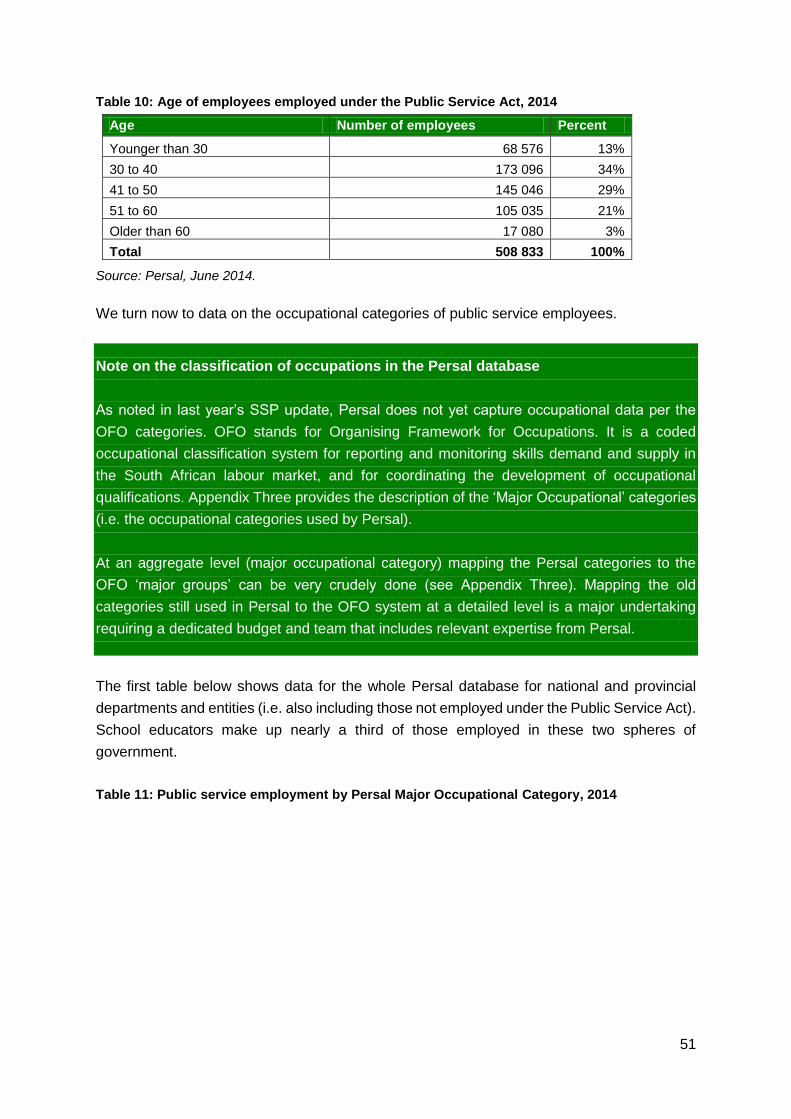
51
Table 10: Age of employees employed under the Public Service Act, 2014
Age Number of employees Percent
Younger than 30 68 576 13%
30 to 40 173 096 34%
41 to 50 145 046 29%
51 to 60 105 035 21%
Older than 60 17 080 3%
Total 508 833 100%
Source: Persal, June 2014.
We turn now to data on the occupational categories of public service employees.
Note on the classification of occupations in the Persal database
As noted in last year’s SSP update, Persal does not yet capture occupational data per the
OFO categories. OFO stands for Organising Framework for Occupations. It is a coded
occupational classification system for reporting and monitoring skills demand and supply in
the South African labour market, and for coordinating the development of occupational
qualifications. Appendix Three provides the description of the ‘Major Occupational’ categories
(i.e. the occupational categories used by Persal).
At an aggregate level (major occupational category) mapping the Persal categories to the
OFO ‘major groups’ can be very crudely done (see Appendix Three). Mapping the old
categories still used in Persal to the OFO system at a detailed level is a major undertaking
requiring a dedicated budget and team that includes relevant expertise from Persal.
The first table below shows data for the whole Persal database for national and provincial
departments and entities (i.e. also including those not employed under the Public Service Act).
School educators make up nearly a third of those employed in these two spheres of
government.
Table 11: Public service employment by Persal Major Occupational Category, 2014
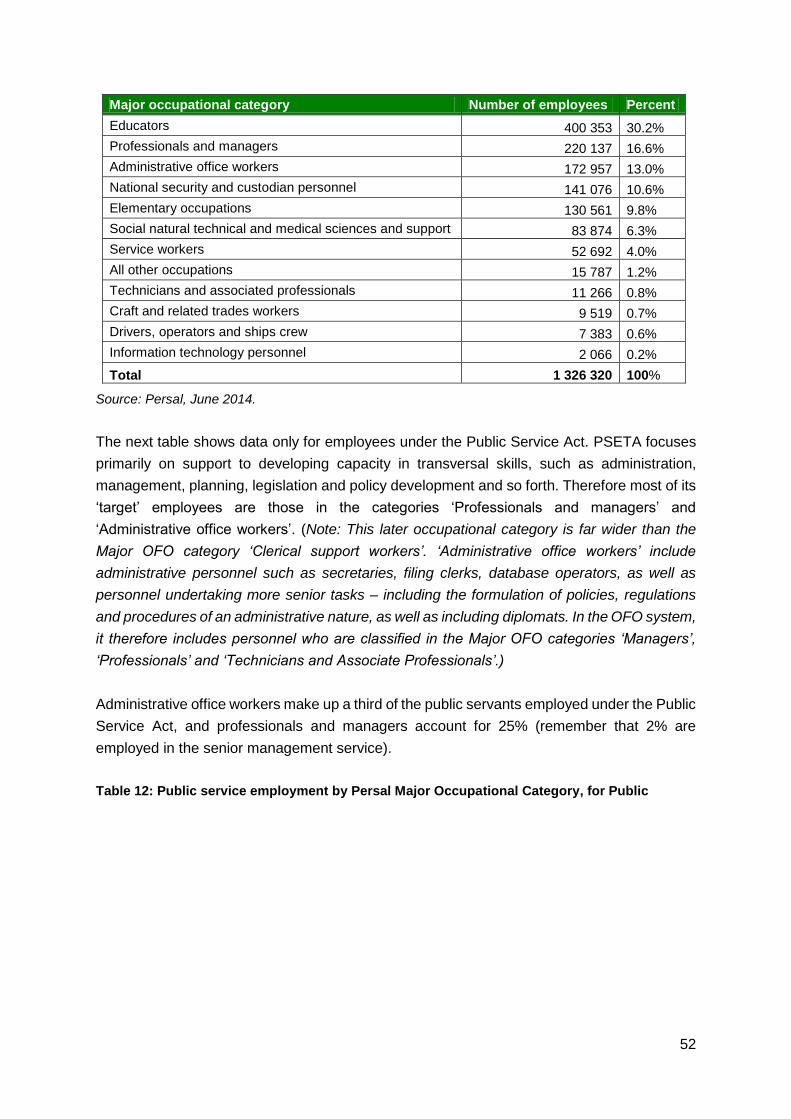
52
Major occupational category Number of employees Percent
Educators 400 353 30.2%
Professionals and managers 220 137 16.6%
Administrative office workers 172 957 13.0%
National security and custodian personnel 141 076 10.6%
Elementary occupations 130 561 9.8%
Social natural technical and medical sciences and support 83 874 6.3%
Service workers 52 692 4.0%
All other occupations 15 787 1.2%
Technicians and associated professionals 11 266 0.8%
Craft and related trades workers 9 519 0.7%
Drivers, operators and ships crew 7 383 0.6%
Information technology personnel 2 066 0.2%
Total 1 326 320 100%
Source: Persal, June 2014.
The next table shows data only for employees under the Public Service Act. PSETA focuses
primarily on support to developing capacity in transversal skills, such as administration,
management, planning, legislation and policy development and so forth. Therefore most of its
‘target’ employees are those in the categories ‘Professionals and managers’ and
‘Administrative office workers’. (Note: This later occupational category is far wider than the
Major OFO category ‘Clerical support workers’. ‘Administrative office workers’ include
administrative personnel such as secretaries, filing clerks, database operators, as well as
personnel undertaking more senior tasks – including the formulation of policies, regulations
and procedures of an administrative nature, as well as including diplomats. In the OFO system,
it therefore includes personnel who are classified in the Major OFO categories ‘Managers’,
‘Professionals’ and ‘Technicians and Associate Professionals’.)
Administrative office workers make up a third of the public servants employed under the Public
Service Act, and professionals and managers account for 25% (remember that 2% are
employed in the senior management service).
Table 12: Public service employment by Persal Major Occupational Category, for Public

53
Servants employed under the Public Service Act, 2014
Major occupational category Frequency Percent
Administrative office workers 172 957 33.9
Elementary occupations 130 561 25.6
Professionals and managers 126 388 24.8
Social natural technical and medical sciences and support 17 890 3.5
All other occupations 15 787 3.1
Service workers 14 109 2.8
Technicians and associated professionals 11 266 2.2
Craft and related trades workers 9 519 1.9
Drivers, operators and ships crew 7 383 1.4
Information technology personnel 2 066 0.4
National security and custodian personnel 1 979 0.4
Total 509 905 100
Source: Persal, June 2014.
Of the departments who report directly to PSETA (i.e. those who are not also reporting to
another SETA), 56% fall under the category ‘Administrative officer workers’ and a third fall
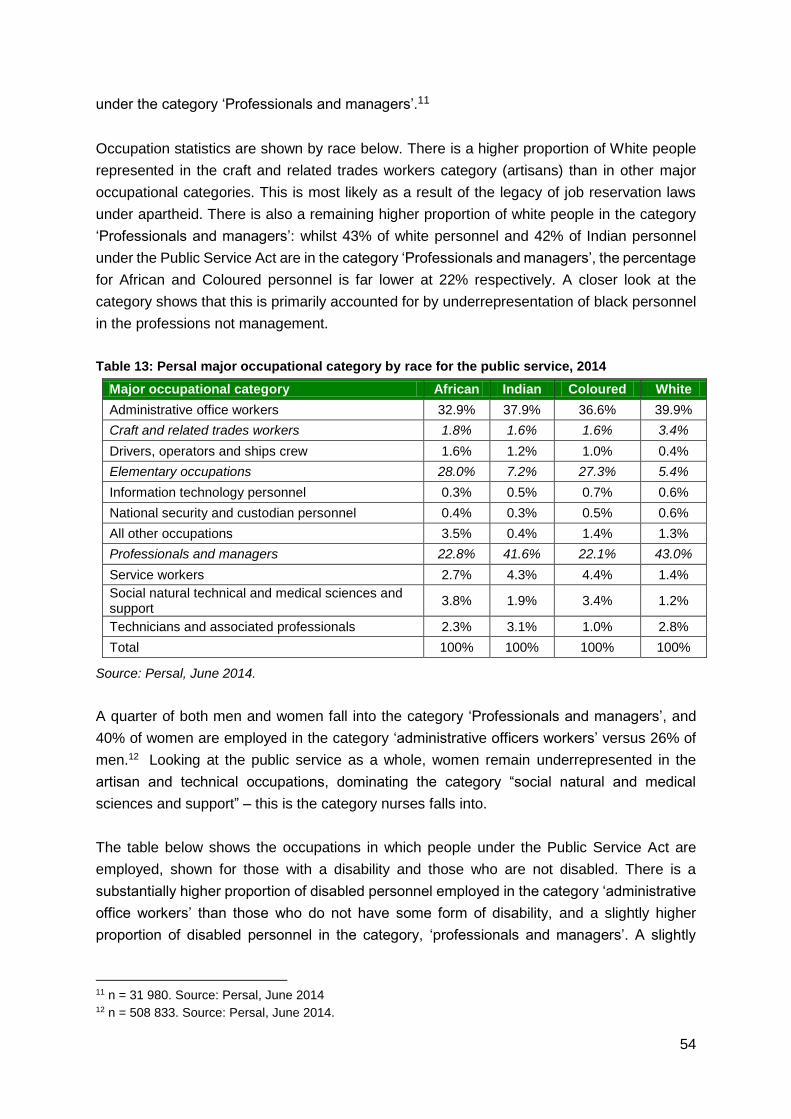
54
under the category ‘Professionals and managers’.11
Occupation statistics are shown by race below. There is a higher proportion of White people
represented in the craft and related trades workers category (artisans) than in other major
occupational categories. This is most likely as a result of the legacy of job reservation laws
under apartheid. There is also a remaining higher proportion of white people in the category
‘Professionals and managers’: whilst 43% of white personnel and 42% of Indian personnel
under the Public Service Act are in the category ‘Professionals and managers’, the percentage
for African and Coloured personnel is far lower at 22% respectively. A closer look at the
category shows that this is primarily accounted for by underrepresentation of black personnel
in the professions not management.
Table 13: Persal major occupational category by race for the public service, 2014
Major occupational category African Indian Coloured White
Administrative office workers 32.9% 37.9% 36.6% 39.9%
Craft and related trades workers 1.8% 1.6% 1.6% 3.4%
Drivers, operators and ships crew 1.6% 1.2% 1.0% 0.4%
Elementary occupations 28.0% 7.2% 27.3% 5.4%
Information technology personnel 0.3% 0.5% 0.7% 0.6%
National security and custodian personnel 0.4% 0.3% 0.5% 0.6%
All other occupations 3.5% 0.4% 1.4% 1.3%
Professionals and managers 22.8% 41.6% 22.1% 43.0%
Service workers 2.7% 4.3% 4.4% 1.4%
Social natural technical and medical sciences and support
3.8% 1.9% 3.4% 1.2%
Technicians and associated professionals 2.3% 3.1% 1.0% 2.8%
Total 100% 100% 100% 100%
Source: Persal, June 2014.
A quarter of both men and women fall into the category ‘Professionals and managers’, and
40% of women are employed in the category ‘administrative officers workers’ versus 26% of
men.12 Looking at the public service as a whole, women remain underrepresented in the
artisan and technical occupations, dominating the category “social natural and medical
sciences and support” – this is the category nurses falls into.
The table below shows the occupations in which people under the Public Service Act are
employed, shown for those with a disability and those who are not disabled. There is a
substantially higher proportion of disabled personnel employed in the category ‘administrative
office workers’ than those who do not have some form of disability, and a slightly higher
proportion of disabled personnel in the category, ‘professionals and managers’. A slightly
11 n = 31 980. Source: Persal, June 2014 12 n = 508 833. Source: Persal, June 2014.
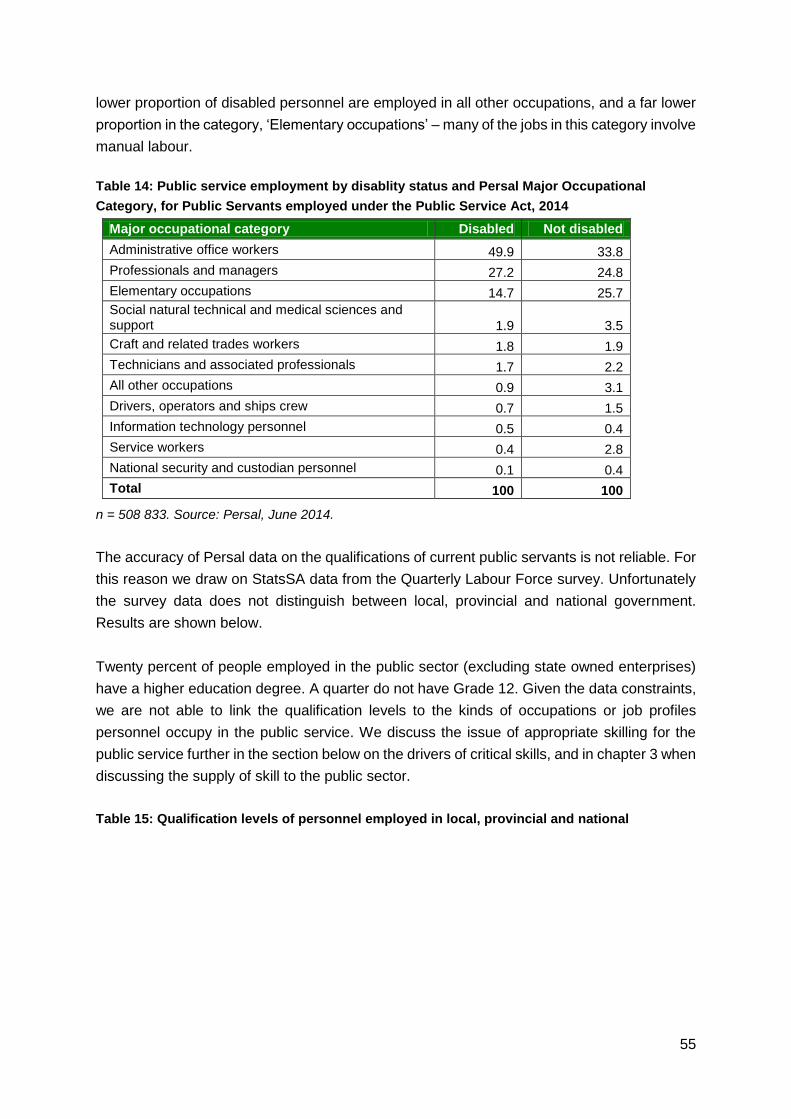
55
lower proportion of disabled personnel are employed in all other occupations, and a far lower
proportion in the category, ‘Elementary occupations’ – many of the jobs in this category involve
manual labour.
Table 14: Public service employment by disablity status and Persal Major Occupational
Category, for Public Servants employed under the Public Service Act, 2014
Major occupational category Disabled Not disabled
Administrative office workers 49.9 33.8
Professionals and managers 27.2 24.8
Elementary occupations 14.7 25.7
Social natural technical and medical sciences and support 1.9 3.5
Craft and related trades workers 1.8 1.9
Technicians and associated professionals 1.7 2.2
All other occupations 0.9 3.1
Drivers, operators and ships crew 0.7 1.5
Information technology personnel 0.5 0.4
Service workers 0.4 2.8
National security and custodian personnel 0.1 0.4
Total 100 100
n = 508 833. Source: Persal, June 2014.
The accuracy of Persal data on the qualifications of current public servants is not reliable. For
this reason we draw on StatsSA data from the Quarterly Labour Force survey. Unfortunately
the survey data does not distinguish between local, provincial and national government.
Results are shown below.
Twenty percent of people employed in the public sector (excluding state owned enterprises)
have a higher education degree. A quarter do not have Grade 12. Given the data constraints,
we are not able to link the qualification levels to the kinds of occupations or job profiles
personnel occupy in the public service. We discuss the issue of appropriate skilling for the
public service further in the section below on the drivers of critical skills, and in chapter 3 when
discussing the supply of skill to the public sector.
Table 15: Qualification levels of personnel employed in local, provincial and national

56
government, 2014
Qualification level Number of employees Percent
Primary school and less 176 343 7,7%
Grade 9 and below 150 351 6,5%
Less than Grade 12 244 716 10,6%
Grade 12 631 523 27,4%
Certificate/diploma 592 467 25,7%
Certificate/diploma without grade 12 28 556 1,2%
Bachelors 294 917 12,8%
Honours 106 157 4,6%
Master and above 60 218 2,6%
Do not know 7 629 0,3%
Other 10 708 0,5%
Total 2 303 584 100%
Source: StatsSA, Quarterly Labour Force Survey, 1st Quarter 2014
2.4. Growth and replacement demand
Growth demand refers to new appointments to the public service i.e. new labour demanded
over and above those needed for replacing existing staff that leave the public service (PSETA,
2011). The purpose of estimating the demand growth is to provide the parameters for planning
and budgeting for the number of people that will have to be skilled and recruited over a given
period.
A 2011 estimate of growth demand in the public service, i.e. the estimation of the growth in
the public service as a result of new jobs (for those employees to be employed under the
Public Service Act) was 4.4% on average over the 2012 to 2016 period (given historical trends)
(DPSA, 2013b). 13 However, as noted in the section above, the number of employees
employed in the Public service (national and provincial government) has decreased very
13 These estimates include only those public servants employed in terms of the Public Service Act. Data
reported in a report of the PSSC based on a model for estimating labour demand developed by PSETA.
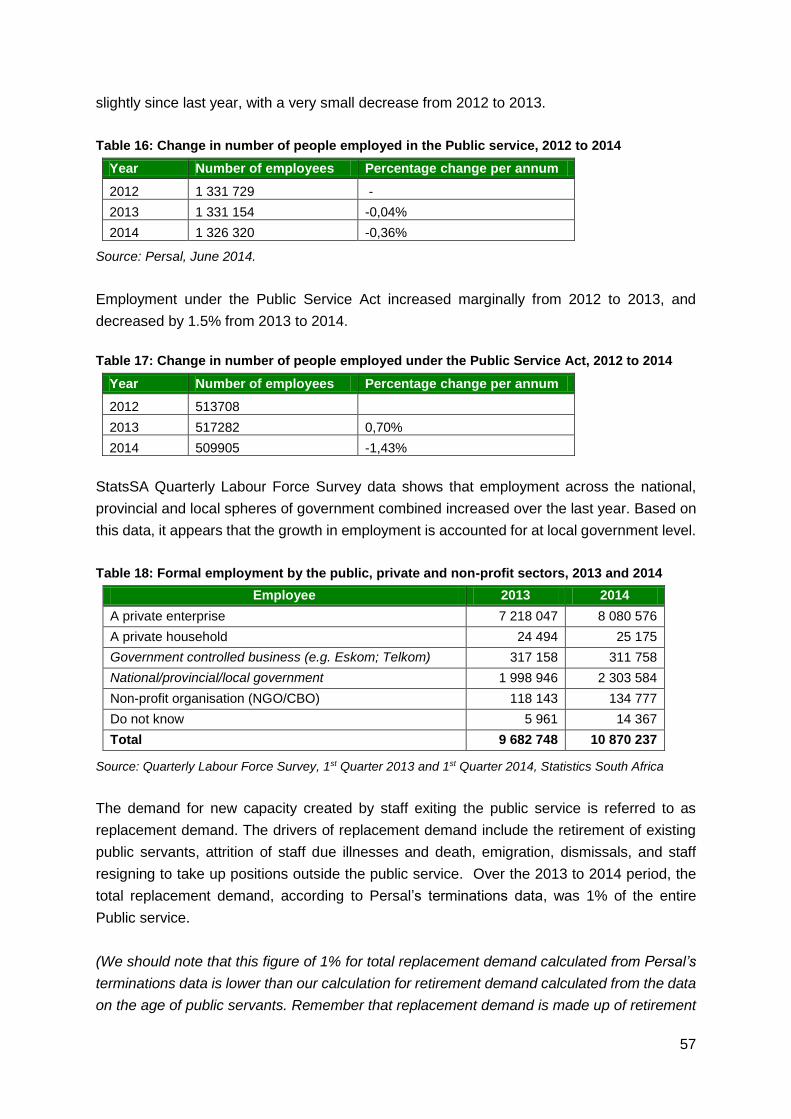
57
slightly since last year, with a very small decrease from 2012 to 2013.
Table 16: Change in number of people employed in the Public service, 2012 to 2014
Year Number of employees Percentage change per annum
2012 1 331 729 -
2013 1 331 154 -0,04%
2014 1 326 320 -0,36%
Source: Persal, June 2014.
Employment under the Public Service Act increased marginally from 2012 to 2013, and
decreased by 1.5% from 2013 to 2014.
Table 17: Change in number of people employed under the Public Service Act, 2012 to 2014
Year Number of employees Percentage change per annum
2012 513708
2013 517282 0,70%
2014 509905 -1,43%
StatsSA Quarterly Labour Force Survey data shows that employment across the national,
provincial and local spheres of government combined increased over the last year. Based on
this data, it appears that the growth in employment is accounted for at local government level.
Table 18: Formal employment by the public, private and non-profit sectors, 2013 and 2014
Employee 2013 2014
A private enterprise 7 218 047 8 080 576
A private household 24 494 25 175
Government controlled business (e.g. Eskom; Telkom) 317 158 311 758
National/provincial/local government 1 998 946 2 303 584
Non-profit organisation (NGO/CBO) 118 143 134 777
Do not know 5 961 14 367
Total 9 682 748 10 870 237
Source: Quarterly Labour Force Survey, 1st Quarter 2013 and 1st Quarter 2014, Statistics South Africa
The demand for new capacity created by staff exiting the public service is referred to as
replacement demand. The drivers of replacement demand include the retirement of existing
public servants, attrition of staff due illnesses and death, emigration, dismissals, and staff
resigning to take up positions outside the public service. Over the 2013 to 2014 period, the
total replacement demand, according to Persal’s terminations data, was 1% of the entire
Public service.
(We should note that this figure of 1% for total replacement demand calculated from Persal’s
terminations data is lower than our calculation for retirement demand calculated from the data
on the age of public servants. Remember that replacement demand is made up of retirement

58
demand, plus resignations, plus exits due to ill heath, mortality and dismissal. Replacement
demand figures should thus be higher than retirement demand figures. Either there is missing
data from the terminations data i.e. an undercount, or not all of the age data is acurrate, or a
combination of both).
Assuming that all public servants employed under the Public Service Act retire at the age of
60 then Persal data estimates that 70 695 will retire in five years time (14% of the current
employees employed under the Public Service Act). This is the ‘upper’ estimate of retirement
demand, as not all Public Servants leave at 60 years of age. This figure of 14% is a slight
increase since last year in the proportion of the staff who will leave the public service to retire
(this figure was 13% in 2013). If all Public Servants under the Public Service Act are assumed
to retire at the age of 65, then Persal data estimates that 23 303 will retire in five years time
(4.6% of current employees employed under the Public Service Act).14
According to Persal data for this year, retirement accounted for 38% of the total replacement
demand for the Public service. The most common reason for leaving the Public service was
resignations (45.7% of total replacement demand).15
Table 19: Reasons for officials leaving the Public service over the 2013 to 2014 period
Reason for leaving Percent of total exits
Resignation 45,7%
Retirement 37,6%
Deceased 10,0%
Contract expired and not renewed 2,6%
Dismissal or resignation with criminal charges 1,9%
Discharged for Ill-health 0,4%
Misconduct or suspension 0,1%
Other 1,6%
Total 100%
Source: Quarterly Labour Force Survey, 1st Quarter 2013 and 1st Quarter 2014, Statistics South Africa
As was mentioned in the last SSP, there is no up-to-date data on twhat proportinon of civil
servants who leave the public sector leave to work in the private sector versus the civil society
sector, or due to emigration. Estimates of the rate of emigration of the working population from
South Africa vary from 0.1% to just over 0.2%, depending on the statistics used16. Professional
14 n = 508 833. Source: Persal, June 2014. 15 Resignations can include leaving the public service due to ill-health – those who were not boarded. 16 The latest definitive StatsSA figures that could be found for emigration were for the year 2003, in which
year 12 285 people of working age (age 20 to 60) were self-declared emigrants – source: StatsSA, 2003.
The Centre for Development and Enterprise estimated an average of 37 142 emigrants per year for the period
1989 to 2003 (28 228 people between the ages of 20 and 60) – source: Forced Migration Studies Programme,
2010.

59
occupations are more likely to the affected.
PSETA’s SSP (2011) noted that, “Although no specific figures are available for public service
employees, the ASSA [Actuarial Society of South Africa] statistics for HIV prevalence, overlaid
on the demographics of public sector employment, suggest that more than 100 000 public
sector employees are likely to be infected” (2011 is the latest date that updated statistics from
the model were developed). This is approximately a fifth of the employees employed under
the Public Service Act, and just under a tenth of those in the whole Public service. It should
be noted, however, that since these figures were estimated, there has been a more substantial
roll out of Anti-Retroviral Treatment. Whilst death was the third leading cause of replacement
demand in the public service (10% of exits), this represented only 0.07% of the entire public
service from 2013 to 2014.
Given that replacement demand over the last year was 1% of the public service, according to
the latest Persal data (we suspect it is slightly higher than this – see our comments above) it
is clear that the large majority of staff turnover is created by mobility within the public service
(see also PSC, 2008) rather exits from the public service. Average turnover rates in the public
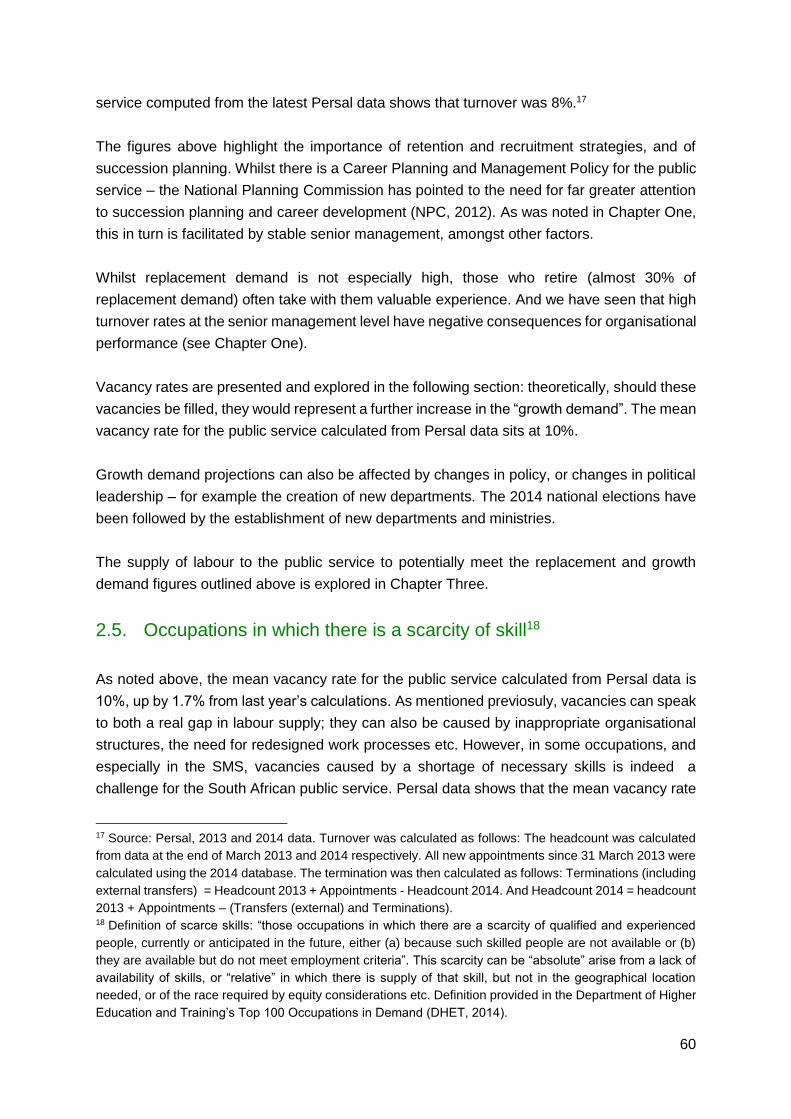
60
service computed from the latest Persal data shows that turnover was 8%.17
The figures above highlight the importance of retention and recruitment strategies, and of
succession planning. Whilst there is a Career Planning and Management Policy for the public
service – the National Planning Commission has pointed to the need for far greater attention
to succession planning and career development (NPC, 2012). As was noted in Chapter One,
this in turn is facilitated by stable senior management, amongst other factors.
Whilst replacement demand is not especially high, those who retire (almost 30% of
replacement demand) often take with them valuable experience. And we have seen that high
turnover rates at the senior management level have negative consequences for organisational
performance (see Chapter One).
Vacancy rates are presented and explored in the following section: theoretically, should these
vacancies be filled, they would represent a further increase in the “growth demand”. The mean
vacancy rate for the public service calculated from Persal data sits at 10%.
Growth demand projections can also be affected by changes in policy, or changes in political
leadership – for example the creation of new departments. The 2014 national elections have
been followed by the establishment of new departments and ministries.
The supply of labour to the public service to potentially meet the replacement and growth
demand figures outlined above is explored in Chapter Three.
2.5. Occupations in which there is a scarcity of skill18
As noted above, the mean vacancy rate for the public service calculated from Persal data is
10%, up by 1.7% from last year’s calculations. As mentioned previosuly, vacancies can speak
to both a real gap in labour supply; they can also be caused by inappropriate organisational
structures, the need for redesigned work processes etc. However, in some occupations, and
especially in the SMS, vacancies caused by a shortage of necessary skills is indeed a
challenge for the South African public service. Persal data shows that the mean vacancy rate
17 Source: Persal, 2013 and 2014 data. Turnover was calculated as follows: The headcount was calculated
from data at the end of March 2013 and 2014 respectively. All new appointments since 31 March 2013 were
calculated using the 2014 database. The termination was then calculated as follows: Terminations (including
external transfers) = Headcount 2013 + Appointments - Headcount 2014. And Headcount 2014 = headcount
2013 + Appointments – (Transfers (external) and Terminations). 18 Definition of scarce skills: “those occupations in which there are a scarcity of qualified and experienced
people, currently or anticipated in the future, either (a) because such skilled people are not available or (b)
they are available but do not meet employment criteria”. This scarcity can be “absolute” arise from a lack of
availability of skills, or “relative” in which there is supply of that skill, but not in the geographical location
needed, or of the race required by equity considerations etc. Definition provided in the Department of Higher
Education and Training’s Top 100 Occupations in Demand (DHET, 2014).
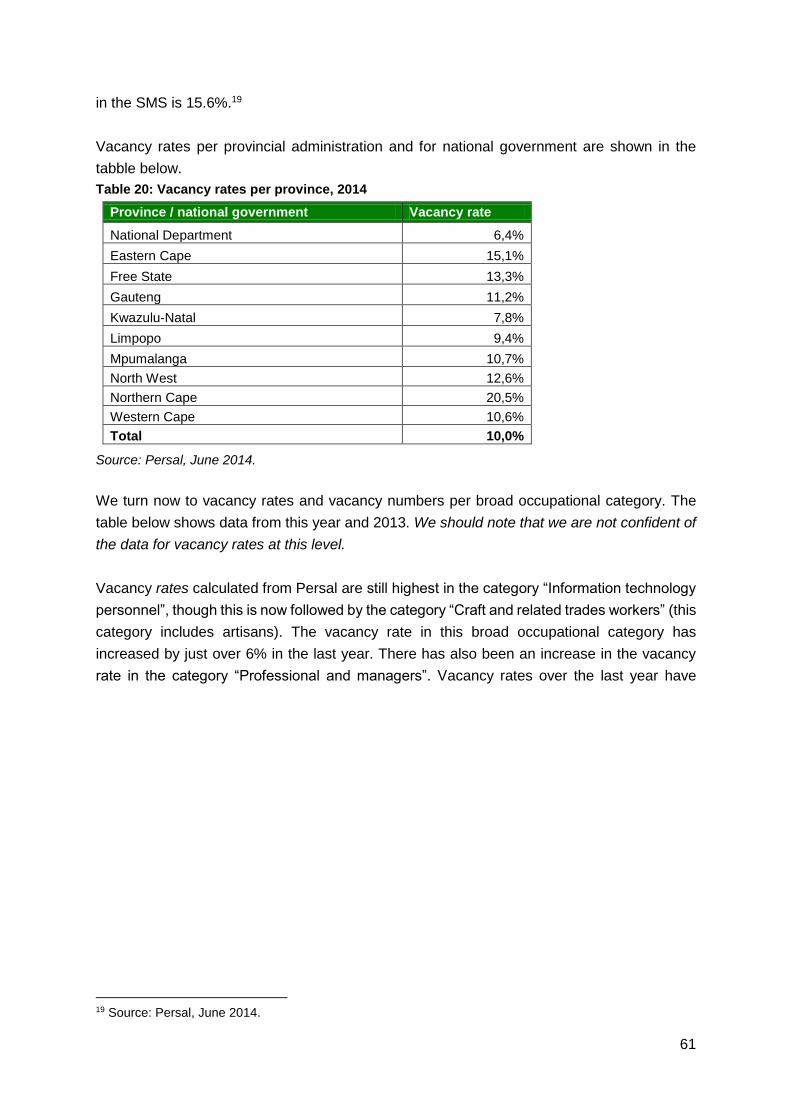
61
in the SMS is 15.6%.19
Vacancy rates per provincial administration and for national government are shown in the
tabble below.
Table 20: Vacancy rates per province, 2014
Province / national government Vacancy rate
National Department 6,4%
Eastern Cape 15,1%
Free State 13,3%
Gauteng 11,2%
Kwazulu-Natal 7,8%
Limpopo 9,4%
Mpumalanga 10,7%
North West 12,6%
Northern Cape 20,5%
Western Cape 10,6%
Total 10,0%
Source: Persal, June 2014.
We turn now to vacancy rates and vacancy numbers per broad occupational category. The
table below shows data from this year and 2013. We should note that we are not confident of
the data for vacancy rates at this level.
Vacancy rates calculated from Persal are still highest in the category “Information technology
personnel”, though this is now followed by the category “Craft and related trades workers” (this
category includes artisans). The vacancy rate in this broad occupational category has
increased by just over 6% in the last year. There has also been an increase in the vacancy
rate in the category “Professional and managers”. Vacancy rates over the last year have
19 Source: Persal, June 2014.

62
dropped in the categories “Technicians and associated professionals”.20
In terms of the absolute number of vacancies per broad occupational category, the vacancies
are highest in “Professionals and managers”, “administrative office workers”, (these two
categories being PSETA’s focus) “elementary occupations” and educators. Note that the
cateogories “Professionals and managers”, “administrative office workers” are both very
broad.
In summary, vacancy rates are highest in the technical and professional occupations which
require either specialist training in higher education institutions (in the case of the professions)
or training in colleges and appropriate artisanships (in the case of artisans and other technical
occupations); and highest in terms of absolute numbers in the administrative and managerial
occupations. The NPC mentions acute shortages of technical and administrative skill within
departments and a reliance on outsourcing for professional and technical services (NPC, 2011
and NPC, 2012).
20 The category ‘National security and custodian personnel’ encorporates a very wide range of skills levels.

63
Table 21: Vacancy rates and numbers in the public service per Persal Major Occupational
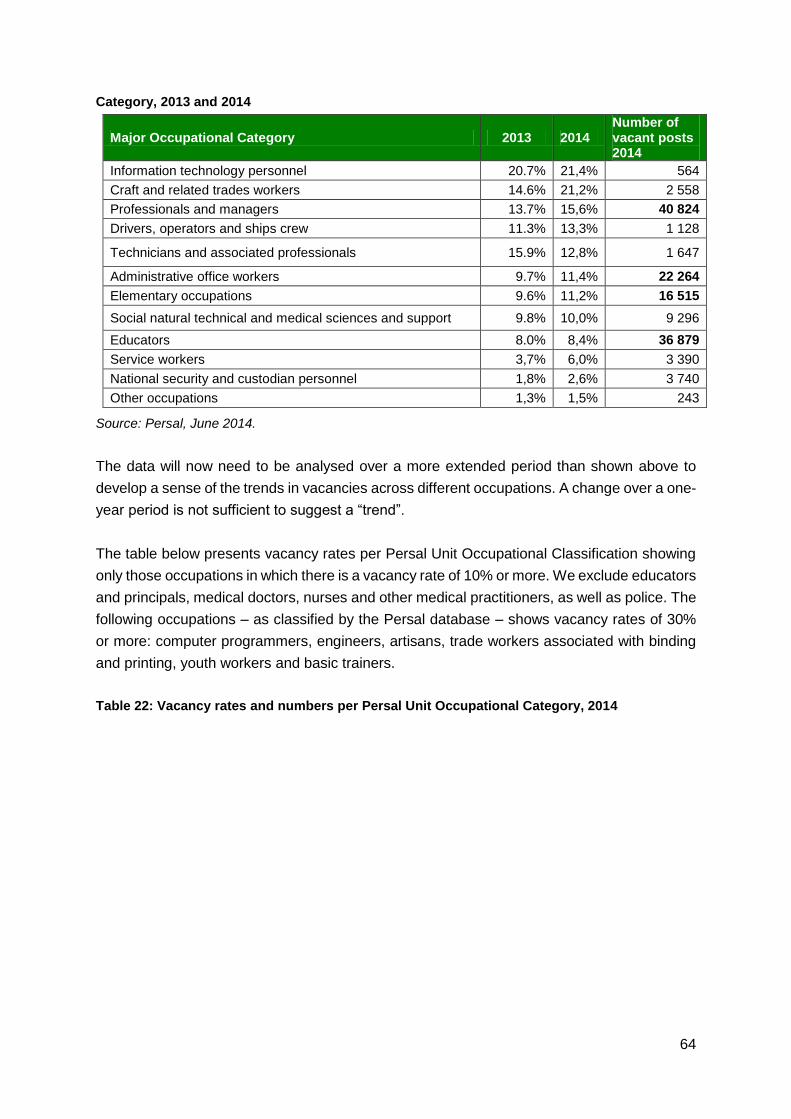
64
Category, 2013 and 2014
Major Occupational Category 2013 2014 Number of vacant posts 2014
Information technology personnel 20.7% 21,4% 564
Craft and related trades workers 14.6% 21,2% 2 558
Professionals and managers 13.7% 15,6% 40 824
Drivers, operators and ships crew 11.3% 13,3% 1 128
Technicians and associated professionals 15.9% 12,8% 1 647
Administrative office workers 9.7% 11,4% 22 264
Elementary occupations 9.6% 11,2% 16 515
Social natural technical and medical sciences and support 9.8% 10,0% 9 296
Educators 8.0% 8,4% 36 879
Service workers 3,7% 6,0% 3 390
National security and custodian personnel 1,8% 2,6% 3 740
Other occupations 1,3% 1,5% 243
Source: Persal, June 2014.
The data will now need to be analysed over a more extended period than shown above to
develop a sense of the trends in vacancies across different occupations. A change over a one-
year period is not sufficient to suggest a “trend”.
The table below presents vacancy rates per Persal Unit Occupational Classification showing
only those occupations in which there is a vacancy rate of 10% or more. We exclude educators
and principals, medical doctors, nurses and other medical practitioners, as well as police. The
following occupations – as classified by the Persal database – shows vacancy rates of 30%
or more: computer programmers, engineers, artisans, trade workers associated with binding
and printing, youth workers and basic trainers.
Table 22: Vacancy rates and numbers per Persal Unit Occupational Category, 2014
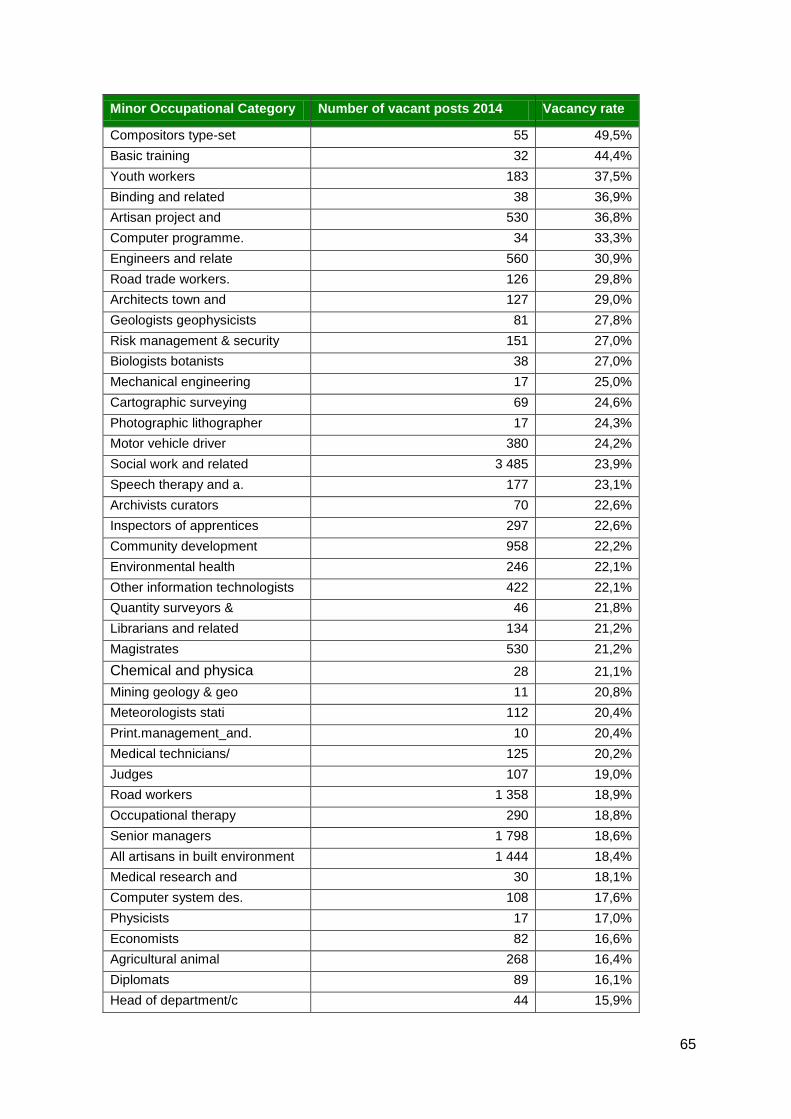
65
Minor Occupational Category Number of vacant posts 2014 Vacancy rate
Compositors type-set 55 49,5%
Basic training 32 44,4%
Youth workers 183 37,5%
Binding and related 38 36,9%
Artisan project and 530 36,8%
Computer programme. 34 33,3%
Engineers and relate 560 30,9%
Road trade workers. 126 29,8%
Architects town and 127 29,0%
Geologists geophysicists 81 27,8%
Risk management & security 151 27,0%
Biologists botanists 38 27,0%
Mechanical engineering 17 25,0%
Cartographic surveying 69 24,6%
Photographic lithographer 17 24,3%
Motor vehicle driver 380 24,2%
Social work and related 3 485 23,9%
Speech therapy and a. 177 23,1%
Archivists curators 70 22,6%
Inspectors of apprentices 297 22,6%
Community development 958 22,2%
Environmental health 246 22,1%
Other information technologists 422 22,1%
Quantity surveyors & 46 21,8%
Librarians and related 134 21,2%
Magistrates 530 21,2%
Chemical and physica 28 21,1%
Mining geology & geo 11 20,8%
Meteorologists stati 112 20,4%
Print.management_and. 10 20,4%
Medical technicians/ 125 20,2%
Judges 107 19,0%
Road workers 1 358 18,9%
Occupational therapy 290 18,8%
Senior managers 1 798 18,6%
All artisans in built environment 1 444 18,4%
Medical research and 30 18,1%
Computer system des. 108 17,6%
Physicists 17 17,0%
Economists 82 16,6%
Agricultural animal 268 16,4%
Diplomats 89 16,1%
Head of department/c 44 15,9%

66
Civil engineering 107 15,9%
Middle managers 9 073 15,5%
Other administration policy 2 262 15,4%
Financial and relate 1 112 14,9%
General legal administration 435 14,8%
Veterinary assistant 10 14,7%
Housekeepers laundry 139 14,6%
Secretaries and other 2 083 14,4%
Nature conservation 83 14,3%
Psychologists and volunteers 203 14,2%
Electrical and electrician 25 14,2%
Human resources & or 917 14,2%
Regulatory inspector 1 258 14,1%
Water plant 50 13,9%
Trade labourers 1 202 13,8%
Advocates 107 13,8%
Household and laundry 2 094 13,7%
Language practitioner 247 13,6%
Financial clerks and 1 847 13,4%
Attorneys 39 13,3%
Building and other p 1 011 13,2%
Logistical support p 606 13,2%
Library mail and rel 796 13,2%
Farm hands and labour 641 12,6%
Educationists. 68 12,6%
Road superintendents 27 12,6%
Print.& machine operations 36 12,5%
Professional nurse 9 584 12,5%
Cartographers and su 53 12,5%
Dental therapy 42 12,4%
Motorised farm and f 46 12,3%
Statisticians and re 138 12,3%
Trade/industry advisor 122 12,1%
Light vehicle driver 380 11,5%
Veterinarians 34 11,2%
Mess ports & delivery 1 004 10,9%
Farming forestry advisor 29 10,8%
Other machine operations 24 10,7%
Material-recording a 932 10,5%
Other administrative 10 744 10,3%
Cleaners in offices 7 750 10,1%
Auxiliary and 1 799 10,1%
Source: Persal, June 2014.

67
Given that vacancy rates calculated from current Persal data suggest that vacancies are high
across a very wide range of skills, how to we identify priority scarce skills within this context?
As trite as the observation is, it is worth noting that even if vacancy rates or vacancy numbers
are equally high across a number of different occupations, these occupations do not
necessarily require equal attention: a shortage of managers will have a far greater impact on
service delivery than, say, office cleaners. We will therefore now look at what a range of other
studies have suggested about scarce skills in the public service.
In May this year, the DHET published, for public comment, a list of “top 100 occupations in
demand” in the South African economy (DHET, 2014). The list was developed based on a
literature review of qualitative studies and quantitative studies, policy documents such as the
NDP, the Industrial Policy Action Plan and the New Growth Path, as well as data from SETA
sector skills analysis. 21 The list includes management skills in specific areas (Municipal
Managers, Human Resource Management, Operations Management, Health and Safety,
General Managers); medical practitioners are also mentioned, as are project mangers in IT
and construction, and teachers in maths and science. Engineers, technicians and artisans,
however, dominate the list.
Persal data shows that vacancy rates for engineers in the public service sit at 31% (and higher
for specific engineering occupations). National Treasury personnel (August 2013) suggest that
there is a shortage of supply of electrical engineers – skills also include in the Top 100 list.
Vacancy rates in the engineering profession are not always created by an absolute scarcity of
skill – recruitment of engineers to the departments based outside the major metropolitan areas
presents a particular challenge.
A recent report on the water and sanitation sector in South Africa notes the shortage of
technical skills outside the urban centres as a challenge for delivery (Morgan et al, 2014).
However, the report highlights that the primary shortage in this sector does not lie in
engineering occupations, but in the artisan and trades related occupations - such as
millwrights, sewage works operators, plumbers and so forth (Morgan et al, 2014). The study
shows that despite the need for these skills, personnel budget allocations (in terms of salaries
and in terms of number of posts) have privileged senior managers over trades related
occupations, deepening the problem of recruiting and training artisans and technical personnel
(Morgan et al, 2014).
A 2013 PSSC report notes that, “The trades remain a key skills shortage in the country as a
whole” and that forecasts show that even with the increased focus on training new artisans,
the increase will not be sufficient to respond to demand over the next five years.” (DPSA,
21 Depending on where the skill was listed as scarce, how many times and so forth, it was weighted using a
specified methodology.

68
2013b). According to Persal, there are 9 519 people currently employed in the category ‘Craft
and related trades workers’. The National Skills Accord, signed in 2011, is an agreement
between labour, business, and government. The aim of the Accord is expand skills for
economic growth and to contribute to creating 5 million jobs by 2020 in line with New Growth
Path targets. The Accord commits the public sector to increasing its intake and training of
artisans – primarily through state owned enterprises. There are eight commitments outlined in
the National Skills Accord – from funding commitments to commitments to improving training
at Further Education and Training (FET) colleges.22
The scarcity of engineering and artisan skills also has implications for South Africa being able
to transition to a more ‘green economy’. There are now various policies that commit South
Africa to transitioning to a ‘green economy’ (see for example the New Growth Path, see also
the National Development Plan). Whilst the renewable energies sector has the potential to
create employment (it is more labour intensive than fossil fuel), the supply of technical skills
to support the move towards a more environmentally sustainable economy will need to
increase. However, estimating the exact scarcity of green skills has been difficult for a number
of reasons, as a recent paper notes (Lotz-Sisitka et al, 2013). The Department of
Environmental Affairs, in partnership with associated government departments and civil
society, has embarked on initiatives focusing on addressing skills gaps in the environmental
sector. A Green Matter and National Environmental Sector Skills Planning Forum has been
developed, and research is being undertaken to inform the development of new qualifications
to support the green economy and improved environmental sustainability, on estimating labour
demand, as well as mapping existing qualifications to this sector. (See Lotz-Sisitka et al, 2013)
The increase in infrastructure development as a result of the funding provided for the Strategic
Integrated Projects (SIPs) will see increased demand for built environment specialists, and for
personnel in infrastructure procurement and management (interviews with National Treasury,
August 2013). An Infrastructure Delivery Management System (IDMS) is being developed
which aims to provide a coordinated system for procuring, developing, managing and
physically maintaining the various infrastructure projects. The Construction Education and
Training Sector Authority (CETA) SSP highlights that the demand for all skills across the
construction sector will increase with the roll out of SIP. Interviews with personnel in the
National Treasury planning for the roll out of the SIPS (August, 2013) suggested that there is
an absolute scarcity of professional registrations in Geographic Information Systems and a
number of other occupations in the build environment sector. The DHET’s draft list of Top 100
occupations in demand includes quantity surveyors (21% vacancy according to the Persal
22 Expand the level of training using existing facilities; Make internship and placement opportunities available
within workplaces; Set guidelines of ratios of trainees: artisans as well as across the technical vocations, in
order to improve the level of training; Improve the funding of training and the use of funds available for training
and incentives on companies to train; Set annual targets for training in state owned enterprises; Improve
SETA governance and financial management as well as stakeholder involvement; Align training to the New
Growth Path and improve Sector Skills Plans; Improve the role and performance of FET Colleges. Source:
Department of Economic Development, 2011.
69
data), construction project managers, and land surveyors. In the built environment sector,
urban planners are also mentioned as scarce skills.
Many reports, including the NPC’s Diagnostic (2011), refer to weakness in the management
capacity in the public service. We have already noted that the vacancy rate in the SMS is
15.6%. And there is a high vacancy rate for middle managers in the Persal database. The
shortage in skills in management are not so much in the lack of supply of personnel with
degrees in public administration, public management, business management and so on. As
we will show in the section below, it is the competency and skill of personnel employed in
many senior management positions in the public service that is of concern.
Effective management requires a range of supporting functions – strong basic administrative
capacity for example. Studies have pointed to weaknesses in administrative functions such as
record keeping (TAU, 2012). Research by PARI (Yuba, 2013) has identified this occupation
as one in which there is an absolute scarcity of skills. However PARI’s research found that the
recruitment of archivists and related professionals has also been affected by cutbacks in
funding to these positions and by a lack of prioritisation of this kind of skill in many government
departments. Recent interviews with the National Treasury (August, 2013) on the roll out of
the SIP pointed to the fact that unless basic administration capacity is improved, the IDMS
system will not function properly. This requires people skilled in record keeping, database
management, administrative systems design and related skills sets.
Vacancy rates for finance related occupations sit amongst the lowest, according to the Persal
database (though vacancy rates are too high given the centrality of this function to public
service performance and accountability to citizens). Yet, based on the Auditor-General
findings (Auditor General, 2013) there is a real need to improve the state of financial
management in the South African public service, especially as it affects procurement. The
Chief Procurement Officer (OCPO) in the National Treasury has noted that one of the reasons
that skills in the area of public procurement have not been classified as “scarce” is because
senior management in the public sector has not fully appreciated that public procurement is a
highly complex and technically demanding task that requires specialist training (interviews with
the OCPO, September 2013).23 In India, for example, there are well-respected schools and
training programmes that specialise in developing skills in public procurement (interviews with
SARS, September 2013). This has not been the case in South Africa. The OCPO is currently
in the process developing a detailed outline of the specific competencies needed in public
procurement to support departments across the country.
According to the Persal data, vacancies in the occupations classified as HR sit at 14% -
23 For a more detailed analysis of the challenges to improving the procurement system and improving
compliance across the public service, see the report Technical Assistance Unit of the National Treasury
(TAU), 2012. Diagnostic Research Report on Corruption, Non-Compliance and Weak Organisations. Study
undertaken by the Public Affairs Research Institute (PARI) for the TAU. Pretoria: TAU.
70
amongst the lowest across occupations, though arguably too high given the importance of the
HR function in departments. The need for South Africa to develop more specialist human
resource managers for the broader economy is now being recognised: Human Resource
Managers are included in the DHET’s draft list of top 100 occupations in demand in the South
African economy (DHET, 2014). With respect to the public service, a PSSC report notes that,
“There are mixed views about whether there are enough funded and filled HR posts in the
public sector…”, though note though that, “ The public service represents 15% of all formal
employment in SA, but only about 8% of all HR professionals.…” (DPSA, 2013b).
The DPSA has highlighted that the capacity of many (though certainly not all) HR and HRD
personnel in the public service is a cause for concern: “HR Connect data suggests that even
where HR posts exist and are filled, the staff employed in these posts do not have the task
proficiency, knowledge proficiency or critical skills required…”. (DPSA, 2013b).
We turn now to an examination of where current employees in the public service require
training and other forms of capacity building.
2.6. Competency gaps of current public servants
The NDP points to major skills deficits in the public service (NPC, 2012). HR Connect results
suggest large shortfalls in Public Servants’ skills and content knowledge across all OFO
Groups. A PSSC report notes that, “The DPSA’s HR Connect data24 shows that many public
service sector employees are vastly under qualified or/and skilled to perform their jobs
efficiently.” (DPSA, 2013).
The National Planning Commission highlights that this deficit in skill is especially acute at
senior management level.
The Chief Directorate of the SMS now undertakes routine ‘competency’ assessments of the
capacity of the SMS. 25 The assessments scored officials on a scale of 1 to 4, where 1 is
described as “not achieved proficiency”, 2 is “partially achieved”, 3 is “achieved” and 4 is
24 The DPSA’s HR Connect data measures public servants’ levels of task proficiency in their roles, their
content knowledge, qualifications gaps etc. The assessments were essentially guided self-assessments of
public servants’ competencies. 25 The DPSA defines competencies as “The blend of knowledge, skills, behaviour and aptitude that a person
can apply in the work environment, which indicates a person’s ability to meet the requirements of a specific
post.” (DPSA, 2008).

71
“exceeded expectation” (DPSA, 2013c).
The average scores per salary level are shown in the table below. None of the management
levels scored at the level of “proficient” or above.
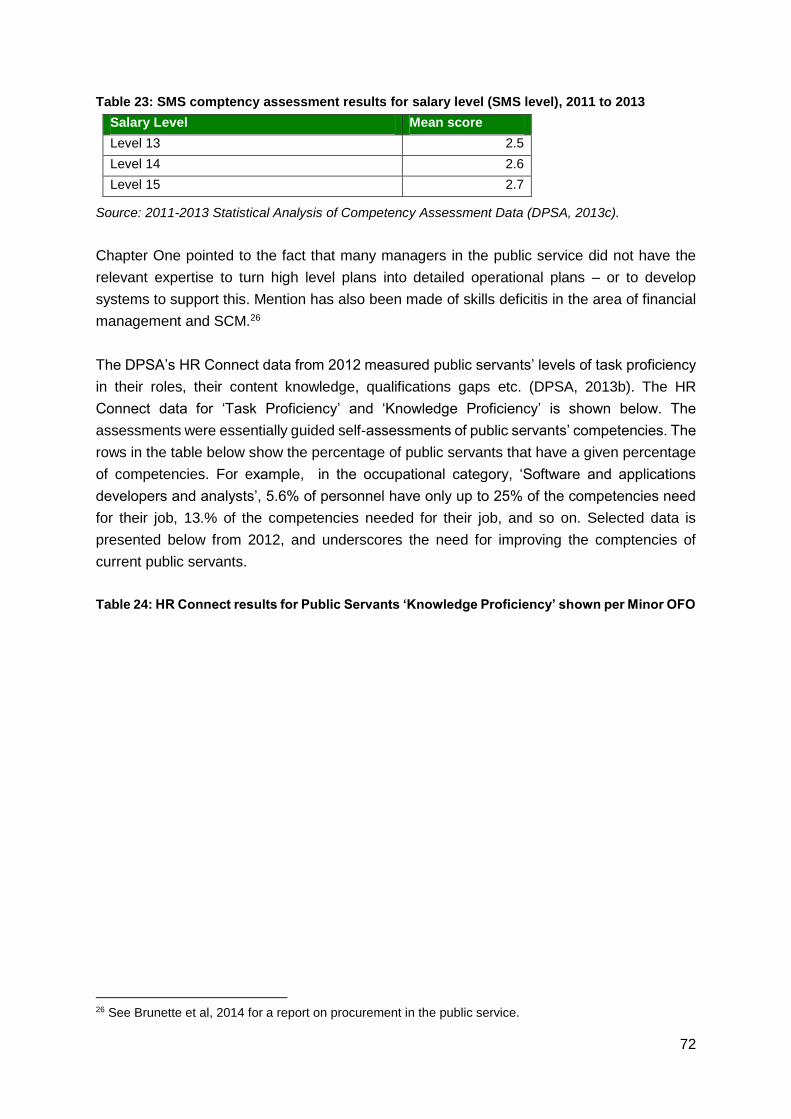
72
Table 23: SMS comptency assessment results for salary level (SMS level), 2011 to 2013
Salary Level Mean score
Level 13 2.5
Level 14 2.6
Level 15 2.7
Source: 2011-2013 Statistical Analysis of Competency Assessment Data (DPSA, 2013c).
Chapter One pointed to the fact that many managers in the public service did not have the
relevant expertise to turn high level plans into detailed operational plans – or to develop
systems to support this. Mention has also been made of skills deficitis in the area of financial
management and SCM.26
The DPSA’s HR Connect data from 2012 measured public servants’ levels of task proficiency
in their roles, their content knowledge, qualifications gaps etc. (DPSA, 2013b). The HR
Connect data for ‘Task Proficiency’ and ‘Knowledge Proficiency’ is shown below. The
assessments were essentially guided self-assessments of public servants’ competencies. The
rows in the table below show the percentage of public servants that have a given percentage
of competencies. For example, in the occupational category, ‘Software and applications
developers and analysts’, 5.6% of personnel have only up to 25% of the competencies need
for their job, 13.% of the competencies needed for their job, and so on. Selected data is
presented below from 2012, and underscores the need for improving the comptencies of
current public servants.
Table 24: HR Connect results for Public Servants ‘Knowledge Proficiency’ shown per Minor OFO
26 See Brunette et al, 2014 for a report on procurement in the public service.

73
Group, 2012
OFO Minor Group Name27
Per
cent
hold
25% or
less
Per cent
hold 26
to 50%
Per
cent
hold 51
to 75%
Per
cent
hold 76
to
100%
Per cent
in 50% or
less
Per cent
51 to
100%
Software and applications developers and
analysts 5.6 13.5 23.0 57.9 19.0 81.0
Legislators and senior officials 9.9 19.3 38.5 32.3 29.2 70.8
Business services and administration managers 15.0 14.3 18.4 52.3 29.3 70.7
Librarians, archivists and curators 22.0 22.6 26.6 28.8 44.6 55.4
Sales, marketing and development managers 45.5 0.0 0.0 54.5 45.5 54.5
Information and communications technology
service managers 27.3 18.2 0.0 54.5 45.5 54.5
Finance professionals 23.1 23.2 24.5 29.3 46.3 53.7
Administrative and specialised secretaries 23.7 23.2 26.1 27.1 46.8 53.2
Manufacturing, mining, construction and
distribution managers 19.0 28.0 24.8 28.3 47.0 53.0
Sales and purchasing agents and brokers 47.2 0.0 0.0 52.8 47.2 52.8
Database and network professionals 23.3 26.5 18.9 31.3 49.8 50.2
Professional services managers 33.2 16.9 16.2 33.7 50.1 49.9
Administration professionals 26.3 23.9 19.6 30.2 50.2 49.8
Business services agents 32.1 29.5 21.8 16.6 61.6 38.4
Source: DPSA, 2012.
HR Connect data also shows that many public servants (including managers) require training
to develop a range of ‘generic’ skills or comptencies in administration, computer skills, basic
data analysis skills and so forth.
There have also been concerns raised about the level of competency of staff in the artisan
and trades occupations. Interviews with personnel in the National Treasury show that
government is considering the introduction of an extended on-the-job training programme for
artisans training in the FET colleges to make up for the deficit in learning (interviews, August
2013). At present some state employers feel they need to undertake a further three years of
internal training in order to have new artisans work ready. Planned support for the roll out of
the SIPs includes a series of interventions to increase the resources dedicated by state
employers to in-house training of young artisans.
2.7. Conclusion: priority skills for building a ‘capable’ public service
The NDP’s Chapter Twelve (on building a capable state), mentions two focus areas with
particular relevance for PSETA’s work:
1. Making the public service and local government administration careers of choice by
building a skilled and professional public service from the top and the bottom.

74
27 OFO Minor Group is two levels of specification down from the OFO Major group.
75
2. Developing technical and specialist professional skills and creating career paths for
technical specialists.
Analysis from Chapter One showed that many departments have struggled to stabilise their
senior leadership, develop career paths for public servants, to retain their staff, to develop
effective operational processes and systems, to develop accountable leadership and so forth.
These remain the central challenges. We may produce more engineering graduates, but how
do we incentivise them to join the public service? How do we ensure the best graduates are
employed by the public service, how do we, “make the public service a career of choice” and
create the conditions for being able to train “specialist technical and professional skills”?
Realising a capable state requires developing the preconditions for the goals above. What we
suggest is that in the context of South Africa (as with other public services that have undergone
rapid transformations or which do not have long histories of effective bureaucracies), there is
a need to focus on those skills associated with organisational development (OD).
Based on the demand side data presented above, significant state policies, and the analysis
from Chapter One on the drivers of organisational performance in the Public Sector, areas of
priority support for PSETA therefore include:
1. Skills development initiatives that support OD.
2. Scarce skills (insufficient supply of labour) lie in the areas of the technical and
professional occupations primarily. In the case of many of these occupations, the
responsibility of supporting increased supply of personnel lies primarily with other
SETAs (the Manufacturing, Engineering and Related Services SEAT and CETA for
example). PSETA has an important roll to play however in developing the
management skills of professionals. In what areas should this focus?
Fundamentally, the evidence presented in Chapter One and Two above suggests that
PSETA’s focus over the medium term should be on building capacity in those skills sets which
are most directly linked to stabilising and improving the way in which organisations are
managed and routine work is performed on a daily basis. Which occupations are implicated?
Developing HR capacity in order stabilise government departments, improving
departments’ capacity to identify their skills and training requirements, and improving
departments’ abilities to act as a “training space”. HR and HRD are the crucial
development partners for “professionalising the public service” as called for in the NDP.
Effective HR practice is thus a foundation for organisational performance. Yet
historically, it has often been one of the weakest functions in the public service. MPAT
data has shown that effective HR is the single biggest driver of improved organisational
compliance in all other areas (finance, strategic management and ‘governance and
accountability’) (DPME, 2013).
76
The analysis presented in Chapter One of the drivers of organisational performance in
the South African public sector has pointed to the importance of operationally
inclined and focused managers in supporting effective service delivery. This is
therefore identified as a key area of focus. The focus here is not on developing skills
to produce high-level strategy. It suggest a focus on developing competency in detailed
programme planning, project management and designing processes to support
delivery. Management skills – as a transversal focus – are the primary area of PSETA’s
responsibility.
Chapter One and Two also identified weak basic administration capacity across
many departments in the public service (such as record keeping, data collection,
database management etc.) – affecting departments’ ability to contract service
providers appropriately, to support substantive compliance with a range of regulations,
including meeting auditing standards in financial management and so on. Building
basic administrative capacity is therefore identified as another priority area. It is
proposed that in the short term the primary focus in on managers who can develop
administrative systems (such as librarians or database managers) rather than on filing
clerks or data capturers. The logic is that the later personnel cannot effectively apply
their new skills in, say, data capture, until the system itself is improved.
As was noted above, the state now performs many of its functions through the
management of services providers. Effective procurement has become essential for
service delivery. Government has identified a need to reform and improve the
procurement system across all spheres of government in order to improve service
delivery and reduce corruption and wastage of state resources. The reform process
was formally initiated by the establishment of the OCPO in the National Treasury. The
roll out of SIPs will also require strengthened procurement capability. SCM is therefore
identified as the fourth area of focus under the banner of ‘organisational development’.
Chapter Three:
Supply of skills and training for the public service
3.1. Introduction
The following chapter focuses on the supply of skills to the public service and on the training
providers and forms of training available to the public service. It assesses the extent to which
the supply of labour and training meets the needs of the public service outlined in Chapter
Two, and outlines broad areas of focus for PSETA in developing supply side capacity. These

77
are developed further in Chapter Four, which discussed priority skills and training

78
interventions.
Given the diversity of the functions performed by the public service, the appropriate
qualifications for public servants (where formal qualifications are needed) can potentially span
the full spectrum of the post-school education and training system:
General, professional and vocational degrees and diplomas offered by Universities,
Universities of Technology and Comprehensive Universities.
Trade certificates conferred by FET / Technical and Vocational Education and Training
(TVET) Colleges (National Certificate (Vocational) and the old Nated Programme
certificates.
Learnerships and artisanships: structured learning processes for gaining theoretical
knowledge and practical skills in the workplace, offered through an agreement
between a college, or some other training provider, and a workplace and which lead to
a qualification registered on the National Qualifications Framework (NQF) and
accredited by a SETA.
Training outside of the formal qualifications system for public servants includes workplace
training in the form of coaching or mentoring, internships, in-service training by public sector
academies, short courses and longer programmes offered by PALAMA, provincial government
academies, and other public and private training providers (including by the FET colleges and
higher education institutions). Public servants can obtain Adult Basic Education and Training
certificates via a range of providers. E-learning is now being used as a training medium for all
or part of some training programmes.
Chapter Three covers the following:
A description of the extent of graduations from the formal education system –detailing
graduations from the higher education institutions, FET Colleges and Matriculation
from the school system.
An overview of training in the workplace, covering learnerships, internships and related
forms of training.
An overview of public service training institutions, including the National School of
Government.
A brief assessment of the quality and appropriateness of current training for the public
service.
The Chapter concludes by outlining the priorities for the PSETA in developing supply
side capacity to support the development of a more ‘capable state’.
3.2. Skills formation through the formal education system
3.2.1. National Senior Certificate (Matriculation)

79
Twenty seven percent of current government employees do not have a qualification beyond a
Matric or a FET level diploma or certificate. A quarter have less than a Matric. The qualification
levels that departments require of their staff varies from department to department depending
on their mandate. The DTI, for example, requires the majority of its personnel to have degrees
or diplomas (interviews with DTI, August 2013), whereas this is not necessary in the DHA
(interviews with DHA, August 2013). Though as we noted in last year’s SSP Update, senior
officials responsible for skills development and HR in the Home Affairs Department state that
they are increasingly hiring staff with higher education qualifications in posts historically not
requiring these qualifications (staff with degrees and diplomas are assumed to be more
autonomous, better prepared to use their discretion appropriately etc.).
The number of people obtaining a National Senior Certificate (NSC) (Matric) and the
achievement levels of those who pass matters then for both for the supply of people to the
further and higher education sectors, and for the direct supply of labour for the public service
in occupations which do not require post-school qualifications.
Enrolment in school education up to the end of compulsory school going age is near 100%,
and the majority of learners receive a Grade 9 education (‘Basic Education’). However, school
drop-out after Grade 9 is high – figures from 2009 show that approximately 50% of those who
enrol in school education will complete Grade 12 (Meny-Gibert, 2012).
The latest NSC results publically available in some detail (2012) are shown in the tables below.
To obtain an NSC a candidate must achieve either 40% or 30% per cent (depending on the
minimum requirements for the particular subject) in six subjects. In the seventh subject a
candidate is allowed to achieve less than 30% (Department of Basic Education, 2014).
Seventy four percent of the candidates who sat for the NSC examination passed (377 847
people). Thirty six percent of those who passed qualified for entry into a degree programme
at a university (136 047).
Table 25: National Senior Certificate examination results, 2012
Candidates who wrote the NSC, 2012
Candidates Who Failed/Did
Not Achieve
Candidates Who
Passed/Achieved TOTAL
Number Per cent Number Per cent Number Per cent
132 881 26% 377 847 74% 510 728 100%

80
Candidates who passed / achieved the NSC
Candidates NOT receiving
marks for admission to higher
education
Candidates receiving marks
for admission to higher
education
TOTAL
Number Per cent Number Per cent Number Per cent
297 0.1% 377 550 99.9% 377 847 100%
Candidates receiving marks for admission to higher education
Qualified for Bachelor
Programme
Qualified for Diploma
Programme
Qualified for Higher
Certificate
Programme
TOTAL
Number Per cent Number Per cent Number Per cent Number Per cent
136 047 36% 152 881 40.5% 88 604 23.5 377 550 100%
Source: Education Statistics in South Africa 2012 (Department of Basic Education, 2014).
The pass rate has consistently increased over the last five years (from 2009 to 2013). In 2013
the pass rate was 78.2%. There is no clear trend over the last five years regarding increases
or decreases in the number of NSC passes, though there is a slight upward trend in the
number of candidates obtaining sufficient credits for entry into a bachelor degree.
Forty four per cent of the NSC candidates wrote the Maths exam. Of these, 80 716 (36%)
passed with a pass of 40% or more. Of those who wrote Maths Literacy, 61% passed. There
is now a wealth of research28 on the poor levels of numeracy, mathematical achievement and
literacy of South African school leavers affecting the ability of school levers to master certain
elementary tasks in the workplace and to qualify for, and complete, FET and Higher education
28 These very poor learning outcomes (Taylor et al, 2011) are shown in local and international assessments
such as the Department of Education’s Systemic Evaluations, and the TIMMS, PIRLS and SACMEQ studies
respectively. See Trends in International Mathematics and Science Study, 2002; the Progress in International
Reading Literacy Study results, 2006; the Southern and Eastern African Consortium for Monitoring Education
Quality surveys of 2000 and 2007.

81
qualifications (especially in professional and technical occupations).
A PSSC report to the HRD Council notes that many post-school institutions in South Africa do
not have adequate capacity to serve the needs of the country (DPSA, 2013b). These post-
school institutions are, however, affected by the poor learning outcomes of the school system
(Council on Higher Education, 2013). A 2013 Council on Higher Education (CHE) report notes
that the high dropout and failure rates in higher education institutions is primarily caused by
poor academic preparation at school (CHE, 2013). The report noted that there is "no prospect"
that the schooling sector will be able to produce the numbers of adequately prepared
matriculants that higher education requires "in the foreseeable future" and – as an interim
palliative measure it has recommended extending undergraduate degrees from three to four
years (CHE, 2013).
3.2.2. Higher education
As was shown in Chapter Two, 20% of public sector employees (including local government
employees) have a bachelor degree or higher. A quarter have a certificate or diploma (with a
Matric).
There are differing opinions locally and internationally about the appropriate proportion of the
population that should be completing different levels of education29. In South Africa it may be
that employers are increasingly demanding higher levels of qualification as a result of the very
weak education people receive in many primary and secondary schools in South Africa.
Schooling, that is, is no longer a signal of having mastered certain competencies.30 It is partly
in this context that there is pressure for employees to be increasing more formally qualified.
StatsSA Quarterly Labour Force Survey data shows that while the state employs 24% of the
workforce, it employs 43.5% of graduates in South Africa31. This is a 2.5% increase since last
year. Based on interviews with a small sample of departments, as well as estimating the kinds
of professional skills required with the implementation of SIPS and other policies, including
the National Skills Accord, it is estimated that there will be an increased demand for personnel
with post-Matric qualifications, and in particular, those with degrees. An increased supply of
graduates is therefore needed to meet demand in the public service.
The public service will be competing with the private sector for the best available graduates,
especially for black graduates from the better-ranked universities in the country. In the case
of students graduating from public administration programmes, many may apply directly to
departments in the public service – though here too the public service may compete with the
29 See for example Allais, 2005 for reference to the international debate, see Meny-Gibert, 2012 for local
debates on secondary schooling versus FET training. 30 See for example Van der Berg et al (2011) as well as Gustafsson (2011). 31 StatsSA, Quarterly Labour Force Survey, 1st Quarter 2014.

82
private sector for graduates. There is a dearth of research in South Africa on graduate
preferences for the kind of employers they would like to work for and how the public sector
compares with the private sector as a preferred employer, how this varies across occupations
and the relationship between these preferences and the competencies of graduates recruited
to departments in the public sector. We suggested last year that this would be a valuable area
of future research.
In 2012, the latest year for which detailed HEMIS data is publically available, 867 210 people
were registered for undergraduate degrees, diplomas or certificates and 63 526 for
postgraduate qualifications at HEIs in South Africa.
Table 26: Headcount enrolments at all public higher education institutions in South Africa,
201232
1st order CESM category Undergraduate Postgraduate
AGRICULTURE, AGRICULTURAL OPERATIONS AND RELATED SCIENCES 15 937 1 953
ARCHITECTURE AND THE BUILT ENVIRONMENT 9 685 1 310
VISUAL AND PERFORMING ARTS 12 199 951
BUSINESS, ECONOMICS AND MANAGEMENT STUDIES 263 652 11 756
COMMUNICATION, JOURNALISM AND RELATED STUDIES 19 773 656
COMPUTER AND INFORMATION SCIENCES 36 039 1 960
EDUCATION 162 873 4 814
ENGINEERING 71 618 5 420
HEALTH PROFESSIONS AND RELATED CLINICAL SCIENCES 42 997 10 043
FAMILY ECOLOGY AND CONSUMER SCIENCES 2 856 239
LANGUAGES, LINGUISTICS AND LITERATURE 14 854 1 812
LAW 47 298 3 648
LIFE SCIENCES 20 035 4 218
PHYSICAL SCIENCES 23 426 3 532
MATHEMATICS AND STATISTICS 14 237 827
MILITARY SCIENCES 3 16
PHILOSOPHY, RELIGION AND THEOLOGY 4 299 1 734
PSYCHOLOGY 25 792 2 179
PUBLIC MANAGEMENT AND SERVICES 30 968 2 422
SOCIAL SCIENCES 48 670 4 039
TOTAL 867 211 63 29
Source: HEMIS, 2013.
There has been an average increase in the number of students completing undergraduate
and postgraduate qualifications over the five-year period, 2008 to 2012, of 5.4% and 5.1%
32 CESM is ‘Classification of Educational Subject Matter’. Note that undergraduate enrolments include
undergraduate diplomas, certificates, degree as well as PG Bach, and Honours degrees and diplomas.
Postgraduate includes all headcount enrolments in Master degrees and diplomas and Doctorates.

83
respectively. Graduation numbers increased in all subjects, with the exception of architecture
and the build environment, education, and mathematics. As mentioned, the roll out of SIPs is
likely to see an increase in demand for certain professions in the Build Environment and
Engineering sectors.
We should note though that whilst graduation numbers have been increasing in many fields,
throughput rates (the percentage of students who graduate relative to enrolment) from HEIs
are very low (throughput rates from FET colleges are even more worrying – see the section
below this).33
Figure 3: Graduations from all public higher education institutions in South Africa, 2008-2012
Source: HEMIS, 2013
In 2012, one hundred and fifty three thousand people graduated with an undergraduate
degree, diploma or certificate, and 12 210 with a postgraduate qualification.
Black African graduates represented 64% of total undergraduate passes in 2012, but only
42% of the postgraduate passes. Substantially more black African women obtained an
undergraduate degree, certificate or diploma (62 163) than black African men (37 518), though
more African men obtained a postgraduate degree.34 Research by Chipkin has suggested that
where public sector organisations cannot fill a particular position because of an insufficient
number of black applicants with the necessary qualifications and experience, many
33 A 2009 report by the Council for Higher Education (CHE) noted that less than half of those enrolled in
bachelors or national diplomas are projected to complete their studies (CHE, 2009). A more recent report by
the CHE (2013) notes that dropout rates from higher education are still very high, as are failure rates. 34 Source: HEMIS data, 2013.
2008 2009 2010 2011 2012
Undergraduate 124 545 135 360 143 271 149 359 153 778
Postgradute 8 696 9 492 10 054 11 266 12 210
0
50 000
100 000
150 000
200 000
He
adco
un
t gr
adu
atio
ns Graduations 2008-2012
Undergraduate
Postgradute

84
departments leave the post vacant (Chipkin, 2011).
The figures per CESM (Classification of Educational Subject Matter) category are provided
below.
Table 27: Graduations35 at all Higher Education Institutions in South Africa, 2012
1st order CESM category Undergraduate Postgraduate
AGRICULTURE, AGRICULTURAL OPERATIONS AND RELATED
SCIENCES 2 952 368
ARCHITECTURE AND THE BUILT ENVIRONMENT 2 673 382
VISUAL AND PERFORMING ARTS 2 974 180
BUSINESS, ECONOMICS AND MANAGEMENT STUDIES 43 319 2 724
COMMUNICATION, JOURNALISM AND RELATED STUDIES 3 461 96
COMPUTER AND INFORMATION SCIENCES 5 650 237
EDUCATION 34 660 817
ENGINEERING 10 673 1 022
HEALTH PROFESSIONS AND RELATED CLINICAL SCIENCES 10 461 1 497
FAMILY ECOLOGY AND CONSUMER SCIENCES 527 27
LANGUAGES, LINGUISTICS AND LITERATURE 2 767 354
LAW 5 225 764
LIFE SCIENCES 4 417 855
PHYSICAL SCIENCES 4 186 753
MATHEMATICS AND STATISTICS 1 964 198
MILITARY SCIENCES 1 7
PHILOSOPHY, RELIGION AND THEOLOGY 897 400
PSYCHOLOGY 5 178 475
PUBLIC MANAGEMENT AND SERVICES 5 303 320
SOCIAL SCIENCES 6 490 735
TOTAL 153 778 12 210
Source: HEMIS, 2013.
Almost all public higher education institutions in South Africa offer degrees or diplomas in
public administration. There are, however, a range of degree and diploma qualifications that
provide the kinds of skills required by the public service. In Chapter Two we identified four key
areas for focus in terms of the ‘organisational development’ needed to build a ‘capable state’).
These were:
HR and HRD.
SCM.
Operationally focused management.
Developing administrative systems and capacity.
Building this capacity across the public service will require training across a broad range of
35 The number of students who fulfilled the requirements for a degree/diploma/certificate according to
major(s)/area of specialisation and qualification type.

85
skills levels. The analysis in Chapter Two suggested, however, that the medium term focus
should be on developing managerial and senior level capacity in these four areas, followed by
a longer-term focus on developing the clerical support. This suggests then that ensuring the
skills pipeline produces more and better-educated graduates is essential.
The CESM categories with the highest number of graduates are, ‘Business, economics and
management studies’ (28% of total graduations), followed by education, engineering and
health.
Some CESM categories include specialisation in management in a particular sector (building
and construction management for example); and most postgraduate qualifications in
management are open to students with any undergraduate degree.
It should be noted that increasing the supply of effective ‘managers’ to the public service is
not an issue that can simply be addressed by increasing the number of people with managerial
qualifications – we return to this point in Chapter Four, in the section on developing
management capacity.
A number of departments, such as the DTI, and National Treasury have developed successful
specific degree programmes in partnership with higher education institutions that focus on
their area of work, and link these programmes to internship and mentoring programmes in the
department.
A final note on unemployed graduates: StatsSA estimates that the broad unemployment rate
for graduates in South Africa in 2014 is 6.3% (up from 5.8% last year).36 Research by the
DPRU (2006, cited in PSETA, 2011) suggests that the problem of unemployed graduates is
largely driven by employers’ perceptions of the poor quality of training and education provided
to graduates in some HEIs, shortfalls in the supply of graduates in particular sectors and an
oversupply in others, and graduates not being prepared to work for entry-level salaries set by
some employers.
3.2.3. FET Colleges
FET / TVET colleges enrol substantially fewer students than higher education. Just over 400
000 students enrolled in public FET Colleges in 2011. (The Green Paper on Post School
Education and Training (2012) has set ambitious gaols for improving the number of people
entering and completing FET courses. At present a very low percentage of those who enrol,
will sit for the final exam).
The National Certificate (Vocational) (NCV) is a qualification offered by FET / TVET colleges
36 StatsSA, Quarterly Labour Force Survey, 1st Quarter 2013 and 1st Quarter 2014.

86
at NQF levels 2 to 4. Students receive practical, industry-focused training that enables them
to seek work in a range of fields such as business administration, hospitality, and engineering
and applied technology. Applicants to these programmes must have a minimum of a Grade 9
pass. NATED or Report 191 courses are programmes that consist of 18 months theoretical
studies at colleges and 18 months relevant practical application in work places. Engineering
studies range from N1 – N6 while Business and Utility Studies range from N4 – N6. Applicants

87
are required to have Grade 12 for admission to study from NQF Level 4.37
In 2011, just under half of the 17 836 candidates who wrote the NC(V) Level 4 exam passed,
and just under half of the 2900 or so students who wrote N3 report 191 examinations passed.
The pass rate for the N6 Report courses was higher at 60%. (DHET, 2013). The number of
passes per course are shown in the tables below.
Table 28: Number of NC(V) Level 4 students registered, wrote and passed, per course, 2011
C(V) Level 4 Course Total Total Total
Registered Wrote Passed
Civil Engineering And Building Construction 1 345 1 264 526
Education And Development 111 104 65
Electrical Infrastructure Construction 2 940 2 663 1 136
Engineering And Related Design 2 694 2 390 808
Finance, Economics And Accounting 1 669 1 446 699
Hospitality 1 102 989 324
Information Technology And Computer Science 1 082 948 257
Management 961 840 429
Marketing 907 808 456
Mechatronics 135 121 50
Office Administration 4 573 4 109 1 785
Primary Agriculture 612 538 170
Safety In Society 585 545 255
Tourism 1 173 1 071 678
Total 19 889 17 836 7 638
Source: DEHT, 2013
Table 29: Number of Report 191 N3 students registered, wrote and passed, per course, 2011
Report 191 N3 course Total Entered Total Wrote Total Passed
Business Studies Accounting /Admin (Revised) 209 209 29
Business Studies Secretarial (Revised) 46 46 9
Engineering Studies (Revised) 2 621 2 621 1 323
Laboratory Assistants 3 3 0
Water And Waste-Water Treatment Practice 30 30 5
Total 2 909 2 909 1 366
Source: DEHT, 2013
37 http://www.fetcolleges.co.za/Site_Courses.aspx accessed June 2014.
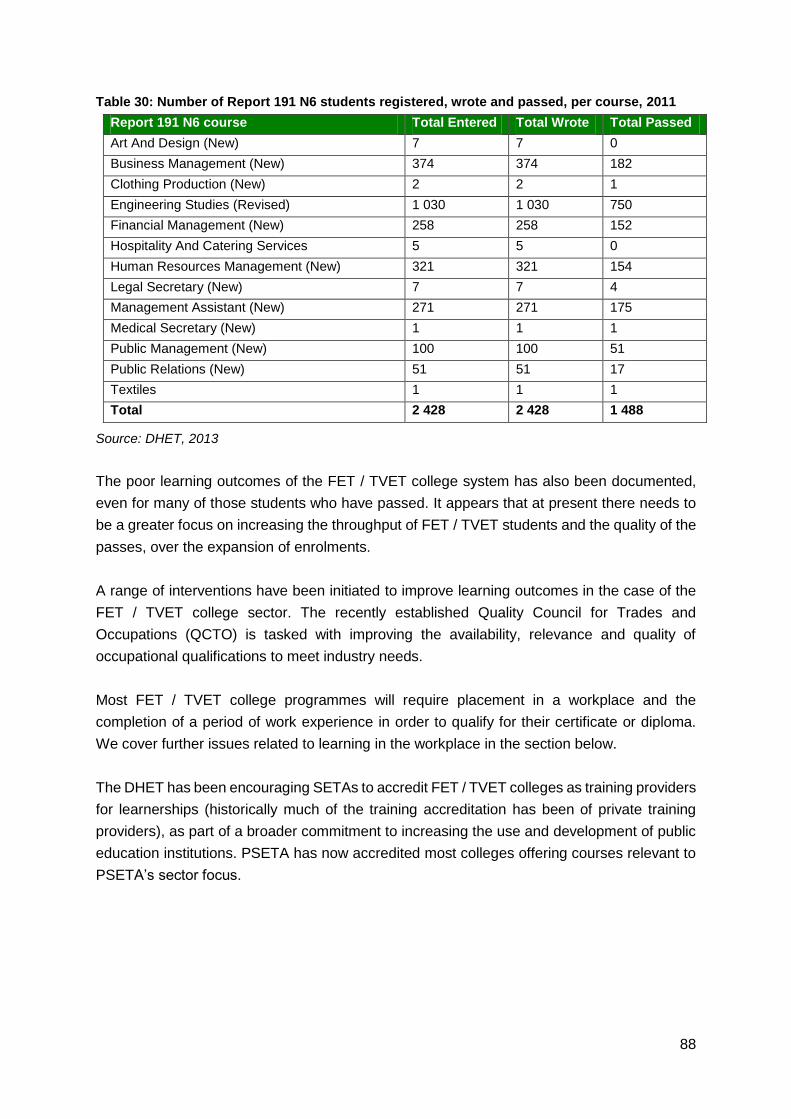
88
Table 30: Number of Report 191 N6 students registered, wrote and passed, per course, 2011
Report 191 N6 course Total Entered Total Wrote Total Passed
Art And Design (New) 7 7 0
Business Management (New) 374 374 182
Clothing Production (New) 2 2 1
Engineering Studies (Revised) 1 030 1 030 750
Financial Management (New) 258 258 152
Hospitality And Catering Services 5 5 0
Human Resources Management (New) 321 321 154
Legal Secretary (New) 7 7 4
Management Assistant (New) 271 271 175
Medical Secretary (New) 1 1 1
Public Management (New) 100 100 51
Public Relations (New) 51 51 17
Textiles 1 1 1
Total 2 428 2 428 1 488
Source: DHET, 2013
The poor learning outcomes of the FET / TVET college system has also been documented,
even for many of those students who have passed. It appears that at present there needs to
be a greater focus on increasing the throughput of FET / TVET students and the quality of the
passes, over the expansion of enrolments.
A range of interventions have been initiated to improve learning outcomes in the case of the
FET / TVET college sector. The recently established Quality Council for Trades and
Occupations (QCTO) is tasked with improving the availability, relevance and quality of
occupational qualifications to meet industry needs.
Most FET / TVET college programmes will require placement in a workplace and the
completion of a period of work experience in order to qualify for their certificate or diploma.
We cover further issues related to learning in the workplace in the section below.
The DHET has been encouraging SETAs to accredit FET / TVET colleges as training providers
for learnerships (historically much of the training accreditation has been of private training
providers), as part of a broader commitment to increasing the use and development of public
education institutions. PSETA has now accredited most colleges offering courses relevant to
PSETA’s sector focus.
89
3.3. Training and development in the workplace
3.3.1. Learnerships, skills programmes and internships
Learnerships are structured learning programmes for gaining theoretical knowledge and
practical skills in the workplace – offered through an agreement between a training provider
(public or private) and a workplace and which lead to a qualification registered on the NQF.
Employers may develop and register their own learnerships, supported and quality assured
by their relevant SETA. Learnerships include artisanships and can be the delivery mechanism
for a range of occupational qualifications (occupational qualifications are NQF registered
qualifications, which are quality assured by an Education and Training Qualifications Authority
(ETQA) or any other statutory quality assurance body).
Public servants may take up learnerships offered by a range of SETAs. Those registered with
PSETA focus primarily on transversal skills associated with management and administration.
PSETA has registered and quality assured learnerships in general public administration,
record keeping, inspection and enforcement, management, human resources, purchasing and
stores management, business administration, programmes aimed specifically at personnel in
Home Affairs, amongst others.
One hundred and sixty seven learners were registered for qualification-linked programmes
under PSETA in the 2012/13. PSETA has found that officials generally prefer mainstream
university qualifications to learnerships. Learnerships and skills programmes registered with
PSETA that have had the highest take-up are those that have been “demand-led” – those
courses which were established for their staff by departments – such as DIRCO’s courses –
and which speak to a very specific training need.
Regarding the public service as a whole, Persal data shows that in 2014 there are 3 681
people in the public service on learnerships, up from 3 237 last year. 38 Thirty percent were
classified under the Persal occupational category ‘Professionals and Managers’, and 15%
under ‘Administrative Office Workers’; 18% were classified under ‘Craft related workers’
(despite the fact that this category only makes up 0,7% of the total employees in the public
service, this may be as a result of the focus on developing technical skills - most artisans are
38 Persal data, June 2014.
90
classed in this category).
There are still too few artisans being produced to meet the needs of the public service, as
mentioned in Chapter Two. And the quality of training remains very poor. Forty three percent
of artisans certified by Indlela in 2011/12 passed, and in some courses the pass rate was as
low as 11% (DHET, 2013). In 2011/12, 13 168 artisans were certified in South Africa.
As part of the focus on “opening up the public service as a training space”, departments have
been encouraged to take on increased numbers of interns. Just over five thousand (5176)
interns are recorded on the Persal database this year, up from the 4 943 recorded last year.
Thirty nine percent of these interns were classified under the Persal occupational category,
‘Professionals and managers’ and 43% under ‘Administrative office workers’.
According to a 2012 government directive, part of departments’ budgets should be used for
training unemployed graduates – this includes providing internships, supporting learnerships,
and providing bursaries. In 2011/12, 53 092 unemployed people were provided with such
support in South Africa. Figures specifically for the public service are not available (figures are
reported per SETA, and some of the SETAs cover the public and private sectors – see DHET,
2013).
Five hundred and sixty eight internships were provided to previously unemployed graduates
for departments falling under PSETA in 2011/12. We note that the directive on unemployed
individuals has lead to an increase in the provision of spaces for unemployed individuals in
the departments directly reporting to PSETA in the last year.
PSETA has provided a number of departments with assistance over the last year with
interviewing and placing unemployed graduates and learners in departments. It has also
provided training for workplace coaching for managers wanting to improve their abilities to
mentor junior staff.
PSETA has also played a facilitation role for departments wanting to support the recognition
of prior learning (RPL) for some employees. PSETA has facilitated conversations between
these departments and Indlela for obtaining RPL for artisans.
3.3.2. Improving workplace trianing
The success of learnerships, artisanships, and internships rest on the ability of departments
to effectively provide workplace training. The recent government commitment to opening up
the public service to act as a training space is welcome. Yet not all departments and public
entities currently have the capacity to effectively train those learners and interns placed in their
organisations. Last year’s SSP noted that reviews have shown that in some departments,
interns have not ben appropriately placed in units / functions that build on their formal skills
91
training and that they have not been effectively supported to improve their skills.
Capacity to take on interns needs to be developed over time. Some departments already have
this capacity, and can be encouraged to take on more learners and interns. For those
departments already struggling to strategically develop skills development and train their
existing staff, internship programmes might start with the development of formal structured
programmes. These should outline the formal training interns will receive, how they will be
assigned to different units in the organisation, how they will be assigned tasks and how they
will be mentored to develop improved proficiency. This could outline aspects such as whether
they will be put on job-rotation to receive exposure to different functions in the organisation.
There is also possibly room for departments partnering with each other to provide interns
exposure to other parts of the sector or to other ‘business processes’. National Treasury for
example sends interns to provincial departments and other organisations for workplace
exposure.
PSETA has organised capacity building workshops for managers and other officials wishing
to obtain skills in how to mentor interns. PSETA notes that it can play a role in supporting
departments to develop formal structured internship programmes, where departments express
a willingness to develop these.
As we mentioned in Chapter One, the focus on developing the public service as a training
space requires developing the competency of public servants already in the system –
especially those of managers. Last year’s SSP Update emphasised that this capacity is
unlikely to be developed primarily through formal training qualifications. Research suggests
that “most learning in the workplace is incidental, rather than the product of formal training”
(O’Keeffe, 2002). Proficiency or competency in a particular occupation or area of work
(especially at middle management and operational levels) is often learnt “on the job” and
perfected over long periods of service in a particular area and deep familiarity with a particular
scope of work or subject matter. We have noted that the DHA attributes the successful training
of officials associated with its turnaround strategy (the dramatic improvement in the efficient
delivery of identity books) to a focus on on-the-job training and mentoring, rather than external,
“classroom training” (Mkhize, 2011). The Department notes that, “The DHA experience
demonstrates there is also a need for on-the-job training, coaching and mentoring as a
learning methodology, especially for turning around frontline service delivery processes”.
(Mkhize, 2011).
Building capacity in the National Treasury (which was a very weak institution in the later days
of apartheid) was supported by the long-term secondment of expertise from other
departments, and foreign expertise from other treasuries. A case study of the post-apartheid
National Treasury notes that long-term secondments were preferred over short term
contracting of consultants, which saw the transfer of capacity over time (Dagut, 2007).
92
Mentorship and coaching should ideally be at the heart of skills development in the public
service. Yet the PSC’s 2011 evaluation of HRD in the public service found that, “Eleven out of
the 30 sampled departments (37%) had Mentorship policies and programmes in place. Of the
three programmes, namely mentorship, internship and learnership programmes, departments
found the implementation of the mentorship programme to be the most difficult [to implement].
Reasons for non-compliance was [sic] the lack of understanding on how to establish such a
programme, the lack of participation by staff as mentors (especially senior managers),
financial constraints, unavailability of time for coaching and mentoring.” (PSC, 2011).
Departments in the public service that have managed to develop a culture of mentoring staff
have established this on the basis of a number of “preconditions”. These have included
stabilising the senior management and retaining the staff of experienced managers and
professionals, the strategic placement of HR and recruitment of HR practitioners with strong
proven abilities in HRD, and stringent criteria for selecting new staff.
RESOURCE ALLOCATION BY THE PUBLIC SERVICE ON SKILLS ALLOCATION
Departments and public entities in the public service are required to allocate 1% of their budget
for compensation of employees to training and skills development. This funding can be
allocated to bursaries, short courses, learnerships, coaching and so forth. Whilst some
Departments alllocated more than 1% to training (3% was the highest allocation), the average
across national and provincial government did not exceed the mandatory 1% for the last
financial year, as shown by National Treasury’s Estimates of National Expenditure (National
Treasury, 2014a).
National government spent 10% of this training allocation on bursaries, and provincial
government spent 5% on bursaries (National Treasury, 2014a).
In addition to the monies allocated by Departments, some provinces also have their own
training insitutions and monies for training are also provided from the National Skills Fund and
from SETAs themselves. Given the low levels of funding of PSETA over the last few years,
PSETA has not directly funded many training programmes, but has focused on playing its role
its role in quality assurance through the ETQA division and facilitating the entry of unemployed
people and learners into learnerships and work placements.
3.4. Public service training institutions
There are a number of public service training institutions undertaking training and development
within the public service. As noted in Chapter One, academies exist at national government
and provincial level, as well as within specific government sectors. A number of the provincial
academies do not appear to be working very effectively. The academy of the Western Cape

93
has started to develop strong in-house capacity for training.
The recently established National School of Government will offer a range of qualifications to
public servants, which aim to provide for career advancement and professional development
to overcome the current misalignment between departmental strategies and skills. The exact
form of the School will take and its relationship to the other provincial and sector academies
(DIRCO, StatsSA, the academy for the training of traffic officials to name a few) is still to be
decided. It has been proposed that these academies would become the sector “branches” of
the School – the Foreign Affairs branch, Justice branch and so forth.
At present it has been mooted that the School will be registered as a higher education
institution. Whether this route is pursued or not, the School will need to develop strong capacity
in supporting occupational based qualifications.
The initial focus of the National School of Government has been the introduction of the
Compulsory Induction Programme (CIP), though this was first rolled out under PALAMA. CIP
has been implemented in a number of departments. it aims to induct all new public service
employees into the government sector. All current employees will also have to attend CIP.
The curriculum has been registered with SAQA, though PSETA understands that the School
still needs to be accredited to provide the training. Many departments that PSETA spoke to in
preparation for this SSP welcomed the CIP, but noted that if it is to be effective the
implementation of CIP must be appropriately paced. And that it should be reviewed and
evaluated before being taken to full scale.
Once rolled out the CIP could assist senior managers in holding their staff accountable for
compliance with regulations, as staff will have been appropriately informed of the content and
purpose of regulations pertaining to the public service. However, CIP will not directly address
the challenges to developing the operational capacity that this SSP has identified. External
service providers have provided much of the public service training over the last two decades,
and it has tended to be expensive and overly generic, lacking application to local contexts.
Given the scale of CIP it will have to rely on external service providers too.
The School also had a potentially meaningful role to play in the development of cohort training.
Cohort training has been a striking feature about the approaches to training of more effective
bureaucracies internationally. Training is provided in groups who ‘travel together’, as it were,
through the ladder of learning. This is evident in common processes throughout the
employment life cycle from recruitment, induction programmes, and other forms of on-going
training. State run academies or public service schools (for example in India, France and
China) are one key means through which this common training takes place. France has a wide
network of civil service schools that focus on all levels of the administration from executive to
secretarial functions. These are separate from public universities and are run by the state.
These schools offer training before officials enter the public service. The schools focus on
94
particular knowledge or skills areas. One effect of this ‘group pathway’ from of training is to
produce a sense of camaraderie and common purpose – of particular relevance for the NDP’s
call to “professionalise the public service”. The model that a number of countries have opted
for, including Brazil, is that those wishing to enter the public service must first receive training
in schools orientated towards developing professional and administrative skill for the public
service, and must then pass a stringent entrance exam in order to become a state employee.
The National School of Government plans to reduce the current reliance on external providers.
Instead it plans to use expertise in the existing state academies and to use experienced senior
public servants to teach at the School. Developing a strong in-house teaching body and strong
curriculum content will be essential for the School to play a meaningful role in building the
capacity of the state. In order to achieve this in-house capacity and in order to effectively
deliver cohort training (a “cadet school” for professional public servants), the School will
require substantial resources. It is critical that the School pilots the development of new
teaching approaches and curriculum content, and undertakes substantial reviews of these
pilots before rolling out training at scale. PSETA suggests that capacity can only be achieved
incrementally over a long period of time – the challenge facing all institution building. The
School can then play a meaningful role in cohort development and training.
In conclusion to this section: there have been two important interventions in the last few years
to build public service capacity. The first is the establishment of the PSSC, and the second
the National School of Government. There have also been a number of interventions
spearheaded by the DHET to encourage improved workplace training and occupational
qualifications. The HRD Council’s recently commissioned review of the SETA and skills
training system points to the need for greater clarity on how these forums and institutions
relate to each to support effective capacity building.
3.5. Supply side focus for building a capable state
Building on PSETA’s analysis developed last year (2013/14 SSP Update), Chapter Two
identified the following area of focus for PSETA’s work over the medium term: developing
those skills linked most demonstrably to OD, i.e. those most directly linked to stabilising and
improving the way in which organisations are managed and routine work is performed on a
daily basis.
Departments need to be supported to be able to identify the nature of their staff competency
gaps and what kinds of training are most appropriate for developing capacity in these areas.
This once again highlights the importance of the focus on building HRD skills.
This Chapter has also pointed to the fact that the capacity for the public service to act as a
training space is highly uneven and that departments should be encouraged to build this
capacity over time, rather than pushing to take on as many interns and learnerships as

95
possible to meet annual targets. PSETA can play an expanded role in this space.
Where skills gaps are simply related to lack of knowledge of a very specific task, such as how
to operate a computer programme, staff could take part in cost-effective e-learning courses.
Where these gaps are more profound, they need to include mentoring and or coaching,
possibly supplemented by longer-term classroom based training, in for example, the National
School of Government.
The importance of workplace based capacity building has been outlined above – this is
particularly so in the case of developing skills related to “organisational development”. PSETA
will focus on drawings lessons and experience from departments who are developing
successful and innovative approaches to workplace based training.
On a final note: there has been much discussion in the public domain about the lack of service-
orientated culture amongst many public servants. Changes in values and norms are generally
not affected by time spent in short courses on values and ethics. In line with the evidence
presented above about the value of training cohorts of public servants through long-term
training (building skills, but also a common sense of purpose and commitment to the public
service). The new National School of Government has the potential to play a fundamental role
here if curriculum and delivery models are carefully piloted, and a strong faculty of teachers
developed.

96
Chapter Four:
Priority Scarce and Critical Skills for the Public Service
4.1. Introduction
The 2013/14 SSP Update focused on developing an analytical approach to determining skills
priorities. This year’s SSP Update retains this approach. The approach highlights that skills
development priorities cannot be identified simply from an analysis of the scarce skills and
competency gaps of individual employees if we are to develop the state capabilities called for
in the NDP. The approach uses organisational performance as the lens to thematise skills
needs: a priority skill is one that will make the biggest difference to the performance of the
public service.
The priority skills detailed in this chapter have been identified using this approach to analyse
the data presented in Chapters One to Three. These priorities were confirmed and agreed by
stakeholders attending the 2014 PSETA Workshop on Priority Skills for the Public Service
(held in July 2014).
This chapter goes further than identifying a list of skills needed, with associated OFO codes
and target numbers. The HRD Council has noted that skills development in the public sector
should specifically aim at building the state capabilities to deliver on the NDP. The chapter
outlines the approach to capacity building that has already been adopted by the public service
for the financial management occupations (this is under consideration as the approach for
building capacity across all other occupations as well); it then uses this capacity building
approach to propose solutions for addressing gaps in the priority skills areas. Above all, the
chapter represents a strategic perspective. The individual skills development interventions
presented in this chapter are inter-related, and reflect an attempt to improve the economy,
efficiency, effectiveness and equity of the system through which skills are developed in the
public service. In this sense, it takes forward the strategic framework adopted at the national
PSETA Colloquium on Public Service Skills in 2012, as presented in Chapter One (we return
to this strategy in detail in the final chapter).
4.2. A “capacity-building” approach to priority skills development
In March 2014 National Treasury adopted the Capacity Development Framework for Public
Financial Management (National Treasury, 2014b).39 Interviews conducted with DPSA have
39 The strategy was developed in partnership with the Department for Public Service and Administration
(DPSA), Department of Cooperative Governance (DCoG), the Public Administration Leadership and
Management Academy (PALAMA) and other stakeholders.

97
indicated that DPSA is considering the National Treasury framework as the framework for
capacity building for all occupations in the public service i.e. not only for financial management
occupations. The framework takes forward the HRD Council mandate to link skills
development to organisational capacity building. It also reflects PSETA’s commitment to doing
so (as outlined in Chapter One). A summary of this framework is provided here – it has
informed PSETA’s conceptualisation of some of the skills development interventions proposed

98
for addressing the priority skills outlined in the following Chapter.
The Capacity Development Framework (hereafter called the Framework) borrows the United
Nations Development Programme’s definition of capacity as “the ability of individuals,
institutions and societies to perform functions, solve problems, and achieve objectives in a
sustainable manner”. Capacity development is therefore defined as “the process through
which these abilities are obtained, strengthened, adapted and maintained over time” (Saasa
2007, cited in National Treasury, 2014b: 7).
The Framework includes five dimensions of capacity development: environmental,
institutional, organisational, individual and stakeholder capacity. The Framework notes that
these “are inter-related, and it is only in combination that they allow sustainable capacity
development to be achieved” (ibid). The Framework is summarised in Figure 4 below.
Figure 4: The integrated capacity development framework
Source: National Treasury
Environmental capacity refers to “the broad environment or system within which
organisations and individuals function. It includes the international and domestic economic
climate, political dispensation, social norms, technological developments and general
legislative frameworks”. (Ibid).
Institutional capacity refers to the “governance, legislative and policy frameworks of the
public sector, including procedures, practices, structures, values and systems”. (Ibid)
Organisational capacity refers to “all factors affecting the internal environment, including
organisational design and development, culture, climate, leadership, values, resources,
infrastructure, processes and procedures, management systems and technology....

99
Government represents the institution..., departments represent organisational capacity”.
(Ibid)
Individual capacity refers to “the knowledge, skills, competence, behaviour, commitment,
experience, attitude and values demonstrated by staff. Such capacity is developed through
formal, non-formal and informal learning. Individual capacity is enhanced through education,
work readiness, staff profiling, performance agreements, recognition and reward, learning
frameworks, skills programmes and so on”. (Ibid).
Stakeholder capacity refers to “the ability of stakeholders to contribute to and support the
implementation of the strategy. Stakeholders include any individual or entity with an interest
in capacity development”. (Ibid).
Four strategic objectives are defined in relation to capacity building:
Support the development of an enabling environment.
Enhance organizational capacity.
Develop and empower a corps of competent and committed high-performance
employees.
Create an environment that enables and sustains mutually beneficial stakeholder
relationships.
Key performance indicators are established for each of these, which form the basis for
monitoring and evaluation of the strategy. Change management is a key component. The
strategy includes, “a phased approach that responds to the status and needs of each
department…” and “integration with current and new systems, such as the performance
management development system (PMDS) and HR Connect…”. (Ibid)
The strategy proposes six focus areas that cut across the strategic objectives:
1. Developing “champions of change” who will “lead the transformation of their
departments…groups and teams”.
2. Enhancing management and leadership capabilities.
3. Supporting team/group level transformation – focusing on “small wins that can be
emulated”.
4. Fast-tracking professionalisation.
5. Conducting “systemic diagnosis” to “identify the root causes of problems”.
6. Strengthening knowledge and information management and using this as a “learning
platform”.
It is significant that the Framework – as applied to the financial management occupations –
notes that, “effective implementation…will require funding additional to what is provided
through the normal budget process”. If the Framework is to be used to build capacity across
all occupations, the PSETA skills funding will be woefully inadequate to address all aspects.

100
Partnerships and co-funding strategies will be needed in implementing the Framework to

101
address the scarce and critical skills priorities.
4.3. Overview of PSETA’s 2014/2015 priority scarce and critical skills
The priority skills emerge from stakeholder engagements, the demand side analysis as
outlined in Chapter Two, and an analysis of the capabilities needed to support the outcomes
of the NDP. They were also verified and elaborated in detailed engagements with potential
partners in each priority area agreed.
To reiterate: Chapters One and Two noted that given the particular history of the South African
public service, skills development initiatives to be supported by PSETA should primarily focus
on those skills that support organisational development. PSETA’s focus over the medium term
is on building capacity in those skills sets that are most directly linked to stabilising and
improving the way in which organisations are managed, capacity building is facilitated and
routine work is performed on a daily basis.
The priority skills agreed by stakeholders reflect an effort to take forward this approach as well
as the Framework for Capacity-Building. The priority skills are as follows:

102
Priority Skill Area Justification
Developing competencies to deliver on the NDP
1 Professional and
Technical Skills ,
through SIPs
NDP Chapter 13 has “improve the professional and
technical capabilities of the state” as a sub-outcome
The SIPs cannot be rolled out effectively without such
capabilities.
There is a strong correlation between professional and
technical capabilities and service delivery in many
government departments.
The public service is committed to the professionalisation
agenda.
2 SCM and Contract
Management
NDP Chapter 13 Sub-outcome 3 is “economical and
efficient procurement systems”
We have outlined the importance of procurement as a
function in the delivery of government services in South
Africa and weaknesses in current capacity of systems
and personnel to effectively procure.
3 Operationally
competent
management
Management skills – as a transversal focus – are a
primary area of PSETA's responsibility.
NDP Chapter 13 Sub-Outcome 2 is “efficient and
effective management systems”.
The deficit in strong management skills across the public
sector has been outlined in Chapter Two.
The analysis presented in Chapter One of the drivers of
organisational performance in the South African public
sector has pointed to the importance of operationally
inclined and focused managers in supporting effective
service delivery.
Further, the SIPs have identified a cluster of
management occupations that are required as immediate
and urgent priority skills. These include finance
managers; environmental managers; quality managers;
project and programme managers; and contract
managers.

103
4 Generic skills HR Connect has identified a set of generic skills (such as
computer skills, basic statistical skills, minute taking,
chairing meetings etc) in which tens of thousands of
public servants have indicated they need development.
These are in most cases strongly related to
administrative functions identified as a weakness in
chapter one; and can in most cases be delivered
effectively through e-learning.
Developing the skills recruitment and delivery system
5 Human Resource
Management and
Human Resource
Development
Effective HR practice is a foundation for organisational
performance.
The 2012 OPSC assessment of HR practices in the
public service identified key weaknesses in HRM/HRD
competence and capacity.
Developing HR capacity is required to stabilise
government departments, improving departments’
capacity to identify their skills and training requirements,
and improving departments’ abilities to act as a “training
space”.
HR and HRD are the crucial development partners for
“professionalising the public service” as called for in the
NDP.
6 Buidling capacity in
the area of “bridging
into work” by drawing
on innovations in the
Green Skills sector
The Green Skills sector is currently undertaking the “best
in class” work in the area of bridging into work and work-
integrated learning.
Green Skills was also chosen as a starting point to
establish the links between NDP Chapters 13 and the
environment-related outcomes – “environment” identified
in the NDP.
The DHET SIPs project asked PSETA specifically to
explore Environmental Management and Environmental
Engineering as part of the “transversal” cluster.
7 Developing capacity
to deliver e-learning
While e-learning is the vehicle for delivering
programmes, some skills development will be required
both for programme developers (based in state
academies) as well as for HRM/D staff based in
departments, who will need to understand how to
promote and manage e-learning within their workplaces.
This SSP indicates that a significant increase in scale,
economy and efficiency will be needed to build a more
skilled and capable public service.

104
These priority skills can be divided into two sub-sets: the first set aims to address key skills
weaknesses in professional and managerial occupations, especially as they relate to SIPs and
the public procurement system. They are central competencies needed to deliver on the NDP.
The second set aims to build the capacity of the skills development system itself:
Support to the professional and technical skills will be delivered through targeted
support to SIPs. Here PSETA will promote the public service as a career of choice to
professionals identified as important for improving infrastructure development and
management. Further, PSETA will also provide support to the lDMS training
programme.
The SCM skills will be delivered by PSETA partnering with the National Treasury
project on building capacity in the financial management occupations. This project will
also assist PSETA in building the skills to undertake similar capacity-building projects
in relation to other occupations.
The management skills interventions will aim to strengthen the “administrative” and
“operational” competencies of managers. The plan for rolling out IDMS training will
strengthen the managerial competencies of those responsible for managing the SIPs.
Second, the e-learning/generic interventions will aim to provide a set of programmes
on basic administrative skills (such as writing a submission, organising meetings,
taking minutes and designing policies and procedures). See below. Third, PSETA is in
discussion with departments who have developed successful programmes for
developing the operational capacity of managers, on sharing with other departments
the lessons and resources used in improving the capacity of managers.
The generic skills interventions will be provided through e-learning, against the list of
generic skills needs identified by HR Connect. PSETA intends to partner the National
School of Government to lead the State Academies Forum in adapting some of the
best existing programmes to e-learning. These e-learning programmes will then be
made available to all state academies under the National School of Government, as
well as to departments that have already established the infrastructure for e-learning
delivery. PSETA intends to collaborate with other Government SETAs on this project,
with each SETA funding a small number of programmes that are then shared with all
other SETAs.
In the second set (building the capacity of the system to recruit and train):
The HRM/D skills aim at building the “demand-side capacity” for planning,
implementation, monitoring and evaluation and reporting. The intervention also aims
to take forward the professionalisation of HRM/D, which in turn will support the
professionalization agenda more widely.
The e-learning focus aims at building the “supply-side capacity”, enabling more
economical and efficient provision, and therefore allowing for an increased scale of
provision. The intervention has been conceptualised in a way that assists the National
105
School of Government to coalesce more fully out of the State Academies Forum.
The most important reason for choosing the green skills sector as a priority in the public
service is to improve the mechanisms and processes through which departments
bridge unemployed graduates into work placement opportunities in the public service.
The green skills sector is arguably doing the most innovative work to support the
training of unemployed graduates and internships in general. The Green Skills focus
thus represents an attempt to improve the “bridging into work” capacity of the
public service. It will improve work-integrated learning (WIL) and internships, and
promote improved partnerships between providers and public service workplaces.
The rest of this chapter provides detailed information on the priority skills, the causes of these
skills shortages and the broad capacity-building approach needed to address them (the detail
of PSETA’s role in supporting the development of these skills is outlined in Chapter 5). The
first set – focused on the state capabilities needed to deliver the NDP – are dealt with first.
The second set – focused on building the capabilities of the skills system itself – are dealt with
next.

106
4.4. Priority 1: Rebuilding the Professional and Technical Capabilities
of the Public Service through the SIPs
4.4.1. Overiew of the Strategic Integrated Projects (SIPs)
The public infrastructure delivery environment in South Africa has gone through major
structural changes in the last two years. Improved infrastructure delivery has become a major
item on government’s agenda. The 2012 Medium Term Budget Policy Statement includes the
following fiscal policy objectives, “Improving the impact of spending by shifting the balance of
resource allocation towards investment in infrastructure”. Under the NDP, government aims
to increase public infrastructure investment to reach 10 per cent of GDP. The National
Infrastructure Plan (NIP) was launched in 2012 making provision for 18 SIPs, which are mainly
large scale construction projects cutting across different sectors. The Presidential
Infrastructure Coordinating Committee was established to provide strategic guidance to the
implementation of the NIP.
SIPs require skills to build the infrastructure efficiently and effectively (“skills for SIPs”); but
skills will also be generated through training and employing people to work on the SIPs (the
“skills through SIPs”).
4.4.2. Skills shortages and organisational capacity in professional and technical
occupations
As noted in Chapter Two, scarce skills (insufficient supply of labour) in the public sector lie
mainly in the areas of the technical and professional occupations. The Persal data presented
in Chapter Two however, does not fully reflect the scale of the challenge (possibly because of
the need to update Persal occupation categories and improve data capture).
In terms of professional and technical skills affecting SIPs, officials working on development
the IDMS suggest that there is not an absolute shortage of labour in most key professions
related to infrastructure development such as architects, quantity surveyors, town planners
and so forth (they do note absolute shortages in certain engineering professions such as
electrical engineering). These anecdotal accounts are supported by SSPs from the
construction and engineering SETAs. There are however, as noted in Chapter Two, fairly high
vacancies in the public service in many of these professions.
The challenge to recruiting these skills lies in regional demand-supply mismatches, in poor
recruiting practices in the public service (affected by a complex range of factors), and in the
regulations (and related remuneration structures) pertaining to hiring professionals and
artisans in the public sector. In some of the professional occupations, professionals must be
professionally registered before they can apply for a post. In order to be professionally

107
registered, however, they must work for at least three years under the supervision or
mentorship of a more experienced professional – and then apply for a government post. The
public sector loses many young professionals to the private sector as a result. Challenges to
recruiting and utilising the skills of artisans lie in the fact that the FET college training is not
equipping artisans for their trade.
Independent research under the Presidential Infrastructure Coordinating Committee reported
that the state has haemorrhaged professional and technical capacity to the point at which it is
no longer possible to rebuild these skills within the state. Most professions, for example,
require a period of work experience under the supervision of a registered professional before
they can register for professional practice themselves. Where no such registered
professionals exist, it is not possible for the state to incubate these skills internally.
Senior project managers managing large public infrastructure projects require a combination
of technical knowledge, project management capacity and also knowledge of the governance
environment in the public sector (to ensure appropriate reporting to the Standing Committee
on Public Accounts (SCOPA) for example), and, ideally, capacity in managing labour relations,
and other vital ‘softer skills’ that facilitate projects being implemented according to plan and
budget and ensuring service providers deliver.
Research conducted for this SSP notes the following hard-hitting findings with respect to
shortages in skills needed for SIPs:
“Eight of the nine Public Works’s departments in provinces have less than 14% of the
required skills to manage construction procurement and infrastructure projects on
behalf of provincial health authorities”
“Some provinces like Mpumalanga, Northern Cape and Free State have less than 10%
of the required skills”. (PSETA, 2014).
The main challenges in terms of skills for infrastructure management across the three spheres
of government are the following:
In the individual dimension (as per the framework outlined above):
o The majority of technical personnel employed do not match the required built
environment qualifications.
o There is an inability to link individuals’ skills gaps to appropriate and accredited
training courses.
In the organisational dimension:
o There are no or poor technical job descriptions to inform recruitment processes.
o Skills audits are not based on valid and relevant built environment competence
standards.
o There are high vacancy rates in infrastructure units if existing personnel are
measured against qualifications and professional registration requirements.
o The education system is not producing graduates that have been sufficiently

108
trained and educated to apply themselves successfully in the workplace – this

109
includes artisans who need to complete their training in the workplace.
o SCM processes do not the necessary technical skills (such as build environment
specialists) needed to ensure specifications are appropriately developed, quality
of work is delivered etc.
o Lack of leadership skills in municipal councils and municipal managers to
maintain an attractive employment environment for senior technical staff.
o There are insufficient professional and technical skills in departments to mentor
and train new recruits (see section above).
The consequences of the skills challenges itemised above are:
Poor infrastructure planning.
Underspending or overspending on projects.
Poor contract administration.
Lack of adherence to contractual requirements for example projects not completed and
as built drawings not obtained.
Financial management reporting not complied with adequately enough to meet
management information standards.
Fraud and corruption.
Despondency amongst senior technical staff and high rates of resignation.
A plethora of infrastructure legislation developed in the context of a State lacking
capacity to deliver has created over regulation.
Addressing the scarcities in the professional and technical occupations will thus require a
holistic, integrated approach, as per the Framework for Capacity Building. The Plan therefore
involves collaboration between the key departments and organisations required to address all
the above dimensions.
4.4.3. What is required to improve capacity?
National Treasury in partnership with Construction Industry Development Board (CIDB)
developed IDMS, supported by a Toolkit and a ‘Community of Practice’ (referred to as the
IDMBOK). IDMS aims to enhance the know-how and capacity of infrastructure delivery
managers and professionals within the public sector responsible for managing the planning,
implementation, operations and maintenance and asset management of infrastructure related
to the construction sector. Public sector infrastructure managers and professionals require
training to use the IDMS. This training is being provided by the University of Pretoria and will
also be rolled out by other Universities. Construction procurement training will specifically be
provided by the CIDB for professionals in the public and private sectors.
Figure 5: Overview of the IDMS skills plan
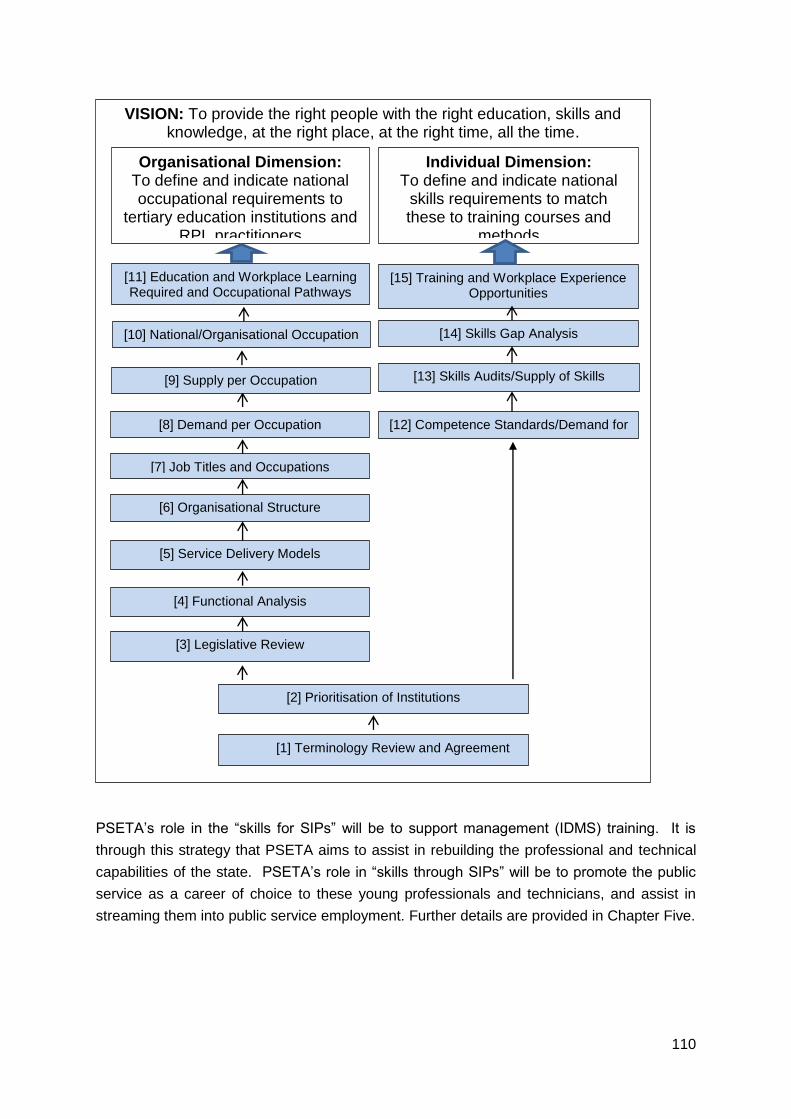
110
PSETA’s role in the “skills for SIPs” will be to support management (IDMS) training. It is
through this strategy that PSETA aims to assist in rebuilding the professional and technical
capabilities of the state. PSETA’s role in “skills through SIPs” will be to promote the public
service as a career of choice to these young professionals and technicians, and assist in
streaming them into public service employment. Further details are provided in Chapter Five.
VISION: To provide the right people with the right education, skills and knowledge, at the right place, at the right time, all the time.
Organisational Dimension:
To define and indicate national occupational requirements to
tertiary education institutions and RPL practitioners
Individual Dimension: To define and indicate national
skills requirements to match these to training courses and
methods
[11] Education and Workplace Learning Required and Occupational Pathways
[8] Demand per Occupation
[7] Job Titles and Occupations
[6] Organisational Structure
[5] Service Delivery Models
[4] Functional Analysis
[3] Legislative Review
[15] Training and Workplace Experience Opportunities
[14] Skills Gap Analysis
[13] Skills Audits/Supply of Skills [Individual]
[12] Competence Standards/Demand for Skills
[9] Supply per Occupation
[1] Terminology Review and Agreement
[10] National/Organisational Occupation Gap
[2] Prioritisation of Institutions

111
4.5. Priority 2: Procurement and Contract Management Skills
Taken together with improved professional and technical skills and an operationally focused
management service (see priority skills 3 below), the performance of government departments
and agencies can significantly be improved by strengthening their ability to manage the supply
chain.
As mentioned, there is a need to improve the SCM system to support government’s massive
planned investment in public infrastructure – through the state owned enterprises (such as the
Transnet Stock Renewal Programme) and through funding to be made available for
departments via SIPs. SIPs will first focus on developing and improving infrastructure in the
education and health sectors and then support infrastructure development in roads and other
sectors (Interview with National Treasury, August 2013). In preparation for the rollout of SIPs,
National Treasury, the Construction Industry Development Board, and other stakeholders
such as Public Works, are developing IDMS. The system aims to support planning for
infrastructure, designing and developing infrastructure, maintaining infrastructure and
monitoring and evaluation spending (Interview with National Treasury, August 2013). It is
being designed with a view to facilitating coordination between departments - for example,
between a provincial department of education and public works.
In the area of infrastructure procurement and maintenance, effective procurement of
infrastructure requires a depth of technical knowledge about infrastructure development - i.e.
personnel with training in the build environment and / or civil and related engineering
professions (Interview with National Treasury, August 2013) as well as experience and / or
training in project management. Managers who do not have training in these technical and
professional fields are not far less able to contact and monitor delivery of infrastructure
appropriately. At present, the technical capacity in many of the public works departments is
not sufficient to support the large expansion of infrastructure development (interview with
National Treasury, August 2013). This capacity is also needed in departments such as health
and education where the demand for new or improved infrastructure will first be identified.
4.5.1. Competencies associated with SCM
According to Draft National Treasury Regulations 40 , “SCM means the design, planning,
execution, control, and monitoring of supply chain activities in the delivery of goods and
services, with the objective of creating net value and providing oversight and co-ordination of
information and finances within the supply chain.” Yet SCM is often treated as a discrete
function, unrelated to the wider planning and management functions in departments, reducing
SCM simply to one of its component functions i.e. tendering for goods and services. Instead,
SCM consists of a range of functions and capabilities (see the table below). Improving SCM
40 Notice 1005 of 2012.

112
in South Africa requires a broader understanding of SCM.
Table 31: Functions and capabilities involved in effective procurement and contract
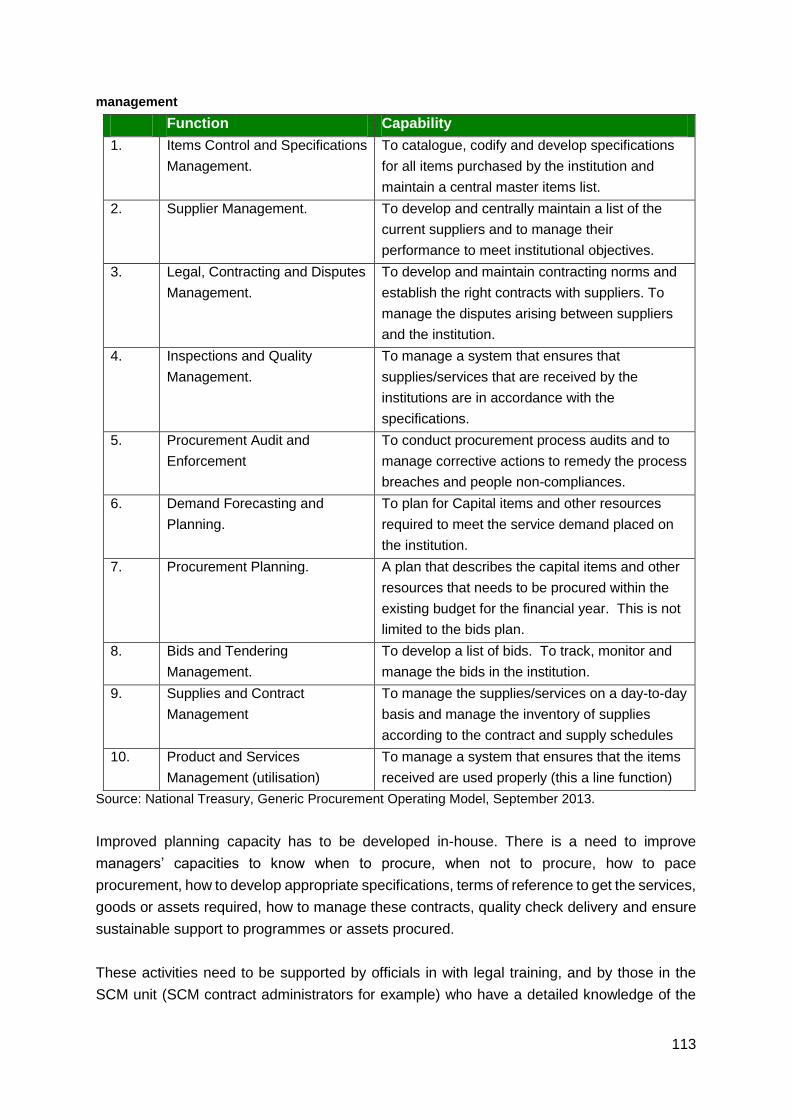
113
management
Function Capability
1. Items Control and Specifications
Management.
To catalogue, codify and develop specifications
for all items purchased by the institution and
maintain a central master items list.
2. Supplier Management. To develop and centrally maintain a list of the
current suppliers and to manage their
performance to meet institutional objectives.
3. Legal, Contracting and Disputes
Management.
To develop and maintain contracting norms and
establish the right contracts with suppliers. To
manage the disputes arising between suppliers
and the institution.
4. Inspections and Quality
Management.
To manage a system that ensures that
supplies/services that are received by the
institutions are in accordance with the
specifications.
5. Procurement Audit and
Enforcement
To conduct procurement process audits and to
manage corrective actions to remedy the process
breaches and people non-compliances.
6. Demand Forecasting and
Planning.
To plan for Capital items and other resources
required to meet the service demand placed on
the institution.
7. Procurement Planning. A plan that describes the capital items and other
resources that needs to be procured within the
existing budget for the financial year. This is not
limited to the bids plan.
8. Bids and Tendering
Management.
To develop a list of bids. To track, monitor and
manage the bids in the institution.
9. Supplies and Contract
Management
To manage the supplies/services on a day-to-day
basis and manage the inventory of supplies
according to the contract and supply schedules
10. Product and Services
Management (utilisation)
To manage a system that ensures that the items
received are used properly (this a line function)
Source: National Treasury, Generic Procurement Operating Model, September 2013.
Improved planning capacity has to be developed in-house. There is a need to improve
managers’ capacities to know when to procure, when not to procure, how to pace
procurement, how to develop appropriate specifications, terms of reference to get the services,
goods or assets required, how to manage these contracts, quality check delivery and ensure
sustainable support to programmes or assets procured.
These activities need to be supported by officials in with legal training, and by those in the
SCM unit (SCM contract administrators for example) who have a detailed knowledge of the
114
legislation and regulations pertaining to procurement.
Further, National Treasury officials highlight that effective procurement requires that contracts
are appropriately developed and filed, and that data is collected and analysed to assess
delivery. As noted above, improved basic administrative systems are also therefore necessary
to support more effective and efficient procurement. In the area of SCM itself, administrative
capacity is needed to check each bid in detail, vet the bid contents and so forth.
The internal audit function needs to be improved – this will required improved capacity in
planning. Internal audit functions by assessing planned outcomes against actual outcomes. If
the planning does not meet certain standards of accuracy and disclosure, the internal audit
function will be compromised.
Experts with technical subject knowledge in the area or domain that is being procured, be it in
IT or in medical equipment, are vital for effective procurement. This is important so that
departments are able to set specifications in bids and tenders that correspond to what
departments actually need. Such technical specialist knowledge is also key for evaulauting
bids and for holding service providers accountable.
4.5.2. Skills and capacity gaps in SCM41
The National Treasury notes that, “South Africa’s shortage of skills is felt sharply in PFM with
41 This section is a based on extracts from the Capacity Building Model for Financial Management in the
Public Service, National Treasury, 2010, and the 2014 Annual Performance Plan of the Office of the Chief
Procurement Officer (OCPO), ‘Report on the Skills Dimension to the National Infrastructure Plan’ and the
‘Report for the DPSA on Skills Planning for SIPs implementation, with specific focus on the occupation:
Commercial Contract Manager’, and input by Mr M Kuipers, Chief Director: Client Support in the Office of the
Chief Procurement Officer, as well as Mr Khuzwayo, Director: HRD Strategy and Policy – DPSA.
115
the public sector falling behind in the competition for scarce skills. According to the South
African Institute of Chartered Accountants (SAICA), there were 22 030 public and private
sector auditing and accounting vacancies in 2008. Projections indicate that the supply of
graduates and professionals entering the market is inadequate to keep up with increased
demand. Furthermore, only 1.6 per cent of accountant posts in the public sector are filled by
registered professionals, compared with 11.5 per cent of such posts in the private sector
(SAICA 2008)”. (National Treasury, 2014b). Research into vacancy rates in 2010 also
revealed that, “vacancy rates for staff in the public sector averaged 31 per cent for finance
positions, 36 per cent for SCM, 39 per cent for internal audit and 44 per cent for risk
management (National Treasury 2010). The situation is made worse by a high turnover rate
in PFM, averaging 14.6 months.” (Ibid).
The OCPO has identified a range of challenges currently facing the system:
Limited capacity (inappropriate structures, posts, vacancies).
Insufficient and inadequate supporting systems (both information technology and
administrative systems).
Inadequate skills.
Weak operations management.
Limited delivery capability (service providers do not have the right experience, skills
and capacity and learning institutions are not responding to the needs of the public
sector in respect of appropriate education, training and development solutions).
An area receiving attention within the broader SCM capability is that of contract management.
National Treasury defines contract management as, “maintaining control or influence over the
contractual arrangement between the institution and the contractor or service provider
including administering and regulating such agreement.”42
A DPSA report notes, “Since the establishment of the Office of the Procurement Officer under
the National Treasury, there has been an increased focus on the role of contract management
in government departments. Additionally, the research into the DPSA commissioned ‘Report
on the Skills Dimension to the National Infrastructure Plan’... identified contract management
as one of the essential skills for the successful delivery of the infrastructure, [and] has also
revealed valuable information about this function and the occupation”.43 Given the importance
of contract management, the DPSA commissioned a report specifically focusing on contact
42 Page 106, Draft National Treasury Regulations (Notice 1005 of 2012) 43 Submission by Director: HRD Strategy and Policy – DPSA. The submission references two key reports,
namely the ‘Report on the Skills Dimension to the National Infrastructure Plan’ and the ‘Report for the DPSA
on Skills Planning for SIPs implementation’. The report was developed in partnership with the National
Treasury and the professional body, Chartered Institute for Purchasing and Supply.... The report makes
valuable recommendations for consideration which will be analysed during the course of the 2014-15
financial-year.

116
management.44 The report identifies a professional (ideal pathway) for a Commercial Contract
Manager, and “key activities / responsibilities / competencies”, including, risk management,
SCM, operations management, financial management, negotiation and relationship
management (external and internal), and legal aspects of contracts and agreements.
The report identifies “problems causing shortages in the [contract management] profession”.
These include, inter alia:
“[T]he necessary degree is not offered by most tertiary institutions in South Africa
...[and] Contract Management is not a specific module in the curriculum…” despite the
fact that, “There is… no problem with material or study content. Global subject matter
experts and study material is available and can be acquired relatively easily from
professional bodies (both global and local).
“Work experience – these are high-risk roles in any organisation. The skills pool is too
small to warrant freeing up professionals in the workplace to mentor less-experienced
colleagues. The competencies required take many years to learn and apply effectively.
Any ‘shadowing’ or ‘mentoring’ programmes must extend for many months, even
years…”.
“[T]here is no recognised national standard for the profession. And practitioners are
not required to meet any specific level of competence or to adhere to any code of
professional conduct.
“Expertise achieved – the current pool of talent is ageing and there is no stream of
incoming talent to replace it.”
“The profession is not viewed as attractive and has to compete with more ‘glamorous’
alternatives such as a career in finance where the earning potential is far higher.”
4.5.3. What is required to improve capacity?
National Treasury is working with departments to identify appropriate organisational structures
and posts required for improving the SCM system in general and procurement in infrastructure
in particular.
Capacity development will require:
More substantial training for managers and new recruits to the public service on
specific legislation, regulations and processes of procurement in the South African
public sector.
The development of specific courses and programmes in the tertiary sector and in the
National School of Government on procurement, including courses on specifications
development, contract management and so forth.
Support for the recruitment of further technical skills to ensure specifications are
44 ‘Report for the DPSA on Skills Planning for SIPs implementation, with specific focus on the occupation:
Commercial Contract Manager’.

117
correctly developed, and the use of technical skills and subject matter expertise is
appropriately incorporated into the procurement process (see the section above on
professional and technical skill).
Re SIPS: The need for training that provides information about the new IDMS, about
changes to legislation (to the PFMA for example) and so forth.
Capacity in the wider procurement system (in the occupations identified above) will have to
be developed incrementally and there will need to be partnerships developed with higher
education institutions to develop depth of theoretical and practical knowledge about
procurement in the South African context.
The OCPO has identified that in order for the state SCM capability to be developed in an
efficient, effective and accelerated manner, it requires inter alia: support from, and improved
collaboration with, all related stakeholders; a holistic and sustainable sector approach,
governance structures to be created that include representation from the various finance-
related disciplines including, inter alia, accounting, risk, internal audit, and SCM. Significantly,
it also notes that HRD initiatives need to be aligned to the needs of the workplace and that
HRD units to be adequately trained.
With regards to PSETA specifically, the OCPO proposes that PSETA:
Coordinate ETD interventions nationally.
Advocate for HRD in the public sector.
Fund priority skills development interventions.
In the area of contract management specifically, the DPSA report proposes the following

118
interventions:
“Short-term (6 – 24 months)
o Licensing of the profession.
o Include Complex Contract Management as part of relevant degree programmes at
universities/business schools.
o Support current practitioners who do not have a qualification or adequate skills
(training, applied learning opportunities, assessments, mentoring provided by
‘retired’ professionals)
o Introduce programmes centered in practical, workplace learning opportunities with
applied learning as a medium for delivering know-how.
o Assess competence of lecturers and education professionals as regards supply
chain and contracts management. Engage global and local subject matter experts
to design and develop the ideal profile of education practitioners.
o Provide bursaries in SCM.
“Medium-term (2 – 5 years)
o Increase attractiveness of the profession with initiatives such as the CIPS Global
“Be a Buyer” campaign at secondary and tertiary institutions.
“Long-term (5 years and onwards)
o Include relevant subjects in secondary education.
o Improve quality of subjects offered at primary and secondary schools – such as
mathematics and accountancy.
With regards to the possible role of PSETA in supporting the development of contract
management, the DPSA notes, “During the development of the Report on the Skills Dimension
to the National Infrastructure Plan, SETAs were approached to commit funding towards the
recommended interventions to address the skills gaps identified. While much funding
commitment was made towards other occupations, none was made for Contract Management.
This is where the PSETA can make a contribution.” They note that this can include supporting
departments with mentorship programmes, RPL, bursaries for employees and prospective
employees, creation of research chairs at institutions of learning which feed into the
advancement of occupation and internships. We detail PSETA’s planned interventions to
support SCM and contract management in Chapter 5.
4.6. Priority 3: Building Operationally Focused Management Skills
4.6.1. Why “Operationally Focused” Management Skills?
We have noted how there has been much emphasis since the end of the Apartheid period in
improving the managerial capacity of the public service. This is also the key transversal
responsibility of the PSETA. Most schools of public administration and management in South
Africa focus on equipping students with generic management skills as well as providing them

119
with insight into the policy making process and the strategic, developmental challenges of the
country. In some cases these broad development challenges are explored ‘sectorally’ so that
students graduate with, for example, some understanding of the policy and strategic
challenges in the field of education or health or energy and so on. What is often missing,
however, is the ability to translate policy or strategy into operations.
The MPAT survey undertaken by the DPME has found consistently that managers in many
departments do not pay sufficient attention to operational plans and operational designs as
key aspects of their work. Even when these plans are developed it is not always clear that
they are inform decisions about how resources are allocated and work is planned. Too
frequently, they are done for compliance reasons.
The focus then needs to be on developing departments’ ability to translate high-level strategic
statements or outcomes into detailed plans for implementing programmes. This will require
managers to develop their ability to approach problems critically, applying strong analytical
skills to the development of appropriate programmes of action. It requires that managers are
able to develop detailed plans, systems and processes for implementation. Depending on the
nature of the programme or project this may also require the department to develop improved
expertise in process design and systems engineering. Not all managers need this kind of skill,
but many require the experience of knowing when to bring this expertise in.
Monitoring and evaluation was an area that many managers identified as a weakness in their
own departments (see SMS competency assessment data). Whilst an official can be sent for
a short course on how to use some of the tools developed for monitoring and evaluation
(logframe development etc.), strong monitoring and evaluation skill emerges out of a prior
ability to analytically consider a problem and to develop an understanding of the planning and
processes needed for implementation of a programme or project.
A further area of competence that all managers in the public service need to have developed
is that of appropriately selecting and managing service providers. This is not a skill that only
personnel in the SCM unit need to develop. Government is outsourcing a lot of its core work
to service providers. We have also seen that since the introduction of the PFMA in 2000, the
system of procurement has been radically decentralised. All managers require a base level
competency in procurement.
Managers have also identified a need for developing their ‘softer’ skills in conflict management,
supervision of staff etc. HR departments could play a role in this area – see section below on
HR and HRD.
SIPs have identified a number of management occupations that require specific attention for
purposes of the SIPs. PSETA conducted the foundational work on understanding the nature
of the needs; and is a member of the current management Occupational Task Teams under

120
the DHET. These include:
project managers and programme managers (as identified above)
contract managers and supply chain manager (as identified above)
financial managers
quality systems managers
environmental managers
occupational health and safety managers.
4.6.2. How does management skill ideally get developed?
In South Africa, turnover rates of senior management are high. National turnover and vacancy
data published by Statistics South Africa shows that turnover and vacancy rates affect senior
management competencies and skill shortage in public and private organizations. Turnover in
the organizations occur for many reasons (the NDP has pointed to tensions in the political-
administrative interface for example, NPC, 2012); it results in the loss of the senior
management intellectual capital and “shortages of ... [senior management] supply, costs in
recruitment, training and mentoring…” (Xaba, 2003: 287) and impacts on organisations’ ability
to train and mentor new and / or young staff members.
The development of management skill happens over relatively long periods of time, often
through the mentorship of more senior staff. It is fundamentally supported by stability in the
organisation – as was detailed in Chapter One.
The development of management capacity is not necessarily linked to a particular learning
pathway or qualification. Typically, a public service manager starts off with a base degree. An
environmental manager might start with a life sciences degree; a construction manager with
a building science degree etc. Sometimes a public service manager will start with a base
degree; then move into a workplace. After a number of years of work experience, they may
progress on to a management qualification. Some managers begin in the workplace and over
the years, they progress up the management ladder.
Typically a good manager will draw on procedural knowledge (knowledge about “how”, for
example, how to develop a plan); declarative knowledge (knowledge about “what”, for
example, the water sector); and strategic knowledge (knowledge about why, who, where and
when). Interviews with a number of skills development practitioners in the public service have
emphasised that operationally inclined management cannot be developed simply by the
provision of ‘generic’ management skilling – but has to be developed either integrally or as a
‘top-up’ to content knowledge in a specific sector. Subject matter expertise is considered
relevant not just for technical and professional staff, but also for improving operations
management, contracting, project management and financial management. For example,
managers in Public Works departments supporting SIP will need training and a depth of
content knowledge in built environment related subjects. Managers in the health sector ideally

121
require training and depth of experience in the health sector and so forth.
4.6.3. What is required to improve capacity?
In-service training is fundamental: Key to building this management capacity at a fairly senior
level will be improving the public service’s ability to train people ‘on-the-job’ through
mentorship by experienced professionals, supported by carefully designed modules
specifically designed for the public service in skills such as project planning, budgeting,
reporting writing, personnel management etc. The new National School of Government has
an important role to play here.
Improved curriculum content of public administration schools: Interviews in preparation for this
SSP with a number of PSETA departments point to the need to improve the curriculum content
and relevance of public administration courses to prepare students appropriately for work in
the public service. Research by PARI (Chipkin and Meny-Gibert, 2011) has pointed to the fact
that the field of public administration in universities has historically been, and remains on
average, analytically weak and thus does not sufficiently support the development of critical,
analytical capability, often needed for the development and implementation of policies to meet
South Africa’s complex social, economic and institutional challenges.
The immediate focus of training: The section above suggests an important corrective to how
managers in the public service are trained. The School of Government could play a leading
role in management programmes that initiate managers in operational planning, process
design and systems engineering. We have noted that there should be a focus on training for
managers outside of the SCM units on procurement, in particular on developing experience in
writing details terms of reference and specifications.
Chapter One and Two also identified weak basic administration capacity across many
departments in the public service (such as record keeping, data collection, database
management etc.) – affecting departments’ ability to contract service providers appropriately,
to support substantive compliance with a range of regulations, including meeting auditing
standards in financial management and so. Building basic administrative capacity is therefore
identified as another priority area – it supports better contract management, monitoring and
evaluation and other competencies (see Priority Skill 4 – Generic Skills).
PSETA has an important role to play in sharing lessons of successful approaches to
developing operationally inclined managers – through sharing of case studies, dialogues and
study tours.
In addition, the IDMS training to be supported by PSETA (see Priority 1 above) will aim to
strengthen operationally focused project management skills, concentrated on the
infrastructure projects.

122
Lastly, the provision of generic skills through e-learning (see section on generic skills below)
aims to improve the administrative capabilities of the managers, amongst others.
4.7. Priority 4: Generic Skills
4.7.1. Generic Skills as a priority critical skills component
Critical skills normally include two main categories. First, there may be job-specific top-up
training required, either because initial training was inadequate or because there have been
developments that require continuous professional development. Second, “generic” skills
include life skills, interpersonal skills, organisational skills or administrative skills that are
seldom adequately covered in occupational or vocational training. Many of the failures of
“operationally focused” management – the administrative capabilities of government – are
related to the weaknesses in these generic skills.
4.7.2. Generic skills required in the public service
HR Connect collected data on the training needs of officials on ‘generic skills’. The number
of officials who indicated that they require formalised learning, or simply some mentoring, to
develop these generic skills are shown in the table below.
Table 32: HR Connect data on generic skills training required by public servants

123
Skill Total Need learning Need mentoring
Address client needs 52087 12633 7638
Address customer needs 140126 30948 15023
Advanced business writing 224061 92085 51322
Applied strategic thinking 196762 65766 40149
Basic business writing 263098 75093 37702
Benchmarking 229940 100820 60252
Chair meetings 247600 66690 41673
Change management 204989 72152 46823
Conflict resolution 248342 66390 36384
Continuous improvement 222150 63513 36523
Determine client needs 52483 12967 8389
Determine customer needs 141296 30620 15072
Developing others 227071 57110 32902
Diversity management 222125 58583 36213
Document management 244149 101183 55676
Edit and utilise MS Excel Spreadsheets 258383 113089 54534
Evaluate client service 51983 13449 8639
Evaluate customer service 131456 33685 17463
Facilitation of groups 249188 73526 40763
Financial management 196944 82750 50739
Governance 237315 102409 63860
Information management 223429 75080 58514
Listening 318571 35566 17861
Manage client expectations 49681 13000 8141
Manage customer expectations 136313 31031 14789
Materials or facilities utilisation 213947 62995 35852
Minute-taking 261987 63254 32919
Prepare and use MS PowerPoint 244734 116439 55653
Problem analysis 246979 70531 38049
Problem-solving and decision-making 251601 76742 36457
Procurement 230784 108958 56773
Promote honest conduct 269248 92988 45359
Public speaking 256751 66331 39908
Risk management 243034 105649 57156
Team work 273497 80311 35805
Technology applied 203933 88926 42701
Use job-specific software programmes 252191 111777 52471
Utilise MS Outlook including email,
calendar and contacts
251605 105983 51709
Utilise MS Word to produce and edit
documents
262593 95845 45967
Work output planning 246196 73614 48255

124
4.7.3. What is required to build capacity?
The PSETA Stakeholder Workshop on Priority Skills agreed that PSETA should explore a
partnership with the National School of Government and the State Academies Forum, in
addressing the generic skills through e-learning. They also agreed that it may be helpful to
partner other Government SETAs who are also interested in exploring e-learning, in this
project. These initiatives should be undertaken in a way that builds the capacity of the supply-
side to undertake e-learning on a larger scale.
For purposes of this SSP, therefore, PSETA consulted with the State Academies Forum and
with three state academies separately. All have indicated a willingness to share their existing
programmes that may be of wider value (for example, the DIRCO programme on writing a
submission; Stats Academy programs on basic statistical analysis; and Justice Academy
programmes on the Promotion of Administrative Justice Act).
PSETA also consulted with some of the other Government SETAs who have previously
expressed an interest in collaborating on the project. Finally, PSETA consulted with the e-
learning division in the National School of Government, including consultation on how to
quality assure e-learning better.
The specific generic skills suggested as priorities in this chapter are those related to improving
operationally focused management, as per the Capacity Development Framework focus.
4.8. Priority 4: Human Resource Management, Development and

125
Planning Skills
4.8.1. The importance of HR as a strategic function
Analysis of the MPAT assessment scores undertaken in 2013 (DPME, 2013) against a variety
of other factors found that HRM/D scores are strongly correlated with overall organisational
performance improvement. However, as noted in Chapter Two, the HR function in the South
African public service is very uneven, and often weak.
The OCPO in the National Treasury has pointed to improving HRD competency in
departments as a necessary component of improving the procurement system in the public
sector (to recruit, train and retain the appropriate skills and develop depth of experience in
state procurement across a range of sectors).
According to the South African Board for People Practices (SABPP, 2013) the full set of
functions involved in HR in an organisation are as follows:
Strategic HRM
Talent management.
HR Risk Management Functional/cross functional HR value chain
Workforce Planning.
Learning and Development.
Performance management.
Reward.
Wellness.
Employment Relations Management.
Organisation Development.
HR Service Delivery.
HR Technology Measurement.
HR Measurement (SABPP, 2013: 3).
A recent case study commissioned by PSETA has shown that in some departments the HR
function does not include a number of the functions above. HR is often limited to compliance
reporting and transactional functions i.e. the strategic role of HR in recruiting and training staff
to deliver on its mandate is often missing. This situation is impacted on by a number of issues.
One of these is the need for improved skills amongst HR personnel, and improved HR skills
in line managers; another is related to the lack of seniority of HR personnel in some public
service organisations; and HR is also impacted on by the politicisation of the HR function in
some departments and related to this, turnover in HR that this can cause.
The NDP has drawn attention to deficiencies in current recruitment practices. It is not simply
that unskilled or unqualified people are being appointed in the public service. Often recruitment

126
practices do not accord with the strategic priorities of departments, so that key role are not
filled or are not adequately filled. Recruitment practices often do not adequately take adequate
attention of the roles and positions that are key to the performance of the department, agency
or office.
This mismatch might speak to a design flaw in many departments themselves. Often HR is
headed by a Chief Director reporting to a Chief Financial Officer, who may have an incentive
to evaluate recruitment strategies and practices primarily from the perspective of affordability,
competitiveness and other financial management considerations. Although it is beyond the
scope of the PSETA and the SSP, it is worth considering whether improving the recruitment
function in departments might also be supported by a wider debate about the significance of
HR function in relation to other functions. A compelling argument could be made that HR
should be located at a Deputy Directorate General level.
4.8.2. How should improved HR and HRD capacity be approached?
Interventions to support HR/D include:
Increased status and supply of HR professionals: Students leaving the schooling system
should be incentivised to undertake courses in human resource management, industrial
psychology and other programmes which build capacity in HR and HRD, through bursaries
and prestigious graduate development programmes in departments with strong HRD capacity.
National School of Government has a vital role to play in the development of HR capacity in
the public service, and has already developed a framework for programmes.
Benchmarking: The South African Board for Personnel Practices has recently issued a
National Standard for HR. This addresses a key gap in the system, and provides a uniform
benchmark against which HR practices and systems can be audited and improved.
Discussion and support for HR as a senior function: A recent case study report commissioned
by PSETA suggests that the placement of the HR function head at DDG level may be an
important variable in ensuring a more strategic approach to HR. PSETA is well placed to
support an informed debate about the position and role of the HR function in the public service.
Stakeholders attending the PSETA 2014 Workshop agreed that HR should be a priority
intervention. However, they cautioned against a grand scheme for doing this, arguing instead
that PSETA should work with existing practitioner networks and aim to build their skills in ways
that are related to immediate challenges they are experiencing. As noted in the Framework

127
for Capacity-Building, it is the HR practitioners who will lead the “people development”
component in capacity building. To do so, they will need to be able to work with line functions
around linking skills efforts to organisational development; they will need to be able to select,
place, induct and manage internships better; and they will need some skills and understanding
of how to promote and support e-learning better within their workplaces.
Other issues discussed by stakeholders included the professionalisation of HR practitioners;
the possibility of putting HR practitioners through an e-learning programme and RPL
programme under the National School of Government; and improving the skills pipeline for HR
practitioners.
128
4.9. Priority 6: ‘Bridging into Work’ – leaning from the Green Skills
sector
PSETA has begun to explore a focus on Green Skills for a number of reasons: one is to explore
the relationship between transversal skills and other skills – green skills are the “test case” for
exploring inter-sectoral coordination required in skills efforts. Second, amongst the NDP
outcomes, green skills are amongst the most complex. They are an “emergent” skill category
that do not lend themselves well to classification on the OFO system and are embedded within
qualification systems. They are a future-oriented driver, aimed at preparing the country for
climate change and other pressures not yet being felt. And green skills are about sustainable
development – the core development paradigm implied by the shift to a developmental state.
They hold significant job creation potential. PSETA’s focus on green skills therefore is about
capacitating the state to unlock this potential. However, in the short to medium term, the
most important reason for choosing green skills as a priority in the public service is to
improve the mechanisms and processes through which departments bridge
unemployed graduates into work placement opportunities in the public service.
4.9.1. Bridging into Work in the Public Service Context
Chapter 3 reported on work-integrated learning within the public service, noting that there is a
strong policy commitment to opening up the public service as a training space. Some
departments are doing it well, but challenges remain in many others.
Internships are the most important bridge between the skills pipeline and public service
employment. The DPSA Policy on Internships directs all departments to take on a minimum
of 5% of their staff complement as interns each year. In 2012, the public service took on a
total of more than 12 000 interns, and the target for 2013 was set at 15 000. (Data on
achievement against these targets is not yet available). The internships are sometimes funded
through the 1%, but in many cases are funded over and above the 1%.
The internships are therefore an expensive strategy. Not only do they incur the direct costs
of stipends paid to interns, but the time invested by existing employees in recruiting, inducting
and supervising interns is a substantial indirect cost. The only sensible reason for any
employer to invest these kinds of resources in human resource development is to improve the
pool of skilled labour on which they can draw. There have been substantial increases in the
number of interns year by year since the policy was introduced, and increasing numbers of
interns are subsequently being employed after their internship. However, the numbers remain
low in absolute terms; and one reason is that interns are often being employed in occupations
where the public service is already overstaffed. Improving the recruitment, selection,
placement, induction, coaching and subsequent absorption of interns is therefore key to
building a more skilled and capable workforce, and to improving the return on this substantial

129
investment.
There are a number of “good practice” examples to draw on in this regard. The Department
of Energy, for example, recruits interns in scarce skill priority occupations. Recognising that
their future employees need to understand the sector they regulate, they place these interns
for periods of time with constituent employers: Eskom, the national energy regulator (NERSA)
and others. The foundational subject-matter expertise (knowledge of “what”) is thus provided
by their higher education studies; procedural expertise (knowledge of “how”) is provided by
the Department itself; and contextual expertise (knowledge of “why and where”) is provided
by the department and the secondary placements in constituent employers in the energy
sector. Similarly, the DIRCO cadet programme provides interns with the opportunities for
international exposure so key to international relations. Chapter 3 has already reported on
the DHA successes in this regard.
Perhaps the most systematic work being done on internships is in the Green Skills Sector,
however. This is in part due to Groen Sebenza, a Presidential Jobs Fund project under the
South African National Biodiversity Institute. Groen Sebenza has taken on 800 unemployed
graduates, and is taking them through a two-year intensive work-integrated learning
programme to bridge them into employment. Note that the intention is for these graduates to
begin opening up the 460 000 job opportunities envisaged by the Green Jobs report: the
investment aims to unlock job creation downstream. PSETA therefore aims to partner with
the Green Skills sector to learn lessons from the experience, and to share these lessons and
resources more widely in improving internships in the public service.
4.9.2. Learning from successful bridging to work programmes
The Green Skills sector is broadly coordinated under the National Environmental Skills
Planning Forum, a stakeholder body falling directly under the Department of Environmental
Affairs. Various projects have been initiated under this forum. One of these – the Bridging
into Work workstream led by WWF – conducted an analysis of the challenges underpinning
the internships strategy. They have subsequently developed a set of resource materials to
address the challenges and have conducted workshops with national and provincial
departments, local government agencies and other organisations involved. The project is
ongoing, scheduled to take place over the next 3 years. PSETA is therefore exploring a
partnership with this project, with the intention of sharing the resources and lessons learned
more widely across the public service.
The project is also in the process of developing a set of resources aimed at building mentoring
capacity within organizations. The approach adopted is consistent with the Framework for
Capacity Development:
The project works with departments to help them interpret their legal/policy mandate
130
in relation to the environment, and to review their organogram and staffing against this.
They build the capacity of the department by working with the HRD practitioners, in
identifying the green skills they require, and in recruiting and selecting the appropriate
interns.
They continue to support the HRD practitioners in strengthening the quality of
workplace learning.
The PSETA workshop with stakeholders in 2014 agreed that improving efforts to bridge
unemployed people into work through internships should be a priority; and that in the process
PSETA should partner with organisations who have already developed resources and
expertise such as the Green Skills sector, and share these more widely across the sector.
4.10. OFO Codes, Qualifications and Estimated Shortages for the Priority

131
Scarce and Critical Skills
The OFO Codes, associated qualifications and estimated shortages for the priority scarce and
critical skills in the public service are detailed below. Please note:
These are clustered around the state capabilities to which they are linked, as per the
broad mandate from the HRD Council.
Some are only scarce skills, some are critical skills, and some are both. In other words,
while there are absolute shortages in some areas, existing staff sometimes need top-
up skills. The scarce and critical skills have therefore been summarised in one table
against the occupations to which they relate.
The professional and technical skills were identified as part of the SIPs skills needs
analysis, and cross-referenced to the vacancy rates reported in Chapter 2. Note that
even though these do not fall within PSETA’s scope of coverage as transversal skills,
PSETA has a role to play in promoting the public service as a career of choice. In
relation to PSETA constituent employers experiencing these shortages, PSETA has a
more direct role to play in partnering appropriate organisations to help address the
shortages.
Re management skills: there is not a shortage of unemployed people with
management qualifications in South Africa generally. However, there are absolute
shortages in the specific management occupations detailed in the table, again
specifically for purposes of addressing the SIPs.
The generic skills were selected from the HR Connect data on generic skills needs as
relevant to the theme of building more “operationally focused management
capabilities. While the numbers of public servants who indicated they needed these
skills obviously include employees who are not management, they nevertheless
represent part of a management “capability”. (A manager will seldom be responsible
for taking minutes or managing documents, for example, but having good minutes or
good document management is crucial to good management).
The procurement and SCM targets have been independently established by Treasury
and through the DHET SIPs project. Critical skills needs have also been established
for these occupations, but since the system is under revision these are not included
here.
Building the demand-side, supply-side and bridging into work elements all involve the
HR practitioners. PSETA already has established networks here, and can easily work
with other existing networks. Following the Capacity Development Framework,
PSETA aims to work with these practitioners – through the networks and projects – to
help them understand the Framework itself, and to understand their roles in Work
Integrated Learning and e-learning.
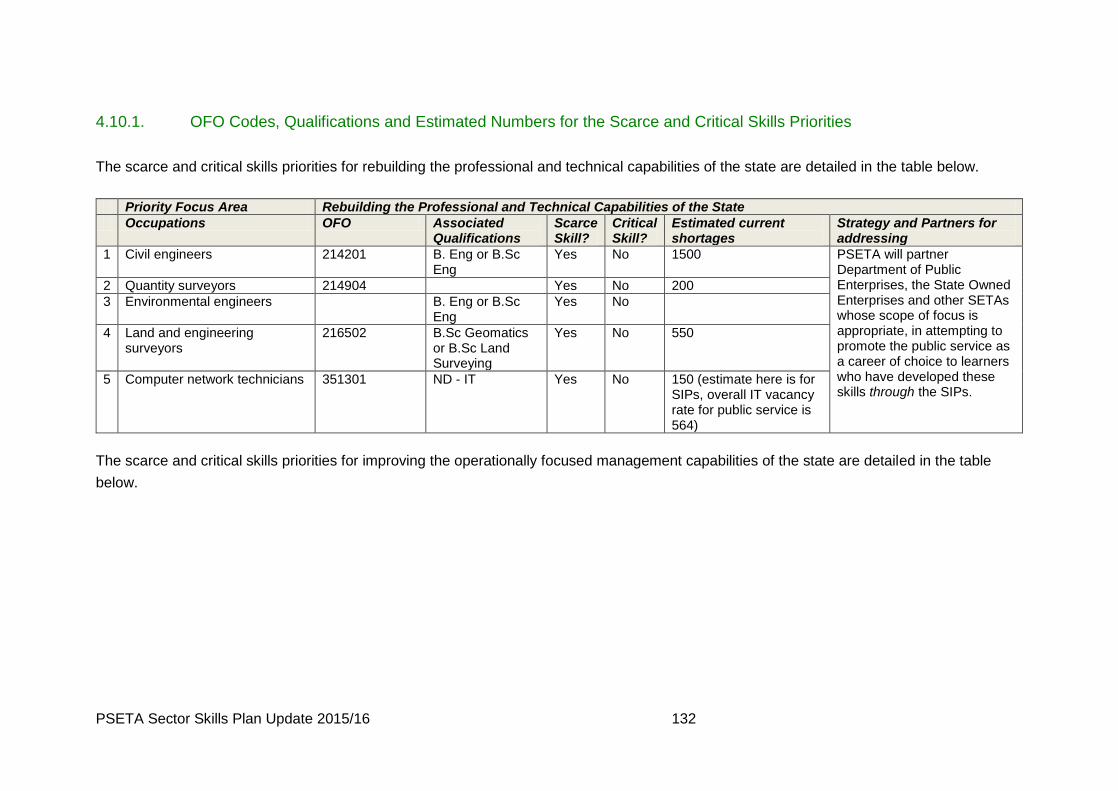
PSETA Sector Skills Plan Update 2015/16 132
4.10.1. OFO Codes, Qualifications and Estimated Numbers for the Scarce and Critical Skills Priorities
The scarce and critical skills priorities for rebuilding the professional and technical capabilities of the state are detailed in the table below.
Priority Focus Area Rebuilding the Professional and Technical Capabilities of the State
Occupations OFO Associated Qualifications
Scarce Skill?
Critical Skill?
Estimated current shortages
Strategy and Partners for addressing
1 Civil engineers 214201 B. Eng or B.Sc Eng
Yes No 1500 PSETA will partner Department of Public Enterprises, the State Owned Enterprises and other SETAs whose scope of focus is appropriate, in attempting to promote the public service as a career of choice to learners who have developed these skills through the SIPs.
2 Quantity surveyors 214904 Yes No 200
3 Environmental engineers B. Eng or B.Sc Eng
Yes No
4 Land and engineering surveyors
216502 B.Sc Geomatics or B.Sc Land Surveying
Yes No 550
5 Computer network technicians 351301 ND - IT Yes No 150 (estimate here is for SIPs, overall IT vacancy rate for public service is 564)
The scarce and critical skills priorities for improving the operationally focused management capabilities of the state are detailed in the table
below.

PSETA Sector Skills Plan Update 2015/16 133
Priority Focus Area Building Operationally Focused Management Capabilities in the State
Occupations OFO Associated Qualifications
Scarce Skill?
Critical Skill?
Estimated current shortages
Partners for addressing
1 Infrastructure Delivery Management System specialists
None Yes Yes To be finalised during project. Estimate of 104 national and provincial departments with minimum of 2 staff per department = 208.
PSETA will partner DHET, DPSA and National Treasury in training personnel managing the SIPs with IDMS training through UP
2 Project and programme managers
121905 B.Sc Construction Hons
Yes Yes 350
3 Environmental managers 134901 B. Sc Env Science
Yes No 150 PSETA will partner the Department of Environmental Affairs and the National Environmental Skills Forum Bridging into Work programme to support the development and recruitment of environmental managers through public service internships
4 Quality systems manager 121908 B. Tech Quality Management or other relevant management qualifications
Yes No 100 PSETA will partner with SSETA and relevant professional bodies
5 Basic computer skills (excel) No Yes 54 534 PSETA aims to partner the National School of Government, various State Academies and the other Government SETAs in rolling out these generic skills through e-learning or blended learning
5 Work output planning No Yes 48 255
6 Chairing meetings No Yes 66 690
7 Minute-taking No Yes 32 919
8 Document management No Yes 55 676
The scarce and critical skills priorities for improving the procurement and SCM capabilities of the state are detailed in the table below. Please
note that critical skills needs for SCM are also available in some detail, but these have not been provided here because the system is under

PSETA Sector Skills Plan Update 2015/16 134
review.
Priority Focus Area Improving procurement and SCM capabilities of the state
Occupations OFO Associated Qualifications
Scarce Skill?
Critical Skill?
Estimated current shortages
Partners for addressing
1 Contract managers 121904 Under review Yes Yes 100 5PSETA will partner with the National Treasury, DPSA, CIMA and the OPSC project aiming to build the state’s financial management capabilities
2 Procurement officers 332302 Under review No Yes
3 Supply Chain Practitioner 333905 Under review Yes Yes
4 Cost and management accountants 241101 Under review Yes No 100
5 Physical Asset Manager 121903
6 Physical Asset Practitioner 333911
7 Property Portfolio and Asset Manager 333907
The scarce and critical skills priorities for building the demand-side, supply side and bridging into work capabilities of the state skills
development system are detailed in the table below.
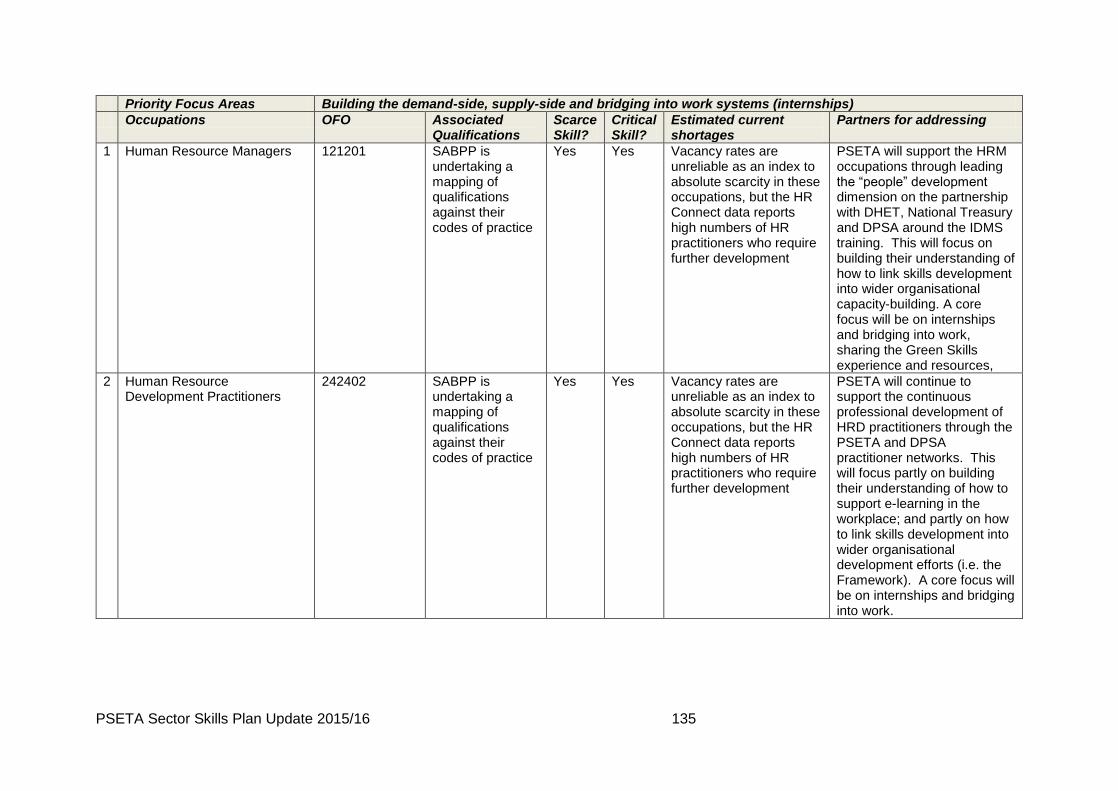
PSETA Sector Skills Plan Update 2015/16 135
Priority Focus Areas Building the demand-side, supply-side and bridging into work systems (internships)
Occupations OFO Associated Qualifications
Scarce Skill?
Critical Skill?
Estimated current shortages
Partners for addressing
1 Human Resource Managers 121201 SABPP is undertaking a mapping of qualifications against their codes of practice
Yes Yes Vacancy rates are unreliable as an index to absolute scarcity in these occupations, but the HR Connect data reports high numbers of HR practitioners who require further development
PSETA will support the HRM occupations through leading the “people” development dimension on the partnership with DHET, National Treasury and DPSA around the IDMS training. This will focus on building their understanding of how to link skills development into wider organisational capacity-building. A core focus will be on internships and bridging into work, sharing the Green Skills experience and resources,
2 Human Resource Development Practitioners
242402 SABPP is undertaking a mapping of qualifications against their codes of practice
Yes Yes Vacancy rates are unreliable as an index to absolute scarcity in these occupations, but the HR Connect data reports high numbers of HR practitioners who require further development
PSETA will continue to support the continuous professional development of HRD practitioners through the PSETA and DPSA practitioner networks. This will focus partly on building their understanding of how to support e-learning in the workplace; and partly on how to link skills development into wider organisational development efforts (i.e. the Framework). A core focus will be on internships and bridging into work.

PSETA Sector Skills Plan Update 2015/16 136
3 Training and Development Specialists
242401 No Yes PSETA support for the development of training and development practitioners in the National School of Government and the state academies will focus on building e-learning programme design capabilities.

PSETA Sector Skills Plan Update 2015/16 137
Chapter Five:
Sector Skills Strategy for the Public Service
5.1. Introduction
The SSP has provided a framework for identifying priority skills in the public service based on
an understanding of the specific historical context of the South African public service. Demand
analysis outlined the importance of focusing on skills and competencies that have been most
essential to developing organisations, as apposed simply to developing individual skills.
Supply side analysis emphasised the importance of training approaches that attend to training
in an organisational setting.
Further PSETA’s considerations shaping the formulation of PSETA’s strategic objectives and
subsequent planning approaches include the following important developments in the policy
and governance area:
1. The White Paper on Post-School Education and Training.
2. National Development Plan Imperatives.
3. Transforming the public service into a “learning organisation”; with the public service
transformed into an active training space.
4. Skills development interventions need to be monitored and measured for impact.
5. New funding model for PSETA.
6. The HRD Council Skills Review of the current skills development system.
5.2. Strategic and policy environment
This SSP Update has highlighted a number of changes in the skills development landscape
with relevance for PSETA’s work and mandate, some of which have already been outlined
above. These include:
5.2.1. The White Paper on Post-School Education and Training
The policy directive to open up the public sector as a training space for learners in technical
and vocational training and for unemployed graduates as outlined in the White Paper, requires
SETAs to have a strong Work Integrated Learning (WIL) programmes to enable learners to
acquire the relevant work experience as a prerequisite to acquiring their qualifications,
particularly TVET learners. The PSETA has established a strategic to “open up the Public
Service as a Training Space” and will continue with more efforts to bridge education and work
through identifying workplaces for practical work experience. Workplace learning will be an
integral part of qualification and programmes.

PSETA Sector Skills Plan Update 2015/16 138
5.2.2. National Development Plan Imperatives: Transforming the Public Service into
a “learning space”
The National Development Plan (NDP) – Vision 2030 emphasize that in order for South Africa
to eliminate poverty and reduce inequality, PSETA need a different approach to tackle this
challenge. NDP calls for building a ‘capable state’- underpinned by “effectively coordinated
state institutions with skilled public servants who are committed to good and capable of
delivering consistently high-quality services, while prioritising the national developmental
objectives” (NDP, 2012). The PSETA SSP Update has considered the nine outcomes outlined
in the National Development Plan to “Building a capable state” – relevant outcomes from the
NDP for the public service, namely:
1. A stable political-administrative interface.
2. A public service which is a career of choice.
3. Sufficient technical and specialist professional skills.
4. Efficient and effective management and operations systems.
5. Procurement systems that deliver value for money.
6. Strengthened delegation, accountability and oversight.
7. Improved inter-departmental coordination.
8. Reduced corruption in the public service.
Subsequently, the DPSA reviewed its approach towards developing a public service cadre
whose attitude, orientation and skills will best serve the developmental agenda of the State.
Having recognised that Vision 2030 implores role players to "make the public service and local
government “employers of choice" and "initiating a formalised graduate recruitment scheme
to attract talented graduates into government"; the response to this call has been swift. The
DPSA has sought to “professionalise” the public service, through the Compulsory Induction
Programme, and promoting full occupational qualifications within the sector to ensure that all
new entrants and serving employees have the requisite skills to deliver of public services.
5.2.3. Skills development interventions need to be monitored and measured for
impact
One of PSETA’s mandates is to monitor, measure and analyse the impact of the skills
development interventions within public service. PSETA has to ensure it develops, together
with DPSA instruments and systems to monitor and analyse the impact of skills development
in the sector. This also features as an important priority for the PSSC where all stakeholders
will be consulted on the skills performance measurement model.
The National Skills Development Strategy III places much emphasis on the need for the skills
development system to prioritize and increase its focus and attention on the production of
PSETA Sector Skills Plan Update 2015/16 139
skills for rural development to support government’s prioritization of rural development as part
of the rural development strategy.
The PSETA has identified the need to enter into strategic partnerships with various
Municipalities and TVETs in line with the NSDS III principle of supporting economic growth for
employment creation and poverty eradication in particular in rural areas.
The PSETA therefore continues focusing on the rural, economically underdeveloped areas for
the purposes of impact and measurability in stimulating youth development and increased
employment.
5.2.4. Funding model of PSETA
The National Treasury has issued a circular to national government departments to effect
transfer payments of 30% of the 1% of payroll to PSETA, on the 10 July 2014. Although the
effect of the circular means that the majority of the training budget will still remain with the
departments. This implies that the PSETA is still largely mandated to guide the sector on how
best to utilise their training budgets. The PSETA is now hopeful that the levies from
government departments will stream in for 2015/16.
5.2.5. HRDC Skills Review of the current skills development system
The HRD Council established a task (Skills System Review Technical Task Team – SSR-TTT)
in June 2011 to conduct a review of the current skills development system in order to ascertain
whether the sectoral model for delivering skills is still the best model for the country.
It proposes a new vision for the skills system –“An inclusive and integrated skills system that
is responsive to the needs of the economy and society, now and in the future”.
The SSR-TTT explored various international models and proposes a hybrid model that is
flexible and responsive to the skills systems. The proposed model re-iterates the centralised
body alluded to in the White Paper, with centralised skills planning, funding, governance,
stakeholder engagement, quality assurance and a number of shared services such as
corporate services. The work of the task team was presented to the HRD Council and to
stakeholders at the HRD Council Summit on 3rd and 4th March 2014. SETAs echoed their
dissatisfaction around the poor consultation with themselves.
The next phase of the project is the development of a business case for proposed hybrid
model, and an implementation plan that will set out the process from moving from the current
system to the envisaged system.
DHET is yet to inform SETAs of the implementation plan, and whether the SETA Landscape

PSETA Sector Skills Plan Update 2015/16 140
will change as of 1 April 2016, with the new hybrid model as proposed by the SSR-TTT.
5.3. A strategic approach
Over the last few years PSETA has substantially improved skills planning, including improved
use of statistical data, triangulation with qualitative studies. The SSP Updates in 2012/13 and
2014/15 identified the “size and shape” of the skills development problem. This is critical in
understanding the public service sector’s needs in terms of how many people need skills
development? What resources are available, and what are the financial parameters informing
delivery scenarios?
Growth demand and replacement demand estimates – when added together – suggest that
the bulk of people employed by the state in 10 years’ time are still in the skills pipeline. One
component required in any successful strategy to build a skilled and capable state should
therefore focus on the skills pipeline (the schools, TVETs and HEIs).
The DPSA internships policy is then the key bridging mechanism between the pipeline and
public sector workplaces. Staff turnover in the current SSP update stands at 8% and at 16%
for the SMS (Persal data, June 2014) though these figures are likely an undercount; and the
internships policy requires departments to take in at least 5% of their staffing complement as
interns, aimed at addressing replacement demand. This percentage on turnover rates in
public service highlight the importance of retention, recruitment strategy and succession
planning. The National Planning Commission has further highlighted the need for far greater
attention to succession planning and career development (NPC, 2012).
Building a more skilled and capable workforce therefore requires partnerships between
PSETA, departments themselves and the skills pipeline. The PSSC process brought these
constituencies into a dialogue, and PSETA proposes to take this dialogue forward. Work will
include reviewing the TVETS and HEIs qualifications against the relevant OFOs; dialogue with
the HEIs and TVETs around curriculum changes; supporting departments in planning for more
strategic selection, placement and absorption of interns; and improving Work Integrated

PSETA Sector Skills Plan Update 2015/16 141
Learning (WIL).
The SSP Update of 2014/15 and this year’s SSP have focused on refining a robust framework
for identifying priority skills in the context of a sector that has vacancies and skills gaps across
a wide range of areas. What categories of skills development? Which are the priorities? These
questions are central to understanding what the PSETA needs to do; how to do it; and what
the necessary partnerships should be.
Based on the demand side data presented above, significant state policies, and the analysis
from Chapter One on the drivers of organisational performance in the Public Sector, areas of
priority support for PSETA are:
1. Skills development initiatives that support organisational development and the
development of capacity in the skills system itself (such as HR and HRD).
2. PSETA has an important role to play however in developing management skill
and supporting the development of professionals and technical skills through
support to SIPs.
Fundamentally, the evidence presented in Chapter One and Two above suggests that
PSETA’s focus over the medium term should be on building capacity in those skills sets which
are most directly linked to stabilising and improving the way in which organisations are
managed and routine work is performed on a daily basis.
Our finding is that there are known “absolute” scarcities in “professionals and managers”,
“administrative office workers”, These two categories remain as being part of PSETA’s priority
focus. (P.43 SSP 2015-2016). With regards to managers, the primary challenge is to improve
the management skills of those already in the public service.
A key issue emerging from the analysis of the shortages is that the scarce skills challenges
faced by the state have many inter-related causes. The strategies required to address
these will require a combination of supply-side and demand-side capacity-building
efforts.
Very many of the identified needs can be addressed through training, and can be cost-
effectively delivered through e-learning which is one of the priority focus area that came out
of the current SSP update. This applies to knowledge and generic skills in particular. The
DHA “Coaching Kiosk” model demonstrates another cost-effective alternative, with probably
much bigger impact on organizational performance orientation. PSETA plans to move to scale
on such interventions as quickly as possible.
Task proficiency (procedural knowledge) is more complex, since procedure is often
workplace-specific and depends on workplace policies and procedures. Recent successes

PSETA Sector Skills Plan Update 2015/16 142
(SARS, DHA) have involved departments building some form of business process engineering
capability to design the processes, develop the procedure manuals and train staff. Except in
highly specialized, standardized functions, task proficiency can probably not be addressed on
scale through centralized training provision. PSETA intends to build the “diagnostic capacity”
or curriculum design capacity including such process engineering capability, to support
department-level task training.
What is less adequately profiled anywhere is the affective domain (“attitudes and values”,
although educational psychology more extensively classifies this into a variety of conative
constructs). Attitudes and values cannot be trained (although long-range curricular coherence
in the educational pipeline can assist in building knowledge and awareness). Attitudes and
values are most effectively built through coaching and mentoring linked to individual
performance management; and supported by changes in workplace cultures and
organizational discourses. It may be possible for PSETA to play a role in this; but the role is
about building the “demand-side” capacity to undertake such OD/HRD interventions.
According to the draft Framework for the National Skills Development Strategy 2011/12 –
2015/16 (April, 2010), there is a recognition that sectors are different in their skills needs but
that they also share a common commitment to the national vision of an inclusive society. This
means that those that have been excluded by past discriminatory practices should be actively
embraced so that the country’s future is brighter for all. In this regard, the draft framework
identifies at least seven forms of exclusion that too often compound to create insurmountable
barriers for some. These include, race, class, gender, age, disability, HIV/Aids, and
geographical location.
In meeting the strategic objectives of the PSETA and NSDS III, PSETA has incorporated these
equity requirements in all its programmes as crosscutting objectives.
An important development in the 2015/2016 SSP Update involved conceptualising the PSETA
strategic objectives as a coherent value chain in their own right. Thus each division’s key
outcome and objectives relate to each other; and the value chain represented by PSETA
operations cumulatively leads to the goal. This goal has been formulated by integrating
outcomes 5 and 12. Each of the individual strategic objectives has then been translated into
a plan that meets the requirements for performance plans in section 5.2.
Please note however that the PSETA Strategic Objective 2 – research and innovation to
address problems that cannot be resolved through “business as usual” is detailed as an
objective, but not yet fully detailed as an operational area. This is key to developing PSETA’s
approach to the non-formal and informal training and development focus areas.

PSETA Sector Skills Plan Update 2015/16 143
5.4. Integrated approach for building the public service skills
development system
The Public Services Sector Skills Strategy developed by PSETA during 2012 has been refined
and adopted as the overall strategic framework for skills development across the whole of
government. This has been endorsed by the HRD Council, and is reflected in the diagram
immediately below. PSETA’s role in implementing this framework is detailed in this section,
based on the 2012 Colloquium.
Figure 6: The PSETA Sector Skills Strategy
PSETA Colloquium Discussion Document, 2012.
As depicted in the diagram, four themes have been used to organise the various elements of
the strategy. These are:
1. Strategic Focus One: Defining the Impact.
2. Strategic Focus Two: Building the Demand-Side Capacity.
3. Strategic Focus Three: Building the Supply-Side Capacity.
4. Strategic Focus Four: Bridging the Supply-Demand Mismatch.
5.4.1. Strategic focus one: defining the impact
All organs of state are constitutionally required to use state resources economically, efficiently,
effectively and equitably. These four criteria represent what counts as “performance” in any
domain, and also apply to skills development.
Economy is about getting the right resources, at the right time, for the best price. (For

PSETA Sector Skills Plan Update 2015/16 144
example, the PSETA SSP 2014/15 argued that the sector must find more economical
strategies for increasing the scale of skills development – such as e-learning or
coaching and mentoring. We do not have the budget to achieve our targets through
“training as usual”). With PSETA being able to receive levies form departments in
PSETA Sector Skills Plan Update 2015/16 145
2015/2016 PSETA will be in the position to have provide budget for training.
Efficiency is about using the resources to achieve the best results. (For example, data
in the PSETA SSP shows that parts of the public services sector are achieving a
completion rate of less than 30%. Skills development cannot complain about a
shortage of resources until we use existing resources more efficiently).
Effectiveness is about how well we are achieving the goals. (For example, are skills
development efforts reducing vacancy rates or improving departmental capacity to
fulfill their mandates? Anecdotal evidence suggests that many public servants apply
for bursaries to help them leave the public services sector and enter the private sector.
In such cases, skills development may well be undermining the state’s capacity).
Equity is about who is benefiting from the efforts. Equity is one dimension of the wider
impact intended.
The state has adopted a set of national outcomes against which performance should be
measured. Delivery Agreements 5 and 12 (respectively for the Minister of Higher Education
and Training, and the Minister for Public Service and Administration) are:
1. A skilled and capable workforce to support an inclusive growth path (Outcome 5)
2. An efficient, effective and development oriented public service and an empowered, fair
and inclusive citizenship (Outcome 12).
PSETA has proposed (PSETA SSP 2011) that the public services sector should integrate
Ministerial Outcomes 5 and 12 as the overall impact required of skills development in the
sector: The skilled and capable workforce required to achieve a more efficient, effective and
development-oriented public services sector. More recently, DHET has prioritised the public
service as a training space; while DPSA is focused on the professionalisation of the public
service sector. It may therefore be timely to amend the impact statement to reflect these two
goals.
Defining and measuring outcomes
As in the case of impact statements, there is no consistent, clear framework of outcome
statements for skills development in the public services sector. During 2011, PSETA began
using a “Return on Investment” framework for measuring and reporting on skills development
outcomes. As summarised in the diagram below, there are six levels of measurement for
return on investment in skills:
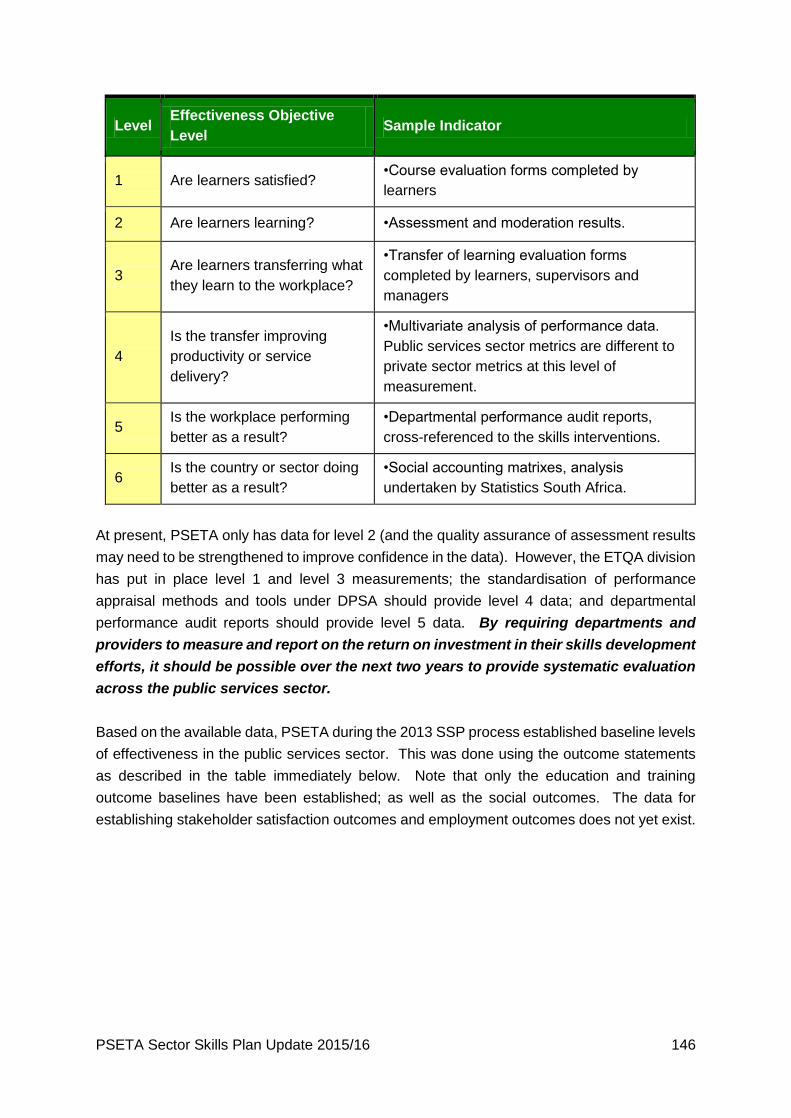
PSETA Sector Skills Plan Update 2015/16 146
Level Effectiveness Objective
Level Sample Indicator
1 Are learners satisfied? •Course evaluation forms completed by
learners
2 Are learners learning? •Assessment and moderation results.
3 Are learners transferring what
they learn to the workplace?
•Transfer of learning evaluation forms
completed by learners, supervisors and
managers
4
Is the transfer improving
productivity or service
delivery?
•Multivariate analysis of performance data.
Public services sector metrics are different to
private sector metrics at this level of
measurement.
5 Is the workplace performing
better as a result?
•Departmental performance audit reports,
cross-referenced to the skills interventions.
6 Is the country or sector doing
better as a result?
•Social accounting matrixes, analysis
undertaken by Statistics South Africa.
At present, PSETA only has data for level 2 (and the quality assurance of assessment results
may need to be strengthened to improve confidence in the data). However, the ETQA division
has put in place level 1 and level 3 measurements; the standardisation of performance
appraisal methods and tools under DPSA should provide level 4 data; and departmental
performance audit reports should provide level 5 data. By requiring departments and
providers to measure and report on the return on investment in their skills development
efforts, it should be possible over the next two years to provide systematic evaluation
across the public services sector.
Based on the available data, PSETA during the 2013 SSP process established baseline levels
of effectiveness in the public services sector. This was done using the outcome statements
as described in the table immediately below. Note that only the education and training
outcome baselines have been established; as well as the social outcomes. The data for
establishing stakeholder satisfaction outcomes and employment outcomes does not yet exist.

PSETA Sector Skills Plan Update 2015/16 147
Education and
training
outcomes
% correlation of enrolment figures against scarce and critical
needs of sector
% rise in achievement rates, measured by the number of learners
passing divided by those who enrolled
% rise in retention rates, measured by the number of learners
completing divided by those who enrolled
Stakeholder
Satisfaction
Outcomes
% learner satisfaction, measured against standardized course
evaluation ratings
% employer satisfaction, measured against standardized employer
feedback ratings
Employment
Outcomes
% of unemployed learners in jobs 6 months after training
% transfer of learning to the workplace, measured against
standardized transfer of learning ratings
Social Outcomes
% contribution to sector employment equity objectives
(applicable to all providers for reporting, but only to SETA-funded
provision as measurement)
Note that PSETA has used the above framework of outcome statements in the absence
of any sector-wide agreement on outcomes for skills development. The first task is to
agree the impact statements. Thereafter it becomes a priority that the outcome
statements be aligned to the impact statements; consultation around the framework
take place; and that the criteria, systems and tools be integrated into the core business
processes for skills development at all levels of the sector. The tasks are described
immediately below.
The above frameworks are generic in nature. A further priority is linking these generic skills
development outcomes to department-specific policy objectives (as described in the legal
mandate of each department). This link is important if the state is to measure how well skills
development (across sectors) is supporting wider state policies and strategies; and will equip
departments to better govern their “line” SETAs.
Proposed Strategies for Defining and Implementing Performance Based Skills
Development in the Public Services Sector
PSETA proposes to put the above in place in the sector through four main strategies:
First, the impact statements should be defined and agreed in a process between
PSETA stakeholders, DPSA and DHET.
Second, the outcome statements should be defined and agreed with sector

PSETA Sector Skills Plan Update 2015/16 148
stakeholders. This includes linking the outcome statements to NSDS3 requirements
and the Public Service HRD strategy; as well as integrating the outcomes with
department-specific policy objectives.
The framework should be integrated into the systems, tools and processes for the core
business of skills development at all levels. This includes the WSPs/ATRs; provider
accreditation processes; and service provider contracts. The system should be piloted
in a developmental way, mobilising and educating the sector in the process.
Departments and providers should begin reporting to PSETA against the framework.
This should form the basis of Skills Development Scorecards for departments and
providers, along the lines of the Blue Drop Reports in the water sector.
5.4.2. Strategic Focus Two: Building the Demand-Side Capacity
The national skills development strategy aimed to shift from a supply-driven system to a
demand-led system; yet the public services sector still has significant weaknesses in the
demand-side capacity to lead such efforts. The vision of workplaces as sites of learning was
crucial to this vision, and has been reaffirmed in the Minister for Higher Education and
Training’s goal of “the public services sector as a training space”, and in the DHET focus on
work-integrated learning. Again, these require demand-side capacities that need to be
strengthened. Finally, the Minister of Public Service and Administration’s goal of
“professionalising” the public service cannot be achieved through supply-side mechanisms
(“training courses”) in isolation. It will require transforming workplaces into sites of learning;
transforming workplace cultures; integrating coaching and mentoring with individual
performance management; and efforts to inspire the hearts and the minds of public servants
themselves. All the above points to the need for concerted, coordinated strategies for building
demand-side capacities. PSETA proposes a set of such interventions below.
Proposed Strategies for Building Demand-Side Capacity
PSETA proposes the following strategies for building demand-side capacity:
First, there is still a need for greater coordination and improvement generally of current skills
planning mechanisms. There is also a need for clarity on the role of SETAs in relation to plans
to centralise skills planning. PSETA has raised concerns about the WSP/ ATR data and its
use for skills planning. Over the last two years (see pervious SSP and this year’s update)
PSETA has developed a methodology for identifying priority skills based on the triangulation
of a range of data that is then analyzed within a broader understanding of the drivers of
organisational performance in the public sector. Further, PSETA has developed a set of
recommendations for adapting the WSP / ATR templates to improve their reliability for use in
skills planning. PSETA has also developed recommendations for improving Persal data.
These recommendations for improving Persal are relevant whether PSETA is undertaking the
skills data analysis, or whether the skills analysis is undertaken centrally (though for example,

PSETA Sector Skills Plan Update 2015/16 149
LMIP).
Once priority skills have been identified, further analysis is needed to provide in-depth
understanding of the reasons for skills challenges in these occupations. PSETA has already
started the process of undertaking qualitative research and stakeholder engagement with
relevant government departments on the priority skills identified. Further, PSETA will establish
and lead task teams (consisting of employers facing the need and providers supplying the
skills), for each priority skill agreed. These task teams will investigate the causes and explore
the range of possible responses in recommending interventions required.
The above should integrate and improve the systems, processes and tools; and should
provide much better understanding of the skills needs as well as the appropriate responses.
At this point PSETA proposes to concentrate its efforts on building departmental and provider
capacity to play roles required of them and further debate the priority skills needs.
For the purposes of improving WSP and other skills development reporting, the SDF training
has been formalised and rolled out to all provinces to build capacity. Therefore SDFs who are
found competent should be held accountable for submission of complete WSPs. Ideally, HRM
professionals should be trained and held accountable for effective recruitment and selection
of staff, measured against the performance metrics of staff appointed. HRD professionals and
supervisors should be trained, assessed and held accountable for the efficiency of training,
measured against pass rates and transfer of learning to the workplace. Skills development
personnel should be held accountable for their performance; and the performance metrics
proposed are a mechanism for doing so. These are long-term goals – the quality of data in the
WSP and ATRs reflects a wider issue of the need for greater professionalisation of the HR
and HRD function. PSETA has identified HR and HRD as a priority skill – and specific
recommendations in this regard were made in Chapter 4, with PSETA’s role outlined below
(see ‘Strategy for delivering on priority skills areas).
Better skills planning should give rise to appropriate interventions for establishing the public
service as a training space, and professionalising the public service. These may require policy
instruments from DPSA; and PSETA may also be able to help workplaces to put sound
workplace policies and procedures in place for coaching and mentoring; recognition of prior
learning; internships; and other forms of work-integrated learning. As proposed in Chapter 3
and 4 – the capacity of departments to act as a training space is uneven and this capacity
should be build in departments overtime, rather than expecting all departments to be able to
take on and appropriately train the same number of learners.
A number of departments have been doing outstanding quality work in relation to each of the
workplace interventions required. Home Affairs has in place a coaching and mentoring
programme; the local government sector is busy with an RPL capacity-building programme;
etc. PSETA proposes to build on the existing experience and resources by showcasing “good

PSETA Sector Skills Plan Update 2015/16 150
practices”, through a variety of strategies that make these more widely available. Sharing
good practices should substantially improve the “economy” of skills development in the sector.
PSETA will develop a partnership with LGSETA in sharing the lessons and resources around
Recognition of Prior Learning (RPL); and with the SANBI project to build sector experience
and capacity around work-integrated learning (WIL). The targets and budgets for these and
all other projects will be established through the consultative process with departments
themselves.
5.4.3. Strategic Focus Three: Building the Supply-Side Capacity
The PSETA 2013/14 SSP demonstrated a number of key strengths and weaknesses in the
public service supply-side capacity. These include:
The platforms for education and training provision (as reflected in the employment
classification systems and associated qualifications) have been strikingly fragmented.
There has been rapid growth in the public provider system, through the provincial and
sectoral academies and the transformed PALAMA that is now National School of
Government. There have also been rapidly developing partnerships between these
providers and the higher education institutions (HEIs) and further education and
training (FET) colleges. The public provider system is evolving as a more coherent,
functionally inter-dependent system therefore, although much remains to be done
regarding how the various roleplayers relate to each other.
The HEIs and TVETs are remarkably efficient providers, but not always very effective;
while the other public providers are much more effective but not as efficient.
There are serious (educational, regional and preference) mismatches between supply-
side outputs and demand-side needs. These are reflected in the pool of unemployed
graduates while the state is experiencing extremely high vacancy rates and looming
skills shortages. The pipelines from the supply-side into the sector are also weak.
Key Strategies for Building the Public Service Supply-Side Capacity
PSETA proposes the following strategies for building the public service supply-side capacity:
PSETA initiated a Public Service Qualifications Framework during 2012. This included
rationalising 41 000 public service job titles into about 250 OFOs. By focusing qualifications
design on the OFOs, PSETA will significantly improve the efficiency of supply-side training.
The priority qualifications for 2014 include those qualifications linked to the Compulsory
Induction Programs. Others in 2014 and subsequent years will focus on the priority scarce
and critical skills, thereby establishing the supply-side platforms for provision.
There is a strong emphasis from DHET on building the public provider system. This includes
continuing to build PALAMA as the School of Government; the provincial academies as key
delivery agents; the sectoral academies; as well as partnerships with the HEI and FET provider

PSETA Sector Skills Plan Update 2015/16 151
systems. PSETA proposes to work with these providers, promoting and facilitating the
partnerships needed to address the priority scarce and critical needs of the sector. The DIRCO
model provides an excellent example of how public provider systems can be built through
such partnerships; and PSETA proposes to “mainstream” the experiences learned through

PSETA Sector Skills Plan Update 2015/16 152
the DIRCO model.
Recent research demonstrates that the public FET system and the public HEI system have
remarkably inefficient pass rates. These provider systems are therefore quite inefficient; but
further problems lie in how effective they are (the educational/qualification “mismatches”
described below). PSETA proposes to address these mismatches through the projects
described. The SSP also demonstrates that the PSETA-accredited providers achieve much
lower pass rates: public servants attend programs, but do not complete their assignments or
sit their exams. PSETA therefore proposes to focus on improving the efficiency and
effectiveness of the provider system, improving learner enrolment, retention and achievement
rates. PSETA also has MoUs with specific FETs and HEIs (as detailed in the Annual
Performance Plan); and will be establishing others for purposes of implementing the projects
described above (in particular, those required to build the capacity for SIPs and the
Compulsory Induction Programs.
The project of professionalising the public service – captured in the Compulsory Induction
Programme and associated interventions – is the central organising focus for the above
efforts. PSETA proposes to work in partnerships with National School of Government (NSG)
and the public provider system to improve sectoral platforms, capacity and throughput rates
in support of this goal. PSETA’s efforts to build the demand-side will also support the supply-
side interventions through ensuring there is “transfer of learning” into the workplace.
5.4.4. Strategic Focus Four: Bridging Supply-Demand Mismatches
The question is often asked how it is possible that the public service should be sitting with high
vacancy rates in a context of unemployed graduates. PSETA suggests that the answer lies
in at least two factors:
First, there are a variety of mismatches between supply and demand. These include
education and qualification mismatches: the complaint that providers are not producing
graduates who are “work-ready”, or do not have the skills required for the job. There are also
regional mismatches: graduates may be needed in provinces or areas where they are not
prepared to work because their spouses or children are in another province or area. And there
are preference mismatches: young people may enter programs of study that they have no
intention of working in, simply because it is the only study option available to them. In addition,
vacancies can relate to inappropriate organisational design and structure (how work inside the
organisation is allocated) – this in turn can be related to weaknesses in the HR function.
Second, neither providers nor employers are managing the supply-demand mismatches well.
There are a variety of issues underpinning why departments often fail to fill vacancies. To the
extent that these are because of educational mismatches, however, PSETA proposes to start
from the reality that these mismatches exist; and to put in place strategies for bridging the

PSETA Sector Skills Plan Update 2015/16 153
mismatches. At the same time, PSETA proposes to increase efforts to close the supply-
demand mismatches through bringing employers and providers into a dialogue around the
priority needs of the sector through stakeholder engagement workshops and seminar, as
described earlier in this document.
Proposed Strategies for Bridging the Public Service Supply-Demand Mismatch
PSETA proposes at least three sets of strategies for bridging supply-demand mismatch in the
public services sector:
PSETA understands a “demand-led” skills pipeline for current employees as starting in the
workplace (where the needs are identified and employees are prepared for training); shifting
to the provider (where training should be relevant to the workplace, with opportunities to plan
transfer); and shifting back to the workplace (where opportunities for applying the learning
must be provided and supported). This value chain is currently fragmented; and PSETA
proposes to integrate it through the demand-side and supply-side capacity-building
interventions described above. These efforts should promote transfer of learning, and are
central to the goal of professionalising the public service.
For new labour market entrants, PSETA will identify the mismatches; provide training and
experience through an incubator model to ensure participants are “work-ready” through CIP
programme; and place and support the participants into available workplaces. The project will
heighten awareness of the mismatches and build capacity amongst providers and workplaces
to close the gaps. As such, the project should build significant understanding and resources
as to how the existing mismatches can be bridged. PSETA proposes to work with DPSA to
ensure the project is a success; and to “mainstream” the experience and project resources to
assist other parts of the sector in addressing mismatches.
As described earlier, PSETA has identified the priority skills needs in the public service.
PSETA now proposes to bring employers and providers into a dialogue about the causes of
these needs and the appropriate responses. These projects will begin to address the causes
of the mismatches, amongst other factors.

PSETA Sector Skills Plan Update 2015/16 154
5.5. Strategies for Delivering the Priority Skills area
The PSETA management workshop and seminar held in July 2014 further explored some
elements of the strategy, focusing on the priority skills identified in Chapter Four.
PSETA, as the Sector Authority is expected to influence the development of the new HRDSF
and ensure the Framework responds to the Sector Skills Plan, focus areas and identified
priority skills, which are:
1. Supporting the development of professional and technical skills through SIPs.
2. Improving SCM skills, including contract management.
3. Support to the development of operationally inclined managers.
4. Supporting the delivery of training on generic skills (computer training, administrative,
data analysis capacity and so on).
5. HRD support and professionalization.
6. Improving capacity to delivery training through e-learning.
7. Building capacity in the area of “Bridging to Work” by drawing on innovations in the
Green Skills sector.
These priority skills, has been validated by PSETA stakeholders through the SSP
consultation processes, and will form the basis of the PSETA Strategy and sector
interventions for the next 5 years.
5.5.1. PSETA Strategy for Developing the Professional and Technical Skills through
PSETA Sector Skills Plan Update 2015/16 155
SIPs
PSETA management agreed that:
PSETA will explore a partnership with the Department of Public Enterprises in 2015, to
find mechanisms through which the State Owned Enterprises can support the process of
rebuilding the professional and technical capabilities of the state.
In terms of support to the IDMS: In the case of many of the technical and professional
occupations implicated in SIPS, the responsibility of supporting increased supply of
personnel lies primarily with other SETAs (the Manufacturing, Engineering and Related
Services SETA and CETA for example). PSETA will explore working with the professional
associations, through the SIPs, to strengthen the role they play in developing professionals
for the public service.
PSETA is already driving the development of technical skills through the G-SETA forum
on artisan development, in partnership with Indlela. This strategy is proving successful,
and should continue.
For purposes of this SSP, PSETA collaborated with the DHET’s Special Projects Division,
National Treasury, the State Information Technology Agency and DPSA in developing a
Plan for the Roll Out of the Skills Development Dimension of the Infrastructure Delivery
Management System (IDMS) across All Three Spheres of Government (PSETA 2014).
The Plan is formulated within the Capacity Building Framework; and indicates how PSETA
will collaborate with key stakeholders in building the IDMS management competencies
and professional and technical skills.
PSETA is exploring a set of partnerships (not yet finalised) for taking forward further
support to the sector. The elements of the strategy are:
o To partner with Department of Public Enterprises, in negotiating with the State Owned
Enterprises to incubate the professional and technical skills required.
o As the professionals and technicians develop the required work experience, to partner
with DIRCO in establishing EU-SA dialogues through which the best infrastructure
planning employees in EU countries (e.g. Poland for rail infrastructure) have sustained
dialogues with their SA counterparts.
o This may be followed by programmes of study or study tours, already taking place
under the DHET Special Projects Unit.
o Professional bodies will be asked to support on the job coaching and mentoring for the
young professionals and technicians.
This would be a multi-year project aimed at incubating the professional and technical skills.
In the process, PSETA would promote the public service as a career of choice to the
learners involved in these programmes and dialogues.

PSETA Sector Skills Plan Update 2015/16 156
PSETA will also continue engaging actively with the DHET Occupational Task Teams in
2015. The goal will be to actively recruit the skills produced through the SIPs into the
public service. This supports the DPSA objective of promoting the public service as a
Career of Choice.
5.5.2. PSETA Strategy for Developing the SCM Skills
PSETA management agreed the following strategies for building the SCM capacity of the
state:
PSETA will review the SCM qualifications during 2014, to ensure that they reflect the new
sets of competencies suggested for SCM practitioners under the Chief Procurement
Officer.
PSETA will also engage with Treasury, on the interventions required to build such skills.
PSETA will collaborate with DPSA, Treasury and DHET on the training required to support
SIPs. This will focus on IDMS, now agreed as the SCM model for procurement and
management of the SIPs.
The OCPO has noted that improved HR and HRD capacity is vital for a more effective
procurement system, and have noted that PSETA can play a role in ‘advocating for HRD
in the public sector’. This is included as part of PSETA’s focus (see PSETA Strategy for
building HRM and HRD’ below).
5.5.3. PSETA Strategy for Developing the Management Skills
SIPs have identified a number of management occupations that require specific attention for
purposes of the SIPs. PSETA conducted the foundational work on understanding the nature
of the needs; and is a member of the current management Occupational Task Teams under
the DHET. These include:
project managers and programme managers
contract managers and supply chain managers
financial managers
In addition, in general (i.e. not only relating to the management areas above) skills
development initiatives need to focus on building administrative and operational capacity.
Three broad strategies for taking forward the development of operationally focused
management competencies have been agreed by stakeholders, and are under discussion

PSETA Sector Skills Plan Update 2015/16 157
with relevant partners who can assist in taking them forward.
First, the IDMS training discussed above will aim to strengthen operationally focused
project management skills, concentrated on the infrastructure projects.
Second, discussion with Department of Home Affairs has focused on whether it is
possible for DHA to share the lessons and resources in improving operationally focused
management skills with other departments. This may take place through a variety of
informal and non-formal interventions, including compiling a set of DHA resources onto a
CD and sharing them; “study tours” by other departments to DHA; and/or a workshop at
which DHA shares its approach and resources with other departments at senior
management level.
Third, the e-learning strategy proposed below may concentrate on the procedural
competencies required to improve business processes within organizations, through a
focus on how to design policies and procedures – a basic process engineering skill.
Fourth, the provision of generic skills through e-learning (see section on generic skills
below) aims to improve the administrative capabilities of the managers, amongst others.
5.5.4. PSETA Strategy for Developing Generic Skills
The specific generic skills suggested as priorities in this chapter are those related to
improving operationally focused management, as per the Capacity Development
Framework focus.
As noted in Chapter 4, the PSETA Stakeholder Workshop on Priority Skills agreed that it
would be helpful to partner other Government SETAs who are also interested in
exploring e-learning, in this project. These initiatives should be undertaken in a way that
builds the capacity of the supply-side to undertake e-learning on a larger scale.
For purposes of this SSP PSETA consulted with the State Academies Forum and with
three state academies separately. All have indicated a willingness to share their existing
programs that may be of wider value (for example, the DIRCO programme on writing a
submission; Stats Academy programs on basic statistical analysis; and Justice Academy
programs on the Act for Promotion of Administrative Justice).PSETA also consulted with
some of the other Government SETAs who have previously expressed an interest in
collaborating on the project. Finally, PSETA consulted with the e-learning division in the
National School of Government, including consultation on how to quality assure e-
learning better.
PSETA will take these discussion further over the next year. (See the ‘Strategy for

PSETA Sector Skills Plan Update 2015/16 158
developing e-learning skills below).
5.5.5. PSETA Strategy for Developing the HRM and HRD Skills
PSETA management agreed the following strategy in relation to HRM and HRD skills for the
public service in 2014/15:
PSETA will partner with the HRD Chief Directorate in DPSA and) and the National School
of Government, in a project aimed at professionalising the HRM/D sector in the public
service.
This project will aim to conduct a sector-wide recognition of prior learning (RPL) of HRM/D
practitioners in the public service. This will be supported by e-learning to address the
gaps; and through a series of continuous professional development activities. The model
used to professionalise HRM/D practitioners will follow the models used to professionalise
estate agents and insurance brokers in recent years.
The project will aim to achieve several goals simultaneously. First, it will aim to provide
relevant formal qualifications to practitioners. Second, it will give them a direct personal
experience both of RPL and of the professionalization agenda. This in turn will equip them
to better undertake such interventions themselves. Third, the project will bring HRM/D
under professional regulation, with a code of practice and standards of practice that are
legally regulated. Finally, the project will aim to improve the quality of HRM/D practices in
the South African public service.
5.5.6. PSETA Strategy for supporting ‘Bridging to Work’ – learning from the Green
Skills Sector
The PSETA workshop with stakeholders in 2014 agreed that improving efforts to bridge
unemployed people into work through internships should be a priority; and that in the
process PSETA should partner with organizations who have already developed resources
and expertise such as the Green Skills sector, and share these more widely across the
sector.
PSETA aims to partner with the Green Skills sector to learn lessons from the experience,
and to share these lessons and resources more widely in improving internships in the
public service.
PSETA is exploring a partnership with the Bridging into Work stream led by WWF project
(under the National Environmental Skills Planning Forum, a stakeholder body falling under
the Department of Environmental Affairs) with the intention of sharing the resources and
lessons learned more widely across the public service. The project is also in the process

PSETA Sector Skills Plan Update 2015/16 159
of developing a set of resources aimed at building mentoring capacity within organizations.
5.5.7. PSETA Strategy for Developing the e-Learning Skills
PSETA management agreed the following in relation to e-learning during 2015:
The National School of Government will begin rolling out e-learning on scale through the
public service in 2015. PSETA will review all policies and practices to ensure that quality
assurance of e-learning is aligned to best practices for the quality assurance of e-learning
and blended learning internationally.
DPSA’s draft policy on e-learning will probably be implemented during 2015. Again,
PSETA proposes to ensure that its quality assurance of how departments implement this
is aligned to best practices internationally.
5.6. Strategic Overview
5.5.8. Vision Statement
Cutting-edge skills for Quality Public Services.
PSETA management agreed the following in relation to e-learning during 2015:
5.5.9. Mission Statement
Leading in the development of skilled and competent human capital in the Public Service
Sector through:
Effective coordination of skills development interventions based on occupationally-
directed qualifications;
Focusing on learning programmes; and
Promoting learner placement and absorption within the public service sector.
5.5.10. Moto
Developing & Growing People.
5.5.11. Value Proposition

PSETA Sector Skills Plan Update 2015/16 160
Lead and coordinate building of a capable and skilled Public Service workforce.
5.5.12. Values
Honesty and Integrity
Accountability
Service Excellence
Fairness and transparency
5.5.13. Legislative and other mandates
Legislative
Skills Development Act, No. 97 of 1998, as amended aims to:
a) Develop the skills of the South African workforce to:
improve the quality of life of workers, their prospects of work and labour mobility;
improve productivity in the workplace and the competitiveness of employers;
promote self-employment; and
improve the delivery of social services;
b) Increase the levels of investment in education and training in the labour market and to
improve the return on that investment;
c) Encourage employers to:
to use the workplace as an active learning environment;
to provide employees with the opportunities to acquire new skills;
to provide opportunities for new entrants to the labour market to gain work experience;
and
to employ persons who find it difficult to be employed;
d) Encourage workers to participate in learnership and other training programmes;
e) Improve the employment prospects of persons previously disadvantaged by unfair
discrimination and to redress those disadvantages through training and education;
f) Ensure the quality of education and training in and for the workplace;
g) Assist:
work-seekers to find work;
retrenched workers to re-enter the labour market;
employers to find qualified employees; and
h) Provide and regulate employment services.
These aims are to be achieved by—
Establishing an institutional and financial framework comprising--
- the National Skills Authority;

PSETA Sector Skills Plan Update 2015/16 161
- the National Skills Fund; a skills development levy-grant scheme as
contemplated in the Skills Development Levies Act; and
- SETAs;
Encouraging partnerships between the public and private sectors of thewill economy
to provide education and training in and for the workplace; and
Co-operating with the South African Qualifications Authority and other Quality
Councils.
Skills Development Levies Act, No. 9 of 1999
It makes provision for leviable employers to pay 1% of their payroll to South African Revenue
Service (SARS):
20% will go toward a national skills fund;
80% to SETAs
10.5% will go toward SETA operating costs and QCTO (0.5%)
20% can be claimed by employers.
Remaining amounts for PIVOTAL programmes
This is what is stipulated by the Skills Development Levies Act and Grant Regulations
published in December 2012.
It is important, however, to mention that this stipulation does not apply to PSETA with
respect to the State as the Employer, as mandatory grants do not apply to the Public
Service, as government departments will retain 70% of the 1% levies, in terms of the
envisaged DPSA Directive.
National Qualification Framework Act, No. 67 of 2008
The National Qualifications Framework (NQF) seeks to:
(a) Create a single integrated national framework for learning achievements;
(b) Facilitate access to, and mobility and progression within, education, training and career
paths;
(c) Enhance the quality of education and training;
(d) Accelerate the redress of past unfair discrimination in education, training and
employment opportunities; and
(e) Contribute to the full personal development of each learner and the social and economic
development of the nation at large.
SAQA and the Quality Councils oversee the NQF to achieve the following:
a) Developing, fostering and maintaining an integrated and transparent national
framework for the recognition of learning achievements;
b) Ensuring that South African qualifications meet appropriate criteria, determined by the
Minister, and are internationally comparable; and
c) Ensuring that South African qualifications are of an acceptable quality.

PSETA Sector Skills Plan Update 2015/16 162
Policy mandates
Central to the development of the PSETA’s five year strategy is the Government’s Medium
Term Strategic Framework. This is the document that outlines government’s key strategic
priorities for economic growth and social development for the period 2009-2014, including
education and training.
The MSTF provides a guide for planning and resource allocation across all spheres of
government, including the PSETA as one of the 21 public entities charged with facilitation and
promotion of skills development in the Public Service Sector. Therefore, the centrality of skills
development which is the PSETA’s primary mandate is clearly stated in the MTSF thus,
“critically, investment in quality education for all young people and in skills development should
form the backdrop of government’s approach.
The White paper for Post – School Education and Training launched on 16 January 2014
emphasise the need for SETAs to ensure that their learning programmes are providing
adequate theoretical and practical workplace experience. The need to open up Public Service
as a training space, with a focus to ensuring vocational training learners are afforded the
relevant experiential training to enable them to finalise their studies and that government is
playing its role in addressing the national skills shortages.
The need for greater collaboration between SETAs, industry, universities, colleges and the
stakeholders on skills development initiatives. The White paper for Post – School Education
and Training also highlights the need to ensure the various sectors is training and developing
relevant and skilled workforce to support the Strategic Integrated Projects.
The NDP: The National Development Plan (NDP) calls for the building of a ‘capable state’ –
underpinned by “effectively coordinated state institutions with skilled public servants who are
committed to the public good and capable of delivering consistently high-quality services,
while prioritising the nation’s developmental objectives” (NDP, 2012).
The National HRD Strategy of South Africa (HRDSA): The HRDSA has the following
commitments which were designed to also address government’s priorities:
Overcoming the shortages in the supply of people with the priority skills needed for the
successful implementation of current strategies to achieve accelerated economic
growth.
Increasing the number of appropriately skilled people to meet the demands of current
and emerging economic and social development priorities.
Ensuring improved universal access to quality basic education and schooling (up to
Grade 12).

PSETA Sector Skills Plan Update 2015/16 163
Implementing skills development programmes that are purposefully aimed at
equipping recipients/citizens with requisite skills to overcome related scourges of
poverty and unemployment.
Ensuring that young people have access to education and training that enhances
opportunities and increases their chances of success in further vocational training and
sustainable employment.
Improve the technological and innovation capability and outcomes within the public
and private sectors to enhance South Africa’s competitiveness in the global economy
and to meet its human development priorities.
Ensuring that the public sector has the capability to meet the strategic priorities of the
South African Developmental State.
From these commitments, a process for identifying priority skills that will be needed by
practitioners to assist in the achievement of these objectives, particularly in the public service
sector, can begin. Priority skills needed in the public service as identified by PSETA are
captured in the Sector Skills Plan Update.
The revised Human Resource Development Strategy 2010 to 2030 deserves a mention, as
one of its eight areas of commitment directly relevant to the SSP update. Commitment
Seven: We will ensure that the Public Sector has the capability to meet the strategic
priorities of the South African Developmental State (HRD Strategy, 2010: 42) is
comprised of two strategic priorities accompanied by objectives and indicators. The first
priority is to improve the credibility and impact of training in the public sector by improving
service-delivery; and the second is to leverage the SETAs to contribute optimally to capacity
development in the public sector. Many of the activities listed pertain to PSETA, such as the
performance of skills audits and improvement of capacity for the planning and delivery of
training services.
The challenge in dealing with a plethora of policy frameworks is how to ensure they speak to
one another. PSETA has addressed the relationships between NSDS3 and the HRDS
systematically in the planning template used in this SSP.
Central to the PSETA’s strategic plan and annual performance plan is the National Skills
Development Strategy III and the National Skills Accord:
National Skills Development Strategy (NSDS III)
National Skills Development Strategy III aims to:
a) Improve the skills development system so as to be more responsive to labour
market needs and social equity requirements
b) Integrate workplace training and theoretical learning
c) Improve the skills level of graduates of secondary and tertiary education
d) Address skills shortages in artisanal, technical and professional fields
PSETA Sector Skills Plan Update 2015/16 164
e) Reduce the over-emphasis on NQF level 1-3 learnerships
f) Equip those in the workforce with sufficient technological skills
g) Improve co-operation between universities, further education and training colleges
and sector education and training authorities (SETA)
h) Support economic growth and development through viable skills development
i) Develop sufficient skills for rural development
National Skills Accord
The National Skills Accord was signed in July 2011 by Government and social partners to:
a) Expand the level of training using existing facilities more fully
b) Make internship and placement opportunities available within workplaces.
c) Set guidelines of ratios of trainees: artisans as well as across the technical
vocations, in order to improve the level of training
d) Improve the funding of training and the use of funds available for training and
incentives on companies to train
e) Set annual targets for training in state-owned enterprises
f) Improve SETA governance and financial management as well as stakeholder
involvement
g) Align training to the New Growth Path and improve Sector Skills Plans
h) Improve the role and performance of FET Colleges
The DPSA’s Strategic Plan 2010-2014
The PSETA works very closely with the DPSA in driving skills development and capacity
building that is aimed towards improving the performance, productivity, quality and cost-
effectiveness of the public service. The DPSA is responsible for the organisation and
administration of the public service, the regulation of the conditions of employment, terms of
office, discipline, retirement and discharge of members of the public service.
In order to deliver on its mandate, the DPSA has developed a Strategic Plan that is informed
by the strategic priorities of government which are translated into the Medium-term Strategic
Framework (MTSF). The Strategic Plan is located within the context of the government's
adoption of the new outcomes-based performance approach. This approach enables
government departments to outline clear and measurable outputs that will realise the
outcomes. The outputs are further broken into activities together with measures, targets and
timeframes. These are then translated into measurable objectives, which guide the structuring
of the Strategic Plan.
According to the Department of Public Service and Administration’s Strategic Plan 2010–
2014, the main dimensions underpinning how this needs to be done begins with ensuring that
the following are in place:
Capacity building mechanisms, which ensure development of individual public
servants to be able to do the work and remain productive.

PSETA Sector Skills Plan Update 2015/16 165
Institutional development and support within departments which ensure that groups
of public servants function synergistically as collective delivery teams within an
empowered environment.
Governance initiatives, which enhance disciplined democratic structures to enhance
public participation.
Continuous economic growth and development initiatives regionally, nationally and
on the continent.
These four pillars of the strategic framework have informed the DPSA vision for HRD, which
is “A dedicated, responsive and productive Public Service.” While the DPSA argument is that
all need to be in place for there to be high performance in the public service, the capacity
building initiatives are of particular relevance to PSETA.
The 12 outcomes expressed in the Government’s Programme of Action (PoA) are an
expression of the key priorities that government seeks to address. The MTSF priorities have
been translated into 12 Key Outcomes that form the basis for the current electoral mandate
for the period 2010 – 2014 seeks to address.
The Sector Skills Plan (SSP) provides the roadmap for PSETA work in terms of skills
development priorities in the short and long term. The SSP provides the backdrop for the
Annual Performance Plan of the SETA and performance targets are set in respect of skills
development initiatives detailed.
In developing the PSETA SSP, a performance based planning approach was used. This
approach is relevant as it ensures that PSETA is focused on achieving the expected outcomes
of improved capacity and capabilities within the public service, and of building a developmental
and capable state. When developing plans and determining targets, the end goal – what
change is planned becomes relevant. This is referred to as the impact that we are striving for.
Within a government context, the “impact” is defined as an improved economy with job
creation and a reduction in poverty and increasing education levels to support this.
For PSETA, Outcomes 5 and 12 as reflected in the MSTF as A skilled and capable
workforce to support an inclusive growth path (Outcome 5)
An efficient, effective and development orientated public service and an empowered,
fair and inclusive citizenship (Outcome 12).
PSETA’s impact statement therefore is “the skilled and capable workforce required to achieve
a more efficient, effective and development-oriented public services sector”.
Table 33: The PSETA Scope of Coverage
SIC CODE SCOPE OF COVERAGE
91101 Government Departments
91102 Provincial Administrations

PSETA Sector Skills Plan Update 2015/16 166
9110F Parastatals n.e.c (not elsewhere classified)
91106 Department of International Relations & Cooperation
91107 Department of Trade and Industry
In terms of its scope of coverage, the PSETA is primarily responsible for the provision of skills
for departments that wholly fall within its scope (in the business of government) and the
transversal skills in all national and provincial departments, participating national and
provincial public entities and parastatals, secretariat of parliament and provincial legislatures.

PSETA Sector Skills Plan Update 2015/16 167
References
Advance skills and Innovation – The Conference Board of Canada.
http:///www.conferenceboard.ca/hcp/hot-topics/innovation.asp.
Allais, S. 2005. What is Matric? A Response to Foxcroft and Stumpf. Matric: what is to be
done? Seminar Papers and Presentations. Pretoria, 23 June, Centre for Higher Education
Transformation and Umalusi.
Auditor General of South Africa. 2013. Consolidated general report on the national and
provincial audit outcomes, PFMA 2012-13. Pretoria: Auditor General of South Africa.
Baker, J. A. (1992). Paradigms. The Business of discovering the future. New York: First
Harper Business.
Bean, R. and Radford, R. (2002). The Business of Innovation. Managing the Corporate
Imagination for maximum results. New York: American Management Association.
Bendix, S. (1996). Industrial Relations in South Africa. Juta and Company Ltd.
DPSA. (2012). Report on organisational skills requirements and senior management service
members skills gaps.
Brunette, R. et al. 2014. The Contract State: Outsourcing and Decentralisation in
Contemporary South Africa, Study funded by the Ford Foundation, Public Affairs Research
Institute, Johannesburg, May.
Chipkin, Ivor. 2011. Beyond the Popular Discourse: Capacity Constraints in the Public Sector.
PARI Short Essay, No. 3, Public Affairs Research Institute (PARI), Johannesburg, May.
Construction Education and Training Authority (CETA). 2010. Sector Skills Plan. Pretoria:
CETA.
Council on Higher Education (CHE). 2013. A proposal for undergraduate curriculum reform in
South Africa: The case for a flexible curriculum structure, August 2013.
Council on Higher Education (CHE). The State of Higher Education in South Africa, A report
of the CHE Advice and Monitoring Directorate, Higher Education Monitor No. 8, October 2009,
8.
Dagut, S. 2007. The South African National Treasury, the Matthew Effect and some tentative
thoughts about civil service reform in Africa. Unpublished term paper, Woodrow Wilson School
PSETA Sector Skills Plan Update 2015/16 168
of Public and International Affairs, Princeton University.
Department of Basic Education (DBE). 2014. Education Statistics in South Africa 2012,
January 2014. Pretoria: DBE.
Department of Higher Eucation and Training (DHET). 2014. Call for Comments on the National
Scarce Skills List: Top 100 Occupations in Demand, Notice 380 of 2014.
Department of Higher Education and Training (DHET). 2013. Statistics on Post-School
Education and Training in South Africa: 2011. Pretoria: DHET.
Department of Higher Education and Training (DHET). 2012. The Green Paper on Post School
Education and Training. Pretoria: DHET.
Department of Higher Education and Training (DHET). Undated. National Skills Development
Strategy III. Pretoria: DHET.
Department of Performance Monitoring and Evaluation (DPME). 2013. The State of
Management Practices in the Public Serice. Pretoria: DPME.
Department of Public Service and Administration (DPSA). 2008. Srategic Human resource
Planning, October 2008. Pretoria: DPSA.
Department of Public Service and Administration (DPSA). 2013a. ‘SMS competency
assessments: input for HRD council report’, 13 February 2013. Pretoria: DPSA.
Department of Public Service and Administration (DPSA). 2013b. Achieving a Skilled and
Capable Workforce for an Efficient, Effective, Professional and Development-Oriented State:
A Coordinated Approach, Ministry for Public Service and Administration Report to the Human
Resource Development Council of South Africa, 26 March 2013. Pretoria: DPSA.
Department of Public Service and Administration (DPSA). 2013c. 2011-2013 Statistical
Analysis of Competency Assessment Data.
Forced Migration Studies Programme, 2010. Population Movements in and to South Africa,
Migration Factsheet 1. FMSP, University of the Witwatersrand.
Gustafsson, M. 2011. The when and how of leaving school: the policy implications of new
evidence on secondary schooling in South Africa, Stellenbosch Economic Working Papers:
09/11. Stellenbosch: Stellenbosch University.
Human Resource Development Council of South Africa (HRDSA). 2014. National Integrated

PSETA Sector Skills Plan Update 2015/16 169
Human Resource Development Plan 2014-2018. Pretoria: HRDSA.
Human Resource Development Council (HRDSA), 2009. Human Resource Development
Strategy for South Africa (HRDSA) 2010 – 2030, March 2009. Pretoria: HRDSA.
Human Resource Development Council (HRDCSA), 2013. HRDC website:
PSETA Sector Skills Plan Update 2015/16 170
http://www.hrdcsa.org.za/, accessed 7 June 2013.
Huluman, S. 2011. The Role of PSETA, Presentation to the Public Sector Trainers’ Forum
Conference, Bloemfontein, 27 September 2011.
Janse van Rensburg, A. (2009). Human Resource Management as a Profession in South
Africa. Pretoria: University of Pretoria.
Kraak, A, Jewison, R, Pillay, P, Chidi, M, Bhagwan, N, Nomvete, S, Egelbrecht, B. 2013.
Review of the current skills development system and recommendations towards the best
model for delivering skills in the country. Skills System Review Technical Task of the Human
Resource Development Council of South Africa, 24 November 2013, Pretoria.
Konstant, T., Obery, I. and Setshwaelo, T. 2010. ‘Dragging Home Affairs to its feet: Reluctant
change in the cradle-to-grave department’. Pretoria: DPME.
Kuye, J.O., 2006. “Public Sector Reforms: The Case for South Africa – 1994-2005” in Journal
of Public Administration, 41(2.2).
Lodge, Tom. 2005. “Provincial Government and State Authority in South Africa.” In Journal of
Southern African Studies, 31(4): 737 – 753.
Lotz-Sisitka, H., Ramsurup, P., Gumede, M., Togo, M. and Rosenberg, E. 2013. ‘Green Skills
Development in South Africa: System perspectives for the shaping of learning pathway
possibilities for sustainable development, the green economy and climate resilient
development’, October.
Meny-Gibert, 2012. Marking time: Inefficiencies in the schooling system and possible
responses. PARI Short Essays, Number 4.
Mkhiza, S. V. 2011. Case study: DHA ID turnaround process, Presentation to the Public Sector
Trainers’ Forum Conference, Bloemfontein, 27 September 2011.
Morgan, N. 2014. Where have all the people gone? Exploring water and sanitation delivery in
South Africa. Study funded by the Open Society Foundation for South Africa, Public Affairs
Research Institute, Johanneburg, May.
National Planning Commission. 2011. Diagnostic. Pretoria: National Planning Commission.
National Planning Commission. 2012. National Development Plan – 2013. Pretoria: National
Planning Commission.

PSETA Sector Skills Plan Update 2015/16 171
National Treasury. 2014a. Estimates of National Expenditure. Pretoria: National Treasury.
National Treasury. 2014b. Capacity Development Strategy for Public Financial Management.
National Treasury, March.
National Treasury, Personal Communication, 19 August 2013.
Paton, C. 2013. “‘Extra eye’ in Treasury to cut fraud in government supply chain” in Business
Day, 20 August 2013.
Peires, Jeff B. 1992. “The Implosion of the Transkei and Ciskei.” In African Affairs, 91: 365–
87.
Picard, L. 2005. The state of the state. Institutional transformation, capacity and political
change in South Africa. Johannesburg: Wits University Press.
Pillay, P., Juan, A. and Twalo. T. 2011. Measuring impact assessment of skills development
on service delivery in government departments, study commissioned by the Department of
Labour, October 2011. Pretoria: Human Sciences Research Council.
Public Service Commission (PSC). 2011. Assessment of the State of Human Resource
Management in the Public Service. Pretoria: PSC.
Public Service Commission (PSC). 2008. The Turn-over Rate of Heads of Department and its
Implications for the Public Service. Pretoria: PSC.
Public Service Sector Education and Training Authority (PSETA). 2011. The PSETA Sector
Skills Plan Update 2012-16, November 2011.
Public Service Sector Education and Training Authority (PSETA). 2013a. Annual Report,
2013/13. Pretoria: PSETA.
Public Service Sector Education and Training Authority, 2013b. The PSETA Sector Skills Plan
Update 2014/15.
Ramsurup, 2013. Based on NLRD qualifications analysis, Rhodes University Environmental
Learning Research Centre.
Republic of South Africa, 1998. Skills Development Act no. 97 of 1998. Pretoria: Government
Gazette.
Republic of South Africa, 2014. Public Administration Management Act, No. 11 of 2014.

PSETA Sector Skills Plan Update 2015/16 172
Government Publications.
South Africa Board for People Practices, (2013). Setting HR Standards. Draft HR
Management System Standards for South Africa. Pretoria: Government Printers.
Statistics South Africa. 2003. Documented Migration, 2003, Report 03-51-03. Pretoria:
StatsSA.
Taylor, N., Mabogoane, T. and Akoobhai, B. 2011.Service Delivery Research Project: The
School Sector, report submitted to the Office of the Presidency, May. Johannesburg: JET
Education Services.
Technical Assistance Unit of the National Treasury (TAU), 2012. Diagnostic Research Report
on Corruption, Non-Compliance and Weak Organisations. Study undertaken by the Public
Affairs Research Institute (PARI) for the TAU. Pretoria: TAU.
Van der Berg, S., Burger, K., Burger, R.,deVos, M., Gustafsson, M., Moses, E., Sheperd, D.,
Spaull, N., Taylor, S., van Brokhuizen, H. and von Fintel, D. 2011. Low quality education as a
poverty trap, Research Report, March. Stellenbosch: Social Policy Research Group,
Stellenbosch University.
Yuba, M. 2013. The role of the National Archives and Records Service of South Africa in the
young democracy. Masters thesis, Graduate School of Public and Development Management,
University of the Witwatersrand.

PSETA Sector Skills Plan Update 2015/16 173
Appendix One: PSETA Scope of Coverage
Government departments that fall exclusively within the remit of PSETA
Government Department
Economic Development
Government Communications and Information Systems (GCIS)
Home Affairs
International Relations and Co-operation
Labour
Public Administration Leadership and Management Academy*
Public Enterprises
Public Service and Administration
Public Service Commission
Rural Development and Land Reform
Statistics South Africa
Trade and Industry
The Presidency
* PALAMA is not a department per se, but is an academy that is responsible for the provision of training for
public sector employees in general.
Government departments that provide services that are not performed exclusively by
government and that are affiliated to a line function SETA

PSETA Sector Skills Plan Update 2015/16 174
Government Department
Agriculture, Forestry and Fisheries
Arts and Culture
Basic Education
Communications
Co-operative Governance and Traditional Affairs
Correctional Services
Defence and Military Veterans
Energy
Environmental Affairs
Health
Higher Education and Training
Human Settlements
Independent Complaints Directorate
Justice and Constitutional Development
Mineral Resources
National Intelligence Agency
National Treasury
Police Civilian Secretariat
Public Works
Science and Technology
Social Development
SA National Academy of Intelligence
SA Police Service
SA Revenue Service
SA Secret Service
Sports and Recreation South Africa
Tourism
Transport
Water Affairs
Women, Children and People with Disabilities
All provincial departments that have a specialised technical competency belong to line
function SETAs. Offices of the Premier, planning departments, departments of rural
development and economic development departments are then proposed to belong to
PSETA. However, PSETA is responsible for everything related to the business of
government (transversal skills) in all provincial departments. In practice, this means that
when provincial departments submit WSPs to their SETAs, they should all submit the
section of the WSP that deals with the business of government (transversal skills) to PSETA.
Provincial administrations within the PSETA Scope of Coverage

PSETA Sector Skills Plan Update 2015/16 175
Provincial Administration Provincial Departments
Eastern Cape Provincial Government
Office of the Premier
Rural Development and Agrarian Reform
Education and Training
Provincial Planning and Finance
Health
Human Settlements
Local Government and Traditional Affairs
Roads and Public Works
Safety and Liaison
Social Development, Women, Youth and People
with Disabilities
Sports, Recreation, Arts and Culture
Transport
Free State Provincial Government
Office of the Premier
Agriculture
Co-operative Governance, Traditional Affairs and
Human Settlements
Economic Development, Tourism and
Environmental Affairs
Education
Health
Police, Roads and Transport
Provincial Treasury
Public Works and Rural Development
Social Development
Sport, Arts, Culture and Recreation
Gauteng Provincial Government
Office of the Premier
Agriculture and Rural Development
Community Safety
Economic Development and Planning
Education
Finance
Health and Social Development
Local Government and Housing
Infrastructure Development
Roads and Public Transport
Sport, Arts, Culture and Recreation

PSETA Sector Skills Plan Update 2015/16 176
KwaZulu Natal Provincial Government
Office of the Premier
Agriculture, Environmental Affairs and Rural
Development
Arts, Culture, Sport and Recreation
Economic Development and Tourism
Education
Finance
Health
Public Works
Local Government, Housing and Traditional
Affairs
Social Development
Transport and Community Safety and Liaison
Limpopo Provincial Government
Office of the Premier
Agriculture
Economic Development, Environment and
Tourism
Education
Health and Social Development
Local Government and Housing
Public Safety and Liaison
Provincial Treasury
Public Works
Roads and Public Transport
Sport, Arts and Culture
Mpumalanga Provincial Government
Office of the Premier
Agriculture, Rural Development and Land
Administration
Community Safety, Security and Liaison
Co-operative Governance and Traditional Affairs
Culture, Sport and Recreation
Economic Development, Environment and
Tourism
Education
Finance
Health and Social Development
Human Settlement
Public Works, Roads and Transport
North West Provincial Government
Office of the Premier
Agriculture, Conservation, Environment and Rural
Development
Economic Development and Tourism
Education
Finance
Health and Social Development
Human Settlement
Local Government and Traditional Affairs
Public Safety
Public Works, Roads and Transport
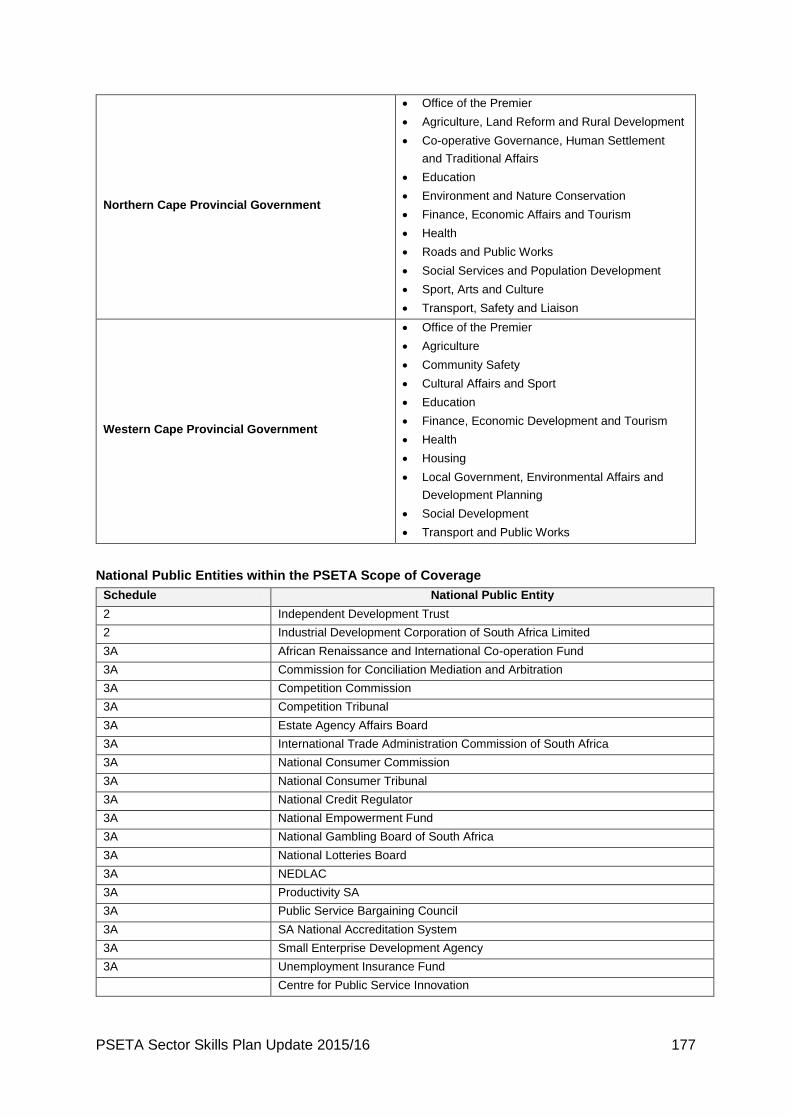
PSETA Sector Skills Plan Update 2015/16 177
Northern Cape Provincial Government
Office of the Premier
Agriculture, Land Reform and Rural Development
Co-operative Governance, Human Settlement
and Traditional Affairs
Education
Environment and Nature Conservation
Finance, Economic Affairs and Tourism
Health
Roads and Public Works
Social Services and Population Development
Sport, Arts and Culture
Transport, Safety and Liaison
Western Cape Provincial Government
Office of the Premier
Agriculture
Community Safety
Cultural Affairs and Sport
Education
Finance, Economic Development and Tourism
Health
Housing
Local Government, Environmental Affairs and
Development Planning
Social Development
Transport and Public Works
National Public Entities within the PSETA Scope of Coverage
Schedule National Public Entity
2 Independent Development Trust
2 Industrial Development Corporation of South Africa Limited
3A African Renaissance and International Co-operation Fund
3A Commission for Conciliation Mediation and Arbitration
3A Competition Commission
3A Competition Tribunal
3A Estate Agency Affairs Board
3A International Trade Administration Commission of South Africa
3A National Consumer Commission
3A National Consumer Tribunal
3A National Credit Regulator
3A National Empowerment Fund
3A National Gambling Board of South Africa
3A National Lotteries Board
3A NEDLAC
3A Productivity SA
3A Public Service Bargaining Council
3A SA National Accreditation System
3A Small Enterprise Development Agency
3A Unemployment Insurance Fund
Centre for Public Service Innovation

PSETA Sector Skills Plan Update 2015/16 178
Provincial Public Entities within the PSETA Scope of Coverage
Schedule Provincial Public Entity
3C Eastern Cape Gambling and Betting Board
3C Free State Gambling and Racing Board
3C Gauteng Economic Development Agency
3C Gauteng Enterprise Propeller
3C Gauteng Gambling Board
3C Gauteng Partnership Fund
3C KZN Gambling Board
3C Limpopo Development Enterprise
3C Limpopo Gambling Board
3C Limpopo Panel of Mediators
3C Limpopo Planning Commission
3C Mpumalanga Gambling Board
3C Northern Cape Gambling Board
3C North West Gambling Board
3C Western Cape Gambling and Racing Board
3C Western Cape Language Committee
3C Western Cape Provincial Development Council
3D East London Industrial Development Zone Corporation
3D Eastern Cape Development Corporation
3D Free State Development Corporation
3D Ithala Development Finance Corporation
3D Limpopo Development Corporation
3D Mpumalanga Economic Growth Agency
3D North West Development Corporation
National Parliament (including the National Council of Provinces) and the nine (9) provincial
legislatures also fall within the PSETA Scope of Coverage.
Source: PSETA, 2011.

PSETA Sector Skills Plan Update 2015/16 179
Appendix Two: Excerpts from the Public Administration Management Act
of 2014
From Chapter Four: Capacity Development and Training
National School of Government
11. (1) The National School of Government will, in consultation with the Minister responsible
for higher education and training, be established as a higher education institution
contemplated in the Higher Education Act, 1997 (Act No. 101 of 1997).
(2) The School must, through education and training, promote the progressive realisation of
the values and principles governing public administration and enhance the quality, extent
and impact of the development of human resource capacity in institutions.
(3) The School must give effect to subsection (2) by—
. (a) subject to the National Qualifications Framework Act, 2008 (Act No. 67 of 2008),
providing such education and training or causing such education and training to be
provided or conducting or cause to be conducted such examinations or tests as the
Head of the School determines;
. (b) interacting with and fostering collaboration, in consultation with the Minister
responsible for higher education and training, among training institutions, higher
education institutions, further education and training institutions and private sector
training providers in furtherance of such education and training; and
. (c) performing any other function or exercising any other power as prescribed.
(4) The provisions of this section do not affect institution or sector specific training.
Directive by Minister relating to education
12. (1) The Minister, in consultation with the Minister responsible for higher education and
training, may direct the School to provide qualifications, part- qualifications and non-formal
education as recognised by the National Qualifications Framework or the South African
Qualifications Authority.
(2) Insofar as a directive under subsection (1) applies to municipalities, the Minister must act
in consultation with the Minister responsible for local government and after consultation with
organised local government.

PSETA Sector Skills Plan Update 2015/16 180
Compulsory educational requirements for employment
13. (1) The Minister may, after approval by the Cabinet, direct that the successful completion
of specified education, training, examinations or tests is—
. (a) a prerequisite for specified appointments or transfers; and
. (b) compulsory in order to meet development needs of any category of employees.
(2) The Minister must consult organised local government and obtain the concurrence of the
Minister responsible for local government before seeking the approval of the Cabinet
contemplated in subsection (1) in respect of a directive to be applicable to municipalities.

PSETA Sector Skills Plan Update 2015/16 181
Appendix Thee: Description of the Major Occupational Classification /
Groups used in Persal
(i) Elementary occupations
Elementary occupations are normally responsible for routine, often manual, tasks. With few
exceptions only limited personal initiative and judgement are required. The main tasks
consist of the delivery of messages/goods, cleaning, washing, pressing, property watching
and working as labourers.
(ii) Administrative Office Workers
This group comprises two clusters of occupations. The first cluster is referred to as clerks
and related personnel and includes occupations whose main tasks require the knowledge
and experience necessary to organise, store, compare and retrieve information. The main
tasks consist of performing secretarial duties, operating word processors and other office
machines, recording and computing numerical data and performing a number of customer-
oriented clerical duties. The second cluster is referred to as administrative policy and related
personnel and includes occupations whose main tasks are to formulate and advise on
government policies of an administrative nature, formulate/administer laws, rules and
regulations directly associated with the policies and legislation of the employing institution.
Employees in this category are also responsible for inspections to ensure that regulations
are complied with.
(iii) Professionals and Managers
This group includes occupations whose main tasks require a high level of professional
knowledge and experience in the fields of physical and life sciences, or social sciences and
humanities. The main tasks consist of increasing the existing stock of knowledge, applying
scientific and artistic concepts and theories to the solution of problems, about the foregoing
in a systematic manner. This group also includes various levels of managers. The lowest
level of managers’ main tasks usually includes planning, directing and coordinating activities
of components in a department, directing daily operations, overseeing the selection, training
and performance of staff, liaising with managers of other components and in other
departments and representing the department in its dealings with other parts of the
organisation or with outside bodies. The second level of managers’ main tasks usually
include determining and formulating policies, planning, directing and co-ordinating the
general functioning of directorates/chief directorates (or the equivalent thereof) with the help
of other managers under her/his control. The highest level of managers in this major group
are heads of departments/provincial departments who are accountable for the effective and
efficient management of departments/provincial departments/organisational components
indicated in schedule 1, 2 and 3 of the Public Service Act, 1994.

PSETA Sector Skills Plan Update 2015/16 182
(iv) Technicians and Associated Professionals
This group includes occupations whose main tasks require technical knowledge and
experience in one or more fields of physical and life sciences, or social sciences and
humanities. The main tasks consist of carrying out technical work connected with the
application of concepts and operational methods in the above-mentioned fields.
(v) Service Workers
Service workers provide personal and protective services related to housekeeping, catering,
personal care, social auxiliary services, protection against fire and unlawful acts, etc. Tasks
performed include housekeeping, food preparation, child care, care for persons at homes or
institutions, personal care, protection of individuals and property against fire and unlawful
acts.
(vi) Social, Natural, Technical and Medical Sciences Supplementary and Support Personnel
Personnel in this major group normally apply their knowledge and skills as part of
supplementary and support functions directly associated with Professionals and
Technicians. They assist with supporting services like operating specialised
equipment/make preparations for specialised tasks to be performed by
Professionals/Technicians. They may also render supplementary functions in e.g. the social
services fields.
(vii) Craft and Related Trades Workers
Craft and related trades workers apply their knowledge and skills in the fields of
construction, working with metals, erecting structures, maintaining and repairing machinery,
printing work and producing handicraft goods. The work is carried out by using
equipment/tools to reduce the physical effort and time required for specific tasks, as well as
to improve the quality of the products. An understanding of the various stages of the
production processes, the materials and tools used and the nature and purpose of the final
product is required. .
(viii) Drivers, Operators and Ships’ Crew
Personnel in this major group operate and monitor machinery and equipment and execute
deck duties on board vessels. They can also be responsible for the driving of vehicles. The
work mainly requires experience and understanding of machinery, equipment, vehicles and
vessels. Supervision of other workers may be required.
(ix) National Security Services and Custodian Personnel
Included in this major group are members of the army, navy, air force, police and
correctional services. No specific skill level has been linked to this major group.
(x) Information Technology Personnel
PSETA Sector Skills Plan Update 2015/16 183
Information Technology Personnel conduct research, plan, develop and improve computer
based information systems, software and related concepts as well as maintain management
systems such as databases to ensure integrity and security of data. They also provide
assistance to users of micro-computers and standard software packages, control and
operate computers and peripheral equipment and carry out programming tasks (complexity
may vary) related with the installation and maintenance of computer hardware and software.
In some cases they may also receive guidance from managers.


![SKILLS DEVELOPMENT ACT - PSETA · SKILLS DEVELOPMENT ACT NO. 97 OF 1998 [ASSENTED TO 20 OCTOBER, 1998] [DATE OF COMMENCEMENT TO BE PROCLAIMED] (Unless otherwise indicated) (English](https://img.pdfslide.net/doc/110x75/5fa8cdf13a1d2f1b901d7d0e/skills-development-act-skills-development-act-no-97-of-1998-assented-to-20-october.jpg)