Embed Size (px)
Citation preview

The Puerto RicoEconomic Activity Index (“EDB-EAI”)
September 2021

DISCLAMER
The Economic Development Bank for Puerto Rico (EDB), the Government of Puerto Rico, its instrumentalities and agencies (the “Government”), and each of their respectiveofficers, directors, employees, agents, attorneys, advisors, members, partners or affiliates (collectively, with EDB and the Government, the “Parties”) make no representationor warranty, express or implied, to any third party with respect to the information contained herein and all Parties expressly disclaim any such representations or warranties.The Government has had to rely upon preliminary information and unaudited financials for 2015, 2016 and 2017 in addition to the inherent complexities resulting from aprolonged period of lack of financial transparency. As such, EDB and the Government have made certain assumptions that may materially change once those financialstatements are fully audited. The Parties do not owe or accept any duty or responsibility to any reader or recipient of this presentation, whether in contract or tort, and shallnot be liable for or in respect of any loss, damage (including without limitation consequential damages or lost profits) or expense of whatsoever nature of such third party thatmay be caused by, or alleged to be caused by, the use of this presentation or that is otherwise consequent upon the gaining of access to this document by such third party. TheParties do not undertake any duty to update the information contained herein. This document does not constitute an audit conducted in accordance with generally acceptedauditing standards, an examination of internal controls or other attestation or review services in accordance with standards established by the American Institute of CertifiedPublic Accountants or any other organization. Accordingly, the Parties do not express an opinion or any other form of assurance on the financial statements or any financial orother information or the internal controls of the Government and the information contained herein. Any statements and assumptions contained in this document, whetherforward-looking or historical, are not guarantees of future performance and involve certain risks, uncertainties, estimates and other assumptions made in this document. Theeconomic and financial condition of the Government and its instrumentalities is affected by various legal, financial, social, economic, environmental, governmental andpolitical factors. These factors can be very complex, may vary from one fiscal year to the next and are frequently the result of actions taken or not taken, not only by theGovernment, but also by Financial Oversight and Management Board for Puerto Rico and other third-party entities such as the government of the United States. Examples ofthese factors include, but are not limited to,: – Any future actions taken or not taken by the United States government related to Medicaid or the Affordable Care Act; – Theamount and timing of receipt of any distributions from the Federal Emergency Management Agency and private insurance companies to repair damage caused by HurricanesMaría and Irma; – The amount and timing of receipt of any amounts allocated to Puerto Rico and provided under the Community Disaster Loans Program; – The amount andtiming of receipt of any additional amounts appropriated by the United States government to address the funding gap described herein; – The timeline for completion of thework being done by the Puerto Rico Electric Power Authority (“PREPA”) to repair PREPA’s electric system and infrastructure and the impact of any future developments orissues related to PREPA’s electric system and infrastructure on Puerto Rico’s economic growth; – The impact of the measures described herein on outmigration; and – Theimpact of the resolution of any pending litigation in the Title III cases Because of the uncertainty and unpredictability of these factors, their impact cannot be included in theassumptions contained in this document. Future events and actual results may differ materially from any estimates, projections, or statements contained herein. Nothing inthis document should be considered as an express or implied commitment to do or take, or to refrain from taking, any action by EDB, the Government, or any governmentinstrumentality in the Government or an admission of any fact or future event. Nothing in this document shall be considered a solicitation, recommendation or advice to anyperson to participate, pursue or support a particular course of action or transaction, to purchase or sell any security, or to make any investment decision. By receiving thisdocument, the recipient shall be deemed to have acknowledged and agreed to the terms of these limitations. This document may contain capitalized terms that are notdefined herein or may contain terms that are discussed in other documents or that are commonly understood. You should make no assumptions about the meaning ofcapitalized terms that are not defined, and you should refer questions to EDB ([email protected]) should clarification be required.

Table of Content
01 Definitions 02 Description of the
EDB-EAI
04 Interpretation of the
EDB-EAI
05 EDB-EAI Overview
September 2021
03 EDB-EAI Composition
06 EDB-EAI Monthly
Components
07 EDB-EAI: Data 2012-
2021 08 EDB-EAI: Graphs
09 Conclusions 10 Contact Information

Definitions
ARRA American Recovery and Reinvestment Act of 2009
BLS Bureau of Labor Statistics of the United States Department of Labor and Human
Resources
COFINA Puerto Rico Sales Tax Financing Corporation (Spanish acronym)
EAI Economic Activity Index
EDB Economic Development Bank for Puerto Rico
FY Puerto Rico’s Fiscal Year (July-June)
GDB Government Development Bank for Puerto Rico
GNP Puerto Rico’s Gross Product
GNP54 Puerto Rico’s Real Gross Product
kWh Kilowatt-hour
m-o-m Month-over-month
PREPA Puerto Rico Electric Power Authority
PRTHA Puerto Rico Highways and Transportation Authority
s. a. Seasonally adjusted
TCB The Conference Board is a Company that promotes the understanding of business
practices and economic cycles and supports and undertake nonpartisan analysis and
research.
y-o-y Year-over-year
Go to the Table of Content

Description of the
EDB-EAI
5
y = 47.661x - 222.01R² = 0.9467
3,000
3,500
4,000
4,500
5,000
5,500
6,000
6,500
7,000
7,500
8,000
80 100 120 140 160 180
GN
P i
n m
illi
on
of
19
54
do
lla
rs
EDB-EAI new
Relationship on the levels: (FY1981-FY2020)
y = 0.7428x + 0.0035R² = 0.8444
-6%
-4%
-2%
0%
2%
4%
6%
-10% -5% 0% 5% 10%
GN
P54
an
nu
al g
row
th
EDB-EAI annual growth
Relationship on the growth rates (FY1982-FY2020)
The EDB-EAI is a
coincident index for the
economic activity of Puerto
Rico. It is highly correlated
to Puerto Rico’s real GNP
in both level and annual
growth rates.
This index’s methodology is
similar to the one used in TCB’s
coincident index of the US
economy. This methodology
follows a standard procedure to
adjust the data for seasonality
and volatility factors.
Real Gross National
Product as a function of
the EDB Economic
Activity Index
Go to the Table of Content

EDB-Economic Activity
Index Composition The EDB-EAI is made up of 4 indicators:
Total Payroll Employment (Establishment Survey/Thousands of employees). This variable is provided bythe Bureau of Labor Statistics of the US Department ofLabor and Human Resources (BLS) on a monthlybasis. The establishment survey providesemployment, hours, and earnings estimates based onpayroll records of business establishments in PuertoRico.
Total Electric Power Generation (Millions of kWh).This variable is provided by the Puerto Rico PowerAuthority (PREPA) on a monthly basis. This indicatorincludes the electric power generation produced bypetroleum, natural gas, coal and renewable energysources. The renewable energy is supplied by utility-scale solar photovoltaic generating capacity, two windfarms and landfill gas sources.
Cement Sales (Millions of 94lb. bags). This variable isprovided by CEMEX Puerto Rico & Argos Puerto RicoLLC on a monthly basis. The data is compiled andconverted to a standardized measure per unit by theEDB.
Gasoline Consumption (Millions of gallons). Thisvariable is provided by Puerto Rico Highways andTransportation Authority (PRHTA) on a monthly basis.The EDB adjusts the series with a 3-month movingaverage.
Advantages of the EDB-EAI:
Readily available in a monthlybasis to the financial community.
Highly correlated measuring toolof Puerto Rico’s real GNP.
Reliable instrument to monitorcurrent trends in Puerto Rico’seconomy for economists,investors and multiple playersamong the financial community.
6
EDB Economic Activity Index
Highlights01
02
03
04
Go to the Table of Content

Interpretation of
the EDB-EAI
7
The EDB-EAI is an indicator of
general economic activity, not a
direct measurement of Puerto
Rico’s real GNP. The annual
growth rate of the EAI is not the
same as the annual growth rate
of the Island’s real GNP. The
EAI does not include all the
economic sectors that comprise
the GNP.
When annualized, the level of the EAI is highly correlated
with the level of the real GNP (with a Pearson correlation
coefficient of 0.9730; i.e., 97% for FY1981-FY2020).
The annual growth rates of both variables are also highly
correlated (with a Pearson correlation coefficient of 0.9189;
i.e., 92% for FY1982-FY2020).
Nevertheless, the annual growth rate of the EAI IS NOT the
same as the annual growth rate of the real GNP, since being
highly correlated does not mean being identical.
In order to calculate an approximate of the real GNP trend
from the EAI annual growth, the EDB estimates a linear
regression model relating both variables.
Plugging-in the EAI annual growth rates into the resulting
equation produces real GNP annual growth rate estimates
relatively comparable to the real GNP annual growth figures
published by the Puerto Rico Planning Board.
Go to the Table of Content

The graph compares actual real GNP growth rates with estimated real GNP growth rates based
on the EDB-EAI.
Sources: Puerto Rico Planning Board and EDB.
3.0%
1.5%
-0.3%
2.1%
2.7%
1.9%
0.5%
-1.2%
-2.9%
-3.8%-3.6%
-1.7%
0.5%
-0.1%
-1.8%
-0.8%
-1.6%
-3.2%
-4.4%
1.8%
-3.2%
2.0%
1.0% -0.4%
1.7%2.0%
1.4%
0.5%
-0.7%
-1.4%
-2.9% -3.1%
-1.7%
0.2% 0.1%
-2.0%-1.1%
-0.7%-0.8%
-4.9%
5.3%
-1.1%
-6%
-4%
-2%
0%
2%
4%
6%
2000 2001 2002 2003 2004 2005 2006 2007 2008 2009 2010 2011 2012 2013 2014 2015 2016 2017 2018 2019 2020
Real GNP vs. Real GNP estimated with the EDB-EAI*
Real GNP annual growth rate Real GNP annual growth rate estimated with the EDB-EAI
Interpretation of the EDB-EAI
8
* The EDB-EAI is an indicator of general economic activity, not a direct measurement of real GNP. The annual growth rate
of the EAI is not the same as the annual growth rate of the real GNP. The EAI does not include all the economic sectors
that comprise the GNP.
Go to the Table of Content
Fiscal
Year
EDB-EAI
annual
growth
Real GNP annual
growth
estimated using
the EDB-EAI
Current
real GNP
annual
growth
2000 2.3% 2.0% 3.0%
2001 0.8% 1.0% 1.5%
2002 -1.0% -0.4% -0.3%
2003 1.9% 1.7% 2.1%
2004 2.2% 2.0% 2.7%
2005 1.5% 1.4% 1.9%
2006 0.2% 0.5% 0.5%
2007 -1.4% -0.7% -1.2%
2008 -2.4% -1.4% -2.9%
2009 -4.4% -2.9% -3.8%
2010 -4.6% -3.1% -3.6%
2011 -2.8% -1.7% -1.7%
2012 -0.2% 0.2% 0.5%
2013 -0.4% 0.1% -0.1%
2014 -3.2% -2.0% -1.8%
2015 -2.0% -1.1% -0.8%
2016 -1.4% -0.7% -1.6%
2017 -1.6% -0.8% -3.2%
2018 -7.1% -4.9% -4.4%
2019 6.7% 5.3% 1.8%
2020 -1.9% -1.1% -3.2%
Sources: Puerto Rico Planning Board and EDB.
Interpretation of
the EDB-EAI
9
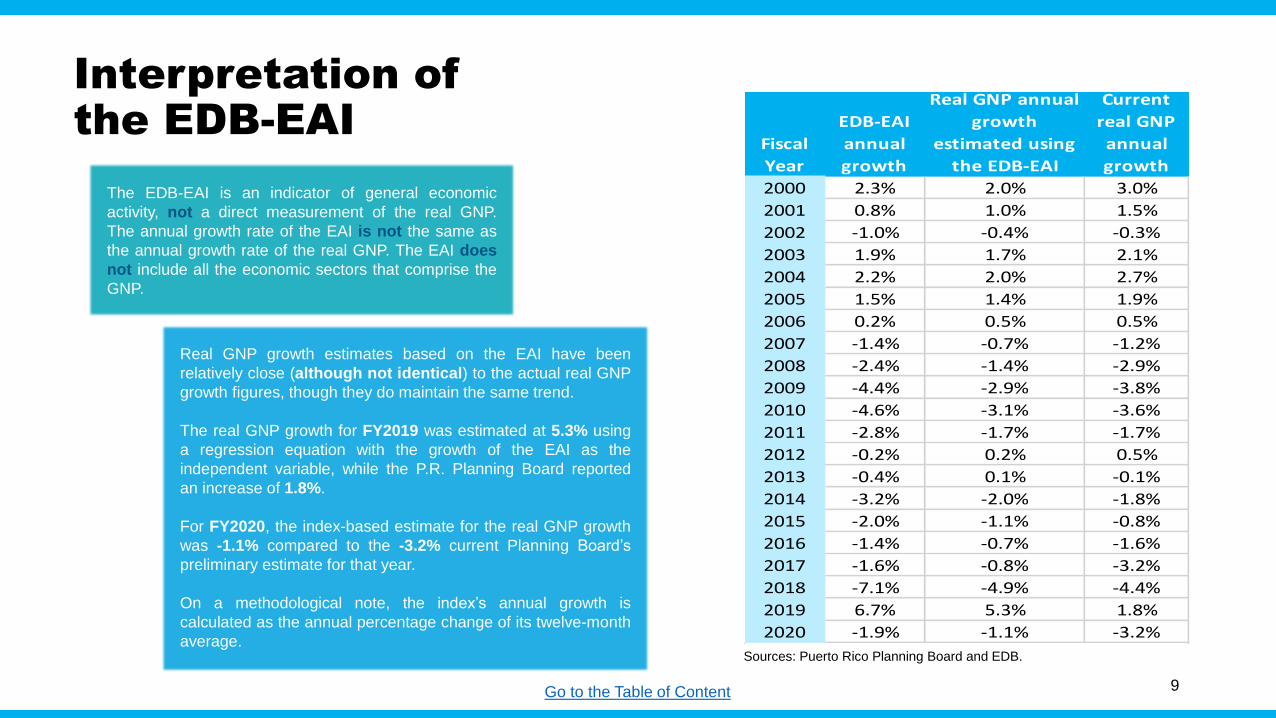
The EDB-EAI is an indicator of general economic
activity, not a direct measurement of the real GNP.
The annual growth rate of the EAI is not the same as
the annual growth rate of the real GNP. The EAI does
not include all the economic sectors that comprise the
GNP.
Real GNP growth estimates based on the EAI have been
relatively close (although not identical) to the actual real GNP
growth figures, though they do maintain the same trend.
The real GNP growth for FY2019 was estimated at 5.3% using
a regression equation with the growth of the EAI as the
independent variable, while the P.R. Planning Board reported
an increase of 1.8%.
For FY2020, the index-based estimate for the real GNP growth
was -1.1% compared to the -3.2% current Planning Board’s
preliminary estimate for that year.
On a methodological note, the index’s annual growth is
calculated as the annual percentage change of its twelve-month
average.
Go to the Table of Content

EDB-EAI Overview –
September 2021
10
Sources: BLS, PREPA, PRHTA and EDB.
* EDB applies a 3-month moving average adjustment to the gasoline consumption data.
The EDB-EAI improved by
2.7% during September
when compared to the
preceding year and by 0.7%
in a m-o-m basis.
The EDB-EAI, s. a., moved to 120.3 points in September, a 2.7% raise when compared
to September 2020. This is the seventh increase after 12 y-o-y consecutive decreases,
due to the COVID-19 pandemic. The recovery in economic activity continues at a
moderate pace; which is consistent with labor reports pointing to personnel recruitment
difficulties and persistent employment vacancies. Furthermore, higher energy costs and
inflationary pressures due to current supply chain bottlenecks are also a concern. Given
how inconsistent the preventive measures to control the virus are being enforced from
country to country, and due to vaccine access inequality, no region in the world is
exempted from lingering economic consequences triggered by pandemic.
During fiscal year 2021, the EDB-EAI, s. a., decreased by 1.7% when compared to fiscal
year 2020, while for the first quarter of fiscal year 2022 it grew by 3.7%. The calendar
year 2020 showed a 5.0% reduction, the first annual decrease after two years of growth.
For the period (Jan-Sep) of calendar year 2021, it moved forward by 2.7%.
Total non-farm payroll employment, s. a., averaged 862,300 jobs in September; which
translates to a nominal upturn of 0.01% with respect to August in a m-o-m basis, and an
annual increase of 3.3%.
Electric power generation, s. a., for September 2021, totaled 1,625.4 million kWh,
decreasing by 2.2% in a m-o-m basis, while growing by 1.3% annually.
The preliminary estimate for gasoline consumption*, s. a., in September 2021 totaled
66.8 million gallons, showing a downturn of 0.1% with respect to August, and a 0.6%
increase when compared to September 2020.
Cement sales, s. a., totaled 1.3 million of 94lb. bags for September 2021, with an
expansion of 0.8% in a m-o-m basis, and an 11.4% decrease when compared to
September 2020.
Go to the Table of Content

Total non-farm payroll employment, s. a.,
averaged 862,300 employees in September. This
represents a nominal gain of 0.01% when compared
against the previous month. As well, it increased by
3.3% in a y-o-y basis.
Sources: BLS and PREPA. Seasonally Adjusted by EDB.
Total Non-Farm Payroll Employment*(Thousand of jobs)
650
700
750
800
850
900
950
Jul-1
4
Nov-1
4
Ma
r-15
Jul-1
5
Nov-1
5
Ma
r-16
Jul-1
6
Nov-1
6
Ma
r-17
Jul-1
7
Nov-1
7
Ma
r-18
Jul-1
8
Nov-1
8
Ma
r-19
Jul-1
9
Nov-1
9
Ma
r-20
Jul-2
0
Nov-2
0
Ma
r-21
Jul-2
1
Electric power generation**, s. a., for September
2021, totaled 1,625.4 million kWh; a 2.2% decrease
in a m-o-m basis, and an annual improvement of
1.3%.
Electric Power Generation*(Million of kWh)
0
500
1,000
1,500
2,000
2,500
Jul-1
4
Nov-1
4
Ma
r-15
Jul-1
5
Nov-1
5
Ma
r-16
Jul-1
6
Nov-1
6
Ma
r-17
Jul-1
7
Nov-1
7
Ma
r-18
Jul-1
8
Nov-1
8
Ma
r-19
Jul-1
9
Nov-1
9
Ma
r-20
Jul-2
0
Nov-2
0
Ma
r-21
Jul-2
1 * Seasonally adjusted with TRAMO-SEATS Method.
** The monthly electric power generation indicator includes
energy produced by petroleum, natural gas, coal and
renewable energy sources. The renewable energy is supplied
by utility-scale solar photovoltaic generating capacity, two wind
farms and landfill gases sources.
EDB-EAI Monthly Components (7/2014 to 9/2021)
11Go to the Table of Content

Sources: PRHTA and EDB. Seasonally Adjusted by EDB.
Cement sales, s. a., totaled 1.3 million of 94 lb. bags;
an upturn of 0.8% in a m-o-m basis for September
2021, whereas the annual change declined by 11.4%.
Cement Sales*(94lb. bags sold, in thousands)
0
200
400
600
800
1,000
1,200
1,400
1,600
Jul-1
4
Nov-1
4
Ma
r-15
Jul-1
5
Nov-1
5
Ma
r-16
Jul-1
6
Nov-1
6
Ma
r-17
Jul-1
7
Nov-1
7
Ma
r-18
Jul-1
8
Nov-1
8
Ma
r-19
Jul-1
9
Nov-1
9
Ma
r-20
Jul-2
0
Nov-2
0
Ma
r-21
Jul-2
1
The preliminary estimate of gasoline consumption**,
s. a., for September 2021 was 66.8 million gallons, or
0.1% below the previous month, while the annual
change up ticked by 0.6%.
Gasoline Consumption*(Millions of gallons)
0
20
40
60
80
100
120
Jul-1
4
Nov-1
4
Ma
r-15
Jul-1
5
Nov-1
5
Ma
r-16
Jul-1
6
Nov-1
6
Ma
r-17
Jul-1
7
Nov-1
7
Ma
r-18
Jul-1
8
Nov-1
8
Ma
r-19
Jul-1
9
Nov-1
9
Ma
r-20
Jul-2
0
Nov-2
0
Ma
r-21
Jul-2
1
* Seasonally adjusted with TRAMO-SEATS Method.
** The EDB applies a 3-month moving average adjustmentto the gasoline consumption data.
EDB-EAI Monthly Components (7/2014 to 9/2021)
12Go to the Table of Content

2013 2014 2015 2016 2017 2018 2019 2020 2021 2022
JULY 135.4 130.7 127.1 126.7 124.8 122.8 123.0 123.2 113.5 119.2
AUGUST 135.0 130.4 127.3 125.7 124.5 122.5 122.8 123.2 115.6 119.4
SEPTEMBER 135.0 130.6 126.5 125.2 124.4 115.3 122.6 123.0 117.1 120.3
OCTOBER 134.8 130.8 126.9 125.4 124.3 102.4 122.0 123.3 118.0
NOVEMBER 135.0 130.6 126.4 125.9 123.5 96.4 122.4 123.8 118.0
DECEMBER 134.6 130.2 127.0 125.9 123.4 101.0 122.1 124.0 118.0
JANUARY 134.6 129.3 126.9 125.7 122.3 112.9 122.1 122.7 118.8
FEBRUARY 134.0 128.8 127.5 125.2 122.7 117.9 121.7 122.1 119.3
MARCH 133.4 128.9 127.7 125.1 122.3 119.9 122.1 119.4 119.5
APRIL 132.6 129.5 127.9 124.8 122.9 120.8 122.2 114.4 119.2
MAY 132.1 128.8 128.0 125.0 122.9 121.9 122.6 110.7 119.4
JUNE 131.1 128.4 127.5 124.8 123.2 122.5 122.9 110.1 118.9
YEAR OVER YEAR PERCENTAGE CHANGE
2013 2014 2015 2016 2017 2018 2019 2020 2021 2022
JULY 1.4 -3.5 -2.8 -0.3 -1.5 -1.6 0.1 0.2 -7.9 5.0
AUGUST 1.5 -3.4 -2.4 -1.2 -0.9 -1.6 0.2 0.4 -6.2 3.3
SEPTEMBER 1.4 -3.3 -3.2 -1.0 -0.7 -7.3 6.4 0.3 -4.8 2.7
OCTOBER 0.7 -3.0 -3.0 -1.2 -0.9 -17.6 19.1 1.0 -4.3
NOVEMBER 0.0 -3.3 -3.3 -0.4 -1.9 -22.0 27.0 1.2 -4.6
DECEMBER -0.3 -3.3 -2.4 -0.9 -2.0 -18.1 20.8 1.5 -4.8
JANUARY -0.2 -4.0 -1.8 -1.0 -2.7 -7.7 8.1 0.5 -3.2
FEBRUARY -0.7 -3.9 -1.0 -1.8 -2.0 -3.9 3.2 0.3 -2.3
MARCH -1.1 -3.4 -0.9 -2.0 -2.2 -2.0 1.8 -2.2 0.1
APRIL -1.7 -2.3 -1.2 -2.4 -1.5 -1.7 1.1 -6.3 4.1
MAY -2.2 -2.5 -0.6 -2.3 -1.6 -0.8 0.5 -9.7 7.9
JUNE -3.3 -2.0 -0.7 -2.1 -1.3 -0.6 0.3 -10.4 8.0
SUMMARY DATA
2013 2014 2015 2016 2017 2018 2019 2020 2021 2022
FISCAL YEAR *
AVERAGE 134.0 129.7 127.2 125.5 123.4 114.7 122.4 120.0 117.9
DIFFERENCE -0.5 -4.2 -2.5 -1.8 -2.0 -8.7 7.7 -2.4 -2.0
% CHANGE -0.4 -3.2 -2.0 -1.4 -1.6 -7.1 6.7 -1.9 -1.7
JUL-SEP
AVERAGE 135.1 130.6 126.9 125.9 124.6 120.2 122.8 123.1 115.4 119.7
DIFFERENCE 1.9 -4.6 -3.6 -1.0 -1.3 -4.4 2.6 0.4 -7.7 4.2
% CHANGE 1.5 -3.4 -2.8 -0.8 -1.1 -3.5 2.2 0.3 -6.3 3.7
CALENDAR YEAR
AVERAGE 131.8 127.9 126.7 124.6 116.4 120.9 122.8 116.6
DIFFERENCE -3.3 -3.9 -1.2 -2.1 -8.2 4.5 1.9 -6.2
% CHANGE -2.4 -2.9 -0.9 -1.6 -6.6 3.9 1.6 -5.0
JAN-SEP
AVERAGE 132.2 128.3 127.0 124.9 121.9 120.5 122.5 116.2 119.3
DIFFERENCE -2.9 -3.9 -1.3 -2.1 -3.0 -1.4 2.1 -6.4 3.2
% CHANGE -2.1 -2.9 -1.0 -1.7 -2.4 -1.1 1.7 -5.2 2.7
* Runs from July of the previous year to June current year.
Source: EDB. *Base period: January 1980=100.
EDB Economic Activity Index* 2013-2022
13Go to the Table of Content

Source: BLS. Seasonally Adjusted by EDB.
Total Non-Farm Payroll Employment, s. a., (000’s) 2013-2022
14Go to the Table of Content
2013 2014 2015 2016 2017 2018 2019 2020 2021 2022
JULY 941.4 923.9 908.4 901.1 894.8 874.7 866.5 878.6 815.3 855.7
AUGUST 941.9 924.3 908.3 899.5 893.2 874.3 867.8 880.0 826.8 862.2
SEPTEMBER 942.8 921.0 907.3 898.9 895.0 869.4 869.0 882.7 835.1 862.3
OCTOBER 942.0 920.0 907.0 897.9 894.2 828.6 869.2 884.3 840.9
NOVEMBER 940.1 918.9 906.9 895.9 891.8 840.0 871.9 885.3 844.4
DECEMBER 939.6 918.3 906.1 895.8 891.5 860.2 871.7 885.4 835.4
JANUARY 936.0 915.9 905.6 896.0 888.9 851.2 875.9 883.6 852.4
FEBRUARY 934.8 915.2 905.2 894.9 887.0 855.2 876.3 884.9 853.6
MARCH 933.7 913.6 904.9 894.1 886.1 856.5 878.1 885.4 849.3
APRIL 930.1 912.0 904.8 893.9 883.0 860.5 877.9 766.8 851.3
MAY 929.2 912.6 901.8 893.9 881.7 862.2 878.6 771.8 849.7
JUNE 928.2 909.3 900.8 893.6 879.8 863.5 880.0 796.0 852.5
YEAR OVER YEAR PERCENTAGE CHANGE
2013 2014 2015 2016 2017 2018 2019 2020 2021 2022
JULY 1.7 -1.8 -1.7 -0.8 -0.7 -2.2 -0.9 1.4 -7.2 5.0
AUGUST 2.0 -1.9 -1.7 -1.0 -0.7 -2.1 -0.7 1.4 -6.0 4.3
SEPTEMBER 1.9 -2.3 -1.5 -0.9 -0.4 -2.9 0.0 1.6 -5.4 3.3
OCTOBER 1.7 -2.3 -1.4 -1.0 -0.4 -7.3 4.9 1.7 -4.9
NOVEMBER 1.1 -2.2 -1.3 -1.2 -0.5 -5.8 3.8 1.5 -4.6
DECEMBER 1.2 -2.3 -1.3 -1.1 -0.5 -3.5 1.3 1.6 -5.6
JANUARY 0.2 -2.1 -1.1 -1.1 -0.8 -4.2 2.9 0.9 -3.5
FEBRUARY 0.1 -2.1 -1.1 -1.1 -0.9 -3.6 2.5 1.0 -3.5
MARCH -0.1 -2.1 -1.0 -1.2 -0.9 -3.3 2.5 0.8 -4.1
APRIL -0.9 -1.9 -0.8 -1.2 -1.2 -2.5 2.0 -12.7 11.0
MAY -1.0 -1.8 -1.2 -0.9 -1.4 -2.2 1.9 -12.2 10.1
JUNE -1.4 -2.0 -0.9 -0.8 -1.5 -1.9 1.9 -9.5 7.1
SUMMARY DATA
2013 2014 2015 2016 2017 2018 2019 2020 2021 2022
FISCAL YEAR *
AVERAGE 936.6 917.1 905.6 896.3 888.9 858.0 873.6 857.1 842.2
DIFFERENCE 5.0 -19.5 -11.5 -9.3 -7.4 -30.9 15.6 -16.5 -14.8
% CHANGE 0.5 -2.1 -1.3 -1.0 -0.8 -3.5 1.8 -1.9 -1.7
JUL-SEP
AVERAGE 942.0 923.1 908.0 899.8 894.3 872.8 867.8 880.4 825.7 860.1
DIFFERENCE 17.6 -18.9 -15.0 -8.2 -5.5 -21.5 -5.0 12.6 -54.7 34.4
% CHANGE 1.9 -2.0 -1.6 -0.9 -0.6 -2.4 -0.6 1.5 -6.2 4.2
CALENDAR YEAR
AVERAGE 926.5 910.2 901.0 893.9 871.1 863.8 880.3 832.2
DIFFERENCE -12.5 -16.3 -9.2 -7.1 -22.8 -7.4 16.5 -48.1
% CHANGE -1.3 -1.8 -1.0 -0.8 -2.5 -0.8 1.9 -5.5
JAN-SEP
AVERAGE 929.0 911.4 902.5 894.4 880.5 861.4 878.7 829.5 854.3
DIFFERENCE -9.6 -17.6 -8.9 -8.1 -13.8 -19.2 17.3 -49.2 24.8
% CHANGE -1.0 -1.9 -1.0 -0.9 -1.5 -2.2 2.0 -5.6 3.0
* Runs from July of the previous year to June current year.

2013 2014 2015 2016 2017 2018 2019 2020 2021 2022
JULY 1,846.6 1,761.1 1,752.6 1,738.0 1,711.2 1,681.3 1,533.8 1,577.7 1,602.0 1,632.5
AUGUST 1,831.0 1,795.7 1,727.5 1,719.7 1,716.7 1,693.8 1,505.9 1,579.0 1,626.7 1,661.8
SEPTEMBER 1,887.7 1,813.9 1,712.3 1,729.6 1,634.5 883.2 1,535.6 1,603.4 1,605.2 1,625.4
OCTOBER 1,854.8 1,793.9 1,766.2 1,749.4 1,698.6 286.9 1,494.5 1,593.8 1,572.6
NOVEMBER 1,894.8 1,783.2 1,734.8 1,720.3 1,680.1 787.9 1,534.3 1,601.3 1,559.7
DECEMBER 1,842.8 1,749.2 1,715.8 1,754.9 1,720.1 1,075.4 1,533.6 1,609.6 1,551.7
JANUARY 1,829.8 1,792.7 1,757.6 1,742.9 1,664.1 1,243.0 1,517.9 1,427.3 1,563.3
FEBRUARY 1,814.2 1,773.8 1,767.0 1,731.2 1,693.8 1,231.9 1,527.6 1,539.3 1,536.0
MARCH 1,823.4 1,826.1 1,739.4 1,724.5 1,679.2 1,391.4 1,569.8 1,496.9 1,579.8
APRIL 1,818.5 1,783.8 1,763.1 1,758.1 1,670.7 1,427.2 1,550.8 1,518.8 1,588.3
MAY 1,789.2 1,737.1 1,762.3 1,747.0 1,690.6 1,446.1 1,559.5 1,576.0 1,616.2
JUNE 1,741.6 1,764.9 1,723.2 1,726.9 1,650.9 1,509.6 1,583.4 1,600.9 1,511.3
YEAR OVER YEAR PERCENTAGE CHANGE
2013 2014 2015 2016 2017 2018 2019 2020 2021 2022
JULY 0.7 -4.6 -0.5 -0.8 -1.5 -1.7 -8.8 2.9 1.5 1.9
AUGUST 1.9 -1.9 -3.8 -0.5 -0.2 -1.3 -11.1 4.9 3.0 2.2
SEPTEMBER 1.6 -3.9 -5.6 1.0 -5.5 -46.0 73.9 4.4 0.1 1.3
OCTOBER -0.4 -3.3 -1.5 -0.9 -2.9 -83.1 420.9 6.6 -1.3
NOVEMBER 1.8 -5.9 -2.7 -0.8 -2.3 -53.1 94.7 4.4 -2.6
DECEMBER 0.1 -5.1 -1.9 2.3 -2.0 -37.5 42.6 5.0 -3.6
JANUARY -0.8 -2.0 -2.0 -0.8 -4.5 -25.3 22.1 -6.0 9.5
FEBRUARY 0.0 -2.2 -0.4 -2.0 -2.2 -27.3 24.0 0.8 -0.2
MARCH 0.0 0.2 -4.7 -0.9 -2.6 -17.1 12.8 -4.6 5.5
APRIL -1.5 -1.9 -1.2 -0.3 -5.0 -14.6 8.7 -2.1 4.6
MAY -3.1 -2.9 1.4 -0.9 -3.2 -14.5 7.8 1.1 2.6
JUNE -8.8 1.3 -2.4 0.2 -4.4 -8.6 4.9 1.1 -5.6
SUMMARY DATA
2013 2014 2015 2016 2017 2018 2019 2020 2021 2022
FISCAL YEAR *
TOTAL 21,974.3 21,375.4 20,921.7 20,842.5 20,210.6 14,657.7 18,446.5 18,724.0 18,912.9
DIFFERENCE -161.9 -598.9 -453.8 -79.2 -631.9 -5,552.9 3,788.9 277.5 188.9
% CHANGE -0.7 -2.7 -2.1 -0.4 -3.0 -27.5 25.8 1.5 1.0
JUL-SEP
TOTAL 5,565.3 5,370.7 5,192.4 5,187.3 5,062.4 4,258.3 4,575.3 4,760.0 4,833.9 4,919.6
DIFFERENCE 75.8 -194.6 -178.3 -5.1 -124.9 -804.1 317.0 184.7 73.9 85.7
% CHANGE 1.4 -3.5 -3.3 -0.1 -2.4 -15.9 7.4 4.0 1.6 1.8
CALENDAR YEAR
TOTAL 21,513.7 21,087.5 20,924.5 20,591.8 16,457.9 17,386.8 18,873.6 18,677.2
DIFFERENCE -726.7 -426.2 -163.0 -332.7 -4,133.9 928.9 1,486.8 -196.5
% CHANGE -3.3 -2.0 -0.8 -1.6 -20.1 5.6 8.6 -1.0
JAN-SEP
TOTAL 16,187.4 15,870.8 15,699.8 15,493.0 14,307.7 12,824.4 14,068.9 13,993.1 14,314.5
DIFFERENCE -460.7 -316.6 -170.9 -206.9 -1,185.3 -1,483.2 1,244.4 -75.7 321.4
% CHANGE -2.8 -2.0 -1.1 -1.3 -7.7 -10.4 9.7 -0.5 2.3
* Runs from July of the previous year to June current year.
Source: PREPA. Seasonally Adjusted by EDB.
Electric Energy Generation, s. a., (mm kWh) 2013-2022
15Go to the Table of Content

2013 2014 2015 2016 2017 2018 2019 2020 2021 2022
JULY 85.1 85.4 75.4 78.0 83.4 80.7 83.5 77.0 61.8 66.1
AUGUST 83.4 81.8 84.4 78.9 82.1 81.3 79.0 76.7 64.6 66.9
SEPTEMBER 83.3 82.0 77.9 80.0 82.6 80.0 79.2 76.4 66.4 66.8
OCTOBER 83.1 86.7 81.1 83.6 84.9 81.9 80.4 76.0 66.2
NOVEMBER 84.8 84.3 78.3 86.5 78.4 87.8 80.1 77.2 67.1
DECEMBER 87.7 85.0 84.0 81.5 76.5 92.2 76.4 76.8 68.2
JANUARY 87.0 76.6 82.6 83.2 74.2 96.9 75.8 78.7 69.7
FEBRUARY 84.7 81.6 84.7 80.8 78.7 93.2 75.7 77.8 68.4
MARCH 85.6 79.9 86.1 85.3 79.8 88.8 76.4 75.1 66.8
APRIL 81.1 87.8 86.2 80.8 82.5 84.8 76.9 70.3 67.3
MAY 85.8 77.1 84.2 83.7 82.3 86.1 77.7 64.8 67.0
JUNE 83.3 81.4 81.7 81.6 84.9 85.9 79.6 61.3 67.6
YEAR OVER YEAR PERCENTAGE CHANGE
2013 2014 2015 2016 2017 2018 2019 2020 2021 2022
JULY -4.8 0.3 -11.7 3.4 7.0 -3.2 3.5 -7.8 -19.7 6.9
AUGUST -4.2 -1.9 3.2 -6.5 4.1 -0.9 -2.9 -2.8 -15.8 3.5
SEPTEMBER -5.2 -1.6 -5.1 2.8 3.3 -3.1 -1.1 -3.5 -13.1 0.6
OCTOBER -5.7 4.3 -6.5 3.1 1.5 -3.6 -1.9 -5.4 -13.0
NOVEMBER -0.5 -0.7 -7.1 10.5 -9.3 11.9 -8.8 -3.6 -13.1
DECEMBER 5.0 -3.1 -1.2 -3.0 -6.1 20.5 -17.2 0.5 -11.2
JANUARY 0.5 -11.9 7.9 0.7 -10.8 30.6 -21.8 3.8 -11.5
FEBRUARY -2.5 -3.7 3.8 -4.5 -2.7 18.5 -18.8 2.7 -12.0
MARCH 1.8 -6.7 7.8 -1.0 -6.4 11.3 -14.0 -1.7 -11.0
APRIL -5.5 8.4 -1.9 -6.3 2.2 2.8 -9.4 -8.5 -4.3
MAY -0.5 -10.2 9.3 -0.6 -1.7 4.7 -9.8 -16.7 3.5
JUNE 0.2 -2.2 0.4 -0.1 3.9 1.2 -7.3 -23.1 10.3
SUMMARY DATA
2013 2014 2015 2016 2017 2018 2019 2020 2021 2022
FISCAL YEAR
TOTAL 1,014.9 989.4 986.5 983.9 970.2 1,039.7 940.5 888.0 801.1
DIFFERENCE -18.8 -25.4 -2.9 -2.6 -13.7 69.5 -99.2 -52.6 -86.9
% CHANGE -1.8 -2.5 -0.3 -0.3 -1.4 7.2 -9.5 -5.6 -9.8
JUL-SEP
TOTAL 251.8 249.2 237.7 236.9 248.1 242.1 241.6 230.1 192.9 199.8
DIFFERENCE -12.4 -2.7 -11.5 -0.8 11.2 -6.0 -0.5 -11.5 -37.3 6.9
% CHANGE -4.7 -1.1 -4.6 -0.3 4.7 -2.4 -0.2 -4.8 -16.2 3.6
CALENDAR YEAR
TOTAL 1,012.5 965.3 994.0 983.4 986.2 1,014.2 922.1 822.2
DIFFERENCE -7.5 -47.3 28.7 -10.6 2.9 28.0 -92.1 -100.0
% CHANGE -0.7 -4.7 3.0 -1.1 0.3 2.8 -9.1 -10.8
JAN-SEP
TOTAL 756.5 721.9 742.4 743.5 724.3 777.4 692.2 620.7 606.6
DIFFERENCE -7.8 -34.6 20.4 1.2 -19.2 53.1 -85.2 -71.4 -14.2
% CHANGE -1.0 -4.6 2.8 0.2 -2.6 7.3 -11.0 -10.3 -2.3
* Runs from July of the previous year to June current year.
*The EDB applies a three (3)-month moving average adjustment to the gasoline consumption data.
Source: PRHTA. Seasonally Adjusted by EDB.
Gasoline Consumption*, s. a., Million of Gallons 2012-2021
16Go to the Table of Content

Source: compiled by EDB. Seasonally Adjusted by EDB.
Cement Sales, s. a., (000’s of 94lb. Bags) 2013-2022
17Go to the Table of Content
2013 2014 2015 2016 2017 2018 2019 2020 2021 2022
JULY 1,569.5 1,286.6 1,197.5 1,151.9 968.1 963.8 1,198.8 1,106.4 1,370.2 1,331.7
AUGUST 1,557.1 1,376.5 1,117.5 1,028.0 968.9 973.1 1,200.2 1,110.9 1,444.0 1,250.0
SEPTEMBER 1,714.4 1,289.7 1,113.8 1,054.7 1,013.6 315.4 1,214.1 1,074.9 1,422.6 1,260.1
OCTOBER 1,520.3 1,298.0 1,169.2 1,047.0 938.9 474.7 1,104.6 1,160.7 1,321.8
NOVEMBER 1,495.4 1,319.6 1,113.9 1,041.3 858.6 723.8 1,189.4 1,202.6 1,228.9
DECEMBER 1,453.6 1,137.0 1,189.6 1,009.1 1,023.6 1,013.0 1,147.8 1,092.8 1,472.7
JANUARY 1,503.2 1,314.1 1,112.5 996.1 955.5 1,114.3 1,152.6 919.7 1,417.5
FEBRUARY 1,446.6 1,261.6 1,099.7 992.4 1,026.7 1,161.3 1,107.1 1,050.3 1,344.2
MARCH 1,366.0 1,259.1 1,171.5 938.5 906.8 1,220.0 1,153.8 466.7 1,373.6
APRIL 1,442.8 1,262.3 1,103.9 962.8 994.0 1,283.5 1,058.1 442.3 1,299.9
MAY 1,294.0 1,206.9 1,185.9 964.8 990.0 1,263.2 1,124.7 1,257.0 1,408.7
JUNE 1,232.6 1,227.2 1,183.5 951.9 970.2 1,194.5 1,138.7 1,477.4 1,199.9
YEAR OVER YEAR PERCENTAGE CHANGE
2013 2014 2015 2016 2017 2018 2019 2020 2021 2022
JULY 5.0 -18.0 -6.9 -3.8 -16.0 -0.4 24.4 -7.7 23.8 -2.8
AUGUST 24.1 -11.6 -18.8 -8.0 -5.7 0.4 23.3 -7.4 30.0 -13.4
SEPTEMBER 8.4 -24.8 -13.6 -5.3 -3.9 -68.9 285.0 -11.5 32.3 -11.4
OCTOBER -18.3 -14.6 -9.9 -10.4 -10.3 -49.4 132.7 5.1 13.9
NOVEMBER -12.6 -11.8 -15.6 -6.5 -17.5 -15.7 64.3 1.1 2.2
DECEMBER -19.4 -21.8 4.6 -15.2 1.4 -1.0 13.3 -4.8 34.8
JANUARY -13.7 -12.6 -15.3 -10.5 -4.1 16.6 3.4 -20.2 54.1
FEBRUARY -15.7 -12.8 -12.8 -9.8 3.5 13.1 -4.7 -5.1 28.0
MARCH -17.4 -7.8 -7.0 -19.9 -3.4 34.5 -5.4 -59.6 194.3
APRIL -14.5 -12.5 -12.5 -12.8 3.2 29.1 -17.6 -58.2 193.9
MAY -24.0 -6.7 -1.7 -18.6 2.6 27.6 -11.0 11.8 12.1
JUNE -27.4 -0.4 -3.6 -19.6 1.9 23.1 -4.7 29.7 -18.8
SUMMARY DATA
2013 2014 2015 2016 2017 2018 2019 2020 2021 2022
FISCAL YEAR
TOTAL 17,595.5 15,238.7 13,758.7 12,138.7 11,614.9 11,700.8 13,790.0 12,361.7 16,304.2
DIFFERENCE -2,309.0 -2,356.8 -1,480.0 -1,620.0 -523.8 85.9 2,089.3 -1,428.3 3,942.4
% CHANGE -11.6 -13.4 -9.7 -11.8 -4.3 0.7 17.9 -10.4 31.9
JUL-SEP
TOTAL 4,841.0 3,952.8 3,428.8 3,234.7 2,950.6 2,252.3 3,613.1 3,292.3 4,236.8 3,841.7
DIFFERENCE 510.6 -888.2 -523.9 -194.2 -284.1 -698.3 1,360.9 -320.9 944.5 -395.0
% CHANGE 11.8 -18.3 -13.3 -5.7 -8.8 -23.7 60.4 -8.9 28.7 -9.3
CALENDAR YEAR
TOTAL 15,992.6 14,432.9 13,189.2 11,578.2 10,307.0 14,291.8 13,483.5 13,873.6
DIFFERENCE -3,515.7 -1,559.8 -1,243.6 -1,611.0 -1,271.2 3,984.8 -808.4 390.2
% CHANGE -18.0 -9.8 -8.6 -12.2 -11.0 38.7 -5.7 2.9
JAN-SEP
TOTAL 12,238.0 10,960.1 10,091.8 8,757.1 8,095.4 10,850.0 10,027.4 9,850.2 11,885.7
DIFFERENCE -2,801.0 -1,277.9 -868.4 -1,334.6 -661.7 2,754.6 -822.7 -177.2 2,035.5
% CHANGE -18.6 -10.4 -7.9 -13.2 -7.6 34.0 -7.6 -1.8 20.7
* Runs from July of the previous year to June current year.

EDB Economic Activity Index Historical Graph
from January 1980 to September 2021
80
90
100
110
120
130
140
150
160
Jan
-80
Nov-8
0
Se
p-8
1
Jul-
82
Ma
y-8
3
Ma
r-8
4
Jan
-85
Nov-8
5
Se
p-8
6
Jul-
87
Ma
y-8
8
Ma
r-8
9
Jan
-90
Nov-9
0
Se
p-9
1
Jul-
92
Ma
y-9
3
Ma
r-9
4
Jan
-95
Nov-9
5
Se
p-9
6
Jul-
97
Ma
y-9
8
Ma
r-9
9
Jan
-00
Nov-0
0
Se
p-0
1
Jul-
02
Ma
y-0
3
Ma
r-0
4
Jan
-05
Nov-0
5
Se
p-0
6
Jul-
07
Ma
y-0
8
Ma
r-0
9
Jan
-10
Nov-1
0
Se
p-1
1
Jul-
12
Ma
y-1
3
Ma
r-1
4
Jan
-15
Nov-1
5
Se
p-1
6
Jul-
17
Ma
y-1
8
Ma
r-1
9
Jan
-20
Nov-2
0
Se
p-2
1
Ind
ex (
Ja
nu
ary
19
80
=1
00
)
Recession Periods
EDB-EAI
18
The complete series of the EAI concurs with the economic cycles of the Puerto Rico’s economy. It starts in January 1980 and exhibits the recession of FY1979 to FY1983, the
subsequent recuperation period, the mild recession of FY1991 with its expansion phase, and the recession of 2001. It also shows the downward path of the Index since the
beginning of the 2006 recession with a recuperation episode in 2012, after which the EAI resumed its descendent trend in 2013. The collapse experienced after hurricanes Irma
and Maria struck the Island in September 2017, and the subsequent effect of the recovery efforts are also displayed. The last drop corresponds to the January 7th, 2020,
earthquakes and its related aftershocks, compounded by the burdens that the COVID-19 global pandemic stresses on the economic activity.
Source: EDB.
Puerto Rico’s Fiscal Crisis,
Subprime Mortgage
Market Meltdown
Hurricane
Hugo
Sept. 1989
Recession
1979-83
Hurricanes
Irma &
María
Sept. 2017
Hurricane
Georges
Sept. 1998COFINA,
ARRA Funds,
Medicaid Funds
Local Stimulus
Program
Tax Reform
Act 154 Excise Tax
Recession
2001
Recession
1991
Earthquakes
& COVID-19
Pandemic
Go to the Table of Content

In September 2021, the EDB-EAI increased by 2.7% in a y-o-y basis and by 0.7% when compared to the previous month.
126.9
127.5
127.7
127.9
128.0
127.5
126.7
125.7
125.2
125.4
125.9
125.9
125.7
125.2
125.1
124.8
125.0
124.8
124.8
124.5
124.4
124.3
123.5
123.4
122.3
122.7
122.3
122.9
122.9
123.2
122.8
122.5
115.3
102.4
96.4
101.0
112.9
117.9
119.9
120.8
121.9
122.5
123.0
122.8
122.6
122.0
122.4
122.1
122.1
121.7
122.1
122.2
122.6
122.9
123.2
123.2
123.0
123.3
123.8
124.0
122.7
122.1
119.4
114.4
110.7
110.1
113.5
115.6
117.1
118.0
118.0
118.0
118.8
119.3
119.5
119.2
119.4
118.9
119.2
119.4
120.3
-1.8
%-1
.0%
-0.9
%-1
.2%
-0.6
%-0
.7%
-0.3
%-1
.2%
-1.0
%-1
.2%
-0.4
%-0
.9%
-1.0
%-1
.8%
-2.0
%-2
.4%
-2.3
%-2
.1%
-1.5
%-0
.9%
-0.7
%-0
.9%
-1.9
%-2
.0%
-2.7
%-2
.0%
-2.2
%-1
.5%
-1.6
%-1
.3%
-1.6
%-1
.6%
-7.3
%-1
7.6
%-2
2.0
%-1
8.1
%-7
.7%
-3.9
% -2.0
%-1
.7%
-0.8
%-0
.6%
0.1
%0.2
%6.4
%19.1
%27.0
%20.8
%8.1
%3.2
%1.8
%1.1
%0.5
%0.3
%0.2
%0.4
%0.3
%1.0
%1.2
%1.5
%0.5
%0.3
%-2
.2%
-6.3
%-9
.7%
-10.4
% -7.9
%-6
.2%
-4.8
%-4
.3%
-4.6
%-4
.8%
-3.2
%-2
.3% 0
.1%
4.1
%7.9
%8.0
%5.0
%3.3
%2.7
%
-0.1
%0.4
%0.2
%0.2
%0.0
%-0
.4%
-0.6
%-0
.8%
-0.4
%0.1
%0.4
%0.0
%-0
.2%
-0.4
%-0
.1%
-0.2
%0.2
%-0
.2%
0.0
%-0
.2%
-0.1
%0.0
%-0
.6%
-0.1
%-0
.9%
0.3
%-0
.3%
0.5
%0.0
%0.2
%-0
.3%
-0.2
%-5
.9%
-11.1
%-5
.9%
4.8
%
11.8
%4.4
%1.7
%0.7
%0.9
%0.5
%0.4
%-0
.2%
-0.1
%-0
.5%
0.3
%-0
.2%
0.0
%-0
.4%
0.3
%0.1
%0.3
%0.3
%0.2
%0.0
%-0
.2%
0.2
%0.4
%0.1
%-1
.0%
-0.5
%-2
.2%
-4.2
%-3
.3% -0
.5%
3.1
%1.9
%1.3
%0.8
%0.0
%0.0
%0.6
%0.4
%0.2
%-0
.3%
0.2
%-0
.4%
0.2
%0.2
%0.7
%
-30%
-20%
-10%
0%
10%
20%
30%
95
100
105
110
115
120
125
130
Jan
-15
Ap
r-15
Jul-
15
Oct-
15
Jan
-16
Ap
r-16
Jul-
16
Oct-
16
Jan
-17
Ap
r-17
Jul-
17
Oct-
17
Jan
-18
Ap
r-18
Jul-
18
Oct-
18
Jan
-19
Ap
r-19
Jul-
19
Oct-
19
Jan
-20
Ap
r-20
Jul-
20
Oct-
20
Jan
-21
Ap
r-21
Jul-
21
Ind
ex
(Ja
nu
ary
19
80
= 1
00
)
Value Year-over-year percent change Month-over-month percent change
Source: EDB.
EDB Economic Activity Index Growth Rates Comparison
From January 2015 to September 2021
19Go to the Table of Content

20
Conclusions
The EDB-EAI reached 120.3 points in September 2021 whichis an upturn of 0.8% in a m-o-m basis. On a y-o-y basis, theIndex recovered by 2.7%.
The EDB-EAI declined by 1.7% during fiscal year 2021 (July– June), while it grew by 3.7% for the first quarter of fiscalyear 2022. The calendar year 2020 closed with a drop of5.0%. During the period Jan-Sep of calendar year 2021, itimproved by 2.7%. All the percent changes are the result of ay-o-y comparison.
The EDB-EAI y-o-y percent change increased for 20consecutive months, in tandem with the recovery effortsthat followed hurricanes Irma and Maria, and up until Marchof 2020, when the stricter containment measures to halt thespread of the COVID-19 pandemic were put into effect.
Hence, the EDB-EAI exhibited twelve consecutive monthswith annual decreases since March 2020, although the trendchanged as of March 2021, trailing henceforth animprovement in the economic activity.
However, to maintain a sustainable economic growth theemployment sectors most affected by the pandemic crisis(that are: services in entertainment and hospitality, educationand health, among others) have yet to recover. Alternatively,the resulting job losses would need to be absorbed by otherindustries.
Difficulties in the recruitment of personnel, unavailability ofmanufacturing materials, higher energy costs and a shortageof warehouse space and overwhelmed U.S. entry ports, aresome of the key elements responsible for the current supplychain pressures, which have been tangled further byregionally variable COVID-19 preventive measures anddisproportionate access to the vaccines.
Also, if the virus continues to circulate around the world, therecovery cannot be taken for granted in any region. Thus,affecting supply chains and production in other areas of theglobe, and, consequently, the economic recovery.
During September 2021, two of the Index’s four s. a.components registered monthly growth: non-farm payrollemployment (0.01%) and cement sales (0.8%); meanwhilegasoline consumption and electric energy generationdeclined by 0.1% and 2.2%, respectively.
When compared against the same month from the previousyear (September 2020), three components improved: non-farm payroll employment (3.3%), gasoline consumption(0.6%) and electric energy generation (1.3%), while cementsales displayed a decrease of 11.4%. The annual comparisonanalysis exhibit the effects of the pandemic lockdown.
Go to the Table of Content

Mrs. Gladys L. Medina Claudio
Economist • Office of Economic Studies
Tel: 787-641-4300
[email protected] • www.bde.pr.gov
CONTACT
INFORMATION
Mr. Juan C. González -Ruiz
Economist • Office of Economic Studies
Tel: 787-641-4300
[email protected] • www.bde.pr.gov
Go to the Table of Content