Embed Size (px)
Citation preview

RICHARD T ELY LECTURE
The Quiet Revolution That Transformed Womenrsquos EmploymentEducation and Family
By CLAUDIA GOLDIN
I Evolutionary and Revolutionary Phases
Womenrsquos increased involvement in the econ-omy was the most significant change in labormarkets during the past century Their moderneconomic role emerged in the United States infour distinct phases The first three were evolu-tionary the last was revolutionary The rev-olution was a ldquoquietrdquo one not the ldquobig-bangrdquotype The evolutionary phases led slowly tothe revolutionary phase First I will discussthe three evolutionary phases and how theyled to the revolutionary phase I will thendescribe the changes that occurred during therevolutionary phase and end with whether therevolution as some have claimed is stalled orbeing reversed
I am not using the terms ldquoevolutionrdquo andldquorevolutionrdquo lightly By the term evolution andthe shift to revolution I mean something quitespecific The distinction between the two per-tains to three aspects of womenrsquos choices anddecisions The first concerns ldquohorizonrdquo that iswhether at the time of human capital investmenta woman perceives that her lifetime labor forceinvolvement will be long and continuous orintermittent and brief The second concerns
ldquoidentityrdquo1 that is whether a woman findsindividuality in her job occupation profes-sion or career The third concerns ldquodecisionmakingrdquo Here the distinction is whether laborforce decisions are made fully jointly if a womanis married or in a long-term relationship or on theother hand whether the woman is a ldquosecondaryworkerrdquo who optimizes her time allocation bytaking her husbandrsquos labor market decisions asgiven to her
Thus the transition from evolution to rev-olution was a change from static decision-making with limited or intermittent horizonsto dynamic decision-making with long-termhorizons It was a change from agents whowork because they and their families ldquoneedthe moneyrdquo to those who are employed atleast in part because occupation and employ-ment define onersquos fundamental identity andsocietal worth It involved a change fromldquojobsrdquo to ldquocareersrdquo where the distinction be-tween these two concepts concerns both ho-rizon and human capital investment2 Those
Department of Economics Harvard University Cam-bridge MA 02138 and National Bureau of Economic Re-search (e-mail cgoldinharvardedu) I am grateful toLawrence F Katz for an embarrassingly large amount ofguidance I am indebted to the Andrew W Mellon Foun-dation for providing access to the College and Beyonddataset and for research funds provided to the RadcliffeInstitute for Advanced Study where I am Katherine Hamp-son Bessell Fellow for 2005ndash2006 Claudia Olivetti andBruce Weinberg were enormously generous in their provi-sion of data and advice Lisa Blau Kahn was instrumental inher assistance in using various datasets and Crystal Yangprovided able assistance on many details First and fore-most I thank George Akerlof for inviting me to present thislecture
1 George A Akerlof and Rachel E Kranton (2000) con-sider how individualsrsquo conception of their identity affectstheir social interactions
2 The distinction used here between ldquojobrdquo and ldquocareerrdquoconcerns the degree to which the individual believes shewill be in the labor force for a sufficient time to engagein substantial human capital investment both in formalschooling and on-the-job training Those whose partici-pation will be intermittent will take positions that involveless depreciation during work absences whereas thosewith a long time horizon of employment will take posi-tions that require more formal education involve moreinternal promotion and have a greater loss from out-of-work spells These notions are similar to those in JacobMincer and Solomon Polachek (1974) and are consistentwith the dictionary definition of ldquocareerrdquo eg ldquoin modlanguage [after Fr carriere] freq used for A course ofprofessional life or employment which affords opportu-nity for progress or advancement in the worldrdquo (OxfordEnglish Dictionary)
1
in the evolutionary phases married earlyenough that their adult identity was formedafter marriage whereas those in the revolu-tionary phase married late enough that theiridentity formation could precede marriage Itwas a change from passive actors who takethe income and time allocation of other mem-bers as given to active participants who bar-gain somewhat effectively in the householdand the labor market
The shift from evolution to revolution more-over did not occur among only more highly ed-ucated women although they will be a focus ofthis essay Rather the changes were far moreuniversal as can be seen in data on the age at firstmarriage divorce number and timing of childrenrelative earnings and labor market attachment
A chronology of the evolutionary phases isneeded to understand the forces that led each tomorph into the other and ultimately to the rev-olutionary phase Some change occurs to co-horts and some is by period Because workingwomen range in age typically from their lateteens to their sixties these precise dates shouldbe considered with respect to women in theirthirties The chronology may be a bit different ifanother age group is chosen
Phase I occurred from the late nineteenthcentury to the 1920s Phase II a transition erawas from about 1930 to 1950 and Phase III theldquoroots of the revolutionrdquo took place from 1950to around the mid- to late-1970s I date PhaseIV the quiet revolution as beginning in thelate-1970s when the birth cohorts of the late1940s were in their early thirties and continu-ing to the present for the revolution is not over
What economic and social indicators reveal theoutcomes of the phases The primary series usedto demonstrate economic and social change islabor force participation as well as the relatedseries on annual hours of work and full-time workBut these series I will show reveal more aboutthe evolutionary phases rather than the revolution-ary phase One must seek other series for evidenceof the revolutionary phase
The series on labor force participation full-time work and annual hours of work are fairlycontinuous albeit with some periods of quick-ening Although they do not reveal sharpchanges the increase in participation and thegreater number of hours worked by women wasa critical prerequisite for the transition from theevolutionary to the revolutionary phase More
important though is that labor force participa-tion by itself is not revolutionary in the sensethat I am using the word Increased participationand greater hours of work need not involvechanges in horizon identity and decision-making Women in poor countries for exampleare often employed in the paid labor force to aconsiderable degree but few would claim theywere part of a societal and economic revolutionAdult women were employed in the UnitedStates historically Yet prior to the 1940s em-ployed married women came disproportionatelyfrom the lower part of the education distribu-tion Their identities just like that of women inpoor countries were not found in their occupa-tions Their decisions were made as secondaryworkers and their market work effort evapo-rated when family incomes rose sufficiently3
The various series that disclose the revolution-ary phase are wide ranging They include theexpectations of future employment by teenagedgirls the determinants of life satisfaction variousinvestments in human capital (such as collegeenrollment and graduation college majors enroll-ment in and graduation from professional andgraduate schools) earnings relative to comparablemen labor force participation of women with in-fants lifetime labor force participation the age atfirst marriage and the fraction of onersquos life spentmarried Each of these series contains a sharpbreak or inflection point signifying social changeThese inflection points moreover are remarkablycoincident in the approximately ten series I willpresent
The revolutionary part of the processmdashlikemany revolutionsmdashwas preceded by fundamentallong-run and evolutionary changes that were nec-essary but not sufficient for the revolutionaryphase Before I get to the revolutionary phase Imust first explore the three evolutionary phasesconvince you that there was evolutionary and thenrevolutionary change and account for thechanges I will in addition link the evolutionarychanges to pioneering contributions to the subjectof labor economics mainly labor supply I willthen turn to the revolutionary period and addresswhether an authentic long-lasting revolution oc-curred or whether the revolution has stalled or
3 On the U-shaped relationship between economic devel-opment and female labor force participation see Goldin(1995)
2 AEA PAPERS AND PROCEEDINGS MAY 2006
reversed Although much that I have to say is wellknown and widely accepted I promise to providenewly uncovered facts and interpretations
II The Three Phases of Evolutionary Changeand the Birth of Modern Labor Economics
The evolutionary period as I have notedoccurred in three phases The shifts from onephase to the next were due to various exogenouschanges These changes include the increasedrelative demand for female office workers in theearly twentieth century which made ldquonicerdquo jobsavailable and the growth of educational insti-tutions at the secondary level from the 1910s tothe 1940s which greatly increased the supply ofpotential office workers Changes in householdproduction technology from the 1920s to the1940s also altered female labor supply as didinstitutional changes that made part-time workreadily available and dispensed with barriers tothe employment of married women
Each of the phases produced different mag-nitudes for the two key parameters of laborsupply the own-wage (compensated) elasticityand the income elasticity of the Slutsky equa-tion When considerable social stigma existedconcerning the paid work of wives the incomeeffect was large (and negative) When at thesame time the substitution effect was smallincreased demand could do little to increasewomenrsquos paid employment and higher incomesfor husbands operated in the opposite directionThus the growth of married womenrsquos employ-ment had to await various changes that alteredthe two parameters of the Slutsky equation Forvarious reasons that will become clear the sub-stitution elasticity of labor supply eventuallygrew and the income effect (in absolute value)shrank In the late 1940s and 1950s labor de-mand began to shift out across a rather elasticfemale labor supply function The effect contin-ued and married womenrsquos labor force partici-pation rates climbed Because the elasticitieschanged in each of the phases so did the rela-tive importance of labor supply and labor de-mand in explaining the increase in labor forceparticipation and hours worked
Each evolutionary phase moreover led tomajor advances in the field of modern empiricaland theoretical labor economics that mirroredthe reality of womenrsquos changing role The studyof labor was once mired in the institutions of the
labor market As womenrsquos employment ex-panded economists began to study labor supplyand the decisions made by families and house-holds My discussion of the evolution of mod-ern labor economics will stop with develop-ments in the 1960s as the field was firmlyestablished by then and the list of economistswho made major contributions since the 1960sis too large to include here
Womenrsquos labor market choices and decisionshave become central to the field of labor econom-ics as a perusal of any undergraduate text willdemonstrate4 It would not be much of an exag-geration to claim that women gave ldquobirthrdquo to mod-ern labor economics especially labor supplyEconomists need variance to analyze changes inbehavioral responses and women provided anabundance of that Men by and large were not asinteresting since their participation and hours var-ied far less in cross section and over time
A Phase I Late-Nineteenth Century to the1920smdashThe Independent Female Worker
From the late-nineteenth century to the1920s female workers in the labor market asopposed to those working in the household orfamily business were generally young and un-married They were often piece workers in man-ufacturing or labored in the service sector asdomestics and laundresses These women expe-rienced little or no learning on the job and sawonly slight gain from formal human capital be-yond common or elementary school if that5 Ascant minority were professional workers oftenteachers and clerical employees a group thatexpanded enormously beginning in the 1910sThe vast majority of women workers were
4 See the textbook for undergraduates by Ronald GEhrenberg and Robert S Smith (2006) on the relative im-portance of research on womenrsquos labor force participationhours earnings occupations household production humancapital investment and so forth The index listing forldquowomenrdquo is more than three times longer than that forldquomenrdquo and there are additional listings under ldquogenderrdquoldquodiscriminationrdquo ldquomaternity benefitsrdquo and others relatingdirectly to women
5 About 47 percent of all female workers in manufactur-ing in 1890 were paid by the piece and more than 30 percentof all white female workers in 1890 were in the servicesector In two surveys of working women in 1907 in whichformal education was asked the monetary return to a year ofeducation was between 1 and 2 percent when estimatedaround six years of education (Goldin 1990 table 41)
3VOL 96 NO 2 RICHARD T ELY LECTURE
poorly educated often from low-income house-holds and those headed by a foreign-born indi-vidual During this phase the average marriedwoman worker was less educated than the pop-ulation average suggesting that the income ef-fect greatly swamped the substitution effect
Prior to the 1920s women almost always exitedthe workforce at marriage although some inpoorer homes and among the more highly edu-cated did not Substantial social stigma regardingthe work of wives outside the home existed due inlarge measure to the nature of the work Jobs wereoften dirty dangerous repetitive and long inhours per day and days per week
The income elasticity was therefore largewhereas the substitution elasticity was smallalthough its precise magnitude is uncertain Theresult was that the (negative) income effectfrom increased husbandsrsquo income greatly ex-ceeded the (positive) substitution effect fromincreased wivesrsquo earnings6
With a very inelastic labor supply functionthe increase in female labor force participationrates from 1890 to 1930mdash95 percentage pointsfor women 25 to 44 years old and 73 percent-age points for married women 35 to 44 years old(Figure 1)mdashmust have resulted largely fromshifts in the labor supply function In additionthe large negative income effect means thatpositive supply shifts had to have been substan-tial in magnitude to outweigh the negative effectof increased husbandsrsquo income7
The field of modern labor economics likethat of market work for married women wasnascent at the dawn of the twentieth centuryFemale workers were of interest to economistsbecause of social policy issues such as wageequity the minimum wage and maximum-hours laws Edith Abbott was among the mostprolific of the economists researching women in
the early 1900s8 She was also a historian whoreminded her readers that lower-class womenhad always worked if not in the market then athome and that they faced a life no differentfrom that of their grandmothers But the wom-enrsquos movement the first generations of collegewomen and the drive for the franchise held thepromise of real change for Abbott who ob-served that middle-class working women wereembarking on a ldquosocial revolutionrdquo (Abbott1906) Richard T Ely a founder of the Amer-ican Economic Association its first secretaryand sixth president and whom this lecture me-morializes called the period the ldquoEra ofWomanrdquo and in reaction to a call for restrictionson women to protect menrsquos jobs averred ldquoRev-olutions do not go backwardrdquo9 Despite the op-
6 See Goldin (1990 table 52) for data on the wage(uncompensated) elasticity () the own-substitution (com-pensated wage) elasticity (s) and the income elasticity ()as estimated in eight cross-city studies from around 1900 to1970 and one time series study for 1950 to 1980 Theown-substitution (compensated wage) elasticity (s) is cal-culated from the Slutsky equation s where wifersquos full-time income divided by husbandrsquos (orfamilyrsquos) actual income
7 Positive supply shifters include the greatly increasededucation of young women decreased fertility the greaternumber of nice jobs for women and the related change innorms regarding womenrsquos work
8 Edith Abbott published 13 articles in the Journal ofPolitical Economy from 1904 (two years before she re-ceived her PhD in economics from the University of Chi-cago) to 1911 and 19 from 1904 to 1925 and she had sixin the American Journal of Sociology from 1908 to 1911She also published about 20 books in her lifetime most ofwhich concerned such progressive social reform issues ashousing immigrants crime prisons and truancy in addi-tion to womenrsquos employment and its history
9 Helen Campbell (1893 pp v vii) The aphorism isapparently due to President Abraham Lincoln but in the
FIGURE 1 LABOR FORCE PARTICIPATION RATES FOR
FEMALES AND MALES BY AGE AND MARITAL STATUS1890 TO 2004
Notes All races marital statuses and education groups areincluded unless indicated otherwise The labor force partic-ipation rate from 1890 to 1930 is the fraction of ldquogainfulworkersrdquo in the relevant population The difference betweenthe Census and CPS for females is small and somewhatlarger for malesSources 1890 to 1970 Goldin (1990) from US PopulationCensus 1965 to 2004 March Current Population Survey(CPS)
4 AEA PAPERS AND PROCEEDINGS MAY 2006
timism of Abbott and Ely the revolution inwomenrsquos work would take another 75 years andsome today believe it is going backward a viewI will evaluate in this essay
B Phase II 1930s to 1950mdashEasing theConstraints on Married Womenrsquos Work
From 1930 to 1950 the labor force participationrate for married women 35 to 44 years old in-creased by 155 percentage points or from about10 percent to 25 percent (Figure 1) Whereas just8 percent of employed women were married in1890 the number rose to 26 percent in 1930 and47 percent in 1950 The fraction of single womenin the labor force had not declined by muchRather the labor force participation of marriedwomen had increased substantially
The shift from Phase I to Phase II came aboutbecause of several complementary factors thatwere in large measure exogenous to female laborsupply The most important were the greatly in-creased demand for office and other clerical work-ers beginning in the early 1900s with the arrival ofnew types of information technologies and theenormous growth in high school enrollment andgraduation from 1910 to 1930 The fraction of thefemale labor force (nonfarm) employed as clericalworkers rose from 6 percent in 1900 to 23 percentin 1930 whereas 24 percent of clerical workers in1900 were women the number rose to 52 percentin 193010 Nationwide high school graduationrates increased from 9 percent in 1910 to 27 per-cent in 1928 In the states outside the South theincrease was from 11 percent to 32 percent and to56 percent by 193811
Both the increased demand for clerical work-ers and the increased supply of high schoolgraduates meant that prior to marriage youngwomen entered nicer cleaner shorter-hour andthus more ldquorespectablerdquo jobs Some remainedemployed after marriage although levels wereinsubstantial until the 1940s Part of the exodusat marriage was due to the institution of mar-riage bars which were regulations that forced
single women to leave employment upon mar-riage and barred the hiring of married womenThese bars existed in many school districts andsome clerical employment especially in the1930s but were almost entirely eliminated afterthe early 1940s12
As work for women became more acceptedparticularly by their husbands the income effectdeclined At the same time the substitution effectrose substantially One of the reasons for the in-creased substitution effect concerns the rise ofpart-time work Although weekly hours of workhad been substantially reduced from 1900 to 1930part-time work was a rarity13 The absence of hourand day flexibility placed bounds on the substitu-tion elasticity As the real wage for women rosethe margin of change was participation not hoursIn consequence a smaller increase in both hoursand employment could occur than had there beengreater flexibility in hours (and days) of workWith the creation of scheduled part-time work inthe 1940s and its enormous diffusion in the 1950sthe substitution effect became larger Reinforcingfactors include the almost complete diffusion ofmodern electric household technologies such asthe refrigerator and the washing machine and theprevious diffusion of basic facilities such as elec-tricity running water and the flush toilet14 Thereduced price of these appliances served to de-crease womenrsquos reservation wage and increase theelasticity of the aggregate female labor supplyfunction
1890s it may not have required a reference since it was sowell known
10 See Goldin (1984) on the switch from manufacturingto clerical positions and the relative roles of supply anddemand
11 The ldquohigh school movementrdquo is discussed in Goldin(1998)
12 On marriage bars see Goldin (1991b)13 Hours of work in private nonagricultural employment
decreased from about 60 per week in 1900 to below 45 perweek in 1930 just before the large and mainly temporarydecline during the Great Depression (Goldin 2000) On thepaucity of scheduled part-time work in the pre-1940 era seeGoldin (1990 chap 6)
14 Jeremy Greenwood et al (2005 fig 1) who empha-size the role of household technology in increasing wom-enrsquos labor market participation have compiled data onadoption percentages for ldquobasic facilitiesrdquo such as electric-ity and indoor plumbing and household electrical appli-ances Most basic facilities had been adopted in 60 to 90percent of households by 1950 In terms of appliances 80percent had refrigerators by 1950 and about 60 percent hadvacuum cleaners and electric washers Omitted from thiswork is the use of market substitutes for home appliancesAbout 70 percent of the households in the 1917ndash19 Cost ofLiving Survey which included primarily middle-incomefamilies used commercial laundry services and spentenough to do six to seven pounds per week 33 percent atemeals in restaurants and 16 percent employed servants(Caroline M Moehling 2001)
5VOL 96 NO 2 RICHARD T ELY LECTURE
The reason for the increase in female laborforce participation during Phase II is compli-cated by changes in both the income and sub-stitution elasticities of female labor supply Thefactors responsible for increased female laborforce participation in the early part of the phasewere primarily shifts in the labor supply func-tion similar to the discussion for Phase I sincesupply was rather inelastic But in the secondpart of Phase II labor supply became moreelastic and both supply and demand shiftsplayed a role in increasing female participationAs labor supply became even more elastic aswill be discussed for Phase III labor demandshifts would swamp those on the supply side
As married women began to enter the labormarket in greater numbers labor economists ana-lyzed female labor supply decisions in the contextof the family unit rather than the individual andinquired about the influence of husbandrsquos incomeon wifersquos ldquogainful employmentrdquo15 Interest ini-tially emerged from an investigation of backwardbending labor supply functions by Paul H Doug-las (1934) and Douglas and Erika H Schoenberg(1937) By exploring the labor supply of men andwomen across cities Douglas noticed that marriedwomenrsquos gainful employment was negatively re-lated to husbandrsquos income The evidence sug-gested a rather large income effect ldquoa freeing ofmarried women from the necessity of workingoutside the homerdquo (Douglas and Schoenberg1937 p 61) But this large negative incomeeffect would soon begin to decline in (abso-lute) magnitude Had it not married womenrsquoslabor force participation would never havegreatly increased
C Phase III 1950s to 1970smdashRoots of theRevolution
Married womenrsquos labor force participationcontinued to expand in the 1950s to 1970sgreatly at first for an older group of women (45to 54 years old) and with soaring rates later fora younger group (25 to 34 years old) For mar-ried women in the 35- to 44-year-old group
participation increased from 25 to 46 percentfrom 1950 to 1970 (Figure 1)
In the 1940s and 1950s female labor supplyhad become considerably more elastic and thusmore responsive to changes in wages At thesame time the income effect continued itsdownward trend as work for married womenbecame more acceptable16 The average mar-ried working woman by the 1940s was moreeducated than the average married woman in thepopulation a reverse of my previous observa-tion and another indication that the substitutioneffect had begun to swamp the income effect
Many factors contributed to the increase inthe own-wage elasticity One was the creationof scheduled part-time employment The avail-ability of part-time work by firms led to anincrease in those working fewer than 35 hoursper week from 18 percent of the female laborforce in 1940 to 28 percent in 1960 and from 14percent of the female sales sector in 1940 to 40percent in 1960 Another factor was the greateracceptance of married women in the labor forceand the almost complete end of marriage bars
Labor supply had become sufficiently elasticand the income elasticity sufficiently small thatmost of the increase in female labor force par-ticipation and hours of work during Phase IIIwas demand driven The demand function forlabor increased rapidly over a relatively stableand highly elastic female labor supply function
But despite large gains in employment mar-ried women were still the secondary earners intheir households They took the labor supplydecisions of their husbands as given they weretied stayers at times and tied movers at othersTheir human capital continued to increase butthe investments occurred mainly off the job informal education or vocational training ratherthan on the job Secretaries teachers nursessocial workers and librarians among otherscame to their jobs with most of the necessaryskills Some advancement was possible in of-fices and elsewhere but not much according tomost estimates of earnings functions Interviewsfor first jobs even those of women with college
15 The distinction between labor force participation andldquogainful employmentrdquo is that the former concept was intro-duced with the 1940 Census whereas previously the ques-tion asked was the occupation in which the individual wasldquogainfully employedrdquo
16 See Goldin (1990 table 52) for labor supply elasticityestimates from 1900 to 1980 The evidence for 1940 to 1960relies on cross-city estimates from the work of William GBowen and T Aldrich Finegan (1969) Mincer (1962) andGlen G Cain (1966)
6 AEA PAPERS AND PROCEEDINGS MAY 2006
degrees often began with the straightforwardquestion ldquoHow well do you typerdquo17
Even though many would eventually be em-ployed for a significant portion of their livestheir expectations of future employment whenthey were young were quite different Womenborn from 1931 to 1940 for example wereeventually employed for more than 40 percentof their post-schooling years (up to around age50) the figure is 55 percent for those born from1941 to 195018 Most of these women had an-ticipated brief and intermittent employment invarious jobs not generally in a career Sometrained for the remote possibility that theywould have to support themselves later in lifeCollege for many was a way to meet a suitablespouse rather than a way to embark on a careerTheir investments in education and trainingwere consistent with their expectations Butthey were in for a great surprise
The Phase III decades were ones of greatexpansion of the female labor force and alsoimmense strides in modern labor economicsClarence Long (1958) picked up where Douglasleft off19 Long was an empirical economistwho explored the large increase in marriedwomenrsquos labor force participation from 1890 tothe 1950s and was puzzled by an apparent in-consistency Cross-section labor supply esti-mates for 1940 from the US Census and for
1951 and 1956 from the Current PopulationReports revealed substantial negative effectsfrom increases in husbandrsquos income20 The timeseries data clearly showed growth in femalelabor supply Because husbandsrsquo income hadincreased substantially the two findings wereapparently inconsistent Longrsquos attempt to re-solve the paradox between the cross-section es-timates and the time series data was to arguethat the female labor supply function shiftedoutward and to explore some of the reasonssuch as advances in household production Heconcluded that although these factors movedin the right direction their magnitude wasinsufficient
Jacob Mincer (1962) resolved the apparentparadox between the time series and cross-section results by considering both the incomeand substitution effects21 He also recognizedthat individual-level cross-section estimates ofthe income effect would be potentially biasedupward for use in time-series simulations Thereason was that husbandsrsquo incomes in crosssection contain a transitory component to whichwives would respond whereas the time seriesaverages had less of the transitory and more ofthe permanent component According toMincer the use of city-level data reduced thetransitory component of husbandsrsquo income andproduced coefficient estimates appropriate foruse in the time series simulation The resultingsubstitution effect was considerably greater thanthe income effect and the apparent paradox was
17 In a US Department of Labor Womenrsquos Bureau sur-vey of college women who graduated in the class of 1957a surprisingly large fraction remarked that they were askedhow well they could type in their first job interview(1957ndash64 College Graduate Survey Goldin 1990 p 230)Supreme Court Justice Sandra Day OrsquoConnor has oftenrecounted that her first job interview obtained throughpersonal contacts after graduating near the top of her 1952Stanford Law School class landed her a position as a legalsecretary and no California law firm offered her a positionas a lawyer In Rona Jaffersquos best-selling novel and movieThe Best of Everything (1958) the main character graduatesfrom Radcliffe in the 1950s and assumes a secretarial po-sition in a publishing house with the hopes of becoming aneditor Among college graduate women 30 to 34 years oldin the 1950 US Census 97 percent were secretaries and 19percent were clerical workers The occupation of secretarywas the second most numerous behind teaching and wasslightly more important than that of nurse
18 These figures are calculated from the Panel Study inIncome Dynamics (PSID) 1968 to 2003 and are for theunweighted sample of white women
19 John D Durand (1948) also added to the literature onthe causes of change and emphasized altered customs andnorms fostered by what he termed ldquothe succession ofgenerationsrdquo
20 Clarence Long (1958 chap 7) used aggregated data atthe city level The 1950 Census published tables were notyet available Note that Long did not directly consider theexistence of a substitution effect in addition to an incomeeffect Although he tried to assess the effects of increasedfemale education he compared the relative levels of edu-cation for older men with those of various groups of womenrather than assessing the differences these levels meant forwomenrsquos employment and earnings
21 Mincer in an interview with me in 2002 recountedthe course he took from Albert Rees during his post-grad-uate stint at the University of Chicago ldquoAl Rees spent thatparticular quarter reporting on the book by Clarence Long [and] this paradox that if the husbandrsquos income was highthe woman was unlikely to be in the labor force But overtime income grew for both husband and wife and there wasan increase in participation rather than a decrease I wassitting in Al Reesrsquo class and I asked myself ldquowhat abouttaking two variables rather than onerdquo We had income andprices or wages Shouldnrsquot that tell what was going on Itcould if the price effect was stronger than the incomeeffect But then you have to bring in the familyrdquo
7VOL 96 NO 2 RICHARD T ELY LECTURE
resolved As real incomes rose the labor forceparticipation rate of married women increasedeven though the earnings of women relative tothose of men advanced only slightly
Major advances in labor economics mostlyassociated with the work of Gary S Beckerextended the analysis of women as part of afamily unit22 Fertility became an endogenousvariable marriage was analyzed as a marketdivorce was a possibility and a threat point Thefamily was the optimizing unit with the familyutility function optimized by the altruistic fam-ily head23
III The Quiet RevolutionmdashPhase IVLate 1970s to the Present
A Revolutionary Indicators
Most labor force participation measures donot divulge that there was a revolution in wom-enrsquos economic status since the late 1970s Anexception is the labor force participation rate formarried women (20 to 44 years old) with a childunder the age of one year which soared from020 in 1973 to 062 in 200024 But in generalparticipation rates for married women as wellas rates for the fraction working full time revealonly small increases in the past several de-cades25 In contrast married womenrsquos laborforce participation increased greatly in evolu-tionary Phases II and III As I discussed earlierthe labor force participation rate by itself is nota reliable indicator of a social and economicrevolution The increase in participation duringPhase III however was to become an importantprecondition for the quiet revolution for reasonsthat will become clear
If soaring participation rates are a precondi-tion but not a sign of the revolution then whatare its indicators Revolutionary indicators arefound in various series that reflect the threechanges mentioned previously horizon iden-tity and decision making26 I will mainly dis-cuss the first two In almost all cases the turningpoints of the indicator series are strikingly sim-ilar by cohort For marriage age college grad-uation and professional school enrollment theturning points were all around 1970 Changes inoccupations occurred in the early 1970s Forearnings relative to comparable men the turn-ing point was a bit later around 1980 Expec-tations regarding future work social normsconcerning womenrsquos family and career and fac-tors accounting for womenrsquos life satisfaction be-gan to change in the late 1960s and 1970s Someof the changes were preconditions for others suchas college majors professional school enrollmentand occupational change Their synchronicityshould not be surprising The series taken to-gether present a logical progression
Expanded HorizonsmdashBy expanded hori-zons I mean that women more accuratelyanticipated their future work lives27 Withmore accurate expectations they could better pre-pare by investing in formal education and theycould assume positions that involved advance-ment That is they could plan for careers ratherthan jobs
The revolutionary phase began with co-horts born in the late 1940s who were teen-agers in the mid-1960s These young womenbegan to perceive that their adult lives woulddiffer substantially from those of their moth-ersrsquo generation Their expectations of futureemployment when they were in their mid tolate teens can be gleaned from the Nation-
22 See Becker (1981) although many of the articles onmarriage fertility and the family were first published in the1960s and 1970s
23 On bargaining models within households that do notposit an altruistic head see the seminal work of Marjorie BMcElroy and Mary Jean Horney (1981) as well as a novelversion by Shelly Lundberg and Robert A Pollak (1993)
24 March Current Population Survey (CPS) for whitenon-Hispanic women A decline since the year 2000 may beapparent to some but it has lasted for too brief a period andin too sluggish a macroeconomy for any definitive statementconcerning whether the labor force participation rate ofmothers with infants has declined
25 The decreases in the last five years are probably due tomacroeconomic phenomena since participation rates formen have also dropped
26 On decision-making and bargaining during Phase IVsee the evidence in Dora Costa and Matthew Kahn (2000)which suggests greater equality in location decisions atleast among college graduates That bargaining with onersquosemployer may not be female-friendly see Linda Babcockand Sara Laschever (2004)
27 They did not however do a very good job forecastingtheir future family size A far greater fraction of women inthe College and Beyond dataset (to be discussed) respondedas freshmen (in the Astin survey) that they expected to havechildren than actually didmdash82 percent (at about 18 yearsold) said they expected to have children but only 69 percentactually did (by 37 years of age)
8 AEA PAPERS AND PROCEEDINGS MAY 2006
al Longitudinal Survey (NLS) of YoungWomen which began with 14- to 24-year-olds in 1968 and the NLS of Youth whichbegan with 14- to 21-year-olds in 1979 Bothsurveys asked similar questions about ex-pectations of paid employment at age 35Their responses can be linked by respondentage to see how expectations changed overtime for young women of various ages (Fig-ure 2)
Young women in their late teens during the1970s upwardly revised their expectations ofbeing in the paid labor force when they wereolder They began with expectations similarto the actual participation of their mothersrsquogeneration (their prediction was around 033whereas their mothersrsquo actual rate was about03) But in the next ten years young womenbegan to correctly anticipate and in factslightly overstate their future labor force par-ticipation rates By 1974 young women werepredicting their participation rate to be in the055 to 065 range Actual rates for 35-year-olds had risen to 046 in 1974 but women intheir late twenties had experienced large in-creases in the early 1970s suggesting futureadvances for those in their thirties By the late1970s young women were predicting partici-pation rates above 080 whereas the actualrate in 1978 was 056 By the time the NLSyouth reached thirty-five years of age theirparticipation rate was about 07528 Youngwomen gained horizon and perceived thattheir lives would differ from those of their-elders29 Their revised expectations of futureemployment in turn led young women tocontinue with college and to graduate30
In the 1970s and 1980s girls began to takemore college preparation courses in high schooland narrowed the gap between girls and boys inscience and math courses Relative to boys girlsincreased their aptitude scores in math and read-ing They increased their math and readingscores by nearly one-fifth of a standard devia-tion so that in 1992 girls who were high schoolseniors were just slightly behind boys in mathand considerably ahead in reading31
As a consequence females greatly increasedtheir college attendance and graduation ratesrelative to males beginning with birth cohorts inthe late 1940s For the earliest birth cohortsshown in Figure 3 from 1877 to the 1910scollege attendance rates were fairly equal in
28 Actual labor force participation rates are from theCPS and are for married white women averaged for ages34 to 36 The figure of 03 for their mothers is for 1962Data from the two NLS surveys are for white femalesonly
29 Young women in the early 1970s may have beenenabled to make more informed extrapolations because theresurgence of feminism in the 1960s and the womenrsquosliberation movement in the 1970s supported their challeng-ing older ways and outmoded norms
30 Goldin et al (2005) find that among female pre-college teens (who were 14 to 18 years old in 1968) thosewho stated that they would be in the labor force when theywere 35 years old had eventual college graduation rates thatwere 143 percentage points higher than those who said theywould be ldquoat home with familyrdquo at age 35 Those in theformer group had a mean graduation rate of 328 percent
whereas the mean graduation rate for the latter group was185 percent
31 The relative increases in math and science courses andmath and reading aptitude test scores are from a comparisonof the NLS72 and the NELS88 The changes are consistentwith those from the National Assessment of EducationalProgress (NAEP) although somewhat larger and US De-partment of Education transcript surveys (Goldin et al2005)
FIGURE 2 EMPLOYMENT EXPECTATIONS OF FEMALE YOUTH
BY AGE 1967 TO 1984
Notes The NLS data are the response to whether an indi-vidual stated she expected to be in the paid labor force atage 35 and are given here for white women The NLS datalink the averages for each age group over time Thus the14- to 15-year-olds in the NLS68 in 1968 became 16 to 17years old in 1970 and are linked to the 16- to 17-year-oldsin 1979 in the NLSYSources 1968 National Longitudinal Survey of YoungWomen (NLS68) and 1979 National Longitudinal Survey ofYouth (NLSY) See Goldin (2005) for details
9VOL 96 NO 2 RICHARD T ELY LECTURE
part because women often attended two-yearteacher-training schools With the cohorts bornin the late 1910s and 1920s large differencesemerged between male and female college at-tendance and graduation rates From the cohortsborn in the 1930s to the late 1940s males had a10-percentage-point lead in attendance and al-most the same for graduation But with thecohorts born in the late 1940s the lead wasswiftly eliminated for both attendance andgraduation
A set of related demographic changes duringthe same period occurred for college womenThe median age at first marriage increased by anastounding 25 years for female college gradu-ates born between 1949 and 1956 that is be-tween those married in the early 1970s andthose married in the early 1980s (Figure 4) Theage at first marriage continued to climb by an-other year during the next decade A similarincrease in the age at first marriage also oc-curred for women who attended but did notgraduate from a four-year college
The median female college graduate from the1950s to the early 1970s was married within ayear after college graduationmdashat 225 years old
But by the early 1980s the median female col-lege graduate married at 25 years old With alater age at first marriage women could takecollege more seriously Most women who hadmarried within a year of graduation must havemet their future husbands while in collegepossibly in the same college Although someaspects of college social life did not differmuch across these generations the pressure tomeet a spouse while in college diminishedconsiderably
Not only did women increase their attend-ance and graduation from college more thanmen they also began to close the gap with menwith regard to college majors Whereas in1970 a standard dissimilarity index for collegemajors between men and women exceeded 05it fell to about 03 in 1985 (Goldin 2005) Bothmen and women increased their majors in busi-ness administration but women did to a greaterextent and reduced their concentrations in themore traditional female fields of education lit-erature languages and home economics Wom-enrsquos majors shifted from those that wereldquoconsumptionrdquo related to those that were ldquoin-vestmentrdquo related
Women also began to further their educationin professional and graduate schools around1970 (Figure 5) Whereas in the late 1960s onein 20 entering law school was a woman two outof five were in 1980 and parity was reached in
1870 1880 1890 1900 1910 1920 1930 1940 1950 1960 1970 1980
Birth year
-010
-005
000
005
010
Fem
ale
rate
min
us m
ale
rate
College Attendance
College Graduation
FIGURE 3 FEMALE MINUS MALE COLLEGE ATTENDANCE
AND GRADUATION RATES BIRTH COHORTS 1877 TO 1974
Notes The underlying data are the fraction of four-yearcollege attendees or graduates by birth cohort and sexadjusted to 35 years of age for the US born Collegegraduates are those with 16 or more completed years ofschooling for the 1940ndash1980 samples and those with abachelorrsquos degree or higher in the 1990ndash2000 samples Theunderlying samples include all US-born residents aged 25 to64 years For information on the age-adjustment regressionssee De Long et al (2003 fig 1) and Goldin et al (2005)Sources 1940 to 2000 Census of Population Integrated PublicUse Micro-data Samples (IPUMS)
1930 1940 1950 1960 1970 Birth year
20
21
22
23
24
25
26
27
Med
ian
age
at f
irst
mar
riag
e
Some collegeCollege graduate
FIGURE 4 MEDIAN AGE AT FIRST MARRIAGE FOR BIRTH
COHORTS OF FEMALE COLLEGE GRADUATES AND
ATTENDEES 1931 TO 1968 BIRTH YEARS
Notes Three-year centered moving averages are shownSources Current Population Survey Fertility and MaritalHistory Supplement 1990 and 1995
10 AEA PAPERS AND PROCEEDINGS MAY 2006
the early 2000s A similar trend occurred formedical students The increase in the fraction offemales also rose for other professional pro-grams including dentistry business administra-tion veterinary medicine optometry andpharmacy Most important is that the turningpoints for the four professions given in Figure5 all occurred during the early 1970s
With longer and more informed horizonsyears of accumulated job experience increasedand the returns to job experience increased aswell Most estimates of returns to experiencefrom the 1970s and 1980s show that returnsincreased for women by a very large amountbut that returns increased by a rather smallamount for men32 Greater and more appropri-
ate levels of human capital investment are onepossible reason why returns to job experienceincreased for women relative to men Otherpossible reasons include antidiscriminationlaws and governmental interventions to enforcethem
Altered IdentitiesmdashThe revolution can alsobe seen in the changed outlook of women con-cerning their individual identities As womenmarried later they could ldquomake a namerdquo forthemselves before having to choose to changetheir name In the 1970s and continuing in the1980s more women retained their surnameupon marriage particularly among those whohad advanced degrees Virtually all marriedwomen took their husbandrsquos name in the early1970s By 1990 about 20 percent of all collegegraduate women retained their surname at mar-riage although during the 1990s the percentagedeclined somewhat (Goldin and Maria Shim2004)
Ever since the mid-1960s a significant frac-tion of American college freshmen have beensurveyed about their future personal satisfactionand the relative roles of family finances com-munity meaningful philosophy of life helpingothers and career success Beginning in theearly 1970s women placed greater emphasis oncoworker recognition and career success in thefactors they believed would be important totheir personal satisfaction and they placed farless emphasis on their concern with others33
Their responses moreover became more simi-lar to those of comparable men entering collegeIn the Survey of American Freshmen (AlexanderW Astin et al 2002) females increasedthe weight they placed on recognition by col-leagues and financial success males increasedtheir relative weight on family (Figure 6) Bythe early 1980s men and women gave aboutequal weight to recognition and family Womenhad changed considerably and were far more
32 On the increase in returns to experience see FrancineD Blau and Lawrence M Kahn (1997) Claudia Olivetti(2001) and June OrsquoNeill and Polachek (1993) On theincrease in hours of work due to the increase in returns seeOlivetti (2005) Although all agree that returns increasedmore for women than men the magnitudes reported differBlau and Kahn and OrsquoNeill and Polachek report a doubling
of the returns to women Olivetti shows for a somewhatlonger period (1970s and 1990s) that womenrsquos returns in-creased by about 25 percent and menrsquos from 6 to 9 percent
33 Concern with others can be observed in the objectivesldquohelping others who are in difficultyrdquo ldquoparticipating incommunity action programrdquo and ldquohelping to promote racialunderstandingrdquo All of these objectives declined in impor-tance and fell more for women than men in terms of theiroverall significance to the individual
1955 1965 1975 1985 1995 2005Year of professional school entry
0
01
02
03
04
05
Frac
tion
fem
ale
MedicalLawDentistryMBA
FIGURE 5 FRACTION FEMALE AMONG FIRST-YEAR
STUDENTS IN PROFESSIONAL PROGRAMS 1955 TO 2005
Sources First-year law students from the American Bar As-sociation Web site httpwwwabanetorglegaledstatisticsfemstatshtml First-year medical students (to 1994) fromJournal of the American Medical Association (various years1978 to 1998) and (from 1994 to 2005) from the AmericanAssociation of Medical Colleges Web site httpwwwaamcorgdatafacts20052005summaryhtm First-year dentistrystudents extrapolated from dental degrees awarded laggedfour years from US Department of Education NCES(2005 table 257) Masters in business administration first-year students extrapolated from MBA degrees awardedlagged two years from US Department of EducationNCES (2005 table 278)
11VOL 96 NO 2 RICHARD T ELY LECTURE
concerned with personal success and familyalthough men still placed more weight on finan-cial success
Alterations in identity are reflected in con-tinued changes to the parameters of theSlutsky equation Both income and substitu-tion elasticities decreased substantially in (ab-solute) magnitude for all education groups ofwomen in the 1980s and again in the 1990s34
The decrease in the income elasticity contin-ued its twentieth-century trend downwardThe decrease in the substitution effect sharplyreversed its trend upward in the first two-thirds of the century35 By the 1990s incomeand substitution effects of the labor supplyfunction while still somewhat greater forwomen than for men were more similar thanestimated values at any other time
Changes in the income and substitution ef-fects reflect a fundamental transformation inhow women view their employment Ratherthan jobs most see employment as part of along-term career Most perceive their work as afundamental aspect of their satisfaction in lifeand view their place of work as an integral partof their social world They have added identityto their decision about whether to work or not towork given changes in wages and incomes Asa consequence women have become stickier intheir labor force attachment Leaving the work-place involves a loss in identity for a womanjust as being unemployed or retired has com-monly involved a loss of prestige and socialbelonging to most men Income and substitutioneffects changed for women in low- and high-income families alike and for those at almostall levels of schooling Ethnographic researchcorroborates the empirical finding that low-in-come and even poor women increased their at-
tachment to the workplace as a source of personalidentity36
Relative Earnings and OccupationsmdashTheresult of expanded horizons and altered identi-ties was that younger cohorts of women wereconsiderably better prepared to enter the labormarket and were determined to have careersThese changes are reflected in their occupationsand earnings relative to those of men The earn-ings of women relative to those of men began toincrease around 1980 after remaining flat sincethe 1950s (Figure 7)37 Much of the increasewas due to womenrsquos greater job experience andto their more market-relevant skills as reflected
34 According to Blau and Kahn (2005) married womenrsquosown wage elasticity (with respect to hours of work) fell by50 to 56 percent from 1980 to 2000 and the elasticity ofhours with respect to husbandrsquos income fell by 38 to 47percent Similar results are found for participation Theirresults are robust to alternative specifications and correc-tions for various types of selectivity bias
35 The unit of observation in Blau and Kahn (2005) is theindividual whereas it is the city in the eight studies for thepre-1970s period The Blau and Kahn finding of a reduction(in absolute value) in the two elasticities within the 1980 to2000 period allows one to make inferences about the longerperiod
36 Typical of the findings in the ethnographic literature isLillian B Rubin (1994) who did a similar study two decadesbefore ldquoUniversally the women I interviewed work be-cause they must Almost as often they find a level ofself-fulfillment and satisfaction on the job that theyrsquore loathto give uprdquo (p 81) With regard to changes in their sense offairness in the labor market Rubin writes ldquoNow all thewomen even those who greeted the idea with reservationstwo decades ago endorse the principle of equal pay withoutequivocationrdquo (p 83) With greater attachment to theirpositions they demanded to be treated as the equals of men
37 The ratio of female to male hourly earnings is higherthan that for full-time year-round workers because menwork more hours even among those working full-time
1965 1970 1975 1980 1985 1990 1995 2000
Freshman year
-10
0
10
20
Mal
e m
inus
fem
ale
wei
ght
Family
Recognitionby colleagues
Financial success
FIGURE 6 PERSONAL SATISFACTION FACTORS FOR COLLEGE
FRESHMEN DIFFERENCES BY SEX 1966 TO 2000
Notes Individuals surveyed were freshmen The data givenare weighted to produce a nationally representative collegefreshmen average An objective goal or value is given fullweight (100) if the individual listed it as ldquoessentialrdquo or ldquoveryimportantrdquo and no weight (0) otherwise Individuals couldchoose any number of factors from the 12 to 19 possibleobjectives goals or values listed on the survey in each yearSources Astin et al (2002)
12 AEA PAPERS AND PROCEEDINGS MAY 2006
in the increased return to experience38 Occupa-tions shifted not surprisingly from those thathad been considered traditional ones forwomen such as teacher nurse librarian andsocial worker to a varied group of professionsincluding lawyer physician professor andmanager (Figure 8) But it has also been notedthat even within cohorts the earnings of womenincreased relative to those of men suggestingthat change may have diffused to those in theirmiddle age and was caused at least in part bychanges within the labor market or imposed onit by antidiscrimination legislation
B What Caused the Revolution
Mincer was right In the 1950s and 1960slabor demand increased greatly and for womenit raced across a relatively stable and ratherelastic labor supply function But many of thewomen in Phase III were caught by surpriseThey had incorrectly anticipated their futurelabor force participation They were often
trapped in positions that involved little advance-ment College women had majored in fields thatwere more consumption than investment ori-ented Few had continued to professional andgraduate schools
But the next generation observed the largeincrease in participation and in full-time workof their immediate predecessors They extrapo-lated on that basis to form more accurate expec-tations for their futures In doing so they werebetter prepared to invest in human capital Ashigh school students they took more collegepreparation courses and their aptitude testscores rose relative to those of boys Theygreatly increased their college attendance andgraduation rates At college they altered theircollege majors toward those that were morevaluable in the labor market and less valuable athome and they continued with post-graduateeducation to a far greater extent than did previ-ous generations
The age at first marriage for college womenincreased with cohorts born around 1950 Mar-riage delay enabled women to take formal edu-cation more seriously and led to changes in theirrelationship to work The period divorce ratebegan to increase in the 1960s The combinationof the increase in divorce and the later age atfirst marriage for all women meant that the
38 OrsquoNeill and Polachek (1993) decompose the increasein relative earnings for women and find that increasedreturns to experience account for a larger fraction of thedifference than the increase in work experience They donot however explain the increase in returns to experiencein terms of better preparation for the labor market or bettertreatment by the labor market
1940 1950 1960 1970 1980 1990 2000000
015
030
045
060
075
Doctors lawyers professors managers etc
Teachers nurses librarians social workers etc
FIGURE 8 OCCUPATIONS OF COLLEGE GRADUATE WOMEN30 TO 34 YEARS OLD 1940 TO 2000
Notes The occupations in the two groups are grade schoolteachers nurses librarians social or religious workers sec-retaries and other clerical workers and doctors lawyersprofessors managers and scientistsSources Integrated Public Use Micro-data Sample of theUS Federal Population Census 1940 to 1960 March Cur-rent Population Survey 1970 to 2000
1960 1965 1970 1975 1980 1985 1990 1995 2000 200555
60
65
70
75
80
FIGURE 7 WOMENrsquoS EARNINGS AS A PERCENTAGE OF
MENrsquoS EARNINGS 1960 TO 2003
Notes Based on median earnings of full-time year-roundworkers 15 years old and over as of March of the followingyear Before 1989 earnings are for civilian workers onlySource httpwwwcensusgovhhesincomehistincp40html
13VOL 96 NO 2 RICHARD T ELY LECTURE
fraction of their lives they would spend marriedplummeted and economic independence be-came more valuable (Figure 9) These changesaltered the identity of women and shifted it froma family- and household-centered world to awider one that was more career oriented
One of the reasons for the increase in the ageat first marriage was the introduction of thecontraceptive ldquopillrdquo Although the pill was ap-proved by the Food and Drug Administration in1960 and quickly diffused among marriedwomen young single women found it harder toobtain due to restrictive state laws Legalchanges at the state level such as mature minordecisions and the increased age of majority thatmainly occurred from the late 1960s and early1970s enabled young women to obtain the pilleven though the rulings and legal changes werenot normally intended for that purpose39 As useof the pill diffused through the young unmar-ried population a potent reason for early mar-riage disappeared With a larger group of singleindividuals others could afford to wait and amultiplier effect added to the increased age at
first marriage40 As the age at first marriageincreased women could be more serious in col-lege plan for an independent future and formtheir identities before marriage and family41
IV Has the Quiet Revolution Stalled
A Is There a ldquoNatural Raterdquo of FemaleLabor Force Participation
Female labor force participation rates and thefraction working full time are no longer soaringlet alone rising Participation rates for women ofalmost all ages education levels and maritalstatuses seem to have leveled off since around1990 after rising nonstop for at least the lastcentury (Figure 1) The participation rate ofmarried college graduate women in their thir-ties for example has hovered around 76 per-cent since 1990 For high school graduatemarried women in their thirties a rate ofabout 72 percent has been sustained for thepast 15 years42 Thus it appears that a plateauin female labor force participation wasreached a decade and a half ago43 The par-ticipation rate for women with infants mayeven have declined These facts have ledmany to wonder if some type of ldquonatural raterdquoof female labor force participation has beenreached Since participation rates are bounded
39 In fact many states increased their age of majorityafter passage of the Twenty-Sixth Amendment to the USConstitution in July 1971 that lowered the minimum votingage to 18
40 Goldin and Katz (2002) describe the model that gen-erates an increased age at first marriage with the diffusionbeginning in the pill and provide evidence concerning thetiming of the pillrsquos spread among young women
41 Why divorce increased is a more contentious issueSome thought the increase was due to the legal changesbeginning in the 1960s that relaxed divorce statutes invarious states and allowed unilateral divorce Others pos-ited along the lines of the Coase Theorem that the legalchanges should not have mattered The empirical literatureshows that the immediate effect of the laws was to increasedivorce but that after a decade divorce rates revert to theirinitial levels For a summary of the debate and an empiricalanalysis of the short and long-run effects of legal changessee Justin Wolfers (2003)
42 The data given are from the March Current PopulationSurvey (CPS) Similar data for women in their forties showslightly higher rates
43 The plateau in most labor force participation seriesbegan in the early- to mid-1990s during a weak economybut was sustained during the boom economy of the late1990s Therefore it would not appear that the macro-economy was solely to blame The dip in participation in theearly 2000s however was due to the low employmentgrowth
1935 1940 1945 1950 1955 1960 1965Birth Year
06
065
07
075
08
085
25 to 40 years old25 to 45 years old25 to 50 years old
Fraction of time married during ages
FIGURE 9 FRACTION OF YEARS SPENT MARRIED
FOR ALL WOMEN
Notes All education groups and all races are includedldquoMarriedrdquo includes all who were listed as married indepen-dent of whether the spouse was present The data begin withage 25 years and end with age 50 A missing cell (25-yearolds in 1961) was created by extrapolationSource March Current Population Survey (CPS) 1962 to2004
14 AEA PAPERS AND PROCEEDINGS MAY 2006
above by one the question is really whether thenatural rate is lower than some had thought itwould be
Whether or not the data support a naturalrate hypothesis depends on the particular agegroup examined For women in their thirtiesa natural rate does not appear to have beenreached even though a leveling off has oc-curred The reason the evidence does notyet support the natural rate notion concernschanged demographics
With a later age at marriage and a delay ofchildbearing women in their thirties now have ahigher probability of having a child under theage of six than they did 25 years ago and aboutan equal probability as in the mid-1960s (Figure10)44 Despite this greater child burden partic-ipation rates for women in their thirties arehigher today than in the early 1980s and farhigher than in the 1960s During the past twodecades the participation rate of this group hasremained relatively stable and substantial Thusrather than peaking or declining their partici-pation rates appear to be keeping up given thechanged demographics
The participation rate for 33- to 37-year-old
married college women for example was 77percent in 1999 while the fraction with childrenunder the age of six was 61 percent (Figure10)45 In 1965 just 40 percent were in the laborforce and 57 percent had children under sixyears of age Participation rates increased from1965 to 1999 by 37 percentage points while thechild burden actually increased by four percent-age points46 From 1980 to 1999 participationrates rose 11 percentage points while the kidburden rose 12 percentage points and from1990 to 1999 both participation rates rose andthe kid burden rose by about 25 percentagepoints
The notion that a natural rate has beenreached does not appear to be supported forthese ldquothirty-something-year-oldsrdquo Ratherthese women appear to be committed to thelabor force probably because they were in thelabor force far longer before they married in-vested more in formal and informal training andshaped their identities before having children
What about women in their twenties Onceagain consider the female college graduate thistime for all marital statuses Labor force partic-ipation rates for women 25 to 29 years old havebeen very high in the 90-percent range throughthe 1990s but these rates too have been veryflat (and have like others declined a bit throughthe downturn of the early 2000s) As opposed tothe group in their thirties and early forties thesewomen have not had any increase in their childburden In fact the fraction with young childrendeclined substantially to the mid-1980s and hasbeen flat ever since Thus both their participa-tion rates and their child burdens remainedfairly constant since 1990 at the latest If anatural rate has been reached then this groupmight provide confirmation But in the 1990sparticipation rates of women in their late twen-ties were not much different from those of com-parable men47
44 The number of children per mother was greater in thepast even though the fraction of mothers with children underthe age of six years is greater today
45 The rate was 74 percent in 2004 But in all casesincluding that of men participation rates from 2000 to 2004were depressed relative to previous rates and reflect thesluggish labor market in general rather than anything spe-cific to women Because of the macroeconomic slowdownI use 1999 data
46 ldquoChild burdenrdquo measures whether there is a childunder six years old not the number of children
47 Further confirmation is provided by Heather Boushey(2005) who finds that the child penaltymdashthe lower laborforce participation of women with young childrenmdash
1960 1970 1980 1990 2000
04
05
06
07
08
Lab
or f
orce
par
ticip
atio
n ra
te
045
05
055
06
065
Frac
tion
with
chi
ldre
n lt
6 ye
ars
Labor Force Participation
Fraction with Children lt 6 Years
FIGURE 10 LABOR FORCE PARTICIPATION AND FRACTION
WITH YOUNG CHILDREN FOR 33- TO 37-YEAR-OLD
MARRIED COLLEGE GRADUATE WOMEN 1962 TO 2004
Notes Three-year centered moving averages are shownldquoMarriedrdquo means currently married although not necessarilywith a spouse present ldquoCollege graduaterdquo means greaterthan or equal to four years of collegeSource March Current Population Survey (CPS) 1962 to2004
15VOL 96 NO 2 RICHARD T ELY LECTURE
B Opting Out of the Revolution
Back in the 1950s when Americans wereconcerned that women were dropping out ofcollege to get married many questionedwhether women should attend college at allRecently a similar issue has been raised48
Even women who have graduated from the bestuniversities and finest professional schools arereported to be fleeing the labor force for thecomforts of home and family and the identitiesof mother and wife Rather than being ldquopushedoutrdquo or ldquoforced outrdquo they have according tosome made a conscious decision in their latetwenties and early thirties to ldquoopt outrdquo49 Doesthe current evidence support the notion that thequiet revolution is unraveling
To evaluate the opt-out assertion requireslongitudinal or retrospective data of a sufficienttimespan The individual who opts out todaymay return to the workplace tomorrow and thewoman who left the corporate law office yes-terday may wind up on the city council in ayear Young women who see romance and com-fort in being ldquostay-at-home momsrdquo may changetheir minds long before they receive their diplo-mas The requisite data must also include alarge number of female and male graduatesfrom top-ranked institutions of higher educa-tion since the opt-out assertion generally per-tains to women who by virtue of theirundergraduate institution are thought to haveopted for careers A reasonable evaluation alsorequires comparisons with similar men
The College and Beyond dataset of theAndrew W Mellon Foundation meets thesestringent criteria The dataset consists ofadministrative data for individuals from 34 ldquose-lectiverdquo universities and colleges and the results
of a survey50 The entering class of 1976 isexamined here because it is one of the latestcollege cohorts for which information exists totheir mid-life The survey was completed in1995ndash96 when the respondents were around 37years old by which time most of the womenhad completed their childbearing years al-though career and other demographic transi-tions would continue51 College and Beyondcontains the largest sample of college graduatesfrom selective institutions that currently existswith data relevant to the issues at hand52 Usingthese data I explore out-of-work spells amongcollege graduate women and how these spellswere affected by family further education andoccupation53 Only noneducation related spellsare considered and only spells of more than sixmonths were recorded in the survey
In the more than 15 years since receivingtheir baccalaureate degrees the median womanwho graduated from one of the 34 selectivecolleges was never out of work for more thansix months at a time and that was true evenamong those who had at least one child (Table1)54 The sum of all out-of-work spells was just155 years that for women with children was208 years and that for women without childrenwas 041 years or just 5 months Among allwomen less than one-quarter had out-of-workspells totaling two years or more and among
decreased from 1984 to 2004 controlling for year effectsand demographics
48 A moment of deja vu can be found in a reviewby Caroline Hill in the Journal of Political Economy ofCharlotte Perkins Gilmanrsquos book Hill remarked ldquoThe con-servative has had his innings since about 1900 because afew highly educated women have abandoned their specialtiesfor their families they are used as illustrations of the futility ofopening graduate schools to womenrdquo (Hill 1904 p 410)
49 See the New York Times magazine section article byLisa Belkin (2003) on what she termed the ldquoopt out revo-lutionrdquo and the firestorm that ensued in newspapers acrossthe nation
50 Because of confidentiality requirements the Collegeand Beyond dataset is restricted I thank the Andrew WMellon Foundation for making the data available to me forthis and other research For more information on the Collegeand Beyond survey see the data appendix in William GBowen and Derek Bok (1998)
51 The cumulative probability of a college graduatewoman born from 1955 to 1959 having any birth after age37 was 0136 The total number of births this group wouldhave to age 44 was 1424 The probability of a first birthafter age 37 for this group was 003 (Goldin et al unpub-lished 2006)
52 Lawrence F Katz Bryce Ward and I are currentlycompiling similar data for various entering classes begin-ning in 1969 from one highly selective college These datawill be more current than are those in the College andBeyond and will contain better demographic and occupa-tional data
53 The College and Beyond data do not include informa-tion on the birth dates of the children Only data on thenumber of children were collected although the no-workspell information includes whether the spell was for ldquofamilyreasonsrdquo
54 Because I include education spells for which the re-spondent also gave another reason (eg family responsibil-ities) out-of-work spells are likely to be a bit overstated
16 AEA PAPERS AND PROCEEDINGS MAY 2006
women with children the figure is less thanone-third For most women the sum of all out-of-work spells during their first 15 years aftergraduation was remarkably short The spellswere to be sure larger than those for compa-rable men who logged 0244 years (or 3months) total in out-of-work spells but theywere nonetheless a small fraction of their yearssince graduation Of the fraction of the timesince graduation not spent to advance their ed-ucation these women were away from workjust 11 percent of the time and only 7 percentwere away from work for more than 50 percentof the time
In a regression context children were themost important factor related to out-of-workspells for women and a clear nonlinearity existsin the impact of successive numbers of childrenOne child increased total time not at work byjust 036 years on average two children by 141years and three (or more) by 284 years55 Theopposite effect holds for men The first childdecreased out-of-work spells by 014 years thenext by 018 years and beyond that by 021years Women with advanced degrees had far
briefer spells than other women and the effectholds even for those with children In fact al-most all of the difference between the out-of-work spells of those with advanced degreesand others is due to the shorter duration oftheir spells for having children Those withmedical degrees had the shortest no-workspells PhDs were next and then lawyersAfrican American women had the briefestspells of all56
Evidence from the Current Population Sur-veys (CPS) and the College and Beyond datasetdoes not indicate that college graduate womenparticularly those from selective institutionshave opted out in significant numbers and thatthe phenomenon has increased57 But becausedata to be meaningful must reveal the fulllongitudinal view from late in life the path of
55 Coefficients on the number of children are from aregression including marital status race and the variousprofessional and graduate degrees Controls for college se-lectivity and the individualrsquos SAT scores did not affect theestimates
56 Attendance at a womanrsquos college decreased out-of-work spells but only because womenrsquos college graduates inthis sample had fewer children due in part because a lowerpercentage married
57 The opt-out thesis can also be evaluated with regard towhether women in the 1976 entry class who earned ad-vanced degrees were in occupations in 1995 that weredirectly degree-related The vast majority of women whotrained to be medical doctors were employed as physicianswhen in their late thirties the same is true for women whoreceived law degrees and lawyers Women in these gradu-ating classes stuck with their specialties to about the samedegree as did comparable men
TABLE 1mdashTOTAL OUT-OF-WORK SPELLS AMONG GRADUATES OF SELECTIVE COLLEGES AND UNIVERSITIESENTERING CLASS OF 1976
Total out-of-work spells(excluding for education)
Women Men
AllWith
childrenWithoutchildren
Prof or graddegree All
0 0585 0501 0765 0705 085905 years 00351 00366 00315 00340 00222 05 to 1 years 00745 00703 00837 00738 00513 1 to 2 years 00713 00751 00629 00557 00360 2 to 5 years 0109 0139 00446 00759 00228 5 to 155 years 0125 0178 00125 00557 00084Mean years not working 155 208 0410 0808 0244Number of observations 10663 7241 3308 2440 10890
Notes Sample includes only those who received a bachelorrsquos degree from 1978 to 1985 Of those women with a graduationdate listed in the survey 98 percent received their degrees between 1978 and 1985 and 94 percent did between 1979 and 1981Out-of-work spells are defined in the survey as those greater than six months each The possible reasons for no work includefamily responsibilities layoffs retirement could not find a suitable position did not want to work and personal illness Spellsthat were solely for educational reasons are excluded here Professional or graduate degrees include doctorates (eg PhD)professional degrees (eg MD DSS DVM) and law degrees but not masterrsquos degrees (eg MA MBA) ldquoChildrenrdquois the number listed by the respondent and may include adopted or step-children (or be missing)Source Andrew W Mellon Foundation College and Beyond dataset entering class of 1976
17VOL 96 NO 2 RICHARD T ELY LECTURE
the most recent generations cannot yet bejudged There are however some hints Evi-dence on aspirations from the Astin freshmansurvey does not suggest major changes in thefactors that young people expect will yield sat-isfaction in life Data on the age at first birthfrom The National Vital Statistics Systemshows a continued increase among college grad-uate women and a slight but noticeable in-crease in the number of births to those with fouror more years of college As for the validity ofthe opt-out theory for younger cohorts the jurymust remain out for at least another decade
V Three Evolutions the Quiet Revolution andBeyond A Summary
What forces propelled the three evolutions inthe lives of adult women and brought about thequiet revolution At the risk of simplifying acomplicated social and economic transforma-tion that unleashed the most momentous changein the labor force of the twentieth century I willsummarize my argument
I separated the approximately first three-quarters of the twentieth century into threephases of evolutionary change During Phase Ifew adult and married women were in the laborforce The income elasticity of female laborsupply was large (and negative) and the substi-tution elasticity of labor supply was small Vir-tually all change in participation had to comefrom shifts in labor supply Until the two elas-ticities of the Slutsky equation changed eco-nomic growth and the consequent increasein real earnings for women would not elicitan increase in the participation of adult andmarried women But change they did duringPhase II
The income elasticity decreased considerablyin (absolute) magnitude with the arrival of nicejobs that reduced the stigma surrounding mar-ried womenrsquos work outside the home and withthe increase in high school attendance and grad-uation rates that made nice work a possibilityfor many young women The substitution effectincreased substantially with the reduction inweekly hours (and days) of work the initialstirrings of part-time work and the rapid diffu-sion of the electric household Also of someimportance although often exaggerated wasthe impact of World War II in demonstrating towomen and their families that the workplace
could be respectable and showing employersthat women were profitable to employ58
By Phase III female labor supply was ratherelastic The large increase in aggregate demandespecially in the 1960s and the accommodationof married women with the expansion of part-time work led to an enormous increase in mar-ried womenrsquos labor force participation Putsuccinctly demand raced over an elastic laborsupply function But these changes could hardlyhave been accurately predicted by the partici-pants Mostmdasheven those with college de-greesmdashhad not made plans to be in theworkforce for an extended period Work was ajob to ldquofall back onrdquo not a career The skill setof these women was not commensurate withtheir eventual life cycle labor force participa-tion But all of that would also change
Young women growing up in the 1960s couldsee that adult and married women had partici-pation rates that were rapidly increasing Theyoung began to extrapolate to their own livespossibly influenced by the resurgence of femi-nism that encouraged them to think indepen-dently Two other important changes tookplace One was the contraceptive innovationknown as the pill Aided by changes in statelaws the pill diffused to young single womenThe other was the enormous increase in divorcein the 1960s The advent of the pill for youngwomen allowed them to plan their careers be-fore planning for their families and to be takenmore seriously by their employers and advisorsA consequence of the pill was that the age atfirst marriage increased Together with the risein divorce a far smaller fraction of a womanrsquoslife would be spent married Young women inthe 1960s and 1970s were better able to predictwhat their future lifetime employment wouldbe As a result they increased their investmentsin formal schooling majored in career-orientedsubjects and continued on to professional andgraduate schools in far greater numbers They
58 Goldin (1991a) demonstrates the relatively short-livednature of the increase in womenrsquos employment in the 1940sDaron Acemoglu et al (2004) identify that female laborsupply did shift because of wartime work Using a similaridentification strategy Raquel Fernandez Alessandra Fogliand Olivetti (2004) find that wartime work not only in-creased female labor supply but had a multiplier effectthrough a change in work preferences The sons of workingwomen who lived through the early 1940s were more will-ing to have a working wife
18 AEA PAPERS AND PROCEEDINGS MAY 2006
had longer horizons than did previous genera-tions and an altered identity that placed careerahead or on equal footing with marriage
Wives were less often secondary workers theflotsam and jetsam of the labor market Theincome and substitution effects of labor supplychanged once again mainly in the 1980s and1990s No longer was womenrsquos labor supplyhighly elastic It was influenced even less thanbefore by husbandrsquos earnings The earnings ofwomen rose relative to those of men occupa-tions changed from more traditional ones tothose that had been considered nontraditional
The quiet revolution was set in motion bythe generation born in the late 1940s but anoisier revolution led by some in the oldercohorts preceded it59 As opposed to thenoisy revolution the quiet revolution was ac-complished by many who were unaware thatthey were part of a grand transformationThey were the unwitting foot soldiers of anupheaval that would alter womenrsquos employ-ment education and family But was Elycorrect in asserting that ldquoRevolutions do notgo backwardrdquo There is little evidence thatthis one has at least for now
REFERENCES
Abbott Edith ldquoA History of Industrial Employ-ment of Women in the United States AnIntroductory Studyrdquo Journal of PoliticalEconomy 1906 14(8) pp 461ndash501
Acemoglu Daron Autor David H and LyleDavid ldquoWomen War and Wages The Effectof Female Labor Supply on the Wage Struc-ture at Midcenturyrdquo Journal of PoliticalEconomy 2004 112(3) pp 497ndash551
Akerlof George A and Kranton Rachel E ldquoEco-nomics and Identityrdquo Quarterly Journal ofEconomics 2000 115(3) pp 715ndash53
Astin Alexander W Oseguera Leticia SaxLinda J and Korn William S The Americanfreshman thirty-five year trends Los Ange-les Higher Education Research Institute2002
Babcock Linda and Laschever Sara Womendonrsquot ask Negotiation and the gender dividePrinceton Princeton University Press 2003
Becker Gary S A treatise on the family Cam-bridge MA Harvard University Press 1981
Belkin Lisa ldquoThe Opt-Out Revolutionrdquo NewYork Times Magazine October 26 2003Section 6 p 42
Blau Francine D and Kahn Lawrence MldquoSwimming Upstream Trends in the GenderWage Differential in 1980srdquo Journal of La-bor Economics 1997 15(1) pp 1ndash42
Blau Francine D and Kahn Lawrence MldquoChanges in the Labor Supply Behavior ofMarried Women 1980ndash2000rdquo National Bu-reau of Economic Research Inc NBERWorking Papers No 11230 2005
Boushey Heather ldquoAre Women Opting OutDebunking the Mythrdquo Center for Economicand Policy Research Briefing Paper 2005
Bowen William G and Bok Derek The shape ofthe river Long-term consequences of consid-ering race in college and university admis-sions Princeton Princeton University Press1998
Bowen William G and Finegan T Aldrich Theeconomics of labor force participationPrinceton Princeton University Press 1969
Cain Glen G Married women in the laborforce An economic analysis Chicago Uni-versity of Chicago 1966
Campbell Helen Women wage-earners Theirpast their present and their future BostonRoberts Brothers 1893
Costa Dora L and Kahn Matthew E ldquoPowerCouples Changes in the Locational Choiceof the College Educated 1940ndash1990rdquo Quar-terly Journal of Economics 2000 115(4) pp1287ndash315
De Long J Bradford Goldin Claudia and KatzLawrence F ldquoSustaining US EconomicGrowthrdquo in Henry J Aaron James M Lind-say and Pietro S Nivola eds Agenda for thenation Washington DC Brookings Institu-tion Press 2003 pp 17ndash60
Douglas Paul H The theory of wages NewYork Macmillian Company 1934
Douglas Paul H and Schoenberg Erika HldquoStudies in the Supply Curve of Labor TheRelation in 1929 between Average Earningsin American Cities and the Proportions Seek-ing Employmentrdquo Journal of Political Econ-omy 1937 45(1) pp 45ndash79
59 The noisy revolution began in the 1960s as part of thecivil rights and somewhat later anti-war movements Theyounger cohorts transformed it in the early 1970s and cre-ated the womenrsquos liberation movement See the excellentdiscussion in Rosen (2000)
19VOL 96 NO 2 RICHARD T ELY LECTURE
Durand John D The labor force in the UnitedStates 1890ndash1960 New York Social Sci-ence Research Council 1948
Ehrenberg Ronald G and Smith Robert S Mod-ern labor economics Theory and public pol-icy 9th ed Boston Addison Wesley Press2006
Fernandez Raquel Fogli Alessandra and Ol-ivetti Claudia ldquoMothers and Sons Prefer-ence Formation and Female Labor ForceDynamicsrdquo Quarterly Journal of Economics2004 119(4) pp 1249ndash99
Goldin Claudia ldquoThe Historical Evolution ofFemale Earnings Functions and Occupa-tionsrdquo Explorations in Economic History1984 21(1) pp 1ndash27
Goldin Claudia Understanding the gender gapAn economic history of American womenOxford Oxford University Press 1990
Goldin Claudia ldquoMarriage Bars Discrimina-tion against Married Women Workers fromthe 1920s to the 1950srdquo in Patrice HigonnetDavid S Landes and Henry Rosovsky edsFavorites of fortune Technology growthand economic development since the Indus-trial Revolution Cambridge MA HarvardUniversity Press 1991a pp 511ndash36
Goldin Claudia ldquoThe Role of World War II inthe Rise of Womenrsquos Employmentrdquo Ameri-can Economic Review 1991b 81(4) pp741ndash56
Goldin Claudia ldquoThe U-Shaped Female LaborForce Function in Economic Developmentand Economic Historyrdquo in T Paul Schultzed Investment in womenrsquos human capitaland economic development Chicago Uni-versity of Chicago Press 1995 pp 61ndash90
Goldin Claudia ldquoAmericarsquos Graduation fromHigh School The Evolution and Spread ofSecondary Schooling in the Twentieth Cen-turyrdquo Journal of Economic History 199858(2) pp 345ndash74
Goldin Claudia ldquoLabor Markets in the Twen-tieth Centuryrdquo in Stanley L Engerman andRobert E Gallman eds The Cambridgeeconomic history of the United States vol-ume 3 The Twentieth Century CambridgeCambridge University Press 2000 pp549 ndash 623
Goldin Claudia ldquoFrom the Valley to the Sum-mit A Brief History of the Quiet RevolutionThat Transformed Womenrsquos Workrdquo Re-gional Review Q1 2005 14(3) pp 5ndash12
Goldin Claudia and Katz Lawrence F ldquoThePower of the Pill Oral Contraceptives andWomenrsquos Career and Marriage DecisionsrdquoJournal of Political Economy 2002 110(4)pp 730ndash70
Goldin Claudia Katz Lawrence F and Kuzi-emko Ilyana ldquoThe Homecoming ofAmerican Women The Reversal of theCollege Gender Gaprdquo Unpublished Paper2005
Goldin Claudia Katz Lawrence F ShangQingyan and Weinberg Bruce ldquoWhorsquos OptingOut Evidence from the CPS and Vital Sta-tisticsrdquo Unpublished Paper 2006
Goldin Claudia and Shim Maria ldquoMaking aName Womenrsquos Surnames at Marriage andBeyondrdquo Journal of Economic Perspectives2004 18(2) pp 143ndash60
Greenwood Jeremy Seshadri Ananth andYorukoglu Mehmet ldquoEngines of LiberationrdquoReview of Economic Studies 2005 72(1) pp109ndash33
Hill Caroline ldquoThe Economic Value of theHomerdquo Journal of Political Economy 190412(3) pp 408ndash19
Long Clarence D The labor force under chang-ing income and employment PrincetonPrinceton University Press 1958
Lundberg Shelly and Pollak Robert A ldquoSeparateSpheres Bargaining and the Marriage Mar-ketrdquo Journal of Political Economy 1993101(6) pp 988ndash1010
McElroy Marjorie B and Horney Mary JldquoNash-Bargained Household Decisions To-ward a Generalization of the Theory of De-mandrdquo International Economic Review1981 22(2) pp 333ndash49
Mincer Jacob ldquoLabor Force Participation ofMarried Women A Study of Labor Supplyrdquoin H Gregg Lewis eds Aspects of laboreconomics Princeton Princeton UniversityPress 1962 pp 63ndash97
Mincer Jacob and Polachek Solomon ldquoFamilyInvestments in Human Capital Earnings ofWomenrdquo Journal of Political Economy1974 82(2) Part 2 Marriage Family HumanCapital and Fertility pp S76ndashS108
Moehling Carolyn M ldquoWomenrsquos Work andMenrsquos Unemploymentrdquo Journal of Eco-nomic History 2001 61(4) pp 926ndash49
Olivetti Claudia ldquoChanges in Womenrsquos Hoursof Market Work The Role of Returns toExperiencerdquo Boston University Working
20 AEA PAPERS AND PROCEEDINGS MAY 2006
Paper Series in Macroeconomics NoWP2005ndash008 2005
Olivetti Claudia ldquoMeasuring Changes in Re-turns to Experience Learning-by-Doing andGender Differentialsrdquo Unpublished Paper2001
OrsquoNeill June and Polachek Solomon ldquoWhy theGender Gap in Wages Narrowed in the1980srdquo Journal of Labor Economics 199311(1) Part I pp 205ndash28
Rosen Ruth The world split open How themodern womenrsquos movement changed Amer-ica New York Viking 2000
Rubin Lillian B Families on the fault line NewYork Harper Collins 1994
US Bureau of the Census Current populationsurveys March Washington DC US Bu-reau of the Census 1962ndash2004 Available atwwwcisercornelleduASPsbrowse_ath-aspCATEGORY140
US Department of Education National Center forEducation Statistics Digest of education statis-tics 2004 Series Washington DC USDepartment of Education Available on-lineonly httpncesedgovprogramsdigestd04 2005
21VOL 96 NO 2 RICHARD T ELY LECTURE
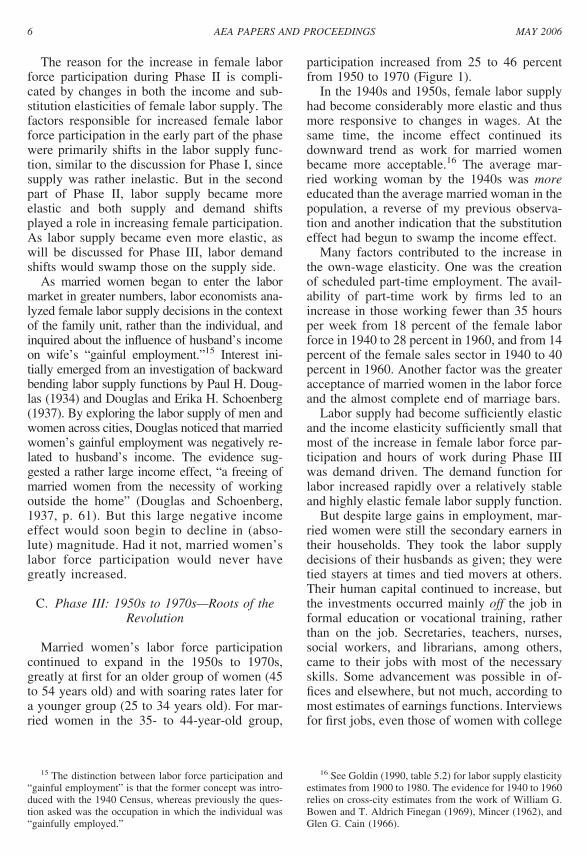
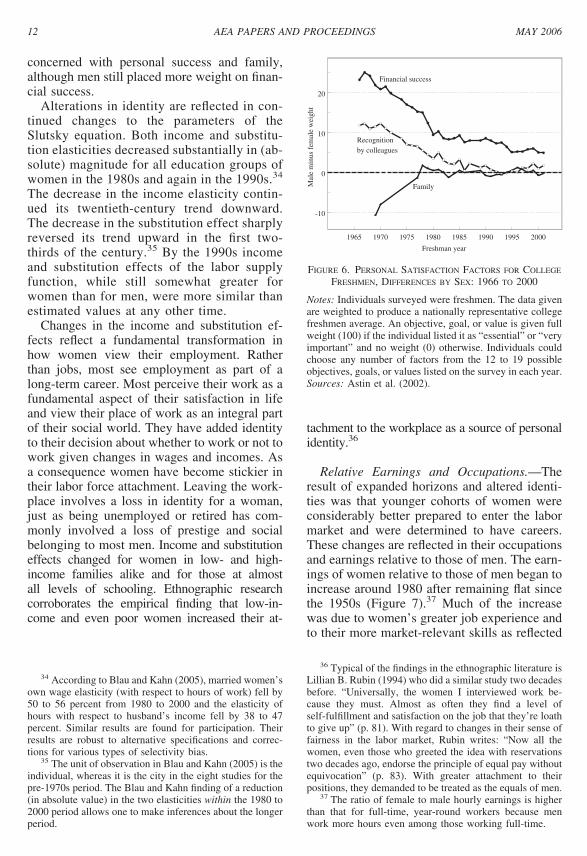