Embed Size (px)
Citation preview
T h e R a m a n sp e c tru m o f ro c k -sa lt
B y R . S. K r i s h n a n
From the Department of Physics, Indian Institute of Science, Bangalore
(Communicated by Sir C. V. Raman, F.R.S.— Received 20 June 1945)[P la te 5]
Using a non-luminescent crystal of rock-salt, a quartz spectrograph with a fine slit, and the 2536*5 A resonance radiations of mercury arc as exciter, the Raman effect in rock-salt has been studied. The spectrum exhibits nine distinct Raman lines with frequency shifts 135, 184, 202, 235, 258, 278, 314, 323 and 350 cm .-1. The frequency shifts 235 and 184 cm .-1 representing conspicuous lines in the Raman spectrum agree as nearly as could be expected with the position of the two subsidiary infra-red absorption maxima observed by Barnes & Czerny with thin films of rock-salt. The principal infra-red absorption frequency of 163 cm .-1 is inactive in the Raman effect, but its octave is represented.
The nature of the Raman spectrum to be expected is deduced on the basis of a theory due to Tamm, as also on the basis of another due to Fermi, the vibration spectrum of the rock- salt lattice being taken to be that worked out by Kellermann on the basis of the Born lattice dynamics. The results are altogether of a different nature from those actually observed experimentally in the present investigation. The conclusion is thus reached that the Born lattice dynamics does not correctly picture the vibration spectrum of the rock-salt lattice. On the other hand the observed facts, both in respect of Raman effect and infra-red absorption, fit into the theoretical picture provided by the dynamics of crystal lattices recently worked out by Sir C. V. Raman.
1 . I n t r o d u c t i o n
Rock-salt is the typical ionic crystal, and specimens of it are readily available. I t was naturally, therefore, one of the solids with which the earliest attempts to record a Raman spectrum were made. The failure to obtain any results was explained by Schaefer (1929) as due to the fundamental vibration of the rock-salt lattice being inactive in the Raman effect. A little later, however, the employment of a more powerful technique enabled Rasetti (1931) to achieve be er success. The spectrum obtained by him was reproduced, together with a microphotometric record, in a paper written jointly with Fermi (Fermi & Rasetti 1931), the latter author contributing some remarks on the theoretical aspects of the case. The spectrum as seen in the reproductions shows some noteworthy features, but no detailed descriptions or measurements were given in the paper. In view of this lack of detail in the published account of Rasetti’s experimental work and the fundamental importance of the case, it appeared desirable that the matter should be thoroughly reinvestigated. This has been done and the results are here reported. The facts disclosed by the present investigation are also fully discussed in the paper in the light of the current theories of crystal dynamics and of the Raman effect in solids.
2 . E x p e r i m e n t a l t e c h n i q u e
Following Rasetti, the present author has made use of the 2537 A radiation of the mercury arc for exciting the Raman spectrum. The arrangement, however, differed in some details from Rasetti’s. In order to excite the 2537 A radiation with great intensity and without self-reversal, the procedure described by Wood (1912) was
[ 188 ]
on August 16, 2018http://rspa.royalsocietypublishing.org/Downloaded from

The Raman spectrum of rock-salt 189
followed. A vertical type quartz mercury arc was constructed in the laboratory with mercury cathode and an anode of tungsten. The arc was kept continuously evacuated by an efficient pumping system and was operated on 220 V with sufficient resistance to keep the current well below 2 amp. To secure continuity in the operation of the lamp, a considerable self-inductance was also included in the circuit. The cathode bulb of the arc was kept immersed in running water. The discharge inside the quartz tube was pressed against its wall with the aid of a powerful electromagnet.
The specimen of rock-salt to be investigated was cut in the form of a rectangular block and its faces were well polished. The block was mounted with its longer axis parallel to the arc and facing the most intense portion of the discharge inside it. The light scattered transversely within the crystal was focused on the slit of a Hilger (E 3) quartz spectrograph by means of a condensing lens. The 2537 A radiation in the scattered light was effectively suppressed before its entry into the spectrograph by absorption in a column of mercury vapour. In order to prevent the rock-salt from getting unduly heated, a current of air was directed towards it. Under these conditions the temperature of the crystal was maintained below 40° C. In some of the earlier experiments, a 45° quartz prism was employed to enable the light scattered by the rock-salt along its longer axis to be utilized and focused on the slit of the spectrograph. With this arrangement, however, the strongest Raman line of quartz (466 cm.-1) came out feebly in the spectrogram (see figures 1 c and e, plate 5). In the later experiments, any possible co iplications of this nature were avoided by dispensing with the quartz prism and utilizing the light scattered by the rock-salt along the shorter axis of the block, though this was a less efficient arrangement. In order to get a satisfactory resolution of the details of the spectrum, the slit of the instrument was kept narrow, the width employed being between 0*02 and 0-03 mm. Ilford special rapid plates were used. Exposures of the order of two to three days were usually given to get a reasonably intense spectrogram.
3. L u m i n e s c e n c e o f r o c k -s a l t
In the first instance, several specimens of rock-salt from the Punjab mines were tried out. I t was noticed that they acquired a fugitive yellow coloration during the exposure to the intense source of ultra-violet radiation. To start with, the specimens were clear and colourless, but after a few hours of exposure the coloration began to develop, the intensity varying from specimen to specimen. The spectrograms obtained with the crystals exhibiting this effect show two prominent luminescent bands. The first of these extends from 2400 A up to 2600 A (see figure 16, plate 5). The second band extends from 2800 A to the visible region. Figures lb,c,d and e represent spectrograms taken with four different specimens of rock-salt in which the coloration for the same duration of exposure was in decreasing order of magnitude. The intensity of the first luminescent band varies also in the same order. I t is rather unfortunate that the intense portion of this band falls precisely-in the same region where the Raman spectrum of rock-salt is recorded. I t will be noticed that in
on August 16, 2018http://rspa.royalsocietypublishing.org/Downloaded from

190 R. S. Krishnan
figures 1 6 and c the Raman spectrum is masked by the luminescent band with the result that one can see scarcely any detail in it. In figures 1 d and e, where the band is comparatively of feebler intensity, one can see the Raman spectrum standing out of the background, but not with all its detail. The last two photographs, namely, figures 1 / and g, represent printings of different density of the same spectrogram taken with a crystal of rock-salt from Baluchistan. With this specimen the Raman spectrum came out clearly without being masked by luminescence.
4 . T h e R a m a n s p e c t r u m
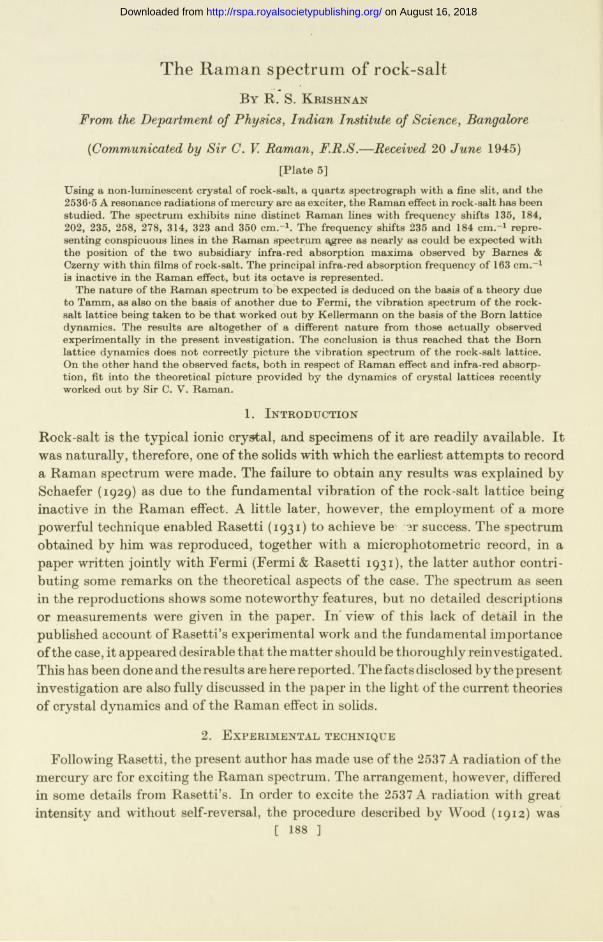
Using the non-luminescent crystal, three different spectrograms were recorded. A microphotometric record of the best of the three is reproduced together with the spectrum itself as figures 2 a and b, plate 5. The spectrum of the mercury arc is also included as figure 2 c for purposes of comparison. The region between the exciting 2536-5 A and the faint mercury line 2561-2 A where the Raman spectrum falls, is fortunately quite clear of any mercury lines except an extremely faint one at 2548-2 A, which can with difficulty be seen in the spectrogram and reveals itself by a kink in the microphotometric record. Adjacent to the exciting 2536-5 A line, there is a band extending towards the longer wave-lengths with a clearly masked maximum of intensity displaced from it by about 60 cm.-1. Rasetti thought that this was a Raman band. This view, however, does not appear to be correct, as a band with a maximum of intensity in the same position is also seen in the spectrum of the mercury arc though with less intensity. I t appears not improbable that this band is of instrumental origin.
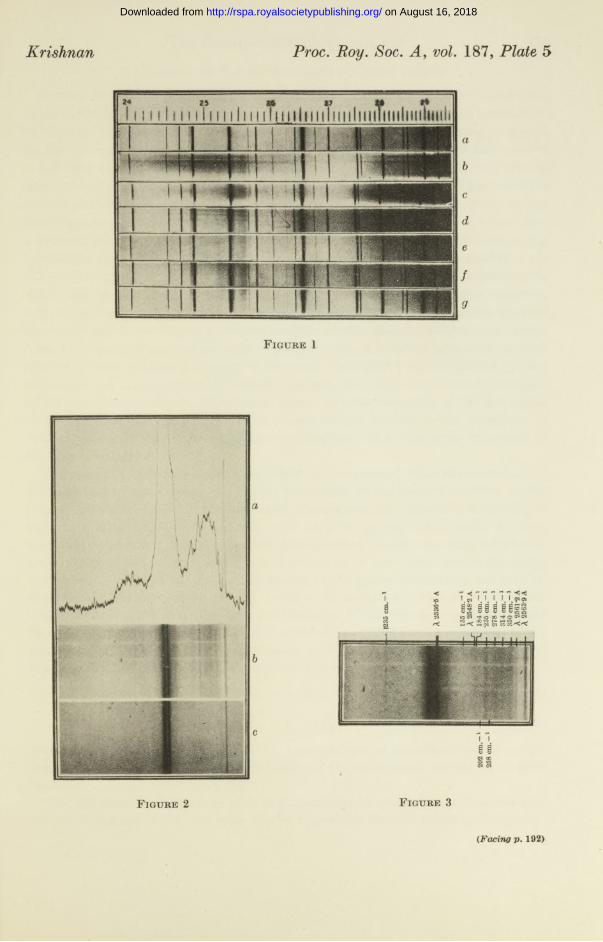
The Raman spectra recorded in the present investigation represent a considerable improvement on the work of Rasetti, a fact which may be ascribed to the use in the present work of the smallest practicable slit-width combined with an exposure sufficiently prolonged to record the fainter features properly. As is evident from figures 2 and 3, plate 5, the spectrum consists of a series of distinct Raman lines, of which at least six can be distinguished without difficulty. Their positions are marked in figure 3, their frequency shifts from the exciting line as measured being respectively 135, 184, 235, 278, 314 and 350 cm.-1. The line at 235 cm.-1 is both sharp and intense and hence is the most prominent feature of the spectrum. The corresponding anti-Stokes line is also clearly visible in the spectrogram. The lines with frequency shifts 184 and 135 cm.-1, though weaker, are also sharp. Besides the six lines listed above, the presence of two other feeble lines with frequency shifts 202 and 258 cm.-1 clearly resolved from their near neighbours on either side, has been established by a careful scrutiny of-the spectrograms and the microphotometric records. The lines with frequency shifts 278, 314 and 350 cm.-1 appear rather broad. The microphotometric records suggest that this is due to the presence in them of imperfectly resolved component lines. Between the lines with frequency shifts 314 and 350 cm.-1, an inflexion at about 323 cm.-1 is seen in the microphotometric records, indicating the presence of still another Raman line with this frequency shift.
on August 16, 2018http://rspa.royalsocietypublishing.org/Downloaded from

The Raman spectrum of rock-salt
5 . T h e i n f r a -r e d a b s o r p t i o n s p e c t r u m
191
In view of this wealth of detail in the Raman spectrum, it is of interest to recall the investigations of Barnes (1932) and Barnes & Czerny (1931) on the behaviour of rock-salt in infra-red absorption. By using thin sputtered films, they succeeded in obtaining more detail in the absorption spectrum and also greater accuracy of measurement. The principal absorption peak for rock-salt was located at 61*1 ± 0-3/i (163 wave numbers), and besides this, the existence of two other subsidiary absorption maxima was also established. These were located at 40-5 and 51/i respectively, the former being the more prominent.
We may here remark that there is no Raman line with a frequency shift 163 cm.-1, but this is not surprising, since according to the well-known selection rules, for a crystal with full cubic symmetry (Placzek 1934), the fundamental frequencies active in infra-red absorption would be inactive in light-scattering. We might, however, expect the octave of this frequency as a Raman shift. I t is doubtful if either of two Raman lines, having frequency shifts 314 and 350 cm.-1 respectively, can be explained in this way, in view of the accuracy with which Barnes & Czerny claim to have determined the infra-red active frequency. As remarked earlier, however, the microphotometric records indicate the presence of a Raman line with a frequency shift of 323 cm.-1. This agrees nearly enough with the octave of the principal infrared active vibration frequency. As the subsidiary infra-red absorption maxima are rather weak and appear on the slope of a steeply falling absorption curve, their frequencies (247 and 196 cm.-1), as given by Barnes & Czerny, are probably uncertain to some extent. Indeed, it appears likely that they are the same as the frequency shifts (235 and 184 cm.-1 respectively) of the two most conspicuous lines in the Raman spectrum.
6 . T h e v i b r a t i o n s o f t h e r o c k -s a l t l a t t ic e
We shall now consider the significance of the facts ascertained by the present investigation in relation to the theories of the Raman effect in crystals which have been proposed by Mandelstam, Landsberg & Leontowitsch (1930) and by Tamm (1930). As these authors take the Born lattice dynamics as their starting-point, the task of comparing the consequences of their theories with the experimental facts is made much easier by the recent work of Kellermann (1940, 1941) who has calculated the vibration spectrum of the rock-salt lattice on the same basis. Kellerma.m analyses the frequency distribution of the lattice vibrations by drawing separate curves for the ‘ acoustic ’ and ‘ optical ’ waves in the crystal, these being subdivided into the ‘ longitudinal ’ and ‘ transverse ’ sets of waves. Each of the four distribution curves is a continuous one stretching between wide limits of frequency and exhibiting a single broad hump between these limits. The frequency spectrum obtained by summation of the four separate distributions is likewise a continuous one and stretches from zero frequency upwards to about 320 cm.-1, exhibiting three humps in its course between these limits. The limiting frequency for acoustic waves of great
on August 16, 2018http://rspa.royalsocietypublishing.org/Downloaded from

192 R. S. Krishnan
length is naturally zero; while for the transverse optical waves, Kellermann finds it to be 151 cm.-1, and this he identifies with the frequency of the ‘residual rays’ of rock-salt. This calculated frequency, it may be remarked, is not very wide of the observed infra-red absorption peak at 163 wave numbers. Kellermann offers no interpretation of the subsidiary infra-red absorption maxima observed by Barnes and Czerny at 247 and 196 cm.-1.
7. T h e o r y o f t h e f i r s t -o r d e r R a m a n e f f e c t
Following Born, Tamm (1930) assumes that the vibrations of the crystal lattice in the acoustic as well as in the infra-red regions of frequency may be analysed into sets of plane waves extending through the crystal, each of a definite wave-length. The application of the energy and momentum theorems to a collision between a photon and the vibration quantum leads to the formulae
vm = vl± (1)
K m = K l± K (r) (2)
where the v is a frequency and K a reciprocal wave vector; the suffixes l, m and cr refer respectively to the incident light, the scattered light and the vibrational waves. Since the difference between K m and K z is never great, it follows from equation (2) that whenever there is an observable scattering, the wave-length of the lattice vibrations giving rise to it is comparable with the wave-length of the incident light and hence large compared with the lattice spacings in the crystal. Hence, the only vibrations which can manifest themselves in the Raman effect are those having such large phase wave-lengths.
The physical meaning of the relations stated in (1) and (2) becomes clearer when we consider the origin of the scattered radiations. Each volume element in the crystal is optically polarized under the influence of the electric field of the light waves traversing it, and this polarization is varied periodically by the vibrations of the lattice. Hence arises an optical stratification of the medium having the same spacing as the phase waves of the mechanical vibrations. According to equation (2), the scattering of light with altered frequency may be interpreted as a kind of reflexion of the incident light waves by these optical stratifications. Alternatively, we may regard each volume element in the crystal pulsating with frequency as a source of secondary light waves of altered frequency vm as indicated by^(l). The optical pulsations in individual volume elements located everywhere in the crystal have coherent phase relationships and therefore also the scattered radiations originating from them. Accordingly, these cancel out by mutual interference except in the special circumstance indicated by equation (2); this equation is the condition for the agreement in phase of the secondary radiations from the different volume elements and their mutual reinforcement in the direction of observation.
on August 16, 2018http://rspa.royalsocietypublishing.org/Downloaded from
Krishnan Proc. Roy. Soc. A ,vol. 187, Plate 5
F ig u r e 1
F ig u re 2 F ig u re 3
(Facing p . 192)
on August 16, 2018http://rspa.royalsocietypublishing.org/Downloaded from

The Raman spectrum of rock-salt 193
8 . T h e o r y o f t h e s e c o n d -o r d e r R a m a n e f f e c t
Coming now to the case of rock-salt, the changes of frequency due to the reflexion of the light waves by the acoustic waves of appropriate length would be too small to be recorded by a prismatic spectrograph. On the other hand, the limiting frequency for the optical waves corresponds to a vibration active in the infra-red but inactive in light-scattering. Hence, on the basis of the Tamm theory, rock-salt can give no observable Raman effect so long as the oscillations of the lattice and the resulting optical stratifications are assumed to be strictly of a harmonic type. Thus, to find an explanation for the Raman spectrum which is actually recorded with rock-salt, it becomes necessary to consider the second-order effects which arise when the lattice oscillations are anharmonic and/or when the variations of optical polarizability are not exactly proportional to the atomic displacements. The optical stratifications would then not be of the simple harmonic type, either in respect of time variation, or in respect of space distribution. Considering a single set of plane waves of specified frequency and wave-length, a Fourier analysis of the optical stratifications arising from it in respect of time would yield additional terms (a constant term, octave, etc.), while a Fourier analysis in respect of the space distribution would similarly give a constant term, stratifications of half wave-length, etc. When two or more vibrations of different frequencies are superposed, apart from the overtones of the individual vibrations, combinational frequencies would also be present in the variations of optical polarizability. Corresponding complications would also arise in respect of the space variations.
The general features of the Raman effect to be expected when the second-order term s are taken into account can readily be inferred on the basis of the ideas underlying Tamm’s treatment of the first-order phenomena. An observable scattering of light with altered frequency can only arise when an optical stratification of corresponding frequency and of appropriate spacing exists, thereby enabling the photon and the crystal to exchange energy and momentum. I t is evident that on this basis, the constant terms in the Fourier expansion of the space distribution can give no observable effect and may be ignored. Further, it follows that a second-order Raman spectrum exhibiting overtones and combinations of the lattice frequencies would be observed only in respect of the lattice vibrations which satisfy equations of the same general type as (1) and (2) but suitably modified. We may, for instance, expect the octaves of lattice frequencies to appear as Raman shifts when
Vm = Vl ± 2 v ir, (3)
K m = K l±2K<r, (4)
the factor 2 in equation (4) indicating th a t the optical stratifications of double frequency have half the phase wave-length of the mechanical vibrations as their spacing.
The theoretical position may thus be summarized by the statement that the only lattice vibrations which can give rise to observable Raman shifts of frequency,
Vol. 187. A. 13
on August 16, 2018http://rspa.royalsocietypublishing.org/Downloaded from

194 R. S. Krishnan
either of the first order (fundamentals) or of the second order (overtones and combinations) are the so-called limiting vibrations which have phase wave-lengths large compared with the lattice spacings of the crystal. Since, according to Keller- mann, rock-salt has only one limiting optical frequency, it follows that the second- order Raman spectrum should consist exclusively of a single sharp line with a frequency shift of double that frequency. As we have seen, however, the experimental facts are totally different. We are thus compelled to recognize that the theory of Tamm is incompetent to explain the observed behaviour of rock-salt in the Raman effect.
9. An a l t e r n a t i v e t h e o r y
In his paper written jointly with Rasetti, Fermi (1931) has sought to approach the theory of the Raman effect in crystals from a standpoint which is somewhat different from that of Tamm. He considers the crystal to be made up of numerous volume elements each of which includes a great many lattice cells but is, nevertheless, of dimensions small enough to justify neglect of the variations in phase of the incident and scattered light beams inside it. Fermi then proceeds to consider the phases of the lattice vibrations and the resulting variations of optical polarizability within a volume element. I t is obvious that if such variations have a constant sign within a volume element, the scattered radiations from the individual lattice cells contained in it would reinforce each other and give an observable effect. contra, when the phase varies from cell to cell within the element of volume, the scattered radiations from the individual cells would cancel out each other’s effect, and thus give a negligible resultant effect.
The approach suggested by Fermi would obviously be justified only if each volume element could be regarded as functioning independently of the others, in other words , if the vibrations of infra-red frequency in adjacent volume elements have no coherent relations of phase. This, it should be remarked, is a fundamental departure from the basic ideas of the Born lattice dynamics. Nevertheless, it is not without interest to follow up the line of thought suggested by Fermi and to investigate what the Raman spectrum of rock-salt would be if the vibrations of its lattice were assumed to be those described in Kellermann’s paper. I t is readily shown that the position is the same as on Tamm’s theory in respect of the first-order effects. The second-order phenomena, however, would be totally different. We are no longer concerned with the optical stratifications which figure so prominently in the Tamm theory. On the other hand, the space-constant but time-variable effects arising from second-order terms, which were previously insignificant, would now play the leading role. As a consequence, it follows that every mode of vibration of the lattice and not merely the vibration of limiting frequency would contribute its quota to the second-order Raman spectrum exhibiting the octaves and combinations of the lattice frequencies.
According to Kellermann, the frequency of the transverse optical waves ranges from 119 to 194 cm.-1. Hence, the octaves would appear in the second-order Raman
on August 16, 2018http://rspa.royalsocietypublishing.org/Downloaded from

The Raman spectrum of rock-salt 195
spectrum as a continuous band covering the range of frequency shifts from 238 to 388 cm.-1. The longitudinal optical waves should similarly give a continuous band covering the frequency range from 366 to 640 cm.-1. If the acoustical waves could make any sensible contribution to the second-order Raman spectrum, this would similarly be in the nature of a continuous band covering the region of frequency shifts from 0 to 362 cm.-1, which would partly overlap and intensify the band due to the transverse optical waves. Combinational frequencies would also manifest themselves, but they need not be discussed in detail, since the result of their superposition would not alter the general nature of the spectrum to be expected, namely a continuous band covering the region of frequency shifts from 238 to 640 'em.-1 and possibly extending towards lower frequencies, but not exhibiting any fine structure of the kind actually observed.
10. G e n e r a l c o n c l u s i o n s
From the preceding discussion, it is clear that neither on the basis of the Tamm theory nor according to the modified approach suggested by Fermi, is it possible to reconcile the consequences of the Born lattice dynamics with the experimental facts of the Raman effect as observed with rock-salt. The discrepancies observed between fact and theory are of a far-reaching character, and extend to every aspect of the observed spectrum. Hence we are left in no doubt about the conclusion to be drawn, namely, that the vibration spectrum of the rock-salt lattice in the infra-red region of frequency, as deduced from the lattice dynamics of Born, bears no resemblance to the actual vibration spectrum.
The normal modes and frequencies of vibration of the atoms in the space-lattice of a crystal have been investigated in a general manner by Sir C. V. Raman (1943) in a recent memoir. The conclusions reached therein regarding the nature of the vibration spectrum are altogether different from those envisaged in the well-known theories of Debye and of Max Born. I t is sufficient here to quote the results of the memoir as applied to the particular case of rock-salt, viz. that the lattice structure of this crystal has nine characteristic modes of vibration in the region of infra-red frequencies. These have been described fully (Chelam 1943) and the nature of the modes is such that none of them can manifest itself as a frequency shift in the Raman spectrum of the first order. All the nine modes, however, are allowed as octaves in the second-order Raman spectrum. Only one of the nine modes is active in infra-red absorption. The eight other modes can only appear as octaves and combinations in the infra-red absorption spectrum.
That the Raman spectrum of rock-salt as actually observed is a second-order effect is clear from the fact that it is only recorded under the most intense excitation. Further, as we have seen, the spectrum exhibits nine distinct Raman lines. The frequency shifts of the two most conspicuous of these agree as closely as could be expected with the frequencies of certain infra-red absorption bands. The latter, it may be inferred from their extreme weakness, are octaves and not actual lattice
1 3 - 2
on August 16, 2018http://rspa.royalsocietypublishing.org/Downloaded from

196 R. S. Krishnan
frequencies. Thus, in all its details, the spectroscopic behaviour of rock-salt fits into the theoretical picture provided by the new approach to crystal dynamics. Further investigations would be required to determine with complete certainty the assignment of the frequencies observed spectroscopically to the particular modes of vibration possible.
In conclusion, the author wishes to express his indebtedness to Professor Sir C. V. Raman, F.R.S., for kind encouragement and useful discussions.
R e f e r e n c e s
Barnes 1932 Z . P h ys. 75, 723.Barnes & Czerny 1931 Z . Phys. 72, 447.Chelam 1943 Proc. Ind. Acad. Sci. A, 18, 257.Fermi & R asetti 1931 Z. Phys. 71, 689.Kellermann 1940 Phil. Trans. A, 238, 513.Kellermann 1941 Proc. Roy. Soc. A, 178, 17.Mandelstam, Landsberg & Leontowitsch 1930 Z. Phys. 60, 334. Placzek 1934 M arx , Handbuch der Radiologic, 6 , part 2.Ram an 1943 Proc. Ind. Acad. Sci. A, 18, 237.R asetti 1931 N ature , 127, 626.Schaefer 1929 Z. Phys. 54, 153.Tamm 1930 Z. Phys. 60, 345.W ood 1912 Phil. M ag. 50, 761.
D e s c r i p t i o n o f P l a t e
F ig u r e 1. Spectrograms, two-fold enlarged: a, mercury arc and wave-length scale; b, c, d, e, scattering and luminescence in four different specimens of rock-salt; / and g , Ram an spectra * of non-lum inescent crystal.
F ig u r e 2. Spectrograms, six-fold enlarged: 6, Raman spectrum; a, its m icrophotom etric record; c, mercury arc comparison. N ote . The diffuse band adjoining the exciting line to its right is seen both in b and c and is thus not a Raman band.
F ig u r e 3. Raman spectrum nine-fold enlarged and with frequency shifts marked.
on August 16, 2018http://rspa.royalsocietypublishing.org/Downloaded from