Embed Size (px)
Citation preview

The Real Biofuel Cycles
Tad W. Patzek
Department of Civil and Environmental Engineering
425 Davis Hall, MC 1716
University of California, Berkeley, CA 94720
Email: [email protected]
Online Supporting Material for Science Letter, Vol. 312, p. 1747, 26 June, 2006
July 11, 2006
Abstract
This paper analyzes energy efficiency of the industrial corn-ethanol cycle and brackets energyefficiency of the switchgrass-cellulosic ethanol cycle. In particular, it critically evaluates thepublications by Farrell et al. (2006a; 2006c) and Shapouri, Wang, et al. (Wang, 2001; Shapouriet al., 2002; Shapouri et al., 2003; Shapouri and McAloon, 2004). It is demonstrated that ina net-energy analysis of the industrial corn-ethanol cycle (Farrell et al., 2006a; Farrell et al.,2006c) did not (i) define the system boundaries, (ii) conserve mass, and (iii) conserve energy.
As already pointed out in (Patzek, 2004), most of the current First Law net-energy models ofthe industrial corn-ethanol cycle are based on nonphysical assumptions and should be discarded.The energy cost of producing and refining carbon fuels in real time, e.g., corn and ethanol, is highrelative to that of fossil fuels deposited and concentrated over geological time. Proper mass andenergy balances of corn fields and ethanol refineries that account for the photosynthetic energy,part of the environment restoration work, and the coproduct energy have been formulated. Thesebalances show that energetically production of ethanol from corn is 2 – 4 times less favorablethan production of gasoline from petroleum. From thermodynamics it also follows that ecologicaldamage wrought by industrial biofuel production must be severe, see also (Patzek, 2004; Patzekand Pimentel, 2006). With maximum theoretical yield of ethanol and the DDGS coproductenergy credit, 3.9 gallons of ethanol displace on average the energy in 1 gallon of gasoline.Without the DDGS energy credit, this average number is 6.2 gallons of ethanol. EquivalentCO2 emissions from corn ethanol are 50% higher than those from gasoline, and become 100%higher if methane emissions from cows fed with DDGS are accounted for.
The U.S. ethanol industry has consistently inflated its ethanol yields by counting 5 volumepercent of # 14 gasoline denaturant (8% of energy content) as ethanol. Also, imports fromBrazil and higher alcohols seem to have been counted as U.S. ethanol. A detailed analysis of778 samples of 401 corn hybrids reveals that the highest possible yield of ethanol is 2.64± 0.05gal ethanol/per nominal wet bushel of corn. The commonly accepted USDA estimate of meanethanol yield in the U.S., 2.682 gal EtOH/bu, is one standard deviation above the rigorousstatistical estimate in this paper. From a mass balance of soil (Patzek, 2004), it follows thatethanol coproducts should be returned to the fields.
The energy efficiency of current cellulosic ethanol production is poorer than that of any otherindustrially produced liquid biofuel (Patzek and Pimentel, 2006).
1


U.C. Berkeley T. W. PATZEK i
Contents
1 Introduction 1
2 Corn Has No Energy 2
2.1 Net energies of various fuels . . . . . . . . . . . . . . . . . . . . . . . . . . . . . . . . 4
3 Ethanol Yield is High 8
3.1 Corn Characterization and Starch Content . . . . . . . . . . . . . . . . . . . . . . . . 9
3.2 Starch Yield and Theoretical Ethanol Yield . . . . . . . . . . . . . . . . . . . . . . . 9
3.3 Comparison with Ethanol Industry Average . . . . . . . . . . . . . . . . . . . . . . . 14
3.4 Summary of Ethanol Yield Conclusions . . . . . . . . . . . . . . . . . . . . . . . . . 16
4 Co-Products Receive Energy Credit 17
5 System Boundaries, Mass, and Energy Balance 19
5.1 How to Analyze the Corn-Ethanol Cycle? . . . . . . . . . . . . . . . . . . . . . . . . 21
5.2 The Mass Balances of Subsystems I-II . . . . . . . . . . . . . . . . . . . . . . . . . . 21
5.2.1 Mass Balance of Corn Farming (Subsystem I) . . . . . . . . . . . . . . . . . . 23
5.2.2 Overall Mass Balance of Soil (Subsystem I) . . . . . . . . . . . . . . . . . . . 23
5.2.3 Mass Balance of Corn Processing (Subsystem II) . . . . . . . . . . . . . . . . 24
5.3 The Energy Balances of Subsystems I-II . . . . . . . . . . . . . . . . . . . . . . . . . 24
5.3.1 Energy Balance of Corn Farming (Subsystem I) . . . . . . . . . . . . . . . . . 24
5.3.2 Overall Energy Balance of Soil (Subsystem I) . . . . . . . . . . . . . . . . . . 25
5.3.3 Overall Energy Efficiency of Corn Farming (Subsystem I + Environment) . . 25
5.3.4 Energy Balance of Corn Processing (Subsystem II) . . . . . . . . . . . . . . . 26
5.4 What Is Wrong with Net-Energy Analysis? . . . . . . . . . . . . . . . . . . . . . . . 29
5.5 Coproduct Energy Credit Revisited . . . . . . . . . . . . . . . . . . . . . . . . . . . . 30
6 Equivalent CO2 Emissions from the Corn-Ethanol Cycle 32
7 Ecology & Macro-Economics of Corn Ethanol Production 33
7.1 Ecological Consequences . . . . . . . . . . . . . . . . . . . . . . . . . . . . . . . . . . 33
7.2 Economic Consequences for Midwest . . . . . . . . . . . . . . . . . . . . . . . . . . . 35
7.3 Economic Consequences for U.S. . . . . . . . . . . . . . . . . . . . . . . . . . . . . . 36
8 Cellulosic Ethanol 39
9 Summary and Conclusions 41
10 Acknowledgements 42
List of Tables
1 Energy efficiencies of fuel production processes . . . . . . . . . . . . . . . . . . . . . 7
2 Hybrid corn varieties in the 2005 Illinois database . . . . . . . . . . . . . . . . . . . . 8
3 Overall Ethanol Yields Reported in Renewable Fuels Association’s 2004 EthanolIndustry Outlook . . . . . . . . . . . . . . . . . . . . . . . . . . . . . . . . . . . . . . 14
4 Corn kernel composition . . . . . . . . . . . . . . . . . . . . . . . . . . . . . . . . . . 16

ii The Real Biofuel Cycles
5 Average high and low heating values of fuels . . . . . . . . . . . . . . . . . . . . . . . 176 True cost of ethanol . . . . . . . . . . . . . . . . . . . . . . . . . . . . . . . . . . . . 38
List of Figures
1 Equivalence of ancient and contemporary sequestration of solar energy . . . . . . . . 32 Ancient and new plants . . . . . . . . . . . . . . . . . . . . . . . . . . . . . . . . . . 43 The carbon cycle . . . . . . . . . . . . . . . . . . . . . . . . . . . . . . . . . . . . . . 54 Free energy (exergy) flow the ideal CO2-Glucose-EtOH cycle . . . . . . . . . . . . . 65 Fraction of motor gasoline replaceable with all U.S. corn . . . . . . . . . . . . . . . . 76 Increase of passenger car mileage sufficient to replace all ethanol in the U.S. . . . . . 87 Extractable starch vs. total starch . . . . . . . . . . . . . . . . . . . . . . . . . . . . 108 Distribution of extractable starch . . . . . . . . . . . . . . . . . . . . . . . . . . . . . 119 Nominal losses in in #2 Yellow Corn . . . . . . . . . . . . . . . . . . . . . . . . . . . 1110 Distribution of theoretical ethanol yields in kg/kg . . . . . . . . . . . . . . . . . . . . 1211 Distribution of grain moisture . . . . . . . . . . . . . . . . . . . . . . . . . . . . . . . 1212 Distribution of theoretical ethanol yields in gal/bu . . . . . . . . . . . . . . . . . . . 1413 Ethanol yields reported by the industry . . . . . . . . . . . . . . . . . . . . . . . . . 1514 Fossil energy used in ethanol refineries . . . . . . . . . . . . . . . . . . . . . . . . . . 1915 Ratio of energy used to refine corn grain to ethanol and energy used to refine crude
oil to diesel fuel . . . . . . . . . . . . . . . . . . . . . . . . . . . . . . . . . . . . . . . 2016 DDGS from all U.S. corn as cow feed . . . . . . . . . . . . . . . . . . . . . . . . . . . 2117 Mass and energy balance: system boundaries . . . . . . . . . . . . . . . . . . . . . . 2218 Overall energy efficiency of industrial corn-ethanol cycle . . . . . . . . . . . . . . . . 3019 Gallons of corn-ethanol needed to produce energy in 1 gallon of gasoline . . . . . . . 3020 Equivalent CO2 emissions by source . . . . . . . . . . . . . . . . . . . . . . . . . . . 3221 Equivalent CO2 emissions from corn ethanol and other fossil fuels . . . . . . . . . . . 3422 Severe field soil erosion . . . . . . . . . . . . . . . . . . . . . . . . . . . . . . . . . . . 3523 Surface area of the anoxic zone in GOM . . . . . . . . . . . . . . . . . . . . . . . . . 3624 Normalized corn yield and price in Iowa . . . . . . . . . . . . . . . . . . . . . . . . . 3725 E85 fuel is sold here . . . . . . . . . . . . . . . . . . . . . . . . . . . . . . . . . . . . 3926 Glucose decomposition paths . . . . . . . . . . . . . . . . . . . . . . . . . . . . . . . 4727 Schematic of a dry grind corn ethanol plant . . . . . . . . . . . . . . . . . . . . . . . 48
U.C. Berkeley T. W. PATZEK 1
Nothing useless is, or low;
Each thing in its place is best;
And what seems but idle show
Strengthens and supports the rest.
The Builders by Henry Wadsworth Longfellow
1 Introduction
This paper analyzes energy efficiency of the industrial corn-ethanol cycle and brackets energyefficiency of the switchgrass-cellulosic ethanol cycle. In particular, it critically reviews the Reportby Farrell et al., Ethanol Can Contribute to Energy and Environmental Goals, Science, 311,506-508, 2006 (abbreviated here as Report). Farrell et al. should be commended for attemptingto bring together the different studies in the area of biofuel production. They acknowledge thatenvironmental effects of large-scale biofuel production are poorly understood and need to be studied,and they indicate that large-scale use of ethanol will require lignocellulosic conversion.
The Farrell et al. (2006a) Report is based on an Excel spreadsheet with cells containingnumbers from three peer-reviewed papers (Patzek, 2004; Pimentel and Patzek, 2005; de Oliveiraet al., 2005) and four1 gray-literature reports (Wang, 2001; Graboski, 2002; Shapouri et al., 2002;Shapouri and McAloon, 2004). The authors cite the only relevant peer-reviewed paper by Shapouri
et al. (2003) merely to rationalize their Footnote 6 that disposes of the calorific value of corn grain.The Report’s Supporting Online Material (abbreviated here as SOM) is a Users’ Manual that
explains the spreadsheet assumptions and contents. The authors then perform certain arithmeticoperations on the numbers they have stored in the spreadsheet, from which they draw their con-clusions.
There are several important peer-reviewed papers and books the Report does not mention, forexample:
1. The outstanding book by Professor Vaclav Smil et al. (1983) that contains the most com-plete physical model of industrial corn agriculture to date is not quoted.
2. The powerful and thorough book, Fatal Harvest - The Tragedy of Industrial Agriculture
(Kimbrell, 2002), could inform the cellulosic ethanol enthusiasts, but is not mentioned. Thisbook goes very well with another monograph by Professor Smil, Carbon – Nitrogen – Sulfur
– Human Interferences in Grand Biospheric Cycles (Smil, 1985).
3. The seminal Proceedings of the International Federation of Institutes for Advanced Study(Slesser, 1974; Slesser, 1975) that have provided guidelines for Parts II and III of (Patzek,2004) are neither cited nor followed.
4. The great handbook of ecological case histories and the science tools used to address them,edited by Professors Charles Hall and John Day, Jr. (Hall and Day, 1977), is neithercited nor followed. This book provides deep insights into the complex relationship betweenman and nature.
In order to arrive at their conclusions about corn and cellulosic ethanol, the authors chose thefollowing path:
1The terse, 5-page report (Shapouri and McAloon, 2004) is incomplete and, e.g., corn ethanol yield must beinferred from (Shapouri et al., 2002).
2 The Real Biofuel Cycles
C1. Corn Grain Has No Energy. Calorific value of corn grain is omitted and not subtractedas a raw energy input to ethanol refineries.
C2. Ethanol Yield Is High. Average yield of corn ethanol is increased by more than possible.
C3. Co-Products Receive Energy Credit. Roughly 30 to 50% of the fossil energy used todistill ethanol is subtracted from the biorefinery energy balance2.
C4. Results Are Consistent with Some Reports. The final results are consistent with thefollowing reports: (Wang et al., 1997; Wang, 2001), (Graboski, 2002), and (Shapouri et al.,2002; Shapouri and McAloon, 2004).
C5. While Corn Ethanol May Not Be So Good, Cellulosic Ethanol Is. Even if theaverage net fossil energy ratio were 1.2 for the corn ethanol-cycle3, the entire U.S. corn cropwould replace only 2% of the energy in motor gasoline used in the U.S. Cellulosic ethanol,however, “could play a key role in meeting the nation’s energy and environmental goals.”
My thermodynamics paper was quoted because some of the numbers in the Report’s spreadsheetoriginated from it. The most important Part III of (Patzek, 2004) contains (i) the parametersclassified in the spreadsheet as “NR” (for not reported), and (ii) a proper mass balance of soil anda free energy (Second Law) balance of corn-ethanol cycle. This Second Law balance: (1) Naturallyaccounts for the free energy of starch (C1), (2) highlights limitations of the USDA ethanol yieldestimate (C2), (3) naturally separates starch and ethanol from corn grain leftovers and co-products(C3), and (4) calculates the ratio of the cumulative free energy consumed in ethanol productionto mechanical work obtained from this ethanol to be up to 7:1, depending on the machine thattransforms the chemical energy of ethanol into work (C4).
Here I will discuss at some length the scientific underpinnings of C1 – C5. I will try to makemy reasoning accessible to general public.
2 Corn Has No Energy
The goal of this section is to remind the reader that crude oil has essentially the same relationshipto gasoline as corn grain to corn ethanol. Both could be burned directly as fuel for cookingand heating4. Both are feedstocks in the production of an automotive liquid fuel (gasoline) andoxygenate5 (ethanol), respectively.
Just as one subtracts the energy of petroleum input from the energy of refined fuel output(Sheehan et al., 1998) to estimate efficiency of a petroleum refinery, one must subtract the energyof corn starch input from the ethanol output (Patzek, 2004) of a biorefinery to estimate its efficiency.This was not done in the Report.
2Ethanol distillation is the single biggest expenditure of fossil energy in the corn-ethanol cycle, see Section 4.3And it is not, even according to (Shapouri et al., 2003), see the two bottom lines in Table 6, and (Shapouri and
McAloon, 2004), the bottom line of Table 3.4Corn grain stoves have been used in the South and Southwest since 1969, when the stove was invented by Carol
Buckner of Arden, NC. The most famous demonstration of the heating power of corn was performed in the OvalOffice, where a corn stove was installed during the administration of President Jimmy Carter. Apparently, corn is acarbon-based fuel just like petroleum. For more information, type into Google corn grain stove.
5It is well-known that the fundamental characteristic of an automotive fuel governing the distance driven is thefuel’s heating value (Brinkman et al., 1975; Berger, 1984), provided that the stoichiometric air/fuel ratio is used.Ethanol molecule has 16/46 = 0.35 of oxygen, which does not contribute to its heating value. Therefore, its heatingvalue (low or high, see Table 5 below) is about 65% of the heating value of gasoline, and ethanol should be classifiedas oxygenate.
U.C. Berkeley T. W. PATZEK 3
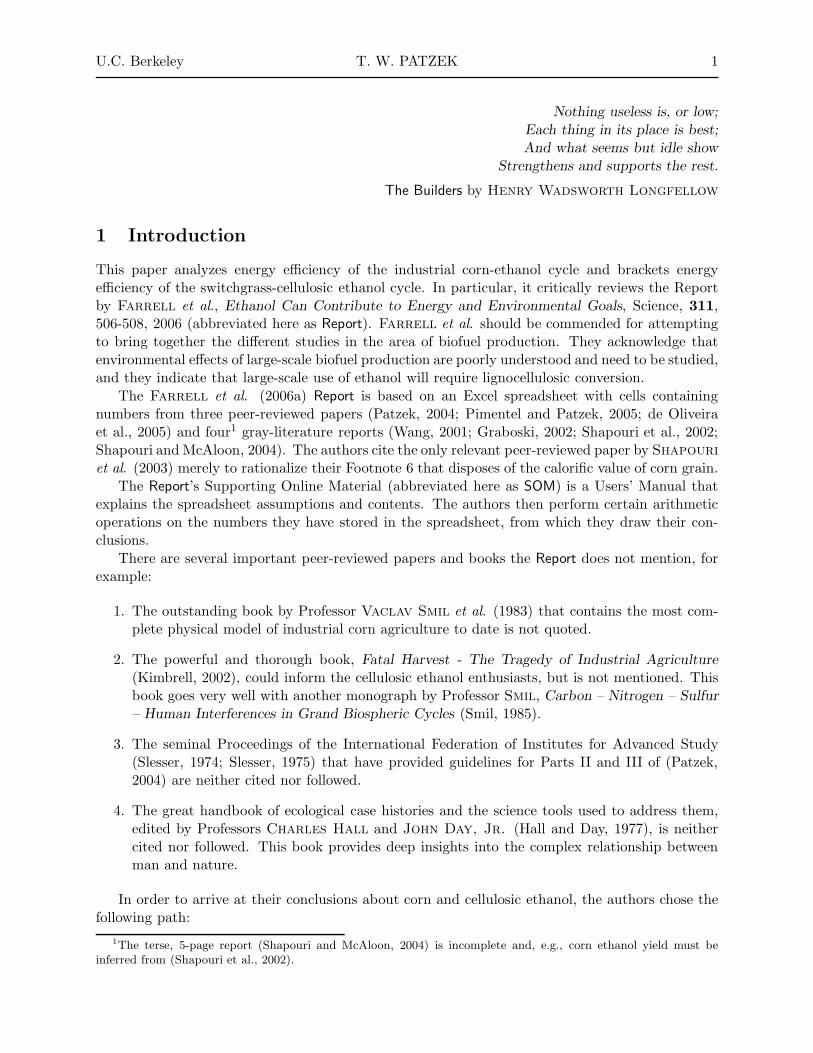
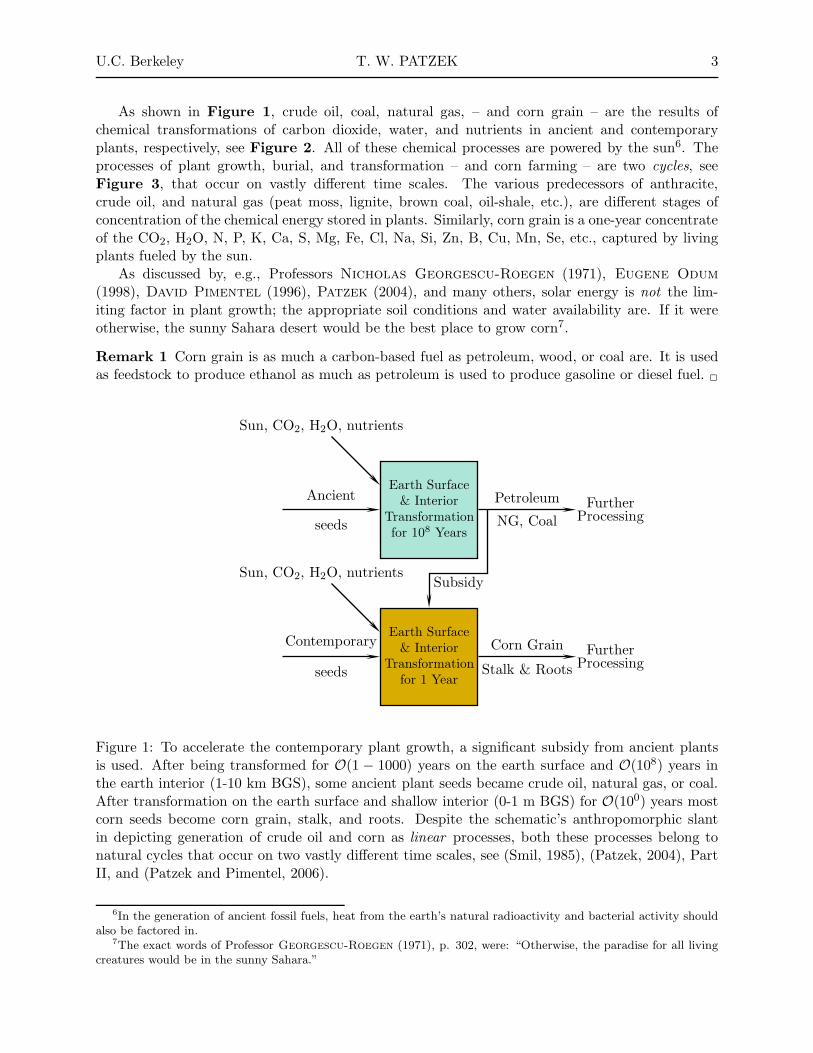
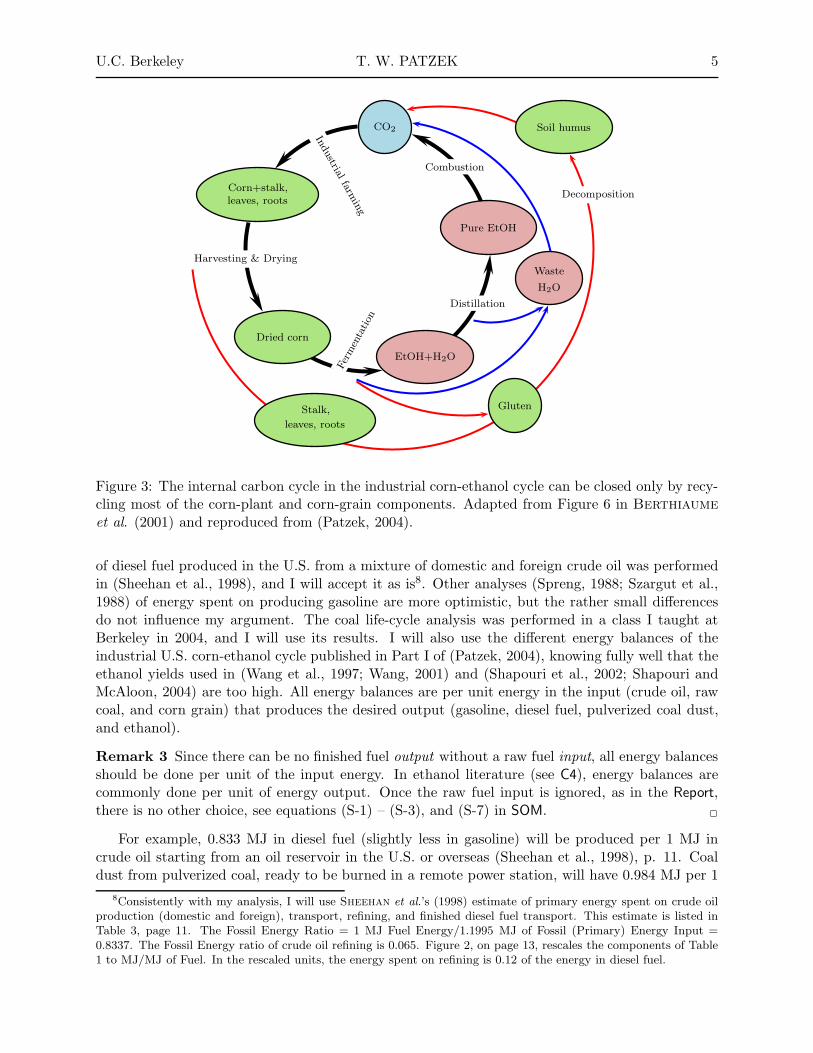
As shown in Figure 1, crude oil, coal, natural gas, – and corn grain – are the results ofchemical transformations of carbon dioxide, water, and nutrients in ancient and contemporaryplants, respectively, see Figure 2. All of these chemical processes are powered by the sun6. Theprocesses of plant growth, burial, and transformation – and corn farming – are two cycles, seeFigure 3, that occur on vastly different time scales. The various predecessors of anthracite,crude oil, and natural gas (peat moss, lignite, brown coal, oil-shale, etc.), are different stages ofconcentration of the chemical energy stored in plants. Similarly, corn grain is a one-year concentrateof the CO2, H2O, N, P, K, Ca, S, Mg, Fe, Cl, Na, Si, Zn, B, Cu, Mn, Se, etc., captured by livingplants fueled by the sun.
As discussed by, e.g., Professors Nicholas Georgescu-Roegen (1971), Eugene Odum
(1998), David Pimentel (1996), Patzek (2004), and many others, solar energy is not the lim-iting factor in plant growth; the appropriate soil conditions and water availability are. If it wereotherwise, the sunny Sahara desert would be the best place to grow corn7.
Remark 1 Corn grain is as much a carbon-based fuel as petroleum, wood, or coal are. It is usedas feedstock to produce ethanol as much as petroleum is used to produce gasoline or diesel fuel. 2
Earth Surface& Interior
Transformationfor 108 Years
Ancient
seeds
Earth Surface& Interior
Transformationfor 1 Year
Contemporary
seeds
Sun, CO2, H2O, nutrients
Sun, CO2, H2O, nutrientsSubsidy
Petroleum
NG, Coal
FurtherProcessing
Corn Grain
Stalk & Roots
FurtherProcessing
Figure 1: To accelerate the contemporary plant growth, a significant subsidy from ancient plantsis used. After being transformed for O(1 − 1000) years on the earth surface and O(108) years inthe earth interior (1-10 km BGS), some ancient plant seeds became crude oil, natural gas, or coal.After transformation on the earth surface and shallow interior (0-1 m BGS) for O(100) years mostcorn seeds become corn grain, stalk, and roots. Despite the schematic’s anthropomorphic slantin depicting generation of crude oil and corn as linear processes, both these processes belong tonatural cycles that occur on two vastly different time scales, see (Smil, 1985), (Patzek, 2004), PartII, and (Patzek and Pimentel, 2006).
6In the generation of ancient fossil fuels, heat from the earth’s natural radioactivity and bacterial activity shouldalso be factored in.
7The exact words of Professor Georgescu-Roegen (1971), p. 302, were: “Otherwise, the paradise for all livingcreatures would be in the sunny Sahara.”
4 The Real Biofuel Cycles
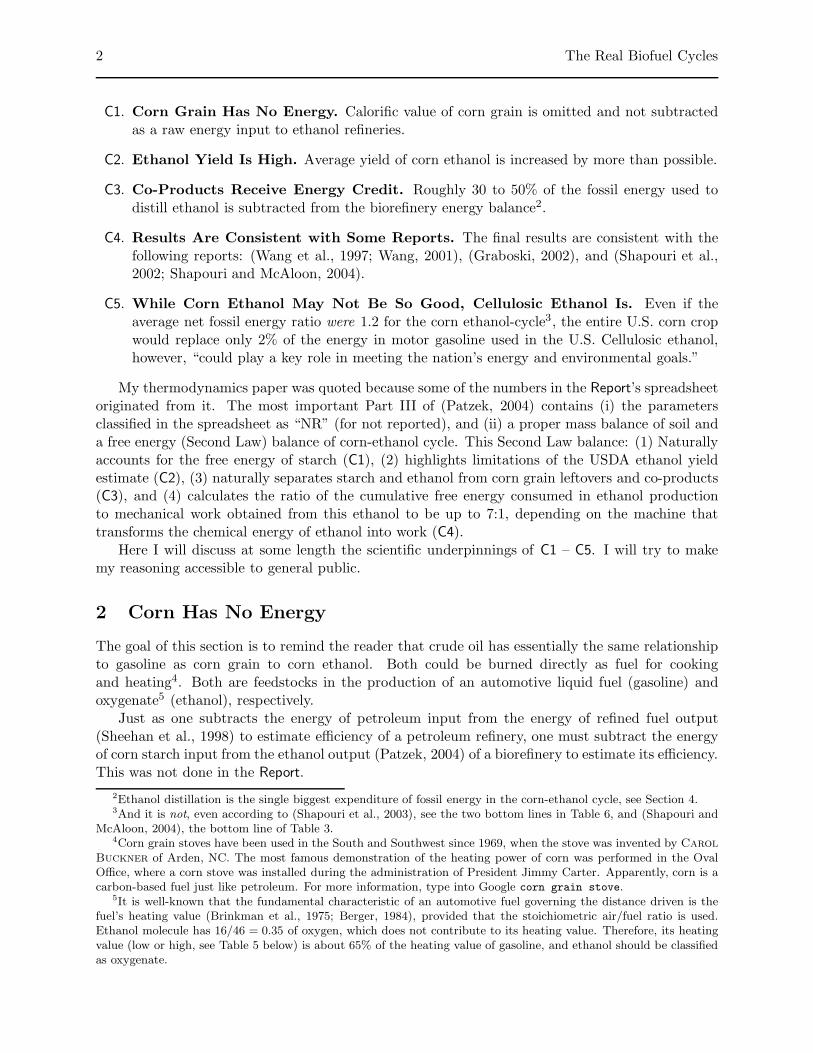
Figure 2: Left: Exceedingly few, see (Patzek & Pimentel, 2006), ancient plants, like this fossilizedWoodwardia virginica foliage, ever become coal, crude oil, or natural gas. Right: Many corn seedsbecome plants. Image sources: www.botany.org/PlantImages/ (left), W. Suszynski (right).
If one observes that the corn → ethanol process is a cycle, as shown in Figures 3 and 4, andone performs a proper (free) energy balance of that cycle, it becomes immediately obvious (Patzek,2004) that
1. The starch energy is a part of energy accounting, and
2. The non-starch part of corn grain (future dry distiller’s grain and solubles (DDGS) or similar)is not a part of the glucose-beer distillation process.
Sometimes, the corn-ethanol cycle is imagined as the flow of only fossil energy into corn fieldsand corn ethanol. This view is inaccurate. Without good soil and a plethora of nutrients in thesoil’s water and organic matter, fossil fuels can do nothing. Imagine plowing and pouring fertilizersonto sterile desert sand, planting seeds, and waiting for the sun to do its share free of charge (Patzeket al., 2005).
By focusing only on fossil energy, the incomplete net-energy balances of corn-ethanol cyclelead to erroneous conclusions and should be discarded. A complete First Law energy balance isformulated instead in Section 5 to fully describe the corn-ethanol cycle.
Remark 2 Demonstrating incompleteness of the First Law energy balances of corn-ethanol cycle,and proposing a more complete Second Law free energy balance was the essence of my thermody-namics paper, see Parts II – IV in (Patzek, 2004). The authors’ Excel spreadsheet impugns (Patzek,2004) for not reporting most primary energy inputs and Biological Oxygen Demand (BOD) cleanupcosts in a biorefinery. These inputs were defined and used in Part III of (Patzek, 2004) in a proper,Second Law energy balance of the corn-ethanol cycle. 2
2.1 Net energies of various fuels
Only to illustrate how the First Law energy balances might be used, I will now consistently rankproduction of motor gasoline (or diesel fuel), coal, and corn ethanol. A detailed life-cycle analysis
U.C. Berkeley T. W. PATZEK 5
Pure EtOH
CO2
Corn+stalk,leaves, roots
Dried corn
EtOH+H2O
Combustion
Distillation
Fer
men
tation
Harvesting & Drying
Industrial
farmin
g
Stalk,
leaves, roots
Gluten
Waste
H2O
Soil humus
Decomposition
Figure 3: The internal carbon cycle in the industrial corn-ethanol cycle can be closed only by recy-cling most of the corn-plant and corn-grain components. Adapted from Figure 6 in Berthiaume
et al. (2001) and reproduced from (Patzek, 2004).
of diesel fuel produced in the U.S. from a mixture of domestic and foreign crude oil was performedin (Sheehan et al., 1998), and I will accept it as is8. Other analyses (Spreng, 1988; Szargut et al.,1988) of energy spent on producing gasoline are more optimistic, but the rather small differencesdo not influence my argument. The coal life-cycle analysis was performed in a class I taught atBerkeley in 2004, and I will use its results. I will also use the different energy balances of theindustrial U.S. corn-ethanol cycle published in Part I of (Patzek, 2004), knowing fully well that theethanol yields used in (Wang et al., 1997; Wang, 2001) and (Shapouri et al., 2002; Shapouri andMcAloon, 2004) are too high. All energy balances are per unit energy in the input (crude oil, rawcoal, and corn grain) that produces the desired output (gasoline, diesel fuel, pulverized coal dust,and ethanol).
Remark 3 Since there can be no finished fuel output without a raw fuel input, all energy balancesshould be done per unit of the input energy. In ethanol literature (see C4), energy balances arecommonly done per unit of energy output. Once the raw fuel input is ignored, as in the Report,there is no other choice, see equations (S-1) – (S-3), and (S-7) in SOM. 2
For example, 0.833 MJ in diesel fuel (slightly less in gasoline) will be produced per 1 MJ incrude oil starting from an oil reservoir in the U.S. or overseas (Sheehan et al., 1998), p. 11. Coaldust from pulverized coal, ready to be burned in a remote power station, will have 0.984 MJ per 1
8Consistently with my analysis, I will use Sheehan et al.’s (1998) estimate of primary energy spent on crude oilproduction (domestic and foreign), transport, refining, and finished diesel fuel transport. This estimate is listed inTable 3, page 11. The Fossil Energy Ratio = 1 MJ Fuel Energy/1.1995 MJ of Fossil (Primary) Energy Input =0.8337. The Fossil Energy ratio of crude oil refining is 0.065. Figure 2, on page 13, rescales the components of Table1 to MJ/MJ of Fuel. In the rescaled units, the energy spent on refining is 0.12 of the energy in diesel fuel.

6 The Real Biofuel Cycles
Sola
rhν,∆
b0 ch
=+
2833
Soil
nutr
ients
C6H12O6+6O2
6CO2
∆b0
ch = +119
∆b0
ch = −1612CO2+2C2H5OH+6O2
6CO2 C2H
5O
HC
om
bust
ion
∆b0 c
h=
−2672
6H2O6H2O
Figure 4: Flow of photosynthetic and chemical free energy (exergy b) in the ideal, fossil-fuel-free,CO2-Glucose-EtOH cycle. The units are MJ/kmol. Please remember that the water-dissolvednutrients in good soil control plant growth and solar energy sequestration as biomass. Only some0.3% of the vast solar energy input is used annually to produce an excellent corn crop, see, e.g.,(Good and Bell, 1980; Lemon, 1960; Musgrave and Moss, 1961; Patzek, 2004). Adapted from(Patzek, 2004).
MJ in coal from a near-surface deposit in Western United States, and 0.970 MJ per 1 MJ in coalfrom a coal seam in Eastern United States. The output/input energy ratio (energy efficiency) canbe defined as
ηfuel =Fuel Output/Unit Feedstock Energy
1 +∑
Process Energies/Unit Feedstock Energy(1)
The calculations based on the data in (Patzek, 2004), Part I, are listed in Table 1 and the conclusionis immediate9.
Remark 4 An industrial corn field is a contemporary carbon fuel reservoir that is filled withbiomass in real time by the joint action of water, soil nutrients, fossil energy subsidies, and photo-synthetic energy. The calculations of the process energy spent to produce a fuel (diesel, gasoline, orcoal) or an oxygenate (ethanol) show that production of corn-ethanol is ∼3 – 4 times less efficientrelative to gasoline or pulverized coal. The primary sources of the process energy are the mainfeedstocks in their original states (crude oil in a reservoir, coal in a deposit, and corn seeds). 2
This 3- or 4-fold difference in the energy transfer efficiency is caused by the rate of the transfer,and the lack of concentration and transformation of chemical energy in biomass. In other words,given 108 years, crude oil or coal became almost pure automotive or power station fuels, while corngrain created in 100 days is far from being pure ethanol.
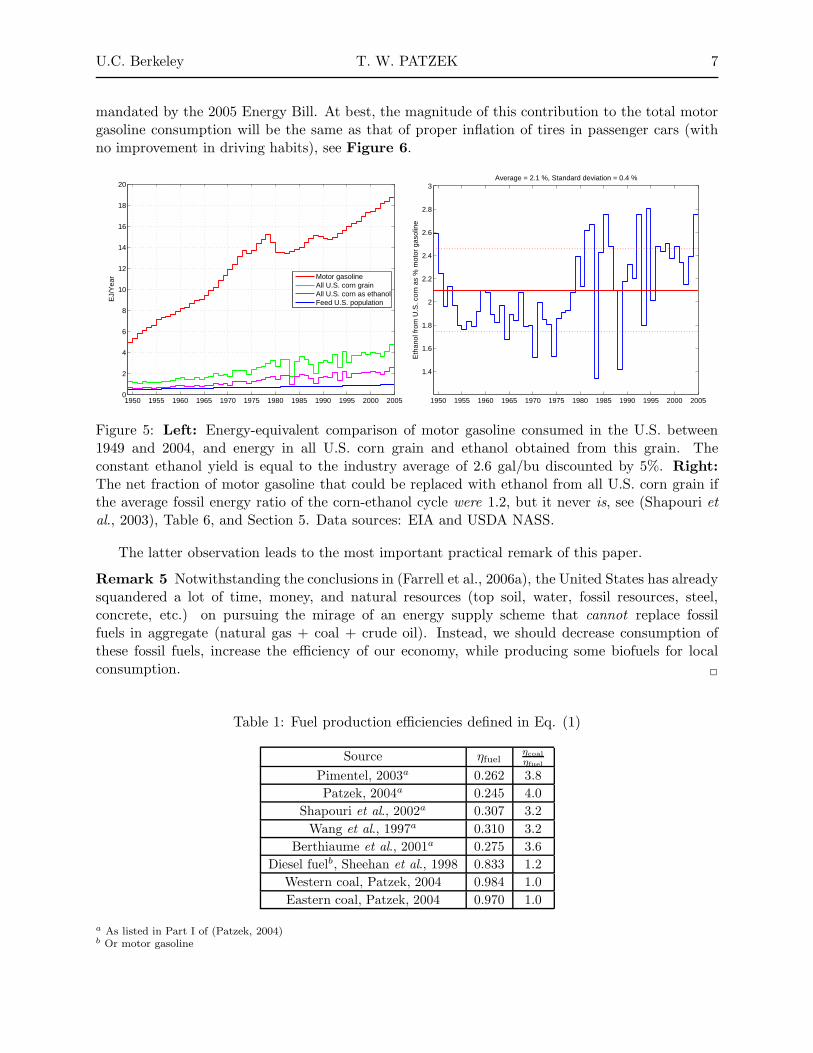
In addition to the low energy efficiency, ethanol from corn delivers only ∼0.2 W/m2 of thefield (Patzek and Pimentel, 2006). Therefore, the quantity of ethanol produced by converting evenall corn in the U.S. will be minuscule relative to the current consumption of motor gasoline ordiesel fuel, see Figure 5. In 2012, 7.5 billion gallons of ethanol will be produced in the U.S., as
9First Law energy calculations in Part I of (Patzek, 2004) did not account for photosynthetic energy and forthe environment restoration work; both were included in Part III of (Patzek, 2004) in the subsequent Second Lawanalysis, and will be included here in Section 5 in First Law calculations. As it turns out, the energy efficienciescalculated in Table 1 will not change much.
U.C. Berkeley T. W. PATZEK 7
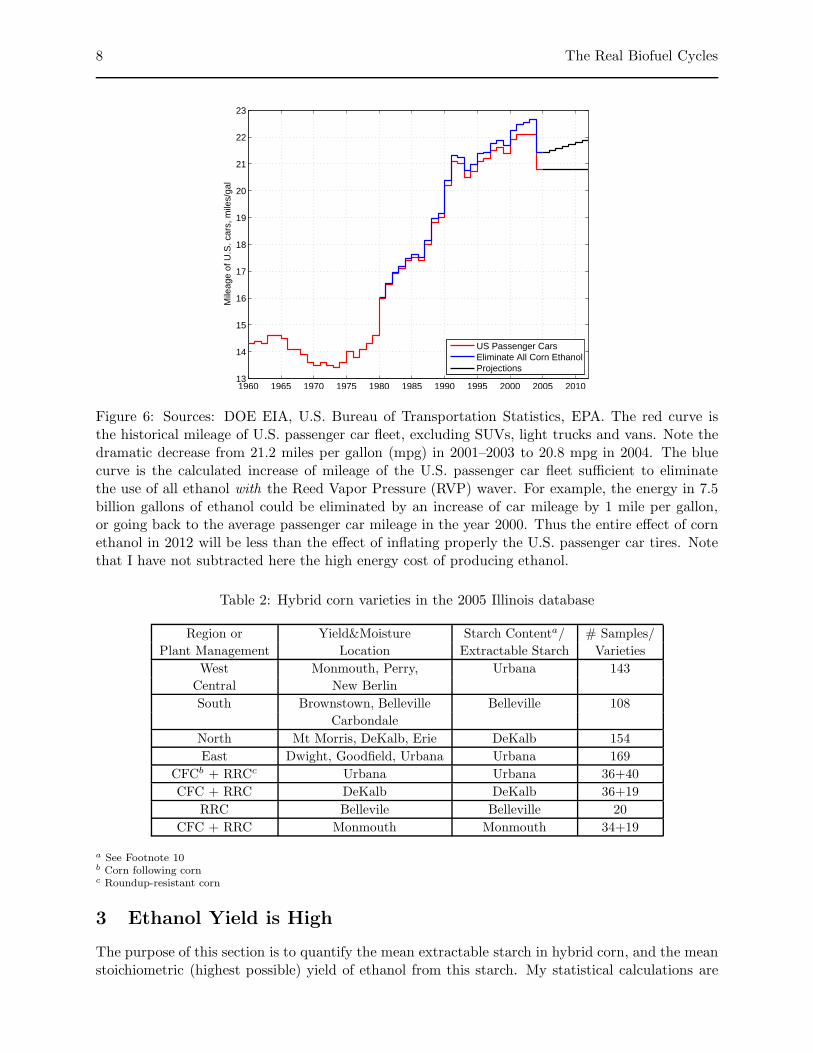
mandated by the 2005 Energy Bill. At best, the magnitude of this contribution to the total motorgasoline consumption will be the same as that of proper inflation of tires in passenger cars (withno improvement in driving habits), see Figure 6.
1950 1955 1960 1965 1970 1975 1980 1985 1990 1995 2000 20050
2
4
6
8
10
12
14
16
18
20
EJ/
Yea
r
Motor gasolineAll U.S. corn grainAll U.S. corn as ethanolFeed U.S. population
1950 1955 1960 1965 1970 1975 1980 1985 1990 1995 2000 2005
1.4
1.6
1.8
2
2.2
2.4
2.6
2.8
3
Eth
anol
from
U.S
. cor
n as
% m
otor
gas
olin
e
Average = 2.1 %, Standard deviation = 0.4 %
Figure 5: Left: Energy-equivalent comparison of motor gasoline consumed in the U.S. between1949 and 2004, and energy in all U.S. corn grain and ethanol obtained from this grain. Theconstant ethanol yield is equal to the industry average of 2.6 gal/bu discounted by 5%. Right:The net fraction of motor gasoline that could be replaced with ethanol from all U.S. corn grain ifthe average fossil energy ratio of the corn-ethanol cycle were 1.2, but it never is, see (Shapouri etal., 2003), Table 6, and Section 5. Data sources: EIA and USDA NASS.
The latter observation leads to the most important practical remark of this paper.
Remark 5 Notwithstanding the conclusions in (Farrell et al., 2006a), the United States has alreadysquandered a lot of time, money, and natural resources (top soil, water, fossil resources, steel,concrete, etc.) on pursuing the mirage of an energy supply scheme that cannot replace fossilfuels in aggregate (natural gas + coal + crude oil). Instead, we should decrease consumption ofthese fossil fuels, increase the efficiency of our economy, while producing some biofuels for localconsumption. 2
Table 1: Fuel production efficiencies defined in Eq. (1)
Source ηfuelηcoal
ηfuel
Pimentel, 2003a 0.262 3.8
Patzek, 2004a 0.245 4.0
Shapouri et al., 2002a 0.307 3.2
Wang et al., 1997a 0.310 3.2
Berthiaume et al., 2001a 0.275 3.6
Diesel fuelb, Sheehan et al., 1998 0.833 1.2
Western coal, Patzek, 2004 0.984 1.0
Eastern coal, Patzek, 2004 0.970 1.0
a As listed in Part I of (Patzek, 2004)b Or motor gasoline
8 The Real Biofuel Cycles
1960 1965 1970 1975 1980 1985 1990 1995 2000 2005 201013
14
15
16
17
18
19
20
21
22
23
Mile
age
of U
.S. c
ars,
mile
s/ga
l
US Passenger CarsEliminate All Corn EthanolProjections
Figure 6: Sources: DOE EIA, U.S. Bureau of Transportation Statistics, EPA. The red curve isthe historical mileage of U.S. passenger car fleet, excluding SUVs, light trucks and vans. Note thedramatic decrease from 21.2 miles per gallon (mpg) in 2001–2003 to 20.8 mpg in 2004. The bluecurve is the calculated increase of mileage of the U.S. passenger car fleet sufficient to eliminatethe use of all ethanol with the Reed Vapor Pressure (RVP) waver. For example, the energy in 7.5billion gallons of ethanol could be eliminated by an increase of car mileage by 1 mile per gallon,or going back to the average passenger car mileage in the year 2000. Thus the entire effect of cornethanol in 2012 will be less than the effect of inflating properly the U.S. passenger car tires. Notethat I have not subtracted here the high energy cost of producing ethanol.
Table 2: Hybrid corn varieties in the 2005 Illinois database
Region or Yield&Moisture Starch Contenta/ # Samples/
Plant Management Location Extractable Starch Varieties
West Monmouth, Perry, Urbana 143
Central New Berlin
South Brownstown, Belleville Belleville 108
Carbondale
North Mt Morris, DeKalb, Erie DeKalb 154
East Dwight, Goodfield, Urbana Urbana 169
CFCb + RRCc Urbana Urbana 36+40
CFC + RRC DeKalb DeKalb 36+19
RRC Bellevile Belleville 20
CFC + RRC Monmouth Monmouth 34+19
a See Footnote 10b Corn following cornc Roundup-resistant corn
3 Ethanol Yield is High
The purpose of this section is to quantify the mean extractable starch in hybrid corn, and the meanstoichiometric (highest possible) yield of ethanol from this starch. My statistical calculations are

U.C. Berkeley T. W. PATZEK 9
based on the extensive database published annually for hybrid corn varieties in Illinois (Joos, 2005).I then compare my results with the ethanol industry’s data and the USDA estimate of 2.682 galEtOH/wet bushel (Shapouri et al., 2002).
3.1 Corn Characterization and Starch Content
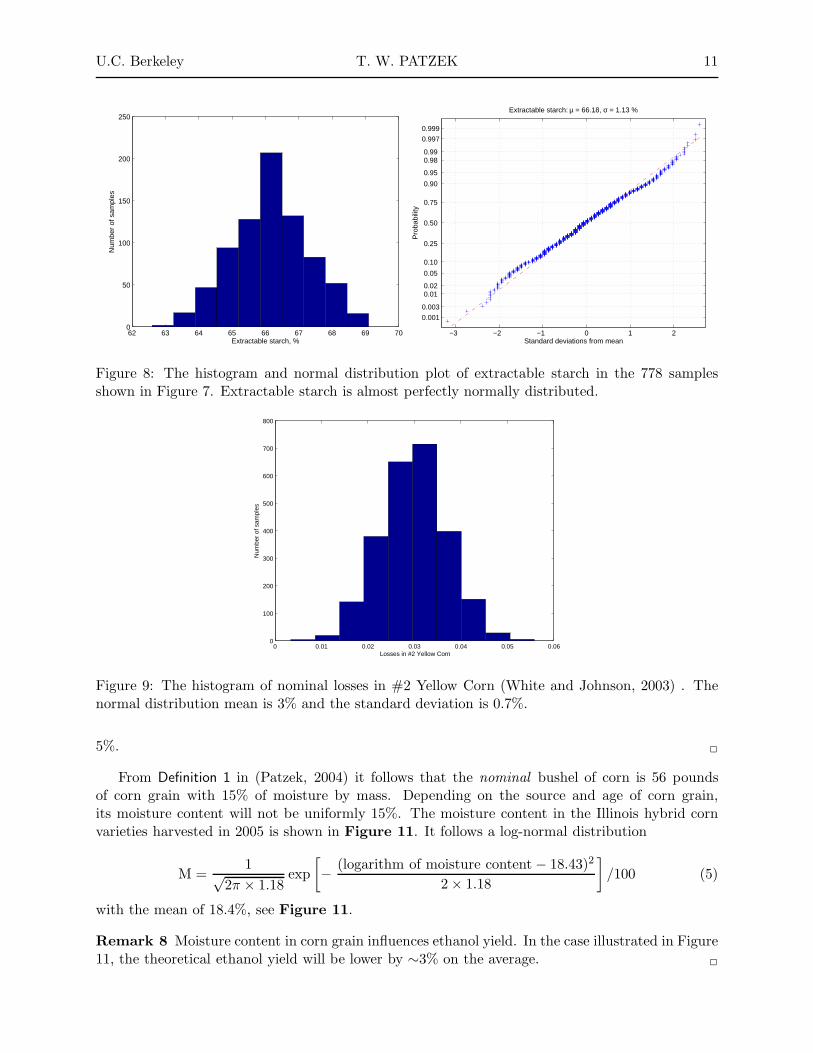
Based on the results of the Illinois State Variety Test in 2005 (Joos, 2005), the mean starch contentof 778 samples of 401 commercial varieties of hybrid corn, see Table 2, was 71%, and the meanextractable starch10 was 66%, the same as in (White and Johnson, 2003) and (Patzek, 2004), seealso Figure 7. As shown is Figure 8, extractable starch in Illinois follows almost perfectly thefollowing normal distribution:
ES =1√
2π × 1.13exp
[
− (extractable starch − 66.18)2
2 × 1.13
]
/100 (2)
A measure of most interest to me is fermentable starch. Extractable starch measures what isavailable from a wet milling process. However, almost all new ethanol is produced in a dry grindprocess and more than extractable starch could be fermentable.
Remark 6 One could argue11 that the total, not extractable, starch should be used to estimatethe ultimate yield of corn ethanol in dry grind plants12. Also, the difference between the two starchcontents may depend on the measurement method. I will try to investigate this complex issuelater13. 2
3.2 Starch Yield and Theoretical Ethanol Yield
Now we are ready to obtain estimates of ethanol yield from the hybrid corn varieties tested inIllinois. To do so, Monte Carlo simulations have been run using the normal distribution in Eq.(2). To obtain the net starch yield, the nominal grain losses (White and Johnson, 2003) caused bycrushed grain, dirt, pebbles, etc., have been estimated as
Loss =1√
2π × 0.7exp
[
− (Percent loss − 3)2
2 × 0.7
]
/100 (3)
A single realization of the normal distribution (3) is shown in Figure 9.
10Measuring extractable starch is a tricky problem (Eckhoff et al., 1996; Paulsen et al., 2003). Corn starchmeasurements in the Illinois data set are performed using the Corn Refiners Association (CRA) method. Theextractable starch is from a 100-g test by Dr. Eckhoff (Eckhoff et al., 1996). Dr. Paulsen (Paulsen et al., 2003)uses the 100-g extractable starch test as a reference method for the NIR prediction of extractable starch. Sources:Drs. Darin Joos and Marvin Paulsen, 360-B Ag Engr. Sciences Bldg, 1304 W. Pennsylvania Ave, Urbana, IL61801, 217-333-7926. Private communication, Feb. 8, 2006.
11Apparently, Farrell et al. did not read this remark when they formulated their Response in Science (2006b):“. . . Nonetheless, much of his analysis (i.e., this paper, TWP) appears to be rigorous in detail but erroneous overall.For instance, extractable starch only applies to wet milling, which presently produces approximately 30% of U.S.ethanol. Almost all new ethanol plants are dry mills, for which total fermentable starch is a better measure ofethanol yield, and that yield at least 5% more ethanol per unit mass of corn than wet milling.”
12Dr. Marvin Paul Scott, USDA-ARS , Private communication, Feb. 1, 2006.13Dr. David Andress of EIA has observed that the corn starch analysis in this paper considers all corn samples, but
ethanol plant operators attempt to purchase high extractable starch corn. This can be accomplished by segregationor the use of inexpensive testing procedures. The difference in extractable starch is on the order of several percent.I will investigate his observation if I pursue this subject further. Source: Private communication, Feb. 22, 2006.

10 The Real Biofuel Cycles
69 70 71 72 73 7462
63
64
65
66
67
68
69
70
Starch content, %DB
Ext
ract
able
sta
rch,
%D
B
West Central Region, 29000ppaUrbana RRC, 29000ppaUrbana CFC, 29000ppaSouth Region, 26000ppaNorth Region, 29000ppaMonmouth CFC, 29000ppaMonmouth RRC, 29000ppaEast Central Region, 29000ppaDeKalb RRC, 29000ppaDeKalb CFC, 29000ppaBelleville RRC, 26000ppa
Figure 7: Source: The 2005 Illinois State Variety Test (http://vt.cropsci.uiuc.edu/corn.html), ac-cessed 12/01/05. Some 401 commercial hybrids were grown in four regions of Illinois (not all hybridswere grown in all regions). The starch content was predicted by NIR. The number of samples from12 locations is 778. The mean starch content is 71.46 ± 0.92%. The mean extractable starch is66.18 ± 1.13%. The acronyms are ppa = plants per acre, CFC = corn following corn, RRC =Roundup-resistant corn.
To obtain a distribution of the net yield of extractable starch, the individual random variables(2) and (3) were treated as statistically independent and 2500 realizations were used.
Given the random extractable starch (ES) in Eq. (2) and the corn losses in Eq. (3), the maximumtheoretical ethanol yield can be calculated as
Theoretical EtOH Yield = (1 − Loss) × ES × 180
162× 0.51
kg EtOH
kg dry corn(4)
The Monte Carlo simulation results are shown in Figure 10. The mean stoichiometric ethanol yieldis 0.364 kg EtOH/kg dry corn, and the standard deviation is 0.007. Note that the current statisticalestimate of the theoretical yield of ethanol from absolutely dry corn grain is somewhat lower thanthe 0.374 kg EtOH/kg dry corn in (Patzek, 2004). According to Remark 6, the theoretical ethanolyield in dry grind plants may be higher.
The U.S. ethanol industry uses a confusing and imprecise system of units and it customarilyexaggerates ethanol yields. For example, ethanol is measured by volume of unknown compositionand corn grain is measured in bushels with unknown moisture content.
Remark 7 One gallon of ethanol reported by the industry contains 5% by volume of #14 gasolinedenaturant, which is not ethanol, and, therefore, all ethanol yields are overestimated by at least
U.C. Berkeley T. W. PATZEK 11
62 63 64 65 66 67 68 69 700
50
100
150
200
250
Extractable starch, %
Num
ber
of s
ampl
es
−3 −2 −1 0 1 2
0.001
0.003
0.01 0.02
0.05
0.10
0.25
0.50
0.75
0.90
0.95
0.98 0.99
0.997
0.999
Standard deviations from mean
Pro
babi
lity
Extractable starch: µ = 66.18, σ = 1.13 %
Figure 8: The histogram and normal distribution plot of extractable starch in the 778 samplesshown in Figure 7. Extractable starch is almost perfectly normally distributed.
0 0.01 0.02 0.03 0.04 0.05 0.060
100
200
300
400
500
600
700
800
Losses in #2 Yellow Corn
Num
ber
of s
ampl
es
Figure 9: The histogram of nominal losses in #2 Yellow Corn (White and Johnson, 2003) . Thenormal distribution mean is 3% and the standard deviation is 0.7%.
5%. 2
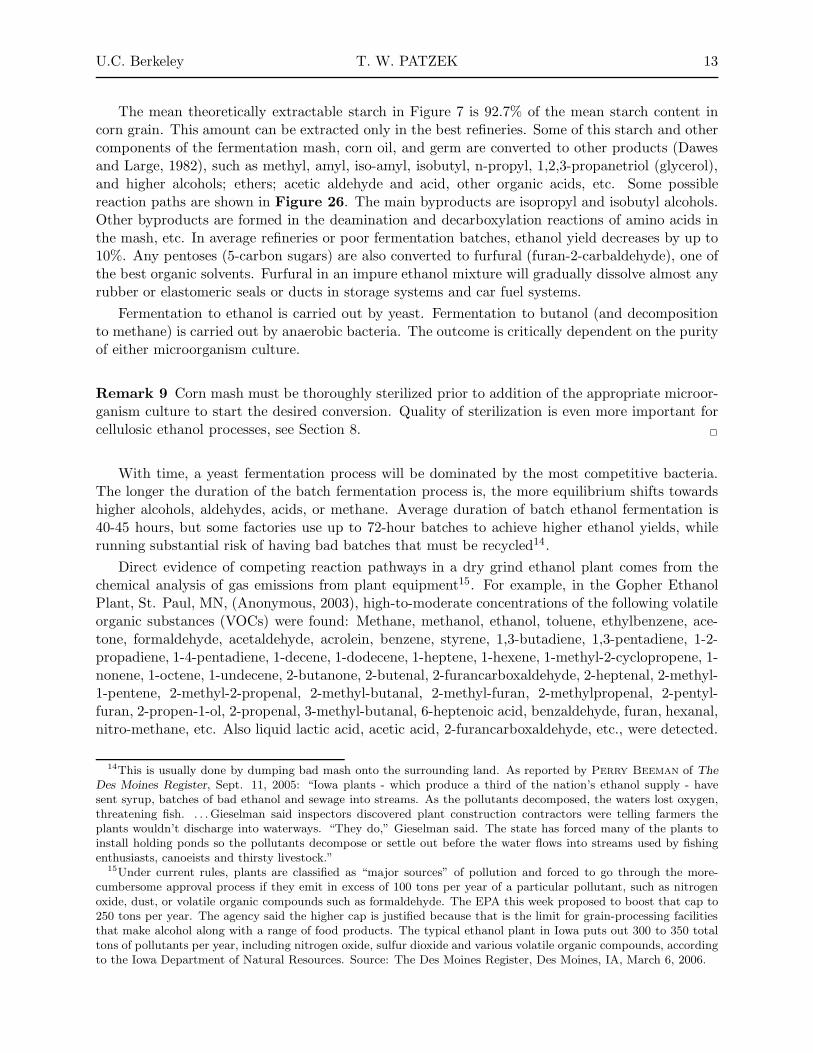
From Definition 1 in (Patzek, 2004) it follows that the nominal bushel of corn is 56 poundsof corn grain with 15% of moisture by mass. Depending on the source and age of corn grain,its moisture content will not be uniformly 15%. The moisture content in the Illinois hybrid cornvarieties harvested in 2005 is shown in Figure 11. It follows a log-normal distribution
M =1√
2π × 1.18exp
[
− (logarithm of moisture content − 18.43)2
2 × 1.18
]
/100 (5)
with the mean of 18.4%, see Figure 11.
Remark 8 Moisture content in corn grain influences ethanol yield. In the case illustrated in Figure11, the theoretical ethanol yield will be lower by ∼3% on the average. 2
12 The Real Biofuel Cycles
0.34 0.345 0.35 0.355 0.36 0.365 0.37 0.375 0.38 0.385 0.390
100
200
300
400
500
600
700
Theoretical Specific Yield, kg EtOH/kg dry corn
Num
ber
of s
ampl
es
EtOH Yield: µ = 0.364, σ = 0.007 kg/kg
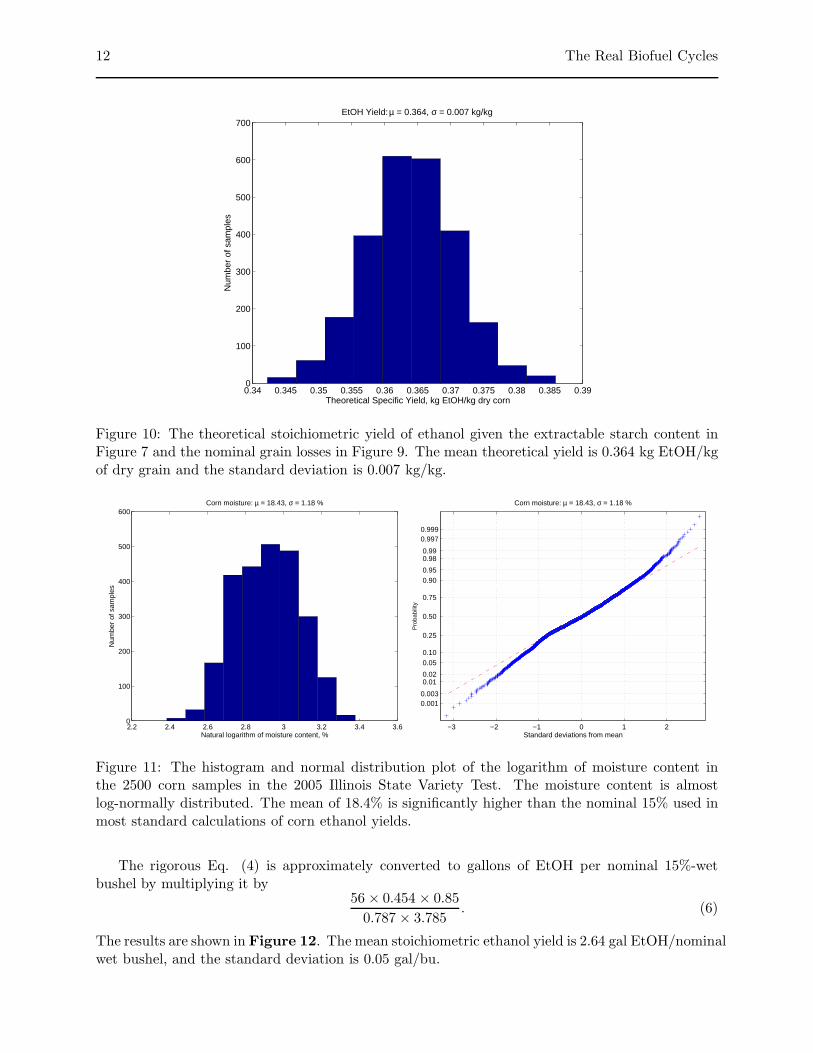
Figure 10: The theoretical stoichiometric yield of ethanol given the extractable starch content inFigure 7 and the nominal grain losses in Figure 9. The mean theoretical yield is 0.364 kg EtOH/kgof dry grain and the standard deviation is 0.007 kg/kg.
2.2 2.4 2.6 2.8 3 3.2 3.4 3.60
100
200
300
400
500
600Corn moisture: µ = 18.43, σ = 1.18 %
Natural logarithm of moisture content, %
Num
ber
of s
ampl
es
−3 −2 −1 0 1 2
0.0010.003
0.01 0.02
0.05 0.10
0.25
0.50
0.75
0.90 0.95
0.98 0.99
0.9970.999
Standard deviations from mean
Pro
babi
lity
Corn moisture: µ = 18.43, σ = 1.18 %
Figure 11: The histogram and normal distribution plot of the logarithm of moisture content inthe 2500 corn samples in the 2005 Illinois State Variety Test. The moisture content is almostlog-normally distributed. The mean of 18.4% is significantly higher than the nominal 15% used inmost standard calculations of corn ethanol yields.
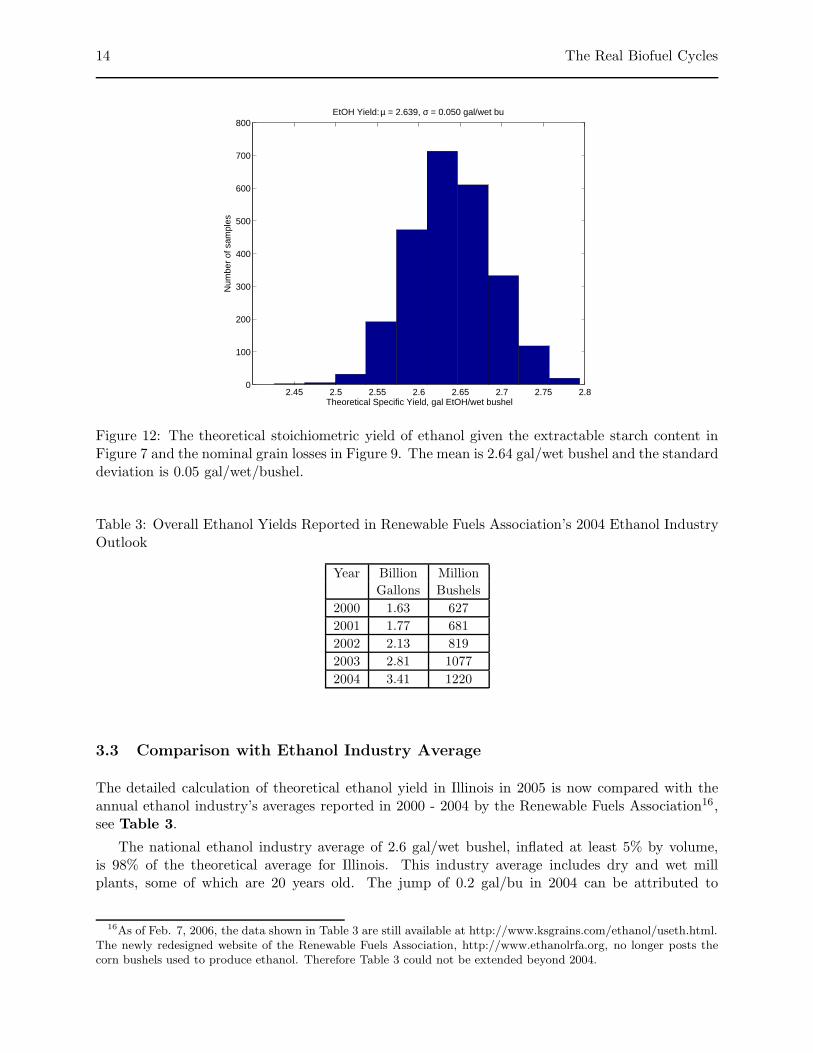
The rigorous Eq. (4) is approximately converted to gallons of EtOH per nominal 15%-wetbushel by multiplying it by
56 × 0.454 × 0.85
0.787 × 3.785. (6)
The results are shown in Figure 12. The mean stoichiometric ethanol yield is 2.64 gal EtOH/nominalwet bushel, and the standard deviation is 0.05 gal/bu.
U.C. Berkeley T. W. PATZEK 13
The mean theoretically extractable starch in Figure 7 is 92.7% of the mean starch content incorn grain. This amount can be extracted only in the best refineries. Some of this starch and othercomponents of the fermentation mash, corn oil, and germ are converted to other products (Dawesand Large, 1982), such as methyl, amyl, iso-amyl, isobutyl, n-propyl, 1,2,3-propanetriol (glycerol),and higher alcohols; ethers; acetic aldehyde and acid, other organic acids, etc. Some possiblereaction paths are shown in Figure 26. The main byproducts are isopropyl and isobutyl alcohols.Other byproducts are formed in the deamination and decarboxylation reactions of amino acids inthe mash, etc. In average refineries or poor fermentation batches, ethanol yield decreases by up to10%. Any pentoses (5-carbon sugars) are also converted to furfural (furan-2-carbaldehyde), one ofthe best organic solvents. Furfural in an impure ethanol mixture will gradually dissolve almost anyrubber or elastomeric seals or ducts in storage systems and car fuel systems.
Fermentation to ethanol is carried out by yeast. Fermentation to butanol (and decompositionto methane) is carried out by anaerobic bacteria. The outcome is critically dependent on the purityof either microorganism culture.
Remark 9 Corn mash must be thoroughly sterilized prior to addition of the appropriate microor-ganism culture to start the desired conversion. Quality of sterilization is even more important forcellulosic ethanol processes, see Section 8. 2
With time, a yeast fermentation process will be dominated by the most competitive bacteria.The longer the duration of the batch fermentation process is, the more equilibrium shifts towardshigher alcohols, aldehydes, acids, or methane. Average duration of batch ethanol fermentation is40-45 hours, but some factories use up to 72-hour batches to achieve higher ethanol yields, whilerunning substantial risk of having bad batches that must be recycled14.
Direct evidence of competing reaction pathways in a dry grind ethanol plant comes from thechemical analysis of gas emissions from plant equipment15. For example, in the Gopher EthanolPlant, St. Paul, MN, (Anonymous, 2003), high-to-moderate concentrations of the following volatileorganic substances (VOCs) were found: Methane, methanol, ethanol, toluene, ethylbenzene, ace-tone, formaldehyde, acetaldehyde, acrolein, benzene, styrene, 1,3-butadiene, 1,3-pentadiene, 1-2-propadiene, 1-4-pentadiene, 1-decene, 1-dodecene, 1-heptene, 1-hexene, 1-methyl-2-cyclopropene, 1-nonene, 1-octene, 1-undecene, 2-butanone, 2-butenal, 2-furancarboxaldehyde, 2-heptenal, 2-methyl-1-pentene, 2-methyl-2-propenal, 2-methyl-butanal, 2-methyl-furan, 2-methylpropenal, 2-pentyl-furan, 2-propen-1-ol, 2-propenal, 3-methyl-butanal, 6-heptenoic acid, benzaldehyde, furan, hexanal,nitro-methane, etc. Also liquid lactic acid, acetic acid, 2-furancarboxaldehyde, etc., were detected.
14This is usually done by dumping bad mash onto the surrounding land. As reported by Perry Beeman of The
Des Moines Register, Sept. 11, 2005: “Iowa plants - which produce a third of the nation’s ethanol supply - havesent syrup, batches of bad ethanol and sewage into streams. As the pollutants decomposed, the waters lost oxygen,threatening fish. . . . Gieselman said inspectors discovered plant construction contractors were telling farmers theplants wouldn’t discharge into waterways. “They do,” Gieselman said. The state has forced many of the plants toinstall holding ponds so the pollutants decompose or settle out before the water flows into streams used by fishingenthusiasts, canoeists and thirsty livestock.”
15Under current rules, plants are classified as “major sources” of pollution and forced to go through the more-cumbersome approval process if they emit in excess of 100 tons per year of a particular pollutant, such as nitrogenoxide, dust, or volatile organic compounds such as formaldehyde. The EPA this week proposed to boost that cap to250 tons per year. The agency said the higher cap is justified because that is the limit for grain-processing facilitiesthat make alcohol along with a range of food products. The typical ethanol plant in Iowa puts out 300 to 350 totaltons of pollutants per year, including nitrogen oxide, sulfur dioxide and various volatile organic compounds, accordingto the Iowa Department of Natural Resources. Source: The Des Moines Register, Des Moines, IA, March 6, 2006.
14 The Real Biofuel Cycles
2.45 2.5 2.55 2.6 2.65 2.7 2.75 2.80
100
200
300
400
500
600
700
800
Theoretical Specific Yield, gal EtOH/wet bushel
Num
ber
of s
ampl
es
EtOH Yield: µ = 2.639, σ = 0.050 gal/wet bu
Figure 12: The theoretical stoichiometric yield of ethanol given the extractable starch content inFigure 7 and the nominal grain losses in Figure 9. The mean is 2.64 gal/wet bushel and the standarddeviation is 0.05 gal/wet/bushel.
Table 3: Overall Ethanol Yields Reported in Renewable Fuels Association’s 2004 Ethanol IndustryOutlook
Year Billion Million
Gallons Bushels
2000 1.63 627
2001 1.77 681
2002 2.13 819
2003 2.81 1077
2004 3.41 1220
3.3 Comparison with Ethanol Industry Average
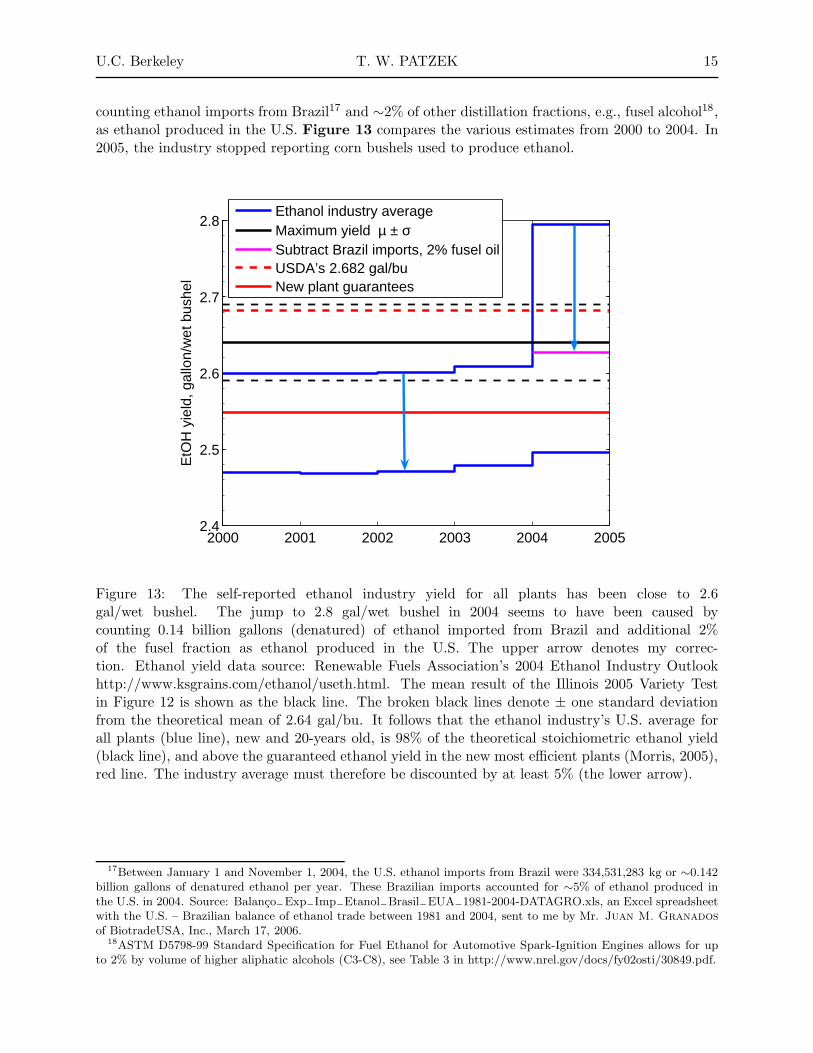
The detailed calculation of theoretical ethanol yield in Illinois in 2005 is now compared with theannual ethanol industry’s averages reported in 2000 - 2004 by the Renewable Fuels Association16,see Table 3.
The national ethanol industry average of 2.6 gal/wet bushel, inflated at least 5% by volume,is 98% of the theoretical average for Illinois. This industry average includes dry and wet millplants, some of which are 20 years old. The jump of 0.2 gal/bu in 2004 can be attributed to
16As of Feb. 7, 2006, the data shown in Table 3 are still available at http://www.ksgrains.com/ethanol/useth.html.The newly redesigned website of the Renewable Fuels Association, http://www.ethanolrfa.org, no longer posts thecorn bushels used to produce ethanol. Therefore Table 3 could not be extended beyond 2004.
U.C. Berkeley T. W. PATZEK 15
counting ethanol imports from Brazil17 and ∼2% of other distillation fractions, e.g., fusel alcohol18,as ethanol produced in the U.S. Figure 13 compares the various estimates from 2000 to 2004. In2005, the industry stopped reporting corn bushels used to produce ethanol.
2000 2001 2002 2003 2004 20052.4
2.5
2.6
2.7
2.8
EtO
H y
ield
, gal
lon/
wet
bus
hel
Ethanol industry averageMaximum yield µ ± σSubtract Brazil imports, 2% fusel oilUSDA’s 2.682 gal/buNew plant guarantees
Figure 13: The self-reported ethanol industry yield for all plants has been close to 2.6gal/wet bushel. The jump to 2.8 gal/wet bushel in 2004 seems to have been caused bycounting 0.14 billion gallons (denatured) of ethanol imported from Brazil and additional 2%of the fusel fraction as ethanol produced in the U.S. The upper arrow denotes my correc-tion. Ethanol yield data source: Renewable Fuels Association’s 2004 Ethanol Industry Outlookhttp://www.ksgrains.com/ethanol/useth.html. The mean result of the Illinois 2005 Variety Testin Figure 12 is shown as the black line. The broken black lines denote ± one standard deviationfrom the theoretical mean of 2.64 gal/bu. It follows that the ethanol industry’s U.S. average forall plants (blue line), new and 20-years old, is 98% of the theoretical stoichiometric ethanol yield(black line), and above the guaranteed ethanol yield in the new most efficient plants (Morris, 2005),red line. The industry average must therefore be discounted by at least 5% (the lower arrow).
17Between January 1 and November 1, 2004, the U.S. ethanol imports from Brazil were 334,531,283 kg or ∼0.142billion gallons of denatured ethanol per year. These Brazilian imports accounted for ∼5% of ethanol produced inthe U.S. in 2004. Source: Balanco
−Exp
−Imp
−Etanol
−Brasil
−EUA
−1981-2004-DATAGRO.xls, an Excel spreadsheet
with the U.S. – Brazilian balance of ethanol trade between 1981 and 2004, sent to me by Mr. Juan M. Granados
of BiotradeUSA, Inc., March 17, 2006.18ASTM D5798-99 Standard Specification for Fuel Ethanol for Automotive Spark-Ignition Engines allows for up
to 2% by volume of higher aliphatic alcohols (C3-C8), see Table 3 in http://www.nrel.gov/docs/fy02osti/30849.pdf.

16 The Real Biofuel Cycles
3.4 Summary of Ethanol Yield Conclusions
Some 778 corn starch measurements and 2500 corn grain samples from the 2005 Illinois Corn VarietyTest have been used to obtain the detailed statistical estimates of the mean extractable corn starch(66.19 ± 1.13%) and the mean theoretical ethanol yield (2.64 ± 0.05 gal EtOH/wet bushel). Theseresults demonstrate that the extractable starch content estimate of 66% used in (Patzek, 2004)is correct, see Table 4. The ethanol industry’s national average of 2.6 gal/wet bushel has beeninflated by counting 5 percent by volume of gasoline as ethanol. Consequently, this average istoo high, about 98% of the theoretical yield in Illinois, and it is above the more reasonable yieldguarantees of 2.55 gal EtOH/wet bushel (Morris, 2005) in the new efficient plants. If the nationalaverage is discounted 5% by removing the volume of gasoline counted as ethanol, it becomes 2.46gal/bushel, somewhat above my estimate of 2.30 gal/bushel in (Patzek, 2004), which also discountsheavy alcohols. After subtracting ethanol imports from Brazil, the average ethanol yield in 2004was discounted by another 2% to bring it below the mean theoretical yield calculated here.
Remark 10 The USDA estimate of 2.682 gallons of 100% pure ethanol per nominal wet bushelof corn with 15% of moisture by weight has been accepted as the basis of net energy calculationsin (Farrell et al., 2006a; Farrell et al., 2006c). Based on the analysis here, this USDA estimate isincorrect. 2
In 2004, after the correction for #14 gasoline and fusel oil, corn ethanol satisfied less than1.5% of U.S. motor gasoline consumption, because the 1 psi Reid Vapor Pressure (RVP) waiverfor gasoline-EtOH blends was not repealed by states fighting increased air pollution19. In 2012,with the waiver upheld, ethanol will displace another 1% of U.S. motor gasoline consumption on anenergy-equivalent basis. If the waiver is repealed, the lighter gasoline components will be removedin refineries to lower the RVP. The repeal of the waiver would reduce20 ethanol displacement ofconventional gasoline by 30 or 40%. Note that fossil energy use in corn ethanol production has notbeen accounted for in the above estimates.
Table 4: Average dry mass composition of corn grain (White and Johnson, 2003)
Component % by mass
Starch 66
Oil 3.9
Gluten feed (21% protein) 24
Gluten meal (60% protein) 5.7Losses 0.4
19States no longer will have to add corn-based ethanol or MTBE to gasoline to fight pollution – a requirement thatcosts as much as 8 cents a gallon – under rules announced on February 15, 2006, by the Environmental ProtectionAgency. They eliminate a mandate from the 1990 Clean Air Act that gasoline used in metropolitan areas with theworst smog contain 2 percent oxygen by weight. The law did not say which oxygenate must be used, but most refinersuse either ethanol or methyl tertiary butyl ether, known as MTBE. Source: Associated Press, Feb. 15, 2006.
20(Source: Potential Supply Impacts of Removal of 1-Pound RVP Waiver, September 2002, Office of Oil and Gasof the EIA, Mary J. Hutzler (202-586-2222, [email protected]). The EIA study was requested by Senator JeffBingaman, Chairman of the Senate Committee on Energy and Natural Resources).

U.C. Berkeley T. W. PATZEK 17
Table 5: Average high and low heating values of some fossil fuels from (Castorph et al., 1999;Bossel, 2003; Spiers, 1961). Other sources are listed in the footnotes.
Fuel Density HHVa LHVa HHVa LHVa Sourcei
kg/sm3 MJ/kg MJ/kg MJ/kg MJ/kg
Gasoline 720-800 46.7b 42.5b 46.8 43.6 Table 339
Diesel fuel 840 45.9 43.0 45.3 42.3 Table 350
Methane 0.66d 55.5c 50.1c 55.1(gas) Table 347
LPGe 0.58 50.0 46.0
NGf 0.84 48.7 43.9
Ethanol 787h 29.7g 26.7g 29.6 26.8 Table 353
Corn grain dry 18.8j
Corn stoverk 17.7 16.5
Corn stalksl 15.8 14.8
Corn mealm 16.0
Corn oiln 909.5 39.5 38.8
aHHV = High Heating Value; LHV = Low Heating ValuebAverage of gas station fuels, I choose the mean density of 740 kg/m3, The leftmost gasoline, diesel fuel, LPG, and NG dataare from (Castorph et al., 1999)cFrom Bossel, Table A, (Bossel, 2003)d (Lide, 1994), 6-25eA mixture of propane and butane, C3H8 and C4H10f An average of natural gas compositions from Groningen, Orenb., Ekofisk, and Leman Bankg http://bioenergy.ornl.gov/papers/misc/energy
−conv.html
h (Lide, 1994), 15-46i (Spiers, 1961)j Based on the mean of the values reported by Schneider & Spraque (1955), p. 496, 2033 kcal/lb; and Miller (1958), p.639, 2059 kcal/lb. 1 thermochemical kcal = 4.184 kJk The mature corn stalks of corn from which the ears have been removed. (Domalski et al., 1987), p. 16l (Domalski et al., 1987), p. 17m Zea mays, 11.79% moisture (Domalski et al., 1987), p. 93n Liquid vegetable oil (Domalski et al., 1987), p. 223
4 Co-Products Receive Energy Credit
Now I will focus on a modern dry grind ethanol refinery sketched in Figure 27. Because corn grainis a nascent or “baby” fossil fuel, it takes a lot of energy to transform it into ethanol, cf. Remark4.
To demonstrate this fact, I will start from quoting the best existing written performance guar-antee by ICM, Inc., 310 North First Street, Colwich, Kansas 67030, (www.icminc.com):
1. Ethanol yield: 2.80 gallons per bushel21 (denatured)
2. Natural gas use: 34,000 Btu per gallon of ethanol (denatured)
3. Electricity use: 0.75 kWh per gallon of ethanol (presumably denatured too)22.
21With an unspecified moisture content.22The actual energy bills paid by ethanol refineries in South Dakota point to about 40,000 Btu and 1.95 kWh per

18 The Real Biofuel Cycles
After removing 5% of #14 gasoline, the yield is 2.8 × 0.95 = 2.66 gal/bu of ethanol, plus 2% ofisobutyl and isopropyl alcohol, see Footnote 18. If the latter were true, there would be 2.66×0.98 =2.60 gal/bu ethanol in the final mixture, which is still an incredible 98% of the mean theoreticalethanol yield calculated in Section 3. As long as the processed corn is old and dry (has less than15% of moisture by weight) the yield guarantee can be met, otherwise it is unlikely23.
Natural gas use is 9.48/0.95 = 9.98 MJ/L of gasoline-free product. Electricity use is 0.71/0.95 =0.75 MJ/L of gasoline-free product. As primary energy, this electricity is about 3 times more or2.25 MJ/L. Primary fossil energy necessary to produce the product mixture is therefore 12.23 MJ/Lor 15.5 MJ/kg.
Remark 11 Even in the most efficient ethanol refinery, one spends 15.5/26.7, i.e., an equivalent of58% of the low heating value of ethanol, on direct refining costs. This number should be comparedwith an average energy ratio for refining crude oil, ∼12% for diesel fuel (or gasoline), in an averageU.S. refinery, see Footnote 8. Thus, excluding corn grain/ethanol transportation energy, it takes 5times more fossil energy to produce corn ethanol in the best biorefinery than gasoline or diesel fuelfrom crude oil in an average petroleum refinery. 2
As shown in Figures 14 and 15, both based on the data published by (Morris and Ahmed,1992), ICM, Inc., (Patzek, 2004), and (Sheehan et al., 1998), the average fossil energy expended inethanol refineries is 7 times that in petroleum refineries.
Remark 12 From a purely energetic point of view, corn grain refining to ethanol and the associatedtransport logistics are poor choices. Corn is a widely dispersed, low energy-density source, and itcannot be piped. Similarly, ethanol cannot be piped. Thus, energy costs of corn and ethanoltransportation can be as high as 3 MJ/L of ethanol for a refinery on the East or West Coast24. 2
A careful look at Figure 27 reveals that starch liquefaction is the stage at which liquid glucosecould be separated from corn grain solids and corn oil. The solids could then be sent directly tothe centrifuge and drum drier. All of these operations do not involve distillation. Therefore, itis not entirely correct to subtract 4.1/0.95 = 4.3 MJ/L of ethanol, or roughly 50% of the naturalgas expenditure in an ICM plant. This subtraction also makes little sense based on (Patzek, 2004),where I argued that most corn processing coproducts should be returned to the fields to limitthe egregious irreversibility and unsustainability of industrial corn farming (Tegtmeier and Duffy,2004).
The net heating value of ethanol production coproducts25 might be subtracted from the heatingvalue of corn grain, but not from the fossil energy spent on distilling corn beer. Again, since corngrain has no calorific value in the Report and in the literature sources it accepts (Wang et al., 1997;Wang, 2001; Shapouri et al., 2002; Shapouri et al., 2003; Shapouri and McAloon, 2004), the authorssubtract the calorific value of DDGS (about 1/3 of corn grain energy) from the fossil energy spenton ethanol distillation.
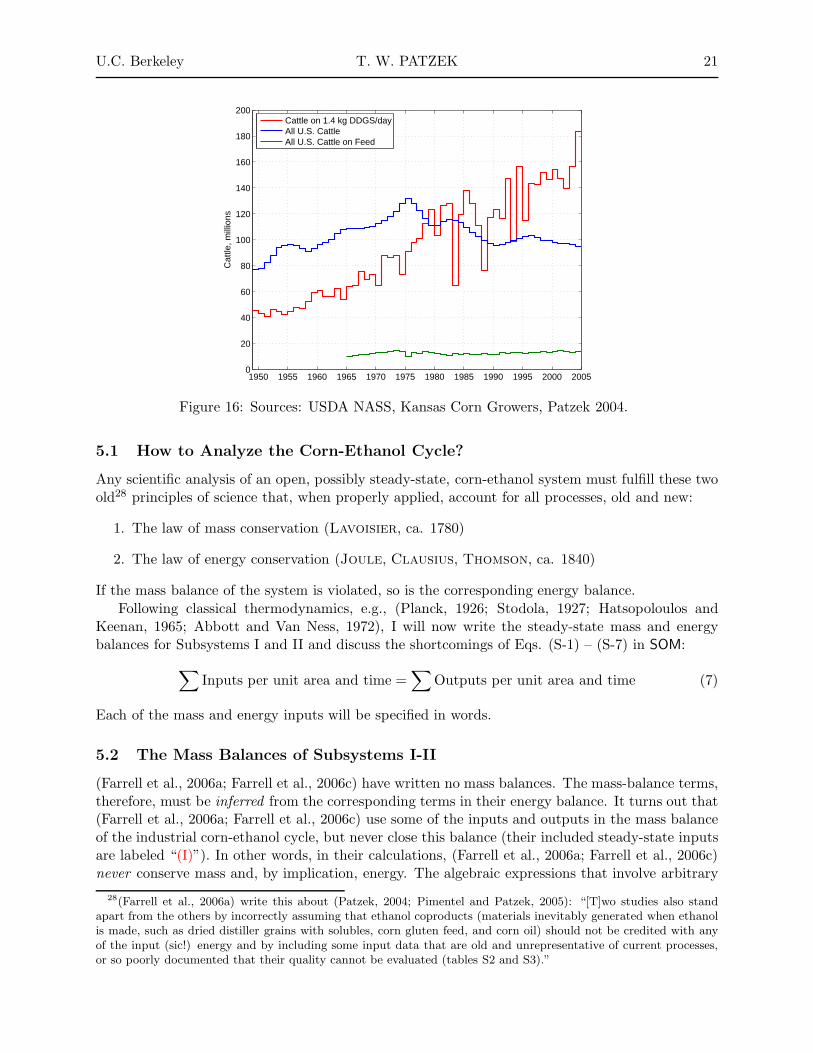
Finally, the DDGS coproduct energy credits do not scale up, see Figure 16. Suppose that wewanted to feed cattle with the main by-product of transforming all U.S. corn into ethanol, DDGS.There would be enough DDGS to feed 180 million cows, twice as much as the head count of all
gallon of ethanol. Source: The South Dakota Public Utilities Commission. Private communication, April 7, 2006.23Note that the imprecise, ill-defined units used by the U.S. ethanol industry offer some leeway. For example, in a
report on the Gopher dry mill plant in St. Paul, MN, (Anonymous, 2003), the mean ethanol yield is 2.5 gal/bu, but1 bushel weighs 68.5 lbm, not 56 lbm, as it is supposed to, see page 4.
24Estimating Ethanol Logistics Cost and Energy Use. Personal communication, Dr. David Hirshfeld, MathPro,Washington D.C., Jan. 27, 2006.
25The LHV or HHV of coproducts - Sum of Process Energies of Separation and Drying.

U.C. Berkeley T. W. PATZEK 19
0 5 10 15 20 25 30
2006 S.D. PUC Energy Bills
1995 National Average, Wet Mill
1995 National Average, Dry Mill
1995 Best State, Wet Mill
1995 Best State, Dry Mill
1995 State−of−the−Art, Wet Mill
1995 State−of−the−Art, Dry Mill
2005 ICM, Inc. Dry Mill
2002 Illinois State Guidelines
MJ/L EtOH
Includes electricity cogeneration
SteamElectricity (Primary)Bulk TransportOtherPatzek, 2004EtOH LHV
Figure 14: Fossil energy used in ethanol refineries. The blue vertical line is my average estimate(Patzek, 2004). Other sources are: The ICM written guarantee, the 1995 update of Morris &
Ahmed (1992), and www.iletohprefeas.com/include/input.pdf for the 2002 Illinois Guidelines forpotential ethanol plant builders. The Low Heating Value (LHV) of ethanol, i.e., the amount ofenergy one obtains from combusting it in a car engine, is the red vertical line. The ICM andMorris & Ahmed’s data were discounted by taking out 5 volume percent of gasoline. Note thatthe 1995 U.S. national average for dry mills is the LHV of ethanol. Also note that my estimate(Patzek, 2004) is a little better than the “Best State” wet mill.
cows in the U.S. Cows have evolved to digest grass (ruminate) and cannot be fed DDGS alone.Cow feedlot managers suggest using up to 3 pounds of DDGS per day per cow to prevent the cowsfrom getting sick and being pumped full of antibiotics.
5 System Boundaries, Mass, and Energy Balance
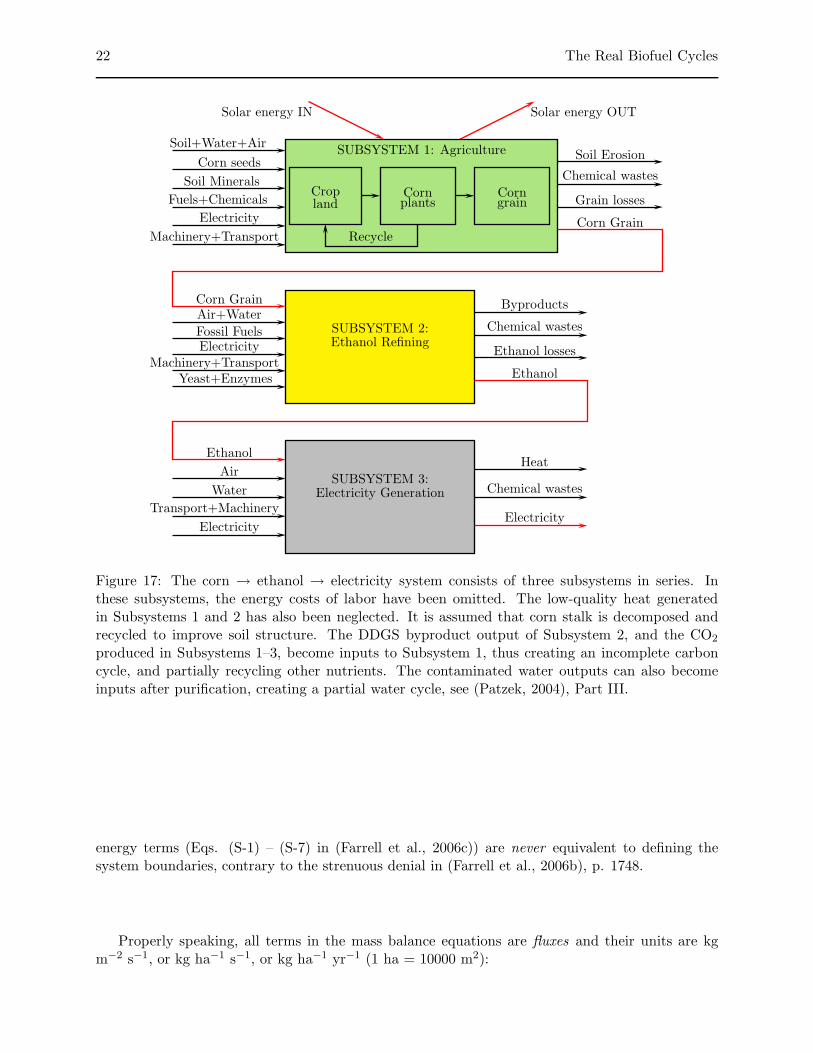
Let me now discuss how Farrell et al. (2006a; 2006c) have failed to define the system boundariesand perform proper mass and energy balances. The authors claim to use “commensurate systemboundaries,” to arrive at their net energy ratios for corn ethanol, but never define these boundaries,thus violating the strongest recommendations in (Slesser, 1974; Slesser, 1975), (Hall and Day, 1977),and (Patzek, 2004). As stated clearly in (Patzek, 2004), mass and energy inputs and outputs(fluxes) can only be defined relative to a system boundary. In other words, a system without aclear boundary cannot be properly described and the most fundamental axioms of science: massand energy conservation will be violated.
Here, following (Patzek, 2004), the system boundary is defined as in Figure 17. Subsystem I

20 The Real Biofuel Cycles
0 2 4 6 8 10 12
2006 S.D. PUC Energy Bills
1995 National Average, Wet Mill
1995 National Average, Dry Mill
1995 Best State, Wet Mill
1995 Best State, Dry Mill
1995 State−of−the−Art, Wet Mill
1995 State−of−the−Art, Dry Mill
2005 ICM, Inc. Dry Mill
2002 Illinois State Guidelines
Energy of ethanol refining/Energy of petroleum refining
Includes electricity cogeneration
SteamElectricity (Primary)Bulk TransportOther
Figure 15: Ratio of energy used to refine corn grain to ethanol and energy used to refine crude oilto diesel fuel or gasoline. The calculations are based on the data shown in Figure 14 and on theNREL report (Sheehan et al., 1998). The mean ratio is 7.
encloses the corn fields26 and plants. Subsystem I operates in annual cycles, and is refilled withthe supply of corn seeds, soil nutrients, soil water, and heavy subsidies from ancient carbon fuels,minerals, and machinery. The 30-year average year-around solar irradiance27 of a flat horizontalsurface in Des Moines, Iowa, is 200 W/m2. The corresponding annual irradiation of 1 ha is therefore63000 GJ. The all time highest average crop in Iowa has been 181 bushels/acre or 9700 kg of drycorn grain/ha. The biomass energy sequestered in this crop is, see Table 5, 18.8 MJ kg−1 × 9700kg ha−1 = 182 GJ ha−1. Accounting for the stalk and roots, the total biomass energy is about360 GJ ha−1, or 360/63000 = 0.006 of the annual irradiation energy. Thus, almost all solar energyis reflected, radiated, thermally conducted, and convected with water evaporated from the soiland plants. From the point of view of biomass sequestration the sun acts as a catalyst (Patzek,2004). Subsystem I operates at two vastly different energy scales: The solar energy megascale, andthe chemical/fossil energy microscale. The megascale solar energy balance is not pertinent to thechemical/fossil microscale energy balance performed here.
Subsystem II encloses ethanol refineries, their soil, and local surface and subsurface waterresources. Subsystem III encloses machines that convert chemical energy in corn ethanol into aflow of electricity through fuel-cell cars or electrical power stations. Subsystem III is defined thisway to keep the free-energy efficiency comparisons consistent among solar cells, wind turbines, andbiofuel cycles, for details see (Patzek, 2004) and (Patzek and Pimentel, 2006). Subsystem III is notrelevant to the discussion of this paper.
26Additional field area for hybrid corn breeding should also be included.27For definitions and details, see my Fall 2005 CE24 Lecture, http://petroleum.berkeley.edu/patzek/ce24/-
Fall2005/Materials/PlantEfficiency.pdf
U.C. Berkeley T. W. PATZEK 21
1950 1955 1960 1965 1970 1975 1980 1985 1990 1995 2000 20050
20
40
60
80
100
120
140
160
180
200
Cat
tle, m
illio
ns
Cattle on 1.4 kg DDGS/dayAll U.S. CattleAll U.S. Cattle on Feed
Figure 16: Sources: USDA NASS, Kansas Corn Growers, Patzek 2004.
5.1 How to Analyze the Corn-Ethanol Cycle?
Any scientific analysis of an open, possibly steady-state, corn-ethanol system must fulfill these twoold28 principles of science that, when properly applied, account for all processes, old and new:
1. The law of mass conservation (Lavoisier, ca. 1780)
2. The law of energy conservation (Joule, Clausius, Thomson, ca. 1840)
If the mass balance of the system is violated, so is the corresponding energy balance.
Following classical thermodynamics, e.g., (Planck, 1926; Stodola, 1927; Hatsopoloulos andKeenan, 1965; Abbott and Van Ness, 1972), I will now write the steady-state mass and energybalances for Subsystems I and II and discuss the shortcomings of Eqs. (S-1) – (S-7) in SOM:
∑
Inputs per unit area and time =∑
Outputs per unit area and time (7)
Each of the mass and energy inputs will be specified in words.
5.2 The Mass Balances of Subsystems I-II
(Farrell et al., 2006a; Farrell et al., 2006c) have written no mass balances. The mass-balance terms,therefore, must be inferred from the corresponding terms in their energy balance. It turns out that(Farrell et al., 2006a; Farrell et al., 2006c) use some of the inputs and outputs in the mass balanceof the industrial corn-ethanol cycle, but never close this balance (their included steady-state inputsare labeled “(I)”). In other words, in their calculations, (Farrell et al., 2006a; Farrell et al., 2006c)never conserve mass and, by implication, energy. The algebraic expressions that involve arbitrary
28(Farrell et al., 2006a) write this about (Patzek, 2004; Pimentel and Patzek, 2005): “[T]wo studies also standapart from the others by incorrectly assuming that ethanol coproducts (materials inevitably generated when ethanolis made, such as dried distiller grains with solubles, corn gluten feed, and corn oil) should not be credited with anyof the input (sic!) energy and by including some input data that are old and unrepresentative of current processes,or so poorly documented that their quality cannot be evaluated (tables S2 and S3).”
22 The Real Biofuel Cycles
Solar energy IN Solar energy OUT
SUBSYSTEM 1: Agriculture
Cropland
Cornplants
Corngrain
Recycle
Soil+Water+Air
Corn seeds
Soil Minerals
Fuels+Chemicals
Electricity
Machinery+TransportCorn Grain
Corn Grain
Grain losses
Chemical wastes
Soil Erosion
SUBSYSTEM 2:Ethanol Refining
Air+Water
Fossil FuelsElectricity
Machinery+TransportYeast+Enzymes Ethanol
Ethanol
Ethanol losses
Chemical wastes
Byproducts
SUBSYSTEM 3:Electricity Generation
Air
Water
Transport+Machinery
ElectricityElectricity
Chemical wastes
Heat
Figure 17: The corn → ethanol → electricity system consists of three subsystems in series. Inthese subsystems, the energy costs of labor have been omitted. The low-quality heat generatedin Subsystems 1 and 2 has also been neglected. It is assumed that corn stalk is decomposed andrecycled to improve soil structure. The DDGS byproduct output of Subsystem 2, and the CO2
produced in Subsystems 1–3, become inputs to Subsystem 1, thus creating an incomplete carboncycle, and partially recycling other nutrients. The contaminated water outputs can also becomeinputs after purification, creating a partial water cycle, see (Patzek, 2004), Part III.
energy terms (Eqs. (S-1) – (S-7) in (Farrell et al., 2006c)) are never equivalent to defining thesystem boundaries, contrary to the strenuous denial in (Farrell et al., 2006b), p. 1748.
Properly speaking, all terms in the mass balance equations are fluxes and their units are kgm−2 s−1, or kg ha−1 s−1, or kg ha−1 yr−1 (1 ha = 10000 m2):

U.C. Berkeley T. W. PATZEK 23
5.2.1 Mass Balance of Corn Farming (Subsystem I)
1. Mass of Corn Seeds (I) +
2. Mass of CO2 from Air +
3. Mass of Mineral Uptake by Corn Plants (I) +
4. Mass of Pesticide and Herbicide Uptake (I) +
5. Mass of Water In =
6. Mass of Corn Plants (Grain (I) + Stalk + Roots) +
7. Mass of Effluent Liquids (Water + Aqueous Chemicals) +
8. Mass of Effluent Solids (Plant Parts) +
9. Mass of Effluent Gases (O2, CO2, H2O, etc.)
(8)
5.2.2 Overall Mass Balance of Soil (Subsystem I)
1. Mass Corn Stalk + Roots + Other Recycled Plant Parts/Animals +
2. Mass of Weathered Minerals and Soil from Inundations +
3. Mass of Soil Restoration Materials +
4. Mass of Human Mineral Inputs to Soil (I) =
5. Mineral Uptake by Plants and Animals +
6. Mass of Eroded Topsoil (Effluent+Dust) +
7. Mass of Effluent Gases and Aerosols (O2, CO2, CO, NH3, NOx, SOx, etc.)
(9)
In industrial corn farming the soil mass balance is seldom steady-state because soil erosion andmineral withdrawal from soil mineral store often exceed mineral and plant inputs. Also, individualmineral component mass (and energy) balances must be performed separately. For example, theoverall mass balance of human fertilizers:
Mass of Human Mineral Inputs =
Mass of Human Mineral Uptake by Corn Plants +
Mass of Human Mineral Uptake by Soil +
Mass of Human Minerals in All Effluents
(10)
needs to be split into N, P, K, Mg, Ca, S, etc. mass balances, not all of which will be steady-state.For multiple examples of such calculations, see, e.g., (Patzek and Pimentel, 2006).

24 The Real Biofuel Cycles
5.2.3 Mass Balance of Corn Processing (Subsystem II)
1. Mass of Corn Grain In +
2. Mass of Fossil/Synthetic Chemical Inputs to Corn Processing (I) +
3. Mass of Yeast and Enzyme Inputs to Corn Processing +
4. Mass of Water In +
5. Mass of O2 from Air, SO2, etc. =
6. Mass of Alcohols Out (I) +
7. Mass of DDGS Out (I) +
8. Mass of Other Distillation Byproducts +
9. Mass of Solid, Liquid, and Gaseous Effluents from Corn Processing
(11)
The overall mass balance of corn processing is violated in (Farrell et al., 2006a; Farrell et al., 2006c).Note that for 1 kg of corn grain input in a biorefinery there are 10–15 kg of process water inputs.Much of this water is evaporated, and some is recycled.
Terms 1, 6, 7, 8 and 9 in equation (11) can be extracted from Eq. (11) to yield just the balanceof corn mass:
Mass of Corn Grain In =
Mass of Alcohols Out (I) +
Mass of DDGS Out (I) +
Mass of Other Distillation Byproducts +
Mass of Some Solid, Liquid, and Gaseous Effluents from Corn Processing
(12)
5.3 The Energy Balances of Subsystems I-II
Properly speaking, all terms in the energy balances below should have units of power fluxesJ m−2 s−1, or MJ ha−1 crop−1, or GJ ha−1 yr−1.
5.3.1 Energy Balance of Corn Farming (Subsystem I)
1. Energy in Corn Seeds (I) + Photosynthetic Solar hν m−2 s−1 +
2. Energy of CO2 from Air +
3. Energy of Mineral/Chemicals Uptake by Plants (I) +
4. Energy of Water In =
5. Energy of Corn Plants (Grain + Stalk + Roots) +
6. Energy of Effluent Liquids (Water + Aqueous Chemicals) +
7. Energy of Effluent Solids (Plant Parts) +
8. Energy of Effluent Gases (O2, CO2, H2O, etc.)
(13)
Note that some of the energy fluxes are close to zero (2), or are defined to be zero at standardconditions (4). The photosynthetic solar energy flux is a tiny fraction of solar irradiance. Thefundamental energy balance (13) of corn farming is violated in (Farrell et al., 2006a; Farrell et al.,2006c).

U.C. Berkeley T. W. PATZEK 25
5.3.2 Overall Energy Balance of Soil (Subsystem I)
1. Net Solar Energy into Soil +
2. Energy of Corn Stalk + Roots + Other Recycled Plant Parts/Animals +
3. Energy of Weathered Minerals and Their Aqueous Solutions +
4. Energy of Human Mineral Inputs (I) +
5. Soil Restoration Work +
6. Fossil Energy of Soil Reworking and Irrigation (I) =
7. Energy Stored in Soil Structure +
8. Energy of Mineral Uptake by Plants and Animals +
9. Energy of Eroded Topsoil (Effluent+Dust)+
10. Energy of Effluent Gases and Aerosols (O2, CO2, CO, NH3, NOx, SOx, etc.)
(14)
Note that the soil energy balance is seldom steady-state. The fundamental energy balance (14) ofsoil is violated in (Farrell et al., 2006a; Farrell et al., 2006c).
5.3.3 Overall Energy Efficiency of Corn Farming (Subsystem I + Environment)
If one assumes for simplicity that the calorific value of corn grain is equal to the solar energysequestered as corn grain, then the overall energetic efficiency of industrial corn farming can bedefined as:
ηcorn grain =1
1 +∑
Farming Energy Inputs +∑
Restoration Work Inputs
ηcorn grain =Output Corn Energy
Sequestered Solar Energy
1
1 +∑
Fossil/Environmental Energy Subsidy Fractions(15)
where the dimensionless Farming Energy Inputs, Restoration Work Inputs, and their sum, Energy
Subsidy Fractions, have the units of MJ/MJ in sequestered solar energy. The second term in Eq.(15)2 describes energy losses in industrial corn agriculture. In perfect solar-driven agricultureηcorn grain ≡ 1.
Most energy balances ignore the environmental impacts of industrial farming, which are veryhigh (Tegtmeier and Duffy, 2004); exceptions are rare, e.g., (Berthiaume et al., 2001) and (Patzek,2004), Part III. The first sum in the denominator is about 0.2, see (Patzek, 2004), Part I, or ∼0.4when the environmental impacts of direct fossil energy inputs to corn farming are also considered,see Part III. The second sum contains a relatively small Term 5 in Eq. (14), and a very large workterm to restore the environment of the open corn fields Subsystem I. This work is external to Eq.(14) and has not been included yet in (Patzek, 2004). The energy needed to perform restorationwork must originate from the corn-ethanol cycle, other environmental resources, and fossil energyinputs. For example, the ethanol coproducts can serve to restore the corn fields and get properenergy credit, see Section 5.5 for more discussion.
The second sum could certainly exceed 0.8 for the increasingly degraded industrial farmingecosystems (Ho and Ulanowicz, 2005). A conservatively low value29 for Iowa today might be 0.4
29It is difficult to grasp the scale of the ecosystem restoration problem. For example, in 1997, 20,500 gigatonnes/yrof N were injected into the U.S. environment from distributed human sources; one third was exported (Howarth et al.,2002). More than 60 percent of our coastal rivers and bays in every coastal state of the continental United States are

26 The Real Biofuel Cycles
(0.2 for the Subsystem I restoration work (Patzek, 2004) plus 0.2 for the environment restorationwork), see also Section 7.1. With this assumption,
ηcorn grain =1
1 + 0.2 + (0.2 + 0.2)= 0.63 (16)
5.3.4 Energy Balance of Corn Processing (Subsystem II)
To understand the delicate question of DDGS energy credits, we must perform the following detailedenergy balance of the biorefinery in Figure 27:
1. Energy of Corn Grain +
2. Energy of Fossil/Synthetic Chemical Inputs to Corn Processing (I) +
3. Energy of Yeast and Enzyme Inputs to Corn Processing +
4. Energy of Water In +
5. Energy of O2 from Air, SO2, etc. =
6. Energy of Concentrated Alcohols Out (I) +
7. Energy of Dry DDGS Out (I) +
8. Energy of Other Distillation Byproducts +
9. Energy of Solid, Liquid, and Gaseous Effluents from Corn Processing
(17)
This overall energy balance of biorefinery is violated in (Farrell et al., 2006a; Farrell et al., 2006c).
Remark 13 If we drop the requirement that the alcohols in Term 6 be concentrated and theDDGS in Term 7 be dry, Terms 1, 6, 7, 8 and 9 in equation (17) can be extracted to balance justthe corn grain energy, which tells us only that the energy of the dilute (8-12%) alcohol solution, plusthe energy of the aqueous suspension of the non-starch solids and corn oil, balance almost exactlythe energy in corn grain. This is approximately true because (1) the beer water and effluent CO2
have almost no energy, and (2) starch cooking and hydrolysis consume some heat, but glucosefermentation generates an almost equal amount of heat. 2
The corn energy balance in the Slurry tank + Jet cooker + Liquefaction + Fermentation part ofbiorefinery is
Energy in Corn Grain =
Energy in Corn Ethanol (I) & Other Alcohols + Energy in DDGS (I) +
Energy in Other Distillation Byproducts +
Energy in Some of Effluents
(18)
This corn energy balance in the refinery is also violated in (Farrell et al., 2006a; Farrell et al.,2006c).
Now we can check if the assertion in Remark 13 is correct, and the mass and energy balanceequations, (12) and (18), are consistent with the data in Tables 4 and 5. In keeping with thecustomary industry units, let me base the energy balance on 1 standard bushel of corn, or 56 lbm
moderately to severely degraded by nutrient pollution. This degradation is particularly severe in the mid Atlanticstates, in the southeast, and in the Gulf of Mexico (Howarth, 2000) Therefore, ground and surface water restorationwill add to the Restoration Work Inputs another term that may be significantly larger than 1.

U.C. Berkeley T. W. PATZEK 27
of corn grain that contains 15% of moisture by weight, or 21.6 kg of bone dry grain. From thecalculations in Section 3.2, it follows that with zero losses30, this bushel will yield 2.639 gallons of100% ethanol or 7.86 kg of pure ethanol. The combined mass and energy balances now yield thefollowing:
21.6 kg/bushel × 18.8 MJ/kg (Energy in Corn Grain) =
7.86 kg/bushel × 29.7 MJ/kg (Energy in Corn Ethanol) +
0.297 × 21.6kg/bushel × 18.8MJ/kg (Energy in non-starch solids) +
0.039 × 21.6kg/bushel × 39.5MJ/kg (Energy in corn oil) +
0.045 × 21.6kg/bushel × 18.8MJ/kg (Energy in Losses)
(19)
or
406 MJ/bushel (Energy in Corn Grain) =
233 MJ/bushel (Energy in Corn Ethanol) +
103 MJ/bushel + 33 MJ/bushel (Energy in DDGS) +
18 MJ/bushel (Energy in Losses)
(20)
Thus, the corn processing energy balance, consistent with the corresponding mass balance, is 406 ≈387 MJ/bushel, i.e., it closes to within 5%. This is not bad at all, considering the inaccuracies inmeasuring the high heating values of the non-starch parts of corn grain that – mixed together –form DDGS. Also the energy in mash cooking, starch liquefaction, and fermentation, as well as inthe liquid and gaseous effluents has been neglected.
Note that at this stage we have balanced the output energy of dilute corn beer, and dilutesolid suspension of the non-starch portion of corn grain and yeast, with the input energy of corngrain. This beer must now be concentrated from ∼10% to 100% of ethanol, and the solids must beseparated from water and dried. Ethanol concentration by multi-stage distillation is an extremelyenergy-intensive process. It is done in the Distillation and Drum Dryer section of the biorefinery inFigure 27. Almost all of the fossil energy in the biorefinery is spent on the beer distillation andDDGS separation and drying, see Section 4 and Figure 14.
Remark 14 To close the complete biorefinery energy balance equation (17), the fossil energy spenton distillation should be added as the second energy input after corn grain, i.e., the input energyin yeast and enzymes will be neglected for now. 2
Now we are ready to perform the complete energy balance of the dry grind corn biorefinery. Iwill use the most optimistic ICM estimate of the distillation/drying energy, 15.5 MJ/kg of ethanol +butanol + isopropanol + etc. I will also charge the refinery with 1.5 MJ/kg in wastewater cleanup,and grain, alcohol and DDGS transportation costs31.
21.6 kg/bushel × 18.8 MJ/kg (Energy in Corn Grain) +
7.86 kg/bushel × (15.5 + 1.5) MJ/kg (Fossil Energy ) =
7.86 kg/bushel × 29.7 MJ/kg (Energy in Distillation Products) +
0.297 × 21.6kg/bushel × 18.8MJ/kg (Energy in non-starch solids) +
0.039 × 21.6kg/bushel × 39.5MJ/kg (Energy in corn oil) +
All Energy Losses in Corn Processing
(21)
30Note that I am using here the maximum theoretical yield of ethanol based on the real data presented in Section3.2. No industrial facility exceeds 85-95% of this yield for a long time. Thus, the counter-argument in (Farrell et al.,2006b), quoted in Footnote 11, is not quite correct.
31In (Patzek, 2004), this energy cost was 2 times higher.

28 The Real Biofuel Cycles
or
406 MJ/bushel (Energy in Corn Grain) +
134 MJ/bushel (Energy in Fossil Fuels) =
233 MJ/bushel (Energy in Distillation Products) +
136 MJ/bushel (Energy in DDGS) +
171 MJ/bushel (All Energy Losses in Corn Processing)
(22)
The overall biorefinery efficiency is defined as
ηethanol =Output Ethanol Energy
∑
Refinery Energy Inputs
ηethanol =Output Ethanol Energy
Input Corn Energy
1
1 +∑
Fossil/Environmental Energy Input Fractions
(23)
where the dimensionless Energy Input Fractions have the units of MJ/MJ in corn grain. The secondterm in Eq. (23)2 describes energy losses in a corn-ethanol biorefinery. A perfect solar drivencorn-ethanol refinery with the maximum theoretical ethanol yield has ηethanol = 233/406 = 0.57.In that refinery all coproducts would have to be recycled back to the corn fields to limit fossilenergy inputs to agriculture, see Eq. (15) and the stanza at the beginning of this paper.
At this stage, we can calculate efficiency of the best possible ethanol refinery32 in two differentways:
1. According to Eq. (1):
ηethanol =233
406 + 134= 0.43 (24)
2. Or, we can attempt to squeeze in the DDGS as another finished fuel (Which it is not! Seethe discussion in Section 5.5)
ηethanol+DDGS =233 + 136
406 + 134= 0.68 (25)
Note that the best-case ethanol refining is far less efficient than average petroleum refining (ηgasoline =0.88). If one replaces the best ICM biorefinery with the 1995 National Average Dry Mill, see Figure14, the second term in Eq. (22) increases from 134 to 220 MJ/bushel, and the average biorefineryefficiencies are 0.37 and 0.59, respectively.
To obtain the best overall efficiency of industrial corn-ethanol cycle, the biorefinery efficienciesin Eq. (24) or (25) should be multiplied by the overall corn farming efficiency, Eq. (16). We thenget the following.
1. (No DDGS coproduct credit):
η1 = ηethanol × ηcorn grain = 0.43 × 0.63 = 0.27 (26)
2. (Full DDGS coproduct credit):
η2 = ηethanol+DDGS × ηcorn grain = 0.68 × 0.63 = 0.43 (27)
32This refinery operates at the maximum theoretical yield of ethanol all the time; an obvious impossibility.

U.C. Berkeley T. W. PATZEK 29
These efficiencies are 0.23 and 0.37, respectively, for the average dry mill case. All cases shownin Figure 14 are compared in Figure 18. By including photosynthetic energy, but also a penaltyfor the restoration of corn fields, rivers, aquifers, etc., the overall corn-cycle efficiency is still 3 – 4times lower (without the DDGS energy credit), or ∼2 times lower (with the DDGS energy credit),than the overall efficiency of gasoline production (0.833). See Remark 4 for comparison.
So, no matter how we do the calculations, we reach the following conclusion:
Remark 15 Fossil fuels must be conserved if our civilization is to survive a little longer, seeFigure 19. From thermodynamics it follows that ecological damage wrought by industrialbiofuel production must be severe. 2
5.4 What Is Wrong with Net-Energy Analysis?
Equations (S-2) and (S-3) in (Farrell et al., 2006c) do not follow from any conceivable mass balanceequation for a corn-ethanol system and are inconsistent with the fundamental energy balanceequations (13) – (18). In their net-energy analysis, (Farrell et al., 2006a; Farrell et al., 2006c)did not (i) define the system boundaries, (ii) close mass balances and, consequently, (iii) conserveenergy in violation of the First Law of Thermodynamics.
As already pointed out in (Patzek, 2004), most of the existing net-energy models of the energeticsof industrial corn-ethanol cycle are based on nonphysical assumptions and must be discarded33:
Remark 16 The net-energy models currently used to evaluate industrial biofuel cycles pick onlythose terms in the fundamental energy balances that justify a posteriori business and/or politicaloutcomes. These models are favored by some engineers, managers, economists and political scien-tists, see, e.g., (Wang et al., 1997; Wang, 2001; Shapouri et al., 2002; Graboski, 2002; Shapouriet al., 2003; Shapouri and McAloon, 2004; Farrell et al., 2006a), and lead to never-ending discus-sions (cf. Footnote 28) of the sort: “My net-energy balance (sic!) is better than yours becauseyou did/did not include this or that term34.” The only hope to achieve progress in the comparisonof relative merits of biofuel cycles is to use their complete energy balances, and define the overallenergy efficiencies that account for the horrendous, widespread damage of the environment causedby these cycles (Patzek, 2004; Patzek and Pimentel, 2006; Pimentel and Patzek, 2005). It is timeto move away from the ongoing and tedious fossil fuel net energy balance debate and on to theecological problems that are poorly understood. 2
33The legendary mathematician and computer scientist John von Neumann, once said (Gaston, 1955): “Thesciences do not try to explain, they hardly even try to interpret, they mainly make models. By a model is meanta mathematical construct which, with the addition of certain verbal interpretation, describes observed phenomena.The justification of such a mathematical construct is solely and precisely that it is expected to work - that is, correctlydescribe phenomena from a reasonable wide area.”
34Moreover, the path-independent internal energy or free energy (both functions of state) are commonly mixed upwith the path-dependent heat and work flows (ways of exchanging energy). Also, the potential energy of electrons,which can be converted to mechanical work with almost 100% efficiency, is often confused with the calorific value ofa fuel. Take, for example, the following statement: “Burn 3 kcal of coal to get 1 kcal of electricity. “Net energy” isnegative 235%, but electricity is higher quality than coal.” (Dr. Bruce Dale’s presentations at the National PressClub in Washington D.C., Aug. 23, 2005, and at the Ag Biotech & Midwest Rural Development Conference, Chicago,Sep. 8, 2005).

30 The Real Biofuel Cycles
0 0.2 0.4 0.6 0.8 1
2002 Illinois State Guidelines
1995 National Average, Wet Mill
1995 National Average, Dry Mill
2006 S.D. PUC Energy Bills
1995 Best State, Wet Mill
Patzek, 2004
1995 State−of−the−Art, Wet Mill
1995 Best State, Dry Mill
2005 ICM, Inc. Dry Mill
1995 State−of−the−Art, Dry Mill
Overall energy efficiency of corn−ethanol cycle
Without DDGSWith DDGSGasolineCoal Dust
Figure 18: Overall energy efficiency of the industrial corn-ethanol cycle. Data sources are listed inthe caption of Figure 14.
0 1 2 3 4 5 6 7 8
2002 Illinois State Guidelines
1995 National Average, Wet Mill
1995 National Average, Dry Mill
2006 S.D. PUC Energy Bills
1995 Best State, Wet Mill
Patzek, 2004
1995 State−of−the−Art, Wet Mill
1995 Best State, Dry Mill
2005 ICM, Inc. Dry Mill
1995 State−of−the−Art, Dry Mill
Gallons of ethanol to displace 1 gallon of gasoline
With DDGSWithout DDGS
Figure 19: Gallons of ethanol, produced in a cycle driven by corn ethanol, needed to displace energyin 1 gallon of gasoline are calculated as 1/η1/0.64 or 1/η2/0.64. With the full DDGS energy credit,3.9 gallons of ethanol displace on average the energy in 1 gallon of gasoline. Without the DDGSenergy credit, this average number is 6.2 gallons of EtOH. Note that the 2006 South Dakota plantrepresents both averages.
5.5 Coproduct Energy Credit Revisited
As highlighted in Footnote 28, there are serious disagreements whether the coproduct energy creditsare justified or not. The reasons for their introduction and my arguments against them have been
U.C. Berkeley T. W. PATZEK 31
discussed in Section 4. Now we are ready to make more quantitative arguments:
1. From a pure energy argument, see Eq. (20), the energy embodied in a fuel made of bone-dryDDGS is 136/406 or 33% of the energy embodied in corn grain, while the ethanol energy is233/406 or 57%.
2. The additional refinery fossil energy inputs embodied in DDGS are 0.33 × 233/136 or 0.57of the DDGS energy. The direct fossil energy embodied in harvested corn grain is about 0.2,see Eq. (16). Therefore, 1 bushel of DDGS is equivalent to 3 bushels of corn in terms ofits fossil energy content. One might give DDGS an energy credit, but only if one eliminatescorn farming in proportion to the ratio of the respective energy contents. Thus, for 4 billiongallons of ethanol per year one would have to eliminate 0.95 × 4 × 109/2.5 × 0.33 × 3 = 1.6billion bushes of corn per year, or about 3.5-4 million hectares of farms that produce corn forfeed. Otherwise, talk about DDGS “displacing” corn is meaningless.
3. When one performs a mass balance of soil, Eq. (9), as was done in (Patzek, 2004), one dis-covers that to keep the soil from deterioration and ever-deepening dependence on syntheticfertilizers it is necessary to recycle as much plant matter as possible35. This was the ther-modynamic reason for my rejection of these credits. No soil mass balance was done in theReport and the references listed in C4.
4. I have argued that DDGS should be returned back to the fields to limit the irreversibility ofmodern agriculture (see Section 3.12 in (Patzek, 2004)). Therefore, from my macro-ecologicalpoint of view, the DDGS energy credit is somewhat negative: The DDGS energy output ofa biorefinery becomes an energy input to remote corn farms, minus the energy losses forprocessing, handling, transport, and spreading the DDGS on the fields. On the other hand,the diminished need for nitrogen fertilizer, decrease of soil erosion, and decrease of toxic waterrunoff from the fields, will improve energy efficiency of corn agriculture and subtract perhapsas much as 0.2 from the denominator of Eq. (16).
5. From the micro-economic point of view, one could argue that there is monetary value of theco-products replacing corn. In other words, someone operating a corn ethanol distillery couldsell these products to offset the cost of corn and fossil energy he/she purchased. The sale priceof DDGS could then be translated back into a payment for some of the DDGS’ embodiedenergy. The extent of this reimbursement would depend on the fossil fuel and electricityprices, and DDGS price, and would not, in general, be equal to 33% of the grain energy.
6. Dr. Marvin Paul Scott follows up on this argument36, and says: “Inclusion of co-productsin the calculation makes a big difference in the outcome, and I find your suggestion that theco-products should be returned to the field intriguing. Have there been any studies of theeffects of doing this? It would be an interesting experiment. It may reduce the amount ofchemical fertilizers required, in which case it would still have an effect on the calculations.The co-products question ties into problems associated with our food production/consumptionsystem as well. Producing cattle on range and pastureland that is not suitable for row crops isa good use of our resources. Unfortunately, much of our beef is produced in feed lots with feedthat includes corn and ethanol co-products and antibiotics to keep [the cattle] healthy. Theuse of antibiotics in agriculture is a big problem and leads to the development of antibiotic
35The same argument applies with force to all large-scale schemes to cellulosic ethanol production, see Section 8and (Patzek and Pimentel, 2006).
36Personal communication, Feb. 13, 2006.
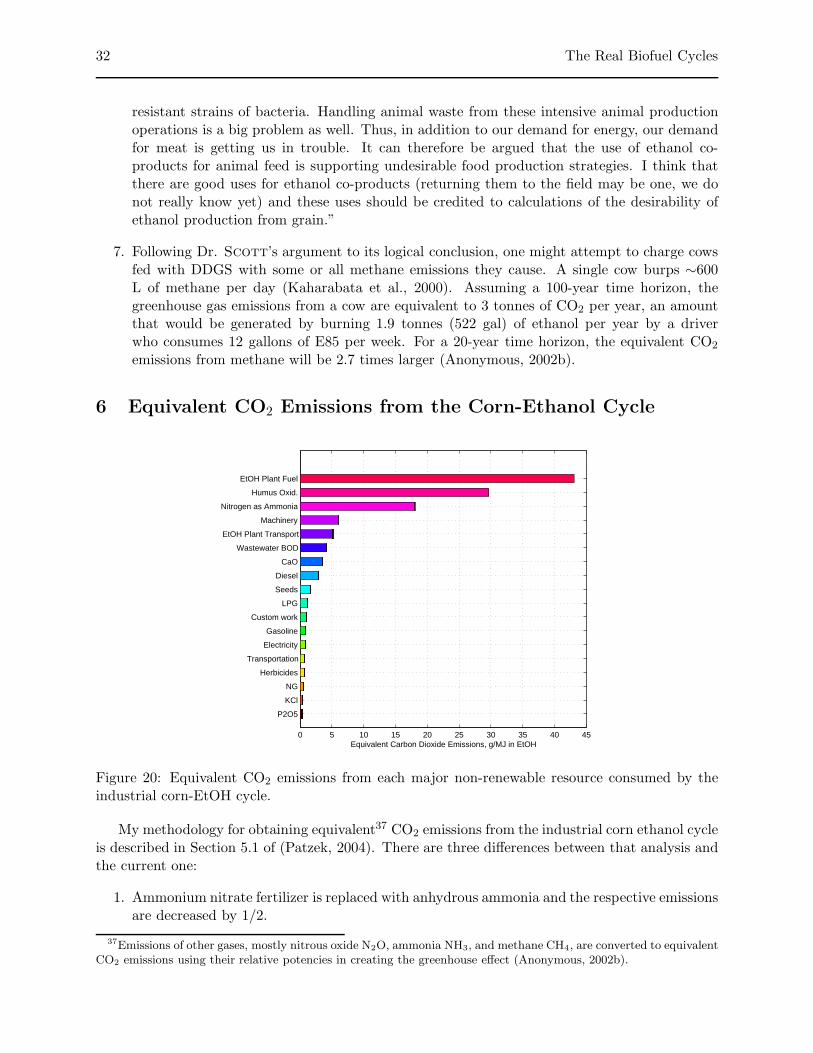
32 The Real Biofuel Cycles
resistant strains of bacteria. Handling animal waste from these intensive animal productionoperations is a big problem as well. Thus, in addition to our demand for energy, our demandfor meat is getting us in trouble. It can therefore be argued that the use of ethanol co-products for animal feed is supporting undesirable food production strategies. I think thatthere are good uses for ethanol co-products (returning them to the field may be one, we donot really know yet) and these uses should be credited to calculations of the desirability ofethanol production from grain.”
7. Following Dr. Scott’s argument to its logical conclusion, one might attempt to charge cowsfed with DDGS with some or all methane emissions they cause. A single cow burps ∼600L of methane per day (Kaharabata et al., 2000). Assuming a 100-year time horizon, thegreenhouse gas emissions from a cow are equivalent to 3 tonnes of CO2 per year, an amountthat would be generated by burning 1.9 tonnes (522 gal) of ethanol per year by a driverwho consumes 12 gallons of E85 per week. For a 20-year time horizon, the equivalent CO2
emissions from methane will be 2.7 times larger (Anonymous, 2002b).
6 Equivalent CO2 Emissions from the Corn-Ethanol Cycle
0 5 10 15 20 25 30 35 40 45
P2O5
KCl
NG
Herbicides
Transportation
Electricity
Gasoline
Custom work
LPG
Seeds
Diesel
CaO
Wastewater BOD
EtOH Plant Transport
Machinery
Nitrogen as Ammonia
Humus Oxid.
EtOH Plant Fuel
Equivalent Carbon Dioxide Emissions, g/MJ in EtOH
Figure 20: Equivalent CO2 emissions from each major non-renewable resource consumed by theindustrial corn-EtOH cycle.
My methodology for obtaining equivalent37 CO2 emissions from the industrial corn ethanol cycleis described in Section 5.1 of (Patzek, 2004). There are three differences between that analysis andthe current one:
1. Ammonium nitrate fertilizer is replaced with anhydrous ammonia and the respective emissionsare decreased by 1/2.
37Emissions of other gases, mostly nitrous oxide N2O, ammonia NH3, and methane CH4, are converted to equivalentCO2 emissions using their relative potencies in creating the greenhouse effect (Anonymous, 2002b).

U.C. Berkeley T. W. PATZEK 33
2. Emissions from humus oxidation in soil eroded by wind are included with the following as-sumptions: (a) topsoil contains 4% of humus (Stevenson, 1982), (b) humus contains 50% ofC by weight (Stevenson, 1982), wind-eroded soil is enriched in humus by (1.3 + 5)/2 ≈ 3 onaverage (Allison, 1973), (c) wind erodes only 1 mm of topsoil per year, or 10 tonnes/ha-yr(Pimentel, 2006), and (d) the airborne humus is completely oxidized.
3. To make the comparisons meaningful, methane, gasoline, and diesel fuel are now chargedwith incremental 17% (2% more than before) emissions for their recovery, transportation,and processing.
With these assumptions, the specific emissions of equivalent CO2 in grams per MJ in ethanolare shown in Figure 20. Note that the minimal CO2 emissions from soil erosion are the secondbiggest source after ethanol refineries. These soil emissions are likely to be several times higher onflat terrain with dry topsoil, such as that in South Dakota during drought.
The specific emissions from Subsystems I and II in the corn ethanol cycle are compared inFigure 21 with the equivalent emissions from other fossil fuels, methane, gasoline, and diesel fuel.It seems that the cumulative corn-ethanol emissions are 50% higher than those from ancient fossilfuels.
If one charges corn ethanol with equivalent CO2 emissions from methane burped by the cowsfed with DDGS, one adds at the minimum
0.33kg DDGS
kg dry corn× 1
0.364
kg dry corn
kg EtOH× 44
30
kg CO2
kg DDGS× 0.12 × 16
44
kg CH4
kg CO2 burped×
×56kg equiv. CO2
kg equiv. CH4× 1
29.7
kg EtOH
MJ× 1000 ≈ 110
g equiv. CO2
MJ in EtOH
(28)
or another 38% of equivalent CO2 emissions over and above the gasoline emissions. The factorof 56 in the equation above comes from the relative potency of methane over the 20-year timehorizon (Anonymous, 2002b), and it was assumed that 12% of the gas burped by a cow is methane(Kaharabata et al., 2000).
If ethanol refineries switch from natural gas to coal, their GHG emissions will increase by atleast 70 – 80%, see Table 19 in (Patzek, 2004), not counting the high energy costs of coal transportto the dispersed biorefineries.
7 Ecology & Macro-Economics of Corn Ethanol Production
Let me remind the reader that the U.S. corn is the single largest crop on the earth (the sugarcanecrop is larger, but it contains more water). The U.S. produces some 42% of world’s corn, see(Patzek, 2004). In 2004, U.S. corn could have fed the entire population of China for one year. Amere 2% of the corn used by the United States goes directly to feed people; another 19 percentgoes into processed foods (e.g., high-fructose corn syrup, chips). Seventy five percent of U.S. corngoes to feed livestock (Kimbrell, 2003). So ethanol manufacturing coproducts will flood the animalfeed market and depress corn price even more.
7.1 Ecological Consequences
People who fill their cars with biofuels often think that they are saving the world from an ecologicaldisaster. Unfortunately, on a large scale, the opposite is true (Patzek, 2004; Patzek and Pimentel,2006),

34 The Real Biofuel Cycles
0 20 40 60 80 100 120 140
NRR in EtOH−Corn Cycle
Diesel Fuel
Gasoline Fuel
Methane Fuel
Equivalent Carbon Dioxide Emissions, g/MJ in Fuel
Fossil FuelsCorn FarmingEthanol PlantBOD Treatment
Figure 21: Equivalent CO2 emissions from corn agriculture, corn ethanol production, and otherfossil fuels. The corn-ethanol cycle emissions double if methane burped by cows fed with the DDGScoproduct is accounted for.
By now, on average, 1/2 of the top 14 inches of soil in Iowa is gone (Pimentel et al., 1995).Erosion is rampant, see Figure 7.1, and so is chemical pollution of the entire Mississippi Riverdrainage basin and the Gulf of Mexico near the Mississippi delta (Scavia et al., 2003), see Figure23. For example, over the last 20 years, the nitrate runoff from the Midwest corn and wheat fieldsdischarged between 2,000 and 10,000 tonnes of nitrate per day into the Gulf of Mexico. Thus,thanks to agribusiness and industrial agriculture, the most productive grassland ecosystem on theearth may be destroyed in another 70 years. As they continue to be degraded, Midwestern fieldswill have to become larger and be subsidized even more with fossil energy (Ho and Ulanowicz,2005).
Industrial crop production (corn, wheat, soybeans, etc.) causes environmental damage and losthuman health valued at between $5.7 and $16.9 billion per year (Tegtmeier and Duffy, 2004). Thehidden subsidies of agribusiness from the environmental resources are estimated to be $24–96/ha-yr.
If one compares a corn field with a prairie, one concludes that the prairie runs on sunlight38,while the corn field runs on fossil fuels (Kimbrell, 2002), p. 101. The most eloquent testimony tothis effect was given by Ms. Theresa Schmalshof of the National Corn Growers Association(NCGA) before the House Subcommittee on Energy and Mineral Resources, Washington, D.C.,May 19, 2005. Ms. Schmalshof was strongly in favor of getting more natural gas and oil fromanywhere in the U.S., including the Arctic National Wildlife Reserve (ANWR) and the outercontinental shelf, to provide more of the vital fossil fuels for the corn and ethanol industries. Shealso wanted us to use much more coal in ethanol plants to displace the increasingly expensivenatural gas39.
I have not addressed here the looming shortage of all water in the U.S. (Gale, 2006). We willrun out of clean water for drinking, agriculture, ethanol processing, and other industrial uses a
38The cellulosic ethanol proponents confuse the high ecological efficiency of a grassland system (almost 100%) thatrecycles practically all mass, with its net productivity, which is almost exactly zero (Ulanowicz and Hannon, 1987;Patzek and Pimentel, 2006; Ho and Ulanowicz, 2005).
39Ms. Schmalshof’s testimony is available at http://resourcescommittee.house.gov/archives/109/testimony/-2005/TheresaSchmalshof.htm
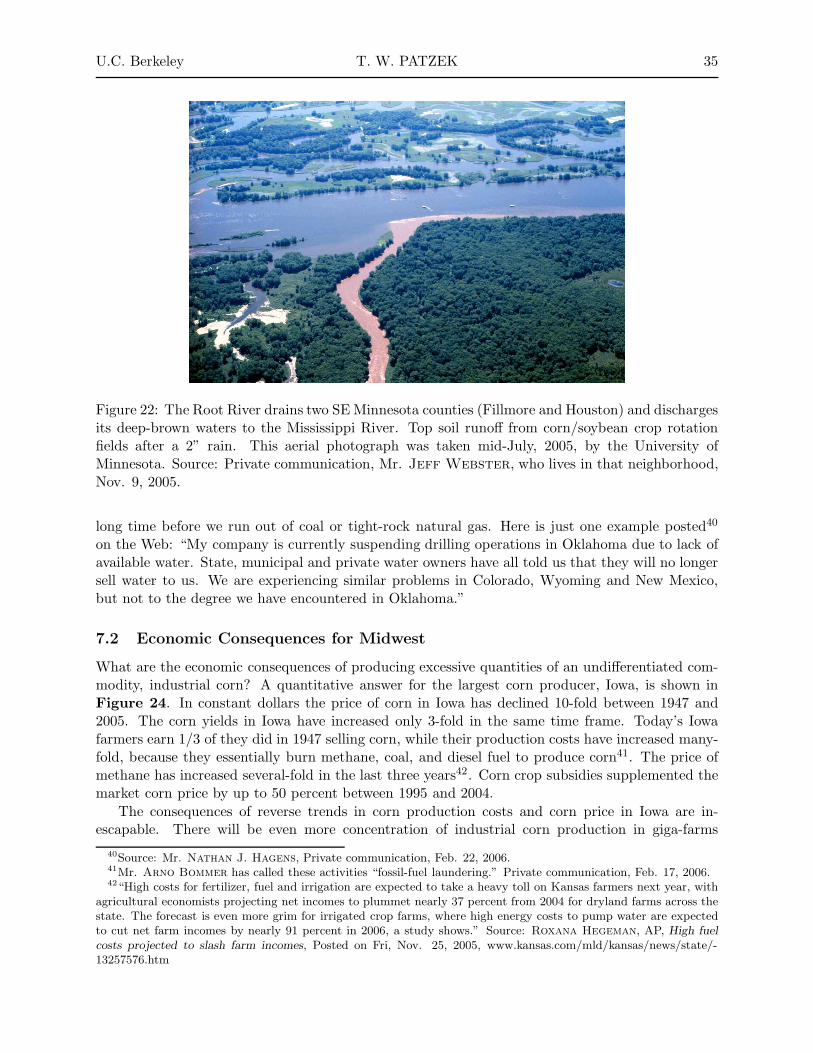
U.C. Berkeley T. W. PATZEK 35
Figure 22: The Root River drains two SE Minnesota counties (Fillmore and Houston) and dischargesits deep-brown waters to the Mississippi River. Top soil runoff from corn/soybean crop rotationfields after a 2” rain. This aerial photograph was taken mid-July, 2005, by the University ofMinnesota. Source: Private communication, Mr. Jeff Webster, who lives in that neighborhood,Nov. 9, 2005.
long time before we run out of coal or tight-rock natural gas. Here is just one example posted40
on the Web: “My company is currently suspending drilling operations in Oklahoma due to lack ofavailable water. State, municipal and private water owners have all told us that they will no longersell water to us. We are experiencing similar problems in Colorado, Wyoming and New Mexico,but not to the degree we have encountered in Oklahoma.”
7.2 Economic Consequences for Midwest
What are the economic consequences of producing excessive quantities of an undifferentiated com-modity, industrial corn? A quantitative answer for the largest corn producer, Iowa, is shown inFigure 24. In constant dollars the price of corn in Iowa has declined 10-fold between 1947 and2005. The corn yields in Iowa have increased only 3-fold in the same time frame. Today’s Iowafarmers earn 1/3 of they did in 1947 selling corn, while their production costs have increased many-fold, because they essentially burn methane, coal, and diesel fuel to produce corn41. The price ofmethane has increased several-fold in the last three years42. Corn crop subsidies supplemented themarket corn price by up to 50 percent between 1995 and 2004.
The consequences of reverse trends in corn production costs and corn price in Iowa are in-escapable. There will be even more concentration of industrial corn production in giga-farms
40Source: Mr. Nathan J. Hagens, Private communication, Feb. 22, 2006.41Mr. Arno Bommer has called these activities “fossil-fuel laundering.” Private communication, Feb. 17, 2006.42“High costs for fertilizer, fuel and irrigation are expected to take a heavy toll on Kansas farmers next year, with
agricultural economists projecting net incomes to plummet nearly 37 percent from 2004 for dryland farms across thestate. The forecast is even more grim for irrigated crop farms, where high energy costs to pump water are expectedto cut net farm incomes by nearly 91 percent in 2006, a study shows.” Source: Roxana Hegeman, AP, High fuel
costs projected to slash farm incomes, Posted on Fri, Nov. 25, 2005, www.kansas.com/mld/kansas/news/state/-13257576.htm

36 The Real Biofuel Cycles
0 5 10 15 20 25
198519861987198819891990199119921993199419951996199719981999200020012002
Hypoxic Zone Extent × 1000 km2
No DataNo Data
Iowa’s ShareOther States
Figure 23: The run-off agricultural chemicals (nitrates, phosphates, potassium, calcium, etc.) dis-charge into the Gulf of Mexico and cause a large anoxic zone there. This zone seems to haveappeared in the early 1980’s. Source: (Scavia et al., 2003).
operated by large agribusiness corporations, and real farmers will only rent the land.
In words of Dr. Kamyar Enshayan43:
Economist Ken Meter has assembled data from Agricultural Census and the Bu-reau of Economic Analysis for many counties around the nation to characterize thenature of commodity agriculture (Meter, 2005). For our 8-county area around BlackHawk County, we have about 8,500 farmers who mostly raise corn and beans and somelivestock. On the average, from 1999 to 2003, these farms sold $1.08 billion worth ofcrops every year. But, they spent $1.14 billion every year to produce it. A loss of $62million, every year, from 1999-2003. Most other counties in Iowa are doing worse, evenas we see images of record harvest, etc.
During the same period, our 8-county area farms received $173 million per year infederal government crop subsidies for corn and beans. It is a long story, but by everymeasure rural communities are declining and these huge subsidies have not helped,because these are not community-building subsidies, these are commodity-exportingsubsidies for two specific crops.
7.3 Economic Consequences for U.S.
American taxpayers spent a staggering $143.8 billion on farm subsidies over the past ten years, morethan $104 billion of which (72 percent) went to the top 10 percent of recipients–some 312,000 largefarming operations, cooperatives, partnerships and corporations that collected, on average, morethan $33,000 every year. Most of this money goes to support the prices of just three commodities:corn, soybeans and wheat. Only a small fraction is spent on conservation and restoration programs.
43Dr. Kamyar Enshayan is an agricultural engineer and works at University of Northern Iowa. He can be reachedat [email protected]. His report is posted at www.uni.edu/ceee/foodproject.
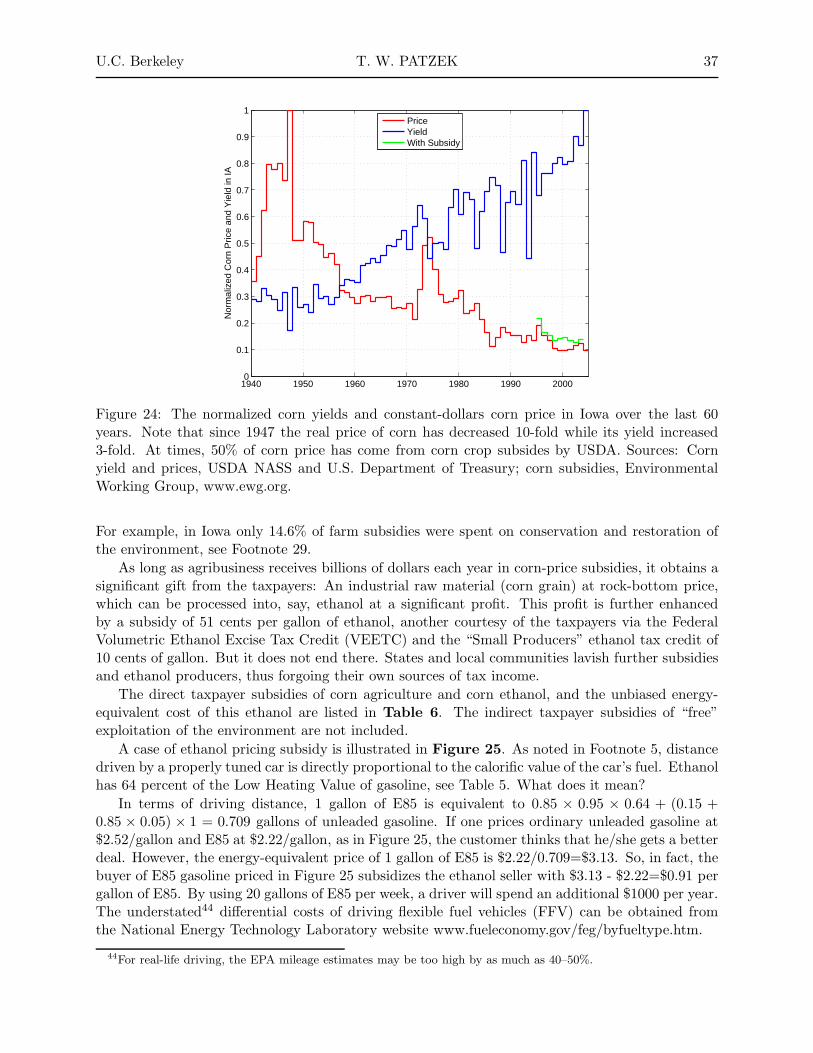
U.C. Berkeley T. W. PATZEK 37
1940 1950 1960 1970 1980 1990 20000
0.1
0.2
0.3
0.4
0.5
0.6
0.7
0.8
0.9
1
Nor
mal
ized
Cor
n P
rice
and
Yie
ld in
IA
PriceYieldWith Subsidy
Figure 24: The normalized corn yields and constant-dollars corn price in Iowa over the last 60years. Note that since 1947 the real price of corn has decreased 10-fold while its yield increased3-fold. At times, 50% of corn price has come from corn crop subsides by USDA. Sources: Cornyield and prices, USDA NASS and U.S. Department of Treasury; corn subsidies, EnvironmentalWorking Group, www.ewg.org.
For example, in Iowa only 14.6% of farm subsidies were spent on conservation and restoration ofthe environment, see Footnote 29.
As long as agribusiness receives billions of dollars each year in corn-price subsidies, it obtains asignificant gift from the taxpayers: An industrial raw material (corn grain) at rock-bottom price,which can be processed into, say, ethanol at a significant profit. This profit is further enhancedby a subsidy of 51 cents per gallon of ethanol, another courtesy of the taxpayers via the FederalVolumetric Ethanol Excise Tax Credit (VEETC) and the “Small Producers” ethanol tax credit of10 cents of gallon. But it does not end there. States and local communities lavish further subsidiesand ethanol producers, thus forgoing their own sources of tax income.
The direct taxpayer subsidies of corn agriculture and corn ethanol, and the unbiased energy-equivalent cost of this ethanol are listed in Table 6. The indirect taxpayer subsidies of “free”exploitation of the environment are not included.
A case of ethanol pricing subsidy is illustrated in Figure 25. As noted in Footnote 5, distancedriven by a properly tuned car is directly proportional to the calorific value of the car’s fuel. Ethanolhas 64 percent of the Low Heating Value of gasoline, see Table 5. What does it mean?
In terms of driving distance, 1 gallon of E85 is equivalent to 0.85 × 0.95 × 0.64 + (0.15 +0.85 × 0.05) × 1 = 0.709 gallons of unleaded gasoline. If one prices ordinary unleaded gasoline at$2.52/gallon and E85 at $2.22/gallon, as in Figure 25, the customer thinks that he/she gets a betterdeal. However, the energy-equivalent price of 1 gallon of E85 is $2.22/0.709=$3.13. So, in fact, thebuyer of E85 gasoline priced in Figure 25 subsidizes the ethanol seller with $3.13 - $2.22=$0.91 pergallon of E85. By using 20 gallons of E85 per week, a driver will spend an additional $1000 per year.The understated44 differential costs of driving flexible fuel vehicles (FFV) can be obtained fromthe National Energy Technology Laboratory website www.fueleconomy.gov/feg/byfueltype.htm.
44For real-life driving, the EPA mileage estimates may be too high by as much as 40–50%.
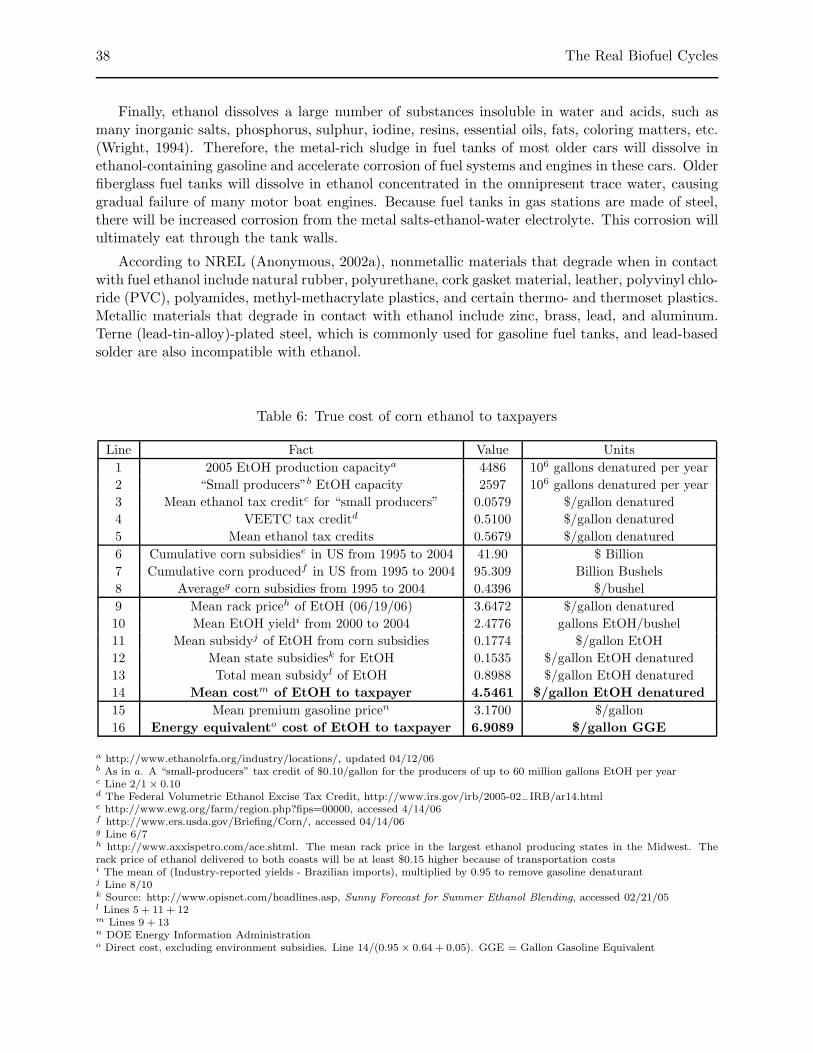
38 The Real Biofuel Cycles
Finally, ethanol dissolves a large number of substances insoluble in water and acids, such asmany inorganic salts, phosphorus, sulphur, iodine, resins, essential oils, fats, coloring matters, etc.(Wright, 1994). Therefore, the metal-rich sludge in fuel tanks of most older cars will dissolve inethanol-containing gasoline and accelerate corrosion of fuel systems and engines in these cars. Olderfiberglass fuel tanks will dissolve in ethanol concentrated in the omnipresent trace water, causinggradual failure of many motor boat engines. Because fuel tanks in gas stations are made of steel,there will be increased corrosion from the metal salts-ethanol-water electrolyte. This corrosion willultimately eat through the tank walls.
According to NREL (Anonymous, 2002a), nonmetallic materials that degrade when in contactwith fuel ethanol include natural rubber, polyurethane, cork gasket material, leather, polyvinyl chlo-ride (PVC), polyamides, methyl-methacrylate plastics, and certain thermo- and thermoset plastics.Metallic materials that degrade in contact with ethanol include zinc, brass, lead, and aluminum.Terne (lead-tin-alloy)-plated steel, which is commonly used for gasoline fuel tanks, and lead-basedsolder are also incompatible with ethanol.
Table 6: True cost of corn ethanol to taxpayers
Line Fact Value Units
1 2005 EtOH production capacitya 4486 106 gallons denatured per year
2 “Small producers”b EtOH capacity 2597 106 gallons denatured per year
3 Mean ethanol tax creditc for “small producers” 0.0579 $/gallon denatured
4 VEETC tax creditd 0.5100 $/gallon denatured
5 Mean ethanol tax credits 0.5679 $/gallon denatured
6 Cumulative corn subsidiese in US from 1995 to 2004 41.90 $ Billion
7 Cumulative corn producedf in US from 1995 to 2004 95.309 Billion Bushels
8 Averageg corn subsidies from 1995 to 2004 0.4396 $/bushel
9 Mean rack priceh of EtOH (06/19/06) 3.6472 $/gallon denatured
10 Mean EtOH yieldi from 2000 to 2004 2.4776 gallons EtOH/bushel
11 Mean subsidyj of EtOH from corn subsidies 0.1774 $/gallon EtOH
12 Mean state subsidiesk for EtOH 0.1535 $/gallon EtOH denatured
13 Total mean subsidyl of EtOH 0.8988 $/gallon EtOH denatured
14 Mean costm of EtOH to taxpayer 4.5461 $/gallon EtOH denatured
15 Mean premium gasoline pricen 3.1700 $/gallon
16 Energy equivalento cost of EtOH to taxpayer 6.9089 $/gallon GGE
a http://www.ethanolrfa.org/industry/locations/, updated 04/12/06b As in a. A “small-producers” tax credit of $0.10/gallon for the producers of up to 60 million gallons EtOH per yearc Line 2/1 × 0.10d The Federal Volumetric Ethanol Excise Tax Credit, http://www.irs.gov/irb/2005-02
−IRB/ar14.html
e http://www.ewg.org/farm/region.php?fips=00000, accessed 4/14/06f http://www.ers.usda.gov/Briefing/Corn/, accessed 04/14/06g Line 6/7h http://www.axxispetro.com/ace.shtml. The mean rack price in the largest ethanol producing states in the Midwest. Therack price of ethanol delivered to both coasts will be at least $0.15 higher because of transportation costsi The mean of (Industry-reported yields - Brazilian imports), multiplied by 0.95 to remove gasoline denaturantj Line 8/10k Source: http://www.opisnet.com/headlines.asp, Sunny Forecast for Summer Ethanol Blending, accessed 02/21/05l Lines 5 + 11 + 12m Lines 9 + 13n DOE Energy Information Administrationo Direct cost, excluding environment subsidies. Line 14/(0.95 × 0.64 + 0.05). GGE = Gallon Gasoline Equivalent

U.C. Berkeley T. W. PATZEK 39
Figure 25: The caption of this photograph was: “At this station in Chicago last month, E85 wasclearly the fuel of choice for consumers trying to save money or reduce oil imports.”. Source: Simon
Romero, Much Talk, Little Action on Energy Front, The New York Times, Feb. 2, 2006, PagesC1-C4.
8 Cellulosic Ethanol
The discussion of cellulosic ethanol in the Report has been limited to one point per Fig. 1 and2, and a couple of sentences that describe the current lack of data and analyses. The authors,nevertheless, predict that cellulosic ethanol will play a key role in meeting “the nation’s energy andenvironmental goals.”
It is difficult to cope with an argument that has not been presented yet, but a couple ofcomments are in order. First, the term “cellulosic ethanol” is imprecise. It is meant to suggest thatcertain components of wood and green plant materials (cellulose, pectins, and hemicelluloses) canbe chemically separated (from mostly lignin in wood) and partially split into hexose and pentosemonomers, which are then fermented to produce ethanol.
Cellulose is the principal structural component of cell walls in higher plants. It is the mostabundant form of living terrestrial biomass (Crawford, 1981). For hundreds of millions of years,cellulose has protected plants from elements and animals, and from chemical attacks by fungi andbacteria. Cotton is 98% pure cellulose; flax is 80%, and wood is 40-50% cellulose, with the remaining50-60% made up from other complex polysaccharides (20-35% hemicellulose and 15-35% lignin).
The special properties of cellulose result from the association of the long, straight polymericchains to form fibers called micro-fibrils. The micro-fibrils then form larger fibers, which arelaid down in a cris-cross pattern, and intermixed with gel-like polysaccharides, hemicelluloses andpectins, that function as biocement (Taiz and Zeiger, 1998). In some ways this structure resemblesfiberglass and other composite materials, in which rigid crystalline fibers are used to reinforce amore flexible matrix.
The beta-glycosidic bonds are crucial in determining the structural properties of cellulose, andthus the strength of the cellulose fibers. Because of the beta-bonds, the chain assumes an extendedrigid configuration, with each glucose residue turned 180 deg from its neighbor, see (Taiz and Zeiger,1998), Chapter 15. Another consequence of alternating top/bottom glucose residues is that OHgroups of adjacent chains allow very extensive hydrogen-bonding between chains. This extensiveinter-chain hydrogen-bonding, and rigid beta-configuration makes cellulose fibers very strong andable to resist strong sodium hydroxide and acid solutions.
Remark 17 Close to one billion years of plant evolution have made cellulose very stable andresistant to biochemical attacks. Cellulose can be quickly decomposed and hydrolyzed only bymechanical grinding or steam exploding and severe chemical attack by hot concentrated sulfuric

40 The Real Biofuel Cycles
acid or sodium hydroxide. Biochemical enzymatic attacks take a long time and have low efficiency.2
The process of separating cellulose fibers from the rest of woody biomass is well-known, fast,efficient, and very energy intensive. It is called the paper kraft-process45. Unfortunately, the bestenergy efficiency of this process is ∼30 MJ/kg of paper pulp46, more than the high heating valueof pure ethanol. Therefore a much milder, enzymatic process must be used to obtain simple sugarsfrom cellulose.
Here is a brief summary of the formidable obstacles faced by cellulosic ethanol:
Contamination: For corn starch fuel ethanol, normal fermentation times in batch mode (thereare no continuous reactors in operation) are 48 hours; up to 72 hours is acceptable, see Section3.2. These estimates do not include downtime, cleaning, start up, etc. Over 72 hours thenumber of failures increases exponentially due to contamination with bacteria: acetogensand others, see Figure 26 and Footnote 14. As described in the literature, typical enzymeprocesses for lignocellulosic alcohol take 5 to 7 days, i.e., about 120-170 hours. This spellsbig problems if lignocellulosic ethanol producers ever go outside the laboratory or pilot scale(sterile fermenters) to a conventional fermentation vessel, which can not be sterilized for120–170 hours.
Biomass availability: Natural productivity of a mature ecosystem (an earth household, e.g., aforest or grassland) is practically zero on human time scale47. What is produced by au-totrophic plants and algae, and by rock weathering and floods, is consumed by heterotrophs(bacteria, fungi, and animals that are continuously recycled as nutrients for the plants).Therefore, “biowaste” is an engineering classification of plant (and animal) parts unused inan industrial process. This dated human concept is completely alien to natural ecosystems,which must recycle their matter completely in order to survive. Excessive “biowaste” removalrobs ecosystems of vital nutrients and species, and degrades them irreversibly. As discussedin (Patzek and Pimentel, 2006), those ecosystems from which we remove biomass at high rate(crop fields, tree plantations) must be heavily subsidized with fossil energy and earth minerals(see Theresa Schmalshof’s testimony, Footnote 39).
Enzyme Yield vs. Rate: The rate of lignocellulose hydrolysis and fermentation can be increasedby enough pre-treatment (such as ball milling to exceedingly fine dust, at enormous energycosts, or steam exploding with acid pre-treatment), but rates will slow down rather rapidlybefore high yields are obtained. The main problem is the number of binding sites available;the outside-in rate limitation phenomenon. It simply takes time to chew into the sturdylignocellulosic particles. Of course, one could run the lignocellulose through the kraft-likeprocess. This cannot be done, however, for lignocellulosic ethanol because energy losseswould be severe. One can get rather good yields and rates if one performs energy-intensiveand unaffordable pretreatment, or (relatively) high yields with modest pre-treatment if onewaits long enough (ideally for weeks). Thus, despite claims to the contrary, a real industrialprocess for lignocellulosic ethanol does not exist, and may never have a sufficiently favorableenergy balance.
45The kraft process is used in production of paper pulp and involves the use of caustic sodium hydroxide andsodium sulfide to extract the lignin from the wood fiber in large pressure vessels called digesters. The process nameis derived from German kraft, meaning strong. It was developed by Carl Dahl in 1884 and now is used for about80% of production volume of paper. Source: Wikipedia.
46See Professor Robert U. Ayres’ lecture in Barcelona, Spain, antalya.uab.es/−
c−
ceambientals/XTEI/curs/-Ayres2.pdf
47Very slow carbon burial occurs on geological time scale.

U.C. Berkeley T. W. PATZEK 41
Thermodynamics: Current energy efficiency of producing cellulosic ethanol is so low that allother investigated paths to liquid biofuels are better, see (Patzek and Pimentel, 2006).
Better Solutions: There is a better way of converting any biomass to synthetic fuels other thanethanol. It is called the Fischer-Tropsch process, and it was discussed in detail in (Patzekand Pimentel, 2006).
9 Summary and Conclusions
This paper has been written in response to the Science Report by Farrell et al. (2006a; 2006c) andthe related gray-literature reports (Wang, 2001; Graboski, 2002; Shapouri et al., 2002; Shapouriand McAloon, 2004).
It has been shown here that the mass and energy calculations in (Farrell et al., 2006a) and, byextension, in (Wang et al., 1997; Wang, 2001; Shapouri et al., 2002; Shapouri et al., 2003; Shapouriand McAloon, 2004), violate the fundamental laws of mass and energy conservation. In particular,Eq. (S-2) in (Farrell et al., 2006c), generates ethanol coproduct energy from nothing. This energycould then be used to drive a Carnot engine (Carnot, 1943), in direct contradiction to the FirstLaw of thermodynamics. In effect, (Farrell et al., 2006a) have constructed a perpetuum mobile ofthe first kind (Hatsopoloulos and Keenan, 1965).
The energy cost of producing and refining carbon fuels in real time, e.g., corn and ethanol, is veryhigh relative to that of fossil fuels deposited and concentrated over geological time. Proper massand energy balances of corn fields and ethanol refineries that account for photosynthetic energy,some of the environment restoration work, and the coproduct energy have been formulated. Thesebalances show that production of ethanol from corn is 2 – 4 times less favorable than productionof gasoline from petroleum. Also, for thermodynamical reasons, ecological devastation wrought bythe real-time industrial biofuel production must be severe.
The main conclusion of this paper is that the United States has already spent enough time,money, and natural and human resources on pursuing the mirage of replacing fossil fuels in aggregate(petroleum + natural gas + coal) with biomass. Better solutions lie on the demand side: limitingconsumption, improving efficiency, consuming more locally, fostering local biofuel production, etc.These solutions are feasible, readily available, and usually ignored.
My thorough critique of cellulosic ethanol schemes will be delivered elsewhere. Here it suffices tosay that (i) the astronomic quantities of cellulosic biomass will never be extractable from ecosystemswithout commensurate fossil fuel subsidies and (ii) the production of cellulosic ethanol from woodis always the poorest energy conversion option in tropical biomass plantations. For a detailedthermodynamic analysis of biomass conversion to energy, including cellulosic ethanol, please seePatzek & Pimentel (2006).
Finally, I believe we need to move the public discussion away from simplistic debate whetherbiofuels are good or bad to the more realistic question: At what level should we be producingbiofuels? I do not think it is zero. Today biofuels replace a very small fraction of transportation fuelsand, unless we are successful in developing cellulose-based fuels (obviously feedstock, environmentaland land use issues have to be addressed here too), this fraction will remain small.
Build to-day, then, strong and sure,
With a firm and ample base;
And ascending and secure
Shall to-morrow find its place.
The Builders by Henry Wadsworth Longfellow
42 The Real Biofuel Cycles
10 Acknowledgements
My work on biofuels receives zero funding. I have received, however, heart-felt support fromhundreds of people of different walks of life: students at Berkeley, Iowa State and many othercampuses, farmers, engineers, community activists, environmentalists, lawyers, scientists, academicteachers, business people, consultants, writers, journalists, and so on. I cannot overstate how muchtheir encouragement has meant to me and I thank them all from the bottom of my heart. Inparticular, I would like to thank my wife, Joanna, for putting up with my being absent almostevery evening and weekend for five weeks. I want to thank Ms. Katie Schwartz, a graduate studentin my group, for programming in pstricks the beautiful schematics of ethanol plant and pyruvatereaction pathways. Many people have provided me with important information; their personalcommunications are acknowledged in the footnotes, and I thank them here again. In particular,I would like to thank Dr. Dmitriy Silin and another person, who wishes to remain anonymous,for their meticulous reviews of the paper manuscript, and significant improvements to its contentand style. Dr. Clayton Radke has zeroed in on Section 5 and made me explain the crucialmass and energy balances so much better. Dr. David Andress has provided an insightful writtencritique of the manuscript, most of which has been incorporated. In addition, Drs. Kamyar
Enshayan, David Hirshfeld, Richard Muller, David Pimentel, and Marvin Scott, andMr. Nathan Hagens, Harry Blazer and Jeff Webster reviewed the manuscript and providedvaluable feedback. Finally, I am very grateful to my cellular biologist son Lucas, currently with theHarvard Medical School, and my freshly minted biochemist daughter Sophie, for carefully editingthe manuscript and providing the final touches.
References
Abbott, M. M. and Van Ness, H. C. 1972, Thermodynamics, McGraw-Hill Book Company, NewYork.
Allison, F. E. 1973, Soil Organic Matter and Its Role in Crop Production, Elsevier, New York.Anonymous 2002a, Handbook for Handling, Storing, and Dispensing E85, National Renewable
Energy Laboratory, U.S. Department of Energy: http://www.nrel.gov/docs/fy02osti/30849.pdf.Anonymous 2002b, Inventory of U.S. Greenhouse Gas Emissions and Sinks: 1990 -
2000, Report EPA 430-R-02-003, U.S. Environmental Protection Agency, Office of At-mospheric Programs, Washington, D.C., http://yosemite.epa.gov/oar/globalwarming.nsf/-UniqueKeyLookup/SHSU5BUM9T/$File/ghg−gwp.pdf.
Anonymous 2003, Public Health Assessment Gopher State Ethanol, City of St. Paul RamseyCounty, Minnesota, Report Under Cooperative Agreement with the Agency for Toxic Sub-stances and Disease Registry, The Minnesota Department of Health, St. Paul, MN 55164-0975,www.health.state.mn.us/divs/eh/hazardous/sites/ramsey/gopher/pha.html.
Berger, J. E. 1984, Encyclopedia of Chemical Processing and Design, Chapt. 20. Ethanol as Fuel:Options, Advantages, Disadvantages to Exhaust Stacks, Cost, pp 1–11, Marcel Dekker, Inc.,New York.
Berthiaume, R., Bouchard, C., and Rosen, M. A. 2001, Exergetic evaluation of the renewability ofa biofuel, Exergy Int. J. 1(4): 256–68.
Bossel, U. 2003, Well-to-Wheel Studies, Heating Values, and the Energy Conservation Principle,Technical report, European Fuel Cell Forum, Morgenacherstrasse 2F, CH-5452 Oberrohrdorf,Switzerland, http://www.efcf.com.
Brinkman, N. D., Gallopoulos, N. E., and Jackson, M. W. 1975, Exhaust emissions, fuel econ-
U.C. Berkeley T. W. PATZEK 43
omy, and driveability of vehicles fueled with alcohol-gasoline blends, No. 750120, Society ofAutomotive Engineers.
Carnot, S. 1943, Reflections on the Motive Power of Heat and on the Machines Fitted to DevelopThis Power, The American Society of Mechanical Engineers, New York.
Castorph, D., Kollera, M., and Waas, P. 1999, Brennwert und Heizwert (The High and LowHeating Values), Technical report, Fachhochschule Munchen, FB 03, Dachauer Straße 98 b,80335 Munchen, http://www.fm.fh-muenchen.de/labore/waas/skripten/kap11.pdf.
Crawford, R. L. 1981, Lignin biodegradation and transformation, John Wiley and Sons, New York,http://www.ac.wwu.edu/∼stephan/malthus/malthus.0.html.
Dawes, I. and Large, P. J. 1982, Biochemistry and Bacterial Growth, Chapt. Class 1 reactions:Supply of carbon skeletons, pp 125–158, Blackwell, Oxford.
de Oliveira, M. E. D., Vaughan, B. E., and Rykiel, E. J. 2005, Ethanol as fuel: Energy, carbondioxide balances, and ecological footprint, Bioscience 55(7): 593–602.
Domalski, E. S., Jobe Jr., T. L., and Milne, T. A. (eds.) 1987, Thermodynamic Data for BiomassMaterials and Waste Components, The American Society of Mechanical Engineers, UnitedEngineering Center, 345 East 47th Street, New York, N.Y. 10017.
Eckhoff, S. R., Singh, K., Zehr, B. E., Rausch, K. D., Fox, E. J., Mistry, A. K., Haken, A. E., Niu,Y. X., Zou, S. H., Buriak, P., Tumbleson, M. E., and Keeling, P. L. 1996, A 100g laboratorycorn wet milling procedure, Cereal Chemistry 73: 54–57.
Farrell, A. E., Plevin, R. J., Turner, B. T., Jones, A. D., O’Hare, M., and Kammen, D. M. 2006a,Ethanol can contribute to energy and environmental goals, Science 311: 506–508.
Farrell, A. E., Plevin, R. J., Turner, B. T., Jones, A. D., O’Hare, M., and Kammen, D. M. 2006b,Science Letters – Response, Science 312: 1747–1748.
Farrell, A. E., Plevin, R. J., Turner, B. T., Jones, A. D., O’Hare, M., and Kammen, D. M. 2006c,Supporting Online Material, www.sciencemag.org/cgi/content/full/311/5760/506/DC1.
Gale, T. 2006, Turning off the taps; The Great Plains. (The water may run out), Article 378.8464,14 Feb., The Economist (US), Expanded Academic ASAP.
Gaston, L. L. 1955, The unity of knowledge, The Columbia University Bicentennial ConferenceSeries, Doubleday, Garden City, NY.
Georgescu-Roegen, N. 1971, The Entropy Law and the Economic Process, Harvard UniversityPress, Cambridge, Massachusetts.
Good, N. E. and Bell, D. H. 1980, The Biology of Crop Productivity, Chapt. Photosynthesis, PlantProductivity and Crop Yield, pp 3–50, Academic Press, Inc., New York.
Graboski, M. S. 2002, Fossil Energy Use in the Manufacture of Corn Ethanol, Report preparedfor the National Corn Growers Association, Colorado School of Mines.
Hall, C. A. S. and Day, J. W. (eds.) 1977, Ecosystem Modeling in Theory and Pactice: AnIntroduction with Case Histories, John Wiley & Sons, New York.
Hatsopoloulos, G. and Keenan, J. 1965, Principles of General Thermodynamics, John Wiley &Sons, New York.
Ho, M.-W. and Ulanowicz, R. 2005, Sustainable systems as organisms?, Biosystems 82: 39 – 51.Howarth, R. W. 2000, Nutrient pollution of coastal rivers, bays, and seas, Issues in Ecology 7.Howarth, R. W., Boyer, E. W., Pabich, W. J., and Galloway, J. N. 2002, Nitrogen use in the United
States from 19612000 and potential future trends, Ambio 31(2): 88 – 96.Joos, D. 2005, Variety Testing, Department of Crop Sciences, 2008 South Wright St., Urbana, IL
61801, http://vt.cropsci.uiuc.edu/corn.html.Kaharabata, S. K., Schuepp, P. H., and Desjardins, R. L. 2000, Estimating methane emissions from
dairy cattle housed in a barn and feedlot using an atmospheric tracer, Environmental Science& Technology 34(15): 3296–3302, http://dx.doi.org/10.1021/es990578c.

44 The Real Biofuel Cycles
Kimbrell, A. (ed.) 2002, Fatal Harvest: The Tragedy of Industrial Agriculture, Island Press,Washington.
Kimbrell, A. (ed.) 2003, Fatal Harvest: The Tragedy of Industrial Agriculture, Foundation for DeepEcology, New York.
Lemon, E. R. 1960, Photosynthesis under field conditions II. An aerodynamic method for deter-mining the turbulent carbon dioxide exchange between the atmosphere and a corn field, Agron.J. 52: 697–703.
Lide, D. R. (ed.) 1994, CRC Handbook of Chemistry and Physics, CRC Press, Boca Raton, FL, 75edition.
Meter, K. 2005, Black Hawk County (Iowa) Region’s Food & Farm Economy, Web:www.crcworks.org/blackhawksum.pdf, Crossroads Resource Center, P.O. Box 7423, Minneapo-lis, Minnesota 55407, Tel: 612.869.8664.
Miller, D. F. 1958, Composition of Cereal Grains and Forages, National Academy of Sciences –National Research Council, Washington, D. C..
Morris, D. 2005, The Carbohydrate Economy, Biofuels and the Net Energy Balance, Web report,www.ilsr.org, (24 pages), Institute for Local Self-Reliance, Washington, D.C..
Morris, D. and Ahmed, I. 1992, How Much Energy Does it take to Make a Gallon ofEthanol?, Monograph (8 pages), Institute for Local Self-Reliance, Washington, D.C., Updatespublished at http://www.carbohydrateeconomy.org/library/admin/uploadedfiles/How−Much−-Energy−Does−it−Take−to−Make−a−Gallon−.html.
Musgrave, R. B. and Moss, D. N. 1961, Photosynthesis under field conditions I. A portable, closedsystem for determining net assimilation and transpiration of corn, Crop Sci. 1: 37–41.
Odum, E. 1998, Ecological Vignettes – Ecological Approaches to Dealing with Human Predicaments,Hardwood Academic Publishers, Amsterdam.
Patzek, T. W. 2004, Thermodynamics of the corn-ethanol biofuel cycle, Critical Reviews in PlantSciences 23(6): 519–567, An updated web version is at http://petroleum.berkeley.edu/papers/-patzek/CRPS416-Patzek-Web.pdf.
Patzek, T. W., Anti, S.-M., Campos, R., Ha, K. W., Lee, J., Li, B., Padnick, J., and Yee, S.-A.2005, Ethanol from corn: Clean renewable fuel for the future, or drain on our resources andpockets?, Environment, Development & Sustainability 7: 319 – 336.
Patzek, T. W. and Pimentel, D. 2006, Thermodynamics of energy production from biomass, CriticalReviews in Plant Sciences 24(5–6): 329–364, Available at http://petroleum.berkeley.edu/-papers/patzek/CRPS-BiomassPaper.pdf.
Paulsen, M. R., Mbuvi, S. W., Haken, A. E., and B. Ye, R. 2003, Extractable starch as a qualitymeasurement of dried corn, Applied Engineering in Agriculture 19: 211–217.
Pimentel, D. 1996, Food, Energy, and Society, University Press of Colorado, Niwot, CO.Pimentel, D. 2006, Soil erosion: A food and environment threat, Environment, Development &
Sustainability 8: 119–137.Pimentel, D., Harvey, C., Resosudarmo, P., Sinclair, K., Kurtz, D., McNair, M., Crist, S., Spritz,
L., Fitton, L. Saffouri, R., and Blair, R. 1995, Environmental and economic costs of soil erosionand conservation benefits, Science 267(24 Feb.): 1117 – 1123.
Pimentel, D. and Patzek, T. W. 2005, Ethanol production using corn, switchgrass, and wood;biodiesel production using soybean and sunflower, Natural Resource Research 14(1): 67–76,Available at http://petroleum.berkeley.edu/papers/patzek/CRPS-BiomassPaper.pdf.
Planck, M. 1926, Treatise on Thermodynamics, Dover Publications, Inc., New York, 3 edition,1945 Dover Reproduction.
Scavia, D., Rabalais, N. N., Turner, R. E., Justic, D., and W. J. Wiseman, J. 2003, Predictingthe response of gulf of mexico hypoxia to variations in mississippi river nitrogen load, Limnol.
U.C. Berkeley T. W. PATZEK 45
Oceanogr. 48(3): 951–956.Schneider, B. H. and Spraque, G. F. 1955, Corn and Corn Improvement, Academic Press, New
York.Shapouri, H., Duffield, J. A., and Wang, M. 2002, The Energy Balance of Corn Ethanol: An Update,
Agricultural Economic Report No. 814, U.S. Department of Agriculture, Economic ResearchService, Office of the Chief Economist, Office of Energy Policy and New Uses, Washington,D.C..
Shapouri, H., Duffield, J. A., and Wang, M. 2003, The energy balance of corn ethanol revisited,Trans. ASAE 46(4): 959–968.
Shapouri, H. and McAloon, A. 2004, The 2001 net energy balance of corn ethanol, Report,USDA, Washington, D.C., Also presented as a conference paper by H. Shapouri, A. McAloon,and M. Wang, Corn Utilization and Technology Conference, June 7–9, 2004, Indianapolis, IN,www.usda.gov/oce/reports/energy/index.htm.
Sheehan, J., Camobreco, V., Duffield, J., Graboski, M., and Shapouri, H. 1998, Life Cy-cle Inventory of Biodiesel and Petroleum Diesel for Use in an Urban Bus, Final Re-port NREL/SR-580-24089, National Renewable Energy Laboratory, Golden, Colorado 80401,www.nrel.gov/docs/legosti/fy98/24089.pdf.
Slesser, M. (ed.) 1974, Energy Analysis Workshop on Methodology and Conventions, The NobelHouse, Stockholm, Sweden, International Federation of Institutes for Advanced Study.
Slesser, M. (ed.) 1975, Workshop on Energy Analysis and Economics, Lidingo, Sweden, Interna-tional Federation of Institutes for Advanced Study.
Smil, V. 1985, Carbon – Nitrogen – Sulfur – Human Interferences in Grand Biospheric Cycles,Plenum Press, New York and London.
Smil, V., Nachman, P., and Long II, T. V. 1983, Energy Analysis and Agriculture – An Applicationto U.S. Corn Production, Westview Press, Boulder, Co..
Spiers, H. M. 1961, Technical Data on Fuel, The British National Committee, World PowerConference, 201 Grand Buildings, Trafalgar Square, London WC2, 6 edition.
Spreng, D. T. 1988, Net-Energy Analysis and the Energy Requirements of Energy Systems, Praeger,New York.
Stevenson, F. J. 1982, Humus chemistry. Genesis, composition, reactions, John Wiley & Sons,New York.
Stodola, A. 1927, Steam and Gas Turbines with the Supplement on the prospects of the thermalprime mover, McGraw-Hill Book Company, Ltd., New York, 1 edition, Two volumes, authorizedtranslation of the sixth German edition.
Szargut, J., Morris, D. R., and Steward, F. R. 1988, Exergy analysis of thermal and metallurgicalprocesses, Hemisphere Publishing Corporation, New York.
Taiz, L. and Zeiger, E. 1998, Plant Physiology, Sinauer Associates, Inc., Publishers, Sunderland,Massachusetts, 2 edition.
Tegtmeier, E. M. and Duffy, D. 2004, External costs of agricultural production in the United States,Int. J. Agricultural Sustainability 2(1): 1–20.
Ulanowicz, R. E. and Hannon, B. M. 1987, Life and the production of entropy, Proc. Royal Soc.London. Series B, Biological Sci. 232(1267): 181–192.
Wang, M. 2001, Development and use of GREET 1.6 fuel-cycle model for transporation fuelsand vehicle technologies, Technical Report ANL/ESD/TM-163, Argonne National Laboratory,Center for Transportation Research, Argonne, IL 60439.
Wang, M., Saricks, C., and Wu, M. 1997, Fuel-cycle fossil energy use and greenhouse gas emissionsof fuel ethanol produced from U.S. Midwest corn, Report sponsored by the Illinois Departmentof Commerce and Community Affairs, Argonne National Laboratory, Center for Transportation

46 The Real Biofuel Cycles
Research, Argonne, IL 60439.White, P. J. and Johnson, L. A. (eds.) 2003, Corn Chemistry and Technology, American Association
of Cereal Chemists.Wright, F. B. 1994, Distillation of alcohol and de-naturing, Lindsay Publications, Bradley, IL, 2
edition.
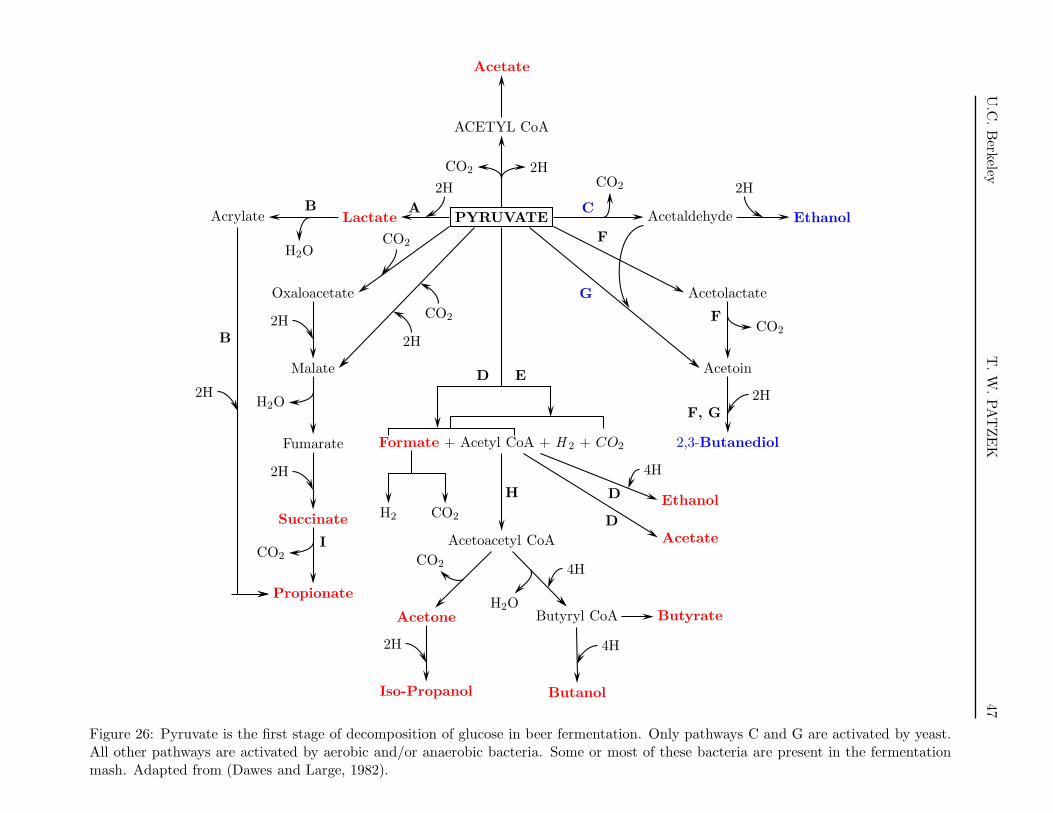
U.C
.B
erkeleyT
.W
.PAT
ZE
K47
PYRUVATE
ACETYL CoA
2HCO2
Acetate
Lactate
2H
AAcrylate
H2O
B
Oxaloacetate
CO2
Malate
2H
2H
CO2
Fumarate
H2O
Succinate
2H
Propionate
CO2I
2H
B
Acetaldehyde
CO2
CEthanol
2H
Acetolactate
F
Acetoin
CO2F
G
2,3-Butanediol
2HF, G
D E
Formate + Acetyl CoA + H 2 + CO2
H2 CO2
Ethanol
4H
D
AcetateD
Acetoacetyl CoA
H
Acetone
CO2
Butyryl CoA
4H
H2OButyrate
Butanol
4H
Iso-Propanol
2H
Figure 26: Pyruvate is the first stage of decomposition of glucose in beer fermentation. Only pathways C and G are activated by yeast.All other pathways are activated by aerobic and/or anaerobic bacteria. Some or most of these bacteria are present in the fermentationmash. Adapted from (Dawes and Large, 1982).

48T
he
Rea
lB
iofu
elC
ycl
es
The process of makingethanol starts here
Whole CornHammer Mill
Fresh Water &4 Recycled Water
Sources
Slurry Tank
Jet Cooker
Steam
Liquefaction
Mash Cooling
FermentationYeast
Enzymes
CO2
Beer
DistillationSystem
190Proof
Ethanol
Molecular Sieves200 ProofEthanol
200 ProofDenaturedEthanol Fi-nal Product
5% Gasoline
Centrifuge
WholeStil-lage
ThinStil-lage
Condensate
Syrup
Wet Grain
Drum Dryer
DDGS Fi-nal Product
Figure 27: Schematic of a dry grind corn ethanol plant. Note that after starch hydrolysis (liquefaction) to glucose, the solid part of cornmash and oil could be physically separated from the glucose liquor, and go straight to the centrifuge and drying. Therefore, at best, theco-product energy minus the energy cost of obtaining these coproducts, could be subtracted from the input grain energy.