Embed Size (px)
Citation preview

The Real Winner’s Curse∗
Leopoldo Fergusson† Pablo Querubin‡
Nelson A. Ruiz-Guarin§ Juan F. Vargas¶
December 15, 2016
Abstract
We study the unintended consequences of political inclusion in a context of weak insti-tutions. Using a regression discontinuity approach, we show that the narrow election ofpreviously excluded leftist parties to local executive office in Colombia results in an almostone-standard-deviation increase in violent attacks by right-wing paramilitaries, more thantripling the sample mean. We interpret this surge in violence as a de facto reaction of tra-ditional political and economic elites, who seek to offset the increase in outsiders’ de jurepolitical power. Consistent with this interpretation, we find that other types of violence areunaffected, and that levels of violence are not influenced by the victory of right-wing partiesin close elections. Moreover, we show that the surge in paramilitary violence is concentratedin the year of the next election, which gives left-wing parties a large incumbency disadvan-tage in Colombia. Our findings highlight the dangers of broadening political inclusion inthe absence of efforts to strengthen other institutional dimensions. Open elections that arenot complemented by checks and balances to prevent the disproportional accumulation ofpolitical power by some groups in society may have unintended negative consequences.
JEL Codes: O12, D02, and D74.Keywords: Democracy, elections, political inclusion, violence, regression discontinuity.
∗For their helpful comments, we thank Juan Carlos Angulo, Tim Besley, Catherine Boone, Laura Bronner,Adriana Camacho, Ernesto Dal-Bo, Emilio Depetris, Guadalupe Dorna, Juan Dubra, Marcela Eslava, Clau-dio Ferraz, Jean-Paul Faguet, Xavier Freixas, Sebastian Galiani, Francisco Gallego, Jenny Guardado, FrancesHagopian, Dominik Hangartner, Daniel Hidalgo, Marc Hofstetter, Oskar Nupia, Rafael Santos, Jose Tessada,Santiago Tobon, Hernan Vallejo, Diana Weinhold, and participants at the Brown “Violence: Processes, Re-sponses, & Alternatives” Workshop, CEDE-Universidad de los Andes Weekly Seminar, Universidad del Rosario,Universidad Catolica de Chile, Forum Ridge-Lacea Political Economy, Harvard-DRCLAS Tuesday Seminar Se-ries, Harvard Political Economy Graduate Workshop, LSE’s Political Science Work in Progress Seminar, LSEPolitical Economy and Public Policy Workshop, LSE’s Research Seminar in International Development, MIT’sLatin American Working Group, MPSA Annual Meetings 2016, NEWEPS 2016, the NYU Graduate PoliticalEconomy Seminar, and the 6th Annual Conference of the Al Capone network. Juan Carlos Angulo, JulianaAragon, Carmen Delgado, Francisco Eslava, Diego Martın, and Juan Camilo Mejıa provided superb researchassistance. Ruiz-Guarin gratefully acknowledges UNU-WIDER for its support.†Facultad de Economıa, Universidad de los Andes. Calle 19A No. 1-37 Este Bloque W, Bogota, Colombia.
Tel: +57 1 339-4949 Ext 2439, Email: [email protected]‡The Wilf Family Department of Politics, New York University. 19 W 4th Street, Room 208, New York, NY
10012. Tel: +1 212 992 6525, Email: [email protected]§International Development Department, London School of Economics and Political Science. 6-8th
Floors, Connaught House, Houghton Street, London WC2A 2AE. Tel: +44 (020) 7955 6565, Email:[email protected]¶CAF-Development Bank of Latin America and Facultad de Economıa, Universidad del Rosario. Casa Pedro
Fermın, Calle 12C No. 4-59, Bogota, Colombia 110321. Tel: +57 1 297-0200, Email: [email protected] &[email protected]

1 Introduction
In many countries, despite the presence of nominally democratic institutions, some political
groups remain largely excluded from formal political power. De facto barriers include fraud,
clientelism, uneven access to economic resources, violence, and legal constraints on political
participation. Yet in spite of these barriers, traditionally excluded groups may succeed in
winning elections and entering the political system. What happens when these outsiders gain
formal political power?
One possibility is that giving excluded groups a voice and a stake in the political process
strengthens democracy and promotes political stability. However, another likely implication
is that, faced with electoral defeat by outsiders, powerful political elites who have previously
enjoyed a monopoly over access to power will feel that their interests are threatened. Where de
jure institutions such as elections fail to favor the more powerful groups in society, these groups
may strengthen their emphasis on de facto means of avoiding policy change and preventing
other groups from gaining formal power (Acemoglu & Robinson, 2008). Moreover, in weakly
institutionalized environments in which political power is concentrated in a few hands, this may
help explain the relatively mild or null effects of democratic reforms on economic policies and
other political and economic outcomes (Mulligan, Gil, & Sala-i Martin, 2004). As long as the
underlying distribution of power remains unchanged, traditional political elites may prevent
these reforms from having the intended effect.
This paper examines elite responses to previously excluded (left-leaning) groups gaining local
representation in Colombia by winning mayoral elections. Traditional elites have responded with
the most direct form of de facto power: violence. We assess whether the victory of left-leaning
parties in mayoral elections (1) generates (or exacerbates existing) violence and (2) if so, if this
prevents non-traditional groups from attaining political power in the future.
Colombia is an ideal setting in which to study this question. Following a legacy of power-
sharing agreements between the Liberal and Conservative parties (which are described in more
detail in Section 2), Colombia introduced local elections in the late 1980s to open up the political
system and broaden access to power to formerly excluded groups. These reforms included the
introduction of single plurality rule elections to select municipal mayors; they were previously
appointed by one of the two traditional parties. A new constitution enacted in 1991 further
weakened the dominance of traditional parties. While the left remained a political minority,
some of its candidates were elected to local offices like mayoral posts and municipal councils,
which represented an important change in the local political arena. The new parties began
advocating different policy preferences than those of traditional parties, including a stronger
emphasis on redistribution, communal property rights, land reform, and vindication of peasant
rights. Moreover, competitive elections took place in the midst of a decades-long violent conflict
between left-wing guerrillas, the government, and right-wing paramilitary militias organized by
local elites to fight the guerrillas.
To study the effect of left-wing victories on violence, we use a regression discontinuity design
(RDD) based on close elections and compare municipalities in which the left narrowly won vs.
narrowly lost the mayoral race. To document the validity of our RDD approach, we show
balance across a wide range of political and socio-economic characteristics in municipalities in
2

which the left either won or lost by a small margin. We also show that left-wing candidates are
no more or less likely to win very close races than candidates from other parties, which confirms
that the outcome of the elections resembles a coin toss.
Our results show that a narrow left-wing victory leads to up to 6.8 additional yearly attacks
per 100, 000 inhabitants by right-wing paramilitary groups during the subsequent government
term. This effect is large: it is equivalent to almost one standard deviation and over three
times the sample mean. Importantly, we do not find a significant surge in violence when other
(non-left-wing) parties win by a small margin. Furthermore, we show that left-wing parties
suffer from an incumbency disadvantage that is almost six times larger than that experienced
by other parties in Colombia (which has been documented by Klasnja and Titiunik (in press)).
Several additional findings support our interpretation that paramilitary attacks following
left-wing victories form part of a deliberate strategy by local elites to offset (via de facto meth-
ods) the political power gained by the left through institutional means. For instance, consistent
with the idea that traditional elites incite violence in order to prevent left-wing groups from
increasing their representation in local government, we show that the increases in levels of vio-
lence are concentrated around the time of the subsequent local election. Moreover, we find that
this effect becomes much weaker after 2006, when paramilitary groups signed a peace deal with
the government and demobilized. While splinter criminal bands continued to engage in violent
acts after 2006, violence has been less politically motivated since then.
Ruling out some alternative interpretations of our results, we find no comparable increase
in paramilitary (or any type of) violence in the period before narrow victories by left-wing
candidates. Similarly, we find no changes in violence perpetrated by groups other than right-
wing paramilitaries after narrow victories by the left. Thus, our results do not seem to reflect
pre-existing trends in violence or an increase in overall violence in constituencies where the left
wins. Nor does increased violence appear to be a reaction to corruption or poorer performance
by leftist mayors while in office. We do not find that left-leaning parties are involved in more
corruption investigations or convictions than other parties, or that their administrations exhibit
worse governance indicators.
Our results are consistent with anecdotal and case study evidence (which we present in
detail in Section 8) that left-wing political activists have often been the target of paramilitary
groups following left-wing victories. We show that these patterns of violence against the general
population and party activists in areas where the left wins local elections are systematic and
do not represent isolated incidents. Moreover, it demonstrates that this violence is perpetrated
with the goal of preventing policy change and thwarting future electoral victories by the left.
The paper is related to several strands of literature. First, it is closely associated with the
literature on “subnational authoritarianism” (e.g. Gibson, 2005, 2014; Giraudy, 2010; Sidel,
2014). The patterns of violence that we document are consistent with elites using “boundary
control” strategies to maintain control over their local authoritarian enclaves following the
national democratization reforms in Colombia in the late 1980s (Gibson, 2014).
As noted above, our purported mechanism of informal control also provides evidence in line
with Acemoglu and Robinson’s (2008) idea that, when operating in weak institutional settings,
elites may react to a loss in de jure power by investing in de facto methods to avoid substantial
3
changes in equilibrium institutions and policies. Bandiera and Levy (2011) provide suggestive
evidence of the potential relevance of de facto power for the political equilibrium by showing
that in Indonesia, policy is tilted towards the elites in areas where the poor population is
more ethnically diverse and therefore has a harder time organizing against the elites’ potential
influence. Bruce and Rocha (2014) show that after democratization in Brazil in the 1980s,
turnout patterns were consistent with illiterate voter manipulation by elites aligned with the
former dictatorship. Yet, few papers have studied what is perhaps the most obvious (and
potentially damaging) form of de facto power: outright political violence. Fergusson, Vargas,
and Vela (2013) is an exception. They study the use of violence in the form of electoral coercion
by paramilitaries following media scandals affecting their preferred candidates. Here, we instead
study violent reactions to the election of formerly excluded groups that threaten the interests
of traditional elites.
This reaction by elites is particularly important, as it constitutes a response to democra-
tization reforms – i.e., the introduction of local elections to broaden access to formal political
power. While we study the effect of formerly excluded groups gaining access to power rather
than the introduction of elections per se, our results also relate to the literature on elections and
violence. Elections are said to provide an “antidote to international war and civil strife” (Bill
Clinton, 1994, in J. L. Snyder (2000)). Scholars have emphasized several mechanisms via which
elections may lead to a reduction in violence: the preferences of the opposition receive attention
as part of the political debate, which reduces their incentives to revolt (Regan & Henderson,
2002); they create a path to power that is less costly than violence (Davenport, 2007); elites can
credibly commit to future redistribution when policy concessions are insufficient to persuade
excluded groups not to revolt (Acemoglu & Robinson, 2006); and increasing the legitimacy of
the incumbent government undermines revolts (Kurzman, Werum, & Burkhart, 2002). But by
creating winners and losers, elections may increase incentives for violent behaviors that could
otherwise be avoided, for example, by power-sharing agreements. As Chacon, Robinson, and
Torvik (2011) put it, the key issue is the conditions under which losers will peacefully relinquish
power. Eifert, Miguel, and Posner (2010) also show that political competition may exacerbate
(ethnic) identities, which represent another source of conflict. Despite the conflicting theoreti-
cal effects, several authors suggest that elections and “democratic transitions” nurture violence
(Huntington, 1991; Horowitz, 1993; Sahin & Linz, 1995; Casper & Taylor, 1996; J. Snyder,
2000); fewer find results in the opposite direction (e.g. Davenport, 1997; Fergusson & Vargas,
2013). Our paper shows that the effect of introducing elections on violence is conditional on the
identity of the winner: when traditional incumbent elites lose elections, they resort to violence
to prevent policy changes and regain political power in the future.
While our empirical evidence focuses on the case of Colombia, our argument and empirical
findings have wider external relevance. Increases in violence after previously excluded groups
are newly elected to office have been observed at the national level across the world: in Egypt,
when the Muslim Brotherhood came to power and enacted very different policies – including
redrafting the constitution – this triggered increased violence and a coup. Similarly, when
Haiti transitioned from dictatorship to democracy in 1990, Jean Bertrand Aristide, a priest
representing a new group in politics, won the election. Aristide proposed several reforms, such as
4

a military under civilian control and much more redistribution. These policies generated violent
reactions from the old elite, which culminated in a violent military coup in 1991 (Collins Jr &
Cole, 1996). While these examples suggest that political inclusion has a potentially destabilizing
effect when groups with very different policy preferences have access to power, it is hard to
determine whether the political inclusion of a formerly excluded group was what caused the
increase in violence. Our study allows us to address this causal question more systematically.
Finally, our paper also relates to the literature on the incumbency (dis)advantage. While
Gelman and Huang (2008) claim that “incumbency advantage is one of the most widely studied
features in American legislative elections” (p. 437), an incumbency curse or disadvantage has
been documented in other settings, mostly in developing countries, which are often characterized
by weak parties and politicians’ incentives to use local office opportunistically (Roberts, 2008;
Uppal, 2009; Klasnja & Titiunik, in press; Klasnja, 2015). Our findings point to the de facto
reaction of elites as a complementary explanation for the incumbency disadvantage of some
parties in weakly institutionalized democracies.
The remainder of the paper is organized as follows. Section 2 discusses the general context
and describes the history of local elections in Colombia. Section 3 presents our empirical
strategy and data. In Section 4 we present our main result: the election of a left-leaning
mayor in Colombia leads to increased violence in his or her constituency perpetrated by right-
wing paramilitary groups. This section also reports some basic robustness checks and validates
the underlying assumptions of our empirical approach. In Section 5 we address and rule out
alternative interpretations of our results. Section 6 provides evidence to support our preferred
interpretation of the reasons behind the increase in violence following left-wing victories. In
Section 7 we document the consequences of the surge in violence after the electoral success of
left-wing parties. In Section 8 we discuss some anecdotal evidence, and in Section 9 we conclude
and discuss the implications of our findings and contribution.
2 Context: Local elections in Colombia’s political landscape
Figure 1 provides a brief outline of Colombia’s recent political history. Colombian politics were
dominated by the Liberal and Conservative parties from independence until the late 20th century
(Bushnell, 1993). Inter-party violence was widespread during that time, and reached its height
between 1948 and 1953 in a period known as La Violencia. In order to pacify the country, both
parties agreed to the Frente Nacional (National Front) deal, which included alternating the
presidency every four years between 1958 and 1974, and ensuring parity in party representation
in all government bodies.1
The National Front blurred the ideological line dividing the two main parties and consoli-
dated a highly clientelistic system of political exchange. There were relatively few differences in
the socio-economic origins of supporters of both parties, which were ultimately seen as agents of
different factions of economic elites (Leal-Buitrago & Davila, 1990; Davila, 1992, 1999). Indeed,
the National Front openly excluded other political movements from national and local political
1This parity agreement was facilitated by the prevailing local electoral rules. Up until 1988, municipal mayorswere appointed by departmental governors, who were themselves appointed by the president.
5
processes. Among the excluded groups, peasants, workers and others ideologically aligned with
the left stood out, and some of their most important demands, in particular land reform, were
attempted but always failed under an elite-friendly National Front (Safford & Palacios, 2002,
Chapter 14). The traditional parties more closely represented the interests of the landed elites,
who were ideologically closer to the right. Bipartisan dominance persisted after the National
Front formally ended in 1974, and only collapsed in the late 1980s and early 1990s with the
adoption of the 1986 electoral reforms and the enactment of the 1991 constitution.
The absence of political opportunities for outsiders, combined with the lack of state presence
in the Colombian periphery and the survival of Liberal rural guerrillas from La Violencia, led
to the formation of left-leaning guerrilla movements in the early 1960s (Bushnell, 1993), the
most powerful of which was the Armed Revolutionary Forces of Colombia (Fuerzas Armadas
Revolucionarias de Colombia – FARC), which is still active today (although currently on the
verge of demobilization following the signing of a peace agreement with the government).2 In the
late 1970s, to finance their activities the FARC and other guerrilla movements began kidnapping
and extorting wealthy individuals, particularly landowners. Some of these landlords were also
involved in the illegal drug industry and, while they fought the state as a result of their illegal
activities, their interest in fighting the guerrillas overlapped with that of the traditional economic
elite. This precipitated the creation of paramilitary self-defense militias, which in many cases
operated with at least the implicit complacency of the national army, local politicians, and the
local elite (Dudley, 2004; Duncan, 2007; Gutierrez-Sanin & Baron, 2005; Gutierrez-Sanin, 2008;
Acemoglu, Robinson, & Santos, 2013).
By the early 1980s the Colombian state’s legitimacy was at stake: there were few political
options for third parties, violence in rural areas, and repression of left-leaning supporters by
the government of Julio Cesar Turbay, from 1978 to 1982 (Bushnell, 1993; Centro Nacional
de Memoria Historica, 2013). This situation motivated the government of Belisario Betancur
(1982-1986) to negotiate with insurgents. As part of the peace talks, and to signal a credible
opening of the country’s democratic system, the electoral system was reformed to allow the
direct election of local mayors by simple plurality rule (Maldonado, 2001). This reform sought
precisely to give voice to excluded groups, especially the traditionally excluded left. It became
effective with the first local elections in 1988. The 1991 constitution further consolidated the
opening of the political system and increased resources and devolved responsibilities to local
governments.3
The reform allowed left-leaning groups that had been historically excluded – such as groups
of peasants, union workers, and other political outsiders – to participate in local elections. As
part of the peace negotiations with the government, the FARC created its own political party,
the Union Patriotica (UP), thus combining “all forms of struggle” – ballots and guns. Initially
the UP openly supported and received support from the FARC, and some FARC members
2Other guerrillas include the still-active National Liberation Army (Ejercito de Liberacion Nacional – ELN),and the Movimiento 19 de Abril or M-19, which demobilized shortly before the 1991 constitution and participatedas a political party in the Constitutional Assembly.
3The 1991 constitution allowed citizens to collect signatures to either run independently without the supportof any party, or to create a new party. In addition, public financing (proportional to the number of votes) andaccess to television was granted to all political parties. These reforms facilitated the creation of third parties andmade politics more competitive.
6

participated in politics. This generated widespread criticism from different sectors of Colombian
society and forced the UP to distance itself from the FARC, which reacted in turn by kidnapping
several top UP politicians (Dudley, 2004). By the early 1990s most of the UP hardliners in favor
of armed struggle had left the party and most of its remaining members openly criticized the
FARC, but many outsiders conflated the FARC and the UP, which led to the assassination of
UP supporters: two presidential candidates, eight congressmen, 13 deputies, 70 councilmen, 11
mayors, and thousands of militants were killed (Centro Nacional de Memoria Historica, 2013,
pg. 142).4 Referring to violence against the UP, Leal-Buitrago and Davila (1990) note that
“facing any political movement representing a challenge to the status quo, the long-standing
state weakness induced informal and illegal mechanisms to defend the system” (p. 85), which
resonates with our results and interpretation. These illegal and informal mechanisms represent
de facto elite reactions in their most extreme form: violence against left-leaning parties that
had recently begun to compete for local office.
The Colombian context we study is therefore characterized by three main features: (1) the
declining importance of traditional parties, which had been largely stripped of their ideological
differences and legitimacy with the signing of the National Front agreement, with a resulting
heavy reliance on clientelism, (2) (left-leaning) political groups gaining access to the local polit-
ical arena for the first time, and (3) the presence of both left- and right-wing violence in various
parts of the country.
The distinction between these two types of violence is important. Left-wing guerrillas are
clearly anti-establishment, and question the legitimacy of Colombia’s democracy. The FARC,
which was responsible for most of the violence in the period under study, emphasized the
peasant struggle against landowners. Right-wing paramilitaries, however, colluded with the
establishment, especially the army and local land-owning elites. In 1997, splinter paramilitary
groups joined forces under an umbrella organization called Autodefensas Unidas de Colombia
(AUC), which had clear political connections and goals. Its leaders signed a secret pact in 2001
in which politicians (including state governors and members of Congress) called for an explicit
role for the AUC in electoral politics. Their objectives were to strengthen the agrarian model
of large landholdings and to use violence and intimidation to protect regional elites from social
and political opposition (Centro Nacional de Memoria Historica, 2013, pg. 170).5
The distinction between left- and right-wing violence also helps explain the focus of our
empirical investigation on the violent response of right-wing paramilitary groups to the local
electoral victories of left-wing politicians. The left was the main outsider group to gain access to
local executive power after the introduction of mayoral elections. The right, even in its extreme
and violent versions like the paramilitary militias, mingled with the traditional elites and sought
to play an active role in electoral politics (Acemoglu et al., 2013).
This is thus an ideal setting in which to evaluate elites’ de facto responses to traditional
4Steele (2011) studies the Uraba region in northwest Colombia and shows that residents of urban neigh-borhoods that voted for the UP in local elections were selectively targeted by paramilitary groups and thusmore likely to flee after the elections than residents of similar neighborhoods where the UP was less successfulelectorally.
5Most of the AUC demobilized in 2005 and 2006, following peace talks that started in 2003 under PresidentAlvaro Uribe. However, remnant paramilitary groups persist to date.
7

outsiders gaining de jure access to power. While in principle increased violence from the left
could have occurred in response to right-wing electoral victories, particularly in places with a
strong guerrilla presence, the two situations are not entirely symmetrical: political exclusion
affected only the left; the right had a comparative advantage in exercising de facto power with
institutional acquiescence. Indeed, as we document below, we find no comparable systematic
increase in violence when the right wins local elections by a narrow margin.
3 Empirical strategy and data
3.1 Left-wing electoral victories and violence: a regression discontinuity ap-
proach
The electoral victory of a left-wing candidate is plausibly correlated with a wide range of
municipal-level socio-economic characteristics. Thus, a naive comparison of violent attacks
across municipalities with and without newly elected left-wing mayors may confound the effect
of other local characteristics. In order to address this problem, we use an RDD approach based
on close elections. Specifically, we compare municipalities in which a left-wing candidate won a
mayoral election by a narrow margin with those in which a left-wing candidate was the runner-
up and lost by a narrow margin.6 The underlying identification assumption is that the outcome
of very close elections is as good as random, and thus municipalities in which a left-wing can-
didate wins or loses by a narrow margin are similar across other characteristics, except for the
ideological leaning of the winner.
Our empirical approach therefore focuses on the sample of races in which the left-wing
candidate either wins or comes second. Focusing on these candidates, let Xit be the win margin
defined as the vote share of the left-leaning candidate minus the vote share of the non-left
candidate. The vote share is computed as a fraction of the total number of votes obtained by
the top two candidates in the race. Then, we define our “treatment” as Lit = 1 if Xit > 0
and Lit = 0 if Xit < 0. We focus on the set of races in which Xit is “small” in absolute value
(smaller than a bandwidth h), in the sense that the outcome of such races can be considered
as good as random. Our treatment effect, α, is the average difference between violence Vit in a
constituency in which the left narrowly wins vs. one in which the left narrowly loses:
α = E [Vit(Lit = 1)− Vit(Lit = 0)| |Xit| < h] (1)
We can estimate α both parametrically and non-parametrically. The choice of bandwidth
involves a trade-off between efficiency and bias in the non-parametric estimation: very small
bandwidths are more likely to approximate the quasi-experimental assignment of the treatment
variable and to attain balance in other observable covariates. Yet they often produce small
sample problems and imprecise estimates. To deal with this issue, in our baseline estimates we
use the optimal bandwidth, bias correction, and robust standard errors proposed by Calonico,
Cattaneo, and Titiunik (2014). These estimates are a refinement of the non-parametric local
6Mayors cannot run for re-election in Colombia, thus our discussion focuses on the potential re-election of(left-wing) parties.
8

polynomial estimators usually employed and we verify the robustness to the order of the poly-
nomial (Lee & Lemieux, 2010). Following Gelman and Imbens (2014), we do so only for linear
and quadratic polynomials.
We also report results using a parametric approach, which simply runs the following type of
regression for our sample of close races with a margin of victory within our choice of bandwidth:
Vit = αLit + f(Xit) + εit. (2)
In (2), f(Xit) is a polynomial in our forcing variable that allows different coefficients for races
with Lit = 0 or Lit = 1, and εit is an idiosyncratic error term. As with our non-parametric
estimates, we rely on Calonico et al. (2014) for the choice of bandwidth. We also show the
robustness of our estimates to different bandwidth values, including that of Imbens and Kalya-
naraman (2012).
3.2 Data
3.2.1 Violence
The source of our violence data is a dataset compiled by Restrepo, Vargas, and Spagat (2003),
which was updated through 2014 by Universidad del Rosario. This dataset codes violent events
recorded in the Noche y Niebla reports from the non-governmental organization (NGO) Centro
de Investigacion y Educacion Popular (CINEP) of the Company of Jesus in Colombia, which
provides a detailed description of the violent event, date, the municipality in which it occurred,
the identity of the perpetrator, and the count of victims involved in the incident. Noche y
Niebla sources include (Restrepo et al., 2003, p. 404): “1. Press articles from more than 20 daily
newspapers of both national and regional coverage. 2. Reports gathered directly by members of
human rights NGOs and other organizations on the ground such as local public ombudsmen and,
particularly, the clergy.” Notably, since the Catholic Church is present in even the most remote
areas of the country, we have extensive coverage of violent events across the entire country.7
Violent events are coded for the period 1988 to 2014 as either an uncontested one-sided attack
(e.g., shootings against the population, assaults on police stations, or an ambush on a military
patrol) or a clash (in which two or more groups exchange fire).
This dataset allows us to identify the three main perpetrators of violence in the Colombian
conflict: the government (armed forces), the paramilitaries, and the guerrillas. As explained in
Section 2, we conjecture that paramilitaries are the main perpetrators of violence against left-
wing politicians or their supporters. Therefore our main variable of interest is the number of
attacks perpetrated by paramilitary groups during the mayor’s term following a narrow victory
or defeat by the left. In order to take into account the size of municipalities, we measure
the number of attacks per 100,000 inhabitants. We also compute similar measures of violence
perpetrated by the guerrillas and government to help rule out some alternative interpretations
of our results.
7Figure A-1 in the Appendix shows two examples of events in our violence dataset. Both are paramilitaryattacks in the municipality of Viota, in Cundinamarca. One local councillor was “disappeared” in the first case,and in the second a thirteen year old faced the same fate, this time with the army’s acquiescence.
9

3.2.2 Electoral results and party classification
We use the electoral data compiled by Pachon and Sanchez (2014), which is gathered from the
Colombian national electoral authority, the Registradurıa Nacional del Estado Civil. Figure 2
describes the timing of local elections since their introduction and the availability of electoral
data for our analysis. Local elections take place in October, and the term starts in January of
the following year. For all elections between 1988 and 1994, there is no detailed information on
the vote count of losers; only the total votes cast for the election winners are available. Since
the 1997 election is the first that has detailed information available on winners and losers, this
is the first year for which we can implement an RDD.
Mayors who were elected in 1997 and 2000 (and who began their terms in 1998 and 2001,
respectively) had three-year terms (up to 2000 and 2003, respectively). However, starting in
2003, the terms were extended to four years, so the remaining election years of our sample are
2003, 2007, and 2011, with associated terms starting, respectively, in 2004, 2008, and 2012.
Violence data, while starting early enough, are available only until 2014. Given the difference
in term lengths across the sample, as well as the lack of violence data for 2015, for our main
results we focus on the effect of left-wing victories on violence during the years available for the
government term.8
A central part of our empirical exercise involves identifying and coding left-leaning parties
(we also need to identify and code right-wing parties for key robustness exercises reported in
Section 5). This is a challenging task, since there are 505 different political parties that either
won or came second in a local election during our sample period.9
The coding of parties as left-wing, right-wing, or neither followed a three-step sequential
procedure that is explained in greater detail in Appendix Section A.1. Here we provide a brief
summary of it. First, following Keefer (2012), we check party names, mottos, and slogans for
words that identify the party as clearly left- or right-leaning (e.g., “communist”/socialist” or
“conservative”/“Christian,” respectively).10 For example, the Communist Party of Colombia
was classified as leftist using this criterion. Second, since only a handful of parties can be
classified directly using this method, following Budge, Bara, Volkens, and Klingemann (2001)
we also search the party statutes (when available) for policy stances that are clearly left- or
right-leaning. In particular, we code a party as left-wing if the party statutes include at least
three of the following five leftist policy positions: (1) pro-peasant, (2) advocates greater market
regulation, (3) thinks that workers should be defended against exploitation, (4) advocates state-
owned or communal property rights, and (5) anti-imperialist. In turn, we code a party as right-
leaning if its statutes include at least three of the following five right-wing policy positions:
(1) economic growth is emphasized over redistribution, (2) advocates free market, orthodox
policies, and privatization, (3) believes that family and religion are the moral pillars of society,
(4) appeals to patriotism and nationalism, and accepts the suspension of some freedoms in
8The results using average violence during the first three years produce virtually identical results, and areavailable upon request.
9There was a large increase in the number of parties after the enactment of the 1991 constitution; recentreforms have sought to create incentives for the maintenance of fewer (but stronger) parties (Raga & Botero,2006).
10The Colombian Conservative Party is an exception for the reasons discussed in Section 2.
10

order to guarantee security, and (5) prioritizes law and order. Parties that do not include at
least three of the policy stances from either list in their statutes are classified as neither left-
nor right-wing. Third, for parties for which official statutes are not available, we look at the
government plan that candidates submit to the electoral authority before elections and, when
available, search them for the same policy stances as in the second criterion.11
Of the 505 parties analyzed, we were able to classify 247 (49%): 15 are left-wing, 16 are right-
wing, and 216 are neither.12 However, not all of these parties are included in our estimation
sample, as some of them compete in races with winning margins outside the optimal bandwidth
of Calonico et al. (2014). In particular, our estimation sample includes 178 parties, of which 14
are left-wing, 13 are right-wing, and 163 are neither. It is worth noting, however, that all the
left-wing parties that either win or come second during our sample period do so in at least one
close electoral race. This is important, because it implies that our analysis includes the entire
set of left-wing parties that successfully contested mayoral elections in Colombia between 1997
and 2011.
The municipalities featuring electoral races in which the left either won or was the runner-up
at any time during our sample period are highlighted in Figure 3 (black dots). Places in which
these races were decided by a narrow margin are indicated by a black diamond; these constitute
our baseline municipal sample. While this is a small number of municipalities, reflecting the
limited success of the left (which our results partly help explain), they appear to be spread across
the entire country. This is important for at least two reasons. First, it gives additional external
validity to our results, since they are not limited to a specific region or set of municipalities.
Second, the geographic distribution makes it less likely that our results are driven by other
confounding characteristics of these municipalities, an issue that we investigate in greater detail
in Section 4.3.
3.2.3 Additional variables
Finally, a fundamental assumption of our research strategy is that, except for the ideology of
the elected mayor, treated and control municipalities have similar characteristics. In order to
examine whether this assumption holds, we collected data on a broad range of predetermined
municipal characteristics.
A detailed description of all the variables and their sources is available in Appendix Section
A.3 and Table A-1, including those used for robustness, falsification tests, and testing the
underlying mechanisms.
Finally, throughout our analysis we drop cities with a population greater than 300,000 since
guerrilla and paramilitary attacks are very rare in large cities.13
11For independent candidates who do not run on behalf of a party, we first check if they were supported by acoalition of parties and assign the ideology of the coalition to them, provided that the ideology matches acrossall parties in the coalition. Second, if there is no supporting coalition or if the ideologies of the coalition partiesdo not match, we turn to the third step and search their government plan. See Appendix Section A.1 for details.
12Parties that cannot be classified in steps 1 to 3 of the coding procedure are assumed to be neither left- norright-wing. However, our results are robust to dropping them (and the associated races in which they compete)from the sample. We also explore the robustness of our results to including a fourth classification step thatassigns to parties that are factions of, or splinter movements from, other parties (that in turn are classifiable insteps 1 to 3) the ideology of the parent party (see Table B-1).
13Of the 12 Colombian cities of this size, only four held elections in which a left-wing party won or came second
11

3.2.4 Descriptive statistics
Table 1 presents descriptive statistics for our main variables. The sample in Panels A through
G includes the 254 elections in which a left-wing party was either the winner or the runner-
up. These occur in 193 municipalities (17% of the country): 153 of them appear only once,
27 appear twice, and 13 appear three or more times. That is, a large majority (79%) of the
municipalities in our sample appears only once during our sample period.
Panel A shows average yearly attacks during the mayor’s term. Paramilitary groups per-
petrated an average of 1.98 attacks per 100,000 inhabitants per year in our sample, half of the
corresponding figure for attacks by guerrilla movements. Clashes and attacks by other groups
were less frequent. The variation in both measures is rather large; most municipalities have no
attacks, on average, but the most affected municipalities experience as many as 76 paramilitary
attacks and 90 guerrilla attacks per year. Government one-sided actions in our sample are 0.66
per year, again with a median of zero and a maximum of 35 attacks per 100,000 inhabitants. The
incidence of clashes (Panel B) is much lower, with an average of 0.17 guerrilla vs. paramilitary
confrontations per year, 2.25 guerrilla vs. government clashes, and 0.07 paramilitary vs. govern-
ment confrontations per 100,000 inhabitants. The low number of guerrilla–paramilitary clashes
is consistent with the different strategies of both armed groups: while guerrilla groups engage
more frequently in combat with the government, the paramilitaries specialize in massacres and
selective assassinations (Gutierrez-Sanın, 2008).
Moving to other outcome variables, Panel C shows that 23% of the municipalities in our
sample updated their land cadaster (registry) during the mayor’s term. In turn, Panel D
examines the incidence of corruption indicators originally collected by Martinez (2016), and
Panel E looks at the three indices of local government performance.
Finally, in Panels F and G we show our forcing variable, the win margin for the left-wing
candidate relative to that of the opponent. Looking at the absolute value of this difference
the average win margin is of 9.4 percentage points with a median value of 6.7. Recall that
this is the margin relative to the votes obtained by the top two candidates—rather than to the
total number of votes. In addition, local elections in Colombia often field many candidates; the
average number of candidates in our sample is 4.6 (with a median of 4, and a maximum of 17
candidates). Thus, this represents a relatively small win margin.
In the final panel we restrict the sample to Calonico et. al. (2014)’s optimal bandwidth for
our baseline estimates. The sample drops to 157 observations. That is, over two thirds (67%)
of the races relevant for our study (involving a left versus a non-left candidate) are close using
this criterion.
Descriptive statistics for the sample of electoral races in which a right-wing party came in
first or second are reported in Appendix Table B-4.
during our sample period. Only in Bogota (in 2003 and 2011) and Bucaramanga (in 2011) was the winningmargin within our optimal bandwidth. Our main results remain unchanged when we include these two cities(which had a total of three races that fit the criteria).
12

4 Main results and robustness
4.1 Baseline results
In Table 2 we report our main result: electing a left-wing mayor leads to a substantial and
statistically significant increase in subsequent paramilitary violence. Panel A reports the non-
parametric estimates following Calonico et al. (2014) and Panel B the parametric estimates
of the treatment effect.14 Columns 1 and 5 include no controls; Columns 2 and 6 control
for time-invariant geographic characteristics of the municipalities (such as altitude, average
historical rainfall, distance to Bogota, and region-specific dummies); Columns 3 and 7 include
pre-determined socio-economic and political controls (such as the vote share of left- and right-
wing presidential candidates in 1994, rurality, literacy rates, presence of coca, and historic
violence); and Columns 4 and 8 include all the controls simultaneously. While in principle the
inclusion of these covariates should not have a major impact on the coefficients, doing so may
help improve the precision of the estimates (Lee & Lemieux, 2010).
The non-parametric estimates are positive and statistically significant across all specifica-
tions. The parametric estimates are smaller and not significant under a linear polynomial
specification, but are statistically significant (and of similar magnitude) to the non-parametric
estimates under the quadratic polynomial.
Focusing on the non-parametric estimates, the election of a left-wing mayor leads to an
additional 4.4 to 6.8 attacks per 100,000 inhabitants per year during his or her term. This
increase is quantitatively important. It is equivalent to 2.2 to 3.4 times the sample mean and
63–97% of a standard deviation. Despite our very small sample by the standards of typical RD
analyses, the coefficients are statistically significant at standard confidence levels. Moreover, our
results do not depend on our choice of bandwidth, and are robust to considering less-competitive
elections. Panel A of Figure 5 shows the estimated coefficient and the 95% confidence interval
using a wide range of bandwidths. The effect of a left-wing electoral victory on paramilitary
attacks remains positive and statistically significant for bandwidths as small as 0.07 and as large
as 0.2.15 For bandwidths of 0.05 or smaller, the point estimates become small and noisy, and the
sample sizes become prohibitively small. For bandwidths larger than 0.2 the coefficients remain
positive and stabilize at around 40% of a standard deviation, even if no longer statistically
significant at conventional levels.16
Figure 4 illustrates these (non-parametric) findings. Observations within Calonico et al.
(2014)’s bandwidths for a polynomial of orders one and two are displayed in the left- and right-
14In Panel A, we implement Calonico et. al (2014)’s bias correction and robust standard errors, as well as theiroptimal bandwidths for local polynomials of orders one (Columns 1 to 4) and two (Columns 5 to 8). Optimalbandwidths range from 4.8% to 11.9% depending on the controls included. Estimates in Panel B fit linear andquadratic polynomials (in Columns 1–4 and 5–8, respectively) and restrict the sample to that defined by theoptimal bandwidth computed for the non-parametric case without including controls.
15In order to compare the size of the effects across multiple outcomes, Figure 5 reports the effects on standard-ized outcomes.
16As a validation test, we re-estimate the treatment effect at different “placebo” cutoffs other than the thresholdat which treatment occurs (in this case 0). This practice is especially useful when there are other cutoffs of theforcing variable that may capture changes that are erroneously attributed to the treatment of interest. Whilethis is unlikely in close election settings, for completeness we estimate the effect of left-wing electoral victorieson violence for different cutoffs in the range of -0.14 to 0.14. Estimates at alternative cutoffs (not reported) areunstable, imprecisely measured, and not statistically different from zero.
13

hand side panels, respectively. Each point represents the average of our paramilitary attacks
variable within bins of equal size selected so that there are 10 bins at each side of the cutoff.
Linear and quadratic fits (based on the raw, unbinned data with no controls) are depicted
together with the bin averages. A jump in the number of attacks across the threshold is evident
in both figures.
4.2 Robustness to party coding
Even after following a very strict three-step procedure to code the ideology of political parties,
some parties were left unclassified. As described above, these parties were coded as neither left-
nor right-wing in our baseline analysis. In Appendix Section B.1 we show that our estimates
remain very similar if we drop these unclassified parties (Panel A of Table B-1), or if we code
the ideology for some of them as the same as their parent party (Panels B and C of Table B-1).
4.3 Verifying RD assumptions and additional robustness checks
Our empirical approach relies on the underlying assumption that the outcome of close races is
as good as random. This assumption would be violated if left-wing parties win in inherently
different municipalities, and thus our estimates simply reflect the effect of other confounding
characteristics on violence. To rule out this possibility, and assess the validity of our approach,
we conduct three robustness checks.
First, we look for evidence of manipulation of electoral results, which would translate into
an endogenous selection of winners. If candidates somehow manipulated the electoral results,
for example via cheating or electoral fraud, this would invalidate the assumption that the
assignment of treatment (i.e., win or lose an election) resembles a coin toss. If the results are
manipulated, then any subsequent violence could be triggered by suspicions of fraud, rather
than the political stance of the winner. Testing for sorting around the threshold is a useful way
of examining potential manipulation (Lee & Lemieux, 2010). We thus follow McCrary (2008)
and check the distribution of our forcing variable around the winning threshold. A discontinuous
jump in either direction would indicate that the left is systematically more or less likely to win
close races. Figure 6 shows the results of this test, and reports the statistic of the null hypothesis
of no jump in the distribution. Reassuringly, there is no jump in the density at the threshold.17
Second, we test for balance in municipal characteristics across municipalities in which the
left narrowly won or lost. In particular, we want to make sure that a left-wing victory is not
correlated with pre-election trends in paramilitary (or other forms of) violence. We study this
in Panels D to I of Figure 5, where we plot RD estimates (for several bandwidths) of the effect
of a left-wing electoral victory on pre-election violence. Panels D, E and F focus on violence
during the mayor’s term prior to the election. In turn, Panels G, H and I focus on violence in
the year prior to the election, since this may be when armed groups are likely to try use violence
to shape electoral outcomes. All the point estimates are statistically insignificant across the six
panels, for both small and relatively larger bandwidths. The only exception is paramilitary
attacks in Panel D when focusing on a very short range of bandwidths just above 0.1. Even in
17The estimate is 0.09 with a standard error of 0.24.
14

this case, however, the point estimates are just over half of our benchmark effect of close left-
wing victories on subsequent paramilitary attacks, and just marginally significant. For other
bandwidths, and for the case of paramilitary violence in the year prior to the election (Panel G),
the point estimates are very close to zero. This is also the case for preceding guerrilla attacks.18
Overall, Figure 5 provides compelling evidence that previous violent dynamics are unlikely to
explain our main findings.
Third, we test for balance across other municipal characteristics. Systematic differences on
observables would raise doubts as to whether our estimates reflect the impact of a left-leaning
victory, or instead are the result of confounding observables. In Appendix Section B.3 (Table
B-2) we report estimates of the effect of a left-wing victory in a close election (Column 3) on
a large set of covariates. Reassuringly, we find no statistically significant differences between
treatment and control municipalities for most of these variables. The only exception is the
number of years since the land registry was last updated, which is higher by about 4 years and
significant at the 95% level in municipalities in which the left won, an issue we return to below.
4.4 Endogenous selection and external validity of close races
Our empirical strategy estimates the effect of a left-wing victory only for municipalities in
which the election outcome was decided by a narrow margin. This may generate the concern
that our estimates lack external validity for less competitive electoral races. This is a common
limitation of RD estimates that focus on observations for which the assignment to treatment
can be considered as good as random. A related concern is that the sample of electoral races in
which a left-leaning party ends up winning or losing by a narrow margin is endogenous to the
strategic behavior of elites and the voters. For example, in places where the elite exerts more
effort in preventing a left-wing victory, or where voters anticipate the violent consequences of
a narrow left-wing victory, elections are less likely to have a left-wing candidate win or come
second. Thus, the concern is that our sample consists of municipalities in which elites and
voters failed to behave in this strategic manner.
We address this concern in four main ways. First, McCrary (2008)’s test in Figure 6 and
the reported balance across many observables in Table B-2 suggest that if elites engaged in any
sort of manipulation, this is not correlated with municipal characteristics and did not bias the
outcome of the election in a systematic way. Thus, our main results are internally valid.
Second, Panel A of Figure 5 shows the robustness of our main coefficient of interest to
different bandwidth values. Reassuringly, the positive effect of a left-wing victory on paramili-
tary attacks remains positive, large, and statistically significant for a wide range of bandwidths
(between 0.07 and 0.2). This implies that our results based on close elections are qualitatively
similar to those of not-so-close elections, and thus may have broader external validity for other
Colombian municipalities.19
Naturally, for larger bandwidths we can no longer give our RD estimates a causal interpreta-
18This is not to say that the guerrillas do not increase their attacks during election years (in fact, theyhistorically have), but our findings suggest that this is uncorrelated with the outcome of the election.
19Recall that all the parties classified as left-leaning are involved in at least one close election, and that mostelectoral races in which the left came first or second are close. Figure (3) also suggests that our results haveexternal validity for races in which the left may have won or lost by larger margins.
15

tion, as municipalities in which the left wins by a large margin may be very different from those
in which the left loses by a large margin. However, recall that in Panels D–I of Figure 5 we show
no differences in any preceding form of violence in either competitive or uncompetitive munici-
palities. In addition, in Appendix Section B.3 we show that some key municipal characteristics
such as economic development, institutional quality, historical political preferences, and other
electoral variables exhibit no major differences for municipalities far from the threshold. Thus,
while estimates for larger bandwidths should be interpreted cautiously, they do not seem to
confound other characteristics of these municipalities.20
Third, Appendix Figure B-2, which plots the distribution of the win margin between the
winners and runners-up in mayoral elections, shows that, consistent with Figure 3, most elections
in which a left-wing party either wins or comes second are decided by a small vote margin (Panel
A), and that this is not the case for the sample of all Colombian local mayoral elections (Panel
B). In particular, while about 65% of all elections contested by a left-wing candidate are decided
by a margin smaller than 10% (Panel A, first three bars), less than 40% of all local executive
elections in the country are decided by such small margins (Panel B, first four bars). Thus, for
the case of races with a left-wing winner or runner-up, close races are particularly representative
of the overall universe of races.
Fourth, the strategic behavior by elites and voters to prevent an electoral victory of the left
(discussed at the beginning of this section) is more likely in municipalities in which a left-wing
candidate has previously won. In the absence of any local history of left-wing victories in local
elections (which is very likely, given the exclusion of the left from politics throughout most of
the 20th century – see Section 2), it seems plausible that elites and voters failed to anticipate,
respectively, the outcome (or competitiveness) of the election and the consequences of a left-
wing victory.21 It is well documented that individuals often fail to anticipate events that have
never occurred (Benoit & Dubra, 2013) and thus it is unlikely that our sample of close elections
is endogenous to prior actions or elite/voter failure to anticipate the outcome.
However, following the first narrow electoral victory or defeat by a left-wing party, elites
will learn that these parties represent a real electoral threat, and voters will experience the
resulting spike in paramilitary violence. This suggests that constituencies in which a left-wing
party either wins or comes second for the first time are less likely to be subject to strategic
behavior by elites or voters. Dropping recurring municipalities from the sample (i.e., those that
show up more than once in our sample because they have more than one close election with
left-wing participation) yields results that are, as expected, larger in magnitude, in both close
and non-close races (see Appendix Figure B-3, Panel A).22
20We also estimated basic difference-in-differences regressions to study the effect of electing a left-wing mayoron various forms of violence. Estimates using this approach exploit variation from all municipalities in whichthe left ever held power, and not only those in which a left-wing party won in a close election. The estimates(not reported) are positive for paramilitary attacks (and larger than for other groups), though not statisticallysignificant.
21Also, polling prior to elections in Colombia is very rare outside large cities, and often there are manycandidates competing. Thus, it is usually very hard to predict who will win local elections.
22At the optimal bandwidth of Calonico et. al (2014) the non-parametric (parametric) estimates are 5.8 (5.1)and 6.1 (5.8) additional paramilitary attacks, on average, for local polynomials of orders one and two, respectively.Moreover, Figure B-3 (Panels B, C and D) confirms that for this alternative sample, there are no statisticallysignificant differences in pre-electoral violence (as measured by paramilitary, guerrilla, or government attacks).
16

In sum, the evidence presented above suggests that our results are not just an artifact
of the RD approach, in which inference is based on elections decided by a narrow margin of
votes. Rather, they hold for a larger set of elections in which a left-wing candidate was either
the winner or the runner-up. Nonetheless, it is important to study whether municipalities in
which the left was relatively successful in local elections are representative of all Colombian
municipalities. We find that in several respects they are not. In Table B-3 we investigate the
characteristics of municipalities in our sample relative to all other municipalities in the country.
Panel A shows that our sample of municipality-years in which left-wing parties won or came
second experienced more one-sided attacks by armed groups than those in which the left was
not competitive. This is important, as our argument hinges on the comparative advantage of
local elites to use de facto (violent) means to counteract the democratic threat of the left. Also,
not surprisingly, these are also areas in which the left (right) has higher (lower) average support
than in the rest of the country, in both local and national elections (Panel C). In addition,
municipalities in our sample have larger populations (hence the importance of normalizing our
violence variables) and twice the historic incidence of coca crops relative to municipalities not
included in our sample (Panel C). They also have a weaker institutional capacity, as measured
by the per capita number of local public servants (Panel B).
5 Alternative interpretations
So far we have focused on single-sided attacks by the paramilitary, arguing that such attacks best
exemplify the type of de facto response that traditional elites might exert when facing increased
de jure contestation by left-wing outsiders with different political preferences. However, there
are other potential interpretations of our results.
We start by examining the impact of a narrow left-wing electoral victory on other types
of violence. It is important to rule out, for instance, the possibility that paramilitary attacks
might have risen in response to either increasing or decreasing guerrilla attacks. If the armed and
democratic left are strategic complements (substitutes), then we would expect a spike (decrease)
in guerrilla violence following a left wing victory. In turn, because of their counterinsurgent na-
ture, paramilitaries are likely to react to these dynamics with violence, either by contesting an
empowered armed left or by filling the power vacuum left by a guerrilla retreat. Likewise, and
through similarly complex mechanisms related to the complementarity/substitutability of vio-
lence across armed groups (which are beyond the scope of this study), the surge in paramilitary
violence may be partly driven by a change in the incidence of attacks by government forces
following a left-wing victory. Finally, another alternative is that left-wing mayors are simply
unable to curb (any type of) violence, perhaps because they do not prioritize security and law
and order (see Appendix Section A.1).
We reject these hypotheses by showing that neither guerrilla nor government attacks change
differentially in municipalities in which a left-wing candidate narrowly wins vs. comes second.
This is reported in Columns 1 and 2 of Panel A of Table 3: not only are the point estimates not
statistically significant, but the magnitude of the coefficients for both guerrilla and government
attacks is rather small (0.7 and 1.6 additional attacks per 100,000 inhabitants, respectively,
17

which is much smaller than our baseline effect for paramilitary violence).23 For completeness,
we also look at two-sided armed confrontations (clashes) between different groups, and confirm
that no other type of violence increases as a result of a left-wing candidate being elected mayor.
This is reported in Columns 3 to 5 of Panel A, Table 3 for close races (as defined by the optimal
bandwidth of Calonico et al. (2014)).
Another hypothesis is that left-wing parties and politicians are targeted not because they
advocate policies that are contrary to the interests of traditional elites, but because their gov-
ernments are corrupt or perceived as inept.24 While measuring corruption is challenging, in
Panel B of Table 3 we test whether in places where the left won, the mayor (Columns 1 to 3)
or other top municipal officials at the rank of secretary (Columns 4 to 6) are more likely to
be investigated for misconduct by Procuradurıa General de la Nacion, the government Watch-
dog Agency (Columns 1 and 4), found guilty (Columns 2 and 5), or removed from their post
(Columns 3 and 6). We find no evidence that left-wing mayors or their secretaries are more
corrupt than municipal executive officials from other parties. The point estimates are statisti-
cally insignificant (especially in the case of mayors) and small in magnitude compared to the
average in the sample (Table 1). Furthermore, in Panel C we look at the three indices of govern-
ment performance described in Section 3.2 (Columns 1 to 3), as well as municipal capital and
current fiscal expenditure, to check whether left-wing mayors spend more than non-left-wing
incumbents (Columns 4 and 5). We find no evidence that left-wing mayors perform worse than
those from other parties.25 In short, the evidence does not corroborate the hypothesis that the
violent reaction we observe is driven by higher (or lower) corruption levels or the poorer (better)
governance of left-wing mayors.
Another potential interpretation of our results is that, due to the weak legitimacy of the
democratic system in Colombia, a violent reaction would have taken place after a narrow victory
of other parties as well. Our baseline estimates imply that violence does not increase when the
non-left narrowly defeats the left in local elections. However, the non-left includes a large and
heterogeneous group of parties, some of which may incite violence after winning office and some
of which may not. For example, increased violence may follow the election of a candidate
from any party on the extremes of the ideological spectrum. The most natural comparison
is assessing the impact of narrow electoral victories of right-wing parties on levels of violence.
Panels A and B of Table 4 report the estimated impact on different types of violence of narrow
victories by right-wing vs. non-right-wing parties in mayoral elections in Colombia during
our sample period. There is no significant effect on either total attacks (aggregated across all
groups), or on attacks perpetrated by the paramilitary or guerrilla groups. Attacks carried out
by government forces are negative and significant, and the point estimate suggests that, after
narrow victories of right-wing parties, government attacks drop by 0.5 per 100,000 inhabitants
during the mayor’s term in office. However, this is a small effect, equivalent to less than 40% of
23While the coefficient for paramilitary violence is over three times the mean and almost a full standarddeviation, the estimated effect on guerrilla violence is about a fifth of the mean and less than a tenth of astandard deviation.
24The contrary is also a plausible: the left may be more honest and competent than previous local administra-tions, and hence may be targeted for changing the way in which municipalities are traditionally run.
25These estimates, especially those reported in Columns 2 and 3, are based on a smaller subset of years due todata availability.
18

a standard deviation.26 With the exception of attacks by government forces, the null effects for
other types of violence are robust to varying the estimation bandwidth across a large range of
values (Figure B-4, Panels A, B and C).27 In addition, the magnitude of the coefficients is small
compared to our baseline estimates for paramilitary violence after left-wing parties win in a close
election. The point estimate for paramilitary attacks in Table 4 is 0.18, which is equivalent to
30% of the sample mean and 5% of a standard deviation, as reported for this sample in Table
B-4. In summary, and in line with our expectations given the nature of Colombia’s political
history, the right is not a political outsider, and thus its victories are less threatening to existing
interest groups with the capacity to react via de facto means.
Another possibility is that our estimates simply reflect the effect of the electoral victories
of new parties. As discussed in Section 2, the 1991 constitution facilitated the creation of new
political movements across the entire ideological spectrum, many which (leftist or not) have
been electorally successful in some places. Thus, the violent response of paramilitaries may
reflect a more general reaction to the threat of new political actors to traditional elites’ grip
on power, and not necessarily a reaction to left-wing ideology. To address this possibility we
first follow Galindo-Silva (2015) and code as a new party any party in a given municipality that
(1) is not one of the two traditional parties (Conservative and Liberal) and (2) has never won
an election in that municipality. We then estimate the effect of a narrow electoral victory of a
new party on paramilitary attacks. Importantly, we drop from our estimation sample all left-
wing parties and thus isolate the effect of new parties that were not associated with a left-wing
ideology. The effect of narrowly electing a mayor from a non-left new party on paramilitary
attacks is reported in Table B-5. The estimates are very small (about a tenth or less of the
baseline effects of Table 2) and statistically insignificant (with the exception of the parametric
estimates fitting a linear polynomial). This implies that our results are related to the ideological
stance of left-wing parties, and are not explained by the fact that left-wing parties were simply
new to the local political arena. In the Colombian context, only left-wing parties seem to have
been particularly threatening to the interests of local elites.
One remaining question is whether our estimates reflect a widespread phenomenon associ-
ated with all left-wing parties, or are simply driven by the persecution of the UP, the party
formerly associated with the FARC (see Section 2).28 While the persecution of the UP is partly
the phenomenon that we are documenting in this paper, if our results are entirely driven by the
UP this would potentially decrease the external validity of our results, and call into question our
claim regarding a de facto response to the de jure accumulation of power by any left-wing party,
not only the party with past connections to communist guerrillas. To address this possibility,
we revisit the baseline empirical exercise of Columns 1 and 5 of Panel A of Table 2 but add as
controls a dummy for whether the left-wing party in the close electoral race is the UP and the
26Panel A of Table 4 reports non-parametric estimates and Panel B reports parametric estimates. All estimatesare based on local linear polynomials within the optimal bandwidth and include bias correction and robuststandard errors. The results for the second-order polynomials are similar in magnitude and also not significant.
27Moreover, Appendix Figure B-5 shows that there is no significant evidence of manipulation of the runningvariable in close elections in which right-wing parties are either the winners or the runners-up.
28Even as recently as this year, a UP leader who returned to Colombia from exile in 2015 was the victim ofa violent attack. See “Defensorıa pide esclarecer con urgencia ataque contra lıder de Union Patriotica,” El Es-pectador, May 7, 2016. Available at http://www.elespectador.com/noticias/nacional/bolivar/defensoria
-pide-esclarecer-urgencia-ataque-contra-lider-articulo-631172 (last accessed May 16, 2016).
19

interaction of this dummy with an indicator of whether the left-wing party won. The results
are reported in Appendix Table B-6. The point estimates become somewhat smaller but remain
statistically significant. This suggests that our baseline estimates are not simply driven by the
UP, and that paramilitary violence also followed the election of other left-wing parties. The
interaction term between the UP and the victory dummy is positive, as expected, suggesting
that violence in places where the UP narrowly won was much larger. However, the coefficient is
not statistically significant, probably due to power limitations (the UP contested eight elections
during our sample period, and won half of them).
6 Mechanisms
In this section we present additional evidence that supports our preferred interpretation. We
start by testing what happens to our overall effect after 2006, when the paramilitaries (which
by then had joined forces under the AUC umbrella organization) demobilized after signing a
peace agreement with the Uribe government.29 Table 5 interacts the dummy of a left-wing
victory with a time indicator that captures all local elections that took place after 2006 (i.e., in
2007 and 2011). The estimated interaction coefficient is negative and statistically significant.
Interestingly, we cannot reject the null hypothesis that the effect of a left-wing victory in
elections after 2006 is equal to zero, which suggests that the increase in violence following the
election of left-wing candidates may have disappeared altogether after the demobilization of the
AUC.30
The timing of the observed increase in paramilitary attacks following left-wing victories also
has implications for the validity of our interpretation. We argue that in order to avoid the
consolidation of political power in the hands of left-wing parties, paramilitaries are likely to
concentrate their violent reaction as the subsequent elections approach, thus preventing the
left from winning again.31 Known paramilitary tactics include “terrorizing voters to vote in
particular ways, ... to stay away from the polls so they could stuff ballots, voting instead
of citizens by confiscating their identify cards, terrorizing politicians so that they would not
run against their preferred candidates, and manipulating subsequent vote totals electronically”
(Acemoglu et al., 2013). Table 6 presents estimates of the effect of electing left-wing candidates
as mayor on paramilitary attacks during each year of his or her term in office.32 The results
indicate that the increase in paramilitary violence is driven by increased attacks in the year of
the subsequent election. The coefficient for the first year is positive (4.8), while the coefficient
for the second year is negative (though relatively small in magnitude, -1.2). However, the
coefficients for the third year (10.9) and the year of the subsequent election (18.5) are not only
positive but also substantially larger than the baseline estimates. These estimates are noisy,
and only the one for the third year is significant at conventional levels, which is a consequence
29While splinter paramilitary groups persisted after this time, they were mainly guided by economic ratherthan political motivations.
30We must nonetheless interpret this result cautiously, since a simple time dummy may also capture otherchanges that took place after 2006 in Colombia in addition to the demobilization of paramilitaries. For example,it may indicate an overall improvement in institutions and state capacity in the last decade, or changes in theelectoral law that may have shifted the incentives of political parties.
31This incumbency (dis)advantage is discussed further in Section 7.32Recall from Section 3.2 that mayoral terms are either 3 or 4 years.
20

of our small sample. But the point estimates suggest a pattern in which violence tends to spike
right after the left-wing candidate is elected and, more significantly, approaching the year of the
subsequent election. The next section examines whether this paramilitary strategy of increasing
violence in the last year of a mayor’s term is effective.
7 The consequences of violent paramilitary responses
We now look at the performance of left-wing parties in the subsequent election – i.e., the one
after the close race in which they narrowly won or lost – and establish whether they suffer
from an incumbency disadvantage, at least relative to other political parties. There are several
challenges in estimating incumbency advantage or disadvantage: incumbency status is usually
correlated with other party characteristics that explain both why the party was successful in
getting elected in the first place and its performance in the next election. Moreover, as discussed
in Section 3.2, the large number of local parties in Colombia, many of which are short-lived and
disorganized, makes it harder to identify the electoral effects of incumbency.
To assess subsequent electoral performance we follow Klasnja and Titiunik (in press), who
use a close-elections-based RD approach very similar to the one we use in this paper. For
each electoral period t they focus on incumbent parties (those elected in period t − 1) and
estimate the effect of the (arguably random) arrival in office on future electoral success. Our
main measure of future success is a dummy variable for whether incumbent parties run in and
win the next election (in period t + 1). For close races, for which the outcome of the time t
election is plausibly as good as random, a dummy indicating whether the period t incumbent
wins in t+1 compares the subsequent electoral success of the incumbent party in municipalities
in which it was a close winner vs. a close loser.
We report the estimates from this exercise in Table 7. Columns 1 to 4 of Panel A estimate the
average degree of incumbency advantage in Colombia.33 The estimates for the election winner
dummy are negative and very similar to those reported by Klasnja and Titiunik (in press) for
Colombia.34 This suggests that political parties in Colombian local elections experience an
incumbency disadvantage. However, in Columns 5 and 6 we extend the exercise of Klasnja and
Titiunik (in press) and interact the winner dummy with an indicator for whether the party is
left-wing. The interaction term is negative, statistically significant, and very large. The point
estimate suggests that left-wing parties in Colombian local elections experience an incumbency
disadvantage that is five to six times larger than that of other (non-left-wing) parties.35 We
argue that this may be (at least partly) explained by the attacks targeted at left-wing incumbent
33Columns 1 and 2 follow the non-parametric approach using polynomials of orders 1 and 2, respectively, whilein Columns 3 and 4 we report estimates from a parametric approach.
34For this analysis we use a somewhat larger sample than the one used in the rest of the empirical exercises,because the 1994 electoral results (which, as explained in Section 3.2, are not available for election losers) allowus to identify incumbent parties that participated in the 1997 elections, the first of our sample period. Whilewe want our sample to be as large as possible, the incumbency disadvantage estimates are not sensitive to thischange.
35 To test whether paramilitary violence following close left-wing municipal victories affects voters’ support ofleft-wing parties in subsequent national elections, we estimate the effect of a narrow left-wing victory in mayoralelections on the municipal vote share of left-wing parties in the next presidential and congressional (Senate andHouse) elections. The results (not shown) suggest that such violence does not affect support for the left innational elections.
21

parties right before their potential re-election.36
The exercise presented in Panel A may hide an important consequence of the attacks aimed
at preventing left-wing parties from remaining in power. After being subjected to violent
intimidation, incumbent parties may simply decide not to run in the next election. We explore
this alternative definition of incumbency disadvantage in Panel B of Table 7. The dependent
variable is no longer whether the incumbent party that competed in the election in period t
runs and wins in t + 1, but simply whether the incumbent party runs at all. In contrast to
the results presented in Panel A, we find no statistically significant average effects for non-left
parties who win the election at t. However, resonating with the results of Panel A, we find that
the interaction term of the winning party with an indicator for left-wing parties is negative and
significant (and larger in absolute terms than Panel A’s interaction coefficients). This implies
that left-wing incumbent parties are less likely than non-left-wing incumbents to put forward a
candidate in the next election.37
Another objective of local elites’ de facto responses to the election of left-wing mayors is to
prevent these outsiders from implementing elite-threatening policies. Table 6 hints that this is
likely the case, as the attacks are concentrated during the first and final years of the mayor’s
term in office. While the higher intensity of attacks at the end of the period is intended to shape
the results of the subsequent election, the increase in violence at the beginning of the term is
likely designed to intimidate the incumbent into maintaining the status quo in terms of policies.
We present anecdotal evidence that this is likely the case in Section 8. Here we focus on the
policy that is the most threatening to local elites, most of whom are landowners: land registry
updates. Municipal mayors have the constitutional authority to update local land registries in
order to keep the value of land up to date for the purpose of calculating property and land
taxes. This is the most important source of revenue for most Colombian municipalities, and
one of the few taxes collected at the local level (Vargas & Villaveces, 2016).38
We gathered data on land registry updates and estimate the effect of a narrow left-wing vic-
tory on the probability that the registry will be updated at least once during the new mayor’s
term. The results are reported in Table 8. Columns 1 and 2 focus on the non-parametric esti-
mates and Columns 3 to 6 on the parametric ones. Odd (even) columns fit a linear (quadratic)
local polynomial. The results are not significant in any specification, which suggests that, even
if left-wing candidates are in principle much more likely to adopt redistributive policies, they
are unable to do so while in office. Recall from Table B-2 that municipalities in which a left-
36Admittedly, this conclusion is based on very few observations. There are just four instances in which left-wingincumbent parties (in t− 1) won the election in t and contested a new mayoral election in t + 1. Of these, theylost three and won one. Since even fewer right-wing incumbent parties (unsuccessfully) contest new elections,for these instances the interaction term is perfectly collinear with the “right-wing party” dummy, which makesit impossible to replicate Table 7 for the right.
37While the evidence in Table 7 is obtained using Klasnja and Titiunik (in press)’s approach to studyingincumbency advantage conditional on being an incumbent (that is, on having been elected to office in t− 1), analternative approach is to estimate the success in period t + 1 of all parties that won elections in t, regardlessof their incumbency status. We estimate this alternative specification and report the results in Table B-7. Incontrast to the results from Table 7, when departing from the approach of Klasnja and Titiunik (in press), we findno incumbency disadvantage for the left. Our argument that right-wing paramilitary violence following left-wingelectoral victories generates an incumbency disadvantage for the left should thus be interpreted with caution.
38The others are sales taxes, fuel taxes, and temporal taxes on specific activities. The non-local municipalsources of revenue are transfers from the central government and royalties obtained from the exploitation ofnatural resources.
22
wing party narrowly won present a larger lag since the last registry update. Columns 5 and 6
further control for this covariate, but we still find no effect of a left-wing electoral victory on
the probability of updating the land registry.
In addition to the regression evidence shown so far, a look at some qualitative studies can
help complement our regressions by further understanding the underlying causal mechanisms
(Franzese, 2007; Mahoney & Villegas, 2007). The next section discusses some revealing examples
and codes the nature of the paramilitary attacks on which our regressions are based.
8 Evidence from case studies
Our interpretation of the econometric results is in line with abundant anecdotal evidence on the
nature of paramilitary violence. The Centro Nacional de Memoria Historica (2013, pg. 50), an
autonomous group commissioned by the government to compile the history of victims of violence
in Colombia, notes that from 1988 to 1992 following the introduction of local elections, “big
massacres were true expeditions to punish social mobilization and reject the political success
of the left, in particular the Union Patriotica and the Frente Popular.” This source cites some
of the most emblematic cases of massacres of left-wing militants and the general population
in areas where the left scored important electoral victories. Perhaps the best-known massacre
took place in Segovia, in the department of Antioquia, on November 11, 1988 (Centro Nacional
de Memoria Historica, 2014). This attack killed 46 people in retaliation for the election of a UP
mayor. Before the mayor’s election, leaflets were distributed with the following message:
“We back the big caudillo in this region, Cesar Perez Garcıa (...) We will not
accept Communist mayors or municipal councils made up of idiotic peasants or
vulgar workers like those who make up the Union Patriotica. They don’t have the
intelligence to handle these positions and manage these municipalities that have
always been ours. Now we will get them back NO MATTER WHAT IT COSTS!
... You wait ... We will hit you with a mortal blow” (Dudley, 2004, pg. 121, upper
case in the original).
In 2000, the UP candidate, Adelia Benavides, was narrowly elected mayor in the Liberal
Party stronghold of Viota. In 2003, in the last year of Benavides’ term, Viota experienced
almost 20 paramilitary attacks. While paramilitary leaders justified this violence as a counter-
insurgency strategy,39 the attacks were likely triggered by the new mayor’s aggressive property
tax plans, which threatened to substantially increase the tax burden of local landowners.40
Viota has not elected a leftist mayor again since experiencing these unprecedented levels of
violence against civilians. In 2003 the left placed third with only 11% of the votes, and in 2011
it received 3.5% of the votes. In 2007 there was no leftist candidate in the mayoral race.
In another example, Carlos Zambrano, the leftist party Polo Democratico’s candidate, was
narrowly elected mayor of the municipality of Baranoa in 2003. Zambrano planned to increase
39Paramilitary leader Martın Llanos once argued that the Viota campaign was launched to “help the displacedlandowners of the guerrillas return to their lands.” However, our dataset indicates that post-2000 paramilitaryviolence in Viota was entirely targeted against civilians; there were no clashes with guerrillas.
40By 2003, Benavides had plans to increase property tax revenues by up to 70% after her Liberal predecessorhad allowed property tax revenues to drop to less than 30% of total tax revenues by the end of the term in 2000.
23
taxes on the relatively wealthy in order to subsidize the utility bills of the poor, which made
him unpopular with the local elite. He also forced local utility providers to cut their tariffs.41
In 2004 paramilitary groups started killing local Polo Democratico leaders who worked closely
with Zambrano in this initiative.42 One of the victims was Elıas Duran, a board member of
the Civic Committee for the Defense of Utilities, created by Zambrano.43 Another victim was
a community leader who led a civic initiative in 2003 for citizens to stop paying their water bill
because of the high rates.44 In 2005 Zambrano was forced by paramilitary leader “Jorge 40” to
flee the municipality.45
In 2000 Oscar Quintero, representing the indigenous leftist political movement Autoridades
Indıgenas de Colombia, was narrowly elected mayor in the municipality of Corinto. Starting in
2001, paramilitary groups killed local indigenous political leaders who they labeled “guerrilla
supporters.” In two roadblocks in 2001 and 2002, paramilitaries killed a leader of the “Indige-
nous Civic Guard” and three members of Corinto’s Cabildo (the semi-autonomous indigenous
government).46
On November 27, 2000, shortly before the end of his tenure as mayor of Unguıa, Rigoberto
Castro was killed by paramilitary forces. Castro had won the 1997 election by a small margin.
Castro’s friends reported that his request to the local police chief for additional protection after
receiving threats by armed men was ignored. In 2015 the State Council found that the National
Police was at fault for not protecting Castro, and awarded his family US$ 400,000.47
These are just a few examples of a much wider and deliberate campaign by paramilitary
groups to target left-wing politicians. In some cases the available information makes it clear that,
once in office, the victims intended to adopt policies that hampered the interests of powerful local
elites, which may have triggered the violence. In order to study how systematic this pattern was,
we reviewed the descriptions in our conflict dataset (see Section 3.2) of every single paramilitary
attack that occurred during the term of a left-wing mayor elected by a narrow margin – or in
the years following the narrow defeat of a left-wing candidate. Our dataset is comprised of
reports in national and local newspapers and other media sources; we particularly focused on
information about whether the victim was involved in local politics as well as his or her political
affiliation (see Appendix Section A.2 for details on the coding protocol).
Two patterns emerge from this exercise, which are consistent with our hypothesis. First,
3.5% of the victims of paramilitary attacks in municipalities in which a left-wing mayor was
narrowly elected were left-wing activists, compared with 0.8% where the left barely lost the
41“Baranoa busca acuerdo con consecionario,” El Heraldo, November 1, 2010. Available at http://www
.elheraldo.co/local/baranoa-busca-acuerdo-con-consecionario-15703 (last accessed March 2, 2016).42“Amenazas a 63 Alcaldes,” El Tiempo, June 10, 2004. Available at http://www.eltiempo.com/archivo/
documento/MAM-1533589 (last accessed March 2, 2016).43http://www.nocheyniebla.org/files/u1/29/pdf/13Mayo2004.pdf.44http://www.nocheyniebla.org/files/u1/31/pdf/05casos31.pdf, (last accessed November 21, 2016).45Ibid.46“Colombia: masacres en la zona rural de Corinto, Cauca; y en zonas rurales de El Santuario, Cocorna, La
Pintada, y San Carlos, Antioquia. Durante estos hechos fueron asesinadas cerca de 25 personas,” OrganizacionMundial Contra la Tortura, November 22, 2001. Available at http://www.omct.org/es/urgent-campaigns/
urgent-interventions/colombia/2001/11/d16132/ (last accessed March 2, 2016).47“La condena a la Nacion por el homicidio de un alcalde por parte de ‘paras,’” El Espectador, March 28,
2015. Available at http://www.elespectador.com/noticias/judicial/condena-nacion-el-homicidio-de-un
-alcalde-parte-de-para-articulo-551888 (last accessed March 2, 2016).
24

election. That is, the incidence of left-wing victimization in paramilitary attacks is almost four
and half times higher in places where the left won by a small margin than in places where it
lost. Second, 86% of the leftist activists killed by paramilitary groups in municipalities in which
the left won were actually involved in local politics (some were the elected mayors), while the
figure for places where the left barely lost is 75%.
9 Discussion
In the late 1980s and early 1990s Colombia undertook a number of democratizing reforms,
notably the introduction of mayoral elections. The opening up of the political system marked
the entry of traditionally excluded groups, particularly left-leaning parties. But these reforms,
and the overall shift towards a more inclusive set of institutions, threatened the traditional
balance of power in authoritarian enclaves where economic and political elites held a significant
amount of both institutionalized and illegal (violent) power, a feature that is typical of countries
with an uneven distribution of functioning institutions.48
In this paper we show that left-wing party victories in mayoral elections in Colombia trig-
gered a surge in attacks by right-wing paramilitaries. As predicted in Acemoglu and Robinson
(2008)’s theory about the persistence of power and elites in weakly-institutionalized environ-
ments, we interpret this increase in violence as a de facto reaction of local political and economic
elites to counteract the increase in the de jure power of traditional outsiders. We rule out sev-
eral alternative hypotheses and provide evidence of mechanisms that support this interpretation.
For instance, we show that the surge in violence is concentrated in the year of the subsequent
election, which gives left-wing parties in Colombia a large incumbency disadvantage.
Our interpretation, however, raises some important questions. For example, why did political
elites agree to open up the political system in the first place? If they were powerful enough
to respond to the electoral success of outsiders with violence, shouldn’t they have been able
to prevent reforms that threatened their local monopoly of power? We posit that this is due
to two main reasons. First, the reform that introduced local elections in 1986 was promoted
by the central government (as an outgrowth of its peace negotiation with the rebels), not by
the local elites. In turn, the 1991 constitution (which complemented the 1986 reform) was
promoted by a student movement calling for a Constitutional Assembly. Hence, these reforms
were largely imposed exogenously on local elites, and thus their only alternative was to respond
with strategies of boundary control that, given the low state capacity across the country, were
able to coexist with democratizing national reforms (Robinson, 2013, 2016). The second reason
has to do with uncertainty about the outcome of future elections. Traditional political groups
may have overestimated their electoral success (or underestimated the appeal of outsiders), thus
gambling their chances of losing power when the reform was adopted.
Another important question is why is there violence when the left wins? And, relatedly, why
is there no violence when other non-left parties win? We argue that this relates to the combina-
tion of the persistent de facto power of traditionally strong elites and the relative convergence in
48This feature has been the focus of the “subnational authoritarianism” strand of political science literature,which emphasizes the coexistence of national-level democratization and local authoritarianism (see (Gibson,2014)).
25

policy platforms among traditional parties. Given Colombia’s history of political exclusion and
the power-sharing pact between traditional parties, the entry of the excluded left, with its rad-
ically different policy preferences, makes it hard to bargain a policy compromise. This creates
incentives for a de facto reaction by traditional insiders. The nature of connections between the
local elites and paramilitary groups in Colombia – which features institutional capture, state
acquiescence, and strong connections to legal structures (Romero, 2004; Centro Nacional de
Memoria Historica, 2014) – facilitates paramilitary violence. In contrast, the election of tradi-
tional politicians from non-leftist parties with similar policy preferences constitutes no threat to
local elites, and thus violence perpetrated by insiders is unlikely. Finally, left-wing sympathiz-
ers do not systematically respond violently when non-left challengers are elected mayor because
they do not enjoy such close links with the local political establishment and security forces.
One implication of our findings is that several dimensions of institutions must effectively
function together in order for democracy to prosper. Open elections that are not accompanied
by a state monopoly over violence, or by checks and balances against the disproportional ac-
cumulation of political power in the hands of a few individuals, may have unintended negative
consequences. The absence of strong and functioning institutions across all dimensions is likely
to lead to see-saw effects in elites’ use of different forms of power. When democratizing reforms
strengthen political institutions, elites may simply switch their investments away from the for-
mal or de jure exercise of political power, and towards other more violent means to preserve
their influence and power. Our findings are thus relevant in other countries in which the political
system is opened up in a context of weak institutions and informal means of local authoritarian
control over the territory. This has been the case in many developed countries, and is the case
today in several developing countries with nominally democratic regimes.
Fox (1994) discusses democratization in Latin America and the attempts to eliminate local
authoritarian enclaves. Examples include the uneven nature of state democratization in Mex-
ico, where the PRI has held onto power via violent means: “This pattern was most notable
in Michoacan, the only state where the PRD had a serious chance of winning a governor-
ship. (...) Political violence against the opposition went unpunished” (p.112). Gibson (2014),
when referring to Santiago del Estero in Argentina, also notes that “where institutional con-
trol and clientelism failed to neutralize opponents, outright oppression filled the void.” In the
Philippines, after the restoration of democracy in 1946, a new left-wing party representing the
organized peasantry (the Democratic Alliance, DA), participated in legislative elections despite
being violently repressed by the private armies of landlords, and won legislative races in six con-
gressional districts. However, an elite-controlled Congress illegally refused to allow the DA to
take its seats (Franco, 2001). Even in the US South, where authoritarian enclaves could devise
strategies of control through “perfectly legal” means, “the mixes of boundary-control strate-
gies –violent and nonviolent, legal and illegal – shifted with features of the national territorial
regime” (Gibson, 2014, p.73).
26

References
Acemoglu, D., Garcıa-Jimeno, C., & Robinson, J. A. (2015, August). State capacity and eco-nomic development: A network approach. American Economic Review , 105 (8), 2364-2409. Retrieved from http://www.aeaweb.org/articles?id=10.1257/aer.20140044
doi: 10.1257/aer.20140044Acemoglu, D., & Robinson, J. A. (2006). Economic origins of dictatorship and democracy.
Cambridge: Cambridge : Cambridge University Press.Acemoglu, D., & Robinson, J. A. (2008). Persistence of power, elites, and institutions. American
Economic Review , 98 (1), 267–93. Retrieved from http://www.aeaweb.org/articles
.php?doi=10.1257/aer.98.1.267 doi: 10.1257/aer.98.1.267Acemoglu, D., Robinson, J. A., & Santos, R. J. (2013). The monopoly of violence: Evidence
from Colombia. Journal of the European Economic Association, 11 , 5–44. Retrievedfrom http://dx.doi.org/10.1111/j.1542-4774.2012.01099.x doi: 10.1111/j.1542-4774.2012.01099.x
Acevedo, K. M., & Bornacelly, I. D. (2014, July). Panel Municipal del CEDE (DocumentosCEDE No. 2014-26). Universidad de los Andes-CEDE. Retrieved from https://ideas
.repec.org/p/col/000089/012223.html
Bandiera, O., & Levy, G. (2011). Diversity and the power of the elites in demo-cratic societies: Evidence from Indonesia. Journal of Public Economics, 95 (11–12),1322 - 1330. Retrieved from http://www.sciencedirect.com/science/article/pii/
S0047272711000533 (Special Issue: International Seminar for Public Economics on Nor-mative Tax Theory) doi: http://dx.doi.org/10.1016/j.jpubeco.2011.04.002
Benoit, J.-P., & Dubra, J. (2013). On the problem of prevention. International EconomicReview , 54 (3), 787–805. Retrieved from http://dx.doi.org/10.1111/iere.12017 doi:10.1111/iere.12017
Bruce, R., & Rocha, R. (2014, June). The Reaction of Elites in a Democratization Process: Ev-idence from Brazil (Working Papers, Department of Economics No. 2014-09). Universityof Sao Paulo (FEA-USP).
Budge, I., Bara, J., Volkens, A., & Klingemann, H. (2001). Mapping policy preferences: Esti-mates for parties, electors and governments, 1945-98. Oxford University Press.
Bushnell, D. (1993). The making of modern Colombia : a nation in spite of itself. Berkeley:Berkeley : University of California Press.
Calonico, S., Cattaneo, M. D., & Titiunik, R. (2014). Robust nonparametric confidence intervalsfor regression-discontinuity designs. Econometrica, 82 (6), 2295–2326. Retrieved fromhttp://dx.doi.org/10.3982/ECTA11757 doi: 10.3982/ECTA11757
Casper, G., & Taylor, M. M. (1996). Negotiating democracy: Transitions from authoritarianrule. University of Pittsburgh Press.
Centro Nacional de Memoria Historica. (2013). ¡basta ya! Colombia: Memorias de guerra ydignidad. Bogota: Pro-Off Set.
Centro Nacional de Memoria Historica. (2014). Silenciar la democracia. Las masacres deRemedios y Segovia, 1982 - 1997 (2nd ed.). Bogota: CNMH.
Chacon, M., Robinson, J. A., & Torvik, R. (2011). When is democracy an equilibrium? theoryand evidence from Colombia’s La Violencia. Journal of Conflict Resolution, 55 (3), 366-396.
Collins Jr, E., & Cole, T. M. (1996). Regime legitimation in instances of coup-causedgovernments-in-exile: The cases of presidents Makarios and Aristide. J. Int’l L. & Prac.,5 , 199.
Davenport, C. (1997). From ballots to bullets: an empirical assessment of how national electionsinfluence State uses of political repression. Electoral Studies(4), 517-541.
27

Davenport, C. (2007). State repression and political order. Annual Review of Political Science,10 , 1–23. doi: 10.1146/annurev.polisci.10.101405.143216
Davila, A. (1992). “¿Del bipartidismo a un nuevo sistema de partidos? crisis, constituyente yreconstruccion de un orden polıtico democratico en Colombia (No. 3).
Davila, A. (1999). Clientelismo intermediacion y represetacion polıtica en Colombia: ¿que hapasado en los noventa? (No. Julio-Diciembre).
Dudley, S. S. (2004). Walking ghosts : murder and guerilla politics in Colombia. New York,London: New York, London : Routledge.
Duncan, G. (2007). Los sennores de la guerra. Bogota: Editorial Planeta Colombiana.Eifert, B., Miguel, E., & Posner, D. N. (2010). Political competition and ethnic identification in
Africa. American Journal of Political Science, 54 (2), 494–510. Retrieved from http://
dx.doi.org/10.1111/j.1540-5907.2010.00443.x doi: 10.1111/j.1540-5907.2010.00443.x
Fergusson, L., & Vargas, J. F. (2013, February). Don’t Make War, Make Elections. Fran-chise Extension and Violence in XIXth-Century Colombia (DOCUMENTOS CEDE No.010584). UNIVERSIDAD DE LOS ANDES-CEDE. Retrieved from http://ideas.repec
.org/p/col/000089/010584.html
Fergusson, L., Vargas, J. F., & Vela, M. A. (2013, February). Sunlight Disinfects? FreeMedia in Weak Democracies (DOCUMENTOS CEDE No. 010487). UNIVERSIDAD DELOS ANDES-CEDE. Retrieved from http://ideas.repec.org/p/col/000089/010487
.html
Fox, J. (1994). Latin America’s emerging local politics. Journal of Democracy , 5 (2), 105–116.Franco, J. C. (2001). Elections and democratization in the philippines. Routledge. Retrieved
from https://books.google.com/books?id=fAq9kgbKBAUC
Franzese, R. (2007). Multicausality, context-conditionality, and endogeneity. Oxford UniversityPress.
Galindo-Silva, H. (2015). New parties and policy outcomes: Evidence from colombian localgovernments. Journal of Public Economics, 126 , 86 - 103. Retrieved from http://
www.sciencedirect.com/science/article/pii/S0047272715000560 doi: http://dx.doi.org/10.1016/j.jpubeco.2015.04.001
Gelman, A., & Huang, Z. (2008). Estimating incumbency advantage and its variation, asan example of a before–after study. Journal of the American Statistical Association,103 (482), 437-446. doi: 10.1198/016214507000000626
Gelman, A., & Imbens, G. (2014, August). Why high-order polynomials should not be used inregression discontinuity designs (Working Paper No. 20405). National Bureau of EconomicResearch. Retrieved from http://www.nber.org/papers/w20405 doi: 10.3386/w20405
Gibson, E. (2005). Boundary control: Subnational authoritarianism in democratic countries.World Politics, 58 (1), 101-132.
Gibson, E. (2014). Boundary control: Subnational authoritarianism in federal democracies.Cambridge University Press.
Giraldo, F., Lozada, R., & Munoz, P. (2001). Colombia: Elecciones 2000. Pontificia UniversidadJaveriana, Bogota.
Giraudy, A. (2010). The politics of subnational undemocratic regime reproduction in Argentinaand Mexico. Journal of Politics in Latin America, 2 (2), 53-84.
Gutierrez-Sanin, F. (2008). Telling the difference: Guerrillas and paramilitaries in the Colom-bian war. Politics & Society,(36), 3-34.
Gutierrez-Sanın, F. (2008). Telling the difference: Guerrillas and paramilitaries in the Colom-bian war. Politics & Society , 36 (1), 3-34. doi: 10.1177/0032329207312181
Gutierrez-Sanin, F., & Baron, M. (2005). Re-stating the state: Paramilitary territorial controland political order in Colombia, 1978-2004 (Tech. Rep.). London: London School ofEconomics. (Crisis States Program, Working Paper #1)
28
Horowitz, D. (1993). Democracy in divided societies. Journal of Democracy(4), 18-38.Huntington, S. P. (1991). The third wave: Democratization in the late twentieth century.
University of Ockalhoma Press.Imbens, G., & Kalyanaraman, K. (2012). Optimal bandwidth choice for the regression disconti-
nuity estimator. The Review of Economic Studies, 79 (3), 933–959. Retrieved 2014-05-09,from http://restud.oxfordjournals.org/content/79/3/933.short
Keefer, P. E. (2012). Database of political institutions: Changes and variable definitions. 2012.Development Research Group. The World Bank .
Klasnja, M. (2015). Corruption and the incumbency disadvantage: Theory and evidence. TheJournal of Politics, 77 (4), 928-942.
Klasnja, M., & Titiunik, R. (in press). The incumbency curse: Weak parties, term limits, andunfulfilled accountability. American Political Science Review .
Kurzman, C., Werum, R., & Burkhart, R. (2002). Democracy’s effect on economic growth:A pooled time-series analysis, 1951–1980. Studies in Comparative International Devel-opment , 37 (1), 3–33. Retrieved from http://dx.doi.org/10.1007/BF02686336 doi:10.1007/BF02686336
Leal-Buitrago, F., & Davila, A. (1990). Clientelismo: El sistema polıtico y su expresion regional.Bogota: Instituto de Estudios Polıticos y Relaciones Internacionales.
Lee, D. S. (2008, February). Randomized experiments from non-random selection in U.S. houseelections. Journal of Econometrics, 675–697.
Lee, D. S., & Lemieux, T. (2010, June). Regression discontinuity designs in economics. Journalof Economic Literature, 48 , 281–355.
Mahoney, J., & Villegas, C. (2007). Historical enquiry and comparative politics. Oxford Uni-versity Press.
Maldonado, A. (2001, November). Evaluacion de la decentralizacion municipal en colom-bia. avances y resultados de la descentralizacion polıtica en Colombia (ARCHIVOS DEECONOMIA No. 002625). DEPARTAMENTO NACIONAL DE PLANEACION. Re-trieved from http://ideas.repec.org/p/col/000118/002625.html
Martinez, L. R. (2016). Sources of revenue and government performance: Evidence fromColombia. Unpublished , London School of Economics.
McCrary, J. (2008, February). Manipulation of the running variable in the regression disconti-nuity design - a density test. Journal of Econometrics, 142 (2).
Mulligan, C. B., Gil, R., & Sala-i Martin, X. (2004). Do democracies have different publicpolicies than nondemocracies? Journal of Economic Perspectives, 18 (1), 51-74. Retrievedfrom http://www.aeaweb.org/articles.php?doi=10.1257/089533004773563430 doi:10.1257/089533004773563430
Pachon, M., & Sanchez, F. (2014). Base de datos sobre resultados electorales cede. 1958 – 2011.Documentos CEDE .
Raga, J. C. R., & Botero, F. (2006). Ordenando el caos: Elecciones legislativas y reformaelectoral en colombia. Revista de Cienca Poıtica, 26 (1), 138-151.
Regan, P. M., & Henderson, E. A. (2002, February). Democracy, threats and political repressionin developing countries: Are democracies internally less violent? Third World Quarterly ,23 (1), 119–136. Retrieved from http://www.jstor.org/stable/3993579 doi: 10.2307/3993579
Restrepo, J., Vargas, J., & Spagat, M. (2003). The dynamics of the Colombian civil conflict:A new data set.
Roberts, A. (2008). Hyperaccountability: economic voting in central and eastern europe.Electoral Studies, 27 (3), 533-546.
Robinson, J. A. (2013). Colombia: Another 100 years of solitude? Current History , 112 (751),43-48.
Robinson, J. A. (2016). La miseria en Colombia. Desarrollo y Sociedad , 76 (1), 1-70.
29

Romero, M. (2004). Democratizacion polıtica y contra reforma paramilitar en colombia. InG. Sanchez & E. Lair (Eds.), Violencias y estrategias colectivas en la region andina:Bolivia, Colombia, Ecuador, Peru y Venezuela. Grupo Editorial Norma-IFEA.
Safford, F., & Palacios, M. (2002). Colombia: Fragmented land, divided society. OxfordUniversity Press.
Sahin, Y., & Linz, J. J. (1995). Between states: Interim governments and democratic transitions.Cambridge University Press.
Sidel, J. (2014). Economic foundations of subnational authoritarianism: insights and evidencefrom qualitative and quantitative research. Democratization, 21 (1), 161-184.
Snyder, J. (2000). From voting to violence: Democratization and nationalist conflict. W. W.Norton & Company.
Snyder, J. L. (2000). From voting to violence: democratization and nationalist conflict. NewYork: New York: Norton.
Steele, A. (2011). Electing displacement: Political cleansing in apartado, colombia. Journal ofConflict Resolution(3), 423-445.
Uppal, Y. (2009). The disadvantaged incumbents: Estimating incumbency effects in Indianstate legislatures. Public Choice, 138 (1/2), 9-27.
Vargas, J. F. (2009, February). Military Empowerment and Civilian Targeting in Civil War(HiCN Working Papers No. 56). Households in Conflict Network. Retrieved from http://
ideas.repec.org/p/hic/wpaper/56.html
Vargas, J. F., & Villaveces, J. (2016). Rural property tax revenue in the face of economicconcentration and political competition: Evidence from Colombia (Tech. Rep.).
30

Tables
Table 1: Descriptive Statistics of main variables(Sample: Electoral races in which left-wing parties won or came second: 1997-
2014)
Mean Std. Dev. Minimum Median Maximum
Panel A. Average yearly attacks per 100,000 inhabitants during government periodParamilitary 1.980 7.015 0.000 0.000 75.750Guerrilla 3.820 7.948 0.000 0.065 89.908Government 0.663 2.561 0.000 0.000 35.224
Panel B. Average yearly clashes per 100,000 inhabitants during government periodGuerrilla-Paramilitary 0.169 0.930 0.000 0.000 7.251Guerrilla-Government 2.247 4.912 0.000 0.000 51.322Paramilitary-Government 0.074 0.691 0.000 0.000 10.093
Panel C. Mean occurrence of land cadaster updates during government periodLand cadaster update 0.233 0.424 0.000 0.000 1.000
Panel D. Mean occurrence of corruption episodes during government periodMayor is...Investigated 0.204 0.404 0.000 0.000 1.000Found Guilty 0.121 0.327 0.000 0.000 1.000Impeached 0.089 0.286 0.000 0.000 1.000
Top local official is...Investigated 0.064 0.245 0.000 0.000 1.000Found Guilty 0.038 0.192 0.000 0.000 1.000Impeached 0.025 0.158 0.000 0.000 1.000
Panel E. Average value of government performance indices during government periodFiscal performance 61.687 7.950 39.210 60.793 87.715Legal rules compliance 73.278 15.581 17.020 75.562 98.170Administrative capacity 73.604 15.929 28.090 79.112 97.620
Panel F. Forcing variableV otes left−V otes non−left
V otes top 2 -0.012 0.133 -0.500 -0.000 0.382
|V otes left−V otes non−leftV otes top 2 | 0.094 0.095 0.000 0.067 0.500
Panel G. Forcing variable within bandwidth:V otes left−V otes non−left
V otes top 2 0.004 0.047 -0.093 0.007 0.091
|V otes left−V otes non−leftV otes top 2 | 0.040 0.026 0.000 0.034 0.093
Notes: Number of observations: 254 in Panels A-C and F (corresponding to 193 municipalities); 157 inPanel D (only available since 2000); and 157 in panel G. In Panel E there are 152 observations for fiscalperformance (only available since 2000), and 94 observations for the indices of legal rules complianceand administrative capacity (only available for 2007 and 2011). In Panels A-F the sample includes allmayoral elections where a left-wing party is either the winner or the runner-up and the correspondingvariable is available. The sample in Panel G is restricted to Calonico et. al (2014)’s optimal bandwidth(corresponding to the estimate of the effect of left-wing electoral victories on paramilitary attacks, withfirst-degree local polynomials and no controls.
31

Table 2: Effect of electing a left-wing mayor on paramilitary attacks
Dependent variable: Average yearly paramilitary attacks per 100,000 inhabitants during term in officeLinear polynomials Quadratic polynomials
(1) (2) (3) (4) (5) (6) (7) (8)
Panel A: Non-parametric estimates
Left-wing mayor elected 4.351** 5.258** 6.366*** 6.757*** 5.750** 5.321** 6.121** 6.300**(2.200) (2.247) (2.401) (2.555) (2.385) (2.348) (2.471) (2.594)
Observations 157 121 106 100 186 136 156 143Bandwidth 0.0930 0.0620 0.0520 0.0480 0.119 0.0770 0.0930 0.0810
Panel B: Parametric estimates
Left-wing mayor elected 3.688* 3.564 3.520 3.561 5.225** 5.221** 5.782** 5.880**(2.075) (2.217) (2.186) (2.292) (2.466) (2.529) (2.670) (2.864)
Observations 144 144 143 143 144 144 143 143Bandwidth 0.0930 0.0930 0.0930 0.0930 0.0930 0.0930 0.0930 0.0930Notes: Standard errors in parentheses. * is significant at 10%, ** 5%, and *** 1% level. Calonico et al. (2014) optimalbandwidth and triangular kernel weights in all columns. In Columns 1 to 4 and in Columns 5 to 8 of Panel A, the (unknown)polynomial is approximated with local linear and quadratic polynomials respectively. All regressions in Panel A include thebias correction and robust standard errors of Calonico et al. (2014). Panel B reports parametric OLS estimates that vary thepolynomial degree consistently with Panel A. Columns 1 and 5 include no controls. All the other columns include pre-determinedcontrols: columns 2 and 6 include geographic controls (altitude, average historical rainfall, distance (in km) to Bogota and to theclosest market place), and region dummies (Caribbean, Eastern, Andean and Pacific); Columns 3 and 7 include socio-economiccontrols (vote share for left and right presidential candidates in 1994 elections, rurality index, total population, literacy indexin 1993, presence of coca plantations in 1994 and historic incidence of political violence during La Violencia civil war in themid 20th century); and Columns 4 and 8 include all the controls simultaneously.
32
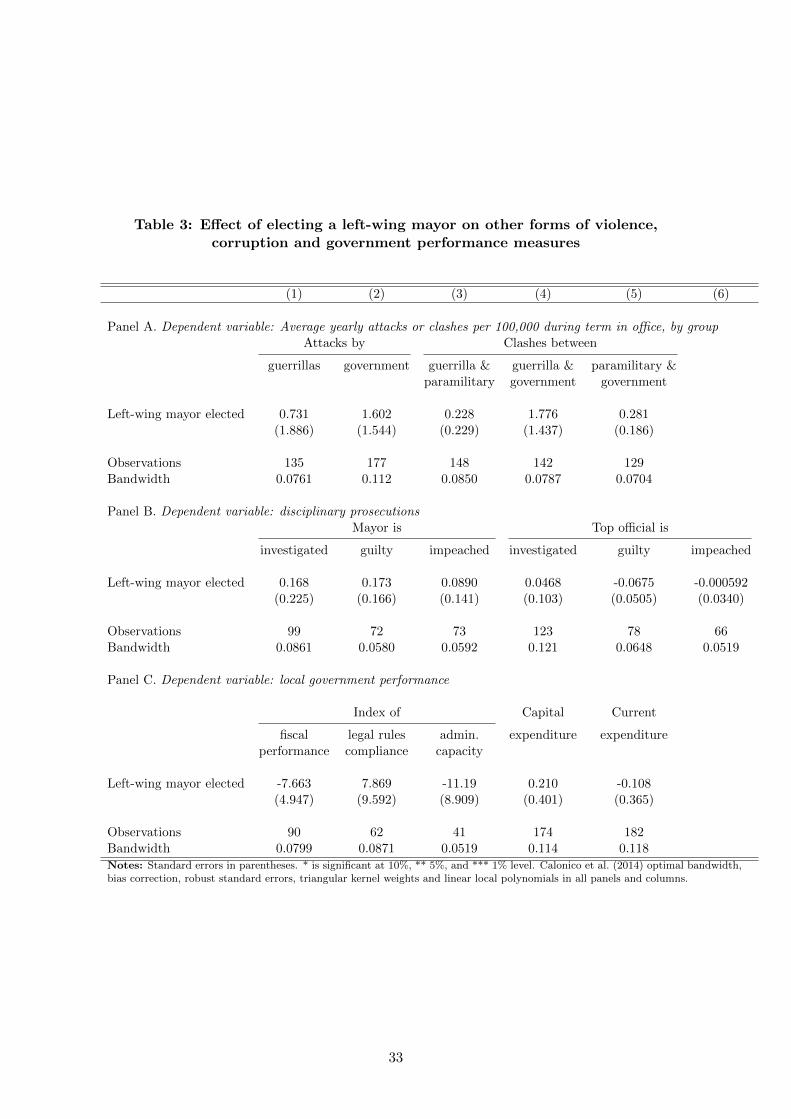
Table 3: Effect of electing a left-wing mayor on other forms of violence,corruption and government performance measures
(1) (2) (3) (4) (5) (6)
Panel A. Dependent variable: Average yearly attacks or clashes per 100,000 during term in office, by groupAttacks by Clashes between
guerrillas government guerrilla & guerrilla & paramilitary ¶military government government
Left-wing mayor elected 0.731 1.602 0.228 1.776 0.281(1.886) (1.544) (0.229) (1.437) (0.186)
Observations 135 177 148 142 129Bandwidth 0.0761 0.112 0.0850 0.0787 0.0704
Panel B. Dependent variable: disciplinary prosecutionsMayor is Top official is
investigated guilty impeached investigated guilty impeached
Left-wing mayor elected 0.168 0.173 0.0890 0.0468 -0.0675 -0.000592(0.225) (0.166) (0.141) (0.103) (0.0505) (0.0340)
Observations 99 72 73 123 78 66Bandwidth 0.0861 0.0580 0.0592 0.121 0.0648 0.0519
Panel C. Dependent variable: local government performance
Index of Capital Current
fiscal legal rules admin. expenditure expenditureperformance compliance capacity
Left-wing mayor elected -7.663 7.869 -11.19 0.210 -0.108(4.947) (9.592) (8.909) (0.401) (0.365)
Observations 90 62 41 174 182Bandwidth 0.0799 0.0871 0.0519 0.114 0.118Notes: Standard errors in parentheses. * is significant at 10%, ** 5%, and *** 1% level. Calonico et al. (2014) optimal bandwidth,bias correction, robust standard errors, triangular kernel weights and linear local polynomials in all panels and columns.
33

Table 4: Effect of electing a right-wing mayor on violence
Dependent variable: Average yearly attacks per 100,000 during term in office by:All groups Paramilitary Guerrilla Government
(1) (2) (3) (4)
Panel A. Non-parametric estimates
Right-wing mayor elected 0.440 0.175 0.0440 -0.543**(1.124) (0.612) (0.143) (0.274)
Observations 386 380 269 437Bandwidth 0.0657 0.0644 0.0443 0.0754
Panel B. Parametric estimates
Right-wing mayor elected 0.274 0.186 0.0198 -0.508**(0.864) (0.472) (0.118) (0.229)
Observations 386 378 268 436Bandwidth 0.0660 0.0640 0.0440 0.0750Notes: Standard errors in parentheses. * is significant at 10%, ** 5%, and *** 1% level.Calonico et al. (2014) optimal bandwidth, bias correction, robust standard errors, triangularkernel weights and linear local polynomials in all panels and columns.
34

Table 5: Effect of electing a left-wing mayor on paramilitary attacksHeterogeneous effects by timing of AUC demobilization
Dependent variable: Average yearly paramilitary attacks per 100,000 duringterm in office
(1) (2)
A Left-wing mayor elected 5.659** 7.332**(2.343) (2.942)
Post AUC demobilization 2.337 2.341(1.792) (1.796)
B Post AUC demobilization × Left-wing mayor elected -5.345** -5.429**(2.304) (2.336)
Constant -0.435 -1.083(0.483) (0.872)
A + B .314 1.903
Ho: A + B = 0F-statistic .02 .86P-value .88 .36
(Local) polynomial order 1 2Notes: Standard errors in parentheses. * is significant at 10%, ** 5%, and *** 1% level.Parametric estimates. Triangular kernel weights, bias correction and optimal bandwidth ofCalonico et al. (2014) in all columns.
35

Table 6: Effect of electing a left-wing mayor on paramilitary attacksHeterogeneous effects by year of violence after the election
Dependent variable: Average yearly paramilitary attacks per100,000 inhabitants in year... of term in office
Year 1 Year 2 Year 3 Nextelection
(1) (2) (3) (4)
Left-wing mayor elected 4.783 -1.203 10.90* 18.48(3.375) (1.410) (6.355) (11.56)
Observations 148 149 150 100Bandwidth 0.0842 0.0860 0.0881 0.0677Notes: Standard errors in parentheses. * is significant at 10%, ** 5%,and *** 1% level. Calonico et al. (2014) optimal bandwidth, bias cor-rection, robust standard errors, triangular kernel weights and linear localpolynomials in all panels and columns.
36
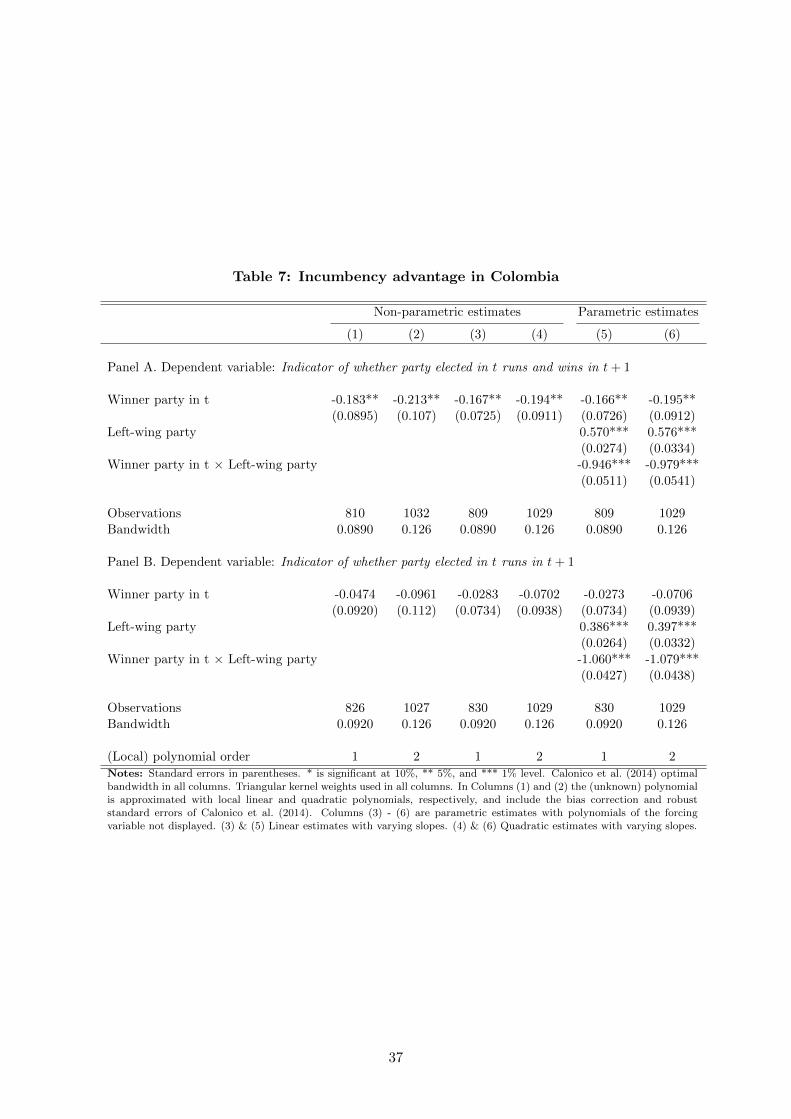
Table 7: Incumbency advantage in Colombia
Non-parametric estimates Parametric estimates
(1) (2) (3) (4) (5) (6)
Panel A. Dependent variable: Indicator of whether party elected in t runs and wins in t+ 1
Winner party in t -0.183** -0.213** -0.167** -0.194** -0.166** -0.195**(0.0895) (0.107) (0.0725) (0.0911) (0.0726) (0.0912)
Left-wing party 0.570*** 0.576***(0.0274) (0.0334)
Winner party in t × Left-wing party -0.946*** -0.979***(0.0511) (0.0541)
Observations 810 1032 809 1029 809 1029Bandwidth 0.0890 0.126 0.0890 0.126 0.0890 0.126
Panel B. Dependent variable: Indicator of whether party elected in t runs in t+ 1
Winner party in t -0.0474 -0.0961 -0.0283 -0.0702 -0.0273 -0.0706(0.0920) (0.112) (0.0734) (0.0938) (0.0734) (0.0939)
Left-wing party 0.386*** 0.397***(0.0264) (0.0332)
Winner party in t × Left-wing party -1.060*** -1.079***(0.0427) (0.0438)
Observations 826 1027 830 1029 830 1029Bandwidth 0.0920 0.126 0.0920 0.126 0.0920 0.126
(Local) polynomial order 1 2 1 2 1 2Notes: Standard errors in parentheses. * is significant at 10%, ** 5%, and *** 1% level. Calonico et al. (2014) optimalbandwidth in all columns. Triangular kernel weights used in all columns. In Columns (1) and (2) the (unknown) polynomialis approximated with local linear and quadratic polynomials, respectively, and include the bias correction and robuststandard errors of Calonico et al. (2014). Columns (3) - (6) are parametric estimates with polynomials of the forcingvariable not displayed. (3) & (5) Linear estimates with varying slopes. (4) & (6) Quadratic estimates with varying slopes.
37

Table 8: Effect of electing a left-wing mayor on land registry updates
Dep. variable: Indicator of whether registry was updated during term in officeNon-parametric Parametric estimates
estimates
(1) (2) (3) (4) (5) (6)
Left-wing mayor elected 0.173 0.140 0.157 0.0622 0.116 0.0250(0.177) (0.201) (0.141) (0.201) (0.148) (0.208)
Years since cadastral update 0.0119* 0.0108(0.00693) (0.00688)
Observations 148 194 148 148 148 148Bandwidth 0.0851 0.127 0.0850 0.0850 0.0850 0.0850(Local) polynomial order 1 2 1 2 1 2
Notes: Standard errors in parentheses. * is significant at 10%, ** at 5%, and *** at 1% level. Calonico etal. (2014) optimal bandwidth in all columns. Triangular kernel weights used in all columns. In Columns(1) and (2) the (unknown) polynomial is approximated with local linear and quadratic polynomials, re-spectively, and we report the bias correction and robust standard errors of Calonico et al. (2014).
Figures
Figure 1: Brief historical timeline
Source: Authors’ own.
38

Figure 2: Election years and available data
Source: Authors’ own.
39

Figure 3: Geographical distribution of electoral races in which a left-wing partywon or came second, 1997–2011
Notes: Light gray lines indicate the municipality boundaries. Black circles are drawn in the centroid of munici-palities that, during our sample period, elected a left-wing candidate as mayor or runner-up. Diamonds indicateclose elections, as defined by the optimal bandwidth of Calonico et al. (2014).
40

Figure 4: Effect of electing a left-leaning mayor on paramilitary attacks-2
02
46
8Pa
ram
ilitar
y at
tack
s pe
r 100
,000
-.1 -.05 0 .05 .1Relative vote share for left party
-50
510
Para
milit
ary
atta
cks
per 1
00,0
00
-.1 -.05 0 .05 .1Relative vote share for left party
Notes: Observations within Calonico et al. (2014)’s bandwidth displayed. Left: linear fit. Right: quadratic fit.10 bins of equal size at each side of the cutoff.
41

Figure 5: Effect of electing a left-leaning mayor on measures of violence
Attacks during term in office by groupPanel A. Paramilitary Panel B. Guerrilla Panel C. Government
-1.5
-1-.5
0.5
11.
5St
anda
rd D
evia
tions
0 .1 .2 .3 .4 .5Bandwidth
-1.5
-1-.5
0.5
11.
5St
anda
rd D
evia
tions
0 .1 .2 .3 .4 .5Bandwidth
-1.5
-1-.5
0.5
11.
5St
anda
rd D
evia
tions
0 .1 .2 .3 .4 .5Bandwidth
Attacks during previous term in office by groupPanel D. Paramilitary Panel E. Guerrilla Panel F. Government
-1.5
-1-.5
0.5
11.
5St
anda
rd D
evia
tions
0 .1 .2 .3 .4 .5Bandwidth
-1.5
-1-.5
0.5
11.
5St
anda
rd D
evia
tions
0 .1 .2 .3 .4 .5Bandwidth
-1.5
-1-.5
0.5
11.
5St
anda
rd D
evia
tions
0 .1 .2 .3 .4 .5Bandwidth
Attacks in year before elections by groupPanel G. Paramilitary Panel H. Guerrilla Panel I. Government
-1.5
-1-.5
0.5
11.
5St
anda
rd D
evia
tions
0 .1 .2 .3 .4 .5Bandwidth
-1.5
-1-.5
0.5
11.
5St
anda
rd D
evia
tions
0 .1 .2 .3 .4 .5Bandwidth
-1.5
-1-.5
0.5
11.
5St
anda
rd D
evia
tions
0 .1 .2 .3 .4 .5Bandwidth
42

Figure 6: McCrary test: Sorting around the winning threshold for the left
02
46
Den
sity
-.5 -.4 -.3 -.2 -.1 0 .1 .2 .3 .4 .5Relative vote share for left party
Each point represents a bin. Bin size is .017Discontinuity estimate (standard error): .09 (.237)
43

Online Appendix
(Not for publication)
A Data appendix: description of coding protocol and variables
A.1 Coding left-wing and right-wing parties
In this appendix we explain the classification of parties into left-wing, right-wing, or neitherleft- nor right-wing. We apply the following procedure to the 505 parties that either won orcame second in mayoral elections during our sample period.49
1. As in Keefer (2012), we first code parties as left-leaning if they self-define, based ontheir name, motto, or slogan as “communist,” “socialist,” “social democratic,” or simply“left-wing.” The parallel terms for right-leaning parties are “conservative,” “Christiandemocratic,” or “right-wing.”50 Most parties, however, cannot be classified based on thiscriterion, in which case we move to step 2.51
2. When available, we look at the party statutes and, following Budge et al. (2001), code theparty as left-wing if at least three of the following five policy stances are present in thedocument:
(a) pro-peasant or social re-vindication in nature,
(b) more market regulation,
(c) defense of workers’ rights against exploitation,
(d) defense of state-owned or communal property rights,
(e) anti-imperialism.
Also following Budge et al. (2001), we code the party as right-wing if at least three of thefollowing five policy stances are mentioned in its statutes:
(a) emphasis on economic growth/development over inequality and redistribution,
(b) endorsement of free-market, orthodox policies, a limited role for the state, and thepromotion of private enterprises,
(c) family and religion as crucial moral pillars of society,
(d) appeal to patriotism and/or nationalism and the suspension of some freedoms inorder to protect the state against subversion,
(e) priority of law and order and a military approach to preserve the state’s monopolyof violence.
Parties that, according to their statutes, are neither left- nor right-wing are classified asneither.52 If the party statutes are not available, we apply the next criterion.
49It is worth noting that 78 of these parties (15% of the 505) simply represent individual politicians who ranunder their own name, even if they are often endorsed by a coalition of parties. In this case the classificationprocedure is slightly different than for actual parties, as explained in the text.
50An exception is the Colombian Conservative Party, which in spite of its right-wing origins in the 19th centuryhas been a centrist party since the start of the National Front in 1958 (see Section 2). This is confirmed by theparty’s policy stance, which is also the criterion used to classify both the Conservative and Liberal parties asneither left- nor right-wing (see criterion 2 below).
51Using this criterion, we identified eight left-leaning parties and no right-wing parties. Note that this criteriononly allows us to classify left- and right-wing parties, but cannot be used to identify those in the “neither”category; the subsequent criteria allow us to do so.
52Using this criterion, we identified seven left-leaning parties, six right-wing parties, and 15 parties that areneither left- nor right-wing.
44

3. We look at the government plan that the party drafts for each municipality/election and,as in step 2, we identify the policy stance associated with a left- or right-wing ideology.53
Parties that, according to their government plan, are neither left- nor right-wing areclassified as neither.54
4. In some robustness specifications (see Table B-1), we make further classification attempts.Some short-lived parties for which formal statutes or government plans (steps 2 and 3,respectively) are not readily available are factions of, or splinter movements from, other(well-established and thus readily classifiable) parties, or simply old parties that changedtheir name. In these cases we assign the ideology of the predecessor party. Parties that,according to their predecessor party, are neither left- nor right-wing are classified as so.55
We do not include splinter parties or factions in our baseline estimates, since this categoryrelies on the classification of other parties, and is thus indirect and probably more proneto measurement error. For these estimates we prefer to use a conservative classificationprocedure. However, as shown in Table B-1, the results are substantively unchanged if weinclude parties classified in this way.
The procedure for the 78 candidates that run under their own name is somewhat different:
1A. Because we are interested in classifying the ideology of parties, rather than individualpoliticians, we first determine whether these candidates in effect represent a coalition ofparties with a known ideological stance (using the 4-step procedure described above). Thisinformation is available from the National Registry Bureau. If this is the case, and theideology of the parties forming the coalition coincides (as either left-wing, right-wing, orneither), then the same ideology is assigned to the candidate. However, if the candidatedoes not represent a coalition, or if he/she does but the ideology of the parties formingthe coalition does not match, then we apply the next criterion.56
2A. Same as step 3 above.57
3A. Same as step 4 above.58
The resulting classification can be found online at: https://docs.google.com/spreadsheets/d/1e-3buFuLZPMqza4aeJKfQg8rrQhmMmCcYCVeulFmABg/edit?usp=sharing. The first sheet clas-sifies all 505 parties that contested local mayoral elections, and the second sheet classifies theparties that contested presidential elections (used for a robustness exercise described in footnote35). We code left-wing parties as 1, right-wing parties as 2, and parties that are neither as 3.Parties that cannot be classified according to their ideology are coded 4. We also indicate thecriterion used to make the classification (from the list above), whether the political entity isan actual party or an independent candidate, the justification for the classification, links to thesource(s) that back the choice (e.g., candidate’s government plan or National Registry Bureauwebsite that lists supporting coalitions), whether a candidate belongs to a coalition (and thenames of the parties in the coalition), the name of the predecessor party (if applicable), and acolumn with clarifying notes.
53Since all candidates running for municipal executive office are required to submit their government plan priorto the election, in principle these plans are also available for runners-up.
54Using this criterion we identified no left-leaning parties, seven right-wing parties, and classified 141 partiesas neither.
55Using this criterion, we identified nine left-leaning parties, 18 right-wing parties, and classified 105 parties asneither.
56Using this criterion, we identified no left- or right-leaning parties, and classified 36 parties as neither.57Using this criterion, we classified no left-leaning parties, three right-wing parties, and 24 parties as neither.58Using this criterion we identified no left-leaning parties, one right-wing party, and classified four parties as
neither.
45

A.2 Coding the ideological stance of victims
In this appendix we explain the classification of the ideological stance and involvement in politicsof civilian victims in paramilitary attacks following a mayoral election in which a left-wing partynarrowly won or came second. We focus on the sample of such close elections that took placeduring our period of study and identify all the paramilitary attacks that occurred during themayor’s term in office. To code the political ideology of the civilian victims of each attack, wefollow a three-step procedure:
1. We search the main national and local newspapers for detailed information about theattacks.59 If there is no information about the event, or if it is reported but the availableinformation cannot be used to classify the resulting victim(s) as left-wing activists or not(for example because of the victim’s affiliation with a union or a left-wing political party),then we turn to the next criterion.
2. We search the websites of human rights NGOs known for monitoring political violence inColombia for detailed information about the attack.60 If there is no information about theevent, or if the event is reported but the available information cannot be used to classifythe resulting victim(s) as left-wing activists or not, then we turn to the next criterion.
3. CINEP’s Noche y Niebla magazine includes narratives with specifics on all the eventsincluded in our violence data.61 Within these narratives we look for hints that can beused to classify the resulting victim(s) as left-wing militants or not.
Victims who cannot be classified as either left-wing or non-left-wing after applying the threecriteria are coded as having an “unknown” ideology.
The results from applying this protocol are used to compute the figures reported in Sec-tion 8. The entire classification can be found at https://docs.google.com/spreadsheets/
d/1U5KMlcq2yEE6OSLFV4e3hY9F1GpN48RoA0NMsGSx9Mo/pubhtml. There, in addition to speci-fying whether the victim was likely to be leftist or not, we provide links to the documentationsupporting each coding decision.
59The newspapers include El Tiempo, El Espectador, El Colombiano, El Heraldo, El Nuevo Siglo, El Paıs, andVanguardia.
60These include the World Organization Against Torture, the International Labor Organization (ILO), VerdadAbierta, Asociacion Colombiana de Juristas, and Asociacion de Cabildos de Indıgenas del Norte del Cauca.
61Recall from Section 3.2 that CINEP is the main source of this dataset.
46

A.3 Additional variables
The main source for variables used in balance tests is the municipal panel maintained andhosted by the Center For Economic Development Studies (CEDE) at Universidad de los Andes(Acevedo & Bornacelly, 2014). Specifically, we check balance across a number of geographicand socio-economic variables, described in Table A-1.
In addition, to explore whether the policies adopted by left-wing mayors differ from thoseadopted by mayors representing other parties, we look at land registry updates, which areavailable from the national land registry agency.62 Since land is mainly taxed based on assessedvalues recorded in the registry, updates to this registry are a policy tool that can be used toincrease taxes on landowners.
Furthermore, in order to rule out the possibility that post-electoral violence following left-wing victories is driven by poorer performance by left-wing mayors relative to incumbents fromother parties, such as a weaker/ stronger fiscal management of the municipal treasury, we look atthe governance indices developed by Departamento Nacional de Planeacion (DNP, the NationalPlanning Department). Specifically we use the DNP’s “index of fiscal performance,” “indexof legal requirements,” and “index of administrative capacity.” The first index summarizes theperformance of municipal governments based on the size of the deficit and the proportion ofmunicipal income that is spent on operational costs vs. invested, as well as the proportionof income that originates from national government transfers vs. municipal tax revenue. Thesecond index assesses the compliance of the municipal administration with national rules on howto spend the central government transfers (targeted specifically at items related to improvingthe municipality health and education indicators). The third index measures the municipaladministration’s capacity to rule effectively, based on the turnover of top officials, the share oftop officials that holds a professional degree, the share of top officials with access to computers,the administration’s access to specialized software that helps automate processes, and the useof protocols for internal administrative controls.
Moreover, to make sure that post-electoral violence is not driven by the potential differentialengagement of elected left-wing mayors in corrupt practices, we build on recent work by Martinez(2016), who uses information from Procuradurıa General de la Nacion (Colombia’s WatchdogAgency), to code disciplinary prosecutions of the municipal mayor and his/her top officials, asa proxy for misbehavior.63 Specifically, the author codes whether the official was investigated,found guilty, or impeached (which entails removal from office and a temporal ban from publicservice).64
62Data for the department of Antioquia come from the department’s land registry agency, which is independentfrom the national agency.
63Unfortunately, the performance and corruption data are only available for a shorter period, which reducesthe sample we can use to test for differences on these variables. Table 1 specifies the sample years for which thesedata are available.
64Not all officials who are found guilty are impeached, as the sanction depends on the severity of the misconduct.Some guilty officials are fined.
47

Figure A-1: Violence data: examples of attacks
48
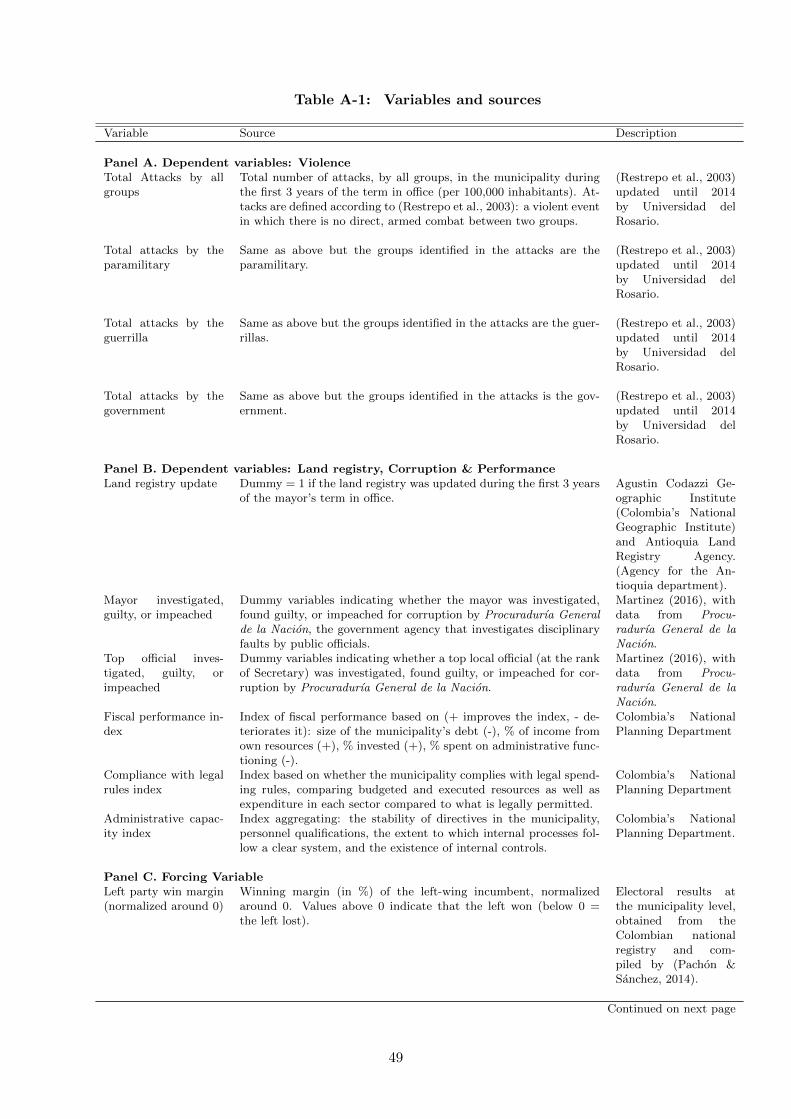
Table A-1: Variables and sources
Variable Source Description
Panel A. Dependent variables: ViolenceTotal Attacks by allgroups
Total number of attacks, by all groups, in the municipality duringthe first 3 years of the term in office (per 100,000 inhabitants). At-tacks are defined according to (Restrepo et al., 2003): a violent eventin which there is no direct, armed combat between two groups.
(Restrepo et al., 2003)updated until 2014by Universidad delRosario.
Total attacks by theparamilitary
Same as above but the groups identified in the attacks are theparamilitary.
(Restrepo et al., 2003)updated until 2014by Universidad delRosario.
Total attacks by theguerrilla
Same as above but the groups identified in the attacks are the guer-rillas.
(Restrepo et al., 2003)updated until 2014by Universidad delRosario.
Total attacks by thegovernment
Same as above but the groups identified in the attacks is the gov-ernment.
(Restrepo et al., 2003)updated until 2014by Universidad delRosario.
Panel B. Dependent variables: Land registry, Corruption & PerformanceLand registry update Dummy = 1 if the land registry was updated during the first 3 years
of the mayor’s term in office.Agustin Codazzi Ge-ographic Institute(Colombia’s NationalGeographic Institute)and Antioquia LandRegistry Agency.(Agency for the An-tioquia department).
Mayor investigated,guilty, or impeached
Dummy variables indicating whether the mayor was investigated,found guilty, or impeached for corruption by Procuradurıa Generalde la Nacion, the government agency that investigates disciplinaryfaults by public officials.
Martinez (2016), withdata from Procu-radurıa General de laNacion.
Top official inves-tigated, guilty, orimpeached
Dummy variables indicating whether a top local official (at the rankof Secretary) was investigated, found guilty, or impeached for cor-ruption by Procuradurıa General de la Nacion.
Martinez (2016), withdata from Procu-radurıa General de laNacion.
Fiscal performance in-dex
Index of fiscal performance based on (+ improves the index, - de-teriorates it): size of the municipality’s debt (-), % of income fromown resources (+), % invested (+), % spent on administrative func-tioning (-).
Colombia’s NationalPlanning Department
Compliance with legalrules index
Index based on whether the municipality complies with legal spend-ing rules, comparing budgeted and executed resources as well asexpenditure in each sector compared to what is legally permitted.
Colombia’s NationalPlanning Department
Administrative capac-ity index
Index aggregating: the stability of directives in the municipality,personnel qualifications, the extent to which internal processes fol-low a clear system, and the existence of internal controls.
Colombia’s NationalPlanning Department.
Panel C. Forcing VariableLeft party win margin(normalized around 0)
Winning margin (in %) of the left-wing incumbent, normalizedaround 0. Values above 0 indicate that the left won (below 0 =the left lost).
Electoral results atthe municipality level,obtained from theColombian nationalregistry and com-piled by (Pachon &Sanchez, 2014).
Continued on next page
49
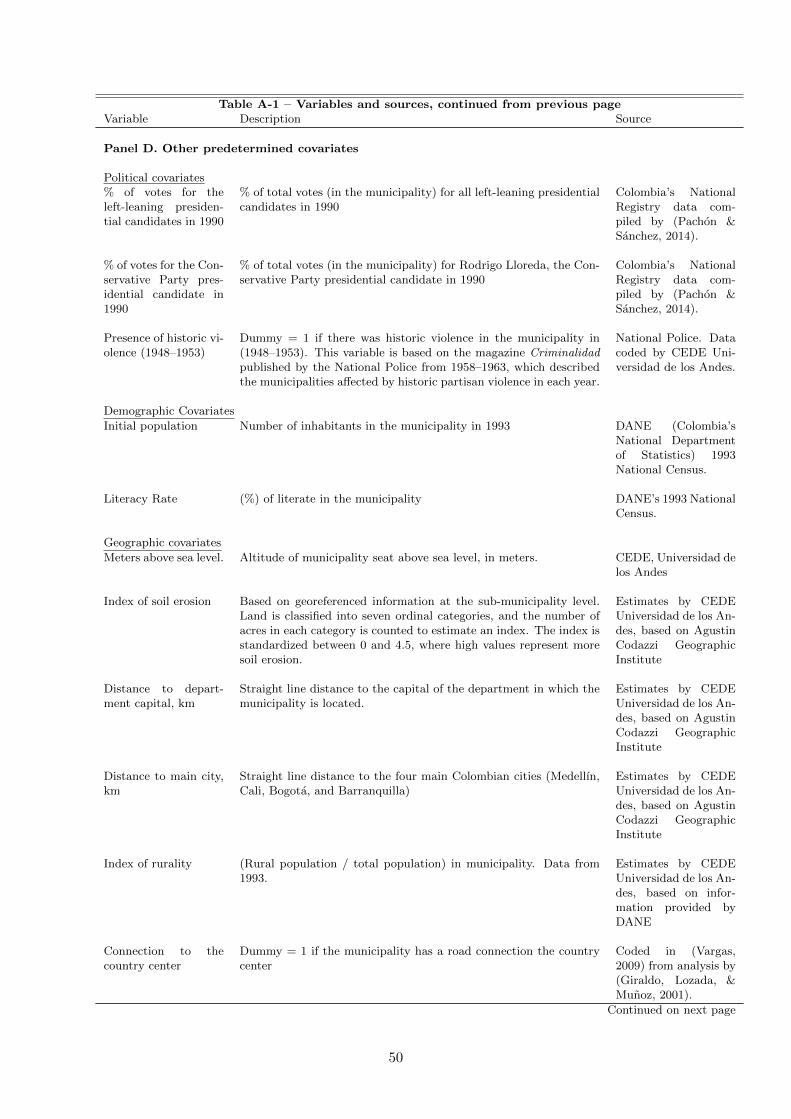
Table A-1 – Variables and sources, continued from previous pageVariable Description Source
Panel D. Other predetermined covariates
Political covariates% of votes for theleft-leaning presiden-tial candidates in 1990
% of total votes (in the municipality) for all left-leaning presidentialcandidates in 1990
Colombia’s NationalRegistry data com-piled by (Pachon &Sanchez, 2014).
% of votes for the Con-servative Party pres-idential candidate in1990
% of total votes (in the municipality) for Rodrigo Lloreda, the Con-servative Party presidential candidate in 1990
Colombia’s NationalRegistry data com-piled by (Pachon &Sanchez, 2014).
Presence of historic vi-olence (1948–1953)
Dummy = 1 if there was historic violence in the municipality in(1948–1953). This variable is based on the magazine Criminalidadpublished by the National Police from 1958–1963, which describedthe municipalities affected by historic partisan violence in each year.
National Police. Datacoded by CEDE Uni-versidad de los Andes.
Demographic Covariates
Initial population Number of inhabitants in the municipality in 1993 DANE (Colombia’sNational Departmentof Statistics) 1993National Census.
Literacy Rate (%) of literate in the municipality DANE’s 1993 NationalCensus.
Geographic covariates
Meters above sea level. Altitude of municipality seat above sea level, in meters. CEDE, Universidad delos Andes
Index of soil erosion Based on georeferenced information at the sub-municipality level.Land is classified into seven ordinal categories, and the number ofacres in each category is counted to estimate an index. The index isstandardized between 0 and 4.5, where high values represent moresoil erosion.
Estimates by CEDEUniversidad de los An-des, based on AgustinCodazzi GeographicInstitute
Distance to depart-ment capital, km
Straight line distance to the capital of the department in which themunicipality is located.
Estimates by CEDEUniversidad de los An-des, based on AgustinCodazzi GeographicInstitute
Distance to main city,km
Straight line distance to the four main Colombian cities (Medellın,Cali, Bogota, and Barranquilla)
Estimates by CEDEUniversidad de los An-des, based on AgustinCodazzi GeographicInstitute
Index of rurality (Rural population / total population) in municipality. Data from1993.
Estimates by CEDEUniversidad de los An-des, based on infor-mation provided byDANE
Connection to thecountry center
Dummy = 1 if the municipality has a road connection the countrycenter
Coded in (Vargas,2009) from analysis by(Giraldo, Lozada, &Munoz, 2001).
Continued on next page
50

Table A-1 – Variables and sources, continued from previous pageVariable Description Source
Index of soil aptitudefor agriculture
Land is categorized into seven ordinal categories based on its suit-ability for agriculture, and the number of acres in each category iscounted to estimate an index.
Estimates by CEDEUniversidad de los An-des, based on infor-mation provided byDANE
Average precipitation,in mm
Mean annual rainfall level in each municipality. IDEAM, Institute ofHydrology, Meteorol-ogy and Environmen-tal Studies
51
B Additional results and robustness tests
B.1 Robustness to party coding
Parties that could not be classified based on their name or slogan, statutes, or governmentplan were coded as neither left- nor right-wing in our baseline analysis. This may potentiallyintroduce bias if a sufficient number of such parties is actually either left- or right-wing. Oneextreme alternative is to drop all unclassified parties from the sample, at the cost of drasticallyreducing the sample size. Panel A of Table B-1 reports the robustness of our main results to thisalternative sample. The structure of the columns is the same as that of Table 2. Note that thesample size drops in all columns relative to that of the baseline regressions. Reassuringly, mostof the coefficients remain significant and of similar magnitude (4.1 to 5 additional paramilitaryattacks during the term in office).
Another approach is to use alternative criteria to code the ideological stance of partiesthat could not be classified in steps 1-3. For instance, because many of the 505 parties thatparticipated in local elections during our sample period originated from previously establishedparties (notably from the two traditional parties), we could assign to them the ideology oftheir parent party (see criterion 4 of the classification procedure described in Appendix SectionA.1). This, however, is subject to some caveats, particularly if the ideology of the faction orsplinter movement is different to that of its predecessor (which may have motivated the split).Since it is impossible to know a priori whether including this additional party classification step(that we refer to as step 4) represents an improvement over our baseline estimates, we take anagnostic position and investigate the robustness of the baseline results to using the ideology ofpredecessor parties as an additional classification criterion.
Panels B and C of Table B-1 report the estimates after using this criterion (step 4) to codethe ideology of parties that could not be classified in steps 1-3. As in the baseline results ofTable 2, Panel B assumes that all the parties left unclassified after steps 1-4 are neither left- norright-wing. In turn, similar to Panel A of Table B-1, Panel C drops from the estimation sampleall parties left unclassified after steps 1-4. Most of the point estimates (particularly in PanelB) remain statistically significant and of similar magnitude to those reported for our baselinesample (Table 2). This is reassuring, and suggests that our specific choices of party ideologyclassification are not driving our substantive findings.
52

Table B-1: Effect of electing a left-wing mayor on paramilitary attacks(Alternative samples resulting from different codings of party ideology)
Dependent variable: Average yearly paramilitary attacks per 100,000 inhabitants during term in officeLinear polynomials Quadratic polynomials
(1) (2) (3) (4) (5) (6) (7) (8)
Panel A. Dropping all unidentified parties after applying criteria 1 to 3 a
Left-wing mayor elected 2.674 2.686 4.578** 4.486*** 3.067 4.050** 4.967** 5.010**(1.761) (1.637) (1.920) (1.708) (1.872) (2.027) (2.005) (1.964)
Observations 136 114 101 97 178 114 143 122Bandwidth 0.0990 0.0770 0.0620 0.0590 0.156 0.0770 0.109 0.0820
Panel B. Coding all unidentified parties as being neither left- nor right-wing after applying criteria1 to 4 a
Left-wing mayor elected 2.736 4.227** 4.528** 4.746** 4.764** 4.351** 4.744** 4.394*(1.891) (1.931) (2.191) (2.339) (2.037) (1.898) (2.238) (2.335)
Observations 195 137 120 111 202 152 178 154Bandwidth 0.122 0.0760 0.0610 0.0540 0.129 0.0860 0.107 0.0900
Panel C. Dropping all unidentified parties after applying criteria 1 to 4 a
Left-wing mayor elected 2.057 2.184 2.917* 2.233 3.280** 3.133* 3.222* 2.668(1.541) (1.450) (1.755) (1.642) (1.593) (1.664) (1.859) (1.924)
Observations 163 142 116 124 179 137 162 141Bandwidth 0.103 0.0840 0.0630 0.0680 0.119 0.0790 0.103 0.0850Notes: Standard errors in parentheses. * is significant at 10%, ** 5%, and *** 1% level. Calonico et al. (2014) optimalbandwidth and triangular kernel weights in all columns. In Columns 1 to 4 and in Columns 5 to 8 of Panel A, the (unknown)polynomial is approximated with local linear and quadratic polynomials, respectively. All regressions in Panel A include thebias correction and robust standard errors of Calonico et al. (2014). Panel B reports parametric OLS estimates that vary thepolynomial degree consistently with Panel A. Columns 1 and 5 include no controls. All the other columns include pre-determinedcontrols: Columns 2 and 6 include geographic controls (altitude, average historic rainfall, distance (in km) to Bogota and to theclosest marketplace, and region dummies (Caribbean, Eastern, Andean, and Pacific); Columns 3 and 7 include socio-economiccontrols (vote share for left and right presidential candidates in 1994 elections, rurality index, total population, literacy indexin 1993, presence of coca plantations in 1994, and historic incidence of political violence during La Violencia. Columns 4 and 8include all the controls simultaneously.
53

B.2 Balance on covariates
In Table B-2 we report estimates of the effect of a narrow left-wing victory (Column 3) on alarge set of covariates. In Panel A we look at the election year to verify whether left-leaningcandidates were disproportionately more likely to win close races earlier or later in the sampleperiod. Panel B examines geographic variables including altitude, rainfall, and distance to maincities and the department capital. Panel C includes socio-economic and political variables, suchas having experienced violence during La Violencia in the 1940s and 1950s, and socio-economicconditions of municipalities like the share of population living in rural areas, a dummy for thepresence of coca plantations, total population, and the literacy rate (all measured prior to oursample period). In Panel D we look at variables related to land inequality and land policy,such as the number of years since the land registry was last updated, measured in the electionyear prior to when the winner of the close race would have taken office. In Panel E we look atdifferent measures of tax revenue, also measured in the election year prior to when the winnerof the close race would have taken office. Finally, Panel F focuses on basic electoral variablessuch as the average number of parties competing in the race, the average number of candidates,and overall turnout.
We find no statistically significant differences between treatment and control municipalitiesfor most of these variables. The only exception is the number of years since the land registrywas last updated, which is about 4 years higher and significant at the 95% level in municipalitiesin which the left won. However, for the remaining variables the estimated effect of a narrowleft-wing victory is both small (typically just a fraction of the mean and standard deviation)and insignificant. Thus, these are precisely estimated coefficients that allow us to reject evensmall effects. Overall, the results reported in Table B-2 give us further confidence that ourbenchmark estimates capture the causal effect of a left-wing electoral victory on paramilitaryviolence rather than the effect of other municipal characteristics.
54

Table B-2: Effect of electing a left-wing mayor on municipal characteristics
Dependent variable Mean Std. Dev. Left victory Std. Error Obs. Bandwidth(1) (2) (3) (4) (5) (6)
Panel A. Election yearYear elected 2002.701 5.447 1.257 2.426 167 .1
Panel B. Geographic characteristicsAltitude, meters 1752.587 3469.152 69.265 671.765 94 .042Average precipitation 93.010 18.665 1.505 8.379 152 .09Distance to department capital, km 81.129 53.511 -1.778 23.432 152 .089Distance to main city, km 145.999 91.279 6.226 41.881 129 .069Andean region dummy 0.417 0.494 -.128 .203 142 .08Pacific region dummy 0.398 0.490 .025 .165 156 .092Eastern region dummy 0.098 0.298 -.065 .112 126 .066Caribbean region dummy 0.087 0.282 .143 .105 166 .099
Panel C. Socioeconomic characteristicsVote % left-wing presidential cand., 1994 0.067 0.070 -.019 .019 111 .056Vote % conservative presidential cand., 1994 0.422 0.209 -.006 .103 129 .069La Violencia incidence (1948-1953) 0.146 0.353 -.146 .16 142 .079Rurality index 0.654 0.238 -.035 .091 178 .114Initial population, 1993 26328.799 33888.293 18839.104 17523.015 148 .083Coca, 1994 0.075 0.264 .089 .093 120 .062Literacy rate, 1993 85.452 8.783 -.664 3.646 150 .088
Panel D. Land variablesLand GINI, based plot sizes 0.707 0.118 -.023 .05 81 .075Land GINI, based on landowner holdings 0.722 0.103 -.013 .049 67 .06Number of years since last cadaster update 5.435 5.109 4.157** 1.972 118 .061
Panel E. Tax RevenueTax income (per capita) 0.071 0.308 -.191 .156 206 .145Non-tax income (per capita) 0.015 0.029 -.015 .012 199 .136Property tax income (per capita) 0.017 0.057 -.046 .035 196 .129Sales tax income (per capita) 0.027 0.188 -.092 .087 216 .163
Panel F. Electoral variablesNumber of candidates in election 4.593 2.547 .163 1.157 138 .079Number of parties in election 3.826 2.165 .525 .885 131 .074Voter turnout 0.598 0.139 -.012 .047 143 .089Notes: Columns 1 and 2 report the basic descriptive statistics of each variable. Column 3 reports RDD point estimates of the effect of a left-wingvictory in Mayor elections on each variable, using Calonico et al. (2014)’s optimal bandwidths (reported in column 6), bias correction, and robuststandard errors (column 4), with linear local polynomials and triangular kernels. Column 5 reports the number of observations including in eachestimation.
55
B.3 External validity
In Figure B-1 we report estimates analogous to those displayed in Figure 5, but where thedependent variables correspond to key potential confounders. This exercise is similar to the onereported in Table B-2, except that we report estimates for a larger set of bandwidths. PanelsA and B show that, for all bandwidth values, municipalities in which a left-wing party won theelections are no different from those in which the left came second in terms of their economicdevelopment and institutional quality, respectively.65
Similarly, and perhaps somewhat surprisingly, municipalities in which a left-wing party wonare no different in terms of the ideological alignment of voters in national elections prior toour sample period. Panels C and D show no differential support for the left- and right-wingcandidates, respectively, in the 1994 presidential elections. Municipalities in which the left wonby a small margin also do not differ in terms of the number of candidates running for mayor orturnout (Panels E and F).
65The development index comprises variables for total population, literacy rate, urbanization, and per capitatax income. The institutional index, as defined by (Acemoglu, Garcıa-Jimeno, & Robinson, 2015), includescentral government employees per capita, local government employees per capita, and public agencies per capita.
56

Figure B-1: Effect of electing a left-wing mayor on economic, institutional andelectoral outcomes
Panel A. Development index Panel B. Institution provision index
-2-1
01
23
Poin
t Est
imat
e
0 .1 .2 .3 .4 .5Bandwidth
-4-2
02
4Po
int E
stim
ate
0 .1 .2 .3 .4 .5Bandwidth
Panel C. Vote % for left-wing presidential candidates in 1994 Panel D. Vote % for right-wing presidential candidates in 1994
-1.5
-1-.5
0.5
1St
anda
rd D
evia
tions
0 .1 .2 .3 .4 .5Bandwidth
-2-1
01
2St
anda
rd D
evia
tions
0 .1 .2 .3 .4 .5Bandwidth
Panel E. Number of candidates in elections Panel F. Voter turnout
-10
12
Stan
dard
Dev
iatio
ns
0 .1 .2 .3 .4 .5Bandwidth
-10
12
3St
anda
rd D
evia
tions
0 .1 .2 .3 .4 .5Bandwidth
57
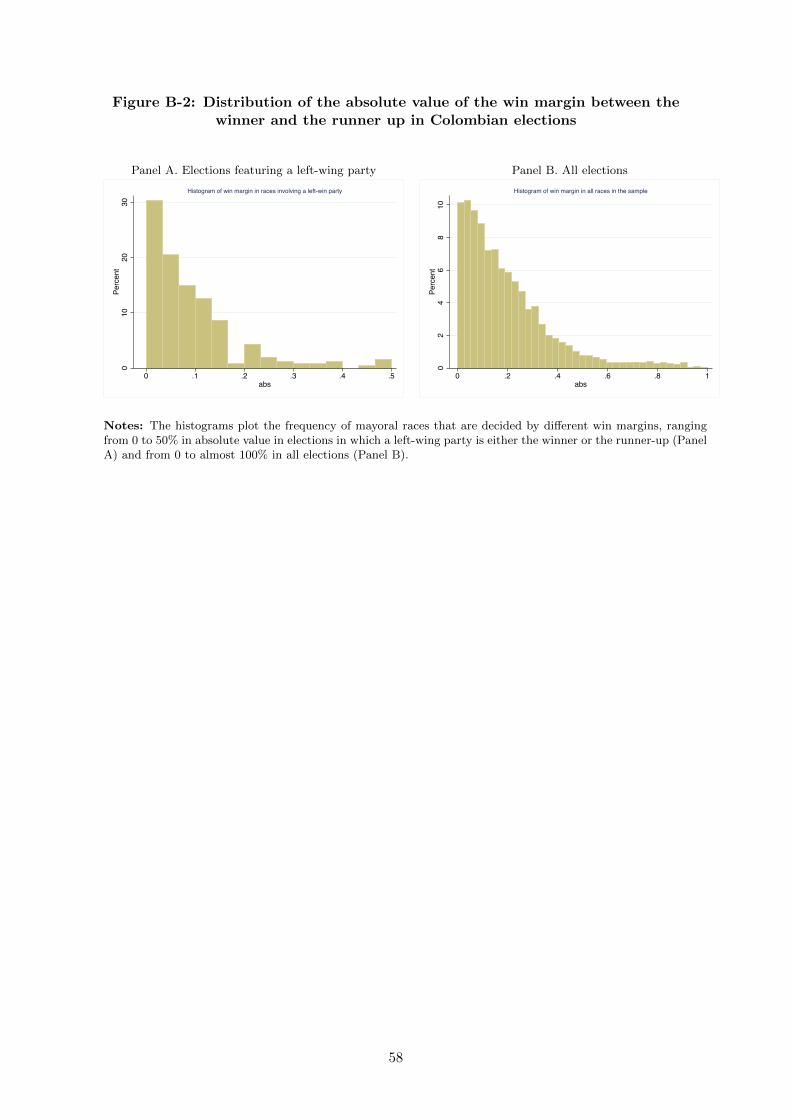
Figure B-2: Distribution of the absolute value of the win margin between thewinner and the runner up in Colombian elections
Panel A. Elections featuring a left-wing party Panel B. All elections
010
2030
Perc
ent
0 .1 .2 .3 .4 .5abs
Histogram of win margin in races involving a left-win party
02
46
810
Perc
ent
0 .2 .4 .6 .8 1abs
Histogram of win margin in all races in the sample
Notes: The histograms plot the frequency of mayoral races that are decided by different win margins, rangingfrom 0 to 50% in absolute value in elections in which a left-wing party is either the winner or the runner-up (PanelA) and from 0 to almost 100% in all elections (Panel B).
58

Figure B-3: Effect of electing a left-wing mayor on violence(dropping recurring municipalities)
Panel A. Paramilitary attacks during term in office Panel B. Paramilitary attacks in previous term
-.50
.51
1.5
Poin
t Est
imat
e
0 .1 .2 .3 .4 .5Bandwidth
-1-.5
0.5
11.
5Po
int E
stim
ate
0 .1 .2 .3 .4 .5Bandwidth
Panel C. Guerrilla attacks in previous term Panel D. Government attacks in previous term
-1.5
-1-.5
0.5
1Po
int E
stim
ate
0 .1 .2 .3 .4 .5Bandwidth
-1-.5
0.5
1Po
int E
stim
ate
0 .1 .2 .3 .4 .5Bandwidth
59

Table B-3: Balance in and out of sample
Sample mean
Out In Diff. P-value
Panel A. Main variables
Average yearly attacks per 100,000 inhabitants by:All groups 5.7358 8.5606 -2.8248*** .0046Paramilitary 1.2567 1.9804 -.7238 .1044Guerrilla 2.619 3.8203 -1.2013** .0193Government .2699 .6629 -.393** .016
Average yearly clashes per 100,000 inhabitants between:Total clashes 1.9444 2.5092 -.5647 .1008Guerrilla and paramilitary .1395 .1691 -.0296 .6276Guerrilla and government 1.7612 2.2469 -.4857 .1282Paramilitary and government .038 .074 -.0361 .412
Panel B. Institutional characteristics
Number per 100,000 inhabitants of:National public employees 26.5433 25.0599 1.4834 .3792Local public employees 2.3102 2.0784 .2318* .09
Panel C. Socioeconomic & political characteristics
Vote share of left-wing parties in mayor elections 0 .2383 -.2383*** 0Vote share of left-wing candidates in 1994 presidential elections .0438 .0667 -.023*** 0Vote share of conservative candidates in 1994 presidential elections .4789 .4224 .0566*** 0Incidence of violence during La Violencia (1948-1953) .1449 .1457 -.0007 .974Rurality index .6343 .6541 -.0198 .1975Population in 1993 21824.6429 26328.7992 -4504.1564** .0401Coca 1994 .0367 .0748 -.0381** .0242Literacy rate in 1993 85.2676 85.4519 -.1844 .7446Notes: “In” is the sample of mayoral elections in which a left-wing party was wither the winner of the runner-up. “Out” refers to all otherelectoral races. Institutional variables are not time varying. All cities with more than 300,000 inhabitants are excluded from sample.
60

B.4 Alternative Interpretations: right wing parties, new parties and the UP
Table B-4: Descriptive statistics of the main variablesSample: Electoral races in which right-wing parties are winners or runners-up:
1997 - 2014
Variable Mean StandardDeviation
Minimum Median Maximum
Panel A. Average yearly attacks per 100,000 inhabitants during term in officeTotal attacks 1.910 6.451 0.000 0.000 93.864Paramilitary 0.597 3.595 0.000 0.000 76.573Guerrilla 0.511 2.143 0.000 0.000 30.315Government 0.211 1.285 0.000 0.000 15.803
Panel B. Forcing Variable:V otes right−V otes non−right
V otes top 2 -0.000 0.113 -0.405 0.001 0.372
|V otes right−V otes non−rightV otes top 2 | 0.088 0.070 0.000 0.072 0.405
Panel C. Forcing Variable within bandwidthsV otes right−V otes non−right
V otes top 2 0.001 0.036 -0.066 0.000 0.066
|V otes right−V otes non−rightV otes top 2 | 0.031 0.019 0.000 0.029 0.066
Notes: Number of observations: 838 in Panels A and B (for 634 municipalities) and 386 in Panel C. The samplein Panels A and B is the set of mayoral elections where a right-wing candidate was the winner or runner up andthe corresponding variable is available. Panel C in addition restricts the sample to the Calonico et. al (2014)optimal bandwidth for our baseline estimates of the effect of right wing victories on total attacks (by all groups)with first-degree local polynomials.
61

Figure B-4: Effect of electing a right-leaning mayor on violenceRobustness to bandwidth selection
Average yearly attacks (per 100,000 inhabitants) during term in office
Panel A. Total attacks Panel B. Paramilitary attacks
-1-.7
5-.5
-.25
0.2
5.5
.75
1St
anda
rd D
evia
tions
0 .05 .1 .15 .2 .25 .3 .35 .4Bandwidth
-1-.7
5-.5
-.25
0.2
5.5
.75
1St
anda
rd D
evia
tions
0 .05 .1 .15 .2 .25 .3 .35 .4Bandwidth
Panel C. Guerilla attacks Panel D. Government attacks
-1-.7
5-.5
-.25
0.2
5.5
.75
1St
anda
rd D
evia
tions
0 .05 .1 .15 .2 .25 .3 .35 .4Bandwidth
-1-.7
5-.5
-.25
0.2
5.5
.75
1St
anda
rd D
evia
tions
.05 .1 .15 .2 .25 .3 .35 .4Bandwidth
Notes: Attacks by paramilitary or guerilla groups (per year and per 100,000 inhabitants) during the 3 years precedingeach election (90% confidence bands). The solid line marks the Calonico et al. (2014) optimal bandwidth, the dashed linethe Imbens and Kalyanaraman (2012) optimal bandwidth. Non-parametric estimates with bias correction, robuststandard errors, triangular kernels, and linear local polynomials (Calonico et al., 2014).
62
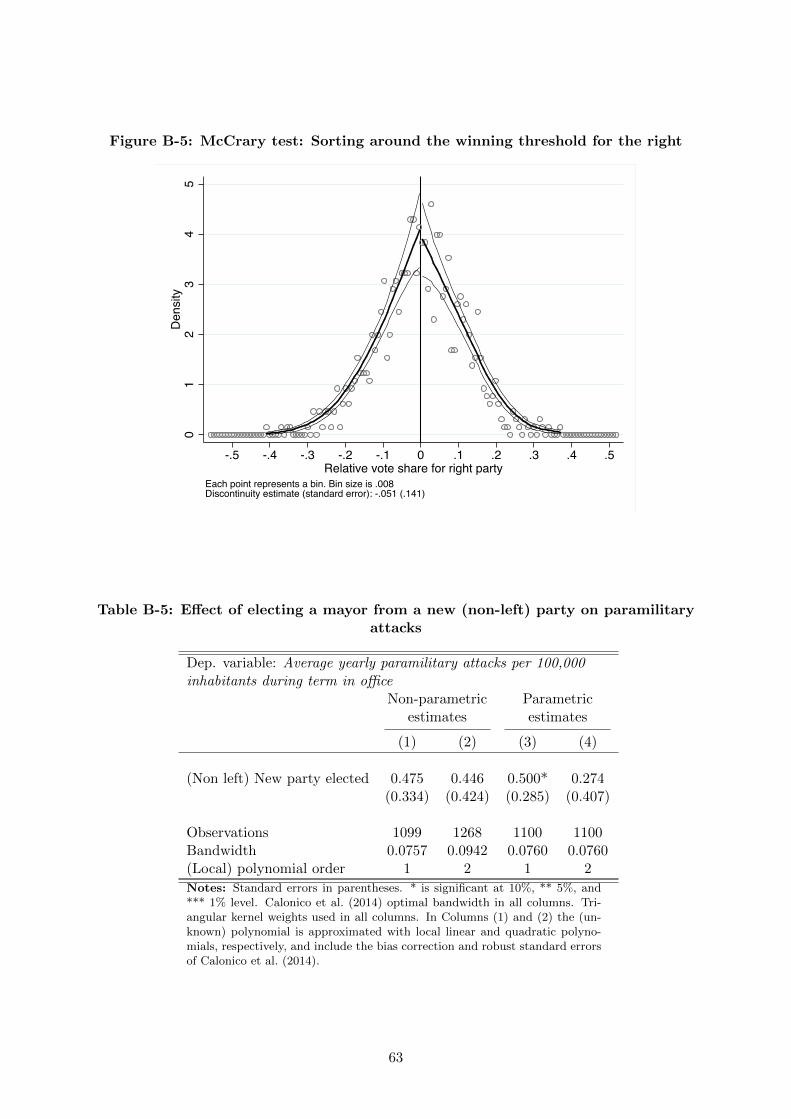
Figure B-5: McCrary test: Sorting around the winning threshold for the right
01
23
45
Den
sity
-.5 -.4 -.3 -.2 -.1 0 .1 .2 .3 .4 .5Relative vote share for right party
Each point represents a bin. Bin size is .008Discontinuity estimate (standard error): -.051 (.141)
Table B-5: Effect of electing a mayor from a new (non-left) party on paramilitaryattacks
Dep. variable: Average yearly paramilitary attacks per 100,000inhabitants during term in office
Non-parametric Parametricestimates estimates
(1) (2) (3) (4)
(Non left) New party elected 0.475 0.446 0.500* 0.274(0.334) (0.424) (0.285) (0.407)
Observations 1099 1268 1100 1100Bandwidth 0.0757 0.0942 0.0760 0.0760(Local) polynomial order 1 2 1 2
Notes: Standard errors in parentheses. * is significant at 10%, ** 5%, and*** 1% level. Calonico et al. (2014) optimal bandwidth in all columns. Tri-angular kernel weights used in all columns. In Columns (1) and (2) the (un-known) polynomial is approximated with local linear and quadratic polyno-mials, respectively, and include the bias correction and robust standard errorsof Calonico et al. (2014).
63

Table B-6: Effect of electing a left-wing mayor on paramilitary attacks(Differential effect of UP)
Dependent variable: Average yearly paramilitary attacksper 100,000 during term in office
(1) (2)
Left-wing mayor elected 2.660* 4.558**(1.521) (1.938)
Union Patriotica (UP) -0.657 -0.736(0.916) (1.049)
UP × Left-wing mayor elected 14.51 14.88(11.65) (11.60)
Observations 157 157Bandwidth 0.0930 0.0930(Local) polynomial order 1 2Notes: Standard errors in parentheses. * is significant at 10%, **5%, and *** 1% level. Calonico et al. (2014) optimal bandwidthand triangular kernel weights in all columns. In Columns 1 and 2the (unknown) polynomial is approximated with local linear andquadratic polynomials respectively. We report bias correction androbust standard errors of Calonico et al. (2014).
64

B.5 Incumbency disadvantage
Table B-7: Incumbency advantage in Colombia usingalternative approach (not conditioning on past incumbency)
Non-parametric estimates Parametric estimates
(1) (2) (3) (4) (5) (6)
Panel A. Dependent variable: Indicator of whether party elected in t runs and wins in t+ 1
Winner party in t -0.0420 -0.0441 -0.0465** -0.0470* -0.0551*** -0.0497*(0.0270) (0.0285) (0.0230) (0.0258) (0.0181) (0.0259)
Left-wing party -0.207*** -0.207***(0.0202) (0.0202)
Winner party in t × Left-wing party 0.0139 0.0135(0.0242) (0.0242)
Observations 5524 7990 5504 7984 7984 7984Bandwidth 0.0840 0.151 0.0840 0.151 0.151 0.151
Panel B. Dependent variable: Indicator of whether party elected in t runs in t+ 1
Winner party in t 0.0136 0.0170 0.0122 0.0153 0.0127 0.0129(0.0293) (0.0333) (0.0248) (0.0301) (0.0211) (0.0302)
Left-wing party -0.259*** -0.259***(0.0217) (0.0218)
Winner party in t × Left-wing party -0.0321 -0.0324(0.0277) (0.0278)
Observations 5794 7540 5814 7540 7540 7540Bandwidth 0.0910 0.135 0.0910 0.135 0.135 0.135
(Local) polynomial order 1 2 1 2 1 2Notes: Standard errors in parentheses. * is significant at 10%, ** 5%, and *** 1% level. Calonico et al. (2014) optimalbandwidth in all columns. Triangular kernel weights used in all columns. In columns (1) and (2) the (unknown) polynomialis approximated with local linear and quadratic polynomials, respectively, and include the bias correction and robust standarderrors of Calonico et al. (2014). Columns (3) - (6) are parametric estimates with polynomials of the forcing variable notdisplayed. (3) & (5) Linear estimates with varying slopes. (4) & (6) Quadratic estimates with varying slopes.
65