Embed Size (px)
Citation preview

APPROVED: Mazhar Siddiqi, Major Professor James Conover, Committee Member Imre Karafiath, Committee Member Robert Pavur, Committee Member Niranjan Tripathy, Committee Member Marcia Staff, Chair, Department of
Finance, Insurance, Real Estate and Law
O. Finley Graves, Dean of the College of Business
James D. Meernik, Acting Dean of the Robert B. Toulouse School of Graduate Studies
THE REASONS FOR THE DIVERGENCE OF IPO LOCKUP AGREEMENTS
Fei Gao, B.A., M.B.A.
Dissertation Prepared for the Degree of
DOCTOR OF PHILOSOPHY
UNIVERSITY OF NORTH TEXAS
August 2010
Gao, Fei. The reasons for the divergence of IPO lockup agreements. Doctor of
Philosophy (Finance), August 2010, 107 pp., 22 tables, 1 figure, references, 61 titles.
Most initial public offerings (IPOs) feature share lockup agreements, which
prohibit insiders from selling their shares for a specified period of time following the IPO.
However, some IPO firms agree to have a much longer lockup period than other IPO
firms, and some are willing to lockup a much larger proportion of shares. Thus, the
primary research question for this study is: “What are the reasons for the divergence of
the lockup agreements?”
The two main hypotheses that this dissertation investigates are the signaling
hypothesis based on information asymmetry, and the commitment hypothesis based on
agency theory. This study uses methods that have not been applied by previous studies
in the literature relating to IPO lockups.
First, I directly use IPO firms operating performance as a proxy for firm quality.
The results show neither a negative nor a strong positive relationship between lockup
length and firm operating performance. Thus, based on operating performance, the
evidence does not support the agency hypothesis while showing weak support for the
signaling hypothesis.
I then examine the long-run returns for IPO firms with different lockup lengths. I
find that firms with short lockup lengths have much better long-run returns than firms
with long lockup lengths. Therefore, the results reject the signaling hypothesis while
supporting the agency hypothesis. This dissertation further contributes to the IPO long-
run underperformance literature by showing that firms with a high agency problem have
much worse long-run returns than those with a low agency problem.
Finally, I investigate the short-term stock returns around lockup expiry. Generally,
I find that firms with short lockup periods experience better stock returns around lockup
expiry than firms with long lockup periods, though the returns are not significantly
different from one another. Overall, I conclude that the results reject the signaling
hypothesis while partially supporting the agency hypothesis. In addition, I show that
firms with high agency problems have much worse stock returns than those with low
agency problems around lockup expiry, even though the agency variable is not
significant in the regression analysis.

ii
Copyright 2010
by
Fei Gao

iii
ACKNOWLEDGMENTS
I wish to express my deepest gratitude to Dr. Mazhar Siddiqi, my Committee
Chairperson, whose guidance and patience make this dissertation possible. I also want
to thank Dr. James Conover, Dr. Imre Karafiath, Dr. Robert Pavur, and Dr. Niranjan
Tripathy, my committee members, and Dr. John Kensinger, for their contributions. Their
insights and discussions were essential for improving the dissertation.
I would like to thank my wife for her tremendous support and encouragement.

iv
TABLE OF CONTENTS
Page
ACKNOWLEDGMENTS………………………………………………………………………..iii
LIST OF TABLES……………………………………………………………………………….v
LIST OF FIGURES……………………………………………………………………….........vi
Chapters
1. INTRODUCTION…………………………………………………………………………1
2. LITERATURE REVIEW………………………………………………………………….5
IPO Underpricing…………………………………………………………………. 5 IPO Long-run Underperformance………………………………………………10 IPO Lockup Agreement……………………………………………………….. 16
3. HYPOTHESIS DEVELOPMENT………………………………………………………27
Signaling Hypothesis…………………………………………………………….27 Agency Hypothesis………………………………………………………………30
4. DATA COLLECTION AND RESEARCH DESIGN…………………………………..35
Signaling Hypothesis…………………………………………………………….35 Agency Hypothesis………………………………………………………………43
5. EMPIRICAL RESULTS………………………………………………………………...50
Summary Statistics……………………………………………………………....50 Signaling Hypothesis…………………………………………………………….51 Agency Hypothesis………………………………………………………………58
6. CONCLUSION AND DISCUSSION…………………………………………………99
REFERENCES…………………………………………………………………………….....

v
LIST OF TABLES
Page
1. Comparisons for the Predictions of Hypotheses…………………………………...34
2. Summary Statistics…………………………………………………………………....64
3. Accounting Numbers and Lockup Length…………………………………………..66
4. Regression for Length of Lockup (OLS)…………………………………………….68
5. Regression for Length of Lockup -- Binary Logistic……………………………….69
6. Regression for Length of Lockup -- Multinomial Logistic…………………………70
7. Accounting Numbers and Lockup Length -- Opaque Firms………………………72
8. Regression for Length of Lockup -- Opaque Firms………………………………..74
9. Accounting Numbers and Lockup Length -- High-tech Firms……………………76
10. Regression for Length of Lockup (High-tech Firms)………………………………77
11. Accounting Numbers and Lockup Length -- High λ Firms………………………..78
12. Regression for Length of Lockup -- high λ…………………………………………80
13. Accounting Numbers and Lockup Length -- Low λ Firms…………………………81
14. Regression for Length of Lockup (Low λ)………………………………………….83
15. Long-run Returns for All IPO Firms…………………………………………………84
16. Abnormal Return around Lockup Expiry……………………………………………86
17. Percentage of Shares Locked……………………………………………………….88
18. Agency Problem and Long-run Return……………………………………………..89
19. Long-run Returns and Underwriter Reputation……………………………………91
20. Venture Capital Backing and Long-run Returns…………………………………..93
21. Auditor Reputation and Long-run Return………………………………………….94
22. Short-run Return and Agency Problem……………………………………………96

vi
LIST OF FIGURES
Page
1. Long-run Return for IPO Firms………………………………………………………97

1
CHAPTER 1
INTRODUCTION
When investment banks take a firm to an initial public offering (IPO), they sign an
underwriter agreement. This contract usually states that without the investment bank‟s
prior written consent, the issuer will not directly or indirectly sell any shares of common
stock for a certain period of time negotiated by the two parties following the public
offering of the stock. Such a contract is known as a share lockup agreement. Most
firms issuing IPOs voluntarily enter into a lockup agreement with their underwriters,
though the contract is not regulated by the Security and Exchange Commission. A
typical lockup lasts for 180 days, and the lockup agreement covers most of the shares
that are not sold in the IPO. The terms of the lockup and its expiration date are
disclosed in the IPO prospectus.
Some IPO firms agree to lockup their shares for a much longer period than other
firms, and some firms lockup more of their shares in the lockup agreement than other
firms. The research interest for this study is to explore the reasons for the divergence of
IPO lockup agreements. Several researchers have examined this topic, and they
approach the issue from two aspects. One aspect is the signaling hypothesis based on
information asymmetry. Courteau (1995) extends Leland and Pyle‟s (1977) signaling
model that focuses on retained ownership by introducing the length of lockup period to
which the owner commits in the prospectus as a signal of firm value. She develops a
model and shows that higher quality firms are more likely to have longer lockups as an
indication of their superior quality. Brav and Gompers (2003) test the signaling
hypothesis developed by Courteau by choosing IPO offer price revision, the probability
of dividend initiation, and frequency of seasoned equity offering (SEO) as measures of

2
firm quality. Their results reject the signaling hypothesis for lockups -- they do not find
that higher quality firms have longer lockup periods. However, Brau, Lambson, and
McQueen (2005) argue that the proxies for firm quality used in Brav et al. (2003) paper
are not appropriate.
Brau et al. (2005) present a theoretical model that shows how the incentives of
insiders, underwriters, and investors can interact with the nature of the firm‟s assets to
explain the existence of lockup agreements. Their results show that larger firms, older
firms, easy to value firms, firms with prestigious investment bankers, firms with venture
capital backing, and firms with well-known auditors have shorter lockup lengths.
However, their empirical evidence indicates only that lockups should be shorter when
the degree of asymmetric information is small. The authors, however, have not shown
that lockup length is a signal for firm quality, which is the main prediction of the signaling
hypothesis by Courteau (1995).
The second way to approach the lockup agreement issue is the commitment
hypothesis based on agency theory. Using Jensen and Meckling‟s (1976) theoretical
model of agency costs, Brav et al. (2003) argue that lockup agreements serve as a
commitment device to alleviate moral hazard problems. As a result, IPOs that have a
higher chance of experiencing agency problems should commit to longer lockup periods
during which the public is convinced to buy their stocks. Brav et al. empirical results
support the commitment hypothesis. But in their paper, the authors use variables of
information asymmetry to test agency hypothesis. For example, they find that smaller
firms, which have high information asymmetry, have longer lockup periods that they
attribute to a higher potential for an agency problem. However, this is not necessarily

3
the case. Insiders of small firms may work hard, while insiders of big firms may be more
likely to take advantage of outside shareholders.
I use different approaches from the papers discussed to test the signaling and
agency hypotheses. First, I directly use firm operating performance several years after
their IPO as a measure of firm quality as in Jain and Kini (1994) and in Zheng and
Stangeland (2007). Then I compare the operating performance for IPOs with long and
short lockup periods to determine whether there is a significant difference between the
two groups. According to the signaling hypothesis, long lockup IPOs, which have higher
quality, should have better operating performance after their offering compared to short
lockup IPOs, which have low quality. On the other hand, according to the agency
hypothesis, firms with longer lockup periods, which have a high agency problem, should
have worse operating performance after their IPO because of their high agency cost
compared to firms with short lockup periods, which have low agency cost.
Second, I investigate the long-run stock returns for IPO firms with different lockup
lengths. According to the signaling hypothesis, firms with longer lockup periods should
have higher quality than firms with shorter lockup periods. However, the information of
the quality of firms imbedded in the length of lockup should be priced into the offer price
of the IPO firms at the time of offerings. Therefore, the long-run returns of the firms with
long and short lockup periods should not be significantly different. Under a signaling
mechanism, only if investors consistently overestimate quality will long-run returns be
worse for longer lockups than shorter lockups. According to the agency hypothesis, in
order to attract investors to buy into their firms‟ shares, companies with a high agency
problem should have a longer lockup period than firms with a low agency problem. This
4
high agency cost will lead to poorer long-run returns for these firms with long lockup
periods compared to firms with short lockup periods.
Third, I examine the short-run stock returns around the lockup expiration date for
IPO firms with long and short lockup lengths. Since all the information about lockup
lengths should be priced into the stock at the time of IPO and since the expiration date
is known to public investors before IPO, there should be no short-run abnormal returns
for firms with long and short lockup lengths according to the signaling hypothesis.
According to the agency hypothesis, on the other hand, insiders of IPO firms may sell
their shares and start to cause an agency problem after lockup expiry. In order not to be
taken advantage of by insiders, investors who hold stocks of firms that have a high
potential for an agency problem will sell their holdings around lockup expiry, leading to
short-term negative returns for these stocks.
In the above mentioned tests, I primarily focus on the firms with short and long
lockup periods: those firms with lockup lengths shorter and longer than 180 days.
However, 75% of the firms in the sample have a lockup period that is exactly 180 days.
In order to investigate why the majority of IPO firms choose 180 days as their lockup
period, I run the multinomial logistic regression, comparing the characteristics of firms
with lockup periods equal to 180 days to those with lockup periods that are shorter and
longer than 180 days.
The remainder of the dissertation is organized as follows: Chapter 2 provides the
literature review. Chapter 3 develops the hypotheses. Chapter 4 discusses the data
collection and research design. Chapter 5 presents the results and chapter 6 concludes.

5
CHAPTER 2
LITERATURE REVIEW
Initial public offerings (IPOs) have attracted much attention from researchers in the
last two decades. Theoretical and empirical literature on IPO-related phenomenon is
extensive. I focus on several main issues of IPOs in this literature review.
IPO Underpricing
Underpricing is the first documented anomaly in the pricing of IPOs of common
stock. It refers to the systematic increase from the offer price to the first day closing
price for firms issuing IPOs. Some early studies documenting positive initial returns
include Ibbotson (1975), Ritter (1984), and Tinic (1988). In a sample of 6,249 IPOs from
1980 to 2001, Ritter and Welch (2002) show that the average first-day return is 18.8%.
Researchers have offered several possible explanations for this short-run IPO
underpricing.
Rock (1986) proposes the winner‟s curse hypothesis. He offers an equilibrium
model in which uninformed investors face a winner‟s curse when they submit an order
for IPO issues because some potential subscribers have superior information. Informed
investors do not subscribe to a new issue when it is priced above its value, leaving the
entire issue to uninformed investors. His model shows that this information asymmetry
may lead to a “lemons problem,” where uninformed investors end up primarily with the
less successful IPOs. Thus, firms are forced to underprice their IPOs in order to
compensate uninformed investors for this adverse selection. Beatty and Ritter (1986)
extend the model to show that the value of information and the necessary underpricing
are higher for issues in which there is greater uncertainty about their value. Michaely
and Shaw (1994) test the empirical implications of the winner‟s curse hypothesis, and

6
consistent with this hypothesis, find that IPOs are not underpriced in markets where
investors know a priori that they do not need to compete with informed investors.
Based on Rock‟s framework, Carter and Manaster (1990) investigate the role of an
investment banker‟s reputation in the IPO market. They show that to maintain their
reputation, prestigious underwriters always choose higher quality and less risky firms,
using information unavailable to the general public. This in turn reduces the uncertainty
and information asymmetry between informed and uninformed investors. Investors
know that by buying IPOs associated with high reputable underwriters, they face less
risk. Using investment bankers‟ capital as a proxy for underwriter reputation, Michaely
and Shaw (1994) show that reputation plays an important role in explaining the initial
day return; that is, IPOs underwritten by reputable investment banks experience less
underpricing.
Because most firms that go public are relatively young and new to general
investors, there are always information asymmetry problems between IPO firms and
outside investors. Welch (1989) presents a signaling model in which high-quality firms
underprice more at the IPO in order to obtain a higher price at a seasoned offering. Low
quality firms cannot imitate high quality firms by having greater underpricing because of
high imitation expenses and the possibility that this imitation is discovered between
offerings. Underpricing by high-quality firms can add sufficient imitation expenses to
induce low-quality firms to reveal their true quality voluntarily. Similarly, Allen and
Faulhaber‟s (1989) model shows that firms with the most favorable prospects will use
the signal of underpricing in an IPO to show their high quality to investors. Their model
predicts that firms that underprice more can recoup the cost of underpricing by going
back to the seasoned offering market more quickly and frequently.

7
In Grinblatt and Hwang‟s (1989) paper, the authors develop a signaling model with
two signals and two attributes to explain new issue underpricing. To overcome the
asymmetric information problem at IPO, the issuer signals the true value of the firm by
offering shares at a discount and by retaining some of the shares of the new issue in
their personal portfolio. This model can be regarded as a generalization of Leland and
Pyle‟s (1977) model, in which the issuer‟s retention ratio of his own company signals the
firm‟s future cash flows. Grinblatt and Hwang‟s results show that a firm‟s intrinsic value
is positively related to the degree its new issue is underpriced.
Underpricing could also be a mechanism to compensate outsiders for the cost of
information production. Chemmanur (1993) presents a model of IPO pricing in which
insiders have private information and sell stock in both the IPO and the secondary
market, and outsiders may engage in costly information production about the firm.
Knowing that they are going to pool with low-value firms, high-value firms induce
outsiders to engage in information production by underpricing, which in turn
compensates outsiders for the cost of producing information. The information is
reflected in the secondary market price of equity, giving a higher expected stock price
for high-value firms.
Michaely and Shaw (1994) test several signaling hypotheses mentioned above,
but do not find evidence supporting the signaling models for IPO underpricing.
Specifically, their results show that firms that underprice more return to the reissue
market less frequently and for lesser amounts than firms that underprice less. Also,
firms that underprice more experience lower earnings and pay fewer dividends.
Baron (1982) assumes that the value of a new issue is affected by market demand
and the investment banker‟s selling effort. In his model, the issuer is less informed

8
relative to its underwriters, not relative to investors. To address this moral hazard and to
induce the underwriter to put in the requisite effort to market shares, it is optimal for the
issuer to permit some underpricing, since the issuer cannot monitor the underwriter
without cost. Muscarella and Vetsuypens (1989) test Baron‟s agency model directly and
find that when underwriters themselves go public, their shares are just as underpriced
even though there is no monitoring problem. This evidence neither favors nor refutes
Baron‟s hypothesis.
There are three types of benefits that issuers find in liquid shares. First, greater
liquidity allows the opportunity to trade retained shares on more favorable terms.
Second, it is often hypothesized that increased liquidity reduces the required return to
investors, thus increasing the price that investors are willing to pay for shares. Third, it
has been shown that increased liquidity can reduce the issuing costs of subsequent
equity offerings. Several studies have investigated the relationship between IPO
underpricing and after-market liquidity.
Booth and Chua (1996) develop an explanation for IPO underpricing in which the
issuers‟ demand for ownership dispersion motivates underpricing and oversubscription.
In their framework, promoting oversubscription can allow broad initial ownership
dispersion and this in turn can achieve a liquid secondary market for the shares.
However, broad initial ownership requires an increase in investor-borne information cost,
which can be compensated by higher underpricing. Their findings suggest that issuers
intentionally underprice to promote oversubscription, which receives a broad initial
ownership, and in turn, increases secondary market liquidity for their stocks.
Reese (1998) studies the relationships between IPO underpricing, investor interest,
and trading volume. He finds that IPOs which appreciate in price during the first two
9
days of trading experience a significantly higher trading volume than those which do not
appreciate in price during the same time period. This difference in trading volume is not
only statistically significant during the first week of trading but persists for more than
three years beyond the issue date. Using the number of newspaper references of a firm
as a proxy for investor interest, Reese finds that there are significant relationships
between the pre-issue market interest in an IPO and its initial return, initial trading
volume, and long-term volume.
Employing 10 measures of liquidity, Hahn and Ligon (2004) explore whether
underpricing of IPOs boosts subsequent secondary market liquidity. They find that, in
general, there is a positive relationship between the two. The positive relationship holds
both prior to and after lockup expiration; thus, the influence of underpricing is not
restricted to the immediate post-issuance period. For three different volume-based
measures of liquidity -- the turnover ratio, Amihud‟s illiquidity measures, and the
average number of trades -- there is a consistent significantly positive relationship
between underpricing and liquidity. They conclude that insiders concerned about future
liquidity for their retained stakes in the issuing firm could benefit from the liquidity-
increasing effects of underpricing.
Zheng and Li (2008) examine a sample of 1,179 Nasdaq IPOs and find that
underpricing is positively related to the number of non-block institutional shareholders
after IPO. The authors also find evidence that the number of non-block institutional
shareholders is positively related to aftermarket liquidity. The relationship is robust and
significant, particularly when liquidity is measured by aftermarket trading volume.
Therefore, they conclude that underpricing is used to help increase the number of non-
block institutional shareholders, which improves secondary market liquidity.

10
Furthermore, the authors show that IPO underpricing is positively related to trading
volume in the secondary market, suggesting that underpricing does have some direct
effect on market liquidity.
In their 2002 paper, Aggarwal, Krigman, and Womack develop a model in which
managers strategically underprice IPOs to maximize personal wealth from selling
shares at lockup expiration. They argue that if IPO firms underprice more, which can
generate more information momentum, they can attract more attention to the firms‟
stock and thereby shift the demand curve for the stock outwards. As a result, this will
allow managers to sell their holdings at a higher price at lockup expiry than they could
otherwise obtain. Their results show that if managers hold more shares of their
company, their stocks will have greater underpricing at IPO. They find also that
underpricing is positively related to research coverage and research coverage is
positively associated with stock returns and insider selling at lockup expiry.
IPO Long-run Underperformance
Long-run underperformance is the second anomaly found in the IPO market, and
the topic has received substantial attention since the early 1990s. Researchers have
tried to find possible explanations for the anomaly by looking at the different
characteristics related to IPO firms.
Ritter (1991) uses a sample of 1,526 IPOs from 1975 to 1984 and finds that IPOs
substantially underperform the sample of matching firms for a three-year period after the
offering. Younger firms and firms going public in heavy volume years do worse than
average. After examining various cross-sectional and time-series patterns, Ritter
attributes this long-run underperformance of IPOs to investors‟ periodically
overoptimistic expectation about the earnings potential of young growth companies.

11
Firms take advantage of these windows of opportunity and go public near the peak of
industry-specific fads.
Schultz (2003) conducts 5,000 simulations of long-run aftermarket abnormal
returns of IPOs and SEOs from 1973 to 2000. He shows that the poor long-run
performance of equity-issuing firms in event-time is real in the sense that IPOs and
SEOs have underperformed relative to their expectations, but that it is not indicative of
any market inefficiency. More firms go public when they can receive a higher price for
their shares. As a result, there are more offerings at peak valuations than at lower
prices. However, the issuing firms do not know prices are at the peak when they issue
stock.
Venture capitalists specialize in providing funds to privately held companies, and
generate their profits from the companies that go public. According to Field and Lowry
(2007) and Megginson and Weiss (1991), prestigious underwriters prefer to deal with
IPOs backed by venture capitalists, as do institutional investors. As a result, the
presence of venture capital may signal a more successful IPO. Brav and Gompers
(1997) investigate the long-run underperformance of IPO firms by comparing a group of
IPOs with venture capital backing to a group without venture capital backing. They find
that the underperformance documented by Ritter comes primarily from small, non-
venture-backed IPOs. Returns on non-venture-backed IPOs are significantly below
those of venture-backed IPOs when returns are weighted equally. Value weighting
significantly reduces underperformance for non-venture-backed IPOs. Carter, Dark, and
Singh (1998) examine the role of underwriter reputation on IPO long-run
underperformance. Reputation concerns force high-ranked investment banks to choose
higher quality and less risky firms with which to do business. Their results show that, on

12
average, the long-run market-adjusted returns are less negative for the IPOs that are
brought to market by more prestigious underwriters.
As an explanation for the IPO long-run underperformance, Teoh, Welch, and
Wong (1998) try to explore a possible source for the over-optimism about the earnings
potential of IPOs found by Ritter. They argue that the IPO process is particularly
susceptible to earnings management, offering entrepreneurs both motivation and
opportunities to manage earnings. Because of information asymmetry between
investors and issuers at the time of the offering, investors must rely on current earnings
reports. As a result, high reported earnings would translate directly into a higher offering
price.
Total accruals can be decomposed into current and long-term components, and
studies have shown that entrepreneurs have more discretion over short-term than over
long-term accruals. Discretionary current accruals are the asset-scaled proxies for
manipulated earnings determined at the discretion of management. So, Teoh, Welch,
and Wong‟s hypothesis is that if marginal investors do not rationally discount for
earnings management in forming expectations about future cash flows, IPOs with
unusually high accruals in the IPO year experience underperformance relative to those
with conservative accruals after three years of the issue. The evidence in their paper
supports this hypothesis.
Miller (1977) argues that uncertainty implies that reasonable investors may differ in
their forecasts. Assuming investors seek to maximize the present value of their
investment, they will have different estimates of expected returns from the investment,
given uncertainty about the true return to the investment in the security. It follows, then,
that the shares will be owned by the investors with the highest evaluation of the return.

13
That is to say, a badly informed or excessively optimistic small group of investors can
bid a stock up to a value that most investors regard as unreasonable. This usually
occurs because they believe that the stock promises substantially better performance
than most other securities available. As a result, the higher the price of a security the
greater the divergence of opinion about the return from the security.
If the divergence of opinion about a stock changes, it follows that the market price
should also change. For instance, if risky stocks become less risky over time, their
prices should drop. This is because the divergence of opinion narrows over time; that is,
the passage of time resolves certain uncertainties about the future of a company. This
can explain the IPOs long-run underperformance. The prices of new issues are set not
by the appraisal of the typical investor, but by the small minority who think highly
enough of the investment merits of the new issue to include it in their portfolio. The
divergence of opinion about the new issue is greatest when the stock is issued,
because the information asymmetry is greatest. Over time, this uncertainty is reduced
as the company discloses more information, and the price of stocks decreases.
In their empirical test for Miller‟s hypothesis, Houge, Loughran, Suchanek, and
Yan (2001) find that all three variables measuring uncertainty -- percentage opening
spread, time of first trade, and flipping ratio (calculated as the sell-side block volume
divided by the total share volume on the IPO day) -- provide significant explanatory
power of IPO returns. A wide opening spread, late opening trade, and a high flipping
ratio are associated with poor long-run returns, suggesting that greater divergence of
opinion or uncertainty about an IPO can generate long-run underperformance.
Chemmanur and Paeglis (2005) empirically examine the relationship between the
quality and reputation of a firm‟s management and various aspects of its IPO return

14
performance. They argue that if a firm has higher management quality and reputation, it
is more likely to attract greater interest from institutional investors, who themselves are
less likely to be subject to over-optimism compared to individual investors. As a result,
such firms are likely to experience a smaller dispersion in beliefs among investors,
which in turn implies that management quality and reputation will be positively
associated with long-run stock price performance following a firm‟s IPO, in accordance
with Miller‟s theory. Their evidence shows that higher management quality is associated
with lower heterogeneity in investor valuations and firms with better managers have
greater long-run stock returns.
Jensen (1986) argues that conflicts of interest between shareholders and
managers over payout policies are particularly severe when the organization generates
substantial free cash flow and managers want to increase managerial benefits like
compensation or power and reputation, implying that there is negative information
contained in the new cash from IPOs. As Miller (1977) shows, the market may not
incorporate the opinion of pessimistic investors into stock valuation because of
divergent investor expectations and short sale constraints. As a result, Zheng (2007)
hypothesizes that the market may not incorporate the negative information contained in
the new cash into stock valuation; that is, the market may under-react to the free cash
flows from an IPO. Thus, Zheng predicts that firms getting more new cash from IPOs
should have poor long-term stock returns. Results indicate that raising more new cash
in an IPO is related to poorer long-term stock performance. IPO firms that receive more
new free cash flow and have large divergences of investor opinion would tend to be
more overvalued, leading to poor long-term returns.
15
Although studies have documented the IPO long-run underperformance, others
question the existence of such an anomaly. These researchers criticize the
methodology of measuring the long-run returns and conclude that different data, a
different study period, or a different methodology will give different answers. They not
only show that abnormal performance measurement is conditional on an asset-pricing
model, but also recognize that the method of measurement of abnormal performance
affects inferences. The method influences both the magnitude of the measured
abnormal performance as well as the size and power of the statistical test. Brav, Geczy,
and Gompers (2000) reexamine the robustness of IPO underperformance with respect
to various model specifications. In measuring event time returns, the authors use
various benchmarks such as the S&P (Standard & Poor‟s) 500, the Nasdaq composite
index, the CRSP (Center for Research in Security Prices) value weight index, and the
CRSP equal weight index. Size and book-to-market portfolios are also formed. The
paper computes the Fama-French three-factor model, the excess return on the value
weighted market portfolio, the return on a zero investment portfolio, and the return on a
portfolio of high book-to-market stocks less the return on a portfolio of low book-to-
market stocks. The authors conclude that value weighting cuts in half the
underperformance calculated from equal-weighting. Once IPO firm returns are matched
to size and book-to-market portfolios, there is no underperformance. Underperformance
is concentrated primarily in small issuing firms with low book-to-market ratios. Model
mis-specification is an important consideration in long horizon performance tests.

16
IPO Lockup Agreement
Rule 144 limits insider selling. It requires that restricted shares (unregistered
shares acquired directly or indirectly from the issuer from non-public offerings) be held
for a minimum of one year from the time that the shares were originally acquired. Before
1997, this minimum holding period was two years.
When an issuing firm and an investment bank enter into an agreement to offer
securities in an IPO, they sign an underwriter agreement. This contract usually states
that without the investment bank‟s prior written consent, the issuer will not directly or
indirectly sell any shares of common stock for a certain period of time negotiated by the
two parties following the commencement of the public offering of the stock. It is typically
a voluntarily agreement, and is not mandated by any SEC or state securities laws that
regulate insider trading.
Most IPOs feature share lockup agreements, which prohibit insiders and other pre-
IPO shareholders from selling any of their shares for a specified period. The typical
lockup lasts for 180 days, though lockups may range anywhere from three months to
three years. The lockup agreement covers most of the shares that are not sold in the
IPO. The terms and the expiration date of lockup are disclosed in the IPO prospectus.
Earlier, I mentioned that IPO underpricing could either be a device to solve the
information asymmetry problem or a device to reduce the agency problem. As outlined
in the papers reviewed below, IPO lockup agreements may also serve as either a
signaling device or a commitment device to solve the asymmetric information problem
and the agency problem in addition to underpricing. As a result, we can regard lockup
agreements as a complementary tool to underpricing that underwriters and issuers can
choose in the IPO process. Further, I try to shed light on the reasons for an IPO long-

17
run underperformance by examining the long-term stock returns for IPOs with different
lockup characteristics.
IPO Lockup Related Literature
Field and Hanka (2001) examine the IPO‟s stock price and trading volume around
the lockup expiration day. They find that while lockups are in effect, there is little selling
by insiders. Around the scheduled unlock day, there is on average a permanent 40%
increase in trading volume and a statistically prominent three-day abnormal return of
1.5%. Both of these effects are roughly three times larger in venture-backed firms than
in non-venture-backed firms. Venture capital investors sell more aggressively than other
pre-IPO shareholders. The authors find limited support for several hypotheses that may
explain the abnormal return, but do not provide a complete explanation. The abnormal
return is not caused by a change in the proportion of trades at the bid price, temporary
price pressure, or increased trading costs. Also, the abnormal return may be partly
caused by downward sloping demand curves or by consistently larger-than-expected
insider sales.
By examining market reaction to the expiration of IPO lockup, Brau, Carter,
Christophe, and Key (2004) find that the expiration of share lockups has important
share-price implications. Results show statistically significant negative abnormal returns
surrounding the lockup expiration. The authors argue that the negative abnormal returns
are consistent with theoretical predictions based on information asymmetries and
decreased incentive alignment between insiders and general shareholders. The results
of the cross-sectional regression also shed light on characteristics that affect market
returns around the lockup expiration date. The paper finds that greater uncertainty
about insiders‟ future actions is related to negative abnormal returns. Specifically,

18
percentage of shares in lockup, venture capital backing, the percentage of management
ownership in the firm after the offer, and the size of the firm are significantly related to
the cumulative abnormal returns.
Ofek and Richardson (2000) conduct a similar study about the volume and price
patterns around the lockup expiration day. Consistent with the previously mentioned
papers, the authors provide evidence that stock prices fall around the end of their IPO
lock-up period, but they also provide evidence that the lockup effect is not arbitrageable.
Trading costs, the difficulty of shorting newly-public stocks, and short-term capital gains
faced by original shareholder can help explain this fact. Furthermore, the paper argues
that the stock price fall is somewhat consistent with a downward sloping curve for
shares and certain variables, such as stock price volatility, have clear predictive power
for the magnitude of the fall.
Bradley, Jordan, and Yi (2001) find that the average abnormal return on the lockup
expiration day is -0.74%, and the cumulative abnormal return over the five-day
surrounding period is -1.61%. However, the negative abnormal returns are largely
concentrated in the 45% of the firms with venture capital backing. Such firms lose, on
average, 3% to 4% of their value. For the venture-capital-backed group, the largest
losses occur for high-tech firms and firms with the greatest post-IPO stock price
increases, the largest relative trading volume in the period surrounding expiration, and
the highest quality underwriters.
Cao, Field, and Hanka (2004) explore whether insider trading impairs market
liquidity around IPO lockup expiration. They show that officers and directors sell
substantial shares of their own at lockup expiration, but those selling have little effect on
effective spreads. Instead they find that quote depth -- the average of ask depth (the

19
number of shares offered for sale at the ask price) and bid depth (the number of shares
offered for sale at the bid price) -- average trade size, and number of trades per day all
increase. Overall, lockup expiration seems to improve liquidity. The authors explain that
the increase in asymmetric information costs is obscured by the liquidity benefits from
increased trading volume.
Using a different approach, Gao (2005) uses intraday data to explore the trading
activity and the information environment around IPO lockup expiration. He finds that the
price drop around lockup expiration is significantly positively correlated with venture
backing, analyst earnings forecast bias, and forecast dispersion. Further, results show
that information asymmetry of IPO stocks experience little change after the unlock day.
This suggests that insider trading on lockup expiry is unlikely to be driven by private
information; instead, insiders sell their holding for the purpose of diversification.
Even though a normal lockup agreement lasts for several months, in some
situations, some underwriters do allow restricted shareholders to sell a small portion of
the restricted shares early according to the lockup agreement between underwriter and
issuers. While the scheduled lockup expiration day is stated in the prospectus prior to
the firms‟ IPO, the early release represents new information to the market. Keasler
(2001) examines the influence of an underwriter‟s early lockup release on shareholders
wealth. The author finds that most of the firms receiving early release are backed by
venture capital and experience an increase in market capitalization after their IPO.
There are significantly negative abnormal returns associated with the early lockup
release announcement, and negative returns are greater for venture backed IPOs.
Further, negative abnormal returns at the lockup expiration day are reduced for firms
announcing the early lockup release.

20
Brav and Gompers (2003) also explore the extent of insider equity sales prior to
lockup expiration. They argue that if lockup agreement is a commitment device, then
only those firms that have greatly reduced the potential for insiders to take advantage of
shareholders will be released from the lockup restriction. Their results show that firms
that are associated with less moral hazard, such as larger firms, firms with higher
turnover, firms backed by venture capitalists, firms with high reputable underwriters, and
firms with higher post-IPO abnormal returns, are more likely to have an early release.
Both of the above papers conclude that their findings are consistent with the
commitment hypothesis.
The Reasons for the Divergence of IPO Lockup Agreements
Some IPOs have a three-month lockup period, while others lockup their shares for
more than three years. Some IPOs lock 60% of their shares, while others lock only 10%.
Thus far, researchers exploring the reasons for the existence of lockup agreements
have focused on two hypotheses, the signaling hypothesis and the agency hypothesis.
In the market for real assets where the quality of projects is highly variable, we
observe a scenario in which entrepreneurs know the quality of their own projects, while
lenders cannot distinguish between them. In order to solve this information asymmetry
problem, Leland and Pyle (1977) show that if the owner remains under-diversified, this
may communicate private information about the value of the firm to prospective
investors. The willingness of the owner to invest in his firm may serve as a signal to the
lending market of the true quality of the project. Lenders will place a value on the project
that reflects the information transferred by the signal. The authors use a signaling model
to come up with the conclusion that the market reads higher entrepreneurial ownership
as a signal of a more favorable future project.

21
However, Gale and Stiglitz (1989) argue that under-diversification at the time of
IPO is not sufficient for fully communicating private information. If the entrepreneur can
sell the retained shares on the secondary market immediately after the issue, the
signaling strategy will not be convincing to investors. Courteau (1995) extends Leland
and Pyle‟s signaling model that focuses on the retained ownership, and introduces the
length of lockup period to which the owner commits in the prospectus as a signal of firm
value. She develops a model and shows that the length of the holding period, in a
signaling mechanism, complements ownership retention. Also, she finds that higher
quality firms are more likely to have longer lockups to show their quality.
Brav and Gompers (2003) test the firm quality signaling hypothesis. The authors
designate the IPO offer price revision, the probability of dividend initiations, and the
frequency of seasoned equity offerings (SEOs) as measures of firm quality. They argue
that firms that signal their higher quality through longer lockups would be more likely to
raise their offering price in order to garner greater proceeds at the time of their IPO, or
they would have a higher chance to initiate dividend payment after IPO, or else they
would be more likely to issue equity in a subsequent seasoned equity offering. The
authors‟ results reject the signaling hypothesis of lockup, because they do not find that
higher-quality firms possess longer lockup periods. However, as argued by Brau,
Lambson, and McQueen (2005), the proxies for firm quality used in Brav et al. paper are
not appropriate.
Brau, Lambson, and McQueen (2005) present a theoretical model that shows how
the incentives of insiders, underwriters, and investors can interact with the nature of the
firm‟s assets to explain the existence of lockup agreements. Their model shows how
lockups can be a signaling solution to the adverse selection problem resulting from

22
information asymmetries at the time of the stock issue. Specifically, insiders cannot only
retain some fraction of shares of their firm, but also sign a lockup agreement not to sell
the shares for a period of time. Their results indicate that lockups should be shorter
when the degree of asymmetric information is small, and when the cost of mimicking is
high. Specifically, larger firms, older firms, easy to value firms, firms with prestigious
investment bankers, firms with venture capital backing, and firms with well-known
auditors have shorter lengths of lockup.
The problem in the findings of Brau et al. (2005) is that the signal is not a valid
signal by definition. For a signal to be valid, there should be a higher cost to mimickers
for sending a false signal. If their conclusion is true, then opaque firms can mimic
transparent firms by setting a shorter lockup period, a false signal, at a lower cost. This
is because with a shorter lockup period, they can cash out, and make themselves
diversified sooner. The authors realize this problem, and try to solve it by showing that
shorter lockup periods are associated with higher idiosyncratic risk. However, the result
for the test is just marginally significant (p-value = 0.0954). Even if their conclusion is
true, the authors have not shown whether lockup length is a signal for firm quality.
Jensen and Meckling (1976) develop a theoretical model of agency costs. Agency
costs arise when the manager‟s interests are not aligned with firm owners‟ interests,
and these costs increase as the equity share of the manager declines. Managers can
have on-the-job perks, shirking, and self-interested and entrenched decisions that might
reduce shareholders wealth.
In their paper, Brav and Gompers (2003) argue that these lockup agreements
serve as a commitment device to alleviate moral hazard problems. After a firm‟s IPO,
interests of insiders may not align with interests of outside shareholders due to the

23
separation of ownership and management. As a result, IPOs that have a higher chance
of having agency problems should have a longer lockup period to convince the public to
buy their stocks. The authors argue that for a firm with high information asymmetry, the
agency problem should be high because outsiders do not know the actions of the
managers. The results support the commitment hypothesis that unprofitable firms, low
book-to-market ratios firms, firms with low reputation underwriters, and firms without
venture backing have significantly longer lockup periods. These firms suffer from a
greater potential for insiders to take advantage of shareholders, therefore they need a
longer lockup to induce investors to buy into the offering. One concern regarding their
conclusion is that the authors use variables of information asymmetry to test agency
hypothesis. For example, they find that smaller firms, which have high information
asymmetry, have longer lockup period because of higher potential for an agency
problem. This is not necessarily true. Insiders of small firms may work hard, and
insiders of big firms may be more likely to take advantage of outside shareholders.
Using underwriter reputation, Yung and Zender (2008) separate their IPO sample
into two groups, one group with high reputation underwriters and the other with low
reputation underwriters, and test whether signaling hypothesis and agency hypothesis
work separately for these different groups. For the group of high reputable underwriters,
the authors argue that these IPOs will have low information asymmetry. Therefore, the
lockup is a device to solve agency problem for these firms. For the group of low
reputable underwriters, the authors argue that these IPOs cannot find high reputable
underwriters to solve information asymmetry problem, so they must use lockups to
solve this problem. One potential problem for this paper is choosing underwriter
reputation as a standard to divide the whole sample into two groups. Yung and Zender

24
(2008) argue that “underwriter certification has been argued to reduce information
asymmetry; however, this certification should have no impact on moral hazard
problems.”
But underwriters do have a monitoring function in reducing the firms‟ agency
problems after the IPO. According to Krigman, Shaw, and Womack (2001), only 30% of
firms completing an SEO within three years of their IPO switched their lead underwriters.
In addition, in the event of a switch, firms will choose more reputable underwriters. Thus,
we can see that IPO firms keep a relatively long and stable relationship with their
underwriter in order to extract more services from these investment banks. As a result,
a firm with a reputable underwriter will have fewer agency problems even after their IPO
due to the monitoring function of underwriters. To keep their reputation, highly reputable
underwriters will set stricter standards to do business with firms. If a firm has a high
agency problem, which lowers operating performance, a highly reputable underwriter
may refuse to do business with this firm rather than hurting its own reputation. This
could motivate such firms to reduce agency problems in order to keep and/or acquire
the services of highly reputable underwriters. In this way, a highly reputable underwriter
could serve as both a resolution to the information asymmetry and the agency problem
(at least to some extent). Thus, choosing this as a standard to divide the whole sample
into two groups is not appropriate.
My Approach to the Reasons of Divergence of IPO Lockup
Even though several studies mentioned above have investigated the reasons for
the divergence of IPO lockup, the results are mixed. Further, those studies have limited
their research to examining the relationships between lockup length and proxies for
information asymmetry and agency problems. They completely ignore both short-term

25
and long-term stock price behaviors from which we can get rich insight for the reasons
in the divergence of IPO lockup agreements. For example, according to signaling
hypothesis, all the information about the lockup length should be valued into the offering
price of firms at the time of their IPO, thus there should not be a significant difference
between the long-run stock returns for IPOs with long and short lockup lengths. On the
other hand, if the agency hypothesis is true, then firms with a long lockup period, which
have high potential for an agency problem will experience long-run underperformance
due to the high agency cost. Therefore, examining long-run stock returns may give us a
clearer idea for the reasons in the divergence of IPO lockup agreements.
At the lockup expiration day, insiders are given their first chance to sell a
substantial proportion of the shares they hold. Since the lockup expiration day is known
to the public, the short-term returns around lockup expiry should not be different for
stocks with long and short lockup lengths according to signaling hypothesis. But for
agency hypothesis, investors will heavily sell their holdings for firms with high potential
for agency problems, in order not to be taken advantage of by insiders of the firms after
the lockup expires. As a result, there should be a greater negative short-term return for
this group of stocks than those with fewer agency problems. Thus, the short-run returns
around lockup expiry may allow us to differentiate between the signaling and agency
hypotheses.
In choosing the proxies for firm quality, prior studies ignore the most direct
measures, the operating performance of IPO firms. Thus we can examine the operating
performance several years after firms‟ offerings to see whether there is a significant
difference between the group with long lockup periods and the group with short lockup
periods. By doing this, we can determine whether lockup length is a signal for firm

26
quality or is a mechanism to solve an agency problem. According to the signaling
hypothesis, firms with long lockup periods should have better operating performances
since they have better quality than short lockup IPO firms. But according to the agency
hypothesis, firms with long lockup periods should have worse operating performances
after their offering because of their high agency cost.

27
CHAPTER 3
HYPOTHESES DEVELOPMENT
Signaling Hypothesis
By signing a lockup agreement with underwriters, insiders of initial public offering
(IPO) firms bear the cost of non-diversification. Insiders of higher quality firms can bear
these costs to show their firms‟ quality to outside investors, while insiders of low quality
firms cannot give the false signal of committing to a long lockup period because of their
expected negative future performance. Therefore, we can predict that high quality firms
should have a long lockup period, while low quality firms should have a short lockup
period. Brav and Gompers (2003) use the probability of SEOs, offer price revision, and
the probability of dividend initiations as proxies for firm quality in their testing of this IPO
lockup signaling hypothesis. But, as argued by Brau et al. (2005), their measures of firm
quality are not appropriate.
Jain and Kini (1994) investigate whether equity retained by the original
entrepreneurs is a signal of firm quality. The authors use firms‟ operating performance
after the IPO as a proxy for firm quality. They find that there is a positive relationship
between the two variables – a higher retention ratio means a higher operating
performance after the firm‟s IPO. Zheng and Stangeland (2007) test whether
underpricing is a signal for firm quality. They also use the operating performance as a
proxy for firm quality and conclude that IPOs with greater underpricing are of better
quality. This dissertation intends to examine whether lockup is a signal for firm quality.
Therefore I use operating performance as a measure of firm quality, a proxy not
previously used in the literature of IPO lockups, thus leading to my first hypothesis.

28
Hypothesis 1: Firms with a longer lockup period should have higher quality, and
therefore higher operating performance for several years after their IPO.
Brau et al. (2005) find that lockups should be shorter when the degree of
asymmetric information is small. I can extend their paper, and partition the whole
sample into two groups, with one group including transparent IPOs, the other including
opaque IPOs. Both groups include high quality firms and low quality firms, because both
types of firms can be either opaque or transparent. Since opaque firms have a higher
degree of asymmetric information problems, high quality firms belonging to this group
have a strong motive to use lockup length to differentiate their quality from other firms.
On the other hand, for transparent firms, it is easier for investors to differentiate high
quality and low quality firms because of less information asymmetry, meaning there may
not be a strong relationship between firm quality and lockup length. Therefore, we
should observe that the relationship between firm quality and lockup length is stronger
for opaque firms than for transparent firms.
Hypothesis 1A: The positive relationship between operating performance and lockup
length (Hypothesis 1) is stronger for opaque firms than for transparent firms.
When partitioning the whole sample into opaque and transparent firms in
Hypothesis 1A, I use the asymmetric-information variables according to Brau et al.
(2005). However, some of those variables are proxies for both information asymmetry
and agency problem. For example, the reputation of an underwriter, as a third party
certification, is a good proxy for information asymmetry (Ritter, 1986; Michaely and
Shaw, 1995; Megginson and Weiss, 1991). But underwriters do have a monitoring
function in reducing the firms‟ agency problems after the IPO. To keep their reputation,
highly reputable underwriters will set strict standards to do business with firms. This

29
could motivate such firms to reduce agency problems in order to keep and/or acquire
the services from highly reputable underwriters. As a result, a firm with a reputable
underwriter will have fewer agency problems. Instead, I will use “high-tech” as a
criterion to separate the sample into opaque and transparent firms. High-tech firms will
have more research and development and know-how, which makes them hard to be
valued due to high information asymmetry. On the other hand, it is not necessarily true
that the managers of high-tech firms will cause more agency problems compared to
non-high-tech firms. Thus, high-tech is a good proxy for information asymmetry, and
can be used to partition the whole sample into opaque and transparent firms, providing
the impetus for my third hypothesis:
Hypothesis 1B: The positive relationship between operating performance and lockup
length (Hypothesis 1) is stronger for high-tech firms than for non-high-tech firms.
A third criterion may be used to separate firms with high information asymmetry
from firms with low information asymmetry. This third criterion is λ, the proportion of the
bid-ask spread due to adverse selection. Firms with a high λ have high information
asymmetry and firms with a low λ have low information asymmetry, therefore:
Hypothesis 1C: The positive relationship between operating performance and lockup
length (Hypothesis 1) is stronger for firms with a high λ than for firms with a low λ.
Brau et al. (2005) argue that the reason they do not examine the long-term stock
returns is that at the time of IPO good firms and bad firms are both fairly priced.
According to the signaling hypothesis, firms with a longer lockup period should have
higher quality than firms with a shorter lockup period. But the information of firm quality
imbedded in the lockup lengths has been incorporated into the stock price at the time of
a firm‟s IPO. In other words, the offer prices of IPO stocks are set according to their
30
quality. As a result, even though IPO firms experience long-run underperformance
compared to the market, we should not observe a difference between long-run stock
returns for firms with long lockup periods, which have high quality, and short lockup
periods, which have low quality. Previous research has not examined the long-run stock
returns for IPOs with different lockup lengths. I propose the following hypothesis:
Hypothesis 2: If investors incorporate the signal of lockup into the IPO offer price, there
will be no difference between the long-run returns for long and short lockups.
Starting from the lockup expiration day, insiders of the IPO firms who are
previously restricted from selling their holdings have the first chance to sell a large
proportion of their shares. However, the dates of IPO lockup expiration and the number
of shares that can then be sold by insiders are well known by investors at the time of
firms‟ IPO from their prospectus. In addition, as Field and Hanka (2001) point out, IPO
lockup expiry is a relatively clean event to study because few companies make
important announcements around lockup expiry, such as earnings, dividend, mergers or
acquisitions. Therefore, there should be no significant abnormal returns for IPO firms
around their lockup expiry. The hypothesis is as follows:
Hypothesis 3: There are no significant abnormal returns for IPO firms around their
lockup expiration dates.
Agency Hypothesis
For IPOs with a high potential for agency problems, investors require more shares
to be locked to avoid being taking advantage of by insiders. This is because if insiders
of high agency firms hold only a very small portion of the firm then even with the lockup
agreement it is hard to align the interests of insiders with the interests of shareholders.
Brav and Gompers (2003) use variables such as firm size and industry to measure

31
agency costs. These variables are not appropriate because they are also proxies for
information asymmetry. Instead, I will use free cash flow, expense ratio, asset utilization
ratio, and debt level to measure the degree of agency problem (McKnight and Weir,
2008) in testing the following:
Hypothesis 4: Higher agency problem IPOs should lock up more shares.
Agency costs arise when the manager‟s interests are not aligned with firm owners‟
interests, and these costs increase as the equity share of the managers declines
(Jensen and Meckling, 1976). As the insiders of high agency IPO firms sell their shares
and therefore reduce their interests in the firm after lockup expiry, they can start to have
on-the-job perks, shirking, and self-interested and entrenched decisions. These agency
costs have a negative impact on the firm‟s operating performance and reduce
shareholders‟ wealth (Jain et al., 1994). As a result, I predict that firms with longer
lockup periods will have greater agency problems, which will lead to worse operating
performance after their IPO.
Hypothesis 5: IPO firms with longer lockup periods will have worse operating
performance for several years after their offerings compared to firms with shorter lockup
periods.
According to the agency hypothesis, firms with a high agency problem should
have a longer lockup period than firms with a low agency problem. At the time of lockup
expiry, Insiders have the chance to sell their holdings of the firm and to cause agency
problems thereafter. In order not to be taken advantage of by insiders, some investors
will sell their shares of high agency firms around lockup expiry, leading to a price drop.
Other investors may still hold their shares, probably due to their underestimate of the
agency problem of the firm. As insiders of these firms continuously cause agency

32
problems, leading to the deterioration of operating performance, more investors will sell
the firms‟ shares. Thus, this high agency cost will lead to poor long-run returns (Harris
and Glegg, 2009) for firms with long lockup periods. On the other hand, for firms with a
low agency problem, investors may not worry too much about the agency problem.
Therefore, they may not sell the shares of the firm as intensively as investors do in high
agency firms.
Hypothesis 6: Firms with long lockup periods will experience worse long-run stock
returns after their offerings compared to firms with short lockups.
As discussed in Hypothesis 1B, high reputation underwriters may be good
monitors and therefore reduce the agency problem for IPO firms. As a result, for firms
with high reputation underwriters, there should be a low agency problem. The lockup
length of these firms is not used to differentiate the agency problem among them. I
predict that there will be no difference between the long-run returns for this group of IPO
firms with long and short lockup lengths. On the other hand, for firms with low reputation
underwriters, agency problems may not be effectively reduced, so these firms still need
to use lockup length to differentiate the agency problems among them. Thus I predict
that the long-run returns for firms with short lockups will be better than firms with long
lockups. The reputation of underwriters works as a complimentary tool for lockup length.
By the same reasoning, venture capital backing and the reputation of auditors may also
work as a mechanism to reduce agency problems, so I have the following hypotheses:
Hypothesis 6A: For firms with high reputation underwriters, auditors, or with venture
capital backing, there is no difference between long-run stock returns for long and short
lockups.

33
Hypothesis 6B: For firms with low reputation underwriters, auditors, or without venture
capital backing, longer lockups are associated with worse long-run stock returns than
shorter lockups.
On the IPO lockup expiration date, insiders of the firm have the chance to sell their
holdings of the firm. Under agency hypothesis, if insiders sell their shares at the lockup
expiration day, they have more incentive to cause agency problems and may start to
expropriate wealth from shareholders. For long lockup IPOs, which have higher
chances of experiencing agency problems, investors will sell their shares around IPO
lockup expiry to avoid wealth expropriated by insiders. Therefore, we should observe a
big price drop for firms with long lockup periods around lockup expiration. On the other
hand, for IPOs with short lockup periods, we should observe no price drop or a smaller
price drop. This is because insiders in these firms will always try to maximize
shareholders wealth, and investors know that there are fewer agency problems in these
firms. As a result, investors will sell the shares for these IPO firms less intensively.
Previous research has not explored the short-run price behavior of IPOs around lockup
expiration for IPOs with different lockup lengths. Therefore, I propose:
Hypothesis 7: There are significant negative abnormal returns for IPO firms around their
lockup expiry, and firms with longer lockups, which have high chances of experiencing
agency problems, will experience worse returns than firms with shorter lockups.
I can use these hypotheses to examine whether the IPO lockup length is a solution
to the agency problem or a signaling mechanism, as shown in Table 1. The predictions
for the signaling hypothesis and the agency hypothesis are quite different. For example,
when examining the operating performance after firms‟ IPOs, the signaling hypothesis
predicts that firms with long lockups will have better performances than firms with short

34
lockups, while the agency hypothesis predicts that, on the contrary, short lockups will
have better performances. For the long-run stock returns, the signaling hypothesis
predicts that there are no differences between the long-run returns for firms with long
and short lockup periods, while the agency hypothesis predicts that firms with short
lockup periods will have better returns than firms with long lockup periods. For the short-
term returns around lockup expiry, the signaling hypothesis predicts that there are no
abnormal returns for IPO firms, while the agency hypothesis predicts that there should
be bigger negative abnormal returns for firms with long lockup periods than firms with
short lockup periods.
Table 1
Comparisons for the Predictions of Hypotheses
Hypotheses Signaling Agency
Operating performance after
IPO
H1: Long lockups will have
better performance
H5: Short lockups will
have better performance
Long-run returns after IPO H2: No difference between
long and short lockups
H6: Short lockups have
better long-run return
Short-run return around
lockup expiry
H3: No short-term
abnormal return
H7: There are short-term
abnormal returns and
long lockups have a
worse return

35
CHAPTER 4
DATA COLLECTION AND RESEARCH DESIGN
The data for this study is from the Thompson Securities Data Corporation (SDC)
database and consists of initial public offerings (IPOs) of equity for the period from 1989
through 2004. The end year, 2004, was chosen to ensure that four years worth of
operating performance data is available on Compustat. Information about each IPO is
collected, such as the IPO date, issuer name, symbol ticker, lead underwriter, IPO
proceeds, offer price, the number of primary shares and secondary shares, percentage
of shares locked up, auditor name, lockup expiration date, and total debt at the time of
the IPO. When SDC misses some data fields, the individual firm prospectus is searched
for the relevant information. Information on underwriter rankings is collected from Jay
Ritter‟s website based on Carter-Manaster (1990). Consistent with current research,
American depository receipts (ADRs), units offerings, closed end funds, real estate
investment fund (REITs), reverse leveraged buyouts (LBOs), and equity carve outs are
excluded. IPOs with offer price below $5 are excluded. Further firms must be listed on
the Center for Research in Security Prices (CRSP) after their offering. Thus daily stock
price, trading volume, and bid-ask spread for each IPO can be collected. Accounting
data is obtained from Compustat.
Signaling Hypotheses
Hypothesis 1 predicts that firms with a longer lockup period should have higher
quality, and therefore have higher operating performance for several years after their
IPO. Following Jain and Kini (1994) and Zheng and Stangeland (2007), growth rates of
several accounting variables are used to measure the operating performance of IPO
firms, which in turn proxy for firm quality. Specifically, two cash flow variables are

36
calculated. First is operating return on assets (OR), which is defined as operating
income before depreciation and taxes divided by total assets at the end of the fiscal
year. This variable provides a measure of the efficiency of asset utilization. The second
operating performance measure is defined as operating cash flows deflated by total
assets (OCF) at the end of the fiscal year. This ratio equals operating income minus
capital expenditures divided by total assets, and is a useful measure since operating
cash flow is a primary component in net present value calculations used to value a firm.
Other performance measures included are sales (SALE), operating income (OI), and
asset turnover (AT), which is defined as the ratio of sales to total assets. Earnings is not
used as a performance variable since managers may adopt a strategy that inflates
earnings initially at the expense of earnings growth rates in future years (Zheng et al.,
2007).
Growth rates are calculated for each performance measure by comparing their
values at the end of each fiscal year following the IPO (Year +2 to +4) to their values at
the end of the fiscal year of IPO (Year +1). The changes in operating performance are
measured as the median changes because the performance measures may be skewed
and the mean is particularly sensitive to outliers (Jain et al., 1994). Only those firms
with positive measures in Year +1 are included in our calculation of growth rates.
Different industries grow at different rates in the economic cycle. IPO firms tend to be
concentrated in high growth industries, thus their growth rate may reflect industry-wide
growth patterns. Industry-adjusted changes are calculated to reduce the effect of such
patterns in IPO growth rates. The industry-adjusted performance for a particular IPO
firm is the difference between its growth rate and the median growth rate in all firms in

37
its industry during the same period. Each IPO firm is matched with firms in the same
industry based on three-digit Standard Industrial Classification (SIC) codes.
Performance growth rates are compared between firms with long lockups and
firms with short lockups in order to evaluate whether long lockup periods are associated
with higher quality. To do this, the entire sample is split into quartiles according to the
length of firm‟s lockup. Then the median growth rates are compared for the first and
fourth quartiles to see whether the growth rates for the fourth quartile (long lockup group)
are significantly higher than those for the first quartile (short lockup group). The
hypotheses are:
H0 : Ms ≥ Ml
H1 : Ms < Ml
where Ms is the median growth rate of performance measure for the short lockup group,
and Ml is the median growth rate of performance measure for the long lockup group.
Regression analysis is performed to control for other variables that may affect the
length of lockup (LOL).
(1). LOLi = β0 + β1 ORi + β2 OCFi + β3 SALEi + β4 OIi + β5 ATi + β6 SIZEi +
β7 AGEi + β8 TECHi + β9 UWi + β10 VCi + β11 AUDIi + εi
where
LOL: length of lockup (number of days);
OR: operating return on asset;
OCF: operating cash flow on asset;
SALE: net total revenue;
OI: operating income;
AT: asset turnover;
38
SIZE: proceeds of a firm‟s IPO;
AGE: the years from a firm‟s inception till IPO;
TECH: a dummy variable for high-tech firms;
UW: Carter-Manaster ranking for underwriter;
VC: a dummy variable for venture capital backing;
AUDI: a dummy variable for the well-known top six auditors.
Length of lockup is the number of days in a firm‟s lockup agreement. Besides
growth rates of the five accounting numbers, several variables that may affect the
lockup length of IPO firms are included. Large firms and older firms will have less
information asymmetry, so they may have a shorter lockup period (Brau et al., 2005).
Following Brau et al., (2007), proceeds from a firm‟s IPO are used as a proxy for firm
size. It is calculated by multiplying the number of shares offered in the IPO with the offer
price. Nominal dollar values are converted to 2004 dollars by using the consumer price
index. Firm ages (AGE) are obtained from Jay Ritter‟s website. When the founding year
is the same as the offering year, 0.5 is assigned as the age for the firm (Brau et al.,
2007). High-tech firms may have higher information asymmetry; therefore, an industry
dummy variable (TECH) is included to catch this effect. TECH equals 1 for high-
technology firms and 0 otherwise. Following Field et al., (2001), high-tech firms are
identified by using three-digit SIC codes of 357, 367, 369, 382, 384, and 737. Following
Beatty and Ritter (1986), Michaely and Shaw (1995), and Megginson and Weiss (1991),
three variables for third party certifications are also included in the regression --
reputation of underwriters (UW), auditors (AUDI), and presence of venture capitalists
(VC). Carter and Manaster (1990) use underwriters‟ relative placements in stock
offering tombstone announcements as the proxy for underwriter reputation. Briefly, the

39
measure is constructed by examining tombstone advertisements and comparing the
relative placement of investment banks in the advertisements. The rankings range from
1 to 9, with higher ranking indicating higher reputation underwriters. AUDI and VC are
set as dummy variables. AUDI equals 1 if the firm‟s auditor is one of the top six auditors,
otherwise it is 0. The big six accounting firms are Arthur Andersen, Coopers & Lybrand,
Deloitte Touche, Ernst & Young, KPMG Peat Marwick, and Price Waterhouse. Firms
backed with venture capital are assigned a VC value of 1, otherwise it is 0. Since firm
quality and lockup length are expected to be positively related, the hypotheses are:
H0 : β1 and β2 and β3 and β4 and β5 ≤ 0
H1 : β1 and β2 and β3 and β4 and β5 > 0
Hypothesis 1A predicts that the positive relationship between operating
performance and lockup length (Hypothesis 1) is stronger for opaque firms than for
transparent firms. Brau et al., (2005) use several variables to measure information
asymmetry, such as firm size, whether or not the firm is in a high tech field, underwriter
reputation, presence of venture capital, and reputation of auditor. Using these variables,
the sample is partitioned into two groups (transparency and opaqueness) by creating
the following scoring scheme. A value of one is assigned to firms with high information
asymmetry -- high tech firms, firms without presence of venture capital, and firms not
using the big 6 auditor firms. Otherwise, 0 is assigned to a firm. For firm size and
underwriter reputation, 0 is assigned to firms that have values above the 75th percentile,
1 to firms below the 25th percentile, and 0.5 to the remaining firms. By summing up all
these scores, each firm in the sample will get a total score. The score can range from 0
to 5. Firms with a high score are opaque firms, while firms with a low score are
transparent firms. Thus, it is possible to test whether there is a stronger relationship

40
between operating performance and lockup length for opaque firms than for transparent
firms. Specifically, the entire sample is partitioned into quartiles according to these
scores and the same regression analysis is performed as in Hypothesis 1 for firms in
quartile 1 (opaque firms) and for quartile 4 (transparent firms). The regressions and
hypotheses are as follows:
(2). LOLoi = βo0 + βo1 ORoi + βo2 OCFoi + βo3 SALEoi + βo4 OIoi + βo5 AToi +
βo6 SIZEoi + βo7 AGEoi + βo8 TECHoi + βo9 UWoi + βo10 VCoi + βo11 AUDIoi +εoi
(3). LOLti = βt0 + βt1 ORti + βt2 OCFti + βt3 SALEti + βt4 OIti + βt5 ATti + βt6 SIZEti +
Βt7 AGEti + βt8 TECHti + βt9 UWti + βt10 VCti + βt11 AUDIti +εti
where equation (2) is the regression for opaque firms (subscript o), and equation (3) is
the regression for transparent firms (subscript t). For opaque firms, a stronger relation
between firm quality and lockup length is expected; therefore, the hypotheses are:
H0 : βo1 ≤ βt1 and βo2 ≤ βt2 and βo3 ≤ βt3 and βo4 ≤ βt4 and βo5 ≤ βt5
H1 : βo1 > βt1 and βo2 > βt2 and βo3 > βt3 and βo4 > βt4 and βo5 > βt5
Hypothesis 1B predicts that the positive relationship between operating
performance and lockup length (Hypothesis 1) is stronger for high-tech firms than for
non-high-tech firms. I partition the sample into high-tech firms and non-high-tech firms
and run tests similar to Hypothesis 1.
(4). LOLhi = βh0 + βh1 ORhi + βh2 OCFhi + βh3 SALEhi + βh4 OIhi + βh5 AThi +
βh6 SIZEhi + βh7 AGEhi + βh8 TECHhi + βh9 UWhi + βh10 VChi + βh11 AUDIhi +εhi
(5). LOLni = βn0 + βn1 ORni + βn2 OCFni + βn3 SALEni + βn4 OIni + βn5 ATni +
βn6 SIZEni + βn7 AGEni + βn8 TECHni + βn9 UWni + βn10 VCni + βn11 AUDIni +εni
where equation (4) is the regression for high-tech firms (subscript h), and equation (5) is
the regression for non-high-tech firms (subscript n). For high-tech firms, a stronger

41
relation between firm quality and lockup length is expected; therefore, the hypotheses
are:
H0 : βh1 ≤ βn1 and βh2 ≤ βn2 and βh3 ≤ βn3 and βh4 ≤ βn4 and βh5 ≤ βn5
H1 : βh1 > βn1 and βh2 > βn2 and βh3 > βn3 and βh4 > βn4 and βh5 > βn5
Hypothesis 1C predicts that the positive relationship between operating
performance and lockup length (Hypothesis 1) is stronger for firms with a high λ than for
firms with a low λ. The bid-ask spread has three components: order processing costs,
inventory holding costs, and adverse information costs. Since the asymmetric
information component is of interest in this paper, this component needs to be extracted
from the total spread. Following Chazi and Tripathy (2007), one generally accepted
measure, λ, will be used to proxy for the adverse selection component. The measure λ
is from a modification of Lin, Sanger, and Booth‟s (1995) model, which is based on the
model of Huang and Stoll (1994). In the following regression, λ represents the portion of
the spread due to adverse selection.
(6). Qt+1 – Qt = λzt + et+1
where
Qt = (Askt + Bidt)/2, is the quote midpoint at time t;
zt = Pricet – Qt , is the effective half-spread.
Chazi et al. use t as a measure of daily changes and extract λ from yearly
regression by firm. Thus, in their model, λ measures the firm‟s yearly adverse selection.
I am interested in the information asymmetry around IPO lockup expiration, so λ will be
extracted from the trading data 30 days after the expiration day. Daily stock closing
numbers are used for price, bid, and ask values. After partitioning the sample into high-λ
firms and low-λ firms, I run tests similar to Hypothesis 1.
42
(7). LOLhi = βh0 + βh1 ORhi + βh2 OCFhi + βh3 SALEhi + βh4 OIhi + βh5 AThi +
βh6 SIZEhi + βh7 AGEhi + βh8 TECHhi + βh9 UWhi + βh10 VChi + βh11 AUDIhi +εhi
(8). LOLli = βl0 + βl1 ORli + βl2 OCFli + βl3 SALEli + βl4 OIli + βl5 ATli +
βl6 SIZEli + βl7 AGEli + βl8 TECHli + βl9 UWli + βl10 VCli + βl11 AUDIni +εli
where equation (7) is the regression for high-λ firms (subscript h), and equation (8) is
the regression for low-λ firms (subscript l). For high-λ firms, a stronger relation between
firm quality and lockup length is expected; therefore, the hypotheses are:
H0 : βh1 ≤ βl1 and βh2 ≤ βl2 and βh3 ≤ βl3 and βh4 ≤ βl4 and βh5 ≤ βl5
H1 : βh1 > βl1 and βh2 > βl2 and βh3 > βl3 and βh4 > βl4 and βh5 > βl5
Hypothesis 2 predicts that if investors incorporate the signal conveyed in lockup
length into the IPO offer price, there will be no difference between the long-run stock
returns for long and short lockups. Because model mis-specification is an important
consideration in long horizon stock price performance tests (Brav, Geczy, and Gompers,
2000), when testing for hypotheses 2, two alternative methods are used to measure the
long-run stock returns: equally-weighted market-adjusted excess returns, and value-
weighted market-adjusted excess returns. Long-run returns are defined as the three-
year holding period return following a firm‟s IPO. All the returns are calculated starting at
the 26th day after firms‟ IPOs to avoid the effect of earlier aftermarket activities such as
stabilization and quiet period (Brau et al., 2007). Market adjusted return (MAR) is
defined as the firm‟s buy and hold return (BAH) minus the market return from CRSP.
Buy and hold return is defined as the geometrically compounded return:
(9). BAH = (1 +𝑀𝑡=𝑗 ri,t )-1
where ri,t is the daily return for stock i on day t, j is the starting day, and M is the ending
day for a calculating period. Market adjusted return is calculated as:

43
(10). MAR = (1 +𝑀𝑡=𝑗 ri,t ) - (1 +𝑀
𝑡=𝑗 rm,t )
where rm,t is the equally-weighted or value-weighted daily market return from the CRSP.
After obtaining the long-run returns for each firm, univariate tests are conducted to
see whether the mean and median returns are significantly different for firms with a long
lockup period and firms with a short lockup period.
H0 : µs = µl or Ms = Ml
H1 : µs ≠ µl or Ms ≠ Ml
Where µs and Ms are the average and median long-run returns, respectively, for
short lockups, and µl and Ml are the average and median long-run returns, respectively,
for long lockups. The power of these tests is low because the null hypothesis represents
the signaling model. However, when testing the agency hypothesis, I set the null
hypothesis in the normal way, and therefore provide the counterparts of these tests,
increasing the test power. This is the case also for a few of the hypotheses that follow.
Further, regression analysis is conducted by fitting the long-run returns (LR)
against lockup lengths while controlling for other variables.
(11). LRi = β0 + β1 IRi + β2 LOLi + β3 SIZEi + β4 AGEi
+ β5 TECHi + β6 UWi + β7 VCi + β8 AUDIi +εi
Houge et al. (2001) find that initial return (IR) is negatively correlated with long-run
performance. Therefore, this variable is included in our regression. Other variables that
might affect the IPO long-run returns - SIZE, AGE, TECH, UW, VC, and AUDI - are
defined the same as in equation (1). There should be no significant relationship
between LR and LOL. The hypotheses are:
H0 : β2 = 0
H1 : β2 ≠ 0

44
Hypothesis 3 predicts that there are no significant abnormal returns for IPO firms
around their lockup expiration dates. Event study methodology is used to examine the
stock prices behavior around IPO lockup expiration. The market model is specified as
follows:
(12). Rit = αi + βi Rmt + εit,
where
Rit is the return for firm i on day t in estimation period;
Rmt is the average return for all firms in the stock market on day t (CRSP
value-weighted index is used as the market index);
αi and βi are the intercept and the slope parameters for firm i;
εit represents the error term for firm i on day t.
αi and βi will be estimated over T trading days in the estimation period, where T
varies according to the length of lockup. For IPOs having a lockup period between 3 to
5 months, the estimation period will start at the first day of the IPO and end 10 days
before the event day (lockup expiry). If an IPO has a 6 month or longer lockup period,
the estimation period will start 130 days before the event day and end 10 days before
the event day. EVENTUS software will be used for these tests. The average 7-day
abnormal return (3 days before and after the IPO lockup expiration day) is calculated.
Univariate tests will be conducted and the hypotheses are:
H0 : µs = 0 and µl = 0
H1 : µs ≠ 0 and µl ≠ 0
where µs is the average abnormal return for short lockup IPOs, and µl is the average
abnormal return for long lockup IPOs. Further the means of the two groups of stocks are
compared, and the hypotheses are:

45
H0 : µs = µl
H1 : µs ≠ µl
Agency Hypotheses
Hypothesis 4 predicts that higher agency problem IPOs should lock more shares.
Free cash flow, growth rate, expense ratio, asset utilization ratio, and the amount of
debt at the time of a firm‟s IPO are used as proxies for agency cost (McKnight and Weir,
2008). If a firm has high free cash flow and low growth opportunity, then the firm has a
higher chance of having an agency problem. Following McKnight et al. (2008) and
Zheng (2007), the sum of two values standardized by total assets is used as the proxy
for free cash flow. The first value is defined as operating income before depreciation
minus the sum of taxes plus interest expense and dividends paid at the time of IPO
(Lehn and Poulsen, 1989). This value represents the free cash flow a firm has before its
IPO. The second value is the cash that a firm raises in the IPO. The sum of the two
numbers then is divided by the total assets at the time of a firm‟s IPO to measure the
free cash flow IPO firms have. Market-to-book ratio is used to measure the growth
opportunity for IPO firms. The ratio is calculated by using the market value of a firm
divided by its book value, where market value is the product of the firm‟s stock price and
the number of shares outstanding, and book value is the difference between the firm‟s
asset and total liability. A firm‟s growth opportunity is an increasing function of its
market-to-book ratio. Firms with a market-to-book ratio lower than the median are
assigned a 1 and are seen as low growth opportunity firms. A value of 0.5 is assigned to
firms with a market-to-book ratio greater than the median and these firms are seen as
high growth opportunity firms. Each firm‟s market-to-book value is then multiplied by its
free cash flow value. Firms with high free cash flow and low growth opportunities

46
receive higher values, which could indicate a higher chance of an agency problem.
Expense ratios are defined as operating expenses scaled by annual sales. It is
positively related to the agency cost (Mcknight et al., 2008). Asset utilization ratio is
calculated as annual sales divided by total assets, and it is negatively related to the
agency cost (Mcknight et al., 2008). Debt holders could be good monitors, so the higher
total debt a firm has at the time of IPO, the lower the potential for agency problem.
The sample is partitioned into a high agency cost group and a low agency cost
group by creating a scoring scheme similar to that used for information asymmetry. One
is assigned to the firms with high potential for an agency problem -- firms with values
above the 75th percentile for the four variables measuring agency problem. Zero is
assigned to the firms that have values below the 25th percentile, and 0.5 to the
remaining firms. By summing all these scores for each firm, a total score can be
obtained for every firm in the sample. The scores range from 0 to 4. Firms with a high
score will have a greater potential for an agency problem. By partitioning the entire
sample into quartiles according to these scores, IPOs with a high agency problem
(quartile 4) can be compared to IPOs with a low agency problem (quartile 1) to see
whether the former group locks up more shares. Hypotheses are:
H0 : µsha ≤ µsla
H1 : µsha > µsla
where µsha is the mean percentage of shares locked up for high agency IPOs, and µsla is
the mean percentage of shares locked up for low agency IPOs.
Hypothesis 5 predicts that IPO firms with longer lockup periods will have worse
operating performances several years after their IPOs compared to firms with shorter

47
lockup periods. The same methodology is applied as was done for Hypothesis 1. The
hypotheses are:
H0 : Ms ≤ Ml
H1 : Ms > Ml
where Ms is the median growth rate of performance measure for short lockup group, and
Ml is the median growth rate of performance measure for long lockup group.
Regression analysis is performed to control for other variables that may affect the
length of lockup (LOL).
(13). LOLi = β0 + β1 ORi + β2 OCFi + β3 SALEi + β4 OIi + β5 ATi + β6 SIZEi +
β7 AGEi + β8 TECHi + β9 UWi + β10 VCi + β11 AUDIi + εi
According to Hypothesis 5, there should be a negative relationship between
growth rates of operating performance and lockup length.
H0 : β1 and β2 and β3 and β4 and β5 ≥ 0
H1 : β1 and β2 and β3 and β4 and β5 < 0
Hypothesis 6 predicts that firms with long lockup periods will experience worse
long-run stock returns after their IPOs compared to firms with short lockup periods. The
same methodology is applied as was done for Hypothesis 2. After obtaining the long-run
returns for each firm, univariate tests are conducted to see whether the mean and
median returns are significantly higher for groups with short lockup periods than for
firms with long lockup periods.
H0 : µs ≤ µl or Ms ≤ Ml
H1 : µs > µl or Ms > Ml
where µs and Ms are the average and median long-run returns for short lockups, and µl
and Ml are the average and median long-run returns for long lockups.

48
Further, regression analysis is conducted by fitting long-run returns (LR) against
lockup lengths.
(14). LRi = β0 + β1 IRi + β2 LOLi + β3 SIZEi + β4 AGEi
+ β5 TECHi + β6 UWi + β7 VCi + β8 AUDIi +εi
According to Hypothesis 6, there should be a significant negative relationship
between LR and LOL. The hypotheses are:
H0 : β2 ≥ 0
H1 : β2 < 0
Hypothesis 6A predicts that firms with high reputation underwriters, auditors, or
venture capital backing will experience no difference between long-run stock returns for
long and short lockups, while Hypothesis 6B predicts that longer lockups are associated
with worse long-run stock returns than shorter lockups for firms with low reputation
underwriters, auditors, or no venture capital backing. After obtaining the long-run stock
returns, the sample is divided into firms with high reputation underwriters and low
reputation underwriters, firms with venture capital backing and no venture capital
backing, and firms with well-known auditors and without well-known auditors. Then the
long-run returns of firms with different lockup lengths are compared within each group.
For firms with high reputation underwriters, auditors, or with venture capital
backing:
H0 : µs = µl or Ms = Ml
H1 : µs ≠ µl or Ms ≠ Ml
For firms with low reputation underwriters, auditors, or no venture capital backing:
H0 : µs = µl or Ms = Ml
H1 : µs > µl or Ms > Ml

49
where µs and Ms are the average and median long-run returns for short lockups, and µl
and Ml are the average and median long-run returns for long lockups.
Hypothesis 7 predicts that there are significant negative abnormal returns for IPO
firms around their lockup expiry, and firms with longer lockups, which have high
chances of experiencing agency problems, will experience worse returns than firms with
shorter lockups. The same methodology is applied as was done for Hypothesis 3.
Univariate tests are conducted to compare the short-run abnormal returns around
lockup expiry for firms with long and short lockup periods. The hypotheses are:
H0 : µs = 0 and µl = 0
H1 : µs < 0 and µl < 0
where µs is the average short-term abnormal return for short lockup IPOs, and µl is the
average short-term abnormal return for long lockup IPOs. Further the means of the two
groups of stocks are compared, and the hypotheses are:
H0 : µs ≤ µl
H1 : µs > µl

50
CHAPTER 5
EMPIRICAL RESULTS
Table 2 provides summary characteristics of the sample. Panel A provides
information on the full sample. There are 3980 initial public offering (IPO) firms that
have lockup lengths available from 1989 to 2004. The mean lockup length is 220 days,
while the median is 180 days. The average underpricing for the sample is 21.19%,
consistent with the literature (Ibbotson 1975; Ritter 1984; Tinic 1988).
Panel B lists sub-periods and shows the variation of lockup length and other IPO
characteristics over time. In 1995 and 1996 there were 948 companies that went to IPO.
The number of IPOs went down after the bust of the high-tech bubble in the early 2000s.
More and more IPO firms choose to use 180-day as their lockup length. In 1989 and
1990, 54% of IPO firms chose lockup lengths other than 180 days, while this number
decreased to 22% in the 1995 – 1996 period, and further dropped to 12% in 2001 and
2002. As a result, the mean lockup length decreased from 223 days in 1989 - 1990 to
186 days in 2001 - 2002. Researchers have noticed this standardization of the lockup
length in recent years; but no reasons have been found to explain it (Field and Hanka
2001; Bradley, Jordan, and Yi 2001). The percentage of IPO firms that are backed by
venture capital is relatively stable across time, with the highest 55% in the 1999 – 2000
period. Almost half of the firms that went public in this period were high-tech firms. This
period also has the highest underpricing -- 54.2% -- as investors appeared to have a
high level of passion for these high-tech firms. The percentage of IPO firms that use the
top six auditors is relatively stable over the 1989-2004 period.
In Panel C, I partition the sample into three groups – IPOs with lockup length
shorter than 180 days (define as short lockup group), those with lockup length equal to
51
180 days, and those with lockup longer than 180 days (define as long lockup group).
About 1000 firms (25% of the sample) use lockup lengths not equal to 180 days. I find
some differences when comparing the characteristics of the three groups. First, 77% of
IPO firms with lockup lengths shorter than 180 days have venture capital backing, while
only 18% of firms with lockup lengths longer than 180 days are backed by venture
capital. Thirty-five percent of IPO firms with short lockups are high-tech firms, while only
7% of IPO firms with long lockups are high-tech firms. The reputation of underwriters for
the group with short lockups and the group with a lockup length equal to 180 days is
much higher than that for the group with long lockups. Similarly, in comparison to the
other groups, the long-lockup group contains a smaller proportion of firms that use a
top-six auditor. Lastly, firms with a 180-day lockup length have the highest offer price
and raise the most funds among the three groups.
Tests for the Signaling Hypothesis
Hypothesis 1: Firms with a longer lockup period should have higher quality, and
therefore a higher operating performance for several years after their IPO.
The results of the test for Hypothesis 1 are contained in Table 3. Before I discuss
these, an explanation of the missing data is in order. I use the growth rates of five
accounting variables to proxy for firm quality. There are 264 firms that do not have the
needed accounting data in Compustat for the four years after the IPO. In addition, for
IPO years, 1052 firms have negative operating returns on assets, 1052 firms have
negative operating income, and 1448 firms have negative operating cash flows. It does
not make sense to calculate the growth rates based on the negative number of the base
year. Thus, following Jain and Kini (1994) I do not calculate the growth rates of these
three accounting variables for firms with negative numbers in IPO years. There are 272
52
firms that do not have sales data available for IPO years. Growth rates for sales and
asset turnover are not calculated for these firms because of missing base year data.
For the second post-IPO year, there are 267 firms without data for operating
returns on assets and operating income, 240 firms without data for operating cash flow,
and 82 firms without sales data. For the third post-IPO year, there are 511 firms without
data for operating returns on assets and operating income, 441 firms without data for
operating cash flow, and 484 firms without sales data. For the fourth post-IPO year,
there are 999 firms without data for operating returns on assets and operating income,
857 firms without data for operating cash flow, and 1178 firms without sales data. As a
result, Table 3 shows that the numbers of observations dropped year by year.
The results from the test of Hypothesis 1, as shown in Table 3, are mixed.
Operating returns on assets and operating cash flow on assets get worse as time goes
by. For example, the growth rate of operating returns on assets for firms with lockup
lengths shorter than 180 days decreases from -7% in the 1-2 year period to -27% in the
1-4 year period. On the other hand, sales, operating income, and asset turnover
improve over time. For example, the growth rate of sales for firms with a 180 day lockup
period increases from 33% in the 1-2 year period to 93% in the 1-4 year period. When
comparing the medians for firms with long and short lockups, only the growth rates of
asset turnover support Hypothesis 1. For example, the growth rate of asset turnover for
firms with long lockups in the 1-2 year period is 10%, compared to 3% for firms with
short lockups. The difference between the two growth rates is significant at the 1% level.
The 1-3 and 1-4 periods show similar results. When comparing firms with and without a
180-day lockup period, I find that the growth rates of operating return on asset and
operating income for firms with a lockup length equal to 180 days are better than those

53
for firms with lockup lengths other than 180 days for all three periods. In sum, from the
univariate tests, only one variable among the five – asset turnover – supports
Hypothesis 1.
In the OLS regression shown in Table 4, I control for other variables that may
affect the length of lockup. Among the five accounting variables, operating return on
asset is significantly negatively correlated with lockup length. The coefficient is -0.118,
and it is significant at the 1% level (p-value of 0.003). At the same time, asset turnover
is significantly positively correlated with lockup length. Its coefficient is 0.069, and it is
significant at the 5% level (p-value of 0.048). Though not reported, when using growth
rates of year 1-2 and 1-4 as independent variables instead of year 1-3, none of the
accounting variables are significant. Since the majority of the sample is firms with a
lockup length of 180 days, I also ran the OLS regression including only firms with lockup
lengths other than 180 days. The results are very similar with those using all three
groups. Thus, consistent with the univariate tests, I do not find any clear relationship
between the operating performance and lockup lengths.
Because the relationship between operating performance and lockup length may
not be linear, I also use a non-linear model – binary logistic model – to run the
regression. As Table 5 shows, among the five accounting variables, asset turnover is
marginally significant. It has a coefficient of 0.710, an odds ratio of 2.033, and is
significant at the 10% level (p-value of 0.076). It means that with each 1% increase in
the growth rate of asset turnover, the odds of a firm having a lockup length greater than
180 days increases by 2.033 times. In other words, firms with a lockup length greater
than 180 days tend to have a higher growth rate of asset turnover. When using years 1-
2 and 1-3 as independent variables, all accounting variables are not significant.

54
Therefore, I conclude that there is a weak non-linear relationship between operating
performance and lockup length since only one out of the five accounting variables has a
marginal significance.
In order to examine why firms choose 180 days as their lockup period, I run a
multinomial logistic regression to compare the characteristics of firms with a 180-day
lockup length to firms with a lockup length longer and shorter than 180 days. Table 6
shows the results. When comparing firms with a 180-day lockup period to firms with a
lockup period shorter than 180 days, size has a coefficient of -0.85, an odds ratio of
0.427, and it is significant at the 1% level (p-value of 0.000). Similarly, when comparing
firms with a 180-day lockup period to firms with a lockup period longer than 180 days,
size has a coefficient of -0.959, an odds ratio of 0.383, and it is significant at the 1%
level (p-value of 0.000). The results indicate that as firms‟ sizes increase, firms have a
higher chance to choose 180 days as their lockup length. In other words, because I use
proceeds from IPO as the proxy for firm size, firms choosing 180 days as their lockup
period raise more money in their IPO than other firms do. When using 1-3 and 1-4 year
growth rates in the regression, I get similar results.
Hypothesis 1A: The positive relationship between operating performance and
lockup length (Hypothesis 1) is stronger for opaque firms than for transparent firms.
Table 7 contains the results from the univariate tests for accounting numbers for
opaque firms. Among the five accounting variables, only asset turnover is significantly
greater for firms with long lockups than that for firms with short lockups. Table 8 shows
the results of OLS regression for opaque firms that include lockup lengths equal to 180
days, longer than 180 days, and shorter than 180 days. Among the five accounting
variables, four are significant. But two variables are positively related with lockup length

55
while the other two are negatively related with lockup length. When using 1-2 and 1-4
year periods, none of the accounting variables are significant. I further run the OLS
regression by excluding firms with a lockup length equal to 180 days and find similar
results. In addition, the binary logistic regressions testing the non-linear relationship
between operating performance and lockup length show no significant results. For
transparent firms, I repeat all the tests mentioned above, but find no significant results.
In sum, the evidence does not support Hypothesis 1A.
Hypothesis 1B: The positive relationship between operating performance and
lockup length (Hypothesis 1) is stronger for high-tech firms than for non-high-tech firms.
The growth rates of the five accounting variables for high-tech firms are shown in
Table 9. Similar with opaque firms in Hypothesis 1A, only asset turnover shows a
superior growth rate for high-tech firms with long lockups. However, in the regression
results shown in Table 10, none of the accounting variables are significantly and
positively related to lockup length. I also conduct other similar regression analysis in
Hypothesis 1A for high-tech firms and non-high-tech firms, and no further significant
results are found. Therefore, the evidence does not support Hypothesis 1B.
Hypothesis 1C: The positive relationship between operating performance and
lockup length (Hypothesis 1) is stronger for firms with a high λ than for firms with a low λ.
Table 11 contains the results of univariate tests for firms with a top 20% of λ. As
one can see from the table, consistent with Hypothesis 1A and 1B, only asset turnover
shows a high growth rate for firms with a high λ. Table 12 shows the OLS regression
results for firms with a top 20% of λ. Asset turnover is significant at the 1% level (p-
value of 0.007) with a coefficient of 0.867. Operating return on asset is also significant
(p-value of 0.042), but with a coefficient of -2.052. The results show no clear

56
relationship between operating performance and lockup length. Other tests similar with
Hypothesis 1A show no significant results for accounting variables for top λ firms.
I compare the growth rates for these five accounting variables for firms with a
bottom 20% of λ in Table 13. The same pattern as before is found. Asset turnover is the
only significant variable. Table 14 shows the OLS regression results for firms with a
bottom 20% of λ. Asset turnover is significant at 5% level (p-value of 0.036) with a
coefficient of 0.248. Other tests show no significant results for accounting variables for
bottom λ. Therefore, there is no evidence to support Hypothesis 1C.
Hypothesis 2: If investors incorporate the signal conveyed in lockup length into the
IPO offer price, there will be no difference between the long-run stock returns for long
and short lockups.
There are 3980 IPO firms that have lockup lengths available from SDC, among
which only 3813 firms have available stock return data from the CRSP. The difference
may be due to the fact that some IPO firms included in Securities Data Corporation
(SDC) are listed on the Pink Sheet or Small Capital Market where no stock price data is
available from CRSP.
Table 15 shows the long-run returns for IPO firms with different lockup lengths.
Panel A shows that, generally, IPO firms experience long-run stock return
underperformance compared to the market, consistent with the literature (Ritter 1991;
Loughran and Ritter 1995). When I divide the whole sample into three groups according
to the length of lockup, some differences appear among groups. For example, the
median 6-month value-weighted stock return for firms with a lockup length shorter than
180 days is -7%, higher than the -11% for firms with a 180-day lockup period, and -15%
for firms with a lockup length longer than 180 days. The differences are significant at the

57
1% level. The 1-year, 2-year, and 3-year returns give similar results. The evidence
shows that firms with a shorter lockup length experience better long-run stock returns
than firms with a longer lockup length.
Figure 1 plots the 1-year return for these three groups, with all three groups
showing similar patterns. For firms with a lockup length shorter than 180 days, 62% of
firms have a negative 1-year return, compared to 73% for firms with a lockup length
longer than 180 days. Thirty-two percent of firms with short lockups have returns less
than -50%, while 45% of firms with long lockups have returns below -50%. Twenty-one
percent of firms with short lockups have returns greater than 50%, while only 12% of
firms with long lockups have returns greater than 50%. Thus, the poor long-run returns
for long lockups are not driven by some extreme numbers; on the contrary, they are
driven by general poor returns for the group.
In the regression analysis in Panel B, I control for other variables that may affect
the long-run returns. The dependent variable is the 3-year long-run stock return. The
lockup length variable has a coefficient of -0.15, and it is significant at the 1% level (p-
value of 0.00). It indicates that lockup length and IPO long-run returns are significantly
negatively related. The long-run returns for 6-month, 1-year, and 2-year periods give
similar results. In sum, I conclude that the long-run returns are significantly different for
firms with long and short lockups; therefore, I find no support for Hypothesis 2.
Hypothesis 3: There are no significant abnormal returns for IPO firms around their
lockup expiration dates.
There are 3249 firms that have short-term returns available around lockup expiry
from EVENTUS. Some possible reasons for the missing data are: data end before
lockup expiration day, no data available for estimation period, and data start after
58
expiration day. Panel A of Table 16 shows the short-run returns for the whole sample.
The mean seven-day return for firms with a lockup length shorter than 180 days is -
1.4%, while the return for firms with a lockup length longer than 180 days is -1.91%.
Both of them are significantly different from zero. However, the difference between the
two groups of returns is not significant.
Next, I examine the short-run returns for firms with high information asymmetry
and low information asymmetry. Panel B shows that transparent firms have significantly
negative abnormal returns around lockup expiry. Panel C indicates that high-tech firms
experience a much worse short-run return around lockup expiry than non-high-tech
firms. The difference is significant at the 1% level. This finding is consistent with
literature (Field and Hanka, 2001; Bradley, Jordan, and Yi, 2001), but no explanations
have been found. Panel D shows that for firms with high adverse selection, those that
have a lockup period shorter than 180 days experience a positive abnormal return. In
sum, because firms do have significant abnormal returns around lockup expiry, I reject
Hypothesis 3.
Tests for the Agency Hypothesis
Hypothesis 4: Higher agency problem IPOs should lock up more shares.
As shown in Table 17, the mean and median percentage of shares locked for firms
with a high agency problem are 60.28% and 67.25%, respectively. The mean and
median percentage of shares locked for firms with a low agency problem are 60.02%
and 64.88%, respectively. The means and medians are very close and are not
significantly different. Because the agency hypothesis says firms with a high agency
problem should have a longer lockup period, I further compare the percentage of shares
locked between firms with long and short lockup periods. The mean and median

59
percentage of shares locked for firms with a lockup length shorter than 180 days are
50.45% and 57.58%, respectively. The mean and median percentage of shares locked
for firms with a lockup length longer than 180 days are 52.29% and 56.79%,
respectively. The means and medians are not significantly different between the two
groups. In sum, there is no evidence to support Hypothesis 4.
Hypothesis 5: IPO firms with longer lockup periods will have worse operating
performance several years after their offerings compared to firms with shorter lockup
periods.
The same tests are applied as for Hypothesis 1. As shown in Table 3, among the
five accounting variables, only the growth rates of operating return on asset and
operating income for firms with short lockups are higher than those for firms with long
lockups in the 1-2 and 1-3 year periods. Further, the OLS regressions and logistic
regressions do not show a clear relationship between operating performance and
lockup length as shown in Hypothesis 1. Thus, I find no support for Hypothesis 5.
Hypothesis 6: Firms with long lockup periods will experience worse long-run stock
returns after their offerings compared to firms with short lockup periods.
The same tests are applied as for Hypothesis 2. As shown in Table 10, the long-
run returns for firms with a short lockup period are significantly better than firms with a
long lockup period. Therefore, the evidence supports Hypothesis 6.
Further, I compare the long-run returns for firms with high agency problems and
low agency problems. Table 18 shows the results. In Panel A, the median 2-year long-
run return for firms with a low agency problem is -28%, which is significantly greater
than the -64% for firms with a high agency problem. Other returns show similar results.
In the regression analysis in Panel B, the 1-year stock return is the dependent variable,
60
and the independent variables are factors that may affect the long-run return. The
agency score has a coefficient of -0.23, and it is significant at the 1% level. The returns
for 6-month, 2-year, and 3-year give similar results. Thus, the evidence indicates that
high agency firms experience much worse long-run stock returns compared to firms with
low agency problems. Note that the R-squared is 4.4%. This is normal because the
studies investigating IPO long-run returns by using regressions analysis normally show
an R-squared around 5%. However, when examining the relationship between lockup
length and long-run returns for firms with high and low agency problems, both
regressions generate a negative but insignificant coefficient for lockup length.
Hypothesis 6A: For firms with high reputation underwriters, auditors, or venture
capital backing, there is no difference between long-run stock returns for long and short
lockups.
Hypothesis 6B: For firms with low reputation underwriters, auditors, or no venture
capital backing, longer lockups are associated with worse long-run stock returns than
shorter lockups.
Table 19 shows the long-run returns for high- and low-reputation underwriters. In
Panel A, it shows that the median long-run return for firms with high-reputation
underwriters is much higher than that for firms with low-reputation underwriters,
consistent with the literature (Carter, Dark, and Singh 1998). For example, the median
1-year returns are -11% and -55% for firms with high-reputation underwriters and low-
reputation underwriters, respectively. The difference is significant at the 1% level. The
returns for other time periods also show similar results. Panel B shows the results for
firms with high-ranking underwriters. The long-run returns for firms with long and short
lockups are not significantly different from one another. This is because high ranking

61
underwriters are good monitors of agency problems, so firms with reputable
underwriters will have low agency problems. As a result, these firms do not need to use
lockup length to indicate their potential for agency problems. On the contrary, in Panel C,
because firms do not have high-reputation underwriters as monitors of agency problems,
they still need to use lockup length to differentiate the agency problem. Thus, the long-
run returns for firms with short lockups, which have low agency problems, are
significantly better than firms with long lockups, which have high agency problems.
Table 20 shows the long-run returns for firms with and without venture capital
backing. Panel A shows that all the returns in different time periods for firms with
venture capital backing are significantly better than those for firms without venture
capital backing, consistent with the literature (Brav and Gompers 1997). When looking
at Panel B and C, I find that with or without venture capital backing, firms with short
lockups have significantly better long-run returns for all the time periods than firms with
long lockups. The result is different from that of underwriter. This may be because
venture capital is not a good monitor of agency problems, thus firms still need to use
lockup length to differentiate their agency problems.
Table 21 shows the long-run returns for firm with high- and low-ranking auditors. I
find that, in Panel A, firms with a high-ranking auditor experience much better long-run
stock returns than firms with a low-ranking auditor. As with venture capital, I find that
auditors, regardless of rankings, are not good monitors of firm agency problems. As a
result, the long-run returns for firms with short lockups are always better than those for
firms with long lockups, not matter whether they have high-ranking or low-ranking
auditors.

62
Thus, the agency problem appears to be closely related to firms‟ lockup length and
long-run stock returns. If firms already have a good mechanism to control for agency
problems, lockup length does not mean a great deal to them. Thus, their long-run stock
returns, regardless of lockup lengths, are not different. On the other hand, firms lacking
a good mechanism to control for agency problems need to use lockup lengths to
differentiate their agency problems. Therefore, high agency problem firms, which have
longer lockup lengths, experience much worse long-run stock returns than low agency
problem firms, which have shorter lockup lengths.
Hypothesis 7: There are significant negative abnormal returns for IPO firms around
their lockup expiry, and firms with longer lockups, which have a high probability of
experiencing agency problems, will experience worse returns than firms with shorter
lockups.
The same tests are conducted as for Hypothesis 3. As Panel A of Table 11 shows,
firms with short lockups and long lockups have significant negative short-term abnormal
returns around their lockup expiry. The negative return is greater for long lockups
compared to short lockups, but the difference is not significant. Thus, Hypothesis 7 is
partially supported.
Further, I examine the relationship between short-run return around lockup expiry
and agency problem. In Panel A of Table 22, I find that firms with high agency problems
experience a much higher negative abnormal return than firms with low agency
problems. For instance, the mean 7-day return around lockup expiry for firms with a low
agency problem is -0.58%, and it is not significantly different from zero. While the return
for firms with a high agency problem is -3.34% with a significant level of 1%. The
evidence indicates that investors sell their holdings for firms with high agency problems

63
around lockup expiry to avoid being taking advantage of by insiders after lockup expiry.
In the regression analysis in Panel B, the agency score variable is not significant, while
venture capital is significantly negatively related to short-run stock return around lockup
expiry. Field and Hanka (2001) and Bradley, Jordan, and Yi (2001) also find that firms
with venture capital backing experience a much worse return than non-venture backed
firms, but no reasonable explanations have been found yet.

64
Table 2
Summary Statistics
Panel A: Full Sample (N = 3980)
Mean Median
Number of Lockup days 220 180
Underwriter Ranking(UR) 6.8 8
Offer Price(OP) $11.85 $11.50
Underpricing(UP) 21.19% 11.11%
Panel B: Distribution of IPOs by Year and Characteristics
Lockup Length IPO Characteristics
Period N Non-180 Mean VC TECH UP UR AUDIT
1989-1990 186 54% 223 41% 26% 13.2% 7.3 58%
1991-1992 598 32% 221 44% 24% 16.5% 7.1 82%
1993-1994 822 31% 242 37% 20% 13.9% 6.5 77%
1995-1996 948 22% 228 43% 37% 20.8% 6.7 79%
1997-1998 605 26% 224 36% 29% 18.6% 6.4 78%
1999-2000 425 14% 184 55% 48% 54.2% 6.6 63%
2001-2002 117 12% 186 36% 30% 15.5% 7.9 77%
2003-2004 279 13% 183 43% 22% 12.7% 7.6 72% (table continues)

65
Table 2 (continued).
Panel C: IPOs with Different Lockup Lengths and Their Characteristics
Lockup Length IPO Characteristics
Length N Mean VC TECH UP UR AUDIT SIZE OP
<180 309(7.6) 108 77% 35% 16% 6.8 76% 45 M 11.56
=180 2979(74.8%) 180 45% 31% 22% 7.3 79% 68 M 12.65
>180 692(17.4%) 443 18% 7% 19% 4.4 59% 30 M 8.54
Note: Underwriter ranking (UR) is based on Carter-Manaster (1990), and the higher the score, the higher the reputation. Venture Capital (VC) is the percentage of IPOs backed by venture capital, TECH is the percentage of IPOs that are high-tech firms, and AUDIT is the percentage of IPOs using top six auditors. SIZE is the product of number of shares offered and offer price. Underpricing (UP) is the average percentage price change from offer price to the closing price of the first day after IPO.

66
Table 3
Accounting Numbers and Lockup Length
Panel A: Operating Return On Asset
GR <180 (1) N =180 (2) N >180 (3) N Comparison(p-value)
3&1 2&1 2&3
Yr 1 to 2 -0.07 204 -0.05*** 1892 -0.15*** 301 NA NA 0.00
Yr 1 to 3 -0.2*** 183 -0.13*** 1702 -0.31*** 268 NA NA 0.00
Yr 1 to 4 -0.27*** 147 -0.19*** 1309 -0.3*** 209 NA NA 0.03
Panel B: Operating Cash Flow On Asset
GR <180 (1) N =180 (2) N >180 (3) N Comparison(p-value)
3&1 2&1 2&3
Yr 1 to 2 -0.17*** 176 -0.16*** 1617 -0.29*** 235 NA NA 0.02
Yr 1 to 3 -0.40*** 162 -0.27*** 1457 -0.40*** 208 NA NA 0.02
Yr 1 to 4 -0.44*** 130 -0.35*** 1120 -0.42*** 161 NA NA NA
Panel C: Sales
GR <180 (1) N =180 (2) N >180 (3) N Comparison(p-value)
3&1 2&1 2&3
Yr 1 to 2 0.3*** 257 0.33*** 2572 0.36*** 533 0.06 NA NA
Yr 1 to 3 0.69*** 229 0.63*** 2276 0.76*** 455 NA NA NA
Yr 1 to 4 1.00*** 180 0.93*** 1739 1.05*** 347 NA NA NA (table continues)

67
Table 3 (continued).
Panel D: Operating Income
GR <180 (1) N =180 (2) N >180 (3) N Comparison(p-value)
3&1 2&1 2&3
Yr 1 to 2 0.29*** 204 0.28*** 1892 0.17*** 301 NA NA 0.00
Yr 1 to 3 0.47*** 183 0.45*** 1702 0.21 268 NA NA 0.00
Yr 1 to 4 0.53*** 147 0.56*** 1309 0.25** 209 NA NA 0.06
Panel E: Asset Turnover
GR <180 (1) N =180 (2) N >180 (3) N Comparison(p-value)
3&1 2&1 2&3
Yr 1 to 2 0.03 257 0.05*** 2572 0.10*** 533 0.00 NA NA
Yr 1 to 3 0.06 229 0.06*** 2276 0.15*** 455 0.00 0.08 NA
Yr 1 to 4 0.02 180 0.07*** 1739 0.17*** 347 0.00 0.02 NA
Note: Operating Return on Asset is defined as operating income before depreciation and taxes divided by total assets, Operating Cash Flow on Asset equals operating income minus capital expenditures, divided by total assets, and Asset Turnover is defined as the ratio of sales to total assets. GR is the median growth rate of a post-IPO year relative to the IPO year. Industry-adjusted growth rates are used. *, **, and *** denote significant different from zero at 10%, 5%, and 1% level, respectively. Mann-Whitney test is used to compare the medians for two groups. When p-value is greater than 0.10, I use NA instead of the real p-value. The null hypothesis for the comparison of 3&1 is that the median for firms with short lockups is greater than or equal to that for firms with long lockups. The null hypothesis for the comparison of 2&1 is that the median for firms with short lockups is greater than or equal to that for firms with a 180-day lockup period. The null hypothesis for the comparison of 2&3 is that the median for firms with long lockups is greater than or equal to that for firms with a 180-day lockup period.

68
Table 4
Regression for Length of Lockup (OLS)
Estimated Coefficient P-Value
Operating Retn 1-3 Year Growth Rate -0.118 0.003
Cash Flow 1-3 Year Growth Rate 0.005 0.813
Sales 1-3 Year Growth Rate -0.039 0.347
Opera Income 1-3 Year Growth Rate 0.064 0.164
Asset Turnover 1-3 Year Growth Rate 0.069 0.048
Size -0.063 0.021
Age -0.017 0.453
High-tech -0.037 0.105
Underwriter Ranking -0.335 0.000
Venture Capital Backing -0.094 0.000
Auditor Ranking -0.054 0.013
Adjusted R Square 18.10
Note: Number of lockup days is the dependent variable. Independent variables are listed in the table. Size is the natural logarithm of the product of the number of shares offered and offer price. Age is defined as the years from a firm‟s inception till IPO. High-tech is a dummy variable, and it equals 1 for high-tech firms and 0 otherwise. Venture Capital Backing is a dummy variable, and it equals 1 for firms with venture capital backing and 0 otherwise. Auditor Ranking is a dummy variable, and it equals 1 for firms use top six auditors and 0 otherwise. All other independent variables are defined as before. The sample includes firms with lockup lengths longer than 180 days, equal to 180 days, and shorter than 180 days. Ordinary Least Square (OLS) is used.

69
Table 5
Regression for Length of Lockup -- Binary Logistic
Estimated Coefficient P-Value Exp(B)
Operating Retn 1-4 Year Growth Rate -0.096 0.647 0.908
Cash Flow 1-4 Year Growth Rate -0.017 0.602 0.983
Sales 1-4 Year Growth Rate -0.052 0.629 0.949
Opera Income 1-4 Year Growth Rate 0.075 0.362 1.077
Asset Turnover 1-4 Year Growth Rate 0.710 0.076 2.033
Size 0.465 0.044 1.592
Age -0.004 0.649 0.996
High-tech -0.405 0.226 0.667
Underwriter Ranking -0.436 0.000 0.647
Venture Capital Backing -1.243 0.000 0.288
Auditor Ranking 0.220 0.513 1.246
Adjusted R Square 35.30
Note: The sample only includes firms with lockup lengths other than 180 days. Binary logistic test is used. Dependent variable is 0 for firms with a lockup length shorter than 180 days, and 1 for firms with a lockup length longer than 180 days. Independent variables are the same as defined before. Exp(B), or odds ratio, is calculated by raising e to the power of logistic coefficient.

70
Table 6
Regression for Length of Lockup -- Multinomial Logistic
Panel A: Compare Length <180 and =180
Estimated Coefficient P-Value Exp(B)
Operating Retn 1-3 Year Growth Rate -0.008 0.503 0.992
Cash Flow 1-3 Year Growth Rate 0.010 0.190 1.010
Sales 1-3 Year Growth Rate 0.001 0.992 0.959
Opera Income 1-3 Year Growth Rate 0.005 0.582 1.005
Asset Turnover 1-3 Year Growth Rate 0.026 0.339 1.027
Size -0.851 0.000 0.427
Age 0.002 0.582 1.002
High-tech 0.330 0.027 1.390
Underwriter Ranking 0.032 0.472 1.033
Venture Capital Backing 0.001 0.992 1.001
Auditor Ranking -0.168 0.306 0.845
Panel B: Compare Length >180 and =180
Estimated Coefficient P-Value Exp(B)
Operating Retn 1-3 Year Growth Rate -0.006 0.516 0.994
Cash Flow 1-3 Year Growth Rate -0.001 0.903 0.999
Sales 1-3 Year Growth Rate 0.007 0.757 1.007
Opera Income 1-3 Year Growth Rate 0.004 0.671 1.004
Asset Turnover 1-3 Year Growth Rate 0.010 0.710 1.010
(table continues)

71
Table 6 (continued).
Estimated Coefficient P-Value Exp(B)
Size -0.959 0.000 0.383
Age -0.008 0.077 0.992
High-tech -0.137 0.334 0.872
Underwriter Ranking -0.379 0.000 0.682
Venture Capital Backing -0.540 0.000 0.583
Auditor Ranking -0.330 0.015 0.719
Note: The sample is partitioned into three groups – firms with lockup length equal to 180 days, shorter than 180 days, and longer than 180 days. The group with a 180-day lockup length is a reference group, and its characteristics are compared to those of the other two groups. Dependent variable is 0, 1, and 2, representing each of the three groups, respectively. Independent variables are defined as before. Multinomial logistic regression is conducted. Exp(B), or odds ratio, is calculated by raising e to the power of logistic coefficient.

72
Table 7
Accounting Numbers and Lockup Length -- Opaque Firms
Panel A: Operating Return On Asset
GR <180 (1) N =180 (2) N >180 (3) N Comparison(p-value)
3&1 2&1 2&3
Yr 1 to 2 -0.15* 19 -0.09 39 -0.40*** 89 NA NA 0.00
Yr 1 to 3 -0.29** 17 -0.17 36 -0.52** 74 NA NA 0.06
Yr 1 to 4 -0.32** 16 -0.48*** 31 -0.47*** 58 NA NA NA
Panel B: Operating Cash Flow On Asset
GR <180 (1) N =180 (2) N >180 (3) N Comparison(p-value)
3&1 2&1 2&3
Yr 1 to 2 -0.40 15 -0.08 36 -0.57*** 65 NA NA 0.00
Yr 1 to 3 -0.48* 14 -0.11 33 -0.58*** 53 NA NA 0.06
Yr 1 to 4 -0.30** 13 -0.73*** 29 -0.52*** 39 NA NA NA
Panel C: Sales
GR <180 (1) N =180 (2) N >180 (3) N Comparison(p-value)
3&1 2&1 2&3
Yr 1 to 2 0.39*** 28 0.22*** 61 0.35*** 180 NA NA NA
Yr 1 to 3 0.98*** 22 0.46*** 50 0.76*** 144 NA NA NA
Yr 1 to 4 1.73*** 21 0.79*** 43 1.12*** 107 NA NA NA
(table continues)

73
Table 7 (continued).
Panel D: Operating Income
GR <180 (1) N =180 (2) N >180 (3) N Comparison(p-value)
3&1 2&1 2&3
Yr 1 to 2 0.25 19 0.27* 39 -0.22 89 NA NA 0.03
Yr 1 to 3 0.43** 17 0.54** 36 0.04 74 NA NA 0.02
Yr 1 to 4 0.24 16 0.32 31 0.00 58 NA NA NA
Panel E: Asset Turnover
GR <180 (1) N =180 (2) N >180 (3) N Comparison(p-value)
3&1 2&1 2&3
Yr 1 to 2 -0.03 28 0.01 61 0.19*** 180 0.05 NA NA
Yr 1 to 3 0.07 22 -0.09 50 0.29*** 144 0.06 NA NA
Yr 1 to 4 -0.03 20 -0.13*** 43 0.39*** 107 0.04 NA NA
Note: Operating Return on Asset is defined as operating income before depreciation and taxes divided by total assets, Operating Cash Flow on Asset equals operating income minus capital expenditures, divided by total assets, and Asset Turnover is defined as the ratio of sales to total assets. GR is the median growth rate of a post-IPO year relative to the IPO year. Industry-adjusted growth rates are used. *, **, and *** denote significant different from zero at 10%, 5%, and 1% level, respectively. Mann-Whitney test is used to compare the medians for two groups. When p-value is greater than 0.10, I use NA instead of the real p-value. The null hypothesis for the comparison of 3&1 is that the median for firms with short lockups is greater than or equal to that for firms with long lockups. The null hypothesis for the comparison of 2&1 is that the median for firms with short lockups is greater than or equal to that for firms with a 180-day lockup period. The null hypothesis for the comparison of 2&3 is that the median for firms with long lockups is greater than or equal to that for firms with a 180-day lockup period.

74
Table 8
Regression for Length of Lockup -- Opaque Firms
Estimated Coefficient P-Value
Operating Retn 1-3 Year Growth Rate -0.448 0.002
Cash Flow 1-3 Year Growth Rate -0.152 0.257
Sales 1-3 Year Growth Rate -1.166 0.002
Opera Income 1-3 Year Growth Rate 0.602 0.007
Asset Turnover 1-3 Year Growth Rate 0.960 0.007
Size -0.189 0.207
Age -0.078 0.443
High-tech 0.045 0.733
Underwriter Ranking -0.226 0.133
Venture Capital Backing -0.043 0.674
Auditor Ranking -0.182 0.146
Adjusted R Square 24.20
Note: The regression is for opaque firms that include lockup lengths equal to 180 days, longer than, and shorter than 180 days. OLS is used. All variables are defined as before.

75
Table 9
Accounting Numbers and Lockup Length -- High-tech Firms
Panel A: Operating Return On Asset
GR <180 (1) N =180 (2) N >180 (3) N Comparison(p-value)
3&1 2&1 2&3
Yr 1 to 2 -0.08 76 -0.01 523 -0.20 64 NA NA 0.00
Yr 1 to 3 -0.19* 72 -0.13** 468 -0.42*** 58 NA NA 0.00
Yr 1 to 4 -0.43** 60 -0.37*** 360 -0.55** 45 NA NA NA
Panel B: Operating Cash Flow On Asset
GR <180 (1) N =180 (2) N >180 (3) N Comparison(p-value)
3&1 2&1 2&3
Yr 1 to 2 -0.25*** 70 -0.11*** 467 -0.24*** 53 NA NA NA
Yr 1 to 3 -0.46*** 67 -0.28*** 419 -0.46*** 47 NA NA NA
Yr 1 to 4 -0.57*** 56 -0.58*** 319 -0.64*** 36 NA NA NA
Panel C: Sales
GR <180 (1) N =180 (2) N >180 (3) N Comparison(p-value)
3&1 2&1 2&3
Yr 1 to 2 0.35*** 98 0.37*** 817 0.37*** 131 NA NA NA
Yr 1 to 3 0.76*** 91 0.68*** 705 0.66*** 108 NA NA NA
Yr 1 to 4 1.17*** 72 0.99*** 539 1.04*** 80 NA NA NA
(table continues)

76
Table 9 (continued).
Panel D: Operating Income
GR <180 (1) N =180 (2) N >180 (3) N Comparison(p-value)
3&1 2&1 2&3
Yr 1 to 2 0.29* 76 0.34*** 522 0.17* 64 NA NA 0.03
Yr 1 to 3 0.58** 72 0.43*** 468 0.09 58 NA NA 0.02
Yr 1 to 4 0.02 60 0.21*** 360 0.10 45 NA NA NA
Panel E: Asset Turnover
GR <180 (1) N =180 (2) N >180 (3) N Comparison(p-value)
3&1 2&1 2&3
Yr 1 to 2 0.04 98 0.13*** 817 0.14*** 131 0.01 0.00 NA
Yr 1 to 3 0.09 91 0.16*** 705 0.22*** 108 0.03 0.00 NA
Yr 1 to 4 0.10 72 0.19*** 539 0.30*** 80 0.02 0.02 NA
Note: Operating Return on Asset is defined as operating income before depreciation and taxes divided by total assets, Operating Cash Flow on Asset equals operating income minus capital expenditures, divided by total assets, and Asset Turnover is defined as the ratio of sales to total assets. GR is the median growth rate of a post-IPO year relative to the IPO year. Industry-adjusted growth rates are used. *, **, and *** denote significant different from zero at 10%, 5%, and 1% level, respectively. Mann-Whitney test is used to compare the medians for two groups. When p-value is greater than 0.10, I use NA instead of the real p-value. The null hypothesis for the comparison of 3&1 is that the median for firms with short lockups is greater than or equal to that for firms with long lockups. The null hypothesis for the comparison of 2&1 is that the median for firms with short lockups is greater than or equal to that for firms with a 180-day lockup period. The null hypothesis for the comparison of 2&3 is that the median for firms with long lockups is greater than or equal to that for firms with a 180-day lockup period.
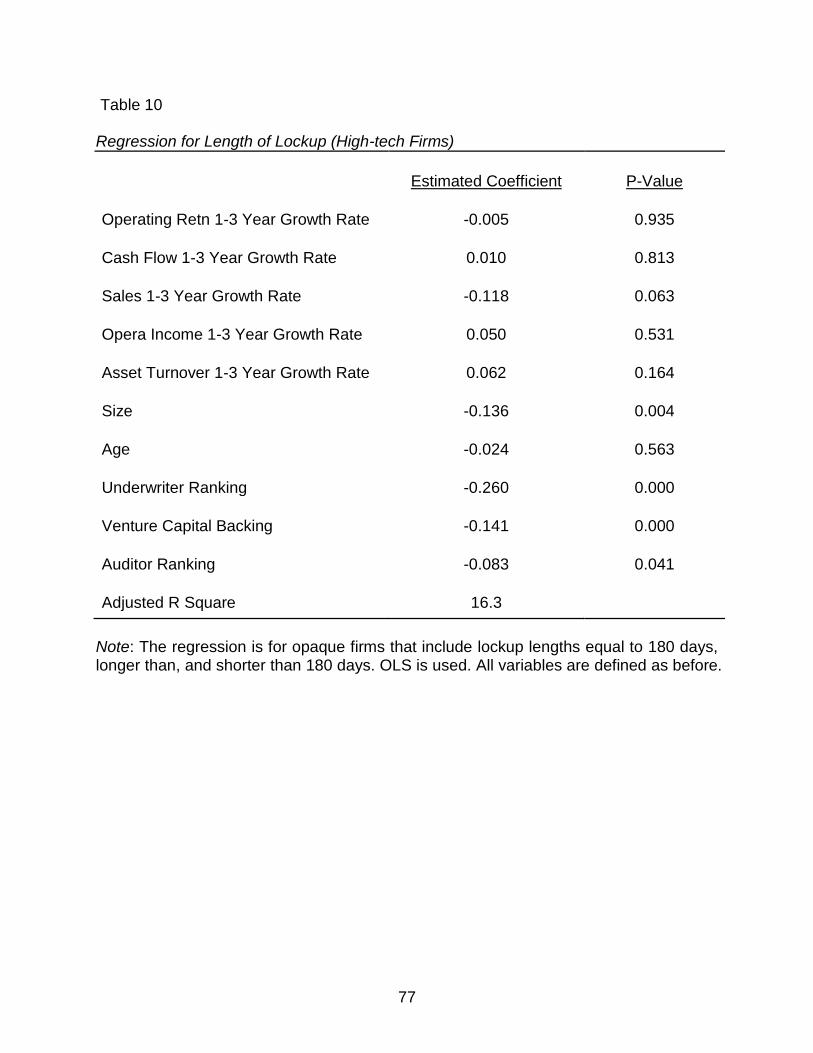
77
Table 10
Regression for Length of Lockup (High-tech Firms)
Estimated Coefficient P-Value
Operating Retn 1-3 Year Growth Rate -0.005 0.935
Cash Flow 1-3 Year Growth Rate 0.010 0.813
Sales 1-3 Year Growth Rate -0.118 0.063
Opera Income 1-3 Year Growth Rate 0.050 0.531
Asset Turnover 1-3 Year Growth Rate 0.062 0.164
Size -0.136 0.004
Age -0.024 0.563
Underwriter Ranking -0.260 0.000
Venture Capital Backing -0.141 0.000
Auditor Ranking -0.083 0.041
Adjusted R Square 16.3
Note: The regression is for opaque firms that include lockup lengths equal to 180 days, longer than, and shorter than 180 days. OLS is used. All variables are defined as before.

78
Table11
Accounting Numbers and Lockup Length -- High λ Firms
Panel A: Operating Return On Asset
GR <180 (1) N =180 (2) N >180 (3) N Comparison(p-value)
3&1 2&1 2&3
Yr 1 to 2 0.41** 17 0.02 340 -0.14** 25 NA NA 0.00
Yr 1 to 3 0.05 17 -0.09* 301 -0.24** 23 NA NA 0.00
Yr 1 to 4 -0.74** 11 -0.18*** 265 -0.28** 17 NA NA NA
Panel B: Operating Cash Flow On Asset
GR <180 (1) N =180 (2) N >180 (3) N Comparison(p-value)
3&1 2&1 2&3
Yr 1 to 2 0.20* 17 -0.02 290 -0.02 20 NA NA NA
Yr 1 to 3 -0.34** 17 -0.16** 257 -0.15* 18 NA 0.04 NA
Yr 1 to 4 -1.02*** 11 -0.31*** 215 -0.30** 13 NA 0.06 NA
Panel C: Sales
GR <180 (1) N =180 (2) N >180 (3) N Comparison(p-value)
3&1 2&1 2&3
Yr 1 to 2 0.58** 25 0.30*** 542 0.35** 46 NA NA NA
Yr 1 to 3 1.45*** 21 0.54*** 463 0.65*** 39 NA NA NA
Yr 1 to 4 2.24*** 12 0.68*** 401 0.67*** 28 NA NA NA
(table continues)

79
Table11 (continued).
Panel D: Operating Income
GR <180 (1) N =180 (2) N >180 (3) N Comparison(p-value)
3&1 2&1 2&3
Yr 1 to 2 1.20** 17 0.26** 340 0.07 25 NA NA 0.03
Yr 1 to 3 1.82** 16 0.40*** 301 0.21** 23 NA NA 0.02
Yr 1 to 4 0.63* 11 0.35*** 265 -0.05 17 NA NA 0.07
Panel E: Asset Turnover
GR <180 (1) N =180 (2) N >180 (3) N Comparison(p-value)
3&1 2&1 2&3
Yr 1 to 2 0.07 25 0.07** 542 0.10** 46 0.05 NA NA
Yr 1 to 3 0.00 21 0.08** 463 0.23** 39 0.03 0.06 NA
Yr 1 to 4 -0.19 12 0.09** 401 0.13** 28 0.02 0.02 NA
Note: Operating Return on Asset is defined as operating income before depreciation and taxes divided by total assets, Operating Cash Flow on Asset equals operating income minus capital expenditures, divided by total assets, and Asset Turnover is defined as the ratio of sales to total assets. GR is the median growth rate of a post-IPO year relative to the IPO year. Industry-adjusted growth rates are used. *, **, and *** denote significant different from zero at 10%, 5%, and 1% level, respectively. Mann-Whitney test is used to compare the medians for two groups. When p-value is greater than 0.10, I use NA instead of the real p-value. The null hypothesis for the comparison of 3&1 is that the median for firms with short lockups is greater than or equal to that for firms with long lockups. The null hypothesis for the comparison of 2&1 is that the median for firms with short lockups is greater than or equal to that for firms with a 180-day lockup period. The null hypothesis for the comparison of 2&3 is that the median for firms with long lockups is greater than or equal to that for firms with a 180-day lockup period. High λ firms are defined as those firms with top 20% of λ calculated in the one month period after firms‟ lockup expiry.

80
Table 12
Regression for Length of Lockup -- high λ
Estimated Coefficient P-Value
Operating Retn 1-4 Year Growth Rate -2.052 0.042
Cash Flow 1-4 Year Growth Rate 0.370 0.269
Sales 1-4 Year Growth Rate -0.140 0.597
Opera Income 1-4 Year Growth Rate 1.110 0.095
Asset Turnover 1-4 Year Growth Rate 0.867 0.007
Size 0.584 0.465
Age -0.071 0.694
High-tech -0.415 0.064
Underwriter Ranking 0.325 0.489
Venture Capital Backing -0.432 0.285
Auditor Ranking -0.241 0.257
Adjusted R Square 61.3
Note: The OLS regression excludes firms with lockup length equal to 180 days and includes firms with top 20% λ.

81
Table13
Accounting Numbers and Lockup Length -- Low λ Firms
Panel A: Operating Return On Asset
GR <180 (1) N =180 (2) N >180 (3) N Comparison(p-value)
3&1 2&1 2&3
Yr 1 to 2 -0.09 38 -0.07 387 -0.06 78 NA NA NA
Yr 1 to 3 -0.09 35 -0.14** 360 -0.19** 68 NA NA NA
Yr 1 to 4 -0.25** 33 -0.15** 292 -0.20** 60 NA NA NA
Panel B: Operating Cash Flow On Asset
GR <180 (1) N =180 (2) N >180 (3) N Comparison(p-value)
3&1 2&1 2&3
Yr 1 to 2 0.17** 32 -0.17*** 336 -0.04 62 NA NA NA
Yr 1 to 3 -0.44** 29 -0.25*** 310 -0.23** 52 0.08 0.04 NA
Yr 1 to 4 -0.43*** 28 -0.27*** 250 -0.20** 45 NA 0.03 NA
Panel C: Sales
GR <180 (1) N =180 (2) N >180 (3) N Comparison(p-value)
3&1 2&1 2&3
Yr 1 to 2 0.26*** 45 0.28*** 477 0.37*** 134 NA NA NA
Yr 1 to 3 0.69*** 40 0.60*** 439 0.73*** 121 NA NA NA
Yr 1 to 4 0.66*** 33 0.94*** 355 1.05*** 99 0.05 0.02 NA
(table continues)

82
Table13 (continued).
Panel D: Operating Income
GR <180 (1) N =180 (2) N >180 (3) N Comparison(p-value)
3&1 2&1 2&3
Yr 1 to 2 0.21** 39 0.22** 387 0.22* 78 NA NA NA
Yr 1 to 3 0.49*** 35 0.49*** 360 0.31** 68 NA NA 0.06
Yr 1 to 4 0.62*** 29 0.67*** 292 0.71*** 60 NA NA NA
Panel E: Asset Turnover
GR <180 (1) N =180 (2) N >180 (3) N Comparison(p-value)
3&1 2&1 2&3
Yr 1 to 2 -0.02 45 0.02 477 0.12*** 134 0.01 NA NA
Yr 1 to 3 0.00 40 0.02 439 0.13** 121 0.01 NA NA
Yr 1 to 4 -0.03 37 0.05** 355 0.17*** 99 0.02 NA NA
Note: Operating Return on Asset is defined as operating income before depreciation and taxes divided by total assets, Operating Cash Flow on Asset equals operating income minus capital expenditures, divided by total assets, and Asset Turnover is defined as the ratio of sales to total assets. GR is the median growth rate of a post-IPO year relative to the IPO year. Industry-adjusted growth rates are used. *, **, and *** denote significant different from zero at 10%, 5%, and 1% level, respectively. Mann-Whitney test is used to compare the medians for two groups. When p-value is greater than 0.10, I use NA instead of the real p-value. The null hypothesis for the comparison of 3&1 is that the median for firms with short lockups is greater than or equal to that for firms with long lockups. The null hypothesis for the comparison of 2&1 is that the median for firms with short lockups is greater than or equal to that for firms with a 180-day lockup period. The null hypothesis for the comparison of 2&3 is that the median for firms with long lockups is greater than or equal to that for firms with a 180-day lockup period. High λ firms are defined as those firms with bottom 20% of λ calculated in the one month period after firms‟ lockup expiry.

83
Table 14
Regression for Length of Lockup (Low λ)
Estimated Coefficient P-Value
Operating Retn 1-3 Year Growth Rate -0.391 0.220
Cash Flow 1-3 Year Growth Rate 0.165 0.305
Sales 1-3 Year Growth Rate -0.030 0.856
Opera Income 1-3 Year Growth Rate 0.118 0.711
Asset Turnover 1-3 Year Growth Rate 0.248 0.036
Size -0.119 0.353
Age -0.174 0.086
High-tech -0.093 0.384
Underwriter Ranking -0.281 0.032
Venture Capital Backing -0.190 0.096
Auditor Ranking 0.058 0.581
Adjusted R Square 27.10
Note: The OLS regression excludes firms with a 180-day lockup period, and includes firms with bottom 20% of λ.
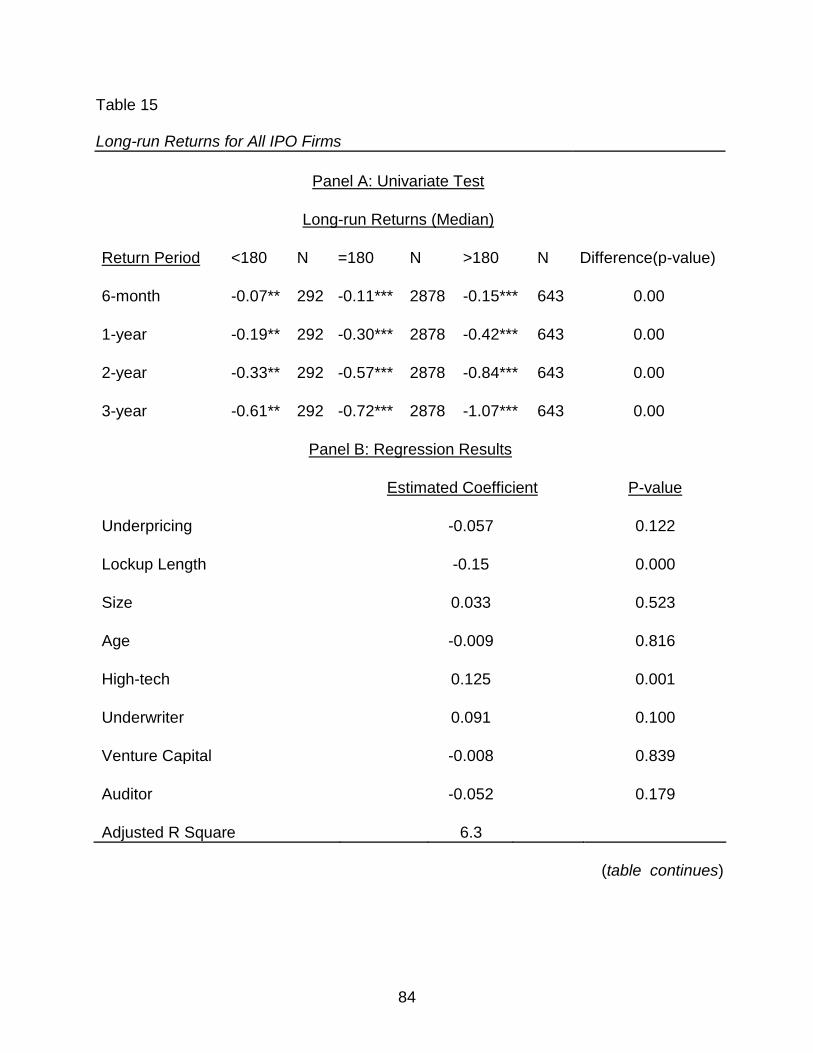
84
Table 15
Long-run Returns for All IPO Firms
Panel A: Univariate Test
Long-run Returns (Median)
Return Period <180 N =180 N >180 N Difference(p-value)
6-month -0.07** 292 -0.11*** 2878 -0.15*** 643 0.00
1-year -0.19** 292 -0.30*** 2878 -0.42*** 643 0.00
2-year -0.33** 292 -0.57*** 2878 -0.84*** 643 0.00
3-year -0.61** 292 -0.72*** 2878 -1.07*** 643 0.00
Panel B: Regression Results
Estimated Coefficient P-value
Underpricing
-0.057
0.122
Lockup Length
-0.15
0.000
Size
0.033
0.523
Age
-0.009
0.816
High-tech
0.125
0.001
Underwriter
0.091
0.100
Venture Capital
-0.008
0.839
Auditor
-0.052
0.179
Adjusted R Square 6.3
(table continues)

85
Table 15 (continued).
Note: Long-run returns are defined as the 6-month, 1-year, 2-year, and 3-year holding period return following a firm‟s IPO. All the returns are calculated starting at the 26th day after firms‟ IPO to avoid the effect of earlier aftermarket activities such as stabilization and quiet period (Brau et al. 2007). Value-weighted and equally-weighted (not shown) market-adjusted excess returns are calculated. Market adjusted return (MAR) is defined as the firm‟s buy and hold return (BAH) minus the market return from CRSP. Buy and
hold return is defined as the geometrically compounded return BAH = (1 +𝑀𝑡=𝑗 ri,t )-1,
where ri,t is the daily return for stock I on day t, j is the starting day and M is the ending
day for a calculating period. Market adjusted return is calculated as MAR = (1 +𝑀𝑡=𝑗 ri,t )
– (1 +𝑀𝑡=𝑗 rm,t ), where rm,t is the equally-weighted or value-weighted daily market return
from the CRSP. In the OLS regression, 3-year long-run return is the dependent variable, and all the independent variables are defined as before.

86
Table 16
Abnormal Return around Lockup Expiry
Panel A: All Data
Short-run Returns (Mean, %)
Return Period <180 N =180 N >180 N Difference(p-value)
Day (-3,3) -1.4*** 280 -1.85*** 2391 -1.91*** 578 0.12
Day (-4,4) -0.91** 280 -1.79*** 2391 -2.52*** 578 0.16
Panel B: Opaque and Transparent
Short-run Return (Mean, %)
Return Period Opaque N Transparent N Difference(P-value)
Day(-3,3) -1.64* 402 -2.23*** 925 0.058
Day(-4,4) -2.31 402 -2.1*** 925 0.16
Panel C: High-tech and Non-high-tech
Short-run Return (Mean, %)
Return Period High-tech N Non-high-tech N Difference(P-value)
Day(-3,3) -2.82*** 1104 -1.28*** 2503 0.00
Day(-4,4) -3.20*** 1104 -1.19*** 2503 0.00
Panel D: Top 20 Adverse Selection
Short-run Return (Mean, %)
Return Period <180 N >180 N Difference(P-value)
Day(-3,3) 3.62* 30 -0.27 53 0.058
Day(-4,4) 5.33** 30 -0.50 53 0.16
(table continues)

87
Table 16 (continued).
Note: The market model is specified as follows: Rit = αi + βi Rmt + εit, where Rit is the return for firm I on day t in estimation period; Rmt is the average return for all firms in the stock market on day t (CRSP value-weighted index is used as the market index); αi and βi are the intercept and the slope parameters for firm I; αi and βi will be estimated over T trading days in the estimation period, where T varies according to the length of lockup. For IPOs having a lockup period between 3 to 5 months, the estimation period will start at the first day of its IPO, and end 10 days before the event day (lockup expiry). If an IPO has a 6 month or longer lockup period, the estimation period will start 130 days before the event day and end 10 days before the event day. The average 7-day and 9-day abnormal returns (3 days and 4 days before and after the IPO lockup expiration day) are calculated.

88
Table 17
Percentage of Shares Locked
Percent of Shared Locked (%)
High Agency Low Agency Difference (P-value)
Mean 60.28 60.02 0.39
Median 67.25 64.88 0.21
<180 >180
Mean 50.45 52.29 0.19
Median 57.58 56.79 0.3
Note: Free cash flow, growth rate, expense ratio, asset utilization ratio, and the amount of debt at the time of a firm‟s IPO are used as proxies for agency cost to partition the sample into high and low agency firms. Percent of share locked is defined as number of shares locked in the lockup agreement divided by the number of shares outstanding after a firm‟s IPO.
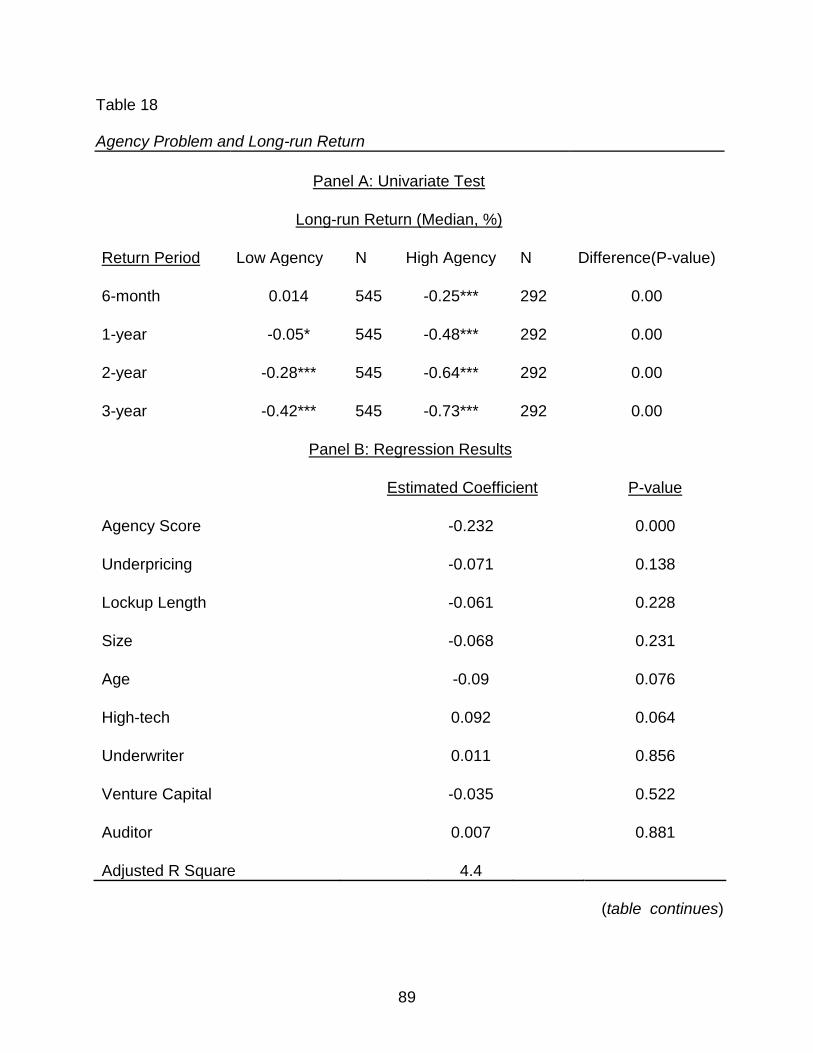
89
Table 18
Agency Problem and Long-run Return
Panel A: Univariate Test
Long-run Return (Median, %)
Return Period Low Agency N High Agency N Difference(P-value)
6-month 0.014 545 -0.25*** 292 0.00
1-year -0.05* 545 -0.48*** 292 0.00
2-year -0.28*** 545 -0.64*** 292 0.00
3-year -0.42*** 545 -0.73*** 292 0.00
Panel B: Regression Results
Estimated Coefficient P-value
Agency Score
-0.232
0.000
Underpricing
-0.071
0.138
Lockup Length
-0.061
0.228
Size
-0.068
0.231
Age
-0.09
0.076
High-tech
0.092
0.064
Underwriter
0.011
0.856
Venture Capital
-0.035
0.522
Auditor
0.007
0.881
Adjusted R Square 4.4
(table continues)

90
Table 18 (continued).
Note: The sample is partitioned into high and low agency groups by using the scoring scheme discussed. The dependent variable is the 1-year stock return. Six-month, 2-year, and 3-year returns give similar results. Higher agency score indicates a higher agency problem. Other variables are defined as before. OLS is used.

91
Table 19
Long-run Returns and Underwriter Reputation
Panel A: High and Low Reputation
Long-run Return (Median, %)
Return Period High N Low N Difference(P-value)
6-month 0.002 290 -0.24*** 292 0.00
1-year -0.11** 290 -0.55*** 292 0.00
2-year -0.27*** 290 -1.01*** 292 0.00
3-year -0.51*** 290 -1.23*** 292 0.00
Panel B: High Reputation
Long-run Return (Median, %)
Return Period <180 N >180 N Difference(P-value)
6-month 0.026 154 -0.019 135 0.48
1-year -0.054 154 -0.18*** 135 0.09
2-year -0.26*** 154 -0.28*** 135 0.31
3-year -0.52*** 154 -0.51*** 135 0.29
Panel C: Low Reputation
Long-run Return (Median, %)
Return Period <180 N >180 N Difference(P-value)
6-month -0.22 39 -0.24*** 306 0.11
1-year -0.33** 39 -0.55*** 306 0.06
2-year -0.65** 39 -1.05*** 306 0.00
3-year -0.86** 39 -1.26*** 306 0.00
(table continues)

92
Table 19 (continued).
Note: If an underwriter has a ranking of 8 or above, I define it as a high reputation underwriter. If an underwriter has a ranking of 4 or below, I define it as a low reputation underwriter.

93
Table 20
Venture Capital Backing and Long-run Returns
Panel A: With and without VC Backing
Long-run Return (Median, %)
Return Period VC N No VC N Difference(P-value)
6-month -0.10** 253 -0.13*** 687 0.05
1-year -0.32*** 253 -0.36*** 687 0.04
2-year -0.61*** 253 -0.74*** 687 0.03
3-year -0.87*** 253 -0.93*** 687 0.03
Panel B: VC Backing
Long-run Return (Median, %)
Return Period <180 N >180 N Difference(P-value)
6-month -0.01 129 -0.15*** 124 0.02
1-year -0.14** 129 -0.43*** 124 0.00
2-year -0.29*** 129 -0.84*** 124 0.00
3-year -0.60*** 129 -1.07*** 124 0.00
Panel C: No VC Backing
Long-run Return (Median, %)
Return Period <180 N >180 N Difference(P-value)
6-month -0.07** 165 -0.16*** 521 0.03
1-year -0.19*** 165 -0.42*** 521 0.00
2-year -0.34*** 165 -0.85*** 521 0.00
3-year -0.64*** 165 -1.06*** 521 0.00
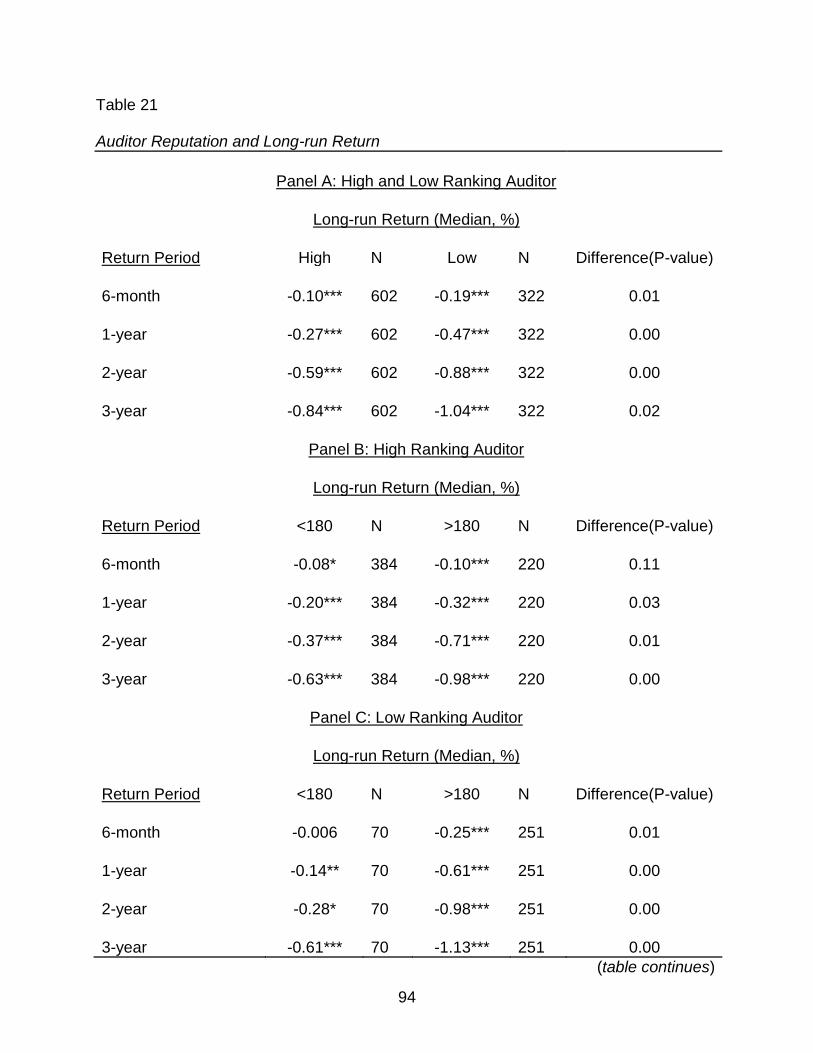
94
Table 21
Auditor Reputation and Long-run Return
Panel A: High and Low Ranking Auditor
Long-run Return (Median, %)
Return Period High N Low N Difference(P-value)
6-month -0.10*** 602 -0.19*** 322 0.01
1-year -0.27*** 602 -0.47*** 322 0.00
2-year -0.59*** 602 -0.88*** 322 0.00
3-year -0.84*** 602 -1.04*** 322 0.02
Panel B: High Ranking Auditor
Long-run Return (Median, %)
Return Period <180 N >180 N Difference(P-value)
6-month -0.08* 384 -0.10*** 220 0.11
1-year -0.20*** 384 -0.32*** 220 0.03
2-year -0.37*** 384 -0.71*** 220 0.01
3-year -0.63*** 384 -0.98*** 220 0.00
Panel C: Low Ranking Auditor
Long-run Return (Median, %)
Return Period <180 N >180 N Difference(P-value)
6-month -0.006 70 -0.25*** 251 0.01
1-year -0.14** 70 -0.61*** 251 0.00
2-year -0.28* 70 -0.98*** 251 0.00
3-year -0.61*** 70 -1.13*** 251 0.00
(table continues)

95
Table 21 (continued).
Note: The top six auditors are defined as reputable auditors, and the remaining auditors are defined as low ranking auditors.

96
Table 22
Short-run Return and Agency Problem
Panel A: Low and High Agency
Short-run Return (Mean, %)
Return Period Low Agency N High Agency N Difference(P-value)
Day(-3,3) -0.58 529 -3.34*** 281 0.00
Day(-4,4) -0.53 529 -3.13*** 281 0.00
Panel B: Regression Results
Estimated Coefficient P-value
Agency Score
0.24
0.666
Size
0.096
0.087
Insider Holding Before IPO
0.053
0.276
High-tech
-0.065
0.201
Underwriter
-0.045
0.433
Venture Capital
-0.147
0.009
Adjusted R Square 2.7
Note: Low and high agency firms are defined as before. OLS regression is used in panel B. Dependent variable is the short-run return around lockup expiry, and independent variables are some factors that may affect the short-run abnormal returns.

97
-2
-1
0
1
2
3
4
11
12
13
14
15
16
17
18
19
11
01
11
11
21
13
11
41
15
11
61
17
11
81
19
12
01
21
12
21
23
12
41
25
12
61
27
12
81
Re
turn
Number of Observations
1- year Return (<180)
-2
-1
0
1
2
3
4
5
6
1
21
41
61
81
10
1
12
1
14
1
16
1
18
1
20
1
22
1
24
1
26
1
28
1
30
1
32
1
34
1
36
1
38
1
40
1
42
1
44
1
46
1
48
1
50
1
52
1
54
1
56
1
58
1
60
1
62
1
64
1
Re
turn
Number of Observations
1-year Return ( >180)

98
Figure 1: Long-run Return for IPO Firms. The figure shows the long-run returns for firms with lockup lengths shorter than, equal to, and longer than 180 days. Horizontal axis is the number of observations, and the vertical axis is the median 1-year returns.
-2
-1
0
1
2
3
4
5
61
88
17
5
26
2
34
9
43
6
52
3
61
06
97
78
4
87
1
95
81
04
5
11
32
12
19
13
06
13
93
14
80
15
67
16
54
17
41
18
28
19
15
20
02
20
89
21
76
22
63
23
50
24
37
25
24
26
11
26
98
27
85
Re
turn
Number of Observations
1-year Return (=180)

99
CHAPTER 6
CONCLUSION AND DISCUSSION
This dissertation investigates the reasons for the divergence of initial public
offering (IPO) lockup agreements. Previous studies exploring this topic chose
inappropriate proxies for firm quality, information asymmetry, and agency problems.
They also ignored long-term stock returns after firms‟ IPO, and short-term stock returns
after firms‟ lockup expiry. These return behaviors may give us some insight about the
reasons for the existence of IPO lockup agreements. In this dissertation, I try to fill in
some of the gaps in existing literature.
I use the growth rate of IPO firms‟ operating performance as a proxy for firm
quality to examine whether there is a relationship between lockup length and firm quality.
I also study this relationship for firms with different levels of information asymmetry. I
partition the sample into firms with high and low information asymmetry by using two
new proxies for information asymmetry – high-tech firms and high-adverse selection
firms.
I find that, among the five accounting variables used, only asset turnover shows a
positive relationship with lockup length for some time periods. This is true for both the
whole sample and for sub-samples containing only firms with high information
asymmetry. Since there are not consistently strong positive relationships between
operating performance and lockup length, I conclude that there is only weak evidence to
support the notion that lockup length is used to signal firms‟ quality. In other words,
there is weak evidence that high-quality firms use a longer lockup length to differentiate
their quality from low-quality firms. On the other hand, I do not find a significant negative
relationship between operating performance and lockup length. Thus, based on

100
operating performance, there is no evidence to support the notion that lockup length is
used to differentiate firms with low agency problems from firms with high agency
problems.
There are two possible reasons why I do not find a strong relationship between
lockup length and firm quality. First, even though the growth rate of operating
performance has been used as a proxy for firm quality in the literature, it may not be a
good one. Further, choosing different accounting variables may give different results.
Second, for some of the tests, the number of observations is too small to get a
significant result due to missing data or negative accounting values in the base year.
Future research should focus on searching for better proxies for firm quality and test
their relationship with lockup length.
I then examine the long-run stock returns for IPO firms. For the whole sample, I
find that IPOs with short lockups experience a much better long-run return than that for
IPOs with long lockups. For instance, the median 2-year stock return for firms with short
lockups is -33%, while it is -84% for firms with long lockups. The difference is significant
at the 1% level. This result rejects the signaling hypothesis, which predicts no difference
between the long-run returns of the two groups, and is consistent with the agency
hypothesis. According to the agency hypothesis, as insiders of high agency firms
continuously cause agency problems after lockup expiry, firms‟ operating performance
will deteriorate. As a result, more investors will sell the firms‟ shares. Thus, this high
agency cost will lead to poor long-run returns for firms with long lockup periods.
Further, I find that among firms with low-reputation underwriters, the long-run
returns of short lockups are consistently higher than long-run returns for long lockups.
Among firms with high-reputation underwriters, on the other hand, I find no difference

101
between long-run returns for short and long lockups. This finding is consistent with the
agency explanation and suggests strongly that underwriter reputation and lockup length
are substitute methods for controlling the agency problem.
When I examine long-run returns for firms that have venture capital backing and
for firms that use a top six auditor, I find no relationship between lockup length and long-
run returns. Unlike underwriter reputation, venture capital backing and auditor quality do
not appear to be substitutes for lockup length in controlling agency problems.
I further contribute to the IPO long-run return literature by finding that firms with
high agency problems experience much worse long-run returns than firms with low
agency problems. The sample is partitioned into high and low agency firms by using five
agency variables from the literature: free cash flow, growth rate, expense ratio, asset
utilization ratio, and the amount of debt. The results show that firms with low agency
problems have a median 3-year stock return of -42%, which is significantly higher than
the -73% for firms with high agency problems.
Finally, I investigate the short-run returns for IPO firms around their lockup
expiration day. For the whole sample, I find that firms with long lockups and short
lockups do have significant negative abnormal returns, even though they are not
significantly different from each other. Thus, I reject the signaling hypothesis which
predicts that there should be no abnormal returns. However, the results do not fully
support the agency hypothesis either. The agency hypothesis predicts that short-run
returns for short lockups should be better than those for long lockups. Consistent with
the literature, I find that high-tech firms experience a much worse short-run abnormal
return than non-high-tech firms, and venture capital backed firms experience a much
worse short-run abnormal return than non-venture-backed firms. I, like previous
102
researchers, am unable to provide an explanation for these unusual returns. In sum, the
evidence from the short-run returns around the lockup expiration date rejects the
signaling hypothesis while partially supporting the agency hypothesis (negative short-
run returns at lockup expiry). The possible reason for not finding a full support for the
agency hypothesis is that there may be other unknowns, and therefore factors not
controlled for that also affect the short-term stock behavior. Future research can be
focused on the possible reasons for the lack of significant difference in short-run returns
for short and long lockups at lockup expiry.
My examination of short-run returns at lockup expiry also shows that firms with
high agency problems experience a much worse short-run return than firms with low
agency problems. For instance, the average 7-day abnormal return around lockup
expiry for firms with low agency problems is -0.58%, which is insignificant different from
zero. This is significantly better than the -3.34% for firms with high agency problems.
However, in the regression analysis, the agency variable is not significant while venture
capital is significantly negatively related to short-run returns.
Interestingly, I do not find a significant relationship between the percentage of
shares locked and lockup length. But I do find that firms with a 180-day lockup period
have bigger size, which is proxied by the proceeds from the IPO. In other words, firms
with a 180-day lockup period raise more money in their IPOs than firms with a lockup
period shorter or longer than 180 days. The average proceeds for firms with a 180-day
lockup period is $68 million, compared to $30 million for long lockups and $45 million for
short lockups.

103
REFERENCES
Aggarwal, R., Krigman, L., & Womack, K. (2002). Strategic IPO underpricing, information momentum, and lockup expiration selling. Journal of Financial Economics, 66, 105-137.
Allen, F., & Faulhaber, G. (1989). Signaling by underpricing in the IPO market. Journal
of Financial Economics, 23, 303-323. Ang, J., Cole, R., & Lin, J. (2000, Feb). Agency costs and ownership structure. Journal
of Finance, 81-105. Baron, D. (1982). A model of the emand for investment banking advising and
distribution services for new issues. Journal of Finance, 37, 955-976. Beatty, R., & Ritter, J. (1986). Investment banking, reputation, and the underpricing of
initial public offerings. Journal of Financial Economics, 15, 213-232. Booth, J., & Chua, L. (1996). Ownership dispersion, costly information, and IPO
underpricing. Journal of Financial Economics, 41, 291-310. Bradley, D., Jordan, B., Roten, I., & Yi, H. (2001). Venture capital and IPO lockup
expiration: An empirical analysis. Journal of Financial Research, 24, 465-493. Brau, J., Carter, D., Christophe, S., & Key, K. (2004). Market reaction to the expiration
of IPO lockup provisions. Managerial Finance, 30, 75-91. Brau, J., Lambson, V., & McQueen, G. (2005). Lockups revisited. Journal of Financial
and Quantitative Analysis, 40, 519-530. Brau, J., Li, M., & Shi, J. (2007). Do secondary shares in the IPO process have a
negative effect on aftermarket performance? Journal of Banking & Finance, 31, 2612-2631.
Brav, A., Geczy, C., & Gompers, P. (2000). Is the abnormal return following equity
issuances anomalous? Journal of Financial Economics, 56, 209-249. Brav, A., & Gompers, P. (2003). The role of lockups in initial public offerings. Review of
Financial Studies, 16, 1-29. Brav, A., & Gompers, P. (1997). Myth or reality? The long-run underperformance of
initial public offerings: Evidence from venture and non-venture capital-backed companies. Journal of Finance, 5, 1791-1821.
Cao, C., Field, L., & Hanka, G. (2004). Does insider trading impair market liqudity?
Evidence from IPO lockup expirations. Journal of Financial and Quantitative Analysis, 39, 25-46.

104
Carter, R., Dark, F., & Singh, A. (1998). Underwriter reputation, initial returns, and the long-run performance of IPO stocks. Journal of Finance, 1, 285-311.
Carter, R., & Manaster, S. (1990). Initial public offerings and underwriter reputation.
Journal of Finance, 45, 1045-1067. Chazi, A., & Tripathy, N. (2007). Which version of equity market timing affects capital
structure? Journal of Applied Finance, 17, 1, 70-81. Chemmanur, T. (1993). The pricing of initial public offerings: A dynamic model with
information production. Journal of Finance, 1, 285-304. Chemmanur, T., & Paeglis, I. (2005). Management quality, certification, and initial public
offerings. Journal of Financial Economics, 76, 331-368. Courteau, L. (1995). Under-diversification and retention commitments in IPOs. Journal
of Financial and Quantitative Analysis, 30, 487-517. Ertimur, Y., Sletten, E., & Sunder, J. (2008). Voluntary disclosure strategy around IPO
lockup expirations. Unpublished Manuscript. Department of Finance, Northwestern University, Evanston, Illinois.
Field, L., & Hanka, G. (2001). The expiration of IPO share lockups. Journal of Finance,
56, 471-500. Field, L., & Lowry, M. (2007). Institutional versus individual investment in IPOs: The
importance of firm fundamentals. Unpublished Manuscript. Department of Finance, Penn State University, University Park, Pennsylvania.
Gale, I., & Stiglitz, J.E. (1989). The informational content of initial public offerings.
Journal of Finance, 44, 469-477. Gao, Y. (2005). Trading and the information environment of IPO stocks around lockup
expiration: Evidence from intraday data. Unpublished Manuscript. Department of Finance, Cornell University, Ithaca, New York.
Grinblatt, M., & Hwang, C. (1989). Signaling and the pricing of new issues. Journal of
Finance, 44, 393-420. Hahn, T., & Ligon, J. (2004). Liquidity and initial public offering underpricing.
Unpublished Manuscript. Department of Finance, Auburn University at Montgomery, Montgomery, Alabama.
Harris, O., & Glegg, C. (2009). Government quality and privately negotiated stock
repurchase: Evidence of agency conflict. Journal of Banking and Finance, 33, 317-325.

105
Houge, T., Loughran, T., Suchanek, G., & Yan, X. (2001). Divergence of opinion, uncertainty, and the quality of initial public offerings. Financial Management, 4, 5-23.
Huang, R., & Stoll, H. (1994). Market microstructure and stock predictions. Review of
Financial Studies, 7, 179-213. Ibbotson, R. (1975). Price performance of common stock new issues. Journal of
Financial Economics, 3, 235-272. Jain, B., & Kini, O. (1994, Dec). The post-issue operating performance of IPO firms.
Journal of Finance, 1699-1726. Jensen, M. (1986). Agency costs of free cash flow, corporate finance, and takeovers.
American Economic Review, 37, 525-550. Jensen, M., & Meckling, W. (1976). Theory of the firm: Managerial behavior, agency
costs and ownership structure. Journal of Financial Economics, 3, 305-360. Krigman, L., Shaw, W., & Womack, K. (2001). Why do firms switch underwriters?
Journal of Financial Economics, 60, 245-284. Lehn, K., & Poulsen, A. (1989). Free cash flow and stock holder gains in going private
transactions. Journal of Finance, 44, 774-789. Leland, H., & Pyle, D. (1977). Informational asymmetries, financial structure, and
financial intermediation. Journal of Finance, 32, 371-387. Lin, J., Sanger, G., & Booth, G. (1995). Trade size and components of bid-ask spread.
Review of Financial Studies, 8, 1153-1183. McKnight, P., & Weir, C. (2008). Agency cost, corporate governance mechanisms and
ownership structure in large UK publicly quoted companies: A panel data analysis. Quarterly Review of Economics and Finance, 49, 2, 139-158.
Megginson, W., & Weiss, K. (1991). Venture capitalist certification in initial public offers.
Journal of Finance, 46, 879-903. Michaely, R., & Shaw, W. (1995). Does the choice of auditor convey quality in and initial
public offering? Financial Management, 24, 15-30. Michaely, R., & Shaw, W. (1995). The pricing of initial public offerings: Tests of adverse
selection and signaling theories. Review of Financial Studies, 7, 279-319. Miller, E. (1977). Risk, uncertainty, and divergence of opinion. Journal of Finance, 4,
1151-1168.

106
Muscarella, C., & Vetsuypens, M. (1989). The underpricing of „second‟ initial public offerings. Journal of Financial Research, 12, 183-192.
Ness, B., Ness, R., & Warr, R. (2001, Aug). How well do adverse selection components
measure adverse selection? Financial Management, 5-30. Ofek, E., & Richardson, M. (2000). The IPO lock-up period: Implications for market
efficiency and downward sloping demand curves. Unpublished Manuscript. Department of Finance, New York University, New York City, New Jersey.
Reese, W. (1998). IPO underpricing, trading volume and investor interest. Unpublished
Manuscript. Department of Finance, Tulane University, New Orleans, Louisiana. Ritter, J. (1984). The hot issue market of 1980. Journal of Business, 32, 215-240. Ritter, J., & Welch, I. (2002). A review of IPO activity, pricing, and allocations. Journal of
Finance, 4, 1795-1828. Ritter, J. (1991). The long-run performance of initial public offerings, Journal of Finance,
1, 3-27. Rock, K. (1986). Why new issues are underpriced. Journal of Financial Economics, 15,
187-212. Singh, M., & Davidson, W. (2003). Agency costs, ownership structure and corporate
governance mechanisms. Journal of Banking and Finance, 27, 793-816. Schultz, P. (2003). Pseudo market timing and the long-run underperformance of IPOs.
Journal of Finance, 2, 483-517. Teoh, S., Welch, I., & Wong, T.J. (1998). Earnings management and the long-run
market performance of initial public offerings. Journal of Finance, 6, 1935-1974. Tinic, S. (1988). Anatomy of initial public offerings of common stock. Journal of Finance,
43, 789-822. Venkatesh, P., & Chiang, R. (1986). Information asymmetry and the dealer‟s bid-ask
spread: A case study of earnings and dividend announcements. Journal of Finance, 41, 1089-1102.
Welch, I. (1989). Seasoned offerings, imitation costs and the underpricing of initial
public offerings. Journal of Finance, 44, 421-449. Yung, C., & Zender, J. (2008). Moral hazard, asymmetric information and IPO lockups.
Unpublished Manuscript. Department of Finance, University of Colorado at Boulder, Boulder, Colorado.

107
Zheng, S., & Stangeland, D. (2007). IPO underpricing, firm quality, and analyst forecasts. Financial Management, 36, 45-64.
Zheng, S., & Li, M. (2008). Underpricng, ownership dispersion, and aftermarket liquidity
of IPO stocks. Journal of Empirical Finance, 15, 436-454. Zheng, X. (2007). Market underreaction to free cash flows from IPOs. The Financial
Review, 42, 75-97.


![(52,911)...Allison 4th Generation Electronic Controls wittr closed loop adaptive shifu Shift Sequences [C = Converter mode (lockup clutch disengaged); L = [o*up (lockup clutch engaged)]](https://img.pdfslide.net/doc/110x75/611640d480377e06ac19f53b/52911-allison-4th-generation-electronic-controls-wittr-closed-loop-adaptive.jpg)