Embed Size (px)
Citation preview

The reform of the EU's Common Agricultural Policy:
drivers and challenges
ABARES – Outlook 2014 Canberra, 4-5 March 2014
Tassos Haniotis
Director, Economic Analysis, perspectives and evaluations
DG Agriculture and Rural Development
European Commission

Outline
Four basic questions of (any) reform
1. How much?
2. For whom?
3. Why?
4. How?
2

3
How much: the path of CAP expenditure 1980-2020
Source: DG Agriculture and Rural Development.
0
10
20
30
40
50
60
70
1980
1981
1982
1983
1984
1985
1986
1987
1988
1989
1990
1991
1992
1993
1994
1995
1996
1997
1998
1999
2000
2001
2002
2003
2004
2005
2006
2007
2008
2009
2010
2011
2012
2013
2014
2015
2016
2017
2018
2019
2020
billion EUR (current prices)
Export refunds Other market measures Market expenditure Coupled support
Decoupled support Direct payments Rural development
EU-28 EU-10 EU-12 EU-15 EU-25 EU-27
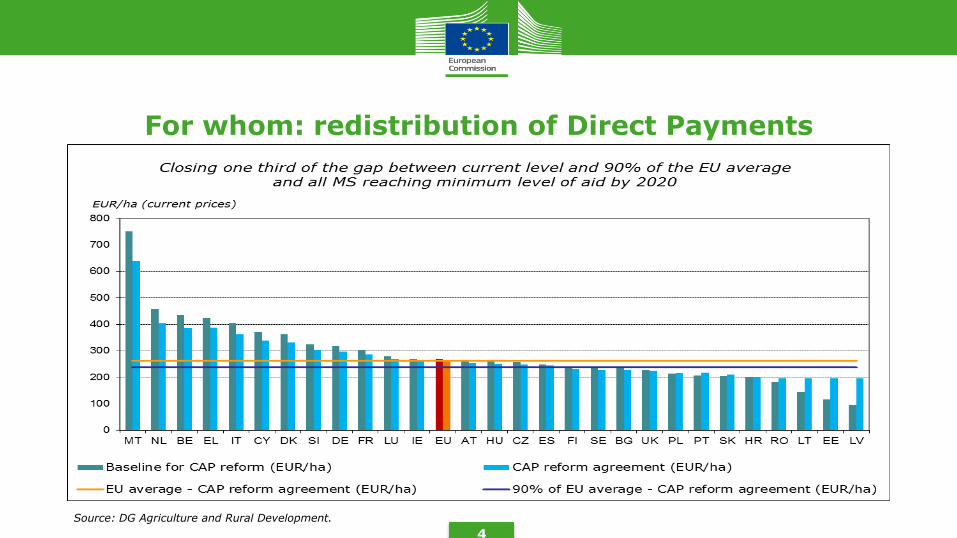
For whom: redistribution of Direct Payments
4
Source: DG Agriculture and Rural Development.
5
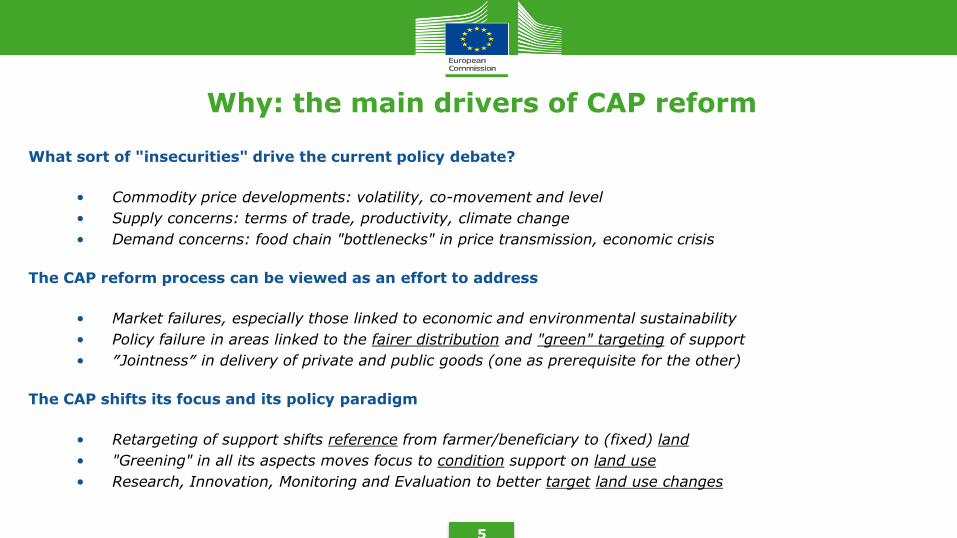
Why: the main drivers of CAP reform
What sort of "insecurities" drive the current policy debate?
• Commodity price developments: volatility, co-movement and level
• Supply concerns: terms of trade, productivity, climate change
• Demand concerns: food chain "bottlenecks" in price transmission, economic crisis
The CAP reform process can be viewed as an effort to address
• Market failures, especially those linked to economic and environmental sustainability
• Policy failure in areas linked to the fairer distribution and "green" targeting of support
• ″Jointness″ in delivery of private and public goods (one as prerequisite for the other)
The CAP shifts its focus and its policy paradigm
• Retargeting of support shifts reference from farmer/beneficiary to (fixed) land
• "Greening" in all its aspects moves focus to condition support on land use
• Research, Innovation, Monitoring and Evaluation to better target land use changes

The objectives of CAP reform
6
Challenges
Environmental
Economic
Territorial
Policy objectives
Sustainable management of natural resources and climate
action
Balanced territorial development
Viable food production
Reform objectives
Improved sustainability
Enhanced competitiveness
Greater effectiveness
Fairer
Greener
Simpler

7
Annual real commodity price indexes
Source: World Bank
0
50
100
150
200
250
300
1948
1950
1952
1954
1956
1958
1960
1962
1964
1966
1968
1970
1972
1974
1976
1978
1980
1982
1984
1986
1988
1990
1992
1994
1996
1998
2000
2002
2004
2006
2008
2010
2012
(2005 = 100)
Agriculture Fertilizers Energy Metals & minerals

US energy prices…
Source: World Bank.
8
0
5
10
15
20
25
Jan-00 Jan-02 Jan-04 Jan-06 Jan-08 Jan-10 Jan-12
Crude oil (World Bank average)
Natural gas (US)
Coal (Australia)
( $ per mmbtu )

…and their link to world natural gas prices
Source: World Bank.
9
0
5
10
15
20
Jan-00 Jan-02 Jan-04 Jan-06 Jan-08 Jan-10 Jan-12
US
Europe
Japan (LNG)
( $ per mmbtu )

Climate change – Possible impacts on EU agriculture
10
▲ Floods risk ▲ Hotter and drier summers ▲ Sea levels ▲ Risk crop pests, diseases ▲ Crop, forage yields ▼ Animal health, welfare
▼ Water availability ▲ Risk drought, heat spells ▲ Risk soil erosion ▼ Growing season, crop yields ▼ Optimal crop areas
▼ Summer rainfall ▲ Winter storms, floods ▲ Length growing season,
yields ▲ Suitable farmland ▲ Pests, diseases risks
▲ Winter rainfall, floods ▼ Summer rainfall ▲ Risk drought, water stress ▲ Soil erosion risk ▲ Yields, range of crops
Source: DG Agriculture and Rural Development, based on EEA reports, JRC and MS academic studies.

Importance of primary sector in employment
11
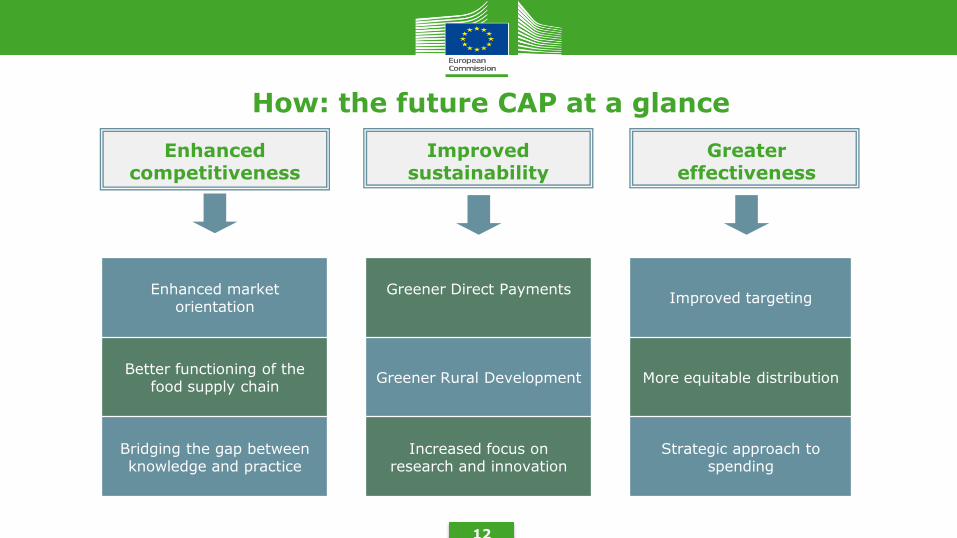
How: the future CAP at a glance
12
Improved sustainability
Enhanced competitiveness
Greater effectiveness
Enhanced market orientation
Greener Direct Payments
Improved targeting
Better functioning of the food supply chain
Greener Rural Development More equitable distribution
Bridging the gap between knowledge and practice
Increased focus on research and innovation
Strategic approach to spending

How: enhanced competitiveness
13
Better functioning of the food supply chain
Enhanced market orientation
Bridging the gap between
knowledge and practice
Phasing out of quotas and other restrictions to production Streamlining market measures; enhancing the safety net Strengthening the crisis management mechanism
Reinforced framework for POs and IBOs Financial support for creation of Producer Organisations Strengthened support to short supply chains
European Partnership for Innovation in Agriculture Enhance agricultural research and knowledge transfer Enhance Farm Advisory Services

EU-28 agricultural trade structure, 2003-13
14
150000
100000
50000
0
50000
100000
150000
2003 2004 2005 2006 2007 2008 2009 2010 2011 2012 2013
Commodities Intermediate Final products Other products Confidential Trade Balance
Source: COMEXT
Exports
in million Euro
Imports

15
EU competitiveness - Wheat
Source: elaboration by DG Agriculture and Rural Development
50
100
150
200
250
300
350
03/0
7/0
1
03/1
1/0
1
03/0
3/0
2
03/0
7/0
2
03/1
1/0
2
03/0
3/0
3
03/0
7/0
3
03/1
1/0
3
03/0
3/0
4
03/0
7/0
4
03/1
1/0
4
03/0
3/0
5
03/0
7/0
5
03/1
1/0
5
03/0
3/0
6
03/0
7/0
6
03/1
1/0
6
03/0
3/0
7
03/0
7/0
7
03/1
1/0
7
03/0
3/0
8
03/0
7/0
8
03/1
1/0
8
03/0
3/0
9
03/0
7/0
9
03/1
1/0
9
03/0
3/1
0
03/0
7/1
0
03/1
1/1
0
03/0
3/1
1
03/0
7/1
1
03/1
1/1
1
03/0
3/1
2
03/0
7/1
2
03/1
1/1
2
03/0
3/1
3
03/0
7/1
3
03/1
1/1
3
€/T
EU cereal support price EU Wheat Rouen US SRW Wheat
101.31

16
EU competitiveness - Beef
Source: elaboration by DG Agriculture and Rural Development
100
150
200
250
300
350
400
450
03/0
1/0
0
03/0
6/0
0
03/1
1/0
0
03/0
4/0
1
03/0
9/0
1
03/0
2/0
2
03/0
7/0
2
03/1
2/0
2
03/0
5/0
3
03/1
0/0
3
03/0
3/0
4
03/0
8/0
4
03/0
1/0
5
03/0
6/0
5
03/1
1/0
5
03/0
4/0
6
03/0
9/0
6
03/0
2/0
7
03/0
7/0
7
03/1
2/0
7
03/0
5/0
8
03/1
0/0
8
03/0
3/0
9
03/0
8/0
9
03/0
1/1
0
03/0
6/1
0
03/1
1/1
0
03/0
4/1
1
03/0
9/1
1
03/0
2/1
2
03/0
7/1
2
03/1
2/1
2
03/0
5/1
3
03/1
0/1
3
€/100kg carcass
EU Intervention Price US Omaha EU Beef A/C R3 Brazil Arroba do boi
347
324
301
156

17
EU competitiveness - Milk
Source: elaboration by DG Agriculture and Rural Development
100
150
200
250
300
350
400
450
15/0
1/0
0
15/0
6/0
0
15/1
1/0
0
15/0
4/0
1
15/0
9/0
1
15/0
2/0
2
15/0
7/0
2
15/1
2/0
2
15/0
5/0
3
15/1
0/0
3
15/0
3/0
4
15/0
8/0
4
15/0
1/0
5
15/0
6/0
5
15/1
1/0
5
15/0
4/0
6
15/0
9/0
6
15/0
2/0
7
15/0
7/0
7
15/1
2/0
7
15/0
5/0
8
15/1
0/0
8
15/0
3/0
9
15/0
8/0
9
15/0
1/1
0
15/0
6/1
0
15/1
1/1
0
15/0
4/1
1
15/0
9/1
1
15/0
2/1
2
15/0
7/1
2
15/1
2/1
2
15/0
5/1
3
€/T
EU Milk Equivalent Support Price World Milk Equivalent Price EU Milk Price
282 263
244 225
220 215
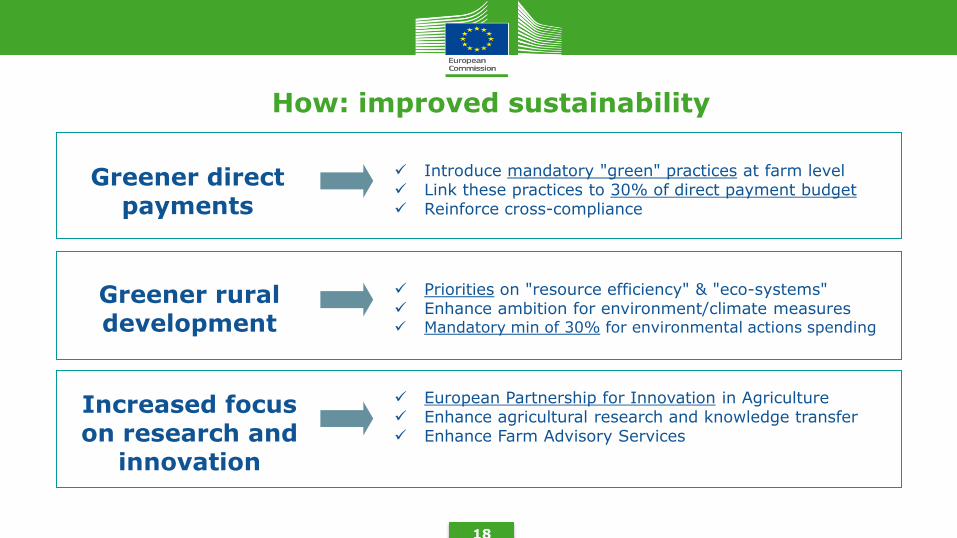
How: improved sustainability
18
Greener rural development
Greener direct payments
Increased focus on research and
innovation
Introduce mandatory "green" practices at farm level Link these practices to 30% of direct payment budget Reinforce cross-compliance
Priorities on "resource efficiency" & "eco-systems" Enhance ambition for environment/climate measures Mandatory min of 30% for environmental actions spending
European Partnership for Innovation in Agriculture Enhance agricultural research and knowledge transfer Enhance Farm Advisory Services

How: greater effectiveness
19
More equitable distribution
Improved targeting
Strategic approach to
spending
Provisions for active farmer and young farmers Green payment Specific support to regions, sectors and farm size
Convergence of payments among MS Convergence of payments among farmers Flexibility in choice of regionalisation for MS
Improved integration with other EU policies Strategic approach in rural development programming Improved monitoring and evaluation of policy

20
The new greening architecture of the CAP
Agricultural area (eligible for direct payments)
Cross compliance
Greening
Rural development
Cu
mu
lati
ve
en
vir
on
men
tal
ben
efi
ts
Regulatory (Statutory
Management Requirements and Good Agricultural
Environmental Conditions)
Mandatory with financial
support (decoupled “green”
payment per hectare)
Voluntary with compensation for cost incurred
and income forgone
Implementation mechanism

For further information
Political agreement on the CAP2020
http://ec.europa.eu/agriculture/cap-post-2013/agreement/index_en.htm
Legal proposals
http://ec.europa.eu/agriculture/cap-post-2013/legal-proposals/index_en.htm
Impact assessment
http://ec.europa.eu/agriculture/policy-perspectives/impact-assessment/cap-towards-2020/index_en.htm
21
Thank you