Embed Size (px)
Citation preview

Bulletin of Indonesian Economic Studies, Vol. 48, No. 3, 2012: 367–95
ISSN 0007-4918 print/ISSN 1472-7234 online/12/030367-29 © 2012 Indonesia Project ANUhttp://dx.doi.org/10.1080/00074918.2012.728644
THE REGIONAL EFFECTS OF INDONESIA’S OIL AND GAS POLICY:
OPTIONS FOR REFORM
Cut Dian R.D. Agustina* Wolfgang Fengler*World Bank World Bank
Günther G. Schulze*University of Freiburg
This paper analyses the effects on the regions of Indonesia’s fuel policy. It discusses how the sharing of oil and gas revenue and taxes between the centre and the regions affects the sub-national fiscal position, and examines the distribution of fuel sub-sidies across regions. The paper also examines the recent proposals to discontinue subsidising gasoline for private vehicles or to eliminate fuel subsidies altogether, and shows how the regions would be affected if these suggestions were adopted. We argue that the proposals would increase efficiency and equity and should there-fore be implemented.
Keywords: Oil policy, fuel subsidies, regional transfers, regional distribution of inter-governmental fiscal transfers
INTRODUCTIONIndonesia is richly endowed with natural resources, especially oil and gas. The income from oil and gas is an important component of the government budget; about one-fifth of consolidated revenue is derived from oil and gas production through taxes, revenue-sharing contracts and the profits of the state-owned oil company, Pertamina. Indonesia currently has 33 provinces and 491 districts, with very diverse socio-economic and ethnic profiles. The regions have authority over about a third of consolidated revenue, making Indonesia one of the most decen-tralised resource-rich countries in the world.
The decentralisation framework raises the question of how Indonesia’s oil and gas policy affects the regions. On the revenue side, the income from oil and
* [email protected]; [email protected]; [email protected]. We are grateful to Sukmawah Yuningsih and Dhanie Nugroho for excellent research assistance, to Hal Hill as the editor in charge, and to Blane Lewis, Judith Müller, Bambang Sjahrir Putra, Ahya Ihsan and two anonymous referees for helpful comments. We also benefited greatly from input received from Tim Bulman. Beth Thomson provided diligent copy editing. The usual disclaimer applies. The views expressed are those of the authors and do not necessarily coincide with those of the organisations with which they are affiliated. The German Ministry of Education and Research supported this research under grant number 01UC0906.

368 Cut Dian R.D. Agustina, Wolfgang Fengler and Günther G. Schulze
gas is shared by the centre and the regions through agreements that allow the resource-rich regions to retain a substantial share of the income generated by their resources. Papua and Aceh, which enjoy special autonomy status, are allowed even larger shares of their oil and gas revenues. The regions also receive block grants from the central government, a portion of which is derived from oil and gas production. These grants account for 26% of net domestic revenue after the deduction of shared revenue funds and major subsidies, including the fuel sub-sidy. The block grants are allocated according to a formula that takes into account the gap between a region’s fiscal capacity and its fiscal need, as well as its wage bill for civil service salaries. As a consequence, the income from oil and gas is dis-tributed very unequally among the regions.
On the expenditure side, oil and gas-related expenses take the form of fuel subsidies on vehicle gasoline, diesel, kerosene and liquefied petroleum gas (LPG). These subsidies tie up a substantial part of government resources. In 2010, for example, they accounted for more than 12% of consolidated national expenditures – comparable to overall capital expenditures at 15.5%. Because the ability to make use of subsidies is linked to consumption, which in turn is linked to income, some regions benefit far more than others from fuel subsidies. The main beneficiaries are the wealthier regions, especially those with high levels of urbanisation. The revenue-sharing scheme, meanwhile, favours the resource-rich regions, while the method of allocating block grants benefits poorer regions with large fiscal gaps. The overall effect of these various arrangements on the regions is a priori unclear and thus an empirical issue. This becomes the first concern of the paper, that is, to determine the regional distribution of the existing oil and gas-related arrange-ments, for revenue, for expenditure, and for revenue and expenditure combined.
Obviously, the income the government receives from oil and gas, as well as the amount it has to pay out in subsidies, varies with the world oil price. In the mid-2000s, the national budget came under pressure from a rising oil price: while the increases in subsidies were borne entirely by the centre, the increases in revenue had to be shared with the regions, leaving the centre at a financial disadvantage. To address this problem, in 2009 the government decided to deduct all subsidies from the national budget before applying the block grant formula. This effectively made the regions share the cost of the subsidies.
While this measure reduced the burden on the central government, it did not solve the equity and efficiency problems implied by the subsidisation of fuel. The subsidies predominantly benefit the wealthier sections of the population. They compromise incentives to save energy and to develop alternative energy sources, and rather than internalising the externality created by carbon dioxide emissions, they encourage emissions. The government is currently considering a proposal to reduce the level of subsidies by removing fuel for private vehicles from the scheme, as well as a more far-reaching proposal to eliminate fuel subsidies alto-gether.1 Both proposals would have implications for the regions and are the sec-ond concern of this paper. We analyse the effects of the oil and gas policy under different scenarios, both for fuel subsidies and for oil and gas-related transfers, and show which regions would profit from the suggested reforms.
1 These proposals are mentioned in Law 25/2000 on the National Development Plan for 2000–2004; Ministry of Energy and Mineral Resources Regulation 31/2005 on Technical Procedures for Energy Saving; and Law 10/2010 on the 2011 State Budget.

The regional effects of Indonesia’s oil and gas policy: options for reform 369
The remainder of the paper is organised as follows. First, it discusses how the government derives income from oil and gas and how this revenue is shared between the various tiers of government. Next, it explains the fuel subsidy mech-anism and looks at how the subsidy is distributed across households and regions. It then examines the combined regional impact of oil and gas revenue transfers and fuel subsidies. The paper discusses the changes that would take place in the regional distribution of oil and gas revenue and subsidies if the government’s proposals were implemented, before presenting some conclusions.
THE REGIONAL DISTRIBUTION OF OIL AND GAS REVENUE
Government income from oil and gasThe main sources of government revenue from oil and gas are taxes on produc-tion and the income from revenue-sharing contracts with private investors. The most common type of joint cooperation contract used in the upstream sector is the production-sharing contract (PSC). Under this type of contract, the govern-ment and the private investor agree to split the oil or gas revenue in specified proportions (PwC Indonesia 2012: 42). Other types of contract are the enhanced oil recovery (EOR) contract; the technical assistance contract (TAC); the joint opera-tion agreement (JOA); and the joint operation body (JOB). An EOR is an agree-ment between Pertamina and a private contractor to use advanced technology to increase the recovery of hydrocarbons from an existing reservoir. A TAC is a type of PSC that is usually limited to exploitation activities. JOAs and JOBs are separate agreements – in addition to PSCs, EORs and TACs – regulating the management and conduct of operations (US Embassy 2008: 11).
In 2006, PSCs accounted for 87% of Indonesia’s oil and gas production, other types of contract for 4%, and Pertamina as the sole contractor for the remaining 9% (US Embassy 2008). Under a typical PSC arrangement for oil, the government receives around 85% of the revenue generated by a project (after cost recovery and taxes), either directly under the terms of the contract or through taxation, with the remainder accruing to the private contractor (appendix 1). For gas, the split is typically 70% for the government and 30% for the private contractor.
In the 2010 government budget, oil and gas revenue accounted for about one-fifth of total revenue: 5% from income taxation, 14% from non-tax sources and 0.9% from Pertamina (table 1). This represented a decline of 31% from 2008, when taxes made up 6% of all oil and gas revenue, non-tax sources 21% and Pertamina’s profits another 1.2%.2 The decline was caused mainly by a fall in the Indonesian crude oil price (ICP) from an average of $96 per barrel in 2008 to $62 in 2009 and $79 in 2010.3 The impact of the oil price is particularly evident in the fall in the non-tax component of oil and gas revenue, which has become a significant con-tributor to total natural resource revenue over the years.
2 This figure excludes the profits of the state gas company, Perusahaan Gas Negara (PGN). If its profits are included, the decline is 30%.3 The contribution of oil and gas to overall revenue depends on production, which has been declining steadily, and the oil price, which has risen significantly in the last few years, making the net effect on the budget positive (Agustina et al. 2008). The OPEC basket price of crude oil reached a peak of $140 per barrel in July 2008, plunged below $40 in February 2009 and rebounded to around $110 in 2010 and 2011; see <http://www.opec.org>.

370 Cut Dian R.D. Agustina, Wolfgang Fengler and Günther G. Schulze
Regional distribution of oil and gas revenue and the overall pattern of sub-national revenueUnder Indonesia’s decentralisation and inter-governmental transfer framework, the revenue generated by oil and gas must be shared between the centre and the regions. The calculation of shares is based on net oil and gas revenue, which is largely equivalent to profit after cost recovery and the deduction of the PSC share, but before tax.
TABLE 1 Consolidated National Revenue, 2008–10a
2008 2009 2010
Rp billion
% of total revenue
Rp billion
% of total revenue
Rp billion
% of total revenue
REVENUE & GRANTS 1,042,608 100.0 944,960 100.0 1,106,032 100.0
Domestic revenue 1,039,643 99.7 943,293 99.8 1,103,009 99.7
Tax revenue 687,800 66.0 682,627 72.2 795,159 71.9Domestic tax 653,142 62.6 663,957 70.3 766,244 69.3
Income tax 318,028 30.5 317,583 33.6 357,046 32.3Non-oil & gas 255,927 24.5 267,540 28.3 298,173 27.0Oil & gas 62,101 6.0 50,044 5.3 58,873 5.3
Sales tax 199,785 19.2 193,068 20.4 230,605 20.8Land & building tax 25,526 2.4 24,270 2.6 28,581 2.6Duties on land & building transfers
5,529 0.5 6,465 0.7 8,026 0.7
Excises & other taxes 104,274 10.0 122,571 13.0 141,987 12.8International trade tax 34,658 3.3 18,670 2.0 28,915 2.6
Import duties 19,800 1.9 18,105 1.9 20,017 1.8Export tax 14,858 1.4 565 0.1 8,898 0.8
Non-tax revenue 351,843 33.7 260,666 27.6 307,850 27.8Natural resources 228,961 22.0 138,559 14.7 168,826 15.3
Oil & gas 219,084 21.0 125,752 13.3 152,733 13.8Non-oil & gas 9,877 0.9 12,807 1.4 16,092 1.5
Profits of public enterprises 35,044 3.4 26,050 2.8 30,097 2.7Pertamina 12,400 1.2 10,472 1.1 9,509 0.9State Gas Company 300 0.0 703 0.1 4,000 0.4Other public enterprises 22,344 2.1 14,874 1.6 16,588 1.5
Other 87,838 8.4 96,058 10.2 108,927 9.8
Grants 2,965 0.3 1,667 0.2 3,023 0.3
Average ICPb ($/barrel) 96 62 79
a Consolidated national revenue for 2008 and 2009 is based on realised budget figures for all levels of government; the 2010 data are based on realised budget figures for the central level of government and planned budget figures for the regional (district and provincial) levels of government.b ICP = Indonesian crude oil price.
Source: Ministry of Finance.

The regional effects of Indonesia’s oil and gas policy: options for reform 371
Law 33/2004 on the Fiscal Balance between the Centre and the Regions is the primary legal document governing the fiscal arrangements between the central government and the regions. It states that 80% of the revenue from most natural resources – namely forestry, general mining, fisheries and geothermal energy – is to be returned to the regions of origin, with the other 20% accruing to the cen-tral government. In the case of oil and gas, however, the shares of the producing regions are set at 15.5% for oil and 30.5% for gas, with the remainder going to the central government. In accordance with their status as special autonomy regions, Aceh and the two Papuan provinces receive higher shares of their oil and gas revenue: an additional 55% for oil and 40% for gas. Thus, these provinces receive a total share of 70% of their oil and gas revenues.
The revenue allocated to the producing regions is further divided between the provincial and district levels of government. Of the amount returned to each pro-ducing region, 20% is retained by the provincial government, 40% goes to the producing district or districts, and the remaining 40% is shared equally among the non-producing districts. The revenue-sharing framework is shown in figure 1.
a That is, 26% of total net revenue after deducting shared revenue funds and the fuel subsidy. DAU = Dana Alokasi Umum (General Allocation Fund).
Source: Authors’ illustration based on Law 34/2004 and Government Regulation 55/2005.
FIGURE 1 Oil and Gas Revenue-sharing Arrangement between the Central, Provincial and Local Levels of Government
Oil & gas revenue
Central government: • 84.5% of oil revenue• 69.5% of gas revenue
Central government taxes on oil & gas
Sub-national governments• 15.5% of oil revenue• 30.5% of gas revenue
DAU oil & gas transfer to the regions: 26%b
DAU oil & gas transfer to the regions: 26%b
Provincial government:
20%
District governments: 80%• 40% for producing district in province• 40% distributed equally among non-
producing districts in province
Shared revenue funds from oil & gas

372 Cut Dian R.D. Agustina, Wolfgang Fengler and Günther G. Schulze
In addition to the shared revenue from natural resources, the regions receive transfers from the centre in the form of shared tax revenues, block grants from the General Allocation Fund (Dana Alokasi Umum, DAU) and conditional grants from the Specific Purpose Fund (Dana Alokasi Khusus, DAK). The revenue from taxes is split between the centre and the regions in varying proportions: 80:20 in the case of income tax; 10:90 in the case of property tax; and 20:80 in the case of taxes on transfers of ownership of land and buildings. The DAU is a discretionary funding mechanism intended to equalise the fiscal capacity of regional govern-ments. The DAK provides earmarked grants to finance specific areas of need that are not covered by the DAU formula, according to national priorities.
The DAU has become the main source of revenue for regional governments, accounting on average for 52% of total sub-national revenue between 2001 and 2009 (based on realised budget data for provinces and districts).4 The formula for allocating the block grants includes a ‘basic allocation’ covering 72.3% of a region’s budgetary spending on civil service salaries,5 and an additional alloca-tion in proportion to the region’s fiscal gap, that is, the difference between its fiscal need and its fiscal capacity. Fiscal need takes into account such variables as the region’s population, area, GDP per capita and human development rating, while fiscal capacity is based on the region’s own-source revenue and income from rev-enue sharing. The formula for calculating the DAU is described in more detail in appendix 2.6
The DAU pool comprises 26% of net domestic revenue, with the shares of the provincial and district governments set at 10% and 90% respectively. Since 2009, net domestic revenue has been defined as the central government’s total domestic revenue minus shared revenue funds and major subsidies (that is, energy, food and fertiliser subsidies). The allocation of DAU transfers to the regions is deter-mined at the beginning of each fiscal year based on the oil price assumption at the time, and is not adjusted subsequently even if the actual oil price deviates from the assumed price. Because it is drawn from net domestic revenue, the DAU pool includes a fraction of central government income from oil and gas production, and a fraction from oil and gas income taxation. The DAK does not contain an oil and gas component; it contributes on average 7% of total local government revenue.7
While the DAU pool is determined on the basis of the projected oil price (and not adjusted afterwards), the transfer of shared revenue funds to the regions is based on actual revenue, which depends on the level of oil production and the oil price. The adjustment between projected and actual shared revenue funds is nor-mally carried out in the last quarter of the financial year, or in some cases in the
4 Realised data at the sub-national level for subsequent years are not yet available.5 The figure of 72.3% refers to districts’ spending on civil service salaries in 2009; for prov-inces, the share was 80.4%. These percentages are not disclosed to the public and may be subject to change.6 For a recent analysis of the inter-governmental fiscal transfer system, see Fadliya and McLeod (2011).7 In addition to DAU, DAK and shared revenue transfers, regions may receive adjustment funds or (in the cases of Aceh, Papua and West Papua) special autonomy funds. Adjust-ment funds are intended to provide incentives for regions to accelerate the development of educational and other infrastructure, and to provide additional funding for teachers.
The regional effects of Indonesia’s oil and gas policy: options for reform 373
first quarter of the subsequent financial year.8 Any increases in the realised prices of oil and gas are capped, however, at 130% of the assumed oil price. If realised oil and gas prices exceed the cap during the financial year, the surplus revenue is distributed to all regions as additional DAU transfers using the usual formula.
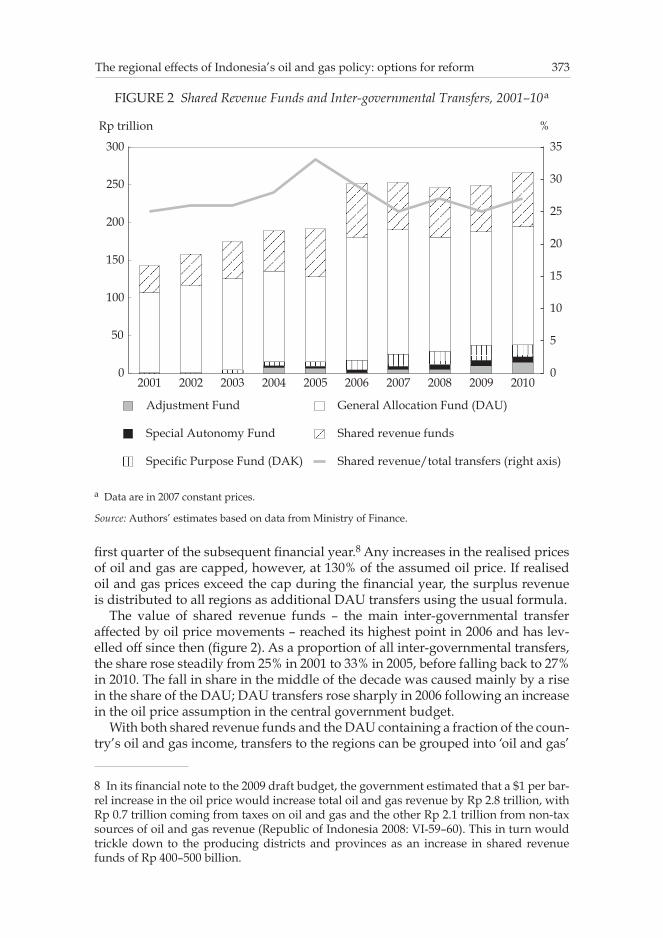
The value of shared revenue funds – the main inter-governmental transfer affected by oil price movements – reached its highest point in 2006 and has lev-elled off since then (figure 2). As a proportion of all inter-governmental transfers, the share rose steadily from 25% in 2001 to 33% in 2005, before falling back to 27% in 2010. The fall in share in the middle of the decade was caused mainly by a rise in the share of the DAU; DAU transfers rose sharply in 2006 following an increase in the oil price assumption in the central government budget.
With both shared revenue funds and the DAU containing a fraction of the coun-try’s oil and gas income, transfers to the regions can be grouped into ‘oil and gas’
8 In its financial note to the 2009 draft budget, the government estimated that a $1 per bar-rel increase in the oil price would increase total oil and gas revenue by Rp 2.8 trillion, with Rp 0.7 trillion coming from taxes on oil and gas and the other Rp 2.1 trillion from non-tax sources of oil and gas revenue (Republic of Indonesia 2008: VI-59–60). This in turn would trickle down to the producing districts and provinces as an increase in shared revenue funds of Rp 400–500 billion.
FIGURE 2 Shared Revenue Funds and Inter-governmental Transfers, 2001–10a
a Data are in 2007 constant prices.
Source: Authors’ estimates based on data from Ministry of Finance.
2001 2002 2003 2004 2005 2006 2007 2008 2009 20100
50
100
150
200
250
300
0
5
10
15
20
25
30
35
Adjustment Fund
Special Autonomy Fund
Specific Purpose Fund (DAK)
General Allocation Fund (DAU)
Shared revenue funds
Shared revenue/total transfers (right axis)
Rp trillion %
374 Cut Dian R.D. Agustina, Wolfgang Fengler and Günther G. Schulze
and ‘non-oil and gas’ transfers. Oil and gas transfers consist of shared revenue funds from oil and gas, plus 26% of net domestic revenue from oil and gas (con-sisting of tax and non-tax revenues from oil and gas, after deducting shared oil and gas revenues and fuel subsidies). Non-oil and gas transfers consist of non-oil and gas-related shared revenue funds, 26% of net domestic revenue from non-oil and gas sources, and grants distributed through the DAK.
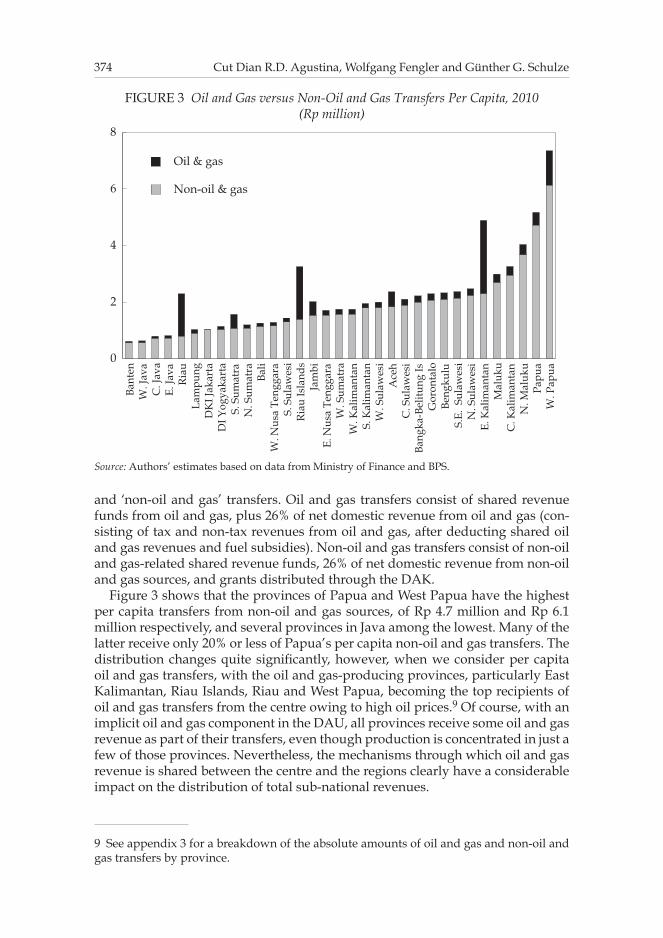
Figure 3 shows that the provinces of Papua and West Papua have the highest per capita transfers from non-oil and gas sources, of Rp 4.7 million and Rp 6.1 million respectively, and several provinces in Java among the lowest. Many of the latter receive only 20% or less of Papua’s per capita non-oil and gas transfers. The distribution changes quite significantly, however, when we consider per capita oil and gas transfers, with the oil and gas-producing provinces, particularly East Kalimantan, Riau Islands, Riau and West Papua, becoming the top recipients of oil and gas transfers from the centre owing to high oil prices.9 Of course, with an implicit oil and gas component in the DAU, all provinces receive some oil and gas revenue as part of their transfers, even though production is concentrated in just a few of those provinces. Nevertheless, the mechanisms through which oil and gas revenue is shared between the centre and the regions clearly have a considerable impact on the distribution of total sub-national revenues.
9 See appendix 3 for a breakdown of the absolute amounts of oil and gas and non-oil and gas transfers by province.
FIGURE 3 Oil and Gas versus Non-Oil and Gas Transfers Per Capita, 2010 (Rp million)
Source: Authors’ estimates based on data from Ministry of Finance and BPS.
Bant
enW
. Jav
aC
. Jav
aE.
Java
Ria
uLa
mpu
ngD
KI J
akar
taD
I Yog
yaka
rta
S. S
umat
raN
. Sum
atra
Bali
W. N
usa
Teng
gara
S. S
ulaw
esi
Ria
u Is
land
sJa
mbi
E. N
usa
Teng
gara
W. S
umat
raW
. Kal
iman
tan
S. K
alim
anta
nW
. Sul
awes
iA
ceh
C. S
ulaw
esi
Bang
ka-B
elitu
ng Is
Gor
onta
loBe
ngku
luS.
E. S
ulaw
esi
N. S
ulaw
esi
E. K
alim
anta
nM
aluk
uC
. Kal
iman
tan
N. M
aluk
uPa
pua
W. P
apua
0
2
4
6
8
Non-oil & gas
Oil & gas

The regional effects of Indonesia’s oil and gas policy: options for reform 375
The concentration of oil and gas production in just a few regions tends to cre-ate geographical inequities in the distribution of revenue. However, the sharp rise in regular transfers – especially DAU transfers – in 2006 (figure 2) following an increase in the oil price assumption has substantially reduced these inequi-ties. The poorer provinces, especially in eastern Indonesia, have been the main beneficiaries of this expansion of transfers. The main challenge for them is not the level of resources, but how to spend their resources more effectively (Lewis and Oosterman 2008; World Bank 2008).
THE REGIONAL EFFECTS OF FUEL SUBSIDIES
The fuel subsidy mechanism Like other oil-producing developing countries, Indonesia has been subsidising fuel since the 1970s when the world experienced its first oil price shock. The gov-ernment fixed the price at a very low level – below 20 cents per litre – until 2005, with the budget bearing the cost of the difference between domestic and inter-national oil prices. When the world oil price started to rise substantially in 2004, fuel subsidies became the main expenditure item in the budget, consuming some $15 billion, or more than 20% of total expenditures, in both 2004 and 2005.
Confronted with a mounting fuel subsidy bill and financial market concerns about the impact of the subsidies on the budget, the government more than dou-bled fuel prices in 2005 to about 50 cents per litre. This radical measure substan-tially reduced the cost of fuel subsidies, although other subsidies, particularly on electricity, continued to increase, because the government kept tariffs low despite rising input – especially fuel – costs. The cost of energy subsidies declined until the global oil price again began to rise in 2007. When oil prices reached a record high in mid-2008, Indonesia faced the same challenge as in 2005. In May 2008, the government increased fuel prices by another 30%. But despite this move and a decline in the oil price towards the end of the year, Indonesia spent a record $23 billion on fuel and electricity subsidies in 2008.
With the decline in the oil price, subsidies returned to more manageable levels in 2009. The ‘break-even’ point for fuel subsidies – the point at which there is no cost to the budget – is $70 per barrel for oil, $60 per barrel for diesel and an unrealistically low $21 per barrel for kerosene (which has, however, largely been replaced by subsidised LPG). With oil prices returning to their long-term trend (the average ICP reached $111.50 per barrel in 2011), subsidies will once again return to very significant levels – unless the policy is changed.
The cost of the fuel subsidy can be estimated by taking the difference between the market price (pm) that would prevail in the absence of a subsidy and the administered price (pad) that the government stipulates, multiplied by the quan-tity (q) of fuel consumed. The subsidy is different for each of the major fuels, namely premium (89 octane) gasoline, diesel, kerosene and LPG. Total fuel subsi-dies are given by:
∑ ∑= −S p p q( )ii
im
iad
ii
, (1)
where subscript i denotes the various fuel products (gasoline, diesel, kerosene, LPG). The free market price is the Mid Oil Platts Singapore (MOPS) price for the
376 Cut Dian R.D. Agustina, Wolfgang Fengler and Günther G. Schulze
relevant type of fuel, plus a margin for transport, storage, distribution and an economic profit. This margin, referred to in Indonesian policy discussions as the ‘α-factor’, was set at Rp 556 per litre in 2010 (Republic of Indonesia 2009).10 Value added tax (VAT) and fuel tax also need to be included in the estimation, making the market price:
α τ= + +p MOPS( )(1 )im
i , (2)
where τ denotes the effective ad valorem tax rate (consisting of VAT and fuel tax) on the product.
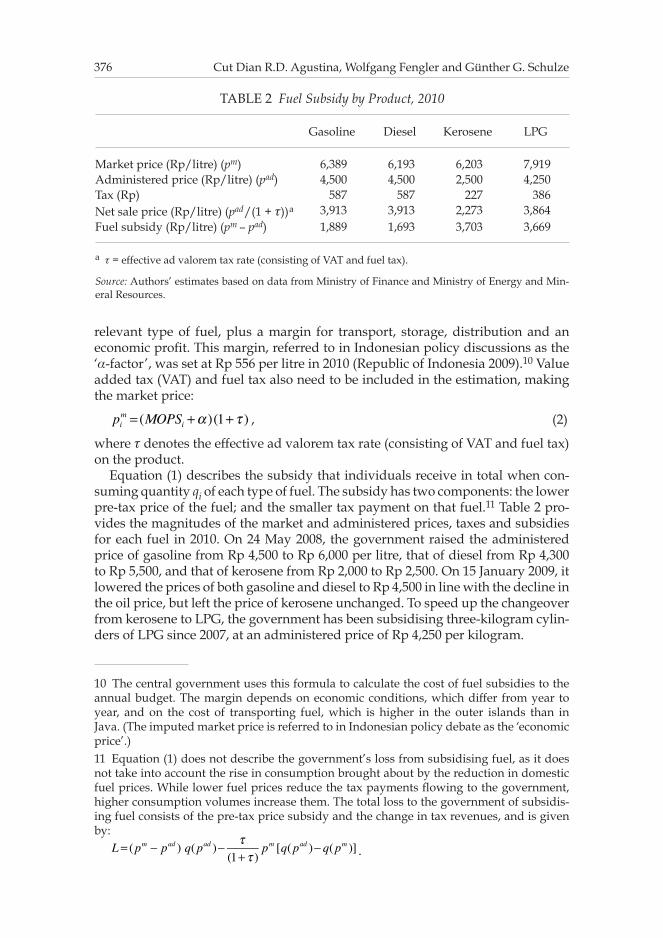
Equation (1) describes the subsidy that individuals receive in total when con-suming quantity qi of each type of fuel. The subsidy has two components: the lower pre-tax price of the fuel; and the smaller tax payment on that fuel.11 Table 2 pro-vides the magnitudes of the market and administered prices, taxes and subsidies for each fuel in 2010. On 24 May 2008, the government raised the administered price of gasoline from Rp 4,500 to Rp 6,000 per litre, that of diesel from Rp 4,300 to Rp 5,500, and that of kerosene from Rp 2,000 to Rp 2,500. On 15 January 2009, it lowered the prices of both gasoline and diesel to Rp 4,500 in line with the decline in the oil price, but left the price of kerosene unchanged. To speed up the changeover from kerosene to LPG, the government has been subsidising three-kilogram cylin-ders of LPG since 2007, at an administered price of Rp 4,250 per kilogram.
10 The central government uses this formula to calculate the cost of fuel subsidies to the annual budget. The margin depends on economic conditions, which differ from year to year, and on the cost of transporting fuel, which is higher in the outer islands than in Java. (The imputed market price is referred to in Indonesian policy debate as the ‘economic price’.)11 Equation (1) does not describe the government’s loss from subsidising fuel, as it does not take into account the rise in consumption brought about by the reduction in domestic fuel prices. While lower fuel prices reduce the tax payments flowing to the government, higher consumption volumes increase them. The total loss to the government of subsidis-ing fuel consists of the pre-tax price subsidy and the change in tax revenues, and is given by:
ττ
= − −+
−L p p q p p q p q p( ) ( )(1 )
[ ( ) ( )]m ad ad m ad m.
TABLE 2 Fuel Subsidy by Product, 2010
Gasoline Diesel Kerosene LPG
Market price (Rp/litre) (pm) 6,389 6,193 6,203 7,919Administered price (Rp/litre) (pad) 4,500 4,500 2,500 4,250Tax (Rp) 587 587 227 386Net sale price (Rp/litre) (pad/(1 + τ))a 3,913 3,913 2,273 3,864Fuel subsidy (Rp/litre) (pm – pad) 1,889 1,693 3,703 3,669
a τ = effective ad valorem tax rate (consisting of VAT and fuel tax).
Source: Authors’ estimates based on data from Ministry of Finance and Ministry of Energy and Min-eral Resources.

The regional effects of Indonesia’s oil and gas policy: options for reform 377
The total subsidy is obtained by multiplying the unit subsidy for each fuel product by the amount consumed. In 2010, the market prices for gasoline, die-sel and kerosene were Rp 6,389, Rp 6,193 and Rp 6,203 respectively, while the unit subsidies were Rp 1,889, Rp 1,693 and Rp 3,703 (table 2). The unit subsidy includes a tax component, which accounts for the fact that a lower pre-tax price of fuel implies lower tax revenues. For budgetary purposes, however, the subsidy is calculated on a net-of-tax basis, that is, as the difference between the market price net of taxes and the administered price net of taxes, multiplied by the quantity consumed.
The fuel subsidy component in the budget is strongly influenced by fluctua-tions in oil prices. Because the fuel subsidy refers to the difference between the market price (the price set by sellers) and the subsidised price (the price set by the government), any increase in the oil price will cause an increase in the cost of the fuel subsidy. The fuel subsidy became a major expenditure item in 2008, when oil prices reached very high levels (table 3). In that year, 20% of consolidated expend-iture was allocated to energy subsidies, similar to the amount allocated to capital expenditures. When oil prices fell in 2008–09 due to the global financial crisis, the
TABLE 3 Consolidated National Expenditure, 2008–10a (Rp billion)
2008 2009 2010
Rp billion
% of total expen-diture
Rp billion
% of total expen-diture
Rp billion
% of total expen-diture
Personnel 275,471 24.3 316,681 27.9 346,656 30.4Material 123,679 10.9 159,649 14.1 179,602 15.7Interest payments 88,430 7.8 93,782 8.3 88,383 7.7Subsidies 275,292 24.3 138,082 12.2 192,707 16.9
Energy 223,013 19.7 94,586 8.3 139,953 12.3Fuel 139,107 12.3 45,039 4.0 82,351 7.2Electricity 83,907 7.4 49,546 4.4 57,602 5.0
Non-energy 52,278 4.6 43,496 3.8 52,754 4.6Social assistance 57,741 5.1 73,814 6.5 68,611 6.0Other routine exp. 84,651 7.5 109,838 9.7 88,554 7.8Capital expenditure 226,327 20.0 241,307 21.3 176,457 15.5
Total 1,131,590 100.0 1,133,152 100.0 1,140,972 100.0
Average ICPb ($/barrel)
96 62 79
a Consolidated national expenditure for 2008 and 2009 is based on realised budget figures for all levels of government; the 2010 data are based on realised budget figures for the central level of gov-ernment and planned budget figures for the regional (district and provincial) levels of government.
b ICP = Indonesian crude oil price.
Source: Ministry of Finance.

378 Cut Dian R.D. Agustina, Wolfgang Fengler and Günther G. Schulze
share of energy subsidies also declined sharply to just 8% in 2009, before increas-ing to 12% in 2010.12
Changes in oil prices also affect the cost to the government of the electricity subsidy. The electricity subsidy is the difference between the basic electricity tariff – the price the consumer pays for electricity, which is regulated by the govern-ment – and the cost of production. Perusahaan Listrik Negara (PLN), the state-owned electricity company, purchases the fuel it uses to generate electricity at a non-subsidised price, so that any increase in price has a direct effect on its produc-tion costs. As long as the basic electricity tariff remains unchanged, the electricity subsidy will move in the same direction as the oil price.
The distribution of fuel subsidies across households and regionsFuel subsidies are very unequally distributed across households and regions. They tend to benefit high-income households, which are likely to consume more fuel, and regions that have larger shares of high-income households and more economic activity.
The relationship between the oil subsidy and household income can be exam-ined by looking at households’ consumption of gas, diesel, kerosene and LPG by income decile.13 Figure 4 shows that around 28% of the subsidy goes to the highest
12 The government’s financial note to the 2009 draft budget estimated that a $1 per bar-rel increase in the oil price would increase fuel subsidy spending by Rp 2.5–2.6 trillion (Republic of Indonesia 2008: VI-59). The 2010 financial note indicated that a $1 per barrel increase in the price would increase the budget deficit by up to Rp 0.3 trillion (Republic of Indonesia 2009: IV-18).13 The estimation relies on panel data on consumption from the annual National Socio-Economic Survey (Susenas), which provides basic information on household welfare and
FIGURE 4 Distribution of Fuel Subsidy by Household Income Decile, 2010 (%)
Source: Authors’ estimates based on data from the National Socio-Economic Survey (Susenas), 2010.
1 2 3 4 5 6 7 8 9 100
5
10
15
20
25
30

The regional effects of Indonesia’s oil and gas policy: options for reform 379
decile, and more than half to the richest 30% of the population. This is because diesel and gasoline consumption is highly elastic to income, with better-off peo-ple more likely to own automobiles, and to consume more diesel and gasoline.14 This finding suggests that subsidies tend to increase income inequality. Pitt (1985) and Olivia and Gibson (2008) also conclude that fuel subsidisation mainly ben-efits the wealthy, and that the reduction or elimination of such subsidies would increase welfare (see also Bulman, Fengler and Ikhsan 2008).
At a regional level, the fuel subsidy tends to favour regions with larger shares of high-income households and more economic activity. The positive correlation between high-income provinces (those with high levels of non-oil and gas GDP per capita) and high levels of fuel consumption is clearly shown in figure 5.
On a per capita basis, provinces such as the Special Capital Region of Jakarta (DKI Jakarta), Bangka-Belitung Islands, Riau, East Kalimantan and Bali have ben-efited most from the fuel subsidy (figure 6). Collectively, the provinces located in Java (East Java, West Java, Central Java and DKI Jakarta) consumed around 50% of the total fuel subsidy in 2010, and Java and Bali together about 59% (figure 7). In contrast, the combined share consumed by the oil and gas-rich provinces of East Kalimantan, Riau and Aceh was less than two-thirds the share of West Java, which received the largest fuel subsidy of all Indonesian provinces in 2010.
the characteristics of household members. The survey also provides information on the fuel consumption of 66,000 representative households, separately for gasoline, diesel, kero-sene and LPG. 14 Demand for kerosene, however, is relatively income-inelastic because it is mainly used for cooking.
FIGURE 5 Non-Oil and Gas Regional GDP Per Capita, 2009, and Fuel Subsidy Per Capita, 2010
Source: Authors’ estimates based on data from BPS and BPH Migas.
F
FF
F
FF
F
F
F F
F
F
F
F
F
FF
FF
F
F
FFF
F
F
F
F
F
F
FF
F
0
100
200
300
400
500
600
700
0 10 20 30 40 50 60 70 80
Fuel
sub
sidy
per
cap
ita (R
p th
ousa
nd)
Non-oil & gas regional GDP per capita (Rp million)

380 Cut Dian R.D. Agustina, Wolfgang Fengler and Günther G. Schulze
FIGURE 6 Fuel Subsidy per Capita by Province, 2010 (Rp thousand)
Source: Authors’ estimates based on data from Ministry of Energy and Mineral Resources and BPH Migas.
E. N
usa
Teng
gara
W. S
ulaw
esi
Papu
aW
. Nus
a Te
ngga
raN
. Mal
uku
S.E.
Sul
awes
iG
oron
talo
C. J
ava
C. S
ulaw
esi
Mal
uku
Beng
kulu
W. J
ava
S. S
ulaw
esi
Lam
pung
E. Ja
vaW
. Kal
iman
tan
S. S
umat
raA
ceh
DI Y
ogya
kart
aBa
nten
W. P
apua
W. S
umat
raN
. Sul
awes
iJa
mbi
S. K
alim
anta
nN
. Sum
atra
C. K
alim
anta
nR
iau
Isla
nds
Bali
E. K
alim
anta
nR
iau
Bang
ka-B
elitu
ng Is
DK
I Jak
arta
0
100
200
300
400
500
600
700
FIGURE 7 Share of Fuel Subsidy Per Capita by Region, 2010 (%)
Source: Authors’ estimates based on data from Ministry of Energy and Mineral Resources and BPH Migas.
Java & Bali(59%)
Sumatra(25%)
Kalimantan(7%)
Sulawesi(5%)
Papua, Maluku &Nusa Tenggara
(4%)

The regional effects of Indonesia’s oil and gas policy: options for reform 381
THE REGIONAL EFFECTS OF INDONESIA’S ENERGY POLICYBoth dimensions of Indonesia’s oil and gas policy – the subsidisation of fuel and the sharing of oil and gas revenues with the regions – have strong regional effects. While oil and gas-related revenue transfers per capita are strongly concentrated in the oil and gas-producing provinces (East Kalimantan, Riau Islands, Riau, West Papua and, to a lesser extent, Aceh and South Sumatra), fuel subsidies per capita – although more evenly distributed – tend to favour the richer provinces (as meas-ured by non-oil and gas regional GDP per capita), such as DKI Jakarta, Bangka-Belitung Islands, Riau, East Kalimantan and Bali (figure 8).
The fuel subsidy tends to make oil-related transfers per capita slightly less skewed across regions compared to the revenue-sharing distribution. Yet, the recipients of each type of transfer are different: whereas the fiscal transfers go mainly to regional governments, the fuel subsidy goes both to the consumers of fuel and to regional governments in the form of taxes, particularly because pro-vincial governments are entitled to collect a 5% tax on motor vehicle fuel. This revenue component is counted as the regional governments’ own-source revenue.
The overall picture of fuel subsidies and oil and gas-related revenue trans-fers combined suggests that the provinces that benefit the most from the current mechanism are oil and gas-producing provinces such as East Kalimantan, Riau Islands, Riau and West Papua, while the ones that benefit the least are East and West Nusa Tenggara and Javanese provinces such as Central Java, West Java and East Java (figure 8).
FIGURE 8 Fuel Subsidy Per Capita and Oil and Gas Revenue Transfers Per Capita by Province, 2010
(Rp million)
Source: Authors’ estimates based on data from Ministry of Finance, BPS and BPH Migas.
DK
I Jak
arta
Bant
enW
. Jav
aC
. Jav
aE.
Java
N. S
umat
raD
I Yog
yaka
rta
Bali
W. N
usa
Teng
gara
Lam
pung
S. S
ulaw
esi
S. K
alim
anta
nE.
Nus
a Te
ngga
raW
. Kal
iman
tan
W. S
umat
raW
. Sul
awes
iC
. Sul
awes
iBa
ngka
-Bel
itung
IsG
oron
talo
Beng
kulu
S.E.
Sul
awes
iN
. Sul
awes
iM
aluk
uC
. Kal
iman
tan
N. M
aluk
uPa
pua
Jam
biS.
Sum
atra
Ace
hW
. Pap
uaR
iau
Ria
u Is
land
sE.
Kal
iman
tan
0.0
0.5
1.0
1.5
2.0
2.5
3.0
3.5
Oil & gas revenue transfers
Fuel subsidy

382 Cut Dian R.D. Agustina, Wolfgang Fengler and Günther G. Schulze
OPTIONS FOR REFORM
The need for reformThere is an obvious need to reform the current oil and gas policy in Indonesia. Fuel subsidies are highly inefficient and have a detrimental effect on the distribu-tion of income (Hartono and Resosudarmo 2008; IMF 2008; Olivia and Gibson 2008). First, they distort individual decisions on the consumption of fuel, and as such create a welfare loss. Second, they increase fuel consumption, and therefore carbon dioxide and sulphur emissions, and thus exacerbate the negative effects of burning fossil fuels. This is why many countries tax gasoline and diesel rather than subsidising them. Third, the subsidisation of fuel provides a disincentive to invest in fuel-saving strategies, such as insulation and more fuel-efficient cars and air conditioners. Fourth, the redistributional argument for fuel subsidies is dubious at best, as they essentially subsidise the rich. Fifth, they are a major budg-etary item (table 3), and thus consume government resources that could more effi-ciently be used to fund pro-poor and pro-growth programs, such as infrastructure investment, education and the like. Moreover, fluctuations in the oil price con-tinue to pose a major risk to the budget (Agustina et al. 2008).15 Finally, the subsi-dies provide incentives for smuggling and corruption, as the fuel can be used for unauthorised purposes or shipped abroad.
The above arguments strongly militate for substantial reform of Indonesia’s fuel subsidy regime. In contrast, the current mechanism for sharing oil and gas revenue can be seen as less problematic, even though the revenue is distributed unequally among regions. In particular, this is because regional governments in producing regions are clearly entitled to additional revenue to compensate them for the social, environmental and infrastructure (transport and delivery) costs of hosting oil and gas exploration.
The first step towards reformUntil 2009, the DAU pool comprised 26% of net domestic revenue after the deduc-tion of shared revenue funds; fuel and other subsidies were borne by the centre alone. This led to a rising central budget deficit when oil prices increased, as the cost of fuel subsidies rose faster than the revenue received from oil and gas. To reduce the risk to the budget of fluctuations in oil prices, in 2009 the government decided to deduct fuel and other major subsidies – in addition to shared revenue funds – from the amount on which the DAU was based. This means that 26% of the cost of fuel subsidies is now shared with the sub-national governments.
This reform implies a significant reduction in fiscal transfers to the regions, particularly in respect of the DAU. Obviously, the more the oil price increases, the greater the reduction in transfers would be.16 To show the difference in out-come before and after the policy change, we compare the actual 2009 budget with
15 For instance, at the current administered price levels, oil prices of $79, $100 and $120 per barrel respectively imply subsidies of 2.5%, 5.0% and 6.6% of GDP. 16 As noted earlier, DAU transfers depend on the projected oil price, not the ex post actual oil price. Until 2009, this established an incentive for the central government to under-estimate the oil price. With fuel subsidies deducted from the amount on which the DAU pool is based, however, the incentive runs in the opposite direction, as net domestic revenue would decrease with a rising oil price given the current level of administered fuel prices.

The regional effects of Indonesia’s oil and gas policy: options for reform 383
the budget as it would have been without the ‘burden-sharing’ policy. As table 4 shows, the reform reduced the DAU pool by around 20%.
The burden-sharing formula reallocates significant resources from the regions to the centre. In 2009, it shifted 4% of overall revenue back to the centre,17 and thus cut the central budget deficit by 43% (table 4). It also reduces the overall size of the DAU pool, and affects the distribution of revenue among regions. All regions receive smaller allocations under the burden-sharing policy, but those with the largest fiscal gaps suffer the most. This is because the salary component of the DAU remains untouched, reducing the amount left over to fund the fiscal gap component of the DAU. As we saw earlier, the DAU formula provides a basic allocation to each region consisting of 72.3% of its civil service wage bill, mak-ing salaries the most important part of the scheme. As table 5 shows, the salary
17 This figure is calculated as (DAU without burden sharing minus DAU with burden sharing) divided by central government revenue.
TABLE 4 Transfers to the Regions with and without Burden-sharing, 2009a (Rp billion)
With Burden Sharing: Actual 2009 Budget
Without Burden Sharing
General Allocation Fund (DAU) 186,414 224,472Total regional transfers: DAU + Specific Purpose Fund (DAK) + shared revenue funds + special autonomy funds)
320,691 358,749
Central government revenueb 984,787 984,787Central budget deficit (51,342) (89,400)
a Estimation is for districts and provinces.
b Central government revenue is the base figure for calculating net domestic revenue (that is, revenue after the deduction of shared revenue funds and major subsidies).
Source: Authors’ estimates based on data from Ministry of Finance.
TABLE 5 The Effect of Burden Sharing on the Fiscal Gap Component of the General Allocation Fund (DAU)a
With Burden Sharing Without Burden Sharing
(Rp billion) (%) (Rp billion) (%)
Total DAU 167,773 100 202,025 100Basic allocation 75,478 45 75,478 37Fiscal gap component 92,295 55 126,547 63
a Estimation is for districts only.
Source: Authors’ estimates based on data from Ministry of Finance.

384 Cut Dian R.D. Agustina, Wolfgang Fengler and Günther G. Schulze
component rises from 37% to 45% of the DAU under burden sharing, leaving only 55% available to fund the fiscal gap component, compared with 63% previously.
Figure 9 shows the reduction in DAU per capita by province caused by the introduction of burden sharing, and contrasts this with the fuel subsidy per capita that the provinces receive. It shows that the poorer regions (Gorontalo, Papua, East Nusa Tenggara, West Nusa Tenggara) suffer disproportionately from the reduction in the size of the DAU, while the richer regions that consume more sub-sidised fuel (especially the Javanese provinces) benefit disproportionately from the fuel subsidy, which remains in place.
The government’s reform to the DAU mechanism has reduced the risk to the budget from oil price fluctuations and has shifted resources back to the centre, but it has not made the regional distribution of DAU transfers more equitable. To mitigate the effect on poorer regions, the government could take a different approach, namely to tie a region’s share of the DAU to its share of subsidised fuel consumption. That is, rather than deducting subsidies from the DAU pool, the government could include proportional weightings of fuel subsidy consumption as part of the DAU formula.
More fundamentally, however, the negative effects of the 2009 reform could be addressed by reducing the fuel subsidy itself. Not only would this relieve the pressure on the DAU pool imposed by the burden-sharing scheme, thus increas-ing the component available to fund poorer regions, but it would also provide an
FIGURE 9 Reduction in General Allocation Fund (DAU) per Capita (after Introduction of Burden Sharing), and Fuel Subsidy Per Capita, 2009
(Rp million)
Source: Authors’ estimates based on data from Ministry of Finance.
W. P
apua
Papu
aC
. Kal
iman
tan
N. M
aluk
uM
aluk
uS.
E. S
ulaw
esi
Gor
onta
loN
. Sul
awes
iBa
ngka
-Bel
itung
IsBe
ngku
luW
. Sul
awes
iC
. Sul
awes
iA
ceh
W. S
umat
raW
. Kal
iman
tan
E. N
usa
Teng
gara
Jam
biS.
Kal
iman
tan
Ria
u Is
land
sS.
Sul
awes
iBa
liW
. Nus
a Te
ngga
raD
I Yog
yaka
rta
N. S
umat
raS.
Sum
atra
Lam
pung
E. K
alim
anta
nC
. Jav
aE.
Java
W. J
ava
Ria
uBa
nten
DK
I Jak
arta
-1.5
-1.0
-0.5
0.0
0.5
1.0
1.5
2.0
DAU
Fuel subsidy

The regional effects of Indonesia’s oil and gas policy: options for reform 385
incentive to cut fuel consumption and thus help to correct the distortionary effect of the subsidy. If subsidies on fuel for private vehicles were eliminated, this too would significantly reduce the adverse distributional effects of what is effectively a subsidy for the rich. This is at the heart of the president’s current proposal, which we discuss below.
The president’s proposalThe government is aware of the need to reform the fuel subsidy regime, particu-larly in the context of continuing increases in the oil price, which has exceeded $100 per barrel since February 2011. Fuel subsidy reform has been on the govern-ment agenda for several years; it is mentioned in Law 25/2000 on the National Development Plan for 2000–2004; Ministry of Energy and Mineral Resources Reg-ulation 31/2005 on Technical Procedures for Energy Saving; and Law 10/2010 on the 2011 State Budget, which allows the government to regulate the allocation of fuel and to improve the targeting of the fuel subsidy in phases. The options that have been discussed include restricting the use of subsidised fuel to cars purchased after 2005; increasing the price of subsidised gasoline; providing cash incentives for people to use public transport; and discontinuing the use of subsi-dised gasoline for private cars. The latter option is the one proposed by the presi-dent and currently being considered by the government; initially it was scheduled to be implemented in Java and Bali in mid-2011.
The proposed reform would significantly relieve the pressure on the budget, but it would also have clear regional consequences. Discontinuing the use of sub-sidised gasoline for private cars would reduce the overall fuel subsidy by approx-imately Rp 13.5 trillion (based on the procedure described in appendix 4), with most of the savings contributed by consumers in Javanese provinces such as DKI Jakarta, West Java and East Java, which have the highest numbers of private cars. At the same time, it would increase the DAU pool by 26% of that amount, that is, by Rp 3.5 trillion, which in turn would increase the amount available to fund the fiscal gap component of the DAU, for the reasons explained above.
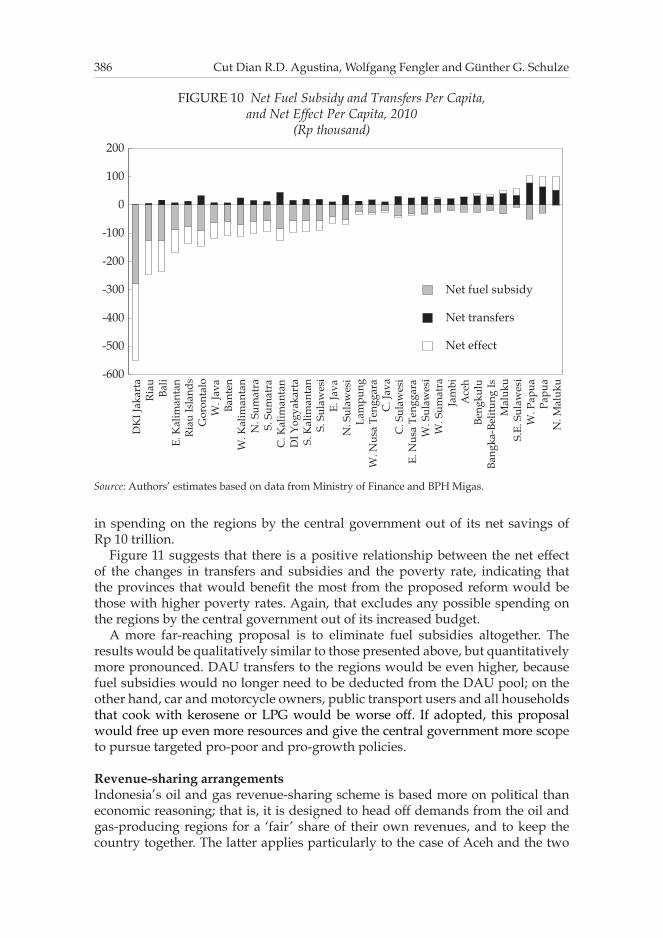
Thus, the redistributive effects of this reform would be to claw back revenue from relatively well-off consumers and return it to the public coffers, with three-quarters of the savings going to the central government and the remainder to the regional governments. The poorer regions would benefit disproportion-ately, because the increase in the DAU pool would flow entirely to the fiscal gap component. The outcome for the individual provinces is depicted in figure 10, which shows the reductions that could be expected in the fuel subsidy (in grey), the increases that could be expected in transfers (in black) and the net effect (in white).18 It suggests that the regions that would receive the most in additional transfers per capita would be the eastern Indonesian provinces of North Maluku, Papua and West Papua, while those that would be hurt the most by a reduction in fuel subsidies would be DKI Jakarta and the high-income provinces of Riau and Bali. It should be noted, however, that figure 10 disregards any possible increase
18 Note that the net effect for the regions is calculated as the difference in net transfers (going to local governments) minus the difference in fuel subsidies (going to fuel consum-ers). It thus aggregates over different units of recipients.
386 Cut Dian R.D. Agustina, Wolfgang Fengler and Günther G. Schulze
in spending on the regions by the central government out of its net savings of Rp 10 trillion.
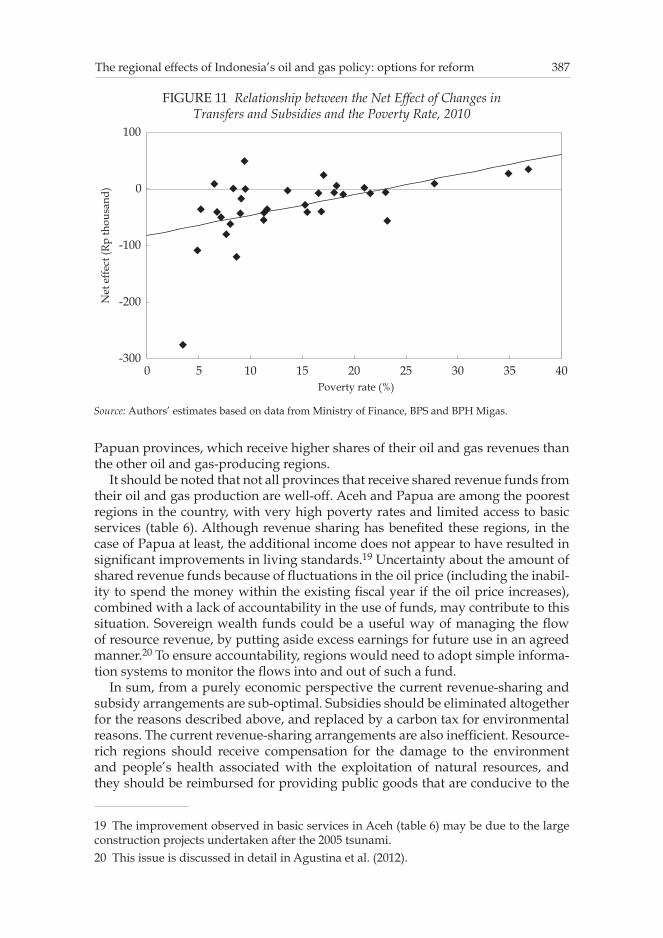
Figure 11 suggests that there is a positive relationship between the net effect of the changes in transfers and subsidies and the poverty rate, indicating that the provinces that would benefit the most from the proposed reform would be those with higher poverty rates. Again, that excludes any possible spending on the regions by the central government out of its increased budget.
A more far-reaching proposal is to eliminate fuel subsidies altogether. The results would be qualitatively similar to those presented above, but quantitatively more pronounced. DAU transfers to the regions would be even higher, because fuel subsidies would no longer need to be deducted from the DAU pool; on the other hand, car and motorcycle owners, public transport users and all households that cook with kerosene or LPG would be worse off. If adopted, this proposal would free up even more resources and give the central government more scope to pursue targeted pro-poor and pro-growth policies.
Revenue-sharing arrangementsIndonesia’s oil and gas revenue-sharing scheme is based more on political than economic reasoning; that is, it is designed to head off demands from the oil and gas-producing regions for a ‘fair’ share of their own revenues, and to keep the country together. The latter applies particularly to the case of Aceh and the two
FIGURE 10 Net Fuel Subsidy and Transfers Per Capita, and Net Effect Per Capita, 2010
(Rp thousand)
Source: Authors’ estimates based on data from Ministry of Finance and BPH Migas.
DK
I Jak
arta
Ria
uBa
liE.
Kal
iman
tan
Ria
u Is
land
sG
oron
talo
W. J
ava
Bant
enW
. Kal
iman
tan
N. S
umat
raS.
Sum
atra
C. K
alim
anta
nD
I Yog
yaka
rta
S. K
alim
anta
nS.
Sul
awes
iE.
Java
N. S
ulaw
esi
Lam
pung
W. N
usa
Teng
gara
C. J
ava
C. S
ulaw
esi
E. N
usa
Teng
gara
W. S
ulaw
esi
W. S
umat
raJa
mbi
Ace
hBe
ngku
luBa
ngka
-Bel
itung
IsM
aluk
uS.
E. S
ulaw
esi
W. P
apua
Papu
aN
. Mal
uku
-600
-500
-400
-300
-200
-100
0
100
200
Net fuel subsidy
Net transfers
Net effect
The regional effects of Indonesia’s oil and gas policy: options for reform 387
Papuan provinces, which receive higher shares of their oil and gas revenues than the other oil and gas-producing regions.
It should be noted that not all provinces that receive shared revenue funds from their oil and gas production are well-off. Aceh and Papua are among the poorest regions in the country, with very high poverty rates and limited access to basic services (table 6). Although revenue sharing has benefited these regions, in the case of Papua at least, the additional income does not appear to have resulted in significant improvements in living standards.19 Uncertainty about the amount of shared revenue funds because of fluctuations in the oil price (including the inabil-ity to spend the money within the existing fiscal year if the oil price increases), combined with a lack of accountability in the use of funds, may contribute to this situation. Sovereign wealth funds could be a useful way of managing the flow of resource revenue, by putting aside excess earnings for future use in an agreed manner.20 To ensure accountability, regions would need to adopt simple informa-tion systems to monitor the flows into and out of such a fund.
In sum, from a purely economic perspective the current revenue-sharing and subsidy arrangements are sub-optimal. Subsidies should be eliminated altogether for the reasons described above, and replaced by a carbon tax for environmental reasons. The current revenue-sharing arrangements are also inefficient. Resource-rich regions should receive compensation for the damage to the environment and people’s health associated with the exploitation of natural resources, and they should be reimbursed for providing public goods that are conducive to the
19 The improvement observed in basic services in Aceh (table 6) may be due to the large construction projects undertaken after the 2005 tsunami. 20 This issue is discussed in detail in Agustina et al. (2012).
FIGURE 11 Relationship between the Net Effect of Changes in Transfers and Subsidies and the Poverty Rate, 2010
Source: Authors’ estimates based on data from Ministry of Finance, BPS and BPH Migas.
F
FF
FF FFF F F FF FF F FF F FF F FFFF FFF F
F F FF
-300
-200
-100
0
100
0 5 10 15 20 25 30 35 40
Net
eff
ect (
Rp
thou
sand
)
Poverty rate (%)

388 Cut Dian R.D. Agustina, Wolfgang Fengler and Günther G. Schulze
exploitation of those resources (such as roads and harbours). But poverty, and development needs more generally, should not be addressed through natural resource revenue sharing, but rather through encompassing schemes such as the DAU.
Such schemes support regions that are poor in both revenue and resources, such as the Maluku islands and East and West Nusa Tenggara. The existing fuel policies, on the other hand, mainly benefit the high-income regions (through fuel subsidies) and the resource-rich regions (through revenue sharing). The other regions benefit from the fuel policies only through the oil and gas component in the DAU. A pro-poor policy would increase the fiscal gap component of the DAU by eliminating the fuel subsidy and reducing the extent of revenue sharing. Obvi-ously, there may be legitimate non-economic considerations that might persuade policy makers to deviate from such a scheme – including considerations of equity based on the view that regions with natural resources are entitled to a larger share of the revenue generated by those resources.
CONCLUSIONIn this paper we have examined the effects on the regions of Indonesia’s oil and gas policy. This policy has three components that affect the regions. First, the income derived from oil and gas production (through taxes and revenue-sharing agreements with producers) is shared between the regions and the centre. This component redistributes revenue to the natural resource-rich regions, particularly East Kalimantan, Riau Islands and Riau. Second, around a quarter of the central government’s share of oil and gas revenue is reallocated to the regions through
TABLE 6 Basic Services in Aceh and Papua (%)
Births Attended by Skilled Personnel
Household Access to Sanitation
Houshold Access to
Safe Water
Household Access to Electricity
Poverty Rate
Aceh2003 75.2 59.3 38.0 84.9 29.62010 87.2 59.2 53.9 93.3 21.0
Papuaa
2003 57.6 44.9 28.3 42.2 38.72010 53.6 46.5 36.0 50.8 36.8
National average2003 67.9 58.2 46.9 87.9 13.32010 79.8 64.8 60.9 94.2 17.4
a The 2003 figures for Papua include West Papua. For consistency, the 2010 figures for Papua also cover both provinces, with the exception of the poverty rate, which is for Papua only. The poverty rate for West Papua in 2010 was 35%.
Source: Authors’ estimates based on data from the National Socio-Economic Survey (Susenas).

The regional effects of Indonesia’s oil and gas policy: options for reform 389
the DAU, with the calculation of regional shares based on each region’s wage bill – the so-called basic allocation – and on its fiscal gap, that is, the difference between its fiscal capacity and its fiscal need. The latter tends to favour the poorer regions. Third, the subsidisation of fuel (premium gasoline, diesel, kerosene and LPG) affects regions differently depending on their consumption levels. This com-ponent favours the richer regions because they consume more fuel. The recipients of the first and second components are mainly regional governments, and only indirectly the residents of those regions through local government spending. The recipients of the third component are the consumers of fuel.
Our analysis shows that fuel subsidies in combination with oil and gas revenue sharing have three main types of regional impacts. First, Java and Sumatra (espe-cially their urban areas) have the highest levels of car ownership and consume the most fuel. These relatively well-off regions tend to benefit the most from the fuel subsidy. Second, a number of very poor regions in eastern and western Indonesia – including Aceh and Papua – are big beneficiaries of revenue sharing and other aspects of Indonesia’s fiscal decentralisation arrangements. These regions have enough resources to address their enormous development needs; the challenge for them is to spend the money well. Third, some parts of Indonesia receive lit-tle benefit from fuel subsidies and do not have natural resources. These regions include East Nusa Tenggara, West Nusa Tenggara, Maluku and parts of Sumatra and Sulawesi. They would be the main beneficiaries of fuel subsidy reform if the resulting savings were spread equitably across the country.
Until 2009, the central government bore the entire burden of fuel and other subsidies; since then, these subsidies have been deducted from the pool on which block grants to the regions are based. This means that regional governments now carry a 26% share of the cost of fuel subsidies. This reform has reduced the risk to the central government budget, but it has also made the regional distribution of the DAU less equitable.
The president has proposed reducing the cost of fuel subsidies by removing gasoline for private cars from the fuel subsidisation scheme. We have argued that this reform would improve efficiency and equity. It would effectively reallocate funds from wealthy consumers to the central and regional governments, giving them more scope to pursue pro-poor and pro-growth policies. It would lower the incentive to consume gasoline, with positive effects for both the budget and the environment. By lessening the deadweight loss to the economy from the subsidy, and by slowing environmental degradation, the reform would ease the distor-tions the subsidy creates. It would also reduce the vulnerability of the central government to fluctuations in the oil price.
The increase in the DAU pool that would flow from this reform would mainly benefit the poorer regions, at the expense of wealthy consumers in the richer regions. This would lead to a more equitable distribution of resources, and sig-nificantly reduce the efficiency losses created by the current nonsensical policy to subsidise fuel consumption.
390 Cut Dian R.D. Agustina, Wolfgang Fengler and Günther G. Schulze
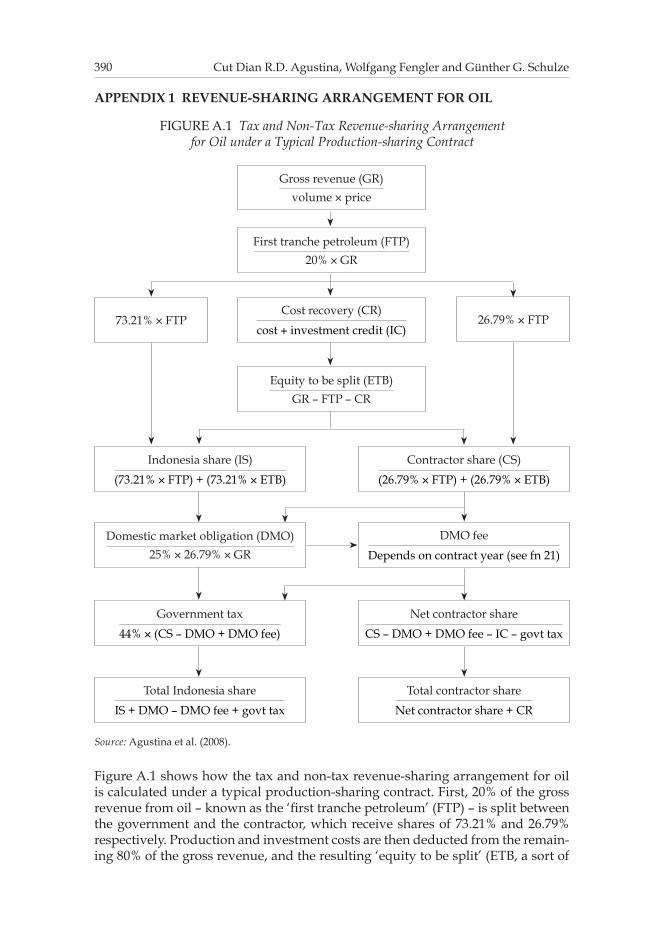
Figure A.1 shows how the tax and non-tax revenue-sharing arrangement for oil is calculated under a typical production-sharing contract. First, 20% of the gross revenue from oil – known as the ‘first tranche petroleum’ (FTP) – is split between the government and the contractor, which receive shares of 73.21% and 26.79% respectively. Production and investment costs are then deducted from the remain-ing 80% of the gross revenue, and the resulting ‘equity to be split’ (ETB, a sort of
APPENDIX 1 REVENUE-SHARING ARRANGEMENT FOR OIL
FIGURE A.1 Tax and Non-Tax Revenue-sharing Arrangement for Oil under a Typical Production-sharing Contract
Gross revenue (GR)
volume × price
First tranche petroleum (FTP)
20% × GR
Cost recovery (CR)
cost + investment credit (IC)
Equity to be split (ETB)
GR – FTP – CR
73.21% × FTP 26.79% × FTP
Indonesia share (IS)
(73.21% × FTP) + (73.21% × ETB)
Contractor share (CS)
(26.79% × FTP) + (26.79% × ETB)
Domestic market obligation (DMO)
25% × 26.79% × GR
DMO fee
Depends on contract year (see fn 21)
Government tax
44% × (CS – DMO + DMO fee)
Total Indonesia share
IS + DMO – DMO fee + govt tax
Net contractor share
CS – DMO + DMO fee – IC – govt tax
Total contractor share
Net contractor share + CR
Source: Agustina et al. (2008).

The regional effects of Indonesia’s oil and gas policy: options for reform 391
net operating profit) is again shared between the government and the contractor in the same proportions.
From the 26.79% of FTP and ETB that the contractor receives (the contractor’s share, or CS), the contractor must give a quarter to the government to serve the domestic market. This is called the domestic market obligation (DMO), for which the contractor is paid a fee (the DMO fee). The amount of this fee depends on the year in which the contract was signed.21
The proceeds accruing to the contractor – CS minus DMO plus the DMO fee – are subject to taxation. This income is taxed at the corporate tax rate of 30%; the amount net of corporate tax is then subject to a 20% dividend tax, making the effective tax rate 44%. So the effective part of the profit accruing to the contractor, ∏, is
∏ = (1 – 0.44) [α (R – C) + DMO – DMOfee] , (1)
where α is the contractor’s share (0.2679), R is total revenue and C is the total cost including investment credit (IC). The DMO is a quarter of α (R – C). If the DMO fee is a share, β, of the price of the oil surrendered under the DMO, then (1) simplifies to
∏ = 0.56 [{0.75 + β 0.25}α (R – C)] , (2)
where β = 0.1 for contracts signed in 1989 and β = 1 for contracts signed thereafter. Thus, for ‘new oil’, the share of gross profits (R – C) that the contractor receives is around 15% (α = 0.2679 and β = 1).
21 The contractor receives 20 cents per barrel for contracts signed before 1989; 10% of the current price of oil for contracts signed in 1989; and the current price for contracts signed after 1989, making the DMO no longer a tax on lifting.

392 Cut Dian R.D. Agustina, Wolfgang Fengler and Günther G. Schulze
APPENDIX 2 THE DAU FORMULA
The DAU has two components: the basic allocation (BA) and the fiscal gap (FG). The formula is constructed as follows:22
DAUi = BAi + γ FGi ,
where the subscript i indicates the district. The basic allocation makes up almost half the DAU; its most important compo-
nent is the district’s civil service wage bill, 72.3% of which is covered by the basic allocation.
The fiscal gap is the difference between a region’s expenditure needs (EN) and its fiscal capacity (FC), that is:
FGi = ENi – FCi .
Fiscal capacity is the sum of the region’s shared tax revenue (STX), shared natural resource revenue (SDA) and own-source revenue (OSR):
FCi = OSRi + STXi + SDAi .
A province’s or district’s expenditure needs are calculated as follows:
ENi = [0.3 * Population indexi + 0.1 * 1 / HDIi + 0.15 * Area indexi + 0.3 * Cost indexi + 0.15 * Regional GDP per capita indexi] * Average expenditure of sub-national government.
The population index gives the relative population size of the province or dis-trict; HDI denotes the province’s or district’s rating on the Human Development Index; the area index gives the relative area of the province or district; the cost index refers to the relative cost of construction; and the regional GDP per capita index shows GDP per capita relative to the average for all provinces or districts. The weighted sum of indexes is then multiplied by the average expenditure of the province (district) to obtain the expenditure needs of each province (district).
22 The DAU formula is laid down in Law 33/2004; see also World Bank (2008: 121). Changes to the DAU formula over time are examined in Hofman et al. (2006).

The regional effects of Indonesia’s oil and gas policy: options for reform 393
APPENDIX 3 TRANSFERS AND FUEL SUBSIDY BY PROVINCE
TABLE A.1 Oil and Gas Transfers, Fuel Subsidy and Non-Oil and Gas Transfers by Province, 2010
(Rp billion)
Oil & Gas Transfers Fuel Subsidy
Total Oil & Gas Transfers
+ Fuel Subsidy
Non-Oil & Gas
TransfersShared Revenue
Funds
General Allocation
Fund (DAU)
Aceh 1,520 866 1,447 3,833 8,251 N. Sumatra 7 1,446 4,845 6,298 13,987 W. Sumatra 0 862 1,677 2,539 7,601 Riau 8,035 235 2,863 11,133 4,416 Riau Islands 2,972 154 670 3,796 2,336 Jambi 1,031 464 1,132 2,627 4,737 S. Sumatra 3,052 663 2,275 5,991 7,935 Bangka-Belitung Islands
26 248 779 1,053 2,443
Bengkulu 0 395 457 852 3,597 Lampung 311 739 2,128 3,178 6,769 DKI Jakarta 111 54 6,389 6,554 9,859 W. Java 275 2,374 11,733 14,382 24,263 Banten 0 529 3,476 4,005 5,977 C. Java 4 2,524 7,913 10,441 23,148 DI Yogyakarta 0 395 1,126 1,521 3,558 E. Java 404 2,832 10,551 13,786 27,265 W. Kalimantan 0 755 1,271 2,026 6,923 C. Kalimantan 0 685 850 1,534 6,525 S. Kalimantan 19 520 1,348 1,887 6,517 E. Kalimantan 9,029 182 1,734 10,945 8,167 N. Sulawesi 0 549 808 1,357 5,065 Gorontalo 0 237 235 473 2,148 C. Sulawesi 7 558 665 1,230 4,963 S. Sulawesi 0 1,119 2,230 3,349 10,417 W. Sulawesi 0 231 182 413 2,086 S.E. Sulawesi 0 527 493 1,020 4,773 Bali 0 462 1,874 2,336 4,424 W. Nusa Tenggara 0 552 862 1,415 5,224 E. Nusa Tenggara 0 794 627 1,422 7,192 Maluku 1 442 401 843 4,133 N. Maluku 0 376 207 583 3,816 Papua 0 1,273 501 1,774 13,386 W. Papua 513 411 256 1,180 4,666
Total 27,316 24,455 74,007 125,778 256,566
Source: Authors’ estimates based on data from Ministry of Finance and BPH Migas.

394 Cut Dian R.D. Agustina, Wolfgang Fengler and Günther G. Schulze
APPENDIX 4 PROCEDURE TO ESTIMATE FUEL SUBSIDY SAVINGS UNDER THE PRESIDENT’S PROPOSAL
The Indonesian president has proposed removing gasoline used in private cars from the fuel subsidy scheme, to relieve the pressure on the government budget. Calculating the effect of such a reform on the level of subsidies per province is not straightforward because provincial-level data on the gasoline consumption of private cars are not available. However, we do know the number of passenger cars, motorcycles, buses and trucks registered in each province (BPS 2010), and the amount of fuel consumed by each province.23
We can then employ three assumptions produced by the Ministry of Finance (2009: table 3) to calculate the gasoline consumption of private cars per province. These assumptions are:
1 passenger cars consist of private and public (commercial) cars in a ratio of 0.9 :0.1;
2 private cars use either gasoline or diesel in a ratio of 0.8 :0.2; and3 gasoline consumption by cars and motorcycles is shared in a ratio of 0.8 :0.2.
For each province i, we know the number of cars (NCi,), the number of motor-cycles (NMi,) and the total gasoline consumption (TGCi). Based on assumptions (1) and (2), we calculate the total number of private cars using gasoline (NPCGi) as:
NPCGi = 0.9 * 0.8 NCi .
The number of public cars using gasoline (NPubCGi) is thus:
NPubCGi = 0.1 * 0.8 NCi .
The total number of cars using gasoline is therefore NCi * 0.8.Using assumptions (2) and (3), we calculate the gasoline consumption of pri-
vate cars per province in litres (Xi) as:
=+
X NPCGNC NM
TGC*0.8*0.8*0.8 *0.2
* .ii
i ii
Multiplying the private gasoline consumption per province in litres by the sub-sidy per litre (s) gives the reduction in subsidies (RSi) per province, namely:
RSi = s * Xi.
23 We are grateful to BPH Migas for providing us with data on fuel consumption by prov-ince.

The regional effects of Indonesia’s oil and gas policy: options for reform 395
REFERENCESAgustina, C.D., Arze del Granado, J., Bulman, T., Fengler, W. and Ikhsan, M. (2008) ‘Black
hole or black gold: the impact of oil and gas prices on Indonesia’s public finances’, Policy Research Working Paper 4718, World Bank, Washington DC, September.
Agustina, C.D., Ahmad, E., Nugroho, D. and Siagian, H. (2012) ‘Political economy of natural resources revenue sharing in Indonesia’, Paper submitted to a conference on Alternative Visions for Decentralization in Indonesia, Jakarta, 12–13 March, available at <http://www2.lse.ac.uk/asiaResearchCentre/_files/ARCWP55-AgustinaAhmad-NugrohoSiagian.pdf>.
BPS (Badan Pusat Statistik) (2010) Statistik Transportasi (Transportation Statistics), Jakarta, November.
Bulman, T., Fengler, W. and Ikhsan, M. (2008) ‘Indonesia’s oil subsidy opportunity’, Far Eastern Economic Review 171 (5): 14–18.
Fadliya and McLeod, R.H. (2011) ‘Fiscal transfers to regional governments in Indonesia’, Paper presented to the Decentralization and Democratization in Southeast Asia confer-ence, University of Freiburg, Freiburg, 15–17 June.
Hartono, D. and Resosudarmo, B.P. (2008) ‘The economy-wide impact of controlling energy consumption in Indonesia: an analysis using a Social Accounting Matrix framework’, Energy Policy 36 (4): 1,404–19.
Hofman, B., Kadjatmiko, Kaiser, K. and Sjahrir, B.S. (2006) ‘Evaluating fiscal equalization in Indonesia’, Policy Research Working Paper 3911, World Bank, Washington DC, May.
IMF (International Monetary Fund) (2008) ‘Fuel and food price subsidies: issues and reform options’, IMF, Washington DC, 8 September, available at <www.imf.org/external/np/pp/eng/2008/090808a.pdf>.
Lewis, B. and Oosterman, A. (2008) ‘The impact of decentralization on sub-national gov-ernment fiscal slack in Indonesia’, Public Budgeting and Finance 29 (2): 27–47.
Ministry of Finance (2009) ‘Penerapan pajak bahan bakar kendaraan bermotor berdasar-kan UU nomor 28 tahun 2009 terkait bbm bersubsidi [The implementation of vehicle tax based on Law 28/2009 on Fuel Subsidies]’ Ministry of Finance, Jakarta, available at <http://www.fiskal.depkeu.go.id/2010/adoku/2011/kajian/pkapbn/Penerapan_Pajak_Bahan_Bakar_Kendaraan_Bermotor_terkait_BBM_Bersubsidi.pdf>.
Olivia, S. and Gibson, J. (2008) ‘Household energy demand and the equity and efficiency aspects of subsidy reform in Indonesia’, Energy Journal 29 (1): 21–39.
Pitt, M. (1985) ‘Equity, externalities and energy subsidies: the case of kerosene in Indo-nesia’, Journal of Development Economics 17: 201–17.
PwC Indonesia (PricewaterhouseCoopers Indonesia) (2012) Oil and Gas in Indonesia: Invest-ment and Taxation Guide 2012, PwC Indonesia, Jakarta, May.
Republic of Indonesia (2008) Nota Keuangan dan Rancangan Anggaran Pendapatan dan Belanja Negara: Tahun Anggaran 2009 [Financial Note and Draft of State Budget: Fiscal Year 2009], Jakarta.
Republic of Indonesia (2009) Nota Keuangan dan Anggaran Pendapatan dan Belanja Negara: Tahun Anggaran 2010 [Financial Note and State Budget: Fiscal Year 2010], Jakarta.
US Embassy (2008) Petroleum Report Indonesia 2007–2008, Embassy of the United States of America, Jakarta, September.
World Bank (2008) Spending for Development: Making the Most of Indonesia’s New Opportuni-ties, Indonesia Public Expenditure Review, 3rd ed., World Bank, Washington DC.