Embed Size (px)
Citation preview
The Regional Municipality of York
2020 Long-Term Debt Management Plan
ATTACHMENT 1

REGIONAL COUNCIL
Regional CouncillorJack Heath
City of Markham
Regional CouncillorDon Hamilton
City of Markham
MayorTom Mrakas
Town of Aurora
Regional CouncillorRobert Grossi
Town of Georgina
MayorMargaret Quirk
Town of Georgina
Chairman & CEOWayne Emmerson
MayorSteve Pellegrini
Township of King
MayorVirginia Hackson
Town of East Gwillimbury
MayorFrank Scarpitti
City of Markham
Regional CouncillorJim Jones
City of Markham
Regional CouncillorJoe Li
City of Markham
MayorDavid Barrow
City of Richmond Hill
Regional CouncillorJoe DiPaola
City of Richmond Hill
Regional CouncillorCarmine Perrelli
City of Richmond Hill
MayorJohn Taylor
Town of Newmarket
Regional CouncillorTom Vegh
Town of Newmarket
Mayor Iain Lovatt
Town of Whitchurch-Stouffville
Regional CouncillorLinda Jackson
City of Vaughan
Regional CouncillorGino Rosati
City of Vaughan
Regional CouncillorMario Ferri
City of Vaughan
MayorMaurizio Bevilacqua
City of Vaughan
i
TABLE OF CONTENTS
Executive Summary 1
Background 2
1. The Long-Term Debt and Financial Obligations Needs Over a Multi-Year Period 4
2. Projections of the Annual Repayment Limit for Each Year of the Multi-Year Period
Compared to its Existing and Proposed Long-Term Debt-Related Payments
7
3. Risk and Mitigation Strategies Associated with the Long-Term Debt Strategy,
including Interest Rate Risk and Foreign Currency Exposure
9
4. Long-Term Debt and Financial Obligations Policy 16
5. Prudent and Cost-Effective Management of Existing and Projected Long- Term
Debt and Other Financial Obligations
16
6. Estimated Temporary Borrowing Needs for 2020 17
7. Evaluation and Comparison of 2019 Projections and Outcomes 17
Conclusion 18
Appendix 1: Determination of Annual Repayment Limit (ARL) 19
The Regional Municipality of York
2020 Long-Term Debt Management Plan
2020 Long-Term Debt Management Plan 1
2020 Long-Term Debt Management Plan
Executive Summary
Council’s annual affirmation of the Long-Term Debt Management Plan is one of the two
conditions required in order for York Region to access the growth-related cost supplement
component of its Annual Repayment Limit (ARL). This supplement allows York, if it wishes,
to borrow more than it would otherwise be permitted under provincial regulations.
Although the 10-year debt projection prepared as part of the 2020 Budget does not envisage
the need to use the supplement, the additional flexibility provided by it would allow York
Region to finance other major projects not currently reflected in its proposed 10-year capital
plan. As a result of York maintaining its Aaa credit rating with Moody’s Investor Service and
its AA+ credit rating from S&P Global Ratings in 2019, it has already satisfied the second
condition required under the regulation.
The 2020 Long-Term Debt Management Plan uses a revised development charge collections
forecast. The new forecast shows that collections could be reduced by $521 million to $3.3
billion over the next 10 years. This is the result of lower than previously anticipated
development activities and changes to provincial legislation. Consequently, there is an
increase in anticipated debt requirements of $611 million during this period. As in prior years,
no new tax or rate-supported debt is forecasted.
Total reserves are expected to grow moderately and could reach $5.1 billion by 2029.
2020 Long-Term Debt Management Plan 2
Background
Municipalities in Ontario may only issue debt for capital purposes. The Province regulates
the amount of municipal debt and other financial obligations through an annual repayment
limit regulation (ARL) under the Municipal Act, 2001.
In 2011, the Province recognized that York Region is a high growth municipality with unique
debt requirements and provided a York-specific regulation that allows it to borrow a higher
amount based on its development charge collections. The York-specific regulation expires on
December 31, 2021.
The annual repayment limit restricts the aggregate annual cost of servicing the anticipated
long-term debt and financial obligations of a municipality to 25 per cent of its own source
revenue plus, in the case of York Region alone, a growth cost supplement equal to 80 per
cent of the average of the last three fiscal years of development charge collections. The
combination of the annual repayment limit and the growth cost supplement is called the
growth-related annual repayment limit, but will be referred to as the annual repayment limit in
this plan.
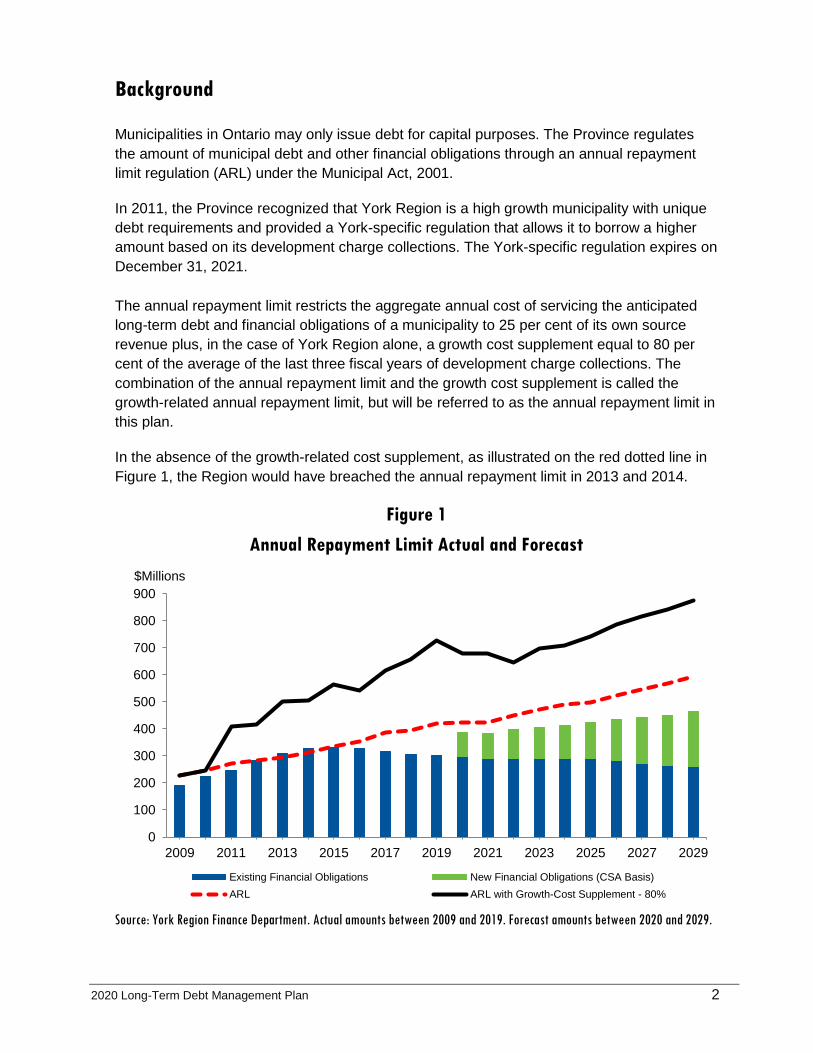
In the absence of the growth-related cost supplement, as illustrated on the red dotted line in
Figure 1, the Region would have breached the annual repayment limit in 2013 and 2014.
Figure 1
Annual Repayment Limit Actual and Forecast
Source: York Region Finance Department. Actual amounts between 2009 and 2019. Forecast amounts between 2020 and 2029.
0
100
200
300
400
500
600
700
800
900
2009 2011 2013 2015 2017 2019 2021 2023 2025 2027 2029
$Millions
Existing Financial Obligations New Financial Obligations (CSA Basis)
ARL ARL with Growth-Cost Supplement - 80%
2020 Long-Term Debt Management Plan 3
The Region meets both conditions to qualify for the growth-related cost
supplement
To qualify for the growth-related cost supplement, the Region is required to meet two
conditions on an annual basis:
1. Maintain at least an Aa3 from Moody’s Investor Service or AA– from S&P Global
Ratings (or equivalent) credit rating; and
2. As part of the preparation of its budget for the fiscal year, Council adopts or affirms a
plan for the management of its long-term debt and financial obligations.
As of October 2019, the Region had met the first condition by maintaining an Aaa credit
rating with Moody’s Investor Service and receiving a AA+ credit rating from S&P Global
Ratings.
To meet the second condition, the Province requires Regional Council to consider the
following items as part of its long-term debt management plan:
1. The long-term debt and financial obligations needs over a multi-year period;
2. Projections of the annual repayment limit for each year of the multi-year period
compared to its existing and proposed long-term debt-related payments;
3. Risk and mitigation strategies associated with the long-term debt strategy;
4. A long-term debt and financial obligations policy;
5. Prudent and cost-effective management of existing and projected long-term debt and
other financial obligations;
6. Estimated temporary borrowing needs for 2020; and
7. Evaluation and comparison of 2019 projections and outcomes.
2020 Long-Term Debt Management Plan 4
1. The Long-Term Debt and Financial Obligations Needs Over a Multi-Year
Period
The fiscal strategy guided the preparation of the 2020 Budget
When preparing the 2020 Budget, staff followed the principles of the fiscal strategy, which
was first approved by Council for the 2014 Budget, to help better manage the Region’s
financial resources. A major tenet of this strategy is to use a more balanced approach when
funding long-term capital expenditure. To accomplish this, there is a detailed annual review
of both the forecasted capital expenditure and the funding sources. Where necessary, the
level of expenditures may be adjusted to better match available funding, while maintaining
overall capital priorities.
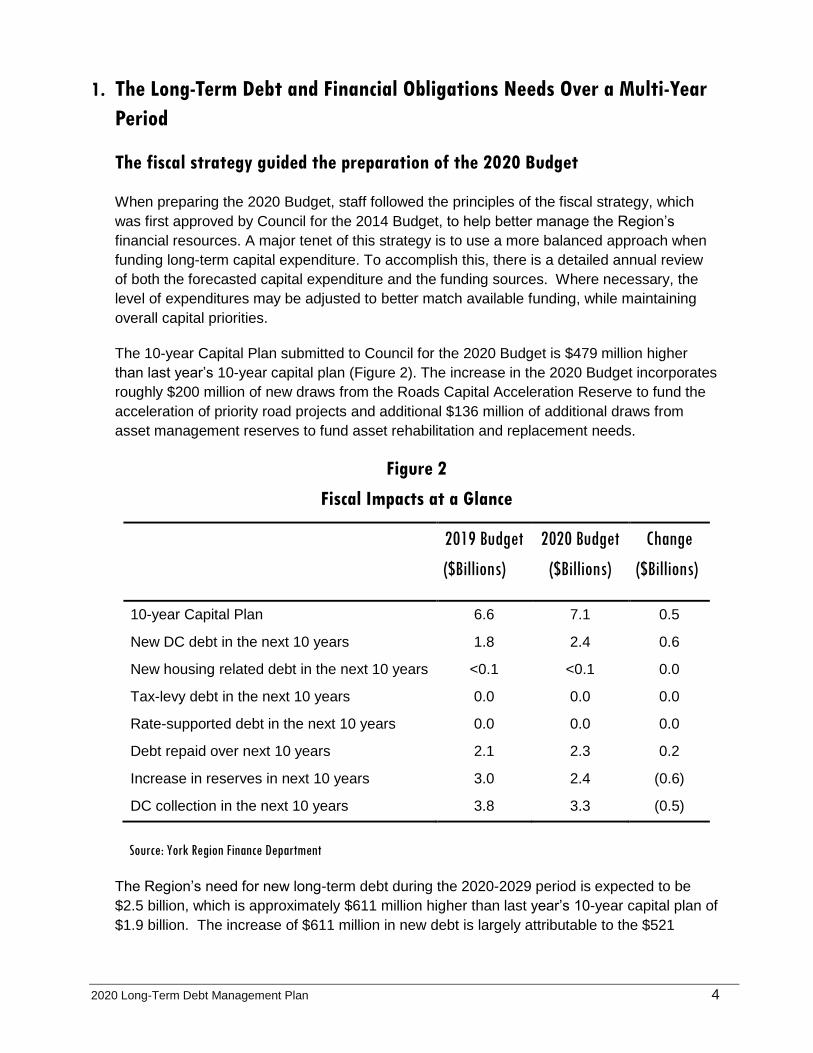
The 10-year Capital Plan submitted to Council for the 2020 Budget is $479 million higher
than last year’s 10-year capital plan (Figure 2). The increase in the 2020 Budget incorporates
roughly $200 million of new draws from the Roads Capital Acceleration Reserve to fund the
acceleration of priority road projects and additional $136 million of additional draws from
asset management reserves to fund asset rehabilitation and replacement needs.
Figure 2
Fiscal Impacts at a Glance
2019 Budget
($Billions)
2020 Budget
($Billions)
Change
($Billions)
10-year Capital Plan 6.6 7.1 0.5
New DC debt in the next 10 years 1.8 2.4 0.6
New housing related debt in the next 10 years <0.1 <0.1 0.0
Tax-levy debt in the next 10 years 0.0 0.0 0.0
Rate-supported debt in the next 10 years 0.0 0.0 0.0
Debt repaid over next 10 years 2.1 2.3 0.2
Increase in reserves in next 10 years 3.0 2.4 (0.6)
DC collection in the next 10 years 3.8 3.3 (0.5)
Source: York Region Finance Department
The Region’s need for new long-term debt during the 2020-2029 period is expected to be
$2.5 billion, which is approximately $611 million higher than last year’s 10-year capital plan of
$1.9 billion. The increase of $611 million in new debt is largely attributable to the $521
2020 Long-Term Debt Management Plan 5
million decline of development charge collections to $3.3 billion. The 2020 development
charge collection forecast is discussed in more detail in section 3 of this plan.
The use of tax levy Debt Reduction Reserve will avoid approximately $436 million of new tax
levy debt over the next 10 years.
The phase-in of full cost recovery for water and wastewater services that began in 2016 is
expected to permit the Region to continue avoid issuing new user rate debt.
Overall reliance on debt increases in the next 10 years
The Region’s overall reliance on new debt in the 10-year 2020 Capital Plan increases due to
a lower development charge collections forecast. As the development charge collections
forecast is highly dependent on the growth assumptions being used, staff used a more
conservative growth forecast when preparing the 2020 Budget to help reduce financial risk
including the need to incur unanticipated debt and/or defer capital projects.
Capital spending authority is based on existing and future project commitments. Capital
spending authority provides Council’s authorization for departments to proceed with capital
projects, including multi-year projects. The Region must have enough debt room when
capital spending authority is approved to remain within its provincially-mandated annual
repayment limit.
Approximately $1.1 billion (or 45 per cent) of the $2.5 billion in projected debenture
requirements has been included within the capital spending authority for 2020, as illustrated
on Figure 3. This amount includes carry forward of unused capital spending authority from
2019. In contrast, approximately $363 million (or 18 per cent) of the $1.9 billion in the
projected debenture requirements was included within the capital spending authority for
2019.
The capital plan also contains projects with an estimated debt of about $1.4 billion that are
planned, but do not yet have capital spending authority. For the purposes of this Debt
Management Plan, Finance has estimated the future debt requirements for each year of the
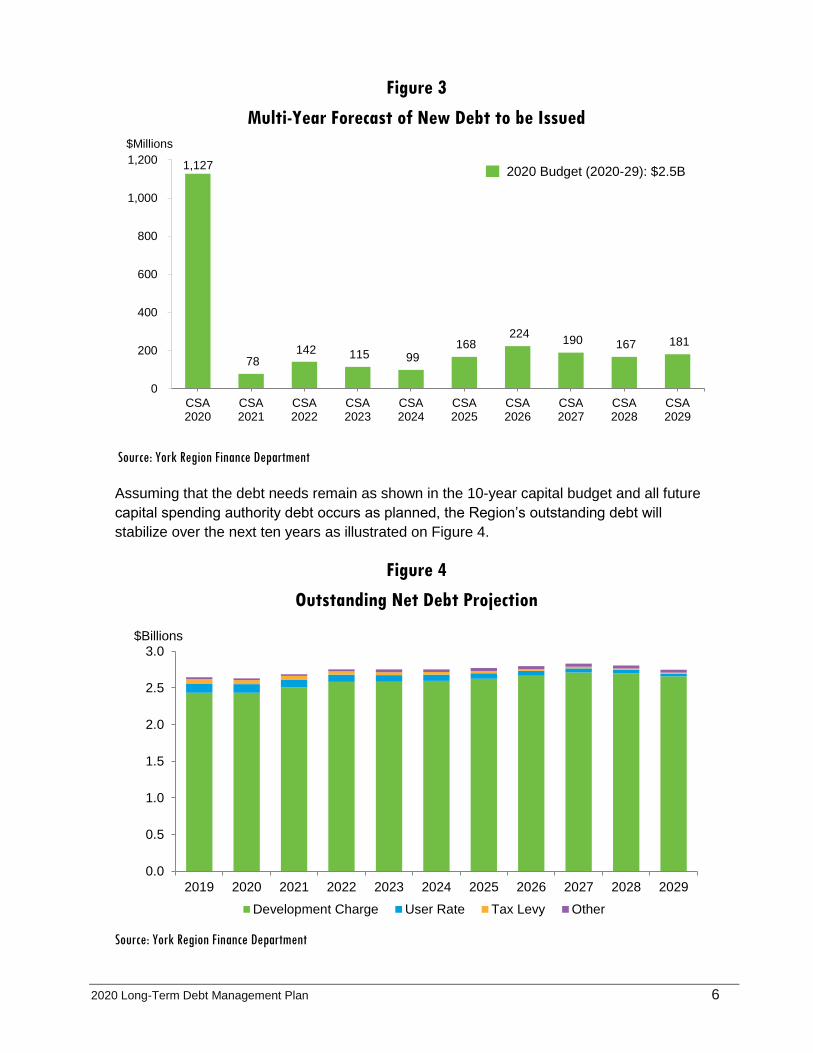
plan on a capital spending authority basis1. Figure 3 illustrates the amount of new debt to be
issued on a capital spending authority (CSA) basis. For example, the Region will seek
Council authorization to issue $1.1 billion of new debt to commit to capital projects within the
capital spending authority for 2020. However, the actual capital expenditure associated with
this debt is expected to flow over 10 years: $177 million in 2020, $205 million in 2021, $155
million in 2022, $123 million in 2023, $123 million in 2024, $107 million in 2025, $99 million in
2026, $75 million in 2027, $44 million in 2028 and $19 million in 2028.
1 Capital Spending Authority (CSA) is the authority from Council to commit funding to a capital project.
The authority may span several years for multiyear projects and is based on departmental spending estimates. The 2020 Budget will approve one year of multi-year capital spending authority for 2020.
2020 Long-Term Debt Management Plan 6
Figure 3
Multi-Year Forecast of New Debt to be Issued
Source: York Region Finance Department
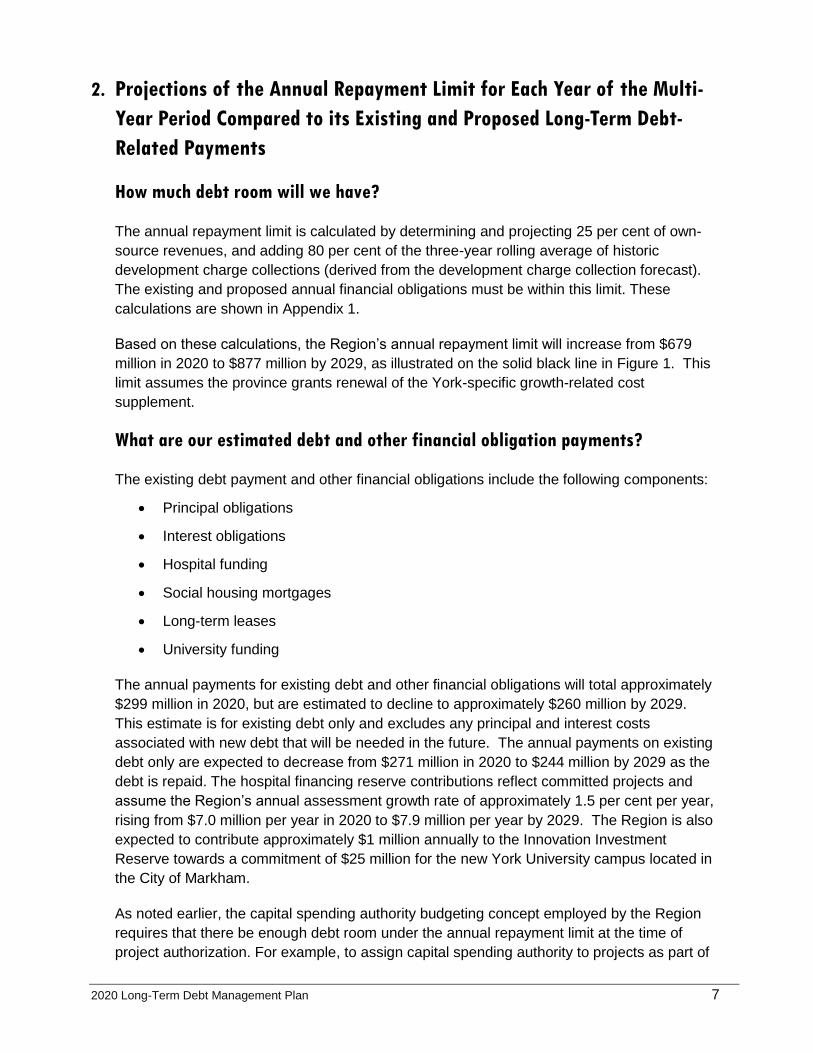
Assuming that the debt needs remain as shown in the 10-year capital budget and all future
capital spending authority debt occurs as planned, the Region’s outstanding debt will
stabilize over the next ten years as illustrated on Figure 4.
Figure 4
Outstanding Net Debt Projection
Source: York Region Finance Department
1,127
78 142 115 99
168 224
190 167 181
0
200
400
600
800
1,000
1,200
CSA2020
CSA2021
CSA2022
CSA2023
CSA2024
CSA2025
CSA2026
CSA2027
CSA2028
CSA2029
$Millions
2020 Budget (2020-29): $2.5B
0.0
0.5
1.0
1.5
2.0
2.5
3.0
2019 2020 2021 2022 2023 2024 2025 2026 2027 2028 2029
$Billions
Development Charge User Rate Tax Levy Other
2020 Budget (2020-29): $2.5B
2020 Long-Term Debt Management Plan 7
2. Projections of the Annual Repayment Limit for Each Year of the Multi-
Year Period Compared to its Existing and Proposed Long-Term Debt-
Related Payments
How much debt room will we have?
The annual repayment limit is calculated by determining and projecting 25 per cent of own-
source revenues, and adding 80 per cent of the three-year rolling average of historic
development charge collections (derived from the development charge collection forecast).
The existing and proposed annual financial obligations must be within this limit. These
calculations are shown in Appendix 1.
Based on these calculations, the Region’s annual repayment limit will increase from $679
million in 2020 to $877 million by 2029, as illustrated on the solid black line in Figure 1. This
limit assumes the province grants renewal of the York-specific growth-related cost
supplement.
What are our estimated debt and other financial obligation payments?
The existing debt payment and other financial obligations include the following components:
Principal obligations
Interest obligations
Hospital funding
Social housing mortgages
Long-term leases
University funding
The annual payments for existing debt and other financial obligations will total approximately
$299 million in 2020, but are estimated to decline to approximately $260 million by 2029.
This estimate is for existing debt only and excludes any principal and interest costs
associated with new debt that will be needed in the future. The annual payments on existing
debt only are expected to decrease from $271 million in 2020 to $244 million by 2029 as the
debt is repaid. The hospital financing reserve contributions reflect committed projects and
assume the Region’s annual assessment growth rate of approximately 1.5 per cent per year,
rising from $7.0 million per year in 2020 to $7.9 million per year by 2029. The Region is also
expected to contribute approximately $1 million annually to the Innovation Investment
Reserve towards a commitment of $25 million for the new York University campus located in
the City of Markham.
As noted earlier, the capital spending authority budgeting concept employed by the Region
requires that there be enough debt room under the annual repayment limit at the time of
project authorization. For example, to assign capital spending authority to projects as part of
2020 Long-Term Debt Management Plan 8
the 2020 budget process, the Region must have sufficient room under its 2020 annual
repayment limit to recognize the full financial cost of the projects “as if” they were going to be
incurred entirely in 2020, even if the actual costs are spread out over multiple years. This is
the case for each year of the capital plan.
The 10-year capital plan in the proposed 2020 Budget is $7.1 billion, of which $2.5 billion will
be debt financed. Assuming a weighted average annual interest rate of 3.92 per cent and a
term of 20 years, the annual obligation arising from the $1.1 billion debt capital spending
authority required in 2020 will be approximately $88 million.2
The annual debt payments related to each year’s increment have been calculated on the
same basis as the 2020 capital spending authority, except that the assumed weighted
average interest rate is projected to increase to 4.50 per cent by 2029. As a result, the
financial obligations associated with new debt-related capital spending authority will increase
to $203 million by 2029.
Will the Region be within its annual repayment limit?
Figure 1 shows that the Region’s financial obligations will be well within its annual repayment
limit for all years.
Based on the proposed debt capital spending authority for 2020, discussed previously, the
Region will also be well within its annual repayment limit, as shown in Figure 5 below.
Figure 5
Region’s 2020 Annual Repayment Limit Calculation ($Millions)
Component Description Forecast 2020
25% of Own Source Revenues 423
Plus: Growth Cost Supplement3 256
Total Annual Repayment Limit 679
Less: Existing Debt Payment and Financial
Obligations
299
Less: Anticipated New Debt Payment 88
Remaining Annual Repayment Limit 292
Source: York Region Finance Department
2 The 2020 repayment obligation of $88 million is based on the weighted average interest rate based
on a review of current and historic rates as well as planned capital spending authority cash flow timing. The 20-year term is based on the anticipated average term of future debt issues. Debt repayment is calculated on a “full commitment basis”, which allocates a full year’s payment to the year of issuance rather than the partial (i.e., interest only) payment that usually occurs as a result of issuance timing. 3 Growth Cost Supplement in 2020 is calculated at 80 per cent of the 3-year rolling average of
development charge collections (2017-2019 inclusive).
2020 Long-Term Debt Management Plan 9
3. Risk and Mitigation Strategies Associated with the Long-Term Debt
Strategy, including Interest Rate Risk and Foreign Currency Exposure
Anticipated development charge collections represent one of the most significant
risks to debt management
The annual repayment limit is calculated by determining and projecting 25 per cent of own-
source revenues, and adding 80 per cent of the three-year rolling average of historic
development charge collections (derived from the development charge collection forecast).
Development charge collections are difficult to predict from one year to the next and can vary
significantly as economic conditions change over time. Collections lower than forecast could
limit the Region’s debt borrowing ability to levels below that indicated in this plan and require
changes in the phasing of the capital plan. Staff reviews development charge collection
trends and forecasts annually to enable further changes before finalization of the capital plan
during the budget process.
This year’s long-term development charge collections forecast also takes into account the
anticipated impact of Bill 108, the More Homes, More Choice Act, 2019. Bill 108 is expected
to result in delayed cash flow and potential permanent revenue loss. Bill 108 also introduced
a new regime for funding certain growth-related services called Community Benefits
Charges. For York Region, Community Benefits Charges will replace development charges
to fund public health, court services, senior services, and social housing.
Although Bill 108 received Royal Assent in June 2019, as of November 2019 it had not yet
been proclaimed and related regulations were still under development. As well, in November
2019 the province tabled Bill 138, which could further amend Bill 108. Given these
uncertainties, the Region’s estimate of potential impacts, which is based on information
available as the Fiscal Strategy was developed, may be subject to change.
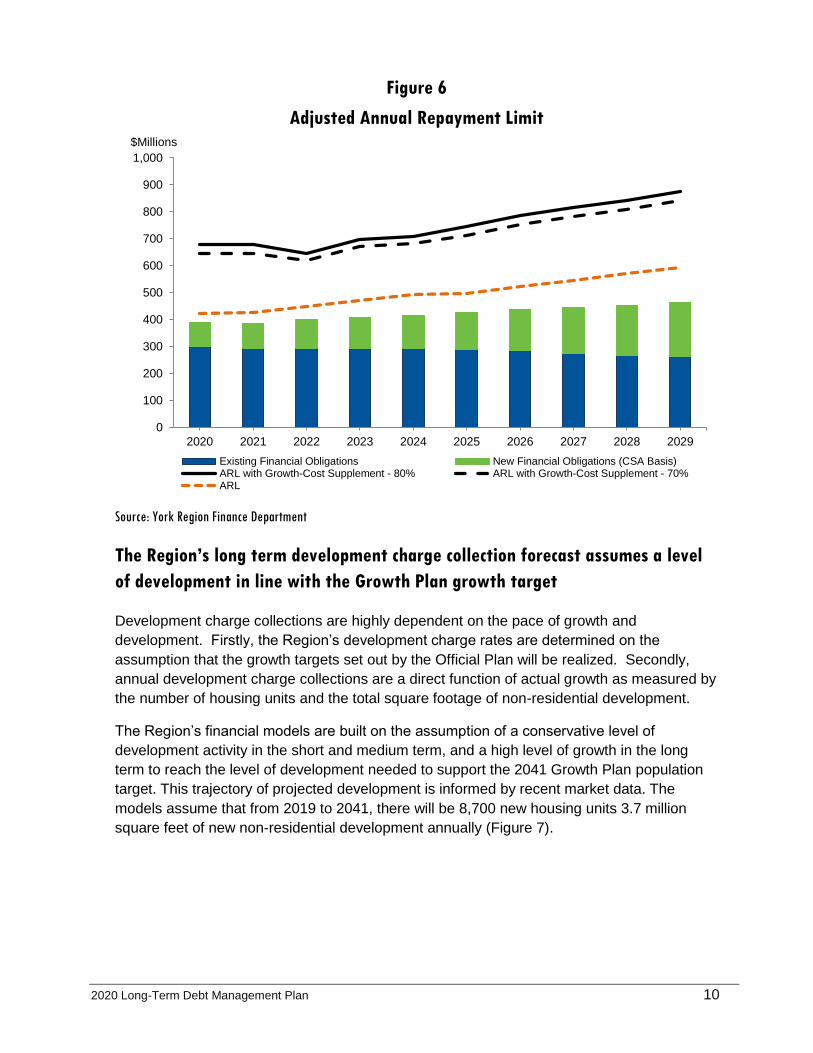
The capital plan is measured against an adjusted annual repayment limit
As a matter of normal practice, the capital plan is measured against an adjusted annual
repayment limit that uses only 70 per cent of the three-year rolling average of historic
development charge collections as a cost supplement, versus the 80 per cent permitted,
unless specific Council approval is obtained to do otherwise. This would have the effect of
partially mitigating the impact of lower than expected development charge collections. The
impact on the annual repayment limit calculations of the adjusted annual repayment limit that
uses only 70 per cent of the three-year rolling average of historic development charge
collections as a cost supplement is illustrated on Figure 6, which shows that the Region’s
obligations would still be well within its annual repayment limit even if only 70 per cent of
forecast development charge collections are considered as a cost supplement.
2020 Long-Term Debt Management Plan 10
Figure 6
Adjusted Annual Repayment Limit
Source: York Region Finance Department
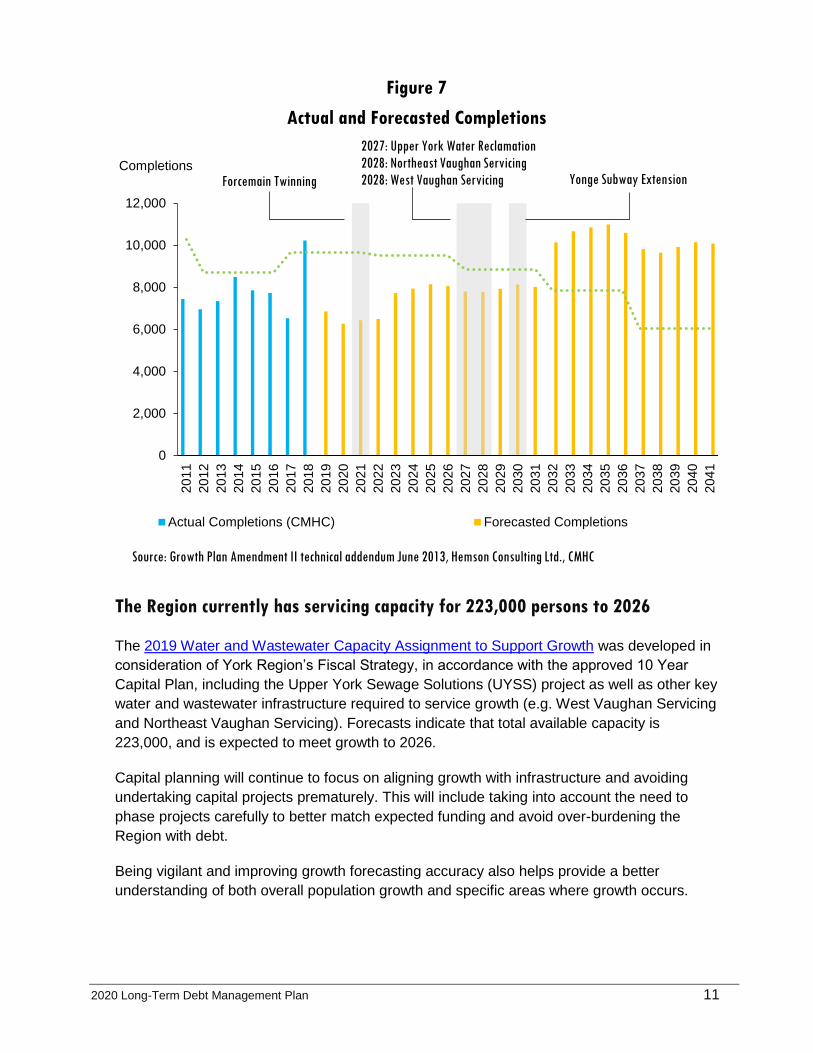
The Region’s long term development charge collection forecast assumes a level
of development in line with the Growth Plan growth target
Development charge collections are highly dependent on the pace of growth and
development. Firstly, the Region’s development charge rates are determined on the
assumption that the growth targets set out by the Official Plan will be realized. Secondly,
annual development charge collections are a direct function of actual growth as measured by
the number of housing units and the total square footage of non-residential development.
The Region’s financial models are built on the assumption of a conservative level of
development activity in the short and medium term, and a high level of growth in the long
term to reach the level of development needed to support the 2041 Growth Plan population
target. This trajectory of projected development is informed by recent market data. The
models assume that from 2019 to 2041, there will be 8,700 new housing units 3.7 million
square feet of new non-residential development annually (Figure 7).
0
100
200
300
400
500
600
700
800
900
1,000
2020 2021 2022 2023 2024 2025 2026 2027 2028 2029
$Millions
Existing Financial Obligations New Financial Obligations (CSA Basis)ARL with Growth-Cost Supplement - 80% ARL with Growth-Cost Supplement - 70%ARL
2020 Long-Term Debt Management Plan 11
Figure 7
Actual and Forecasted Completions
The Region currently has servicing capacity for 223,000 persons to 2026
The 2019 Water and Wastewater Capacity Assignment to Support Growth was developed in
consideration of York Region’s Fiscal Strategy, in accordance with the approved 10 Year
Capital Plan, including the Upper York Sewage Solutions (UYSS) project as well as other key
water and wastewater infrastructure required to service growth (e.g. West Vaughan Servicing
and Northeast Vaughan Servicing). Forecasts indicate that total available capacity is
223,000, and is expected to meet growth to 2026.
Capital planning will continue to focus on aligning growth with infrastructure and avoiding
undertaking capital projects prematurely. This will include taking into account the need to
phase projects carefully to better match expected funding and avoid over-burdening the
Region with debt.
Being vigilant and improving growth forecasting accuracy also helps provide a better
understanding of both overall population growth and specific areas where growth occurs.
0
2,000
4,000
6,000
8,000
10,000
12,000
20
11
20
12
20
13
20
14
20
15
20
16
20
17
20
18
20
19
20
20
20
21
20
22
20
23
20
24
20
25
20
26
20
27
20
28
20
29
20
30
20
31
20
32
20
33
20
34
20
35
20
36
20
37
20
38
20
39
20
40
20
41
Completions
Actual Completions (CMHC) Forecasted Completions
Source: Growth Plan Amendment II technical addendum June 2013, Hemson Consulting Ltd., CMHC
2027: Upper York Water Reclamation
2028: Northeast Vaughan Servicing
2028: West Vaughan Servicing Yonge Subway Extension Forcemain Twinning
2020 Long-Term Debt Management Plan 12
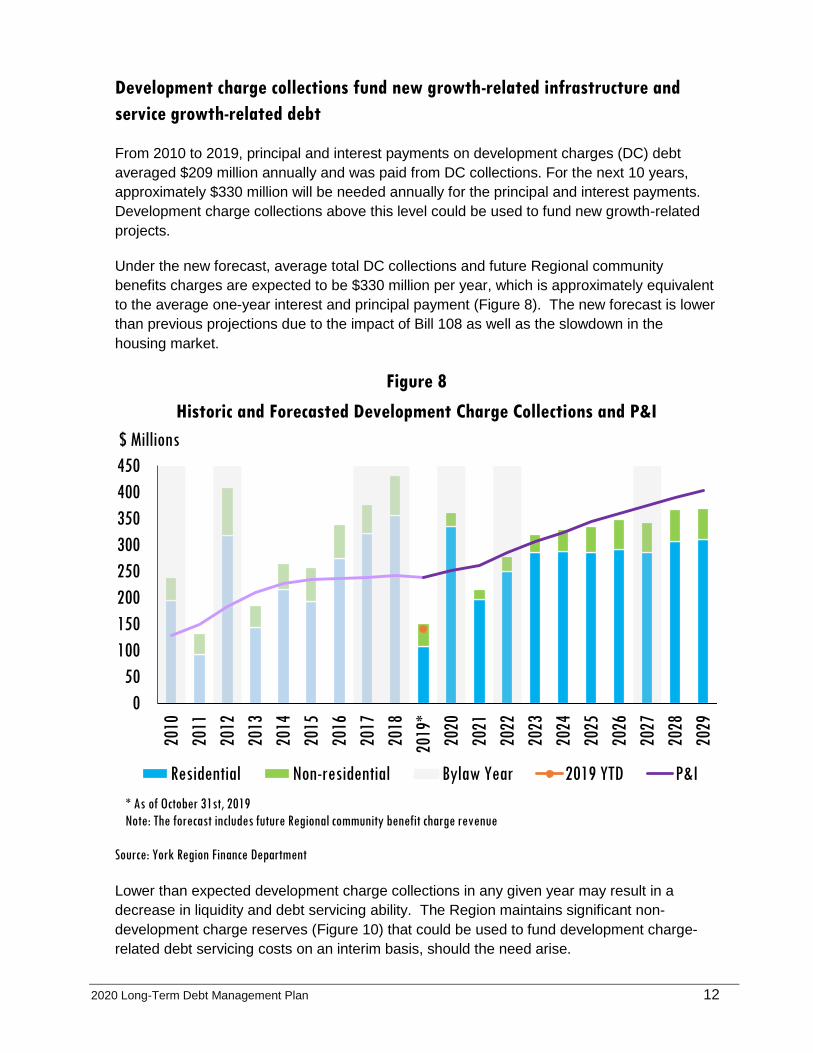
Development charge collections fund new growth-related infrastructure and
service growth-related debt
From 2010 to 2019, principal and interest payments on development charges (DC) debt
averaged $209 million annually and was paid from DC collections. For the next 10 years,
approximately $330 million will be needed annually for the principal and interest payments.
Development charge collections above this level could be used to fund new growth-related
projects.
Under the new forecast, average total DC collections and future Regional community
benefits charges are expected to be $330 million per year, which is approximately equivalent
to the average one-year interest and principal payment (Figure 8). The new forecast is lower
than previous projections due to the impact of Bill 108 as well as the slowdown in the
housing market.
Figure 8
Historic and Forecasted Development Charge Collections and P&I
Source: York Region Finance Department
Lower than expected development charge collections in any given year may result in a
decrease in liquidity and debt servicing ability. The Region maintains significant non-
development charge reserves (Figure 10) that could be used to fund development charge-
related debt servicing costs on an interim basis, should the need arise.
0
50
100
150
200
250
300
350
400
450
2010
2011
2012
2013
2014
2015
2016
2017
2018
2019
*
2020
2021
2022
2023
2024
2025
2026
2027
2028
2029
$ Millions
Residential Non-residential Bylaw Year 2019 YTD P&I
* As of October 31st, 2019
Note: The forecast includes future Regional community benefit charge revenue
2020 Long-Term Debt Management Plan 13
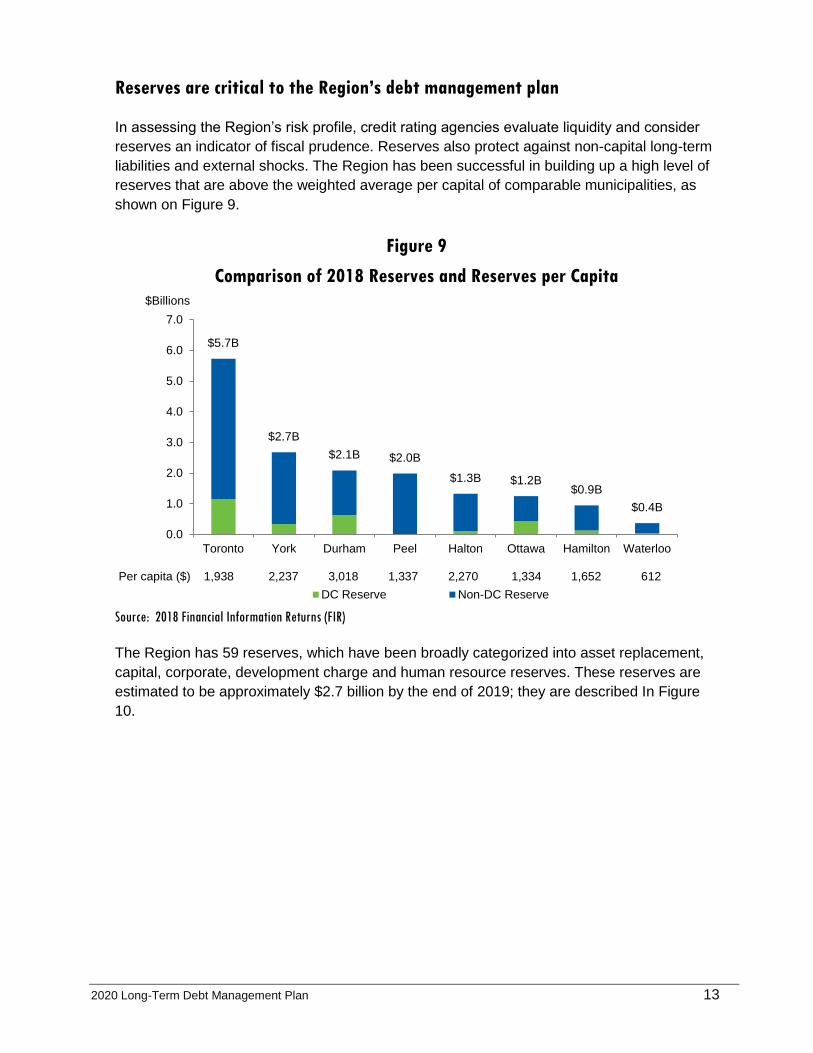
Reserves are critical to the Region’s debt management plan
In assessing the Region’s risk profile, credit rating agencies evaluate liquidity and consider
reserves an indicator of fiscal prudence. Reserves also protect against non-capital long-term
liabilities and external shocks. The Region has been successful in building up a high level of
reserves that are above the weighted average per capital of comparable municipalities, as
shown on Figure 9.
Figure 9
Comparison of 2018 Reserves and Reserves per Capita
Source: 2018 Financial Information Returns (FIR)
The Region has 59 reserves, which have been broadly categorized into asset replacement,
capital, corporate, development charge and human resource reserves. These reserves are
estimated to be approximately $2.7 billion by the end of 2019; they are described In Figure
10.
$5.7B
$2.7B
$2.1B $2.0B
$1.3B $1.2B $0.9B
$0.4B
0.0
1.0
2.0
3.0
4.0
5.0
6.0
7.0
Toronto York Durham Peel Halton Ottawa Hamilton Waterloo
$Billions
DC Reserve Non-DC Reserve
Per capita ($) 1,938 2,237 3,018 1,337 2,270 1,334 1,652 612
2020 Long-Term Debt Management Plan 14
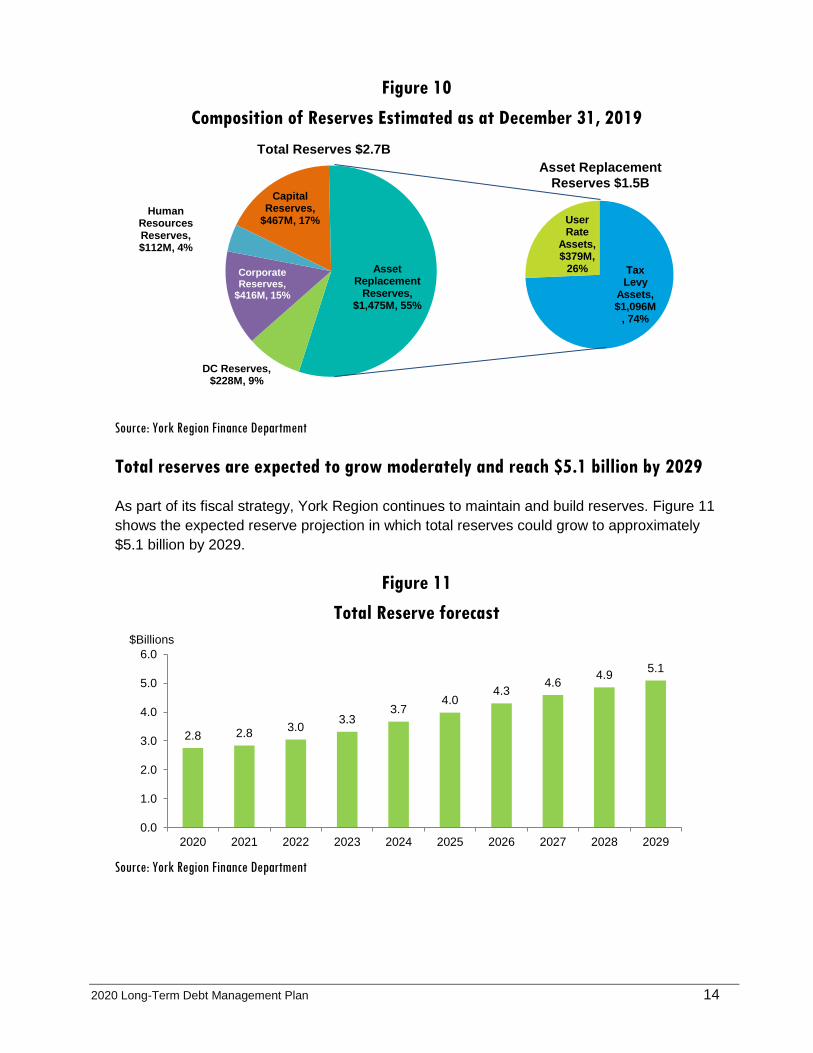
Figure 10
Composition of Reserves Estimated as at December 31, 2019
Source: York Region Finance Department
Total reserves are expected to grow moderately and reach $5.1 billion by 2029
As part of its fiscal strategy, York Region continues to maintain and build reserves. Figure 11
shows the expected reserve projection in which total reserves could grow to approximately
$5.1 billion by 2029.
Figure 11
Total Reserve forecast
Source: York Region Finance Department
2.8 2.8 3.0
3.3 3.7
4.0 4.3
4.6 4.9
5.1
0.0
1.0
2.0
3.0
4.0
5.0
6.0
2020 2021 2022 2023 2024 2025 2026 2027 2028 2029
$Billions
Capital Reserves,
$467M, 17%
Asset Replacement
Reserves, $1,475M, 55%
DC Reserves, $228M, 9%
Corporate Reserves,
$416M, 15%
Human Resources Reserves, $112M, 4%
Tax Levy
Assets, $1,096M
, 74%
User Rate
Assets, $379M,
26%
Total Reserves $2.7B
Asset Replacement
Reserves $1.5B
2020 Long-Term Debt Management Plan 15
York Region is a net investor in 2019
In the 2019 fiscal strategy, the Region was expected to be a net investor by 2020; however
the current forecast now indicates that the target will be achieved one year earlier, in 2019. A
ratio greater than 100 per cent indicates the Region is a net “investor” as opposed to a net
“borrower.”
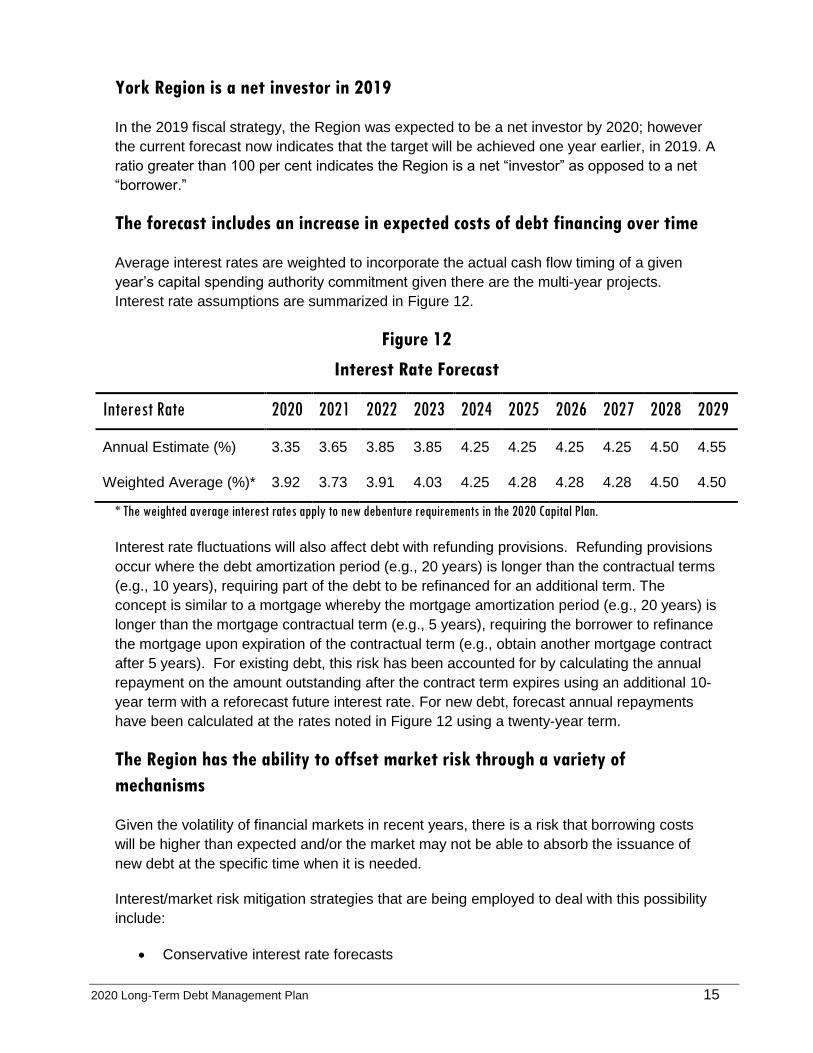
The forecast includes an increase in expected costs of debt financing over time
Average interest rates are weighted to incorporate the actual cash flow timing of a given
year’s capital spending authority commitment given there are the multi-year projects.
Interest rate assumptions are summarized in Figure 12.
Figure 12
Interest Rate Forecast
Interest Rate 2020 2021 2022 2023 2024 2025 2026 2027 2028 2029
Annual Estimate (%) 3.35 3.65 3.85 3.85 4.25 4.25 4.25 4.25 4.50 4.55
Weighted Average (%)* 3.92 3.73 3.91 4.03 4.25 4.28 4.28 4.28 4.50 4.50
* The weighted average interest rates apply to new debenture requirements in the 2020 Capital Plan.
Interest rate fluctuations will also affect debt with refunding provisions. Refunding provisions
occur where the debt amortization period (e.g., 20 years) is longer than the contractual terms
(e.g., 10 years), requiring part of the debt to be refinanced for an additional term. The
concept is similar to a mortgage whereby the mortgage amortization period (e.g., 20 years) is
longer than the mortgage contractual term (e.g., 5 years), requiring the borrower to refinance
the mortgage upon expiration of the contractual term (e.g., obtain another mortgage contract
after 5 years). For existing debt, this risk has been accounted for by calculating the annual
repayment on the amount outstanding after the contract term expires using an additional 10-
year term with a reforecast future interest rate. For new debt, forecast annual repayments
have been calculated at the rates noted in Figure 12 using a twenty-year term.
The Region has the ability to offset market risk through a variety of
mechanisms
Given the volatility of financial markets in recent years, there is a risk that borrowing costs
will be higher than expected and/or the market may not be able to absorb the issuance of
new debt at the specific time when it is needed.
Interest/market risk mitigation strategies that are being employed to deal with this possibility
include:
Conservative interest rate forecasts
2020 Long-Term Debt Management Plan 16
Use of bond forward agreements to hedge interest costs on new debt issues when
appropriate
Pre-financing of capital projects where it is financially beneficial to do so
Borrowing applications to government agencies such as Infrastructure Ontario
Use of variable rate debt/lines of credit or short-term borrowing from reserves in the
event of market disruption or in anticipation of significantly lower interest rates
Use of underwriting syndicates
An active Investor Relations program
Structuring new debt to better meet the needs of potential investors.
The debt management plan has other risks
Other risks relate to the forecast of capital infrastructure costs. Factors such as change
orders, inflation, the addition of new projects, or projects being moved forward in the capital
plan could result in higher debt requirements than are anticipated in this Plan. To address
this risk, phase-in strategies for large capital projects will be considered when appropriate.
4. Long-Term Debt and Financial Obligations Policy
Council has approved a Capital Financing and Debt Policy that guides the overall
management of the Region’s current and expected financing needs and underpins this long-
term debt management plan. This policy, last updated and approved by Council in February
2019, is reviewed annually to identify and incorporate best practices.
The policy covers all long-term financial obligations entered into by the Region. It establishes
objectives, standards of care, authorized financing instruments, and reporting requirements
and responsibilities, so as to ensure that the Region’s infrastructure needs are financed as
effectively as possible.
5. Prudent and Cost-Effective Management of Existing and Projected Long-
Term Debt and Other Financial Obligations
The Capital Financing and Debt Policy sets out provisions to manage existing and projected
long-term debt and other financial obligations in the most prudent and cost-effective manner
possible.
These provisions include:
Parameters and risk considerations for financing leases, which can be used in certain
circumstances where long-term debt financing is neither feasible nor appropriate (i.e.,
lease versus buy)
2020 Long-Term Debt Management Plan 17
Diversification and optimization of the term structure of debentures through a review
of interest rate curves
Limiting the term of financing to the lesser of the anticipated useful life of the
underlying asset or the period over which repayment will occur
Ensuring a high standard of care by ensuring that staff are sufficiently knowledgeable
with respect to standard financing transactions and/or the use of outside advice when
necessary
Maintaining an investor relations program to increase market awareness and boost
demand for Regional debentures
Maintaining at least a AA- credit rating to minimize interest costs and maximize
access to capital markets
Use of an underwriting syndicate to facilitate the marketing and selling of debenture
issues.
6. Estimated Temporary Borrowing Needs for 2020
Temporary borrowing needs arise from the need to finance operational expenditures pending
receipt of taxes and other revenues and the need to finance capital expenditures until long-
term financing is in place.
The Region’s temporary borrowing requirements are addressed in detail under a separate
report to Council. In 2020, it is estimated that approximately $465 million will be required for
operating needs. Temporary borrowing can also result from the need to interim finance
capital expenditures until long-term financing is in place. In 2020, it is estimated that
approximately $300 million will be required for interim capital financing.
Similar to long-term debt and financial obligations, the Province limits the amount of funding
used for temporary borrowing needs to 50 per cent of budgeted total revenue from January
to September of the previous year and 25 per cent from October to December.4 The Region’s
estimated temporary borrowing needs noted above are well within these limits. It is Regional
policy to fund these short-term needs out of reserves and this is expected to continue in
2020. Any funds borrowed from reserves are always paid back during the year of borrowing
with interest at the same rate that would have been earned on the corresponding reserves.
7. Evaluation and Comparison of 2019 Projections and Outcomes
As Figure 13 shows, the Region was in compliance with its annual repayment limit for 2019.
4 Temporary borrowing provisions are set out in Sections 405 and 407 of the Municipal Act, 2001.
Temporary borrowings are not part of the annual repayment limit calculations.
2020 Long-Term Debt Management Plan 18
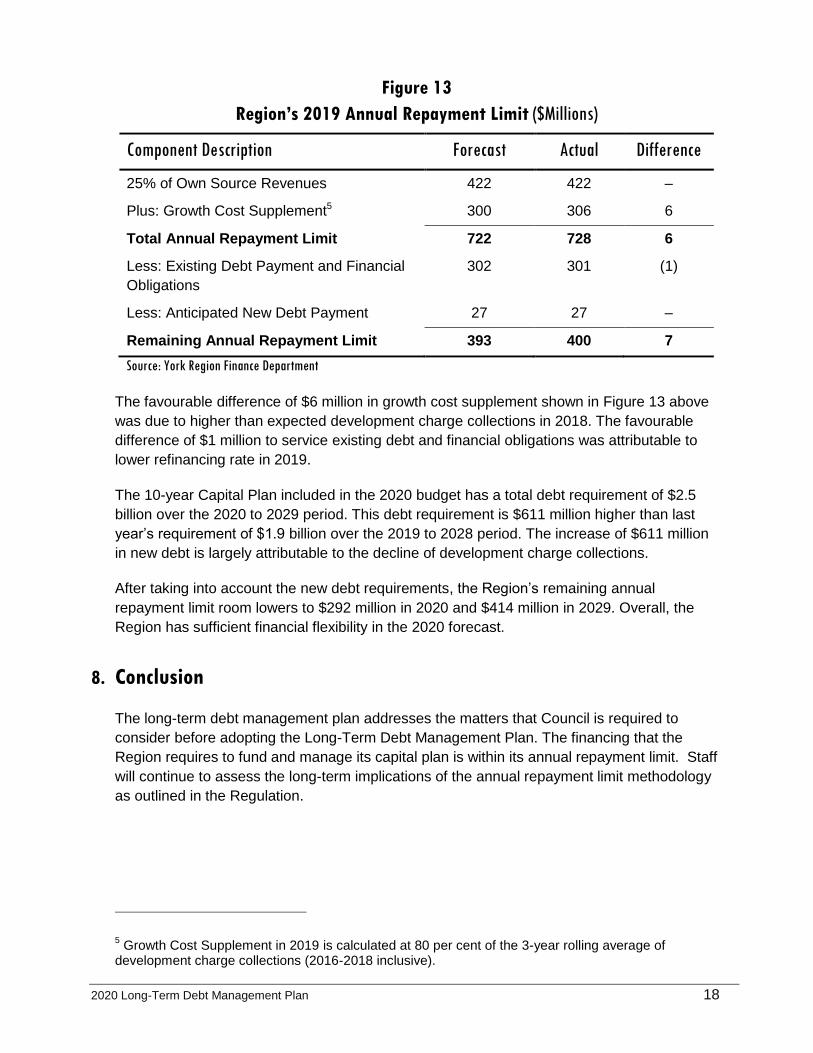
Figure 13
Region’s 2019 Annual Repayment Limit ($Millions)
Component Description Forecast Actual Difference
25% of Own Source Revenues 422 422 –
Plus: Growth Cost Supplement5 300 306 6
Total Annual Repayment Limit 722 728 6
Less: Existing Debt Payment and Financial
Obligations
302 301 (1)
Less: Anticipated New Debt Payment 27 27 –
Remaining Annual Repayment Limit 393 400 7
Source: York Region Finance Department
The favourable difference of $6 million in growth cost supplement shown in Figure 13 above
was due to higher than expected development charge collections in 2018. The favourable
difference of $1 million to service existing debt and financial obligations was attributable to
lower refinancing rate in 2019.
The 10-year Capital Plan included in the 2020 budget has a total debt requirement of $2.5
billion over the 2020 to 2029 period. This debt requirement is $611 million higher than last
year’s requirement of $1.9 billion over the 2019 to 2028 period. The increase of $611 million
in new debt is largely attributable to the decline of development charge collections.
After taking into account the new debt requirements, the Region’s remaining annual
repayment limit room lowers to $292 million in 2020 and $414 million in 2029. Overall, the
Region has sufficient financial flexibility in the 2020 forecast.
8. Conclusion
The long-term debt management plan addresses the matters that Council is required to
consider before adopting the Long-Term Debt Management Plan. The financing that the
Region requires to fund and manage its capital plan is within its annual repayment limit. Staff
will continue to assess the long-term implications of the annual repayment limit methodology
as outlined in the Regulation.
5 Growth Cost Supplement in 2019 is calculated at 80 per cent of the 3-year rolling average of
development charge collections (2016-2018 inclusive).
2020 Long-Term Debt Management Plan 19
APPENDIX 1
Determination of Annual Repayment Limit (ARL)
1. Step 1: Calculate 25 per cent of Own Source Revenue
Own source revenue includes:
Property tax revenue
Water and wastewater revenues
Transit fares
Fees provided for police services, public housing rents, and fees from services
provided to other municipalities.
Own source revenue does not include development charges, grants and subsidies from other
levels of government, other deferred revenues (e.g., gas tax revenues), and contributions
from reserves.
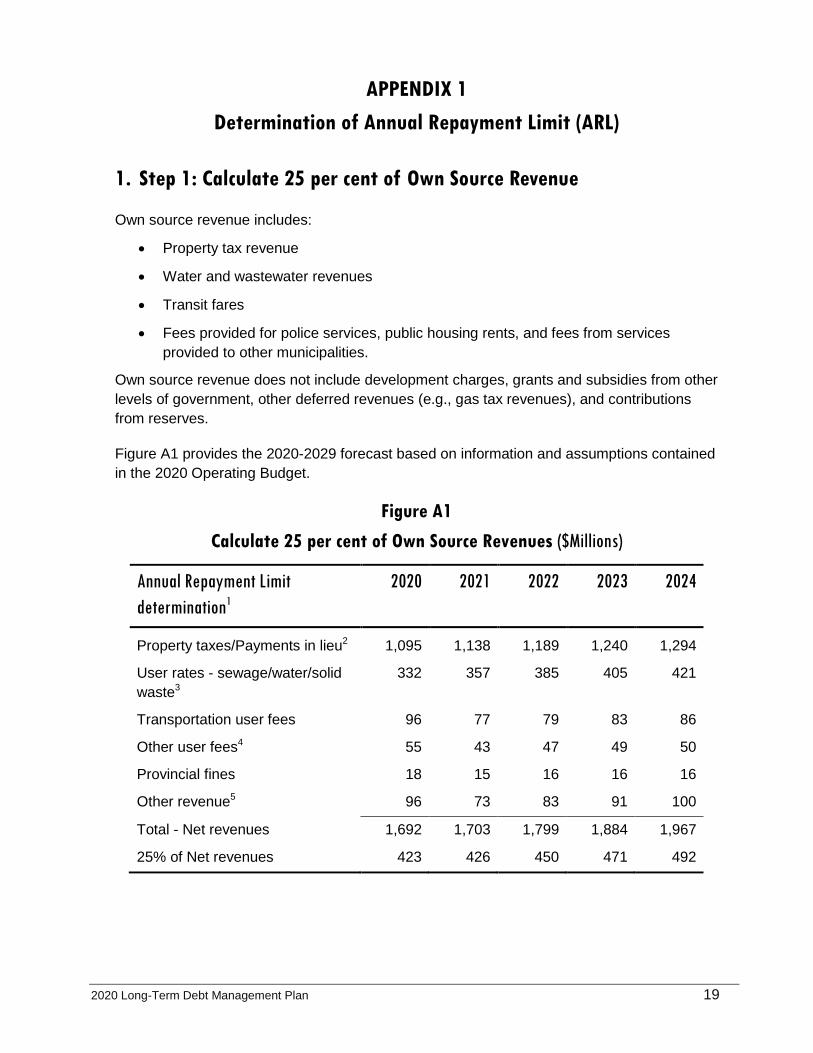
Figure A1 provides the 2020-2029 forecast based on information and assumptions contained
in the 2020 Operating Budget.
Figure A1
Calculate 25 per cent of Own Source Revenues ($Millions)
Annual Repayment Limit
determination1
2020 2021 2022 2023 2024
Property taxes/Payments in lieu2 1,095 1,138 1,189 1,240 1,294
User rates - sewage/water/solid
waste3
332 357 385 405 421
Transportation user fees 96 77 79 83 86
Other user fees4 55 43 47 49 50
Provincial fines 18 15 16 16 16
Other revenue5 96 73 83 91 100
Total - Net revenues 1,692 1,703 1,799 1,884 1,967
25% of Net revenues 423 426 450 471 492
2020 Long-Term Debt Management Plan 20
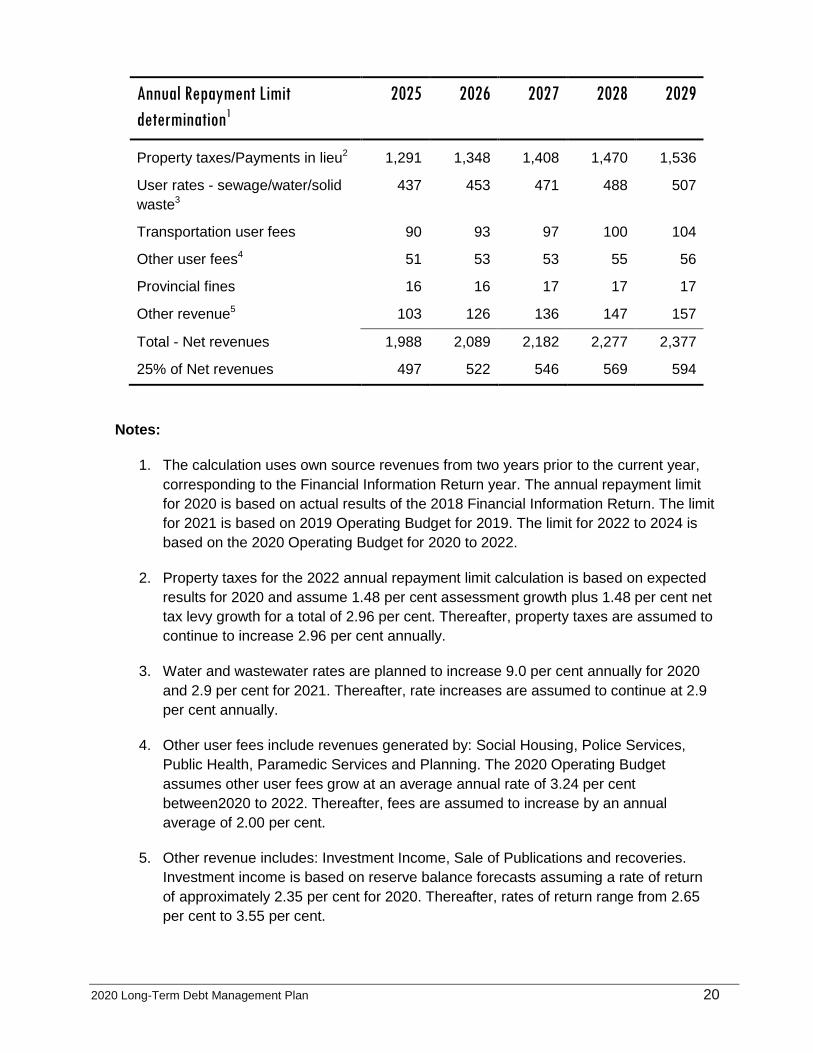
Annual Repayment Limit
determination1
2025 2026 2027 2028 2029
Property taxes/Payments in lieu2 1,291 1,348 1,408 1,470 1,536
User rates - sewage/water/solid
waste3
437 453 471 488 507
Transportation user fees 90 93 97 100 104
Other user fees4 51 53 53 55 56
Provincial fines 16 16 17 17 17
Other revenue5 103 126 136 147 157
Total - Net revenues 1,988 2,089 2,182 2,277 2,377
25% of Net revenues 497 522 546 569 594
Notes:
1. The calculation uses own source revenues from two years prior to the current year,
corresponding to the Financial Information Return year. The annual repayment limit
for 2020 is based on actual results of the 2018 Financial Information Return. The limit
for 2021 is based on 2019 Operating Budget for 2019. The limit for 2022 to 2024 is
based on the 2020 Operating Budget for 2020 to 2022.
2. Property taxes for the 2022 annual repayment limit calculation is based on expected
results for 2020 and assume 1.48 per cent assessment growth plus 1.48 per cent net
tax levy growth for a total of 2.96 per cent. Thereafter, property taxes are assumed to
continue to increase 2.96 per cent annually.
3. Water and wastewater rates are planned to increase 9.0 per cent annually for 2020
and 2.9 per cent for 2021. Thereafter, rate increases are assumed to continue at 2.9
per cent annually.
4. Other user fees include revenues generated by: Social Housing, Police Services,
Public Health, Paramedic Services and Planning. The 2020 Operating Budget
assumes other user fees grow at an average annual rate of 3.24 per cent
between2020 to 2022. Thereafter, fees are assumed to increase by an annual
average of 2.00 per cent.
5. Other revenue includes: Investment Income, Sale of Publications and recoveries.
Investment income is based on reserve balance forecasts assuming a rate of return
of approximately 2.35 per cent for 2020. Thereafter, rates of return range from 2.65
per cent to 3.55 per cent.
2020 Long-Term Debt Management Plan 21
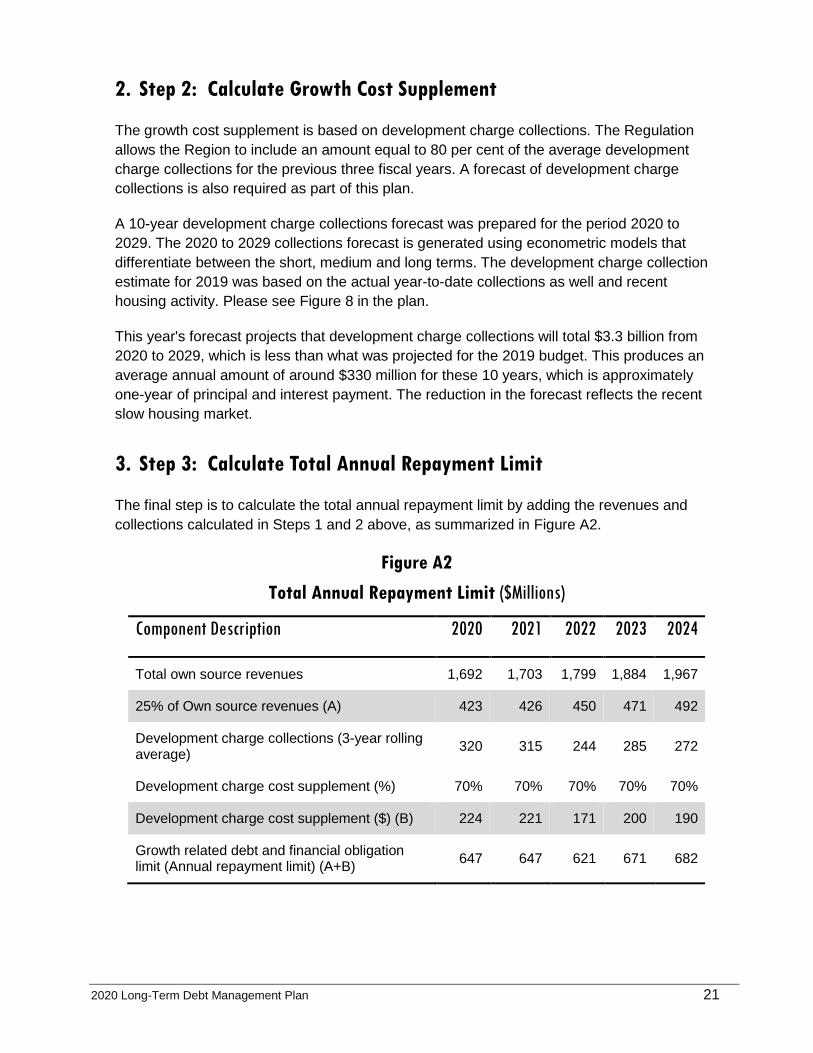
2. Step 2: Calculate Growth Cost Supplement
The growth cost supplement is based on development charge collections. The Regulation
allows the Region to include an amount equal to 80 per cent of the average development
charge collections for the previous three fiscal years. A forecast of development charge
collections is also required as part of this plan.
A 10-year development charge collections forecast was prepared for the period 2020 to
2029. The 2020 to 2029 collections forecast is generated using econometric models that
differentiate between the short, medium and long terms. The development charge collection
estimate for 2019 was based on the actual year-to-date collections as well and recent
housing activity. Please see Figure 8 in the plan.
This year's forecast projects that development charge collections will total $3.3 billion from
2020 to 2029, which is less than what was projected for the 2019 budget. This produces an
average annual amount of around $330 million for these 10 years, which is approximately
one-year of principal and interest payment. The reduction in the forecast reflects the recent
slow housing market.
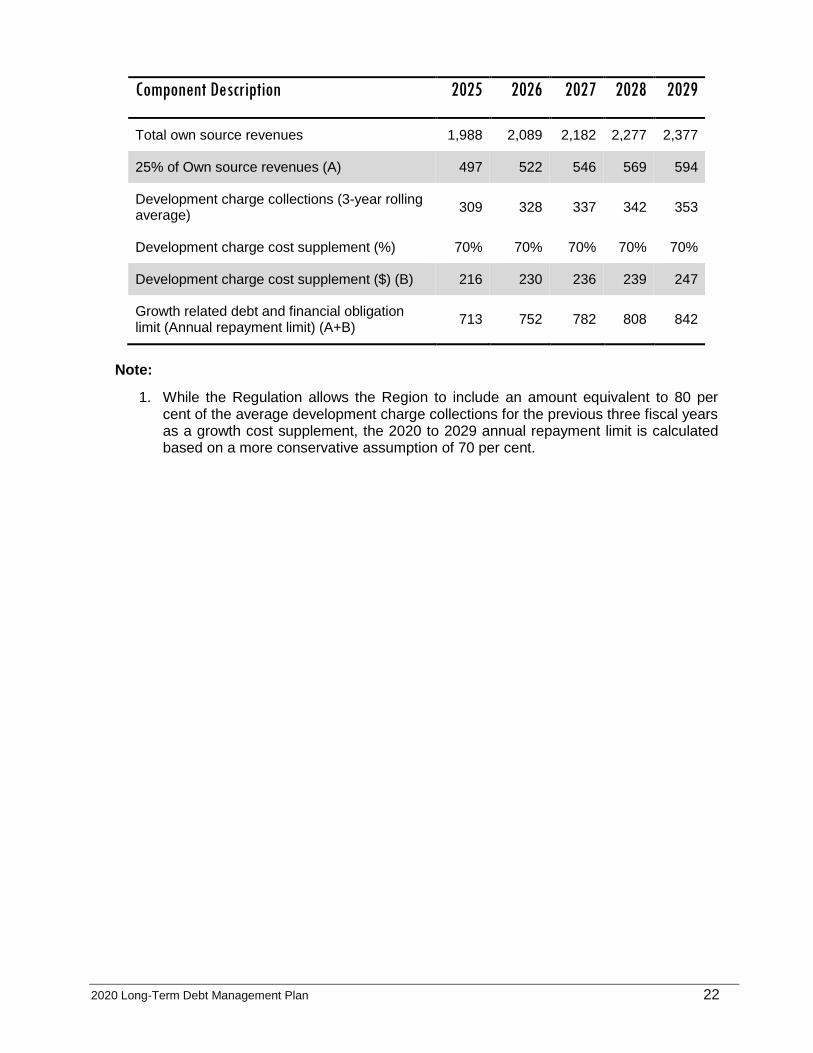
3. Step 3: Calculate Total Annual Repayment Limit
The final step is to calculate the total annual repayment limit by adding the revenues and
collections calculated in Steps 1 and 2 above, as summarized in Figure A2.
Figure A2
Total Annual Repayment Limit ($Millions)
Component Description 2020 2021 2022 2023 2024
Total own source revenues 1,692 1,703 1,799 1,884 1,967
25% of Own source revenues (A) 423 426 450 471 492
Development charge collections (3-year rolling average)
320 315 244 285 272
Development charge cost supplement (%) 70% 70% 70% 70% 70%
Development charge cost supplement ($) (B) 224 221 171 200 190
Growth related debt and financial obligation limit (Annual repayment limit) (A+B)
647 647 621 671 682
2020 Long-Term Debt Management Plan 22
Component Description 2025 2026 2027 2028 2029
Total own source revenues 1,988 2,089 2,182 2,277 2,377
25% of Own source revenues (A) 497 522 546 569 594
Development charge collections (3-year rolling average)
309 328 337 342 353
Development charge cost supplement (%) 70% 70% 70% 70% 70%
Development charge cost supplement ($) (B) 216 230 236 239 247
Growth related debt and financial obligation limit (Annual repayment limit) (A+B)
713 752 782 808 842
Note:
1. While the Regulation allows the Region to include an amount equivalent to 80 per cent of the average development charge collections for the previous three fiscal years as a growth cost supplement, the 2020 to 2029 annual repayment limit is calculated based on a more conservative assumption of 70 per cent.

17250 Yonge Street,Newmarket, ON CanadaL3Y 6Z1