Embed Size (px)
Citation preview
The regulatory design of glycogen metabolismin mammalian skeletal muscle
by
Daniel Christiaan Palm
Dissertation presented for the degree of Doctor ofPhilosophy (Biochemistry) in the Faculty of Science at
Stellenbosch University
Department of BiochemistryUniversity of Stellenbosch
Private Bag X1, 7602 Matieland, South Africa
Promoters:
Prof. J.-H.S. Hofmeyr (promoter) Prof. J.M. Rohwer (co-promoter)
March 2013
Declaration
By submitting this dissertation electronically, I declare that the entirety of the workcontained therein is my own, original work, that I am the sole author thereof (saveto the extent explicitly otherwise stated), that reproduction and publication thereofby Stellenbosch University will not infringe any third party rights and that I havenot previously in its entirety or in part submitted it for obtaining any qualification.
Signature: . . . . . . . . . . . . . . . . . . . . . . . . . . . . . . .D.C. Palm
27 March 2013Date: . . . . . . . . . . . . . . . . . . . . . . . . . . . . . . . . . . .
Copyright c© 2013 Stellenbosch UniversityAll rights reserved.
i
Stellenbosch University http://scholar.sun.ac.za
Summary
It is widely accepted that insufficient insulin-stimulated activation of muscle glyco-gen synthesis is one of the major components of non-insulin-dependent (type 2)diabetes mellitus. Glycogen synthase, a key enzyme in glycogen synthesis, is ex-tensively regulated, both allosterically (by glucose-6-phosphate, ATP, and other lig-ands) and covalently (by phosphorylation). Although glycogen synthase has beena topic of intense study for more than 50 years, its kinetic characterization has beenconfounded by its large number of phosphorylation states. Questions remain re-garding the function of glycogen synthase regulation and the relative importanceof allosteric and covalent modification in fulfilling this function. The regulationof glycogen synthase and glycogen phosphorylase, the enzyme that catalyses thedegradation of glycogen chains, are reciprocal in many respects.
In the present research, using mathematical modelling, we aim to establish thefunction of the allosteric and covalent regulation of glycogen synthase and glyco-gen phosphorylase in muscle and, in the case of glycogen synthase, the relative im-portance of these two mechanisms in performing this function. In order to realizethese aims it is essential that a detailed kinetic model of glycogen metabolism isconstructed.
We begin with a thorough review of the kinetics and regulation of glycogen syn-thase in which we propose that both allosteric and covalent modification of glycogensynthase can be described by a Monod-Wyman-Changeux model in terms of appar-ent changes to L0, the equilibrium constant between the T and R conformers. Wethen proceed to develop a rate equation according to the proposed Monod-Wyman-Changeux model and determine values for its kinetic parameters from publishedexperimental data using non-linear least-squares regression. We show that the ap-plication of the Monod-Wyman-Changeux model to glycogen synthase kinetics alsohas important implications for the rate equations of enzymes that catalyse the phos-phorylation and dephosphorylation of glycogen synthase. We formalize these impli-
ii
Stellenbosch University http://scholar.sun.ac.za
SUMMARY iii
cations for a generic protein that follows Monod-Wyman-Changeux-type conforma-tional change and then also show how the findings apply to glycogen synthase. Tak-ing into account the kinetic model of glycogen synthase and how it also influencesthe covalent regulation of the enzyme, we proceed to construct a detailed mathemat-ical model of glycogen synthesis that includes the glycogen synthase phosphoryla-tion cascade. A variation of this model in which glycogen synthase phosphorylationis described with a single parameter is also provided. We reuse an existing model ofmuscle glycogenolysis and also combine these models in an overall model of glyco-gen metabolism. Finally, we employ the theoretical frameworks of metabolic controlanalysis, supply-demand analysis, and co-response analysis to investigate the func-tion of glycogen synthase and glycogen phosphorylase regulation. We show thatthe function of glycogen synthase regulation is not flux control, as assumed in thetextbook view, but rather the maintenance of glucose-6-phosphate within a narrowrange far from equilibrium. Similarly, we show that regulation of glycogen phos-phorylase functions to minimize variation in cellular energy charge in the face ofhighly variable energy demand. We conclude with an appeal for a renewed interestin the enzyme kinetics of muscle glycogen metabolism.
Stellenbosch University http://scholar.sun.ac.za
Opsomming
Daar word wyd aanvaar dat onvoldoende insulien-gestimuleerde aktivering vanspierglikogeensintese een van die hoofkomponente van insulien-onafhanklike (tipe2) diabetes mellitus is. Glikogeensintase, ’n sleutelensiem in glikogeensintese isonderworpe aan breedvoerige regulering, beide allosteries (deur glukose-6-fosfaat,ATP, en ander ligande) en kovalent (deur fosforilering). Alhoewel glikogeensintasereeds vir meer as 50 jaar deeglik bestudeer word, word die kinetiese karakteris-ering daarvan bemoeilik deur die groot aantal fosforilasiestate waarin die ensiemvoorkom. Daar is steeds vrae betreffende die funksie van die regulering van gliko-geensintase en die relatiewe bydrae van allosteriese en kovalente regulering in dievervulling van hierdie funksie. Die regulering van glikogeensintase en glikogeen-fosforilase, die ensiem wat die afbraak van glikogeenkettings kataliseer, is in baieopsigte resiprook.
In hierdie studie beoog ons om met die hulp van wiskundige modellering vaste stel watter funksie die regulering van glikogeensintase en glikogeenfosforilasevervul en, in die geval van glikogeensintase, wat die relatiewe belang is van alloster-iese en kovalente regulering in die vervulling van hierdie funksie. Om hierdie oog-merke te verwesentlik is dit nodig dat ’n kinetiese model van glikogeenmetabolismeontwikkel word.
Ons begin met ’n omvattende oorsig van die kinetika en regulering van gliko-geensintase waarin ons voorstel dat beide die allosteriese en kovalente reguleringvan glikogeensintase beskryf kan word met die Monod-Wyman-Changeux modelin terme van oenskynlike veranderings aan L0, die ekwilibriumkonstante tussendie T en R konformasies. Ons gaan dan voort om ’n snelheidsvergelyking te ont-wikkel volgens die voorgestelde Monod-Wyman-Changuex-model en bepaal ookdie waardes van hierdie vergelyking se parameters vanaf gepubliseerde eksperi-mentele data deur middel van nie-lineere kleinste-vierkantsregressie. Ons wys datdie toepassing van die Monod-Wyman-Changuex-model op glikogeensintase-kinetika
iv
Stellenbosch University http://scholar.sun.ac.za
OPSOMMING v
belangrike gevolge het vir die snelheidsvergelykings van die ensieme wat die fosfo-rilering en defosforilering van glikogeensintase kataliseer. Ons formaliseer hierdiegevolge vir ’n generiese Monod-Wyman-Changeux-tipe proteıen en wys dan ookhoe die bevindings op glikogeensintase van toepassing is. Met inagneming van diekinetiese model vir glikogeensintase en hoe dit die kovalente regulering van dieensiem beınvloed, gaan ons voort om ’n gedetaileerde wiskundige model van gliko-geensintese, wat ook die glikogeensintase-fosforileringskaskade insluit, te ontwik-kel. ’n Variasie op hierdie model waarin die fosforilering van glikogeensintase deur’n enkele parameter beskryf word, word ook voorsien. Ons herbruik ’n bestaandemodel van spierglikogenolise en kombineer ook hierdie modelle in ’n oorkoepelendemodel van glikogeenmetabolisme. Uiteindelik span ons die teoretiese raamwerkevan metaboliese kontrole-analise, vraag-aanbod-analise, en ko-responsanalise in omdie funksie van die regulering van glikogeensintase en glikogeenfosforilase te on-dersoek. Ons wys dat die funksie van die regulering van glikogeensintase nie fluk-siekontrole, soos algemeen in handboeke aangeneem word, is nie, maar liewer datdit glukose-6-fosfaat handhaaf binne ’n noue band ver vanaf ekwilibrium. Insge-lyks wys ons dat die regulering van glikogeenfosforilase funksioneer om variasiein sellulere energielading te beperk ten spyte van hoogs wisselende vlakke vanenergie-aanvraag. Ons sluit af met ’n pleidooi vir hernieude belangstelling in dieensiemkinetika van glikogeenmetabolisme in die spier.
Stellenbosch University http://scholar.sun.ac.za
Fur Ronell
R→ F[+R]F[−R]F
Stellenbosch University http://scholar.sun.ac.za

Acknowledgements
I would like to express my sincerest gratitude to:
Prof Jannie Hofmeyr whose enthusiasm for molecular cell physiology is both con-tagious and inspiring. His work is original and rigorous. One can only watchand learn.
Prof Johann Rohwer for simplifying my life with a seemingly endless supply ofcommand-line shortcuts and for his keen eye for mistakes. He sparked theidea that would eventually let everything fall into place.
Marnette Coetzee for asking all the questions I thought I had answers to.
Triple J-Group, especially Jalene, for company, discussion, coffee breaks, and laughs.
Illuminati for good food and red wine-infused philosophy. What a rare privilege tobe surrounded by so many exceptionally bright people.
The Open-Source Community for free software.
National Research Foundation for funding.
My parents for believing in me.
Ronell for endless love, encouragement, and support.
God for miracles.
vii
Stellenbosch University http://scholar.sun.ac.za
Contents
Declaration i
Summary ii
Opsomming iv
Dedication v
Acknowledgements vii
Contents viii
List of Figures xi
List of Tables xiv
List of Abbreviations xvi
1 Introduction 1
2 Regulation of glycogen synthase activity 52.1 Introduction . . . . . . . . . . . . . . . . . . . . . . . . . . . . . . . . . . 52.2 Glycogen synthase and its kinetics . . . . . . . . . . . . . . . . . . . . . 62.3 Regulation by phosphorylation . . . . . . . . . . . . . . . . . . . . . . . 222.4 Regulation by glucose-6-phosphate . . . . . . . . . . . . . . . . . . . . 342.5 A unifying view of covalent and allosteric regulation . . . . . . . . . . 432.6 Conclusion . . . . . . . . . . . . . . . . . . . . . . . . . . . . . . . . . . . 50
3 Development of a glycogen synthase rate equation 533.1 Introduction . . . . . . . . . . . . . . . . . . . . . . . . . . . . . . . . . . 53
viii
Stellenbosch University http://scholar.sun.ac.za
CONTENTS ix
3.2 Phosphorylation states . . . . . . . . . . . . . . . . . . . . . . . . . . . . 533.3 Kinetic models . . . . . . . . . . . . . . . . . . . . . . . . . . . . . . . . . 573.4 Parameter optimization . . . . . . . . . . . . . . . . . . . . . . . . . . . . 663.5 Estimation of L0 for each phosphorylation state . . . . . . . . . . . . . . 773.6 Fractional velocity as a function of phosphorylation degree . . . . . . . 82
4 Interaction of allosteric and covalent modification 844.1 Introduction . . . . . . . . . . . . . . . . . . . . . . . . . . . . . . . . . . 844.2 Interaction of allosteric and covalent modification . . . . . . . . . . . . 854.3 Rate equations for covalent modification . . . . . . . . . . . . . . . . . . 944.4 Application to a minimal model of feedforward activation and cova-
lent inhibition . . . . . . . . . . . . . . . . . . . . . . . . . . . . . . . . . 1064.5 Discussion . . . . . . . . . . . . . . . . . . . . . . . . . . . . . . . . . . . 117
5 Modelling skeletal muscle glycogen metabolism 1235.1 Introduction . . . . . . . . . . . . . . . . . . . . . . . . . . . . . . . . . . 1235.2 Glycogen metabolism . . . . . . . . . . . . . . . . . . . . . . . . . . . . . 1255.3 Parametrization . . . . . . . . . . . . . . . . . . . . . . . . . . . . . . . . 1425.4 Models . . . . . . . . . . . . . . . . . . . . . . . . . . . . . . . . . . . . . 149
6 Regulatory design of glycogen metabolism 1536.1 Introduction . . . . . . . . . . . . . . . . . . . . . . . . . . . . . . . . . . 1536.2 Analytic frameworks . . . . . . . . . . . . . . . . . . . . . . . . . . . . . 1546.3 Glycogen synthesis as a supply-demand system . . . . . . . . . . . . . 1556.4 Homeostasis in response to change in external glucose concentration . 1576.5 Degree of GS phosphorylation as a function of PKA and insulin . . . . 1666.6 Homeostasis in response to change in insulin concentration . . . . . . . 1696.7 Effect of glycolysis on the flux control of glycogen synthesis . . . . . . 1766.8 Relative importance of allosteric and covalent modification . . . . . . . 1816.9 The mechanisms by which glucose-6-phosphate stimulates glycogen
synthesis . . . . . . . . . . . . . . . . . . . . . . . . . . . . . . . . . . . . 1906.10 Energy charge homeostasis in response to ATP demand . . . . . . . . . 1996.11 Combining glycogen synthesis and degradation . . . . . . . . . . . . . 207
7 Discussion 2137.1 Glycogen metabolism as a molecular economy . . . . . . . . . . . . . . 2137.2 Regulation of glycogen metabolism . . . . . . . . . . . . . . . . . . . . . 214
Stellenbosch University http://scholar.sun.ac.za
CONTENTS x
7.3 Relative importance of allosteric and covalent modification of glyco-gen synthase . . . . . . . . . . . . . . . . . . . . . . . . . . . . . . . . . . 215
7.4 Qualitative equivalence of allosteric and covalent regulation . . . . . . 2167.5 Modelling glycogen metabolism . . . . . . . . . . . . . . . . . . . . . . . 2207.6 Future research . . . . . . . . . . . . . . . . . . . . . . . . . . . . . . . . 221
A Miscellaneous derivations 223A.1 Expression of the sum of MWC-type rate equations as a single term . . 223A.2 Expression of the overall elasticity of a sum of rates in terms of elas-
ticities of individual rates . . . . . . . . . . . . . . . . . . . . . . . . . . . 225
B Control analysis of two-module system in which allosteric and covalentmodification interact 227B.1 Control analysis of a two-module system . . . . . . . . . . . . . . . . . 227B.2 Elasticity expressions . . . . . . . . . . . . . . . . . . . . . . . . . . . . . 231
C Model parametrization 236C.1 Calculation of rate constants, enzyme concentrations, and maximal
velocities . . . . . . . . . . . . . . . . . . . . . . . . . . . . . . . . . . . . 236C.2 Glycogen phosphorylase rate equation and parameter optimization . . 238
Bibliography 243
Stellenbosch University http://scholar.sun.ac.za
List of Figures
2.1 Cartoon of the tetrameric structure of yeast GS . . . . . . . . . . . . . . . . 112.2 Sequence alignment of the regulatory arginine cluster from mammalian
and yeast glycogen synthases . . . . . . . . . . . . . . . . . . . . . . . . . . 132.3 In vivo phosphorylation sites in mammalian GS . . . . . . . . . . . . . . . . 232.4 Minimal feedforward activation mechanism . . . . . . . . . . . . . . . . . . 412.5 Regulation of GS by G6P, ATP, and phosphorylation . . . . . . . . . . . . . 442.6 Monod-Wyman-Changeux-type model of allosteric and covalent GS reg-
ulation . . . . . . . . . . . . . . . . . . . . . . . . . . . . . . . . . . . . . . . 46
3.1 Interconversion between 18 GS phosphorylation states . . . . . . . . . . . 563.2 Comparison of experimental data points to the rates calculated from the
best-fit equations for the unscaled, scaled, and half-scaled weighting strategies 733.3 Weighted residual plots with respect to the calculated rate v . . . . . . . . 743.4 Comparison of experimental data points to the rates calculated from the
best-fit equation for the mixed weighting strategy . . . . . . . . . . . . . . . 763.5 Kinetic model of a MWC-type enzyme phosphorylated at independent
phosphorylation sites . . . . . . . . . . . . . . . . . . . . . . . . . . . . . . . 803.6 Relationship between fractional velocity and degree of phosphorylation . 83
4.1 Reaction scheme of conversion of protein A to protein B via intermediatesI and I′ . . . . . . . . . . . . . . . . . . . . . . . . . . . . . . . . . . . . . . . 85
4.2 Reaction scheme for the covalent modification of a dimeric Monod-Wyman-Changeux-type enzyme . . . . . . . . . . . . . . . . . . . . . . . . . . . . . 88
4.3 Reaction scheme for the covalent and allosteric modification of a dimericMonod-Wyman-Changeux-type enzyme. . . . . . . . . . . . . . . . . . . . 89
4.4 Influence of saturating allosteric modifier on the degree of cooperativitywith respect to covalent modification . . . . . . . . . . . . . . . . . . . . . . 92
xi
Stellenbosch University http://scholar.sun.ac.za
LIST OF FIGURES xii
4.5 Forward and reverse covalent modification of a monomeric Monod-Wyman-Changeux-type enzyme by enzymes A and B . . . . . . . . . . . . . . . . . 95
4.6 Kinetic model for the forward covalent modification of protein E . . . . . 964.7 Kinetic model for the reverse covalent modification of protein E . . . . . . 1014.8 Feedforward activation mechanism in which the regulated enzyme is in-
hibited by covalent modification . . . . . . . . . . . . . . . . . . . . . . . . 1074.9 The flux response with respect to X as a function of x for the feedforward
system in Fig. 4.8 . . . . . . . . . . . . . . . . . . . . . . . . . . . . . . . . . 118
5.1 Glucose uptake pathway . . . . . . . . . . . . . . . . . . . . . . . . . . . . . 1295.2 Glycogen synthesis pathway . . . . . . . . . . . . . . . . . . . . . . . . . . . 1325.3 Glycogen degradation pathway . . . . . . . . . . . . . . . . . . . . . . . . . 1335.4 GP phosphorylation pathway . . . . . . . . . . . . . . . . . . . . . . . . . . 1335.5 Glycolysis pathway . . . . . . . . . . . . . . . . . . . . . . . . . . . . . . . . 1355.6 Abbreviated glycolysis pathway . . . . . . . . . . . . . . . . . . . . . . . . 1365.7 Cyclic AMP-dependent activation of PKA . . . . . . . . . . . . . . . . . . . 1375.8 Phosphorylation of the N-terminal cluster of GS . . . . . . . . . . . . . . . 1415.9 Phosphorylation of the C-terminal cluster of GS . . . . . . . . . . . . . . . 1425.10 Excerpt from an example Jinja2 template file and the resulting PySCeS file 151
6.1 Glycogen synthesis as a supply-demand system of G6P . . . . . . . . . . . 1566.2 Supply-demand rate characteristics around G6P . . . . . . . . . . . . . . . 1586.3 Nested supply-demand rate characteristics around Glci and UDPG . . . . 1596.4 Effect of changes in L0 on the flux and steady-state G6P concentration . . . 1616.5 Effect of changes in ATP concentration on the flux and steady-state G6P
concentration . . . . . . . . . . . . . . . . . . . . . . . . . . . . . . . . . . . 1626.6 Effect of changes in external glucose concentration on the flux and steady-
state G6P concentration . . . . . . . . . . . . . . . . . . . . . . . . . . . . . . 1636.7 Effect of covalent and allosteric modification of GS on G6P homeostasis . 1656.8 Dependence of L0,app on the concentration of PKA and insulin . . . . . . . 1676.9 Dependence of GS phosphate content per site as a function of PKA and
insulin . . . . . . . . . . . . . . . . . . . . . . . . . . . . . . . . . . . . . . . 1686.10 Dependence of ΩJ:G6P
Glco, J, G6P, and L0,app on PKA and insulin . . . . . . . . 170
6.11 Correlation of ΩJ:G6PGlco
, J, and G6P with L0,app in response to changes inPKA and insulin . . . . . . . . . . . . . . . . . . . . . . . . . . . . . . . . . . 172
6.12 Homeostasis of G6P in response to insulin stimulation . . . . . . . . . . . . 174
Stellenbosch University http://scholar.sun.ac.za
LIST OF FIGURES xiii
6.13 Supply-demand rate characteristic around G6P showing the effect of in-creasing the insulin concentration from basal to hyperglycemic conditions 175
6.14 Glycogen synthesis and glycolysis as a supply-demand system of G6P . . 1776.15 Dependence of glucose uptake, glycogen synthesis, glycolysis, and G6P
on the maximal rate of the glycolytic sink reaction . . . . . . . . . . . . . . 1796.16 Influence of glycolytic rate on elasticities and flux control . . . . . . . . . . 1796.17 Reproduction of experimental data obtained from wildtype and knock-in
mice in which GSK3 is insensitive to insulin . . . . . . . . . . . . . . . . . . 1826.18 Reproduction of experimental data obtained from wildtype and knock-in
mice in which GS is insensitive to G6P . . . . . . . . . . . . . . . . . . . . . 1856.19 Fraction of unliganded and liganded GS in the R conformation . . . . . . . 1886.20 The relative contributions of four mechanisms by which G6P activates
glycogen synthesis . . . . . . . . . . . . . . . . . . . . . . . . . . . . . . . . 1926.21 Dependence of the elasticity of GS to G6P resulting from activation of PP1
by G6P on PKA and insulin . . . . . . . . . . . . . . . . . . . . . . . . . . . 1986.22 Correlation of fluxes and steady-state concentrations of the original and
adapted Lambeth and Kushmerick models . . . . . . . . . . . . . . . . . . 2026.23 ATPase flux and energy charge as functions of GP fractional phosphory-
lation and ATP demand . . . . . . . . . . . . . . . . . . . . . . . . . . . . . 2036.24 Co-response of ATPase flux and energy charge to ATP demand as a func-
tion of GP fractional phosphorylation and ATP demand . . . . . . . . . . . 205
B.1 Feedforward activation mechanism in which the regulated enzyme is in-hibited by covalent modification. . . . . . . . . . . . . . . . . . . . . . . . . 228
C.1 Comparison of experimental data points to the rates calculated from thebest-fit equation . . . . . . . . . . . . . . . . . . . . . . . . . . . . . . . . . . 242
Stellenbosch University http://scholar.sun.ac.za
List of Tables
2.1 Response of arginine cluster mutants to G6P and phosphorylation com-pared to wildtype GS . . . . . . . . . . . . . . . . . . . . . . . . . . . . . . . 14
2.2 In vivo phosphorylation sites in mammalian GS. . . . . . . . . . . . . . . . 242.3 Activity ratios of various GS phosphorylation states . . . . . . . . . . . . . 312.4 Phosphorylation-dependent glycogen synthase distribution . . . . . . . . 32
3.1 Summary of candidate MWC-type GS rate equations . . . . . . . . . . . . 663.2 Optimized kinetic parameters obtained using no weighting strategy . . . 713.3 Optimized kinetic parameters obtained using a scaled weighting strategy 723.4 Optimized kinetic parameters obtained using a half-scaled weighting strat-
egy . . . . . . . . . . . . . . . . . . . . . . . . . . . . . . . . . . . . . . . . . 723.5 Optimized kinetic parameters obtained using a scaled weighting strat-
egy for data obtained by varying UDP-glucose (UDPG) and a half-scaledstrategy for data obtained by varying glucose-6-phosphate (G6P) . . . . . 75
3.6 Activity ratios for various GS phosphorylation states obtained from liter-ature data and the corresponding calculated L0 values . . . . . . . . . . . . 80
3.7 Factors from which all values of L0 can be calculated according to theexpressions in Table 3.8 . . . . . . . . . . . . . . . . . . . . . . . . . . . . . . 81
3.8 Calculated L0 values for all 18 GS phosphorylation states . . . . . . . . . . 81
5.1 Kinetic parameters for glucose uptake pathway . . . . . . . . . . . . . . . . 1445.2 Kinetic parameters for the glycogen synthesis pathway . . . . . . . . . . . 1455.3 Kinetic parameters for the glycogen degradation pathway . . . . . . . . . 1465.4 Kinetic parameters for the abbreviated glycolysis pathway . . . . . . . . . 1465.5 Kinetic parameters for the cAMP signalling pathway . . . . . . . . . . . . 1475.6 Kinetic parameters for GS phosphorylation . . . . . . . . . . . . . . . . . . 1485.7 Equilibrium constants . . . . . . . . . . . . . . . . . . . . . . . . . . . . . . 148
xiv
Stellenbosch University http://scholar.sun.ac.za
LIST OF TABLES xv
5.8 Metabolite and other species concentrations . . . . . . . . . . . . . . . . . . 149
6.1 Comparison of experimental and model control analytic coefficients . . . . 1766.2 Kinetic parameters for PPase and NDPK . . . . . . . . . . . . . . . . . . . . 211
C.1 Rate constants calculated from specific activities of purified enzymes. . . . 237C.2 Rate constants for dephosphorylation of various PP1 substrates. . . . . . . 237C.3 Rate constants for phosphorylation of various PKA substrates. . . . . . . . 237C.4 Maximal velocities calculated from specific activities of crude enzyme ex-
tracts. . . . . . . . . . . . . . . . . . . . . . . . . . . . . . . . . . . . . . . . . 238C.5 Experimental data used during parameter optimization . . . . . . . . . . . 238C.6 Optimized parameters for the best-fit equation (Eq. C.7). . . . . . . . . . . 241
Stellenbosch University http://scholar.sun.ac.za

LIST OF TABLES xvi
Stellenbosch University http://scholar.sun.ac.za
Chapter 1
Introduction
Glycogen, a branched polymer of glucose, is used by numerous organisms as a glu-cose store when glucose is abundant or as a source of glucose under conditions ofmetabolic depletion [1]. The structure of glycogen has been optimized to store alarge amount of glucose that is readily available without affecting cellular osmo-larity [2]. In mammals, skeletal muscle is the major site of glucose disposal [3, 4],storing significantly more glycogen than the liver [5]. Although skeletal muscle in-sulin resistance is not a sufficient causative agent in non-insulin-dependent (type 2)diabetes mellitus, it is considered a primary defect in this disease [6]. Jensen et al.[7] suggest that, in muscle with a high glycogen content, insulin resistance is notnecessarily manifested as decreased glucose uptake, but rather as impaired mus-cle glycogen synthase (GS) activity. GS, the enzyme that incorporates glucose fromUDP-glucose (UDPG) into glycogen, is extensively regulated by both allosteric andcovalent modification. Glucose-6-phosphate (G6P), acting as an activator, and ATP,acting as an inhibitor, as well as many other ligands, compete for an allosteric site onGS. In addition, GS is phosphorylated at nine serine residues, resulting in markedinhibition.
The extensive regulation of GS activity, and its relatively low activity, has ledto the view that it is the “rate-limiting” enzyme of glycogen synthesis [8]. Accord-ingly, phosphorylation and activation by G6P are traditionally considered mecha-nisms that control the flux of glycogen synthesis. This view has been called intoquestion by several in vivo NMR studies, as reviewed by Shulman et al. [8], in whichit was found that, in general, there is no correlation between the glycogen syntheticflux and the degree of GS phosphorylation, as measured by the fractional velocity.Instead, the glycogen synthetic flux was found to be proportional to the glucose im-
1
Stellenbosch University http://scholar.sun.ac.za
CHAPTER 1. INTRODUCTION 2
port activity. These findings led Shulman et al. [8] to suggest that the regulation ofGS activity is not involved in controlling the flux of glycogen synthesis, but ratherserves to maintain G6P homeostasis [9]. In this view phosphorylation functions tomaintain the sensitivity of GS to its feedforward activator, G6P.
The theoretical framework of metabolic control analysis (MCA) [10, 11] has beenapplied to the model proposed by Shulman et al. [8] in a number of studies [9, 12, 13],confirming that the glycogen synthetic flux is controlled by glucose uptake, andsuggesting a role for phosphorylation in the coordinate activation of glucose trans-porter 4 (GLUT4) and GS by insulin as a mechanism of G6P homeostasis. Othermetabolic control analytic (MCA) studies, however, found that control of the glyco-gen synthetic flux is shared almost equally between the glucose uptake and glycogensynthesis activities [14]. Recently, Roach et al. [1] argued for a more neutral view inwhich both glucose uptake and GS potentially control the flux, depending on cellu-lar conditions.
The notion that the regulation of GS activity by phosphorylation can be a mech-anism that maintains metabolite homeostasis [9] is in good agreement with the find-ings of Hofmeyr & Cornish-Bowden [15] that allosteric regulation in feedback in-hibition loops does not function to control the flux through the regulated enzyme,but rather to maintain the concentration of the regulatory metabolite within a nar-row range far from equilibrium. If a similar function is assumed for feedforwardloops, as in the activation of GS by G6P, the allosteric and covalent regulation ofGS activity would appear to be involved in the homeostatic maintenance of G6P.However, Hofmeyr et al. [16] argue that, unlike the situation in feedback inhibition,the type of activation—whether by increasing the kcat or decreasing Km of the regu-lated enzyme—has important consequences for the effectiveness of the mechanismin maintaining the concentration of the regulatory metabolite homeostatically, pre-dicting that an increase in kcat is to be expected rather than a decrease in Km.
The presence of allosteric and covalent regulation of GS activity, and the fact thatvarious stimuli such as insulin signalling make use of both these mechanisms to af-fect GS activity, raise questions regarding the relative importance of these two mech-anisms in the regulation of GS activity. Recent studies using mutant mice in whichglycogen synthase kinase 3 (GSK3), a kinase that phosphorylates GS at various sites,was rendered constitutively active [17] or in which GS was rendered insensitive toactivation by G6P [18] suggest that, in response to insulin, the activation of GS ispredominantly mediated through allosteric and not covalent regulation.
Stellenbosch University http://scholar.sun.ac.za
CHAPTER 1. INTRODUCTION 3
At present no detailed kinetic treatment exists that is able to account for boththe allosteric and covalent regulation of GS. The development of such a model isseverely complicated by the numerous phosphorylation states in which the enzymecan exist. It is thus no surprise that GS phosphorylation is almost always discussedin terms of a two-state model, as the reciprocal of glycogen phosphorylase (GP)phosphorylation.
Similar questions arise when glycogen degradation is considered. In many re-spects, the regulation of GP, the enzyme that catalyses the phosphorolysis of non-reducing glucose residues from glycogen chains to produce glucose-1-phosphate(G1P), is reciprocal to that of GS. Phosphorylation inhibits GS, but activates GP. G6Pactivates GS but inhibits GP. GP is furthermore activated by AMP and inhibited byATP. Using a mathematical model of glycogenolysis, Lambeth & Kushmerick [19]found that the glycogen degradation flux is controlled by the demand for ATP. Thisfinding raises questions regarding the function, if not flux control, of the covalentand allosteric regulation of GP.
In this dissertation, using mathematical modelling, we aim to establish 1) thefunction of the allosteric and covalent regulation of GS and GP in muscle and 2) inthe case of GS, the relative importance of these two mechanisms in performing thisfunction. In order to realize these aims it is essential that a detailed kinetic model ofglycogen metabolism, with emphasis on the kinetics of GS, is constructed.
We begin with a comprehensive review of the allosteric and covalent regulationof GS and suggest that the kinetics of GS is indicative of the classic Monod-Wyman-Changeux (MWC) model. In Chapter 3 we develop a rate equation for GS basedon the kinetics as reviewed in Chapter 2, and obtain kinetic parameter values forthis equation using non-linear regression of published experimental data. In Chap-ter 4 we show that the kinetic model identified as providing the best description ofGS kinetics has important implications for the kinetics of any enzymes that cova-lently modify GS and other proteins that exhibit MWC-type conformational change.Taking these implications into account, we proceed to construct various detailedmathematical models of glycogen metabolism (Chapter 5). The model of Lambeth &Kushmerick [19] is incorporated as a description of glycogen degradation. Finally,in Chapter 6, we make use of analytical frameworks such as MCA and co-responseanalysis to investigate the regulatory design of glycogen synthesis and breakdown.We also discuss several aspects that must be taken into consideration in the con-struction of an overall model of glycogen synthesis and degradation. We conclude
Stellenbosch University http://scholar.sun.ac.za

CHAPTER 1. INTRODUCTION 4
in Chapter 7 with a general discussion of our main findings and suggest directionsfor future research.
Stellenbosch University http://scholar.sun.ac.za
Chapter 2
Allosteric and covalent regulation ofglycogen synthase activity1
2.1 Introduction
In this chapter we provide a comprehensive review of the kinetics and regulationof glycogen synthase (GS). We discuss both the earlier kinetic studies and the morerecent site-directed mutagenesis and crystal structure studies and show how the re-sults from these studies can form the basis of a unifying view of the covalent andallosteric regulation of GS that largely overcomes the combinatorial explosion re-sulting from the numerous phosphorylation states of the enzyme. We begin witha detailed general discussion of the kinetics, structure, and regulation of GS. Wethen proceed to formulate these aspects in terms of a phenomenological kinetic rateequation for the purpose of discussing the effects of covalent and allosteric regula-tion on the kinetic properties of GS. Finally, we propose a variation on the classicMonod-Wyman-Changeux (MWC) model that succinctly accounts for all the appar-ent modifications to GS kinetic properties.
This review is not intended as a comprehensive survey of glycogen metabolismin general, but specifically concerns the regulation of mammalian skeletal muscleGS from a kinetic perspective. For a comprehensive general review of developmentsin glycogen metabolism research over the last decade, the reader is referred to therecent publication by Roach et al. [1]. The present review follows what could beconsidered a “bottom-up” approach, as we avoid discussing higher level regulatoryphenomena such as insulin signalling, but rather focus on the mechanisms under-
1An abridged version of this chapter has been published in FEBS Journal [20].
5
Stellenbosch University http://scholar.sun.ac.za
CHAPTER 2. REGULATION OF GLYCOGEN SYNTHASE ACTIVITY 6
pinning GS regulation. For a discussion of the effects of exercise, adrenaline andinsulin stimulation on GS, the reader is referred to the recent “top-down” review byJensen & Lai [5]. Where no mammalian muscle data were available we also consid-ered, with due care, results from research conducted on other mammalian tissues,other eukaryotes, or even prokaryotes. Unless stated otherwise, or where the contextindicates otherwise, “GS” refers to the muscle enzyme.
2.2 Glycogen synthase and its kinetics
Reaction and thermodynamics
Glycogen chains are readily elongated by glycogen phosphorylase (GP) operatingin the reverse direction using glucose-1-phosphate (G1P) as substrate. However,Leloir and co-workers showed—first in liver [21] and then in muscle [22]—that thephysiologically relevant synthetic pathway uses UDP-glucose (UDPG) as substrate,leading to the discovery of GS. GS catalyses the bi-bi reaction in which the glucosyl(Glc) moiety from UDPG is incorporated into a glycogen molecule comprising nglucose residues by means of an α(1 → 4) glycosidic bond to produce UDP anda glycogen molecule comprising n + 1 glucose residues [22, 23] according to theequation
UDPG + Glcn UDP + Glcn+1 (2.1)
GS requires an oligosaccharide primer as a glucose acceptor and is therefore notcapable of de novo glycogen synthesis. Glucose, maltose, and other short oligosaccha-rides are either unsuitable or only weak primers [22, 24]. Instead, de novo glycogensynthesis is initialized in two phases by the homodimer glycogenin (EC 2.4.1.186).In the first phase, a tyrosyl residue of one subunit (Tyr194 in rabbit muscle) [25, 26] isglycosylated in an intersubunit reaction by its partner [27, 28]. In the second phase,a further seven glucosyl residues are added successively in an intrasubunit reac-tion [26], producing a suitable primer for GS. Like GS, glycogenin uses UDPG assubstrate, but has an additional divalent cation (Mn2+ or Mg2+) requirement [29].GS is initially complexed with glycogenin and it is believed that this association isnecessary for proper initiation of glycogen synthesis [30]. Branches are initiated bybranching enzyme (EC 2.4.1.18), which cleaves α(1→ 4) bonds to reintroduce themas α(1→ 6) bonds [31], thus creating new chains that can serve as primers for elon-
Stellenbosch University http://scholar.sun.ac.za
CHAPTER 2. REGULATION OF GLYCOGEN SYNTHASE ACTIVITY 7
gation by GS. On average, each glycogen chain branches twice and is 12–14 glucoseresidues long [2]. The terminal glucosyl residues of glycogen chains are referred toas non-reducing ends.
The equilibrium constant of the GS reaction is expressed as
Keq =[UDP]eq[Glcn+1]eq
[UDPG]eq[Glcn]eq(2.2)
While Glcn and Glcn+1 typically denote entire glycogen molecules, it is really onlythe non-reducing ends of a glycogen molecule that can partake in the elongationreaction. We may thus define [Glcn] and [Glcn+1] as the total concentrations of allnon-reducing ends that can serve as substrates and products. The majority of non-reducing ends can, however, serve as both substrates and products. For sufficientlylarge glycogen molecules, the difference between the equilibrium values of [Glcn]
and [Glcn+1] therefore becomes negligible, so that Eq. 2.2 simplifies to
Keq =[UDP]eq
[UDPG]eq(2.3)
Kornfeld & Brown [32] reported the formation of 0.0018 µmoles UDPG from7 µmoles UDP in the presence of GS and 5 mg glycogen (pH 7.5, 30C), from whicha Keq of 3900 can be calculated using Eq. 2.3. Assuming that all α(1→ 4) glycosidicbonds in the glycogen molecule are equivalent, an assumption supported by Gold-berg et al. [33], the Keq can also be calculated from the free energy changes of thecomponent half-reactions. Gold [34] estimated a value of 400 at pH 7.0 and 25C. Avalue of 230 (pH 7.0, 25C) is estimated for the reaction with maltopentaose as glu-cose acceptor using the group contribution method developed by Jankowski et al.[35] as implemented by the online service eQuilibrator [36]. Adjusted for pH (7.15)and ionic strength (0.2 mM), this value increases to about 1000. Kashiwaya et al. [37]report a much lower value of 37.7 (corrected for physiological pH and Mg2+ in ratheart).
The difference of more than two orders of magnitude in reported Keq values isa testament to the dependence of this value on experimental conditions. The valueincreases both with ionic strength and pH [36]. The temperature dependence of theKeq is not clear. The large value calculated from the results of Kornfeld & Brown[32] can probably be ascribed both to the high pH and to difficulties in accuratelymeasuring the reactant concentrations. In comparison, the equilibrium ratio of ADPto ADP-glucose for the E. coli enzyme has been reported as ranging from 55.5 to 151
Stellenbosch University http://scholar.sun.ac.za
CHAPTER 2. REGULATION OF GLYCOGEN SYNTHASE ACTIVITY 8
as the pH ranges from 5.27 to 6.82 at 37C [38]. Considering the similarity of theADP-glucose and UDPG phosphoester bonds and the muscle pH of 6.8–7.15 [39],the physiologically relevant Keq for GS in muscle is probably in the order of 102.Regardless of the precise value, it is clear that the reaction will not operate in thereverse direction under physiological conditions.
Kinetic mechanism
The determination of the GS kinetic mechanism is complicated by glycogen’s dualfunction as both substrate and product. In addition to the usual substrate bindingterms, initial velocity equations are required to include product binding terms forglycogen [40]. Moreover, if the glycogen concentration is varied, it will always varyin both its capacity as substrate and product [34]. As a result, the interpretation ofLineweaver-Burk and other reciprocal plots, in which each substrate is varied whilekeeping the other constant, changes significantly. For instance, Brown & Larner [41]suggested a ping-pong mechanism on the basis of parallel Lineweaver-Burk plots,whereas due to the presence of glycogen it can be shown that a ping-pong mecha-nism should in fact result in intersecting plots [40]. Others [24, 42] have obtainedreciprocal plots indicative of either rapid equilibrium random or ordered sequentialmechanisms, while Plesner et al. [40] would accept only the rapid equilibrium ran-dom mechanism. In order to overcome the pitfalls associated with reciprocal plots,Gold [34] studied the mechanism of the rabbit muscle enzyme by determining theequilibrium isotope exchange rates between UDPG and glycogen, and UDPG andUDP. Gold [34] concluded that the mechanism is rapid equilibrium random, but con-ceded that it cannot be distinguished from a rapid equilibrium ordered mechanismwith dead-end binary complexes by any of the methods he employed. Althoughthe majority of research seems to favour the random order mechanism, an orderedsequential mechanism cannot be ruled out at this point.
The rapid equilibrium random bi-bi mechanism is seemingly incompatible withthe observation [34, 43, 44] that glycogen forms stable complexes (lasting 3 min onaverage) with glycogen synthase [34]. However, the kinetic mechanism only de-scribes the rapid exchange of individual non-reducing ends and does not precludeadditional interaction of the glycogen molecule as a whole with GS. Considering thelifetime of the glycogen-GS complex and the kinetic mechanism, Gold [34] makes theconservative estimate that up to 550 chains are visited by GS. It has also been sug-gested that GS is able to add several glucosyl residues successively to the same chain
Stellenbosch University http://scholar.sun.ac.za
CHAPTER 2. REGULATION OF GLYCOGEN SYNTHASE ACTIVITY 9
of a glycogen molecule, i.e., that elongation is processive [34, 45, 46]. The number ofsuccessively added residues is known as the action pattern. Action patterns of 1.4–1.7[45] and 9 (estimated by [34] from [46]) have been reported. These action patternsare however incompatible with a rapid equilibrium random mechanism, which pre-dicts that exactly one glucose residue is successively incorporated in the same chain(distributive elongation) [34]. Parodi et al. [46] observed higher action patterns forliver GS as the molecular weight of glycogen increased. They ascribed the increaseto the possibility that GS penetrates glycogen molecules of higher molecular weightand thus loses mobility, increasing the likelihood that the same chain will be glycosy-lated repetitively. More recently, Baskaran et al. [47] found that yeast GS exhibited adistributive pattern of catalysis with maltooctaose as glucose acceptor. If similar be-haviour is exhibited by the muscle enzyme, deviation from distributive elongation isthen not necessarily linked to a change in the kinetic mechanism, but rather the resultof limited access to chains. At any rate, if glycogen saturation is assumed—a reason-able assumption given the tight association of GS with glycogen—the kinetic mech-anism is of little import to initial velocity kinetic treatments, as all the bi-substratemechanisms suggested simplify to the simple uni-reactant case in which only UDPGis considered a substrate [42].
Tertiary and quaternary structure
Glycogen synthases are members of the GT-B superfamily of glycosyltransferases[48]. The tertiary structure of members of this family, which also includes GP, ischaracterized by a duo of N-terminal and C-terminal Rossmann fold domains sep-arated by an interdomain cleft that houses the active site. The C-terminus typicallyfolds back onto the N-terminal Rossmann fold domain so that the two domains arelinked by a two-stranded hinge [49]. Significant rotation around this narrow hingeis possible and GT-B members differ widely with regard to the size of the interdo-main cleft. Glycogen synthases have a particularly deep fissure between the N- enC-domains [50] and it has been suggested that an interdomain closure is requiredto bring glycogen (binding along the N-domain) and the nucleotide sugar (bind-ing to the C-domain) together for catalysis [49]. Glycogen synthases can be furtherclassified into the ADP-glucose-utilizing non-regulated GT-3 family—including thebacterial and archaeal enzymes—and the UDPG-utilizing regulated GT-5 family—including the mammalian and yeast enzymes [49]. The most significant structuraldifferences between the GT-3 (comprising ∼50 kDa protomers) and GT-5 (compris-
Stellenbosch University http://scholar.sun.ac.za
CHAPTER 2. REGULATION OF GLYCOGEN SYNTHASE ACTIVITY 10
ing ∼80 kDa protomers) families are the presence of two N-terminal inserts (β2–β5and β7–α10), and a C-terminal insert (β11–α17) of which the most prominent sec-ondary structures is a coiled-coil formed by helices α15 and α16 in GT-5 members.Another unique feature of eukaryotic GS is the presence of a conserved arginine-rich cluster (Arg580/581/583/587/589/592 in yeast) on the regulatory R helix (helixα22), believed to be involved in allosteric and covalent regulation.
The only available GS crystal structures are those of the bacteria Agrobacteriumtumefaciens (AtGS) [49] and E. coli (EcGS) [50], the archaeon Pyrococcus abyssi (PaGS)[52], and only recently the yeast—and first eukaryote—S. cerevisiae (ScGS) [51]. Theoligomerization of the known structures range from monomeric to tetrameric andthe secondary structures involved in intersubunit interactions differ widely. AtGSwas solved as an asymmetric dimer [49] in which a 10-residue C-domain insert (407–416) facilitates the primary intersubunit contacts [52]. PaGS, the smallest known GS,lacks the AtGS dimerization insert, but terminates in an 11-residue hydrophobic tail(427–437) not present in bacteria [52]. The C-terminal hydrophobic tail (folded backonto the N-domain) associates with a hydrophobic pocket (53–55, 105–115, 141–142)on the N-domain of a neighbouring subunit, resulting in a trimeric quaternary struc-ture with a three-fold symmetry in which the three N-domains are tightly associated.ScGS contains both the AtGS dimerization insert and the PaGS hydrophobic tail in-volved in trimerization, but neither sequence is conserved and they appear not tobe involved in oligomerization [51]. Instead, ScGS [51, 53] is a two-fold symmetricdimer of a two-fold symmetric dimer pair, in which the subunits can be numbered(following Baskaran et al. [51]) from A to D (Fig. 2.1). The intersubunit contacts inthe A/D (and B/C) interface involve the reciprocal association of helix α16 (locatedin the eukaryote-specific C-terminal insert) of one subunit with the region betweenhelix α2 and sheet β4 (located in the first of the unique N-terminal inserts) of thepartner subunit. In the interface between dimer pairs (AD/BC), the main contactscomprise a reciprocal association of helix α15 from one subunit to the region betweenα15 and β10, so that the α15/16 helix pairs of subunits A and C associate, and thoseof subunits B and D associate. The A/B and C/D interfaces house the allosteric sites,whereas the A/D and B/C interfaces house the active sites. Intriguingly, in AtGSand the activated form of ScGS the movement of the N-domains are unrestricted;whereas in PaGS the N-domains are involved in the trimerization permitting onlyC-domain movement. It appears that GS oligomerization evolved independently inbacteria, archaea, and eukaryotes.
Stellenbosch University http://scholar.sun.ac.za
CHAPTER 2. REGULATION OF GLYCOGEN SYNTHASE ACTIVITY 11
top view front viewbasalstate
aA
B
C
D
N-domain
C-domain
activesite
α15/16
α2
bA
B
D
C
allostericsite
R helix
α15/16
α15/16 Asn284
Asn284
active
state
cA
B
C
D
N-domain
C-domain
activesite
α15/16
α2
dA
B
D
C
R helix
α15/16
α15/16 Asn284
Asn284
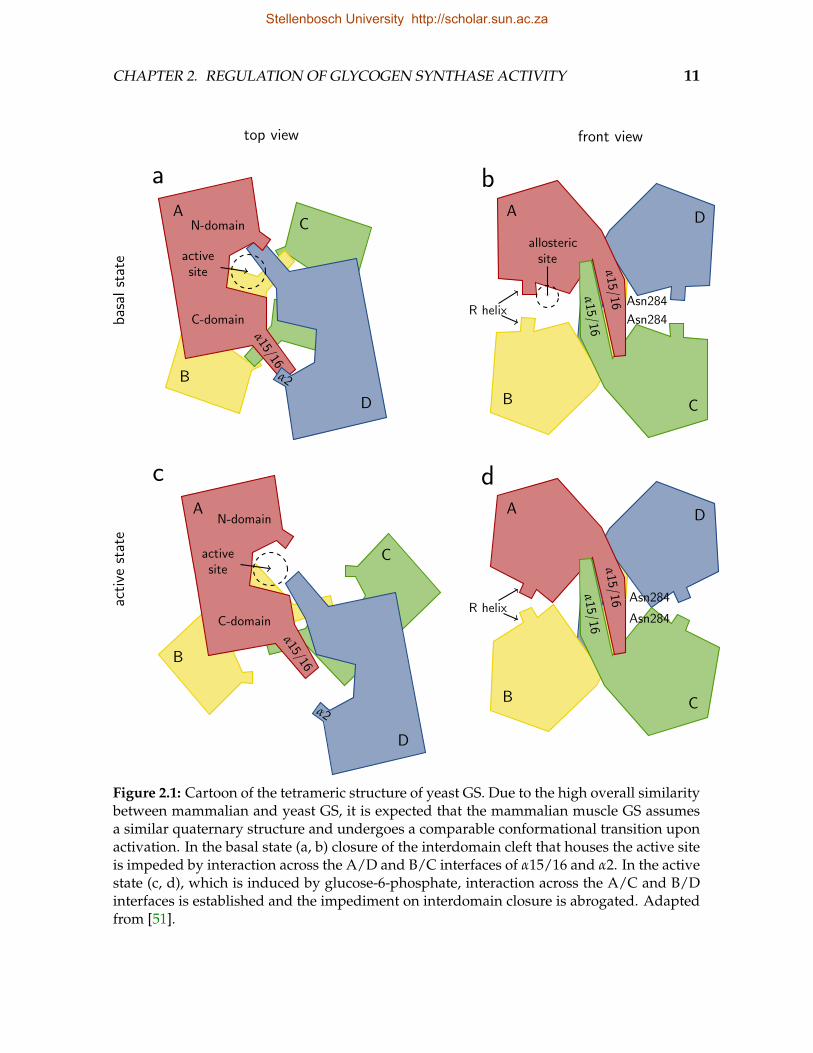
Figure 2.1: Cartoon of the tetrameric structure of yeast GS. Due to the high overall similaritybetween mammalian and yeast GS, it is expected that the mammalian muscle GS assumesa similar quaternary structure and undergoes a comparable conformational transition uponactivation. In the basal state (a, b) closure of the interdomain cleft that houses the active siteis impeded by interaction across the A/D and B/C interfaces of α15/16 and α2. In the activestate (c, d), which is induced by glucose-6-phosphate, interaction across the A/C and B/Dinterfaces is established and the impediment on interdomain closure is abrogated. Adaptedfrom [51].
Stellenbosch University http://scholar.sun.ac.za
CHAPTER 2. REGULATION OF GLYCOGEN SYNTHASE ACTIVITY 12
The oligomerization state of the muscle GS isozyme (∼84 kDa) has been reportedby various workers as dimeric [54, 55], trimeric [41, 54, 56], or tetrameric [44, 54, 57–61]. It is unlikely that the dimeric forms reflect the in vivo state, as they were eithershown to contain a proteolytic fragment [54] or were obtained at very low concen-trations, with the authors [55] suggesting the formation of a tetramer at higher invivo concentrations. Horcajada et al. [52] point out that in many of these earlier in-vestigations the oligomerization state was determined based on the sedimentationcoefficient, a measure which assumes a strictly globular protein shape. Based onthe presence in muscle GS of an insert analogous to the PaGS hydrophobic tail, andon the findings of Brown & Larner [41] using sedimentation equilibrium ultracen-trifugation, a technique not influenced by the protein shape, Horcajada et al. [52]favour a trimeric state for muscle GS. Other workers [59], however, also using sedi-mentation equilibrium ultracentrifugation, observed results indicative of a tetramer.The structure of eukaryotic GS is highly conserved, with only the phosphorylationsites and loops between conserved secondary structures differing [51]. Consider-ing this high degree of conservation, and, in particular, the presence in muscle GSof the secondary structures corresponding to the yeast α15–16 helices, the quater-nary structure of muscle GS is probably, as for the yeast enzyme, tetrameric. It has,however, been reported that glycogen, the degree of phosphorylation [62], glucose-6-phosphate (G6P), and ATP [55] influence the degree of GS oligomerization; higheror lower degrees of oligomerization can therefore not be ruled out.
Regulatory arginine cluster
Following the assumption that the allosteric and covalent regulation of eukaryoticGS is brought about by the interaction of the negatively charged phosphorylatedresidues and G6P with basic amino acid residues, Pederson et al. [63] identified sev-eral arginine and lysine residues that are conserved in eukaryotes. They proceededto generate 23 yeast GS mutants in which these residues were systematically re-placed with alanine residues, with up to three mutations per mutant enzyme. Twoof the mutants, R579A/R580A/R582A (human muscle numbering used for compar-ison; initial methionine included) and R586A/R588A/R591A, were completely in-sensitive to activation by G6P, while still exhibiting significant activity in the absenceof G6P. Upon phosphorylation the Vmax for GS of mutant R579A/R580A/R582A,which was already very low, did not decrease much further, whereas GS of the mu-tant R586A/R588A/R591A, which displayed normal activity in the dephosphory-
Stellenbosch University http://scholar.sun.ac.za
CHAPTER 2. REGULATION OF GLYCOGEN SYNTHASE ACTIVITY 13
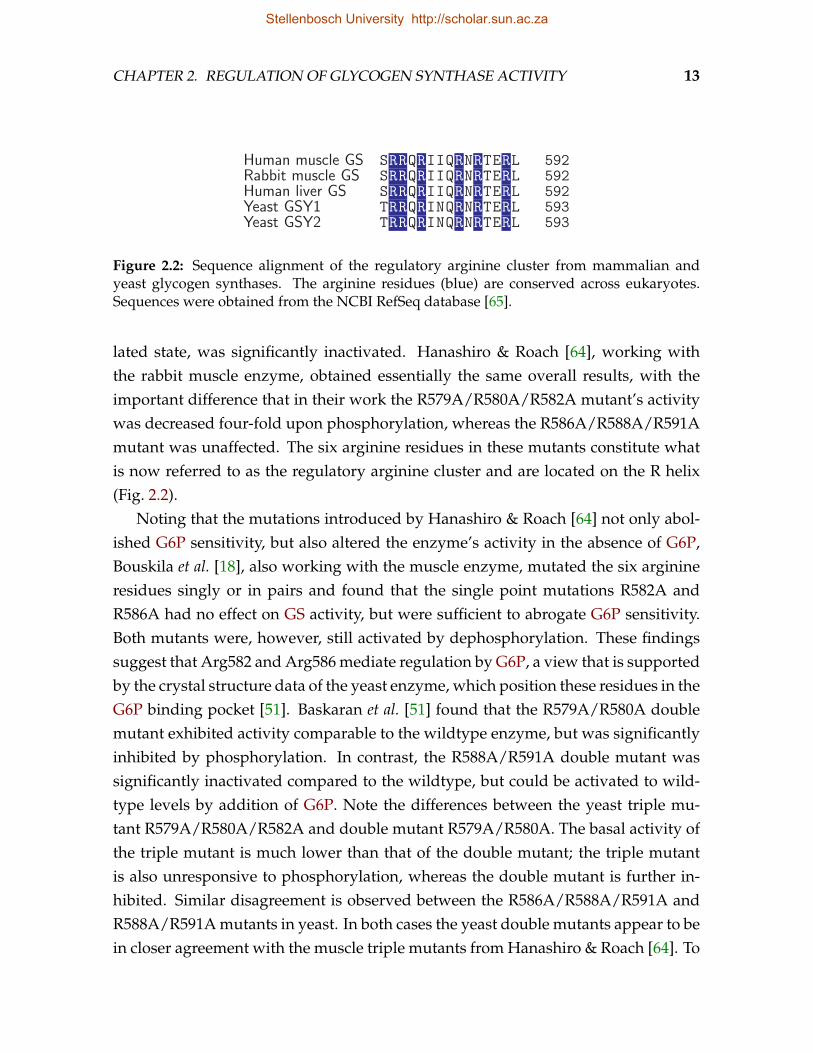
Human muscle GS SRRQRIIQRNRTERL 592Rabbit muscle GS SRRQRIIQRNRTERL 592Human liver GS SRRQRIIQRNRTERL 592Yeast GSY1 TRRQRINQRNRTERL 593Yeast GSY2 TRRQRINQRNRTERL 593
Figure 2.2: Sequence alignment of the regulatory arginine cluster from mammalian andyeast glycogen synthases. The arginine residues (blue) are conserved across eukaryotes.Sequences were obtained from the NCBI RefSeq database [65].
lated state, was significantly inactivated. Hanashiro & Roach [64], working withthe rabbit muscle enzyme, obtained essentially the same overall results, with theimportant difference that in their work the R579A/R580A/R582A mutant’s activitywas decreased four-fold upon phosphorylation, whereas the R586A/R588A/R591Amutant was unaffected. The six arginine residues in these mutants constitute whatis now referred to as the regulatory arginine cluster and are located on the R helix(Fig. 2.2).
Noting that the mutations introduced by Hanashiro & Roach [64] not only abol-ished G6P sensitivity, but also altered the enzyme’s activity in the absence of G6P,Bouskila et al. [18], also working with the muscle enzyme, mutated the six arginineresidues singly or in pairs and found that the single point mutations R582A andR586A had no effect on GS activity, but were sufficient to abrogate G6P sensitivity.Both mutants were, however, still activated by dephosphorylation. These findingssuggest that Arg582 and Arg586 mediate regulation by G6P, a view that is supportedby the crystal structure data of the yeast enzyme, which position these residues in theG6P binding pocket [51]. Baskaran et al. [51] found that the R579A/R580A doublemutant exhibited activity comparable to the wildtype enzyme, but was significantlyinhibited by phosphorylation. In contrast, the R588A/R591A double mutant wassignificantly inactivated compared to the wildtype, but could be activated to wild-type levels by addition of G6P. Note the differences between the yeast triple mu-tant R579A/R580A/R582A and double mutant R579A/R580A. The basal activity ofthe triple mutant is much lower than that of the double mutant; the triple mutantis also unresponsive to phosphorylation, whereas the double mutant is further in-hibited. Similar disagreement is observed between the R586A/R588A/R591A andR588A/R591A mutants in yeast. In both cases the yeast double mutants appear to bein closer agreement with the muscle triple mutants from Hanashiro & Roach [64]. To
Stellenbosch University http://scholar.sun.ac.za
CHAPTER 2. REGULATION OF GLYCOGEN SYNTHASE ACTIVITY 14
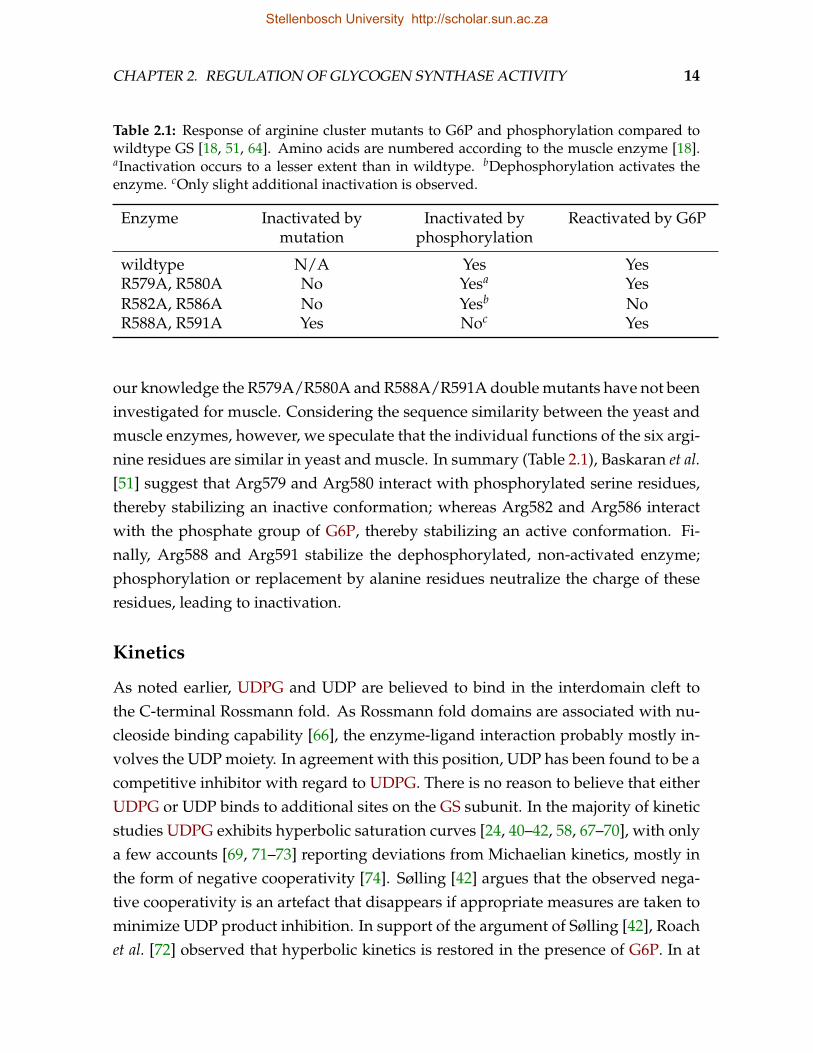
Table 2.1: Response of arginine cluster mutants to G6P and phosphorylation compared towildtype GS [18, 51, 64]. Amino acids are numbered according to the muscle enzyme [18].aInactivation occurs to a lesser extent than in wildtype. bDephosphorylation activates theenzyme. cOnly slight additional inactivation is observed.
Enzyme Inactivated bymutation
Inactivated byphosphorylation
Reactivated by G6P
wildtype N/A Yes YesR579A, R580A No Yesa YesR582A, R586A No Yesb NoR588A, R591A Yes Noc Yes
our knowledge the R579A/R580A and R588A/R591A double mutants have not beeninvestigated for muscle. Considering the sequence similarity between the yeast andmuscle enzymes, however, we speculate that the individual functions of the six argi-nine residues are similar in yeast and muscle. In summary (Table 2.1), Baskaran et al.[51] suggest that Arg579 and Arg580 interact with phosphorylated serine residues,thereby stabilizing an inactive conformation; whereas Arg582 and Arg586 interactwith the phosphate group of G6P, thereby stabilizing an active conformation. Fi-nally, Arg588 and Arg591 stabilize the dephosphorylated, non-activated enzyme;phosphorylation or replacement by alanine residues neutralize the charge of theseresidues, leading to inactivation.
Kinetics
As noted earlier, UDPG and UDP are believed to bind in the interdomain cleft tothe C-terminal Rossmann fold. As Rossmann fold domains are associated with nu-cleoside binding capability [66], the enzyme-ligand interaction probably mostly in-volves the UDP moiety. In agreement with this position, UDP has been found to be acompetitive inhibitor with regard to UDPG. There is no reason to believe that eitherUDPG or UDP binds to additional sites on the GS subunit. In the majority of kineticstudies UDPG exhibits hyperbolic saturation curves [24, 40–42, 58, 67–70], with onlya few accounts [69, 71–73] reporting deviations from Michaelian kinetics, mostly inthe form of negative cooperativity [74]. Sølling [42] argues that the observed nega-tive cooperativity is an artefact that disappears if appropriate measures are taken tominimize UDP product inhibition. In support of the argument of Sølling [42], Roachet al. [72] observed that hyperbolic kinetics is restored in the presence of G6P. In at
Stellenbosch University http://scholar.sun.ac.za
CHAPTER 2. REGULATION OF GLYCOGEN SYNTHASE ACTIVITY 15
least one account, G6P has been shown to counter UDP inhibition [75].The formation of tight enzyme-glycogen complexes [34, 43] indicates that, apart
from the N-domain binding site in the catalytic cleft, glycogen likely interacts withGS at several additional sites. Dıaz et al. [76] identified a non-catalytic glycogenbinding site on the surface of the N-domain of PaGS. Four glucose moieties of mal-tohexaose were found to bind at this site by curling around Tyr174. Mutation ofTyr174 to alanine decreased the acceptor affinity and specific activity with glycogenas substrate, but had no effect on specific activity with maltohexaose as acceptor.In cosedimentation experiments, the native enzyme was found in the pellet frac-tion, whereas the mutant (which still had an intact catalytic glycogen binding site)was located in the supernatant, suggesting that the non-catalytic site has a muchhigher affinity for glycogen than the catalytic site. Dıaz et al. [76] continued to iden-tify Tyr239 as the human muscle GS counterpart to Tyr174. Mutation of Tyr239 andthe nearby Tyr242 decreased both the affinity for glycogen and the specific activity,whereas specific activities were essentially unchanged with maltohexaose as accep-tor. Baskaran et al. [47] identified four maltodextran binding sites, in addition to thecatalytic site, on ScGS. One of these sites (site 1) corresponds roughly to the site iden-tified for PaGS, but involves unique eukaryotic structures and interestingly does notinclude the residue corresponding to Tyr174. The remaining three sites are locatedon the C-domain, with site 4 located in the catalytic cleft near the catalytic glyco-gen binding site. For all four sites, mutation of key residues decreased the Vmax andaffinity for glycogen. Only mutation of site 4 affected the activity with maltooctaoseas acceptor, leading the authors to suggest that this site is involved in positioningthe acceptor in the catalytic site.
The enhanced glycogen affinity brought about by the non-catalytic glycogen bind-ing sites essentially dictates that glycogen binding occurs in a positively cooperativefashion. As these additional sites have little or no effect on the affinity for oligosac-charides such as maltohexaose, this cooperativity is not expected to be the resultof any conformational change, but rather an increase in the apparent concentrationof chains (from the same glycogen molecule) in the vicinity of unoccupied sites onthe same and, possibly, neighbouring subunits. It is therefore surprising that kineticstudies report non-cooperative glycogen binding [24, 40, 41] or even negative co-operativity [74]. We speculate that this apparent contradiction could be resolved ifcomplex formation, which likely proceeds by positive cooperative binding, positionsthe tetramer such that only a single catalytic site is accessible to a glycogen chain. In
Stellenbosch University http://scholar.sun.ac.za
CHAPTER 2. REGULATION OF GLYCOGEN SYNTHASE ACTIVITY 16
such a situation, glycogen binding can be considered infinitely negatively coopera-tive. Infinitely negative cooperativity is kinetically equivalent to Michaelian kinetics.Deviation from this strict infinite negative cooperativity—such as if rotation of theenzyme allows an additional catalytic site to become available, albeit with a reducedaffinity for glycogen—would be observed as classic negative cooperativity.
Before we discuss the effects of modifiers on GS activity, a brief note on nomencla-ture is warranted. Following Cornish-Bowden [77], we use the term specific to referto any modification that results in an altered substrate affinity; and the term catalyticto refer to modification that results in an altered maximal velocity. We adopt theseterms because the more familiar terms (competitive and non-competitive) do not applyto the case of enzyme activation. The term competitive is still used to indicate thatligands physically compete for the same site, as opposed to affecting each other’sbinding affinity by another mechanism.
GS is allosterically regulated by G6P, ATP, and several other ligands. G6P is apotent activator of GS [22] and is generally recognized as the most important al-losteric modifier of GS. Several workers have reported that G6P activates GS byincreasing the substrate affinity, catalytic rate, or both. We will discuss the na-ture of G6P activation in detail in Section 2.4. ATP, on the other hand, inhibits GS[39, 42, 67, 78, 79]. This inhibition is brought about by decreasing the enzyme’s affin-ity for UDPG [39, 42]. To the best of our knowledge, there is no evidence that ATPalso inhibits GS catalytically, but this possibility cannot be ruled out. Regrettably,ATP inhibition is often neglected in GS kinetic studies. Kinetic studies that includeboth G6P and ATP indicate a competitive binding pattern [42, 67, 78]. However, con-trary to what is expected for pure competition, it has been noted in a few cases thatG6P saturation is unable to reverse ATP inhibition completely [42, 67]. Two explana-tions have been offered in this regard. First, G6P and ATP bind to different allostericsites, but binding of either ligand significantly decreases the affinity for the otherligand [67]. Alternatively, both ligands compete for the same allosteric site, but ATPalso competes with UDPG at the catalytic site [42]. In support of the latter explana-tion, it has been observed that the rat muscle enzyme is able to use ADP-glucose asa glucose donor at half the rate of UDPG [80], showing that the adenosine moiety isable to bind to the active site. Moreover, ScGS crystal structure data show that in theG6P binding pocket only the amino acid residues that bind the phosphate moiety areordered, with the remaining residues only assuming an ordered conformation uponligand binding [51]. The phosphate moiety is therefore likely a major determinant
Stellenbosch University http://scholar.sun.ac.za
CHAPTER 2. REGULATION OF GLYCOGEN SYNTHASE ACTIVITY 17
of ligand specificity at the allosteric site. This provides a basis on which G6P andATP—though structurally disparate, apart from the phosphate moiety—could bothbind to the same site. Activation and inhibition curves of G6P and ATP have beenfound by different workers to be either hyperbolic or sigmoidal. Cooperative G6Pbinding has mostly been observed for the phosphorylated enzyme [67, 69, 72, 81],but the dephosphorylated form has also been found to exhibit mild cooperativity[42]. ATP cooperativity has been observed for the dephosphorylated enzyme [67].There is also strong evidence for positive heterotropic cooperativity between G6Pand ATP binding [42, 67, 69]. ATP and ADP are probably equally important GS in-hibitors [39, 79], but detailed kinetic data for the latter ligand are very limited. AMPhas also been reported as a weak inhibitor of GS at high concentrations [39, 79], butconsidering the low AMP concentration in muscle it is unlikely that AMP is a signif-icant effector of GS in vivo. In the remainder of this review ATP serves as a modelGS inhibitor.
The kinetics of GS is influenced by several additional effectors, many of whichdo not clearly exhibit either activation or inhibition. Several G6P analogues suchas galactose-6-phosphate and glucosamine-6-phosphate activate GS, but to a lesserextent than G6P [22, 78]. Therefore, despite activating GS, these analogues inhibitactivation by G6P. UTP is a competitive inhibitor with respect to UDPG [67] andpossibly G6P [69]. ADP and AMP bind to the allosteric site and inhibit GS in a sim-ilar way as ATP [42, 79]. Sølling [42] suggests that these nucleotide inhibitors willall probably bind both to the catalytic site—by virtue of being nucleotides—and tothe allosteric site—by possessing phosphate moieties. Sulphate and inorganic phos-phate have been reported as either activators [42] or inhibitors [82], depending onphosphorylation state. Others found inorganic phosphate to be inhibitory regardlessof GS phosphorylation [39, 79].
Mg2+ activates GS, but becomes inhibitory in the absence of inhibitors [42]. Al-though direct interaction with GS cannot be ruled out, the ambiguous effect of Mg2+
is probably not the result of interaction with GS; instead, Mg2+ forms chelate com-plexes with the various GS activators and inhibitors, thereby mitigating their effects[42, 82]. Mg2+ activation is strongest with respect to allosteric site inhibitors such asATP [42]. The contention that a phosphate (or anionic) moiety is required for bindingat the allosteric site is supported by this observation, as the effect of Mg2+ is to neu-tralize the phosphate moiety. Activation by G6P, which also binds to the allostericsite, is not noticeably influenced by Mg2+ [42, 82], presumably because the associa-
Stellenbosch University http://scholar.sun.ac.za
CHAPTER 2. REGULATION OF GLYCOGEN SYNTHASE ACTIVITY 18
tion constant of Mg-G6P (Ka = 70 M−1, 30C; calculated from [83]) is three orders ofmagnitude lower than that of Mg-ATP (Ka = 73× 103 M−1, 30C [84]). Activation bypyrophosphate, which readily complexes with Mg2+, is however completely abol-ished by Mg2+ [42]. The phosphate moiety is probably less important for binding atthe catalytic site, as UDP inhibition is not markedly influenced by Mg2+ even thoughUDP readily complexes with Mg2+ (Ka = 4× 10³ M−1) [42]. Based on these observedeffects of Mg2+, we speculate that at high concentrations of Mg2+, ATP inhibitioncould shift away from the allosteric site to the catalytic site.
Finally, GS is phosphorylated in vivo at at least nine serine residues [85, 86]. Over-all, phosphorylation has a potent inhibitory effect, but not all phosphorylation sitesaffect the enzyme’s activity. We will discuss the regulation of GS by phosphoryla-tion in detail in Section 2.3. Briefly, inhibition by phosphorylation is the result of analtered affinity of GS for its reactants and modifiers and possibly a decrease in theturnover number (kcat).
Phenomenological rate equation
Up to this point, we have reviewed the general properties and kinetics of GS. Wenow proceed to develop a detailed formal treatment of GS kinetics that will serve asthe setting within which we will discuss the allosteric and covalent regulation of GS.The kinetics of most enzymes is adequately described with only the familiar con-cepts of maximal velocity and half-saturation concentrations parametrized by theVmax and Michaelis constants. In addition to these concepts, a formal treatment ofGS kinetics must also describe cooperativity, and catalytic and specific modification.To describe these concepts, we will here adopt the Hill formalism as generalized byHofmeyr & Cornish-Bowden [87], and Westermark et al. [88]. It is often considered aweakness of the Hill equation that it does not have a mechanistic interpretation; thatis, it is largely independent of the kinetic mechanism and the mechanism of cooper-ativity, at least for non-integer values of the Hill coefficient. However, we considerthis a strength when, as for GS, there is little agreement regarding these mechanismsin the first place. Moreover, while not all the Hill equation’s parameters have mecha-nistic interpretations, they have clear operational definitions. Nevertheless, it shouldbe mentioned that the Hill equation is unable to describe heterotropic cooperativitysuch as is observed for GS between G6P and ATP. This shortcoming does not alterthe meaning of any parameter, but requires us to consider ATP as constant whenG6P is varied and the other way around.
Stellenbosch University http://scholar.sun.ac.za
CHAPTER 2. REGULATION OF GLYCOGEN SYNTHASE ACTIVITY 19
Based on the properties and kinetics of GS discussed up to this point, we makethe following simplifying assumptions:
• glycogen is saturating and binds equally well as substrate and product to GSand is therefore left out
• product inhibition by UDP is significant, but binding at the allosteric site isnegligible
• G6P could be both a catalytic and specific activator
• ATP is only a specific inhibitor
• ATP binds to both the catalytic and allosteric site
• all other effectors are constant and their effects are absorbed in the explicitparameters
Eq. 2.4 then describes the velocity of the GS reaction as in Eq. 2.1 for a particularGS phosphorylation state at constant G6P and ATP concentrations [87]:
v =µcatVmax σ(σ + π)h−1
µspec + (σ + π)h ×(
1− ΓKeq
)(2.4)
where Vmax = kcat · [E]tot; kcat is the catalytic constant; [E]tot is the total GS concen-tration; σ = [UDPG]/UDPG0.5; π = [UDP]/UDP0.5; UDPG0.5 and UDP0.5 are theUDPG and UDP half-saturation concentrations in the absence of other ligands; h isthe degree of reactant (UDPG and UDP) binding cooperativity; Γ is the mass-actionratio; Keq is the equilibrium constant; and µcat and µspec describe catalytic and spe-cific modification. Note that when µcat = 1 and µspec = 1, then Eq. 2.4 simplifies tothe standard reversible Hill equation without modifier effects [87].
From the derivation by Westermark et al. [88] and considering our assumptions,the expression for µcat is given by
µcat =1 + γG6P · αG6P · ξhG6P
G6P + αATP · ξhATPATP
1 + αG6P · ξhG6PG6P + αATP · ξhATP
ATP
(2.5)
where ξG6P = [G6P]/G6P0.5; ξATP = [ATP]/ATP0.5; G6P0.5 and ATP0.5 are the G6Pand allosteric site ATP half-saturation concentrations in the absence of other ligands;γG6P ≥ 1 is the factor by which saturating G6P multiplies kcat (values larger thanunity indicate activation); αG6P ≥ 1 and αATP < 1 are the factors by which saturating
Stellenbosch University http://scholar.sun.ac.za
CHAPTER 2. REGULATION OF GLYCOGEN SYNTHASE ACTIVITY 20
G6P and ATP divide the reactant half-saturation concentrations; hG6P is the degreeof G6P binding cooperativity; and hATP is the degree of ATP binding cooperativity atthe allosteric site. Although we assume that ATP is not a catalytic inhibitor, it doesreverse catalytic activation by G6P and must therefore appear in µcat. In the absenceof G6P or if ATP is saturating, µcat = 1, thus reflecting our assumption that ATP doesnot affect the enzyme’s catalytic capacity. In the absence of ATP, on the other hand,µcat increases from unity to γG6P as the G6P concentration changes in the range fromzero to saturation. At saturating G6P concentrations, the maximal velocity of GS isthus multiplied by a factor γG6P.
Specific activation by G6P and ATP at the catalytic and allosteric sites is describedby µspec [87]:
µspec =(
1 + ξhATP′ATP′
)( 1 + ξhG6PG6P + ξhATP
ATP
1 + αG6P · ξhG6PG6P + αATP · ξhATP
ATP
)(2.6)
where ξATP′ = [ATP]/ATP′0.5; ATP′0.5 is the catalytic site ATP half-saturation con-centration in the absence of other ligands; and hATP′ is the degree of ATP bindingcooperativity at the catalytic site. If [G6P] G6P0.5, Eq. 2.6 simplifies to
µspec =1
αG6P
(1 + ξ
hATP′ATP′
)(2.7)
showing that, although G6P completely overcomes ATP inhibition at the allostericsite, ATP inhibition at the catalytic site would only be abolished for a large valueof αG6P. Saturation by ATP, on the other hand, causes µspec → ∞; that is, reactantbinding is completely inhibited.
The non-mathematically minded may safely ignore these equations, but shouldkeep the operational definitions of the parameters in mind, as they form the basisfor further discussion.
Measures of activity
The complex allosteric and covalent regulation of GS has led to the adoption of mea-sures such as activity ratio and fractional velocity to quantify the effects of phospho-rylation and the enzyme’s sensitivity to G6P. It was initially thought that GS—likeGP—is phosphorylated at only one site and that the phosphorylated form is entirelydependent on G6P for activity. This led Villar-Palasi & Larner [89] to introduce theactivity ratio as the ratio of enzyme activity in the absence of G6P (representative
Stellenbosch University http://scholar.sun.ac.za
CHAPTER 2. REGULATION OF GLYCOGEN SYNTHASE ACTIVITY 21
of I form activity) to that at saturating (typically 7.2 or 10 mM) G6P concentrations(representative of the total enzyme activity):
AR =vG6P=0
vG6PG6P0.5
=I
I + D(2.8)
The activity ratio, which is often alternatively known as the -G6P/+G6P ratioor expressed as a percentage (%I), can thus be interpreted as the fraction of totalenzyme that is present in the I form. However, as more phosphorylation sites werediscovered, it became clear that—although it provided a good measure of the effectof phosphorylation on GS kinetics—the activity ratio could no longer be considereda mole fraction. Guinovart et al. [90] offered an interpretation at the hand of theMichaelis-Menten equation, assuming that G6P has no catalytic effect and increasesthe UDPG affinity to the point of saturation for even the most phosphorylated states:
AR =v
Vmax=
σ
1 + σ(2.9)
where σ = [UDPG]/KUDPG. It is clear from Eq. 2.9 that the activity ratio is inde-pendent of the affinity of GS for G6P [90]. With Eq. 2.4 we are now in a position toprovide a more general expression for the activity ratio, accounting for both catalyticand specific activation. Setting [UDP] = 0 and [ATP] = 0, and substituting Eq. 2.4 inEq. 2.8, we obtain:
AR =1 + αG6P · σ
γG6P · αG6P(1 + σ)(2.10)
As in Eq. 2.9 the enzyme’s affinity for G6P does not influence the activity ratio,however, the degree to which saturating G6P activates GS catalytically (quantifiedby γG6P) and specifically (quantified by αG6P) is reflected in this value. In the limitwhere αG6P → ∞, i.e., supposing that saturating G6P will also enhance UDPG bind-ing to the point of saturation, and if γG6P = 1, i.e., G6P results in no catalytic acti-vation, Eq. 2.10 simplifies to Eq. 2.9. On the other hand, strong catalytic activation(very large γG6P) will generally result in low activity ratios. In the context of phos-phorylation, the activity ratio is then a measure of the effect of phosphorylation onUDPG binding affinity, and specific and catalytic activation by G6P. But it cannot bedetermined from the activity ratio alone whether phosphorylation affects the kcat orG6P0.5. Moreover, Guinovart et al. [90] point out that the activity ratio is only sensi-tive to changes in phosphorylation if σ ≈ 1, necessitating the use of high, impracticalUDPG concentrations for extensively phosphorylated enzyme states.
Stellenbosch University http://scholar.sun.ac.za
CHAPTER 2. REGULATION OF GLYCOGEN SYNTHASE ACTIVITY 22
Fractional velocity has been proposed as a more sensitive measure of the effectsof phosphorylation [90]. It is defined as the ratio of enzyme activity in the presenceof low physiological G6P concentrations to that in the presence of saturating G6P:
FVx =vG6P=x
vG6PG6P0.5
(2.11)
where x is a physiological G6P concentration. Substituting Eq. 2.4 into Eq. 2.11 yields
FVx =
(1 + αG6P · σ)(
1+γG6P·αG6P·ξhG6PG6P
1+αG6P·ξhG6PG6P
)
γG6P · αG6P
(1+ξ
hG6PG6P
1+αG6P·ξhG6PG6P
+ σ
) (2.12)
Since G6P increases the affinity of GS for UDPG, the fractional velocity reflectschanges in the degree of phosphorylation even if UDPG is not near its half-saturationconcentration [90]. Furthermore, it also reflects the effects of phosphorylation onG6P affinity.
Due to the complex kinetics of GS, even recent studies on the allosteric and cova-lent regulation of GS often only report the activity ratio or fractional velocity. It is inprinciple possible to determine kinetic parameter values from these ratios, providedthey were determined under differing conditions. In the sections to come, however,we will use the activity ratio and fractional velocity—keeping in mind their inter-pretations in terms of Eq. 2.4—only to examine trends in parameter values.
2.3 Regulation by phosphorylation
Rosell-Perez et al. [71] showed that GS can be isolated as two kinetically distinctforms: the active G6P-independent (I) form and the less active G6P-dependent (D)form. Their work was prompted by the observation that pre-incubation with insulinor G6P increased the enzyme’s activity in the absence of G6P. This activation wasthe first indication of the covalent modification now known to be reversible phos-phorylation. To date more than 15 phosphorylation sites have been discovered, butonly nine sites have so far been confirmed as in vivo targets [85]. GS was the firstenzyme in which hierarchical multisite phosphorylation was discovered and servesas a paradigm for this, now recognized as common, phenomenon [86, 91].
Stellenbosch University http://scholar.sun.ac.za
CHAPTER 2. REGULATION OF GLYCOGEN SYNTHASE ACTIVITY 23
2 2a 3a 3b 3c 4 5 1a 1b
PKAPhKCaMKIIAMPK CK1
PASKDYRK family
p38 MAPK
p38 MAPKDYRK2
GSK3
CK2
PKA
PKACaMKII
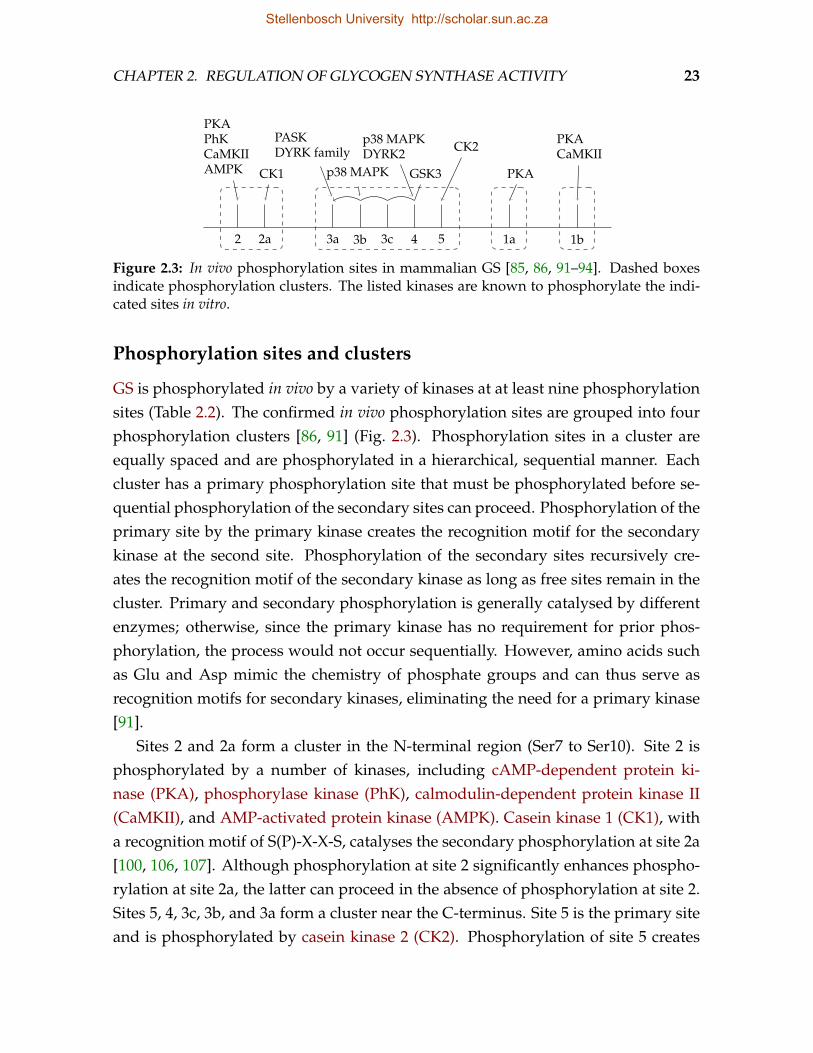
Figure 2.3: In vivo phosphorylation sites in mammalian GS [85, 86, 91–94]. Dashed boxesindicate phosphorylation clusters. The listed kinases are known to phosphorylate the indi-cated sites in vitro.
Phosphorylation sites and clusters
GS is phosphorylated in vivo by a variety of kinases at at least nine phosphorylationsites (Table 2.2). The confirmed in vivo phosphorylation sites are grouped into fourphosphorylation clusters [86, 91] (Fig. 2.3). Phosphorylation sites in a cluster areequally spaced and are phosphorylated in a hierarchical, sequential manner. Eachcluster has a primary phosphorylation site that must be phosphorylated before se-quential phosphorylation of the secondary sites can proceed. Phosphorylation of theprimary site by the primary kinase creates the recognition motif for the secondarykinase at the second site. Phosphorylation of the secondary sites recursively cre-ates the recognition motif of the secondary kinase as long as free sites remain in thecluster. Primary and secondary phosphorylation is generally catalysed by differentenzymes; otherwise, since the primary kinase has no requirement for prior phos-phorylation, the process would not occur sequentially. However, amino acids suchas Glu and Asp mimic the chemistry of phosphate groups and can thus serve asrecognition motifs for secondary kinases, eliminating the need for a primary kinase[91].
Sites 2 and 2a form a cluster in the N-terminal region (Ser7 to Ser10). Site 2 isphosphorylated by a number of kinases, including cAMP-dependent protein ki-nase (PKA), phosphorylase kinase (PhK), calmodulin-dependent protein kinase II(CaMKII), and AMP-activated protein kinase (AMPK). Casein kinase 1 (CK1), witha recognition motif of S(P)-X-X-S, catalyses the secondary phosphorylation at site 2a[100, 106, 107]. Although phosphorylation at site 2 significantly enhances phospho-rylation at site 2a, the latter can proceed in the absence of phosphorylation at site 2.Sites 5, 4, 3c, 3b, and 3a form a cluster near the C-terminus. Site 5 is the primary siteand is phosphorylated by casein kinase 2 (CK2). Phosphorylation of site 5 creates
Stellenbosch University http://scholar.sun.ac.za
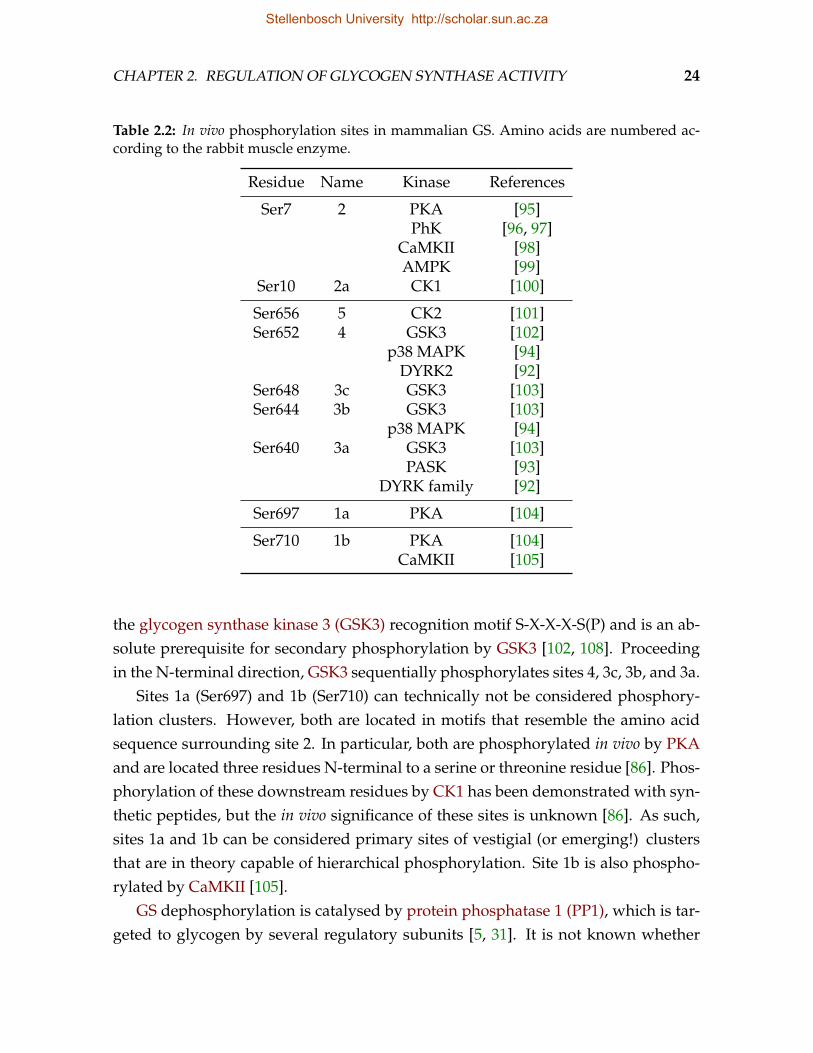
CHAPTER 2. REGULATION OF GLYCOGEN SYNTHASE ACTIVITY 24
Table 2.2: In vivo phosphorylation sites in mammalian GS. Amino acids are numbered ac-cording to the rabbit muscle enzyme.
Residue Name Kinase References
Ser7 2 PKA [95]PhK [96, 97]
CaMKII [98]AMPK [99]
Ser10 2a CK1 [100]
Ser656 5 CK2 [101]Ser652 4 GSK3 [102]
p38 MAPK [94]DYRK2 [92]
Ser648 3c GSK3 [103]Ser644 3b GSK3 [103]
p38 MAPK [94]Ser640 3a GSK3 [103]
PASK [93]DYRK family [92]
Ser697 1a PKA [104]
Ser710 1b PKA [104]CaMKII [105]
the glycogen synthase kinase 3 (GSK3) recognition motif S-X-X-X-S(P) and is an ab-solute prerequisite for secondary phosphorylation by GSK3 [102, 108]. Proceedingin the N-terminal direction, GSK3 sequentially phosphorylates sites 4, 3c, 3b, and 3a.
Sites 1a (Ser697) and 1b (Ser710) can technically not be considered phosphory-lation clusters. However, both are located in motifs that resemble the amino acidsequence surrounding site 2. In particular, both are phosphorylated in vivo by PKAand are located three residues N-terminal to a serine or threonine residue [86]. Phos-phorylation of these downstream residues by CK1 has been demonstrated with syn-thetic peptides, but the in vivo significance of these sites is unknown [86]. As such,sites 1a and 1b can be considered primary sites of vestigial (or emerging!) clustersthat are in theory capable of hierarchical phosphorylation. Site 1b is also phospho-rylated by CaMKII [105].
GS dephosphorylation is catalysed by protein phosphatase 1 (PP1), which is tar-geted to glycogen by several regulatory subunits [5, 31]. It is not known whether
Stellenbosch University http://scholar.sun.ac.za
CHAPTER 2. REGULATION OF GLYCOGEN SYNTHASE ACTIVITY 25
dephosphorylation follows a sequential pattern. There is some indication that de-phosphorylation of sites 2 and 2a proceeds sequentially and in the opposite directionto phosphorylation: a phosphate at site 2a inhibits dephosphorylation of site 2 [109].At least one case has been reported where a protein phosphorylated sequentiallyby CK2 and GSK3 undergoes sequential dephosphorylation in the reverse direction[110]. However, it is not known whether the GS sites phosphorylated by these en-zymes are also dephosphorylated sequentially.
Despite the cluster organization of phosphorylation sites, phosphorylation doesnot always proceed hierarchically. Members of the dual specificity tyrosine phos-phorylation regulated protein kinase (DYRK) family [92], PAS kinase (PASK) [93],and mitogen-activated protein kinase (p38 MAPK) [94] do not require prior phos-phorylation (their recognition motifs do not include a phosphorylated serine residue)and are thus able to circumvent hierarchical phosphorylation. DYRK1A, DYRK1B,DYRK2, and PASK directly phosphorylate site 3a. DYRK2 possibly phosphorylatessite 4 [92], acting as a primary kinase by creating the recognition motif of GSK3 thatwould allow secondary phosphorylation by this kinase without prior phosphoryla-tion by CK2 at site 5. Likewise p38 MAPK phosphorylates sites 4 and 3b. p38 MAPKalso phosphorylates three other sites—Thr713, Thr718, and Ser724—in vitro, but it isnot known whether these sites are phosphorylated in vivo. Thr173 is the “secondary”site of site 1b.
The obligate sequential phosphorylation of GS by GSK3 begs the question whe-ther the phosphorylation is processive (several sites are phosphorylated before thekinases dissociates from its substrate) or distributive (at most one site is phosphory-lated before the kinase dissociates). Working with synthetic peptides, Fiol et al. [111]observed intermediate phosphorylation states, suggesting that phosphorylation isdistributive. However, they also noted that some intermediate states accumulatedto a lesser extent than others, indicating that phosphorylation at these sites is alsoprocessive to some degree.
Kinetic effects of phosphorylation
The majority of kinetic studies on GS have been done within the paradigm of thetwo-state I/D model of phosphorylation. However, as the exact phosphorylationstate of many of the isolated I or D forms is unknown, kinetic parameters reportedin these studies are highly variable. The difficulty in isolating completely dephos-phorylated GS is well-known to experimentalists and has led to the adoption of
Stellenbosch University http://scholar.sun.ac.za
CHAPTER 2. REGULATION OF GLYCOGEN SYNTHASE ACTIVITY 26
bacterial expression systems [107]. It is also unlikely that the D forms isolated byvarious workers were phosphorylated to the same extent or at the same sites. More-over, supraphysiological kinase concentrations were often used, resulting in non-specific phosphorylation and phosphorylation at sites that would not occur in vivo[86]. Nevertheless, a comparison of the reported I and D kinetics provides usefulinformation regarding the general effect of phosphorylation. In this section we willexplore the general effects of phosphorylation—which is believed to be mediatedby the interaction of phosphorylated serine residues with the basic residues in thearginine cluster—on the kinetic parameters of GS as defined by Eq. 2.4, and the con-tribution of individual phosphorylation sites towards these effects.
Modification of kinetic parameters
It is not clear whether phosphorylation affects the kcat of GS. Due to the low ac-tivity of phosphorylated GS, the specific activity is often determined at saturatingG6P. However, by comparing these specific activities, one can only draw conclu-sions about the effect of phosphorylation on the apparent kcat, which is defined askcat,app = kcat · γG6P at saturating G6P. Interestingly, kcat,app appears to be unaffectedby phosphorylation, since phosphorylated and dephosphorylated forms have sim-ilar maximal activities in the presence of G6P [71, 72, 112, 113]. This could eitherbe interpreted to mean that phosphorylation does not alter kcat, or that both kcat andγG6P are altered such that their product remains constant. In cases where the specificactivity has been determined for various phosphorylation states of GS in the absenceof G6P [114, 115], a decline in this value cannot be attributed exclusively to a declinein kcat, as in the absence of G6P the UDPG concentration (4.4 mM) used in the assaysis not necessarily saturating. Roach et al. [72] observed essentially the same Vmax fora number of phosphorylation states; assuming similar enzyme concentrations, thissuggests that phosphorylation does not affect the kcat.
As will be discussed in Section 2.3, particular phosphorylation sites target GSto specific subcellular locations. Phosphorylation at these sites does not affect theactivity of GS per se, but by targeting GS to glycogen-rich pools could increase theapparent local total GS concentration [E]tot, and thus the maximal velocity.
The most pronounced effect of phosphorylation is a marked decrease in UDPGaffinity, i.e., phosphorylation increases UDPG0.5. Rosell-Perez and co-workers ob-served a four-fold higher UDPG0.5 in rat muscle [71], a 1.5-fold higher UDPG0.5 inrabbit muscle [116], and a five-fold higher UDPG0.5 in dog muscle [117] for the D
Stellenbosch University http://scholar.sun.ac.za
CHAPTER 2. REGULATION OF GLYCOGEN SYNTHASE ACTIVITY 27
form than for the I form. The fold increase was much smaller in all three cases in thepresence of G6P. These and other data have been interpreted to mean that at satu-rating G6P the apparent UDPG0.5 is independent of phosphorylation state [113]. Atsaturating G6P the apparent UDPG0.5 is defined as UDPG0.5,app = UDPG0.5/αG6P.In order for UDPG0.5,app to remain constant despite phosphorylation, any increase inUDPG0.5 must be matched by an equal increase in αG6P. Others have only observeda significant difference in UDPG0.5 for the I and D forms in the presence of highATP concentrations (6 mM) [39]. Roach et al. [72] isolated nine samples of GS withphosphate contents ranging from 0.27 to 3.49 mol per mol subunit. In these samplesUDPG0.5 increased with the phosphate content from 1.3 to 9100 mM. In the pres-ence of 5 mM G6P it increased from 65 to 160 µM. These high values obtained for themore phosphorylated forms are probably artefactual, as discussed by the authors,but the overall trend is nevertheless clear. Similarly, Guinovart et al. [90] recorded anincrease in UDPG0.5 from 1.5 to 200 mM as the number of phosphates per subunitincreased from 0 to 4.3.
It should be noted that, in order to adhere to the thermodynamic constraints ofthe Haldane equation, phosphorylation must have equal effects on UDPG0.5 andUDP0.5. However, it has been noted in a few cases that phosphorylation strengthensUDP inhibition, i.e. it decreases UDP0.5 [79, 118]. If this is indeed the case, phosphory-lation should also be expected to have differential effects on the forward and reversecatalytic constants.
Piras et al. [39, 67] noted that higher G6P concentrations are necessary to reverseATP inhibition in the D form than in the I form, and that the D form is much morestrongly inhibited by ATP than the I form. Since they observed no effect of G6Pon UDPG0.5 at pH 6.6, the higher G6P requirements suggest that G6P0.5 increaseswith phosphorylation, i.e., the affinity for G6P decreases, while the affinity for ATPincreases. Without parameter fitting it cannot be determined whether the increasein ATP affinity is the result of decreased ATP′0.5, ATP0.5, or both. Roach et al. [72]showed that G6P0.5 could increase by roughly three orders of magnitude as the phos-phate content increased from 0.27 to 3.49 mol per mol subunit. Similarly, Nimmoet al. [119] observed an increase in G6P0.5 from 0.05 to 10 mM as the number of phos-phates per subunit increased from 0 to 1.95. Wang & Roach [120] found that com-plete phosphorylation by GSK3 increased G6P0.5 ten-fold, whereas phosphorylationby PKA and CK1 increased G6P0.5 100-fold [56].
As discussed earlier, there is evidence that γG6P and αG6P increase with phospho-
Stellenbosch University http://scholar.sun.ac.za
CHAPTER 2. REGULATION OF GLYCOGEN SYNTHASE ACTIVITY 28
rylation such that the effects of phosphorylation on kcat and UDPG0.5 are cancelledby saturating G6P. However, although the specific activation of GS by G6P is well-established, it is much less certain whether G6P also increases the catalytic capacity(kcat) of GS. However, if kcat · γG6P is indeed independent of the phosphorylationstate and if γG6P > 1, then it is implied that phosphorylation also affects kcat. Theeffect of phosphorylation on αATP is not known. However, in analogy to αG6P, wespeculate that αATP approaches unity as phosphorylation increases; that is, ATP willbring about little further inhibition in GS states that are already substantially inhib-ited by phosphorylation.
It is generally accepted that UDPG binding is non-cooperative, i.e. h = 1, regard-less of the phosphorylation state of GS. Hyperbolic kinetics have been reported forboth the I form and D form [24, 41, 67]. Even in cases where negative cooperativityhas been reported, h appears to be unaffected by phosphorylation. Roach et al. [72]reported an average h value of 0.8 for nine GS samples of varying phosphorylationdegrees. In the presence of G6P, this value increased to unity for all phosphorylationstates, thus restoring hyperbolic kinetics.
Roach et al. [72] reported an increase in sigmoidicity with regard to G6P withphosphorylation, i.e. hG6P increased with phosphorylation. Hill plots of their datawere, however, not linear. In support of these findings, Piras et al. [67] observedsteeper Hill plots for the D form than the I form. This effect was potentiated in thepresence of ATP. ATP did not seem to affect hG6P in the I form. Similar results wereobserved for the D form in bovine heart [69]. Phosphorylation of sites in the N-terminal region, however, appears to have little effect on hG6P [56]. Plesner et al. [82]observed sigmoid kinetics with regard to G6P only at low substrate concentrations.
The converse was observed with regard to hATP, i.e. sigmoidicity with respect toATP binding decreases with phosphorylation [67]. In the I form, G6P increased hATP,but in the D form G6P had little effect.
Importance of individual phosphorylation sites
Thus far we have discussed the general effect of phosphorylation on GS kineticswithout considering the importance of specific phosphorylation sites towards theobserved change in kinetic parameters. Much time has been devoted to determinewhich phosphorylation sites have the greatest influence on GS kinetics. The rela-tive importance of a particular site can be assigned by considering the effect thatphosphorylation of the site has on the activity ratio.
Stellenbosch University http://scholar.sun.ac.za
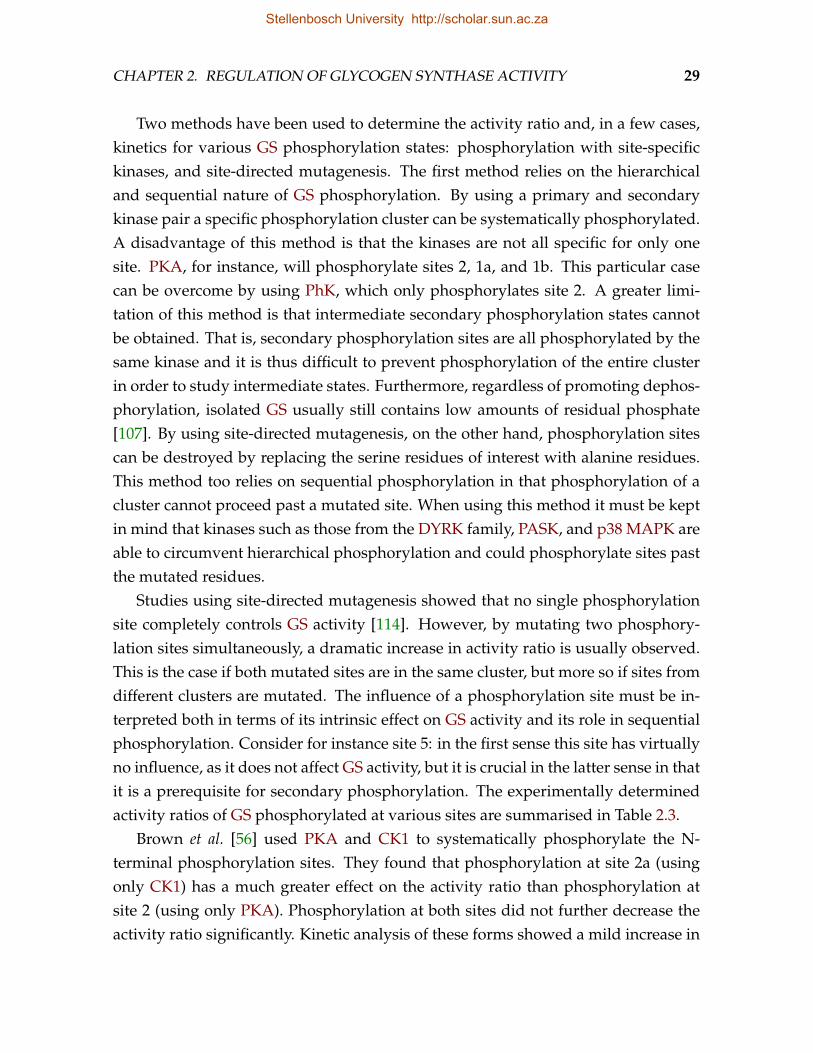
CHAPTER 2. REGULATION OF GLYCOGEN SYNTHASE ACTIVITY 29
Two methods have been used to determine the activity ratio and, in a few cases,kinetics for various GS phosphorylation states: phosphorylation with site-specifickinases, and site-directed mutagenesis. The first method relies on the hierarchicaland sequential nature of GS phosphorylation. By using a primary and secondarykinase pair a specific phosphorylation cluster can be systematically phosphorylated.A disadvantage of this method is that the kinases are not all specific for only onesite. PKA, for instance, will phosphorylate sites 2, 1a, and 1b. This particular casecan be overcome by using PhK, which only phosphorylates site 2. A greater limi-tation of this method is that intermediate secondary phosphorylation states cannotbe obtained. That is, secondary phosphorylation sites are all phosphorylated by thesame kinase and it is thus difficult to prevent phosphorylation of the entire clusterin order to study intermediate states. Furthermore, regardless of promoting dephos-phorylation, isolated GS usually still contains low amounts of residual phosphate[107]. By using site-directed mutagenesis, on the other hand, phosphorylation sitescan be destroyed by replacing the serine residues of interest with alanine residues.This method too relies on sequential phosphorylation in that phosphorylation of acluster cannot proceed past a mutated site. When using this method it must be keptin mind that kinases such as those from the DYRK family, PASK, and p38 MAPK areable to circumvent hierarchical phosphorylation and could phosphorylate sites pastthe mutated residues.
Studies using site-directed mutagenesis showed that no single phosphorylationsite completely controls GS activity [114]. However, by mutating two phosphory-lation sites simultaneously, a dramatic increase in activity ratio is usually observed.This is the case if both mutated sites are in the same cluster, but more so if sites fromdifferent clusters are mutated. The influence of a phosphorylation site must be in-terpreted both in terms of its intrinsic effect on GS activity and its role in sequentialphosphorylation. Consider for instance site 5: in the first sense this site has virtuallyno influence, as it does not affect GS activity, but it is crucial in the latter sense in thatit is a prerequisite for secondary phosphorylation. The experimentally determinedactivity ratios of GS phosphorylated at various sites are summarised in Table 2.3.
Brown et al. [56] used PKA and CK1 to systematically phosphorylate the N-terminal phosphorylation sites. They found that phosphorylation at site 2a (usingonly CK1) has a much greater effect on the activity ratio than phosphorylation atsite 2 (using only PKA). Phosphorylation at both sites did not further decrease theactivity ratio significantly. Kinetic analysis of these forms showed a mild increase in
Stellenbosch University http://scholar.sun.ac.za
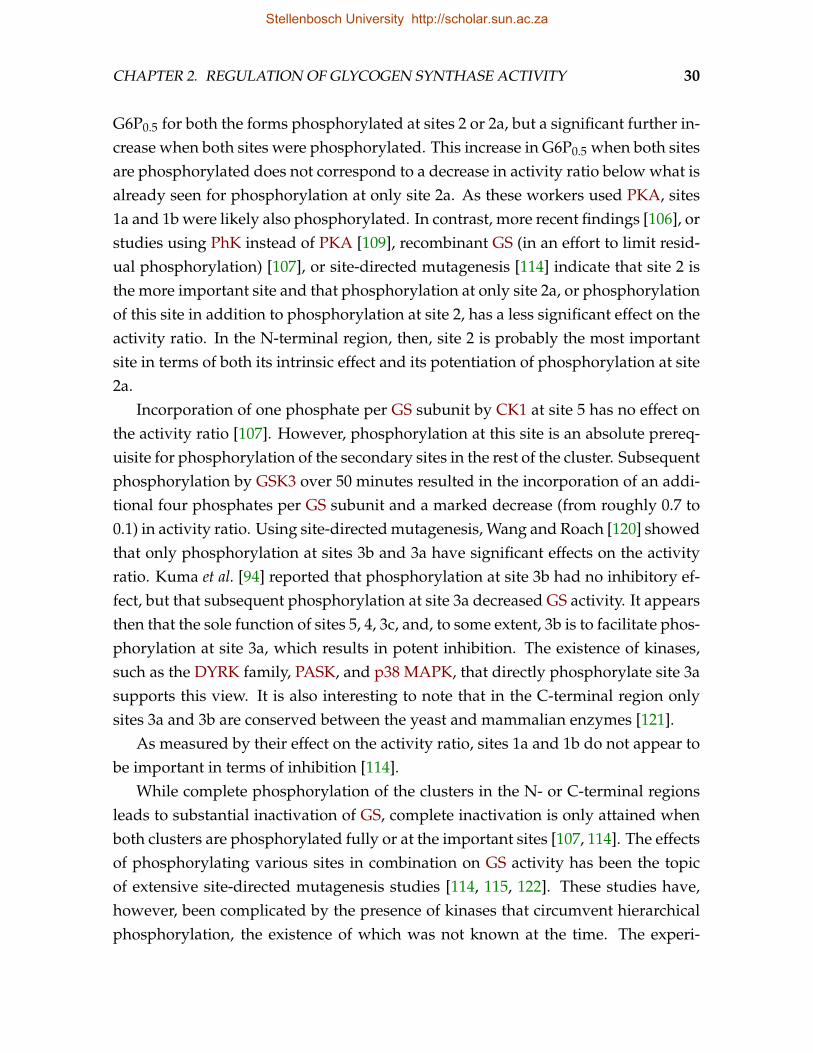
CHAPTER 2. REGULATION OF GLYCOGEN SYNTHASE ACTIVITY 30
G6P0.5 for both the forms phosphorylated at sites 2 or 2a, but a significant further in-crease when both sites were phosphorylated. This increase in G6P0.5 when both sitesare phosphorylated does not correspond to a decrease in activity ratio below what isalready seen for phosphorylation at only site 2a. As these workers used PKA, sites1a and 1b were likely also phosphorylated. In contrast, more recent findings [106], orstudies using PhK instead of PKA [109], recombinant GS (in an effort to limit resid-ual phosphorylation) [107], or site-directed mutagenesis [114] indicate that site 2 isthe more important site and that phosphorylation at only site 2a, or phosphorylationof this site in addition to phosphorylation at site 2, has a less significant effect on theactivity ratio. In the N-terminal region, then, site 2 is probably the most importantsite in terms of both its intrinsic effect and its potentiation of phosphorylation at site2a.
Incorporation of one phosphate per GS subunit by CK1 at site 5 has no effect onthe activity ratio [107]. However, phosphorylation at this site is an absolute prereq-uisite for phosphorylation of the secondary sites in the rest of the cluster. Subsequentphosphorylation by GSK3 over 50 minutes resulted in the incorporation of an addi-tional four phosphates per GS subunit and a marked decrease (from roughly 0.7 to0.1) in activity ratio. Using site-directed mutagenesis, Wang and Roach [120] showedthat only phosphorylation at sites 3b and 3a have significant effects on the activityratio. Kuma et al. [94] reported that phosphorylation at site 3b had no inhibitory ef-fect, but that subsequent phosphorylation at site 3a decreased GS activity. It appearsthen that the sole function of sites 5, 4, 3c, and, to some extent, 3b is to facilitate phos-phorylation at site 3a, which results in potent inhibition. The existence of kinases,such as the DYRK family, PASK, and p38 MAPK, that directly phosphorylate site 3asupports this view. It is also interesting to note that in the C-terminal region onlysites 3a and 3b are conserved between the yeast and mammalian enzymes [121].
As measured by their effect on the activity ratio, sites 1a and 1b do not appear tobe important in terms of inhibition [114].
While complete phosphorylation of the clusters in the N- or C-terminal regionsleads to substantial inactivation of GS, complete inactivation is only attained whenboth clusters are phosphorylated fully or at the important sites [107, 114]. The effectsof phosphorylating various sites in combination on GS activity has been the topicof extensive site-directed mutagenesis studies [114, 115, 122]. These studies have,however, been complicated by the presence of kinases that circumvent hierarchicalphosphorylation, the existence of which was not known at the time. The experi-
Stellenbosch University http://scholar.sun.ac.za
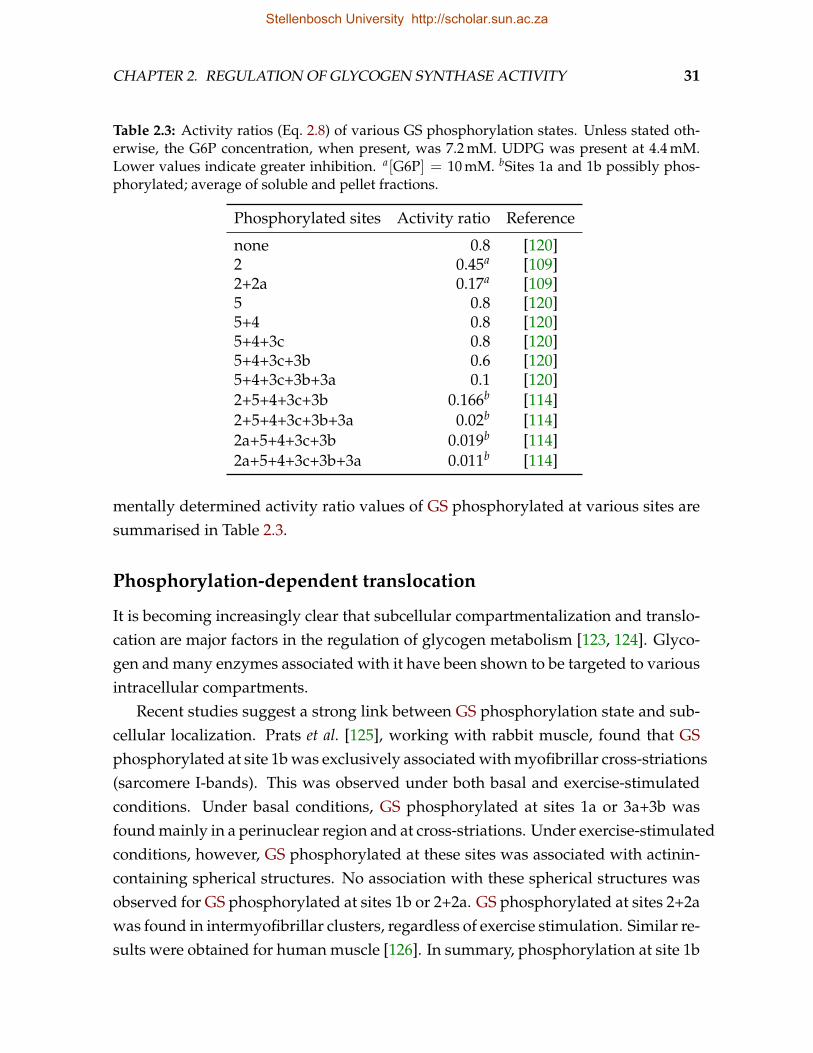
CHAPTER 2. REGULATION OF GLYCOGEN SYNTHASE ACTIVITY 31
Table 2.3: Activity ratios (Eq. 2.8) of various GS phosphorylation states. Unless stated oth-erwise, the G6P concentration, when present, was 7.2 mM. UDPG was present at 4.4 mM.Lower values indicate greater inhibition. a[G6P] = 10 mM. bSites 1a and 1b possibly phos-phorylated; average of soluble and pellet fractions.
Phosphorylated sites Activity ratio Reference
none 0.8 [120]2 0.45a [109]2+2a 0.17a [109]5 0.8 [120]5+4 0.8 [120]5+4+3c 0.8 [120]5+4+3c+3b 0.6 [120]5+4+3c+3b+3a 0.1 [120]2+5+4+3c+3b 0.166b [114]2+5+4+3c+3b+3a 0.02b [114]2a+5+4+3c+3b 0.019b [114]2a+5+4+3c+3b+3a 0.011b [114]
mentally determined activity ratio values of GS phosphorylated at various sites aresummarised in Table 2.3.
Phosphorylation-dependent translocation
It is becoming increasingly clear that subcellular compartmentalization and translo-cation are major factors in the regulation of glycogen metabolism [123, 124]. Glyco-gen and many enzymes associated with it have been shown to be targeted to variousintracellular compartments.
Recent studies suggest a strong link between GS phosphorylation state and sub-cellular localization. Prats et al. [125], working with rabbit muscle, found that GSphosphorylated at site 1b was exclusively associated with myofibrillar cross-striations(sarcomere I-bands). This was observed under both basal and exercise-stimulatedconditions. Under basal conditions, GS phosphorylated at sites 1a or 3a+3b wasfound mainly in a perinuclear region and at cross-striations. Under exercise-stimulatedconditions, however, GS phosphorylated at these sites was associated with actinin-containing spherical structures. No association with these spherical structures wasobserved for GS phosphorylated at sites 1b or 2+2a. GS phosphorylated at sites 2+2awas found in intermyofibrillar clusters, regardless of exercise stimulation. Similar re-sults were obtained for human muscle [126]. In summary, phosphorylation at site 1b
Stellenbosch University http://scholar.sun.ac.za
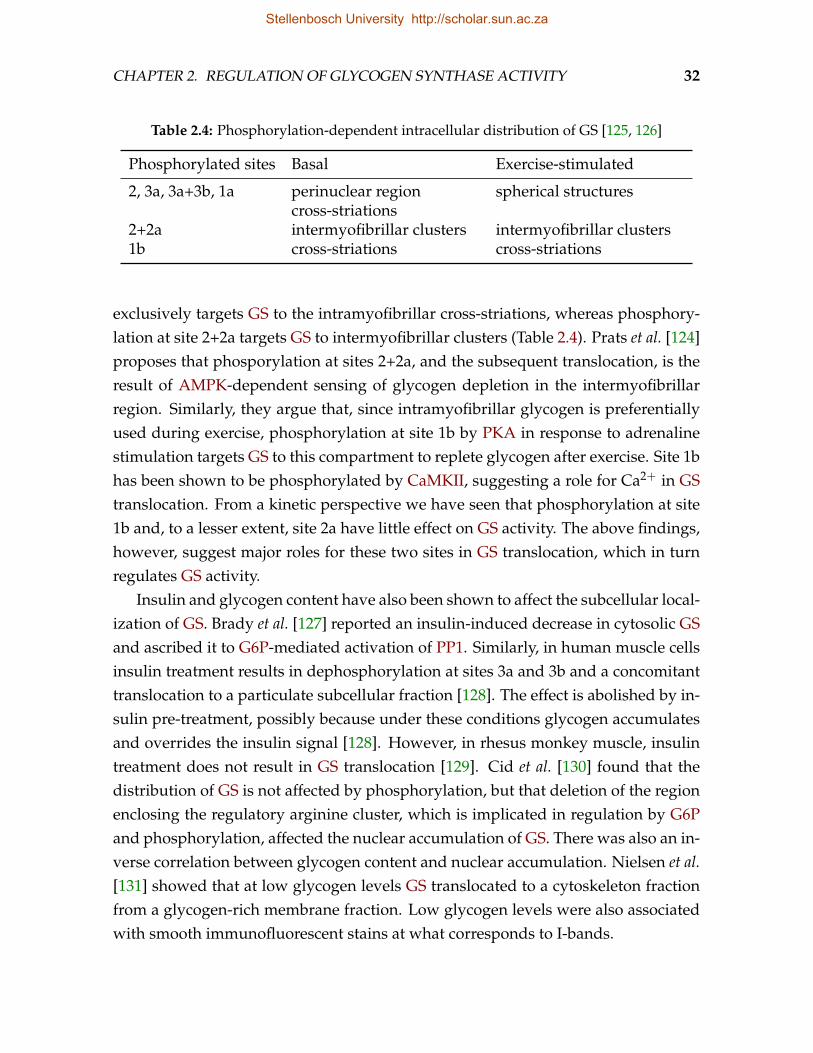
CHAPTER 2. REGULATION OF GLYCOGEN SYNTHASE ACTIVITY 32
Table 2.4: Phosphorylation-dependent intracellular distribution of GS [125, 126]
Phosphorylated sites Basal Exercise-stimulated
2, 3a, 3a+3b, 1a perinuclear regioncross-striations
spherical structures
2+2a intermyofibrillar clusters intermyofibrillar clusters1b cross-striations cross-striations
exclusively targets GS to the intramyofibrillar cross-striations, whereas phosphory-lation at site 2+2a targets GS to intermyofibrillar clusters (Table 2.4). Prats et al. [124]proposes that phosporylation at sites 2+2a, and the subsequent translocation, is theresult of AMPK-dependent sensing of glycogen depletion in the intermyofibrillarregion. Similarly, they argue that, since intramyofibrillar glycogen is preferentiallyused during exercise, phosphorylation at site 1b by PKA in response to adrenalinestimulation targets GS to this compartment to replete glycogen after exercise. Site 1bhas been shown to be phosphorylated by CaMKII, suggesting a role for Ca2+ in GStranslocation. From a kinetic perspective we have seen that phosphorylation at site1b and, to a lesser extent, site 2a have little effect on GS activity. The above findings,however, suggest major roles for these two sites in GS translocation, which in turnregulates GS activity.
Insulin and glycogen content have also been shown to affect the subcellular local-ization of GS. Brady et al. [127] reported an insulin-induced decrease in cytosolic GSand ascribed it to G6P-mediated activation of PP1. Similarly, in human muscle cellsinsulin treatment results in dephosphorylation at sites 3a and 3b and a concomitanttranslocation to a particulate subcellular fraction [128]. The effect is abolished by in-sulin pre-treatment, possibly because under these conditions glycogen accumulatesand overrides the insulin signal [128]. However, in rhesus monkey muscle, insulintreatment does not result in GS translocation [129]. Cid et al. [130] found that thedistribution of GS is not affected by phosphorylation, but that deletion of the regionenclosing the regulatory arginine cluster, which is implicated in regulation by G6Pand phosphorylation, affected the nuclear accumulation of GS. There was also an in-verse correlation between glycogen content and nuclear accumulation. Nielsen et al.[131] showed that at low glycogen levels GS translocated to a cytoskeleton fractionfrom a glycogen-rich membrane fraction. Low glycogen levels were also associatedwith smooth immunofluorescent stains at what corresponds to I-bands.
Stellenbosch University http://scholar.sun.ac.za
CHAPTER 2. REGULATION OF GLYCOGEN SYNTHASE ACTIVITY 33
Function of GS multisite phosphorylation
Compared to GP, which is phosphorylated at only a single site, the multisite phos-phorylation of GS seems almost excessive. Multisite phosphorylation is, however,not uncommon. Its prevalence and general function have been reviewed extensively[91, 132, 133]. Here we will discuss its function as it pertains to GS. As discussed, GShas both dispersed sites and clusters, and within clusters phosphorylation is hierar-chical, sequential, and mostly distributive.
Multisite phosphorylation facilitates the integration of signals from the variousendocrine, neural, and metabolic stimuli. As regards GS, signal integration is man-ifested on the level of both individual phosphorylation sites and clusters. Multiplekinases phosphorylate the same sites or clusters, and many sites share the same ki-nase. Site 2 is a substrate for numerous kinases regulated by different signals. Sim-ilarly, site 3a can be phosphorylated directly by a number of kinases, or via hierar-chical and sequential phosphorylation by GSK3. Site 1b is likewise phosphorylatedboth by PKA and CaMKII. The adrenaline-stimulated cAMP-dependent pathwayand the insulin-stimulated PI3K-dependent pathway—arguably the most prominentGS phosphorylation pathways—each affects different phosphorylation clusters.
Hierarchical phosphorylation is not a prerequisite for sequential phosphoryla-tion. Appropriately positioned anionic amino acids are able to mimic phosphory-lated primary phosphorylation sites and thus allow for sequential secondary phos-phorylation [91]. However, hierarchical phosphorylation facilitates regulation attwo levels: primary phosphorylation and secondary phosphorylation [86]. As bothare catalysed by different kinases, each kinase can be regulated independently. Inthe N-terminal cluster of GS, it is the primary kinases that are regulated; either bythe cAMP-dependent pathway (PKA) or by metabolic signals (AMPK). In the C-terminal cluster, on the other hand, the secondary kinase, GSK3, is regulated via thePI3K-dependent pathway. In addition, phosphorylation can also be regulated at thephosphatase level. Both adrenaline- and insulin-stimulation regulate PP1 activity.
In a random phosphorylation mechanism, the number of phosphorylation statesper subunit increases exponentially with the number of phosphorylation sites. Aprotein subunit with n phosphorylation sites can result in up to 2n phosphorylationstates. In sequential phosphorylation, on the other hand, the number of phosphory-lation states is a linear function (n+ 1) of the number of sites. If one assumes strict se-quential phosphorylation (and dephosphorylation), the number of distinct GS phos-phorylation states per subunit amounts to (2 + 1) × (5 + 1) × 2× 2 = 72. Were a
Stellenbosch University http://scholar.sun.ac.za
CHAPTER 2. REGULATION OF GLYCOGEN SYNTHASE ACTIVITY 34
random mechanism employed, the number of states would amount to 29 = 512. Se-quential phosphorylation therefore severely limits the number of phosphorylationstates and brings about an orderly transition between different states. This is ben-eficial if, as in the case of GS, only specific phosphorylation sites (for example, site3a) elicit a particular effect. Phosphorylation of site 3a can be achieved and reversedwith precision by adjusting the ratio of kinases to phosphatases appropriately in asequential mechanism. In a random mechanism, on the other hand, phosphoryla-tion of a particular site cannot be achieved with precision. However, a number ofkinases circumvents sequential GS phosphorylation, obscuring any benefit it mightentail. The number of states per cluster is therefore also likely significantly morethan 72.
It has been argued (as discussed by Gunawardena [134]) that multisite phospho-rylation, particularly if it proceeds distributively and sequentially, results in an ultra-sensitive response to the ratio of kinase to phosphate, so that below a certain thresh-old the protein in question would be almost completely dephosphorylated, whereasabove the threshold complete phosphorylation is rapidly attained. According to thisview, more phosphorylation sites result in higher sensitivity, approaching switch-like behaviour. However, it has been demonstrated [134] that, although multiplephosphorylation creates a sharp threshold, an increase of the kinase to phosphataseratio beyond the threshold does not result in switch-like behaviour, i.e., completephosphorylation does not ensue rapidly. On the contrary, beyond the threshold,the response becomes milder as the number of phosphorylation sites increases. Itseems feasible then that a function of the sequential phosphorylation of GS is tofine-tune the threshold at which the ratio of kinase to phosphatase elicits a response.This is particularly of interest if one considers that, apart from GS, GSK3 has nu-merous substrates in various signalling pathways [135]; regulation of GSK3 affectsall these pathways, but by employing multiple phosphorylation to different extents,each pathway can refine its response to changes in GSK3 levels.
2.4 Regulation by glucose-6-phosphate
In 1959 Leloir et al. [22] were the first to show that G6P activates GS. They contin-ued to show that G6P, which can appear to be a requirement for catalysis by highlyphosphorylated GS, does not take part in the reaction and presumably binds to an al-losteric site. This initial work was followed by kinetic studies in a variety of species
Stellenbosch University http://scholar.sun.ac.za
CHAPTER 2. REGULATION OF GLYCOGEN SYNTHASE ACTIVITY 35
[71, 116, 117, 136, 137], which suggested that GS activation by G6P is a universalfeature in eukaryotes. The regulation of GS by G6P is multifaceted and the initialassessment of Leloir et al. [22] is no surprise:
“As to the mechanism by which G-6-P increases the activity of the glycogen-forming enzyme, no clue was obtained.”
To date five mechanisms have been described by which G6P affects GS activity:it is 1) a substrate precursor, 2) an allosteric GS activator, 3) a GS kinase inhibitor, 4)a GS phosphatase activator, and 5) it enhances the export of GS from the nucleus.In this section we will discuss the binding of G6P to GS and the resulting confor-mational change that leads to activation (both allosteric and covalent) and possiblytranslocation of GS.
G6P-induced conformational change
The activation of GS by G6P must ultimately be the result of some conformationalchange, but little is known about such a conformational change in the muscle en-zyme. However, due to the high degree of conservation between the yeast andmuscle enzymes, it is instructive to consider the conformational change inducedin ScGS upon G6P binding as revealed by the crystal structure of this enzyme inthe presence of G6P [51]. In ScGS, G6P binds between the R helix (α22) and helixα13. The former contains the regulatory arginine cluster and links the crossed-overC-terminus and the phosphorylation sites to the C-terminal Rossmann fold domain.Helix α13 (together with α12) forms the main connection between the N- and C-terminal Rossmann fold domains. The phosphate moiety of G6P binds tightly ina pocket formed by amino acid residues from both the R helix and α13—includingArg582 and Arg586, residues that have been shown to be essential for G6P activa-tion of the yeast [51, 63] and muscle [18, 64] enzymes. This pocket is ordered in theunbound state, and undergoes little change upon G6P binding. The G6P glucosemoiety, on the other hand, forms hydrogen bonds with His280 and Gln283, whichreorders the region between residues 278 and 284, allowing Asn284 to hydrogenbond with the corresponding residue of the subunit across the dimer pair two-foldsymmetry (i.e. the A/B or C/D interface). The arginine residues therefore likely actas anchors of the G6P molecule so that the glucose moiety can bond with His280and Gln283 [51]. It is tempting to speculate that the phosphate of ATP is similarly
Stellenbosch University http://scholar.sun.ac.za
CHAPTER 2. REGULATION OF GLYCOGEN SYNTHASE ACTIVITY 36
anchored by Arg582 and Arg586, with the difference that the adenosine moiety sta-bilizes an inactive conformation.
G6P binding and the subsequent reordering of residues 278–284 bring about sig-nificant conformational change [51, 53] (Fig. 2.1d). The R helices within the A/B andC/D dimers are forced apart by 3.4 A and the intersubunit helices (α15 and α16) ofthe B/D dimer pairs are translated by 14.2 A away from that of the A/C pair and ro-tated by 7 . Within subunits, the C-domain is rotated by 8.5 relative to the intersub-unit helix pair, and the N-domain is rotated a further 4.5 relative to the C-domain.The overall effect of the conformational change is that the association between theN-domain insert (α2 and the loop between β4 and β5) and C-domain insert (α16),which locks the subunits in an inactive open conformation, as well as the reciprocalintersubunit interaction of the loops between β15 and α18 within the A/D and B/Cinterfaces are abrogated (Fig. 2.1c). In the G6P-bound form, α16 instead associateswith the loop between β15 and α18 of its partner subunit in the dimer, allowing theinterdomain closure that is required for catalysis.
Comparing the structures of the G6P insensitive mutant R580A/R581A/R583A(yeast enzyme numbering) to the inactive, but G6P sensitive, mutant R589A/R592Ain the presence of G6P, Baskaran [53] observed a closure of the active site of subunitB relative to the G6P insensitive mutant over and above of that witnessed in the re-maining three subunits. This additional closure was the result of G6P binding in theactive site of subunit B. Although generally acting as a GS activator, this observa-tion suggests that G6P could also compete with GS substrates, presumably UDPG,for the active site and therefore inhibit GS. Slight inhibition by G6P has been notedbefore for the dephosphorylated enzyme [64].
Effect of G6P on GS kinetics
In agreement with the extensive conformational change resulting from G6P binding,G6P affects the kinetics of GS significantly.
Several workers have observed higher apparent kcat values in the presence ofG6P. Such catalytic activation is described by γG6P > 1. In many cases the extentto which kcat is affected seems to depend on the degree of phosphorylation. Rosell-Perez et al. consistently found an increase in the kcat of the phosphorylated D enzymefrom rat [71], rabbit [116], and dog [117], but observed no or little change in the kcat
for the dephosphorylated I form. The effect was independent of Mg2+. Kornfeld& Brown [32], however, only reported an increase in kcat in the presence of Mg2+.
Stellenbosch University http://scholar.sun.ac.za
CHAPTER 2. REGULATION OF GLYCOGEN SYNTHASE ACTIVITY 37
Others, working with the I form, reported no change in kcat, but did observe thatcontamination with the D form resulted in catalytic activation of GS [42]. Catalyticactivation was also observed for the D form from rat adipose tissue [68], bovineheart [69], and pig brain [70]. More recently, Lai et al. [138] found that catalyticactivation increases with glycogen content, which in turn correlates with degree ofphosphorylation. However, several workers have found no increase in kcat in thepresence of G6P, regardless of the phosphorylation state. Piras et al. [67] found noincrease in kcat for both the I and D forms of the rat muscle enzyme in response toG6P. Similarly, Roach et al. [72] observed essentially the same Vmax, and thus kcat, inthe presence and absence of G6P for a range of phosphorylation states of the rabbitmuscle enzyme.
The apparent effect of G6P on UDPG0.5, on the other hand, is well-established(see for example [72]). Even for the most phosphorylated forms, G6P decreases theapparent UDPG0.5 dramatically. This potent activation potential is indicative of alarge αG6P value. In most cases where catalytic activation was observed, specificactivation was also observed.
G6P further activates GS by suppressing ATP binding at the allosteric site. Thiseffect manifests as an apparent increase in ATP0.5. Several secondary effects on kcat
and UDPG0.5 could ensue, depending on the type of inactivation (specific or cat-alytic) that results from ATP binding. If, for instance, ATP inhibited GS by increasingthe apparent UDPG0.5 (i.e. αG6P < 1), then G6P would enhance substrate binding inthe presence of ATP over and above its own direct activation of GS. Indeed, Piraset al. [67] argue that this indirect activation of GS has more physiological relevancethan the direct effect of G6P on UDPG0.5, since even the phosphorylated forms areoften saturated with G6P at physiological concentrations, thus obscuring both thefunction of phosphorylation and G6P activation. In their view, ATP, which bindspreferentially to the phosphorylated enzyme, restores the necessary G6P sensitivityin inactive GS. Moreover, G6P increases hATP, especially in the dephosphorylatedenzyme, suggesting that, in addition to competing with ATP, G6P also stabilizes aconformation with a low affinity for ATP.
Finally, it is generally accepted that high G6P concentrations activate even themost phosphorylated forms of GS to the same level as the dephosphorylated enzyme[31, 89, 113]. This, as discussed earlier, is equivalent to stating that both kcat · γG6P
and UDPG0.5/αG6P are constants that are independent of phosphorylation state. Anyeffect of phosphorylation on kcat or UDPG0.5 is therefore reversed by G6P.
Stellenbosch University http://scholar.sun.ac.za
CHAPTER 2. REGULATION OF GLYCOGEN SYNTHASE ACTIVITY 38
G6P-dependent covalent activation
Apart from reversing the effects of phosphorylation on the kinetics of GS, it has beendemonstrated in a few cases that G6P also enhances the reversal of covalent phos-phorylation itself; either by inhibiting GS kinases, or by activating GS phosphatases.
Phosphorylation by PKA at site 2 potently inactivates GS. It has, however, beenobserved that in rabbit skeletal muscle insulin inhibits PKA in a seemingly compet-itive fashion with regard to cyclic AMP (cAMP) [139]. At least one mechanism bywhich insulin inhibits PKA is by increasing the G6P concentration [139]. PKA (orR2C2) is a tetrameric enzyme consisting of two catalytic (C) subunits, each associ-ated with a regulatory (R) subunit [140]. The R subunit is a pseudosubstrate thatinhibits the C subunit by blocking its active site. Each R subunit has two bindingsites for cAMP, which binds to it sequentially, leading to the stepwise dissociation ofthe R and C subunits and thus activation of PKA. Several PKA substrates are able toactivate PKA in a cAMP-independent fashion [139]. These substrates compete withthe R subunit for the active site. In the absence of cAMP, GS is able to stimulate PKAto an activity that is roughly 50% of that in the presence of 2 µM cAMP. When G6Pis bound to GS, however, the ability of GS to activate PKA is abolished.
G6P inhibition of phosphorylation appears to be specific to PKA and GS [139].No other GS kinases are inhibited by G6P, neither is the phosphorylation of otherPKA substrates affected. The possibility that G6P brings about the inhibition bybinding to the C or R subunits of PKA is thus ruled out and the inactivation mustbe the result of G6P binding to the allosteric site on GS. Since GS activates PKA bycompeting with the R subunit, one would expect that G6P decreases the C subunit’saffinity for GS. No changes in the Km or Vmax were however found in the presenceor absence of G6P. G6P appears then, by causing a conformational change in GS, toonly hinder its ability to activate PKA and not the kinetics of PKA. This hints at anactivation mechanism other than pure competition of GS with the R subunit. It hasbeen suggested that the protein substrates of PKA could activate it by interactionwith the R subunit [139].
G6P also inhibits one or more yeast GS kinases [141].Traut & Lipmann [142] observed that incubation with G6P increased the activity
of lamb muscle GS in the absence of G6P. GS activated in this way retained the ac-tivation after several days in cold storage. The activation by G6P was reversed byincubation with ATP. Therefore, apart from allosterically activating GS, it also acti-vated the enzyme in a, presumably, covalent fashion. Kinase inhibition by G6P, as
Stellenbosch University http://scholar.sun.ac.za
CHAPTER 2. REGULATION OF GLYCOGEN SYNTHASE ACTIVITY 39
discussed above, does not appear to have contributed significantly to the results ob-tained by Traut & Lipmann, as their preparations were, judging by the activity ratio,already extensively phosphorylated. This suggests that G6P also has the potential toenhance the dephosphorylation of GS. These findings have subsequently been veri-fied by various other workers. Kato & Bishop [143] showed that G6P enhances theD to I form conversion of rabbit muscle GS by a protein phosphatase. This effect ofG6P was not observed in the absence of the phosphatase. G6P analogues such asglucosamine-6-phosphate and galactose-6-phosphate, which also activate GS, had asimilar effect on the dephosphorylation of GS. No effect was seen for the dephospho-rylation of histone by the same phosphatase in the presence of G6P, suggesting thatthe activation of the phosphatase by G6P is mediated by the binding of G6P to GS.Others have shown that activation of the phosphatase reaction by G6P is inhibitedby inorganic phosphate and sulphate [144], and ATP [145]. ATP was also shown toinhibit dephosphorylation of GS in human muscle [145].
More recently, Villar-Palasi [146] found that, in rabbit muscle, G6P activates theD form of GS covalently by promoting dephosphorylation. This effect was observedfor both PP1 and protein phosphatase 2A (PP2A). Except for a slight activation atlow G6P concentrations of GP dephosphorylation by PP1, G6P did not enhance thedephosphorylation of any other tested PP1 or PP2A substrates. This suggests thatG6P does not directly activate the phosphatases in question, but rather causes a con-formational change in GS, rendering it a better substrate. G6P activated dephospho-rylation by PP1 and PP2A to the same degree. The G6P phosphatase activation wasobserved by measuring both the change in GS activity ratio and phosphate release.From both methods a Ka of 0.2 mMwas calculated for phosphatase activation. Thiscoincided with the Ka for GS activation as determined for the preparation used inthe study, strengthening the argument that the activation is caused by G6P bindingto GS. Intriguingly, the affinity of the phosphatases for GS was not altered by G6P.The activation appears to rather involve an increase in the Vmax and thus presumablythe catalytic constant kcat. It has been suggested that the GS conformational changeresulting from G6P binding exposes the phosphorylation sites to PP1 [147]. Althoughsuch a view is a useful metaphor, it is not strictly in agreement with the observationthat only the kcat of the phosphatase is affected. Several other sugar phosphates thatare known to activate GS were tested [146]. Those with the highest affinities for GS,such as fructose-6-phosphate and galactose-6-phosphate, yielded the highest cova-lent activation, with the former matching G6P, but there appeared to be no direct
Stellenbosch University http://scholar.sun.ac.za
CHAPTER 2. REGULATION OF GLYCOGEN SYNTHASE ACTIVITY 40
relationship between GS affinity and phosphatase activation [146]. Note that eventhough PP2A is not generally considered a major in vivo GS phosphatase, we in-clude it here to better illustrate that the reported activation of GS dephosphorylationby G6P is substrate-specific, i.e., independent of the particular phosphatase.
Nucleocytoplasmic shuttling
There is mounting evidence that the subcellular distribution of GS, from both liverand muscle, is regulated by glucose. In liver, incubation with glucose results in thetranslocation of GS from the cytosol to a region near the cell membrane [148, 149].Similarly, Cid et al. [130] have shown that muscle GS translocates from the nucleusto the cytosol when incubated with glucose. Under conditions of glycogen and glu-cose depletion, GS conversely translocates to the nucleus. In addition to mediatingthe allosteric and covalent regulation of GS, the arginine cluster also functions asa nuclear localization sequence. Arginine cluster mutants, in which G6P sensitiv-ity and presumably nuclear localization are abrogated, exhibited little or no nuclearaccumulation. Systematic mutation of the GS phosphorylation sites indicated thatphosphorylation does not affect nucleocytosolic GS translocation, suggesting thatonly G6P stimulates translocation to the cytosol. Moreover, based on the observa-tion that 6-deoxyglucose does not stimulate translocation to the cytosol, Cid et al.[130] suggest that it is in fact G6P, and not glucose, that elicits the translocation.If this is indeed the case, G6P-stimulated translocation of GS to the cytosol wouldeffectively increase the total GS concentration, [E]tot, in the cytosol.
As G6P stimulates net dephosphorylation of GS, it is expected that it would alsoinfluence the subcytosolic distribution of GS by promoting the dephosphorylationof sites, such as 2a and 1b, that are associated with targeting GS to various fractionsin the cytosol.
Function of G6P feedforward activation
G6P is a precursor of UDPG, one of the GS substrates. Activation of GS by G6Ptherefore constitutes a feedforward activation loop. Hofmeyr & Cornish-Bowden[15] have previously demonstrated that a similar regulatory mechanism, the feed-back inhibition loop, does not function to control the flux through the regulated en-zyme, but rather to maintain the concentration of the regulatory metabolite within anarrow range. In terms of GS, supposing a function of feedforward activation simi-
Stellenbosch University http://scholar.sun.ac.za
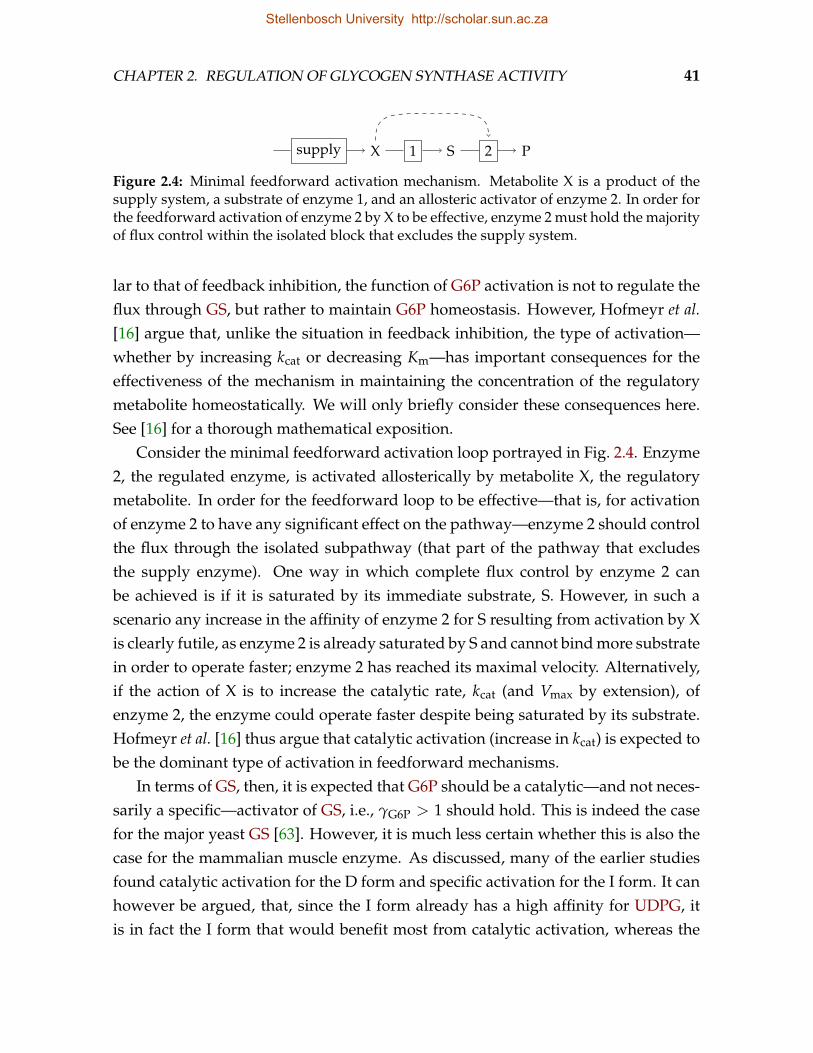
CHAPTER 2. REGULATION OF GLYCOGEN SYNTHASE ACTIVITY 41
X S Psupply 1 2
Figure 2.4: Minimal feedforward activation mechanism. Metabolite X is a product of thesupply system, a substrate of enzyme 1, and an allosteric activator of enzyme 2. In order forthe feedforward activation of enzyme 2 by X to be effective, enzyme 2 must hold the majorityof flux control within the isolated block that excludes the supply system.
lar to that of feedback inhibition, the function of G6P activation is not to regulate theflux through GS, but rather to maintain G6P homeostasis. However, Hofmeyr et al.[16] argue that, unlike the situation in feedback inhibition, the type of activation—whether by increasing kcat or decreasing Km—has important consequences for theeffectiveness of the mechanism in maintaining the concentration of the regulatorymetabolite homeostatically. We will only briefly consider these consequences here.See [16] for a thorough mathematical exposition.
Consider the minimal feedforward activation loop portrayed in Fig. 2.4. Enzyme2, the regulated enzyme, is activated allosterically by metabolite X, the regulatorymetabolite. In order for the feedforward loop to be effective—that is, for activationof enzyme 2 to have any significant effect on the pathway—enzyme 2 should controlthe flux through the isolated subpathway (that part of the pathway that excludesthe supply enzyme). One way in which complete flux control by enzyme 2 canbe achieved is if it is saturated by its immediate substrate, S. However, in such ascenario any increase in the affinity of enzyme 2 for S resulting from activation by Xis clearly futile, as enzyme 2 is already saturated by S and cannot bind more substratein order to operate faster; enzyme 2 has reached its maximal velocity. Alternatively,if the action of X is to increase the catalytic rate, kcat (and Vmax by extension), ofenzyme 2, the enzyme could operate faster despite being saturated by its substrate.Hofmeyr et al. [16] thus argue that catalytic activation (increase in kcat) is expected tobe the dominant type of activation in feedforward mechanisms.
In terms of GS, then, it is expected that G6P should be a catalytic—and not neces-sarily a specific—activator of GS, i.e., γG6P > 1 should hold. This is indeed the casefor the major yeast GS [63]. However, it is much less certain whether this is also thecase for the mammalian muscle enzyme. As discussed, many of the earlier studiesfound catalytic activation for the D form and specific activation for the I form. It canhowever be argued, that, since the I form already has a high affinity for UDPG, itis in fact the I form that would benefit most from catalytic activation, whereas the
Stellenbosch University http://scholar.sun.ac.za
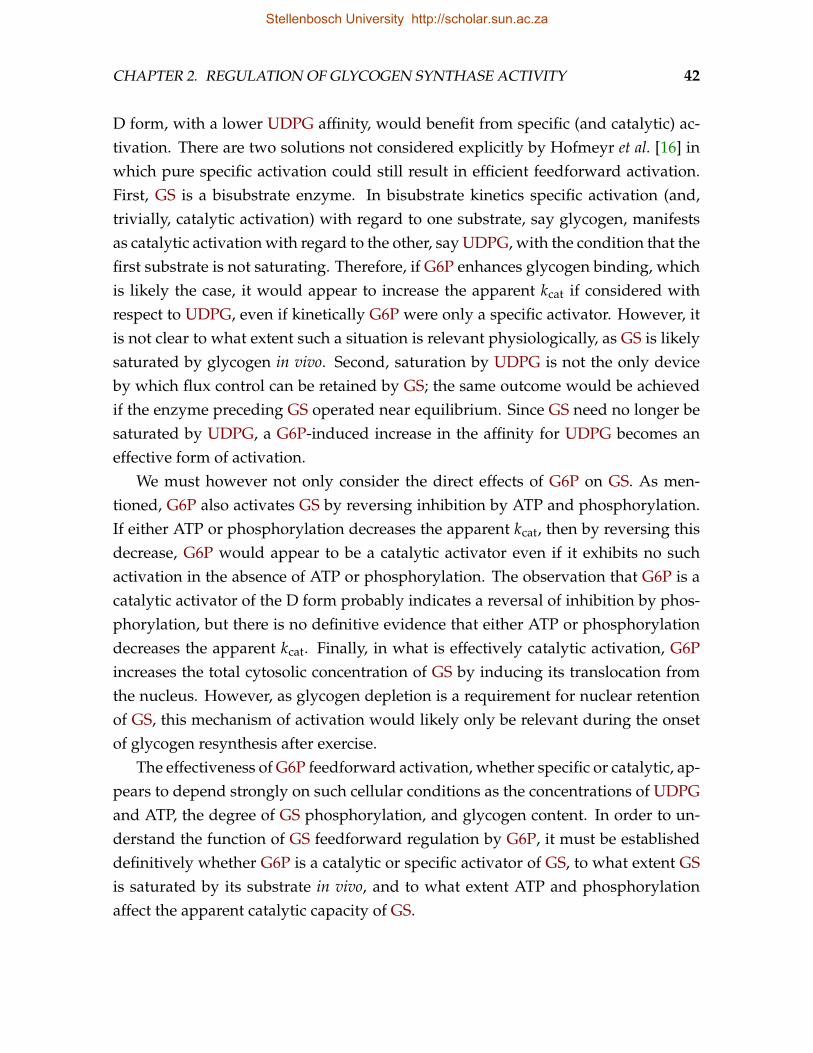
CHAPTER 2. REGULATION OF GLYCOGEN SYNTHASE ACTIVITY 42
D form, with a lower UDPG affinity, would benefit from specific (and catalytic) ac-tivation. There are two solutions not considered explicitly by Hofmeyr et al. [16] inwhich pure specific activation could still result in efficient feedforward activation.First, GS is a bisubstrate enzyme. In bisubstrate kinetics specific activation (and,trivially, catalytic activation) with regard to one substrate, say glycogen, manifestsas catalytic activation with regard to the other, say UDPG, with the condition that thefirst substrate is not saturating. Therefore, if G6P enhances glycogen binding, whichis likely the case, it would appear to increase the apparent kcat if considered withrespect to UDPG, even if kinetically G6P were only a specific activator. However, itis not clear to what extent such a situation is relevant physiologically, as GS is likelysaturated by glycogen in vivo. Second, saturation by UDPG is not the only deviceby which flux control can be retained by GS; the same outcome would be achievedif the enzyme preceding GS operated near equilibrium. Since GS need no longer besaturated by UDPG, a G6P-induced increase in the affinity for UDPG becomes aneffective form of activation.
We must however not only consider the direct effects of G6P on GS. As men-tioned, G6P also activates GS by reversing inhibition by ATP and phosphorylation.If either ATP or phosphorylation decreases the apparent kcat, then by reversing thisdecrease, G6P would appear to be a catalytic activator even if it exhibits no suchactivation in the absence of ATP or phosphorylation. The observation that G6P is acatalytic activator of the D form probably indicates a reversal of inhibition by phos-phorylation, but there is no definitive evidence that either ATP or phosphorylationdecreases the apparent kcat. Finally, in what is effectively catalytic activation, G6Pincreases the total cytosolic concentration of GS by inducing its translocation fromthe nucleus. However, as glycogen depletion is a requirement for nuclear retentionof GS, this mechanism of activation would likely only be relevant during the onsetof glycogen resynthesis after exercise.
The effectiveness of G6P feedforward activation, whether specific or catalytic, ap-pears to depend strongly on such cellular conditions as the concentrations of UDPGand ATP, the degree of GS phosphorylation, and glycogen content. In order to un-derstand the function of GS feedforward regulation by G6P, it must be establisheddefinitively whether G6P is a catalytic or specific activator of GS, to what extent GSis saturated by its substrate in vivo, and to what extent ATP and phosphorylationaffect the apparent catalytic capacity of GS.
Stellenbosch University http://scholar.sun.ac.za
CHAPTER 2. REGULATION OF GLYCOGEN SYNTHASE ACTIVITY 43
2.5 A unifying view of covalent and allosteric
regulation
The complex kinetics and regulation of GS, as discussed in the previous two sections,continue to evade description by a succinct mechanistic model. The sheer numberof phosphorylation states and an incomplete understanding of how GS kinetics isaltered by phosphorylation makes it near impossible to capture the enzyme’s be-haviour with conventional enzyme kinetic rate equations. In this section we willargue that, without deriving any form of rate equation yet, the MWC model couldprovide an adequate description of the nuances of GS kinetics and regulation—bothallosteric and covalent—as reviewed in this writing.
Let us briefly summarize the interplay between G6P, ATP and phosphorylation.In many respects the effects of regulation by G6P and phosphorylation are reciprocal(Fig. 2.5A). G6P binding activates GS (a) in a cooperative fashion (b). It not only re-verses the inhibitory effects of phosphorylation, but also reverses phosphorylationitself (c). Phosphorylation, on the other hand, inhibits GS (e). It also inhibits G6Pbinding (g), but intriguingly enhances G6P binding cooperativity (h). Conversely,the effects of ATP and phosphorylation on GS and each other appear to be qualita-tively identical (Fig. 2.5B). Both inhibit GS (a, e). ATP enhances phosphorylation (c)and phosphorylation enhances ATP binding (g). In addition, phosphorylation de-creases ATP binding cooperativity (h). Finally, G6P binding affects ATP binding andphosphorylation similarly; and ATP binding and phosphorylation affect G6P bind-ing in similar ways (Fig. 2.5C). G6P and ATP decrease each other’s binding affinity(c, g), but enhance each other’s binding cooperativity (h, d).
Several trends concerning the interplay between activation and inhibition of GSemerge. Activators and inhibitors inhibit each other’s binding, but enhance eachother’s binding cooperativity. Inhibitors, on the other hand, enhance each other’sbinding, but each decreases the degree of cooperativity to which the other binds. Itis evident, therefore, that phosphorylation—though covalent—exhibits exactly thesame qualitative behaviour with respect to G6P as ATP—a classic allosteric inhibitor.
We arrived at this picture of GS regulation with the aid of the Hill equation. How-ever, as we have seen, the Hill equation cannot account for the heterotropic coopera-tivity that is observed between activators and inhibitors; that is, in the Hill equationh, the degree of cooperativity, is constant. It has been proposed that a modificationterm be incorporated in the Hill equation that would allow h to be a function of
Stellenbosch University http://scholar.sun.ac.za
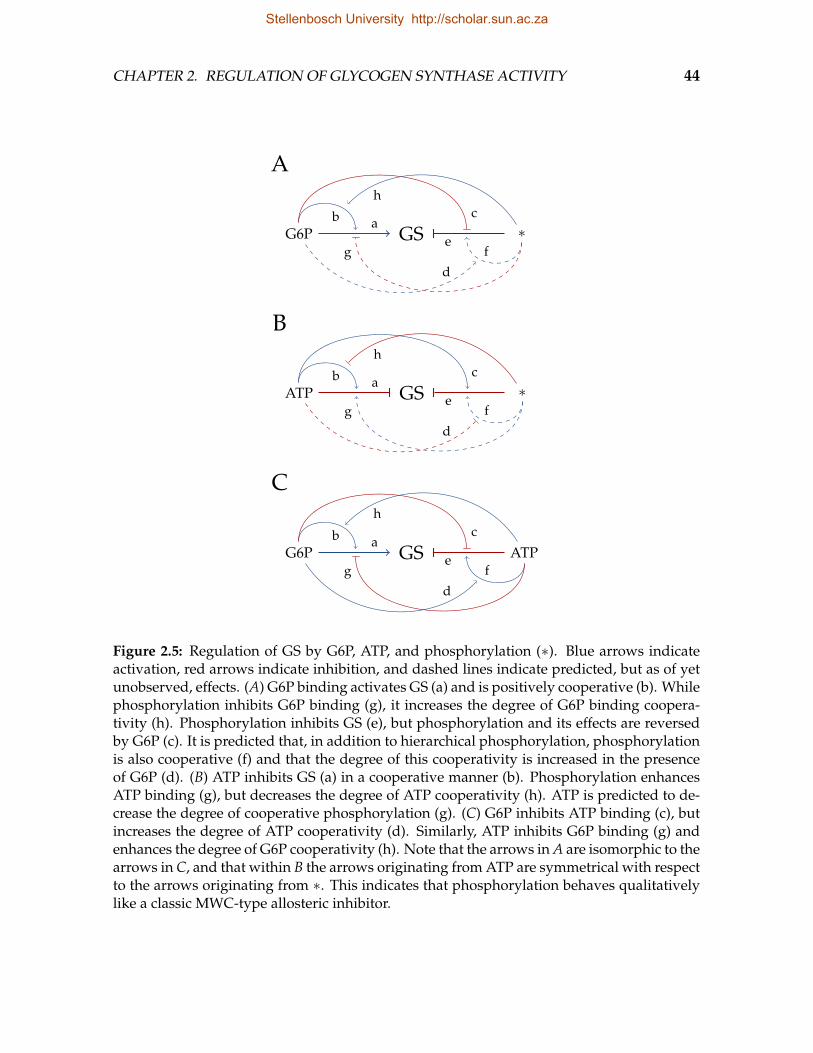
CHAPTER 2. REGULATION OF GLYCOGEN SYNTHASE ACTIVITY 44
G6P GS ∗
A
ae
b c
f
dg
h
ATP GS ∗
B
ae
b c
f
dg
h
G6P GS ATP
C
ae
b c
f
d
g
h
Figure 2.5: Regulation of GS by G6P, ATP, and phosphorylation (∗). Blue arrows indicateactivation, red arrows indicate inhibition, and dashed lines indicate predicted, but as of yetunobserved, effects. (A) G6P binding activates GS (a) and is positively cooperative (b). Whilephosphorylation inhibits G6P binding (g), it increases the degree of G6P binding coopera-tivity (h). Phosphorylation inhibits GS (e), but phosphorylation and its effects are reversedby G6P (c). It is predicted that, in addition to hierarchical phosphorylation, phosphorylationis also cooperative (f) and that the degree of this cooperativity is increased in the presenceof G6P (d). (B) ATP inhibits GS (a) in a cooperative manner (b). Phosphorylation enhancesATP binding (g), but decreases the degree of ATP cooperativity (h). ATP is predicted to de-crease the degree of cooperative phosphorylation (g). (C) G6P inhibits ATP binding (c), butincreases the degree of ATP cooperativity (d). Similarly, ATP inhibits G6P binding (g) andenhances the degree of G6P cooperativity (h). Note that the arrows in A are isomorphic to thearrows in C, and that within B the arrows originating from ATP are symmetrical with respectto the arrows originating from ∗. This indicates that phosphorylation behaves qualitativelylike a classic MWC-type allosteric inhibitor.
Stellenbosch University http://scholar.sun.ac.za
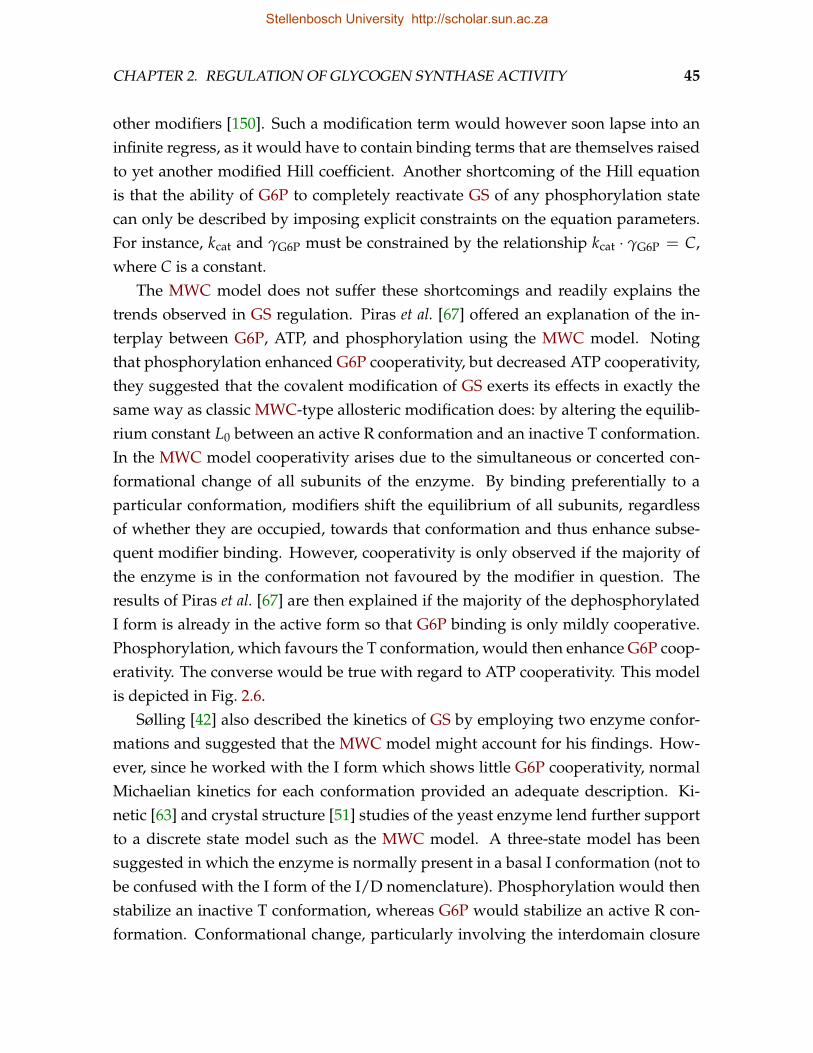
CHAPTER 2. REGULATION OF GLYCOGEN SYNTHASE ACTIVITY 45
other modifiers [150]. Such a modification term would however soon lapse into aninfinite regress, as it would have to contain binding terms that are themselves raisedto yet another modified Hill coefficient. Another shortcoming of the Hill equationis that the ability of G6P to completely reactivate GS of any phosphorylation statecan only be described by imposing explicit constraints on the equation parameters.For instance, kcat and γG6P must be constrained by the relationship kcat · γG6P = C,where C is a constant.
The MWC model does not suffer these shortcomings and readily explains thetrends observed in GS regulation. Piras et al. [67] offered an explanation of the in-terplay between G6P, ATP, and phosphorylation using the MWC model. Notingthat phosphorylation enhanced G6P cooperativity, but decreased ATP cooperativity,they suggested that the covalent modification of GS exerts its effects in exactly thesame way as classic MWC-type allosteric modification does: by altering the equilib-rium constant L0 between an active R conformation and an inactive T conformation.In the MWC model cooperativity arises due to the simultaneous or concerted con-formational change of all subunits of the enzyme. By binding preferentially to aparticular conformation, modifiers shift the equilibrium of all subunits, regardlessof whether they are occupied, towards that conformation and thus enhance subse-quent modifier binding. However, cooperativity is only observed if the majority ofthe enzyme is in the conformation not favoured by the modifier in question. Theresults of Piras et al. [67] are then explained if the majority of the dephosphorylatedI form is already in the active form so that G6P binding is only mildly cooperative.Phosphorylation, which favours the T conformation, would then enhance G6P coop-erativity. The converse would be true with regard to ATP cooperativity. This modelis depicted in Fig. 2.6.
Sølling [42] also described the kinetics of GS by employing two enzyme confor-mations and suggested that the MWC model might account for his findings. How-ever, since he worked with the I form which shows little G6P cooperativity, normalMichaelian kinetics for each conformation provided an adequate description. Ki-netic [63] and crystal structure [51] studies of the yeast enzyme lend further supportto a discrete state model such as the MWC model. A three-state model has beensuggested in which the enzyme is normally present in a basal I conformation (not tobe confused with the I form of the I/D nomenclature). Phosphorylation would thenstabilize an inactive T conformation, whereas G6P would stabilize an active R con-formation. Conformational change, particularly involving the interdomain closure
Stellenbosch University http://scholar.sun.ac.za
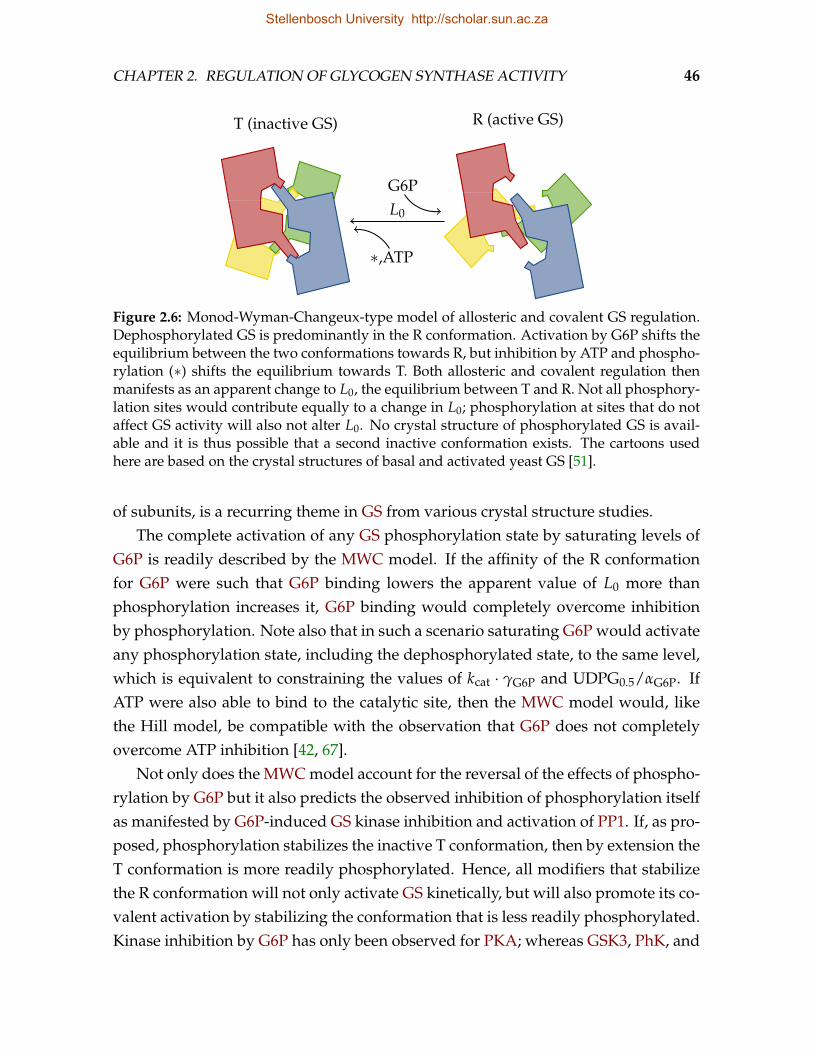
CHAPTER 2. REGULATION OF GLYCOGEN SYNTHASE ACTIVITY 46
L0
G6P
∗,ATP
T (inactive GS) R (active GS)
Figure 2.6: Monod-Wyman-Changeux-type model of allosteric and covalent GS regulation.Dephosphorylated GS is predominantly in the R conformation. Activation by G6P shifts theequilibrium between the two conformations towards R, but inhibition by ATP and phospho-rylation (∗) shifts the equilibrium towards T. Both allosteric and covalent regulation thenmanifests as an apparent change to L0, the equilibrium between T and R. Not all phosphory-lation sites would contribute equally to a change in L0; phosphorylation at sites that do notaffect GS activity will also not alter L0. No crystal structure of phosphorylated GS is avail-able and it is thus possible that a second inactive conformation exists. The cartoons usedhere are based on the crystal structures of basal and activated yeast GS [51].
of subunits, is a recurring theme in GS from various crystal structure studies.The complete activation of any GS phosphorylation state by saturating levels of
G6P is readily described by the MWC model. If the affinity of the R conformationfor G6P were such that G6P binding lowers the apparent value of L0 more thanphosphorylation increases it, G6P binding would completely overcome inhibitionby phosphorylation. Note also that in such a scenario saturating G6P would activateany phosphorylation state, including the dephosphorylated state, to the same level,which is equivalent to constraining the values of kcat · γG6P and UDPG0.5/αG6P. IfATP were also able to bind to the catalytic site, then the MWC model would, likethe Hill model, be compatible with the observation that G6P does not completelyovercome ATP inhibition [42, 67].
Not only does the MWC model account for the reversal of the effects of phospho-rylation by G6P but it also predicts the observed inhibition of phosphorylation itselfas manifested by G6P-induced GS kinase inhibition and activation of PP1. If, as pro-posed, phosphorylation stabilizes the inactive T conformation, then by extension theT conformation is more readily phosphorylated. Hence, all modifiers that stabilizethe R conformation will not only activate GS kinetically, but will also promote its co-valent activation by stabilizing the conformation that is less readily phosphorylated.Kinase inhibition by G6P has only been observed for PKA; whereas GSK3, PhK, and
Stellenbosch University http://scholar.sun.ac.za
CHAPTER 2. REGULATION OF GLYCOGEN SYNTHASE ACTIVITY 47
CK1 showed no activation by G6P. The MWC model, however, predicts that only ki-nases that phosphorylate sites that affect GS activity should be inhibited by G6P andthus little, if any, inhibition is expected for PhK and CK1, if used alone. Similarly, themajority of sites phosphorylated by GSK3 have no effect on GS activity and no inhi-bition by G6P is expected for the phosphorylation of these sites. Inhibition by G6Pis however expected for phosphorylation of site 3a by GSK3, but was not observed[139]. No explanation can be offered in this regard, except that site 3a might havealready been phosphorylated substantially, given that the phosphorylation state wasnot known. Similarly, ATP is predicted to enhance net GS phosphorylation over andabove its contribution as kinase cosubstrate (c in Fig. 2.5B). Embi et al. [151] haveindeed observed stimulation of GSK3 by ATP even after the kinase was already sat-urated with ATP, suggesting a substrate-specific effect. Inhibition of PP1 by ATP, ina manner reversible by G6P, is well-established [142, 145, 152–154].
In the majority of kinetic treatments that incorporate modifier effects, it is as-sumed that specific modification affects binding of substrate-product pairs to thesame extent and that catalytic modification affects forward and reverse rate con-stants to the same extent. These assumptions are sufficient but not necessary tosatisfy the constraints of the Haldane relationship. Differential modification of thebinding affinities of substrates and products is allowed by the Haldane relationship,but with the condition that the forward and reverse rate constants are also modifieddifferentially and to the same extent. Describing differential modification of rateconstants and binding affinity in the Michaelian or Hill models, however, leads tocomplicated rate equations; whereas in the MWC model the behaviour can be ac-counted for without the introduction of additional parameters. This advantage ofthe MWC model is, however, not an argument for its applicability to GS kinetics.
A few objections have been levelled against the MWC model as a model for GSregulation. First, Piras et al. [67] argued that non-cooperative substrate binding isseemingly incompatible with this model. Non-cooperative substrate binding can,however, be achieved by making the usual assumption that only the R conformationis catalytically active, as well as the assumption that the UDPG substrate binds withequal (or only slightly different) affinities to the R conformation and to the T confor-mation. These assumptions lead to no, or very mild, substrate binding cooperativity(comparable to that seen for G6P in the dephosphorylated form) for both the de-phosphorylated and phosphorylated states, but also impose catalytic activation byG6P. Modifier binding cooperativity is retained, as modifiers bind with vastly dif-
Stellenbosch University http://scholar.sun.ac.za
CHAPTER 2. REGULATION OF GLYCOGEN SYNTHASE ACTIVITY 48
ferent affinities to the two conformations. This mechanism is predicted to exhibitpositive substrate cooperativity if the apparent affinity of the two conformations forUDPG is affected to different extents by a competitive inhibitor. This has indeedbeen observed for the bovine heart enzyme, in which UTP elicited positive cooper-ativity with respect to UDPG binding [69]. These assumptions are also supportedby Sølling [42] who was unable to detect significant conformational change inducedby UDPG or UDP. Non-cooperative substrate binding can also be achieved if it is as-sumed that glycogen can bind to only one subunit at a time due to steric constraintsand that UDPG can only bind to the subunit that is already bound to glycogen. Thesetwo assumptions are equivalent to assuming infinite negative cooperativity, which iskinetically indistinguishable from hyperbolic kinetics. This mechanism is, however,incompatible with random order bi-bi kinetics, the favoured kinetic mechanism forGS. Although glycogen saturation alters the random bi-bi mechanism to an appar-ent ordered mechanism, the assumptions here imply a true ordered mechanism thatwould affect even the sites not occupied by glycogen.
In a further objection, Plesner et al. [82] argue that G6P cooperativity is an arte-fact that disappears at high substrate concentrations and they thus reject the MWCmodel. Their observation is however in agreement with the model proposed here.UDPG is expected to bind preferentially to the R conformation (otherwise specificactivation would not be observed). High substrate concentrations would thereforestabilize the R conformation and so abrogate G6P cooperativity. The disappearanceof G6P cooperativity is thus not an artefact, but a characteristic, of the model.
Some aspects of GS regulation suggest that a MWC model with more than twoconformations might be required. Many earlier GS kinetic studies found that cat-alytic activation by G6P was restricted to the D form, whereas specific activationwas restricted to the I form. Unless these finding were artefactual, they can only beaccounted for by a MWC model with at least three conformations. In a similar vein,Piras et al. [39] noted that the specific activation of GS by G6P was pH-dependent,which could indicate that an additional pH-dependent conformational transition oc-curs. Some workers [42, 82] have also found that inorganic phosphate and sulphateare inhibitors of the D form, but activate the I form. This situation could perhaps beexplained with a two-state MWC model if phosphate and sulphate prefer to bind tothe R conformation. In the I form, which is often assayed in the absence of G6P, theywould result in slight activation, whereas in the D form, which is rarely assayed inthe absence of G6P, they would impair G6P activation by competing for the allosteric
Stellenbosch University http://scholar.sun.ac.za
CHAPTER 2. REGULATION OF GLYCOGEN SYNTHASE ACTIVITY 49
site. However, if phosphate and sulphate are true inhibitors of the D form, that is,not only with respect to G6P, additional conformations would be required to explainthe behaviour. Based on crystal structure data, a three-state MWC type model hasindeed been proposed for yeast GS [51], but no rigorous kinetic studies have yetconfirmed this proposal. Until a two-state MWC model is shown to be inadequate,however, little is gained by considering additional conformational states.
The MWC model proposed here, in which phosphorylation increases L0, makesa few predictions that have, to our knowledge, not been tested experimentally. First,it predicts that phosphorylation is cooperative (see f in Fig. 2.5A). That is, phospho-rylation of, say, site 2 on one subunit must enhance phosphorylation of site 2 onthe next subunit. And more generally, phosphorylation of any site that increases L0
should enhance subsequent phosphorylation of any other phosphorylation site—onthe same or other subunits of the oligomeric enzyme—that also increases L0. In sim-pler terms, if phosphorylation at two different sites, whether on the same or differentsubunits, both stabilize the T conformation, then phosphorylation of one site shouldenhance phosphorylation at the other site. Similarly, dephosphorylation should alsoproceed cooperatively. Not all phosphorylation sites affect the activity, and thusL0, of GS. Phosphorylation sites like 1a, 1b, and 5–3c have little if any effect on GSactivity and thus no cooperative phosphorylation of these sites is expected. Hierar-chical sequential phosphorylation is not equivalent to cooperative phosphorylation;however, in a MWC model, these two mechanisms could be difficult to tell apart inphosphorylation assays. Suppose for instance that phosphorylation at both sites 2and 2a stabilizes the T conformation. Phosphorylation of site 2a would then be en-hanced by prior phosphorylation at site 2 by virtue of the recognition motif of CK1containing a phosphorylated serine residue, but also because phosphorylation at site2 stabilizes the same conformation that is favoured by phosphorylation at site 2a. Ithas been noted that phosphorylation of sites 2 and 2a is synergistic [106]: prior phos-phorylation at site 2 greatly enhances, but is not a requirement for, phosphorylationat site 2a. If regulation of GS is indeed adequately described by a MWC-type model,this enhanced phosphorylation at site 2a cannot purely be the result of hierarchicalsequential phosphorylation.
Second, it is predicted that G6P would enhance the degree of cooperative phos-phorylation by stabilizing the conformation not favoured by phosphorylation (d inFig. 2.5A). ATP, on the other hand, will decrease the degree of cooperativity of phos-phorylation (d in Fig. 2.5B), despite the fact that it enhances phosphorylation itself
Stellenbosch University http://scholar.sun.ac.za
CHAPTER 2. REGULATION OF GLYCOGEN SYNTHASE ACTIVITY 50
(c in Fig. 2.5B).The kinetics and regulation of GS seem to be adequately described by a MWC
model in which phosphorylation acts like a classic allosteric modifier. The sequen-tial or Koshland-Nemethy-Filmer (KNF) model [155] is, however, expected to pro-vide an equally adequate description. However, an equation derived from the as-sumptions of the KNF model for a tetramer in a tetrahedral arrangement with prod-uct inhibition and two allosteric modifiers would be too complicated to be useful.Moreover, in the KNF model it is not immediately clear which parameters wouldbe influenced by phosphorylation. The MWC-type model proposed here is almostcertainly a gross over-simplification of the true regulation of GS, but is neverthelessa useful working model.
2.6 Conclusion
In this chapter we discussed the general kinetic properties of GS and how these prop-erties are affected by allosteric and covalent regulation. The covalent regulation ofGS is particularly elaborate, allowing the enzyme to be sensitive to multiple regu-latory signals. However, only a few of the phosphorylation sites have direct effectson the enzyme’s activity. The majority appear to rather fulfil auxiliary roles such astargeting the enzyme to appropriate sub-cellular compartments or to facilitate thephosphorylation of those sites that do directly affect activity. In this regard the sitesphosphorylated by GSK3 are of particular interest, as this kinase can be considereda hub in signal transduction, regulating several downstream processes. We postu-late that the multiple GSK3 sites on GS function to calibrate the response of GS tochanges in the activity of GSK3. The allosteric regulation of GS also appears to bemultifaceted. Not only is the enzyme’s activity directly influenced by its allostericmodifiers, its sub-cellular and nucleocytoplasmic distribution is also affected. More-over, the allosteric and covalent regulation of GS is tightly intertwined. It is clearthat no discussion of the covalent regulation of GS is complete without mention ofits effect on G6P activation, and no treatment of its allosteric regulation is completewithout also considering its effect on phosphorylation. Part of the function of eitherregulatory mechanism, it seems, is to regulate the other.
There is no a priori reason why covalent and allosteric modification of an enzymeshould be considered to be qualitatively different. In fact, both kinds of interactionare, as it were, allosteric; in either case the enzyme’s activity is affected by modifiers
Stellenbosch University http://scholar.sun.ac.za
CHAPTER 2. REGULATION OF GLYCOGEN SYNTHASE ACTIVITY 51
binding (whether covalently, or through ionic or hydrophobic interactions) to a siteother than the catalytic site. Notwithstanding, earlier studies on GS kinetics wereusually entirely devoted to either the I or D form, with little attempt to sketch an inte-grated view. In an effort to remedy this situation, we here proposed a unifying viewof GS regulation in which covalent modification is considered to be qualitativelyidentical to classic allosteric modification as per the MWC model. This is indeed thestandard depiction of the regulation of GS in textbooks: phosphorylation favours aninactive T conformation, whereas G6P favours the active R conformation. However,to our knowledge, this model has never been applied in a kinetic treatment of GSand its implications for the function of the extensive phosphorylation of GS has notbeen considered. Our own endeavours in this regard is the theme of the next chap-ter. A major advantage of this model is that it eliminates the need to determine thekinetic parameters for GS in all its possible phosphorylation states, leaving only therequirement to establish the relationship between a particular phosphorylation stateand L the equilibrium constant between the T and R conformers in the absence ofligands.
We have discussed the function of G6P as a feedforward activator of GS and sug-gested that this feedforward mechanism plays a role in G6P homeostasis in that itincreases the response of the flux local to the glycogen synthesis pathway to G6P.One reason for this elevated response is the fact that G6P binds cooperatively toGS. In the unifying model of GS regulation that we here propose, both ATP (h inFig. 2.5C) and phosphorylation (h in Fig. 2.5A) increase the degree of G6P bindingcooperativity and are thus expected to enhance the response of the glycogen synthe-sis pathway to G6P. If the feedforward loop is indeed a mechanism of G6P homeo-stasis, then physiological concentrations of ATP, as demonstrated by Piras et al. [67],and phosphorylation should be expected to enhance G6P homeostasis.
The model we propose here has interesting implications regarding the relativeimportance of allosteric and covalent regulation. Using knock-in mice in which GSwas desensitized to G6P, Bouskila et al. [18] recently reported that allosteric, andnot covalent, regulation is the major mechanism by which insulin activates glycogensynthesis. From Fig. 2.5A it is clear that if GS is desensitized to activation by G6P,i.e., if arrow (a) is removed, several functions of phosphorylation also disappear (h,g), leading to a possible underestimation of the importance of phosphorylation. Inparticular, only the direct effect of phosphorylation on the activity of GS would beobserved, but its role in increasing the sensitivity of GS towards G6P would be ne-
Stellenbosch University http://scholar.sun.ac.za
CHAPTER 2. REGULATION OF GLYCOGEN SYNTHASE ACTIVITY 52
glected. Similarly, if one were to remove the phosphorylation sites on GS, the func-tion of G6P to inhibit phosphorylation is obscured. It is our opinion that mathemat-ical modelling and metabolic control analysis (MCA) [10, 11] could provide insightsinto the relative contributions of allosteric and covalent regulation towards the ac-tivation of GS, if indeed these contributions can be considered in isolation. It couldalso provide valuable insights regarding the regulatory design of muscle glycogenmetabolism and its involvement in the onset of insulin resistance. One of the cen-tral aims of MCA is to relate properties of individual enzymes to global pathwayresponses. It is therefore essential to obtain a quantitative grasp of the precise effectsof regulation on the kinetics of GS, a grasp that can only be obtained by returningto enzyme kinetics. We thus echo the call by Jensen & Lai [5] for a detailed quanti-tative investigation of the effects of allosteric and covalent regulation on the kineticproperties of GS.
Stellenbosch University http://scholar.sun.ac.za
Chapter 3
Development of a glycogen synthaserate equation
3.1 Introduction
In the previous chapter, borrowing the terminology of the Hill model, we discussedthe kinetics and regulation of glycogen synthase (GS) in detail. The Hill model is in-dependent of the kinetic mechanism and mechanism of cooperativity of the enzymeit describes and its parameters have clear operation meanings. We argued that the ef-fects of allosteric and covalent regulation of GS on its kinetic parameters, as definedby the Hill model, are consistent with an Monod-Wyman-Changeux (MWC)-typemodel in which not only allosteric modification, but also covalent modification, al-ters the equilibrium constant, L0, between the classic T and R conformations. In thischapter we set out to develop a rate equation for GS based on such a MWC-typemodel. Considering only the interconversion between GS phosphorylation states, ageneral form of the rate equation is provided. Several specific forms are then pro-posed for the rate equation, based on the observed GS kinetics. Parameter optimiza-tion is used to determine which forms provide the best description of experimentalkinetic data. Finally, we investigate the relationship between L0 and the fractionalvelocity and show how L0 can be determined from the fractional velocity.
3.2 Phosphorylation states
The total number of distinct phosphorylation states, s, for a protein subunit with nphosphorylation sites grouped together in the same phosphorylation cluster that are
53
Stellenbosch University http://scholar.sun.ac.za
CHAPTER 3. DEVELOPMENT OF A GLYCOGEN SYNTHASE RATE EQUATION 54
phosphorylated randomly is given by the function
s = 2n (3.1)
In the case of strict sequential phosphorylation and dephosphorylation, the numberof states is given by
s = n + 1 (3.2)
Since several independent phosphorylation clusters, some randomly phosphory-lated and some sequentially phosphorylated, can be present on a subunit, the totalnumber of states is the product of states in each cluster
s = ∏i
si (3.3)
where i denotes a particular phosphorylation cluster.Let C22a, C543abc, C1a, and C1b designate the four phosphorylation clusters of GS
(subscripts indicate the phosphorylation sites in each cluster). According to Eq. 3.3,and assuming random phosphorylation for the sites in each cluster, the number ofphosphorylation states for a single GS subunit is
s = sC22a · sC543abc · sC1a · sC1b (3.4)
= 22 · 25 · 2 · 2 (3.5)
= 29 (3.6)
= 512 (3.7)
Assuming strict sequential phosphorylation and dephosphorylation, on the otherhand, the number of phosphorylation states per GS subunit is
s = sC22a · sC543abc · sC1a · sC1b (3.8)
= (2 + 1)(5 + 1)(1 + 1)(1 + 1) (3.9)
= 72 (3.10)
As discussed earlier, the majority of evidence suggests, however, that GS is atetramer. The number of states for a random mechanism and sequential mechanismis then respectively 5124 and 724. But if it is assumed, as in the MWC-model, that
Stellenbosch University http://scholar.sun.ac.za
CHAPTER 3. DEVELOPMENT OF A GLYCOGEN SYNTHASE RATE EQUATION 55
the four subunits are equivalent and that enzyme forms to which the same numberand type of ligand (and thus also covalent bonds) are bound are kinetically equiv-alent, the number of kinetically distinct states decreases dramatically. Granted thisassumption, the number of kinetically distinct states for an enzyme with m sub-units and n phosphorylation sites grouped in the same cluster and phosphorylatedrandomly (assuming phosphorylation at all sites affect the kinetics) is given by thefunction
s = (m + 1)n (3.11)
In the case of sequential phosphorylation, on the other hand, the number of statesis given by the formula for the (n+ 1)th element of the r-topic numbers (the numbersin the (r + 1)th diagonal of Pascal’s Triangle) with r = m:
s =(n + 1)(m)
m!(3.12)
where (n + 1)(m) is the rising factorial. Setting m = 1, Eqs. 3.11 and 3.12 simplifyto Eqs. 3.1 and 3.2 as expected. As before, if multiple phosphorylation clusters canexist per subunit, the number of states is given by the product of the states for eachcluster (Eq. 3.3).
Assuming a random phosphorylation mechanism, the number of kinetically dis-tinct states in which tetrameric GS (m = 4) can exist is
s = sC22a · sC543abc · sC1a · sC1b (3.13)
= (4 + 1)2 · (4 + 1)5 · (4 + 1) · (4 + 1) (3.14)
= 59 (3.15)
= 1953125 (3.16)
and for a sequential mechanism
s = sC22a · sC543abc · sC1a · sC1b (3.17)
=3× 4× 5× 6
4!· 6× 7× 8× 9
4!· 2× 3× 4× 5
4!· 2× 3× 4× 5
4!(3.18)
= 15× 126× 5× 5 (3.19)
= 47250 (3.20)
Stellenbosch University http://scholar.sun.ac.za
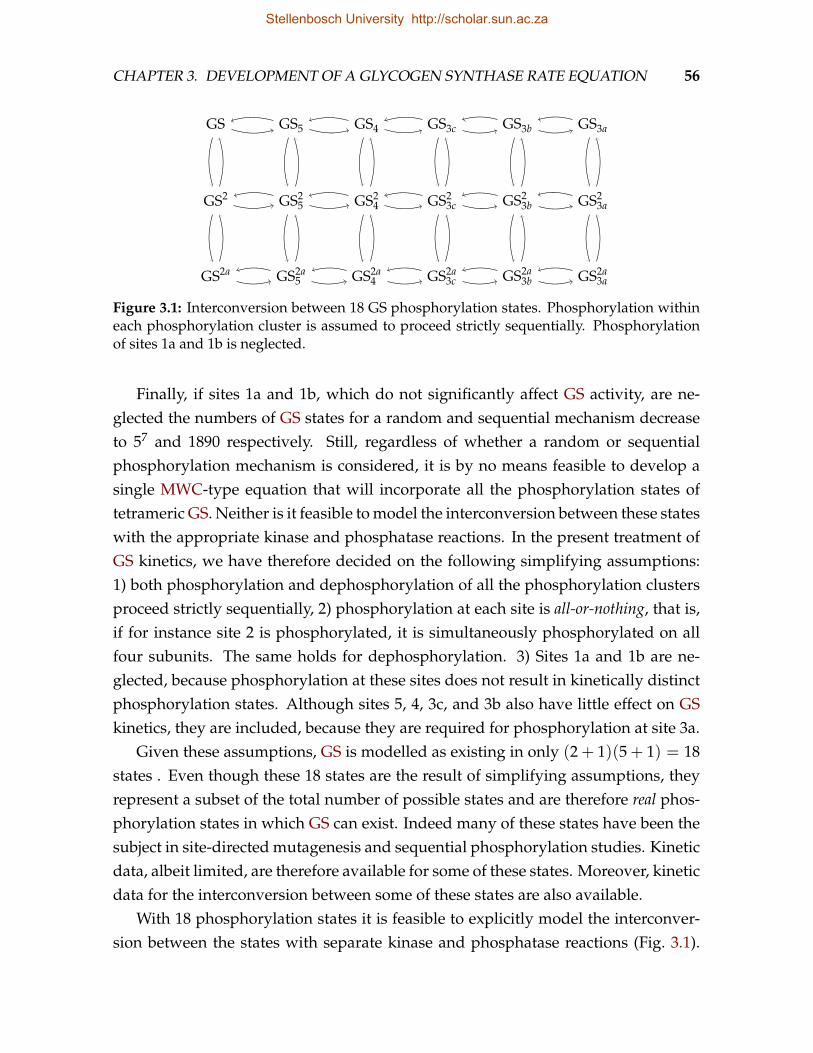
CHAPTER 3. DEVELOPMENT OF A GLYCOGEN SYNTHASE RATE EQUATION 56
GS GS5 GS4 GS3c GS3b GS3a
GS2 GS25 GS2
4 GS23c GS2
3b GS23a
GS2a GS2a5 GS2a
4 GS2a3c GS2a
3b GS2a3a
Figure 3.1: Interconversion between 18 GS phosphorylation states. Phosphorylation withineach phosphorylation cluster is assumed to proceed strictly sequentially. Phosphorylationof sites 1a and 1b is neglected.
Finally, if sites 1a and 1b, which do not significantly affect GS activity, are ne-glected the numbers of GS states for a random and sequential mechanism decreaseto 57 and 1890 respectively. Still, regardless of whether a random or sequentialphosphorylation mechanism is considered, it is by no means feasible to develop asingle MWC-type equation that will incorporate all the phosphorylation states oftetrameric GS. Neither is it feasible to model the interconversion between these stateswith the appropriate kinase and phosphatase reactions. In the present treatment ofGS kinetics, we have therefore decided on the following simplifying assumptions:1) both phosphorylation and dephosphorylation of all the phosphorylation clustersproceed strictly sequentially, 2) phosphorylation at each site is all-or-nothing, that is,if for instance site 2 is phosphorylated, it is simultaneously phosphorylated on allfour subunits. The same holds for dephosphorylation. 3) Sites 1a and 1b are ne-glected, because phosphorylation at these sites does not result in kinetically distinctphosphorylation states. Although sites 5, 4, 3c, and 3b also have little effect on GSkinetics, they are included, because they are required for phosphorylation at site 3a.
Given these assumptions, GS is modelled as existing in only (2 + 1)(5 + 1) = 18states . Even though these 18 states are the result of simplifying assumptions, theyrepresent a subset of the total number of possible states and are therefore real phos-phorylation states in which GS can exist. Indeed many of these states have been thesubject in site-directed mutagenesis and sequential phosphorylation studies. Kineticdata, albeit limited, are therefore available for some of these states. Moreover, kineticdata for the interconversion between some of these states are also available.
With 18 phosphorylation states it is feasible to explicitly model the interconver-sion between the states with separate kinase and phosphatase reactions (Fig. 3.1).
Stellenbosch University http://scholar.sun.ac.za
CHAPTER 3. DEVELOPMENT OF A GLYCOGEN SYNTHASE RATE EQUATION 57
Unlike for the allosteric modification of GS, there will therefore be no explicit termsfor covalent modification in the GS rate equation. As we have chosen to representeach phosphorylation state as a separate species, the general form of the GS rateequation is the sum of the rates of all the GS states:
v = ∑i
vi (3.21)
where i is a particular phosphorylation state. In the next section, several modelsof allosterism and cooperativity are considered in order to arrive at an appropriateexpression for vi.
3.3 Kinetic models
Based on the detailed review of GS kinetics in the previous chapter, the followingassumptions are made:
• GS is a tetrameric enzyme
• reagents bind according to a random order bi-bi mechanism, but due to glyco-gen saturation the mechanism simplifies to a uni-reactant mechanism
• glycogen binding is non-cooperative or, equivalently, infinitely negatively co-operative
• UDP-glucose (UDPG) binding is non-cooperative in the absence of inhibitors
• glucose-6-phosphate (G6P) is an allosteric activator that binds cooperatively tothe phosphorylated enzyme
• G6P activation could be catalytic or specific, or both catalytic and specific
• ATP is an allosteric inhibitor that binds cooperatively to the dephosphorylatedenzyme
• ATP is a specific inhibitor, but the inhibition could also have a catalytic com-ponent
• ATP and G6P compete for the same allosteric site, but the possibility that theybind to different sites cannot be ruled out
• ATP possibly competes with UDPG at the active site
Stellenbosch University http://scholar.sun.ac.za
CHAPTER 3. DEVELOPMENT OF A GLYCOGEN SYNTHASE RATE EQUATION 58
Hill model
We have stated previously that the Hill model does not describe the kinetics of GSadequately. Here we will show more concretely why this is indeed the case. Adapt-ing the Hill-type equation proposed earlier (Eq. 2.4) to also allow for the possibilitythat ATP could be a catalytic inhibitor, to reflect which parameters depend on thephosphorylation state, and setting h = 1, an expression for vi can be written as
vi = kcati · [E]toti · µcati ×σi
µspeci + σi + πi×(
1− ΓKeq
)(3.22)
where
µcati =1 + γG6Pi · αG6Pi · ξhG6Pi
G6Pi+ γATPi · αATPi · ξhATPi
ATPi
1 + αG6Pi · ξhG6PiG6Pi
+ αATPi · ξhATPiATPi
(3.23)
and
µspeci =(
1 + ξhATP′ iATP′ i
) 1 + ξ
hG6PiG6Pi
+ ξhATPiATPi
1 + αG6Pi · ξhG6PiG6Pi
+ αATPi · ξhATPiATPi
(3.24)
where kcat is the catalytic constant; [E]tot is the total GS concentration; σ = [UDPG]UDPG0.5
;
π = [UDP]UDP0.5
; ξG6P = [G6P]G6P0.5
; ξATP = [ATP]ATP0.5
; ξATP′ =[ATP]
ATP′0.5; UDPG0.5, UDP0.5, G6P0.5,
ATP0.5, and ATP′0.5 are the UDPG, UDP, G6P, allosteric site ATP, and catalytic siteATP half-saturation concentrations in the absence of other ligands; γG6P > 1 is thedegree of G6P catalytic activation; γATP < 1 is the degree of ATP catalytic inhibition;αG6P > 1 and αATP < 1 are reactant-modifier interaction factors; hG6P is the degree ofG6P binding cooperativity; hATP and hATP′ are the degrees of ATP binding coopera-tivity at the allosteric and catalytic sites, respectively; Γ = [UDP]
[UDPG]is the mass-action
ratio; and Keq is the equilibrium constant. Parameters that depend on the phospho-rylation state are indicated with the subscript i. Note that [E]toti is not a parameter,but a variable species concentration.
In order to describe the kinetics of all 18 GS phosphorylation states a total of 253parameters are required (14 phosphorylation-dependent parameters per state plusone phosphorylation-independent parameter). Obtaining values for this multitudeof parameters from the limited kinetic data that are available is, however, not feasi-ble.
Stellenbosch University http://scholar.sun.ac.za
CHAPTER 3. DEVELOPMENT OF A GLYCOGEN SYNTHASE RATE EQUATION 59
The number of parameters can be slightly reduced by considering that, in theabsence of ATP, saturating G6P appears to completely overcome the effect of phos-phorylation on kcat and UDPG0.5, i.e., the apparent kcat and UDPG0.5 at saturatingG6P have constant values that are independent of the phosphorylation state i:
kcatapp = γG6Pi · kcati (3.25)
and
UDPG0.5app = UDPG0.5i/αG6Pi (3.26)
Rewriting these equations to have γG6Pi and αG6Pi on the left hand side and sub-stituting in Eq. 3.22 results in an equation with two more phosphorylation-indepen-dent parameters and two fewer parameters per state, decreasing the number of pa-rameters to 219. Introducing similar constraints for ATP, which is harder to justify,further decreases the number of parameters to 185. However, even considering thisreduced number of parameters, we have not been able to find a rich enough experi-mental data set in the literature that would allow fitting these parameters.
A more serious impediment to the application of the Hill model to GS kinetics,regardless of whether a rich enough experimental data set can be obtained, is itsinability to account for variations in the degree of cooperativity (heterotropic coop-erativity). It is well-established that G6P increases the degree of cooperativity withwhich ATP binds to GS, and the other way around. In an attempt to remedy thisshortcoming, it has been proposed [150] that the Hill coefficient for a particular lig-and be expressed as a function of the heterotropic ligand that alters it (assuming ahyperbolic relationship):
happ = h(
1 + βξ
1 + ξ
)(3.27)
where ξ = x/x0.5; x and x0.5 are the heterotropic ligand concentration and half-saturation concentration; and β is the factor by which h is multiplied at saturating x.Given that both G6P and ATP bind cooperatively to GS, one would, however, expecta sigmoidal relationship, but a sigmoidal relationship would result in the mutuallyrecursive expression of hG6Papp in terms of hATPapp:
hG6Papp = hG6P
(1 + βξhATPapp
1 + ξhATPapp
)(3.28)
Stellenbosch University http://scholar.sun.ac.za
CHAPTER 3. DEVELOPMENT OF A GLYCOGEN SYNTHASE RATE EQUATION 60
where
hATPapp = hATP
(1 + βξhG6Papp
1 + ξhG6Papp
)(3.29)
These forms would be even more complicated if they also reflected the competi-tion between ATP and G6P. Unless it can be shown that the dependence of the Hillcoefficient for each ligand on the concentration of the other ligand is hyperbolic, wewould not consider this approach to be workable, especially since two additionalparameters, possibly depending on the phosphorylation state, would have to be in-troduced.
Monod-Wyman-Changeux model
The MWC model is probably the best-known model of cooperativity and allosterism.In the MWC model all n subunits of an enzyme are simultaneously in either the T orR conformation. The conversion of all subunits from one to the other conformationis thus concerted. The equilibrium ratio of the concentration of unliganded enzymein the T conformation to that in the R conformation is given by L0, the allostericconstant. Any ligand that preferentially binds to a particular conformation will bynecessity shift the equilibrium between the liganded T and R conformations in thedirection of the preferred conformation and thus appear to alter L0. The subsequentbinding of another ligand of the same or different type will therefore be enhanced,as the proportion of enzyme in this conformation is increased, thus giving rise tohomotropic cooperativity. The subsequent binding of a different ligand that prefersthe opposite conformation would, on the other hand, be hindered. There is, how-ever, a greater potential for the second ligand to alter the equilibrium in favour ofthe opposite conformation, thus giving rise to heterotropic cooperativity.
Another attractive feature of the MWC model is that it describes cooperativityon a per ligand basis, even allowing complete non-cooperative binding for someligands while others still bind cooperatively. There is no single parameter, as in theHill model, that describes cooperativity. Instead the degree of cooperativity dependson L0, the allosteric constant, n, the number of subunits, and on the relative affinitiesof the two conformations for a particular ligand. Consider the simple irreversibleMWC equation for an enzyme with an allosteric modifier:
Stellenbosch University http://scholar.sun.ac.za
CHAPTER 3. DEVELOPMENT OF A GLYCOGEN SYNTHASE RATE EQUATION 61
v =
Vmaxtnσt (1 + σt)n−1 L0
(1 + ξt
1 + ξr
)n+ Vmaxrnσr (1 + σr)
n−1
(1 + σt)n L0
(1 + ξt
1 + ξr
)n+ (1 + σr)
n(3.30)
where t and r denote enzyme in the T and R conformations; σ = s/Ks; ξ = x/Kx; sand x are the substrate and modifier concentrations; Ks and Kx are intrinsic dissocia-tion constants; and L0 is the allosteric constant. Both conformations are catalyticallyactive and substrate is allowed to bind to either the T or R conformation. Settingn = 1 results in
v =
VmaxtσtL0
(1 + ξt
1 + ξr
)+ Vmaxrσr
(1 + σt) L0
(1 + ξt
1 + ξr
)+ (1 + σr)
(3.31)
thereby abolishing cooperativity with respect to all ligands, regardless of the valuesof L0 or the relative affinities of the two conformations for any particular ligand.Similarly, setting L0 = 0, or letting L0 → ∞ results in
v =Vmaxnσ (1 + σ)n−1
(1 + σ)n (3.32)
=Vmaxnσ
1 + σ(3.33)
thereby abolishing all cooperativity and modifier effects. Cooperativity is observedfor all other values of L0, with the maximum degree of cooperativity with respect toa particular ligand occurring when L0 =
√(Kt/Kr)n. Alternatively, setting σ = σr =
σt, i.e., assuming that substrate binds equally well to the T and R conformations,results in
v =
VmaxtnσL0
(1 + ξt
1 + ξr
)n+ Vmaxrnσ
(1 + σ) L0
(1 + ξt
1 + ξr
)n+ (1 + σ)
(3.34)
In this form of the equation substrate binds non-cooperatively while cooperativitywith respect to the allosteric modifier remains unaffected. The situation is slightlymore complicated when ligands compete for the same site. Supposing that the mod-ifier binds to the catalytic site, instead of the allosteric site, alters Eq. 3.34 to
Stellenbosch University http://scholar.sun.ac.za
CHAPTER 3. DEVELOPMENT OF A GLYCOGEN SYNTHASE RATE EQUATION 62
v =Vmaxtnσ (1 + σ + ξt)
n−1 L0 + Vmaxrnσ (1 + σ + ξr)n−1
(1 + σ + ξt)n L0 + (1 + σ + ξr)
n (3.35)
showing that substrate binds cooperatively, but only in the presence of modifier.Appreciation for the per-ligand description of cooperativity in the MWC model
is often lost due to the assumption, which is practically always made, that substrateonly binds to the R conformation (σt = 0), essentially forcing the condition σt 6= σr,so that substrate binding is always cooperative. Indeed, the supposed inability of theMWC model to describe non-cooperative substrate binding has been put forward asan argument against its applicability to GS kinetics [67].
As for the Hill model, an expression for vi according to the MWC model couldbe formulated by considering each of the 18 phosphorylation states of GS to be de-scribed by a different set of parameter values. This would mean that each phos-phorylation state is in equilibrium between a T and R conformation, but that T andR conformations in different states are not necessarily kinetically identical. Therewould thus be 18 possibly unique T conformations and R conformations. But wehere run into the same problems as with the Hill model: a separate set of parametervalues, with the exception of n and Keq, will have to be obtained for each phos-phorylation state. A simple solution entails treating all T conformations and all Rconformations, regardless of phosphorylation states, as identical, but allowing eachphosphorylation state to have a different value for L0. In other words, a single T andR conformation is shared by all the phosphorylation states, but for each state theequilibrium T/R ratio will be potentially different. This simplification decreases thenumber of parameters significantly, as only L0 and the concentration of the enzymein a particular state will vary with phosphorylation. All other parameters have thesame values, regardless of phosphorylation state.
Not only does the number of parameters decrease, but by treating covalent mod-ification as equivalent to classic MWC-type allosteric modification, i.e., as an appar-ent change to the value of L0 (albeit explicit in the case of covalent modification)it becomes possible to describe the experimentally observed changes in cooperativ-ity with respect to G6P and ATP resulting from phosphorylation. In particular, ifphosphorylation increases the apparent value of L0, it will increase cooperativitywith respect to G6P by virtue of decreasing the concentration of the conformationpreferred by G6P. Conversely, phosphorylation will decrease the degree of cooper-ativity with respect to ATP binding. Admittedly, these phenomena would also beobserved without assuming that all T conformations and all R conformations are
Stellenbosch University http://scholar.sun.ac.za
CHAPTER 3. DEVELOPMENT OF A GLYCOGEN SYNTHASE RATE EQUATION 63
identical, but not making this assumption runs contrary to the central assumptionof the MWC model that ligands do not affect the kinetics of any conformation, butrather affect the apparent equilibrium concentrations of conformations.
We will now proceed to investigate particular forms of the MWC equation, but letus first consider a generic form from which more specific forms can be obtained. Thereversible uni-substrate MWC equation for an enzyme with n subunits, an arbitrarynumber of active site competitive inhibitors, allosteric sites, and ligands competingper allosteric site is given by [156, 157]:
v =
Vmaxtnσt
(1 + σt + πt + ∑
jξtj
)n−1
L0 ∏k
(1 + ∑
lξtkl
)n
+
Vmaxrnσr
(1 + σr + πr + ∑
jξrj
)n−1
∏k
(1 + ∑
lξrkl
)n
(1 + σt + πt + ∑
jξtj
)n
L0 ∏k
(1 + ∑
lξtkl
)n
+
(1 + σr + πr + ∑
jξrj
)n
∏k
(1 + ∑
lξtkl
)n
×(
1− ΓKeq
)
(3.36)where t and r indicate parameters pertaining to the T and R conformations; j indi-cates a particular non-reactant catalytic site ligand; k indicates a particular allostericsite; l indicates a particular ligand that binds to allosteric site k; σ = s/Ks; π = p/Kp;ξ = x/Kx; s, p, and x are substrate, product and modifier concentrations; Ks, Kp, andKx are intrinsic dissociation constants; L0 is the equilibrium ratio of unliganded en-zyme in the T conformation to unliganded enzyme in the R conformation; Γ = p/sis the mass-action ratio; and Keq is the equilibrium constant.
We considered several specific forms of Eq. 3.36 in order to obtain the most ap-propriate expression for vi. In each case the enzyme was assumed to be a tetramer,i.e. n = 4. Furthermore, although we do not consider GS to be irreversible, we wereunable to find an appropriate data set in which UDP is varied; we therefore only con-sidered irreversible forms of Eq. 3.36. When applying Eq. 3.36 to the case of GS, theobservation that saturating G6P concentrations do not completely reverse inhibitionby ATP can be described in two ways. In the first description it is assumed that G6Pand ATP compete for the same allosteric site, but that ATP also binds to the catalyticsite in competition with the substrate UDPG, yielding the equation (DepCom):
Stellenbosch University http://scholar.sun.ac.za
CHAPTER 3. DEVELOPMENT OF A GLYCOGEN SYNTHASE RATE EQUATION 64
vi =
Vmaxtnσt
(1 + σt + ξATP′ t
)n−1L0i
(1 + ξG6Pt + ξATPt1 + ξG6Pr + ξATPr
)n+
Vmaxrnσr
(1 + σr + ξATP′ r
)n−1
(1 + σt + ξATP′ t
)nL0i
(1 + ξG6Pt + ξATPt1 + ξG6Pr + ξATPr
)n+
(1 + σr + ξATP′ r
)n
(3.37)
The MWC equation is often simplified by adopting the assumption that substrateis unable to bind to the T conformation, i.e., σt = 0. However, as discussed above,this assumption only allows for strong cooperativity with respect to substrate bind-ing, whereas in the case of GS only mild or no cooperativity is observed for UDPGbinding. Alternatively, if it is assumed that only the R conformation exhibits anycatalytic activity, i.e., Vmaxt = 0, a much simpler form, but one which allows for mildor no substrate cooperativity, is obtained (terms that disappear as a result of this andsubsequent assumptions are shown in gray, DepComR):
vi =
Vmaxtnσt
(1 + σt + ξATP′ t
)n−1L0i
(1 + ξG6Pt + ξATPt1 + ξG6Pr + ξATPr
)n+
Vmaxrnσr
(1 + σr + ξATP′ r
)n−1
(1 + σt + ξATP′ t
)nL0i
(1 + ξG6Pt + ξATPt1 + ξG6Pr + ξATPr
)n+
(1 + σr + ξATP′ r
)n
(3.38)
For the case in which ATP does not bind to the catalytic site, but still competeswith G6P for the allosteric site (setting ξATP′ r = 0 and ξATP′ t = 0) Eq. 3.37 simplifiesto (Dep)
vi =
Vmaxtnσt
(1 + σt+ ξATP′ t
)n−1L0i
(1 + ξG6Pt + ξATPt1 + ξG6Pr + ξATPr
)n+
Vmaxrnσr
(1 + σr + ξATP′ r
)n−1
(1 + σt + ξATP′ t
)nL0i
(1 + ξG6Pt + ξATPt1 + ξG6Pr + ξATPr
)n+
(1 + σr + ξATP′ r
)n
(3.39)
Stellenbosch University http://scholar.sun.ac.za
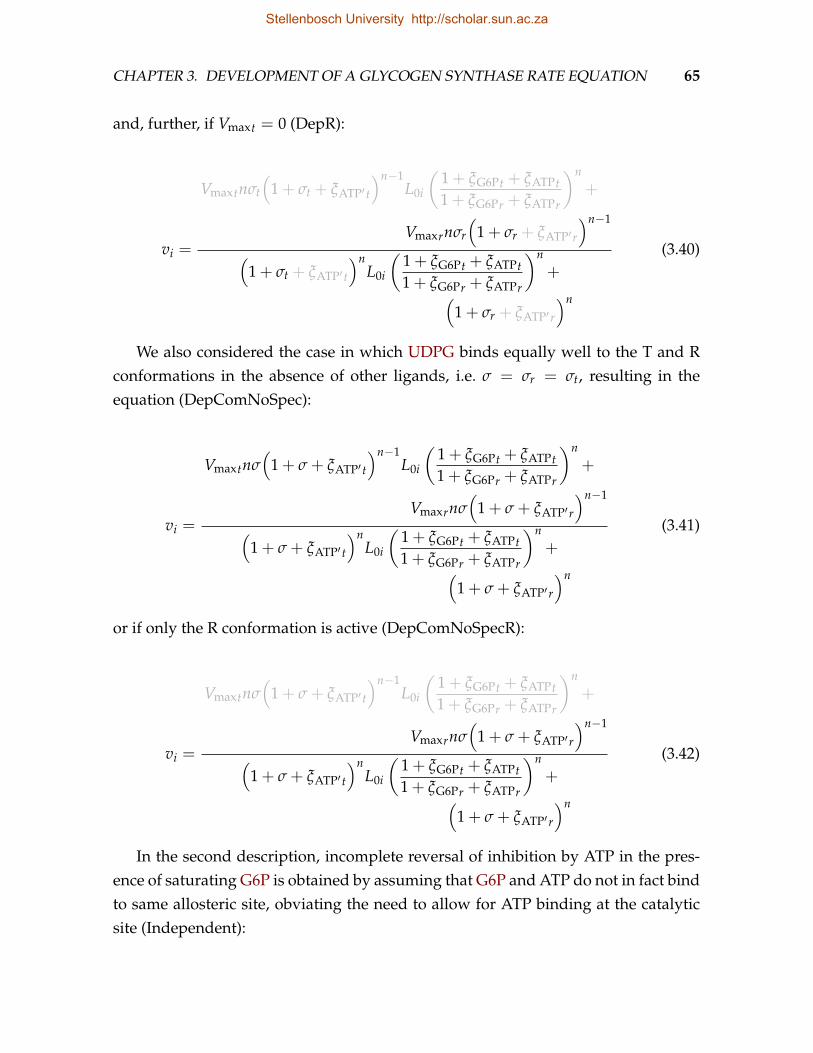
CHAPTER 3. DEVELOPMENT OF A GLYCOGEN SYNTHASE RATE EQUATION 65
and, further, if Vmaxt = 0 (DepR):
vi =
Vmaxtnσt
(1 + σt + ξATP′ t
)n−1L0i
(1 + ξG6Pt + ξATPt1 + ξG6Pr + ξATPr
)n+
Vmaxrnσr
(1 + σr + ξATP′ r
)n−1
(1 + σt + ξATP′ t
)nL0i
(1 + ξG6Pt + ξATPt1 + ξG6Pr + ξATPr
)n+
(1 + σr + ξATP′ r
)n
(3.40)
We also considered the case in which UDPG binds equally well to the T and Rconformations in the absence of other ligands, i.e. σ = σr = σt, resulting in theequation (DepComNoSpec):
vi =
Vmaxtnσ(
1 + σ + ξATP′ t
)n−1L0i
(1 + ξG6Pt + ξATPt1 + ξG6Pr + ξATPr
)n+
Vmaxrnσ(
1 + σ + ξATP′ r
)n−1
(1 + σ + ξATP′ t
)nL0i
(1 + ξG6Pt + ξATPt1 + ξG6Pr + ξATPr
)n+
(1 + σ + ξATP′ r
)n
(3.41)
or if only the R conformation is active (DepComNoSpecR):
vi =
Vmaxtnσ(
1 + σ + ξATP′ t
)n−1L0i
(1 + ξG6Pt + ξATPt1 + ξG6Pr + ξATPr
)n+
Vmaxrnσ(
1 + σ + ξATP′ r
)n−1
(1 + σ + ξATP′ t
)nL0i
(1 + ξG6Pt + ξATPt1 + ξG6Pr + ξATPr
)n+
(1 + σ + ξATP′ r
)n
(3.42)
In the second description, incomplete reversal of inhibition by ATP in the pres-ence of saturating G6P is obtained by assuming that G6P and ATP do not in fact bindto same allosteric site, obviating the need to allow for ATP binding at the catalyticsite (Independent):
Stellenbosch University http://scholar.sun.ac.za
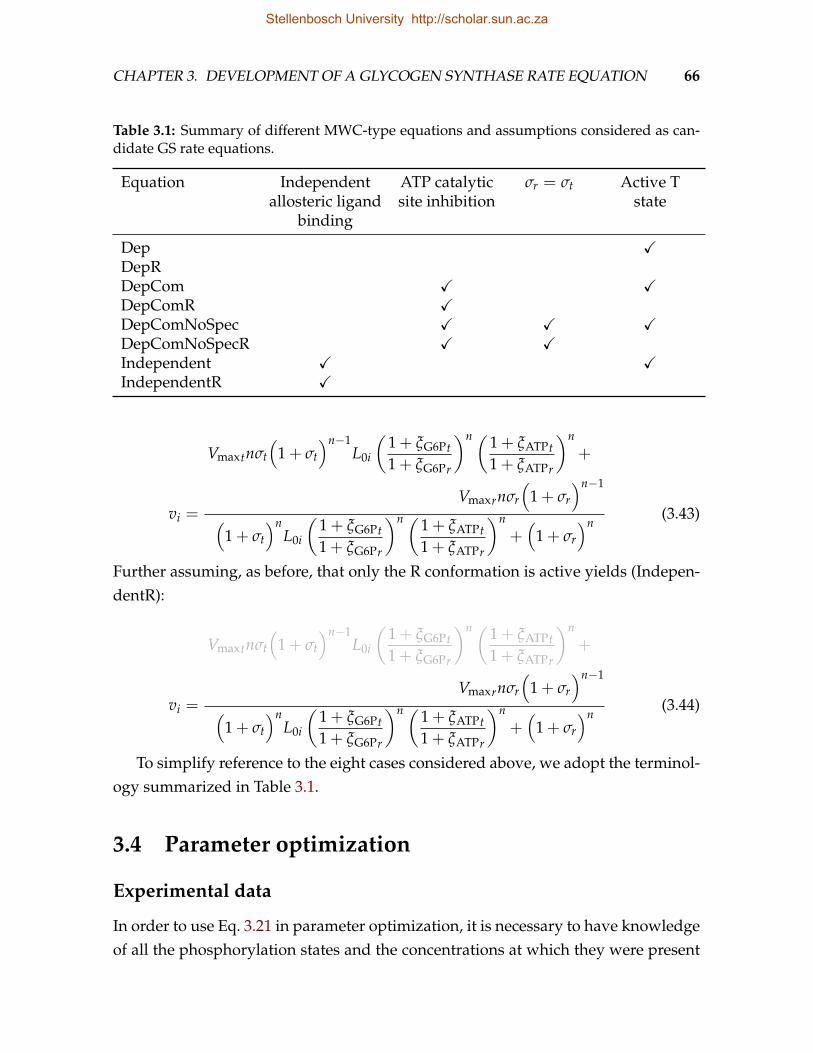
CHAPTER 3. DEVELOPMENT OF A GLYCOGEN SYNTHASE RATE EQUATION 66
Table 3.1: Summary of different MWC-type equations and assumptions considered as can-didate GS rate equations.
Equation Independentallosteric ligand
binding
ATP catalyticsite inhibition
σr = σt Active Tstate
Dep XDepRDepCom X XDepComR XDepComNoSpec X X XDepComNoSpecR X XIndependent X XIndependentR X
vi =
Vmaxtnσt
(1 + σt
)n−1L0i
(1 + ξG6Pt1 + ξG6Pr
)n (1 + ξATPt1 + ξATPr
)n+
Vmaxrnσr
(1 + σr
)n−1
(1 + σt
)nL0i
(1 + ξG6Pt1 + ξG6Pr
)n (1 + ξATPt1 + ξATPr
)n+(
1 + σr
)n(3.43)
Further assuming, as before, that only the R conformation is active yields (Indepen-dentR):
vi =
Vmaxtnσt
(1 + σt
)n−1L0i
(1 + ξG6Pt1 + ξG6Pr
)n (1 + ξATPt1 + ξATPr
)n+
Vmaxrnσr
(1 + σr
)n−1
(1 + σt
)nL0i
(1 + ξG6Pt1 + ξG6Pr
)n (1 + ξATPt1 + ξATPr
)n+(
1 + σr
)n(3.44)
To simplify reference to the eight cases considered above, we adopt the terminol-ogy summarized in Table 3.1.
3.4 Parameter optimization
Experimental data
In order to use Eq. 3.21 in parameter optimization, it is necessary to have knowledgeof all the phosphorylation states and the concentrations at which they were present
Stellenbosch University http://scholar.sun.ac.za
CHAPTER 3. DEVELOPMENT OF A GLYCOGEN SYNTHASE RATE EQUATION 67
in the assay used to obtain the experimental results. We have not been able to obtainan experimental data set from the literature in which both the exact phosphoryla-tion states were known and in which the assay was repeated for all the conditionsthat would allow parameter optimization for any of the kinetic models proposed.However, we have been able to show that, for any of the MWC-type kinetic models,Eq. 3.21 can be rewritten as a single term, as opposed to a sum, that takes on theform of vi, as defined for the particular kinetic model, but with L0, which replacesL0i, as a function of the concentrations of the GS phosphorylation states and the L0i
values for all the states (see Appendix A.1). In this form, if L0 is treated as a param-eter, it is not necessary to know in which phosphorylation states GS is present orat what concentrations. The only remaining requirement is that experimental datamust be available for both extensively dephosphorylated and extensively phospho-rylated enzymes states. In order to obtain values for the parameters of Eqs. 3.37 to3.44, the enzyme must also be assayed for a range of UDPG, G6P, and ATP concen-trations.
Exploiting the sequential and hierarchical phosphorylation of GS, various statesof the C543 [107, 120] and C22a [106] clusters have been assayed. However, as thesestudies did not have a complete kinetic characterization of GS kinetics as goal, thestates were assayed at a single UDPG concentration and at only two G6P concen-trations. Inhibition by ATP was also not considered. On the other hand, others likeSølling [42] assayed GS in the presence of several allosteric modifiers at various con-centrations, but only considered a particular phosphorylation state.
The kinetic characterization of rat muscle GS by Piras et al. [39, 67] provides, toour knowledge, the only experimental data set in which GS was assayed at varyingsubstrate, product, activator, and inhibitor concentrations for both the dephospho-rylated (I form) and phosphorylated (D form) enzyme. Parameters for the variouscandidate definitions of vi were therefore fitted to this data set. Note that the exactcomposition of the two enzyme forms in terms of phosphorylation state is unknown,but, judging by the ratio of activity in the absence and presence of 10 mM G6P, the Iform (0.75–1) was essentially dephosphorylated, whereas the D form (0.05–0.15) wasextensively phosphorylated.
There are a few shortcomings in using this data set. First, the enzyme concentra-tions used in the assays are unknown; it is thus not possible to obtain values for kcat.Second, the dependence of activity on the concentration of UDPG at different ATPconcentrations for the two phosphorylation states are represented as Lineweaver-
Stellenbosch University http://scholar.sun.ac.za
CHAPTER 3. DEVELOPMENT OF A GLYCOGEN SYNTHASE RATE EQUATION 68
Burk plots. Using data linearized according to this transformation in parameteroptimization increases the error in parameter values. To minimize this error andalso to avoid forcing hyperbolic kinetics on UDPG binding, we chose to reverse thislinearization, but in so doing ran the risk of enlarging any error introduced duringthe digitization of the data. Third, the exact x coordinates of many data points areunknown, so that error is introduced in both the x and y coordinates during digiti-zation. Fourth, Piras et al. [39] considered the D form to be contaminated with 10%of the I form and therefore applied a correction to the D form data. Their conclusionwas probably based on the misconception that the D form is entirely dependent onG6P; they therefore ascribed any observed activity in the absence of G6P to contami-nation with I form. We have not attempted to reverse this correction, but expect thatit will only affect the value of L0. Since no L0 value fitted to the data of Piras et al. [67]corresponds to a known phosphorylation state, error in this value is not a concern.
Data points were extracted from the graphs in [67] with the program Engauge Dig-itizer (http://digitizer.sourceforge.net). High-resolution PNG images of the graphswere obtained from a PDF version of the paper. These images were imported intoEngauge individually and zoomed to an appropriate size. The coordinates for eachdata point were set manually at what was judged to be the centre of the associatedsymbol. Where values were clearly given in the text, digitized x coordinates wereadjusted accordingly.
Methods
Algorithm and weighting
The Levenberg-Marquardt algorithm [158] was used to minimize the sum of squaredresiduals S:
S =n
∑i=1
r2i (3.45)
where r2i = (vi − vi)
2, with v the observed rate and v the rate calculated from therate equation.
We found this algorithm to be considerably faster than global optimization al-gorithms such as simulated annealing (SciPy, http://www.scipy.org) or particle swarm[159], but it is less likely to find the global minimum. To increase the likelihood ofobtaining a global minimum, we seeded each optimization with random initial pa-
Stellenbosch University http://scholar.sun.ac.za
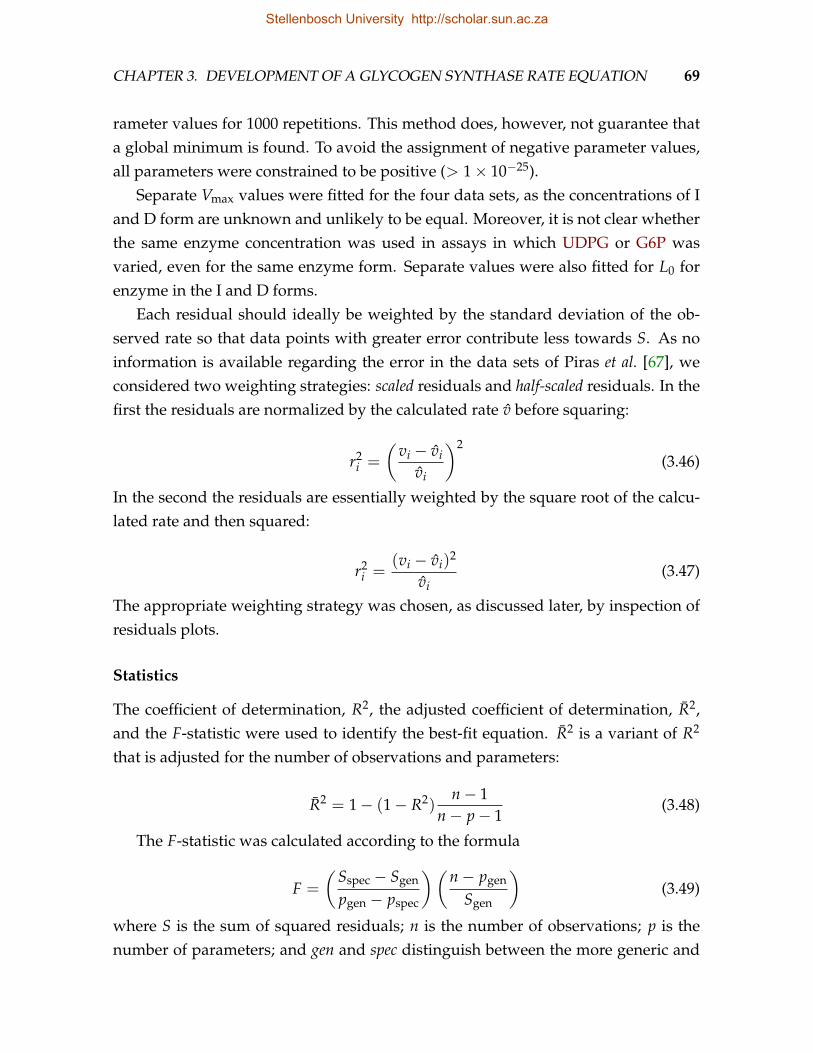
CHAPTER 3. DEVELOPMENT OF A GLYCOGEN SYNTHASE RATE EQUATION 69
rameter values for 1000 repetitions. This method does, however, not guarantee thata global minimum is found. To avoid the assignment of negative parameter values,all parameters were constrained to be positive (> 1× 10⁻²⁵).
Separate Vmax values were fitted for the four data sets, as the concentrations of Iand D form are unknown and unlikely to be equal. Moreover, it is not clear whetherthe same enzyme concentration was used in assays in which UDPG or G6P wasvaried, even for the same enzyme form. Separate values were also fitted for L0 forenzyme in the I and D forms.
Each residual should ideally be weighted by the standard deviation of the ob-served rate so that data points with greater error contribute less towards S. As noinformation is available regarding the error in the data sets of Piras et al. [67], weconsidered two weighting strategies: scaled residuals and half-scaled residuals. In thefirst the residuals are normalized by the calculated rate v before squaring:
r2i =
(vi − vi
vi
)2
(3.46)
In the second the residuals are essentially weighted by the square root of the calcu-lated rate and then squared:
r2i =
(vi − vi)2
vi(3.47)
The appropriate weighting strategy was chosen, as discussed later, by inspection ofresiduals plots.
Statistics
The coefficient of determination, R2, the adjusted coefficient of determination, R2,and the F-statistic were used to identify the best-fit equation. R2 is a variant of R2
that is adjusted for the number of observations and parameters:
R2 = 1− (1− R2)n− 1
n− p− 1(3.48)
The F-statistic was calculated according to the formula
F =
(Sspec − Sgen
pgen − pspec
)(n− pgen
Sgen
)(3.49)
where S is the sum of squared residuals; n is the number of observations; p is thenumber of parameters; and gen and spec distinguish between the more generic and
Stellenbosch University http://scholar.sun.ac.za
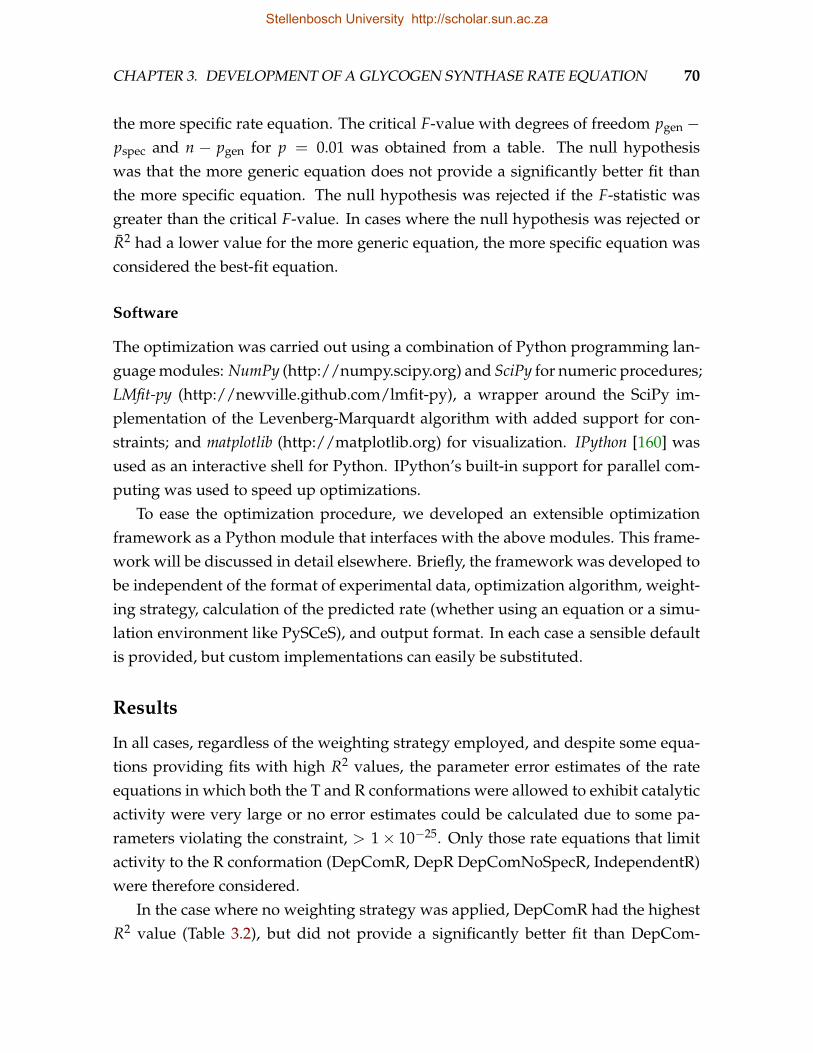
CHAPTER 3. DEVELOPMENT OF A GLYCOGEN SYNTHASE RATE EQUATION 70
the more specific rate equation. The critical F-value with degrees of freedom pgen −pspec and n − pgen for p = 0.01 was obtained from a table. The null hypothesiswas that the more generic equation does not provide a significantly better fit thanthe more specific equation. The null hypothesis was rejected if the F-statistic wasgreater than the critical F-value. In cases where the null hypothesis was rejected orR2 had a lower value for the more generic equation, the more specific equation wasconsidered the best-fit equation.
Software
The optimization was carried out using a combination of Python programming lan-guage modules: NumPy (http://numpy.scipy.org) and SciPy for numeric procedures;LMfit-py (http://newville.github.com/lmfit-py), a wrapper around the SciPy im-plementation of the Levenberg-Marquardt algorithm with added support for con-straints; and matplotlib (http://matplotlib.org) for visualization. IPython [160] wasused as an interactive shell for Python. IPython’s built-in support for parallel com-puting was used to speed up optimizations.
To ease the optimization procedure, we developed an extensible optimizationframework as a Python module that interfaces with the above modules. This frame-work will be discussed in detail elsewhere. Briefly, the framework was developed tobe independent of the format of experimental data, optimization algorithm, weight-ing strategy, calculation of the predicted rate (whether using an equation or a simu-lation environment like PySCeS), and output format. In each case a sensible defaultis provided, but custom implementations can easily be substituted.
Results
In all cases, regardless of the weighting strategy employed, and despite some equa-tions providing fits with high R2 values, the parameter error estimates of the rateequations in which both the T and R conformations were allowed to exhibit catalyticactivity were very large or no error estimates could be calculated due to some pa-rameters violating the constraint, > 1× 10⁻²⁵. Only those rate equations that limitactivity to the R conformation (DepComR, DepR DepComNoSpecR, IndependentR)were therefore considered.
In the case where no weighting strategy was applied, DepComR had the highestR2 value (Table 3.2), but did not provide a significantly better fit than DepCom-
Stellenbosch University http://scholar.sun.ac.za
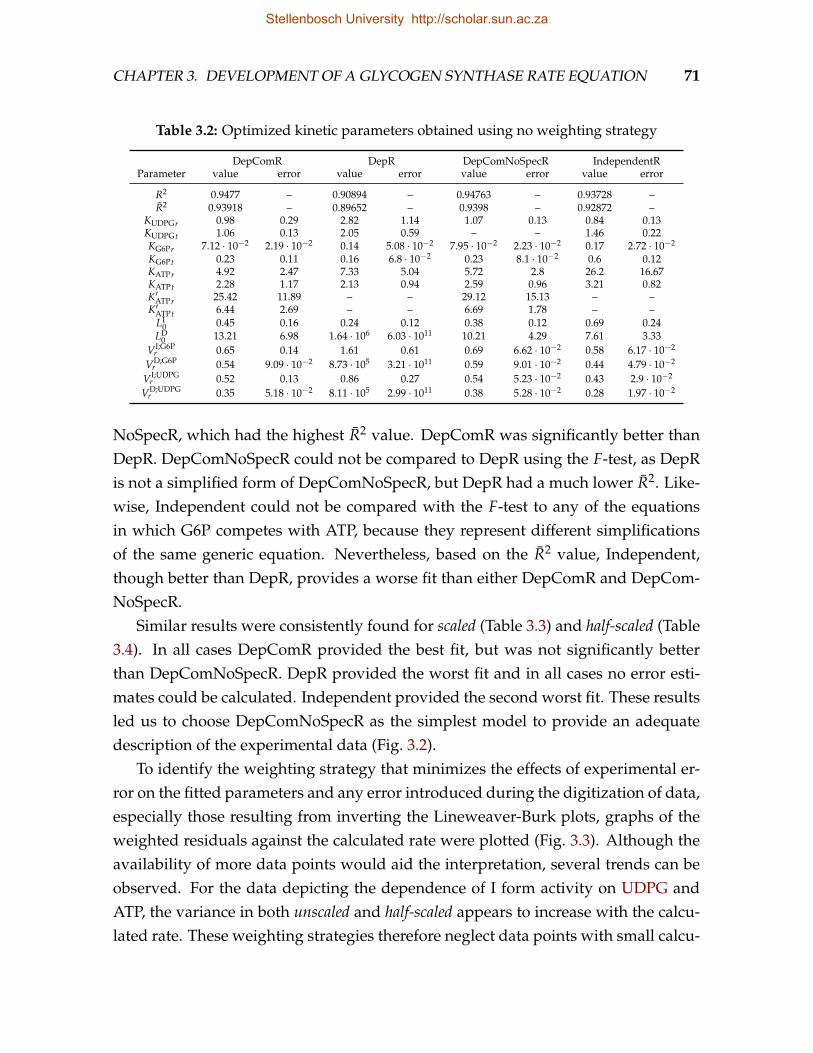
CHAPTER 3. DEVELOPMENT OF A GLYCOGEN SYNTHASE RATE EQUATION 71
Table 3.2: Optimized kinetic parameters obtained using no weighting strategy
DepComR DepR DepComNoSpecR IndependentRParameter value error value error value error value error
R2 0.9477 – 0.90894 – 0.94763 – 0.93728 –R2 0.93918 – 0.89652 – 0.9398 – 0.92872 –
KUDPGr 0.98 0.29 2.82 1.14 1.07 0.13 0.84 0.13KUDPGt 1.06 0.13 2.05 0.59 – – 1.46 0.22KG6Pr 7.12 · 10−2 2.19 · 10−2 0.14 5.08 · 10−2 7.95 · 10−2 2.23 · 10−2 0.17 2.72 · 10−2
KG6Pt 0.23 0.11 0.16 6.8 · 10−2 0.23 8.1 · 10−2 0.6 0.12KATPr 4.92 2.47 7.33 5.04 5.72 2.8 26.2 16.67KATPt 2.28 1.17 2.13 0.94 2.59 0.96 3.21 0.82K′ATPr 25.42 11.89 – – 29.12 15.13 – –K′ATPt 6.44 2.69 – – 6.69 1.78 – –
LI0 0.45 0.16 0.24 0.12 0.38 0.12 0.69 0.24
LD0 13.21 6.98 1.64 · 106 6.03 · 1011 10.21 4.29 7.61 3.33
VI;G6Pr 0.65 0.14 1.61 0.61 0.69 6.62 · 10−2 0.58 6.17 · 10−2
VD;G6Pr 0.54 9.09 · 10−2 8.73 · 105 3.21 · 1011 0.59 9.01 · 10−2 0.44 4.79 · 10−2
VI;UDPGr 0.52 0.13 0.86 0.27 0.54 5.23 · 10−2 0.43 2.9 · 10−2
VD;UDPGr 0.35 5.18 · 10−2 8.11 · 105 2.99 · 1011 0.38 5.28 · 10−2 0.28 1.97 · 10−2
NoSpecR, which had the highest R2 value. DepComR was significantly better thanDepR. DepComNoSpecR could not be compared to DepR using the F-test, as DepRis not a simplified form of DepComNoSpecR, but DepR had a much lower R2. Like-wise, Independent could not be compared with the F-test to any of the equationsin which G6P competes with ATP, because they represent different simplificationsof the same generic equation. Nevertheless, based on the R2 value, Independent,though better than DepR, provides a worse fit than either DepComR and DepCom-NoSpecR.
Similar results were consistently found for scaled (Table 3.3) and half-scaled (Table3.4). In all cases DepComR provided the best fit, but was not significantly betterthan DepComNoSpecR. DepR provided the worst fit and in all cases no error esti-mates could be calculated. Independent provided the second worst fit. These resultsled us to choose DepComNoSpecR as the simplest model to provide an adequatedescription of the experimental data (Fig. 3.2).
To identify the weighting strategy that minimizes the effects of experimental er-ror on the fitted parameters and any error introduced during the digitization of data,especially those resulting from inverting the Lineweaver-Burk plots, graphs of theweighted residuals against the calculated rate were plotted (Fig. 3.3). Although theavailability of more data points would aid the interpretation, several trends can beobserved. For the data depicting the dependence of I form activity on UDPG andATP, the variance in both unscaled and half-scaled appears to increase with the calcu-lated rate. These weighting strategies therefore neglect data points with small calcu-
Stellenbosch University http://scholar.sun.ac.za
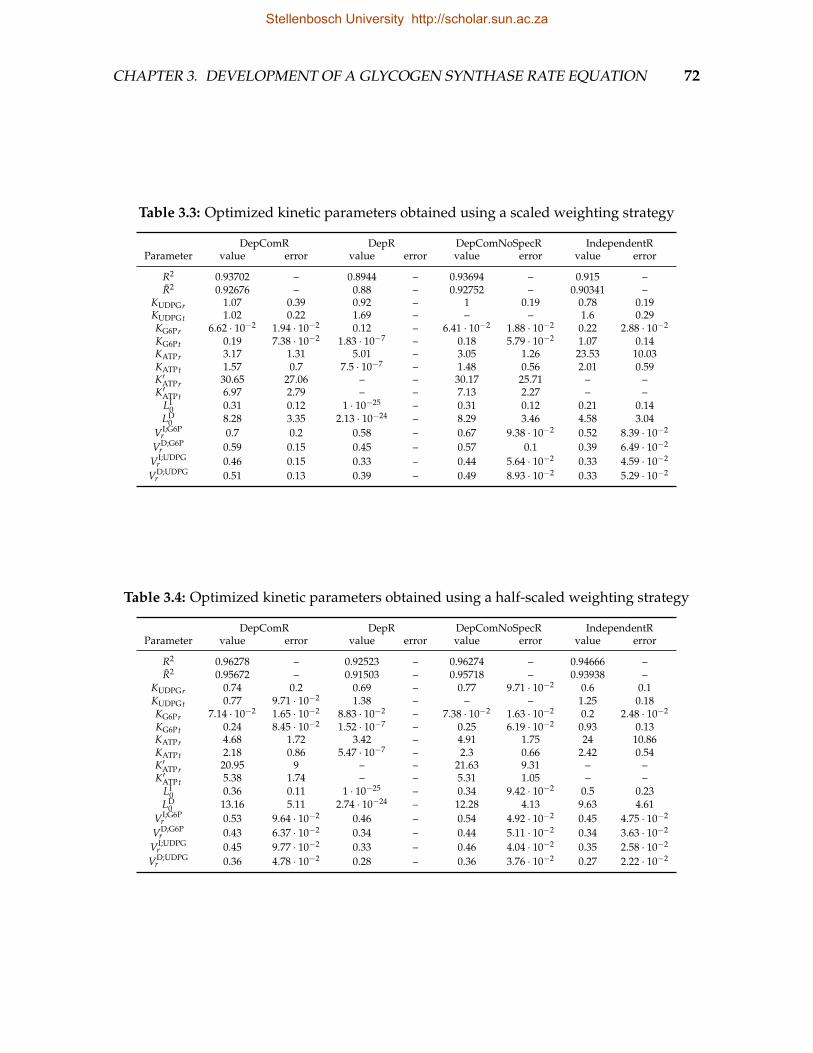
CHAPTER 3. DEVELOPMENT OF A GLYCOGEN SYNTHASE RATE EQUATION 72
Table 3.3: Optimized kinetic parameters obtained using a scaled weighting strategy
DepComR DepR DepComNoSpecR IndependentRParameter value error value error value error value error
R2 0.93702 – 0.8944 – 0.93694 – 0.915 –R2 0.92676 – 0.88 – 0.92752 – 0.90341 –
KUDPGr 1.07 0.39 0.92 – 1 0.19 0.78 0.19KUDPGt 1.02 0.22 1.69 – – – 1.6 0.29KG6Pr 6.62 · 10−2 1.94 · 10−2 0.12 – 6.41 · 10−2 1.88 · 10−2 0.22 2.88 · 10−2
KG6Pt 0.19 7.38 · 10−2 1.83 · 10−7 – 0.18 5.79 · 10−2 1.07 0.14KATPr 3.17 1.31 5.01 – 3.05 1.26 23.53 10.03KATPt 1.57 0.7 7.5 · 10−7 – 1.48 0.56 2.01 0.59K′ATPr 30.65 27.06 – – 30.17 25.71 – –K′ATPt 6.97 2.79 – – 7.13 2.27 – –
LI0 0.31 0.12 1 · 10−25 – 0.31 0.12 0.21 0.14
LD0 8.28 3.35 2.13 · 10−24 – 8.29 3.46 4.58 3.04
VI;G6Pr 0.7 0.2 0.58 – 0.67 9.38 · 10−2 0.52 8.39 · 10−2
VD;G6Pr 0.59 0.15 0.45 – 0.57 0.1 0.39 6.49 · 10−2
VI;UDPGr 0.46 0.15 0.33 – 0.44 5.64 · 10−2 0.33 4.59 · 10−2
VD;UDPGr 0.51 0.13 0.39 – 0.49 8.93 · 10−2 0.33 5.29 · 10−2
Table 3.4: Optimized kinetic parameters obtained using a half-scaled weighting strategy
DepComR DepR DepComNoSpecR IndependentRParameter value error value error value error value error
R2 0.96278 – 0.92523 – 0.96274 – 0.94666 –R2 0.95672 – 0.91503 – 0.95718 – 0.93938 –
KUDPGr 0.74 0.2 0.69 – 0.77 9.71 · 10−2 0.6 0.1KUDPGt 0.77 9.71 · 10−2 1.38 – – – 1.25 0.18KG6Pr 7.14 · 10−2 1.65 · 10−2 8.83 · 10−2 – 7.38 · 10−2 1.63 · 10−2 0.2 2.48 · 10−2
KG6Pt 0.24 8.45 · 10−2 1.52 · 10−7 – 0.25 6.19 · 10−2 0.93 0.13KATPr 4.68 1.72 3.42 – 4.91 1.75 24 10.86KATPt 2.18 0.86 5.47 · 10−7 – 2.3 0.66 2.42 0.54K′ATPr 20.95 9 – – 21.63 9.31 – –K′ATPt 5.38 1.74 – – 5.31 1.05 – –
LI0 0.36 0.11 1 · 10−25 – 0.34 9.42 · 10−2 0.5 0.23
LD0 13.16 5.11 2.74 · 10−24 – 12.28 4.13 9.63 4.61
VI;G6Pr 0.53 9.64 · 10−2 0.46 – 0.54 4.92 · 10−2 0.45 4.75 · 10−2
VD;G6Pr 0.43 6.37 · 10−2 0.34 – 0.44 5.11 · 10−2 0.34 3.63 · 10−2
VI;UDPGr 0.45 9.77 · 10−2 0.33 – 0.46 4.04 · 10−2 0.35 2.58 · 10−2
VD;UDPGr 0.36 4.78 · 10−2 0.28 – 0.36 3.76 · 10−2 0.27 2.22 · 10−2
Stellenbosch University http://scholar.sun.ac.za
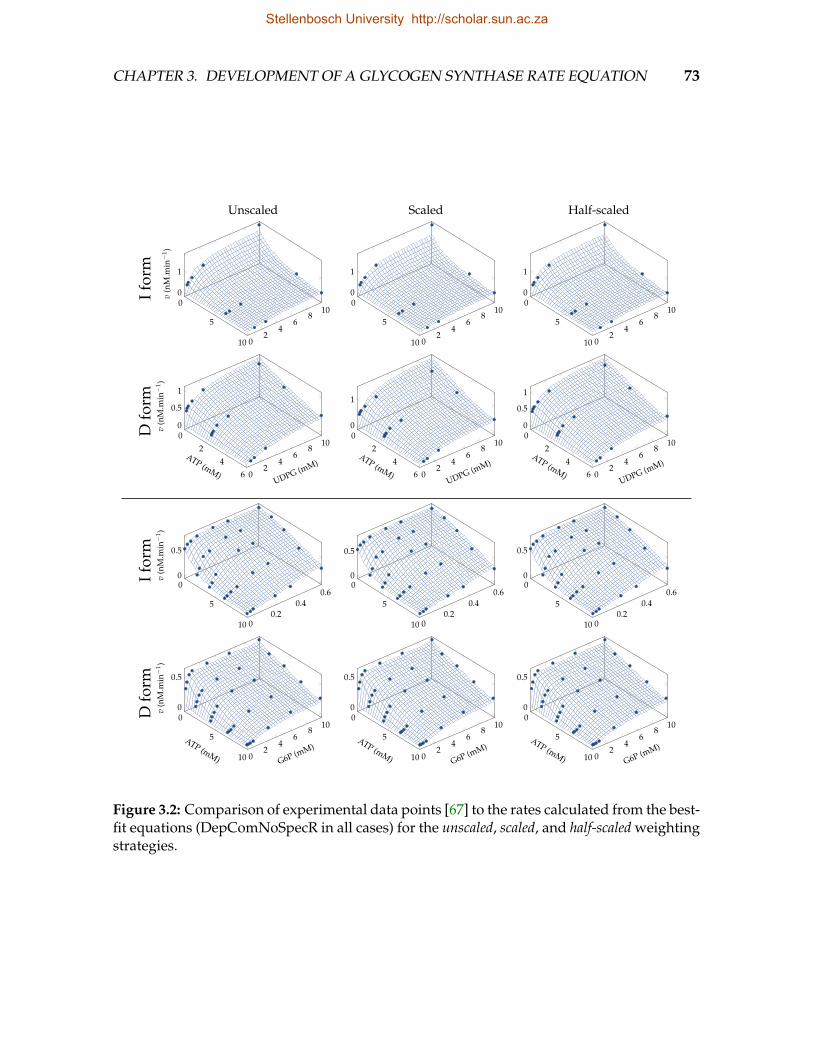
CHAPTER 3. DEVELOPMENT OF A GLYCOGEN SYNTHASE RATE EQUATION 73
0
5
10 02
46
810
0
1
v(n
M.m
in−
1 )
Unscaled
Ifor
m
0
5
10 02
46
810
0
1
Scaled
0
5
10 02
46
810
0
1
Half-scaled
02
46 0
24
68
10
0
0.5
1
ATP (mM)UDPG (mM)
v(n
M.m
in−
1 )D
form
02
46 0
24
68
10
0
1
ATP (mM)UDPG (mM)
02
46 0
24
68
10
0
0.5
1
ATP (mM)UDPG (mM)
0
5
10 00.2
0.40.6
0
0.5
v(n
M.m
in−
1 )If
orm
0
5
10 00.2
0.40.6
0
0.5
0
5
10 00.2
0.40.6
0
0.5
0
5
10 02
46
810
0
0.5
ATP (mM) G6P (mM)
v(n
M.m
in−
1 )D
form
0
5
10 02
46
810
0
0.5
ATP (mM) G6P (mM)
0
5
10 02
46
810
0
0.5
ATP (mM) G6P (mM)
Figure 3.2: Comparison of experimental data points [67] to the rates calculated from the best-fit equations (DepComNoSpecR in all cases) for the unscaled, scaled, and half-scaled weightingstrategies.
Stellenbosch University http://scholar.sun.ac.za
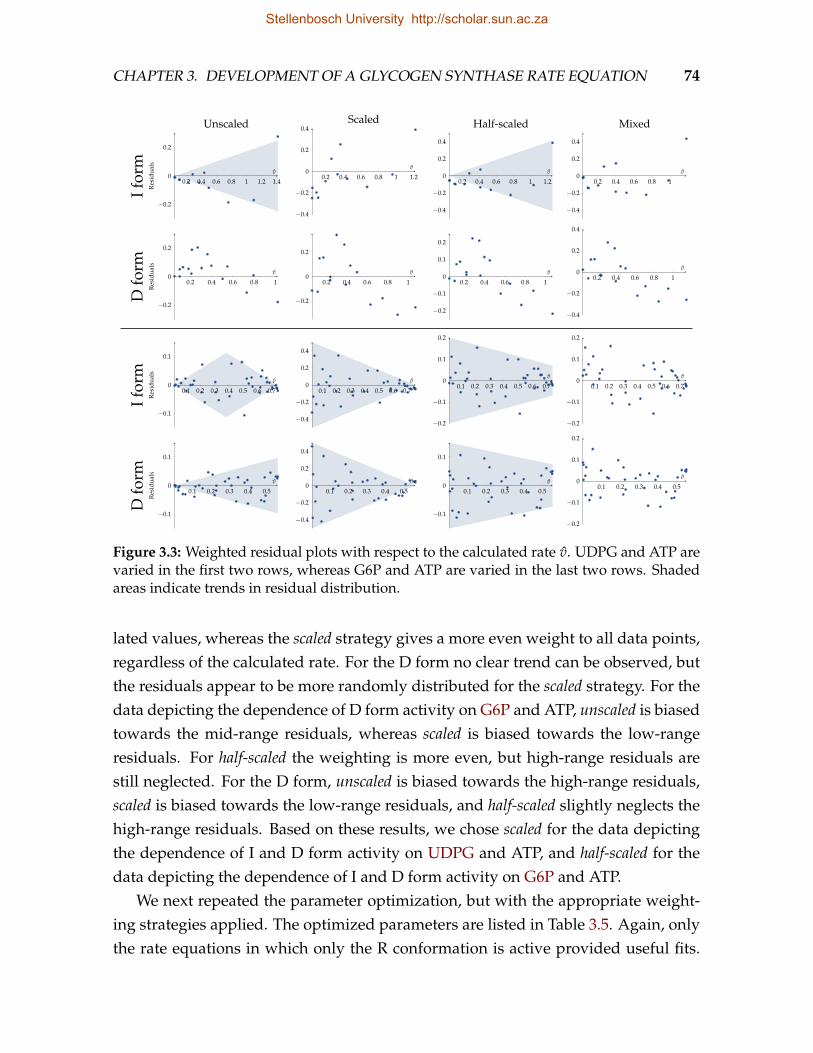
CHAPTER 3. DEVELOPMENT OF A GLYCOGEN SYNTHASE RATE EQUATION 74
0.2 0.4 0.6 0.8 1 1.2 1.4
−0.2
0
0.2
v
Res
idua
ls
UnscaledIf
orm
0.2 0.4 0.6 0.8 1 1.2
−0.4
−0.2
0
0.2
0.4
v
Scaled
0.2 0.4 0.6 0.8 1 1.2
−0.4
−0.2
0
0.2
0.4
v
Half-scaled
0.2 0.4 0.6 0.8 1
−0.4
−0.2
0
0.2
0.4
v
Mixed
0.2 0.4 0.6 0.8 1
−0.2
0
0.2
v
Res
idua
ls
Dfo
rm
0.2 0.4 0.6 0.8 1
−0.2
0
0.2
v
0.2 0.4 0.6 0.8 1
−0.2
−0.1
0
0.1
0.2
v0.2 0.4 0.6 0.8 1
−0.4
−0.2
0
0.2
0.4
v
0.1 0.2 0.3 0.4 0.5 0.6 0.7
−0.1
0
0.1
v
Res
idua
ls
Ifor
m
0.1 0.2 0.3 0.4 0.5 0.6 0.7
−0.4
−0.2
0
0.2
0.4
v0.1 0.2 0.3 0.4 0.5 0.6 0.7
−0.2
−0.1
0
0.1
0.2
v
0.1 0.2 0.3 0.4 0.5 0.6 0.7
−0.2
−0.1
0
0.1
0.2
v
0.1 0.2 0.3 0.4 0.5
−0.1
0
0.1
v
Res
idua
ls
Dfo
rm
0.1 0.2 0.3 0.4 0.5
−0.4
−0.2
0
0.2
0.4
v
0.1 0.2 0.3 0.4 0.5
−0.1
0
0.1
v0.1 0.2 0.3 0.4 0.5
−0.2
−0.1
0
0.1
0.2
v
Figure 3.3: Weighted residual plots with respect to the calculated rate v. UDPG and ATP arevaried in the first two rows, whereas G6P and ATP are varied in the last two rows. Shadedareas indicate trends in residual distribution.
lated values, whereas the scaled strategy gives a more even weight to all data points,regardless of the calculated rate. For the D form no clear trend can be observed, butthe residuals appear to be more randomly distributed for the scaled strategy. For thedata depicting the dependence of D form activity on G6P and ATP, unscaled is biasedtowards the mid-range residuals, whereas scaled is biased towards the low-rangeresiduals. For half-scaled the weighting is more even, but high-range residuals arestill neglected. For the D form, unscaled is biased towards the high-range residuals,scaled is biased towards the low-range residuals, and half-scaled slightly neglects thehigh-range residuals. Based on these results, we chose scaled for the data depictingthe dependence of I and D form activity on UDPG and ATP, and half-scaled for thedata depicting the dependence of I and D form activity on G6P and ATP.
We next repeated the parameter optimization, but with the appropriate weight-ing strategies applied. The optimized parameters are listed in Table 3.5. Again, onlythe rate equations in which only the R conformation is active provided useful fits.
Stellenbosch University http://scholar.sun.ac.za
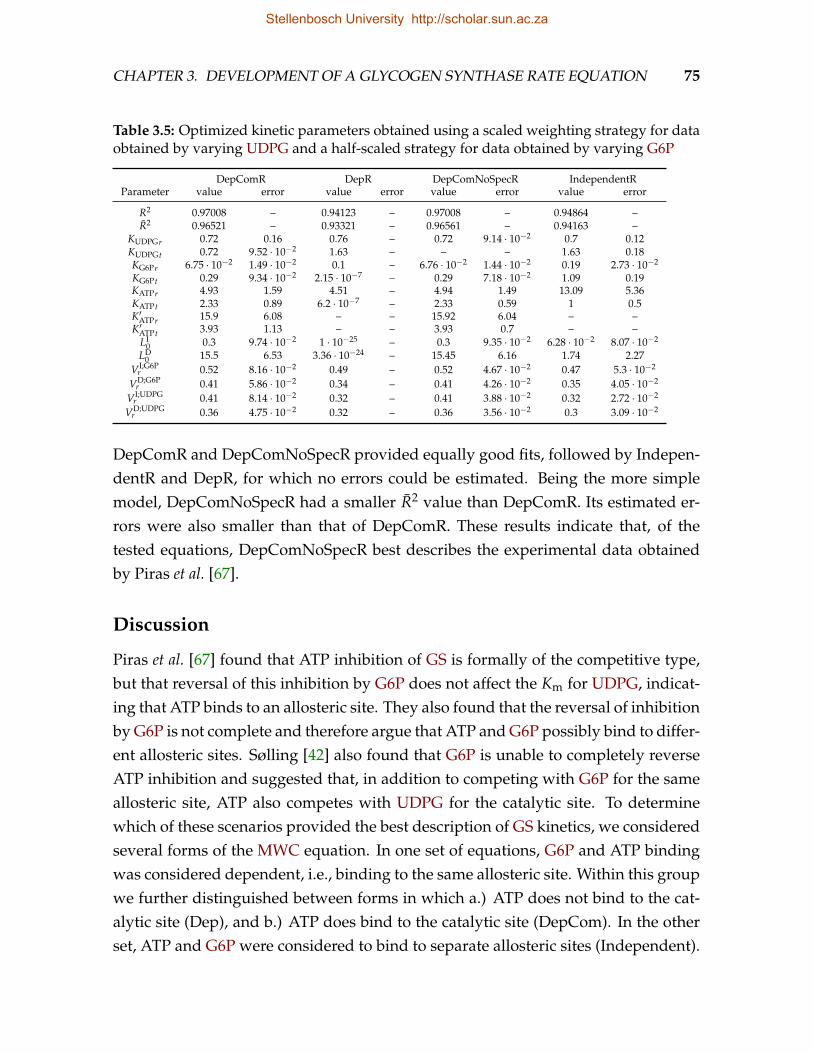
CHAPTER 3. DEVELOPMENT OF A GLYCOGEN SYNTHASE RATE EQUATION 75
Table 3.5: Optimized kinetic parameters obtained using a scaled weighting strategy for dataobtained by varying UDPG and a half-scaled strategy for data obtained by varying G6P
DepComR DepR DepComNoSpecR IndependentRParameter value error value error value error value error
R2 0.97008 – 0.94123 – 0.97008 – 0.94864 –R2 0.96521 – 0.93321 – 0.96561 – 0.94163 –
KUDPGr 0.72 0.16 0.76 – 0.72 9.14 · 10−2 0.7 0.12KUDPGt 0.72 9.52 · 10−2 1.63 – – – 1.63 0.18KG6Pr 6.75 · 10−2 1.49 · 10−2 0.1 – 6.76 · 10−2 1.44 · 10−2 0.19 2.73 · 10−2
KG6Pt 0.29 9.34 · 10−2 2.15 · 10−7 – 0.29 7.18 · 10−2 1.09 0.19KATPr 4.93 1.59 4.51 – 4.94 1.49 13.09 5.36KATPt 2.33 0.89 6.2 · 10−7 – 2.33 0.59 1 0.5K′ATPr 15.9 6.08 – – 15.92 6.04 – –K′ATPt 3.93 1.13 – – 3.93 0.7 – –
LI0 0.3 9.74 · 10−2 1 · 10−25 – 0.3 9.35 · 10−2 6.28 · 10−2 8.07 · 10−2
LD0 15.5 6.53 3.36 · 10−24 – 15.45 6.16 1.74 2.27
VI;G6Pr 0.52 8.16 · 10−2 0.49 – 0.52 4.67 · 10−2 0.47 5.3 · 10−2
VD;G6Pr 0.41 5.86 · 10−2 0.34 – 0.41 4.26 · 10−2 0.35 4.05 · 10−2
VI;UDPGr 0.41 8.14 · 10−2 0.32 – 0.41 3.88 · 10−2 0.32 2.72 · 10−2
VD;UDPGr 0.36 4.75 · 10−2 0.32 – 0.36 3.56 · 10−2 0.3 3.09 · 10−2
DepComR and DepComNoSpecR provided equally good fits, followed by Indepen-dentR and DepR, for which no errors could be estimated. Being the more simplemodel, DepComNoSpecR had a smaller R2 value than DepComR. Its estimated er-rors were also smaller than that of DepComR. These results indicate that, of thetested equations, DepComNoSpecR best describes the experimental data obtainedby Piras et al. [67].
Discussion
Piras et al. [67] found that ATP inhibition of GS is formally of the competitive type,but that reversal of this inhibition by G6P does not affect the Km for UDPG, indicat-ing that ATP binds to an allosteric site. They also found that the reversal of inhibitionby G6P is not complete and therefore argue that ATP and G6P possibly bind to differ-ent allosteric sites. Sølling [42] also found that G6P is unable to completely reverseATP inhibition and suggested that, in addition to competing with G6P for the sameallosteric site, ATP also competes with UDPG for the catalytic site. To determinewhich of these scenarios provided the best description of GS kinetics, we consideredseveral forms of the MWC equation. In one set of equations, G6P and ATP bindingwas considered dependent, i.e., binding to the same allosteric site. Within this groupwe further distinguished between forms in which a.) ATP does not bind to the cat-alytic site (Dep), and b.) ATP does bind to the catalytic site (DepCom). In the otherset, ATP and G6P were considered to bind to separate allosteric sites (Independent).
Stellenbosch University http://scholar.sun.ac.za
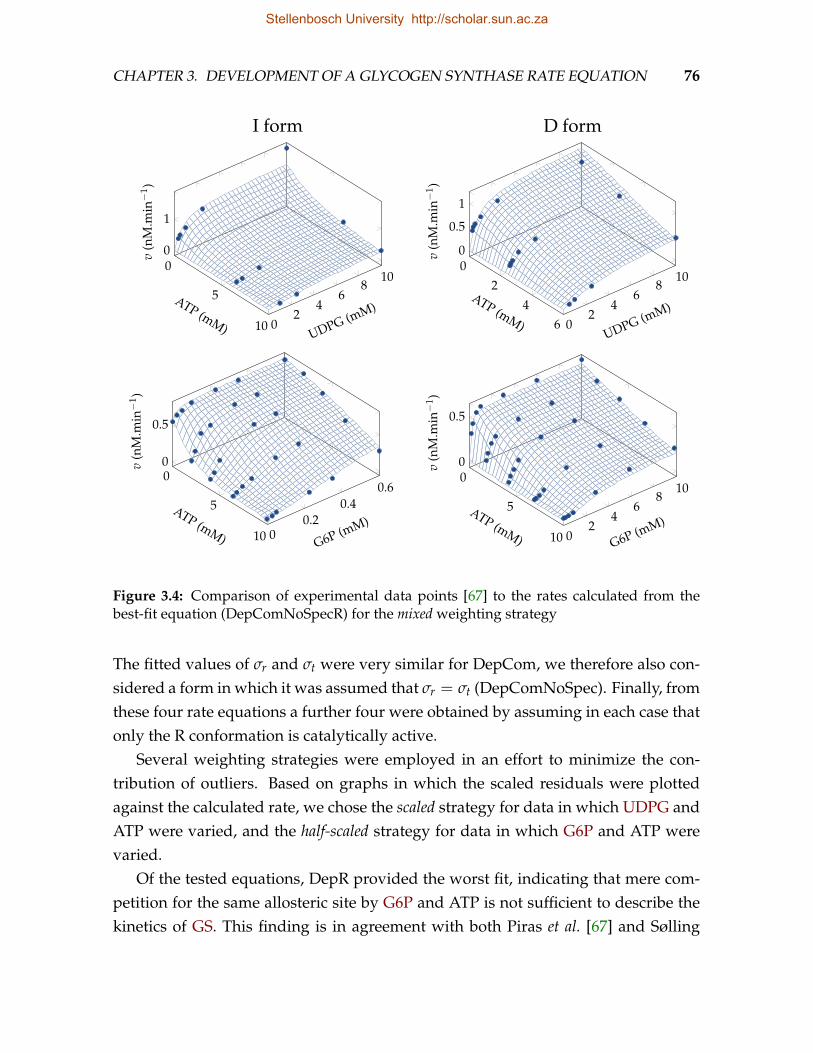
CHAPTER 3. DEVELOPMENT OF A GLYCOGEN SYNTHASE RATE EQUATION 76
0
5
10 02
46
810
0
1
ATP (mM) UDPG (mM)
v(n
M.m
in−
1 )
I form
02
46 0
24
68
10
0
0.5
1
ATP (mM)UDPG (mM)
v(n
M.m
in−
1 )
D form
0
5
10 00.2
0.40.6
0
0.5
ATP (mM) G6P (mM)
v(n
M.m
in−
1 )
0
5
10 02
46
810
0
0.5
ATP (mM) G6P (mM)
v(n
M.m
in−
1 )
Figure 3.4: Comparison of experimental data points [67] to the rates calculated from thebest-fit equation (DepComNoSpecR) for the mixed weighting strategy
The fitted values of σr and σt were very similar for DepCom, we therefore also con-sidered a form in which it was assumed that σr = σt (DepComNoSpec). Finally, fromthese four rate equations a further four were obtained by assuming in each case thatonly the R conformation is catalytically active.
Several weighting strategies were employed in an effort to minimize the con-tribution of outliers. Based on graphs in which the scaled residuals were plottedagainst the calculated rate, we chose the scaled strategy for data in which UDPG andATP were varied, and the half-scaled strategy for data in which G6P and ATP werevaried.
Of the tested equations, DepR provided the worst fit, indicating that mere com-petition for the same allosteric site by G6P and ATP is not sufficient to describe thekinetics of GS. This finding is in agreement with both Piras et al. [67] and Sølling
Stellenbosch University http://scholar.sun.ac.za
CHAPTER 3. DEVELOPMENT OF A GLYCOGEN SYNTHASE RATE EQUATION 77
[42], who found that G6P does not completely reverse ATP inhibition as is assumedin DepR. IndependentR provided the second worst fit, ruling out the suggestion byPiras et al. [67] that ATP and G6P bind to different allosteric sites. Finally, DepComRand DepComNoSpecR provided equally good fits and equivalent parameter values.Having one less parameter than DepComR, DepComNoSpecR is the simplest equa-tion that provides a good description of GS kinetics. Our data therefore indicate thatthe kinetics of GS is best described by a rate equation in which ATP competes withG6P for the allosteric site but also with UDPG for the catalytic site. In all cases, therate equations in which both the T and R conformations were catalytically active re-sulted in either very large errors in the fitted parameters or in negative parametervalues.
The application of DepComNoSpecR to GS kinetics implies that G6P is not in it-self a specific activator of GS, i.e., it does not affect the enzyme’s affinity for UDPG,but merely reverses specific inhibition by ATP. This finding, although in good agree-ment with the analysis of Piras et al. [67], differs from the conventional view thatG6P is a specific activator even in the absence of ATP. These contradictory findingsare explained by recalling that Piras et al. [67] worked at pH 6.6. When workingat pH 7.8 their findings essentially agreed with the conventional view. Given thephysiological muscle pH range (6.6–7.1), it must be stressed that our findings andthose of Piras et al. [67] only apply to one end of the spectrum. Most other studies(see for example [42, 79, 90]) have worked at higher pH concentrations, often ex-ceeding the physiological limit. Since inhibition of GS by ATP is known to increaseas the pH decreases [67], working at a high pH has the advantage of minimizingATP inhibition in experimental set-ups. A more complete description of GS kineticswould also have to consider the effect of pH, possibly by including an additionalpH-dependent conformational change. Note, however, that the lack of specific ac-tivation by G6P does not mean that G6P results in no activation in the absence ofATP, it merely implies that all activation in the absence of ATP must be the result ofcatalytic activation, i.e., an apparent increase in the rate constant.
3.5 Estimation of L0 for each phosphorylation state
Fractional velocity is frequently reported in the GS literature as an indication of thephosphorylation state of GS or its sensitivity towards G6P. In Chapter 2 we providedan expression for the fractional velocity according to the Hill model (Eq. 2.12) to pro-
Stellenbosch University http://scholar.sun.ac.za
CHAPTER 3. DEVELOPMENT OF A GLYCOGEN SYNTHASE RATE EQUATION 78
vide insight into the relationship between the fractional velocity and kinetics param-eters. We can now provide an expression according to Eq. 3.42 (DepComNoSpecR).In the absence of ATP Eq. 3.42 simplifies to
vi =Vmaxrnσ(1 + σ)n−1
(1 + σ)nL0i
(1 + ξG6Pt1 + ξG6Pr
)n+ (1 + σ)n
(3.50)
= Vmaxrnσ(1 + σ)−1[
L0i
(1 + ξG6Pt1 + ξG6Pr
)n+ 1]−1
(3.51)
The fractional velocity is thus expressed as follows
FVx =vi,G6P=x
vi,G6PKG6Pt,r
=
Vmaxrnσ(1 + σ)−1[
L0i
(1 + ξG6Pt1 + ξG6Pr
)n+ 1]−1
Vmaxrnσ(1 + σ)−1[
L0i
(ξG6PtξG6Pr
)n+ 1]−1
=
L0i
(KG6PrKG6Pt
)n+ 1
L0i
(1 + ξG6Pt1 + ξG6Pr
)n+ 1
(3.52)
showing that it is independent of the UDPG concentration and affinity. Setting x = 0,the activity ratio is also obtained:
AR = FV0 (3.53)
=
L0i
(KG6PrKG6Pt
)n+ 1
L0i + 1(3.54)
Since (KG6Pr/KG6Pt)n ' 0.003, the activity ratio is an approximation of 1/(L0i + 1)
or Ri/(Ti + Ri), the fraction of enzyme in state i present in the R conformation in theabsence of ligands. This result is particularly interesting, as the initial definition ofthe activity ratio was indeed that of a mole fraction, namely the fraction of enzymein the I form: I/(D + I).
Stellenbosch University http://scholar.sun.ac.za
CHAPTER 3. DEVELOPMENT OF A GLYCOGEN SYNTHASE RATE EQUATION 79
More importantly, by rewriting Eq. 3.52, L0i can be expressed in terms of frac-tional velocity, so that L0i can be calculated for any phosphorylation state of GS forwhich the fractional velocity (or activity ratio) is known:
L0i =1− FV
FV(
1 + ξG6Pt1 + ξG6Pr
)n−(
KG6PrKG6Pt
)n (3.55)
The fractional velocity or activity ratio is only available for a few of the 18 phospho-rylation states considered here. Following the principles explained below, however,we were able to calculate all 18 L0i values. The left-hand side of Fig. 3.5 depicts anMWC-type enzyme that is phosphorylated in random order at two phosphoryla-tion sites denoted 1 and 2. Phosphorylation is assumed to alter the apparent T/Requilibrium in a manner analogous to any classic allosteric modifier. It is furtherassumed that in all phosphorylation events all the subunits are phosphorylated si-multaneously at the site in question. For the unliganded dephosphorylated form theequilibrium between the T and R conformations is then given by L0. For the un-liganded form phosphorylated at site 1, the corresponding equilibrium is given byL01, and so on. K is the equilibrium constant of phosphorylation for a particular formas denoted by the subscripts. However, since the overall equilibrium constant mustbe the same regardless of whether a particular site is phosphorylated before or afterthe T/R transition occurs, it is clear that not all the equilibria can be independent.In particular, if L01 differs from L0 by a factor α1 as in the right-hand side of Fig. 3.5,then since K1rL01 = L0K1t must hold, K1t = α1K1r must also hold. If we furtherdefine L02 = α2L0, then since K1rL012 = L02K1t, it can be shown that L012 = α1α2L0.It thus follows that if L0, L01 and L02 are available L012 can be calculated. The sameresult is readily but tediously obtained for more elaborate phosphorylation schemes.The general rule is that if a value of L0 is available for each phosphorylation state ina sequentially phosphorylated cluster, then values can be calculated for states thatresult from combinations of phosphorylation in different clusters.
L0 could be calculated from the activity ratio for 12 of the 18 phosphorylationstates (Table 3.6). As not all the activity ratios were calculated at the same saturatingG6P concentration, we used an adapted form of Eq. 3.55 that explicitly contains thesaturating G6P concentration:
L0 =1− FV0
FV0 −(
KG6PrKG6Pr + [G6P]satKG6PrKG6PrKG6Pr + [G6P]satKG6Pt
)n (3.56)
Stellenbosch University http://scholar.sun.ac.za
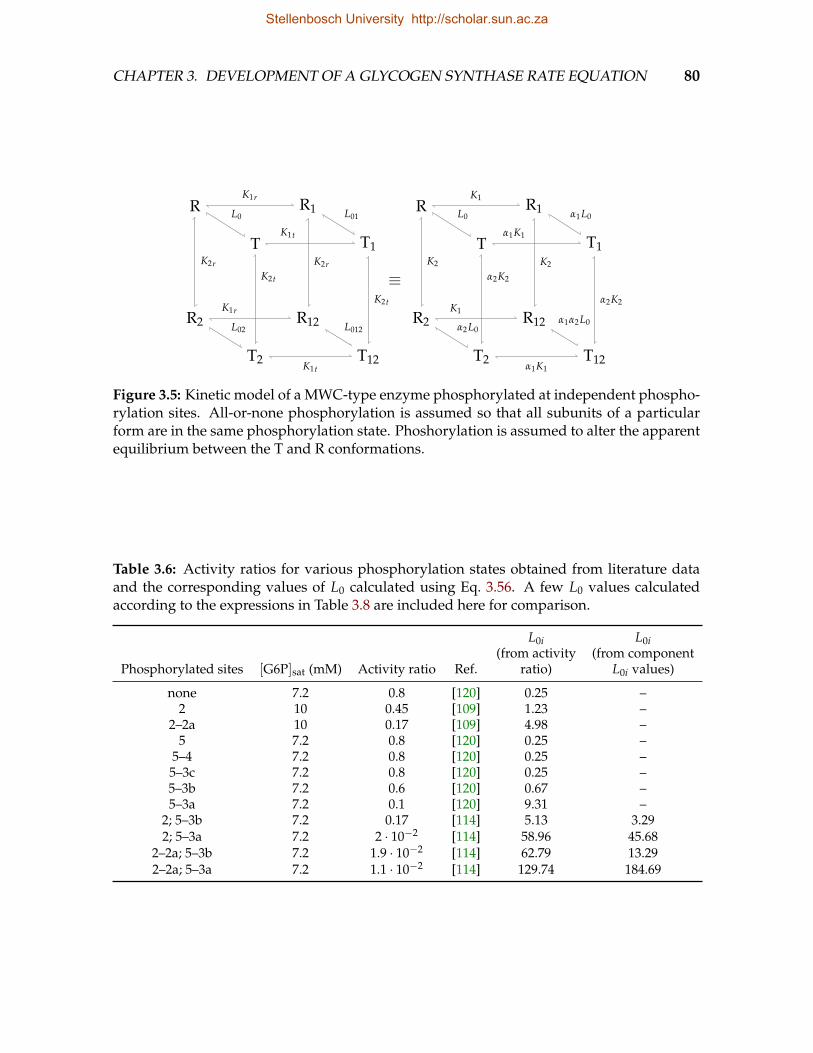
CHAPTER 3. DEVELOPMENT OF A GLYCOGEN SYNTHASE RATE EQUATION 80
R
T
R1
T1
R2
T2
R12
T12
L0 L01
L02 L012
K1r
K1t
K1r
K1t
K2r
K2t
K2r
K2t
≡
R
T
R1
T1
R2
T2
R12
T12
L0 α1L0
α2L0α1α2L0
K1
α1K1
K1
α1K1
K2
α2K2
K2
α2K2
Figure 3.5: Kinetic model of a MWC-type enzyme phosphorylated at independent phospho-rylation sites. All-or-none phosphorylation is assumed so that all subunits of a particularform are in the same phosphorylation state. Phoshorylation is assumed to alter the apparentequilibrium between the T and R conformations.
Table 3.6: Activity ratios for various phosphorylation states obtained from literature dataand the corresponding values of L0 calculated using Eq. 3.56. A few L0 values calculatedaccording to the expressions in Table 3.8 are included here for comparison.
L0i L0i(from activity (from component
Phosphorylated sites [G6P]sat (mM) Activity ratio Ref. ratio) L0i values)
none 7.2 0.8 [120] 0.25 –2 10 0.45 [109] 1.23 –
2–2a 10 0.17 [109] 4.98 –5 7.2 0.8 [120] 0.25 –
5–4 7.2 0.8 [120] 0.25 –5–3c 7.2 0.8 [120] 0.25 –5–3b 7.2 0.6 [120] 0.67 –5–3a 7.2 0.1 [120] 9.31 –
2; 5–3b 7.2 0.17 [114] 5.13 3.292; 5–3a 7.2 2 · 10−2 [114] 58.96 45.68
2–2a; 5–3b 7.2 1.9 · 10−2 [114] 62.79 13.292–2a; 5–3a 7.2 1.1 · 10−2 [114] 129.74 184.69
Stellenbosch University http://scholar.sun.ac.za
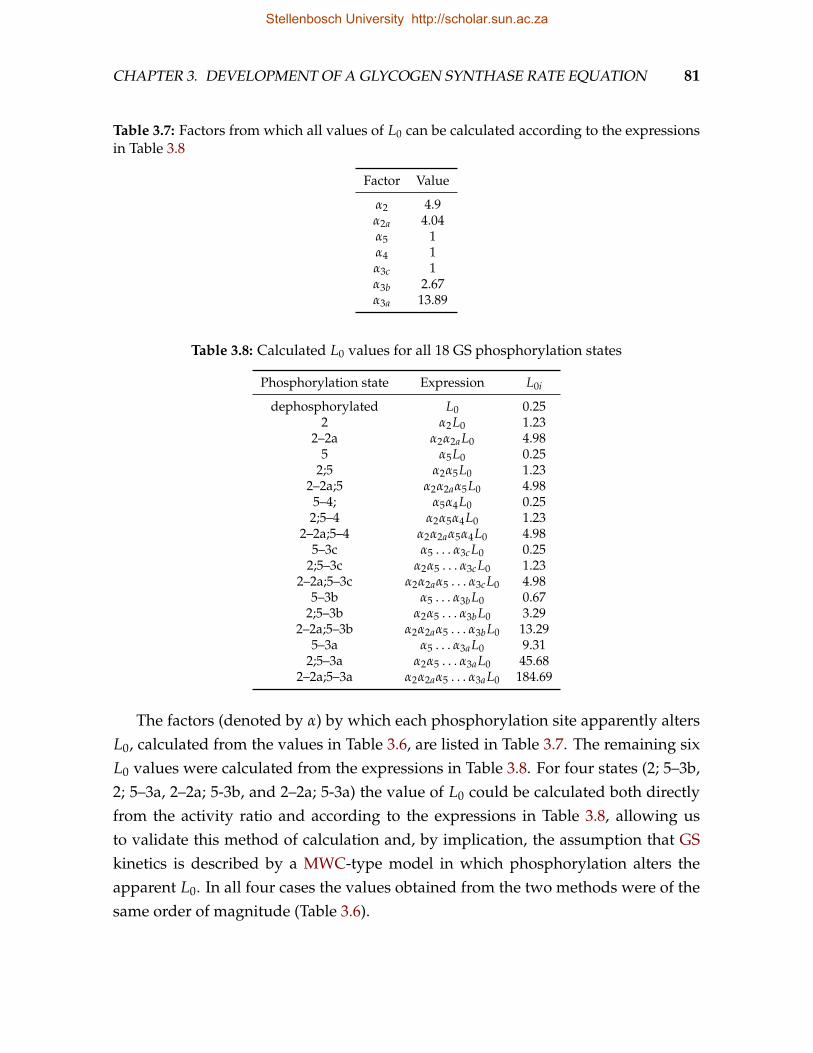
CHAPTER 3. DEVELOPMENT OF A GLYCOGEN SYNTHASE RATE EQUATION 81
Table 3.7: Factors from which all values of L0 can be calculated according to the expressionsin Table 3.8
Factor Value
α2 4.9α2a 4.04α5 1α4 1α3c 1α3b 2.67α3a 13.89
Table 3.8: Calculated L0 values for all 18 GS phosphorylation states
Phosphorylation state Expression L0i
dephosphorylated L0 0.252 α2L0 1.23
2–2a α2α2aL0 4.985 α5L0 0.25
2;5 α2α5L0 1.232–2a;5 α2α2aα5L0 4.98
5–4; α5α4L0 0.252;5–4 α2α5α4L0 1.23
2–2a;5–4 α2α2aα5α4L0 4.985–3c α5 . . . α3cL0 0.25
2;5–3c α2α5 . . . α3cL0 1.232–2a;5–3c α2α2aα5 . . . α3cL0 4.98
5–3b α5 . . . α3bL0 0.672;5–3b α2α5 . . . α3bL0 3.29
2–2a;5–3b α2α2aα5 . . . α3bL0 13.295–3a α5 . . . α3aL0 9.31
2;5–3a α2α5 . . . α3aL0 45.682–2a;5–3a α2α2aα5 . . . α3aL0 184.69
The factors (denoted by α) by which each phosphorylation site apparently altersL0, calculated from the values in Table 3.6, are listed in Table 3.7. The remaining sixL0 values were calculated from the expressions in Table 3.8. For four states (2; 5–3b,2; 5–3a, 2–2a; 5-3b, and 2–2a; 5-3a) the value of L0 could be calculated both directlyfrom the activity ratio and according to the expressions in Table 3.8, allowing usto validate this method of calculation and, by implication, the assumption that GSkinetics is described by a MWC-type model in which phosphorylation alters theapparent L0. In all four cases the values obtained from the two methods were of thesame order of magnitude (Table 3.6).
Stellenbosch University http://scholar.sun.ac.za
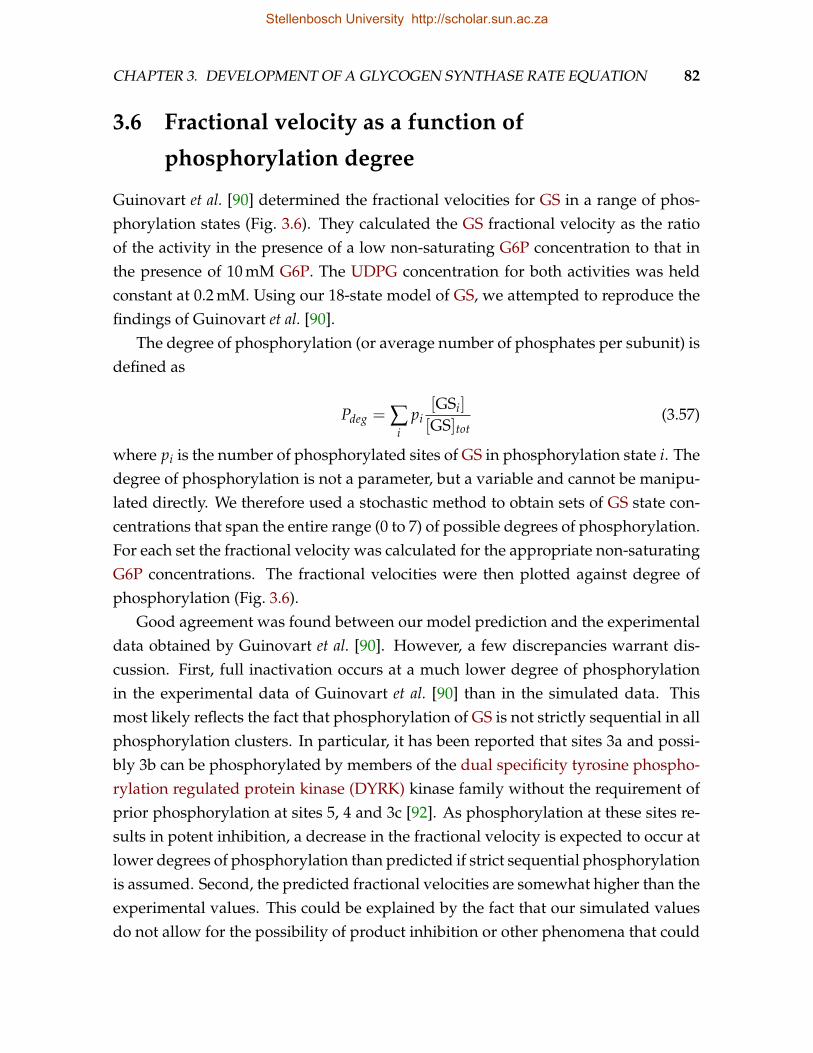
CHAPTER 3. DEVELOPMENT OF A GLYCOGEN SYNTHASE RATE EQUATION 82
3.6 Fractional velocity as a function of
phosphorylation degree
Guinovart et al. [90] determined the fractional velocities for GS in a range of phos-phorylation states (Fig. 3.6). They calculated the GS fractional velocity as the ratioof the activity in the presence of a low non-saturating G6P concentration to that inthe presence of 10 mM G6P. The UDPG concentration for both activities was heldconstant at 0.2 mM. Using our 18-state model of GS, we attempted to reproduce thefindings of Guinovart et al. [90].
The degree of phosphorylation (or average number of phosphates per subunit) isdefined as
Pdeg = ∑i
pi[GSi]
[GS]tot(3.57)
where pi is the number of phosphorylated sites of GS in phosphorylation state i. Thedegree of phosphorylation is not a parameter, but a variable and cannot be manipu-lated directly. We therefore used a stochastic method to obtain sets of GS state con-centrations that span the entire range (0 to 7) of possible degrees of phosphorylation.For each set the fractional velocity was calculated for the appropriate non-saturatingG6P concentrations. The fractional velocities were then plotted against degree ofphosphorylation (Fig. 3.6).
Good agreement was found between our model prediction and the experimentaldata obtained by Guinovart et al. [90]. However, a few discrepancies warrant dis-cussion. First, full inactivation occurs at a much lower degree of phosphorylationin the experimental data of Guinovart et al. [90] than in the simulated data. Thismost likely reflects the fact that phosphorylation of GS is not strictly sequential in allphosphorylation clusters. In particular, it has been reported that sites 3a and possi-bly 3b can be phosphorylated by members of the dual specificity tyrosine phospho-rylation regulated protein kinase (DYRK) kinase family without the requirement ofprior phosphorylation at sites 5, 4 and 3c [92]. As phosphorylation at these sites re-sults in potent inhibition, a decrease in the fractional velocity is expected to occur atlower degrees of phosphorylation than predicted if strict sequential phosphorylationis assumed. Second, the predicted fractional velocities are somewhat higher than theexperimental values. This could be explained by the fact that our simulated valuesdo not allow for the possibility of product inhibition or other phenomena that could
Stellenbosch University http://scholar.sun.ac.za
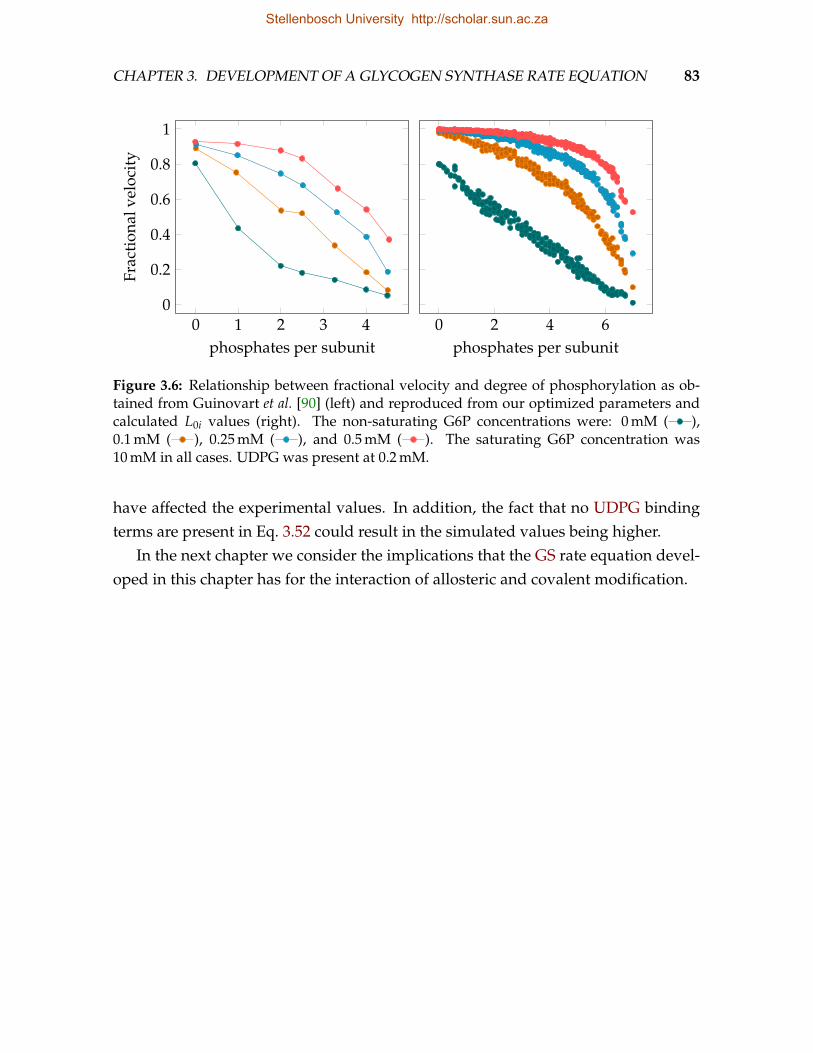
CHAPTER 3. DEVELOPMENT OF A GLYCOGEN SYNTHASE RATE EQUATION 83
0 1 2 3 40
0.2
0.4
0.6
0.8
1
phosphates per subunit
Frac
tion
alve
loci
ty
0 2 4 6phosphates per subunit
Figure 3.6: Relationship between fractional velocity and degree of phosphorylation as ob-tained from Guinovart et al. [90] (left) and reproduced from our optimized parameters andcalculated L0i values (right). The non-saturating G6P concentrations were: 0 mM ( ),0.1 mM ( ), 0.25 mM ( ), and 0.5 mM ( ). The saturating G6P concentration was10 mM in all cases. UDPG was present at 0.2 mM.
have affected the experimental values. In addition, the fact that no UDPG bindingterms are present in Eq. 3.52 could result in the simulated values being higher.
In the next chapter we consider the implications that the GS rate equation devel-oped in this chapter has for the interaction of allosteric and covalent modification.
Stellenbosch University http://scholar.sun.ac.za
Chapter 4
Interaction of allosteric and covalentenzyme modification
4.1 Introduction
We have argued that the observed effects of phosphorylation on glycogen synthase(GS) kinetics is qualitatively the same as would be expected if GS were a Monod-Wyman-Changeux (MWC)-type enzyme in which phosphorylation, in addition toallosteric modification, resulted in a shift in the apparent equilibrium between en-zyme in the T and R conformations. We then proceeded to show that a rate equationbased on such a MWC-type model does indeed provide a good description of theexperimental data published by Piras et al. [67]. In this chapter we will show thatthis model has far-reaching implications, affecting not only the GS rate equation, butalso the rate equations of enzymes that catalyse the covalent modification of GS. Thesignificance of these implications are demonstrated by analysing a minimal feed-forward activation system in which the regulated enzyme is inhibited by covalentmodification. Finally, the findings are applied to GS and glycogen synthesis.
A central principle employed throughout this chapter is that the free energychange, and thus Keq, for the conversion of one substance to another is constantregardless of which other states served as intermediates. Consider, for example,the conversion of protein A to protein B as in the left hand side of Fig. 4.1. Theoverall equilibrium constant Keq for the conversion of A to B remains unaffectedwhether the conversion took place via intermediate I or intermediate I′, so that
Keq = Keq1 · K′eq2 = K′eq1 · Keq2. It follows thatK′eq1Keq1
=K′eq2Keq2
= α, where α is a constant,so that the left hand side of Fig. 4.1 can also be shown as in the right hand side. In
84
Stellenbosch University http://scholar.sun.ac.za
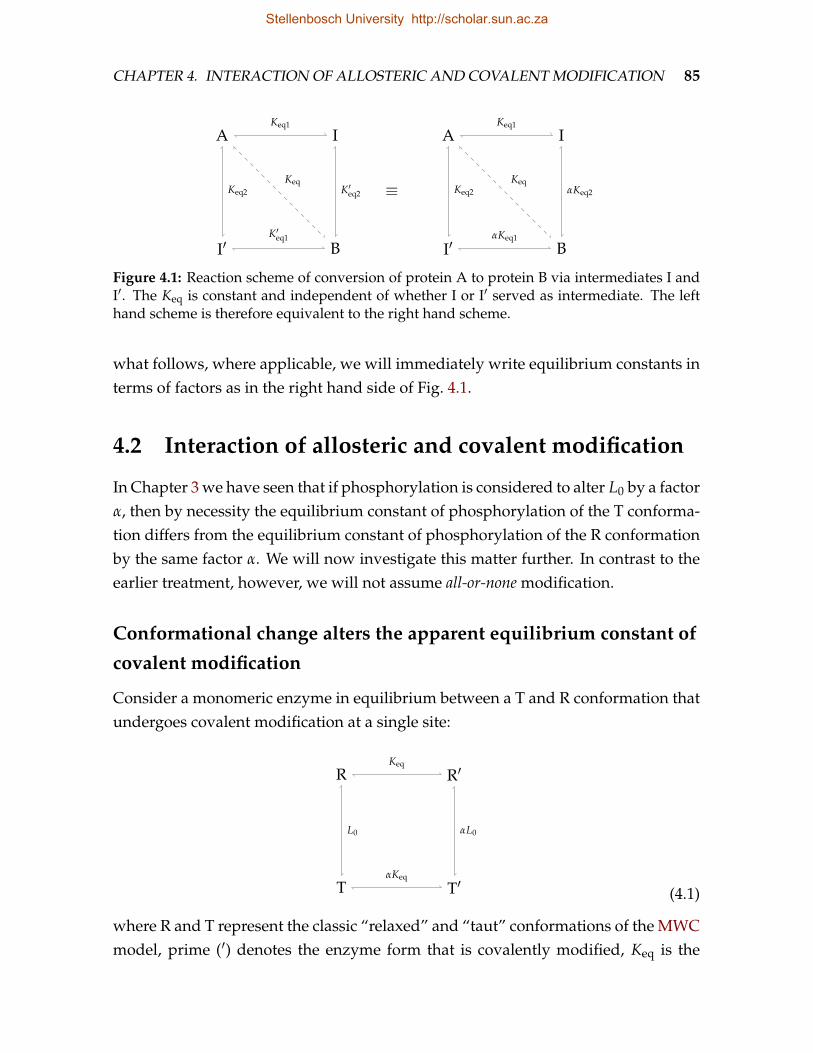
CHAPTER 4. INTERACTION OF ALLOSTERIC AND COVALENT MODIFICATION 85
A
I′
I
B
Keq2 K′eq2
Keq1
K′eq1
Keq
A
I′
I
B
Keq2 αKeq2
Keq1
αKeq1
Keq≡
Figure 4.1: Reaction scheme of conversion of protein A to protein B via intermediates I andI′. The Keq is constant and independent of whether I or I′ served as intermediate. The lefthand scheme is therefore equivalent to the right hand scheme.
what follows, where applicable, we will immediately write equilibrium constants interms of factors as in the right hand side of Fig. 4.1.
4.2 Interaction of allosteric and covalent modification
In Chapter 3 we have seen that if phosphorylation is considered to alter L0 by a factorα, then by necessity the equilibrium constant of phosphorylation of the T conforma-tion differs from the equilibrium constant of phosphorylation of the R conformationby the same factor α. We will now investigate this matter further. In contrast to theearlier treatment, however, we will not assume all-or-none modification.
Conformational change alters the apparent equilibrium constant of
covalent modification
Consider a monomeric enzyme in equilibrium between a T and R conformation thatundergoes covalent modification at a single site:
R R′
T T′
Keq
αKeq
L0 αL0
(4.1)
where R and T represent the classic “relaxed” and “taut” conformations of the MWCmodel, prime (′) denotes the enzyme form that is covalently modified, Keq is the
Stellenbosch University http://scholar.sun.ac.za
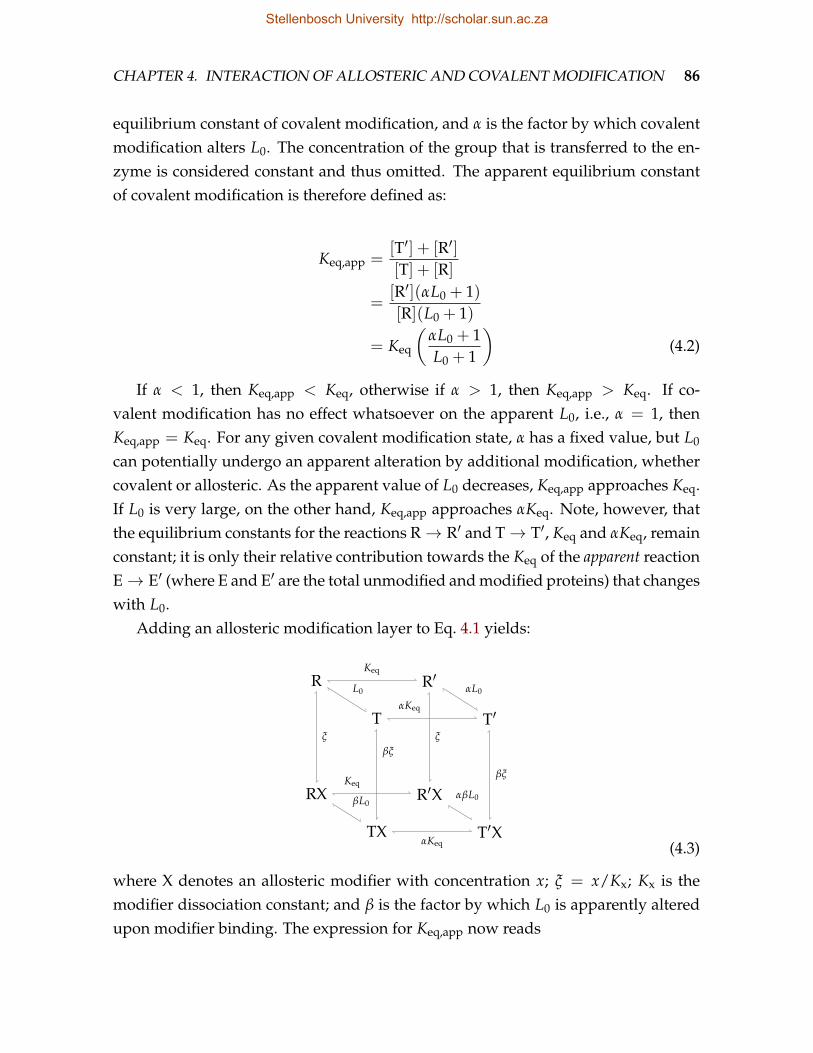
CHAPTER 4. INTERACTION OF ALLOSTERIC AND COVALENT MODIFICATION 86
equilibrium constant of covalent modification, and α is the factor by which covalentmodification alters L0. The concentration of the group that is transferred to the en-zyme is considered constant and thus omitted. The apparent equilibrium constantof covalent modification is therefore defined as:
Keq,app =[T′] + [R′][T] + [R]
=[R′](αL0 + 1)[R](L0 + 1)
= Keq
(αL0 + 1L0 + 1
)(4.2)
If α < 1, then Keq,app < Keq, otherwise if α > 1, then Keq,app > Keq. If co-valent modification has no effect whatsoever on the apparent L0, i.e., α = 1, thenKeq,app = Keq. For any given covalent modification state, α has a fixed value, but L0
can potentially undergo an apparent alteration by additional modification, whethercovalent or allosteric. As the apparent value of L0 decreases, Keq,app approaches Keq.If L0 is very large, on the other hand, Keq,app approaches αKeq. Note, however, thatthe equilibrium constants for the reactions R→ R′ and T→ T′, Keq and αKeq, remainconstant; it is only their relative contribution towards the Keq of the apparent reactionE→ E′ (where E and E′ are the total unmodified and modified proteins) that changeswith L0.
Adding an allosteric modification layer to Eq. 4.1 yields:
R
T
R′
T′
RX
TX
R′X
T′X
L0 αL0
βL0αβL0
Keq
αKeq
Keq
αKeq
ξ
βξ
ξ
βξ
(4.3)
where X denotes an allosteric modifier with concentration x; ξ = x/Kx; Kx is themodifier dissociation constant; and β is the factor by which L0 is apparently alteredupon modifier binding. The expression for Keq,app now reads
Stellenbosch University http://scholar.sun.ac.za
CHAPTER 4. INTERACTION OF ALLOSTERIC AND COVALENT MODIFICATION 87
Keq,app =[T′] + [R′] + [R′X] + [T′X][T] + [R] + [RX] + [TX]
= Keq
(αL0(1 + βξ) + 1 + ξ
L0(1 + βξ) + 1 + ξ
)(4.4)
In the absence of allosteric modifier, Eq. 4.4 simplifies to Eq. 4.2, but at saturatingmodifier concentrations it is transformed to
Keq,app = Keq
(αβL0 + 1βL0 + 1
)(4.5)
= Keq
(αL0 +
1β
L0 +1β
)(4.6)
showing that if X binds preferentially to the T conformation (β > 1) it increases theapparent value of L0 and thus displaces Keq,app towards αKeq. If, however, X prefersto bind to the R conformation (β < 1), then Keq,app approaches Keq as x increases.Note that X need not be an allosteric modifier; any ligand that prefers binding toeither the T or R conformation (β 6= 1) will affect Keq,app. In fact, any process what-soever (including additional covalent modification) that has an apparent effect on L0
will also affect Keq,app.
Covalent modification is positively cooperative
Similar results are obtained for a dimeric enzyme. Figure 4.2 depicts the kineticmodel of a dimeric MWC-type enzyme with a single covalent modification site persubunit. The statistical factors 2 and 1
2 must be included to show that, for instance, R′
can be formed by modifying any of the two sites of R, or by eliminating modificationfrom any of the two sites of R′′. The same is true with regard to T′.
The expression for the overall apparent equilibrium constant is
K2eq,app =
[T′′] + [R′′][T] + [R]
= K2eq
(α2L0 + 1
L0 + 1
)
Keq,app = Keq
√α2L0 + 1
L0 + 1(4.7)
Stellenbosch University http://scholar.sun.ac.za
CHAPTER 4. INTERACTION OF ALLOSTERIC AND COVALENT MODIFICATION 88
R R′ R′′
T T′ T′′
2Keq12 Keq
2αKeq12 αKeq
L0 αL0 α2L0
Figure 4.2: Reaction scheme for the covalent modification of a dimeric Monod-Wyman-Changeux-type enzyme. Each covalent modification (indicated by ′) alters the equilibriumbetween the T and R conformations by a factor α. See text for details.
Keq,app thus varies with L0 and α in a manner qualitatively the same as for themonomeric enzyme.
Considering only the first covalent modification the apparent equilibrium con-stant is given by
2Keq1,app =[T′] + [R′][T] + [R]
= 2Keq
(αL0 + 1L0 + 1
)
Keq1,app = Keq
(αL0 + 1L0 + 1
)(4.8)
and for the second modification by
12
Keq2,app =[T′′] + [R′′][T′] + [R′]
=12
Keq
(α2L0 + 1αL + 1
)
Keq2,app = Keq
(α2L0 + 1αL0 + 1
)(4.9)
It can be shown that Keq2,app > Keq1,app for all α ∈ (0, ∞), α 6= 1 and L0 ∈ (0, ∞):
∆Keq,app = Keq2,app − Keq1,app (4.10)
= KeqL0(1− α)2
(1 + αL0)(1 + L0)> 0 (4.11)
Stellenbosch University http://scholar.sun.ac.za
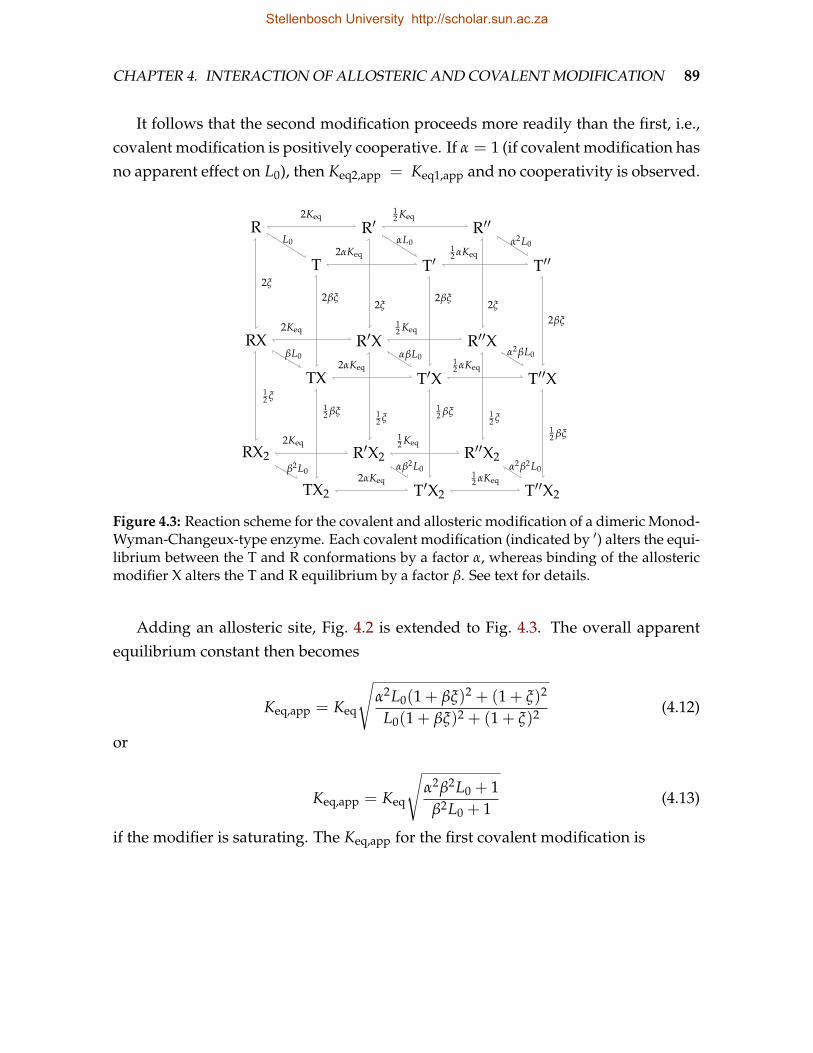
CHAPTER 4. INTERACTION OF ALLOSTERIC AND COVALENT MODIFICATION 89
It follows that the second modification proceeds more readily than the first, i.e.,covalent modification is positively cooperative. If α = 1 (if covalent modification hasno apparent effect on L0), then Keq2,app = Keq1,app and no cooperativity is observed.
R
T
R′
T′
R′′
T′′
RX
TX
R′X
T′X
R′′X
T′′X
RX2
TX2
R′X2
T′X2
R′′X2
T′′X2
L0 αL0 α2L0
2Keq
2αKeq
12 Keq
12 αKeq
βL0 αβL0 α2βL0
2Keq
2αKeq
12 Keq
12 αKeq
β2L0 αβ2L0 α2β2L0
2Keq
2αKeq
12 Keq
12 αKeq
2ξ
12 ξ
2βξ
12 βξ
2ξ
12 ξ
2βξ
12 βξ
2ξ
12 ξ
2βξ
12 βξ
Figure 4.3: Reaction scheme for the covalent and allosteric modification of a dimeric Monod-Wyman-Changeux-type enzyme. Each covalent modification (indicated by ′) alters the equi-librium between the T and R conformations by a factor α, whereas binding of the allostericmodifier X alters the T and R equilibrium by a factor β. See text for details.
Adding an allosteric site, Fig. 4.2 is extended to Fig. 4.3. The overall apparentequilibrium constant then becomes
Keq,app = Keq
√α2L0(1 + βξ)2 + (1 + ξ)2
L0(1 + βξ)2 + (1 + ξ)2 (4.12)
or
Keq,app = Keq
√α2β2L0 + 1
β2L0 + 1(4.13)
if the modifier is saturating. The Keq,app for the first covalent modification is
Stellenbosch University http://scholar.sun.ac.za
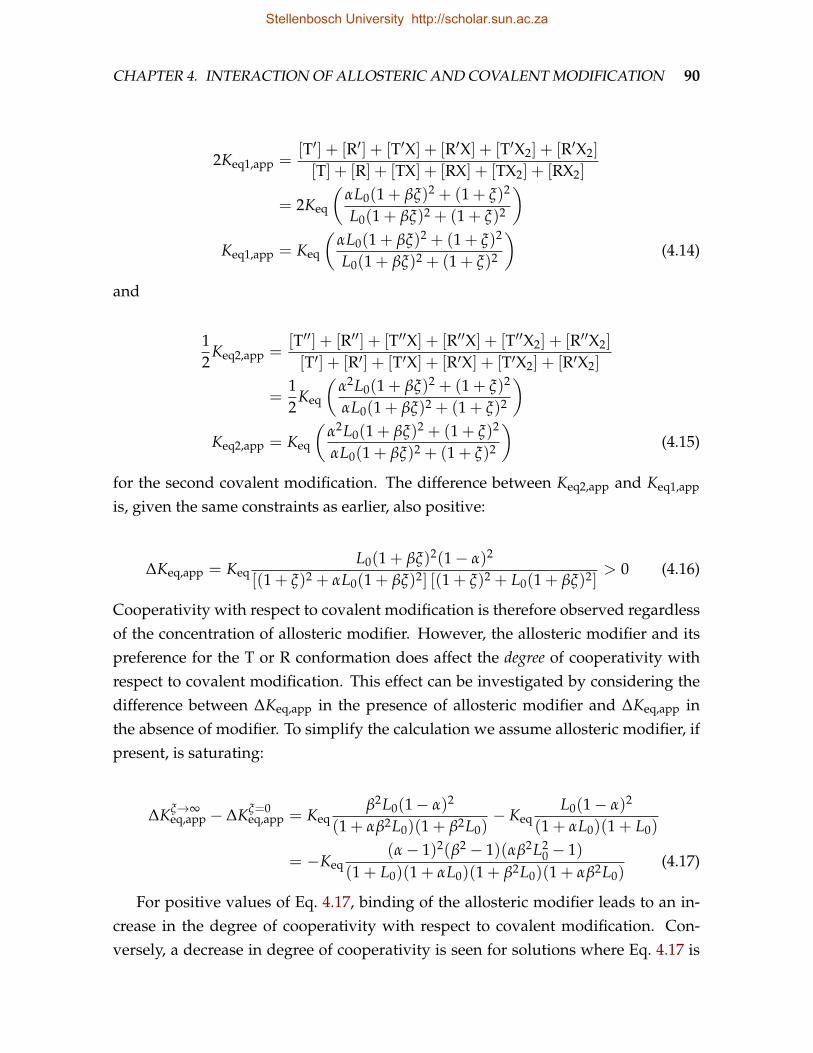
CHAPTER 4. INTERACTION OF ALLOSTERIC AND COVALENT MODIFICATION 90
2Keq1,app =[T′] + [R′] + [T′X] + [R′X] + [T′X2] + [R′X2]
[T] + [R] + [TX] + [RX] + [TX2] + [RX2]
= 2Keq
(αL0(1 + βξ)2 + (1 + ξ)2
L0(1 + βξ)2 + (1 + ξ)2
)
Keq1,app = Keq
(αL0(1 + βξ)2 + (1 + ξ)2
L0(1 + βξ)2 + (1 + ξ)2
)(4.14)
and
12
Keq2,app =[T′′] + [R′′] + [T′′X] + [R′′X] + [T′′X2] + [R′′X2]
[T′] + [R′] + [T′X] + [R′X] + [T′X2] + [R′X2]
=12
Keq
(α2L0(1 + βξ)2 + (1 + ξ)2
αL0(1 + βξ)2 + (1 + ξ)2
)
Keq2,app = Keq
(α2L0(1 + βξ)2 + (1 + ξ)2
αL0(1 + βξ)2 + (1 + ξ)2
)(4.15)
for the second covalent modification. The difference between Keq2,app and Keq1,app
is, given the same constraints as earlier, also positive:
∆Keq,app = KeqL0(1 + βξ)2(1− α)2
[(1 + ξ)2 + αL0(1 + βξ)2] [(1 + ξ)2 + L0(1 + βξ)2]> 0 (4.16)
Cooperativity with respect to covalent modification is therefore observed regardlessof the concentration of allosteric modifier. However, the allosteric modifier and itspreference for the T or R conformation does affect the degree of cooperativity withrespect to covalent modification. This effect can be investigated by considering thedifference between ∆Keq,app in the presence of allosteric modifier and ∆Keq,app inthe absence of modifier. To simplify the calculation we assume allosteric modifier, ifpresent, is saturating:
∆Kξ→∞eq,app − ∆Kξ=0
eq,app = Keqβ2L0(1− α)2
(1 + αβ2L0)(1 + β2L0)− Keq
L0(1− α)2
(1 + αL0)(1 + L0)
= −Keq(α− 1)2(β2 − 1)(αβ2L2
0 − 1)(1 + L0)(1 + αL0)(1 + β2L0)(1 + αβ2L0)
(4.17)
For positive values of Eq. 4.17, binding of the allosteric modifier leads to an in-crease in the degree of cooperativity with respect to covalent modification. Con-versely, a decrease in degree of cooperativity is seen for solutions where Eq. 4.17 is
Stellenbosch University http://scholar.sun.ac.za
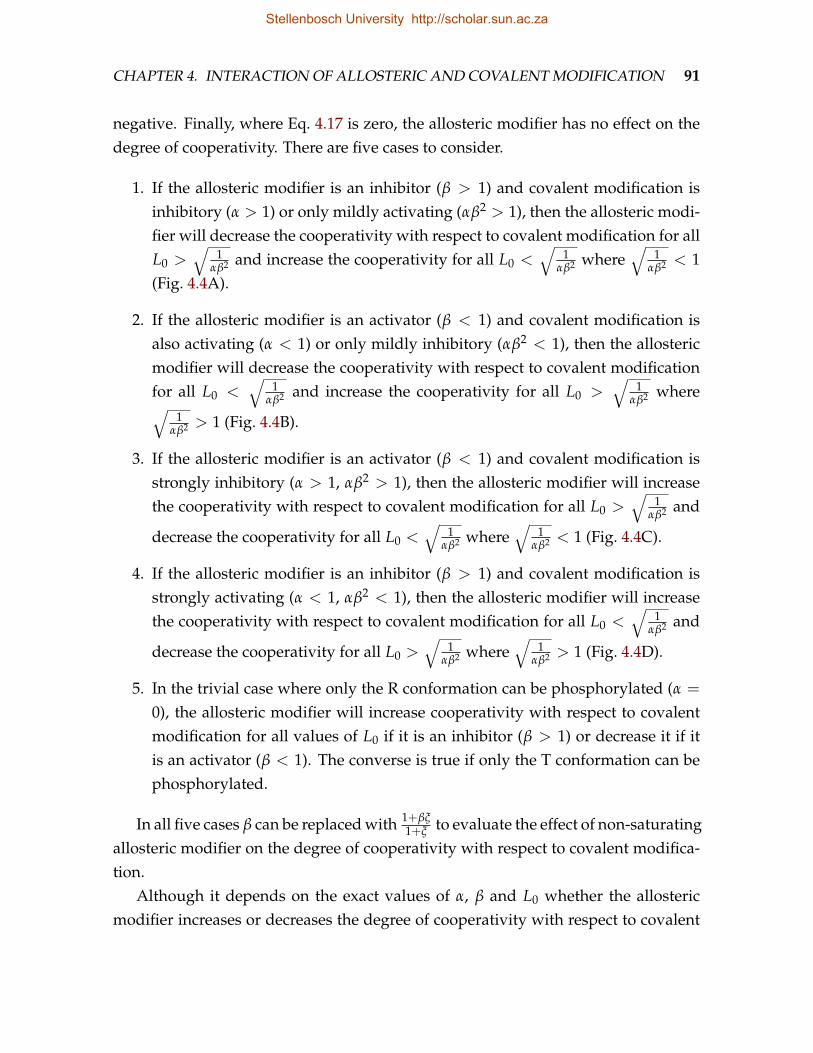
CHAPTER 4. INTERACTION OF ALLOSTERIC AND COVALENT MODIFICATION 91
negative. Finally, where Eq. 4.17 is zero, the allosteric modifier has no effect on thedegree of cooperativity. There are five cases to consider.
1. If the allosteric modifier is an inhibitor (β > 1) and covalent modification isinhibitory (α > 1) or only mildly activating (αβ2 > 1), then the allosteric modi-fier will decrease the cooperativity with respect to covalent modification for allL0 >
√1
αβ2 and increase the cooperativity for all L0 <√
1αβ2 where
√1
αβ2 < 1(Fig. 4.4A).
2. If the allosteric modifier is an activator (β < 1) and covalent modification isalso activating (α < 1) or only mildly inhibitory (αβ2 < 1), then the allostericmodifier will decrease the cooperativity with respect to covalent modificationfor all L0 <
√1
αβ2 and increase the cooperativity for all L0 >√
1αβ2 where
√1
αβ2 > 1 (Fig. 4.4B).
3. If the allosteric modifier is an activator (β < 1) and covalent modification isstrongly inhibitory (α > 1, αβ2 > 1), then the allosteric modifier will increasethe cooperativity with respect to covalent modification for all L0 >
√1
αβ2 and
decrease the cooperativity for all L0 <√
1αβ2 where
√1
αβ2 < 1 (Fig. 4.4C).
4. If the allosteric modifier is an inhibitor (β > 1) and covalent modification isstrongly activating (α < 1, αβ2 < 1), then the allosteric modifier will increasethe cooperativity with respect to covalent modification for all L0 <
√1
αβ2 and
decrease the cooperativity for all L0 >√
1αβ2 where
√1
αβ2 > 1 (Fig. 4.4D).
5. In the trivial case where only the R conformation can be phosphorylated (α =
0), the allosteric modifier will increase cooperativity with respect to covalentmodification for all values of L0 if it is an inhibitor (β > 1) or decrease it if itis an activator (β < 1). The converse is true if only the T conformation can bephosphorylated.
In all five cases β can be replaced with 1+βξ1+ξ to evaluate the effect of non-saturating
allosteric modifier on the degree of cooperativity with respect to covalent modifica-tion.
Although it depends on the exact values of α, β and L0 whether the allostericmodifier increases or decreases the degree of cooperativity with respect to covalent
Stellenbosch University http://scholar.sun.ac.za
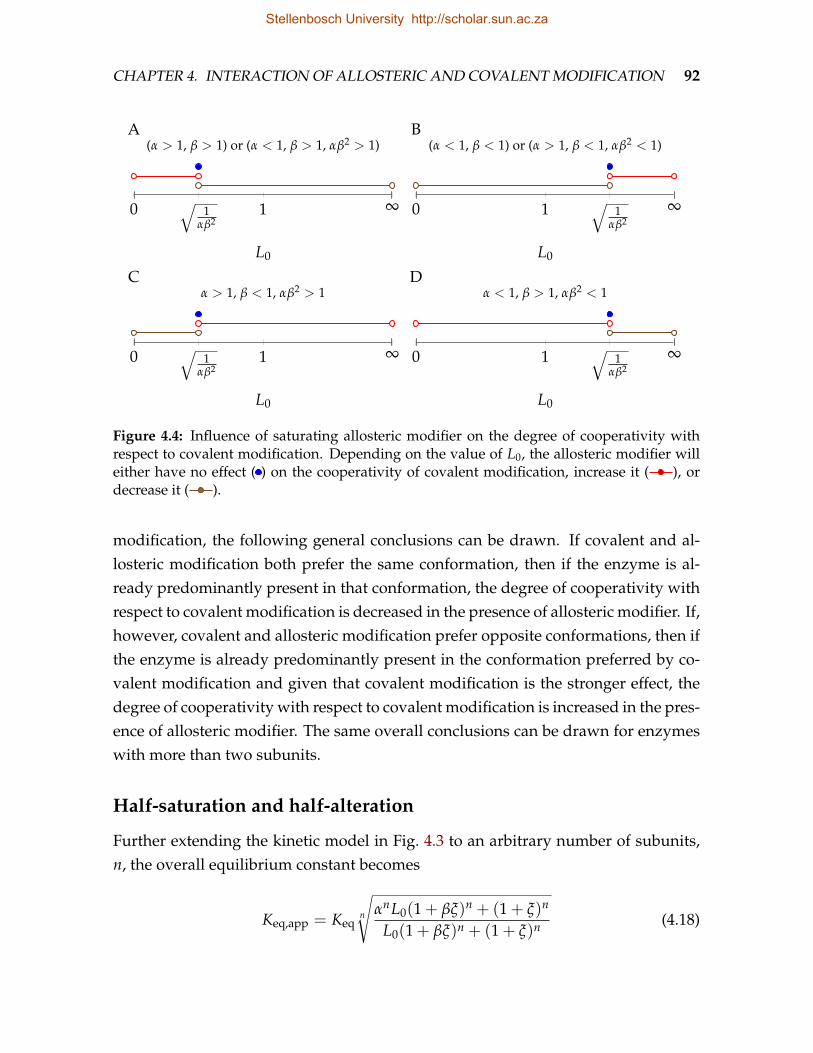
CHAPTER 4. INTERACTION OF ALLOSTERIC AND COVALENT MODIFICATION 92
0 1 ∞√1
αβ2
L0
(α > 1, β > 1) or (α < 1, β > 1, αβ2 > 1)A
0 1 ∞√1
αβ2
L0
(α < 1, β < 1) or (α > 1, β < 1, αβ2 < 1)B
0 1 ∞√1
αβ2
L0
α > 1, β < 1, αβ2 > 1C
0 1 ∞√1
αβ2
L0
α < 1, β > 1, αβ2 < 1D
Figure 4.4: Influence of saturating allosteric modifier on the degree of cooperativity withrespect to covalent modification. Depending on the value of L0, the allosteric modifier willeither have no effect ( ) on the cooperativity of covalent modification, increase it ( ), ordecrease it ( ).
modification, the following general conclusions can be drawn. If covalent and al-losteric modification both prefer the same conformation, then if the enzyme is al-ready predominantly present in that conformation, the degree of cooperativity withrespect to covalent modification is decreased in the presence of allosteric modifier. If,however, covalent and allosteric modification prefer opposite conformations, then ifthe enzyme is already predominantly present in the conformation preferred by co-valent modification and given that covalent modification is the stronger effect, thedegree of cooperativity with respect to covalent modification is increased in the pres-ence of allosteric modifier. The same overall conclusions can be drawn for enzymeswith more than two subunits.
Half-saturation and half-alteration
Further extending the kinetic model in Fig. 4.3 to an arbitrary number of subunits,n, the overall equilibrium constant becomes
Keq,app = Keqn
√αnL0(1 + βξ)n + (1 + ξ)n
L0(1 + βξ)n + (1 + ξ)n (4.18)
Stellenbosch University http://scholar.sun.ac.za
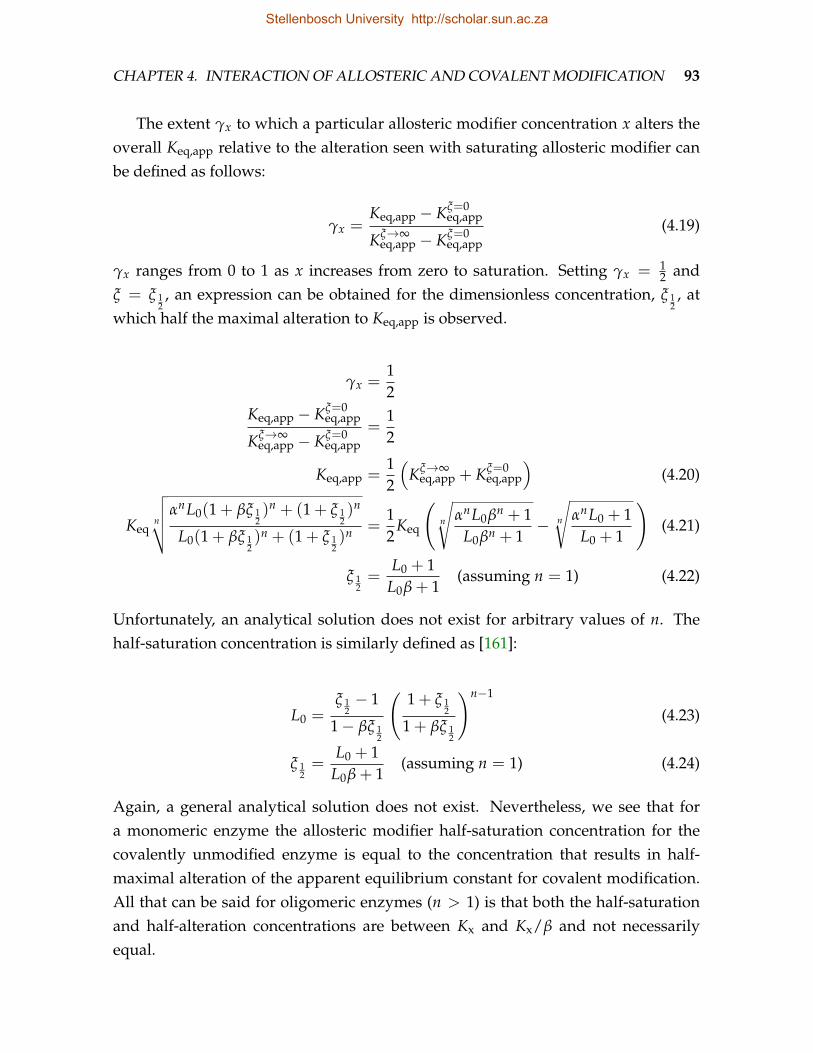
CHAPTER 4. INTERACTION OF ALLOSTERIC AND COVALENT MODIFICATION 93
The extent γx to which a particular allosteric modifier concentration x alters theoverall Keq,app relative to the alteration seen with saturating allosteric modifier canbe defined as follows:
γx =Keq,app − Kξ=0
eq,app
Kξ→∞eq,app − Kξ=0
eq,app(4.19)
γx ranges from 0 to 1 as x increases from zero to saturation. Setting γx = 12 and
ξ = ξ 12, an expression can be obtained for the dimensionless concentration, ξ 1
2, at
which half the maximal alteration to Keq,app is observed.
γx =12
Keq,app − Kξ=0eq,app
Kξ→∞eq,app − Kξ=0
eq,app=
12
Keq,app =12
(Kξ→∞
eq,app + Kξ=0eq,app
)(4.20)
Keqn
√√√√αnL0(1 + βξ 12)n + (1 + ξ 1
2)n
L0(1 + βξ 12)n + (1 + ξ 1
2)n =
12
Keq
(n
√αnL0βn + 1
L0βn + 1− n
√αnL0 + 1
L0 + 1
)(4.21)
ξ 12=
L0 + 1L0β + 1
(assuming n = 1) (4.22)
Unfortunately, an analytical solution does not exist for arbitrary values of n. Thehalf-saturation concentration is similarly defined as [161]:
L0 =ξ 1
2− 1
1− βξ 12
(1 + ξ 1
2
1 + βξ 12
)n−1
(4.23)
ξ 12=
L0 + 1L0β + 1
(assuming n = 1) (4.24)
Again, a general analytical solution does not exist. Nevertheless, we see that fora monomeric enzyme the allosteric modifier half-saturation concentration for thecovalently unmodified enzyme is equal to the concentration that results in half-maximal alteration of the apparent equilibrium constant for covalent modification.All that can be said for oligomeric enzymes (n > 1) is that both the half-saturationand half-alteration concentrations are between Kx and Kx/β and not necessarilyequal.
Stellenbosch University http://scholar.sun.ac.za
CHAPTER 4. INTERACTION OF ALLOSTERIC AND COVALENT MODIFICATION 94
4.3 Rate equations for covalent modification
In the previous section we have shown that the equilibrium constant for the covalentmodification of an MWC-type protein, in which covalent modification brings abouta shift in the equilibrium between the unliganded T and R conformations, undergoesan apparent change as a result of allosteric and covalent modification of the protein.Covalent modification of such a protein would typically be catalysed by an enzyme.It would therefore be of interest to derive a rate equation for such a reaction. TheHaldane relationship
Keq =VfKp
VrKs(4.25)
requires that any change in the equilibrium constant (left hand side of Eq. 4.25) mustbe accompanied by compensating changes in the kinetic parameters on the righthand side of Eq. 4.25. Here we will derive rate equations for the forward and reversecovalent modification reactions. A critical step in the derivation of a rate equation isthe expression of all enzyme forms in terms of only intrinsic equilibrium constants,the free enzyme concentration, and unbound ligand concentrations. This step canonly be performed if it is assumed that all species are in equilibrium. This assump-tion, however, cannot be made if the interconversion between enzyme forms is itselfenzyme-catalysed. Note that the assumption is valid if one is interested in equilib-rium conditions as in the previous sections where an expression for the apparentequilibrium constant was sought. In order to derive a rate equation, then, one isforced to derive a separate equation for each covalent enzyme state and to subse-quently describe the interconversion between states with additional rate equations.The overall rate is then the sum of the rates of the constituent enzyme states. In theprevious chapter we were concerned with finding an expression for such a sum ofrates. Here our focus turns to the interconversion between covalent enzyme states.The interconversion between the two covalent states of a monomeric protein with asingle covalent modification site and one allosteric site will be used as an example(Fig. 4.5). Since the forward and reverse interconversions are usually catalysed bydifferent enzymes, two rate equations are required to describe the interconversion.
Forward covalent modification
Assuming that the forward covalent modification reaction is a bi-substrate coupledreaction with a random binding order that is catalysed by enzyme A, the kinetic
Stellenbosch University http://scholar.sun.ac.za
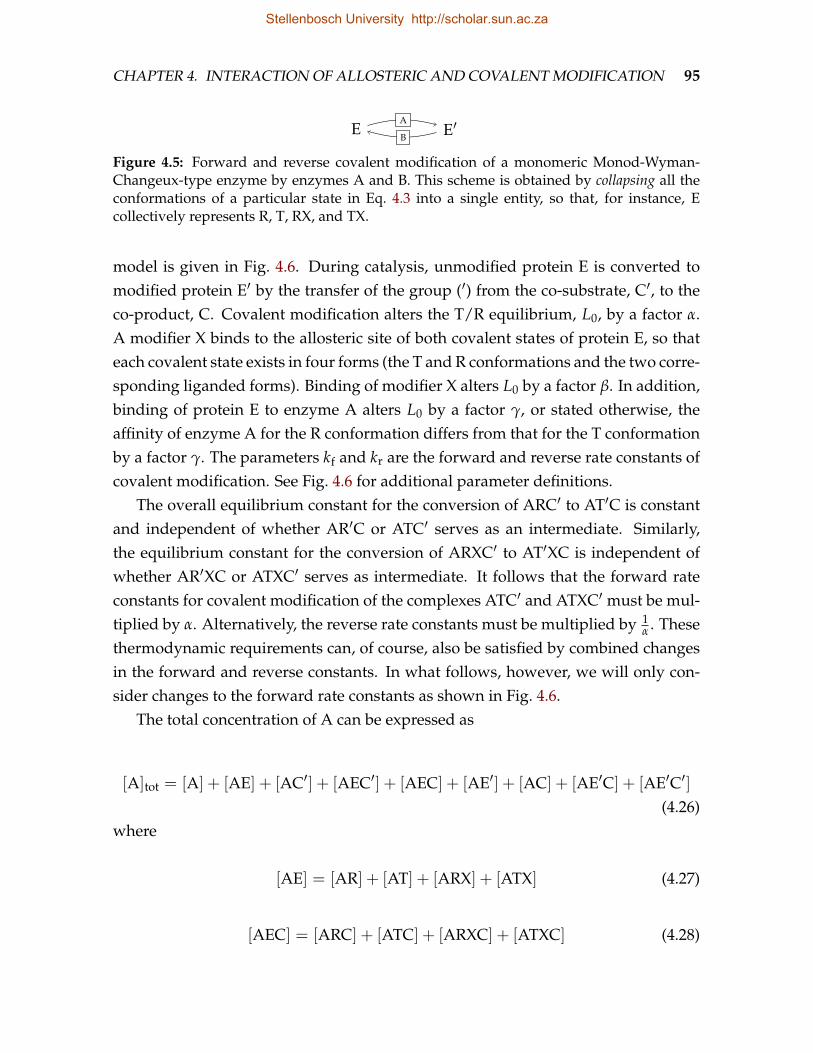
CHAPTER 4. INTERACTION OF ALLOSTERIC AND COVALENT MODIFICATION 95
E E′A
B
Figure 4.5: Forward and reverse covalent modification of a monomeric Monod-Wyman-Changeux-type enzyme by enzymes A and B. This scheme is obtained by collapsing all theconformations of a particular state in Eq. 4.3 into a single entity, so that, for instance, Ecollectively represents R, T, RX, and TX.
model is given in Fig. 4.6. During catalysis, unmodified protein E is converted tomodified protein E′ by the transfer of the group (′) from the co-substrate, C′, to theco-product, C. Covalent modification alters the T/R equilibrium, L0, by a factor α.A modifier X binds to the allosteric site of both covalent states of protein E, so thateach covalent state exists in four forms (the T and R conformations and the two corre-sponding liganded forms). Binding of modifier X alters L0 by a factor β. In addition,binding of protein E to enzyme A alters L0 by a factor γ, or stated otherwise, theaffinity of enzyme A for the R conformation differs from that for the T conformationby a factor γ. The parameters kf and kr are the forward and reverse rate constants ofcovalent modification. See Fig. 4.6 for additional parameter definitions.
The overall equilibrium constant for the conversion of ARC′ to AT′C is constantand independent of whether AR′C or ATC′ serves as an intermediate. Similarly,the equilibrium constant for the conversion of ARXC′ to AT′XC is independent ofwhether AR′XC or ATXC′ serves as intermediate. It follows that the forward rateconstants for covalent modification of the complexes ATC′ and ATXC′ must be mul-tiplied by α. Alternatively, the reverse rate constants must be multiplied by 1
α . Thesethermodynamic requirements can, of course, also be satisfied by combined changesin the forward and reverse constants. In what follows, however, we will only con-sider changes to the forward rate constants as shown in Fig. 4.6.
The total concentration of A can be expressed as
[A]tot = [A] + [AE] + [AC′] + [AEC′] + [AEC] + [AE′] + [AC] + [AE′C] + [AE′C′](4.26)
where
[AE] = [AR] + [AT] + [ARX] + [ATX] (4.27)
[AEC] = [ARC] + [ATC] + [ARXC] + [ATXC] (4.28)
Stellenbosch University http://scholar.sun.ac.za
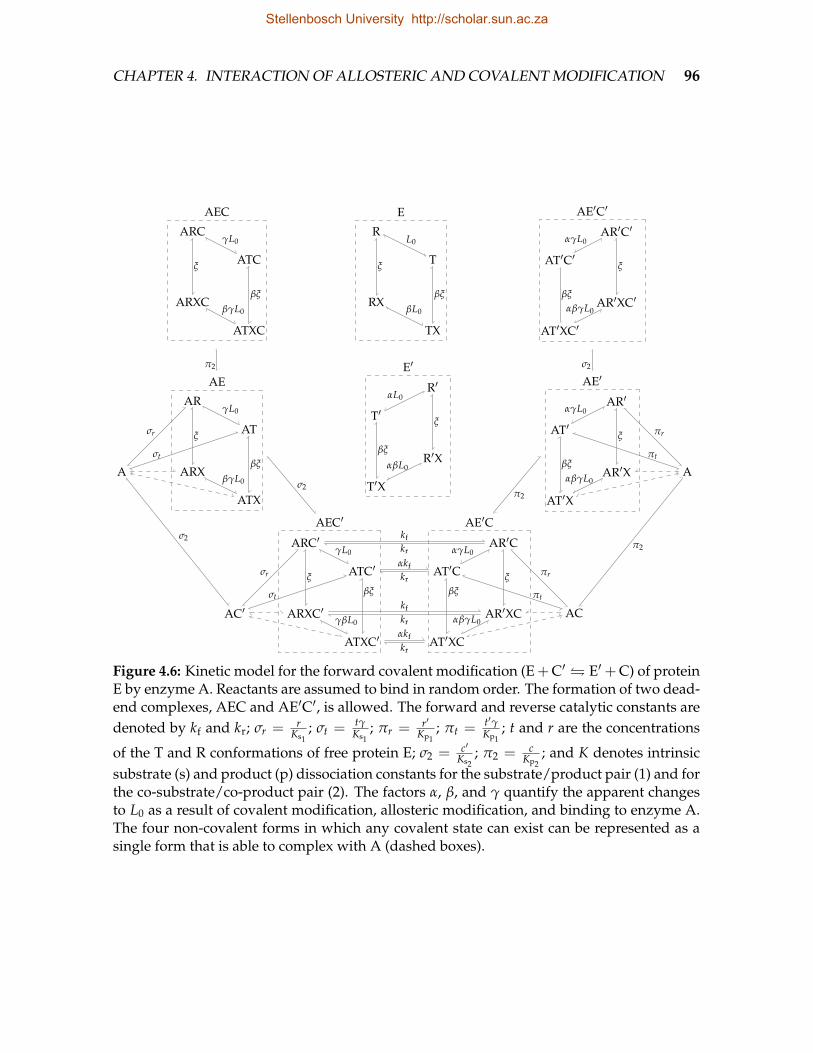
CHAPTER 4. INTERACTION OF ALLOSTERIC AND COVALENT MODIFICATION 96
A
AR
AT
ARX
ATX
AE
ARC
ATC
ARXC
ATXC
AEC
R
T
RX
TX
E
AC′
ARC′
ATC′
ARXC′
ATXC′
AEC′
A
AR′
AT′
AR′X
AT′X
AE′
AR′C′
AT′C′
AR′XC′
AT′XC′
AE′C′
R′
T′
R′X
T′X
E′
AC
AR′C
AT′C
AR′XC
AT′XC
AE′C
σr
σt
πr
πt
σr
σt
πr
πt
γL0
βγL0
ξ
βξ
αγL0
αβγL0
ξ
βξ
γL0
βγL0
ξ
βξ
αγL0
αβγL0
ξ
βξ
L0
βL0
ξ
βξ
αL0
αβL0
ξ
βξ
γL0
γβL0
ξ
βξ
αγL0
αβγL0
ξ
βξ
σ2
σ2
π2
π2
π2 σ2
kf
kr
αkfkr
kf
kr
αkf
kr
Figure 4.6: Kinetic model for the forward covalent modification (E+C′ E′+C) of proteinE by enzyme A. Reactants are assumed to bind in random order. The formation of two dead-end complexes, AEC and AE′C′, is allowed. The forward and reverse catalytic constants aredenoted by kf and kr; σr = r
Ks1; σt =
tγKs1
; πr = r′Kp1
; πt =t′γKp1
; t and r are the concentrations
of the T and R conformations of free protein E; σ2 = c′Ks2
; π2 = cKp2
; and K denotes intrinsicsubstrate (s) and product (p) dissociation constants for the substrate/product pair (1) and forthe co-substrate/co-product pair (2). The factors α, β, and γ quantify the apparent changesto L0 as a result of covalent modification, allosteric modification, and binding to enzyme A.The four non-covalent forms in which any covalent state can exist can be represented as asingle form that is able to complex with A (dashed boxes).
Stellenbosch University http://scholar.sun.ac.za
CHAPTER 4. INTERACTION OF ALLOSTERIC AND COVALENT MODIFICATION 97
[AEC′] = [ARC′] + [ATC′] + [ARXC′] + [ATXC′] (4.29)
[AE′C] = [AR′C] + [AT′C] + [AR′XC] + [AT′XC] (4.30)
[AE′] = [AR′] + [AT′] + [AR′X] + [AT′X] (4.31)
[AE′C′] = [AR′C′] + [AT′C′] + [AR′XC′] + [AT′XC′] (4.32)
or in terms of intrinsic equilibria:
[A]tot = [A] (1 + σr [(1 + ξ) + γL0(1 + βξ)] + πr [(1 + ξ) + αγL0(1 + βξ)])(1 + σ2 + π′2
)
(4.33)The total concentration of unbound protein E is given by
e = [R] + [T] + [RX] + [TX] (4.34)
= [R] [(1 + ξ) + L0(1 + βξ)] (4.35)
and the total concentration of unbound protein E’ is given by
e′ = [R′] + [T′] + [R′X] + [T′X] (4.36)
= [R′] [(1 + ξ) + αL0(1 + βξ)] (4.37)
It thus follows that, [R] =e
(1 + ξ) + L0(1 + βξ)and [R′] =
e′
(1 + ξ) + αL0(1 + βξ),
so that
σr =σ1
(1 + ξ) + L0(1 + βξ)(4.38)
and
πr =π1
(1 + ξ) + αL0(1 + βξ)(4.39)
where σ1 = eKs1
and π1 = e′Kp1
. Substituting Eqs. 4.38 and 4.39 into Eq. 4.33 gives
Stellenbosch University http://scholar.sun.ac.za
CHAPTER 4. INTERACTION OF ALLOSTERIC AND COVALENT MODIFICATION 98
[A]tot = [R](
1 + σ1
[(1 + ξ) + γL0(1 + βξ)
(1 + ξ) + L0(1 + βξ)
]+ π1
[(1 + ξ) + αγL0(1 + βξ)
(1 + ξ) + αL0(1 + βξ)
])(1 + σ2 + π2)
(4.40)The rate of covalent modification is described by
vA =kf[ARC′] + kf[ARXC′] + αkf[ATC′] + αkf[ATXC′]
−(kr[AR′C] + kr[AR′XC] + kr[AT′C] + kr[AT′XC]
) (4.41)
=
[A]tot
[kf[ARC′] + kf[ARXC′] + αkf[ATC′] + αkf[ATXC′]
−(kr[AR′C] + kr[AR′XC] + kr[AT′C] + kr[AT′XC]
)]
[A]tot(4.42)
=
Vfσ1
[(1 + ξ) + αγL0(1 + βξ)
(1 + ξ) + L0(1 + βξ)
]σ2 −Vrπ1
[(1 + ξ) + αγL0(1 + βξ)
(1 + ξ) + αL0(1 + βξ)
]π2
(1 + σ1
[(1 + ξ) + γL0(1 + βξ)
(1 + ξ) + L0(1 + βξ)
]+ π1
[(1 + ξ) + αγL0(1 + βξ)
(1 + ξ) + αL0(1 + βξ)
])(1 + σ2 + π2)
(4.43)
where Vf = kf[A]tot and Vr = kr[A]tot. Equation 4.43 can be written in the form of theclassic bi-substrate random order rate equation:
vA =Vf,appσ1,appσ2 −Vrπ1,appπ2(
1 + σ1,app + π1,app)(1 + σ2 + π2)
(4.44)
with Vf,app = Vf
[(1 + ξ) + αγL0(1 + βξ)
(1 + ξ) + γL0(1 + βξ)
], σ1,app = σ1
[(1 + ξ) + γL0(1 + βξ)
(1 + ξ) + L0(1 + βξ)
],
and π1,app = π1
[(1 + ξ) + αγL0(1 + βξ)
(1 + ξ) + αL0(1 + βξ)
]. Note that, since we have considered
kr to be unaltered by covalent modification, there are no terms that modify Vr.Setting vA = 0 in Eq. 4.44, an expression for the equilibrium constant is obtained:
Stellenbosch University http://scholar.sun.ac.za
CHAPTER 4. INTERACTION OF ALLOSTERIC AND COVALENT MODIFICATION 99
Vf,appσ1,appσ2 −Vrπ1,appπ2(1 + σ1,app + π1,app
)(1 + σ2 + π2)
= 0
Vf,appσ1,appσ2 = Vrπ1,appπ2
ceq · e′eq
c′eq · eeq=
Vf,appKp1,appKp2
VrKs1,appKs2
Keq,app =Vf,appKp1,appKp2
VrKs1,appKs2
Keq,app =VfKp1Kp2
VrKs1Ks2
[(1 + ξ) + αL0(1 + βξ)
(1 + ξ) + L0(1 + βξ)
]
Keq,app = Keq
[(1 + ξ) + αL0(1 + βξ)
(1 + ξ) + L0(1 + βξ)
](4.45)
The expression of Keq,app in Eq. 4.45 is, as expected, identical to the expression inEq. 4.4. Writing Eq. 4.44 in terms of Keq,app yields
vA =
Vf,appσ1,appσ2
(1− e′ · c/(e · c′)
Keq,app
)
(1 + σ1,app + π1,app
)(1 + σ2 + π2)
(4.46)
or, in expanded form:
vA =
Vfσ1
[(1 + ξ) + αγL0(1 + βξ)
(1 + ξ) + L0(1 + βξ)
]σ2
1− e′ · c/(e · c′)
Keq
[(1 + ξ) + αL0(1 + βξ)
(1 + ξ) + L0(1 + βξ)
]
(1 + σ1
[(1 + ξ) + γL0(1 + βξ)
(1 + ξ) + L0(1 + βξ)
]+ π1
[(1 + ξ) + αγL0(1 + βξ)
(1 + ξ) + αL0(1 + βξ)
])(1 + σ2 + π2)
(4.47)If we now suppose that covalent modification does not bring about any confor-
mational change to protein E, i.e., that α = 1, then a factor[(1 + ξ) + γL0(1 + βξ)
(1 + ξ) + L0(1 + βξ)
]
can be cancelled from the numerator and denominator of Eq. 4.47, resulting in therate equation for the classic bi-substrate random order mechanism. Therefore, evenif enzyme A binds the T and R conformations with different affinities (γ 6= 1), nokinetic parameters are modified. On the other hand, if we suppose that enzyme Abinds the T and R conformations with equal affinity (γ = 1), then σ1,app = σ1 andπ1,app = π1, showing that only the maximal forward carrying capacity, Vf, under-goes apparent modification:
Stellenbosch University http://scholar.sun.ac.za
CHAPTER 4. INTERACTION OF ALLOSTERIC AND COVALENT MODIFICATION 100
vA =
φVfσ1σ2
(1− e′ · c/(e · c′)
φKeq
)
(1 + σ1 + π1) (1 + σ2 + π2)(4.48)
where φ =
[(1 + ξ) + αL0(1 + βξ)
(1 + ξ) + L0(1 + βξ)
].
Any change in the apparent Michaelis constants in response to allosteric modi-fication of the substrate and product is solely the result of the differential affinitiesof the enzyme for the two substrate and product conformations and is not directlylinked to the fact that covalent modification alters the value of L0. Changes to theforward maximal rate is, however, solely the result of the fact that covalent modifi-cation alters L0. In what follows, we will assume that enzyme A has an equal affinityfor both conformations of its substrate and product, so that allosteric modificationcan only affect the forward maximal rate as in Eq. 4.48.
Note that modification is absent from the reverse maximal rate as a result of anassumption; equations can also be derived in which only Vr is apparently modi-fied, or in which both Vf and Vr are modified. The important point is that catalyticmodification, whether in the forward or reverse directions, is the result of covalentmodification changing the value of L0, and is independent of whether enzyme Ahas different affinities for the T and R conformations. Note also that the values ofα and β are specific to protein E, and must have the same values in the rate equa-tions for forward and reverse covalent modification. The value of γ, on the otherhand, is specific to the enzyme that catalyses the modification; it should generallydiffer for forward and reverse covalent modification and even for different enzymescatalysing covalent modification in the same direction.
Reverse covalent modification
Assuming that the reverse covalent modification reaction is a uni-bi reaction with arandom binding order catalysed by enzyme B, the kinetic model is given in Fig. 4.7.G is the group released upon reversing the covalent modification. Following a simi-lar method as in the derivation of the forward reaction rate equation, the rate for thereverse covalent modification reaction can be shown to be described by
vB =
φ−1Vfσ′(
1− e · g/e′
φ−1Keq
)
σ + (1 + π2) (1 + π1)(4.49)
Stellenbosch University http://scholar.sun.ac.za
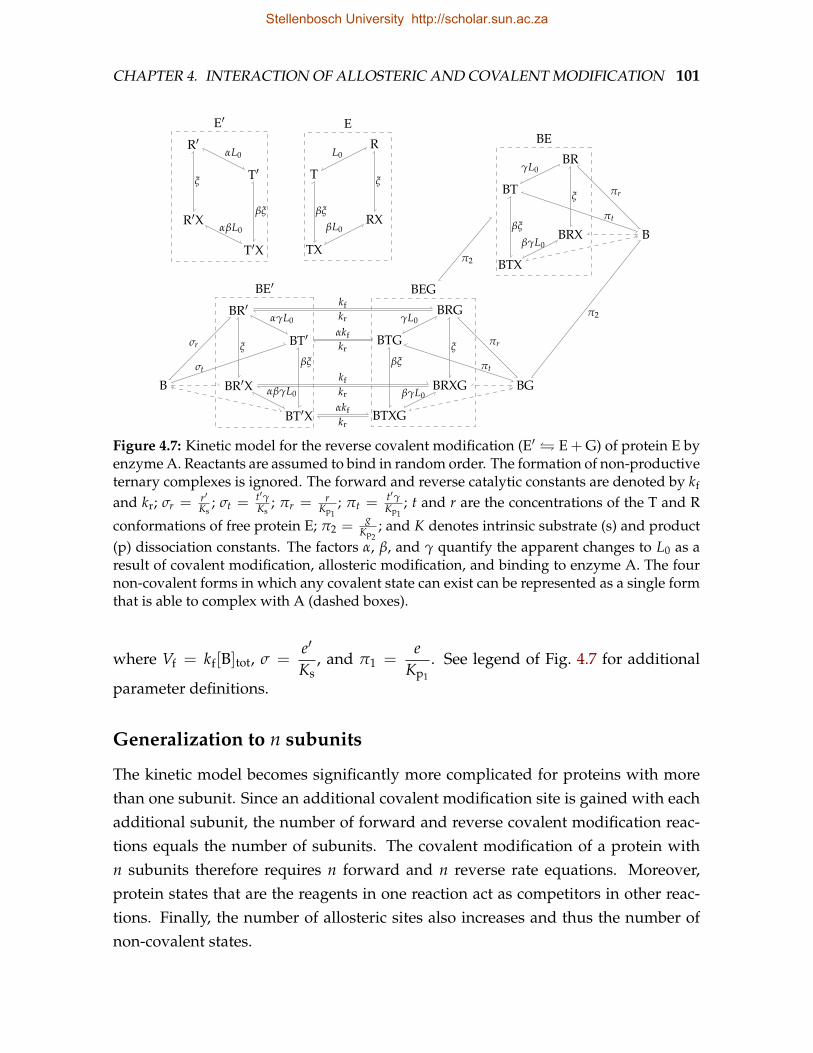
CHAPTER 4. INTERACTION OF ALLOSTERIC AND COVALENT MODIFICATION 101
R′
T′
R′X
T′X
E′
B
BR′
BT′
BR′X
BT′X
BE′
B
BR
BT
BRX
BTX
BER
T
RX
TX
E
BG
BRG
BTG
BRXG
BTXG
BEG
πr
πt
σr
σt
πr
πt
γL0
βγL0
ξ
βξ
L0
βL0
ξ
βξ
αL0
αβL0
ξ
βξ
αγL0
αβγL0
ξ
βξ
γL0
βγL0
ξ
βξ
π2
π2
kfkr
αkfkr
kf
kr
αkf
kr
Figure 4.7: Kinetic model for the reverse covalent modification (E′ E + G) of protein E byenzyme A. Reactants are assumed to bind in random order. The formation of non-productiveternary complexes is ignored. The forward and reverse catalytic constants are denoted by kf
and kr; σr = r′Ks
; σt =t′γKs
; πr = rKp1
; πt =t′γKp1
; t and r are the concentrations of the T and R
conformations of free protein E; π2 = gKp2
; and K denotes intrinsic substrate (s) and product(p) dissociation constants. The factors α, β, and γ quantify the apparent changes to L0 as aresult of covalent modification, allosteric modification, and binding to enzyme A. The fournon-covalent forms in which any covalent state can exist can be represented as a single formthat is able to complex with A (dashed boxes).
where Vf = kf[B]tot, σ =e′
Ks, and π1 =
eKp1
. See legend of Fig. 4.7 for additional
parameter definitions.
Generalization to n subunits
The kinetic model becomes significantly more complicated for proteins with morethan one subunit. Since an additional covalent modification site is gained with eachadditional subunit, the number of forward and reverse covalent modification reac-tions equals the number of subunits. The covalent modification of a protein withn subunits therefore requires n forward and n reverse rate equations. Moreover,protein states that are the reagents in one reaction act as competitors in other reac-tions. Finally, the number of allosteric sites also increases and thus the number ofnon-covalent states.
Stellenbosch University http://scholar.sun.ac.za
CHAPTER 4. INTERACTION OF ALLOSTERIC AND COVALENT MODIFICATION 102
In what follows we will derive the general forms of the n forward and reverse rateequations required to describe the covalent modification of a protein with n subunits.We will not attempt a detailed derivation, but, with the aid of simplifying principles,instead broadly describe how the rate equations were obtained. We begin with thederivation of the forward rate equations, and then also provide the equations for thereverse reactions.
As was shown in the derivation for the forward reaction with a monomeric pro-tein, it is not necessary to explicitly consider all the non-covalent forms of a par-ticular covalent state. For instance, binding of R, T, RX, and TX may be describedcollectively as the binding of E, so that the binding constant is really an apparent con-stant of which the value depends on the allosteric and covalent modification state ofthe protein.
We thus only have to consider the n + 1 covalent modification states in whichprotein E can exist:
E′(0), E′(1), . . . , E′(n) (4.50)
where ′(i) indicates the number of covalently modified subunits of the particularstate. All the states in Eq. 4.50 can exist in free form and in complexes with A. Theconcentration of free E′(i) is expressed by
e′(i) = r′(i)[(1 + ξ)n + αiL0(1 + βξ)n
](4.51)
where r′(i) is the concentration of state E′(i) that is present in the R conformation, andhence
r′(i) =e′(i)
(1 + ξ)n + αiL0(1 + βξ)n (4.52)
A particular state E′(i) can complex with A as either a substrate or a product. E′(i)
has (n − i) unmodified subunits and and i modified subunits. As a substrate, theconcentration of E′(i) is then effectively multiplied by (n− i), whereas in its capacityas product the concentration of E′(i) is effectively multiplied by i. It is thus clear thatE′(0) can only function as a substrate (its concentration as product is multiplied byzero), whereas E′(n) can only function as a product (its concentration as substrate ismultiplied by zero). All other states function as both substrates and products.The concentration of E′(i) complexed as a substrate with A is expressed by
Stellenbosch University http://scholar.sun.ac.za
CHAPTER 4. INTERACTION OF ALLOSTERIC AND COVALENT MODIFICATION 103
[AE′(i)]s =n
∑j[AR′(i)Xj]s +
n
∑j[AT′(i)Xj]s (4.53)
= [AR′(i)]s(1 + ξ)n + [AR′(i)]sαiγL0(1 + βξ)n (4.54)
= [AR′(i)]s[(1 + ξ)n + αiγL0(1 + βξ)n
](4.55)
= [A](n− i)r′(i)
Ks1
[(1 + ξ)n + αiγL0(1 + βξ)n
](4.56)
= [A](n− i)e′(i)
Ks1
[(1 + ξ)n + αiγL0(1 + βξ)n
(1 + ξ)n + αiL0(1 + βξ)n
](4.57)
= [A](n− i)σ(i)1
[(1 + ξ)n + αiγL0(1 + βξ)n
(1 + ξ)n + αiL0(1 + βξ)n
](4.58)
= [A](n− i)σ(i)1,app (4.59)
where σ(i)1,app = σ
(i)1
[(1 + ξ)n + αiγL0(1 + βξ)n
(1 + ξ)n + αiL0(1 + βξ)n
]. Similarly, the concentration of E′(i)
complexed as a product with A is expressed by
[AE′(i)]p = [A](i)π(i)1,app (4.60)
where π(i)1,app = π
(i)1
[(1 + ξ)n + αiγL0(1 + βξ)n
(1 + ξ)n + αiL0(1 + βξ)n
].
In the absence of co-substrate and co-product, the total concentration of enzymeA is given by
[A]tot = [A] +n
∑j=1
[AE′(j−1)]s +n
∑j=1
[AE′(j)]p (4.61)
= [A]
(1 +
n
∑j=1
(n− j + 1)σ′(j−1)1,app +
n
∑j=1
jπ′(j)1,app
)(4.62)
If the co-substrate and co-product, which bind independently of protein E, are alsotaken into account, Eq. 4.61 becomes
[A]tot = [A]
(1 +
n
∑j=1
(n− j + 1)σ′(j−1)1,app +
n
∑j=1
jπ′(j)1,app
)(1 + σ2 + π2) (4.63)
The rate of the ith reaction, E′(i−1) + C′ E′(i) + C, where i ∈ [1, n], is describedby
Stellenbosch University http://scholar.sun.ac.za
CHAPTER 4. INTERACTION OF ALLOSTERIC AND COVALENT MODIFICATION 104
vAi = kf
n
∑j[AR′(i−1)XjC′] + αkf
n
∑j[AT′(i−1)XjC′]− kr[AE′(i)C]
= kf
n
∑j[AR′(i−1)Xj]sσ2 + αkf
n
∑j[AT′(i−1)Xj]sσ2 − kr[AE′(i)]pπ2
= kf[AR′(i−1)]s(1 + ξ)nσ2 + αkf[AR′(i−1)]sαi−1γL0(1 + βξ)nσ2 − kr[AE′(i)]pπ2
= kf[AR′(i−1)]s[(1 + ξ)n + αiγL0(1 + βξ)n
]σ2 − kr[AE′(i)]pπ2
= kf[A](n− i + 1)r′(i−1)
Ks1
[(1 + ξ)n + αiγL0(1 + βξ)n
]σ2 − kr[A](i)π(i)
1,appπ2
= kf[A](n− i + 1)e′(i−1)
Ks1
[(1 + ξ)n + αiγL0(1 + βξ)n
(1 + ξ)n + αi−1L0(1 + βξ)n
]σ2 − kr[A](i)π(i)
1,appπ2
= kf[A](n− i + 1)σ′(i−1)1
[(1 + ξ)n + αiγL0(1 + βξ)n
(1 + ξ)n + αi−1γL0(1 + βξ)n
]σ2 − kr[A](i)π(i)
1,appπ2
= kf[A](n− i + 1)σ′(i−1)1,app
[(1 + ξ)n + αiγL0(1 + βξ)n
(1 + ξ)n + αi−1L0(1 + βξ)n
]σ2 − kr[A](i)π(i)
1,appπ2
= k(i)f,app[A](n− i + 1)σ′(i−1)1,app σ2 − kr[A](i)π(i)
1,appπ2 (4.64)
where k(i)f,app = kf
[(1 + ξ)n + αiγL0(1 + βξ)n
(1 + ξ)n + αi−1L0(1 + βξ)n
]. Multiplying the numerator and de-
nominator of Eq. 4.64 with [A]tot yields
vAi =k(i)f,app[A]tot[A](n− i + 1)σ′(i−1)
1,app σ2 − kr[A]tot[A](i)π(i)1,appπ2
[A]tot(4.65)
=k(i)f,app[A]tot(n− i + 1)σ′(i−1)
1,app σ2 − kr[A]tot(i)π(i)1,appπ2(
1 +n
∑j=1
(n− j + 1)σ′(j−1)1,app +
n
∑j=1
jπ′(j)1,app
)(1 + σ2 + π2)
(4.66)
=V(i)
f,app(n− i + 1)σ′(i−1)1,app σ2 −Vr(i)π
(i)1,appπ2(
1 +n
∑j=1
(n− j + 1)σ′(j−1)1,app +
n
∑j=1
jπ′(j)1,app
)(1 + σ2 + π2)
(4.67)
(4.68)
which can also be written in terms of the equilibrium constant:
Stellenbosch University http://scholar.sun.ac.za
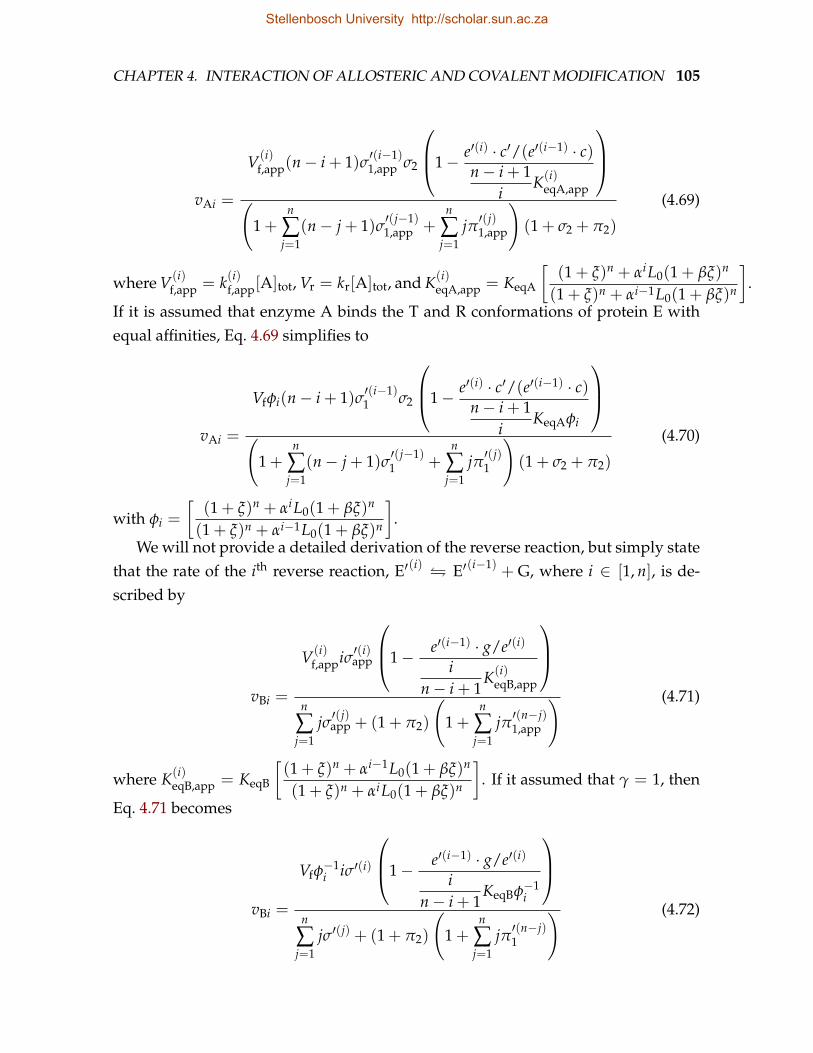
CHAPTER 4. INTERACTION OF ALLOSTERIC AND COVALENT MODIFICATION 105
vAi =
V(i)f,app(n− i + 1)σ′(i−1)
1,app σ2
1− e′(i) · c′/(e′(i−1) · c)
n− i + 1i
K(i)eqA,app
(1 +
n
∑j=1
(n− j + 1)σ′(j−1)1,app +
n
∑j=1
jπ′(j)1,app
)(1 + σ2 + π2)
(4.69)
where V(i)f,app = k(i)f,app[A]tot, Vr = kr[A]tot, and K(i)
eqA,app = KeqA
[(1 + ξ)n + αiL0(1 + βξ)n
(1 + ξ)n + αi−1L0(1 + βξ)n
].
If it is assumed that enzyme A binds the T and R conformations of protein E withequal affinities, Eq. 4.69 simplifies to
vAi =
Vfφi(n− i + 1)σ′(i−1)1 σ2
1− e′(i) · c′/(e′(i−1) · c)
n− i + 1i
KeqAφi
(1 +
n
∑j=1
(n− j + 1)σ′(j−1)1 +
n
∑j=1
jπ′(j)1
)(1 + σ2 + π2)
(4.70)
with φi =
[(1 + ξ)n + αiL0(1 + βξ)n
(1 + ξ)n + αi−1L0(1 + βξ)n
].
We will not provide a detailed derivation of the reverse reaction, but simply statethat the rate of the ith reverse reaction, E′(i) E′(i−1) + G, where i ∈ [1, n], is de-scribed by
vBi =
V(i)f,appiσ′(i)app
1− e′(i−1) · g/e′(i)
in− i + 1
K(i)eqB,app
n
∑j=1
jσ′(j)app + (1 + π2)
(1 +
n
∑j=1
jπ′(n−j)1,app
) (4.71)
where K(i)eqB,app = KeqB
[(1 + ξ)n + αi−1L0(1 + βξ)n
(1 + ξ)n + αiL0(1 + βξ)n
]. If it assumed that γ = 1, then
Eq. 4.71 becomes
vBi =
Vfφ−1i iσ′(i)
1− e′(i−1) · g/e′(i)
in− i + 1
KeqBφ−1i
n
∑j=1
jσ′(j) + (1 + π2)
(1 +
n
∑j=1
jπ′(n−j)1
) (4.72)
Stellenbosch University http://scholar.sun.ac.za
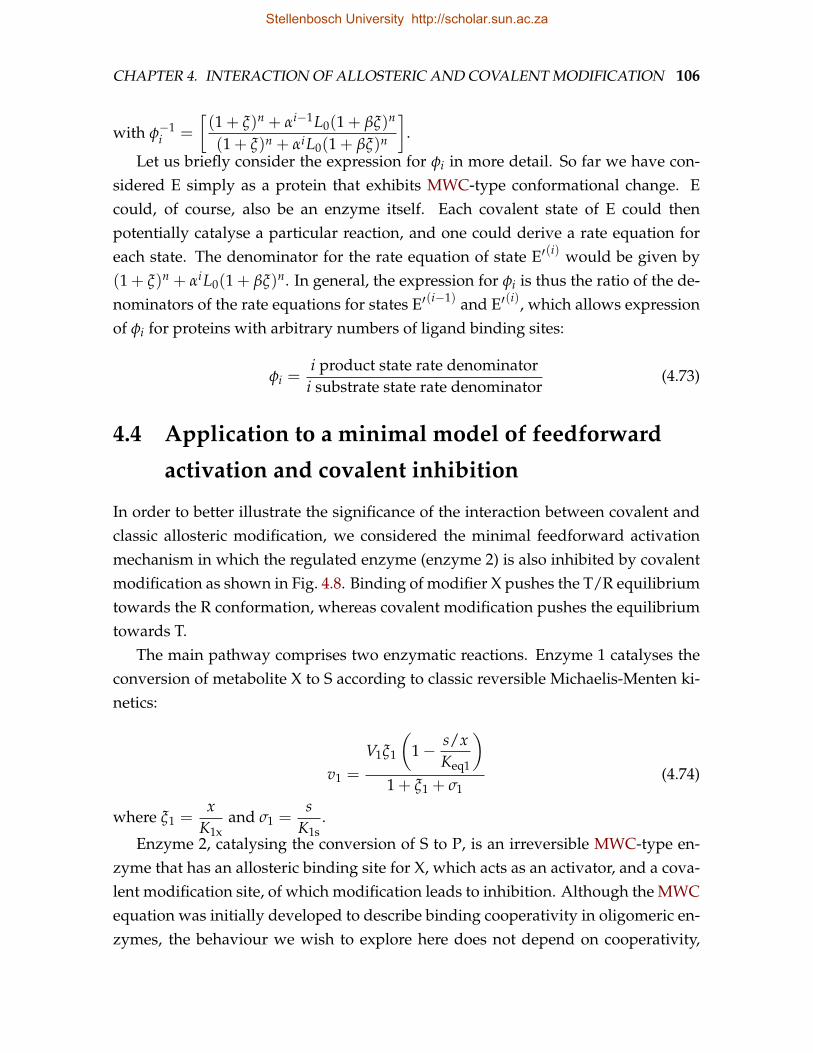
CHAPTER 4. INTERACTION OF ALLOSTERIC AND COVALENT MODIFICATION 106
with φ−1i =
[(1 + ξ)n + αi−1L0(1 + βξ)n
(1 + ξ)n + αiL0(1 + βξ)n
].
Let us briefly consider the expression for φi in more detail. So far we have con-sidered E simply as a protein that exhibits MWC-type conformational change. Ecould, of course, also be an enzyme itself. Each covalent state of E could thenpotentially catalyse a particular reaction, and one could derive a rate equation foreach state. The denominator for the rate equation of state E′(i) would be given by(1 + ξ)n + αiL0(1 + βξ)n. In general, the expression for φi is thus the ratio of the de-nominators of the rate equations for states E′(i−1) and E′(i), which allows expressionof φi for proteins with arbitrary numbers of ligand binding sites:
φi =i product state rate denominator
i substrate state rate denominator(4.73)
4.4 Application to a minimal model of feedforward
activation and covalent inhibition
In order to better illustrate the significance of the interaction between covalent andclassic allosteric modification, we considered the minimal feedforward activationmechanism in which the regulated enzyme (enzyme 2) is also inhibited by covalentmodification as shown in Fig. 4.8. Binding of modifier X pushes the T/R equilibriumtowards the R conformation, whereas covalent modification pushes the equilibriumtowards T.
The main pathway comprises two enzymatic reactions. Enzyme 1 catalyses theconversion of metabolite X to S according to classic reversible Michaelis-Menten ki-netics:
v1 =
V1ξ1
(1− s/x
Keq1
)
1 + ξ1 + σ1(4.74)
where ξ1 =x
K1xand σ1 =
sK1s
.
Enzyme 2, catalysing the conversion of S to P, is an irreversible MWC-type en-zyme that has an allosteric binding site for X, which acts as an activator, and a cova-lent modification site, of which modification leads to inhibition. Although the MWCequation was initially developed to describe binding cooperativity in oligomeric en-zymes, the behaviour we wish to explore here does not depend on cooperativity,
Stellenbosch University http://scholar.sun.ac.za
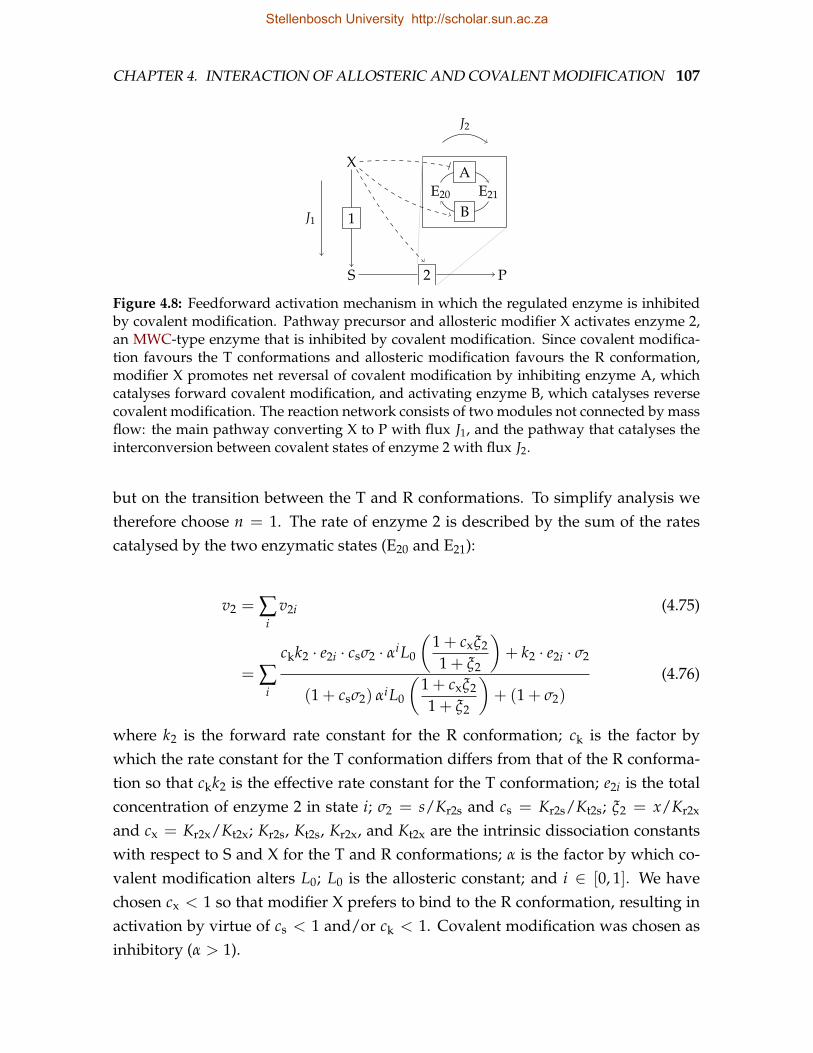
CHAPTER 4. INTERACTION OF ALLOSTERIC AND COVALENT MODIFICATION 107
X
1
S 2 P
AE20 E21
BJ1
J2
Figure 4.8: Feedforward activation mechanism in which the regulated enzyme is inhibitedby covalent modification. Pathway precursor and allosteric modifier X activates enzyme 2,an MWC-type enzyme that is inhibited by covalent modification. Since covalent modifica-tion favours the T conformations and allosteric modification favours the R conformation,modifier X promotes net reversal of covalent modification by inhibiting enzyme A, whichcatalyses forward covalent modification, and activating enzyme B, which catalyses reversecovalent modification. The reaction network consists of two modules not connected by massflow: the main pathway converting X to P with flux J1, and the pathway that catalyses theinterconversion between covalent states of enzyme 2 with flux J2.
but on the transition between the T and R conformations. To simplify analysis wetherefore choose n = 1. The rate of enzyme 2 is described by the sum of the ratescatalysed by the two enzymatic states (E20 and E21):
v2 = ∑i
v2i (4.75)
= ∑i
ckk2 · e2i · csσ2 · αiL0
(1 + cxξ2
1 + ξ2
)+ k2 · e2i · σ2
(1 + csσ2) αiL0
(1 + cxξ2
1 + ξ2
)+ (1 + σ2)
(4.76)
where k2 is the forward rate constant for the R conformation; ck is the factor bywhich the rate constant for the T conformation differs from that of the R conforma-tion so that ckk2 is the effective rate constant for the T conformation; e2i is the totalconcentration of enzyme 2 in state i; σ2 = s/Kr2s and cs = Kr2s/Kt2s; ξ2 = x/Kr2x
and cx = Kr2x/Kt2x; Kr2s, Kt2s, Kr2x, and Kt2x are the intrinsic dissociation constantswith respect to S and X for the T and R conformations; α is the factor by which co-valent modification alters L0; L0 is the allosteric constant; and i ∈ [0, 1]. We havechosen cx < 1 so that modifier X prefers to bind to the R conformation, resulting inactivation by virtue of cs < 1 and/or ck < 1. Covalent modification was chosen asinhibitory (α > 1).
Stellenbosch University http://scholar.sun.ac.za
CHAPTER 4. INTERACTION OF ALLOSTERIC AND COVALENT MODIFICATION 108
The rate equations for the forward modification reaction, catalysing the reactionE20 +C′ E21 +C, and for the reverse modification reaction, catalysing the reactionE21 E20 + G, are of the same form as Eqs. 4.70 and 4.72, but with n = 1:
vA =
φ · kA[A]tot · σA1 · σA2
(1− e21c/(e20c′)
φKeqA
)
(1 + σA1 + πA1) (1 + σA2 + πA2)(4.77)
and
vB =
φ−1kB[B]tot · σB
(1− e20g/e21
φ−1KeqB
)
σB + (1 + πB1) (1 + πB2)(4.78)
where kA and kB are the forward rate constants for enzymes A and B; σA1 = e20/KAs1;σA2 = c′/KAs2; πA1 = e21/KAp1; πA2 = c/KAp2; σB = e21/KBs; πB1 = e20/KBp1; andπB2 = g/KBp2. The expression for φ is given by the denominator of v21 divided bythe denominator of v20:
φ =
(1 + csσ2) αL0
(1 + cxξ2
1 + ξ2
)+ (1 + σ2)
(1 + csσ2) L0
(1 + cxξ2
1 + ξ2
)+ (1 + σ2)
(4.79)
Note therefore, that all ligands of enzyme 2 are effectively also ligands of enzymesA and B. We will consider the conditions that facilitate effective regulation of theflux of this system by feedforward and covalent activation using metabolic controlanalysis (MCA).
Metabolic control analysis
MCA [10, 11] is a theoretical framework that quantitatively relates the responses ofsteady-state variables such as fluxes or variable metabolite concentrations to a per-turbation in a system parameter such as the concentration of an enzyme, externalmetabolite, or effector. Any such systemic response is a combination of local effects(changes in the rates of individual enzymatic steps that are directly affected by theperturbation) and systemic effects (changes in steady-state fluxes or metabolite con-centrations caused by these rate changes in individual enzymatic steps). Local effectsare quantified by elasticity coefficients and systemic effects by control coefficients.
The elasticity coefficient is defined as
Stellenbosch University http://scholar.sun.ac.za
CHAPTER 4. INTERACTION OF ALLOSTERIC AND COVALENT MODIFICATION 109
εvisj =
∂ ln vi
∂ ln sj
∣∣∣∣∣sk,sl ,...,pq,pr,...
(4.80)
where vi is the rate of any step i in the system, sj is any particular variable speciesor parameter that directly affects the step, sk, sl, . . . are the other variable speciesthat directly affect the step, and pq, pr, . . . are the parameters of the step. Note thatall variables are set to their steady-state values. Although elasticities are defined interms of infinitesimal changes, they may be interpreted operationally as the percent-age change in the rate of a step resulting from a 1% change in the value of sj. Alter-natively, the elasticity coefficient is the slope of the graph of ln vi plotted against ln sj
at the steady-state value of sj.The control coefficient is defined as
Cyvi =
∂ ln y∂ ln vi
∣∣∣∣vj,vk,...
(4.81)
where vi is defined as before, vj, vk, . . . are the rates of all other steps in the system,and y is either a flux, in which case Cy
vi is a flux-control coefficient, or a steady-statemetabolite concentration, in which case it is a concentration-control coefficient. Thecontrol coefficient therefore quantifies the percentage change in a system variable(flux or steady-state concentration) that results from a 1% change in the rate of step i.
The systemic response of a flux or steady-state metabolite concentration y to aperturbation in any parameter pj is described by the response coefficient
Rypj =
∂ ln y∂ ln pj
∣∣∣∣∣pk,pl ,...
(4.82)
where pk, pl, . . . are all other system parameters, and the other symbols are definedas before. The central statement of MCA is that the response coefficient of a param-eter pj that affects a single step i can be partitioned as the product of the controlcoefficient, quantifying the systemic effect, and the elasticity coefficient, quantifyingthe local effect:
Rypj = Cy
vi εvipj (4.83)
More generally, if multiple steps are affected by a change in pj, the response coeffi-cient is given by:
Stellenbosch University http://scholar.sun.ac.za
CHAPTER 4. INTERACTION OF ALLOSTERIC AND COVALENT MODIFICATION 110
Rypj = ∑
iCy
vi εvipj (4.84)
= ∑i
iRypj (4.85)
where i is an element of the set of all enzymatic steps that are directly affected bya change in pj, and iRy
pj = Cyvi ε
vipj is the partial response coefficient, quantifying the
response of y to a change in pj through step i.
Modular control analysis
If a reaction network comprises two or more modules that are not connected bymass flow, a distinction can be made between integral or global control coefficients,describing the global control properties of the modular system, and intramodulecontrol coefficients, describing the control properties of a given module consideredin isolation [162]. The global control coefficient has the same definition (and is in factthe same measure) as the control coefficient in Eq. 4.81, but a different symbol, G, isused to distinguish it from the intramodule control coefficient:
Gyvi =
∂ ln y∂ ln vi
∣∣∣∣vj,vk,...
(4.86)
In contrast, the intramodule control coefficient is defined as
Cyvi =
∂ ln y∂ ln vi
∣∣∣∣vj,vk,...,yq,yr,...
(4.87)
where yq, yr, . . . are the variables of all other modules. The integral and intramodulecontrol coefficients have the same operational definition, i.e., it is the percentagechange in a steady-state variable that results from a one percent change in the ratevi, and differ only in scope.
Control analysis of the modular system in Fig. 4.8
The reaction network in Fig. 4.8 comprises two separate modules that are not con-nected by mass flow, namely, the main pathway from X through P (flux J1), and theinterconversion between states of enzyme 2 (flux J2). All the control coefficients ofthis system, and thus also the response coefficients, can be expressed in terms ofelasticities. In the present analysis, we are particularly interested in the flux-control
Stellenbosch University http://scholar.sun.ac.za
CHAPTER 4. INTERACTION OF ALLOSTERIC AND COVALENT MODIFICATION 111
coefficients quantifying the control of flux J1 with respect to the enzymes in the mainand cyclical pathways (see Appendix B.1 for the solution of all control coefficients).For the sake of clarity and brevity, we express the integral control coefficients interms of intramodule control coefficients where possible:
G J1v1 = 1− G J1
v2 (4.88)
G J1v2 =
C J1v2
1 + Csv2
Ce20vA∗εv2
e20
(εvB
s − εvAs) (4.89)
G J1vA = G J1
v2∗εv2
e20Ce20vA (4.90)
G J1vB = −G J1
vA (4.91)
where
Ce20vA =
[(εvB
e20 − εvBe21 ·
e20
e21
)−(
εvAe20 − εvA
e21 ·e20
e21
)]−1
(4.92)
C J1v1 =
εv2s
εv2s − εv1
s(4.93)
C J1v2 =
−εv1s
εv2s − εv1
s(4.94)
Csv2
=−1
εv2s − εv1
s(4.95)
∗εv2e20 = εv2
e20 − εv2e21 ·
e20
e21(4.96)
While it may seem unusual that εvAs and εvB
s are potentially non-zero, it should beremembered that all ligands of enzyme 2 are also indirect, but real, modifiers ofenzymes A and B (see Eqs. 4.77–4.79).
Conditions for effective feedforward and covalent activation
The conditions that will permit effective activation of flux J1 in response to an in-crease in concentration x are those that maximize the response coefficient RJ1
x . RJ1x
can be expressed as the sum of partial response coefficients, each of which quantifies
Stellenbosch University http://scholar.sun.ac.za
CHAPTER 4. INTERACTION OF ALLOSTERIC AND COVALENT MODIFICATION 112
the response of J1 to X through one of four routes, namely, as substrate of enzyme1, as feedforward activator of enzyme 2, as indirect inhibitor of A, and as indirectactivator of B:
RJ1x = 1RJ1
x + 2RJ1x + ARJ1
x + BRJ1x (4.97)
A partial response coefficient iRJjp is maximized when G
Jji and εi
p are maximized
(in absolute terms). If Jj is the flux of a linear pathway, the maximal value that GJji
can achieve is unity when enzyme i is in the same module as the flux Jj or any othervalue, including negative values, when enzyme i is not in the same module as fluxJj.
The partial response coefficient with respect to X through enzyme 1 is given by
1RJ1x = G J1
v1εv1x (4.98)
=(
1− G J1v2
)· εv1
x (4.99)
and the partial response coefficient with respect to X through enzyme 2 is given by
2RJ1x = G J1
v2εv2x (4.100)
=C J1
v2
1 + Csv2
Ce20vA∗εv2
e20
(εvB
s − εvAs) · εv2
x (4.101)
It is clear that G J1v1 can only be maximized at the cost of minimizing G J1
v2 , which wouldhowever also disregard any response elicited by the allosteric regulation of enzyme2. From a regulatory perspective, this represents an uninteresting scenario. Be-sides, as we shall see, 1RJ1
x is not necessarily maximized when G J1v1 is maximized.
We are therefore rather interested in the conditions that will maximize G J1v2 and εv2
x .From Eq. 4.89 it is clear that the maximum value of G J1
v2 tends to C J1v2 when the term
Csv2
Ce20vA∗εv2
e20
(εvB
s − εvAs), which will always have a positive value, is minimized. This
condition will also cause G J1v1 to approach its minimum, namely, C J1
v1 . Let us now, fora moment, suppose that Cs
v2Ce20
vA∗εv2
e20
(εvB
s − εvAs)= 0, so that G J1
v2 = C J1v2 and G J1
v1 = C J1v1 .
It follows that G J1v2 → 1 and G J1
v1 → 0 when∣∣εv1
s∣∣
∣∣εv2s∣∣. This condition is achieved
if enzyme 1 is near equilibrium (εv1s → −∞) or if enzyme 2 is saturated with its
substrate (εv2s = 0). These are of course the extreme cases and combinations of both
strategies will also suffice. Note, however, that when enzyme 1 is near equilibrium,
Stellenbosch University http://scholar.sun.ac.za
CHAPTER 4. INTERACTION OF ALLOSTERIC AND COVALENT MODIFICATION 113
|εv1s | ' |εv1
x |, so that, despite the vanishingly small value of C J1v1 , 1RJ1
x will be approxi-mately equal to εv2
s .As discussed by Hofmeyr et al. [16], saturation of enzyme 2 with its substrate
has important implications for the efficiency of the feedforward loop. In particular,saturation with S will not only cause εv2
s → 0, which is desirable, but will also affectεv2
x . Consider εv2x at saturating s (see Eq. B.39 in Appendix B.2):
limσ→∞
εv2x =
ckcsαiL0cxξ + ξ
ckcsαiL0(1 + cxξ) + (1 + ξ)− csαiL0cxξ + ξ
csαiL0(1 + cxξ) + (1 + ξ)(4.102)
It is clear that if X has no catalytic effect or, put differently, that if the T and R confor-mations exhibit the same maximal rate (ck=1) then εv2
x = 0. However, a difference inthe catalytic rates of the T and R conformation is not sufficient under all conditionsto ensure a non-zero value for εv2
x . In particular, if the binding affinities of the T and Rconformations for S differ sufficiently
(i.e. if cs 1
αi L0
), then the terms in Eq. 4.102
that contain cs become negligible so that εv2x again becomes zero. Our results there-
fore agree with those of Hofmeyr et al. [16], but with the added qualification that ifthe enzyme in question (enzyme 2 in our case) is an MWC-type enzyme saturatedwith substrate, then specific activation by X is not only insufficient to maximize εv2
x ,but will in fact let this value, and thus 2RJ1
x , approach zero when it is sufficientlystrong
(i.e. if cs 1
αi L0
). If enzyme 2 were oligomeric, εv2
x would increase with the
number of subunits, but even then a value for εv2x above 4 would be rarely encoun-
tered.The term Cs
v2Ce20
vA∗εv2
e20
(εvB
s − εvAs)
is minimized when either or all of its factorsare minimized. The value of
∣∣Csv2
∣∣ is minimized by the same conditions that max-imise C J1
2 . As is evident from Eq. 4.100 it is not desirable to minimize either ∗εv2e20 or∣∣Ce20
vA
∣∣, which will also minimize the absolute values of G J1vA and G J1
vB . Finally, the term(εvB
s − εvAs)
is minimized when S saturates enzyme 2, or if S binds equally well to theT and R conformation of enzyme 2 (Appendix B.2), in which case no specific acti-vation of enzyme 2 by X is observed. Note that in order to ensure a maximal valuefor G J1
v2 if cs 6= 1, then∣∣Cs
v2
∣∣ must have a sufficiently small value to compensate forthe large value of
∣∣Ce20vA∗εv2
e20
∣∣ that is necessary to maximize the response to X throughcovalent regulation.
The expression for ARJ1x is given by
Stellenbosch University http://scholar.sun.ac.za
CHAPTER 4. INTERACTION OF ALLOSTERIC AND COVALENT MODIFICATION 114
ARJ1x = G J1
vAεvAx
= G J1v2 · C
e20vA · ∗ε
v2e20 · ε
vAx (4.103)
We must therefore consider which conditions maximize the absolute values of thefour factors in Eq. 4.103. We have already considered G J1
v2 and saw that its maximumvalue, C J1
v2 , is increased when∣∣εv1
s∣∣
∣∣εv2s∣∣. However, if this condition is met by
virtue of saturating enzyme 2 with its substrate, then the effect on ∗εv2e20 and εvA
x mustalso be considered. At saturating S and if cs 1
αi L0the value of ∗εv2
e20 approacheszero (see Appendix B.2). This stems from the fact that all states of enzyme 2 exhibitidentical kinetics when s is saturating; interconversion between these states are thenof no consequence to the activity of enzyme 2. Similarly, if cs 1
αi L0then εvA
x = 0 (seeAppendix B.2). This is explained by considering that, given these conditions, bothforms of enzyme 2 are predominantly in the R conformation, so that an increase inX results in no significant further transition to the R form.∣∣Ce20
vA
∣∣ is maximized when its denominator(
εvBe20 − εvB
e21 · e20e21
)−(
εvAe20 − εvA
e21 · e20e21
)is
minimized in absolute terms. If the reactions catalysed by A and B are consideredinsensitive to their products and operate far from equilibrium, then εvB
e20 = 0 andεvA
e21 = 0, so that Ce20vA simplifies to (see Appendix B.2):
Ce20vA =
[−εvB
e21 ·e20
e21− εvA
e20
]−1
(4.104)
=
[(σB1
1 + σB1− 1)· e20
e21+
(σA1
1 + σA1− 1)]−1
(4.105)
Thus we see that if both A and B are saturated with their respective substrates,i.e., if σB1 → ∞ and σB1 → ∞, then Ce20
vA → −∞. This condition is equivalent towhat has been termed zero-order ultrasensitivity by Goldbeter & Koshland [163] andformulated in terms of MCA by Small & Fell [164]. Complete saturation is of coursenot necessary and will in reality not necessarily be observed because of the presenceof competitive inhibitors such as the products of A and B.
The value of ARJ1x is therefore maximized if S saturates enzyme 2, but binds
equally well to both the T and R conformations (cs = 1). Alternatively, enzyme 1should be near equilibrium. Interestingly, as long as X binds with different affinitiesto the T and R conformations, the absence of specific activation (cs = 1) and catalytic
Stellenbosch University http://scholar.sun.ac.za
CHAPTER 4. INTERACTION OF ALLOSTERIC AND COVALENT MODIFICATION 115
activation (ck = 1) of enzyme 2 by X, will not result in a zero value for εvAx . This re-
sults from the fact that only a conformational change (cx 6= 1) is required for enzymeA to be sensitive to X. For this sensitivity to be relayed to flux J1, however, some formof activation is required, preferably catalytic activation. In addition, both A and Bshould exhibit reasonable substrate occupation. Since G J1
vA = −G J1vB and εvA
x = −εvBx
the same conditions that maximize ARJ1x will also maximize BRJ1
x = G J1vBεvB
x .In summary then, the conditions that maximize RJ1
x are those that
• satisfy∣∣εv2
s∣∣
∣∣εv1s∣∣
– i.e., enzyme 1 should be near equilibrium or enzyme 2 should be satu-rated with substrate, with the condition that if the latter is the case, thenX should be a catalytic rather than specific activator of enzyme 2
• minimize(εvB
s − εvAs)
– i.e., enzyme 2 should be saturated with substrate, or X must not be a spe-cific activator of enzyme 2
• maximize ∗εv2e20
– i.e., the different forms of enzyme 2 must not have identical kinetics. Thiscondition is automatically met by our initial assumption that covalentmodification alters L0 by a factor of α. However, as we have seen, if Xis a specific activator of enzyme 2 and if enzyme 2 is saturated with sub-strate, this condition is no longer necessarily met.
• maximize∣∣Ce20
vA
∣∣
– i.e., enzymes A and B must exhibit near zero-order sensitivity towards itssubstrate and operate far from equilibrium
We have of course chosen X and S to be catalytic effectors of enzymes A and B.This choice was, however, mandated by the fact that we chose α 6= 1. We excludedany specific effects in the interest of simplicity and because they are not mandatedby choosing α 6= 1. We don’t expect the conditions identified here to change signifi-cantly if these effects were included. We also expect similar conditions to maximizeRJ1
x if enzyme 2 were an oligomeric enzyme.
Stellenbosch University http://scholar.sun.ac.za
CHAPTER 4. INTERACTION OF ALLOSTERIC AND COVALENT MODIFICATION 116
Feedforward activation and covalent modification contribute
synergistically to the flux response with respect to X
In the previous section we have stated that the contribution of X through each of fourmechanisms (as initial substrate, feedforward activator, inhibitor of A, and activatorof B) towards the flux is quantified by the partial response coefficients as in Eq. 4.97.If then, for instance, 2RJ1
x is larger than ARJ1x , it can be said that X increases the flux
more through the feedforward loop than by inhibiting A. Although this is certainlythe case, we will here show that the contribution through the feedforward loop orthe contribution through inhibition of enzymes A or B, if quantified in isolation, isan underestimation of the true contribution that is observed when both mechanismsare present. Consider the following four variations on the system in Fig. 4.8:
• FF+COV: both the feedforward loop and covalent modification are present
• FF: only the feedforward loop is present
• COV: only covalent modification is present
• NONE: neither the feedback loop nor covalent modification is present
In FF covalent modification is removed, or more precisely, its effect on the kineticsof enzyme 2 is abolished, by setting α = 1. This has the side-effect that εvA
x = 0 andεvB
x = 0, so that Eq. 4.97 simplifies to
RJ1x = 1RJ1
x + 2RJ1x
= C J1v1εv1
x + C J1v2εv2
x (4.106)
Note however that εv2x is also affected since all the states of enzyme 2 now have
identical kinetics, i.e., that of the unmodified state:
εv2x = ∑
i
v2i
v2ε
v2ix (4.107)
= εv20x ∑
i
v2i
v2(since αi = 1 for all i) (4.108)
= εv20x (4.109)
Stellenbosch University http://scholar.sun.ac.za
CHAPTER 4. INTERACTION OF ALLOSTERIC AND COVALENT MODIFICATION 117
Since covalent modification was chosen as inhibitory and allosteric modification waschosen as activatory, the value of εv2
x decreases when covalent modification is abol-ished.
Alternatively, in COV the feedforward loop is removed by letting Kr2x and Kt2x
approach infinity or by setting Kr2x = Kt2x. This has the result that εv2x = 0, but
importantly εvAx and εvB
x again also become zero. Equation 4.97 then simplifies to
RJ1x = 1RJ1
x
= C J1v1εv1
x (4.110)
Finally, in NONE both the feedforward loop and covalent modification are re-moved, yielding the same expression for RJ1
x as COV (Eq. 4.110).In summary, the presence of covalent modification not only increases RJ1
x by in-creasing 2RJ1
x (through εv2x ), but also results in two additional terms (ARJ1
x and BRJ1x )
in the expression for RJ1x , leading to a further increase in flux response. However,
the presence of the feedforward loop is a prerequisite for these two additional termsto be non-zero. We therefore see that the contributions of the feedforward loop andcovalent modification towards the flux response with respect to X cannot be quanti-fied in isolation; the contribution of both these mechanisms depends on whether theother is present. This finding is of consequence if one wishes to determine the rela-tive importance of allosteric and covalent modification. By abolishing one of thesemechanisms by, for instance, mutation, the response through the other is likely to beunderestimated (Fig. 4.9).
4.5 Discussion
The results of the previous two chapters, namely that the kinetics of GS can be de-scribed by an MWC-type model in which both allosteric and covalent regulationelicit their effects by altering the apparent equilibrium between an inactive T andactive R conformation, led us to develop a formal treatment of the interaction be-tween allosteric and covalent regulation. Although the MWC model is the standardtextbook model of GS regulation, we believe its implications have not been fully ap-preciated, nor has it, to our knowledge, been employed in an actual treatment ofGS kinetics. In this chapter we set out to formalize the implications of interactionbetween allosteric and covalent modification in a manner independent of whether
Stellenbosch University http://scholar.sun.ac.za
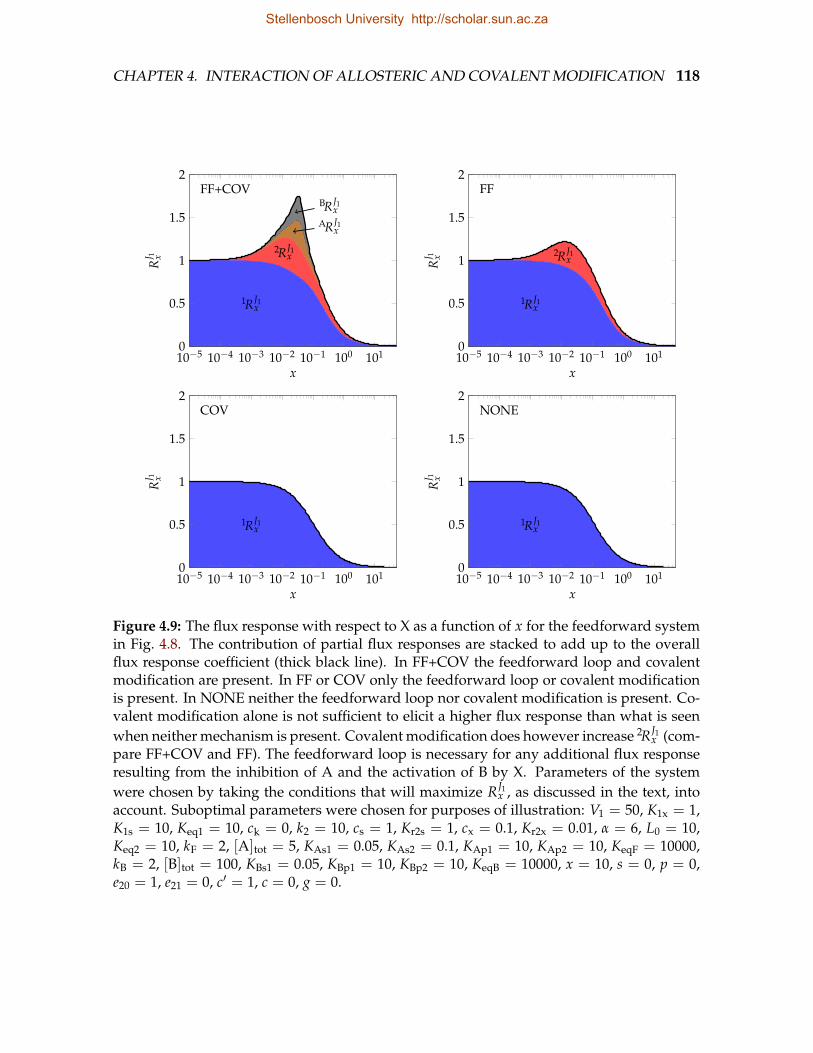
CHAPTER 4. INTERACTION OF ALLOSTERIC AND COVALENT MODIFICATION 118
10−5 10−4 10−3 10−2 10−1 100 1010
0.5
1
1.5
2
x
RJ 1 x
FF+COV
1RJ1x
2RJ1x
ARJ1x
BRJ1x
10−5 10−4 10−3 10−2 10−1 100 1010
0.5
1
1.5
2
x
RJ 1 x
FF
1RJ1x
2RJ1x
10−5 10−4 10−3 10−2 10−1 100 1010
0.5
1
1.5
2
x
RJ 1 x
COV
1RJ1x
10−5 10−4 10−3 10−2 10−1 100 1010
0.5
1
1.5
2
x
RJ 1 x
NONE
1RJ1x
Figure 4.9: The flux response with respect to X as a function of x for the feedforward systemin Fig. 4.8. The contribution of partial flux responses are stacked to add up to the overallflux response coefficient (thick black line). In FF+COV the feedforward loop and covalentmodification are present. In FF or COV only the feedforward loop or covalent modificationis present. In NONE neither the feedforward loop nor covalent modification is present. Co-valent modification alone is not sufficient to elicit a higher flux response than what is seenwhen neither mechanism is present. Covalent modification does however increase 2RJ1
x (com-pare FF+COV and FF). The feedforward loop is necessary for any additional flux responseresulting from the inhibition of A and the activation of B by X. Parameters of the systemwere chosen by taking the conditions that will maximize RJ1
x , as discussed in the text, intoaccount. Suboptimal parameters were chosen for purposes of illustration: V1 = 50, K1x = 1,K1s = 10, Keq1 = 10, ck = 0, k2 = 10, cs = 1, Kr2s = 1, cx = 0.1, Kr2x = 0.01, α = 6, L0 = 10,Keq2 = 10, kF = 2, [A]tot = 5, KAs1 = 0.05, KAs2 = 0.1, KAp1 = 10, KAp2 = 10, KeqF = 10000,kB = 2, [B]tot = 100, KBs1 = 0.05, KBp1 = 10, KBp2 = 10, KeqB = 10000, x = 10, s = 0, p = 0,e20 = 1, e21 = 0, c′ = 1, c = 0, g = 0.
Stellenbosch University http://scholar.sun.ac.za
CHAPTER 4. INTERACTION OF ALLOSTERIC AND COVALENT MODIFICATION 119
the modification results in activation or inhibition and independent of the type ofcovalent modification, e.g., phosphorylation. We showed that when covalent and al-losteric modification act with opposing effects on an enzyme, covalent modificationwill inhibit the binding of allosteric modifiers, and conversely an allosteric modifierwill inhibit covalent modification of the enzyme. In contrast, covalent modifica-tion will, within a certain range, enhance the binding cooperativity of an allostericenzyme; whereas an allosteric modifier will enhance cooperativity with respect tocovalent modification.
The effect of covalent modification on allosteric modification is, to a certain ex-tent, already contained in the classic MWC equation, where it can be considered asan explicit change to the value of L0. The effect of allosteric modification on covalentmodification (over and above the apparent change to L0), on the other hand, mustbe described in additional rate equations, i.e., the rate equations of forward and re-verse covalent modification. We derived expressions for the modification terms thatmust be included in such rate equations. Two findings in this regard are of note.First, if covalent modification alters L0, then the forward or reverse rate constants ofthe enzyme that catalyses the covalent modification must be multiplied by a mod-ification term. Second, if the enzyme that catalyses the covalent modification hasdifferent affinities for the two conformations of its substrate, then its Michaelis con-stants must also be multiplied by modification terms. If, on the other hand, covalentmodification does not alter L0, then all modification terms, including those that mod-ify the Michaelis constants, disappear. It has been shown in a number of cases thatthe ligands of an enzyme affect the Vmax and/or Michaelis constants of kinases orphosphatases that phosphorylate and dephosphorylate the enzyme (see for instance[146, 165–168]), but to our knowledge a mechanism that formally explains this phe-nomenon has not been developed. We derived general rate equations containingthe necessary modification terms for forward and reverse covalent modification ofMWC-type enzymes.
We applied the findings to a minimal feedforward system in which the allosteri-cally regulated enzyme is also modified covalently. We limited the allosteric effect toactivation and the covalent effect to inhibition in an effort to mimic the mammalianmuscle glycogen synthesis pathway. It is, however, conceivable that similar resultswill be obtained for feedback inhibition systems. A plausible system to study inthis regard would be the feedback system in which glucose-6-phosphate (G6P) in-hibits glycogen phosphorylase (GP), an enzyme activated by phosphorylation. In
Stellenbosch University http://scholar.sun.ac.za
CHAPTER 4. INTERACTION OF ALLOSTERIC AND COVALENT MODIFICATION 120
agreement with the earlier findings of Hofmeyr et al. [16], we showed that the fluxresponse with respect to the feedforward modifier X, as mediated through the feed-forward loop, is maximized if the regulated enzyme is saturated with its immediatesubstrate S, but that under these conditions activation by X will only be effective ifit enhances the catalytic rate, as opposed to the substrate affinity, of the regulatedenzyme. In addition, however, we showed that not only is specific activation in-sufficient to elicit a flux response with respect to X (due to the fact that the enzymeis already saturated with its substrate), but also that it is detrimental to such a re-sponse (due to the fact that sufficiently strong specific activation causes all of theenzyme to be present in the R conformation, abolishing any further conversion tothe R conformation, and thus activation, by X).
We also studied the conditions that maximize the response of the system flux tothe indirect activation and inhibition of the forward and reverse covalent modifi-cation reactions by X. Since both these responses are scaled by G J1
v2 , the same con-ditions that maximize the flux control of enzyme 2 (εv2
s → 0) are expected to alsomaximize these responses. Here it is, in one respect, of little consequence whether Xis a catalytic or specific activator of the regulated enzyme; instead, what is at stakeis whether X brings about a significant increase of enzyme in the R conformationrelative to enzyme in the T conformation. However, since in the MWC model suchconformational change always goes hand in hand with differential ligand affinities,it is of consequence whether substrate binding favours the R conformation over theT conformation, i.e., whether cs < 1. If the regulated enzyme is saturated withits substrate and if the substrate’s preference for the R conformation is sufficientlystrong, then X will not be able to bring about any further conformational change,so that the absolute values of G J1
vA , G J1vB , εvA
x , and εvBx are minimized. More generally,
any ligand or covalently bonded group that favours the same conformation as X toa sufficiently strong degree will minimize the flux response with respect to X. Weemphasize the role of substrate S only because saturation with S is one conditionthat will maximize G J1
v2 .Overall, these results indicate that in order to maximize the flux response with
respect to the allosteric modifier in a feedforward activation system in which theregulated enzyme exhibits MWC kinetics and is potentially inhibited by covalentmodification, it is expected that the allosteric modifier should activate the regulatedenzyme by means of increasing its apparent maximal catalytic rate and not by meansof increasing its affinity for its immediate substrate. In fact, the presence of specific
Stellenbosch University http://scholar.sun.ac.za
CHAPTER 4. INTERACTION OF ALLOSTERIC AND COVALENT MODIFICATION 121
activation, which implies conformational change upon substrate binding, will de-crease the flux response with respect to the allosteric modifier. Incidentally, theseconditions are in good agreement with the GS kinetic parameters determined in theprevious chapter. The optimized GS kinetic parameters indicate that the feedfor-ward modifier G6P activates GS by increasing its maximal catalytic rate, but that inthe absence of ATP the substrate UDP-glucose (UDPG) binds with equal affinity tothe T and R conformations.
Covalent inhibition increases the flux response with respect to the allosteric mod-ifier. This increase is the result of two distinct but related mechanisms. First, the ap-parent L0 increases with the degree of covalent modification, which in turn increasesthe value of εv2
x and thus 2RJ1x , the response elicited as a result of the feedforward loop.
Second, net covalent modification is inhibited by the allosteric modifier, resulting ina sharper increase in flux, i.e., a larger response coefficient, with respect to changesin x than is expected if only the feedforward loop were present. We thus see thatfeedforward activation and covalent inhibition increase the flux response with re-spect to X synergistically: covalent inhibition enhances the response elicited by thefeedforward loop, and the feedforward loop is a prerequisite for the response to in-crease due to covalent inhibition. This situation illustrates that the response withrespect to X elicited by either of these mechanisms quantified in isolation, does notreflect the response observed when both mechanisms are active.
The present treatment can be considered a combination and extension of the ear-lier treatments by Small & Fell [164] and Hofmeyr et al. [16]. Small & Fell [164] in-vestigated the conditions that will maximize the response of steady-state variables inresponse to modifiers that affect the enzymes in a monocyclic covalent modificationcycle. Hofmeyr et al. [16], on the other hand, investigated the conditions required formaximal efficiency of feedforward activation loops in which an allosteric enzyme isactivated by a substrate precursor in the pathway. While Small & Fell [164] wereonly concerned with covalent modification and Hofmeyr et al. [16] were only con-cerned with allosteric modification, our results show that the allosteric modifiers ofan enzyme must also act as modifiers of the enzymes that catalyse its covalent modi-fication, particularly when the modified enzyme exhibits MWC-type kinetics. Apartfrom the addition of allosteric modification, the present treatment differs from thatof Small & Fell [164] in a number of respects. First, the modification terms in the rateequations for the enzymes catalysing the interconversion of enzyme 2 are not arbi-trary but are governed by the kinetics of enzyme 2. Second, all ligands of enzyme 2
Stellenbosch University http://scholar.sun.ac.za
CHAPTER 4. INTERACTION OF ALLOSTERIC AND COVALENT MODIFICATION 122
are, and must be, considered effectors of the enzymes catalysing the interconversionof enzyme 2. Third, both covalent states of enzyme 2 are considered active. Fourth,by implication, all effectors have equal but opposite effects on the forward and re-verse covalent modification enzymes. We show that, apart from the requirementfor zero-order sensitivity, the same conditions that maximize the response of an en-zyme to its activator will also maximize the flux response to these ligands throughactivation and inhibition of the enzymes in the covalent modification cascade.
It appears that, in the system considered here, the function of both the feedfor-ward loop and covalent modification is to increase the response of the pathway fluxto metabolite X. If this system were to be included in a larger pathway, one couldconsider the flux response coefficient RJ1
x as the elasticity of the subsystem rate withrespect to changes in x. Since high elasticities generally indicate low flux control,we conclude that the regulatory mechanisms in this pathway do not function toregulate the flux through the pathway, but to maintain the concentration of metab-olite X within narrow bounds. These findings have implications for the regulationof glycogen synthesis. GS is often cited as the flux-controlling enzyme of glycogensynthesis (see for instance [34, 51, 109, 127, 146, 169]). While this is almost certainlytrue if one considers glycogen synthesis in isolation, i.e., excluding glucose uptakeand glycolysis, the results of this chapter suggest that in muscle glycogen metabo-lism as a whole the regulation of GS, whether by allosteric or covalent modification,functions to maintain intracellular concentrations of G6P within a narrow range andnot to control the flux. Glycogen synthesis is of course much more complicated thanthe simple system considered here. First, in addition to activation by G6P, GS is alsoinhibited by ATP. Second, GS is inhibited by phosphorylation at multiple sites persubunit. Third, GS phosphorylation and the influx of glucose into muscle cells areregulated by endocrine and other stimuli. We are now in a position to construct adetailed model of glycogen metabolism and to analyse the regulatory design of thiscomplicated metabolic system.
Stellenbosch University http://scholar.sun.ac.za
Chapter 5
Modelling glycogen metabolism inmammalian skeletal muscle
5.1 Introduction
Up to this point we have considered the kinetics of glycogen synthase (GS) in detailand developed a rate equation that is able to describe these kinetics as altered by al-losteric and covalent modification. We considered the theoretical implications of thedeveloped GS rate equation in a generic minimal model of feedforward activationthat resembles the glycogen synthesis pathway. We are now in a position to inquireinto the regulatory design of skeletal muscle glycogen metabolism using full-scaledetailed kinetic models.
A model of mammalian skeletal muscle glycogen metabolism is by its very na-ture not expected to resemble quantitatively the skeletal glycogen metabolism ofany mammal in particular. Moreover, skeletal muscle is a heterogeneous tissue thatcomprises fibre types that have traditionally been classified as either oxidative fast-twitch or glycolytic slow-twitch fibres [170]. Four major fibre types are now distin-guished according to the fibre’s speed of contraction and resistance to fatigue [170].This classification can be further refined to many additional minor fibre types basedon, amongst other factors, the isoform of myosin expressed in the fibre. By defi-nition, these fibre types differ widely in terms of metabolism, further complicatingattempts to model muscle metabolism. For the most part, the experimental data usedto construct our models of glycogen metabolism were obtained from published stud-ies using enzymes purified from rodent muscle extracts. Our model results shouldtherefore more closely resemble non-oxidative fast-twitch muscle, the predominant
123
Stellenbosch University http://scholar.sun.ac.za
CHAPTER 5. MODELLING SKELETAL MUSCLE GLYCOGEN METABOLISM 124
fibre type in rodent muscle. In addition to the difficulty in confining our models toa specific species and muscle fibre type, it is also subject to the usual critique lev-elled against the treatment of metabolic systems as well-stirred reactors in whichmetabolites are present at much larger concentrations than enzymes [171]. Thesecriticisms may be even more relevant when considering the highly structured na-ture of muscle [171] and the fact that protein kinases and phosphatases are presentat concentrations comparable to their protein substrates. In spite of these difficulties,we demonstrate (see Chapter 6) that the models presented here provide reasonablequantitative descriptions of published experimental results.
Perhaps the greatest difficulty encountered when constructing a model is its pa-rametrization. Parameter values reported in the literature are often of poor quality.Reasons for this poor quality range from fitting parameters to linear transformationsthat inflate error, through erroneously treating sigmoidal kinetics as hyperbolic ki-netics, to determining bi-substrate parameters at non-saturating concentrations ofthe co-substrate. Most important, however, is the fact that enzymes are often as-sayed not under the conditions prevailing in the cell but at which they operate op-timally. In a more robust, but time-consuming, approach one would experimentallydetermine the kinetics of all model enzymes at conditions prevailing in the cell typein question [172]. Such a treatment was not within the scope of the current project.Where necessary, however, we redetermined kinetic parameters from published ex-perimental data using non-linear regression. However, parametrized models are notthe only models that are useful. The structure and regulatory features of a metabolicsystem on its own, informed by how one would model it, provide a frameworkwithin which experimental results can be interpreted.
In a kinetic model the time derivatives of metabolite concentrations are describedin terms of reaction stoichiometry and the rates of reactions that produce or consumethe metabolite in question, together constituting a system of ordinary differentialequations. It is therefore necessary to obtain rate equations for all enzymatic rates,transport processes, and mass-action reactions. All enzymatic and transport rateswere described with reversible rate equations of the form [173]
v = VfK(s, p, x, . . . )(
s− pKeq
)(5.1)
where Vf is the maximal forward rate; K(s, p, x...) is a positive binding function ofsubstrates s, products p, and modifiers x; and Keq is the equilibrium constant. Thisform does not contain the maximal velocity of the reverse reaction (Vr), which is
Stellenbosch University http://scholar.sun.ac.za
CHAPTER 5. MODELLING SKELETAL MUSCLE GLYCOGEN METABOLISM 125
seldom determined experimentally, and ensures thermodynamic consistency by ex-plicitly including the Keq. An exception in this regard are the rate equations of GSand glycogen phosphorylase (GP) which were modelled as irreversible reactions.
In what follows, basic knowledge of enzyme kinetics is assumed. Kinetic param-eters, such as the Michaelis constant, will not be defined for each reaction. The pa-rameter naming scheme roughly follows the format Pc,E,M, where P is any parameterfurther qualified by the subscript c. E and M denote the enzyme or process and me-tabolite or species to which the parameter pertains. Ki,HK,ADP is then the Michaelisconstant that describes inhibitory binding of ADP to hexokinase (HK). For the sakeof readability, where it is clear from the context, subscripts and commas are omitted.Unless stated otherwise, identical symbols in different equations do not denote thesame parameters.
Although great care was taken to include all the relevant reactions and the mod-ifiers that affect these reactions, our main goal was to investigate the regulatorydesign of glycogen metabolism. As such we did not include reactions that wouldcomplicate the models unnecessarily without providing more insight in this regard.
In what follows, we first give an overview of glycogen metabolism as a basisfor our choice of included reactions and their rate equations. We consider glycogenmetabolism as a system that comprises several individual metabolic modules, withan emphasis on glycogen synthesis. Finally, we combine these modules in severalmodels, of varying scope, of glycogen metabolism, and briefly discuss the softwareused in this process.
5.2 Glycogen metabolism
Glucose uptake and GLUT4 trafficking
Glucose is imported into muscle from the interstitial tissue by means of facilitatedtransport. Two transmembrane glucose transporters, glucose transporter 1 (GLUT1)and glucose transporter 4 (GLUT4), are present in muscle [174]. GLUT1, which isconstitutively located in the sarcolemma [175, 176], is present at about 10 to 60% thelevels of GLUT4 [174]. Under basal conditions, however, only about 5% of GLUT4is located in the sarcolemma or in T-tubules, deep invaginations in the sarcolemma[177, 178]. It has been suggested that GLUT1 could contribute significantly to basalglucose uptake, but there is no conclusive evidence for this [174]. The majority
Stellenbosch University http://scholar.sun.ac.za
CHAPTER 5. MODELLING SKELETAL MUSCLE GLYCOGEN METABOLISM 126
of GLUT4 is located in intracellular vesicles cycling between as many as 11 dis-tinct cytosolic pools, involving GLUT4-storage vesicles, endosomes, the trans-Golginetwork, and numerous protein complexes [178]. Insulin stimulation and exerciseresult in rapid translocation of cytosolic GLUT4 to the sarcolemma and T-tubules.Insulin stimulation increases plasma membrane GLUT4 to 40–50% of total GLUT4[177]. Under these conditions GLUT4 accounts for the majority of glucose uptake[174]. Insulin regulates GLUT4 trafficking through the insulin-PI3K-Akt axis [179].In this axis insulin binds to the insulin receptor resulting in the activation of insulinreceptor kinase which phosphorylates insulin receptor substrate proteins. Theserecruit PI3-kinase (or PI3K), which converts phosphatidylinositol(4,5)P2 to phos-phatidyl(3,4,5)P3 (or PIP3). PIP3 indirectly activates protein kinase B (Akt2), whichin turn phosphorylates various substrates leading to the recruitment of GLUT4 to theplasma membrane. While the molecular mechanism has not been fully elucidated,it is thought that the net increase in cell surface GLUT4 is the result of increasedexocytosis and not the result of decreased endocytosis [180].
In spite of the complexity of GLUT4 trafficking and the insulin-PI3K-Akt axis,we modelled insulin stimulation of exocytosis by including a hyperbolic catalyticactivation term in the GLUT4 rate equation (Eq. 5.3).
In terms of glucose transport kinetics GLUT1 is probably the best-studied glu-cose transporter. Interest in GLUT1 kinetics arose from the observed 10-fold lowerVmax and Km for entry into a glucose-free cell (zero-trans entry) than the correspond-ing parameters for exit into a glucose free medium (zero-trans exit) [181]. Moreover,the Km for entry is higher when determined from equilibrium exchange experiments(the glucose concentration is varied inside and outside but kept equal; labelled glu-cose is initially absent on the inside) than from zero-trans experiments or infinite-trans experiments (internal glucose is saturating while external glucose is varied)[182]. GLUT1 asymmetry has been challenged by observations that the asymmetryis reduced or absent when working with ghost cells (erythrocytes of which the cy-tosol is replaced with medium) or inside-out vesicles, suggesting that asymmetryresults from interaction of cytosolic factors with the intracellular epitopes of GLUT1[183]. It has indeed been shown that ATP inhibits GLUT1 and brings about asym-metry [184]. Others [182] have also argued that GLUT1 asymmetry is overestimateddue to experimental difficulties, favouring the position that GLUT1 is intrinsicallysymmetric. As a further argument against GLUT1 asymmetry, it has been shownthat the mobile carrier model, one of two models commonly used to describe trans-
Stellenbosch University http://scholar.sun.ac.za
CHAPTER 5. MODELLING SKELETAL MUSCLE GLYCOGEN METABOLISM 127
porter kinetics [181], when adapted for asymmetry, is thermodynamically unsound[185]. This finding does, however, not completely rule out asymmetry, which canstill be accounted for by a fixed site model [185]. Although GLUT1 assymetry hasbeen observed in human erythrocytes, it has not been observed in rat and rabbiterythrocytes, nor in rat adipocytes and CHO fibroblasts [182]. In contrast, it is well-established that GLUT4 glucose transport is symmetric [186].
We modelled the transport of glucose into the muscle cell (Glco Glci) byGLUT1 and GLUT4 with reversible Michaelis-Menten equations in which symmet-ric glucose binding was assumed. As discussed, an insulin activation term was in-cluded in the GLUT4 equation.
vGLUT1 =
kcat[GLUT1]KGlc
([Glco]−
[Glci]
Keq
)
1 +[Glco]
KGlc+
[Glci]
KGlc
(5.2)
vGLUT4 =
kcat[GLUT4mem]
KGlc
([Glco]−
[Glci]
Keq
)
1 +[Glco]
KGlc+
[Glci]
KGlc
×[Ins]
EC50Ins
1 +[Ins]
EC50Ins
(5.3)
The rate equation for total glucose transport is given by
vGLUT = vGLUT1 + vGLUT4 (5.4)
Since the equilibrium constant for transport of glucose across the sarcolemmais equal to one, net import of glucose by GLUT1 and GLUT4 is only possible inthe presence of a glucose concentration gradient. This gradient is maintained byhexokinase which phosphorylates glucose to glucose-6-phosphate (G6P) upon en-try into the cell. Two isoforms of hexokinase, hexokinase 1 (HK1) and hexokinase 2(HK2), are present in muscle. HK2 is the predominant form in rat muscle, whereasin human muscle, based on the percentage contribution to total hexokinase activ-ity (70–75%), HK1 is the predominant form [187]. The majority of HK1 (95%) andHK2 (72%) is recovered in a particulate fraction during extraction [187]. It has beenshown that insulin stimulation leads to the translocation of HK2, but not HK1, tothe particulate fraction within 30 minutes of treatment with no apparent increasein total HK2 protein [188]. Two hours after treatment, an increase in HK2 mRNAand protein is observed, with an increase in soluble fraction HK2 [189]. No increasein HK1 protein is observed. As reviewed in [190], HK1 readily associates with the
Stellenbosch University http://scholar.sun.ac.za
CHAPTER 5. MODELLING SKELETAL MUSCLE GLYCOGEN METABOLISM 128
mitochondrial membrane protein, porin, possibly explaining its recovery in the par-ticulate fraction. This association is mediated by a targeting hydrophobic regionnear the N-terminal of HK1 that is also present in HK2. It has been postulated thatassociation with the mitochondrion provides ‘privileged’ access to ATP producedduring oxidative phosphorylation. It has also been shown that the Km for ATP islowered and that G6P inhibition is reduced [191]. Whether these are real changes tohexokinase kinetics or simply the result of an increased apparent ATP concentrationis not known.
It is thought that HK1 and HK2, both monomeric 100 kDa proteins, are the prod-ucts of gene duplication and fusion of an ancestral gene coding for a 50 kDa protein[190]. This position is supported by a high degree of amino acid sequence similar-ity between the N-terminal and C-terminal halves, and between these halves and50 kDa hexokinases such as hexokinase 4 (often denoted glucokinase). Only the C-terminal half of HK1 has a functional catalytic site, but the N-terminal half is stillable to bind G6P and ATP [192]. In contrast, catalytic activity is retained in both theC-terminal and N-terminal halves of HK2 [193, 194]. It has also been shown thatbinding of glucose to the N-terminal half increases the affinity for G6P of the C-half,which is otherwise higher than that of the N-half [195]. When expressed as discreteproteins, the C-half of HK1 [192] and the C- and N-halves of HK2 [193] are inhibitedby G6P. The extent to which binding of G6P to one domain inhibits the other is notclear.
In our treatment of HK kinetics we have assumed that any interaction betweenthe C- and N-terminal domains is already contained in the apparent kinetic param-eters of bi-substrate rate equations and have therefore not included any explicitinteraction between these domains. Glucose phosphorylation by HK1 and HK2(Glci + ATP G6P + ADP) was modelled with the reversible bi-substrate Michaelis-Menten equation with random binding order. Since G6P also binds to the adenylatesite and ADP also binds to the sugar site [196], additional competive inhibition termsfor these ligands were included. Translocation to mitochondria and the possible ac-companying change in kinetics were not considered. The identical rate equations forHK1 and HK2 are given by
vHK1 =
Vmax
KGlciKATP
([Glci][ATP]− [G6P][ADP]
Keq
)
(1 +
[Glci]
KGlci
+[G6P]KG6P
+[ADP]K′ADP
)(1 +
[ATP]KATP
+[ADP]KADP
+[G6P]K′G6P
) (5.5)
Stellenbosch University http://scholar.sun.ac.za
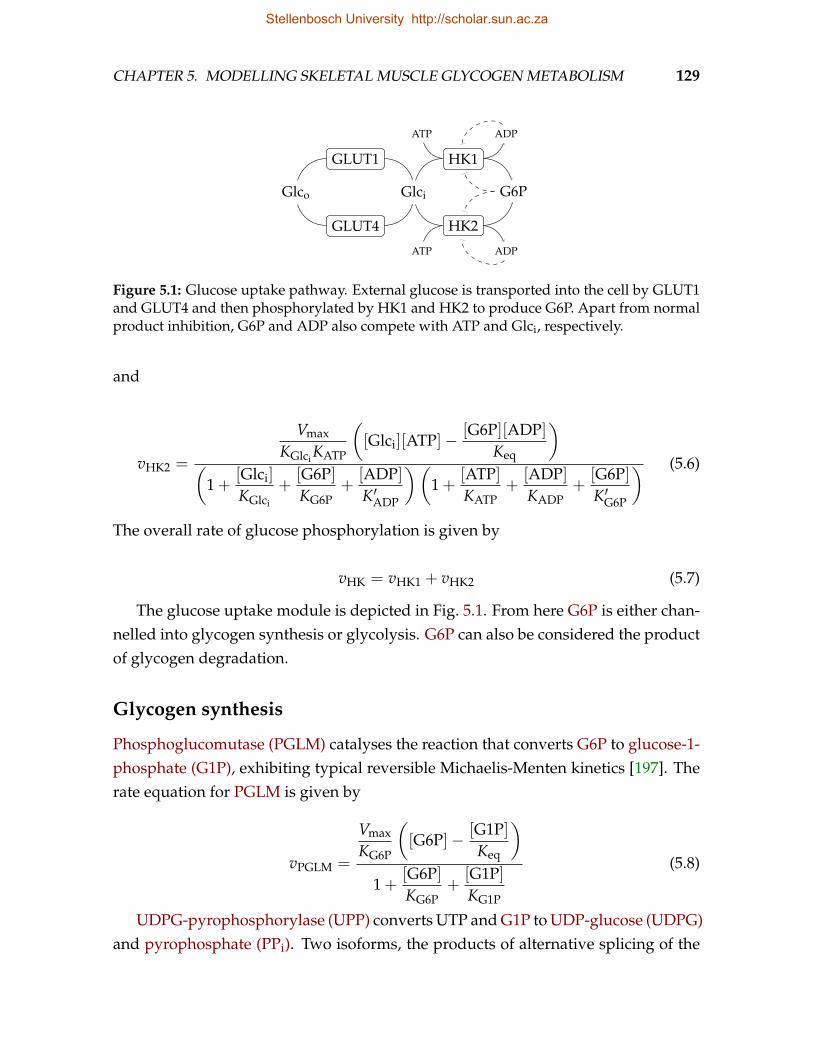
CHAPTER 5. MODELLING SKELETAL MUSCLE GLYCOGEN METABOLISM 129
Glco
GLUT1
GLUT4
Glci
HK1
HK2
G6P
ATP
ATP
ADP
ADP
Figure 5.1: Glucose uptake pathway. External glucose is transported into the cell by GLUT1and GLUT4 and then phosphorylated by HK1 and HK2 to produce G6P. Apart from normalproduct inhibition, G6P and ADP also compete with ATP and Glci, respectively.
and
vHK2 =
Vmax
KGlciKATP
([Glci][ATP]− [G6P][ADP]
Keq
)
(1 +
[Glci]
KGlci
+[G6P]KG6P
+[ADP]K′ADP
)(1 +
[ATP]KATP
+[ADP]KADP
+[G6P]K′G6P
) (5.6)
The overall rate of glucose phosphorylation is given by
vHK = vHK1 + vHK2 (5.7)
The glucose uptake module is depicted in Fig. 5.1. From here G6P is either chan-nelled into glycogen synthesis or glycolysis. G6P can also be considered the productof glycogen degradation.
Glycogen synthesis
Phosphoglucomutase (PGLM) catalyses the reaction that converts G6P to glucose-1-phosphate (G1P), exhibiting typical reversible Michaelis-Menten kinetics [197]. Therate equation for PGLM is given by
vPGLM =
Vmax
KG6P
([G6P]− [G1P]
Keq
)
1 +[G6P]KG6P
+[G1P]KG1P
(5.8)
UDPG-pyrophosphorylase (UPP) converts UTP and G1P to UDP-glucose (UDPG)and pyrophosphate (PPi). Two isoforms, the products of alternative splicing of the
Stellenbosch University http://scholar.sun.ac.za
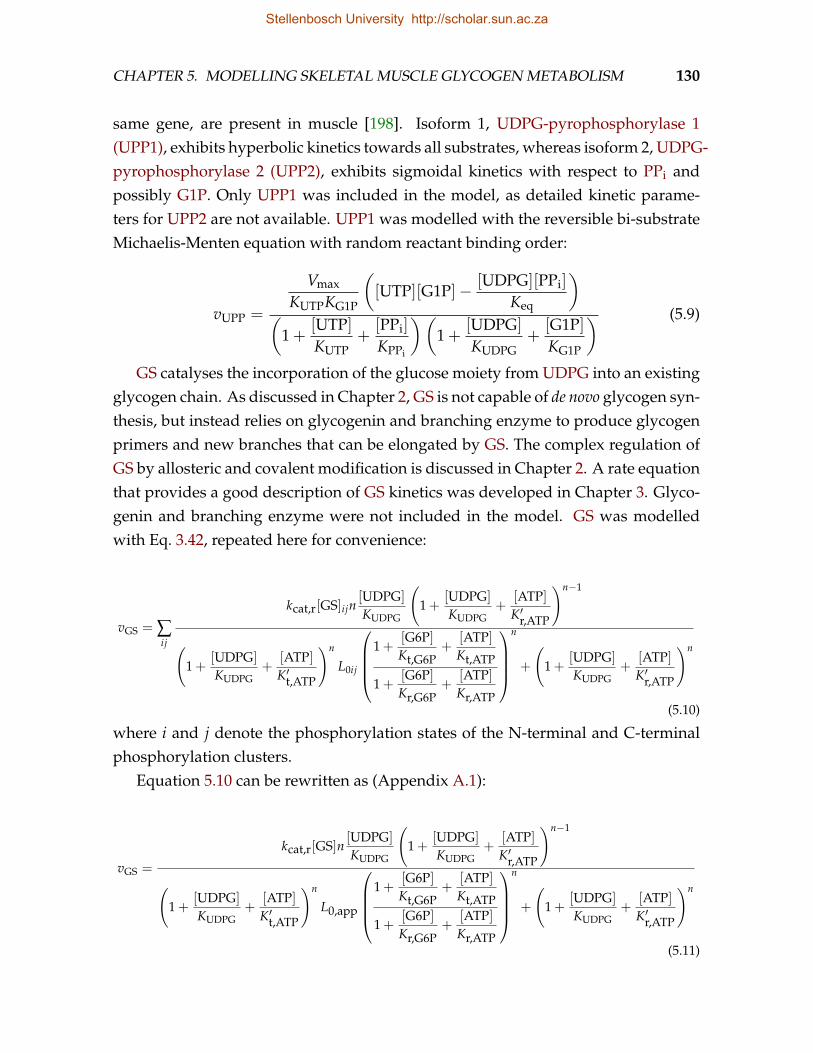
CHAPTER 5. MODELLING SKELETAL MUSCLE GLYCOGEN METABOLISM 130
same gene, are present in muscle [198]. Isoform 1, UDPG-pyrophosphorylase 1(UPP1), exhibits hyperbolic kinetics towards all substrates, whereas isoform 2, UDPG-pyrophosphorylase 2 (UPP2), exhibits sigmoidal kinetics with respect to PPi andpossibly G1P. Only UPP1 was included in the model, as detailed kinetic parame-ters for UPP2 are not available. UPP1 was modelled with the reversible bi-substrateMichaelis-Menten equation with random reactant binding order:
vUPP =
Vmax
KUTPKG1P
([UTP][G1P]− [UDPG][PPi]
Keq
)
(1 +
[UTP]KUTP
+[PPi]
KPPi
)(1 +
[UDPG]
KUDPG+
[G1P]KG1P
) (5.9)
GS catalyses the incorporation of the glucose moiety from UDPG into an existingglycogen chain. As discussed in Chapter 2, GS is not capable of de novo glycogen syn-thesis, but instead relies on glycogenin and branching enzyme to produce glycogenprimers and new branches that can be elongated by GS. The complex regulation ofGS by allosteric and covalent modification is discussed in Chapter 2. A rate equationthat provides a good description of GS kinetics was developed in Chapter 3. Glyco-genin and branching enzyme were not included in the model. GS was modelledwith Eq. 3.42, repeated here for convenience:
vGS = ∑ij
kcat,r[GS]ijn[UDPG]
KUDPG
(1 +
[UDPG]
KUDPG+
[ATP]K′r,ATP
)n−1
(1 +
[UDPG]
KUDPG+
[ATP]K′t,ATP
)n
L0ij
1 +[G6P]Kt,G6P
+[ATP]Kt,ATP
1 +[G6P]Kr,G6P
+[ATP]Kr,ATP
n
+
(1 +
[UDPG]
KUDPG+
[ATP]K′r,ATP
)n
(5.10)
where i and j denote the phosphorylation states of the N-terminal and C-terminalphosphorylation clusters.
Equation 5.10 can be rewritten as (Appendix A.1):
vGS =
kcat,r[GS]n[UDPG]
KUDPG
(1 +
[UDPG]
KUDPG+
[ATP]K′r,ATP
)n−1
(1 +
[UDPG]
KUDPG+
[ATP]K′t,ATP
)n
L0,app
1 +[G6P]Kt,G6P
+[ATP]Kt,ATP
1 +[G6P]Kr,G6P
+[ATP]Kr,ATP
n
+
(1 +
[UDPG]
KUDPG+
[ATP]K′r,ATP
)n
(5.11)
Stellenbosch University http://scholar.sun.ac.za
CHAPTER 5. MODELLING SKELETAL MUSCLE GLYCOGEN METABOLISM 131
where
L0,app =
∑ij
[GS]ij∆ij
L0ij
∑ij
[GS]ij∆ij
(5.12)
∆ij =
(1 +
[UDPG]
KUDPG+
[ATP]K′t,ATP
)n
L0ij
1 +[G6P]Kt,G6P
+[ATP]Kt,ATP
1 +[G6P]Kr,G6P
+[ATP]Kr,ATP
n
+
(1 +
[UDPG]
KUDPG+
[ATP]K′r,ATP
)n
(5.13)
Equation 5.12 can also be written as
L0,app =
∑ij
tij
∑ij
rij(5.14)
which shows its resemblance to the original definition of L0:
L0 =tr
(5.15)
where t and r are the concentrations of unliganded enzyme in the T and R conforma-tions. Despite this similarity, in the original definition L0 is independent of ligandconcentrations, whereas L0,app is not.
Note that L0,app is a function of the concentrations of GS in its various phospho-rylation states and the L0 values for each state ij. Any change in the phosphorylationstate of GS is reflected in the value of L0,app. L0,app assumes its minimum value, L000
when GS is completely dephosphorylated, and its maximum value, L02a3a, when GSis completely phosphorylated. The phosphorylation and dephosphorylation of GSmay therefore be mimicked by treating L0,app as a parameter, designated L0, of whichthe values range between L000 and L02a3a.
In models that did not explicitly include the interconversion between the variousGS phosphorylation states, we therefore used the following rate equation for GS:
Stellenbosch University http://scholar.sun.ac.za
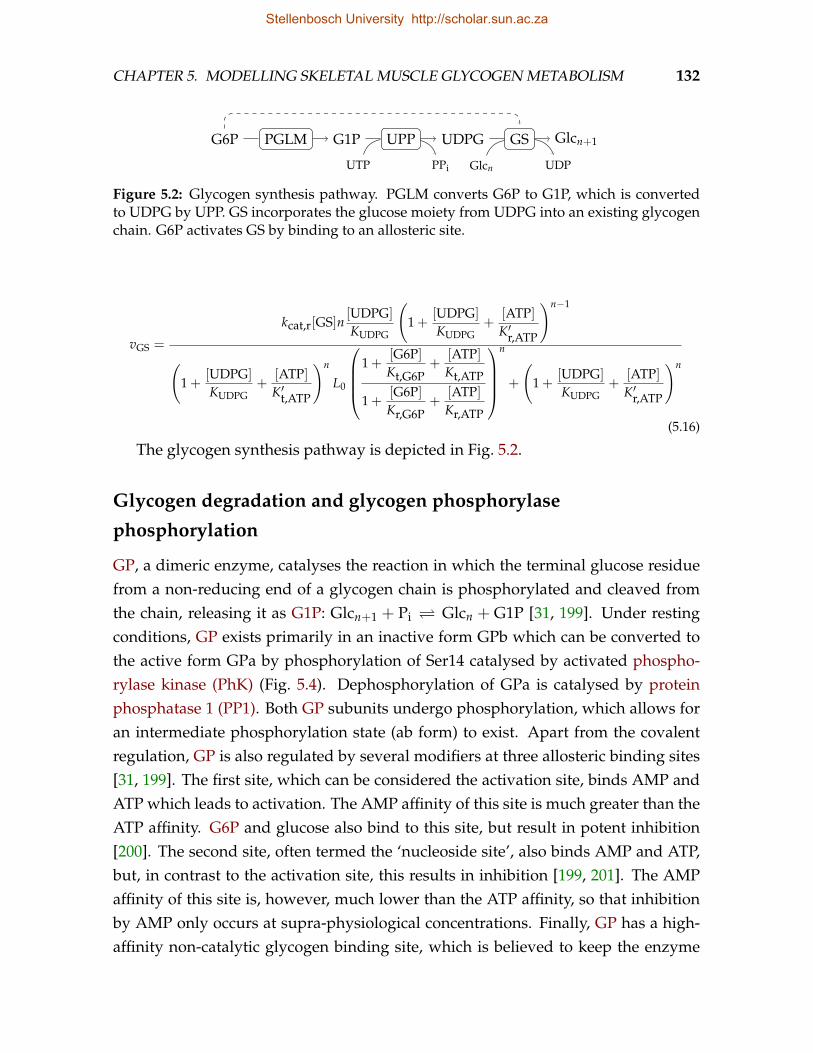
CHAPTER 5. MODELLING SKELETAL MUSCLE GLYCOGEN METABOLISM 132
G6P PGLM G1P UPP
UTP PPi
UDPG GS Glcn+1
Glcn UDP
Figure 5.2: Glycogen synthesis pathway. PGLM converts G6P to G1P, which is convertedto UDPG by UPP. GS incorporates the glucose moiety from UDPG into an existing glycogenchain. G6P activates GS by binding to an allosteric site.
vGS =
kcat,r[GS]n[UDPG]
KUDPG
(1 +
[UDPG]
KUDPG+
[ATP]K′r,ATP
)n−1
(1 +
[UDPG]
KUDPG+
[ATP]K′t,ATP
)n
L0
1 +[G6P]Kt,G6P
+[ATP]Kt,ATP
1 +[G6P]Kr,G6P
+[ATP]Kr,ATP
n
+
(1 +
[UDPG]
KUDPG+
[ATP]K′r,ATP
)n
(5.16)
The glycogen synthesis pathway is depicted in Fig. 5.2.
Glycogen degradation and glycogen phosphorylase
phosphorylation
GP, a dimeric enzyme, catalyses the reaction in which the terminal glucose residuefrom a non-reducing end of a glycogen chain is phosphorylated and cleaved fromthe chain, releasing it as G1P: Glcn+1 + Pi Glcn + G1P [31, 199]. Under restingconditions, GP exists primarily in an inactive form GPb which can be converted tothe active form GPa by phosphorylation of Ser14 catalysed by activated phospho-rylase kinase (PhK) (Fig. 5.4). Dephosphorylation of GPa is catalysed by proteinphosphatase 1 (PP1). Both GP subunits undergo phosphorylation, which allows foran intermediate phosphorylation state (ab form) to exist. Apart from the covalentregulation, GP is also regulated by several modifiers at three allosteric binding sites[31, 199]. The first site, which can be considered the activation site, binds AMP andATP which leads to activation. The AMP affinity of this site is much greater than theATP affinity. G6P and glucose also bind to this site, but result in potent inhibition[200]. The second site, often termed the ‘nucleoside site’, also binds AMP and ATP,but, in contrast to the activation site, this results in inhibition [199, 201]. The AMPaffinity of this site is, however, much lower than the ATP affinity, so that inhibitionby AMP only occurs at supra-physiological concentrations. Finally, GP has a high-affinity non-catalytic glycogen binding site, which is believed to keep the enzyme
Stellenbosch University http://scholar.sun.ac.za
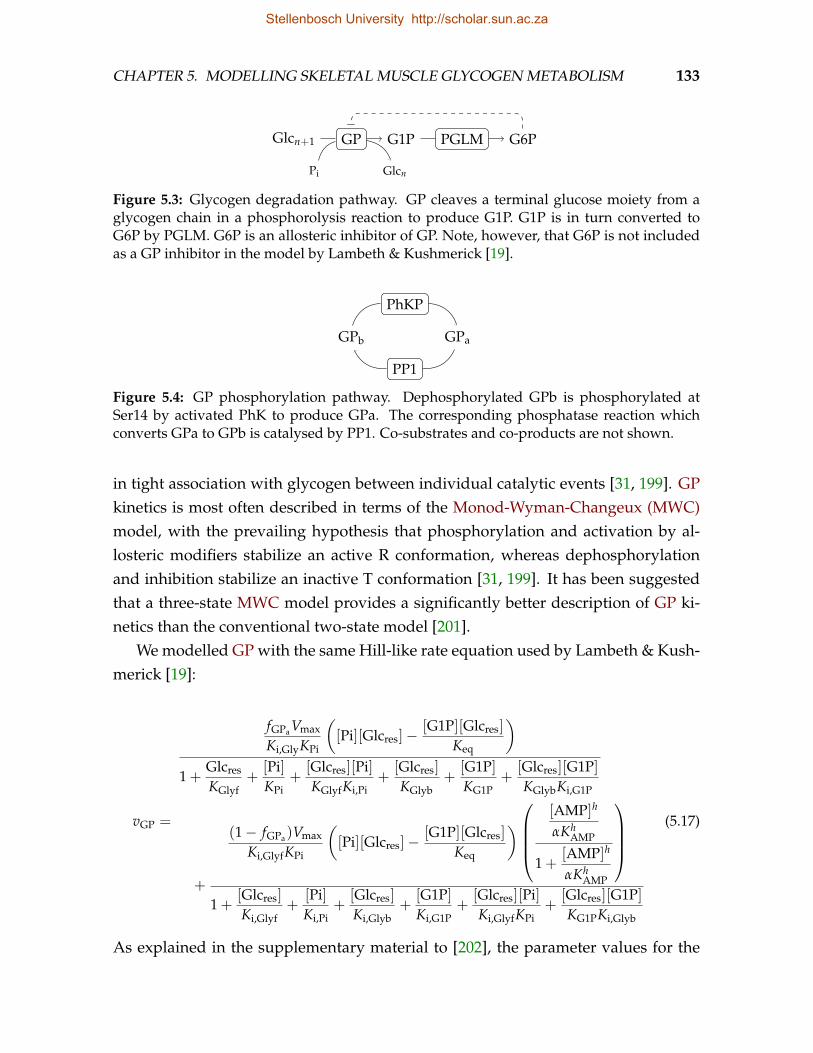
CHAPTER 5. MODELLING SKELETAL MUSCLE GLYCOGEN METABOLISM 133
Glcn+1 GP G1P PGLM G6P
GlcnPi
Figure 5.3: Glycogen degradation pathway. GP cleaves a terminal glucose moiety from aglycogen chain in a phosphorolysis reaction to produce G1P. G1P is in turn converted toG6P by PGLM. G6P is an allosteric inhibitor of GP. Note, however, that G6P is not includedas a GP inhibitor in the model by Lambeth & Kushmerick [19].
GPb
PhKP
PP1
GPa
Figure 5.4: GP phosphorylation pathway. Dephosphorylated GPb is phosphorylated atSer14 by activated PhK to produce GPa. The corresponding phosphatase reaction whichconverts GPa to GPb is catalysed by PP1. Co-substrates and co-products are not shown.
in tight association with glycogen between individual catalytic events [31, 199]. GPkinetics is most often described in terms of the Monod-Wyman-Changeux (MWC)model, with the prevailing hypothesis that phosphorylation and activation by al-losteric modifiers stabilize an active R conformation, whereas dephosphorylationand inhibition stabilize an inactive T conformation [31, 199]. It has been suggestedthat a three-state MWC model provides a significantly better description of GP ki-netics than the conventional two-state model [201].
We modelled GP with the same Hill-like rate equation used by Lambeth & Kush-merick [19]:
vGP =
fGPaVmax
Ki,GlyKPi
([Pi][Glcres]−
[G1P][Glcres]
Keq
)
1 +Glcres
KGlyf+
[Pi]KPi
+[Glcres][Pi]KGlyfKi,Pi
+[Glcres]
KGlyb+
[G1P]KG1P
+[Glcres][G1P]KGlybKi,G1P
+
(1− fGPa)Vmax
Ki,GlyfKPi
([Pi][Glcres]−
[G1P][Glcres]
Keq
)
[AMP]h
αKhAMP
1 +[AMP]h
αKhAMP
1 +[Glcres]
Ki,Glyf+
[Pi]Ki,Pi
+[Glcres]
Ki,Glyb+
[G1P]Ki,G1P
+[Glcres][Pi]Ki,GlyfKPi
+[Glcres][G1P]KG1PKi,Glyb
(5.17)
As explained in the supplementary material to [202], the parameter values for the
Stellenbosch University http://scholar.sun.ac.za
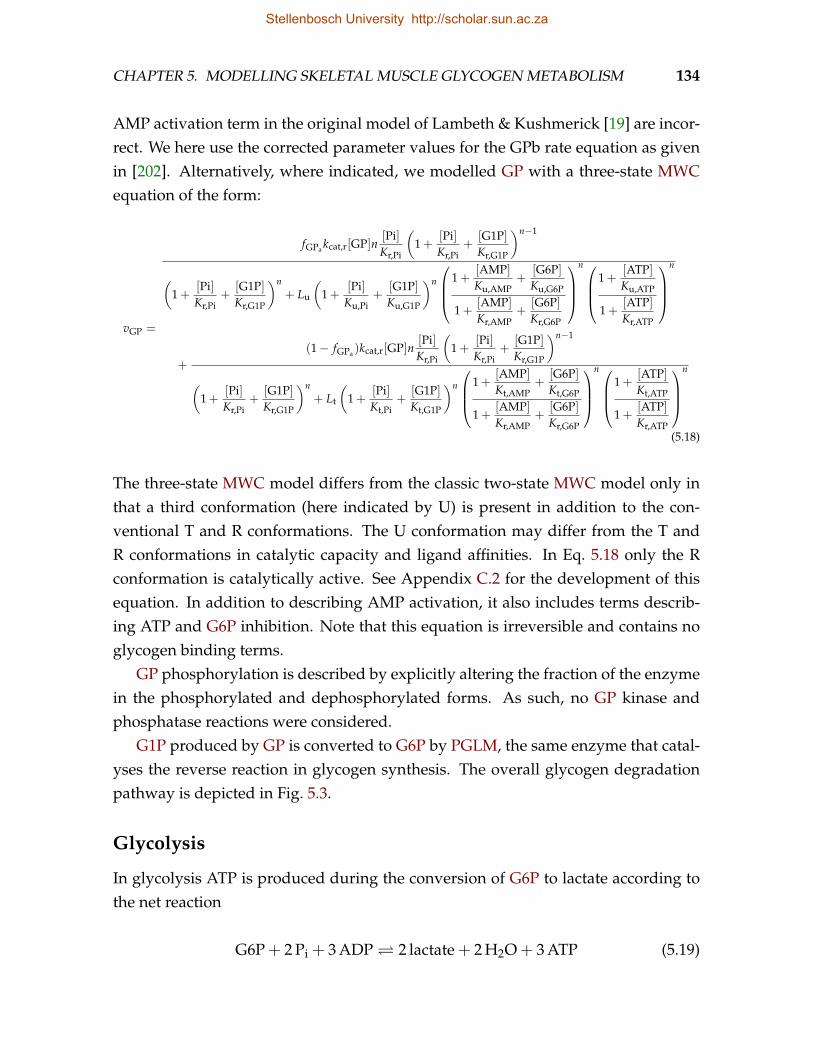
CHAPTER 5. MODELLING SKELETAL MUSCLE GLYCOGEN METABOLISM 134
AMP activation term in the original model of Lambeth & Kushmerick [19] are incor-rect. We here use the corrected parameter values for the GPb rate equation as givenin [202]. Alternatively, where indicated, we modelled GP with a three-state MWCequation of the form:
vGP =
fGPa kcat,r[GP]n[Pi]Kr,Pi
(1 +
[Pi]Kr,Pi
+[G1P]Kr,G1P
)n−1
(1 +
[Pi]Kr,Pi
+[G1P]Kr,G1P
)n+ Lu
(1 +
[Pi]Ku,Pi
+[G1P]Ku,G1P
)n
1 +[AMP]Ku,AMP
+[G6P]Ku,G6P
1 +[AMP]Kr,AMP
+[G6P]Kr,G6P
n
1 +[ATP]Ku,ATP
1 +[ATP]Kr,ATP
n
+
(1− fGPa )kcat,r[GP]n[Pi]Kr,Pi
(1 +
[Pi]Kr,Pi
+[G1P]Kr,G1P
)n−1
(1 +
[Pi]Kr,Pi
+[G1P]Kr,G1P
)n+ Lt
(1 +
[Pi]Kt,Pi
+[G1P]Kt,G1P
)n
1 +[AMP]Kt,AMP
+[G6P]Kt,G6P
1 +[AMP]Kr,AMP
+[G6P]Kr,G6P
n
1 +[ATP]Kt,ATP
1 +[ATP]Kr,ATP
n
(5.18)
The three-state MWC model differs from the classic two-state MWC model only inthat a third conformation (here indicated by U) is present in addition to the con-ventional T and R conformations. The U conformation may differ from the T andR conformations in catalytic capacity and ligand affinities. In Eq. 5.18 only the Rconformation is catalytically active. See Appendix C.2 for the development of thisequation. In addition to describing AMP activation, it also includes terms describ-ing ATP and G6P inhibition. Note that this equation is irreversible and contains noglycogen binding terms.
GP phosphorylation is described by explicitly altering the fraction of the enzymein the phosphorylated and dephosphorylated forms. As such, no GP kinase andphosphatase reactions were considered.
G1P produced by GP is converted to G6P by PGLM, the same enzyme that catal-yses the reverse reaction in glycogen synthesis. The overall glycogen degradationpathway is depicted in Fig. 5.3.
Glycolysis
In glycolysis ATP is produced during the conversion of G6P to lactate according tothe net reaction
G6P + 2 Pi + 3 ADP 2 lactate + 2 H2O + 3 ATP (5.19)
Stellenbosch University http://scholar.sun.ac.za
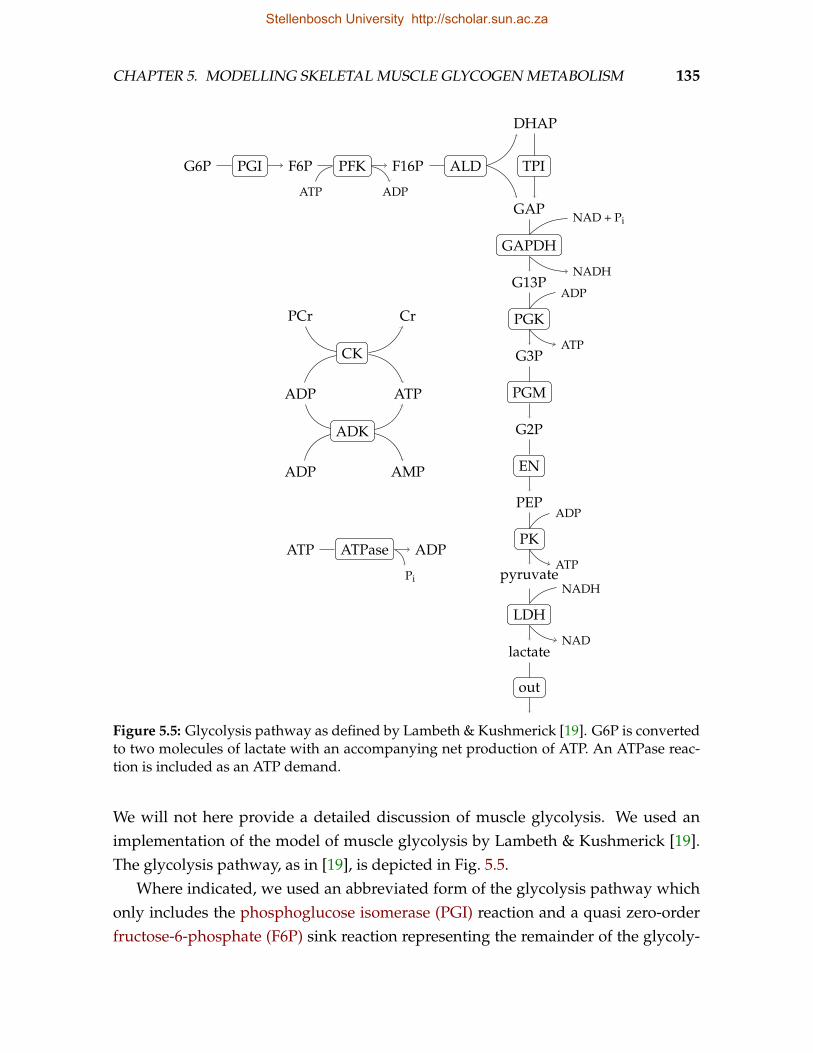
CHAPTER 5. MODELLING SKELETAL MUSCLE GLYCOGEN METABOLISM 135
G6P PGI F6P PFK
ATP ADP
F16P ALD
DHAP
GAP
TPI
GAPDH
NAD + Pi
NADHG13P
PGK
ADP
ATPG3P
PGM
G2P
EN
PEP
PK
ADP
ATPpyruvate
LDH
NADH
NADlactate
out
PCr Cr
CK
ADP ATP
ADK
ADP AMP
ATP ATPase ADP
Pi
Figure 5.5: Glycolysis pathway as defined by Lambeth & Kushmerick [19]. G6P is convertedto two molecules of lactate with an accompanying net production of ATP. An ATPase reac-tion is included as an ATP demand.
We will not here provide a detailed discussion of muscle glycolysis. We used animplementation of the model of muscle glycolysis by Lambeth & Kushmerick [19].The glycolysis pathway, as in [19], is depicted in Fig. 5.5.
Where indicated, we used an abbreviated form of the glycolysis pathway whichonly includes the phosphoglucose isomerase (PGI) reaction and a quasi zero-orderfructose-6-phosphate (F6P) sink reaction representing the remainder of the glycoly-
Stellenbosch University http://scholar.sun.ac.za
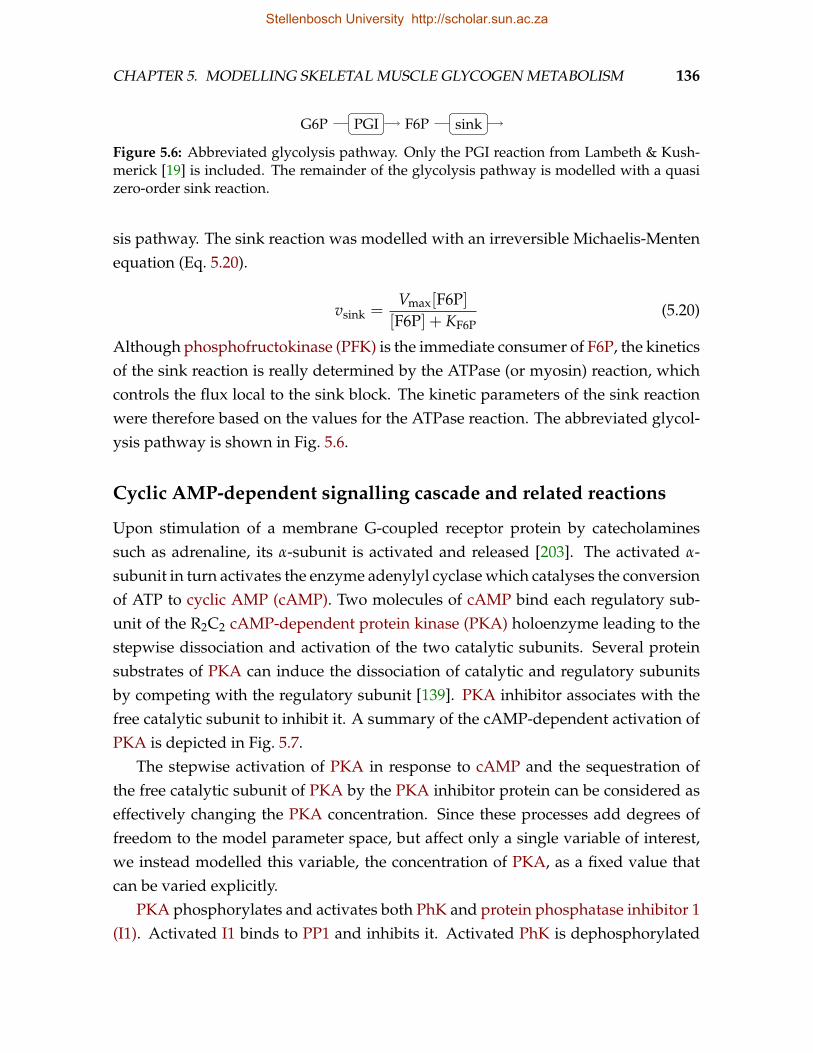
CHAPTER 5. MODELLING SKELETAL MUSCLE GLYCOGEN METABOLISM 136
G6P PGI F6P sink
Figure 5.6: Abbreviated glycolysis pathway. Only the PGI reaction from Lambeth & Kush-merick [19] is included. The remainder of the glycolysis pathway is modelled with a quasizero-order sink reaction.
sis pathway. The sink reaction was modelled with an irreversible Michaelis-Mentenequation (Eq. 5.20).
vsink =Vmax[F6P]
[F6P] + KF6P(5.20)
Although phosphofructokinase (PFK) is the immediate consumer of F6P, the kineticsof the sink reaction is really determined by the ATPase (or myosin) reaction, whichcontrols the flux local to the sink block. The kinetic parameters of the sink reactionwere therefore based on the values for the ATPase reaction. The abbreviated glycol-ysis pathway is shown in Fig. 5.6.
Cyclic AMP-dependent signalling cascade and related reactions
Upon stimulation of a membrane G-coupled receptor protein by catecholaminessuch as adrenaline, its α-subunit is activated and released [203]. The activated α-subunit in turn activates the enzyme adenylyl cyclase which catalyses the conversionof ATP to cyclic AMP (cAMP). Two molecules of cAMP bind each regulatory sub-unit of the R2C2 cAMP-dependent protein kinase (PKA) holoenzyme leading to thestepwise dissociation and activation of the two catalytic subunits. Several proteinsubstrates of PKA can induce the dissociation of catalytic and regulatory subunitsby competing with the regulatory subunit [139]. PKA inhibitor associates with thefree catalytic subunit to inhibit it. A summary of the cAMP-dependent activation ofPKA is depicted in Fig. 5.7.
The stepwise activation of PKA in response to cAMP and the sequestration ofthe free catalytic subunit of PKA by the PKA inhibitor protein can be considered aseffectively changing the PKA concentration. Since these processes add degrees offreedom to the model parameter space, but affect only a single variable of interest,we instead modelled this variable, the concentration of PKA, as a fixed value thatcan be varied explicitly.
PKA phosphorylates and activates both PhK and protein phosphatase inhibitor 1(I1). Activated I1 binds to PP1 and inhibits it. Activated PhK is dephosphorylated
Stellenbosch University http://scholar.sun.ac.za
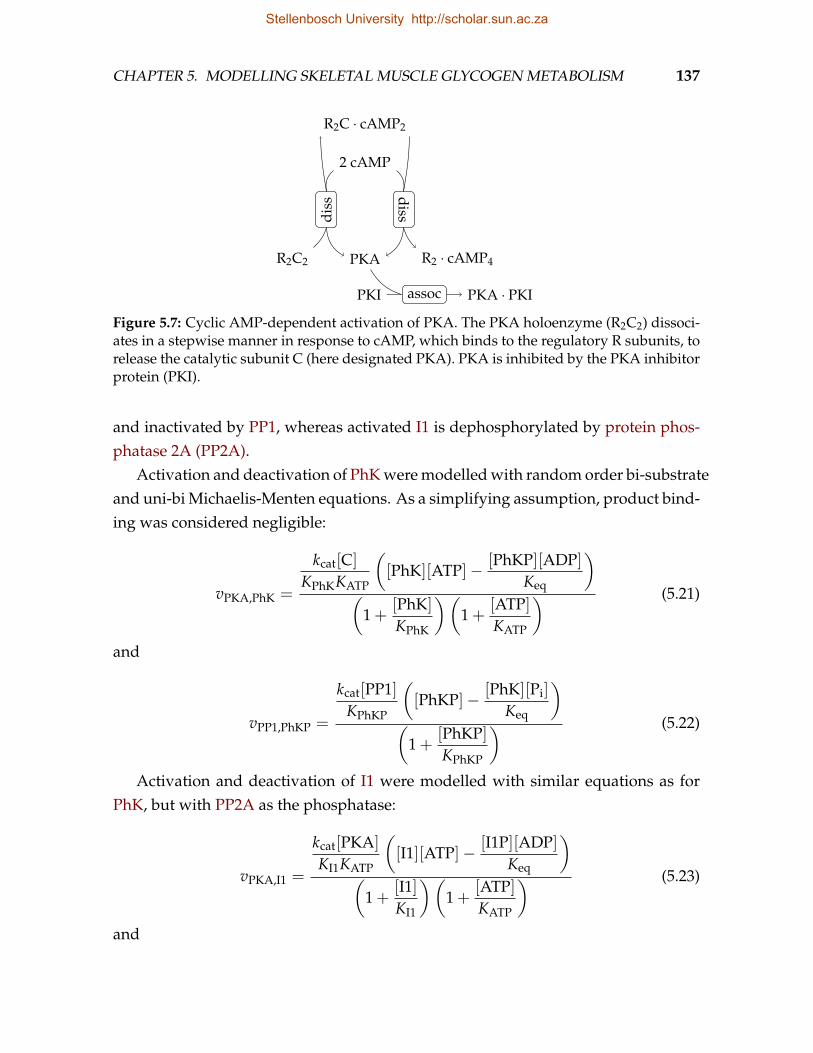
CHAPTER 5. MODELLING SKELETAL MUSCLE GLYCOGEN METABOLISM 137
R2C · cAMP2
2 cAMP
diss
diss
PKAR2C2 R2 · cAMP4
assocPKI PKA · PKI
Figure 5.7: Cyclic AMP-dependent activation of PKA. The PKA holoenzyme (R2C2) dissoci-ates in a stepwise manner in response to cAMP, which binds to the regulatory R subunits, torelease the catalytic subunit C (here designated PKA). PKA is inhibited by the PKA inhibitorprotein (PKI).
and inactivated by PP1, whereas activated I1 is dephosphorylated by protein phos-phatase 2A (PP2A).
Activation and deactivation of PhK were modelled with random order bi-substrateand uni-bi Michaelis-Menten equations. As a simplifying assumption, product bind-ing was considered negligible:
vPKA,PhK =
kcat[C]
KPhKKATP
([PhK][ATP]− [PhKP][ADP]
Keq
)
(1 +
[PhK]
KPhK
)(1 +
[ATP]KATP
) (5.21)
and
vPP1,PhKP =
kcat[PP1]KPhKP
([PhKP]− [PhK][Pi]
Keq
)
(1 +
[PhKP]KPhKP
) (5.22)
Activation and deactivation of I1 were modelled with similar equations as forPhK, but with PP2A as the phosphatase:
vPKA,I1 =
kcat[PKA]
KI1KATP
([I1][ATP]− [I1P][ADP]
Keq
)
(1 +
[I1]KI1
)(1 +
[ATP]KATP
) (5.23)
and
Stellenbosch University http://scholar.sun.ac.za
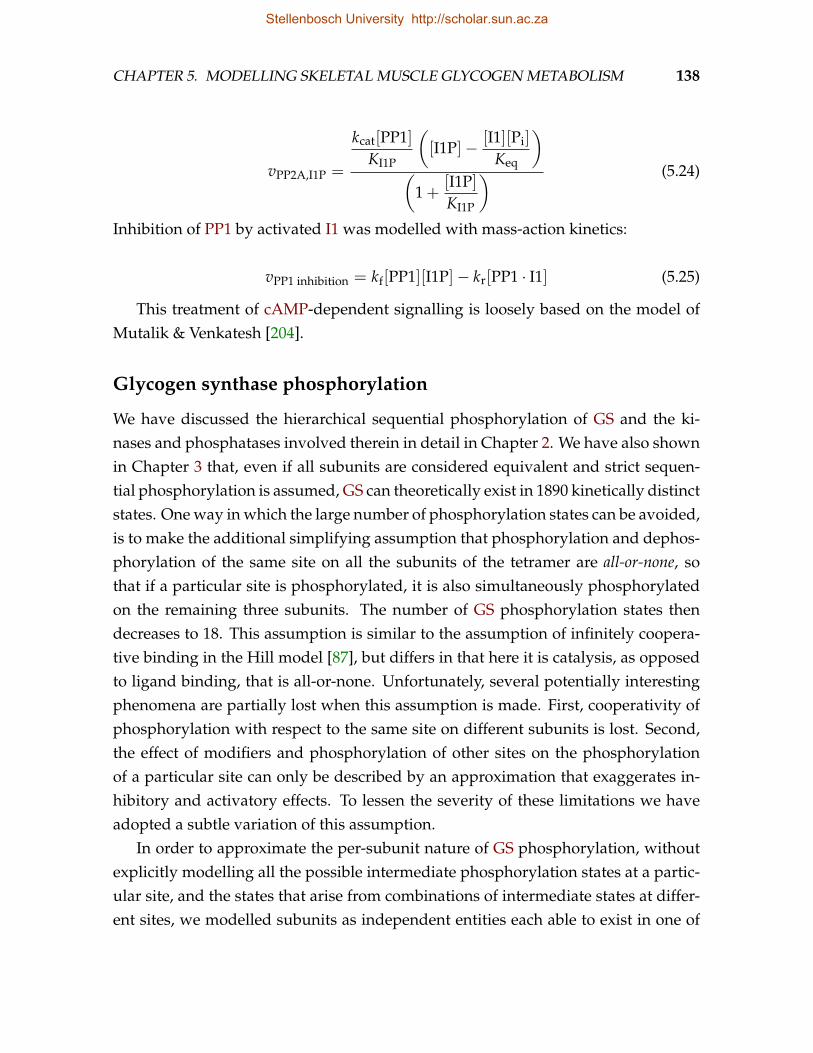
CHAPTER 5. MODELLING SKELETAL MUSCLE GLYCOGEN METABOLISM 138
vPP2A,I1P =
kcat[PP1]KI1P
([I1P]− [I1][Pi]
Keq
)
(1 +
[I1P]KI1P
) (5.24)
Inhibition of PP1 by activated I1 was modelled with mass-action kinetics:
vPP1 inhibition = kf[PP1][I1P]− kr[PP1 · I1] (5.25)
This treatment of cAMP-dependent signalling is loosely based on the model ofMutalik & Venkatesh [204].
Glycogen synthase phosphorylation
We have discussed the hierarchical sequential phosphorylation of GS and the ki-nases and phosphatases involved therein in detail in Chapter 2. We have also shownin Chapter 3 that, even if all subunits are considered equivalent and strict sequen-tial phosphorylation is assumed, GS can theoretically exist in 1890 kinetically distinctstates. One way in which the large number of phosphorylation states can be avoided,is to make the additional simplifying assumption that phosphorylation and dephos-phorylation of the same site on all the subunits of the tetramer are all-or-none, sothat if a particular site is phosphorylated, it is also simultaneously phosphorylatedon the remaining three subunits. The number of GS phosphorylation states thendecreases to 18. This assumption is similar to the assumption of infinitely coopera-tive binding in the Hill model [87], but differs in that here it is catalysis, as opposedto ligand binding, that is all-or-none. Unfortunately, several potentially interestingphenomena are partially lost when this assumption is made. First, cooperativity ofphosphorylation with respect to the same site on different subunits is lost. Second,the effect of modifiers and phosphorylation of other sites on the phosphorylationof a particular site can only be described by an approximation that exaggerates in-hibitory and activatory effects. To lessen the severity of these limitations we haveadopted a subtle variation of this assumption.
In order to approximate the per-subunit nature of GS phosphorylation, withoutexplicitly modelling all the possible intermediate phosphorylation states at a partic-ular site, and the states that arise from combinations of intermediate states at differ-ent sites, we modelled subunits as independent entities each able to exist in one of
Stellenbosch University http://scholar.sun.ac.za
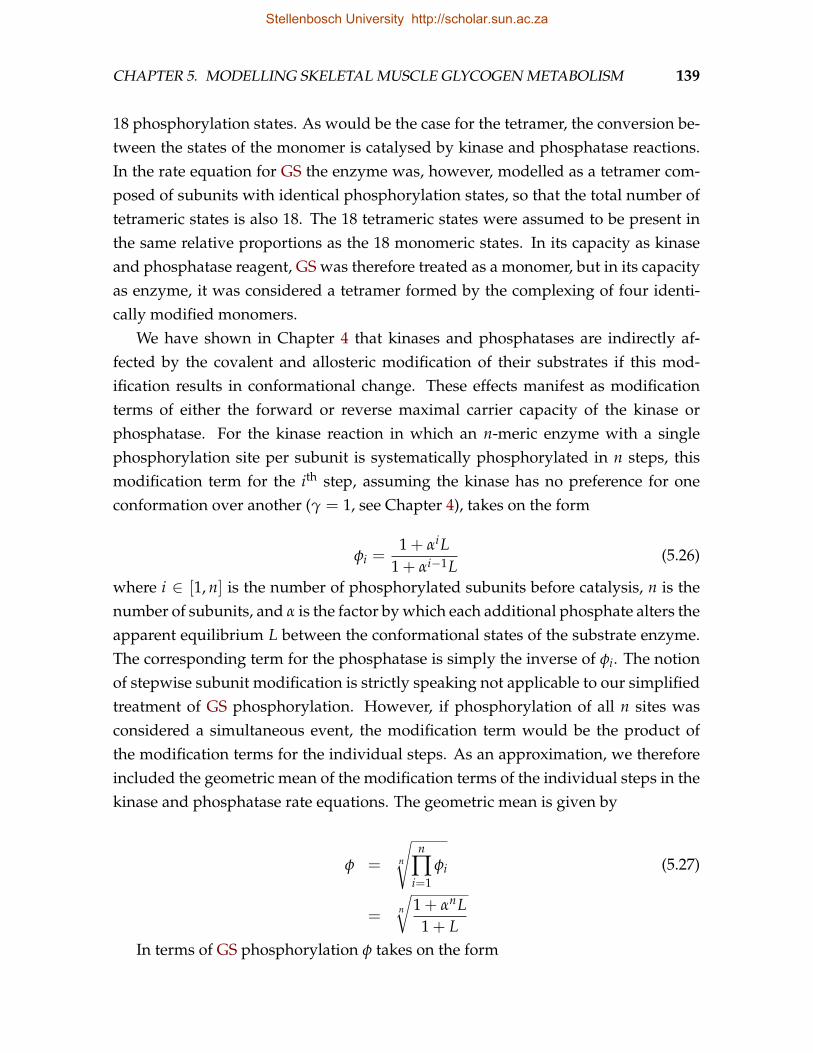
CHAPTER 5. MODELLING SKELETAL MUSCLE GLYCOGEN METABOLISM 139
18 phosphorylation states. As would be the case for the tetramer, the conversion be-tween the states of the monomer is catalysed by kinase and phosphatase reactions.In the rate equation for GS the enzyme was, however, modelled as a tetramer com-posed of subunits with identical phosphorylation states, so that the total number oftetrameric states is also 18. The 18 tetrameric states were assumed to be present inthe same relative proportions as the 18 monomeric states. In its capacity as kinaseand phosphatase reagent, GS was therefore treated as a monomer, but in its capacityas enzyme, it was considered a tetramer formed by the complexing of four identi-cally modified monomers.
We have shown in Chapter 4 that kinases and phosphatases are indirectly af-fected by the covalent and allosteric modification of their substrates if this mod-ification results in conformational change. These effects manifest as modificationterms of either the forward or reverse maximal carrier capacity of the kinase orphosphatase. For the kinase reaction in which an n-meric enzyme with a singlephosphorylation site per subunit is systematically phosphorylated in n steps, thismodification term for the ith step, assuming the kinase has no preference for oneconformation over another (γ = 1, see Chapter 4), takes on the form
φi =1 + αiL
1 + αi−1L(5.26)
where i ∈ [1, n] is the number of phosphorylated subunits before catalysis, n is thenumber of subunits, and α is the factor by which each additional phosphate alters theapparent equilibrium L between the conformational states of the substrate enzyme.The corresponding term for the phosphatase is simply the inverse of φi. The notionof stepwise subunit modification is strictly speaking not applicable to our simplifiedtreatment of GS phosphorylation. However, if phosphorylation of all n sites wasconsidered a simultaneous event, the modification term would be the product ofthe modification terms for the individual steps. As an approximation, we thereforeincluded the geometric mean of the modification terms of the individual steps in thekinase and phosphatase rate equations. The geometric mean is given by
φ = n
√n
∏i=1
φi (5.27)
= n
√1 + αnL
1 + LIn terms of GS phosphorylation φ takes on the form
Stellenbosch University http://scholar.sun.ac.za
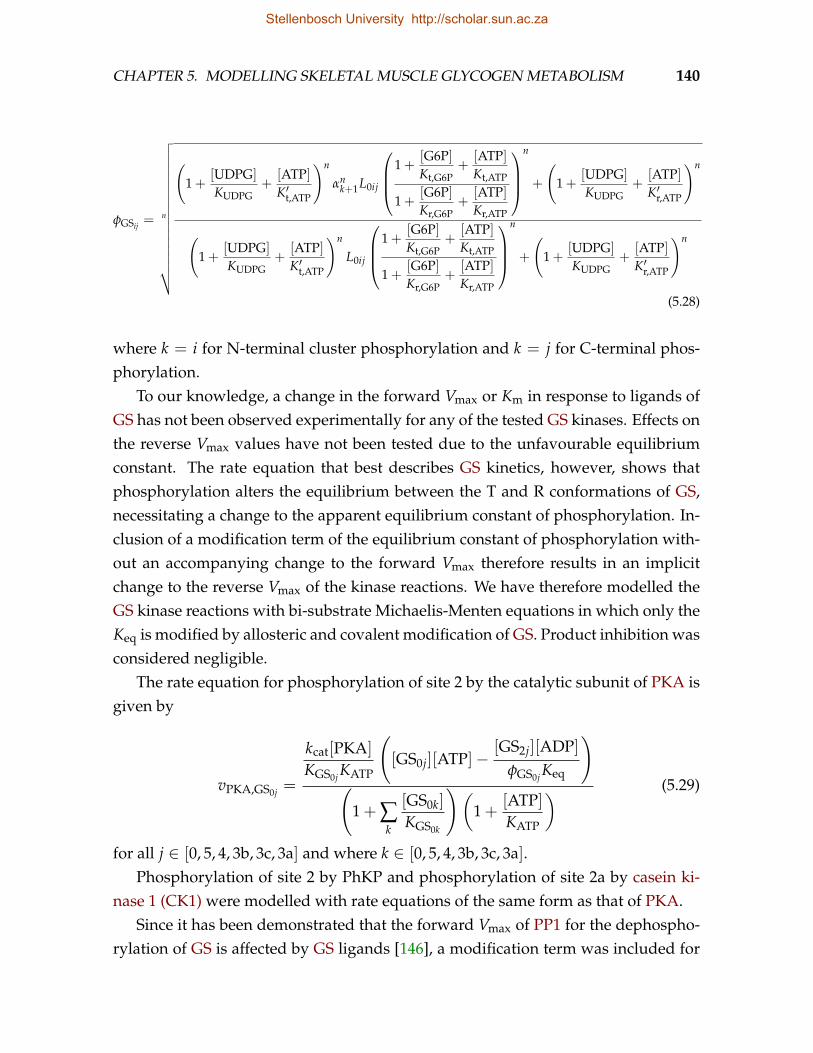
CHAPTER 5. MODELLING SKELETAL MUSCLE GLYCOGEN METABOLISM 140
φGSij =n
√√√√√√√√√√√√√√√√√
(1 +
[UDPG]
KUDPG+
[ATP]K′t,ATP
)n
αnk+1L0ij
1 +[G6P]Kt,G6P
+[ATP]Kt,ATP
1 +[G6P]Kr,G6P
+[ATP]Kr,ATP
n
+
(1 +
[UDPG]
KUDPG+
[ATP]K′r,ATP
)n
(1 +
[UDPG]
KUDPG+
[ATP]K′t,ATP
)n
L0ij
1 +[G6P]Kt,G6P
+[ATP]Kt,ATP
1 +[G6P]Kr,G6P
+[ATP]Kr,ATP
n
+
(1 +
[UDPG]
KUDPG+
[ATP]K′r,ATP
)n
(5.28)
where k = i for N-terminal cluster phosphorylation and k = j for C-terminal phos-phorylation.
To our knowledge, a change in the forward Vmax or Km in response to ligands ofGS has not been observed experimentally for any of the tested GS kinases. Effects onthe reverse Vmax values have not been tested due to the unfavourable equilibriumconstant. The rate equation that best describes GS kinetics, however, shows thatphosphorylation alters the equilibrium between the T and R conformations of GS,necessitating a change to the apparent equilibrium constant of phosphorylation. In-clusion of a modification term of the equilibrium constant of phosphorylation with-out an accompanying change to the forward Vmax therefore results in an implicitchange to the reverse Vmax of the kinase reactions. We have therefore modelled theGS kinase reactions with bi-substrate Michaelis-Menten equations in which only theKeq is modified by allosteric and covalent modification of GS. Product inhibition wasconsidered negligible.
The rate equation for phosphorylation of site 2 by the catalytic subunit of PKA isgiven by
vPKA,GS0j =
kcat[PKA]
KGS0j KATP
([GS0j][ATP]− [GS2j][ADP]
φGS0j Keq
)
(1 + ∑
k
[GS0k]
KGS0k
)(1 +
[ATP]KATP
) (5.29)
for all j ∈ [0, 5, 4, 3b, 3c, 3a] and where k ∈ [0, 5, 4, 3b, 3c, 3a].Phosphorylation of site 2 by PhKP and phosphorylation of site 2a by casein ki-
nase 1 (CK1) were modelled with rate equations of the same form as that of PKA.Since it has been demonstrated that the forward Vmax of PP1 for the dephospho-
rylation of GS is affected by GS ligands [146], a modification term was included for
Stellenbosch University http://scholar.sun.ac.za
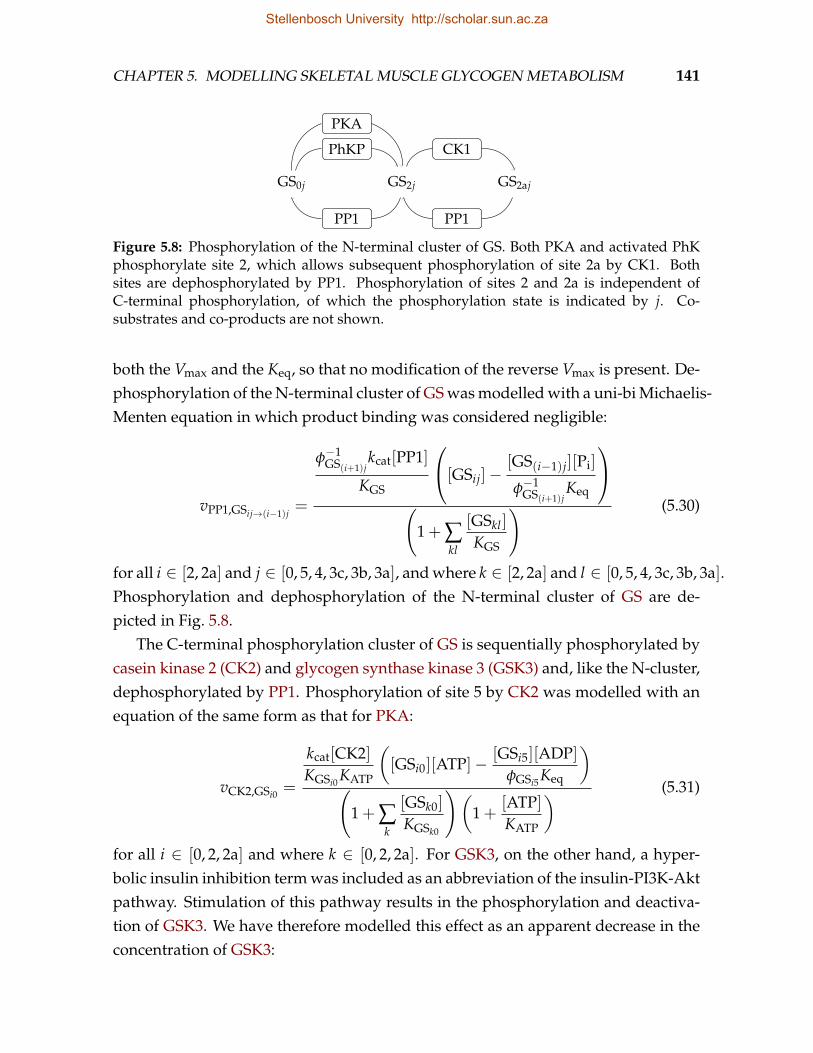
CHAPTER 5. MODELLING SKELETAL MUSCLE GLYCOGEN METABOLISM 141
GS0j
PhKP
PKA
PP1
GS2j
CK1
PP1
GS2aj
Figure 5.8: Phosphorylation of the N-terminal cluster of GS. Both PKA and activated PhKphosphorylate site 2, which allows subsequent phosphorylation of site 2a by CK1. Bothsites are dephosphorylated by PP1. Phosphorylation of sites 2 and 2a is independent ofC-terminal phosphorylation, of which the phosphorylation state is indicated by j. Co-substrates and co-products are not shown.
both the Vmax and the Keq, so that no modification of the reverse Vmax is present. De-phosphorylation of the N-terminal cluster of GS was modelled with a uni-bi Michaelis-Menten equation in which product binding was considered negligible:
vPP1,GSij→(i−1)j=
φ−1GS(i+1)j
kcat[PP1]
KGS
[GSij]−
[GS(i−1)j][Pi]
φ−1GS(i+1)j
Keq
(1 + ∑
kl
[GSkl]
KGS
) (5.30)
for all i ∈ [2, 2a] and j ∈ [0, 5, 4, 3c, 3b, 3a], and where k ∈ [2, 2a] and l ∈ [0, 5, 4, 3c, 3b, 3a].Phosphorylation and dephosphorylation of the N-terminal cluster of GS are de-picted in Fig. 5.8.
The C-terminal phosphorylation cluster of GS is sequentially phosphorylated bycasein kinase 2 (CK2) and glycogen synthase kinase 3 (GSK3) and, like the N-cluster,dephosphorylated by PP1. Phosphorylation of site 5 by CK2 was modelled with anequation of the same form as that for PKA:
vCK2,GSi0 =
kcat[CK2]KGSi0 KATP
([GSi0][ATP]− [GSi5][ADP]
φGSi5Keq
)
(1 + ∑
k
[GSk0]
KGSk0
)(1 +
[ATP]KATP
) (5.31)
for all i ∈ [0, 2, 2a] and where k ∈ [0, 2, 2a]. For GSK3, on the other hand, a hyper-bolic insulin inhibition term was included as an abbreviation of the insulin-PI3K-Aktpathway. Stimulation of this pathway results in the phosphorylation and deactiva-tion of GSK3. We have therefore modelled this effect as an apparent decrease in theconcentration of GSK3:
Stellenbosch University http://scholar.sun.ac.za
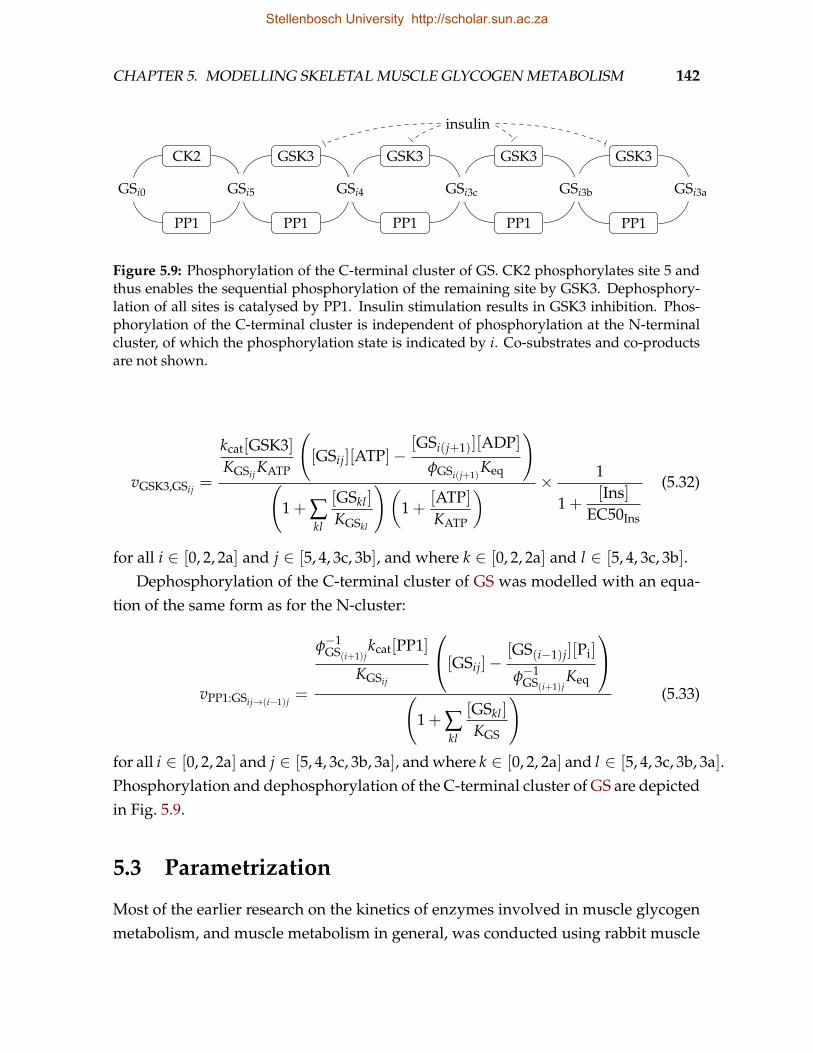
CHAPTER 5. MODELLING SKELETAL MUSCLE GLYCOGEN METABOLISM 142
GSi0
CK2
PP1
GSi5
GSK3
PP1
GSi4
GSK3
PP1
GSi3c
GSK3
PP1
GSi3b
GSK3
PP1
GSi3a
insulin
Figure 5.9: Phosphorylation of the C-terminal cluster of GS. CK2 phosphorylates site 5 andthus enables the sequential phosphorylation of the remaining site by GSK3. Dephosphory-lation of all sites is catalysed by PP1. Insulin stimulation results in GSK3 inhibition. Phos-phorylation of the C-terminal cluster is independent of phosphorylation at the N-terminalcluster, of which the phosphorylation state is indicated by i. Co-substrates and co-productsare not shown.
vGSK3,GSij =
kcat[GSK3]KGSij KATP
([GSij][ATP]−
[GSi(j+1)][ADP]φGSi(j+1)
Keq
)
(1 + ∑
kl
[GSkl]
KGSkl
)(1 +
[ATP]KATP
) × 1
1 +[Ins]
EC50Ins
(5.32)
for all i ∈ [0, 2, 2a] and j ∈ [5, 4, 3c, 3b], and where k ∈ [0, 2, 2a] and l ∈ [5, 4, 3c, 3b].Dephosphorylation of the C-terminal cluster of GS was modelled with an equa-
tion of the same form as for the N-cluster:
vPP1:GSij→(i−1)j=
φ−1GS(i+1)j
kcat[PP1]
KGSij
[GSij]−
[GS(i−1)j][Pi]
φ−1GS(i+1)j
Keq
(1 + ∑
kl
[GSkl]
KGS
) (5.33)
for all i ∈ [0, 2, 2a] and j ∈ [5, 4, 3c, 3b, 3a], and where k ∈ [0, 2, 2a] and l ∈ [5, 4, 3c, 3b, 3a].Phosphorylation and dephosphorylation of the C-terminal cluster of GS are depictedin Fig. 5.9.
5.3 Parametrization
Most of the earlier research on the kinetics of enzymes involved in muscle glycogenmetabolism, and muscle metabolism in general, was conducted using rabbit muscle
Stellenbosch University http://scholar.sun.ac.za
CHAPTER 5. MODELLING SKELETAL MUSCLE GLYCOGEN METABOLISM 143
as source. For this reason and for the sake of consistency we favoured, where avail-able, data obtained from rabbit muscle experiments. A large number of parameterswere also obtained from rat and human muscle data. For any particular enzyme,parameters reported in the same paper, by the same group, or for the same specieswere favoured over compiling parameters from various sources. Where rabbit mus-cle data were available, but a more complete set could be obtained from anotherspecies, the data from the other species were favoured. As needed, data from thesame tissue, but from a different species, were preferred over data from the samespecies, but a different tissue, unless the same isozyme is known to be expressedin both tissues types. Preference was given to data obtained at temperatures andpH values close to the in vivo values (37C and pH 7.2), but where more completedata sets were available, these were favoured. Overall, the guiding principles inchoosing parameter sets were quality of experimental techniques employed in de-termining parameter values and per-enzyme consistency. Where unit conversionwas required, 1 g wet muscle weight was taken as equivalent to 0.75 mL cell water(based on wet-to-dry weight ratio in [205]). The unit of time is minutes and the unitof concentration is mM.
Rate constants and enzyme concentrations
The maximal forward carrying capacity of an enzyme can be expressed as
Vmax = nkcat[E]tot (5.34)
where n is the number of enzyme subunits; kcat is the first-order rate constant; and[E]tot is the total holoenzyme concentration. For the most part, the right hand sideexpression of Eq. 5.34 was used in rate equations. Values for kcat, [E]tot and Vmax
were either obtained directly from the literature, calculated from specific activitiesof crude extracts and purified enzyme, estimated from specific activities relative toknown values, or combinations of these methods. The concentrations of membraneproteins, such as the glucose transporter (GLUT), was normalized to the cytosolicvolume. See Appendix C.1 for detailed calculations. Rate constants, enzyme con-centrations, and other parameters are listed in Tables 5.1–5.6.
Stellenbosch University http://scholar.sun.ac.za
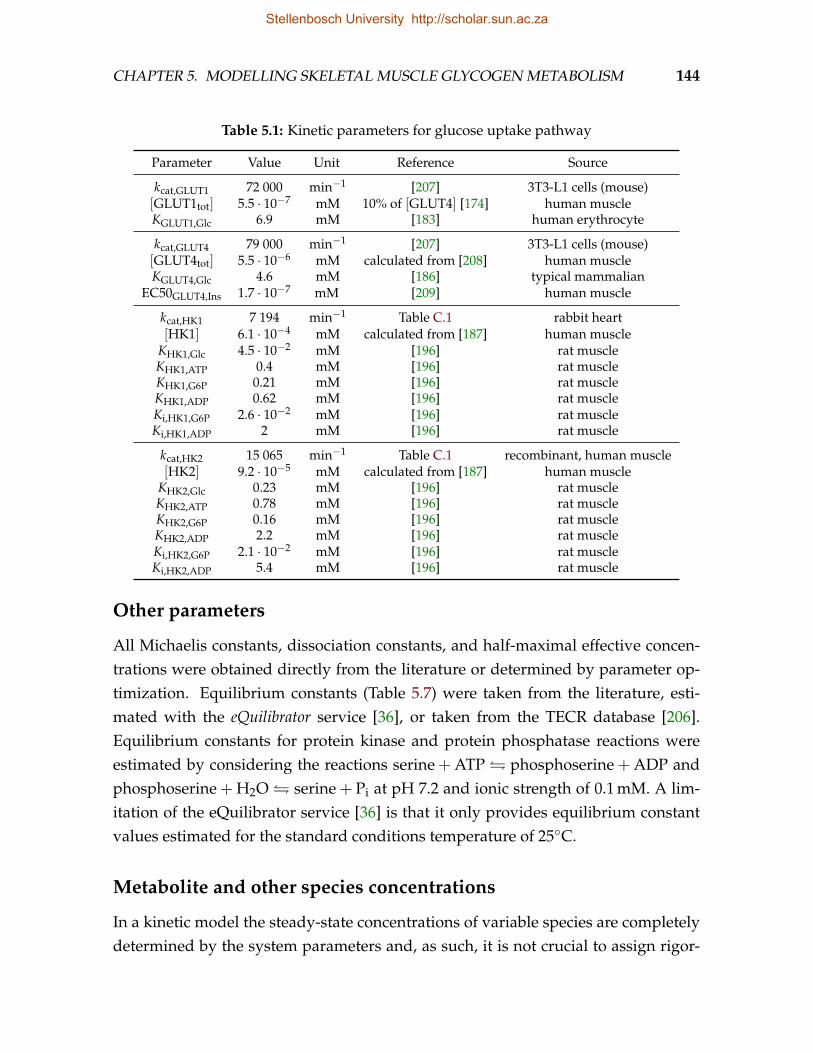
CHAPTER 5. MODELLING SKELETAL MUSCLE GLYCOGEN METABOLISM 144
Table 5.1: Kinetic parameters for glucose uptake pathway
Parameter Value Unit Reference Source
kcat,GLUT1 72 000 min−1 [207] 3T3-L1 cells (mouse)[GLUT1tot] 5.5 · 10−7 mM 10% of [GLUT4] [174] human muscleKGLUT1,Glc 6.9 mM [183] human erythrocyte
kcat,GLUT4 79 000 min−1 [207] 3T3-L1 cells (mouse)[GLUT4tot] 5.5 · 10−6 mM calculated from [208] human muscleKGLUT4,Glc 4.6 mM [186] typical mammalian
EC50GLUT4,Ins 1.7 · 10−7 mM [209] human muscle
kcat,HK1 7 194 min−1 Table C.1 rabbit heart[HK1] 6.1 · 10−4 mM calculated from [187] human muscle
KHK1,Glc 4.5 · 10−2 mM [196] rat muscleKHK1,ATP 0.4 mM [196] rat muscleKHK1,G6P 0.21 mM [196] rat muscleKHK1,ADP 0.62 mM [196] rat muscleKi,HK1,G6P 2.6 · 10−2 mM [196] rat muscleKi,HK1,ADP 2 mM [196] rat muscle
kcat,HK2 15 065 min−1 Table C.1 recombinant, human muscle[HK2] 9.2 · 10−5 mM calculated from [187] human muscle
KHK2,Glc 0.23 mM [196] rat muscleKHK2,ATP 0.78 mM [196] rat muscleKHK2,G6P 0.16 mM [196] rat muscleKHK2,ADP 2.2 mM [196] rat muscleKi,HK2,G6P 2.1 · 10−2 mM [196] rat muscleKi,HK2,ADP 5.4 mM [196] rat muscle
Other parameters
All Michaelis constants, dissociation constants, and half-maximal effective concen-trations were obtained directly from the literature or determined by parameter op-timization. Equilibrium constants (Table 5.7) were taken from the literature, esti-mated with the eQuilibrator service [36], or taken from the TECR database [206].Equilibrium constants for protein kinase and protein phosphatase reactions wereestimated by considering the reactions serine + ATP phosphoserine + ADP andphosphoserine + H2O serine + Pi at pH 7.2 and ionic strength of 0.1 mM. A lim-itation of the eQuilibrator service [36] is that it only provides equilibrium constantvalues estimated for the standard conditions temperature of 25C.
Metabolite and other species concentrations
In a kinetic model the steady-state concentrations of variable species are completelydetermined by the system parameters and, as such, it is not crucial to assign rigor-
Stellenbosch University http://scholar.sun.ac.za
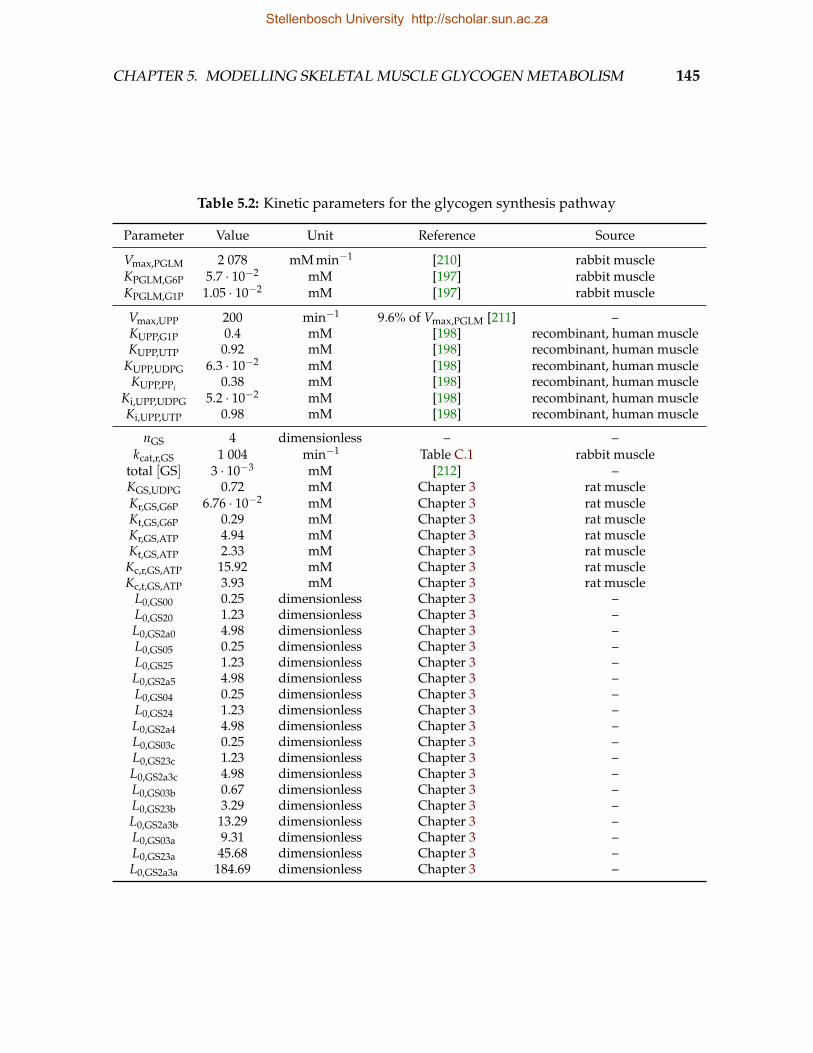
CHAPTER 5. MODELLING SKELETAL MUSCLE GLYCOGEN METABOLISM 145
Table 5.2: Kinetic parameters for the glycogen synthesis pathway
Parameter Value Unit Reference Source
Vmax,PGLM 2 078 mM min−1 [210] rabbit muscleKPGLM,G6P 5.7 · 10−2 mM [197] rabbit muscleKPGLM,G1P 1.05 · 10−2 mM [197] rabbit muscle
Vmax,UPP 200 min−1 9.6% of Vmax,PGLM [211] –KUPP,G1P 0.4 mM [198] recombinant, human muscleKUPP,UTP 0.92 mM [198] recombinant, human muscle
KUPP,UDPG 6.3 · 10−2 mM [198] recombinant, human muscleKUPP,PPi 0.38 mM [198] recombinant, human muscle
Ki,UPP,UDPG 5.2 · 10−2 mM [198] recombinant, human muscleKi,UPP,UTP 0.98 mM [198] recombinant, human muscle
nGS 4 dimensionless – –kcat,r,GS 1 004 min−1 Table C.1 rabbit muscle
total [GS] 3 · 10−3 mM [212] –KGS,UDPG 0.72 mM Chapter 3 rat muscleKr,GS,G6P 6.76 · 10−2 mM Chapter 3 rat muscleKt,GS,G6P 0.29 mM Chapter 3 rat muscleKr,GS,ATP 4.94 mM Chapter 3 rat muscleKt,GS,ATP 2.33 mM Chapter 3 rat muscle
Kc,r,GS,ATP 15.92 mM Chapter 3 rat muscleKc,t,GS,ATP 3.93 mM Chapter 3 rat muscle
L0,GS00 0.25 dimensionless Chapter 3 –L0,GS20 1.23 dimensionless Chapter 3 –L0,GS2a0 4.98 dimensionless Chapter 3 –L0,GS05 0.25 dimensionless Chapter 3 –L0,GS25 1.23 dimensionless Chapter 3 –L0,GS2a5 4.98 dimensionless Chapter 3 –L0,GS04 0.25 dimensionless Chapter 3 –L0,GS24 1.23 dimensionless Chapter 3 –L0,GS2a4 4.98 dimensionless Chapter 3 –L0,GS03c 0.25 dimensionless Chapter 3 –L0,GS23c 1.23 dimensionless Chapter 3 –L0,GS2a3c 4.98 dimensionless Chapter 3 –L0,GS03b 0.67 dimensionless Chapter 3 –L0,GS23b 3.29 dimensionless Chapter 3 –L0,GS2a3b 13.29 dimensionless Chapter 3 –L0,GS03a 9.31 dimensionless Chapter 3 –L0,GS23a 45.68 dimensionless Chapter 3 –L0,GS2a3a 184.69 dimensionless Chapter 3 –
Stellenbosch University http://scholar.sun.ac.za
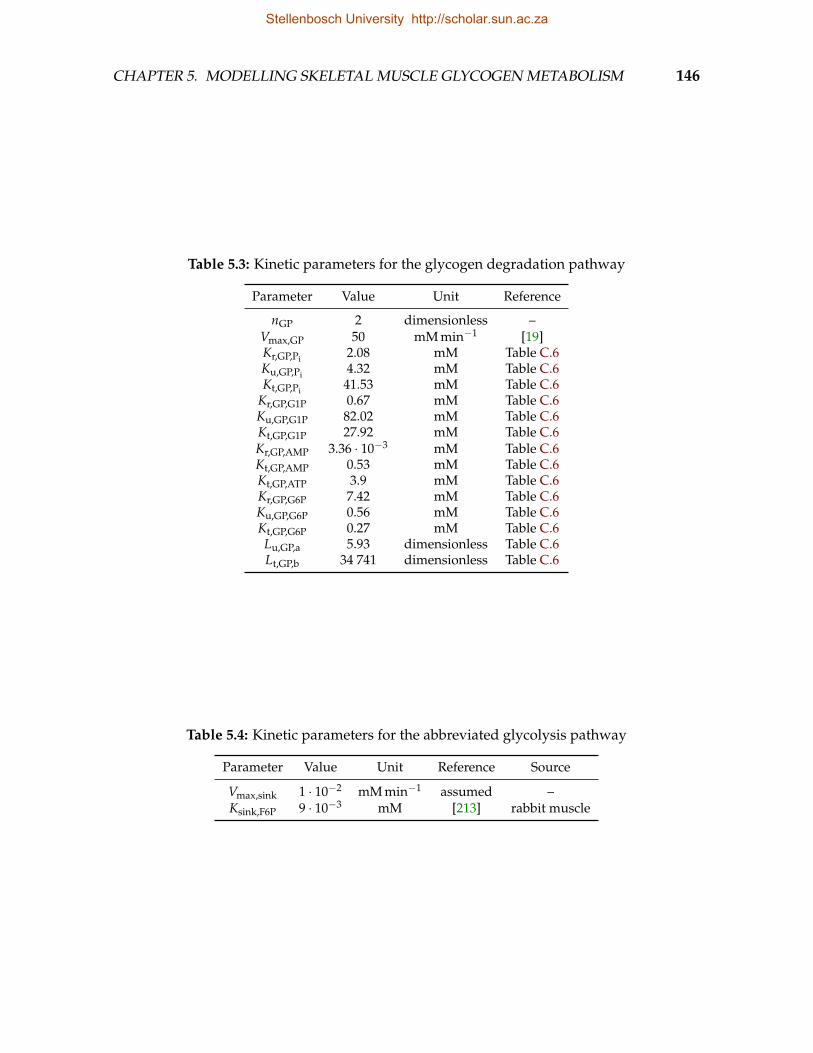
CHAPTER 5. MODELLING SKELETAL MUSCLE GLYCOGEN METABOLISM 146
Table 5.3: Kinetic parameters for the glycogen degradation pathway
Parameter Value Unit Reference
nGP 2 dimensionless –Vmax,GP 50 mM min−1 [19]Kr,GP,Pi 2.08 mM Table C.6Ku,GP,Pi 4.32 mM Table C.6Kt,GP,Pi 41.53 mM Table C.6
Kr,GP,G1P 0.67 mM Table C.6Ku,GP,G1P 82.02 mM Table C.6Kt,GP,G1P 27.92 mM Table C.6Kr,GP,AMP 3.36 · 10−3 mM Table C.6Kt,GP,AMP 0.53 mM Table C.6Kt,GP,ATP 3.9 mM Table C.6Kr,GP,G6P 7.42 mM Table C.6Ku,GP,G6P 0.56 mM Table C.6Kt,GP,G6P 0.27 mM Table C.6Lu,GP,a 5.93 dimensionless Table C.6Lt,GP,b 34 741 dimensionless Table C.6
Table 5.4: Kinetic parameters for the abbreviated glycolysis pathway
Parameter Value Unit Reference Source
Vmax,sink 1 · 10−2 mM min−1 assumed –Ksink,F6P 9 · 10−3 mM [213] rabbit muscle
Stellenbosch University http://scholar.sun.ac.za
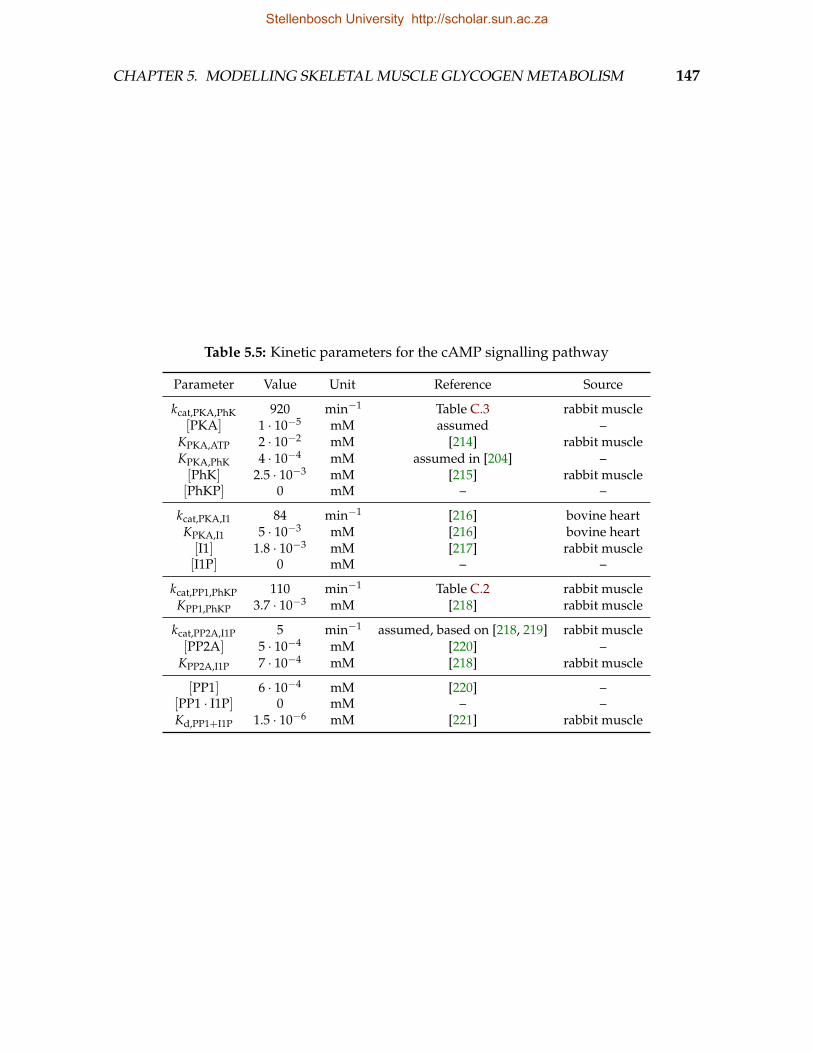
CHAPTER 5. MODELLING SKELETAL MUSCLE GLYCOGEN METABOLISM 147
Table 5.5: Kinetic parameters for the cAMP signalling pathway
Parameter Value Unit Reference Source
kcat,PKA,PhK 920 min−1 Table C.3 rabbit muscle[PKA] 1 · 10−5 mM assumed –
KPKA,ATP 2 · 10−2 mM [214] rabbit muscleKPKA,PhK 4 · 10−4 mM assumed in [204] –[PhK] 2.5 · 10−3 mM [215] rabbit muscle[PhKP] 0 mM – –
kcat,PKA,I1 84 min−1 [216] bovine heartKPKA,I1 5 · 10−3 mM [216] bovine heart[I1] 1.8 · 10−3 mM [217] rabbit muscle[I1P] 0 mM – –
kcat,PP1,PhKP 110 min−1 Table C.2 rabbit muscleKPP1,PhKP 3.7 · 10−3 mM [218] rabbit muscle
kcat,PP2A,I1P 5 min−1 assumed, based on [218, 219] rabbit muscle[PP2A] 5 · 10−4 mM [220] –
KPP2A,I1P 7 · 10−4 mM [218] rabbit muscle
[PP1] 6 · 10−4 mM [220] –[PP1 · I1P] 0 mM – –Kd,PP1+I1P 1.5 · 10−6 mM [221] rabbit muscle
Stellenbosch University http://scholar.sun.ac.za
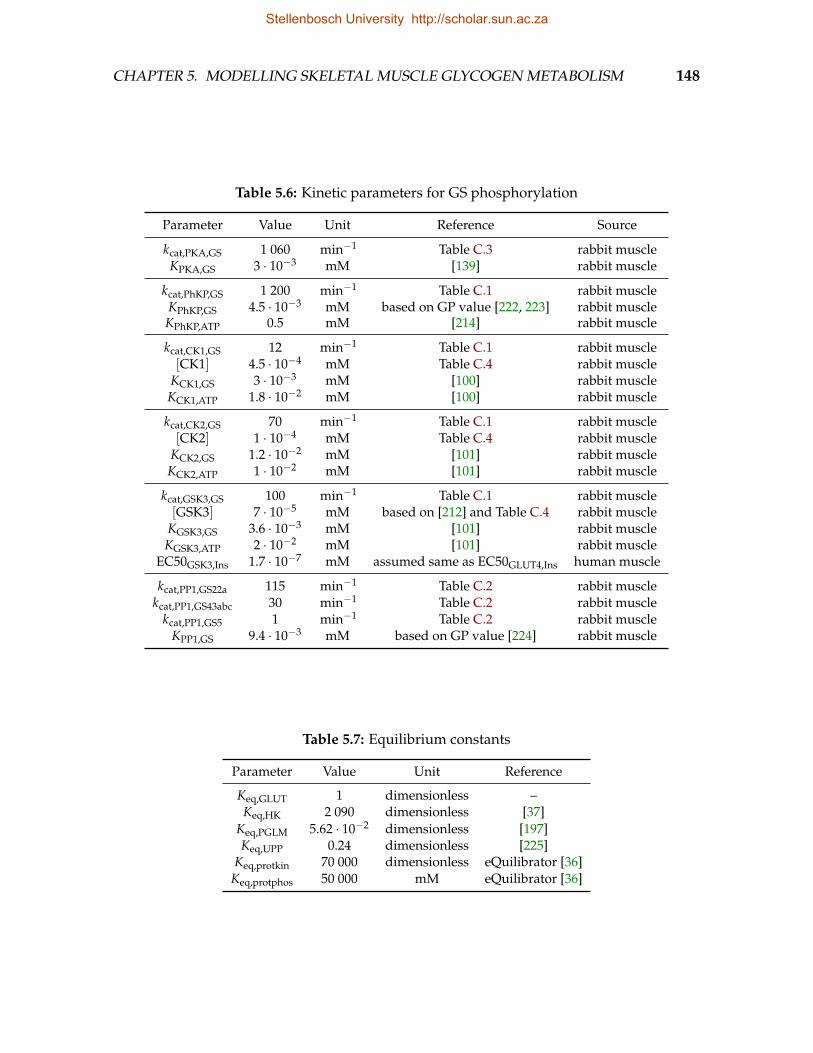
CHAPTER 5. MODELLING SKELETAL MUSCLE GLYCOGEN METABOLISM 148
Table 5.6: Kinetic parameters for GS phosphorylation
Parameter Value Unit Reference Source
kcat,PKA,GS 1 060 min−1 Table C.3 rabbit muscleKPKA,GS 3 · 10−3 mM [139] rabbit muscle
kcat,PhKP,GS 1 200 min−1 Table C.1 rabbit muscleKPhKP,GS 4.5 · 10−3 mM based on GP value [222, 223] rabbit muscleKPhKP,ATP 0.5 mM [214] rabbit muscle
kcat,CK1,GS 12 min−1 Table C.1 rabbit muscle[CK1] 4.5 · 10−4 mM Table C.4 rabbit muscle
KCK1,GS 3 · 10−3 mM [100] rabbit muscleKCK1,ATP 1.8 · 10−2 mM [100] rabbit muscle
kcat,CK2,GS 70 min−1 Table C.1 rabbit muscle[CK2] 1 · 10−4 mM Table C.4 rabbit muscle
KCK2,GS 1.2 · 10−2 mM [101] rabbit muscleKCK2,ATP 1 · 10−2 mM [101] rabbit muscle
kcat,GSK3,GS 100 min−1 Table C.1 rabbit muscle[GSK3] 7 · 10−5 mM based on [212] and Table C.4 rabbit muscle
KGSK3,GS 3.6 · 10−3 mM [101] rabbit muscleKGSK3,ATP 2 · 10−2 mM [101] rabbit muscle
EC50GSK3,Ins 1.7 · 10−7 mM assumed same as EC50GLUT4,Ins human muscle
kcat,PP1,GS22a 115 min−1 Table C.2 rabbit musclekcat,PP1,GS43abc 30 min−1 Table C.2 rabbit muscle
kcat,PP1,GS5 1 min−1 Table C.2 rabbit muscleKPP1,GS 9.4 · 10−3 mM based on GP value [224] rabbit muscle
Table 5.7: Equilibrium constants
Parameter Value Unit Reference
Keq,GLUT 1 dimensionless –Keq,HK 2 090 dimensionless [37]
Keq,PGLM 5.62 · 10−2 dimensionless [197]Keq,UPP 0.24 dimensionless [225]
Keq,protkin 70 000 dimensionless eQuilibrator [36]Keq,protphos 50 000 mM eQuilibrator [36]
Stellenbosch University http://scholar.sun.ac.za
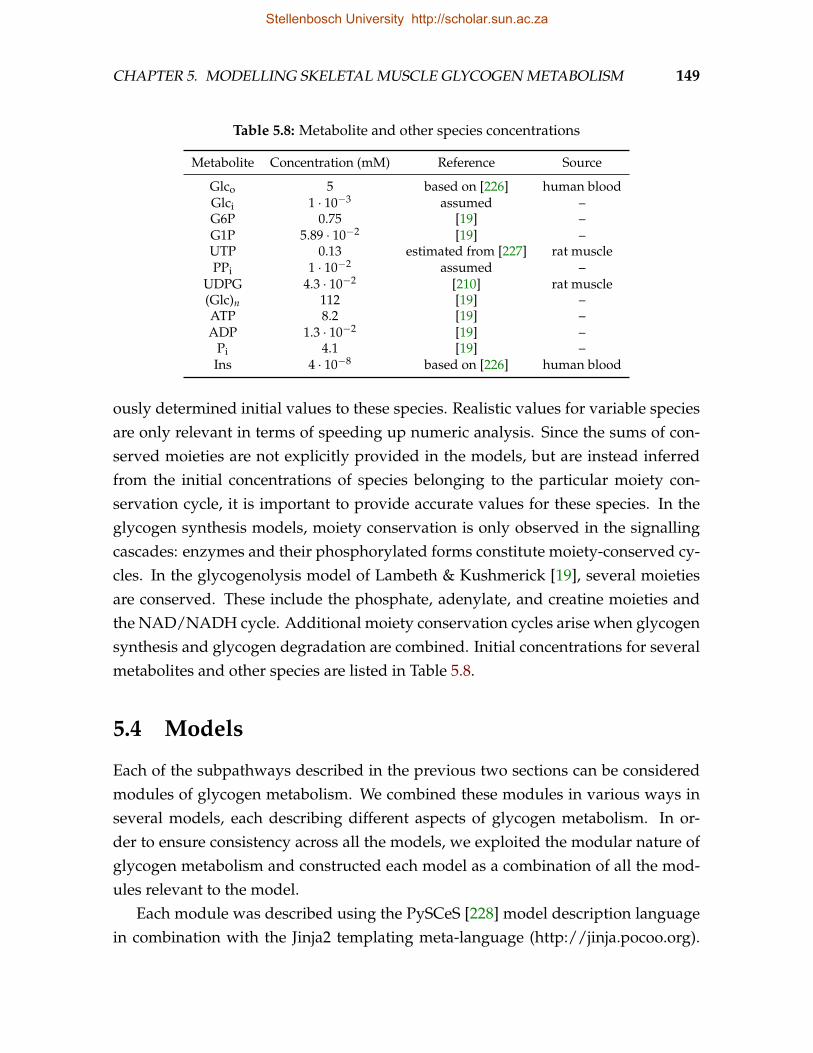
CHAPTER 5. MODELLING SKELETAL MUSCLE GLYCOGEN METABOLISM 149
Table 5.8: Metabolite and other species concentrations
Metabolite Concentration (mM) Reference Source
Glco 5 based on [226] human bloodGlci 1 · 10−3 assumed –G6P 0.75 [19] –G1P 5.89 · 10−2 [19] –UTP 0.13 estimated from [227] rat musclePPi 1 · 10−2 assumed –
UDPG 4.3 · 10−2 [210] rat muscle(Glc)n 112 [19] –ATP 8.2 [19] –ADP 1.3 · 10−2 [19] –
Pi 4.1 [19] –Ins 4 · 10−8 based on [226] human blood
ously determined initial values to these species. Realistic values for variable speciesare only relevant in terms of speeding up numeric analysis. Since the sums of con-served moieties are not explicitly provided in the models, but are instead inferredfrom the initial concentrations of species belonging to the particular moiety con-servation cycle, it is important to provide accurate values for these species. In theglycogen synthesis models, moiety conservation is only observed in the signallingcascades: enzymes and their phosphorylated forms constitute moiety-conserved cy-cles. In the glycogenolysis model of Lambeth & Kushmerick [19], several moietiesare conserved. These include the phosphate, adenylate, and creatine moieties andthe NAD/NADH cycle. Additional moiety conservation cycles arise when glycogensynthesis and glycogen degradation are combined. Initial concentrations for severalmetabolites and other species are listed in Table 5.8.
5.4 Models
Each of the subpathways described in the previous two sections can be consideredmodules of glycogen metabolism. We combined these modules in various ways inseveral models, each describing different aspects of glycogen metabolism. In or-der to ensure consistency across all the models, we exploited the modular nature ofglycogen metabolism and constructed each model as a combination of all the mod-ules relevant to the model.
Each module was described using the PySCeS [228] model description languagein combination with the Jinja2 templating meta-language (http://jinja.pocoo.org).
Stellenbosch University http://scholar.sun.ac.za
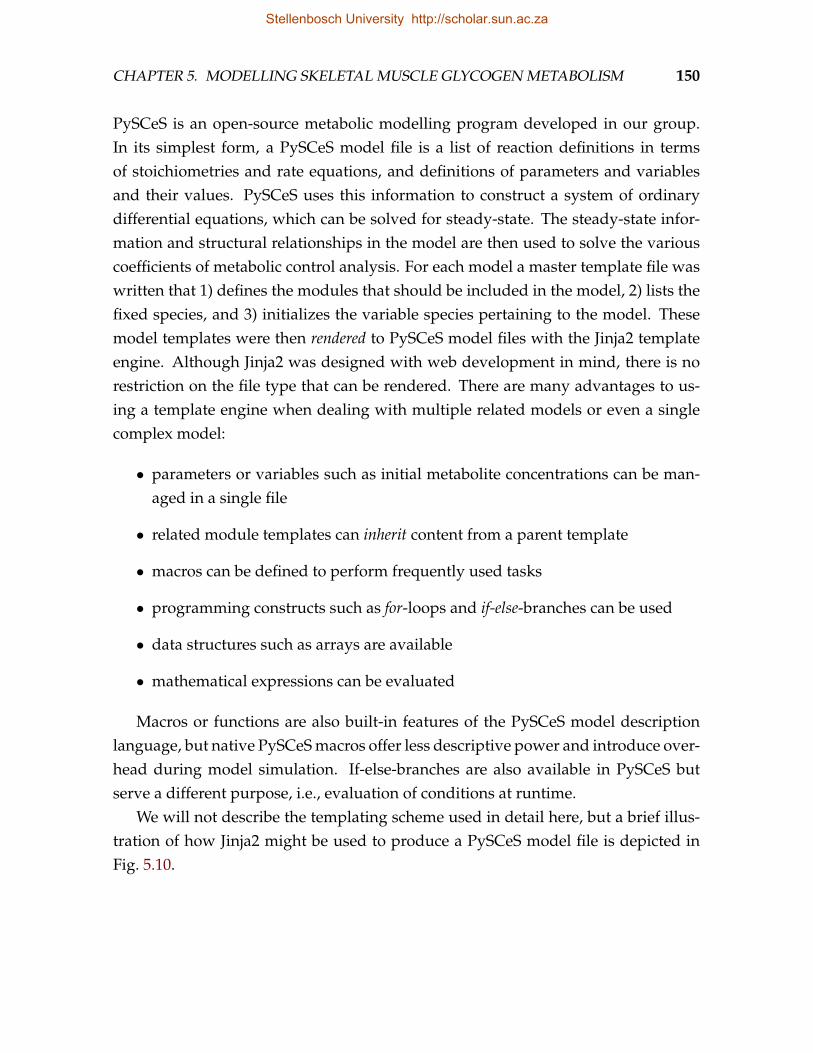
CHAPTER 5. MODELLING SKELETAL MUSCLE GLYCOGEN METABOLISM 150
PySCeS is an open-source metabolic modelling program developed in our group.In its simplest form, a PySCeS model file is a list of reaction definitions in termsof stoichiometries and rate equations, and definitions of parameters and variablesand their values. PySCeS uses this information to construct a system of ordinarydifferential equations, which can be solved for steady-state. The steady-state infor-mation and structural relationships in the model are then used to solve the variouscoefficients of metabolic control analysis. For each model a master template file waswritten that 1) defines the modules that should be included in the model, 2) lists thefixed species, and 3) initializes the variable species pertaining to the model. Thesemodel templates were then rendered to PySCeS model files with the Jinja2 templateengine. Although Jinja2 was designed with web development in mind, there is norestriction on the file type that can be rendered. There are many advantages to us-ing a template engine when dealing with multiple related models or even a singlecomplex model:
• parameters or variables such as initial metabolite concentrations can be man-aged in a single file
• related module templates can inherit content from a parent template
• macros can be defined to perform frequently used tasks
• programming constructs such as for-loops and if-else-branches can be used
• data structures such as arrays are available
• mathematical expressions can be evaluated
Macros or functions are also built-in features of the PySCeS model descriptionlanguage, but native PySCeS macros offer less descriptive power and introduce over-head during model simulation. If-else-branches are also available in PySCeS butserve a different purpose, i.e., evaluation of conditions at runtime.
We will not describe the templating scheme used in detail here, but a brief illus-tration of how Jinja2 might be used to produce a PySCeS model file is depicted inFig. 5.10.
Stellenbosch University http://scholar.sun.ac.za
CHAPTER 5. MODELLING SKELETAL MUSCLE GLYCOGEN METABOLISM 151
sample.ptl sample.psc
FIX: S1 S4
% for i in range(1,4) %
vi:
Si = Si+1
Vmaxi/Kmsi*(Si-Si+1/Keqi)
/(1+Si/Kmsi+Si+1/Kmpi)
% endfor %
FIX: S1 S4
v1:
S1 = S2
Vmax1/Kms1*(S1-S2/Keq1)
/(1+S1/Kms1+S2/Kmp1)
v2:
S2 = S3
Vmax2/Kms2*(S2-S3/Keq2)
/(1+S2/Kms2+S3/Kmp2)
v3:
S3 = S4
Vmax3/Kms3*(S3-S4/Keq3)
/(1+S3/Kms3+S4/Kmp3)
Figure 5.10: Excerpt from an example Jinja2 template file (sample.ptl) and the resultingPySCeS file (sample.psc). The example demonstrates the use of for-loops to contract repet-itive snippets. All model modules were programmed as Jinja2 template files, which werecombined in various ways in master templates and subsequently rendered with the Jinja2templating engine as PySCeS model files.
GlySynth
The GlySynth model describes the synthesis of glycogen from external glucose. Itcomprises modules describing glucose uptake, glycogen synthesis, GLUT4 traffick-ing, the cAMP-dependent cascade (excluding PKA activation and inhibition), andinsulin signalling. Although the concentration of GLUT4 that is present in the sar-colemma is treated as a fixed species, the activation term in the GLUT4 rate equationdescribes an effective increase in [GLUT4mem]. Similarly, instead of including boththe phosphorylated and dephosphorylated forms of GSK3 in the model, the inhibi-tion of GSK3 by insulin is described as an apparent decrease in the concentration ofGSK3. The fixed species are: Glco, ATP, ADP, UTP, PPi, UDP, glycogen, and Pi.
GlySynthExp
This model is essentially the same as GlySynth. However, instead of including aninsulin activation term in the GLUT4 rate equation, the concentration of plasmamembrane GLUT4 is set explicitly (hence ‘Exp’). Similarly, GS phosphorylation
Stellenbosch University http://scholar.sun.ac.za
CHAPTER 5. MODELLING SKELETAL MUSCLE GLYCOGEN METABOLISM 152
and dephosphorylation as regulated by cAMP and insulin are modelled explicitlythrough the parameter L0, which really is a function of the concentrations of thevarious GS phosphorylation states. The advantage of this model is that it allowsthe function of GS phosphorylation to be investigated without concern for the sig-nalling pathways that would bring about the phosphorylation. The fixed speciesare: Glco, ATP, ADP, UTP, PPi, UDP, and glycogen. The values for L0 = 5.6 and[GLUT4mem] = 1 × 10⁻⁶ mM were taken from the corresponding variables inGlySynth at basal insulin concentration.
LamKus
This model is an exact implementation of the mammalian muscle glycogenolysismodel described by Lambeth & Kushmerick [19]. Since GP is present in only twophosphorylation states, it does not include any phosphorylation cascades, but ratherdescribes GP phosphorylation with the parameter fGPa , the fraction of GS in thephosphorylated form. The model was implemented as a glycogen degradation mod-ule and a glycolysis module. As described later, the rate equation for GP was substi-tuted with a MWC-type rate equation as a variation of the model.
GlyMetExp
We combined the GlySynthExp and LamKus models in an overall model of glycogenmetabolism. As described later, additional rate equations and modifications wererequired to ensure stoichiometric consistency. The fixed species are: Glco, glycogen,and lactate.
In the next chapter we will use the models presented here to analyse the regula-tory design of skeletal muscle glycogen metabolism.
Stellenbosch University http://scholar.sun.ac.za
Chapter 6
Regulatory design of glycogenmetabolism
6.1 Introduction
The regulatory design of a metabolic system can be defined as the functional orga-nization of the mechanisms that regulate it. The notion of regulation is, however,itself in need of definition. Traditionally, discussions of regulation in metabolism aremainly concerned with the control of flux in a system [77]. In this paradigm, enzymemodification, whether allosteric or covalent, is immediately considered a mechanismof flux control. In contrast, we here consider regulation as the concurrent control offlux and metabolite concentrations in an effort to absorb environmental perturba-tions. An investigation of the regulatory design of a metabolic system is, therefore,one that considers how enzyme activities are modified in coordination in order tobring about required changes in flux while maintaining metabolite concentrationswithin acceptable ranges. We wish to emphasize that the notion of design, as usedhere, is one that is completely void of intent and purpose.
In this chapter we analyse the models described in the previous chapter withthe aim of elucidating the regulatory design of muscle glycogen metabolism. Webegin with a brief review of the analytic frameworks that will be used in this re-gard. We proceed to discuss the function of the allosteric and covalent regulationof glycogen synthase (GS) in the glycogen synthesis pathway and consider the rel-ative importance of allosteric and covalent regulation in fulfilling this function. Wealso consider the function of the modification of glycogen phosphorylase (GP) inthe glycogen degradation pathway. In conclusion, we discuss the requirements of
153
Stellenbosch University http://scholar.sun.ac.za
CHAPTER 6. REGULATORY DESIGN OF GLYCOGEN METABOLISM 154
constructing a combined model of glycogen synthesis and degradation.
6.2 Analytic frameworks
Supply-demand analysis
It is sometimes desirable to step back from the detail of a complex metabolic path-way and group reactions together in blocks linked by common intermediary me-tabolites [229, 230]. It has been shown that such grouped metabolic systems can beinvestigated with conventional metabolic control analysis (MCA). Supply-demandanalysis (SDA) is a control analytic approach in which a metabolic system is dividedinto supply and demand blocks around a linking metabolite [15, 231]. The linkingmetabolite is the end product of the supply block and the initial substrate of the de-mand block. SDA around the linking metabolite is visually represented by plottingthe rate characteristics of the supply and demand blocks on the same graph [231]. Arate characteristic is generated for each block as a log-log plot of the rate of the blockagainst the concentration the linking metabolite by treating the linking metabolite asa parameter of the block. Such a rate characteristic therefore represents the variationin flux of the isolated block with regard to changes in the linking metabolite concen-tration. The intersection of the supply and demand rate characteristics indicates thesteady-state of the supply-demand system. Regulatory metabolites, i.e. metabolites in-volved in feedback or feedforward loops, and branch point metabolites are generallygood choices of linking metabolite. A general method has been proposed by whichinvestigator bias can be removed in the process of selecting the linking metabolite[232].
As is the case for individual enzymes, each block can be assigned a flux-controland concentration-control coefficient and these can be expressed in terms of theblock elasticities with respect to the linking metabolite [229, 230, 233]. Block elas-ticities, in turn, can be expressed in terms of the properties of the isolated blocks.In particular, since the rate of a block equals the flux through the isolated block, ablock elasticity is the same as the flux-response coefficient of the particular block,considered in isolation, with respect to the linking metabolite:
Stellenbosch University http://scholar.sun.ac.za
CHAPTER 6. REGULATORY DESIGN OF GLYCOGEN METABOLISM 155
εvblockis = RJi
s (6.1)
= ∑j
C Jivj ε
vjs (6.2)
where i denotes the block in question; s is the linking metabolite; Ji is the flux withinthe isolated block (i.e. with fixed s); and j is any enzyme within block i that is sensi-tive to s.
Co-response analysis
In the introduction to MCA in Section 4.4, we have only considered the effect ofperturbations on single steady-state variables. It is, however, instructive to considerhow steady-state variables co-respond to perturbations. The co-response coefficientquantifies the relative change in two steady-state variables y1 and y2 in response toperturbation of a parameter p [234]:
Ωy1:y2p =
Ry1p
Ry2p
=
∑i
Cy1vi ε
vip
∑i
Cy2vi ε
vip
(6.3)
If only a single enzymatic step j is sensitive to p, then the expression for Ωy1:y2p
simplifies to that of the co-control coefficient:
Oy1:y2vj =
Cy1vj
Cy2vj
(6.4)
If y1 is a flux and y2 is a metabolite concentration, the co-response coefficient canbe considered a quantification of metabolite homeostasis or structural stability. Alarge co-response coefficient indicates that metabolite y2 changes minimally in theface of a large change in flux y1, given the change to parameter p.
MCA (as introduced in Section 4.4), SDA, and co-response analysis will be usedin our investigation of the regulatory design of glycogen metabolism.
6.3 Glycogen synthesis as a supply-demand system
The glycogen synthesis pathway can be considered a supply-demand system ofglucose-6-phosphate (G6P) in which glucose uptake (glucose transporter (GLUT)
Stellenbosch University http://scholar.sun.ac.za
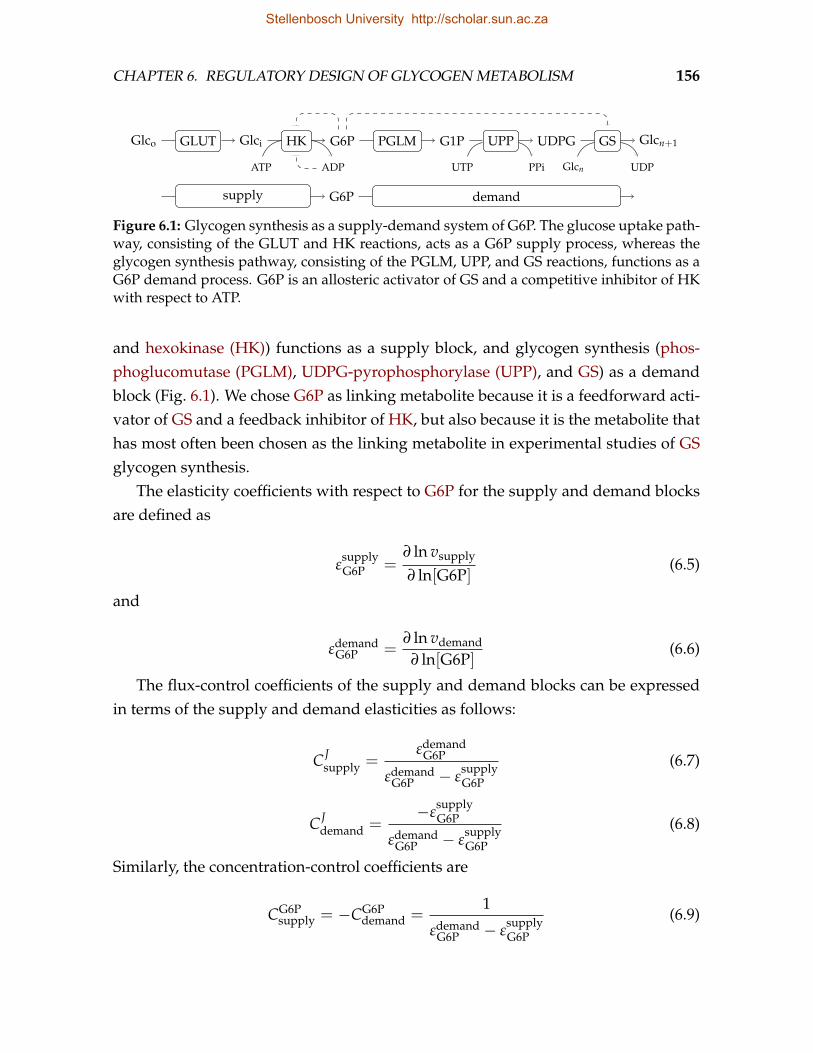
CHAPTER 6. REGULATORY DESIGN OF GLYCOGEN METABOLISM 156
Glco GLUT Glci HK G6P
ATP ADP
PGLM G1P UPP
UTP PPi
UDPG GS Glcn+1
Glcn UDP
Glco supply G6P demand
Figure 6.1: Glycogen synthesis as a supply-demand system of G6P. The glucose uptake path-way, consisting of the GLUT and HK reactions, acts as a G6P supply process, whereas theglycogen synthesis pathway, consisting of the PGLM, UPP, and GS reactions, functions as aG6P demand process. G6P is an allosteric activator of GS and a competitive inhibitor of HKwith respect to ATP.
and hexokinase (HK)) functions as a supply block, and glycogen synthesis (phos-phoglucomutase (PGLM), UDPG-pyrophosphorylase (UPP), and GS) as a demandblock (Fig. 6.1). We chose G6P as linking metabolite because it is a feedforward acti-vator of GS and a feedback inhibitor of HK, but also because it is the metabolite thathas most often been chosen as the linking metabolite in experimental studies of GSglycogen synthesis.
The elasticity coefficients with respect to G6P for the supply and demand blocksare defined as
εsupplyG6P =
∂ ln vsupply
∂ ln[G6P](6.5)
and
εdemandG6P =
∂ ln vdemand
∂ ln[G6P](6.6)
The flux-control coefficients of the supply and demand blocks can be expressedin terms of the supply and demand elasticities as follows:
C Jsupply =
εdemandG6P
εdemandG6P − ε
supplyG6P
(6.7)
C Jdemand =
−εsupplyG6P
εdemandG6P − ε
supplyG6P
(6.8)
Similarly, the concentration-control coefficients are
CG6Psupply = −CG6P
demand =1
εdemandG6P − ε
supplyG6P
(6.9)
Stellenbosch University http://scholar.sun.ac.za
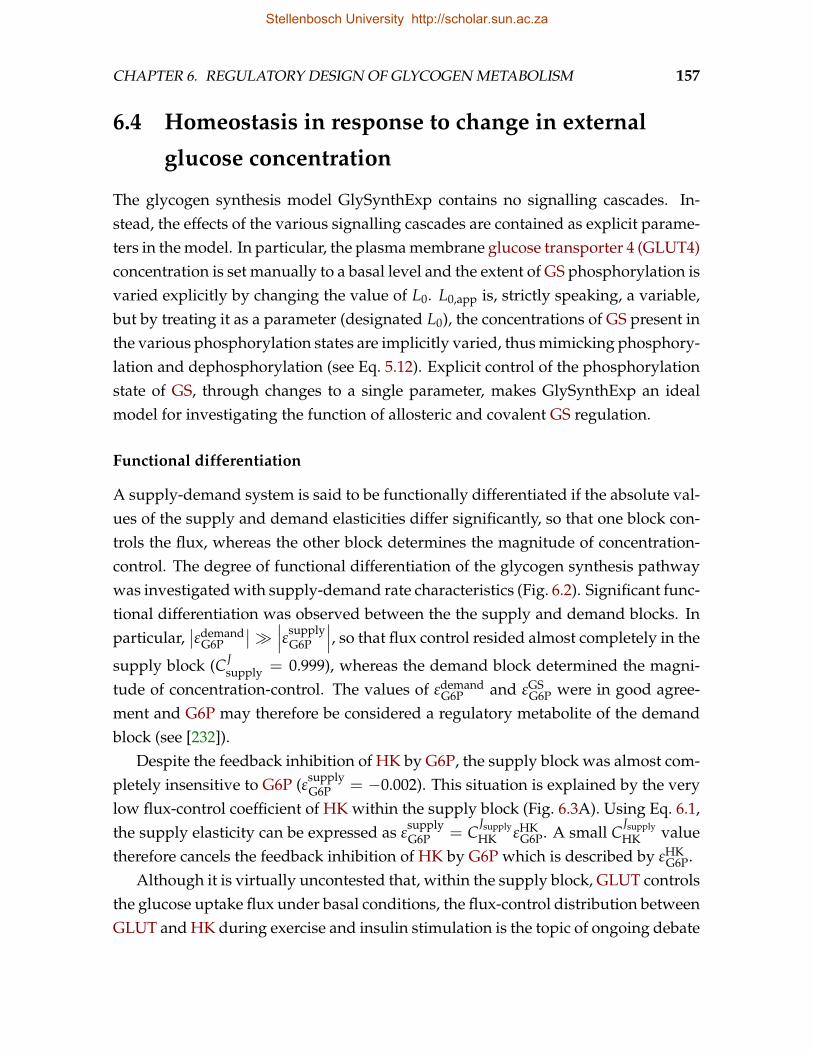
CHAPTER 6. REGULATORY DESIGN OF GLYCOGEN METABOLISM 157
6.4 Homeostasis in response to change in external
glucose concentration
The glycogen synthesis model GlySynthExp contains no signalling cascades. In-stead, the effects of the various signalling cascades are contained as explicit parame-ters in the model. In particular, the plasma membrane glucose transporter 4 (GLUT4)concentration is set manually to a basal level and the extent of GS phosphorylation isvaried explicitly by changing the value of L0. L0,app is, strictly speaking, a variable,but by treating it as a parameter (designated L0), the concentrations of GS present inthe various phosphorylation states are implicitly varied, thus mimicking phosphory-lation and dephosphorylation (see Eq. 5.12). Explicit control of the phosphorylationstate of GS, through changes to a single parameter, makes GlySynthExp an idealmodel for investigating the function of allosteric and covalent GS regulation.
Functional differentiation
A supply-demand system is said to be functionally differentiated if the absolute val-ues of the supply and demand elasticities differ significantly, so that one block con-trols the flux, whereas the other block determines the magnitude of concentration-control. The degree of functional differentiation of the glycogen synthesis pathwaywas investigated with supply-demand rate characteristics (Fig. 6.2). Significant func-tional differentiation was observed between the the supply and demand blocks. Inparticular,
∣∣εdemandG6P
∣∣∣∣∣εsupply
G6P
∣∣∣, so that flux control resided almost completely in the
supply block (C Jsupply = 0.999), whereas the demand block determined the magni-
tude of concentration-control. The values of εdemandG6P and εGS
G6P were in good agree-ment and G6P may therefore be considered a regulatory metabolite of the demandblock (see [232]).
Despite the feedback inhibition of HK by G6P, the supply block was almost com-pletely insensitive to G6P (εsupply
G6P = −0.002). This situation is explained by the verylow flux-control coefficient of HK within the supply block (Fig. 6.3A). Using Eq. 6.1,the supply elasticity can be expressed as ε
supplyG6P = C
JsupplyHK εHK
G6P. A small CJsupplyHK value
therefore cancels the feedback inhibition of HK by G6P which is described by εHKG6P.
Although it is virtually uncontested that, within the supply block, GLUT controlsthe glucose uptake flux under basal conditions, the flux-control distribution betweenGLUT and HK during exercise and insulin stimulation is the topic of ongoing debate
Stellenbosch University http://scholar.sun.ac.za
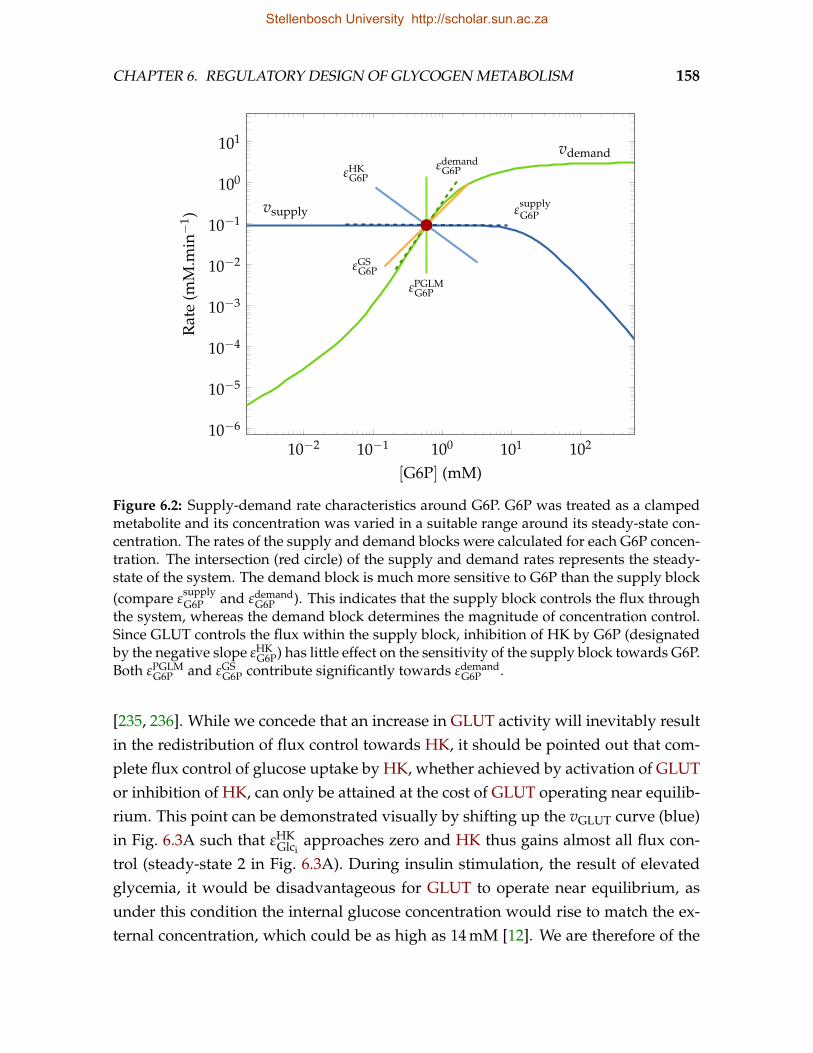
CHAPTER 6. REGULATORY DESIGN OF GLYCOGEN METABOLISM 158
10−2 10−1 100 101 10210−6
10−5
10−4
10−3
10−2
10−1
100
101
vsupply
vdemand
εGSG6P
εPGLMG6P
εHKG6P
εdemandG6P
εsupplyG6P
[G6P] (mM)
Rat
e(m
M.m
in−
1 )
Figure 6.2: Supply-demand rate characteristics around G6P. G6P was treated as a clampedmetabolite and its concentration was varied in a suitable range around its steady-state con-centration. The rates of the supply and demand blocks were calculated for each G6P concen-tration. The intersection (red circle) of the supply and demand rates represents the steady-state of the system. The demand block is much more sensitive to G6P than the supply block(compare ε
supplyG6P and εdemand
G6P ). This indicates that the supply block controls the flux throughthe system, whereas the demand block determines the magnitude of concentration control.Since GLUT controls the flux within the supply block, inhibition of HK by G6P (designatedby the negative slope εHK
G6P) has little effect on the sensitivity of the supply block towards G6P.Both εPGLM
G6P and εGSG6P contribute significantly towards εdemand
G6P .
[235, 236]. While we concede that an increase in GLUT activity will inevitably resultin the redistribution of flux control towards HK, it should be pointed out that com-plete flux control of glucose uptake by HK, whether achieved by activation of GLUTor inhibition of HK, can only be attained at the cost of GLUT operating near equilib-rium. This point can be demonstrated visually by shifting up the vGLUT curve (blue)in Fig. 6.3A such that εHK
Glciapproaches zero and HK thus gains almost all flux con-
trol (steady-state 2 in Fig. 6.3A). During insulin stimulation, the result of elevatedglycemia, it would be disadvantageous for GLUT to operate near equilibrium, asunder this condition the internal glucose concentration would rise to match the ex-ternal concentration, which could be as high as 14 mM [12]. We are therefore of the
Stellenbosch University http://scholar.sun.ac.za
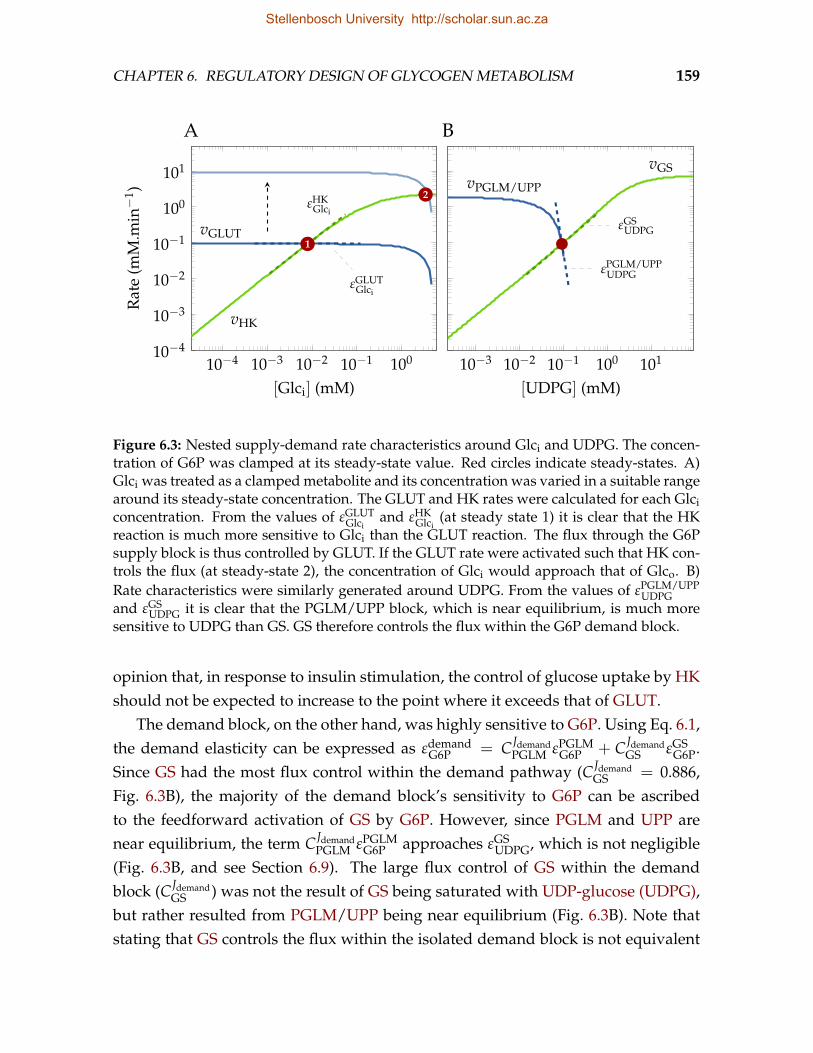
CHAPTER 6. REGULATORY DESIGN OF GLYCOGEN METABOLISM 159
10−4 10−3 10−2 10−1 10010−4
10−3
10−2
10−1
100
101
vGLUT
vHK
2
εGLUTGlci
εHKGlci
1
[Glci] (mM)
Rat
e(m
M.m
in−
1 )A
10−3 10−2 10−1 100 101
vPGLM/UPP
vGS
εPGLM/UPPUDPG
εGSUDPG
[UDPG] (mM)
B
Figure 6.3: Nested supply-demand rate characteristics around Glci and UDPG. The concen-tration of G6P was clamped at its steady-state value. Red circles indicate steady-states. A)Glci was treated as a clamped metabolite and its concentration was varied in a suitable rangearound its steady-state concentration. The GLUT and HK rates were calculated for each Glciconcentration. From the values of εGLUT
Glciand εHK
Glci(at steady state 1) it is clear that the HK
reaction is much more sensitive to Glci than the GLUT reaction. The flux through the G6Psupply block is thus controlled by GLUT. If the GLUT rate were activated such that HK con-trols the flux (at steady-state 2), the concentration of Glci would approach that of Glco. B)Rate characteristics were similarly generated around UDPG. From the values of εPGLM/UPP
UDPGand εGS
UDPG it is clear that the PGLM/UPP block, which is near equilibrium, is much moresensitive to UDPG than GS. GS therefore controls the flux within the G6P demand block.
opinion that, in response to insulin stimulation, the control of glucose uptake by HKshould not be expected to increase to the point where it exceeds that of GLUT.
The demand block, on the other hand, was highly sensitive to G6P. Using Eq. 6.1,the demand elasticity can be expressed as εdemand
G6P = C JdemandPGLM εPGLM
G6P + C JdemandGS εGS
G6P.Since GS had the most flux control within the demand pathway (C Jdemand
GS = 0.886,Fig. 6.3B), the majority of the demand block’s sensitivity to G6P can be ascribedto the feedforward activation of GS by G6P. However, since PGLM and UPP arenear equilibrium, the term C Jdemand
PGLM εPGLMG6P approaches εGS
UDPG, which is not negligible(Fig. 6.3B, and see Section 6.9). The large flux control of GS within the demandblock (C Jdemand
GS ) was not the result of GS being saturated with UDP-glucose (UDPG),but rather resulted from PGLM/UPP being near equilibrium (Fig. 6.3B). Note thatstating that GS controls the flux within the isolated demand block is not equivalent
Stellenbosch University http://scholar.sun.ac.za
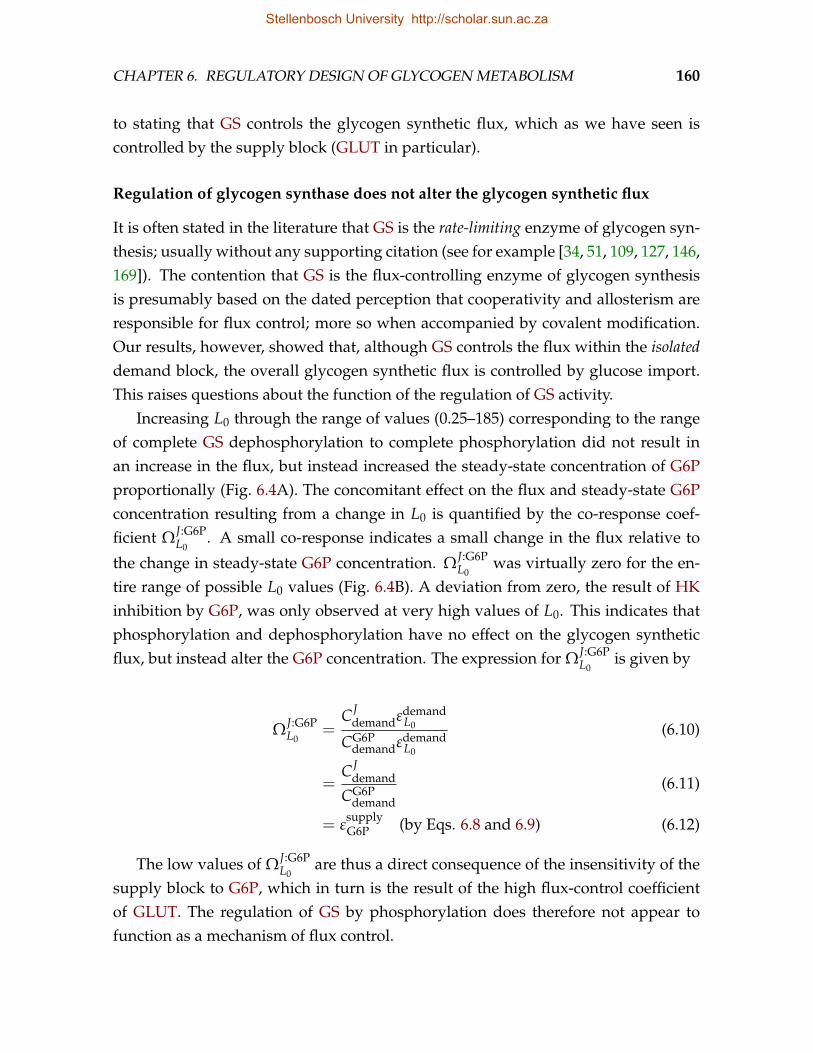
CHAPTER 6. REGULATORY DESIGN OF GLYCOGEN METABOLISM 160
to stating that GS controls the glycogen synthetic flux, which as we have seen iscontrolled by the supply block (GLUT in particular).
Regulation of glycogen synthase does not alter the glycogen synthetic flux
It is often stated in the literature that GS is the rate-limiting enzyme of glycogen syn-thesis; usually without any supporting citation (see for example [34, 51, 109, 127, 146,169]). The contention that GS is the flux-controlling enzyme of glycogen synthesisis presumably based on the dated perception that cooperativity and allosterism areresponsible for flux control; more so when accompanied by covalent modification.Our results, however, showed that, although GS controls the flux within the isolateddemand block, the overall glycogen synthetic flux is controlled by glucose import.This raises questions about the function of the regulation of GS activity.
Increasing L0 through the range of values (0.25–185) corresponding to the rangeof complete GS dephosphorylation to complete phosphorylation did not result inan increase in the flux, but instead increased the steady-state concentration of G6Pproportionally (Fig. 6.4A). The concomitant effect on the flux and steady-state G6Pconcentration resulting from a change in L0 is quantified by the co-response coef-ficient ΩJ:G6P
L0. A small co-response indicates a small change in the flux relative to
the change in steady-state G6P concentration. ΩJ:G6PL0
was virtually zero for the en-tire range of possible L0 values (Fig. 6.4B). A deviation from zero, the result of HKinhibition by G6P, was only observed at very high values of L0. This indicates thatphosphorylation and dephosphorylation have no effect on the glycogen syntheticflux, but instead alter the G6P concentration. The expression for ΩJ:G6P
L0is given by
ΩJ:G6PL0
=C J
demandεdemandL0
CG6Pdemandεdemand
L0
(6.10)
=C J
demand
CG6Pdemand
(6.11)
= εsupplyG6P (by Eqs. 6.8 and 6.9) (6.12)
The low values of ΩJ:G6PL0
are thus a direct consequence of the insensitivity of thesupply block to G6P, which in turn is the result of the high flux-control coefficientof GLUT. The regulation of GS by phosphorylation does therefore not appear tofunction as a mechanism of flux control.
Stellenbosch University http://scholar.sun.ac.za
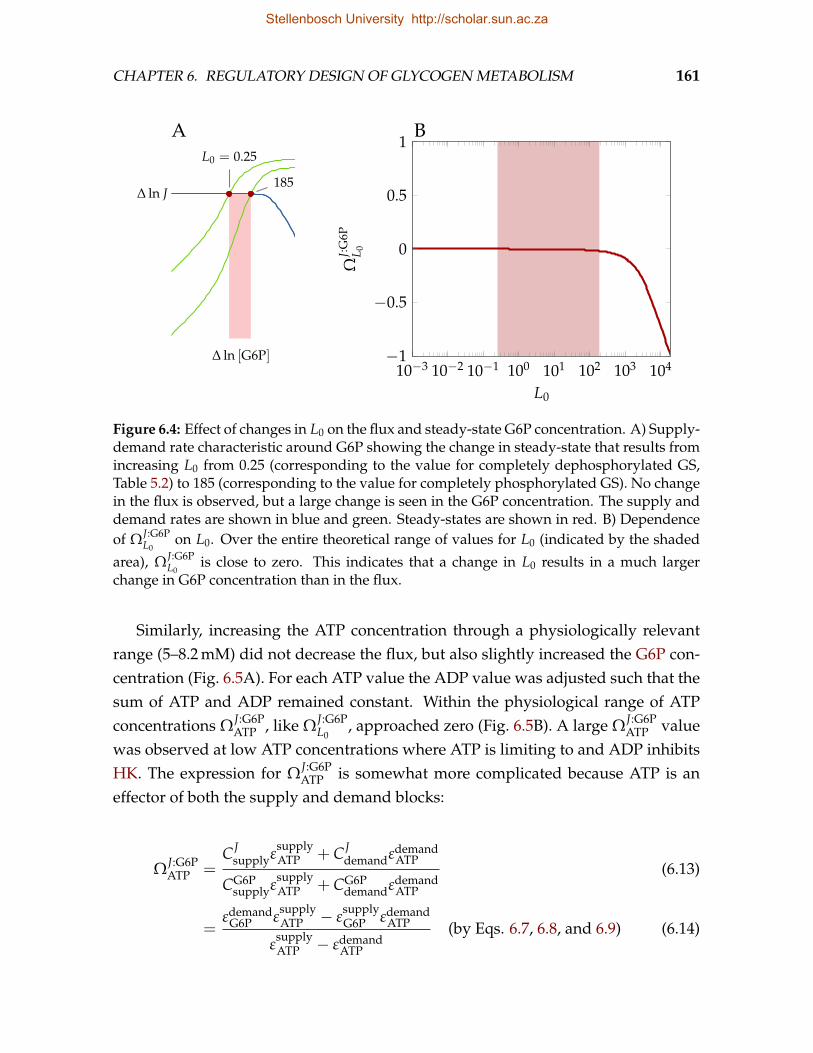
CHAPTER 6. REGULATORY DESIGN OF GLYCOGEN METABOLISM 161
AL0 = 0.25
185∆ ln J
∆ ln [G6P]
B
10−3 10−2 10−1 100 101 102 103 104−1
−0.5
0
0.5
1
L0
ΩJ:
G6P
L 0
Figure 6.4: Effect of changes in L0 on the flux and steady-state G6P concentration. A) Supply-demand rate characteristic around G6P showing the change in steady-state that results fromincreasing L0 from 0.25 (corresponding to the value for completely dephosphorylated GS,Table 5.2) to 185 (corresponding to the value for completely phosphorylated GS). No changein the flux is observed, but a large change is seen in the G6P concentration. The supply anddemand rates are shown in blue and green. Steady-states are shown in red. B) Dependenceof ΩJ:G6P
L0on L0. Over the entire theoretical range of values for L0 (indicated by the shaded
area), ΩJ:G6PL0
is close to zero. This indicates that a change in L0 results in a much largerchange in G6P concentration than in the flux.
Similarly, increasing the ATP concentration through a physiologically relevantrange (5–8.2 mM) did not decrease the flux, but also slightly increased the G6P con-centration (Fig. 6.5A). For each ATP value the ADP value was adjusted such that thesum of ATP and ADP remained constant. Within the physiological range of ATPconcentrations ΩJ:G6P
ATP , like ΩJ:G6PL0
, approached zero (Fig. 6.5B). A large ΩJ:G6PATP value
was observed at low ATP concentrations where ATP is limiting to and ADP inhibitsHK. The expression for ΩJ:G6P
ATP is somewhat more complicated because ATP is aneffector of both the supply and demand blocks:
ΩJ:G6PATP =
C Jsupplyε
supplyATP + C J
demandεdemandATP
CG6Psupplyε
supplyATP + CG6P
demandεdemandATP
(6.13)
=εdemand
G6P εsupplyATP − ε
supplyG6P εdemand
ATP
εsupplyATP − εdemand
ATP
(by Eqs. 6.7, 6.8, and 6.9) (6.14)
Stellenbosch University http://scholar.sun.ac.za
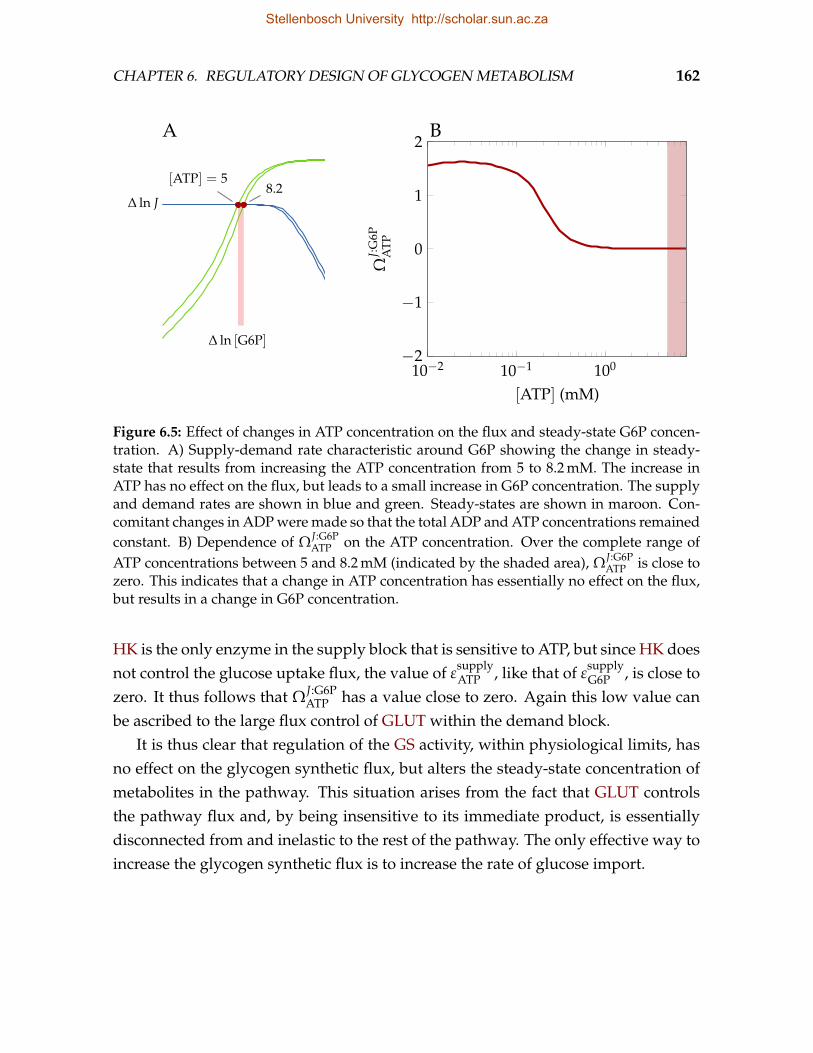
CHAPTER 6. REGULATORY DESIGN OF GLYCOGEN METABOLISM 162
A
[ATP] = 58.2
∆ ln J
∆ ln [G6P]
B
10−2 10−1 100−2
−1
0
1
2
[ATP] (mM)Ω
J:G
6PA
TP
Figure 6.5: Effect of changes in ATP concentration on the flux and steady-state G6P concen-tration. A) Supply-demand rate characteristic around G6P showing the change in steady-state that results from increasing the ATP concentration from 5 to 8.2 mM. The increase inATP has no effect on the flux, but leads to a small increase in G6P concentration. The supplyand demand rates are shown in blue and green. Steady-states are shown in maroon. Con-comitant changes in ADP were made so that the total ADP and ATP concentrations remainedconstant. B) Dependence of ΩJ:G6P
ATP on the ATP concentration. Over the complete range ofATP concentrations between 5 and 8.2 mM (indicated by the shaded area), ΩJ:G6P
ATP is close tozero. This indicates that a change in ATP concentration has essentially no effect on the flux,but results in a change in G6P concentration.
HK is the only enzyme in the supply block that is sensitive to ATP, but since HK doesnot control the glucose uptake flux, the value of ε
supplyATP , like that of ε
supplyG6P , is close to
zero. It thus follows that ΩJ:G6PATP has a value close to zero. Again this low value can
be ascribed to the large flux control of GLUT within the demand block.It is thus clear that regulation of the GS activity, within physiological limits, has
no effect on the glycogen synthetic flux, but alters the steady-state concentration ofmetabolites in the pathway. This situation arises from the fact that GLUT controlsthe pathway flux and, by being insensitive to its immediate product, is essentiallydisconnected from and inelastic to the rest of the pathway. The only effective way toincrease the glycogen synthetic flux is to increase the rate of glucose import.
Stellenbosch University http://scholar.sun.ac.za
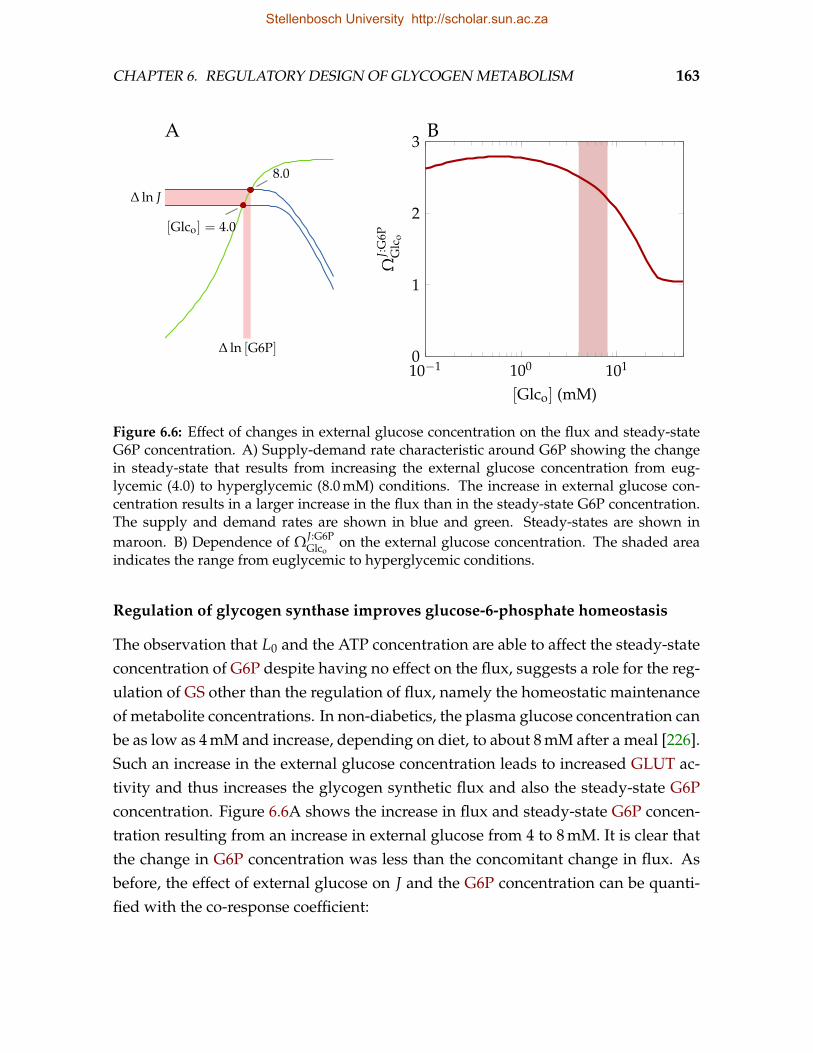
CHAPTER 6. REGULATORY DESIGN OF GLYCOGEN METABOLISM 163
A
[Glco] = 4.0
8.0
∆ ln J
∆ ln [G6P]
B
10−1 100 1010
1
2
3
[Glco] (mM)Ω
J:G
6PG
lco
Figure 6.6: Effect of changes in external glucose concentration on the flux and steady-stateG6P concentration. A) Supply-demand rate characteristic around G6P showing the changein steady-state that results from increasing the external glucose concentration from eug-lycemic (4.0) to hyperglycemic (8.0 mM) conditions. The increase in external glucose con-centration results in a larger increase in the flux than in the steady-state G6P concentration.The supply and demand rates are shown in blue and green. Steady-states are shown inmaroon. B) Dependence of ΩJ:G6P
Glcoon the external glucose concentration. The shaded area
indicates the range from euglycemic to hyperglycemic conditions.
Regulation of glycogen synthase improves glucose-6-phosphate homeostasis
The observation that L0 and the ATP concentration are able to affect the steady-stateconcentration of G6P despite having no effect on the flux, suggests a role for the reg-ulation of GS other than the regulation of flux, namely the homeostatic maintenanceof metabolite concentrations. In non-diabetics, the plasma glucose concentration canbe as low as 4 mM and increase, depending on diet, to about 8 mM after a meal [226].Such an increase in the external glucose concentration leads to increased GLUT ac-tivity and thus increases the glycogen synthetic flux and also the steady-state G6Pconcentration. Figure 6.6A shows the increase in flux and steady-state G6P concen-tration resulting from an increase in external glucose from 4 to 8 mM. It is clear thatthe change in G6P concentration was less than the concomitant change in flux. Asbefore, the effect of external glucose on J and the G6P concentration can be quanti-fied with the co-response coefficient:
Stellenbosch University http://scholar.sun.ac.za
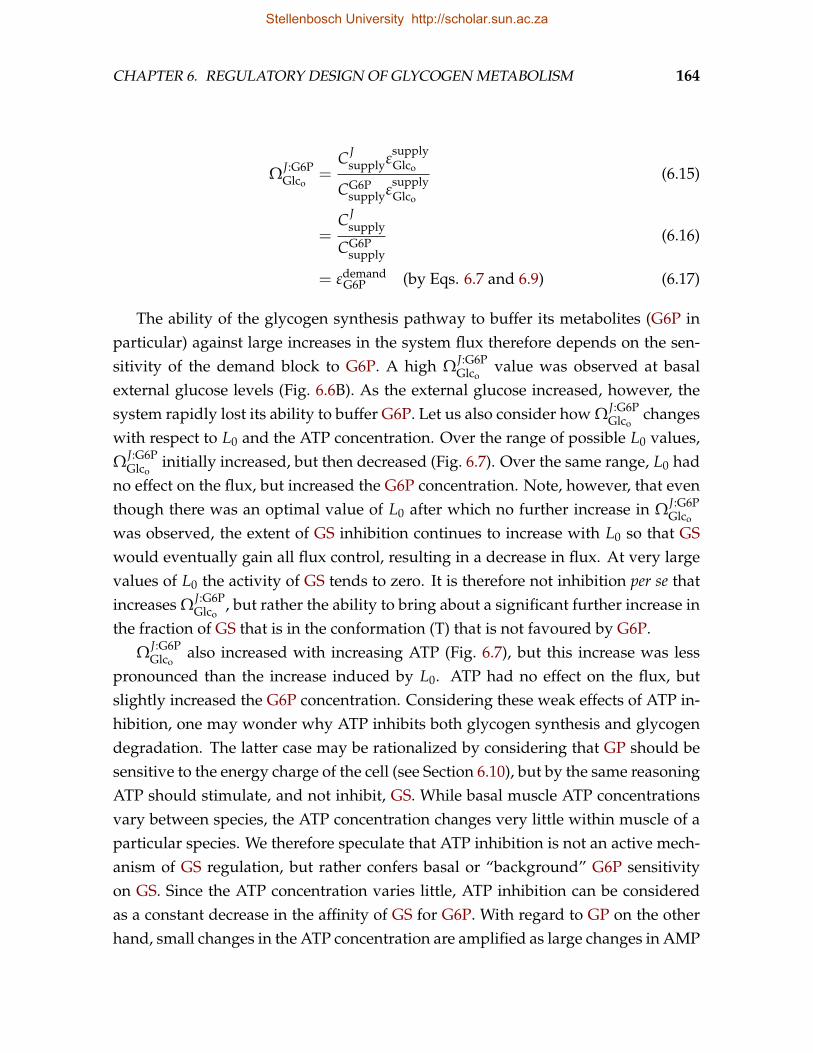
CHAPTER 6. REGULATORY DESIGN OF GLYCOGEN METABOLISM 164
ΩJ:G6PGlco
=C J
supplyεsupplyGlco
CG6Psupplyε
supplyGlco
(6.15)
=C J
supply
CG6Psupply
(6.16)
= εdemandG6P (by Eqs. 6.7 and 6.9) (6.17)
The ability of the glycogen synthesis pathway to buffer its metabolites (G6P inparticular) against large increases in the system flux therefore depends on the sen-sitivity of the demand block to G6P. A high ΩJ:G6P
Glcovalue was observed at basal
external glucose levels (Fig. 6.6B). As the external glucose increased, however, thesystem rapidly lost its ability to buffer G6P. Let us also consider how ΩJ:G6P
Glcochanges
with respect to L0 and the ATP concentration. Over the range of possible L0 values,ΩJ:G6P
Glcoinitially increased, but then decreased (Fig. 6.7). Over the same range, L0 had
no effect on the flux, but increased the G6P concentration. Note, however, that eventhough there was an optimal value of L0 after which no further increase in ΩJ:G6P
Glco
was observed, the extent of GS inhibition continues to increase with L0 so that GSwould eventually gain all flux control, resulting in a decrease in flux. At very largevalues of L0 the activity of GS tends to zero. It is therefore not inhibition per se thatincreases ΩJ:G6P
Glco, but rather the ability to bring about a significant further increase in
the fraction of GS that is in the conformation (T) that is not favoured by G6P.ΩJ:G6P
Glcoalso increased with increasing ATP (Fig. 6.7), but this increase was less
pronounced than the increase induced by L0. ATP had no effect on the flux, butslightly increased the G6P concentration. Considering these weak effects of ATP in-hibition, one may wonder why ATP inhibits both glycogen synthesis and glycogendegradation. The latter case may be rationalized by considering that GP should besensitive to the energy charge of the cell (see Section 6.10), but by the same reasoningATP should stimulate, and not inhibit, GS. While basal muscle ATP concentrationsvary between species, the ATP concentration changes very little within muscle of aparticular species. We therefore speculate that ATP inhibition is not an active mech-anism of GS regulation, but rather confers basal or “background” G6P sensitivityon GS. Since the ATP concentration varies little, ATP inhibition can be consideredas a constant decrease in the affinity of GS for G6P. With regard to GP on the otherhand, small changes in the ATP concentration are amplified as large changes in AMP
Stellenbosch University http://scholar.sun.ac.za
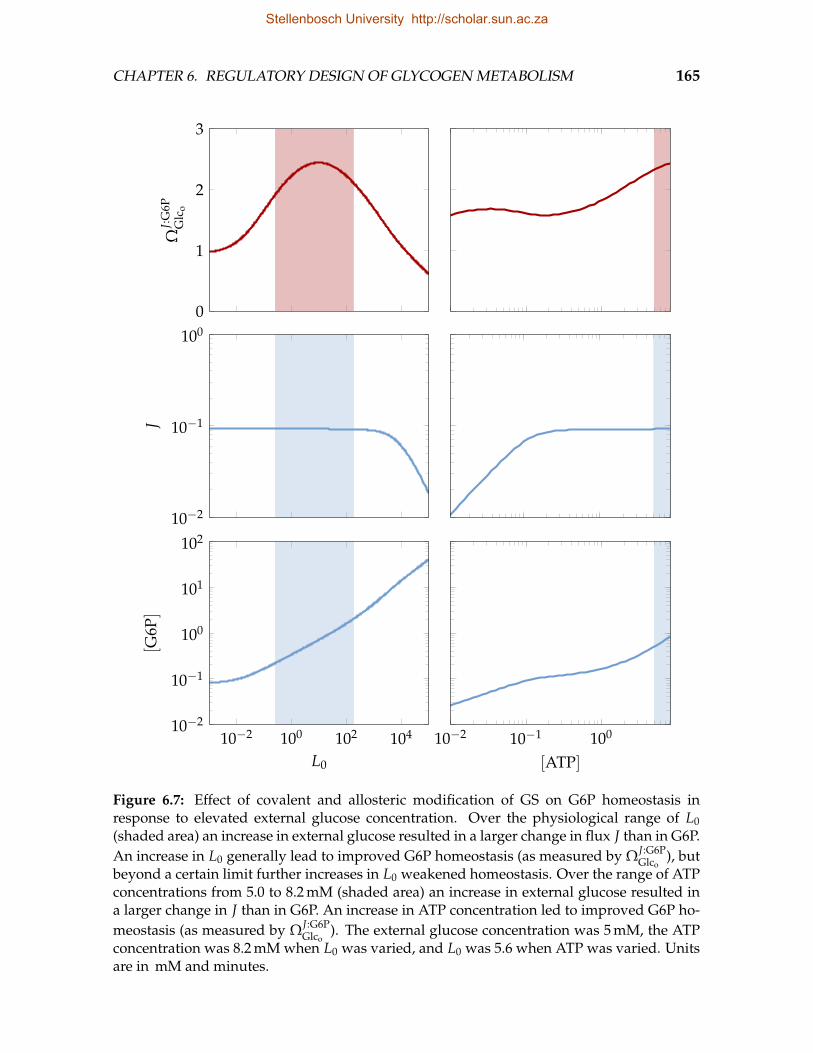
CHAPTER 6. REGULATORY DESIGN OF GLYCOGEN METABOLISM 165
0
1
2
3
ΩJ:
G6P
Glc
o
10−2
10−1
100
J
10−2 100 102 10410−2
10−1
100
101
102
L0
[G6P
]
10−2 10−1 100
[ATP]
Figure 6.7: Effect of covalent and allosteric modification of GS on G6P homeostasis inresponse to elevated external glucose concentration. Over the physiological range of L0(shaded area) an increase in external glucose resulted in a larger change in flux J than in G6P.An increase in L0 generally lead to improved G6P homeostasis (as measured by ΩJ:G6P
Glco), but
beyond a certain limit further increases in L0 weakened homeostasis. Over the range of ATPconcentrations from 5.0 to 8.2 mM (shaded area) an increase in external glucose resulted ina larger change in J than in G6P. An increase in ATP concentration led to improved G6P ho-meostasis (as measured by ΩJ:G6P
Glco). The external glucose concentration was 5 mM, the ATP
concentration was 8.2 mM when L0 was varied, and L0 was 5.6 when ATP was varied. Unitsare in mM and minutes.
Stellenbosch University http://scholar.sun.ac.za
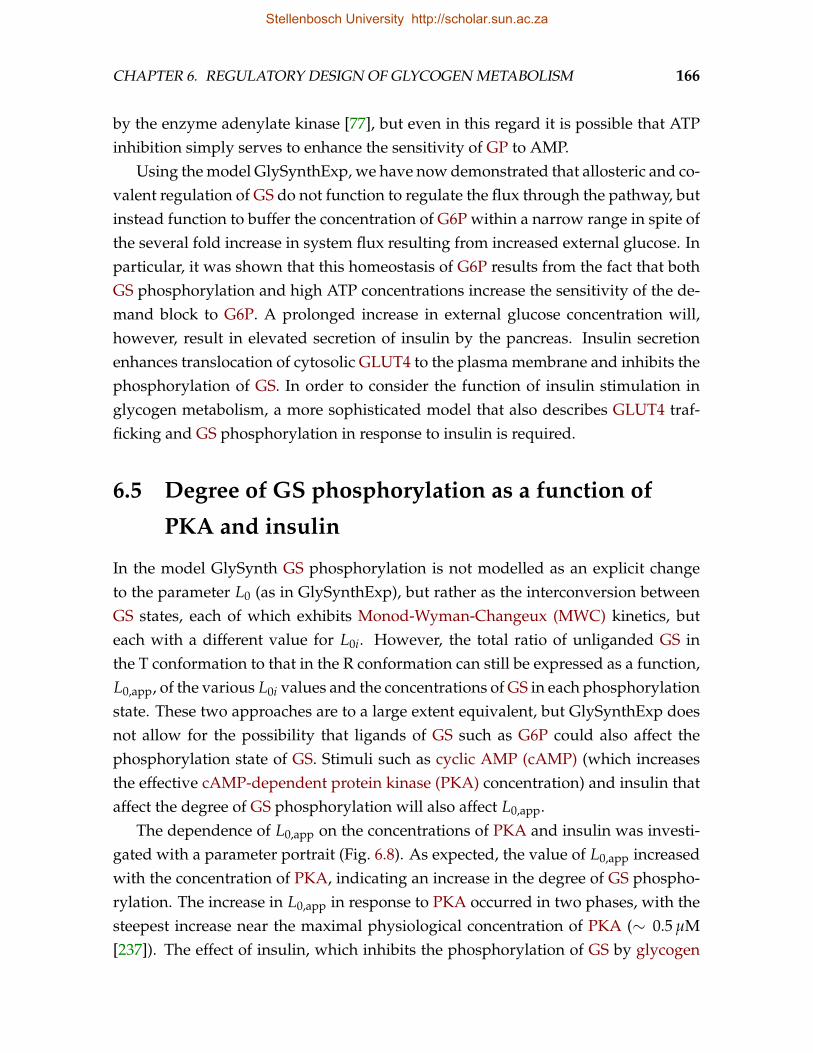
CHAPTER 6. REGULATORY DESIGN OF GLYCOGEN METABOLISM 166
by the enzyme adenylate kinase [77], but even in this regard it is possible that ATPinhibition simply serves to enhance the sensitivity of GP to AMP.
Using the model GlySynthExp, we have now demonstrated that allosteric and co-valent regulation of GS do not function to regulate the flux through the pathway, butinstead function to buffer the concentration of G6P within a narrow range in spite ofthe several fold increase in system flux resulting from increased external glucose. Inparticular, it was shown that this homeostasis of G6P results from the fact that bothGS phosphorylation and high ATP concentrations increase the sensitivity of the de-mand block to G6P. A prolonged increase in external glucose concentration will,however, result in elevated secretion of insulin by the pancreas. Insulin secretionenhances translocation of cytosolic GLUT4 to the plasma membrane and inhibits thephosphorylation of GS. In order to consider the function of insulin stimulation inglycogen metabolism, a more sophisticated model that also describes GLUT4 traf-ficking and GS phosphorylation in response to insulin is required.
6.5 Degree of GS phosphorylation as a function of
PKA and insulin
In the model GlySynth GS phosphorylation is not modelled as an explicit changeto the parameter L0 (as in GlySynthExp), but rather as the interconversion betweenGS states, each of which exhibits Monod-Wyman-Changeux (MWC) kinetics, buteach with a different value for L0i. However, the total ratio of unliganded GS inthe T conformation to that in the R conformation can still be expressed as a function,L0,app, of the various L0i values and the concentrations of GS in each phosphorylationstate. These two approaches are to a large extent equivalent, but GlySynthExp doesnot allow for the possibility that ligands of GS such as G6P could also affect thephosphorylation state of GS. Stimuli such as cyclic AMP (cAMP) (which increasesthe effective cAMP-dependent protein kinase (PKA) concentration) and insulin thataffect the degree of GS phosphorylation will also affect L0,app.
The dependence of L0,app on the concentrations of PKA and insulin was investi-gated with a parameter portrait (Fig. 6.8). As expected, the value of L0,app increasedwith the concentration of PKA, indicating an increase in the degree of GS phospho-rylation. The increase in L0,app in response to PKA occurred in two phases, with thesteepest increase near the maximal physiological concentration of PKA (∼ 0.5 µM[237]). The effect of insulin, which inhibits the phosphorylation of GS by glycogen
Stellenbosch University http://scholar.sun.ac.za
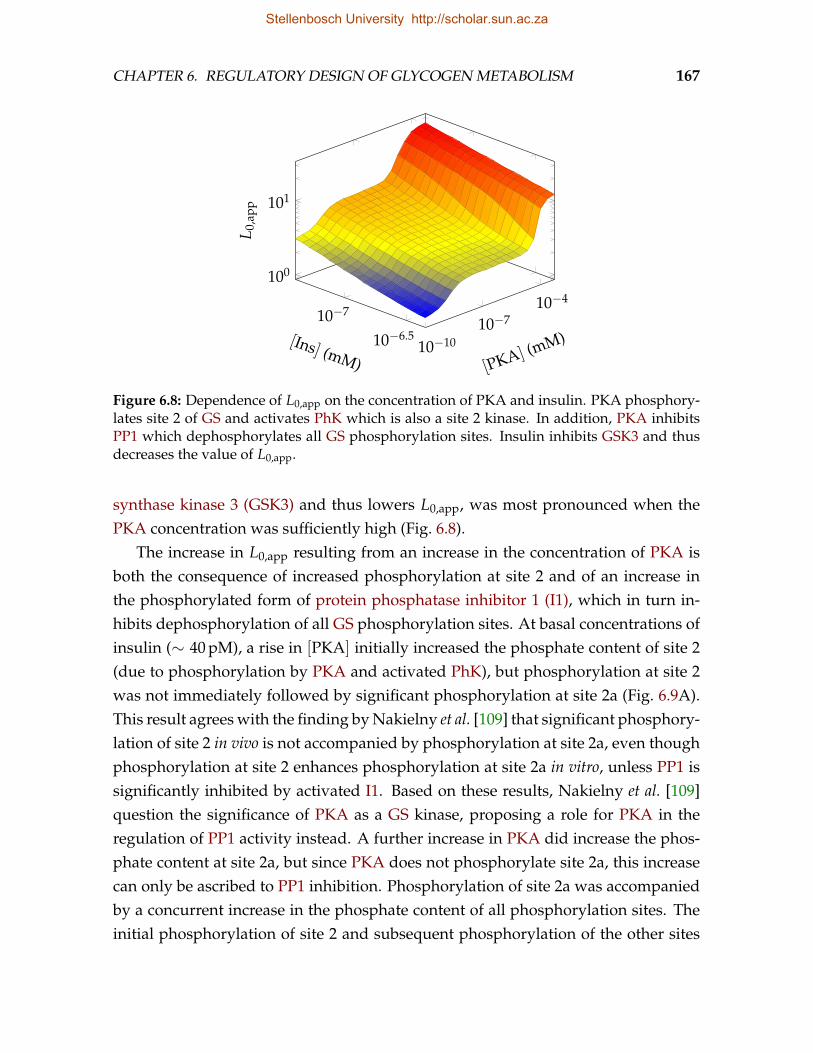
CHAPTER 6. REGULATORY DESIGN OF GLYCOGEN METABOLISM 167
10−7
10−6.510−10
10−710−4
100
101
[Ins] (mM) [PKA] (mM)
L 0,a
pp
Figure 6.8: Dependence of L0,app on the concentration of PKA and insulin. PKA phosphory-lates site 2 of GS and activates PhK which is also a site 2 kinase. In addition, PKA inhibitsPP1 which dephosphorylates all GS phosphorylation sites. Insulin inhibits GSK3 and thusdecreases the value of L0,app.
synthase kinase 3 (GSK3) and thus lowers L0,app, was most pronounced when thePKA concentration was sufficiently high (Fig. 6.8).
The increase in L0,app resulting from an increase in the concentration of PKA isboth the consequence of increased phosphorylation at site 2 and of an increase inthe phosphorylated form of protein phosphatase inhibitor 1 (I1), which in turn in-hibits dephosphorylation of all GS phosphorylation sites. At basal concentrations ofinsulin (∼ 40 pM), a rise in [PKA] initially increased the phosphate content of site 2(due to phosphorylation by PKA and activated PhK), but phosphorylation at site 2was not immediately followed by significant phosphorylation at site 2a (Fig. 6.9A).This result agrees with the finding by Nakielny et al. [109] that significant phosphory-lation of site 2 in vivo is not accompanied by phosphorylation at site 2a, even thoughphosphorylation at site 2 enhances phosphorylation at site 2a in vitro, unless PP1 issignificantly inhibited by activated I1. Based on these results, Nakielny et al. [109]question the significance of PKA as a GS kinase, proposing a role for PKA in theregulation of PP1 activity instead. A further increase in PKA did increase the phos-phate content at site 2a, but since PKA does not phosphorylate site 2a, this increasecan only be ascribed to PP1 inhibition. Phosphorylation of site 2a was accompaniedby a concurrent increase in the phosphate content of all phosphorylation sites. Theinitial phosphorylation of site 2 and subsequent phosphorylation of the other sites
Stellenbosch University http://scholar.sun.ac.za
CHAPTER 6. REGULATORY DESIGN OF GLYCOGEN METABOLISM 168
A
10−9 10−8 10−7 10−6 10−5 10−40
0.2
0.4
0.6
0.8
1
2
2a
5
4
3c
3b
3a
[PKA] (mM)
Phos
phat
eco
nten
tper
site
B
10−7.2 10−7 10−6.8 10−6.6 10−6.4
2
2a
54
3c3b
3a
[Ins] (mM)
Figure 6.9: Dependence of GS phosphate content per site as a function of the PKA and insulinconcentrations. A) Increasing from low concentrations of PKA, site 2 is phosphorylated byPKA and as a result of PhK activation in response to PKA. Further increasing PKA leads tothe inactivation of PP1 and thus extensive phosphorylation of all GS phosphorylation sites.B) Increasing the insulin concentration has little effect on sites 2, 2a, and 5, but sites that arephosphorylated by GSK3, which is inhibited by insulin, are gradually dephosphorylated inresponse to insulin.
at a higher concentration of PKA explain the biphasic increase in L0,app in responseto PKA.
At very low PKA concentrations, the phosphatase activity was sufficiently highthat GS was substantially dephosphorylated at the inhibitory sites (2, 2a, 3a, 3b, seeFig. 6.9A), whereas at high PKA concentrations, GS was almost completely phos-phorylated at most sites. Under these conditions, a decrease in the activity of GSK3,mimicking insulin stimulation, is not expected to activate GS markedly. In the for-mer case GS is already activated to such an extent that insulin stimulation is with-out effect. In the latter case, on the other hand, PP1 is inhibited to such an extentthat it cannot dephosphorylate the GSK3 sites. At a concentration of PKA that ap-proaches the physiological maximum, however, insulin stimulation resulted in sig-nificant dephosphorylation of the sites phosphorylated by GSK3 (sites 4, 3c, 3b, and3a; Fig. 6.9B). The phosphate content of sites 5, 2, and 2a that are not directly affectedby GSK3 remained unchanged, as was also found by Parker et al. [238].
Stellenbosch University http://scholar.sun.ac.za
CHAPTER 6. REGULATORY DESIGN OF GLYCOGEN METABOLISM 169
6.6 Homeostasis in response to change in insulin
concentration
A euglycemic clamp is an experimental setup in which the external glucose con-centration is kept at a constant basal concentration by infusion of glucose while theinsulin concentration may be varied [239]. Here we will consider the homeostaticproperties of glycogen synthesis in response to changes in kinase and insulin con-centrations during a euglycemic clamp.
Using the glycogen synthesis model (GlySynthExp) in which GS phosphoryla-tion is mimicked by an explicit change in L0, we have already shown that an increasein L0, up to a certain point, improves homeostasis with respect to G6P in responseto changes in external glucose concentration. Using the model GlySynth, in whichthe complete GS phosphorylation cascade is included, we can now investigate therelationship between the degree of GS phosphorylation, as modulated by insulinand PKA, and G6P homeostasis. Since an increase in PKA leads to an increase inL0,app, inhibition of GS as a result of PKA-induced phosphorylation is also expectedto improve G6P homeostasis in response to elevated glycemia.
The effect of PKA on G6P homeostasis was investigated with parameter portraitsin which ΩJ:G6P
Glco, J, [G6P], and L0,app were plotted as a function of the PKA concen-
tration (Fig. 6.10). As PKA increased, the value of ΩJ:G6PGlco
initially increased in two
phases and then decreased. The overall variation in ΩJ:G6PGlco
was, however, rathermodest. Even at very low concentrations of PKA more than 10% of GS was stillphosphorylated at both sites 2a and 3a and about 40% was still phosphorylated atsite 2 (Fig. 6.9), so that ΩJ:G6P
Glcowas maintained at the high value of 2. No change in
the flux J was observed, but G6P and L0,app increased in two phases, correspondingto the phosphorylation of site 2 and the inactivation of PP1.
The relationship between PKA and ΩJ:G6PGlco
differed from the ideal relationship
that was found between L0 and ΩJ:G6PGlco
(Fig. 6.7) in the GlySynthExp model. Thisdifference is the result of at least two factors. First, in GlySynth, L0,app is a non-linearfunction of [PKA]. Second, the concentration of G6P, which changes with the degreeof GS phosphorylation, can influence the degree of GS phosphorylation, which wasnot allowed in GlySynthExp. In order to elucidate the relationship between PKAand ΩJ:G6P
Glco, we also considered to component values that constitute ΩJ:G6P
Glco. We have
shown that ΩJ:G6PGlco
= εdemandG6P (Eq. 6.17). As will be discussed in Section 6.9, εdemand
G6P
is the sum of the partial flux-response coefficients of the isolated demand block with
Stellenbosch University http://scholar.sun.ac.za
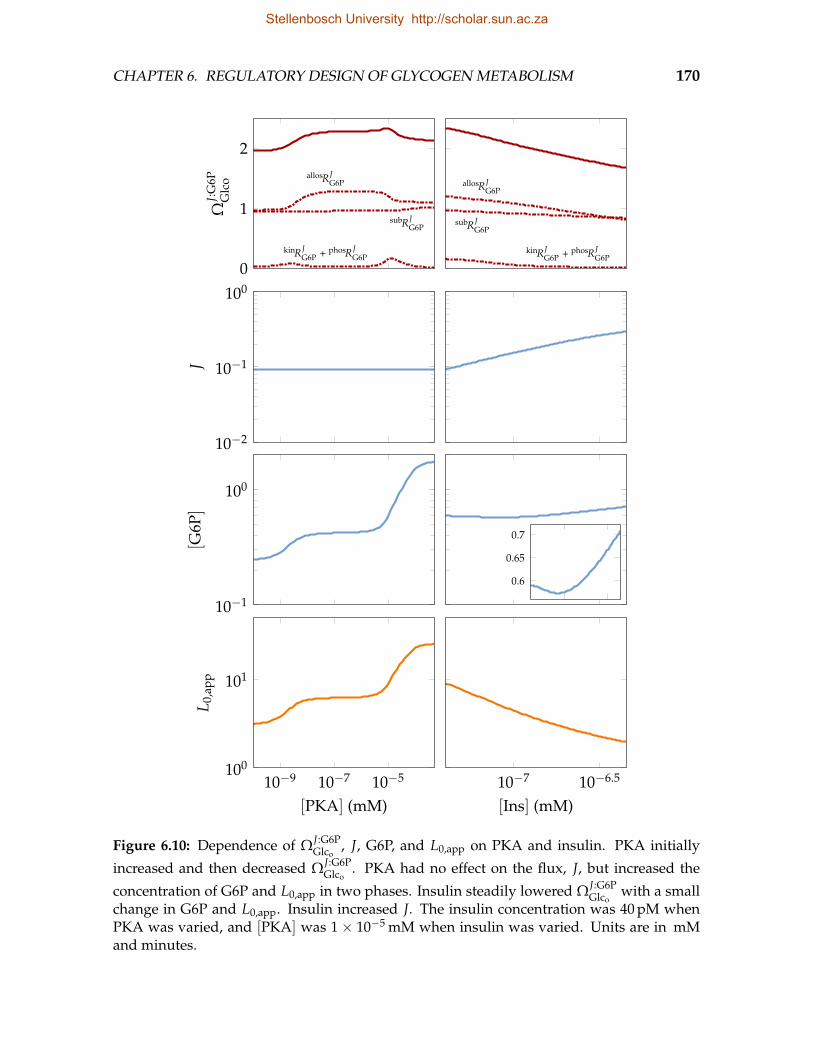
CHAPTER 6. REGULATORY DESIGN OF GLYCOGEN METABOLISM 170
subRJG6P
allosRJG6P
kinRJG6P + phosRJ
G6P
0
1
2
ΩJ:
G6P
Glc
osubRJ
G6P
allosRJG6P
kinRJG6P + phosRJ
G6P
10−2
10−1
100
J
10−1
100
[G6P
]
10−9 10−7 10−5100
101
[PKA] (mM)
L 0,a
pp
10−7 10−6.5
[Ins] (mM)
0.6
0.65
0.7
Figure 6.10: Dependence of ΩJ:G6PGlco
, J, G6P, and L0,app on PKA and insulin. PKA initially
increased and then decreased ΩJ:G6PGlco
. PKA had no effect on the flux, J, but increased the
concentration of G6P and L0,app in two phases. Insulin steadily lowered ΩJ:G6PGlco
with a smallchange in G6P and L0,app. Insulin increased J. The insulin concentration was 40 pM whenPKA was varied, and [PKA] was 1× 10⁻⁵ mM when insulin was varied. Units are in mMand minutes.
Stellenbosch University http://scholar.sun.ac.za
CHAPTER 6. REGULATORY DESIGN OF GLYCOGEN METABOLISM 171
respect to G6P:
εdemandG6P = subRJdemand
G6P + allosRJdemandG6P + kinRJdemand
G6P + phosRJdemandG6P (6.18)
These partial response coefficients were therefore also plotted as a function of [PKA]
(Fig. 6.10). subRJdemandG6P , describing the function of G6P as a substrate of the demand
block, remained near unity over the entire range of PKA concentrations. subRJdemandG6P ,
describing the function of G6P as activator of the demand block, initially increasedwith PKA, but decreased again at higher PKA concentrations. The sum of kinRJdemand
G6P
and phosRJdemandG6P , describing the function of G6P as GS kinase inhibitor and GS phos-
phatase activator, peaked at the PKA concentrations where the largest changes inG6P and L0,app were observed.
In order to facilitate comparison to Fig. 6.7, the results in Fig. 6.10 were also plot-ted against the variable L0,app (Fig. 6.11). As was found with respect to L0 in theappropriate range in Fig. 6.7, there was an almost linear relationship between G6Pand L0,app, but the flux, J, did not vary with L0,app.
An increase in insulin, on the other hand, led to a steady decrease in ΩJ:G6PGlco
(Fig. 6.10), indicating that it weakens G6P homeostasis with respect to changes inthe external glucose concentration. Although this decrease is ultimately the result ofGS dephosphorylation (L0,app decreased as as insulin increased), it is explained by adecrease in the sensitivity of the demand block to G6P in its capacity as PGLM sub-strate, allosteric GS activator, GS kinase inhibitor, and GS phosphatase activator, asmeasured by the decreases in the partial response coefficients subRJdemand
G6P , allosRJdemandG6P ,
kinRJdemandG6P , and phosRJdemand
G6P . The flux J increased with insulin over the entire range,but G6P initially decreased and then increased again at higher insulin concentra-tions (Fig. 6.10). The overall change in G6P in response to insulin was, however,very small compared to that in response to PKA.
These results indicate that GS phosphorylation, brought about by an increasein the concentration of PKA, functions to improve G6P homeostasis in response tochanges in the external glucose concentration. Insulin, on the other hand, weakensthis homeostasis. However, the modest increase in G6P, in spite of the large changein J, that resulted from insulin stimulation, suggests that insulin brings about G6Phomeostasis by means of a different mechanism in which the supply and demandblocks are coordinately activated [13]. It is therefore instructive to also consider thevalue of ΩJ:G6P
Ins , which quantifies the co-response of the flux and the steady-stateG6P concentration to a change in insulin concentration. ΩJ:G6P
Ins is expressed as
Stellenbosch University http://scholar.sun.ac.za
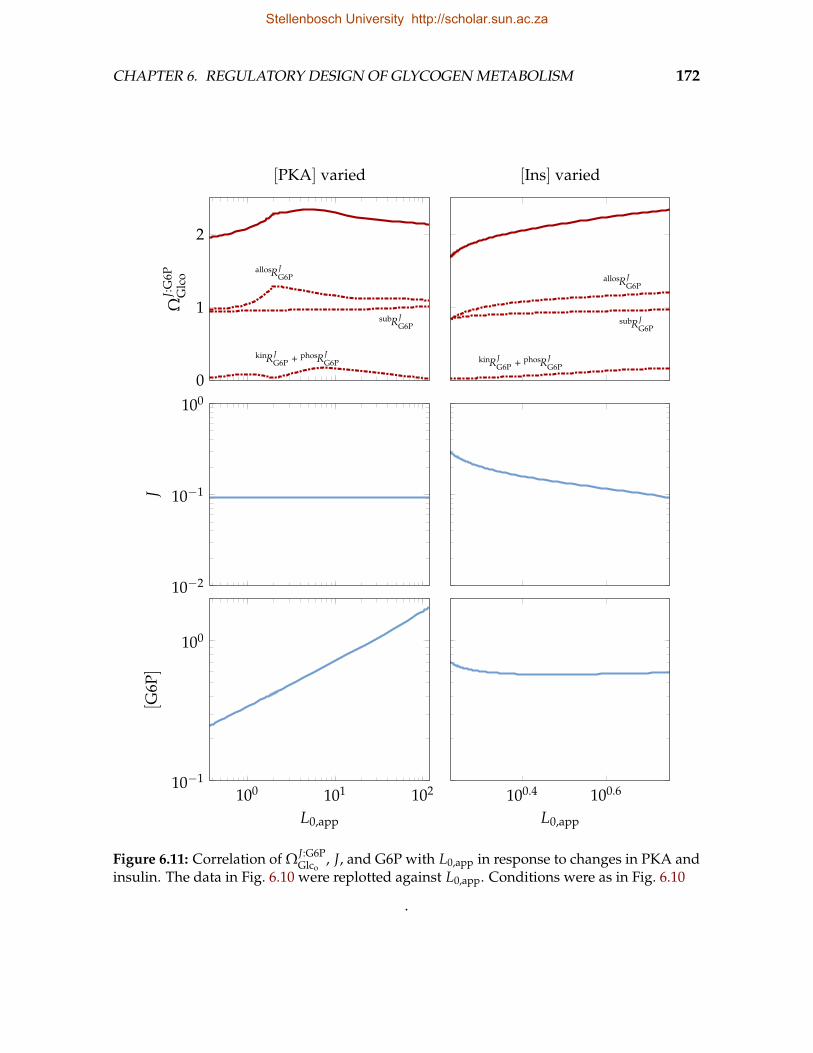
CHAPTER 6. REGULATORY DESIGN OF GLYCOGEN METABOLISM 172
subRJG6P
allosRJG6P
kinRJG6P + phosRJ
G6P
0
1
2
ΩJ:
G6P
Glc
o[PKA] varied
subRJG6P
allosRJG6P
kinRJG6P + phosRJ
G6P
[Ins] varied
10−2
10−1
100
J
100 101 10210−1
100
L0,app
[G6P
]
100.4 100.6
L0,app
Figure 6.11: Correlation of ΩJ:G6PGlco
, J, and G6P with L0,app in response to changes in PKA andinsulin. The data in Fig. 6.10 were replotted against L0,app. Conditions were as in Fig. 6.10
.
Stellenbosch University http://scholar.sun.ac.za
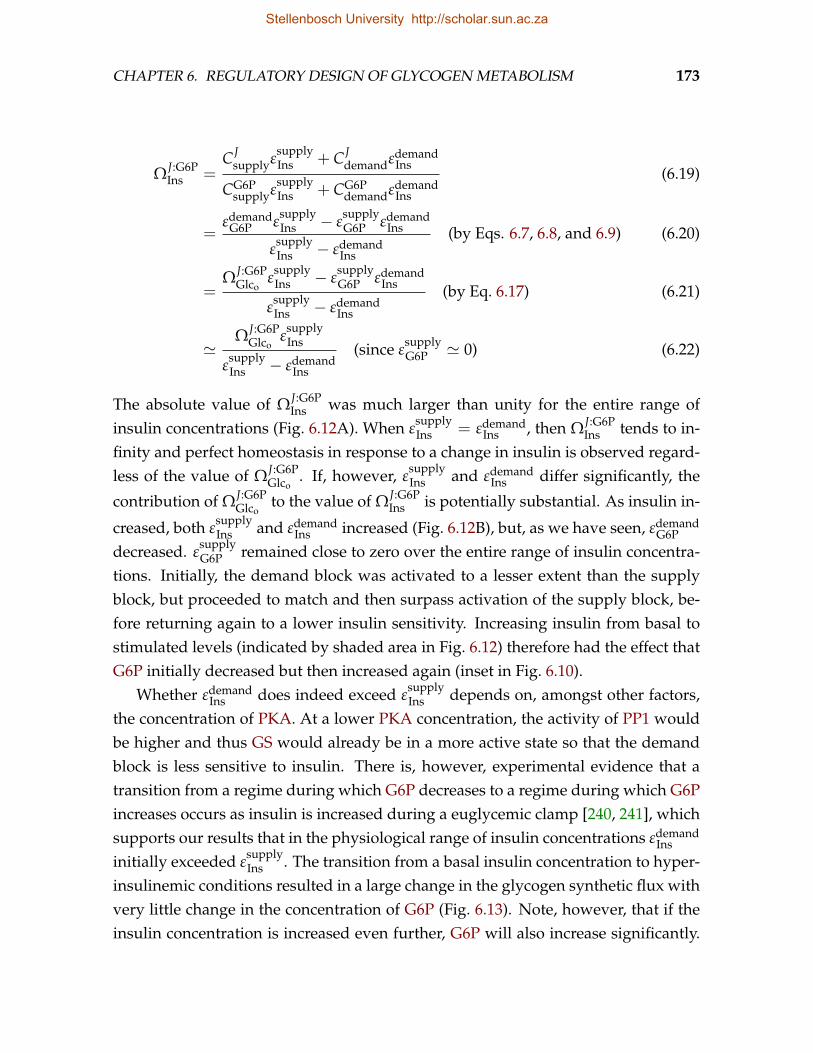
CHAPTER 6. REGULATORY DESIGN OF GLYCOGEN METABOLISM 173
ΩJ:G6PIns =
C Jsupplyε
supplyIns + C J
demandεdemandIns
CG6Psupplyε
supplyIns + CG6P
demandεdemandIns
(6.19)
=εdemand
G6P εsupplyIns − ε
supplyG6P εdemand
Ins
εsupplyIns − εdemand
Ins
(by Eqs. 6.7, 6.8, and 6.9) (6.20)
=ΩJ:G6P
Glcoε
supplyIns − ε
supplyG6P εdemand
Ins
εsupplyIns − εdemand
Ins
(by Eq. 6.17) (6.21)
'ΩJ:G6P
Glcoε
supplyIns
εsupplyIns − εdemand
Ins
(since εsupplyG6P ' 0) (6.22)
The absolute value of ΩJ:G6PIns was much larger than unity for the entire range of
insulin concentrations (Fig. 6.12A). When εsupplyIns = εdemand
Ins , then ΩJ:G6PIns tends to in-
finity and perfect homeostasis in response to a change in insulin is observed regard-less of the value of ΩJ:G6P
Glco. If, however, ε
supplyIns and εdemand
Ins differ significantly, the
contribution of ΩJ:G6PGlco
to the value of ΩJ:G6PIns is potentially substantial. As insulin in-
creased, both εsupplyIns and εdemand
Ins increased (Fig. 6.12B), but, as we have seen, εdemandG6P
decreased. εsupplyG6P remained close to zero over the entire range of insulin concentra-
tions. Initially, the demand block was activated to a lesser extent than the supplyblock, but proceeded to match and then surpass activation of the supply block, be-fore returning again to a lower insulin sensitivity. Increasing insulin from basal tostimulated levels (indicated by shaded area in Fig. 6.12) therefore had the effect thatG6P initially decreased but then increased again (inset in Fig. 6.10).
Whether εdemandIns does indeed exceed ε
supplyIns depends on, amongst other factors,
the concentration of PKA. At a lower PKA concentration, the activity of PP1 wouldbe higher and thus GS would already be in a more active state so that the demandblock is less sensitive to insulin. There is, however, experimental evidence that atransition from a regime during which G6P decreases to a regime during which G6Pincreases occurs as insulin is increased during a euglycemic clamp [240, 241], whichsupports our results that in the physiological range of insulin concentrations εdemand
Ins
initially exceeded εsupplyIns . The transition from a basal insulin concentration to hyper-
insulinemic conditions resulted in a large change in the glycogen synthetic flux withvery little change in the concentration of G6P (Fig. 6.13). Note, however, that if theinsulin concentration is increased even further, G6P will also increase significantly.
Stellenbosch University http://scholar.sun.ac.za
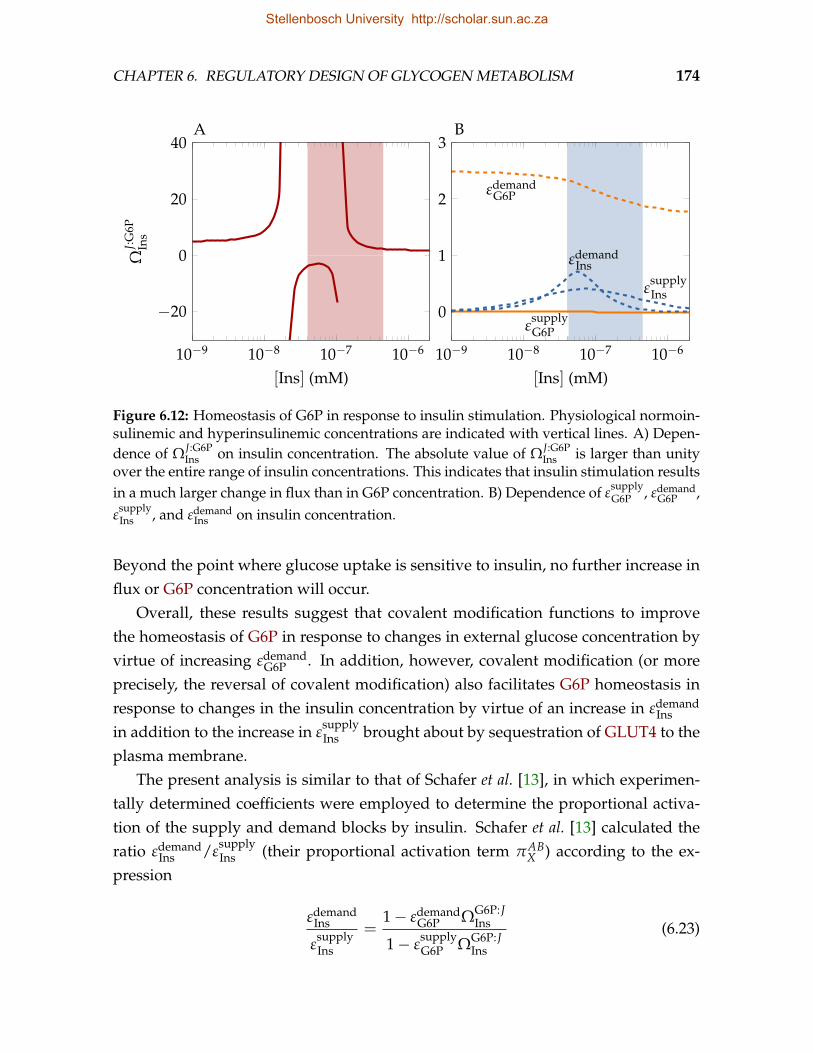
CHAPTER 6. REGULATORY DESIGN OF GLYCOGEN METABOLISM 174
A
10−9 10−8 10−7 10−6
−20
0
20
40
[Ins] (mM)
ΩJ:
G6P
Ins
B
εsupplyG6P
εdemandG6P
εsupplyIns
εdemandIns
10−9 10−8 10−7 10−6
0
1
2
3
[Ins] (mM)
Figure 6.12: Homeostasis of G6P in response to insulin stimulation. Physiological normoin-sulinemic and hyperinsulinemic concentrations are indicated with vertical lines. A) Depen-dence of ΩJ:G6P
Ins on insulin concentration. The absolute value of ΩJ:G6PIns is larger than unity
over the entire range of insulin concentrations. This indicates that insulin stimulation resultsin a much larger change in flux than in G6P concentration. B) Dependence of ε
supplyG6P , εdemand
G6P ,ε
supplyIns , and εdemand
Ins on insulin concentration.
Beyond the point where glucose uptake is sensitive to insulin, no further increase influx or G6P concentration will occur.
Overall, these results suggest that covalent modification functions to improvethe homeostasis of G6P in response to changes in external glucose concentration byvirtue of increasing εdemand
G6P . In addition, however, covalent modification (or moreprecisely, the reversal of covalent modification) also facilitates G6P homeostasis inresponse to changes in the insulin concentration by virtue of an increase in εdemand
Ins
in addition to the increase in εsupplyIns brought about by sequestration of GLUT4 to the
plasma membrane.The present analysis is similar to that of Schafer et al. [13], in which experimen-
tally determined coefficients were employed to determine the proportional activa-tion of the supply and demand blocks by insulin. Schafer et al. [13] calculated theratio εdemand
Ins /εsupplyIns (their proportional activation term πAB
X ) according to the ex-pression
εdemandIns
εsupplyIns
=1− εdemand
G6P ΩG6P:JIns
1− εsupplyG6P ΩG6P:J
Ins
(6.23)
Stellenbosch University http://scholar.sun.ac.za
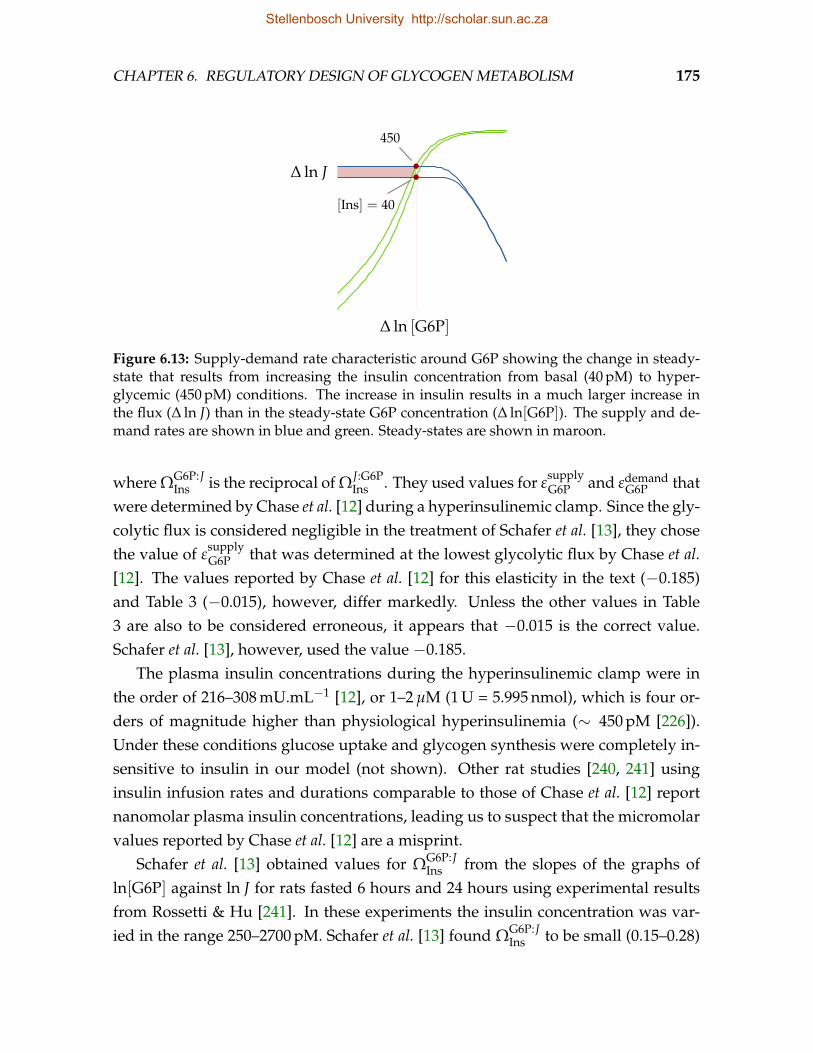
CHAPTER 6. REGULATORY DESIGN OF GLYCOGEN METABOLISM 175
[Ins] = 40
450
∆ ln J
∆ ln [G6P]
Figure 6.13: Supply-demand rate characteristic around G6P showing the change in steady-state that results from increasing the insulin concentration from basal (40 pM) to hyper-glycemic (450 pM) conditions. The increase in insulin results in a much larger increase inthe flux (∆ ln J) than in the steady-state G6P concentration (∆ ln[G6P]). The supply and de-mand rates are shown in blue and green. Steady-states are shown in maroon.
where ΩG6P:JIns is the reciprocal of ΩJ:G6P
Ins . They used values for εsupplyG6P and εdemand
G6P thatwere determined by Chase et al. [12] during a hyperinsulinemic clamp. Since the gly-colytic flux is considered negligible in the treatment of Schafer et al. [13], they chosethe value of ε
supplyG6P that was determined at the lowest glycolytic flux by Chase et al.
[12]. The values reported by Chase et al. [12] for this elasticity in the text (−0.185)and Table 3 (−0.015), however, differ markedly. Unless the other values in Table3 are also to be considered erroneous, it appears that −0.015 is the correct value.Schafer et al. [13], however, used the value −0.185.
The plasma insulin concentrations during the hyperinsulinemic clamp were inthe order of 216–308 mU.mL−1 [12], or 1–2 µM (1 U = 5.995 nmol), which is four or-ders of magnitude higher than physiological hyperinsulinemia (∼ 450 pM [226]).Under these conditions glucose uptake and glycogen synthesis were completely in-sensitive to insulin in our model (not shown). Other rat studies [240, 241] usinginsulin infusion rates and durations comparable to those of Chase et al. [12] reportnanomolar plasma insulin concentrations, leading us to suspect that the micromolarvalues reported by Chase et al. [12] are a misprint.
Schafer et al. [13] obtained values for ΩG6P:JIns from the slopes of the graphs of
ln[G6P] against ln J for rats fasted 6 hours and 24 hours using experimental resultsfrom Rossetti & Hu [241]. In these experiments the insulin concentration was var-ied in the range 250–2700 pM. Schafer et al. [13] found ΩG6P:J
Ins to be small (0.15–0.28)
Stellenbosch University http://scholar.sun.ac.za
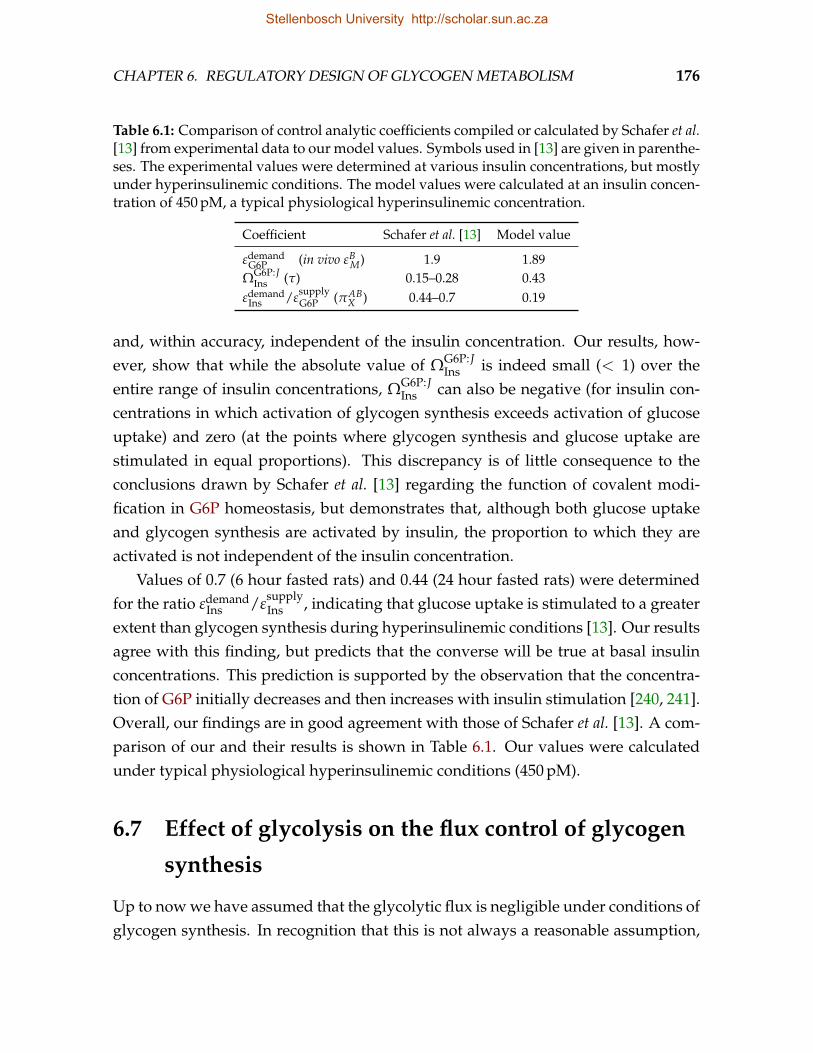
CHAPTER 6. REGULATORY DESIGN OF GLYCOGEN METABOLISM 176
Table 6.1: Comparison of control analytic coefficients compiled or calculated by Schafer et al.[13] from experimental data to our model values. Symbols used in [13] are given in parenthe-ses. The experimental values were determined at various insulin concentrations, but mostlyunder hyperinsulinemic conditions. The model values were calculated at an insulin concen-tration of 450 pM, a typical physiological hyperinsulinemic concentration.
Coefficient Schafer et al. [13] Model value
εdemandG6P (in vivo εB
M) 1.9 1.89ΩG6P:J
Ins (τ) 0.15–0.28 0.43εdemand
Ins /εsupplyG6P (πAB
X ) 0.44–0.7 0.19
and, within accuracy, independent of the insulin concentration. Our results, how-ever, show that while the absolute value of ΩG6P:J
Ins is indeed small (< 1) over theentire range of insulin concentrations, ΩG6P:J
Ins can also be negative (for insulin con-centrations in which activation of glycogen synthesis exceeds activation of glucoseuptake) and zero (at the points where glycogen synthesis and glucose uptake arestimulated in equal proportions). This discrepancy is of little consequence to theconclusions drawn by Schafer et al. [13] regarding the function of covalent modi-fication in G6P homeostasis, but demonstrates that, although both glucose uptakeand glycogen synthesis are activated by insulin, the proportion to which they areactivated is not independent of the insulin concentration.
Values of 0.7 (6 hour fasted rats) and 0.44 (24 hour fasted rats) were determinedfor the ratio εdemand
Ins /εsupplyIns , indicating that glucose uptake is stimulated to a greater
extent than glycogen synthesis during hyperinsulinemic conditions [13]. Our resultsagree with this finding, but predicts that the converse will be true at basal insulinconcentrations. This prediction is supported by the observation that the concentra-tion of G6P initially decreases and then increases with insulin stimulation [240, 241].Overall, our findings are in good agreement with those of Schafer et al. [13]. A com-parison of our and their results is shown in Table 6.1. Our values were calculatedunder typical physiological hyperinsulinemic conditions (450 pM).
6.7 Effect of glycolysis on the flux control of glycogen
synthesis
Up to now we have assumed that the glycolytic flux is negligible under conditions ofglycogen synthesis. In recognition that this is not always a reasonable assumption,
Stellenbosch University http://scholar.sun.ac.za
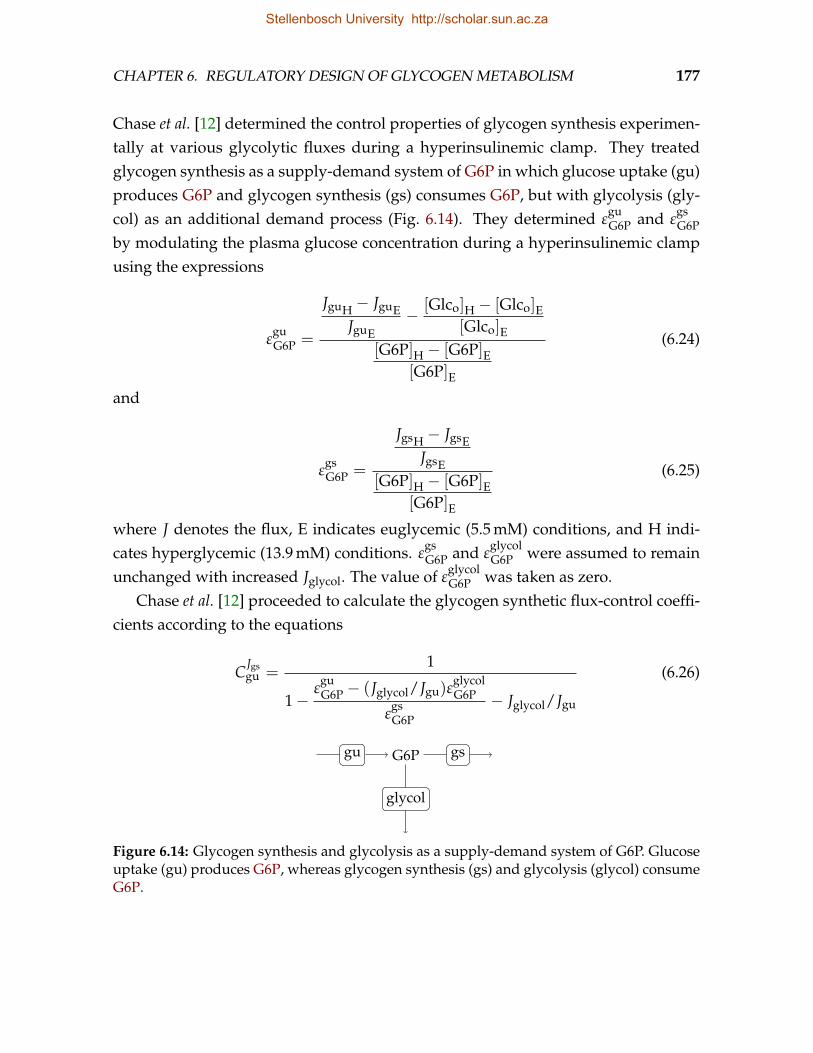
CHAPTER 6. REGULATORY DESIGN OF GLYCOGEN METABOLISM 177
Chase et al. [12] determined the control properties of glycogen synthesis experimen-tally at various glycolytic fluxes during a hyperinsulinemic clamp. They treatedglycogen synthesis as a supply-demand system of G6P in which glucose uptake (gu)produces G6P and glycogen synthesis (gs) consumes G6P, but with glycolysis (gly-col) as an additional demand process (Fig. 6.14). They determined ε
guG6P and ε
gsG6P
by modulating the plasma glucose concentration during a hyperinsulinemic clampusing the expressions
εguG6P =
JguH − JguEJguE
− [Glco]H − [Glco]E[Glco]E
[G6P]H − [G6P]E[G6P]E
(6.24)
and
εgsG6P =
JgsH − JgsEJgsE
[G6P]H − [G6P]E[G6P]E
(6.25)
where J denotes the flux, E indicates euglycemic (5.5 mM) conditions, and H indi-cates hyperglycemic (13.9 mM) conditions. ε
gsG6P and ε
glycolG6P were assumed to remain
unchanged with increased Jglycol. The value of εglycolG6P was taken as zero.
Chase et al. [12] proceeded to calculate the glycogen synthetic flux-control coeffi-cients according to the equations
C Jgsgu =
1
1− εguG6P − (Jglycol/Jgu)ε
glycolG6P
εgsG6P
− Jglycol/Jgu
(6.26)
gu G6P gs
glycol
Figure 6.14: Glycogen synthesis and glycolysis as a supply-demand system of G6P. Glucoseuptake (gu) produces G6P, whereas glycogen synthesis (gs) and glycolysis (glycol) consumeG6P.
Stellenbosch University http://scholar.sun.ac.za
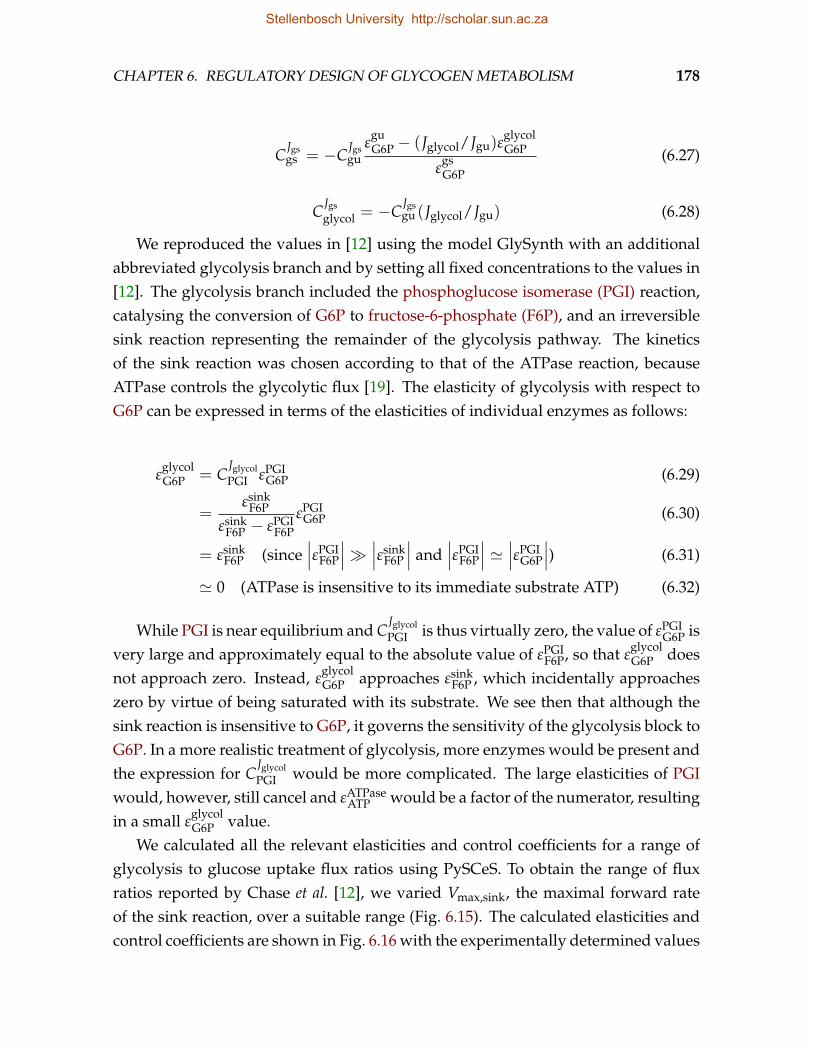
CHAPTER 6. REGULATORY DESIGN OF GLYCOGEN METABOLISM 178
C Jgsgs = −C Jgs
guε
guG6P − (Jglycol/Jgu)ε
glycolG6P
εgsG6P
(6.27)
C Jgsglycol = −C Jgs
gu (Jglycol/Jgu) (6.28)
We reproduced the values in [12] using the model GlySynth with an additionalabbreviated glycolysis branch and by setting all fixed concentrations to the values in[12]. The glycolysis branch included the phosphoglucose isomerase (PGI) reaction,catalysing the conversion of G6P to fructose-6-phosphate (F6P), and an irreversiblesink reaction representing the remainder of the glycolysis pathway. The kineticsof the sink reaction was chosen according to that of the ATPase reaction, becauseATPase controls the glycolytic flux [19]. The elasticity of glycolysis with respect toG6P can be expressed in terms of the elasticities of individual enzymes as follows:
εglycolG6P = C
JglycolPGI εPGI
G6P (6.29)
=εsink
F6P
εsinkF6P − εPGI
F6PεPGI
G6P (6.30)
= εsinkF6P (since
∣∣∣εPGIF6P
∣∣∣∣∣∣εsink
F6P
∣∣∣ and∣∣∣εPGI
F6P
∣∣∣ '∣∣∣εPGI
G6P
∣∣∣) (6.31)
' 0 (ATPase is insensitive to its immediate substrate ATP) (6.32)
While PGI is near equilibrium and CJglycolPGI is thus virtually zero, the value of εPGI
G6P isvery large and approximately equal to the absolute value of εPGI
F6P, so that εglycolG6P does
not approach zero. Instead, εglycolG6P approaches εsink
F6P , which incidentally approacheszero by virtue of being saturated with its substrate. We see then that although thesink reaction is insensitive to G6P, it governs the sensitivity of the glycolysis block toG6P. In a more realistic treatment of glycolysis, more enzymes would be present andthe expression for C
JglycolPGI would be more complicated. The large elasticities of PGI
would, however, still cancel and εATPaseATP would be a factor of the numerator, resulting
in a small εglycolG6P value.
We calculated all the relevant elasticities and control coefficients for a range ofglycolysis to glucose uptake flux ratios using PySCeS. To obtain the range of fluxratios reported by Chase et al. [12], we varied Vmax,sink, the maximal forward rateof the sink reaction, over a suitable range (Fig. 6.15). The calculated elasticities andcontrol coefficients are shown in Fig. 6.16 with the experimentally determined values
Stellenbosch University http://scholar.sun.ac.za
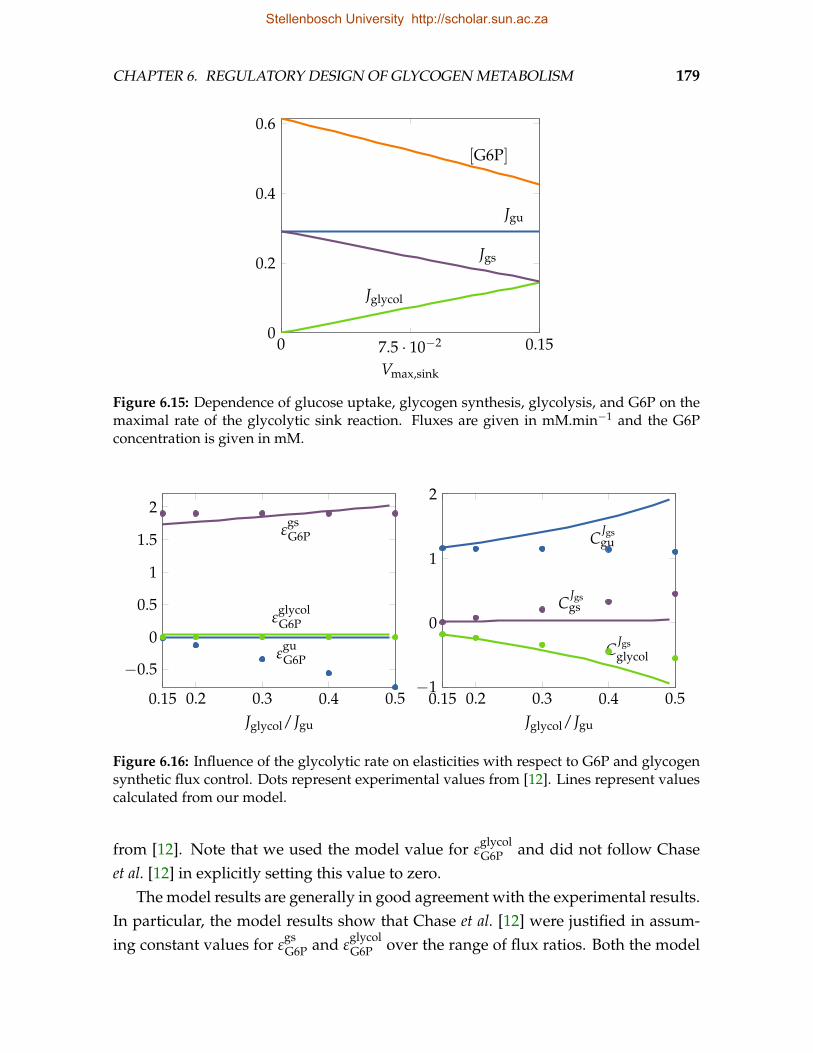
CHAPTER 6. REGULATORY DESIGN OF GLYCOGEN METABOLISM 179
0 7.5 · 10−2 0.150
0.2
0.4
0.6
Jgu
Jglycol
Jgs
[G6P]
Vmax,sink
Figure 6.15: Dependence of glucose uptake, glycogen synthesis, glycolysis, and G6P on themaximal rate of the glycolytic sink reaction. Fluxes are given in mM.min−1 and the G6Pconcentration is given in mM.
0.15 0.2 0.3 0.4 0.5
−0.5
0
0.5
1
1.5
2
εguG6P
εgsG6P
εglycolG6P
Jglycol/Jgu
0.15 0.2 0.3 0.4 0.5−1
0
1
2
C Jgsgu
C Jgsgs
C Jgsglycol
Jglycol/Jgu
Figure 6.16: Influence of the glycolytic rate on elasticities with respect to G6P and glycogensynthetic flux control. Dots represent experimental values from [12]. Lines represent valuescalculated from our model.
from [12]. Note that we used the model value for εglycolG6P and did not follow Chase
et al. [12] in explicitly setting this value to zero.The model results are generally in good agreement with the experimental results.
In particular, the model results show that Chase et al. [12] were justified in assum-ing constant values for ε
gsG6P and ε
glycolG6P over the range of flux ratios. Both the model
Stellenbosch University http://scholar.sun.ac.za
CHAPTER 6. REGULATORY DESIGN OF GLYCOGEN METABOLISM 180
and the experimental results also show that glucose uptake has the largest glycogensynthetic flux control over the entire range of flux ratios. The agreement is, however,not perfect and a few discrepancies warrant discussion. First, Chase et al. [12] foundthat the absolute value of ε
guG6P increased with the glycolytic rate, while we found
that εguG6P remained close to zero for the entire range. Since HK is the only reaction in
the glucose uptake block that is sensitive to G6P, an increase in∣∣εgu
G6P
∣∣ indicates gainof glucose uptake flux control by the HK reaction. This, in turn, can only result frominhibition of HK by G6P, and we must conclude that the results of Chase et al. [12]indicate that G6P increases as the glycolytic flux increases. While this result seemscontradictory, it must be recalled that glycolysis rarely increases without a concomi-tant increase in glycogenolysis, which will replenish G6P. Our model, which doesnot include glycogenolysis, however, predicts a decrease in G6P as the glycolyticflux increases (Fig. 6.15).
It should also be noted that the coefficients in [12] were calculated from largechanges in G6P and Jgu resulting from an increase in the external glucose concentra-tion from euglycemia to hyperglycemia. While this method should provide reason-able approximations of the coefficients determined from infinitesimal changes, it isnot without pitfalls. At basal insulin concentrations, GLUT controls the glucose up-take flux. Increasing the insulin concentration, however, gradually shifts flux controlto HK. Additionally increasing the external glucose concentration further shifts fluxcontrol to HK. In the process, the glucose uptake flux becomes increasingly sensitiveto G6P. Even if the majority of flux control is still held by GLUT under hyperinsu-linemic hyperglycemic conditions, the glucose uptake flux at hyperglycemia (JguH)would be inhibited more than the glucose uptake flux at euglycemia (JguE), so that(JguH− JguE)/JguE is an underestimation of the fractional change in Jgu. This has theconsequence that the ([Glco]H − [Glco]E)/[Glco]E term dominates the numerator ofEq. 6.24 and the overall absolute value of ε
guG6P is larger.
We must point out that while Chase et al. [12] calculated εguG6P for various values
of the ratio Jglycol/Jgu, it is not immediately clear to us how this calculation was per-formed, since Eq. 6.24 does not contain this ratio. We do not contest that ε
guG6P should
vary with this ratio (our own estimates of this value do indeed vary, albeit slightly),but we contend that the dependence can only be obtained by experimentally chang-ing the flux of glycolysis and determining the value at each flux. Chase et al. [12],however, do not report physically altering or measuring the glycolytic flux.
In conclusion, our results and those of Chase et al. [12] suggest that, if glycolysis
Stellenbosch University http://scholar.sun.ac.za
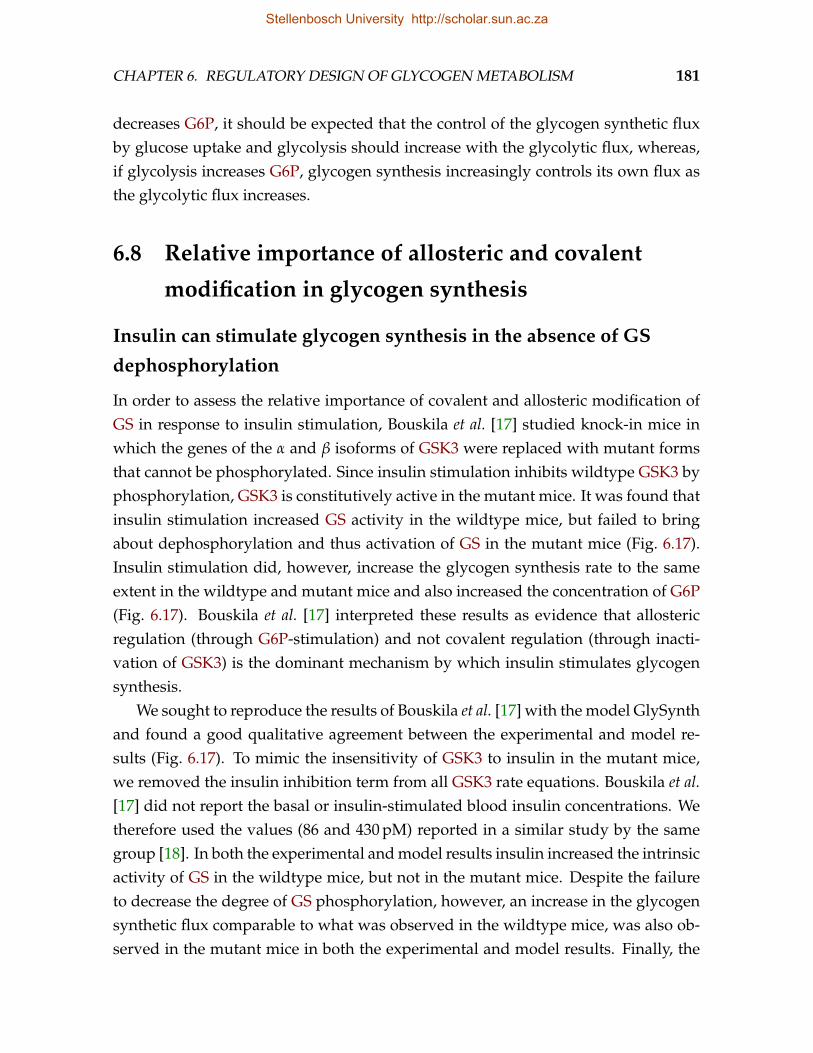
CHAPTER 6. REGULATORY DESIGN OF GLYCOGEN METABOLISM 181
decreases G6P, it should be expected that the control of the glycogen synthetic fluxby glucose uptake and glycolysis should increase with the glycolytic flux, whereas,if glycolysis increases G6P, glycogen synthesis increasingly controls its own flux asthe glycolytic flux increases.
6.8 Relative importance of allosteric and covalent
modification in glycogen synthesis
Insulin can stimulate glycogen synthesis in the absence of GS
dephosphorylation
In order to assess the relative importance of covalent and allosteric modification ofGS in response to insulin stimulation, Bouskila et al. [17] studied knock-in mice inwhich the genes of the α and β isoforms of GSK3 were replaced with mutant formsthat cannot be phosphorylated. Since insulin stimulation inhibits wildtype GSK3 byphosphorylation, GSK3 is constitutively active in the mutant mice. It was found thatinsulin stimulation increased GS activity in the wildtype mice, but failed to bringabout dephosphorylation and thus activation of GS in the mutant mice (Fig. 6.17).Insulin stimulation did, however, increase the glycogen synthesis rate to the sameextent in the wildtype and mutant mice and also increased the concentration of G6P(Fig. 6.17). Bouskila et al. [17] interpreted these results as evidence that allostericregulation (through G6P-stimulation) and not covalent regulation (through inacti-vation of GSK3) is the dominant mechanism by which insulin stimulates glycogensynthesis.
We sought to reproduce the results of Bouskila et al. [17] with the model GlySynthand found a good qualitative agreement between the experimental and model re-sults (Fig. 6.17). To mimic the insensitivity of GSK3 to insulin in the mutant mice,we removed the insulin inhibition term from all GSK3 rate equations. Bouskila et al.[17] did not report the basal or insulin-stimulated blood insulin concentrations. Wetherefore used the values (86 and 430 pM) reported in a similar study by the samegroup [18]. In both the experimental and model results insulin increased the intrinsicactivity of GS in the wildtype mice, but not in the mutant mice. Despite the failureto decrease the degree of GS phosphorylation, however, an increase in the glycogensynthetic flux comparable to what was observed in the wildtype mice, was also ob-served in the mutant mice in both the experimental and model results. Finally, the
Stellenbosch University http://scholar.sun.ac.za
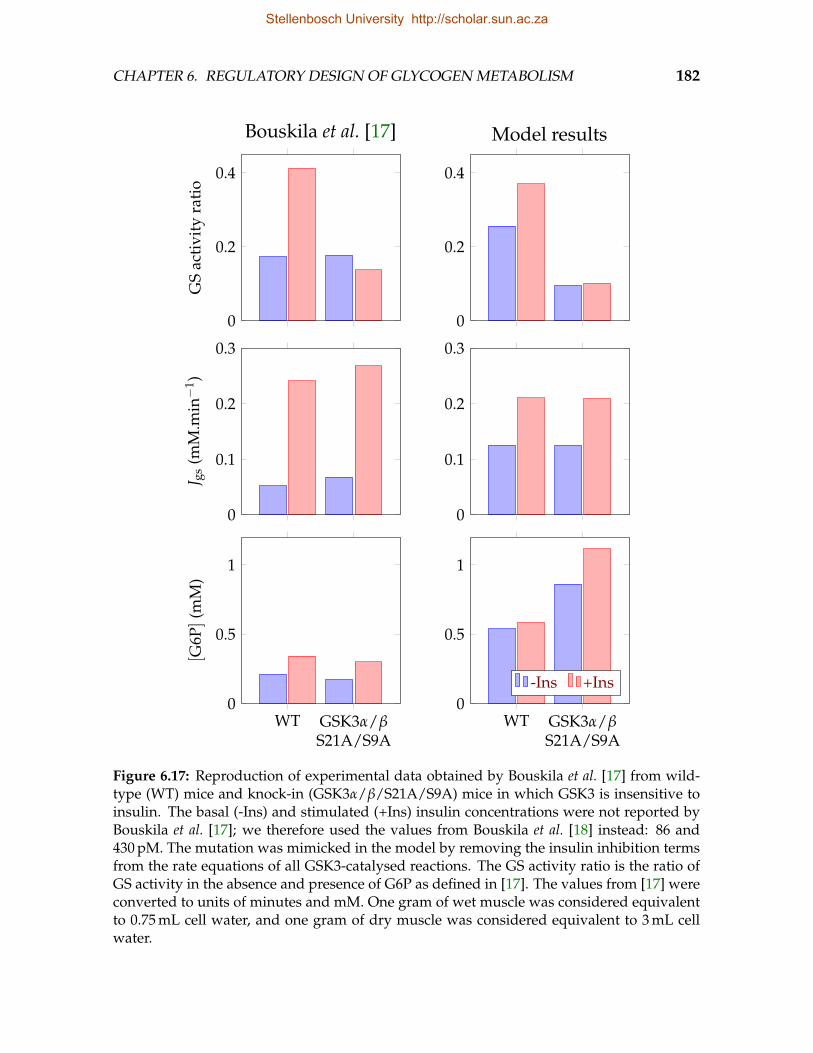
CHAPTER 6. REGULATORY DESIGN OF GLYCOGEN METABOLISM 182
0
0.2
0.4G
Sac
tivi
tyra
tio
Bouskila et al. [17]
0
0.2
0.4
Model results
0
0.1
0.2
0.3
J gs
(mM
.min−
1 )
0
0.1
0.2
0.3
WT GSK3α/βS21A/S9A
0
0.5
1
[G6P
](m
M)
WT GSK3α/βS21A/S9A
0
0.5
1
-Ins +Ins
Figure 6.17: Reproduction of experimental data obtained by Bouskila et al. [17] from wild-type (WT) mice and knock-in (GSK3α/β/S21A/S9A) mice in which GSK3 is insensitive toinsulin. The basal (-Ins) and stimulated (+Ins) insulin concentrations were not reported byBouskila et al. [17]; we therefore used the values from Bouskila et al. [18] instead: 86 and430 pM. The mutation was mimicked in the model by removing the insulin inhibition termsfrom the rate equations of all GSK3-catalysed reactions. The GS activity ratio is the ratio ofGS activity in the absence and presence of G6P as defined in [17]. The values from [17] wereconverted to units of minutes and mM. One gram of wet muscle was considered equivalentto 0.75 mL cell water, and one gram of dry muscle was considered equivalent to 3 mL cellwater.
Stellenbosch University http://scholar.sun.ac.za
CHAPTER 6. REGULATORY DESIGN OF GLYCOGEN METABOLISM 183
experimental and model results show that insulin stimulation leads to an increase inthe G6P concentration in both the wildtype and mutant mice.
While our results are generally in good agreement with those of Bouskila et al.[17], our interpretation of these results differs in a few respects. We have previouslyshown (see Sections 6.4 and 6.6) that, since GS does not control the glycogen syn-thetic flux, neither allosteric nor covalent regulation of GS is expected to alter theglycogen synthetic flux. It is therefore not surprising that the glycogen syntheticflux is stimulated to the same extent in the wildtype and mutant mice in responseto insulin. Whether GS is dephosphorylated (as in the wildtype mice) or remainsphosphorylated (as in the mutant mice), the increase in glycogen synthetic flux inresponse to insulin is the result of increased glucose uptake (resulting from an in-crease in plasma membrane GLUT4) and not the result of increased GS activity. In-stead, the increased GS activity in wildtype mice—resulting from increased G6P anddephosphorylation—allows the glycogen synthetic flux to match the flux of glucoseuptake at a lower G6P concentration. In agreement with this position, our modelshows a larger increase in G6P concentration in the mutant mice over basal than inthe wildtype mice, indicating disturbed G6P homeostasis. The same result was notobserved by Bouskila et al. [17]. It is, however, possible that other pathways com-pensate for the increase in G6P in vivo in the mutant mice. Bouskila et al. [17] alsoreported a higher insulin-stimulated increase in G6P in the wildtype mice than ourmodel suggests. The small increase in G6P predicted by our model results from thecoordinated activation of glucose uptake and glycogen synthesis, but, as we havediscussed before, also depends on cAMP, which effectively regulates the concentra-tion of PKA. In conclusion, we suggest that these results indicate that the regulationof GS activity does not alter the glycogen synthetic flux and that they should notbe interpreted as evidence that dephosphorylation of GSK3 in response to insulinstimulation is less important than allosteric activation.
Insulin fails to restore the glycogen synthetic flux in mice with
G6P-desensitized GS
To corroborate their earlier findings, Bouskila et al. [18] also studied knock-in mice inwhich the gene for GS was replaced by a mutant gene (denoted R285A) of which theproduct GS is insensitive to G6P, but which still exhibits normal activity in the ab-sence of G6P. We reproduced the results of Bouskila et al. [18] with a model in which
Stellenbosch University http://scholar.sun.ac.za
CHAPTER 6. REGULATORY DESIGN OF GLYCOGEN METABOLISM 184
all G6P binding terms in the GS rate equation were removed. The -G6P/+G6P activ-ity ratio or fractional velocity is often used as an indication of GS phosphorylationstate or intrinsic activity. These measures are, however, not applicable to the presentstudy, since a value of unity results for G6P-insensitive GS regardless of phosphory-lation state. Bouskila et al. [18] therefore only report the -G6P activity.
Bouskila et al. [18] found that, while the mutant GS was insensitive to G6P, insulinstimulation was able to increase the -G6P activity to similar levels in both wildtypeand mutant mice (Fig. 6.18). Our model results likewise showed that the intrinsicactivity of GS was similar in the wildtype and mutant mice and that insulin stimu-lation activated GS in the mutant mice to the same extent that it activated GS in thewildtype mice. In further agreement with Bouskila et al. [18], we also found that indouble knock-in mice—in which GS is insensitive to G6P and GSK3 is constitutivelyactive—insulin still resulted in an increase in glycogen synthesis. Although in ourmodel results this increase was very small, and possibly insignificant, we discuss apossible mechanism behind this phenomenon in Section 6.9.
Bouskila et al. [18] reported a significantly higher basal and insulin-stimulatedG6P concentration in mutant mice compared to wildtype mice (Fig. 6.18). While wealso found an increase in mutant G6P concentration, the wildtype G6P concentra-tions and the fold increase of the mutant over wildtype G6P concentrations weremuch larger than what was found by Bouskila et al. [18]. This result is possibly ex-plained by the fact that our model does not include pathways such as glycolysis intowhich excess G6P could be channelled to compensate for the mutation, a positionsupported by the observation that a 2.5-fold increase in the glycolytic flux was ob-served in mutant mice relative to wildtype mice [18]. A side-effect of the high G6Pconcentrations in our model of the mutant mice was that the glucose uptake flux wassignificantly inhibited as a result of HK inhibition by G6P. Bouskila et al. [18] did notobserve a decrease in glucose uptake in the mutant mice, but concede that their di-rect measurement of glucose uptake, as estimated by 2-deoxyglucose uptake, wouldnot reveal HK inhibition, because 2-deoxyglucose-6-phosphate does not inhibit HK.A decrease in glycogen synthetic flux without a decrease in glucose uptake flux is,however, also explained by an increase in glycolysis.
Bouskila et al. [18] interpreted these results, namely that insulin fails to restoreglycogen synthesis in mutants to wildtype levels, as further evidence that insulinincreases the glycogen synthetic flux not by dephosphorylating GS, but by the al-losteric activation of GS by G6P. Despite the good agreement between the results of
Stellenbosch University http://scholar.sun.ac.za
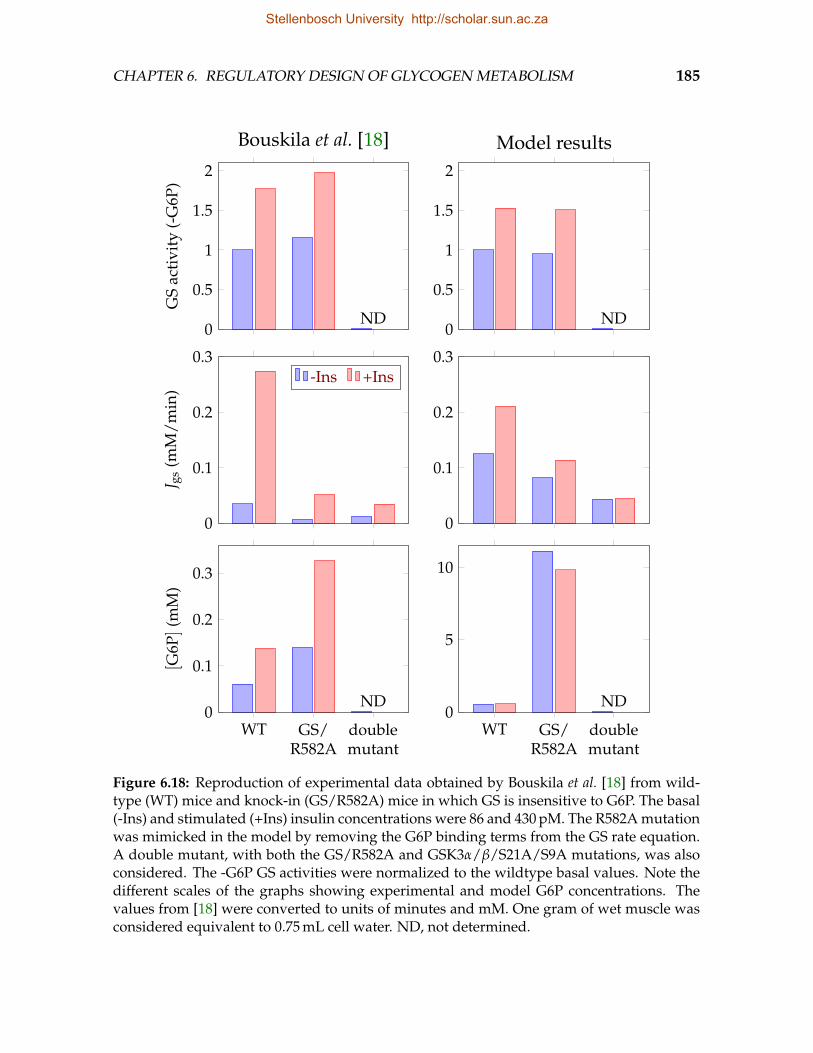
CHAPTER 6. REGULATORY DESIGN OF GLYCOGEN METABOLISM 185
ND0
0.5
1
1.5
2G
Sac
tivi
ty(-
G6P
)
Bouskila et al. [18]
ND0
0.5
1
1.5
2
Model results
0
0.1
0.2
0.3
J gs
(mM
/min
)
0
0.1
0.2
0.3
ND
WT GS/R582A
doublemutant
0
0.1
0.2
0.3
[G6P
](m
M)
ND
WT GS/R582A
doublemutant
0
5
10
-Ins +Ins
Figure 6.18: Reproduction of experimental data obtained by Bouskila et al. [18] from wild-type (WT) mice and knock-in (GS/R582A) mice in which GS is insensitive to G6P. The basal(-Ins) and stimulated (+Ins) insulin concentrations were 86 and 430 pM. The R582A mutationwas mimicked in the model by removing the G6P binding terms from the GS rate equation.A double mutant, with both the GS/R582A and GSK3α/β/S21A/S9A mutations, was alsoconsidered. The -G6P GS activities were normalized to the wildtype basal values. Note thedifferent scales of the graphs showing experimental and model G6P concentrations. Thevalues from [18] were converted to units of minutes and mM. One gram of wet muscle wasconsidered equivalent to 0.75 mL cell water. ND, not determined.
Stellenbosch University http://scholar.sun.ac.za
CHAPTER 6. REGULATORY DESIGN OF GLYCOGEN METABOLISM 186
Bouskila et al. [18] and those reported here, our interpretation of these results dif-fers. It is intriguing that, judged by the GS activity in the absence of G6P, insulinstimulated the dephosphorylation of GS to the same extent in wildtype and mutantanimals, but that this dephosphorylation was not sufficient to activate GS in the mu-tant mice. This indicates that the activation arising from the dephosphorylation ofGS sites that are GSK3 substrates in response to insulin is not sufficient to overcomethe inhibition brought about by phosphorylation at other sites and by allosteric inhi-bition. On the other hand, inhibition by phosphorylation and ATP can be overcomeby the allosteric activator G6P. This is, however, not evidence that, in response toinsulin, activation by G6P is stronger than activation by dephosphorylation of GS,but instead indicates that the allosteric activation of GS by G6P, whether at basal orinsulin-stimulated concentrations, is critically important to the normal functioningof glycogen synthesis. If the light bulb is removed, darkness should not be blamedon the switch.
Change in the fraction of glycogen synthase in the R conformation
in response to insulin and external glucose
The extent to which a change in the GS activity results in a change in the pathwayflux is quantified by the flux control coefficient C J
GS. Changes to the activity of GS—whether by allosteric or covalent modification—will only have a significant effect onthe glycogen synthetic flux if C J
GS has a large value. Consequently, the question ofwhether insulin stimulates glycogen synthesis mostly through allosteric or mostlythrough covalent activation of GS is only relevant if GS has significant control overthe glycogen synthetic flux. If, as we have argued earlier, the function of GS regu-lation, whether allosteric or covalent, is not the control of flux, but the homeostaticmaintenance of metabolite concentrations in the face of large fluctuations in the glu-cose uptake flux, then the answer to the question of whether allosteric or covalentregulation contributes the most to the glycogen synthetic flux in response to insulincan only be that neither mechanism contributes to a change in the flux.
The relative importance of allosteric and covalent GS modification in responseto insulin can also be assessed by only considering the local activity change of GSwithout considering the global effect, such as a change in flux or metabolite concen-tration, brought about by a local change in the GS activity. We thus pose the ques-tion whether an increase—in addition to what is already observed at basal insulin
Stellenbosch University http://scholar.sun.ac.za
CHAPTER 6. REGULATORY DESIGN OF GLYCOGEN METABOLISM 187
concentrations—in the allosteric activation of GS as a result of the insulin-stimulatedincrease in G6P contributes more towards GS activation than the dephosphorylationof GS that occurs during the transition from basal to insulin-stimulated conditions.This question differs from that of Bouskila et al. [18] in that it is not concerned withthe glycogen synthetic flux at all, but rather with the intrinsic activity state of GS.Another difference is that it emphasizes that the change in GS activity must be con-sidered relative to the basal activity in wildtype mice. While this question is difficultto address experimentally, it is readily investigated with an appropriate mathemati-cal model.
Since we have found that the activity of GS in a particular phosphorylation stateis best described by an MWC-type rate equation in which only the R conformation iscatalytically active, the fraction of GS that is present in the R conformation providesa measure of the intrinsic activity of the enzyme. Another aspect of the rate equationis that both allosteric and covalent modification manifest as an apparent alterationto the equilibrium between unliganded enzyme in the T and R conformations. Thisalteration is implicit in the case of allosteric modification, but involves an explicitchange to L0 in the case of covalent modification, i.e., a different L0 value is assignedto each phosphorylation state of GS. The fraction of GS in a particular phosphory-lation state i that is present in the R conformation in the absence of ligands is givenby
R0i =R0i
R0i + T0i(6.33)
=1
1 + L0i(6.34)
The definition of R0i is very similar to that of the GS activity ratio which is expressedas I/(I + D), where I and D represent the G6P-independent and G6P-dependentactivity of GS. Indeed, we showed in Chapter 3 that the activity ratio is an approx-imation of R0. The overall fraction of GS in the R conformation, considering allphosphorylation states, is then given by
R0 = ∑i
[GS]i[GS]tot
R0i (6.35)
The value of R0 is independent of any allosteric modification and only reflects theactivity state as altered by covalent modification. As phosphorylation is inhibitory,R0 increases in response to insulin stimulation which leads to the dephosphorylation
Stellenbosch University http://scholar.sun.ac.za
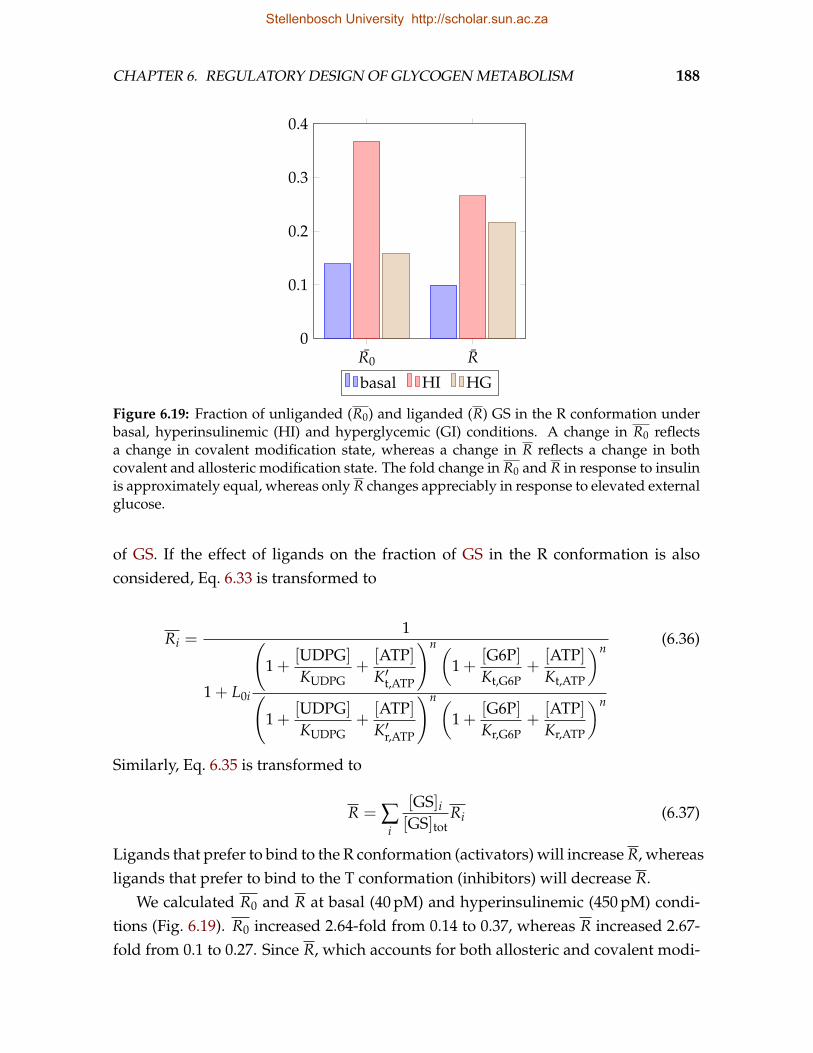
CHAPTER 6. REGULATORY DESIGN OF GLYCOGEN METABOLISM 188
R0 R0
0.1
0.2
0.3
0.4
basal HI HG
Figure 6.19: Fraction of unliganded (R0) and liganded (R) GS in the R conformation underbasal, hyperinsulinemic (HI) and hyperglycemic (GI) conditions. A change in R0 reflectsa change in covalent modification state, whereas a change in R reflects a change in bothcovalent and allosteric modification state. The fold change in R0 and R in response to insulinis approximately equal, whereas only R changes appreciably in response to elevated externalglucose.
of GS. If the effect of ligands on the fraction of GS in the R conformation is alsoconsidered, Eq. 6.33 is transformed to
Ri =1
1 + L0i
(1 +
[UDPG]
KUDPG+
[ATP]K′t,ATP
)n (1 +
[G6P]Kt,G6P
+[ATP]Kt,ATP
)n
(1 +
[UDPG]
KUDPG+
[ATP]K′r,ATP
)n (1 +
[G6P]Kr,G6P
+[ATP]Kr,ATP
)n
(6.36)
Similarly, Eq. 6.35 is transformed to
R = ∑i
[GS]i[GS]tot
Ri (6.37)
Ligands that prefer to bind to the R conformation (activators) will increase R, whereasligands that prefer to bind to the T conformation (inhibitors) will decrease R.
We calculated R0 and R at basal (40 pM) and hyperinsulinemic (450 pM) condi-tions (Fig. 6.19). R0 increased 2.64-fold from 0.14 to 0.37, whereas R increased 2.67-fold from 0.1 to 0.27. Since R, which accounts for both allosteric and covalent modi-
Stellenbosch University http://scholar.sun.ac.za
CHAPTER 6. REGULATORY DESIGN OF GLYCOGEN METABOLISM 189
fication, increases only very slightly more than R0, which only accounts for covalentmodification, we may conclude that the major part of the resulting activation of GSin response to insulin is due to the dephosphorylation of GS and not to allostericactivation by G6P. We also calculated R0 and R at euglycemic (5.5 mM) and hyper-glycemic (13 mM) conditions (Fig. 6.19). R0 increased 1.14-fold from 0.14 to 0.16,whereas R increased 2.17-fold from 0.1 to 0.22. This indicates that, in response toan increase in the external glucose concentration, GS activation results mostly fromactivation by G6P and not from dephosphorylation of the enzyme. These results arein agreement with experimental results showing that insulin [242], but not externalglucose [243, 244], increases the GS fractional velocity.
While we were able to reproduce the results of Bouskila et al. [17, 18] reasonablywell, we argue that those results cannot be interpreted as evidence that, in responseto insulin stimulation, allosteric modification “trumps” [245] covalent modification.To the contrary, our analysis indicates that insulin-dependent dephosphorylation ofGS accounts for the major part of GS activation in response to insulin.
Using R0 and R to quantify the relative contributions of allosteric and covalentmodification to GS activation is, however, not without its shortcomings. If most ofthe unliganded GS is already present in the R conformation, then the effect of ligandsthat also favour the R conformation is less than what would be observed if most ofthe unliganded GS was in the T conformation. Our values for R0 were, however, wellbelow 0.5 and the importance of allosteric modification would only be marginallyunderestimated. Another shortcoming is that while a change in R0 reflects a changein the covalent state of GS, it is also true that G6P can alter the phosphorylation stateof GS by virtue of PP1 activation. This is evident in the change in R0 that results froman increase in external glucose. This insulin-independent change in R0 is, however,much smaller than the change in R and we therefore do not expect it to significantlyaffect the change in R0 resulting from an increase in insulin.
These results agree well with our earlier findings that the value of ΩJ:G6PGlco
is com-
pletely determined by the value of εdemandG6P , whereas ΩJ:G6P
Ins is only influenced byεdemand
G6P when the absolute values of εsupplyIns and εdemand
Ins differ significantly. Thatis, activation of the demand block (glycogen synthesis) by G6P is essential for thehomeostatic maintenance of G6P in response to the increased flux resulting fromelevated external glucose. In response to insulin, on the other hand, the mecha-nism by which G6P is maintained in a narrow range involves the coordinate acti-vation of glucose uptake and glycogen synthesis. The situation is, however, more
Stellenbosch University http://scholar.sun.ac.za
CHAPTER 6. REGULATORY DESIGN OF GLYCOGEN METABOLISM 190
complex, because G6P is also able to stimulate net dephosphorylation of GS in aninsulin-independent mechanism. The result is that εdemand
G6P is not a pure indicationof allosteric activation, and εdemand
Ins is not a pure indication of covalent activation.The relative importance of allosteric and covalent modification can also be inves-
tigated with MCA. In this framework, the effect of insulin on R can be quantifiedwith the response coefficient RR
Ins, which is expressed as
RRIns = CR
GLUTεGLUTIns + ∑
iCR
GSK3iε
GSK3iIns (6.38)
where i denotes a particular GSK3-catalysed reaction. CRGLUT and CR
GSK3ican be ex-
pressed in terms of conventional concentration-control coefficients and hence also interms of elasticities. One would then proceed to separate all the terms that describeallosteric modification from those that describe covalent modification, provided thatthis distinction can be clearly made, in order to quantify the contributions of thesetwo mechanisms toward a change in R. The resulting expression is, however, socomplicated that we will not attempt this analysis here. RR
Glcocould similarly be
employed to investigate the relative contributions of allosteric and covalent modifi-cation to a change in R in response to an increase in external glucose concentration.
6.9 The mechanisms by which glucose-6-phosphate
stimulates glycogen synthesis
In Section 6.4 we saw that εdemandG6P , the elasticity of the glycogen synthesis block to
G6P, is an important determinant of the extent to which the concentration of G6Pis maintained in a narrow range in the face of large increases in the flux resultingfrom elevated external glucose concentrations. In Chapter 2 we reviewed five mech-anisms by which G6P stimulates glycogen synthesis. Four of these mechanisms wereincluded in our model of glycogen synthesis (GlySynth):
• G6P is a precursor of UDPG and can thus be considered the substrate of thedemand (glycogen synthesis) block
• G6P is an allosteric activator of GS
• G6P is a substrate-specific inhibitor of GS kinases
• G6P is a substrate-specific activator of GS phosphatases
Stellenbosch University http://scholar.sun.ac.za
CHAPTER 6. REGULATORY DESIGN OF GLYCOGEN METABOLISM 191
In this section we consider the contribution of each of these mechanisms towards thevalue of εdemand
G6P .Since εdemand
G6P is a block elasticity it can be expressed in terms of the elasticities ofindividual enzymes in the block with respect to G6P, each scaled by the flux-controlcoefficient of the particular enzyme within the block. Stated otherwise, εdemand
G6P is theflux-response coefficient of the isolated block with respect to G6P:
εdemandG6P = RJdemand
G6P (6.39)
= C JdemandPGLM εPGLM
G6P + C JdemandGS εGS
G6P + ∑i
C Jdemandkini
εkiniG6P + ∑
jC Jdemand
phosjε
phosjG6P (6.40)
where kini is any GS kinase reaction and phosj is any GS phosphatase reaction. Ifwe define these partial response coefficients:
subRJdemandG6P = C Jdemand
PGLM εPGLMG6P (6.41)
allosRJdemandG6P = C Jdemand
GS εGSG6P (6.42)
kinRJdemandG6P = ∑
iC Jdemand
kiniε
kiniG6P (6.43)
phosRJdemandG6P = ∑
jC Jdemand
phosjε
phosjG6P (6.44)
then Eq. 6.39 can be rewritten as
εdemandG6P = subRJdemand
G6P + allosRJdemandG6P + kinRJdemand
G6P + phosRJdemandG6P (6.45)
The contribution of each of the four terms in Eq. 6.45 as a function of G6P concentra-tion is shown in Fig. 6.20.
Contribution of G6P as substrate precursor
The contribution of G6P as substrate precursor of GS to the value of εdemandG6P is quanti-
fied by subRJdemandG6P . In order to express subRJdemand
G6P completely in terms of elasticities ofthe demand block, it is necessary to find an expression for C Jdemand
PGLM . In addition to theglycogen synthesis pathway, the demand block also contains the pathway describingthe interconversion between all the GS phosphorylation states. If no intermediates
Stellenbosch University http://scholar.sun.ac.za
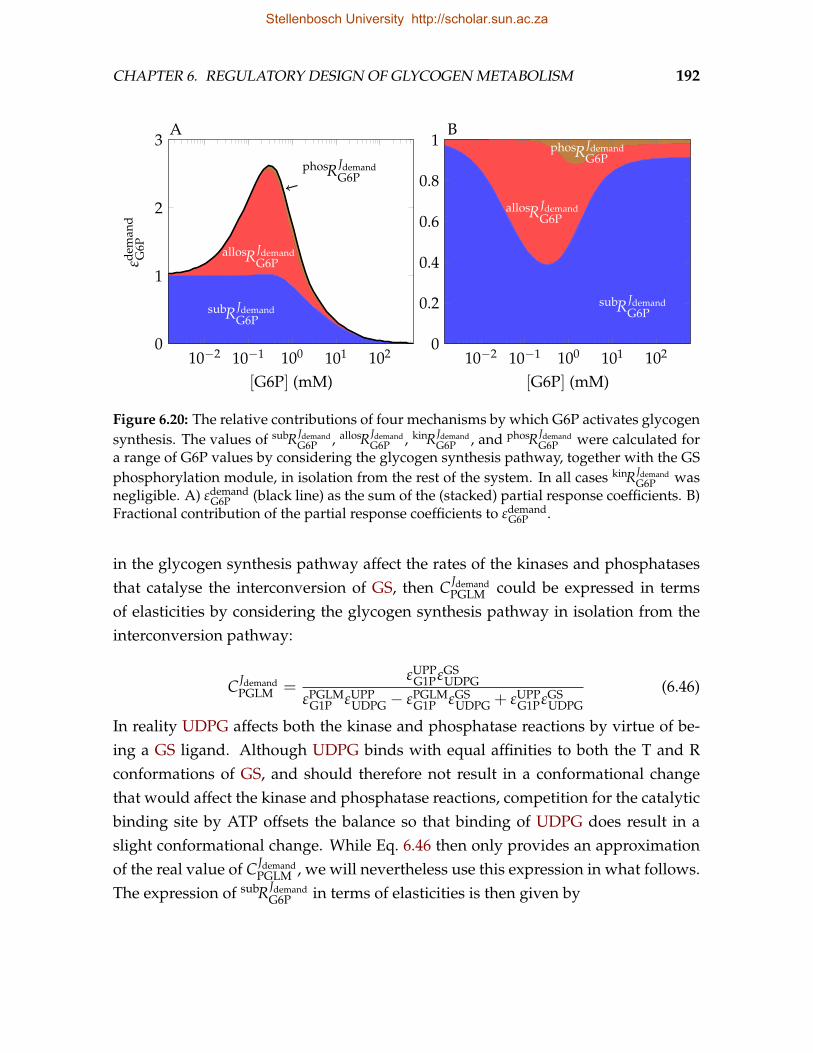
CHAPTER 6. REGULATORY DESIGN OF GLYCOGEN METABOLISM 192
A
10−2 10−1 100 101 1020
1
2
3
[G6P] (mM)
εdem
and
G6P
subRJdemandG6P
allosRJdemandG6P
phosRJdemandG6P
B
10−2 10−1 100 101 1020
0.2
0.4
0.6
0.8
1
[G6P] (mM)
subRJdemandG6P
allosRJdemandG6P
phosRJdemandG6P
Figure 6.20: The relative contributions of four mechanisms by which G6P activates glycogensynthesis. The values of subRJdemand
G6P , allosRJdemandG6P , kinRJdemand
G6P , and phosRJdemandG6P were calculated for
a range of G6P values by considering the glycogen synthesis pathway, together with the GSphosphorylation module, in isolation from the rest of the system. In all cases kinRJdemand
G6P wasnegligible. A) εdemand
G6P (black line) as the sum of the (stacked) partial response coefficients. B)Fractional contribution of the partial response coefficients to εdemand
G6P .
in the glycogen synthesis pathway affect the rates of the kinases and phosphatasesthat catalyse the interconversion of GS, then C Jdemand
PGLM could be expressed in termsof elasticities by considering the glycogen synthesis pathway in isolation from theinterconversion pathway:
C JdemandPGLM =
εUPPG1PεGS
UDPG
εPGLMG1P εUPP
UDPG − εPGLMG1P εGS
UDPG + εUPPG1PεGS
UDPG(6.46)
In reality UDPG affects both the kinase and phosphatase reactions by virtue of be-ing a GS ligand. Although UDPG binds with equal affinities to both the T and Rconformations of GS, and should therefore not result in a conformational changethat would affect the kinase and phosphatase reactions, competition for the catalyticbinding site by ATP offsets the balance so that binding of UDPG does result in aslight conformational change. While Eq. 6.46 then only provides an approximationof the real value of C Jdemand
PGLM , we will nevertheless use this expression in what follows.The expression of subRJdemand
G6P in terms of elasticities is then given by
Stellenbosch University http://scholar.sun.ac.za
CHAPTER 6. REGULATORY DESIGN OF GLYCOGEN METABOLISM 193
subRJdemandG6P ' εUPP
G1PεGSUDPG
εPGLMG1P εUPP
UDPG − εPGLMG1P εGS
UDPG + εUPPG1PεGS
UDPG· εPGLM
G6P (6.47)
Since both PGLM and UPP are near equilibrium, it follows that∣∣εPGLM
G6P
∣∣ '∣∣εPGLM
G1P
∣∣,∣∣εUPPG1P
∣∣ '∣∣εUPP
UDPG
∣∣, and that the value of εGSUDPG is much smaller than εPGLM
G6P and εUPPG1P
in absolute terms. Equation 6.47 then simplifies to
subRJdemandG6P ' εGS
UDPG (6.48)
The high activities of PGLM and UPP essentially keep the concentrations of G6P andUDPG in a fixed ratio, so that a small percentage change in G6P results in an equalpercentage change in UDPG. The relative effect of G6P as substrate precursor ofGS is therefore identical to that of the real GS substrate. At low G6P concentrationssubRJdemand
G6P is the sole contributor to εdemandG6P and has a value close to unity (Fig. 6.20A).
As G6P further increases, the UDPG concentration enters the range in which slightUDPG binding cooperativity is observed, so that subRJdemand
G6P increases to just above 1.Finally, at very high G6P concentrations, the UDPG concentration becomes saturat-ing to GS with the result that subRJdemand
G6P approaches zero. Note that if we modelledGS as a reversible reaction, subRJdemand
G6P would approach infinity, not unity, at very lowG6P concentrations where the GS reaction is near equilibrium.
Contribution of G6P as allosteric activator
The contribution of G6P as allosteric activator of GS to the value of εdemandG6P is quanti-
fied by allosRJdemandG6P = C Jdemand
GS εGSG6P. Following the same reasoning as above, the value
of C JdemandGS can be approximated by considering glycogen synthesis as a pathway
that is isolated from the GS interconversion pathway. The expression for C JdemandGS
then reads
C JdemandGS =
εPGLMG1P εUPP
UDPG
εPGLMG1P εUPP
UDPG − εPGLMG1P εGS
UDPG + εUPPG1PεGS
UDPG(6.49)
Considering that PGLM and UPP operate near equilibrium, Eq. 6.49 simplifies to
C JdemandGS ' 1 (6.50)
and Eq. 6.42 simplifies to
allosRJdemandG6P ' εGS
G6P (6.51)
Stellenbosch University http://scholar.sun.ac.za
CHAPTER 6. REGULATORY DESIGN OF GLYCOGEN METABOLISM 194
The condition C JdemandGS ' 1 could also be achieved if GS were saturated with its
substrate UDPG, i.e., if εGSUDPG ' 0 held. If this were the case, one would expect
G6P to activate GS by increasing the maximal rate of catalysis and not the affinity ofUDPG, as discussed by Hofmeyr et al. [16] and in Chapter 4. However, since UDPGis not saturating in our model, no such restriction is placed on the mechanism bywhich G6P activates GS. Indeed, the rate equation that we have found to provide thebest description of GS kinetics mandates that G6P activates GS both by increasing therate constant (by favouring the catalytically active conformation) and by increasingthe affinity for UDPG (by favouring the conformation in which ATP competitionwith UDPG is the weakest).
εGSG6P itself can be expressed as a sum of weighted elasticities: the elasticity of each
phosphorylation state of GS to G6P contributes to εGSG6P in proportion to the fraction
that catalysis by the particular phosphorylation state contributes toward the overallGS rate (Appendix A.2):
εGSG6P = ∑
i
vGSi
vGSε
GSiG6P (6.52)
where
εGSiG6P =
n
(1 +
[UDPG]
KUDPG+
[ATP]K′t,ATP
)n
L0i
1 +[G6P]Kt,G6P
+[ATP]Kt,ATP
1 +[G6P]Kr,G6P
+[ATP]Kr,ATP
n
[G6P]Kr,G6P
1 +[G6P]Kr,G6P
+[ATP]Kr,ATP
−
[G6P]Kt,G6P
1 +[G6P]Kt,G6P
+[ATP]Kt,ATP
(1 +
[UDPG]
KUDPG+
[ATP]K′t,ATP
)n
L0i
1 +[G6P]Kt,G6P
+[ATP]Kt,ATP
1 +[G6P]Kr,G6P
+[ATP]Kr,ATP
n
+
(1 +
[UDPG]
KUDPG+
[ATP]K′r,ATP
)n
(6.53)
The theoretical maximum value of εGSiG6P is n = 4, which is achieved if the enzyme
is present only in the T conformation (L0i → ∞) and if G6P is saturating (Kr,G6P [G6P]), but does not bind to the T conformation (Kt,G6P → ∞). These conditions arenot met for any of the GS phosphorylation states and therefore ε
GSiG6P and thus εGS
G6P
are smaller than 4 for all i.Rubin & Changeux [161] have shown that the slope of the graph of fractional
saturation against ligand concentration is maximized when L =√
Knt /Kn
r . Since theeffects of ligand binding and covalent modification both manifest as changes in Lapp
(which is proportional to L0,app but takes ligand concentrations into account), it is in-structive to consider the value of Lapp that will result in a maximum ε
GSiG6P value. The
present situation, however, differs from the one considered by Rubin & Changeux
Stellenbosch University http://scholar.sun.ac.za
CHAPTER 6. REGULATORY DESIGN OF GLYCOGEN METABOLISM 195
[161] in that we are interested in the relationship between vGS, which is proportionalto the fractional saturation of GS with UDPG (as opposed to G6P) and G6P. Never-theless, from the fitted values of Kt,G6P and Kr,G6P the value of Lapp that maximizesεGS
G6P is calculated as 18.4. ATP inhibits GS both by preferentially binding to the Tconformation and by competing with G6P for the allosteric site. Since competitionof ATP with G6P results in an apparent change to Kt,G6P and Kr,G6P, the value of Lapp
that results in a maximal value of εGSG6P depends on the ATP concentration. Other
ligands will also alter the optimal Lapp value.The values of L0i range between 0.25 for the dephosphorylated enzyme and 185
for the completely phosphorylated enzyme. While phosphorylation will continue toinhibit GS beyond Lapp values of about 18.4, depending on the concentrations of GSligands, this inhibition will not be accompanied by a further increase in εGS
G6P. In fact,a steady decrease in εGS
G6P is expected. Similarly, inhibition by ATP will increase εGSG6P
only as long as Lapp remains below 18.4. In summary then, the value of εGSG6P is the
result of the cooperative binding of G6P to GS, the degree of which is enhanced byATP and phosphorylation, but only up to a point.
At very low concentrations G6P is not able to activate GS and allosRJdemandG6P does not
contribute to εdemandG6P (Fig. 6.20). As G6P increases to within the range between Kr,G6P
and Kt,G6P, allosRJdemandG6P increases and passes through its maximal value. Further in-
creases in G6P cause GS to become saturated with G6P, so that allosRJdemandG6P decreases
asymptotically to zero again.
Contribution of G6P as kinase inhibitor and phosphatase activator
The contribution of G6P as GS kinase inhibitor and GS phosphatase activator to thevalue of εdemand
G6P is quantified by kinRJdemandG6P and phosRJdemand
G6P . While it is possible toexpress these two partial elasticities in terms of elasticities of individual enzymes inthe demand block, the resulting expressions are too complicated to be workable. Itis, however, reasonable to assume that the same conditions identified for the simplersystem considered in Chapter 4 will also maximize kinRJdemand
G6P and phosRJdemandG6P . These
conditions, as applied to GS modification, are
1. GS must control the flux within the isolated glycogen synthesis pathway
2. UDPG must bind equally well to the T and R conformations of GS
3. the various phosphorylation states of GS must exhibit different kinetics
Stellenbosch University http://scholar.sun.ac.za
CHAPTER 6. REGULATORY DESIGN OF GLYCOGEN METABOLISM 196
4. the GS kinases and phosphatase must exhibit zero-order sensitivity to GS assubstrate
We have already seen that the first condition is satisfied by virtue of PGLM andUPP operating near equilibrium. The second condition is not met, because althoughUDPG binds equally well to the T and R conformations in the absence of ATP, com-petition with ATP at the catalytic site alters the apparent affinity of GS for UDPGto such an extent that, in the presence of ATP, UDPG binds preferentially to the Rconformation. It must, however, be recalled that we fitted the kinetic parameters forGS to experimental data that were obtained under conditions (low pH) were ATPinhibition is very pronounced [39, 67]. At any rate, judging by the mild UDPG co-operativity observed, the violation of the second condition is not significant.
While not all the GS phosphorylation states exhibit the same kinetics, the kineticsof some states are not altered by phosphorylation. Conversion between GS stateswith identical kinetics will not contribute to kinRJdemand
G6P and phosRJdemandG6P . The third
condition is thus only partially satisfied.Finally, for a number of reasons, the fourth condition is also not met. The Michaelis
constants for the phosphatase and kinase reactions are rather high (in the orderof the concentrations of the various GS states) and thus neither the kinase nor thephosphatase reactions are near saturation. For the phosphatase reactions, the highMichaelis constants are possibly explained by the fact that glycogen is generallyomitted in assays. Since both GS and PP1 are in association with glycogen in vivowhich results in an apparent increase in GS concentration, the kinetics determinedin the absence of glycogen would overestimate the Michaelis constant. Moreover,GS in phosphorylation states that do not affect the kinetics of the enzyme competewith GS in states that do, which further increases the apparent Michaelis constants.More extensive kinetic data are required to assess whether this condition is met invivo.
Although most of the conditions that would maximize kinRJdemandG6P and phosRJdemand
G6P
are not satisfied, phosRJdemandG6P still contributes to the value of εdemand
G6P , albeit to an extentwell below the theoretical maximum of infinity. The relationship between phosRJdemand
G6P
and G6P follow a similar profile as that of the relationship between allosRJdemandG6P and
G6P: initially the values are very small but then peak between Kr,G6P and Kt,G6P, onlyto decrease to zero again (Fig. 6.20). Note, however, that the peaks of kinRJdemand
G6P , ifpresent, and phosRJdemand
G6P will generally not coincide with each other or with the peakof allosRJdemand
G6P . Also note that the contribution of kinRJdemandG6P to εdemand
G6P is negligible.
Stellenbosch University http://scholar.sun.ac.za
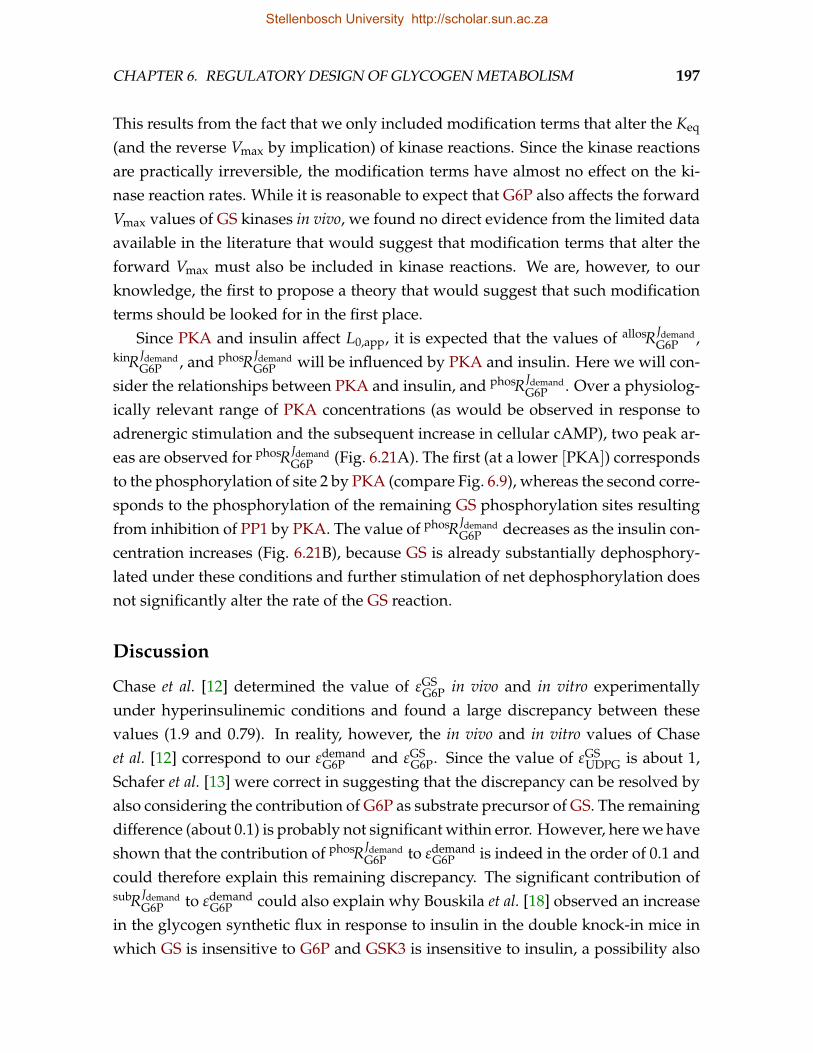
CHAPTER 6. REGULATORY DESIGN OF GLYCOGEN METABOLISM 197
This results from the fact that we only included modification terms that alter the Keq
(and the reverse Vmax by implication) of kinase reactions. Since the kinase reactionsare practically irreversible, the modification terms have almost no effect on the ki-nase reaction rates. While it is reasonable to expect that G6P also affects the forwardVmax values of GS kinases in vivo, we found no direct evidence from the limited dataavailable in the literature that would suggest that modification terms that alter theforward Vmax must also be included in kinase reactions. We are, however, to ourknowledge, the first to propose a theory that would suggest that such modificationterms should be looked for in the first place.
Since PKA and insulin affect L0,app, it is expected that the values of allosRJdemandG6P ,
kinRJdemandG6P , and phosRJdemand
G6P will be influenced by PKA and insulin. Here we will con-sider the relationships between PKA and insulin, and phosRJdemand
G6P . Over a physiolog-ically relevant range of PKA concentrations (as would be observed in response toadrenergic stimulation and the subsequent increase in cellular cAMP), two peak ar-eas are observed for phosRJdemand
G6P (Fig. 6.21A). The first (at a lower [PKA]) correspondsto the phosphorylation of site 2 by PKA (compare Fig. 6.9), whereas the second corre-sponds to the phosphorylation of the remaining GS phosphorylation sites resultingfrom inhibition of PP1 by PKA. The value of phosRJdemand
G6P decreases as the insulin con-centration increases (Fig. 6.21B), because GS is already substantially dephosphory-lated under these conditions and further stimulation of net dephosphorylation doesnot significantly alter the rate of the GS reaction.
Discussion
Chase et al. [12] determined the value of εGSG6P in vivo and in vitro experimentally
under hyperinsulinemic conditions and found a large discrepancy between thesevalues (1.9 and 0.79). In reality, however, the in vivo and in vitro values of Chaseet al. [12] correspond to our εdemand
G6P and εGSG6P. Since the value of εGS
UDPG is about 1,Schafer et al. [13] were correct in suggesting that the discrepancy can be resolved byalso considering the contribution of G6P as substrate precursor of GS. The remainingdifference (about 0.1) is probably not significant within error. However, here we haveshown that the contribution of phosRJdemand
G6P to εdemandG6P is indeed in the order of 0.1 and
could therefore explain this remaining discrepancy. The significant contribution ofsubRJdemand
G6P to εdemandG6P could also explain why Bouskila et al. [18] observed an increase
in the glycogen synthetic flux in response to insulin in the double knock-in mice inwhich GS is insensitive to G6P and GSK3 is insensitive to insulin, a possibility also
Stellenbosch University http://scholar.sun.ac.za
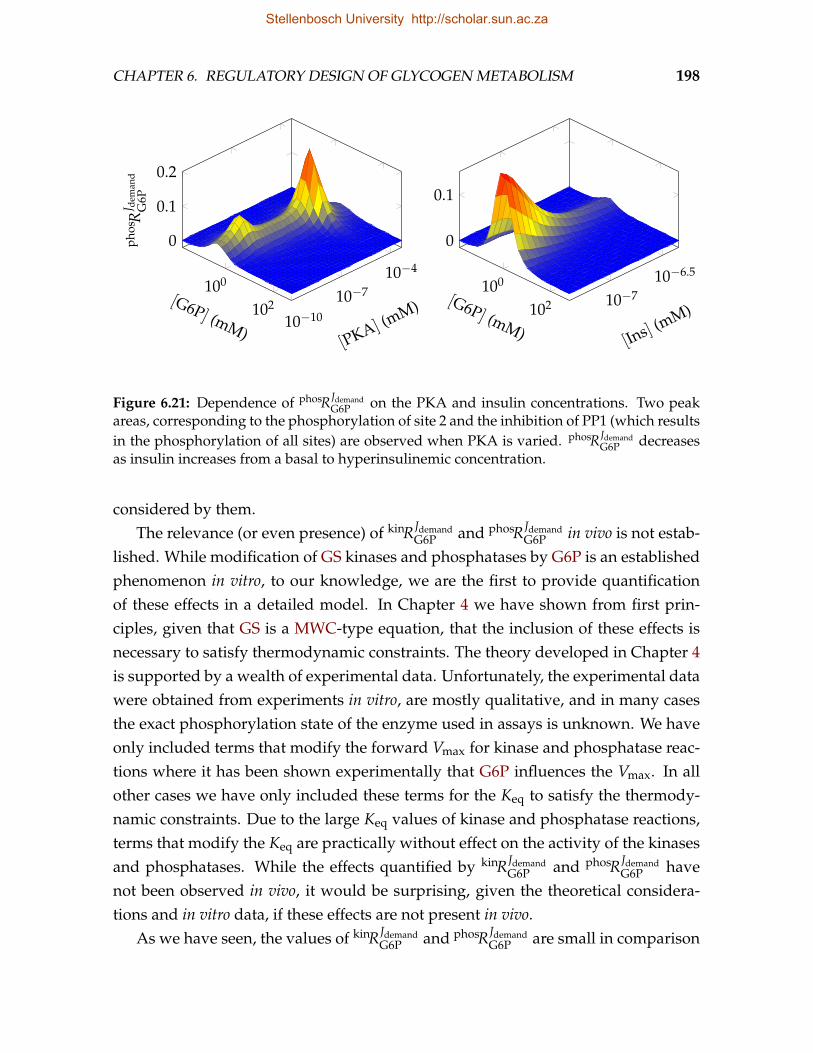
CHAPTER 6. REGULATORY DESIGN OF GLYCOGEN METABOLISM 198
100
10210−10
10−710−4
0
0.1
0.2
[G6P] (mM)[PKA] (mM)
phos
RJ d
eman
dG
6P
100
102 10−710−6.5
0
0.1
[G6P] (mM) [Ins] (mM)
Figure 6.21: Dependence of phosRJdemandG6P on the PKA and insulin concentrations. Two peak
areas, corresponding to the phosphorylation of site 2 and the inhibition of PP1 (which resultsin the phosphorylation of all sites) are observed when PKA is varied. phosRJdemand
G6P decreasesas insulin increases from a basal to hyperinsulinemic concentration.
considered by them.The relevance (or even presence) of kinRJdemand
G6P and phosRJdemandG6P in vivo is not estab-
lished. While modification of GS kinases and phosphatases by G6P is an establishedphenomenon in vitro, to our knowledge, we are the first to provide quantificationof these effects in a detailed model. In Chapter 4 we have shown from first prin-ciples, given that GS is a MWC-type equation, that the inclusion of these effects isnecessary to satisfy thermodynamic constraints. The theory developed in Chapter 4is supported by a wealth of experimental data. Unfortunately, the experimental datawere obtained from experiments in vitro, are mostly qualitative, and in many casesthe exact phosphorylation state of the enzyme used in assays is unknown. We haveonly included terms that modify the forward Vmax for kinase and phosphatase reac-tions where it has been shown experimentally that G6P influences the Vmax. In allother cases we have only included these terms for the Keq to satisfy the thermody-namic constraints. Due to the large Keq values of kinase and phosphatase reactions,terms that modify the Keq are practically without effect on the activity of the kinasesand phosphatases. While the effects quantified by kinRJdemand
G6P and phosRJdemandG6P have
not been observed in vivo, it would be surprising, given the theoretical considera-tions and in vitro data, if these effects are not present in vivo.
As we have seen, the values of kinRJdemandG6P and phosRJdemand
G6P are small in comparison
Stellenbosch University http://scholar.sun.ac.za
CHAPTER 6. REGULATORY DESIGN OF GLYCOGEN METABOLISM 199
to subRJdemandG6P and allosRJdemand
G6P . The question then arises as to what function kinaseinhibition and phosphatase activation by G6P fulfil that is not already fulfilled byallosteric activation of GS. We have already discussed the possibility that kinRJdemand
G6P
and phosRJdemandG6P are underestimated in our model, but even if this is the case the
value of εdemandG6P determined by Chase et al. [12] indicates that the underestimation
cannot be very large. A very large εdemandG6P value would result in switch-like behav-
iour in response to G6P. While switch-like behaviour is desirable in many systems,the possibility must be considered that glycogen synthesis could have evolved torepress this behaviour. This possibility must be considered with regard to the sitesphosphorylated by casein kinase 2 (CK2) and GSK3 in particular. GS states that arephosphorylated to various extents at this cluster will all serve as PP1 substrates, butonly the dephosphorylation of sites 3a and 3b would be enhanced by G6P. The othersites in this cluster will serve as competitive inhibitors in the dephosphorylation ofsites 3a and 3b and their presence will therefore diminish the value of phosRJdemand
G6P .Similarly, GS that is not phosphorylated at sites 4 and 3c will diminish the inhibi-tion by G6P of phosphorylation at sites 3b and 3a by GSK3. It appears therefore thatmultisite phosphorylation could act as a mechanism that minimizes kinRJdemand
G6P andphosRJdemand
G6P . More substantive conclusions can, however, only be drawn when moredetailed experimental data are available.
6.10 Energy charge homeostasis in response to ATP
demand
Up to this point we have only considered the regulation of glycogen synthesis. Inmany respects the regulation of glycogen synthesis and glycogen degradation is re-ciprocal: G6P activates GS, but inhibits GP; phosphorylation generally inhibits GS,but activates GP. Since we have established that the regulation of glycogen synthesisinvolves the maintenance of G6P homeostasis in response to elevated external glu-cose and insulin—and not the control of the glycogen synthetic flux—it is of interestto also consider the function of the regulation of glycogen degradation. For thispurpose we employed an implementation of the mathematical model (LamKus) ofmammalian skeletal muscle glycogenolysis by Lambeth & Kushmerick [19]. Since itwas first published, this model has been extended to also take into account the effectof pH on kinetic parameters and reaction equilibria [202]. We will, however, only be
Stellenbosch University http://scholar.sun.ac.za
CHAPTER 6. REGULATORY DESIGN OF GLYCOGEN METABOLISM 200
concerned with the original model.With regard to the rate equation and kinetics for GP, Lambeth & Kushmerick
[19] chose to only include activation of the dephosphorylated enzyme by AMP, butomitted inhibition by ATP and G6P. Considering the possibility that the modifiersomitted by Lambeth & Kushmerick [19] could play important roles in the regula-tion of glycogen degradation, we developed an alternative GP rate equation thatincludes these modifiers. In developing this rate equation, we followed the same ba-sic strategy as Walcott & Lehman [201], but with the important difference that G6Pinhibition was included and that, similar to our treatment of GS, the kinetics of bothphosphorylation states of GP were simultaneously fitted to experimental data. SeeAppendix C.2 for more details. The developed rate equation is a MWC-type equa-tion in which phosphorylation alters the equilibria between the T, R, and U confor-mations. Only the R conformation is catalytically active. We substituted the GP rateequation in the model of Lambeth & Kushmerick [19] with this equation (GP MWC).We also considered a form of the equation that excludes G6P inhibition for purposesof comparison (GP G6P-insensitive).
The presence of a feedback inhibition loop in which G6P inhibits GP leaves littledoubt that G6P could be considered, as in glycogen synthesis, to be a regulatorymetabolite of glycogen degradation. Unfortunately, glycogen degradation cannotbe treated as a simple supply-demand system of G6P, because G6P is involved in aphosphate moiety-conserved cycle, which prevents the system from being dividedinto functionally differentiated blocks unambiguously. At any rate, it is much morelikely that the regulation of glycogen degradation is primarily concerned with themaintenance of the cellular energy charge than with the homeostasis of G6P.
Energy charge, ψ, is a secondary system variable and has been defined by Atkin-son [246] as:
ψ =2[ATP] + [ADP]
2([ATP] + [ADP] + [AMP])(6.54)
In what follows we will be mainly concerned with the energy charge and ignoremost glycolytic intermediates.
In order to assess the impact on the steady-state of replacing the rate equationof GP, we compared the steady-states of the adapted models to the original modelof Lambeth & Kushmerick [19] (Fig. 6.22). No change in any of the fluxes was ob-served. The differences between metabolite concentrations were, for the most part,very small and in all cases the values from the adapted and original models were
Stellenbosch University http://scholar.sun.ac.za
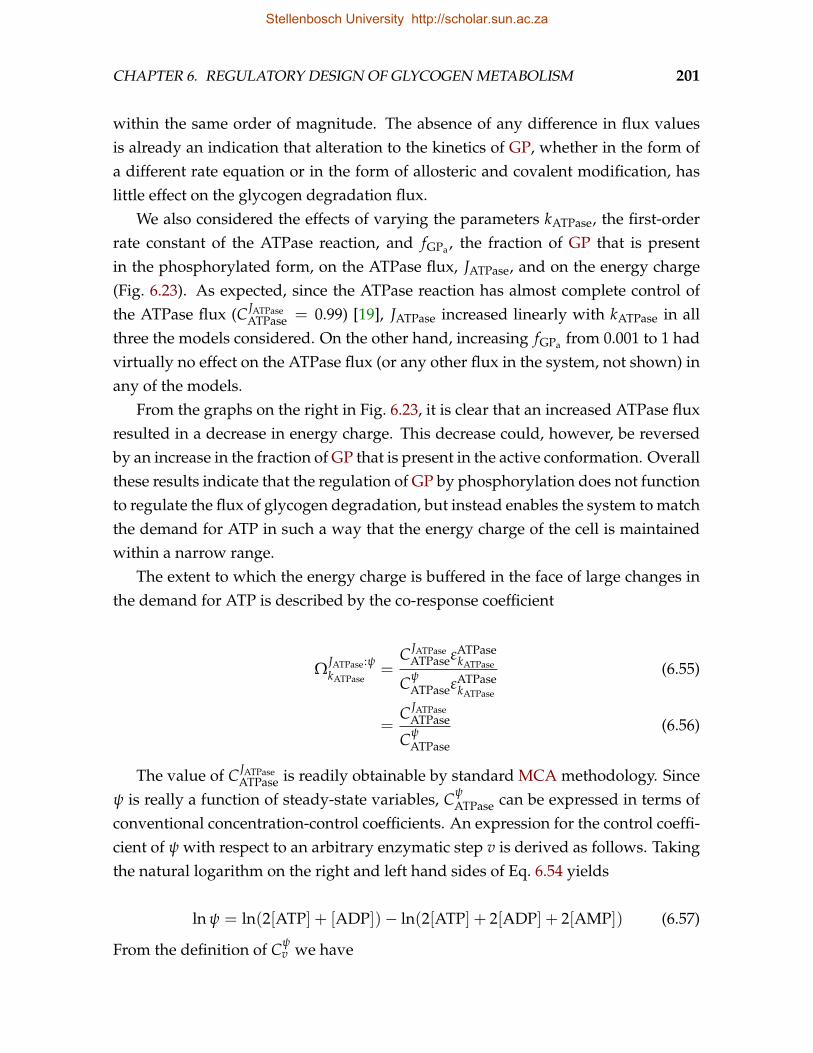
CHAPTER 6. REGULATORY DESIGN OF GLYCOGEN METABOLISM 201
within the same order of magnitude. The absence of any difference in flux valuesis already an indication that alteration to the kinetics of GP, whether in the form ofa different rate equation or in the form of allosteric and covalent modification, haslittle effect on the glycogen degradation flux.
We also considered the effects of varying the parameters kATPase, the first-orderrate constant of the ATPase reaction, and fGPa , the fraction of GP that is presentin the phosphorylated form, on the ATPase flux, JATPase, and on the energy charge(Fig. 6.23). As expected, since the ATPase reaction has almost complete control ofthe ATPase flux (C JATPase
ATPase = 0.99) [19], JATPase increased linearly with kATPase in allthree the models considered. On the other hand, increasing fGPa from 0.001 to 1 hadvirtually no effect on the ATPase flux (or any other flux in the system, not shown) inany of the models.
From the graphs on the right in Fig. 6.23, it is clear that an increased ATPase fluxresulted in a decrease in energy charge. This decrease could, however, be reversedby an increase in the fraction of GP that is present in the active conformation. Overallthese results indicate that the regulation of GP by phosphorylation does not functionto regulate the flux of glycogen degradation, but instead enables the system to matchthe demand for ATP in such a way that the energy charge of the cell is maintainedwithin a narrow range.
The extent to which the energy charge is buffered in the face of large changes inthe demand for ATP is described by the co-response coefficient
ΩJATPase:ψkATPase
=C JATPase
ATPaseεATPasekATPase
CψATPaseεATPase
kATPase
(6.55)
=C JATPase
ATPase
CψATPase
(6.56)
The value of C JATPaseATPase is readily obtainable by standard MCA methodology. Since
ψ is really a function of steady-state variables, CψATPase can be expressed in terms of
conventional concentration-control coefficients. An expression for the control coeffi-cient of ψ with respect to an arbitrary enzymatic step v is derived as follows. Takingthe natural logarithm on the right and left hand sides of Eq. 6.54 yields
ln ψ = ln(2[ATP] + [ADP])− ln(2[ATP] + 2[ADP] + 2[AMP]) (6.57)
From the definition of Cψv we have
Stellenbosch University http://scholar.sun.ac.za
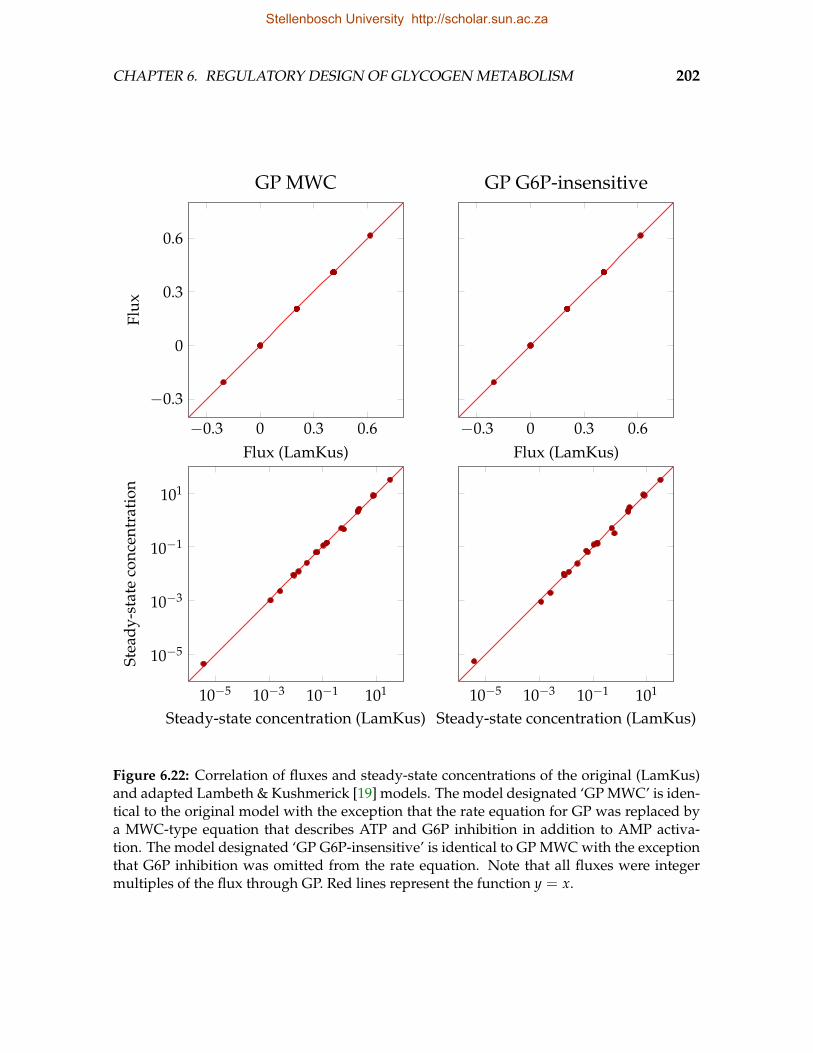
CHAPTER 6. REGULATORY DESIGN OF GLYCOGEN METABOLISM 202
−0.3 0 0.3 0.6
−0.3
0
0.3
0.6
Flux (LamKus)
Flux
GP MWC
−0.3 0 0.3 0.6Flux (LamKus)
GP G6P-insensitive
10−5 10−3 10−1 101
10−5
10−3
10−1
101
Steady-state concentration (LamKus)
Stea
dy-s
tate
conc
entr
atio
n
10−5 10−3 10−1 101
Steady-state concentration (LamKus)
Figure 6.22: Correlation of fluxes and steady-state concentrations of the original (LamKus)and adapted Lambeth & Kushmerick [19] models. The model designated ‘GP MWC’ is iden-tical to the original model with the exception that the rate equation for GP was replaced bya MWC-type equation that describes ATP and G6P inhibition in addition to AMP activa-tion. The model designated ‘GP G6P-insensitive’ is identical to GP MWC with the exceptionthat G6P inhibition was omitted from the rate equation. Note that all fluxes were integermultiples of the flux through GP. Red lines represent the function y = x.
Stellenbosch University http://scholar.sun.ac.za
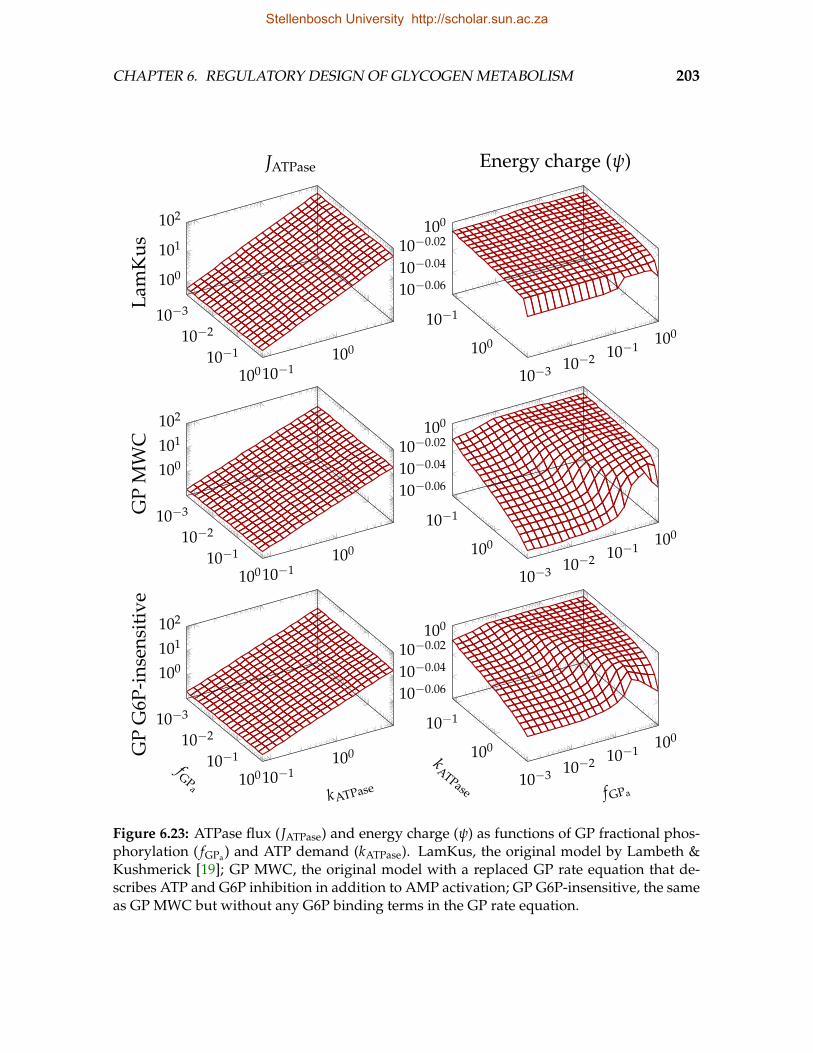
CHAPTER 6. REGULATORY DESIGN OF GLYCOGEN METABOLISM 203
Lam
Kus
10−3
10−2
10−1
10010−1100
100
101
102
JATPase
10−3 10−2 10−1100
10−1
100
10−0.0610−0.0410−0.02
100
Energy charge (ψ)G
PM
WC
10−3
10−2
10−1
10010−1100
100
101
102
10−3 10−2 10−1100
10−1
100
10−0.0610−0.0410−0.02
100
GP
G6P
-ins
ensi
tive
10−3
10−2
10−1
10010−1100
100
101
102
fGPa
kATPase10−3 10−2 10−1
10010−1
100
10−0.0610−0.0410−0.02
100
fGPa
kATPase
Figure 6.23: ATPase flux (JATPase) and energy charge (ψ) as functions of GP fractional phos-phorylation ( fGPa) and ATP demand (kATPase). LamKus, the original model by Lambeth &Kushmerick [19]; GP MWC, the original model with a replaced GP rate equation that de-scribes ATP and G6P inhibition in addition to AMP activation; GP G6P-insensitive, the sameas GP MWC but without any G6P binding terms in the GP rate equation.
Stellenbosch University http://scholar.sun.ac.za
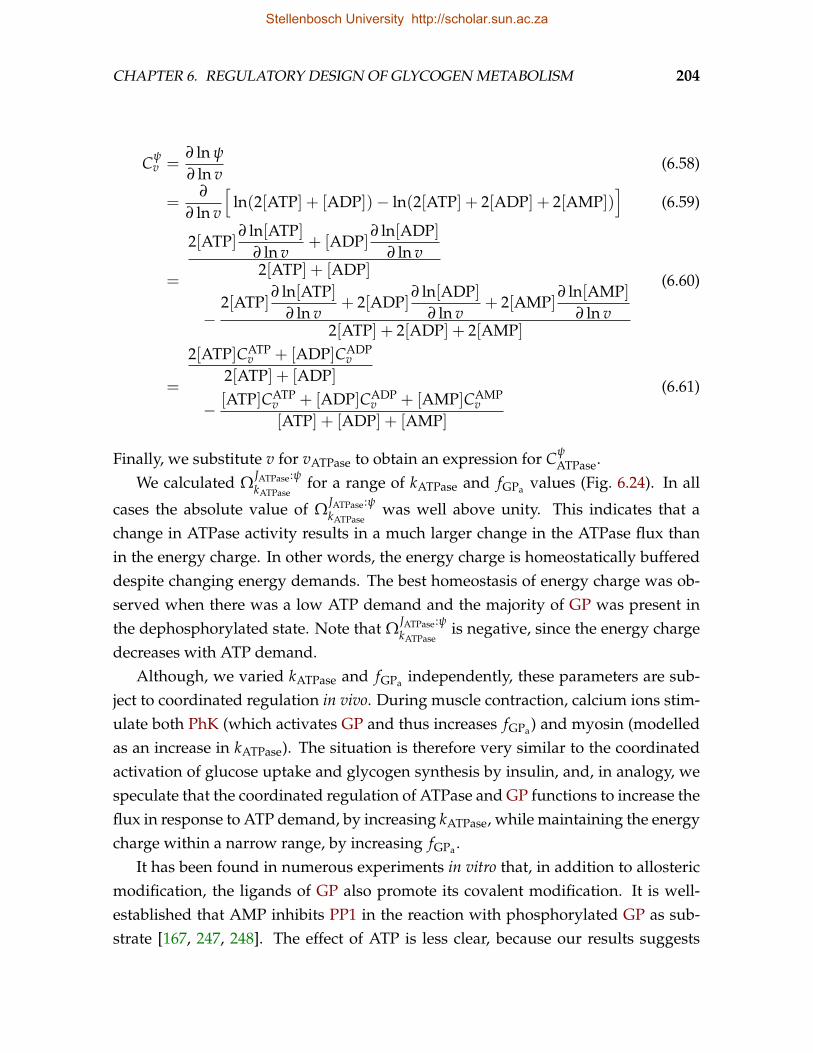
CHAPTER 6. REGULATORY DESIGN OF GLYCOGEN METABOLISM 204
Cψv =
∂ ln ψ
∂ ln v(6.58)
=∂
∂ ln v
[ln(2[ATP] + [ADP])− ln(2[ATP] + 2[ADP] + 2[AMP])
](6.59)
=
2[ATP]∂ ln[ATP]
∂ ln v+ [ADP]
∂ ln[ADP]∂ ln v
2[ATP] + [ADP]
−2[ATP]
∂ ln[ATP]∂ ln v
+ 2[ADP]∂ ln[ADP]
∂ ln v+ 2[AMP]
∂ ln[AMP]∂ ln v
2[ATP] + 2[ADP] + 2[AMP]
(6.60)
=
2[ATP]CATPv + [ADP]CADP
v2[ATP] + [ADP]
− [ATP]CATPv + [ADP]CADP
v + [AMP]CAMPv
[ATP] + [ADP] + [AMP]
(6.61)
Finally, we substitute v for vATPase to obtain an expression for CψATPase.
We calculated ΩJATPase:ψkATPase
for a range of kATPase and fGPa values (Fig. 6.24). In all
cases the absolute value of ΩJATPase:ψkATPase
was well above unity. This indicates that achange in ATPase activity results in a much larger change in the ATPase flux thanin the energy charge. In other words, the energy charge is homeostatically buffereddespite changing energy demands. The best homeostasis of energy charge was ob-served when there was a low ATP demand and the majority of GP was present inthe dephosphorylated state. Note that ΩJATPase:ψ
kATPaseis negative, since the energy charge
decreases with ATP demand.Although, we varied kATPase and fGPa independently, these parameters are sub-
ject to coordinated regulation in vivo. During muscle contraction, calcium ions stim-ulate both PhK (which activates GP and thus increases fGPa) and myosin (modelledas an increase in kATPase). The situation is therefore very similar to the coordinatedactivation of glucose uptake and glycogen synthesis by insulin, and, in analogy, wespeculate that the coordinated regulation of ATPase and GP functions to increase theflux in response to ATP demand, by increasing kATPase, while maintaining the energycharge within a narrow range, by increasing fGPa .
It has been found in numerous experiments in vitro that, in addition to allostericmodification, the ligands of GP also promote its covalent modification. It is well-established that AMP inhibits PP1 in the reaction with phosphorylated GP as sub-strate [167, 247, 248]. The effect of ATP is less clear, because our results suggests
Stellenbosch University http://scholar.sun.ac.za
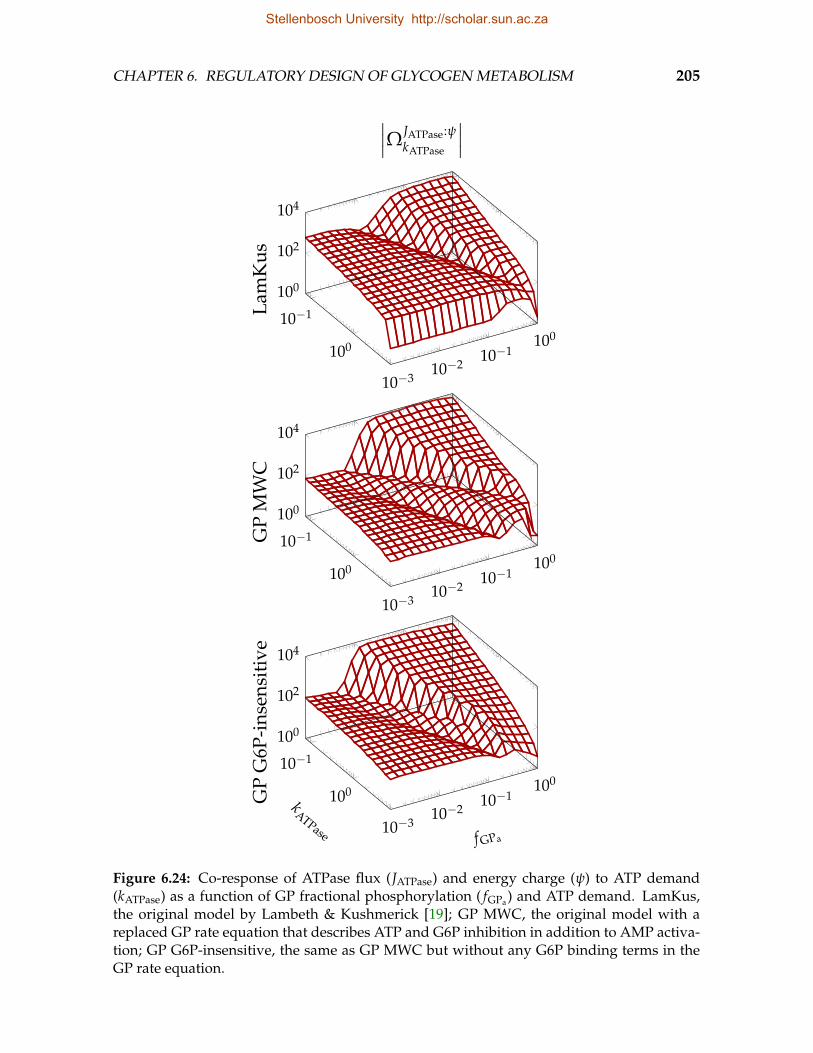
CHAPTER 6. REGULATORY DESIGN OF GLYCOGEN METABOLISM 205
Lam
Kus
10−310−2
10−1100
10−1
100
100
102
104
∣∣∣ΩJATPase:ψkATPase
∣∣∣
GP
MW
C
10−310−2
10−1100
10−1
100
100
102
104
GP
G6P
-ins
ensi
tive
10−310−2
10−1100
10−1
100
100
102
104
fGPa
kATPase
Figure 6.24: Co-response of ATPase flux (JATPase) and energy charge (ψ) to ATP demand(kATPase) as a function of GP fractional phosphorylation ( fGPa) and ATP demand. LamKus,the original model by Lambeth & Kushmerick [19]; GP MWC, the original model with areplaced GP rate equation that describes ATP and G6P inhibition in addition to AMP activa-tion; GP G6P-insensitive, the same as GP MWC but without any G6P binding terms in theGP rate equation.
Stellenbosch University http://scholar.sun.ac.za
CHAPTER 6. REGULATORY DESIGN OF GLYCOGEN METABOLISM 206
that, in addition to being a PhK substrate, it should also be a non-competitive in-hibitor with GP as substrate. G6P, on the other hand, inhibits PhK and activates PP1[166, 168, 222, 249]. These experimental results are in agreement with our findingthat ligands of MWC-enzymes of which covalent modification results in a change inthe equilibrium between conformations of the enzyme will affect the rates of cova-lent modification (see Section 4.3). While the effects of GP ligands on its covalentmodification have not been studied in detail, it seems reasonable to speculate thata decrease in energy charge (decrease in ATP, increase in AMP) will of its own—independent of GP activation by calcium or cAMP—stimulate net phosphorylationof GP and thus act as a mechanism that increases the energy charge.
Any differences between the results obtained from the original model of Lam-beth & Kushmerick [19] and the models with the adapted GP rate equations seemto be primarily quantitative and not qualitative. The differences are most apparentwhen energy charge is shown as a function of kATPase and fGPa (Fig. 6.24). In themodels with MWC-type GP rate equations, the restoration of energy charge by fGPa
was more pronounced than in the original model, but it should be noted that thedecrease in energy charge in the original model in response to increases ATP de-mand was also much less pronounced. It is unlikely that ATP inhibition and G6Pinhibition in the ‘GP MWC’ and ‘GP G6P-insensitive’ models are the primary fac-tors contributing to these quantitative differences, because the ATP concentrationchanges very little and there is only a slight difference between the graphs of the‘GP MWC’ and ‘GP G6P-insensitive’ models. The differences are most likely due toinherent differences between the Hill and MWC models. In particular, the degree ofbinding cooperativity is constant in the Hill model, but variable in the MWC model.The role of the feedback loop in which G6P inhibits GP is unclear from the presentresults.
Several other mechanisms in glycogenolysis probably play more significant rolesin the homeostasis of energy charge. These mechanisms include the amplificationof the sensitivity to changes in the ATP/ADP ratio by adenylate kinase perceived asa large change in AMP [77], the supplementation of ATP from phosphocreatine bycreatine kinase, and the regulation of phosphofructokinase by AMP and ATP. Ouremphasis on the covalent modification of GP results only from the fact that GP isoften considered the rate-limiting enzyme of glycogenolysis (see for example [250–252]), with the implication that its covalent regulation should function to regulate theglycogenolytic flux. Here we have demonstrated instead that the covalent regulation
Stellenbosch University http://scholar.sun.ac.za
CHAPTER 6. REGULATORY DESIGN OF GLYCOGEN METABOLISM 207
of GP is involved in the homeostasis of energy charge.
6.11 Combining glycogen synthesis and degradation
The natural next step is to combine the models of glycogen synthesis and glycogendegradation in an overall model of glycogen metabolism. In order to build suchan overall model, several problems need to be addressed. First, it is necessary toformulate a description of glycogen concentration that accounts for the fact that notall glucose residues in the glycogen molecule are accessible to enzymes such as GSand GP. Second, additional enzymatic steps must be included to ensure that thesystem’s stoichiometry is consistent.
Glycogen concentration
Glycogen is usually quantified as either the total residual glucose concentration oras the non-reducing end concentration. The former is readily determined experi-mentally, but it is the latter that is relevant in terms of enzymatic catalysis. Herewe will show that the structural properties of the glycogen molecule allow one toapproximate the non-reducing end concentration in terms of the glycogenin concen-tration and the total residual glucose concentration. As discussed earlier, glycogensynthesis is initiated by the enzyme glycogenin, which remains covalently bound tothe glycogen molecule. Glycogen is synthesized by the linear elongation of glucosechains by means of α(1 → 4) glycosidic bonds and by the introduction of branchesinitiated by means of α(1→ 6) glycosidic bonds. Glycogen chains are on average 13residues long, and each chain branches twice on average.
If, as a simplification, it is assumed that all glycogen chains have the same lengthand degree of branching, the total number of chains CT and the total number ofglucose residues GT per glycogen molecule can be expressed as follows [2]:
CT =1− CAr
1− r(6.62)
and
GT = CTgc (6.63)
Stellenbosch University http://scholar.sun.ac.za
CHAPTER 6. REGULATORY DESIGN OF GLYCOGEN METABOLISM 208
where CA is the number of chains in the outermost tier of branching, r = 2 is thedegree of branching, and gc = 13 is the number of glucose residues per glycogenchain. Substituting Eq. 6.62 into Eq. 6.63 yields
GT =1− CAr
1− rgc (6.64)
which can be rewritten with CA on the left hand side:
CA =GT(r− 1) + gc
gcr(6.65)
The number of outermost chains for n molecules of glycogen is then given by
CA =n
∑i
CAi (6.66)
=n
∑i
GTi(r− 1) + gc
gcr(6.67)
=∑n
i GTi(r− 1) + ngc
gcr(6.68)
=GT(r− 1) + ngc
gcr(6.69)
where the index i denotes a particular glycogen molecule. The amounts in Eq. 6.69are readily transformed to concentrations to yield
[NRE] =[Glcres](r− 1) + [GN]gc
gcr(6.70)
=[Glcres] + 13[GN]
26(6.71)
where [NRE] is the total non-reducing end concentration, [Glcres] is the total residualglucose concentration, and [GN] is the concentration of glycogenin. Note that thenumber of glycogen molecules, n, is equal to the number of glycogenin molecules.
The reaction stoichiometries for GS and GP would then be given by
UDPG UDP + Glcres (6.72)
Pi + Glcres G1P (6.73)
Stellenbosch University http://scholar.sun.ac.za
CHAPTER 6. REGULATORY DESIGN OF GLYCOGEN METABOLISM 209
so that the model differential equations describe the change in residual glucose, butonly the non-reducing end concentration is used within rate equations. Glycogen isthus effectively treated as a pool of glucose of which only a fraction, which can becalculated with knowledge of the structure of glycogen, can take part in enzymaticreactions.
This treatment is, however, not without shortcomings. First, not all non-reducingends function as both substrates and products for GS and GP. The present treatmentdoes not allow substrate non-reducing ends to be distinguished from product non-reducing ends. But, for sufficiently large glycogen molecules, substrate and productnon-reducing ends overlap to such an extent that all non-reducing ends may be con-sidered both substrates and products. Neglecting the difference between substrateand product non-reducing ends, however, results in further problems. It has theimplication that GS is only sensitive to the ratio of UDPG and UDP, and that GP isonly sensitive to the ratio of glucose-1-phosphate (G1P) and phosphate. Glycogensynthesis is therefore completely decoupled from glycogen degradation and glyco-gen will either accumulate or be depleted; no steady-state can be reached. This isof course not only a modelling problem but is potentially also a problem for the cellitself. It is therefore to be expected that glycogen sensitivity is conferred on GS andGP by mechanisms other than glycogen simply functioning as a reagent. Indeed, itis well-established that glycogen content regulates GS activity in a phosphorylation-dependent manner [138, 253]. A role in this regard has been suggested for AMP-activated protein kinase (AMPK) [254], a GS kinase that is able to sense glycogenbranch points. Whether a similar mechanism also facilitates the sensitivity of GP toglycogen remains to be seen.
Second, Eq. 6.70 predicts a non-zero non-reducing end concentration in the ab-sence of residual glucose. With regard to glycogen synthesis, this anomaly is indeedrequired to facilitate de novo glycogen synthesis. It does, however, allow glycogendegradation to continue even in the absence of residual glucose and thus could re-sult in a negative residual glucose concentration. Third, it enforces no upper limiton the size of glycogen granules, whereas in reality steric constraints limit granulesto 12 tiers (levels of branching). Finally, the roles of branching enzyme, debranchingenzyme, and, to a certain extent, glycogenin are ignored. Until it becomes possible toaddress these problems, the issue of glycogen concentration can be side-stepped bytreating the non-reducing end concentration as a clamped value in the model. Theirony of this solution is of course that such a model of glycogen metabolism does not
Stellenbosch University http://scholar.sun.ac.za
CHAPTER 6. REGULATORY DESIGN OF GLYCOGEN METABOLISM 210
actually describe the metabolism of glycogen.
Stoichiometric considerations
In the models of glycogen synthesis so far considered ATP and ADP are treated asclamped species. In a single cycle from external glucose to elongated glycogen, 3phosphate moieties enter the system as a molecule of ATP, of which 2 leave againas an ADP. Three phosphate moieties also enter as UTP, whereas two leave as PPi
and another two as UDP. There is thus no gain or loss of phosphate moieties in thesystem:
3 −2 +3 −2 −2 = 0ATP ADP UTP PPi UDP
(6.74)
When the glycogen synthesis model is combined with the model of glycogenoly-sis, ATP and ADP, however, become variable species. The conservation of phosphatemoieties is then given by:
3 −2 −2 = −1UTP PPi UDP
(6.75)
which reveals that the phosphate moiety drains from the system. Treating also PPi
as a variable species and adding an inorganic diphosphatase (PPase) reaction thatbreaks PPi down to two molecules of Pi yields
3 −2 = 1UTP UDP
(6.76)
so that now the phosphate moiety accumulates in the system. It is therefore also nec-essary to treat UTP and UDP as variable species and to add a reaction that convertsUDP back to UTP at the cost of ATP.
A combined model of glycogen synthesis and glycogen degradation
Keeping the above considerations in mind, we proceeded to construct a model (Gly-MetExp) of glycogen metabolism by combining the model GlySynthExp with themodel of glycogenolysis by Lambeth & Kushmerick [19]. We treated glycogen as afixed metabolite. In addition to the reactions already present in these models we also
Stellenbosch University http://scholar.sun.ac.za
CHAPTER 6. REGULATORY DESIGN OF GLYCOGEN METABOLISM 211
Table 6.2: Kinetic parameters for PPase and NDPK
Parameter Value Unit Reference Source
Vmax,PPase 30 mM min−1 Table C.4 rabbit muscleKPPase:PPi 5.1 · 10−3 mM [255] rabbit muscleKPPase:ATP 0.3 mM [255] rabbit muscleKPPase:Pi 1 mM based on value from [113] –Keq,PPase 2,460 mM TECR database [206] –
Vmax,NDPK 440 mM min−1 Table C.4 bovine heartKNDPK,UDP 7 · 10−2 mM based on value with ADP as substrate [256] rat liverKNDPK,ATP 0.5 mM [256] rat liverKNDPK,UTP 0.7 mM assumed –KNDPK,ADP 0.14 mM [256] rat liverKeq,NDPK 1 – eQuilibrator [36] –
added the PPase and nucleoside diphosphokinase (NDPK) reactions. PPase cataly-ses the reaction PPi 2Pi. We modelled the reaction with a uni-bi Michaelis-Mentenrate equation containing an additional ATP inhibition term:
vPPase =
Vmax
KPPi
([PPi]−
[Pi]2
Keq
)
[PPi]
KPPi
+[ATP]KATP
+
(1 +
[Pi]
KPi
)2 (6.77)
NDPK catalyses, amongst others, the reaction UDP + ATP UTP + ADP. We mod-elled this reaction with a random-order bi-bi Michaelis-Menten equation:
vNDPK =
Vmax
KUDPKATP
([UDP][ATP]− [UTP][ADP]
Keq
)
(1 +
[UDP]KUDP
+[UTP]KUTP
)(1 +
[ATP]KATP
+[ADP]KADP
) (6.78)
The kinetic parameter values for the PPase and NDPK reactions are listed in Ta-ble 6.2.
Steady-state analysis of the model, however, revealed that, even under restingconditions, the glycolytic flux (JPGI = 2.43× 10⁻¹ mM min−1) was almost three timeslarger than the glucose uptake flux (JGLUT = 9.06× 10⁻² mM min−1). Accordingly,GS had a large flux-control coefficient for the glycogen synthetic flux (C JGS
GS = 0.89).If glycogen were not treated as a fixed species, this high glycolytic flux would resultin complete glycogen depletion. The glycolytic flux could be reduced by decreasingthe first-order rate constant of the ATPase reaction (a parameter that was assignedan arbitrary value by Lambeth & Kushmerick [19]), but with the side-effect that the
Stellenbosch University http://scholar.sun.ac.za
CHAPTER 6. REGULATORY DESIGN OF GLYCOGEN METABOLISM 212
concentration of G6P decreased to values where its activatory effect on GS was nolonger able to overcome inhibition by ATP and phosphorylation. Decreasing therate constant for lactate export very slightly increased G6P again, but at the cost oflactate accumulation. We also replaced the mass-action rate equations for the lactateexport and ATPase reactions with irreversible Michaelis-Menten equations so as notto force unit elasticities on these reactions. These modifications did not improve thesituation.
While it is possible that appropriate parameter adjustments will yield a modelthat is in qualitative agreement with in vivo glycogen metabolism, the merit of suchan approach is questionable unless great care it taken to only use parameter valuesthat fall within experimentally determined ranges. Since construction of a detailedmodel of glycogen degradation is not within the scope of the present research, wedid not pursue this avenue further. Future attempts will have to ensure that thesame modelling approach and philosophy is followed in constructing the glycogensynthesis and degradation modules.
Stellenbosch University http://scholar.sun.ac.za
Chapter 7
Discussion
7.1 Glycogen metabolism as a molecular economy
The inner workings of the cell have been described in terms of a molecular economyof supply and demand [15, 257]. In this analogy between human economies and cel-lular processes, biosynthesis can be compared to a factory in which a certain productis manufactured for consumption by the public. A typical cellular example of such afactory is the biosynthesis of amino acids for consumption by the process of proteinsynthesis. Just as uncontrolled manufacturing without regard for consumer demandresults in overrun or shortage in human economies, usually with financial loss, soany cellular biosynthetic process that is not controlled by the demand for its productwould be detrimental to the proper functioning of the cell.
If biosynthesis is a factory, muscle glycogen metabolism is a warehouse or, per-haps more appropriately, a granary. One may view glycogen metabolism as a supply-demand system of glycogen in which glycogen synthesis and degradation are thesupply and demand processes. However, while glycogen is consumed during ex-ercise, it is not primarily exercise that immediately drives glycogen synthesis. Noris it feeding that drives exercise. It is therefore more instructive to view glycogensynthesis and degradation as processes that can themselves be divided into supplyand demand systems. In keeping with our analogy, the process in which glycogenis synthesized is comparable to the storage of harvested animal feed in the granary.It is clear that the rate at which feed is stored should be determined by the harvestand that there really is no immediate demand, so to speak, by the granary for feed.In glycogen synthesis one therefore expects glucose uptake to control the flux ofglycogen synthesis. Glycogen degradation, on the other hand, can be compared to
213
Stellenbosch University http://scholar.sun.ac.za
CHAPTER 7. DISCUSSION 214
feeding farm animals from the granary. Here it is clear that the rate at which feedis removed from the granary should be determined by the dietary requirements ofthe animals and not by the supply of feed in the granary. With regard to glycogendegradation, one would therefore expect the rate of glycogenolysis to be controlledby the demand for energy and not by the supply of glycogen.
We see then that glycogen synthesis should be expected to be a supply-drivenprocess, whereas glycogen degradation should be expected to be a demand-driven.While it is reasonable to expect that the demand process controls the flux in a biosyn-thetic pathway, it may well be that the supply controls the flux in other pathways. Inboth glycogen synthesis and degradation it is interesting to note that allosteric andcovalent regulation does not affect the activities of the flux controlling processes. Wemay then ask why the activities of enzymes that do not affect the flux are regulated.
7.2 Regulation of glycogen metabolism
Using detailed mathematical models of glycogen synthesis, we have shown first thatthe basal levels of glycogen synthase (GS) phosphorylation and ATP inhibition inconjunction with the feedforward activation of GS by glucose-6-phosphate (G6P)impart G6P sensitivity on the demand block that greatly surpasses that of the supplyblock (Section 6.4). We have also shown that this high G6P sensitivity of the demandblock allows it to match any increases in the flux of the supply block, which wouldtypically result from elevated glycemia, with only minimal increases in G6P. Thissuggests that the allosteric and covalent regulation of GS functions to maintain G6Phomeostasis despite large increases in the blood glucose concentration after meals.Note that changes in the external glucose concentration do not lead to changes in theGS degree of phosphorylation. The basal phosphorylation state of GS is thereforesufficient to ensure G6P homeostasis.
With regard to insulin stimulation, on the other hand, we have shown that GSphosphorylation is not involved in increasing the sensitivity of the demand block toG6P (Section 6.6). On the contrary, insulin stimulation results in the dephosphoryla-tion of GS and therefore weakens G6P homeostasis with respect to increases in exter-nal glucose. Insulin stimulation achieves G6P homeostasis via an entirely differentmechanism, namely, the coordinated activation of glucose uptake and glycogen syn-thesis. These results do not only agree with but also elaborate on the findings ofSchafer et al. [13] in that a wide range of insulin concentrations is considered.
Stellenbosch University http://scholar.sun.ac.za
CHAPTER 7. DISCUSSION 215
Using the existing model of glycogenolysis by Lambeth & Kushmerick [19], wehave also shown that the covalent regulation of glycogen phosphorylase (GP) is notinvolved in flux control, but rather functions to maintain the energy charge of thecell within narrow limits despite large changes in the cell’s energy demand (Sec-tion 6.10). While we have not explicitly considered the function of allosteric regula-tion of GP, GP phosphorylation affects the apparent affinities of GP for its variousallosteric modifiers, so that we may assume similar functions for allosteric and cova-lent regulation of GP. Note that we do not claim that energy charge homeostasis isthe sole function of the regulation of GP, or even that GP regulation is the most im-portant cellular mechanism that enhances energy charge homeostasis. The functionof GP regulation is, however, certainly not the flux control of glycogenolysis.
While it appears that the function of GS regulation is the homeostasis of G6P andthe function of GP regulation is the homeostasis of energy charge, the function of theregulation of enzyme activities is by no means limited to homeostatic maintenance.Flux-controlling enzymes are often regulated, so that changes in the activity of theseenzymes will result in changes to the flux. Indeed, in the coordinated regulation ofglucose uptake and glycogen synthesis by insulin stimulation, the activities of boththe flux-controlling enzyme, glucose transporter 4 (GLUT4), and the “regulated” en-zyme GS, are simultaneously increased. It may be that such coordinated regulationis far more common than is currently recognized and may even be a requirement foreffective flux regulation [258]. We have argued that coordinated regulation is alsoat work in glycogen degradation during exercise. Here too the flux-controlling en-zyme, ATPase, as well as the “regulated” enzyme, GP, are activated in response tocalcium.
7.3 Relative importance of allosteric and covalent
modification of glycogen synthase
The presence of both allosteric and covalent regulation in glycogen metabolism hasled to questions regarding the relative importance of these mechanisms. Hofmeyr &Cornish-Bowden [15] have pointed out that a mechanism’s “regulatory performanceshould always be measured in terms of a specified function.” In judging the relativeimportance of allosteric and covalent modification, one must therefore first identifyits function and also ascertain that both mechanisms indeed have the same function.We have argued that in glycogen synthesis both allosteric and covalent regulation
Stellenbosch University http://scholar.sun.ac.za
CHAPTER 7. DISCUSSION 216
function to maintain the homeostasis of G6P. There is, however, some indicationthat these mechanisms do not perform this function in response to the same stim-uli. We have shown that the increase in intrinsic GS activity in response to elevatedglycemia, measured as the fraction of enzyme in the active R conformation, is almostentirely the result of allosteric activation by G6P. On the other hand, the increase inintrinsic GS activity in response to elevated insulin is almost entirely the result of netdephosphorylation of GS. In a certain sense then, the question of whether allostericor covalent modification is the most important mechanism of G6P homeostasis be-comes irrelevant.
The question of whether allosteric or covalent modification is most importantmay also be posed in a different way: which mechanism contributes most to thebasal activity state of GS? It is well-established that sufficiently high concentrationsof G6P are able to completely reverse inhibition of GS by phosphorylation. In agree-ment with this, Bouskila et al. [18] have found that insulin is unable to restore thebasal activity of GS that has been desensitized to G6P. In other words, dephosphory-lation of the GS sites that are phosphorylated by glycogen synthase kinase 3 (GSK3)does not overcome the inhibition of GS caused by phosphorylation at the remainingsites and the additional inhibition by ATP. Bouskila et al. [18] have interpreted theseresults as evidence that allosteric, and not covalent, regulation of GS is the mostimportant mechanism by which insulin stimulates GS activity. We agree that G6Pactivation is an essential component of the basal GS activity, but argue that the re-sults of Bouskila et al. [18] give no indication of the relative contributions of allostericand covalent activation beyond the basal state.
7.4 Qualitative equivalence of allosteric and covalent
regulation
Covalent enzyme modification is often considered to be fundamentally differentfrom allosteric modification. The various covalent forms of enzymes such as GSand GP are often studied separately. This probably results from the fact that, whileterms for allosteric modification can be incorporated into initial velocity equations,the same cannot be done for covalent modification. Instead, separate rate equationsare required for each covalent form of an enzyme. In a very real sense covalent mod-ification is, however, also a form of allosteric modification in that the covalent bondis usually formed at a site other than the catalytic site. Despite this agreement, the
Stellenbosch University http://scholar.sun.ac.za
CHAPTER 7. DISCUSSION 217
model of cooperativity and allosterism identified as providing the best descriptionof allosteric modification for a particular enzyme is often disregarded when cova-lent modification is considered. A carte blanche is given to covalent modification toalter any kinetic parameter without consideration for an underlying kinetic modelor mechanism by which such alteration is explained.
We have conducted a comprehensive review of GS kinetics and regulation andconcluded that the interaction between the allosteric and covalent modification ofGS behaves in a qualitatively identical manner to what is expected for the interac-tion between two classic heterotropic Monod-Wyman-Changeux (MWC)-type effec-tors (Chapter 2). This led us to propose a unified view of allosteric and covalentregulation of GS in which only the equilibrium between between the T and R con-formation may be altered. In this unified view there is no need to determine thefull set of kinetic parameters for the rate equations of all phosphorylation states ofGS. The only requirement is that L0, the T/R equilibrium, should be determined foreach phosphorylation state. However, for many states L0 can be estimated from thevalues of “component” states. This model allowed us to develop which is to ourknowledge the first kinetic treatment of GS that is able to account for both allostericand covalent regulation (Chapter 3). The same model, but with an additional con-formation, was also used to obtain a rate equation for GP that describes its allostericmodification by all the major effectors as well as its covalent modification.
To be sure, we are not advocating the position that covalent modification will bequalitatively identical to allosteric modification for all enzymes. Nor do we arguethat covalent modification can always be described as bringing about a conforma-tional change. As but one example, phosphorylation of isocitrate dehydrogenasedoes not involve any conformational change, but instead prevents substrate bindingby obstructing the catalytic site [259]. This type of covalent modification cannot bedescribed with the MWC model. With regard to GS there are many phosphorylationsites that do not affect the enzyme’s activity. These sites can, however, be accountedfor in the MWC model by simply considering phosphorylation at each of these sitesas multiplying L0 with a factor of one.
Since activation of GS by G6P and inhibition of GS by phosphorylation stabi-lize opposing conformations of the enzyme, they also reverse each other’s effect onthe activity of GS. This reversal is not only the result of conformational change, butalso results because phosphorylation promotes a state in which G6P associates lessreadily with GS and G6P promotes a state that is more readily dephosphorylated.
Stellenbosch University http://scholar.sun.ac.za
CHAPTER 7. DISCUSSION 218
Phosphorylation favours the T conformation, which is inactive, but also decreasesthe affinity of GS for G6P and may even cause G6P to dissociate. G6P, on the otherhand, favours the R conformation, countering the effect of phosphorylation. Be-cause phosphate is covalently bound, however, G6P is not able to directly cause thephosphate group to dissociate from GS. G6P nevertheless promotes net dephospho-rylation of GS by kinase inhibition and phosphatase activation. Such interactionbetween allosteric and covalent regulation has been observed experimentally for GS(see for example [139, 146]) and GP (see for example [260]). An explanation in termsof an underlying mechanism has to our knowledge not been proposed before.
Covalent modification of an enzyme is itself catalysed by enzymes. Activationor inhibition of these covalent interconversion enzymes by allosteric modifiers ofthe substrate enzyme should therefore manifest as apparent changes to their kineticparameters. From thermodynamic considerations, we have shown that apparentchanges in both the rate constants and Michaelis constants can result from such al-losteric modification (Section 4.3). Changes in the rate constant result entirely fromthe fact that covalent modification alters the T/R equilibrium of the substrate en-zyme. The factor by which rate constants are modified is therefore determined bythe kinetics of the substrate protein and not by the kinetics of the covalent intercon-version enzymes. Changes in the Michaelis constants, on the other hand, are specificto the interconversion enzymes and are not governed by the substrate enzyme’s ki-netics. The substrate and product Michaelis constants are modified by the samefactor. If covalent modification does not alter the T/R equilibrium of the substrateenzyme, then changes are observed in neither the rate constants nor the Michaelisconstants. Note that these effects on the kinetics of the interconversion enzymes areindependent of their kinetic mechanism. Indeed, it may be that the interconversionenzymes are themselves MWC-type enzymes.
The regulation of muscle glycogen synthesis therefore involves a feedforwardactivation loop in which G6P activates GS, but also a complex phosphorylation cas-cade in which all GS ligands are also indirect ligands of the interconversion enzymes.Hofmeyr et al. [16] considered the conditions that would allow feedforward loops tofunction optimally. Small & Fell [164], on the other hand, considered the conditionsthat would allow covalent modification cascades to elicit an optimal response in re-sponse to external effectors. The situation in glycogen metabolism differs from theseanalyses in that the feedforward activator is also the effector that regulates the cova-lent modification of GS. We analysed the conditions that would maximize the flux
Stellenbosch University http://scholar.sun.ac.za
CHAPTER 7. DISCUSSION 219
response to an allosteric modifier in a minimal feedforward system in which theallosteric enzyme is also regulated by a monocyclic cascade (Section 4.4). Broadlyspeaking, our results indicated that one would expect the feedforward activation ofthe regulated enzyme to be dominated by a catalytic and not a specific component,and that the enzymes catalysing the covalent modification of the regulated enzymeshould be saturated with their protein substrates.
Is glucose-6-phosphate really a specific activator?
The GS rate equation and parameters that we identified as providing the best de-scription of experimental data incidentally show that G6P is a catalytic activator ofGS. There is, however, also a slight specific component which results from the com-petition of ATP with the UDP-glucose (UDPG) substrate. Since, however, GS is notsaturated with its substrate and because the enzyme that precedes it operates closeto equilibrium, the strict requirement for catalytic activation may be relaxed. Thestrong catalytic component predicted by our results and the absence of specific ac-tivation in the absence of ATP is, however, at variance with the standard view ofGS kinetics which holds that phosphorylation decreases the UDPG affinity, whereasG6P increases it. This discrepancy could be explained by considering that the experi-mental data that we used for GS parameter optimization were determined at a lowerpH (6.6) than what is usually used (7.8). High pH values suppress ATP inhibition inGS assays [67]. Piras et al. [39, 67] found significant differences in GS kinetics whencomparing data obtained at low and high pH values. Another possible explanationis that GS kinetic parameters are routinely determined from linear transformationsof initial velocity data even though GS is a cooperative enzyme. Walcott & Lehman[201] have shown that this practice, when applied to GP kinetics, portrays ATP asa competitive inhibitor with respect to AMP, whereas non-linear regression, whichallows for fitting sigmoidal curves, suggests that ATP is also a non-competitive in-hibitor and that the non-competitive component is in fact the dominant component.Similar artefacts are to be expected for GS kinetics when cast in a Michaelis-Mentenmould.
Stellenbosch University http://scholar.sun.ac.za
CHAPTER 7. DISCUSSION 220
7.5 Modelling glycogen metabolism
The model of glycogen synthesis, GlySynth, in which the interconversion betweenGS phosphorylation states is described with the appropriate kinase and phosphatasereactions, as well as the combined model of glycogen metabolism that incorporatesthe existing model by Lambeth & Kushmerick [19], contains a substantial numberof parameters that were obtained from the literature. Considering the accumula-tion of experimental error in the determined kinetic parameters, this large num-ber of parameters poses a threat to the validity of the models. We have neverthe-less shown that in many respects the models’ predicted behaviour is qualitativelyin agreement with experimentally observed behaviour. It should be noted that theGlySynth model consists of two modules that are not connected by mass flow: themain pathway and the GS interconversion pathway. While the interconversion path-way is sensitive to G6P and UDPG from the main pathway, the main pathway is onlysensitive to the concentrations of GS in its various states as determined by the inter-conversion pathway. In effect, therefore, the only “parameter” of the main pathwaythat is determined by the interconversion pathway is the equilibrium between theT and R conformations of GS. Any error in the interconversion pathway is there-fore propagated to the main pathway as an error in a single parameter, unless one isspecifically interested in the concentrations of GS in its various states.
Existing models of muscle metabolism that include glycogen synthesis are for themost part based on the model by Cabrera et al. [261]. This model has been extendedto incorporate many additional aspects of muscle metabolism, such as insulin sig-nalling and compartmentation. Some of the more recent extensions are those byDash et al. [262] and Li et al. [263]. While this model includes a GS reaction, its focusis not on glycogen metabolism. It treats the GS reaction as the combined reactionsof GS and UDPG-pyrophosphorylase (UPP). The GS reaction is modelled with ahyperbolic Michaelis-Menten type rate equation that does not include the G6P feed-forward activation loop. No description of GS phosphorylation is present, althoughinsulin stimulation terms have been incorporated in some versions. The model alsotreats glycogen as a pool of glucose in which all residues, as opposed to only non-reducing residues, are visible to enzymes.
We have demonstrated the usefulness of the models that we have constructedin shedding light on the regulatory design of muscle glycogen metabolism. It isessential to understand the regulation of muscle glycogen metabolism by endocrine
Stellenbosch University http://scholar.sun.ac.za
CHAPTER 7. DISCUSSION 221
and other signals in order to fully comprehend the pathology of insulin resistanceand diabetes mellitus type 2. Insulin resistance is, however, a whole-body syndromeinvolving the systemic malfunctioning of insulin-dependent metabolism in varioustissues. There is thus a need to integrate models of insulin-dependent metabolismfrom various tissues. Such models have been constructed [264, 265], but are mostlyphenomenological, contain only abbreviated descriptions of glycogen metabolism,or only include glucose uptake.
While we appreciate the merits of phenomenological modelling, we argue thatgreat care must be taken to ensure that important regulatory features of a pathwayare not obscured by disregard for the underlying mechanisms. In many cases mech-anism does matter. It may be of little consequence, for instance, whether a bi-bireaction is modelled with a ping-pong or random order rate equation [266], but ithas been demonstrated that the seemingly inconsequential difference between cat-alytic and specific activation can have important implications for the effectivenessof regulatory mechanisms such as feedback and feedforward loops [16]. An unin-formed modelling choice could lead to the inclusion of such regulatory mechanismsthat turn out to perform no function at all. Incidentally, careful consideration of themechanism of GS cooperativity was instrumental both in understanding the reg-ulatory design of glycogen synthesis and in the identification of novel regulatoryaspects. Nevertheless, even very detailed mechanistic models are of little use if theyare parametrized with parameter sets of poor quality. There is a pressing need forhigh-quality muscle enzyme kinetic data. It is essential that research in muscle me-tabolism does not neglect enzyme kinetics in favour of semi-quantitative studies.Much can be learned from a good model in less time than from experimentation.
7.6 Future research
Many aspects of muscle glycogen metabolism remain unaddressed by the presentresearch. In future research the model of glycogen synthesis can be extended toalso describe the phosphorylation of GS by AMP-activated protein kinase (AMPK),an enzyme that is able to sense the glycogen concentration as well as the energycharge in the cell [252]. We have also disregarded the targeting of protein phos-phatase 1 (PP1) to various subcellular pools and the role of phosphorylation in thisregard [1, 31]. Additionally, it would be of interest to construct a combined modelof glycogen synthesis and degradation in which glycogen itself is a variable species.
Stellenbosch University http://scholar.sun.ac.za
CHAPTER 7. DISCUSSION 222
It would also be instructive to validate the unified view of allosteric and covalentGS regulation experimentally. Finally, kinetic parameters for the interconversion be-tween GS phosphorylation states and for the main pathway should be determinedunder conditions that would prevail in vivo.
Stellenbosch University http://scholar.sun.ac.za
Appendix A
Miscellaneous derivations
A.1 Expression of the sum of MWC-type rate
equations as a single term
Consider the irreversible two-state MWC rate equation:
v = enkcat,r (1 + σr)
n−1 + nkcat,t (1 + σt)n−1 L0
(1 + σr)n + (1 + σt)
n L0(A.1)
Let
numr = nkcat,r (1 + σr)n−1 (A.2)
numt = nkcat,t (1 + σt)n−1 L0 (A.3)
denr = (1 + σr)n (A.4)
dent = (1 + σt)n L0 (A.5)
then
v = enumr + numtL0
denr + dentL0(A.6)
With appropriate definitions, any two-state MWC rate equation, including re-versible forms, can be written in this form. Consider now the sum of rates v = ∑i vi,
223
Stellenbosch University http://scholar.sun.ac.za
APPENDIX A. MISCELLANEOUS DERIVATIONS 224
where each rate vi is of the form of Eq. A.6, but in which only the parameter L0
depends on i (each enzyme concentration ei is a variable):
v = ∑i
einumr + numtL0i
denr + dentL0i(A.7)
Multiplication of the numerator and denominator with ∑i ei yields
v =
(∑i ei)
(∑i ei
numr + numtL0i
denr + dentL0i
)
∑i ei(A.8)
Further multiplying each sum term in the denominator withdenr + dentL0i
denr + dentL0igives
v =
(∑i ei)
(∑i ei
numr + numtL0i
denr + dentL0i
)
∑i eidenr + dentL0i
denr + dentL0i
(A.9)
The fractions in the numerator and denominator can be separated so that
v =
(∑i ei)∑i
(ei
numr
denr + dentL0i+ ei
numtL0i
denr + dentL0i
)
∑i
(ei
denr
denr + dentL0i+ ei
dentL0i
denr + dentL0i
) (A.10)
=
(∑i ei)
(∑i ei
numr
denr + dentL0i+ ∑i ei
numtL0i
denr + dentL0i
)
∑i eidenr
denr + dentL0i+ ∑i ei
dentL0i
denr + dentL0i
(A.11)
Extracting terms that are independent on i from the sums yields
v =
(∑i ei)
(numr ∑i ei
1denr + dentL0i
+ numt ∑i eiL0i
denr + dentL0i
)
denr ∑i ei1
denr + dentL0i+ dent ∑i ei
L0i
denr + dentL0i
(A.12)
Finally, division of the numerator and denominator by ∑i ei1
denr + dentL0igives
Stellenbosch University http://scholar.sun.ac.za
APPENDIX A. MISCELLANEOUS DERIVATIONS 225
v =
(∑i ei)
numr + numt
∑i eiL0i
denr + dentL0i
∑i ei1
denr + dentL0i
denr + dent
∑i eiL0i
denr + dentL0i
∑i ei1
denr + dentL0i
(A.13)
If we then define
L0,app =∑i ei
L0i
denr + dentL0i
∑i ei1
denr + dentL0i
(A.14)
and
e = ∑i
ei (A.15)
Eq. A.13 is rewritten as
v = enumr + numtL0,app
denr + dentL0,app(A.16)
Note also that, since ei = r(denr + dentL0i) and ti = L0iri, it follows that
L0,app =∑i ti
∑i ri(A.17)
A.2 Expression of the overall elasticity of a sum of
rates in terms of elasticities of individual rates
Let v be the sum of rates catalysed by isoforms or different covalent states of a par-ticular enzyme:
v = ∑i
vi (A.18)
The elasticity of the rate v towards an arbitrary ligand X is then given by
Stellenbosch University http://scholar.sun.ac.za
APPENDIX A. MISCELLANEOUS DERIVATIONS 226
εvx =
∂ ln v∂ ln x
(A.19)
=xv· ∂v
∂x(A.20)
=xv· ∂
∂x
[∑
ivi
](A.21)
=xv·∑
i
∂vi
∂x(A.22)
=xv·∑
i
vi
x· ∂ ln vi
∂ ln x(A.23)
= ∑i
vi
v· ∂ ln vi
∂ ln x(A.24)
= ∑i
vi
v· εvi
x (A.25)
Stellenbosch University http://scholar.sun.ac.za
Appendix B
Control analysis of two-modulesystem in which allosteric andcovalent modification interact
B.1 Control analysis
The control matrix C of a system with arbitrary complexity can be expressed in termsof the matrix formulation
C = E−1 (B.1)
where C is the matrix of control-coefficients with respect to independent fluxes andspecies, and E is a matrix containing structural properties and elasticities. Hofmeyr& Westerhoff [162] have shown that, if a system comprises modules that are notconnected by mass flow, Eq. B.1 becomes
G = E−1 (B.2)
The use of G-notation indicates that the control matrix contains global or integralcontrol coefficients. The internal structure of G is the same as that of C, but for asystem of two modules the rows and columns of G and E can be rearranged to allowthe following partitioning:
[G1
1 G12
G21 G2
2
]=
[E1
1 E12
E21 E2
2
]−1
(B.3)
227
Stellenbosch University http://scholar.sun.ac.za
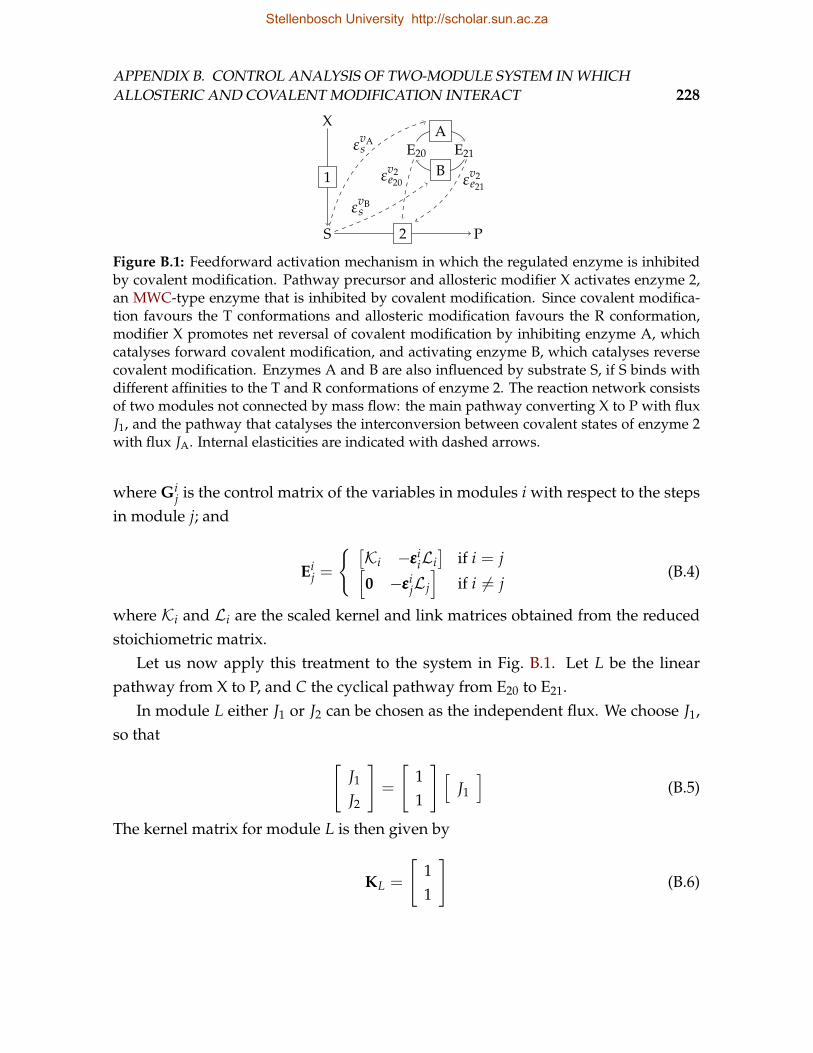
APPENDIX B. CONTROL ANALYSIS OF TWO-MODULE SYSTEM IN WHICHALLOSTERIC AND COVALENT MODIFICATION INTERACT 228
X
1
S 2 P
AE20 E21
B
εvAs
εvBs
εv2e20 εv2
e21
Figure B.1: Feedforward activation mechanism in which the regulated enzyme is inhibitedby covalent modification. Pathway precursor and allosteric modifier X activates enzyme 2,an MWC-type enzyme that is inhibited by covalent modification. Since covalent modifica-tion favours the T conformations and allosteric modification favours the R conformation,modifier X promotes net reversal of covalent modification by inhibiting enzyme A, whichcatalyses forward covalent modification, and activating enzyme B, which catalyses reversecovalent modification. Enzymes A and B are also influenced by substrate S, if S binds withdifferent affinities to the T and R conformations of enzyme 2. The reaction network consistsof two modules not connected by mass flow: the main pathway converting X to P with fluxJ1, and the pathway that catalyses the interconversion between covalent states of enzyme 2with flux JA. Internal elasticities are indicated with dashed arrows.
where Gij is the control matrix of the variables in modules i with respect to the steps
in module j; and
Eij =
[Ki −εεεi
iLi]
if i = j[0 −εεεi
jLj
]if i 6= j
(B.4)
where Ki and Li are the scaled kernel and link matrices obtained from the reducedstoichiometric matrix.
Let us now apply this treatment to the system in Fig. B.1. Let L be the linearpathway from X to P, and C the cyclical pathway from E20 to E21.
In module L either J1 or J2 can be chosen as the independent flux. We choose J1,so that
[J1
J2
]=
[11
] [J1
](B.5)
The kernel matrix for module L is then given by
KL =
[11
](B.6)
Stellenbosch University http://scholar.sun.ac.za
APPENDIX B. CONTROL ANALYSIS OF TWO-MODULE SYSTEM IN WHICHALLOSTERIC AND COVALENT MODIFICATION INTERACT 229
and since no branching is present, KL = KL. As there is no moiety conservation inmodule L, it also follows that LL = LL = [1], where L is the link matrix. Finally theelasticity matrix for module L is given by
εεεLL =
[εv1
s
εv2s
](B.7)
We choose JA as the independent flux in module C. As for module L,KC = KC =
[1 1]T. Since E20 and E21 constitute a moiety-conserved cycle, de20dt = − de21
dt , so that
[de20dt
de21dt
]=
[1−1
] [de20dt
](B.8)
The link matrix for module C is then LC = [1 − 1]T, and the scaled link matrixis the matrix product
LC =
[1
e201
e21
]LC
[e20
]=
[1−e20e21
](B.9)
Finally the elasticity matrix for module C is given by
εεεCC =
[εvA
e20 εvAe21
εvBe20 εvB
e21
](B.10)
Similarly
εεεLC =
[εv1
e20 εv1e21
εv2e20 εv2
e21
]=
[0 0
εv2e20 εv2
e21
](B.11)
and
εεεCL =
[εvA
s
εvBs
](B.12)
Note that εv1e20 and εv1
e21 are zero, as the intermediates in module C only affect enzyme2 in module L. Also, since S is a ligand of enzyme 2, it potentially affects the inter-conversion between covalent forms of enzyme 2, so that εvA
s and εvBs are potentially
non-zero.The expressions for the partitioned E matrices are then
ELL =
[KL −εεεL
LLL
](B.13)
Stellenbosch University http://scholar.sun.ac.za
APPENDIX B. CONTROL ANALYSIS OF TWO-MODULE SYSTEM IN WHICHALLOSTERIC AND COVALENT MODIFICATION INTERACT 230
ELC =
[0 −εεεL
CLC
](B.14)
ECL =
[0 −εεεC
LLL
](B.15)
and
ECC =
[KC −εεεC
CLC
](B.16)
The control matrix G is then
G J1v1 G J1
v2 G J1vA G J1
vB
Gsv1
Gsv2
GsvA
GsvB
G JAv1 G JA
v2 G JAvA G JA
vB
Ge20v1 Ge20
v2 Ge20vA Ge20
vB
=
[KL −εεεL
LLL 0 −εεεLCLC
0 −εεεCLLL KC −εεεC
CLC
]−1
(B.17)
=
1 −εv1s 0 0
1 −εv2s 0 −∗εv2
e20
0 −εvAs 1 −∗εvA
e20
0 −εvBs 1 −∗εvB
e20
−1
(B.18)
=
εv2s (∗εvB
e20 − ∗εvAe20)− ∗ε
v2e20(ε
vBs − εvA
s ) −εv1s (∗εvB
e20 − ∗εvAe20) −εv1
s∗εv2
e20 εv1s∗εv2
e20∗εvB
e20 − ∗εvAe20
∗εvAe20 − ∗ε
vBe20 −∗εv2
e20∗εv2
e20∗εvB
e20 εvAs − ∗εvA
e20 εvBs
∗εvAe20 εvB
s − ∗εvBe20 εvA
s∗εvB
e20(εv2s − εv1
s )− ∗εv2e20 εvB
s∗εv2
e20 εvAs − ∗εvA
e20(εv2s − εv1
s )
εvAs − εvB
s εvBs − εvA
s εv2s − εv1
s εv1s − εv2
s
1(εv2
s − εv1s )(∗εvB
e20 − ∗εvAe20)− ∗ε
v2e20(ε
vBs − εvA
s )
(B.19)
where ∗εv2e20 = εv2
e20 − εv2e21
e20e21
, ∗εvAe20 = εvA
e20 − εvAe21
e20e21
, and ∗εvBe20 = εvB
e20 − εvBe21
e20e21
are “effective”elasticities [230].
We can also solve for the control matrices of the two modules independently,yielding intramodule control coefficients:
[C J1
v1 C J1v2
Csv1
Csv2
]=[KL −εεεL
LLL
]−1(B.20)
=
εv2s
εv2s − εv1
s
−εv1s
εv2s − εv1
s1
εv2s − εv1
s
−1εv2
s − εv1s
(B.21)
Stellenbosch University http://scholar.sun.ac.za
APPENDIX B. CONTROL ANALYSIS OF TWO-MODULE SYSTEM IN WHICHALLOSTERIC AND COVALENT MODIFICATION INTERACT 231
and
[C JA
vA C JAvB
Ce20vA Ce20
vB
]=[KC −εεεC
CLC
]−1(B.22)
=
∗εvBe20
∗εvBe20 − ∗ε
vAe20
−∗εvAe20
∗εvBe20 − ∗ε
vAe20
1∗εvB
e20 − ∗εvAe20
−1∗εvB
e20 − ∗εvAe20
(B.23)
B.2 Elasticity expressions
The elasticity expressions derived in this section all pertain to the reactions in Fig. B.1.
Elasticities with respect to S
The elasticity of v1 with respect to S is given by
εv1s =
− s/xKeq1
1− s/xKeq1
− σ1
1 + ξ1 + σ1(B.24)
where ξ1 =x
K1xand σ1 =
sK1s
. The absolute value of εv1s increases from zero to
unity as s increases from zero to saturation and then suddenly increases to infinityas equilibrium is approached.
∣∣εv1s∣∣ therefore has a maximum value near equilibrium.
The elasticity of v2 with respect to S is given by
εv2s = ∑
i
v2i
v2ε
v2is (B.25)
where
εv2is = 1− csσ2αiL(1 + cxξ2) + σ2(1 + ξ2)
(1 + csσ2)αiL(1 + cxξ2) + (1 + σ2)(1 + ξ2)(B.26)
where ck is the factor by which the rate constant for the T conformation differs fromthat of the R conformation; σ2 = s/Kr2s and cs = Kr2s/Kt2s; ξ2 = x/Kr2x andcx = Kr2x/Kt2x; Kr2s, Kt2s, Kr2x, and Kt2x are the intrinsic dissociation constants withrespect to S and X for the T and R conformations; α is the factor by which covalent
Stellenbosch University http://scholar.sun.ac.za
APPENDIX B. CONTROL ANALYSIS OF TWO-MODULE SYSTEM IN WHICHALLOSTERIC AND COVALENT MODIFICATION INTERACT 232
modification alters L; L is the allosteric constant; and i ∈ [0, 1]. |εv2is | → 0 in the limit
σ2 → ∞:
limσ2→∞
εv2is = 1− csαiL(1 + cxξ2) + (1 + ξ2)
csαiL(1 + cxξ2) + (1 + ξ2)(B.27)
= 0 (B.28)
The expressions for εvAs and εvA
s are given by
εvAs =
[φ′numφnum
− φ′denφden
]1−
e21c/(e20c′)φKeqA
1− e21c/(e20c′)φKeqA
(B.29)
and
εvBs =
[φ′denφden
− φ′numφnum
]1−
e20g/e21
φ−1KeqB
1− e20g/e21
φ−1KeqB
(B.30)
where
φ′num = csσ2αL(1 + cxξ2) + σ2(1 + ξ2) (B.31)
φnum = (1 + csσ2)(1 + cxξ2)αL + (1 + σ2)(1 + ξ2) (B.32)
φ′den = csσ2(1 + cxξ2)L + σ2(1 + ξ2) (B.33)
φden = (1 + csσ2)(1 + cxξ2)L + (1 + σ2)(1 + ξ2) (B.34)
If reactions A and B operate far from equilibrium
εvBs + εvA
s =
[φ′denφden
− φ′numφnum
]+
[φ′numφnum
− φ′denφden
]= 0 (B.35)
If enzyme 2 is saturated with S, or if cs = 1, then εvAs = εvB
s = 0.
Stellenbosch University http://scholar.sun.ac.za
APPENDIX B. CONTROL ANALYSIS OF TWO-MODULE SYSTEM IN WHICHALLOSTERIC AND COVALENT MODIFICATION INTERACT 233
Elasticities with respect to X
The elasticity of v1 with respect to X is given by
εv1x =
1
1− x/sKeq1
− ξ1
1 + ξ1 + σ1(B.36)
The elasticity of v2 with respect to X is given by
εv2x = ∑
i
v2i
v2ε
v2ix (B.37)
where
εv2ix =
ckcsαiLcxξ2 + ξ2
ckcsαiL(1 + cxξ2) + (1 + ξ2)− (1 + csσ2)α
iLcxξ2 + (1 + σ2)ξ2
(1 + csσ2)αiL(1 + cxξ2) + (1 + σ2)(1 + ξ2)(B.38)
When enzyme 2 is saturated with S, εv2ix is given by
limσ2→∞
εv2ix =
ckcsαiLcxξ2 + ξ2
ckcsαiL(1 + cxξ2) + (1 + ξ2)− csαiLcxξ2 + ξ2
csαiL(1 + cxξ2) + (1 + ξ2)(B.39)
which if ck = 1 or if cs 1αi L equals zero.
The elasticities of vA and vB with respect to X are given by
εvAx =
[φ′numφnum
− φ′denφden
]1−
e21c/(e20c′)φKeqA
1− e21c/(e20c′)φKeqA
(B.40)
and
εvBx =
[φ′denφden
− φ′numφnum
]1−
e20g/e21
φ−1KeqB
1− e20g/e21
φ−1KeqB
(B.41)
where
φ′num = (1 + csσ2)cxξ2αiL + (1 + σ2)ξ2 (B.42)
Stellenbosch University http://scholar.sun.ac.za
APPENDIX B. CONTROL ANALYSIS OF TWO-MODULE SYSTEM IN WHICHALLOSTERIC AND COVALENT MODIFICATION INTERACT 234
φnum = (1 + csσ2)(1 + cxξ2)αiL + (1 + σ2)(1 + ξ2) (B.43)
φ′den = (1 + csσ2)cxξ2L + (1 + σ2)ξ2 (B.44)
φden = (1 + csσ2)(1 + cxξ2)L + (1 + σ2)(1 + ξ2) (B.45)
If enzyme 2 is saturated with S, then[
φ′numφnum
− φ′denφden
]=
[φ′numφnum
− φ′denφden
]= 0, so that
εvAx = εvB
x = 0. If enzymes A and B operate far from equilibrium, then εvAx = −εvB
x .
Elasticities with respect to e2
The expression for εv2e20 is given by
εv2e20 =
v20
v2εv20
e20 +v21
v2εv21
e20 (B.46)
=v20
v2(since εv20
e20 = 1, and εv21e20 = 0) (B.47)
Similarly, εv2e21 =
v21
v2. It follows that
εv2e20 − εv2
e21 ·e20
e21=
v20 − v21 · e20e21
v2(B.48)
=
ckk2e20csσ2L(
1 + cxξ2
1 + ξ2
)+ k2e20σ2
(1 + csσ2) L(
1 + cxξ2
1 + ξ2
)+ (1 + σ2)
−ckk2e20csσ2αiL
(1 + cxξ2
1 + ξ2
)+ k2e20σ2
(1 + csσ2) αiL(
1 + cxξ2
1 + ξ2
)+ (1 + σ2)
v2(B.49)
or if S saturates enzyme 2:
εv2e20− εv2
e21· e20
e21=
ckk2e20csL(
1 + cxξ2
1 + ξ2
)+ k2e20
csL(
1 + cxξ2
1 + ξ2
)+ 1
−ckk2e20csαL
(1 + cxξ2
1 + ξ2
)+ k2e20
csαL(
1 + cxξ2
1 + ξ2
)+ 1
v2(B.50)
= 0 (if cs 1
αL) (B.51)
Stellenbosch University http://scholar.sun.ac.za
APPENDIX B. CONTROL ANALYSIS OF TWO-MODULE SYSTEM IN WHICHALLOSTERIC AND COVALENT MODIFICATION INTERACT 235
The expression for εvAe20 is given by
εvAe20 =
1
1− e21c/(e20c′)φKeqA
− σA1
1 + σA1 + πA1(B.52)
= 1− σA1
1 + σA1(assuming πA1 → 0 and KeqA → ∞) (B.53)
Similarly, εvBe21 is given by
εvBe21 = 1− σB1
1 + σB1(B.54)
The expression for εvAe21 is given by
εvAe21 =
− e21c/(e20c′)φKeqA
1− e21c/(e20c′)φKeqA
− πA1
1 + σA1 + πA1(B.55)
= 0 (assuming πA1 → 0 and KeqA → ∞) (B.56)
Similarly, εvBe20 is given by
εvBe20 = 0 (B.57)
Stellenbosch University http://scholar.sun.ac.za
Appendix C
Model parametrization
C.1 Calculation of rate constants, enzyme
concentrations, and maximal velocities
Calculation of kcat and Vmax from specific activity
If the mass of total protein per volume is known, Vmax can be calculated directlyfrom the specific activity (usually product formation per time per mass protein) ofcrude cell extracts according to the equation [210]:
Vmax = crude specific activity× protein per cell volume (C.1)
From the Vmax, if the subunit composition is known, either kcat or [E]tot can be cal-culated if the other is known. If the holoenzyme molecular mass is known, nkcat
can be calculated from the specific activity of cell extracts purified to homogeneityaccording to the equation
nkcat = purified specific activity× holoenzyme molecular mass (C.2)
Alternatively
kcat = purified specific activity× subunit molecular mass (C.3)
Multimeric enzymes that exhibit no cooperativity may be treated as monomericenzymes (n = 1), so that the calculated kcat is really an apparent value.
236
Stellenbosch University http://scholar.sun.ac.za
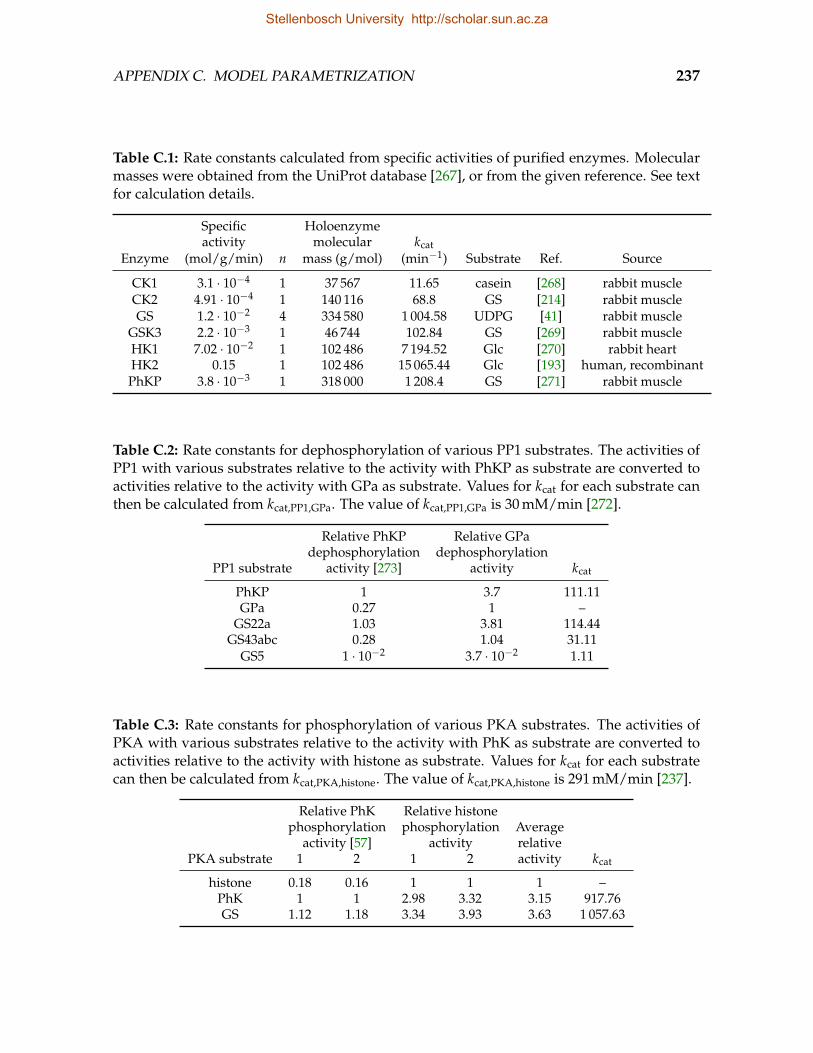
APPENDIX C. MODEL PARAMETRIZATION 237
Table C.1: Rate constants calculated from specific activities of purified enzymes. Molecularmasses were obtained from the UniProt database [267], or from the given reference. See textfor calculation details.
Specific Holoenzymeactivity molecular kcat
Enzyme (mol/g/min) n mass (g/mol) (min−1) Substrate Ref. Source
CK1 3.1 · 10−4 1 37 567 11.65 casein [268] rabbit muscleCK2 4.91 · 10−4 1 140 116 68.8 GS [214] rabbit muscleGS 1.2 · 10−2 4 334 580 1 004.58 UDPG [41] rabbit muscle
GSK3 2.2 · 10−3 1 46 744 102.84 GS [269] rabbit muscleHK1 7.02 · 10−2 1 102 486 7 194.52 Glc [270] rabbit heartHK2 0.15 1 102 486 15 065.44 Glc [193] human, recombinantPhKP 3.8 · 10−3 1 318 000 1 208.4 GS [271] rabbit muscle
Table C.2: Rate constants for dephosphorylation of various PP1 substrates. The activities ofPP1 with various substrates relative to the activity with PhKP as substrate are converted toactivities relative to the activity with GPa as substrate. Values for kcat for each substrate canthen be calculated from kcat,PP1,GPa. The value of kcat,PP1,GPa is 30 mM/min [272].
Relative PhKP Relative GPadephosphorylation dephosphorylation
PP1 substrate activity [273] activity kcat
PhKP 1 3.7 111.11GPa 0.27 1 –
GS22a 1.03 3.81 114.44GS43abc 0.28 1.04 31.11
GS5 1 · 10−2 3.7 · 10−2 1.11
Table C.3: Rate constants for phosphorylation of various PKA substrates. The activities ofPKA with various substrates relative to the activity with PhK as substrate are converted toactivities relative to the activity with histone as substrate. Values for kcat for each substratecan then be calculated from kcat,PKA,histone. The value of kcat,PKA,histone is 291 mM/min [237].
Relative PhK Relative histonephosphorylation phosphorylation Average
activity [57] activity relativePKA substrate 1 2 1 2 activity kcat
histone 0.18 0.16 1 1 1 –PhK 1 1 2.98 3.32 3.15 917.76GS 1.12 1.18 3.34 3.93 3.63 1 057.63
Stellenbosch University http://scholar.sun.ac.za
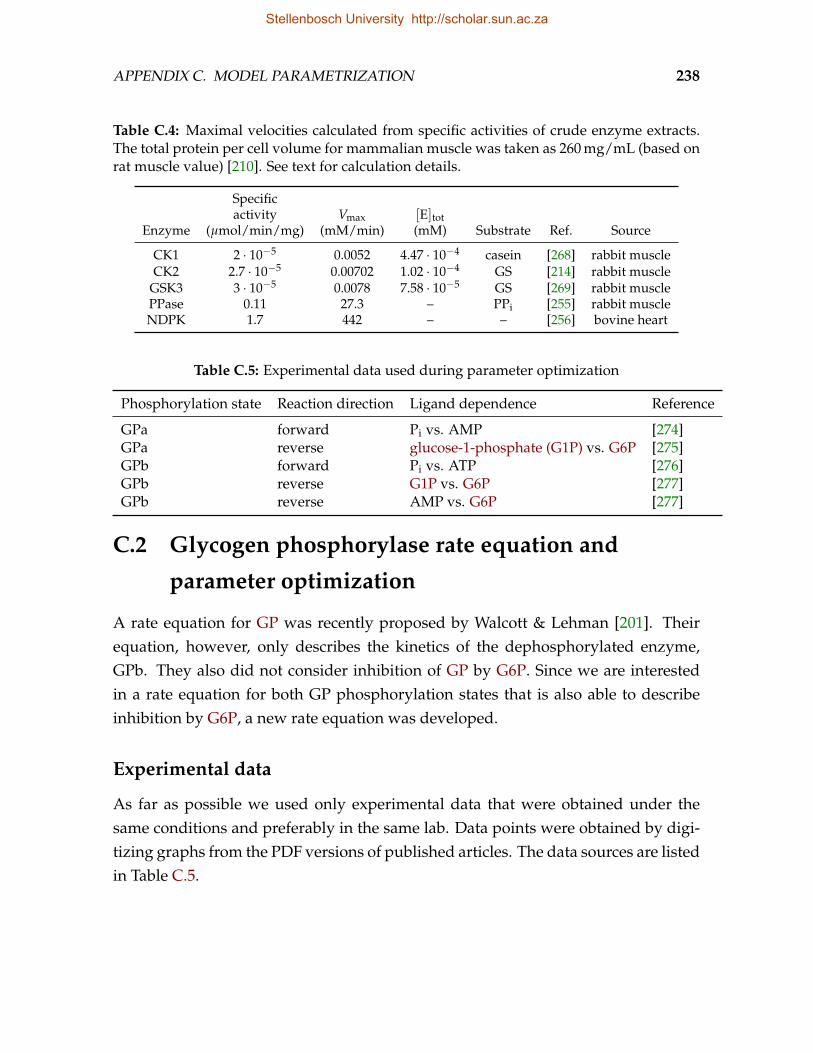
APPENDIX C. MODEL PARAMETRIZATION 238
Table C.4: Maximal velocities calculated from specific activities of crude enzyme extracts.The total protein per cell volume for mammalian muscle was taken as 260 mg/mL (based onrat muscle value) [210]. See text for calculation details.
Specificactivity Vmax [E]tot
Enzyme (µmol/min/mg) (mM/min) (mM) Substrate Ref. Source
CK1 2 · 10−5 0.0052 4.47 · 10−4 casein [268] rabbit muscleCK2 2.7 · 10−5 0.00702 1.02 · 10−4 GS [214] rabbit muscle
GSK3 3 · 10−5 0.0078 7.58 · 10−5 GS [269] rabbit musclePPase 0.11 27.3 – PPi [255] rabbit muscleNDPK 1.7 442 – – [256] bovine heart
Table C.5: Experimental data used during parameter optimization
Phosphorylation state Reaction direction Ligand dependence Reference
GPa forward Pi vs. AMP [274]GPa reverse glucose-1-phosphate (G1P) vs. G6P [275]GPb forward Pi vs. ATP [276]GPb reverse G1P vs. G6P [277]GPb reverse AMP vs. G6P [277]
C.2 Glycogen phosphorylase rate equation and
parameter optimization
A rate equation for GP was recently proposed by Walcott & Lehman [201]. Theirequation, however, only describes the kinetics of the dephosphorylated enzyme,GPb. They also did not consider inhibition of GP by G6P. Since we are interestedin a rate equation for both GP phosphorylation states that is also able to describeinhibition by G6P, a new rate equation was developed.
Experimental data
As far as possible we used only experimental data that were obtained under thesame conditions and preferably in the same lab. Data points were obtained by digi-tizing graphs from the PDF versions of published articles. The data sources are listedin Table C.5.
Stellenbosch University http://scholar.sun.ac.za
APPENDIX C. MODEL PARAMETRIZATION 239
Algorithm and software
The parameter optimization was carried out using a combination of Python pro-gramming language modules: NumPy and SciPy for numeric procedures, and LMfit-py, a wrapper around the SciPy implementation of the Levenberg-Marquardt algo-rithm with added support for constraints. IPython was used as an interactive shellfor Python. IPython’s built-in support for parallel computing was used to speedup optimizations. To increase the likelihood of finding a global minimum, the op-timization was repeated 1000 times with random initial parameter values for eachiteration.
Rate equation and feature selection
Guided by the observation that GP ligands also influence the rate of the kinase andphosphatase that catalyse the covalent modification of GP, we chose an MWC-typerate equation similar to that of Walcott & Lehman [201], but in which phosphoryla-tion and dephosphorylation are considered to only affect the equilibria between thevarious GP conformations. Like Walcott & Lehman [201] we used a MWC equationwith three conformations (R, T, and U) of which only the R conformation is catalyti-cally active.
The GP literature suggests that AMP, ATP, and G6P all bind to the activation site,but that G6P is inhibitory and that ATP, although activatory, binds with a weak affin-ity to this site. AMP and ATP also both bind to the nucleoside site, where they resultin inhibition, but AMP binds only with a weak affinity and is not a physiologicalinhibitor of GP. We could not obtain a rich enough data set from the literature thatwould allow parameters that describe the binding of ATP to the activation site andthe binding of AMP to the inhibition site to be optimized. These features were thusomitted from the onset. In addition, glycogen was considered saturating and wasthus also omitted. The number of subunits were taken as two. Separate Vmax valueswere fitted for data from different source and for the reverse and forward reactions.
The initial rate equation, which was further simplified during a process of featureselection, is given by
Stellenbosch University http://scholar.sun.ac.za
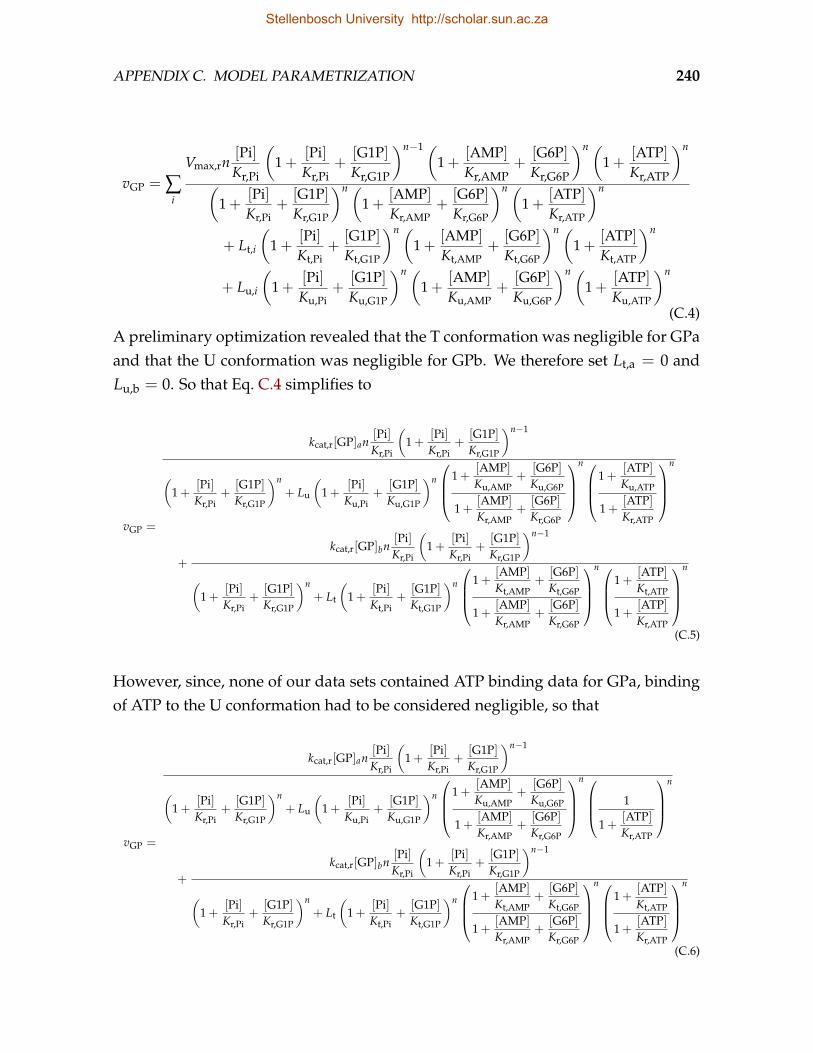
APPENDIX C. MODEL PARAMETRIZATION 240
vGP = ∑i
Vmax,rn[Pi]Kr,Pi
(1 +
[Pi]Kr,Pi
+[G1P]Kr,G1P
)n−1 (1 +
[AMP]Kr,AMP
+[G6P]Kr,G6P
)n (1 +
[ATP]Kr,ATP
)n
(1 +
[Pi]Kr,Pi
+[G1P]Kr,G1P
)n (1 +
[AMP]Kr,AMP
+[G6P]Kr,G6P
)n (1 +
[ATP]Kr,ATP
)n
+ Lt,i
(1 +
[Pi]Kt,Pi
+[G1P]Kt,G1P
)n (1 +
[AMP]Kt,AMP
+[G6P]Kt,G6P
)n (1 +
[ATP]Kt,ATP
)n
+ Lu,i
(1 +
[Pi]Ku,Pi
+[G1P]Ku,G1P
)n (1 +
[AMP]Ku,AMP
+[G6P]Ku,G6P
)n (1 +
[ATP]Ku,ATP
)n
(C.4)
A preliminary optimization revealed that the T conformation was negligible for GPaand that the U conformation was negligible for GPb. We therefore set Lt,a = 0 andLu,b = 0. So that Eq. C.4 simplifies to
vGP =
kcat,r[GP]an[Pi]Kr,Pi
(1 +
[Pi]Kr,Pi
+[G1P]Kr,G1P
)n−1
(1 +
[Pi]Kr,Pi
+[G1P]Kr,G1P
)n+ Lu
(1 +
[Pi]Ku,Pi
+[G1P]Ku,G1P
)n
1 +[AMP]Ku,AMP
+[G6P]Ku,G6P
1 +[AMP]Kr,AMP
+[G6P]Kr,G6P
n
1 +[ATP]Ku,ATP
1 +[ATP]Kr,ATP
n
+
kcat,r[GP]bn[Pi]Kr,Pi
(1 +
[Pi]Kr,Pi
+[G1P]Kr,G1P
)n−1
(1 +
[Pi]Kr,Pi
+[G1P]Kr,G1P
)n+ Lt
(1 +
[Pi]Kt,Pi
+[G1P]Kt,G1P
)n
1 +[AMP]Kt,AMP
+[G6P]Kt,G6P
1 +[AMP]Kr,AMP
+[G6P]Kr,G6P
n
1 +[ATP]Kt,ATP
1 +[ATP]Kr,ATP
n
(C.5)
However, since, none of our data sets contained ATP binding data for GPa, bindingof ATP to the U conformation had to be considered negligible, so that
vGP =
kcat,r[GP]an[Pi]Kr,Pi
(1 +
[Pi]Kr,Pi
+[G1P]Kr,G1P
)n−1
(1 +
[Pi]Kr,Pi
+[G1P]Kr,G1P
)n+ Lu
(1 +
[Pi]Ku,Pi
+[G1P]Ku,G1P
)n
1 +[AMP]Ku,AMP
+[G6P]Ku,G6P
1 +[AMP]Kr,AMP
+[G6P]Kr,G6P
n
1
1 +[ATP]Kr,ATP
n
+
kcat,r[GP]bn[Pi]Kr,Pi
(1 +
[Pi]Kr,Pi
+[G1P]Kr,G1P
)n−1
(1 +
[Pi]Kr,Pi
+[G1P]Kr,G1P
)n+ Lt
(1 +
[Pi]Kt,Pi
+[G1P]Kt,G1P
)n
1 +[AMP]Kt,AMP
+[G6P]Kt,G6P
1 +[AMP]Kr,AMP
+[G6P]Kr,G6P
n
1 +[ATP]Kt,ATP
1 +[ATP]Kr,ATP
n
(C.6)
Stellenbosch University http://scholar.sun.ac.za
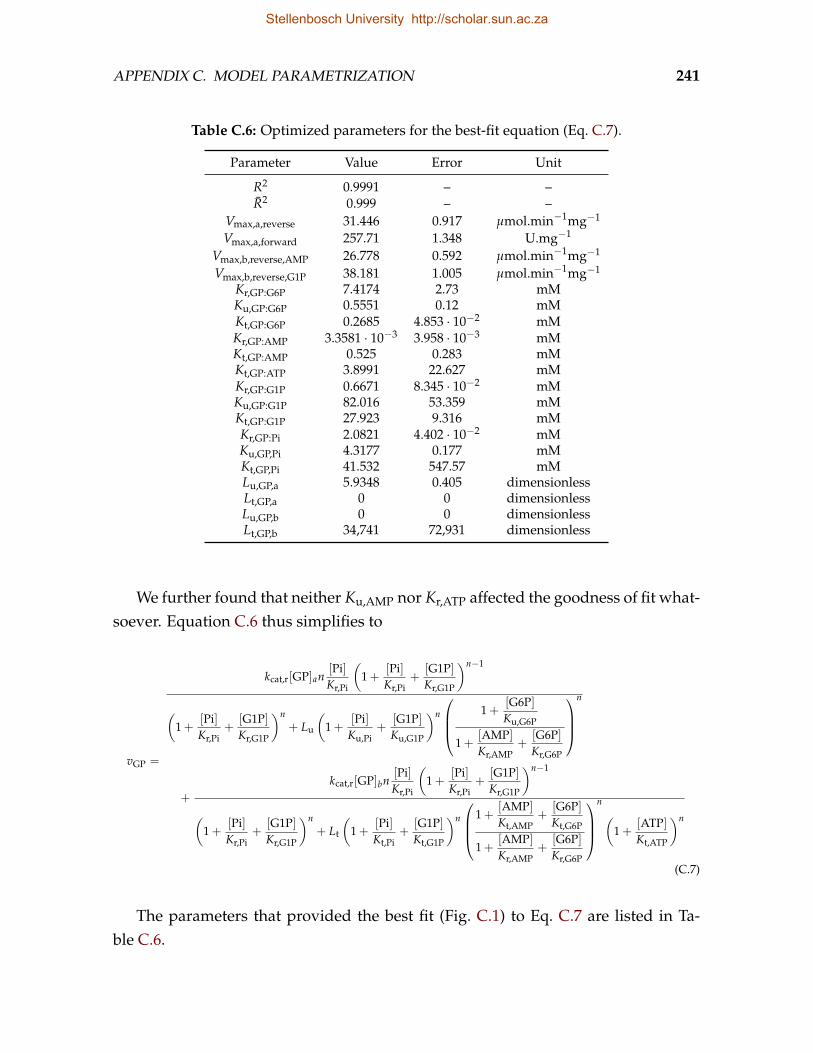
APPENDIX C. MODEL PARAMETRIZATION 241
Table C.6: Optimized parameters for the best-fit equation (Eq. C.7).
Parameter Value Error Unit
R2 0.9991 – –R2 0.999 – –
Vmax,a,reverse 31.446 0.917 µmol.min−1mg−1
Vmax,a,forward 257.71 1.348 U.mg−1
Vmax,b,reverse,AMP 26.778 0.592 µmol.min−1mg−1
Vmax,b,reverse,G1P 38.181 1.005 µmol.min−1mg−1
Kr,GP:G6P 7.4174 2.73 mMKu,GP:G6P 0.5551 0.12 mMKt,GP:G6P 0.2685 4.853 · 10−2 mMKr,GP:AMP 3.3581 · 10−3 3.958 · 10−3 mMKt,GP:AMP 0.525 0.283 mMKt,GP:ATP 3.8991 22.627 mMKr,GP:G1P 0.6671 8.345 · 10−2 mMKu,GP:G1P 82.016 53.359 mMKt,GP:G1P 27.923 9.316 mMKr,GP:Pi 2.0821 4.402 · 10−2 mMKu,GP,Pi 4.3177 0.177 mMKt,GP,Pi 41.532 547.57 mMLu,GP,a 5.9348 0.405 dimensionlessLt,GP,a 0 0 dimensionlessLu,GP,b 0 0 dimensionlessLt,GP,b 34,741 72,931 dimensionless
We further found that neither Ku,AMP nor Kr,ATP affected the goodness of fit what-soever. Equation C.6 thus simplifies to
vGP =
kcat,r[GP]an[Pi]Kr,Pi
(1 +
[Pi]Kr,Pi
+[G1P]Kr,G1P
)n−1
(1 +
[Pi]Kr,Pi
+[G1P]Kr,G1P
)n+ Lu
(1 +
[Pi]Ku,Pi
+[G1P]Ku,G1P
)n
1 +[G6P]Ku,G6P
1 +[AMP]Kr,AMP
+[G6P]Kr,G6P
n
+
kcat,r[GP]bn[Pi]Kr,Pi
(1 +
[Pi]Kr,Pi
+[G1P]Kr,G1P
)n−1
(1 +
[Pi]Kr,Pi
+[G1P]Kr,G1P
)n+ Lt
(1 +
[Pi]Kt,Pi
+[G1P]Kt,G1P
)n
1 +[AMP]Kt,AMP
+[G6P]Kt,G6P
1 +[AMP]Kr,AMP
+[G6P]Kr,G6P
n(
1 +[ATP]Kt,ATP
)n
(C.7)
The parameters that provided the best fit (Fig. C.1) to Eq. C.7 are listed in Ta-ble C.6.
Stellenbosch University http://scholar.sun.ac.za
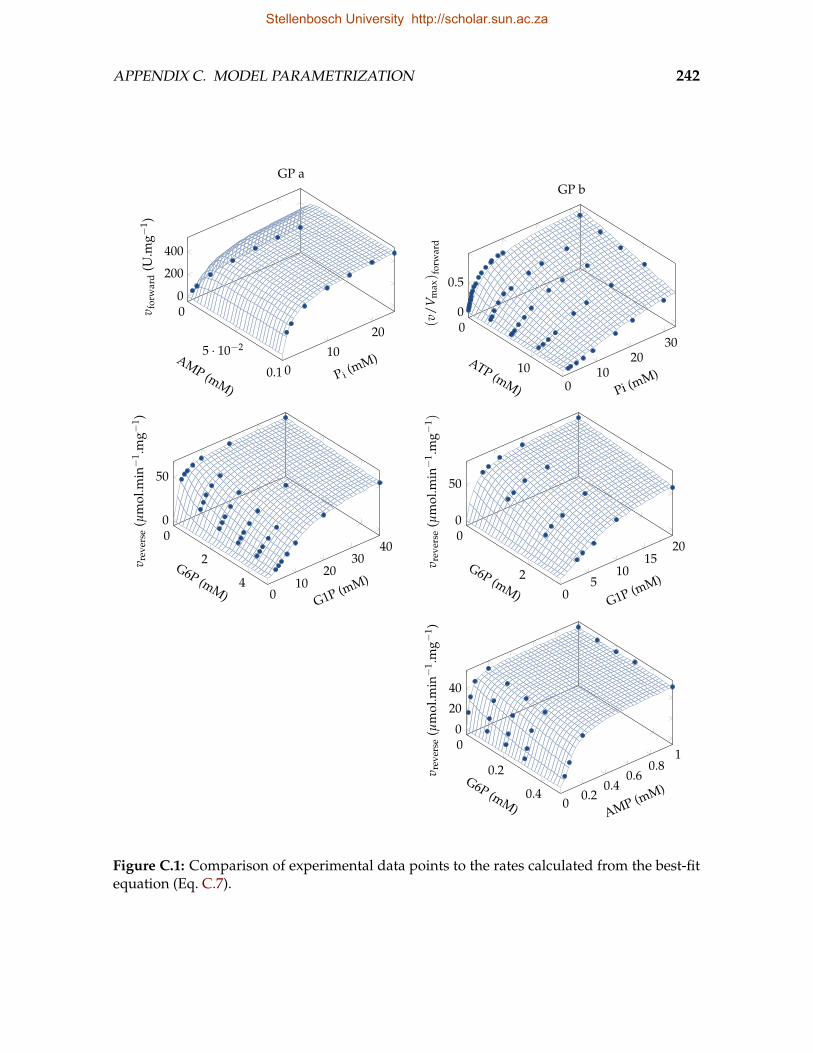
APPENDIX C. MODEL PARAMETRIZATION 242
0
5 · 10−2
0.1 010
20
0
200
400
AMP (mM)P i (mM)
v for
war
d(U
.mg−
1 )
GP a
0
100
1020
30
0
0.5
ATP (mM) Pi (mM)
(v/
V max) f
orw
ard
GP b
0
2
40
1020
3040
0
50
G6P (mM) G1P (mM)
v rev
erse
(µm
ol.m
in−
1 .mg−
1 )
0
2
05
1015
20
0
50
G6P (mM) G1P (mM)
v rev
erse
(µm
ol.m
in−
1 .mg−
1 )
0
0.2
0.40
0.20.4
0.60.8
1
0
20
40
G6P (mM) AMP (mM)
v rev
erse
(µm
ol.m
in−
1 .mg−
1 )
Figure C.1: Comparison of experimental data points to the rates calculated from the best-fitequation (Eq. C.7).
Stellenbosch University http://scholar.sun.ac.za
Bibliography
[1] Roach PJ, DePaoli-Roach AA, Hurley TD & Tagliabracci VS (2012) Glycogenand its metabolism: some new developments and old themes. Biochem J 441,763–787.
[2] Melendez-Hevia E, Waddell TG & Shelton ED (1993) Optimization of molec-ular design in the evolution of metabolism: the glycogen molecule. Biochem J295, 477–483.
[3] DeFronzo RA, Gunnarsson R, Bjorkman O, Olsson M & Wahren J (1985) Effectsof insulin on peripheral and splanchnic glucose metabolism in noninsulin-dependent (type II) diabetes mellitus. J Clin Invest 76, 149–155.
[4] Shulman GI, Rothman DL, Jue T, Stein P, DeFronzo RA & Shulman RG(1990) Quantitation of muscle glycogen synthesis in normal subjects and sub-jects with non-insulin-dependent diabetes by 13C nuclear magnetic resonancespectroscopy. N Engl J Med 322, 223–228.
[5] Jensen J & Lai YC (2009) Regulation of muscle glycogen synthase phosphory-lation and kinetic properties by insulin, exercise, adrenaline and role in insulinresistance. Arch Physiol Biochem 115, 13–21.
[6] DeFronzo RA & Tripathy D (2009) Skeletal muscle insulin resistance is theprimary defect in type 2 diabetes. Diabetes Care 32, S157–S163.
[7] Jensen J, Jebens E, Brennesvik EO, Ruzzin J, Soos MA, Engebretsen EML,O’Rahilly S & Whitehead JP (2006) Muscle glycogen inharmoniously regulatesglycogen synthase activity, glucose uptake, and proximal insulin signaling.Am J Physiol Endocrinol Metab 290, E154–E162.
243
Stellenbosch University http://scholar.sun.ac.za
BIBLIOGRAPHY 244
[8] Shulman RG, Bloch G & Rothman DL (1995) In vivo regulation of muscleglycogen synthase and the control of glycogen synthesis. Proc Natl Acad SciUSA 92, 8535–8542.
[9] Shulman RG & Rothman DL (1996) Enzymatic phosphorylation of muscleglycogen synthase: a mechanism for maintenance of metabolic homeostasis.Proc Natl Acad Sci USA 93, 7491–7495.
[10] Kacser H & Burns JA (1973) The control of flux. Sym Soc Exp Biol 27, 65–104.
[11] Heinrich R & Rapoport TA (1974) A linear steady-state treatment of enzymaticchains. General properties, control and effector strength. Eur J Biochem 42, 89–95.
[12] Chase JR, Rothman DL & Shulman RG (2001) Flux control in the rat gastroc-nemius glycogen synthesis pathway by in vivo 13C/31P NMR spectroscopy.Am J Physiol Endocrinol Metab 280, 598–607.
[13] Schafer JRA, Fell DA, Rothman D & Shulman RG (2004) Protein phosphoryla-tion can regulate metabolite concentrations rather than control flux: the exam-ple of glycogen synthase. Proc Natl Acad Sci USA 101, 1485–1490.
[14] Jucker BM, Barucci N & Shulman GI (1999) Metabolic control analysis ofinsulin-stimulated glucose disposal in rat skeletal muscle. Am J Physiol En-docrinol Metab 277, E505–E512.
[15] Hofmeyr JHS & Cornish-Bowden A (2000) Regulating the cellular economy ofsupply and demand. FEBS Lett 476, 47–51.
[16] Hofmeyr JHS, Rohwer JM & Snoep JL (2006) Conditions for effective allostericfeedforward and feedback in metabolic pathways. IEE Proc-Syst Biol 153, 327–331.
[17] Bouskila M, Hirshman MF, Jensen J, Goodyear LJ & Sakamoto K (2008) In-sulin promotes glycogen synthesis in the absence of GSK3 phosphorylation inskeletal muscle. Am J Physiol Endocrinol Metab 294, E28–E35.
[18] Bouskila M, Hunter RW, Ibrahim AFM, Delattre L, Peggie M, van Diepen JA,Voshol PJ, Jensen J & Sakamoto K (2010) Allosteric regulation of glycogen syn-thase controls glycogen synthesis in muscle. Cell Metab 12, 456–466.
Stellenbosch University http://scholar.sun.ac.za
BIBLIOGRAPHY 245
[19] Lambeth MJ & Kushmerick MJ (2002) A computational model for glycogeno-lysis in skeletal muscle. Ann Biomed Eng 30, 808–827.
[20] Palm DC, Rohwer JM & Hofmeyr JHS (2013) Regulation of glycogen synthasefrom mammalian skeletal muscle - a unifying view of allosteric and covalentregulation. FEBS J 280, 2–27.
[21] Leloir LF & Cardini CE (1957) Biosynthesis of glycogen from uridine diphos-phate glucose. J Am Chem Soc 79, 6340–6341.
[22] Leloir LF, Olavarria JM, Goldemberg SH & Carminatti H (1959) Biosynthesis ofglycogen from uridine diphosphate glucose. Arch Biochem Biophys 81, 508–520.
[23] Hauk R & Brown DH (1959) Preparation and properties ofuridinediphosphoglucose-glycogen transferase from rabbit muscle. BiochimBiophys Acta 33, 556–559.
[24] Salsas E & Larner J (1975) Kinetic studies on muscle glycogen synthase. J BiolChem 250, 3471–3475.
[25] Smythe C, Caudwell FB, Ferguson M & Cohen P (1988) Isolation and structuralanalysis of a peptide containing the novel tyrosyl-glucose linkage in glyco-genin. EMBO J 7, 2681–2686.
[26] Cao Y, Mahrenholz AM, DePaoli-Roach AA & Roach PJ (1993) Characteriza-tion of rabbit skeletal muscle glycogenin. Tyrosine 194 is essential for function.J Biol Chem 268, 14687–14693.
[27] Pitcher J, Smythe C & Cohen P (1988) Glycogenin is the priming glucosyl-transferase required for the initiation of glycogen biogenesis in rabbit skeletalmuscle. Eur J Biochem 176, 391–395.
[28] Lin A, Mu J, Yang J & Roach PJ (1999) Self-glucosylation of glycogenin, theinitiator of glycogen biosynthesis, involves an inter-subunit reaction. ArchBiochem Biophys 363, 163–170.
[29] Lomako J, Lomako WM & Whelan WJ (2004) Glycogenin: the primer for mam-malian and yeast glycogen synthesis. Biochim Biophys Acta 1673, 45–55.
[30] Smythe C, Watt P & Cohen P (1990) Further studies on the role of glycogeninin glycogen biosynthesis. Eur J Biochem 189, 199–204.
Stellenbosch University http://scholar.sun.ac.za
BIBLIOGRAPHY 246
[31] Roach PJ (2002) Glycogen and its metabolism. Curr Mol Med 2, 101–120.
[32] Kornfeld R & Brown DH (1962) Preparation and properties of uridine diphos-phate glucose-glycogen transglucosylase. J Biol Chem 237, 1772–1777.
[33] Goldberg RN, Bell D, Tewari YB & McLaughlin MA (1991) Thermodynamicsof hydrolysis of oligosaccharides. Biophys Chem 40, 69–76.
[34] Gold AM (1980) Kinetic mechanism of rabbit muscle glycogen synthase I. Bio-chemistry 19, 3766–3772.
[35] Jankowski MD, Henry CS, Broadbelt LJ & Hatzimanikatis V (2008) Group con-tribution method for thermodynamic analysis of complex metabolic networks.Biophys J 95, 1487–1499.
[36] Flamholz A, Noor E, Bar-Even A & Milo R (2012) eQuilibrator–the biochemicalthermodynamics calculator. Nucleic Acids Res 40, D770–D775.
[37] Kashiwaya Y, Sato K, Tsuchiya N, Thomas S, Fell DA, Veech RL & PassonneauJV (1994) Control of glucose utilization in working perfused rat heart. J BiolChem 269, 25502–25514.
[38] Fox J, Kawaguchi K, Greenberg E & Preiss J (1976) Biosynthesis of bacterialglycogen. Purification and properties of the Escherichia coli B ADPglucose:1,4-alpha-D-glucan 4-alpha-glucosyltransferase. Biochemistry 15, 849–857.
[39] Piras R, Rothman LB & Cabib E (1967) Metabolite regulation of the I and Dform of rat muscle glycogen synthetase. Biochem Biophys Res Commun 28, 54–58.
[40] Plesner L, Plesner IW & Esmann V (1974) Kinetic mechanism of glycogen syn-thase D from human polymorphonuclear leukocytes. J Biol Chem 249, 1119–1125.
[41] Brown NE & Larner J (1971) Molecular characteristics of the totally depen-dent and independent forms of glycogen synthase of rabbit skeletal muscle. I.Preparation and characteristics of the totally glucose 6-phosphate dependentform. Biochim Biophys Acta 242, 69–80.
[42] Sølling H (1979) Studies on the allosteric properties of glycogen synthase I. EurJ Biochem 94, 231–242.
Stellenbosch University http://scholar.sun.ac.za
BIBLIOGRAPHY 247
[43] Sølling H & Esmann V (1977) The hysteretic properties of glycogen synthase I.Eur J Biochem 81, 129–139.
[44] Krivokobyl’skaia II & Solov’eva GA (1984) [Formation of the glycogen syn-thase I-glycogen complex]. Biokhimiia 49, 1819–1827.
[45] Salsas E & Larner J (1975) Action pattern of muscle glycogen synthase. MolCell Biochem 7, 195–199.
[46] Parodi AJ, Mordoh J, Krisman CR & Leloir LF (1970) Action patterns of phos-phorylase and glycogen synthetase on glycogen. Eur J Biochem 16, 499–507.
[47] Baskaran S, Chikwana VM, Contreras CJ, Davis KD, Wilson WA, DePaoli-Roach AA, Roach PJ & Hurley TD (2011) Multiple glycogen-binding sites ineukaryotic glycogen synthase are required for high catalytic efficiency towardglycogen. J Biol Chem 286, 33999–34006.
[48] Bourne Y & Henrissat B (2001) Glycoside hydrolases and glycosyltransferases:families and functional modules. Curr Opin Struct Biol 11, 593–600.
[49] Buschiazzo A, Ugalde JE, Guerin ME, Shepard W, Ugalde RA & Alzari PM(2004) Crystal structure of glycogen synthase: homologous enzymes catalyzeglycogen synthesis and degradation. EMBO J 23, 3196–3205.
[50] Sheng F, Jia X, Yep A, Preiss J & Geiger JH (2009) The crystal structures ofthe open and catalytically competent closed conformation of Escherichia coliglycogen synthase. J Biol Chem 284, 17796–17807.
[51] Baskaran S, Roach PJ, DePaoli-Roach AA & Hurley TD (2010) Structural basisfor glucose-6-phosphate activation of glycogen synthase. Proc Natl Acad SciUSA 107, 17563–17568.
[52] Horcajada C, Guinovart JJ, Fita I & Ferrer JC (2006) Crystal structure of an ar-chaeal glycogen synthase: insights into oligomerization and substrate bindingof eukaryotic glycogen synthases. J Biol Chem 281, 2923–2931.
[53] Baskaran S (2010) Structure and Regulation of Yeast Glycogen Synthase. Ph.D. the-sis, Indiana University.
[54] Takeda Y, Brewer HB & Larner J (1975) Structural studies on rabbit muscleglycogen synthase. I. Subunit composition. J Biol Chem 250, 8943–8950.
Stellenbosch University http://scholar.sun.ac.za
BIBLIOGRAPHY 248
[55] Staneloni RJ & Piras R (1971) Reversible aggregation of muscle glycogen syn-thetase by metabolites. Biochem Biophys Res Commun 42, 237–244.
[56] Brown JH, Thompson B & Mayer SE (1977) Conversion of skeletal muscleglycogen synthase to multiple glucose 6-phosphate dependent forms by cyclicadenosine monophosphate dependent and independent protein kinases. Bio-chemistry 16, 5501–5508.
[57] Soderling TR, Hickenbottom JP, Reimann EM, Hunkeler FL, Walsh DA &Krebs EG (1970) Inactivation of glycogen synthetase and activation of phos-phorylase kinase by muscle adenosine 3’, 5’-monophosphate-dependent pro-tein kinases. J Biol Chem 245, 6317–6328.
[58] Issa HA & Mendicino J (1973) Role of enzyme-enzyme interactions in the reg-ulation of glycolysis and gluconeogenesis. Properties of glycogen synthetaseisolated from swine kidney. J Biol Chem 248, 685–696.
[59] Nimmo HG, Proud CG & Cohen P (1976) The purification and properties ofrabbit skeletal muscle glycogen synthase. Eur J Biochem 68, 21–30.
[60] Soderling TR (1976) Regulation of glycogen synthetase. Effects of trypsin onthe structure, activity, and phosphorylation of the skeletal muscle enzyme. JBiol Chem 251, 4359–4364.
[61] Sølling H & Esmann V (1977) Purification and properties of glycogen synthaseI from human leukocytes. Eur J Biochem 81, 119–128.
[62] Smith CH & Larner J (1972) Differential aggregation of the totally convertedD and I forms of rabbit muscle glycogen synthase. Biochim Biophys Acta 264,224–228.
[63] Pederson BA, Cheng C, Wilson WA & Roach PJ (2000) Regulation of glycogensynthase. Identification of residues involved in regulation by the allosteric lig-and glucose-6-P and by phosphorylation. J Biol Chem 275, 27753–62771.
[64] Hanashiro I & Roach PJ (2002) Mutations of muscle glycogen synthase thatdisable activation by glucose 6-phosphate. Arch Biochem Biophys 397, 286–292.
[65] Pruitt KD, Tatusova T, Brown GR & Maglott DR (2012) NCBI Reference Se-quences (RefSeq): current status, new features and genome annotation policy.Nucleic Acids Res 40, D130–D135.
Stellenbosch University http://scholar.sun.ac.za
BIBLIOGRAPHY 249
[66] Rao ST & Rossmann MG (1973) Comparison of super-secondary structures inproteins. J Mol Biol 76, 241–256.
[67] Piras R, Rothman LB & Cabib E (1968) Regulation of muscle glycogen syn-thetase by metabolites. Differential effects on the I and D forms. Biochemistry7, 56–66.
[68] Barash V, Schramm H & Gutman A (1973) Adipose tissue glycogen synthetase.I. Kinetic properties. J Biol Chem 248, 3733–3738.
[69] Nakai C & Thomas JA (1975) Effects of magnesium on the kinetic propertiesof bovine heart glycogen synthase D. J Biol Chem 250, 4081–4086.
[70] Passonneau JV, Schwartz JP & Rottenberg DA (1975) The partial purificationand properties of pig brain glycogen synthase. J Biol Chem 250, 2287–2292.
[71] Rosell-Perez M, Villar-Palasi C & Larner J (1962) Studies on UDPG-glycogentransglucosylase. I. Preparation and differentiation of two activities of UDPG-glycogen transglucosylase from rat skeletal muscle. Biochemistry 1, 763–768.
[72] Roach PJ, Takeda Y & Larner J (1976) Rabbit skeletal muscle glycogen syn-thase. I. Relationship between phosphorylation state and kinetic properties. JBiol Chem 251, 1913–1919.
[73] Roach PJ, Rosell-Perez M & Larner J (1977) Muscle glycogen synthase in vivostate: Effects of insulin administration on the chemical and kinetic propertiesof the purified enzyme. FEBS Lett 80, 95–98.
[74] Roach PJ & Larner J (1977) Covalent phosphorylation in the regulation ofglycogen synthase activity. Mol Cell Biochem 15, 179–200.
[75] Steiner DF, Younger L & King J (1965) Purification and properties of uridinediphosphate glucose-glycogen glucosyltransferase from rat liver. Biochemistry4, 740–751.
[76] Dıaz A, Martınez-Pons C, Fita I, Ferrer JC & Guinovart JJ (2011) Processivityand subcellular localization of glycogen synthase depend on a non-catalytichigh affinity glycogen-binding site. J Biol Chem 286, 18505–18514.
[77] Cornish-Bowden A (2004) Fundamentals of Enzyme Kinetics. 3rd edn., PortlandPress, London.
Stellenbosch University http://scholar.sun.ac.za
BIBLIOGRAPHY 250
[78] Rosell-Perez M & Larner J (1964) Studies on UDPG: alpha-1, 4-glucan alpha-4-glucosyltransferase. VI. Specificity and structural requirements for the activa-tor of the D form of the dog muscle enzyme. Biochemistry 3, 773–778.
[79] Roach PJ & Larner J (1976) Rabbit skeletal muscle glycogen synthase. II. En-zyme phosphorylation state and effector concentrations as interacting controlparameters. J Biol Chem 251, 1920–1925.
[80] Goldemberg SH (1962) Specificity of uridine diphosphate glucose-glycogenglucosyltransferase. Biochim Biophys Acta 56, 357–359.
[81] Passonneau JV, Brunner EA, Molstad C & Passonneau R (1971) The effects ofaltered endocrine states and of ether anaesthesia on mouse brain. J Neurochem18, 2317–2328.
[82] Plesner L, Plesner IW & Esmann V (1976) Purification and steady state kineticmechanism of glycogen synthase-D from human polymorpho-nuclear leuko-cytes. Mol Cell Biochem 12, 45–61.
[83] Manchester KL (1980) Determination of magnesium and potassium bindingconstants to phosphoenolpyruvate, 2- and 3-phosphoglycerate and a numberof other anions. Biochim Biophys Acta 630, 225–231.
[84] O’Sullivan WJ & Perrin DD (1964) The stability constants of metal-adeninenucleotide complexes. Biochemistry 3, 18–26.
[85] Poulter L, Ang SG, Gibson BW, Williams DH, Holmes CFB, Caudwell FB,Pitcher J & Cohen P (1988) Analysis of the in vivo phosphorylation state of rab-bit skeletal muscle glycogen synthase by fast-atom-bombardment mass spec-trometry. Eur J Biochem 175, 497–510.
[86] Roach PJ (1990) Control of glycogen synthase by hierarchal protein phospho-rylation. FASEB J 4, 2961–2968.
[87] Hofmeyr JHS & Cornish-Bowden A (1997) The reversible Hill equation: howto incorporate cooperative enzymes into metabolic models. Comput Appl Biosci13, 377–385.
[88] Westermark PO, Hellgren-Kotaleski J & Lansner A (2004) Derivation of a re-versible Hill equation with modifiers affecting catalytic properties. WSEASTrans Biol Med 1, 91–98.
Stellenbosch University http://scholar.sun.ac.za
BIBLIOGRAPHY 251
[89] Villar-Palasi C & Larner J (1960) Insulin-mediated effect on the activity ofUDPG-glycogen transglucosylase of muscle. Biochim Biophys Acta 39, 171–173.
[90] Guinovart JJ, Salavert A, Massague J, Ciudad CJ, Salsas E & Itarte E (1979)Glycogen synthase: a new activity ratio assay expressing a high sensitivity tothe phosphorylation state. FEBS Lett 106, 284–288.
[91] Roach PJ (1991) Multisite and hierarchal protein phosphorylation. J Biol Chem266, 14139–14142.
[92] Skurat AV & Dietrich AD (2004) Phosphorylation of Ser640 in muscle glycogensynthase by DYRK family protein kinases. J Biol Chem 279, 2490–2498.
[93] Wilson WA, Skurat AV, Probst B, DePaoli-Roach A, Roach PJ & Rutter J (2005)Control of mammalian glycogen synthase by PAS kinase. Proc Natl Acad SciUSA 102, 16596–16601.
[94] Kuma Y, Campbell DG & Cuenda A (2004) Identification of glycogen synthaseas a new substrate for stress-activated protein kinase 2b/p38beta. Biochem J379, 133–139.
[95] Chan KF, Hurst MO & Graves DJ (1982) Phosphorylase kinase specificity. Acomparative study with cAMP-dependent protein kinase on synthetic pep-tides and peptide analogs of glycogen synthase and phosphorylase. J Biol Chem257, 3655–3659.
[96] Rylatt DB, Embi N & Cohen P (1979) Glycogen synthase kinase-2 from rabbitskeletal muscle is activated by the calcium-dependent regulator protein. FEBSLett 98, 76–80.
[97] Soderling TR, Sheorain V & Ericsson L (1979) Phosphorylation of glycogensynthase by phosphorylase kinase: stoichiometry, specificity and site of phos-phorylation. FEBS Lett 106, 181–184.
[98] Woodgett JR, Tonks NK & Cohen P (1982) Identification of a calmodulin-dependent glycogen synthase kinase in rabbit skeletal muscle, distinct fromphosphorylase kinase. FEBS Lett 148, 5–11.
[99] Carling D & Hardie DG (1989) The substrate and sequence specificity ofthe AMP-activated protein kinase. Phosphorylation of glycogen synthase andphosphorylase kinase. Biochim Biophys Acta 1012, 81–86.
Stellenbosch University http://scholar.sun.ac.za
BIBLIOGRAPHY 252
[100] Kuret J, Woodgett JR & Cohen P (1985) Multisite phosphorylation of glycogensynthase from rabbit skeletal muscle. Identification of the sites phosphorylatedby casein kinase-I. Eur J Biochem 151, 39–48.
[101] Cohen P, Yellowlees D, Aitken A, Donella-Deana A, Hemmings BA & ParkerPJ (1982) Separation and characterisation of glycogen synthase kinase 3, glyco-gen synthase kinase 4 and glycogen synthase kinase 5 from rabbit skeletalmuscle. Eur J Biochem 124, 21–35.
[102] Fiol CJ, Mahrenholz AM, Wang Y, Roeske RW & Roach PJ (1987) Formationof protein kinase recognition sites by covalent modification of the substrate.Molecular mechanism for the synergistic action of casein kinase II and glyco-gen synthase kinase 3. J Biol Chem 262, 14042–14048.
[103] Rylatt DB, Aitken A, Bilham T, Condon GD, Embi N & Cohen P (1980)Glycogen synthase from rabbit skeletal muscle. Amino acid sequence at thesites phosphorylated by glycogen synthase kinase-3, and extension of the N-terminal sequence containing the site phosphorylated by phosphorylase ki-nase. Eur J Biochem 107, 529–537.
[104] Parker PJ, Aitken A, Bilham T, Embi N & Cohen P (1981) Amino acid sequenceof a region in rabbit skeletal muscle glycogen synthase phosphorylated bycyclic AMP-dependent protein kinase. FEBS Lett 123, 332–336.
[105] Woodgett JR, Davison MT & Cohen P (1983) The calmodulin-dependent glyco-gen synthase kinase from rabbit skeletal muscle. Purification, subunit struc-ture and substrate specificity. Eur J Biochem 136, 481–487.
[106] Flotow H & Roach PJ (1989) Synergistic phosphorylation of rabbit muscleglycogen synthase by cyclic AMP-dependent protein kinase and casein kinaseI. Implications for hormonal regulation of glycogen synthase. J Biol Chem 264,9126–9128.
[107] Zhang W, DePaoli-Roach AA & Roach PJ (1993) Mechanisms of multisite phos-phorylation and inactivation of rabbit muscle glycogen synthase. Arch BiochemBiophys 304, 219–225.
[108] Picton C, Woodgett J, Hemmings B & Cohen P (1982) Multisite phosphoryla-tion of glycogen synthase from rabbit skeletal muscle. Phosphorylation of site
Stellenbosch University http://scholar.sun.ac.za
BIBLIOGRAPHY 253
5 by glycogen synthase kinase-5 (casein kinase-II) is a prerequisite for phos-phorylation of sites 3 by glycogen synthase kinase-3. FEBS Lett 150, 191–196.
[109] Nakielny S, Campbell DG & Cohen P (1991) The molecular mechanism bywhich adrenalin inhibits glycogen synthesis. Eur J Biochem 199, 713–722.
[110] Salazar C & Hofer T (2003) Allosteric regulation of the transcription factorNFAT1 by multiple phosphorylation sites: a mathematical analysis. J Mol Biol327, 31–45.
[111] Fiol CJ, Wang A, Roeske RW & Roach PJ (1990) Ordered multisite protein phos-phorylation. Analysis of glycogen synthase kinase 3 action using model pep-tide substrates. J Biol Chem 265, 6061–6065.
[112] Friedman DL & Larner J (1963) Studies on UDPG-α-glucan transglucosylase.III. Interconversion of two forms of muscle UDPG-α-glucan transglucosylaseby a phosphorylation-dephosphorylation reaction sequence. Biochemistry 2,669–675.
[113] Stalmans W & Hers HG (1973) Glycogen synthesis from UDPG. In The Enzymes(Boyer PD, ed.), vol. IX, 3rd edn., pp. 310–357, Academic Press, New York andLondon.
[114] Skurat AV, Wang Y & Roach PJ (1994) Rabbit skeletal muscle glycogen syn-thase expressed in COS cells. Identification of regulatory phosphorylationsites. J Biol Chem 269, 25534–25542.
[115] Skurat AV & Roach PJ (1995) Phosphorylation of sites 3a and 3b (Ser640 andSer644) in the control of rabbit muscle glycogen synthase. J Biol Chem 270,12491–12497.
[116] Rosell-Perez M & Larner J (1964) Studies on UDPG-alpha-glucan transgluco-sylase. IV. Purification and characterization of two forms from rabbit skeletalmuscle. Biochemistry 3, 75–81.
[117] Rosell-Perez M & Larner J (1964) Studies on UDPG-alpha-glucan transgly-colysase. V. Two forms of the enzyme in dog skeletal muscle and their inter-conversion. Biochemistry 3, 81–88.
Stellenbosch University http://scholar.sun.ac.za
BIBLIOGRAPHY 254
[118] Brown DF, Hegazy M & Reimann EM (1986) Kinetic properties of glycogensynthase from skeletal muscle after phosphorylation by glycogen synthase ki-nase 4. Biochem Biophys Res Commun 134, 1129–1135.
[119] Nimmo HG, Proud CG & Cohen P (1976) The phosphorylation of rabbit skele-tal muscle glycogen synthase by glycogen synthase kinase-2 and adenosine-3’:5’-monophosphate-dependent protein kinase. Eur J Biochem 68, 31–44.
[120] Wang Y & Roach PJ (1993) Inactivation of rabbit muscle glycogen synthase byglycogen synthase kinase-3. Dominant role of the phosphorylation of Ser-640(site-3a). J Biol Chem 268, 23876–23880.
[121] Hardy TA & Roach PJ (1993) Control of yeast glycogen synthase-2 by COOH-terminal phosphorylation. J Biol Chem 268, 23799–23805.
[122] Skurat AV, Dietrich AD & Roach PJ (2000) Glycogen synthase sensitivity to in-sulin and glucose-6-phosphate is mediated by both NH2- and COOH-terminalphosphorylation sites. Diabetes 49, 1096–1100.
[123] Graham TE, Yuan Z, Hill AK & Wilson RJ (2010) The regulation of muscleglycogen: the granule and its proteins. Acta Physiol 199, 489–498.
[124] Prats C, Gomez-Cabello A & Hansen AV (2011) Intracellular compartmental-ization of skeletal muscle glycogen metabolism and insulin signalling. ExpPhysiol 96, 385–390.
[125] Prats C, Cadefau JA, Cusso R, Qvortrup K, Nielsen JN, Wojtaszewski JFP,Hardie DG, Stewart G, Hansen BF & Ploug T (2005) Phosphorylation-dependent translocation of glycogen synthase to a novel structure duringglycogen resynthesis. J Biol Chem 280, 23165–23172.
[126] Prats C, Helge JW, Nordby P, Qvortrup K, Ploug T, Dela F & WojtaszewskiJFP (2009) Dual regulation of muscle glycogen synthase during exercise byactivation and compartmentalization. J Biol Chem 284, 15692–15700.
[127] Brady MJ, Kartha PM, Aysola AA & Saltiel AR (1999) The role of glucose me-tabolites in the activation and translocation of glycogen synthase by insulin in3T3-L1 adipocytes. Biochemistry 274, 27497–27504.
[128] Litherland GJ, Morris NJ, Walker M & Yeaman SJ (2007) Role of glycogen con-tent in insulin resistance in human muscle cells. J Cell Physiol 211, 344–352.
Stellenbosch University http://scholar.sun.ac.za
BIBLIOGRAPHY 255
[129] Ortmeyer HK, Adall Y, Marciani KR, Katsiaras A, Ryan AS, Bodkin NL &Hansen BC (2005) Skeletal muscle glycogen synthase subcellular localization:effects of insulin and PPAR-alpha agonist (K-111) administration in rhesusmonkeys. Am J Physiol Regul Integr Comp Physiol 288, R1509–R1517.
[130] Cid E, Cifuentes D, Baque S, Ferrer JC & Guinovart JJ (2005) Determinantsof the nucleocytoplasmic shuttling of muscle glycogen synthase. FEBS J 272,3197–3213.
[131] Nielsen JN, Derave W, Kristiansen S, Ralston E, Ploug T & Richter EA (2001)Glycogen synthase localization and activity in rat skeletal muscle is stronglydependent on glycogen content. J Physiol 531, 757–769.
[132] Cohen P (2000) The regulation of protein function by multisitephosphorylation–a 25 year update. Trends Biochem Sci 25, 596–601.
[133] Salazar C & Hofer T (2009) Multisite protein phosphorylation–from molecularmechanisms to kinetic models. FEBS J 276, 3177–3198.
[134] Gunawardena J (2005) Multisite protein phosphorylation makes a goodthreshold but can be a poor switch. Proc Natl Acad Sci USA 102, 14617–14622.
[135] Frame S & Cohen P (2001) GSK3 takes centre stage more than 20 years after itsdiscovery. Biochem J 359, 1–16.
[136] Algranati ID & Cabib E (1962) Uridine diphosphate glucosyltransferase D-glucose-glycogen glycosyltransferase from yeast. J Biol Chem 237, 1007–1013.
[137] Rosell-Perez M & Larner J (1962) Studies on UDPG-glycogen transglucosylase.II. Species variation of glucose-6-phosphate sensitivity of UDPG-glycogentransglucosylase. Biochemistry 1, 769–772.
[138] Lai YC, Stuenaes JT, Kuo CH & Jensen J (2007) Glycogen content and contrac-tion regulate glycogen synthase phosphorylation and affinity for UDP-glucosein rat skeletal muscles. Am J Physiol Endocrinol Metab 293, 1622–1629.
[139] Villar-Palasi C (1994) Inhibition by glucose 6-phosphate of cyclic AMP-dependent protein kinase phosphorylation of glycogen synthase. Biochim Bio-phys Acta 1207, 88–92.
[140] Taylor SS (1989) cAMP-dependent protein kinase. J Biol Chem 264, 8443–8446.
Stellenbosch University http://scholar.sun.ac.za
BIBLIOGRAPHY 256
[141] Huang D, Wilson WA & Roach PJ (1997) Glucose-6-P control of glycogen syn-thase phosphorylation in yeast. J Biol Chem 272, 22495–22501.
[142] Traut RR & Lipmann F (1963) Activation of glycogen synthetase by glucose6-phosphate. J Biol Chem 238, 1213–1221.
[143] Kato K & Bishop JS (1972) Glycogen synthetase-D phosphatase. I. Some newproperties of the partially purified enzyme from rabbit skeletal muscle. J BiolChem 247, 7420–7429.
[144] Thomas JA & Nakai C (1973) Control of glycogen synthase phosphatase fromrat heart. The role of substrate. J Biol Chem 248, 2208–2213.
[145] Okubo M, Bogardus C, Lillioja S & Mott DM (1988) Glucose-6-phosphate stim-ulation of human muscle glycogen synthase phosphatase. Metabolism 37, 1171–1176.
[146] Villar-Palasi C (1991) Substrate specific activation by glucose 6-phosphateof the dephosphorylation of muscle glycogen synthase. Biochim Biophys Acta1095, 261–267.
[147] Villar-Palasi C & Guinovart JJ (1997) The role of glucose 6-phosphate in thecontrol of glycogen synthase. FASEB J 11, 544–558.
[148] Fernandez-Novell JM, Arino J, Vilaro S & Guinovart JJ (1992) Glucose inducesthe translocation and the aggregation of glycogen synthase in rat hepatocytes.Biochem J 281, 443–448.
[149] Fernandez-Novell JM, Bellido D, Vilaro S & Guinovart JJ (1997) Glucose in-duces the translocation of glycogen synthase to the cell cortex in rat hepato-cytes. Biochem J 321, 227–231.
[150] Westermark PO & Lansner A (2003) A model of phosphofructokinase and gly-colytic oscillations in the pancreatic beta-cell. Biophys J 85, 126–139.
[151] Embi N, Rylatt DB & Cohen P (1980) Glycogen synthase kinase-3 from rabbitskeletal muscle. Separation from cyclic-AMP-dependent protein kinase andphosphorylase kinase. Eur J Biochem 107, 519–527.
Stellenbosch University http://scholar.sun.ac.za
BIBLIOGRAPHY 257
[152] Gilboe DP & Nuttall FQ (1972) The role of ATP and glucose 6-phosphate in theregulation of glycogen synthetase D phosphatase. Biochem Biophys Res Com-mun 48, 898–906.
[153] Nakai C & Thomas JA (1974) Properties of a phosphoprotein phosphatasefrom bovine heart with activity on glycogen synthase, phosphorylase, and hi-stone. J Biol Chem 249, 6459–6467.
[154] Wang P & Bantle G (1974) The combined effect of glycogen and ATP on the Dto I conversion of glycogen synthetase. Biochem Biophys Res Commun 57, 148–153.
[155] Koshland DE, Nemethy G & Filmer D (1966) Comparison of experimentalbinding data and theoretical models in proteins containing subunits. Biochem-istry 5, 365–385.
[156] Monod J, Wyman J & Changeux JP (1965) On the nature of allosteric transi-tions: A plausible model. J Mol Biol 12, 88–118.
[157] Popova SV & Sel’kov EE (1975) Generalization of the model by Monod,Wyman and Changeux for the case of reversible monosubstrate reaction S =P. FEBS Lett 53, 269–273.
[158] Marquardt DW (1963) An algorithm for least-squares estimation of nonlinearparameters. J Soc Ind Appl Math 11, 431–441.
[159] Vaz AIF & Vicente LN (2007) A particle swarm pattern search method forbound constrained global optimization. Journal of Global Optimization 39, 197–219.
[160] Perez F & Granger BE (2007) IPython: a system for interactive scientific com-puting. Comput Sci Eng 9, 21–29.
[161] Rubin MM & Changeux JP (1966) On the nature of allosteric transitions: im-plications of non-exclusive ligand binding. J Mol Biol 21, 265–274.
[162] Hofmeyr JHS & Westerhoff HV (2001) Building the cellular puzzle: control inmulti-level reaction networks. J Theor Biol 208, 261–285.
[163] Goldbeter A & Koshland DE (1981) An amplified sensitivity arising from cova-lent modification in biological systems. Proc Natl Acad Sci USA 78, 6840–6844.
Stellenbosch University http://scholar.sun.ac.za
BIBLIOGRAPHY 258
[164] Small JR & Fell DA (1990) Covalent modification and metabolic control anal-ysis. Modification to the theorems and their application to metabolic systemscontaining covalently modifiable enzymes. Eur J Biochem 191, 405–411.
[165] Killilea SD, Brandt H, Lee EYC & Whelan WJ (1976) Evidence for the coor-dinate control of activity of liver glycogen synthase and phosphorylase by asingle protein phosphatase. J Biol Chem 251, 2363–2368.
[166] Detwiler TC, Gratecos D & Fischer EH (1977) Rabbit muscle phosphorylasephosphatase. 2. Kinetic properties and behavior in glycogen particles. Biochem-istry 16, 4818–4823.
[167] Martensen TM, Brotherton JE & Graves DJ (1973) Kinetic studies of the inhibi-tion of muscle phosphorylase phosphatase. J Biol Chem 248, 8323–8328.
[168] Tu JI & Graves DJ (1973) Inhibition of the phosphorylase kinase catalyzed re-action by glucose-6-P. Biochem Biophys Res Commun 53, 59–65.
[169] Echigoya Y, Okabe H, Itou T, Endo H & Sakai T (2011) Molecular character-ization of glycogen synthase 1 and its tissue expression profile with type IIhexokinase and muscle-type phosphofructokinase in horses. Mol Biol Rep 38,461–469.
[170] Schiaffino S & Reggiani C (2011) Fiber types in mammalian skeletal muscles.Physiological reviews 91, 1447–1531.
[171] Suarez RK (2003) Shaken and stirred: muscle structure and metabolism. J ExpBiol 206, 2021–2029.
[172] van Eunen K, Bouwman J, Daran-Lapujade P, Postmus J, Canelas AB, Men-sonides FIC, Orij R, Tuzun I, van den Brink J, Smits GJ, van Gulik WM, BrulS, Heijnen JJ, de Winde JH, de Mattos MJT, Kettner C, Nielsen J, WesterhoffHV & Bakker BM (2010) Measuring enzyme activities under standardized invivo-like conditions for systems biology. FEBS J 277, 749–760.
[173] Rohwer JM & Hofmeyr JHS (2010) Kinetic and thermodynamic aspects of en-zyme control and regulation. J Phys Chem B 114, 16280–16289.
[174] Kraegen EW, Sowden JA, Halstead MB, Clark PW, Rodnick KJ, Chisholm DJ &Jamest DE (1993) Glucose transporters and in vivo glucose uptake in skeletal
Stellenbosch University http://scholar.sun.ac.za
BIBLIOGRAPHY 259
and cardiac muscle: fasting, insulin stimulation and immunoisolation studiesof GLUT1 and GLUT4. Biochem J 295, 287–293.
[175] Wang W, Hansen PA, Marshall BA, Holloszy JO & Mueckler M (1996) In-sulin unmasks a COOH-terminal Glut4 epitope and increases glucose trans-port across T-tubules in skeletal muscle. J Cell Biol 135, 415–430.
[176] Mueckler M (2001) Insulin resistance and the disruption of Glut4 trafficking inskeletal muscle. J Clin Invest 107, 1211–1213.
[177] Fazakerley D & Coster A (2010) Muscling in on GLUT4 kinetics. Commun In-tegr Biol 3, 260–262.
[178] Bryant NJ, Govers R & James DE (2002) Regulated transport of the glucosetransporter GLUT4. Nat Rev Mol Cell Biol 3, 267–277.
[179] Rowland AF, Fazakerley DJ & James DE (2011) Mapping insulin/GLUT4 cir-cuitry. Traffic 12, 672–681.
[180] Foley K, Boguslavsky S & Klip A (2011) Endocytosis, recycling, and regulatedexocytosis of glucose transporter 4. Biochemistry 50, 3048–3061.
[181] Carruthers A, DeZutter J, Ganguly A & Devaskar SU (2009) Will the originalglucose transporter isoform please stand up! Am J Physiol Endocrinol Metab297, E836–E848.
[182] Cloherty EK, Heard KS & Carruthers A (1996) Human erythrocyte sugar trans-port is incompatible with available carrier models. Biochemistry 35, 10411–10421.
[183] Carruthers A & Melchior DL (1983) Asymmetric or symmetric? Cytosolicmodulation of human erythrocyte hexose transfer. Biochim Biophys Acta 728,254–266.
[184] Levine KB, Cloherty EK, Hamill S & Carruthers A (2002) Molecular determi-nants of sugar transport regulation by ATP. Biochemistry 41, 12629–12638.
[185] Naftalin RJ (2008) Alternating carrier models of asymmetric glucose transportviolate the energy conservation laws. Biophys J 95, 4300–4314.
Stellenbosch University http://scholar.sun.ac.za
BIBLIOGRAPHY 260
[186] Gould GW & Holman GD (1993) The glucose transporter family: structure,function and tissue-specific expression. Biochem J 295, 329–341.
[187] Ritov VB & Kelley DE (2001) Hexokinase isozyme distribution in human skele-tal muscle. Diabetes 50, 1253–1262.
[188] Vogt C, Yki-Jarvinen H, Iozzo P, Pipek R, Pendergrass M, Koval J, Ardehali H,Printz R, Granner D, DeFronzo R & Mandarino L (1998) Effects of insulin onsubcellular localization of hexokinase II in human skeletal muscle in vivo. JClin Endocrinol Metab 83, 230–234.
[189] Vogt C, Ardehali H, Iozzo P, Yki-Jarvinen H, Koval J, Maezono K, Pender-grass M, Printz R, Granner D, DeFronzo R & Mandarino L (2000) Regulationof hexokinase II expression in human skeletal muscle in vivo. Metabolism 49,814–818.
[190] Wilson JE (2003) Isozymes of mammalian hexokinase: structure, subcellularlocalization and metabolic function. J Exp Biol 206, 2049–2057.
[191] Southworth R, Davey KAB, Warley A & Garlick PB (2007) A reevaluation ofthe roles of hexokinase I and II in the heart. Am J Physiol Heart Circ Physiol 292,H378–H386.
[192] Arora KK, Filburns CR & Pederseng PL (1993) Structure/function relation-ships in hexokinase. Site-directed mutational analyses and characterizationof overexpressed fragments implicate different functions for the N- and C-terminal halves of the enzyme. J Biol Chem 268, 18259–18266.
[193] Ardehali H, Yano Y, Printz RL, Koch S, Whitesell RR, May JM & Granner DK(1996) Functional organization of mammalian hexokinase II. Retention of cat-alytic and regulatory functions in both the NH2- and COOH-terminal halves.J Biol Chem 271, 1849–1852.
[194] Tsai HJ & Wilson JE (1996) Functional organization of mammalian hexoki-nases: both N- and C-terminal halves of the rat type II isozyme possess cat-alytic sites. Arch Biochem Biophys 329, 17–23.
[195] Ardehali H, Printz RL, Whitesell RR, May JM & Granner DK (1999) Functionalinteraction between the N- and C-terminal halves of human hexokinase II. JBiol Chem 274, 15986–15989.
Stellenbosch University http://scholar.sun.ac.za
BIBLIOGRAPHY 261
[196] Grossbard L & Schimke RT (1966) Multiple hexokinases of rat tissues. Purifi-cation and comparison of soluble forms. J Biol Chem 241, 3546–3560.
[197] Gao H & Leary JA (2004) Kinetic measurements of phosphoglucomutaseby direct analysis of glucose-1-phosphate and glucose-6-phosphate usingion/molecule reactions and Fourier transform ion cyclotron resonance massspectrometry. Anal Biochem 329, 269–275.
[198] Duggleby RG, Chao YC, Huang JG, Peng HL & Chang HY (1996) Sequence dif-ferences between human muscle and liver cDNAs for UDPglucose pyrophos-phorylase and kinetic properties of the recombinant enzymes expressed in Es-cherichia coli. Eur J Biochem 235, 173–179.
[199] Johnson LN (1992) Glycogen phosphorylase: Control by phosphorylation andallosteric effectors. FASEB J 6, 2274–2282.
[200] Johnson LN, Snape P, Martin JL, Acharya KR, Barford D & Oikonomakos NG(1993) Crystallographic binding studies on the allosteric inhibitor glucose-6-phosphate to T state glycogen phosphorylase b. J Mol Biol 232, 253–267.
[201] Walcott S & Lehman SL (2007) Enzyme kinetics of muscle glycogen phospho-rylase b. Biochemistry 46, 11957–11968.
[202] Vinnakota K, Kemp ML & Kushmerick MJ (2006) Dynamics of muscle gly-cogenolysis modeled with pH time course computation and pH-dependentreaction equilibria and enzyme kinetics. Biophys J 91, 1264–1287.
[203] Meinkoth JL, Alberts AS, Went W, Fantozzi D, Taylor SS, Hagiwara M,Montminy M & Feramisco JR (1993) Signal transduction through the cAMP-dependent protein kinase. Mol Cell Biochem 127-128, 179–186.
[204] Mutalik VK & Venkatesh KV (2005) Quantification of the glycogen cascadesystem: the ultrasensitive responses of liver glycogen synthase and musclephosphorylase are due to distinctive regulatory designs. Theor Biol Med Model2, 19.
[205] Harmer AR, McKenna MJ, Sutton JR, Snow RJ, Ruell PA, Booth J, ThompsonMW, Mackay NA, Stathis CG, Crameri RM, Carey MF & Eager DM (2000)Skeletal muscle metabolic and ionic adaptations during intense exercise fol-lowing sprint training in humans. J Appl Physiol 89, 1793–803.
Stellenbosch University http://scholar.sun.ac.za
BIBLIOGRAPHY 262
[206] Goldberg RN, Tewari YB & Bhat TN (2004) Thermodynamics of enzyme-catalyzed reactions–a database for quantitative biochemistry. Bioinformatics 20,2874–2877.
[207] Palfreyman PW, Clark AE, Denton RM & Holman GD (1992) Kinetic resolutionof the separate GLUT1 and GLUT4 glucose transport activities in 3T3-L1 cells.Biochem J 284, 275–281.
[208] Ryder JW, Yang J, Galuska D, Rincon J, Bjornholm M, Krook A, Lund S, Ped-ersen O, Wallberg-Henriksson H, Zierath JR & Holman GD (2000) Use of anovel impermeable biotinylated photolabeling reagent to assess insulin- andhypoxia-stimulated cell surface GLUT4 content in skeletal muscle from type 2diabetic patients. Diabetes 49, 647–654.
[209] Stagsted J, Hansen T, Roth RA, Goldstein A & Olsson L (1993) Correlationbetween insulin receptor occupancy and tyrosine kinase activity at low insulinconcentrations and effect of major histocompatibility comples class I-derivedpeptide. J Pharmacol Exp Ther 267, 997–1001.
[210] Albe KR, Butler MH & Wright BE (1990) Cellular concentrations of enzymesand their substrates. J Theor Biol 143, 163–195.
[211] Villar-Palasi C & Larner J (1960) Levels of activity of the enzymes of the glyco-gen cycle in rat tissues. Arch Biochem Biophys 86, 270–273.
[212] Cohen P & Goldstone T (1983) Protein phosphorylation and the control ofglycogen metabolism in skeletal muscle. Philos Trans R Soc Lond, B, Biol Sci302, 13–25.
[213] Amitani I, Sakamoto T & Ando T (2001) Link between the enzymatic kineticsand mechanical behavior in an actomyosin motor. Biophys J 80, 379–397.
[214] Huang KP, Itarte E, Singh TJ & Akatsuka A (1982) Phosphorylation of glyco-gen synthase by cyclic AMP-independent casein kinase-2 from rabbit skeletalmuscle. J Biol Chem 257, 3236–3242.
[215] Embi N, Rylatt DB & Cohen P (1979) Glycogen synthase kinase-2 and phos-phorylase kinase are the same enzyme. Eur J Biochem 100, 339–347.
Stellenbosch University http://scholar.sun.ac.za
BIBLIOGRAPHY 263
[216] Hemmings HC, Nairn AC & Greengard P (1984) DARPP-32, a dopamine- andadenosine 3’:5’-monophosphate- regulated neuronal phosphoprotein. II. Com-parison of the kinetics of phosphorylation of DARPP-32 and phosphatase in-hibitor 1. J Biol Chem 259, 14491–14497.
[217] Foulkes JG & Cohen P (1980) The regulation of glycogen metabolism. Purifi-cation and properties of protein phosphatase inhibitor-2 from rabbit skeletalmuscle. Eur J Biochem 105, 195–203.
[218] Nimmo GA & Cohen P (1978) The regulation of glycogen metabolism. Phos-phorylation of inhibitor-1 from rabbit skeletal muscle, and its interaction withprotein phosphatase-III and -II. Eur J Biochem 87, 353–365.
[219] Ingebritsen TS, Stewart AA & Cohen P (1983) The protein phosphatases in-volved in cellular regulation. 6. Measurement of type-1 and type-2 proteinphosphatases in extracts of mammalian tissues; an assessment of their physi-ological roles. Eur J Biochem 132, 297–307.
[220] Shacter E, Chock PB & Stadtman ER (1984) Energy consumption in a cyclicphosphorylation/dephosphorylation cascade. J Biol Chem 259, 12260–12264.
[221] Foulkes JG, Strada SJ, Henderson PJF & Cohen P (1983) A Kinetic Anal-ysis of the Effects of Inhibitor-1 and Inhibitor-2 on the Activity of ProteinPhosphatase-1. Eur J Biochem 132, 309–313.
[222] Krebs EG, Love DS, Bratvold GE, Trayser KA, Meyer WL & Fischer EH (1964)Purification and properties of rabbit skeletal muscle phosphorylase b kinase.Biochemistry 3, 1022–1033.
[223] Wang ZX, Cheng Q & Killilea SD (1995) A continuous spectrophotometric as-say for phosphorylase kinase. Anal Biochem 230, 55–61.
[224] Meinke MH & Edstrom RD (1991) Muscle glycogenolysis. Regulation of thecyclic interconversion of phosphorylase a and phosphorylase b. J Biol Chem266, 2259–2266.
[225] Bergamini C, Signorini M, Ferrari C & Dallocchio F (1983) Non-Michaeliankinetics of rabbit muscle uridine diphosphoglucose pyrophosphorylase. ArchBiochem Biophys 227, 397–405.
Stellenbosch University http://scholar.sun.ac.za
BIBLIOGRAPHY 264
[226] Daly ME, Vale C, Walker M, Littlefield A, Alberti KG & Mathers JC (1998)Acute effects on insulin sensitivity and diurnal metabolic profiles of a high-sucrose compared with a high-starch diet. Am J Clin Nutr 67, 1186–1196.
[227] Keppler D, Rudiger J & Decker K (1970) Enzymatic determination of uracilnucleotides in tissues. Anal Biochem 38, 105–114.
[228] Olivier BG, Rohwer JM & Hofmeyr JHS (2005) Modelling cellular systems withPySCeS. Bioinformatics 21, 560–561.
[229] Kacser H (1983) The control of enzyme systems in vivo: elasticity analysis ofthe steady state. Biochem Soc Trans 11, 35–40.
[230] Fell DA & Sauro HM (1985) Metabolic control and its analysis. Additional re-lationships between elasticities and control coefficients. Eur J Biochem 561, 555–561.
[231] Hofmeyr JHS & Rohwer JM (2011) Supply-demand analysis: a framework forexploring the regulatory design of metabolism. Methods Enzymol 500, 533–554.
[232] Rohwer JM & Hofmeyr JHS (2008) Identifying and characterising regulatorymetabolites with generalised supply-demand analysis. J Theor Biol 252, 546–554.
[233] Schuster S, Kahn D & Westerhoff HV (1993) Modular analysis of the control ofcomplex metabolic pathways. Biophys Chem 48, 1–17.
[234] Hofmeyr JHS & Cornish-Bowden A (1996) Co-response analysis: a new exper-imental strategy for metabolic control analysis. J Theor Biol 182, 371–380.
[235] Wasserman DH & Fueger PT (2006) Point-Counterpoint: Glucose phosphory-lation is/is not a significant barrier to muscle glucose uptake by the workingmuscle. J Appl Physiol 101, 1803–1805.
[236] Ploug T & Vinten J (2006) Counterpoint: Glucose phosphorylation is not asignificant barrier to glucose uptake by the working muscle. J Appl Physiol 101,1805–1806.
[237] Beavo JA, Bechtel PJ & G KE (1974) Activation of protein kinase by physiolog-ical concentrations of cyclic AMP. Proc Natl Acad Sci USA 71, 3580–3583.
Stellenbosch University http://scholar.sun.ac.za
BIBLIOGRAPHY 265
[238] Parker PJ, Caudwell FB & Cohen P (1983) Glycogen synthase from rabbit skele-tal muscle; effect of insulin on the state of phosphorylation of the seven phos-phoserine residues in vivo. Eur J Biochem 130, 227–234.
[239] DeFronzo RA, Tobin JD & Andres R (1979) Glucose clamp technique: a methodfor quantifying insulin secretion and resistance. Am J Physiol Endocrinol Metab237, E214–E223.
[240] Rossetti L & Giaccari A (1990) Relative contribution of glycogen synthesis andglycolysis to insulin-mediated glucose uptake. A dose-response euglycemicclamp study in normal and diabetic rats. J Clin Invest 85, 1785–1792.
[241] Rossetti L & Hu M (1993) Skeletal muscle glycogenolysis is more sensitiveto insulin than is glucose transport/phosphorylation. Relation to the insulin-mediated inhibition of hepatic glucose production. J Clin Invest 92, 2963–2974.
[242] Farrace S & Rossetti L (1992) Hyperglycemia markedly enhances skeletal mus-cle glycogen synthase activity in diabetic, but not in normal conscious rats.Diabetes 41, 1453–1463.
[243] Kruszynska YT, Home PD & Alberti KGMM (1986) In vivo regulation of liverand skeletal muscle glycogen synthase activity by glucose and insulin. Diabetes35, 662–667.
[244] Mandarino LJ, Consoli A, Jain A & Kelley DE (1993) Differential regulation ofintracellular glucose metabolism by glucose and insulin in human muscle. AmJ Physiol Endocrinol Metab 265, E898–E905.
[245] Brady MJ (2010) Allosteric trumps covalent in the control of glycogen synthe-sis. Cell Metab 12, 428–430.
[246] Atkinson DE (1968) The energy charge of the adenylate pool as a regulatoryparameter. Interaction with feedback modifiers. Biochemistry 7, 4030–4034.
[247] Bailey JM & Whelan WJ (1972) The roles of glucose and AMP in regulatingthe conversion of phosphorylase a into phosphorylase b. Biochem Biophys ResCommun 46, 191–197.
[248] Wang ZX (1999) Influence of substrates on in vitro dephosphorylation of glyco-gen phosphorylase a by protein phosphatase-1. Biochem J 341, 545–554.
Stellenbosch University http://scholar.sun.ac.za
BIBLIOGRAPHY 266
[249] Holmes PA & Mansour TE (1968) Glucose as regulator of glycogen phospho-rylase in rat diaphragm. II. Effect of glucose and related compounds on phos-phorylase phosphatase. Biochim Biophys Acta 156, 275–284.
[250] Young AA, Mott DM, Stone K & Cooper GJS (1991) Amylin activates glycogenphosphorylase in the isolated soleus of the rat. FEBS Lett 281, 149–151.
[251] Baque S, Guinovart JJ & Gomez-Foix AM (1996) Overexpression of muscleglycogen phosphorylase in cultured human muscle fibers causes increasedglucose consumption and nonoxidative disposal. J Biol Chem 271, 2594–2598.
[252] McBride A & Hardie DG (2009) AMP-activated protein kinase–a sensor ofglycogen as well as AMP and ATP? Acta Physiol 196, 99–113.
[253] Danforth WH (1965) Glycogen synthase activity in skeletal muscle: Intercon-version of two forms and control of glycogen synthesis. J Biol Chem 240, 588–593.
[254] McBride A, Ghilagaber S, Nikolaev A & Hardie DG (2009) The glycogen-binding domain on the AMPK beta subunit allows the kinase to act as a glyco-gen sensor. Cell Metab 9, 23–34.
[255] Morita JI & Yasui T (1978) Purification and some properties of a neutral musclepyrophosphatase. Journal of Biochemistry 83, 719–726.
[256] Colomb MG, Cheruy A & Vignais PV (1972) Nucleoside diphosphokinasefrom beef heart cytosol. I. Physical and kinetic properties. Biochemistry 11,3370–3378.
[257] Cascante M & Martı E (1997) Organization and regulation of the metabolicfactory. In New beer in an old bottle: Edward Buchner and the growth of biochemicalknowledge (Cornish-Bowden A, ed.), 1897, pp. 199–214, Universitat de Valencia,Valencia.
[258] Fell DA & Thomas S (1995) Physiological control of metabolic flux: the require-ment for multisite modulation. Biochem J 311, 35–39.
[259] Hurleys JH, Deans AM, Thorsness PE, Koshland DE & Stroud RM (1990)Regulation of isocitrate dehydrogenase by phosphorylation involves no long-range conformational change in the free enzyme. J Biol Chem 265, 3599–3602.
Stellenbosch University http://scholar.sun.ac.za
BIBLIOGRAPHY 267
[260] Villar-Palasi C (1994) On the mechanism of inactivation of muscle glycogenphosphorylase by insulin. Biochim Biophys Acta 1224, 384–388.
[261] Cabrera ME, Saidel GM & Kalhan SC (1998) Role of O2 in regulation of lactatedynamics during hypoxia: mathematical model and analysis. Ann Biomed Eng26, 1–27.
[262] Dash RK, Dibella JA & Cabrera ME (2007) A computational model of skeletalmuscle metabolism linking cellular adaptations induced by altered loadingstates to metabolic responses during exercise. Biomed Eng Online 6, 14.
[263] Li Y, Solomon TPJ, Haus JM, Saidel GM, Cabrera ME & Kirwan JP (2010) Com-putational model of cellular metabolic dynamics: effect of insulin on glucosedisposal in human skeletal muscle. Am J Physiol Endocrinol Metab 298, E1198–E1209.
[264] Liu W, Hsin C & Tang F (2009) A molecular mathematical model of glucosemobilization and uptake. Math Biosci 221, 121–129.
[265] Xu K, Morgan KT, Todd Gehris A, Elston TC & Gomez SM (2011) A whole-body model for glycogen regulation reveals a critical role for substrate cyclingin maintaining blood glucose homeostasis. PLoS Comput Biol 7, e1002272.
[266] Rohwer JM, Hanekom AJ, Crous C, Snoep JL & Hofmeyr JHS (2006) Evalua-tion of a simplified generic bi-substrate rate equation for computational sys-tems biology. IEE Proc-Syst Biol 153, 338–341.
[267] Apweiler R, Bairoch A, Wu CH, Barker WC, Boeckmann B, Ferro S, GasteigerE, Huang H, Lopez R, Magrane M, Martin MJ, Natale DA, O’Donovan C,Redaschi N & Yeh LSL (2004) UniProt: the Universal Protein knowledgebase.Nucleic Acids Res 32, D115–D119.
[268] Itarte E & Huang KP (1979) Purification and properties of cyclic AMP-independent glycogen synthase kinase 1 from rabbit skeletal muscle. J BiolChem 254, 4052–4057.
[269] Woodgett JR & Cohen P (1984) Multisite phosphorylation of glycogen syn-thase. Molecular basis for the substrate specificity of glycogen synthase kinase-3 and casein kinase-II (glycogen synthase kinase-5). Biochim Biophys Acta 788,339–347.
Stellenbosch University http://scholar.sun.ac.za
BIBLIOGRAPHY 268
[270] Illg D & Pette D (1979) Turnover rates of hexokinase I, phosphofructokinase,pyruvate kinase and creatine kinase in slow-twitch soleus muscle and heart ofthe rabbit. Eur J Biochem 97, 267–273.
[271] Soderling TR, Srivastava AK, Bass MA & Khatra BS (1979) Phosphorylationand inactivation of glycogen synthase by phosphorylase kinase. Proc Natl AcadSci USA 76, 2536–2540.
[272] Gratecos D, Detwiler TC, Hurd S & Fischer EH (1977) Rabbit muscle phospho-rylase phosphatase. 1. Purification and chemical properties. Biochemistry 16,4812–4817.
[273] Ingebritsen TS & Cohen P (1983) The protein phosphatases involved in cellularregulation. 1. Classification and substrate specificities. Eur J Biochem 132, 255–261.
[274] Rush JWE & Spriet LL (2001) Skeletal muscle glycogen phosphorylase akinet-ics: effects of adenine nucleotides and caffeine. J Appl Physiol 91, 2071–2078.
[275] Melpidou AE & Oikonomakos NG (1983) Effect of glucose-6-P on the catalyticand structural properties of glycogen phosphorylase a. FEBS Lett 154, 105–110.
[276] Madsen NB & Shechosky S (1967) Allosteric properties of phosphorylase b. II.Comparison with a kinetic model. J Biol Chem 242, 3301–3307.
[277] Oikonomakos NG, Zographos SE, Johnson LN, Papageorgiou AC & AcharyaKR (1995) The binding of 2-deoxy-D-glucose 6-phosphate to glycogen phos-phorylase b: kinetic and crystallographic studies. J Mol Biol 254, 900–917.
Stellenbosch University http://scholar.sun.ac.za