Embed Size (px)
Citation preview
The Regulatory Effi ciency of the CCMA:A Statistical Analysis of the CCMA’s CMS Database
Paul BenjaminDirector
Cheadle Thompson & Haysom [email protected]
and
Carola GruenUniversity of the Witwatersrand
Development Policy Research Unit June 2006 DPRU Working Paper 06/110 ISBN: 1-920055-29-0
Acknowledgement
This Working Paper is one in a series emanating from the SMME project, within the
Employment Promotion Programme, which is aimed at Understanding the Regulatory
Environment for Small Business in South Africa. The DPRU are the Programme
Managers of this DFID funded project whose goal is to promote an enabling environment
for employment creation in South Africa, and to contribute to the Government’s goal of
reducing unemployment.
Development Policy Research Unit Tel: +27 21 650 5705Fax: +27 21 650 5711
Information about our Working Papers and other published titles are available on our website at:http://www.commerce.uct.ac.za/dpru/
Table of Contents
1. Introduction..................................................................................................1
2. Purpose of this Study...................................................................................2
3. CCMA Database..............................................................................................3
4. Overview of CCMA Caseload......................................................................5
5. Unfair Dismissals and Unfair Labour Practices........................................17
6. Hearings, Conciliation, Artbitration and Con-Arb.......................................27
7. Outcome of Dismissal Cases.......................................................................30
8. Indicators of Administrative Effi ciency......................................................38
9. Data not Refl ected in CMS............................................................................58
10. Conclusion....................................................................................................62
11. References....................................................................................................64
12. Statistical Annex..........................................................................................66
Abstract
The study involves a statistical analysis of the case management system (CMS) database
of the Commission for Conciliation Mediation and Arbitration (CCMA) for the fi nancial
years 2001/2, 2003/4 and 2004/5. It focuses on statistical indicators that shed light on the
administrative effi ciency of the CCMA and the outcome of proceedings at the CCMA as a
basis for assessing its regulatory effi ciency in respect of resolving unfair dismissals and
unfair labour practices.
The study concludes that there are marked differences in patterns of dispute resolution
and the outcome of disputes in the CCMA’s different provincial regions. These regional
variations are signifi cantly greater than those between different economic sectors. A
closer scrutiny of these differences contributed to an improved understanding of the
successes and failures of the CCMA.
The CMS database on which the study is based is designed for case management
purposes and this orientation is refl ected in the information contained in the database.
Accordingly, key information required for assessing effi ciency of the CCMA and to inform
policy decisions is not contained in the CMS database and consideration should be given
to expanding the database for these purposes.
The Regulatory Effi ciency of the CCMA: A Statistical Analysis of the CCMA’s CMS Database
1
1. Introduction
The Commission for Conciliation, Mediation and Arbitration (CCMA) was established as
a new dispute resolution body in November 1996. Its main objective is to ensure the swift
and expeditious resolution of employment disputes. Since its establishment, the number
of cases referred to the CCMA has increased substantially (Annual Reports, 1996-2004).
The overwhelming majority of cases concern unfair dismissal, followed by unfair labour
practice, collective bargaining and severance pay.
The establishment of the CCMA raised a number of expectations. Firstly, it was hoped
that disputes could be resolved more effectively and that the national settlement rate
would increase therefore reducing the incidence of strikes and lockouts (CCMA, 2005).
Secondly, by providing comprehensive guidelines and training it was hoped that both
employers and employees would learn about the correct procedures and code of conducts
which ultimately should result in a lower caseload for the CCMA.
Since the CCMA took over responsibility, the national settlement rate has been relatively
high and stable at more than 70 per cent. Compared to the previous bodies (Conciliation
Boards and Industrial Court), the CCMA performs much more effectively in this regard
and clearly contributes to sound labour and industrial relations within the South African
economy. Strike statistics show a signifi cant decline in levels of industrial action.The report assessing of the fi rst decade of democracy Towards a Ten-Year Review describes the achievement of South Africa’s post-apartheid labour market regime in the following terms
“South Africa has made great strides in introducing and amending labour laws
that give employers and employees certainty and security in their employment
relationship. The huge fall in person-strike-days bears testimony to the
success of the policy. The balance between the degree of job security and
the kind of labour market fl exibility that encourages employers to take on new
employees is still being negotiated amongst the economic role-players.” (at 39.)
DPRU WP 06/110 Paul Benjamin and Carola Gruen
2
2. Purpose of this Study
The purpose of the study is to undertake a statistical analysis of the database of the
CCMA to seek to understand patterns of dispute referral, settlement and determination
regionally, sectorally and historically. This study is exploratory seeking to ascertain what
light can be thrown on the debate surrounding the CCMA and in particular, its impact
upon SMMEs, by an analysis of the CCMA’s database. The study focuses primarily on
unfair dismissal as the major category of disputes referred to the CCMA.
The study compares the fi gures from the CMS in respect of three completed years:
2001/2002, 2003/4 and 2004/2005. The choice of these particular fi nancial years is
signifi cant in that:
signifi cant amendments to the Labour Relations Act altered the
operation of the CCMA and introduced a new set of CCMA rules came
into effect on 1 August 2002. The fi nancial years chosen therefore
offer the possibility of a ‘before and after’ comparison in respect of the
changes introduced by the 2002 Amendments;
three other signifi cant changes in the labour law regime which may
have impacted on the number of disputes referred to the CCMA also
occurred during this period:
(i) the fi rst sectoral determination under the Basic Conditions
of Employment Act for domestic workers came into effect on
15 August 2002;
(ii) the fi rst sectoral determination under the Basic Conditions
of Employment Act for farmworkers came into effect on 2
December 2002;
(iii) the Unemployment Insurance Act of 2001 came into effect
on 1 April 2002.
a)
b)
The Regulatory Effi ciency of the CCMA: A Statistical Analysis of the CCMA’s CMS Database
3
3. CCMA Database
The CCMA has, from its inception, operated an electronic case management system
(CMS). Each dispute referred to the CCMA is recorded and entered into this database.
There are a number of mandatory fi elds in CMS which must be fi lled in respect of every
case. The Mandatory fi elds are:
Case creation date
Issue occurred date
District of origin
Jurisdiction state
Number affected in workplace
Sector
Industry
Locality (e.g Johannesburg)
Province/region
All party details (name, contact details)
Issue
Arbitration referral form date
Process
Outcome
Award in favour of
Award date
a)
b)
c)
d)
e)
f)
g)
h)
i)
j)
k)
l)
m)
n)
o)
p)
DPRU WP 06/110 Paul Benjamin and Carola Gruen
4
This information is recorded at the point when the dispute is fi rst referred to the CCMA and
updated as the dispute progresses through the CCMA. The major source of information
for these reports is the applicant who in the case of dismissal disputes is the employee
concerned. The CMS allows for the accurate tracking of the progress of disputes within
the CCMA.
The CCMA produces an annual Review of Operations analysing the data contained in the
CMS. The Review disaggregates the data on a regional basis allowing for a comparison
of the operation of the CCMA’s different regional offi ces.
In addition, the CCMA maintains monthly dispute resolution reports. These reports include
certain information not included in the CMS including the number of review applications
launched in the Labour Court in respect of CCMA awards.
In respect of the total caseload of the CCMA, the fi gures retrieved from the CCMA
database match the offi cial numbers remarkably well: the difference in 2001/02 is
practically negligible and in 2004/05 it amounts to less than 1.5 per cent.
The Regulatory Effi ciency of the CCMA: A Statistical Analysis of the CCMA’s CMS Database
5
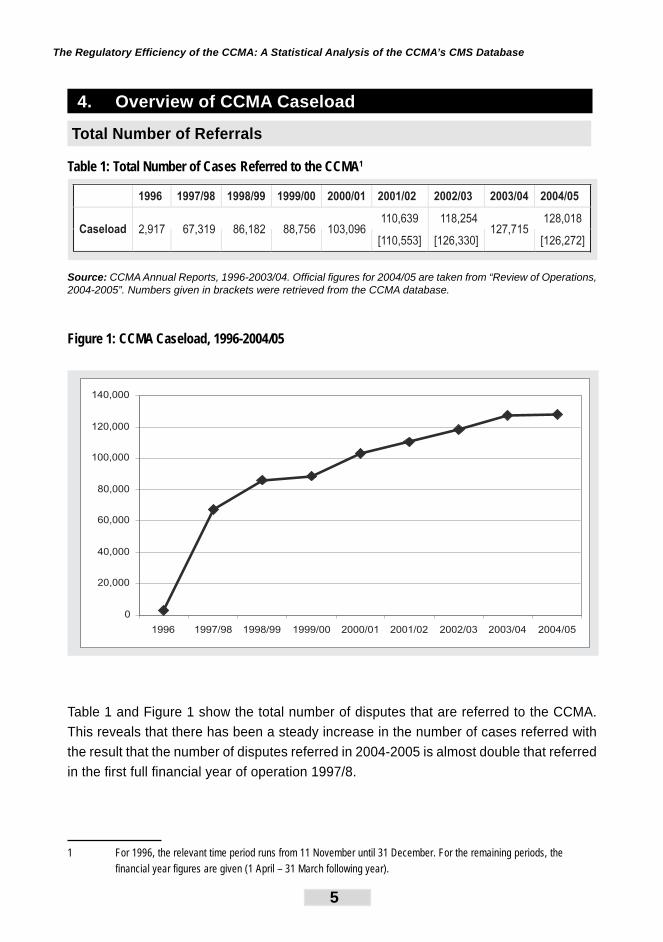
4. Overview of CCMA Caseload
Total Number of Referrals
Table 1: Total Number of Cases Referred to the CCMA1
1996 1997/98 1998/99 1999/00 2000/01 2001/02 2002/03 2003/04 2004/05
110,639 118,254 128,018Caseload 2,917 67,319 86,182 88,756 103,096
[110,553] [126,330]127,715
[126,272]
Source: CCMA Annual Reports, 1996-2003/04. Offi cial fi gures for 2004/05 are taken from “Review of Operations, 2004-2005”. Numbers given in brackets were retrieved from the CCMA database.
Figure 1: CCMA Caseload, 1996-2004/05
0
20,000
40,000
60,000
80,000
100,000
120,000
140,000
1996 1997/98 1998/99 1999/00 2000/01 2001/02 2002/03 2003/04 2004/05
Table 1 and Figure 1 show the total number of disputes that are referred to the CCMA.
This reveals that there has been a steady increase in the number of cases referred with
the result that the number of disputes referred in 2004-2005 is almost double that referred
in the fi rst full fi nancial year of operation 1997/8.
1 For 1996, the relevant time period runs from 11 November until 31 December. For the remaining periods, the
financial year figures are given (1 April – 31 March following year).
DPRU WP 06/110 Paul Benjamin and Carola Gruen
6
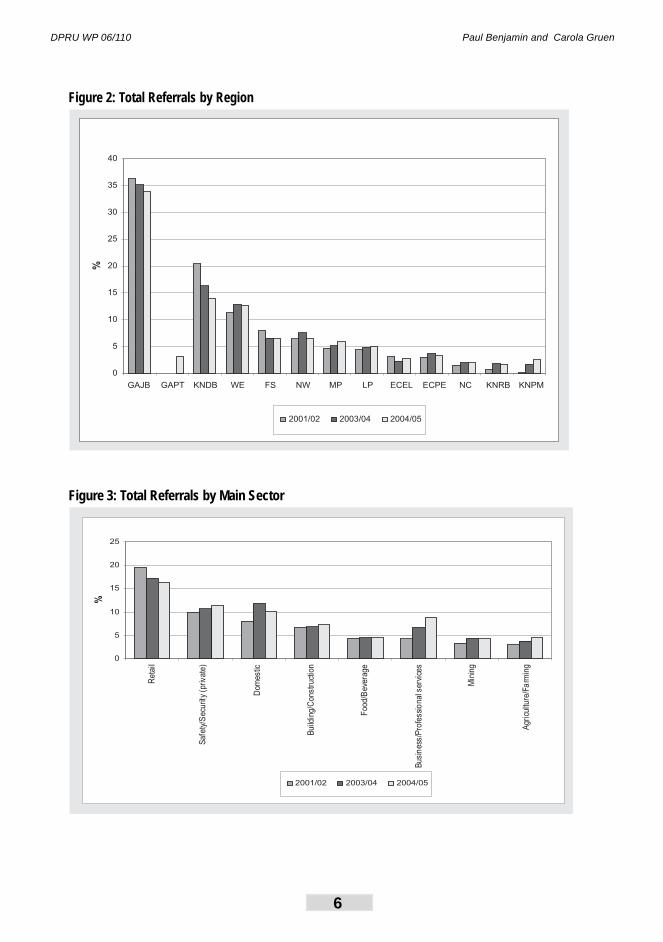
Figure 2: Total Referrals by Region
0
5
10
15
20
25
30
35
40
GAJB GAPT KNDB WE FS NW MP LP ECEL ECPE NC KNRB KNPM
%
2001/02 2003/04 2004/05
Figure 3: Total Referrals by Main Sector
0
5
10
15
20
25
Reta
il
Safe
ty/S
ecu
rity
(priv
ate
)
Dom
estic
Build
ing/C
onstr
uct
ion
Food/B
eve
rage
Busin
ess
/Pro
fessi
onals
erv
ices
Min
ing
Agri
culture
/Fa
rmin
g
%
2001/02 2003/04 2004/05
The Regulatory Effi ciency of the CCMA: A Statistical Analysis of the CCMA’s CMS Database
7
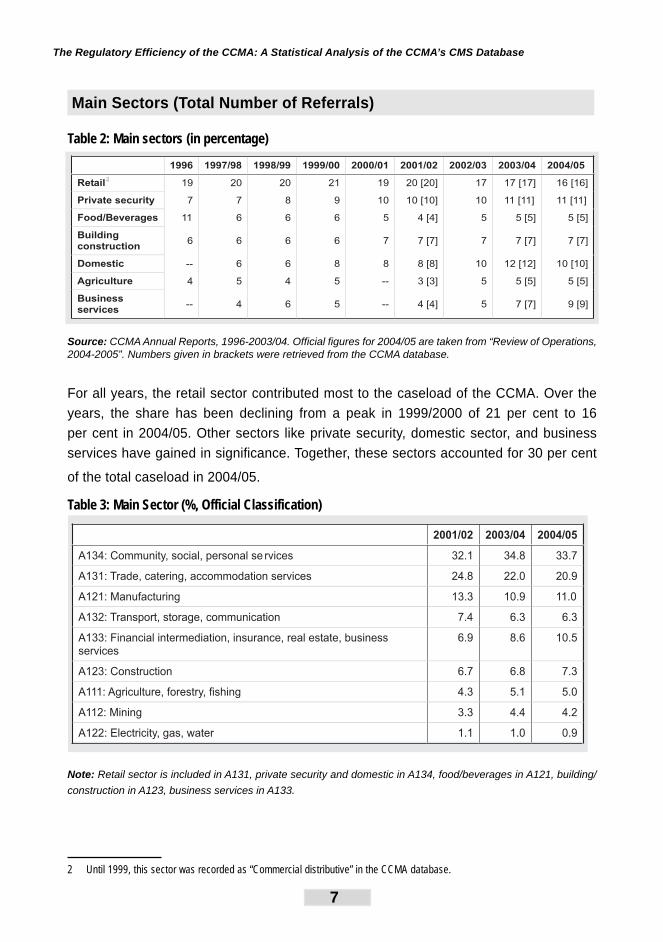
Main Sectors (Total Number of Referrals)
Table 2: Main sectors (in percentage)2
1996 1997/98 1998/99 1999/00 2000/01 2001/02 2002/03 2003/04 2004/05
Retail2
19 20 20 21 19 20 [20] 17 17 [17] 16 [16]
Private security 7 7 8 9 10 10 [10] 10 11 [11] 11 [11]
Food/Beverages 11 6 6 6 5 4 [4] 5 5 [5] 5 [5]
Building
construction6 6 6 6 7 7 [7] 7 7 [7] 7 [7]
Domestic -- 6 6 8 8 8 [8] 10 12 [12] 10 [10]
Agriculture 4 5 4 5 -- 3 [3] 5 5 [5] 5 [5]
Business
services-- 4 6 5 -- 4 [4] 5 7 [7] 9 [9]
Source: CCMA Annual Reports, 1996-2003/04. Offi cial fi gures for 2004/05 are taken from “Review of Operations, 2004-2005”. Numbers given in brackets were retrieved from the CCMA database.
For all years, the retail sector contributed most to the caseload of the CCMA. Over the
years, the share has been declining from a peak in 1999/2000 of 21 per cent to 16
per cent in 2004/05. Other sectors like private security, domestic sector, and business
services have gained in signifi cance. Together, these sectors accounted for 30 per cent
of the total caseload in 2004/05.
Table 3: Main Sector (%, Official Classification)
2001/02 2003/04 2004/05
A134: Community, social, personal se rvices 32.1 34.8 33.7
A131: Trade, catering, accommodation services 24.8 22.0 20.9
A121: Manufacturing 13.3 10.9 11.0
A132: Transport, storage, communication 7.4 6.3 6.3
A133: Financial intermediation, insurance, real estate, business
services
6.9 8.6 10.5
A123: Construction 6.7 6.8 7.3
A111: Agriculture, forestry, fishing 4.3 5.1 5.0
A112: Mining 3.3 4.4 4.2
A122: Electricity, gas, water 1.1 1.0 0.9
Note: Retail sector is included in A131, private security and domestic in A134, food/beverages in A121, building/
construction in A123, business services in A133.
2 Until 1999, this sector was recorded as “Commercial distributive” in the CCMA database.
DPRU WP 06/110 Paul Benjamin and Carola Gruen
8
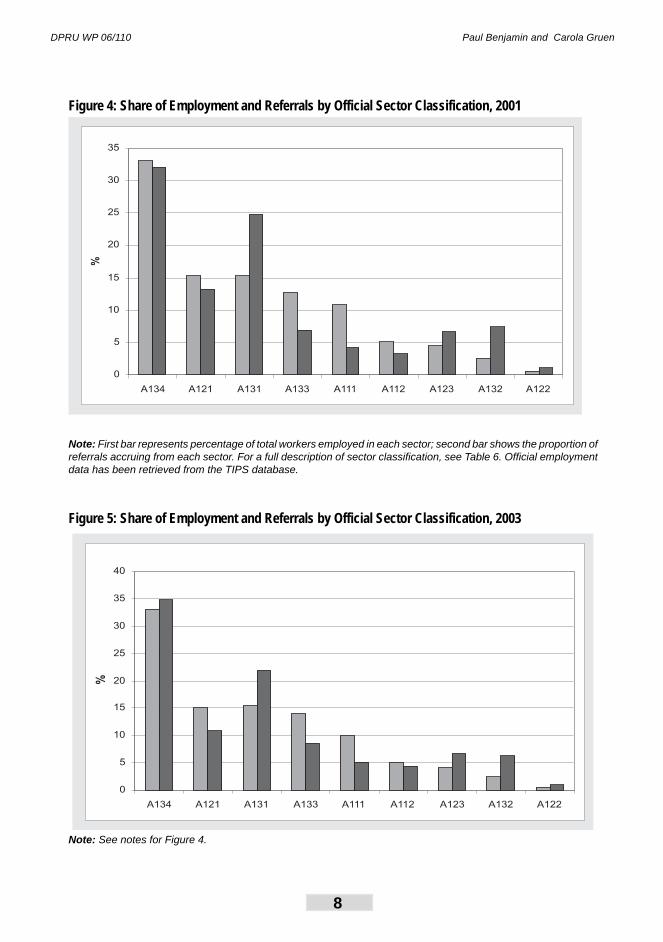
Figure 4: Share of Employment and Referrals by Official Sector Classification, 2001
0
5
10
15
20
25
30
35
A134 A121 A131 A133 A111 A112 A123 A132 A122
%
Note: First bar represents percentage of total workers employed in each sector; second bar shows the proportion of referrals accruing from each sector. For a full description of sector classifi cation, see Table 6. Offi cial employment data has been retrieved from the TIPS database.
Figure 5: Share of Employment and Referrals by Official Sector Classification, 2003
0
5
10
15
20
25
30
35
40
A134 A121 A131 A133 A111 A112 A123 A132 A122
%
Note: See notes for Figure 4.
The Regulatory Effi ciency of the CCMA: A Statistical Analysis of the CCMA’s CMS Database
9
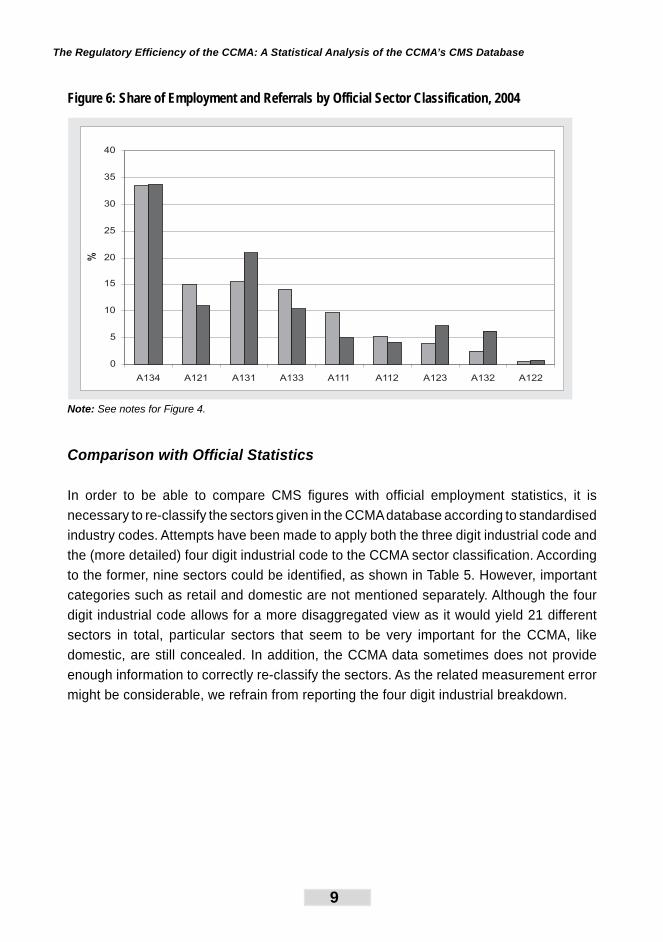
Figure 6: Share of Employment and Referrals by Official Sector Classification, 2004
0
5
10
15
20
25
30
35
40
A134 A121 A131 A133 A111 A112 A123 A132 A122
%
Note: See notes for Figure 4.
Comparison with Offi cial Statistics
In order to be able to compare CMS fi gures with offi cial employment statistics, it is
necessary to re-classify the sectors given in the CCMA database according to standardised
industry codes. Attempts have been made to apply both the three digit industrial code and
the (more detailed) four digit industrial code to the CCMA sector classifi cation. According
to the former, nine sectors could be identifi ed, as shown in Table 5. However, important
categories such as retail and domestic are not mentioned separately. Although the four
digit industrial code allows for a more disaggregated view as it would yield 21 different
sectors in total, particular sectors that seem to be very important for the CCMA, like
domestic, are still concealed. In addition, the CCMA data sometimes does not provide
enough information to correctly re-classify the sectors. As the related measurement error
might be considerable, we refrain from reporting the four digit industrial breakdown.
DPRU WP 06/110 Paul Benjamin and Carola Gruen
10
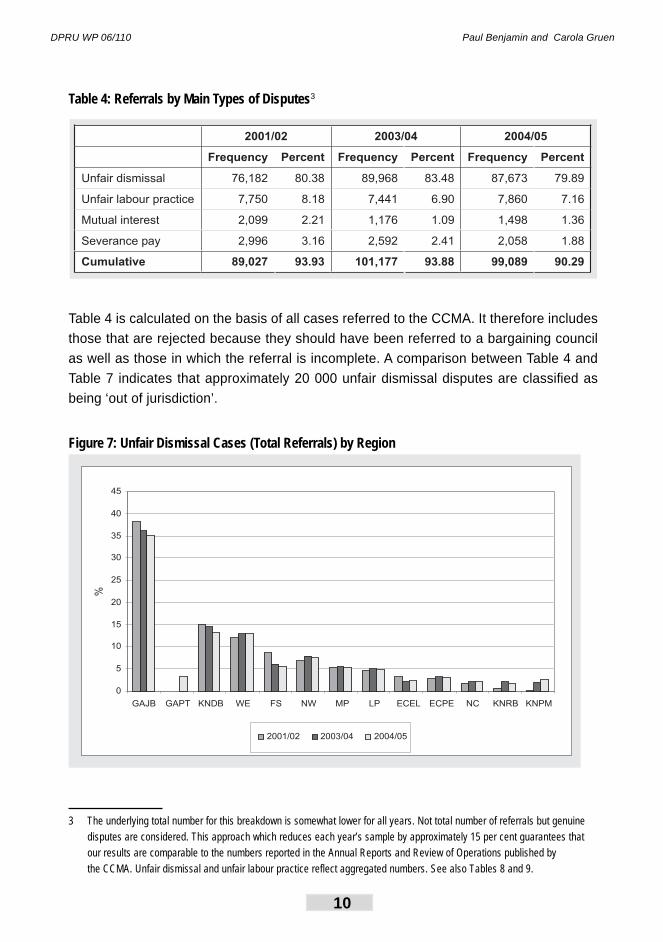
Table 4: Referrals by Main Types of Disputes3
Table 4 is calculated on the basis of all cases referred to the CCMA. It therefore includes
those that are rejected because they should have been referred to a bargaining council
as well as those in which the referral is incomplete. A comparison between Table 4 and
Table 7 indicates that approximately 20 000 unfair dismissal disputes are classifi ed as
being ‘out of jurisdiction’.
Figure 7: Unfair Dismissal Cases (Total Referrals) by Region
0
5
10
15
20
25
30
35
40
45
GAJB GAPT KNDB WE FS NW MP LP ECEL ECPE NC KNRB KNPM
%
2001/02 2003/04 2004/05
3 The underlying total number for this breakdown is somewhat lower for all years. Not total number of referrals but genuine
disputes are considered. This approach which reduces each year’s sample by approximately 15 per cent guarantees that
our results are comparable to the numbers reported in the Annual Reports and Review of Operations published by
the CCMA. Unfair dismissal and unfair labour practice reflect aggregated numbers. See also Tables 8 and 9.
2001/02 2003/04 2004/05
Frequency Percent Frequency Percent Frequency Percent
Unfair dismissal 76,182 80.38 89,968 83.48 87,673 79.89
Unfair labour practice 7,750 8.18 7,441 6.90 7,860 7.16
Mutual interest 2,099 2.21 1,176 1.09 1,498 1.36
Severance pay 2,996 3.16 2,592 2.41 2,058 1.88
Cumulative 89,027 93.93 101,177 93.88 99,089 90.29
The Regulatory Effi ciency of the CCMA: A Statistical Analysis of the CCMA’s CMS Database
11
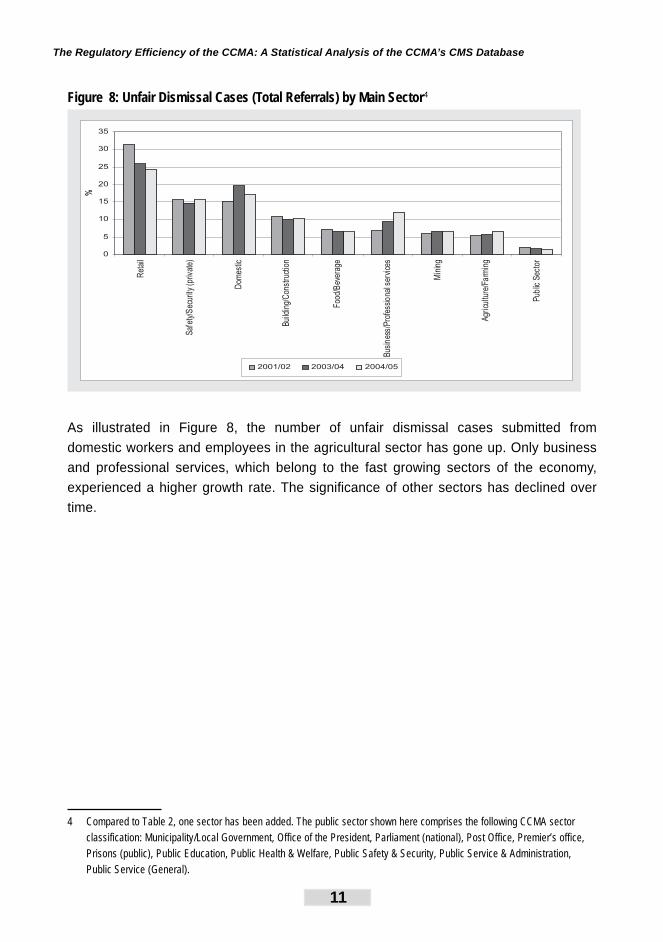
Figure 8: Unfair Dismissal Cases (Total Referrals) by Main Sector4
0
5
10
15
20
25
30
35
Ret
ail
Saf
ety/
Sec
urity
(priv
ate)
Dom
estic
Bui
ldin
g/C
onst
ruct
ion e
Foo
d/B
ever
ag
esB
usin
ess/
Pro
fsi
ona
lser
vice
s
Min
ing
Agr
icul
ture
/Fa
rmin
g
Pub
licS
ecto
r
%
2001/02 2003/04 2004/05
As illustrated in Figure 8, the number of unfair dismissal cases submitted from
domestic workers and employees in the agricultural sector has gone up. Only business
and professional services, which belong to the fast growing sectors of the economy,
experienced a higher growth rate. The signifi cance of other sectors has declined over
time.
4 Compared to Table 2, one sector has been added. The public sector shown here comprises the following CCMA sector
classification: Municipality/Local Government, Office of the President, Parliament (national), Post Office, Premier’s office,
Prisons (public), Public Education, Public Health & Welfare, Public Safety & Security, Public Service & Administration,
Public Service (General).
DPRU WP 06/110 Paul Benjamin and Carola Gruen
12
Comment: Domestic Workers and Agriculture
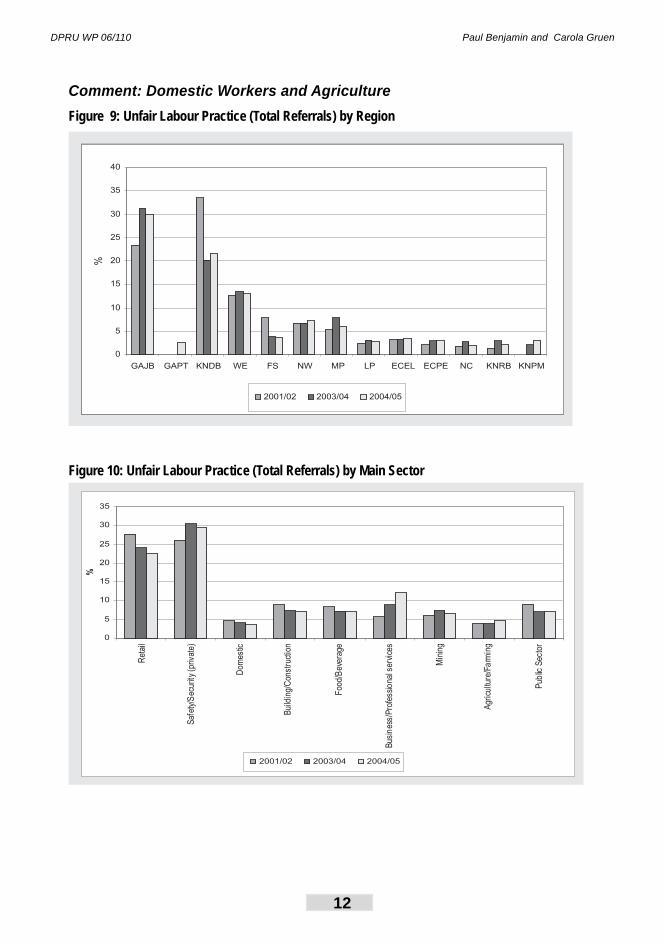
Figure 9: Unfair Labour Practice (Total Referrals) by Region
0
5
10
15
20
25
30
35
40
GAJB GAPT KNDB WE FS NW MP LP ECEL ECPE NC KNRB KNPM
%
2001/02 2003/04 2004/05
Figure 10: Unfair Labour Practice (Total Referrals) by Main Sector
Ret
ail
Saf
ety/
Sec
urity
(priv
ate)
Dom
estic
Bui
ldin
g/C
onst
ruct
ion e
Foo
d/B
eve
rag
esB
usin
ess/
Pro
fsi
ona
lse
rvic
es
Min
ing
Agr
icu
lture
/Fa
rmin
g
Pub
licS
ecto
r
0
5
10
15
20
25
30
35
%
2001/02 2003/04 2004/05
The Regulatory Effi ciency of the CCMA: A Statistical Analysis of the CCMA’s CMS Database
13
Cases out of Jurisdiction
Table 5: State of Jurisdiction, Total Numbers
2001/02 2003/04 2004/05
Frequency Percent Frequency Percent Frequency Percent
In 74,699 67.57 81,650 64.63 82,417 65.27
Out 35,822 32.40 44,612 35.31 43,720 34.62
Condonation pending 21 0.02 35 0.03 85 0.07
Unknown 10 0.01 33 0.03 50 0.04
Case closed 1 0.00 0 0 0 0
Total 110,553 100.0 126,330 100.0 126,272 100.0
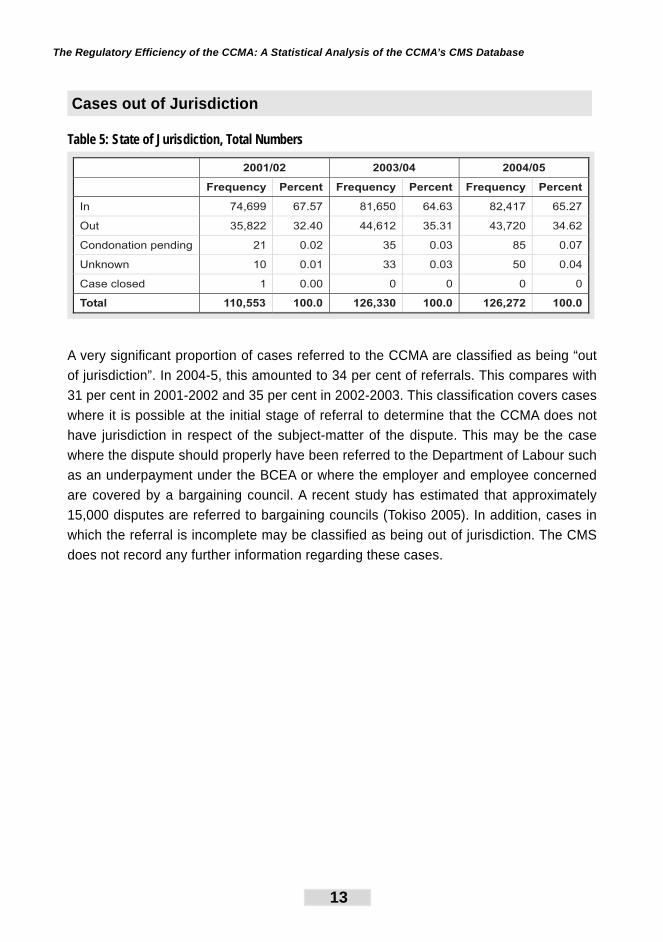
A very signifi cant proportion of cases referred to the CCMA are classifi ed as being “out
of jurisdiction”. In 2004-5, this amounted to 34 per cent of referrals. This compares with
31 per cent in 2001-2002 and 35 per cent in 2002-2003. This classifi cation covers cases
where it is possible at the initial stage of referral to determine that the CCMA does not
have jurisdiction in respect of the subject-matter of the dispute. This may be the case
where the dispute should properly have been referred to the Department of Labour such
as an underpayment under the BCEA or where the employer and employee concerned
are covered by a bargaining council. A recent study has estimated that approximately
15,000 disputes are referred to bargaining councils (Tokiso 2005). In addition, cases in
which the referral is incomplete may be classifi ed as being out of jurisdiction. The CMS
does not record any further information regarding these cases.
DPRU WP 06/110 Paul Benjamin and Carola Gruen
14
Figure 11: Out of Jurisdiction Cases by Region
0
10
20
30
40
50
60
GAJB GAPT KNDB WE FS NW MP LP ECEL ECPE NC KNRB KNPM
%
2001/02 2003/04 2004/05
The Regulatory Effi ciency of the CCMA: A Statistical Analysis of the CCMA’s CMS Database
15
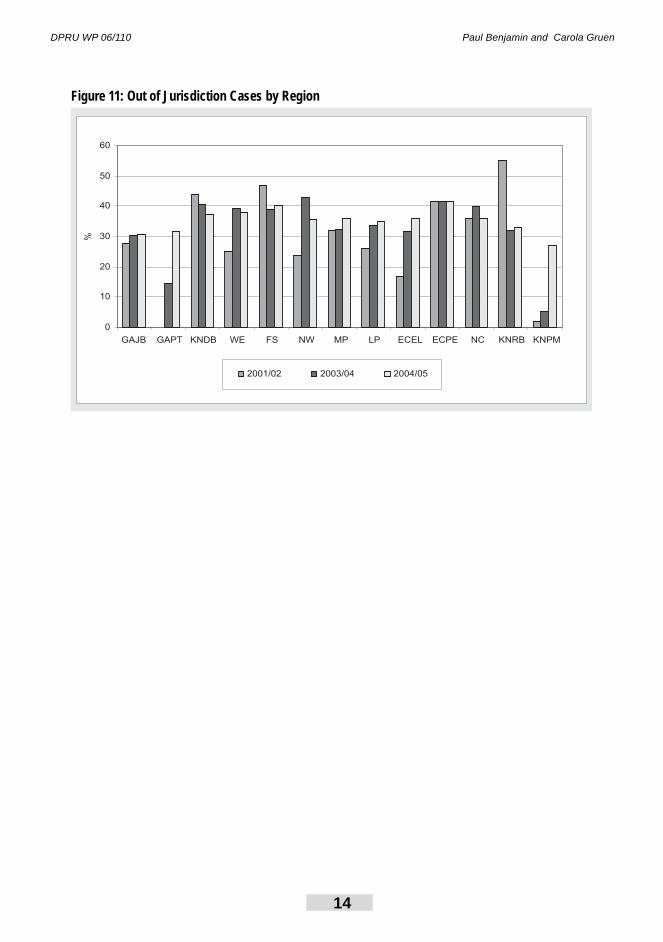
Regional Variation
In 2004-2005 the level of non-jurisdictional referrals in regions varied between 26 per
cent (PMB) and 40 per cent (EL, FS).
Figure 12: Out of Jurisdiction by Main Sector
Reta
il
Safe
ty/S
ecurity
(private
)
Dom
estic
Build
ing/C
on
str
uctio
n eF
oo
d/B
eve
rag
es
Bu
sin
ess/P
rof
sio
nalse
rvic
es
Min
ing
Agri
cu
lture
/Fa
rmin
g
0
10
20
30
40
50
%
2001/02 2003/04 2004/05
Sectoral Variation
There are signifi cant sectoral variations. For instance, in 2004-5, the highest rate
of “out of jurisdiction” referral are in sectors with bargaining councils (eg: metal 53%,
local government 41 per cent). The lowest rate of “out of jurisdiction” referrals are in
respect of “high tech” sectors such as computing (16 per cent), media (20 per cent) and
pharmaceutical (19 per cent). In a large sector with high levels of unskilled workers and
high levels of unionisation such as mining the rate is 29.75 per cent while in a sector with
a relatively low level of union density, such as agriculture, it is 27 per cent.
DPRU WP 06/110 Paul Benjamin and Carola Gruen
16
Comment
The referral of a large number of “out of jurisdiction” cases to the CCMA imposes a
considerable administrative burden on the CCMA. At the same time, the fact that such a
high proportion are screened out at the referral stage prevents these cases from consuming
more resources by being enrolled for conciliation or arbitration. One explanation is that
the CCMA enjoys a relatively high profi le compared to other dispute resolution agencies
such as the Department of Labour and bargaining councils. The screening out of “out of
jurisdiction “ cases must be viewed in conjunction with the number of in limine applications
being brought during proceedings discussed below.
Table 6: Open Cases
2001/02 2003/04 2004/05
Frequency Percent Frequency Percent Frequency Percent
Case closed 74,590 99.85 80,478 98.56 76,066 92.29
Outcome 53 0.07 534 0.65 3,044 3.69
Arrangement 31 0.04 311 0.38 1,776 2.15
Scheduled 21 0.03 271 0.33 1,200 1.46
Activated 4 0.01 56 0.07 331 0.40
Total 74,699 100.0 81,650 100.0 82,417 100.0
The CMS captures information about the status of disputes. The information is purely
administrative5. Cases are considered to be closed when the dispute has been settled
but can be opened again if a party decides to, for example, contest a particular ruling. If a
case has not been closed it is open either waiting to be scheduled or waiting to be closed
(Outcome) or to be “taken back to ‘Activated’ or ‘Arrangement’ to await rescheduling”
(Review of Operations, 2004/2005, p. 13).
5 Information given by the CCMA staff, 16 Aug 2005.
The Regulatory Effi ciency of the CCMA: A Statistical Analysis of the CCMA’s CMS Database
17
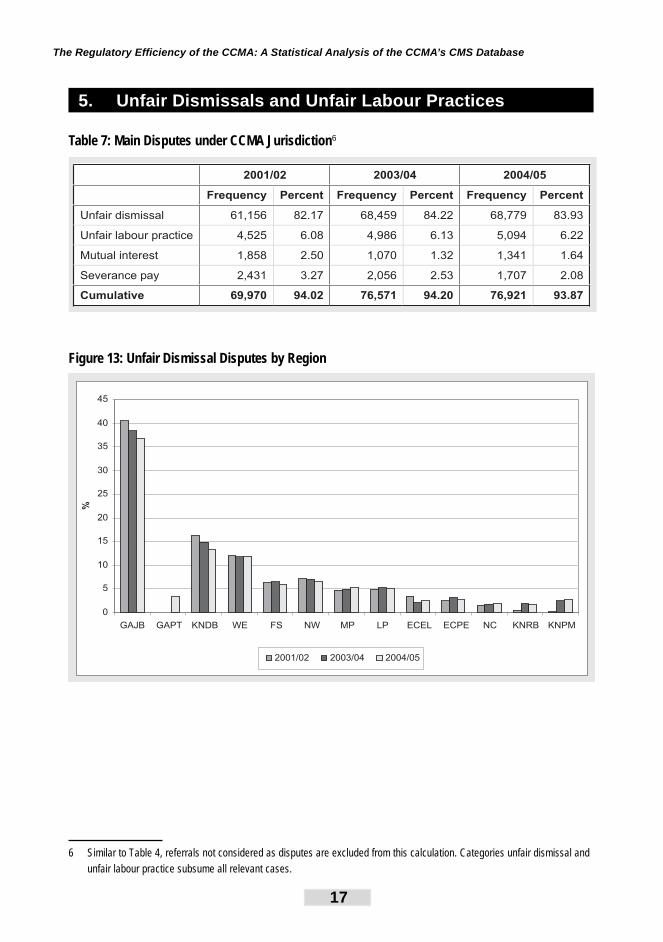
5. Unfair Dismissals and Unfair Labour Practices
Table 7: Main Disputes under CCMA Jurisdiction6
2001/02 2003/04 2004/05
Frequency Percent Frequency Percent Frequency Percent
Unfair dismissal 61,156 82.17 68,459 84.22 68,779 83.93
Unfair labour practice 4,525 6.08 4,986 6.13 5,094 6.22
Mutual interest 1,858 2.50 1,070 1.32 1,341 1.64
Severance pay 2,431 3.27 2,056 2.53 1,707 2.08
Cumulative 69,970 94.02 76,571 94.20 76,921 93.87
Figure 13: Unfair Dismissal Disputes by Region
0
5
10
15
20
25
30
35
40
45
GAJB GAPT KNDB WE FS NW MP LP ECEL ECPE NC KNRB KNPM
%
2001/02 2003/04 2004/05
6 Similar to Table 4, referrals not considered as disputes are excluded from this calculation. Categories unfair dismissal and
unfair labour practice subsume all relevant cases.
DPRU WP 06/110 Paul Benjamin and Carola Gruen
18
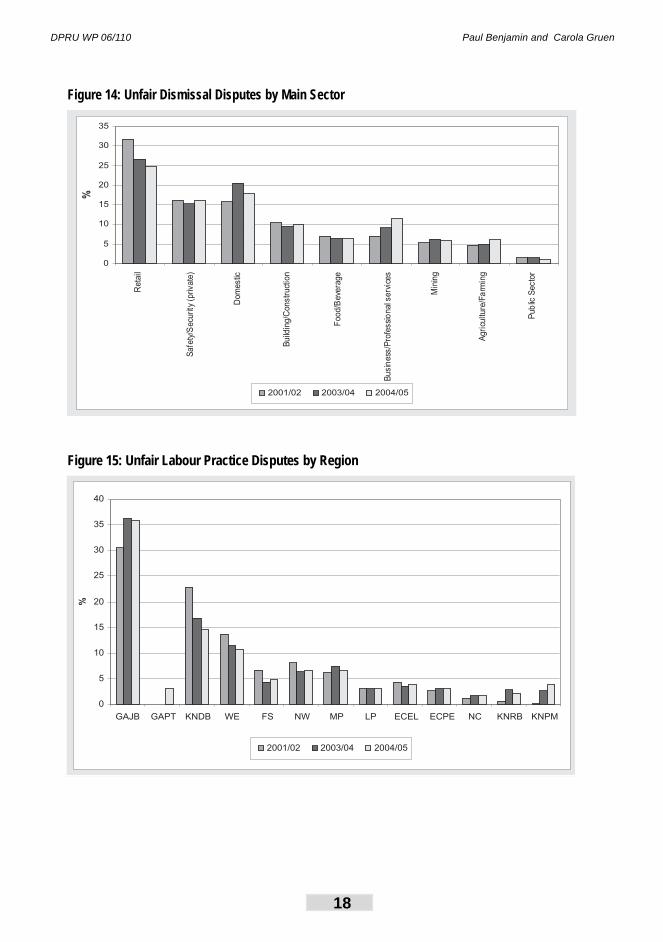
Figure 14: Unfair Dismissal Disputes by Main Sector
Reta
il
Safe
ty/S
ecurity
(private
)
Dom
estic
Build
ing/C
on
str
uctio
n eF
oo
d/B
eve
rag
es
Bu
sin
ess/P
rof
sio
nalse
rvic
es
Min
ing
Agri
cu
lture
/Fa
rmin
g
Pub
licS
ec
tor
0
5
10
15
20
25
30
35
%
2001/02 2003/04 2004/05
Figure 15: Unfair Labour Practice Disputes by Region
0
5
10
15
20
25
30
35
40
GAJB GAPT KNDB WE FS NW MP LP ECEL ECPE NC KNRB KNPM
%
2001/02 2003/04 2004/05
The Regulatory Effi ciency of the CCMA: A Statistical Analysis of the CCMA’s CMS Database
19
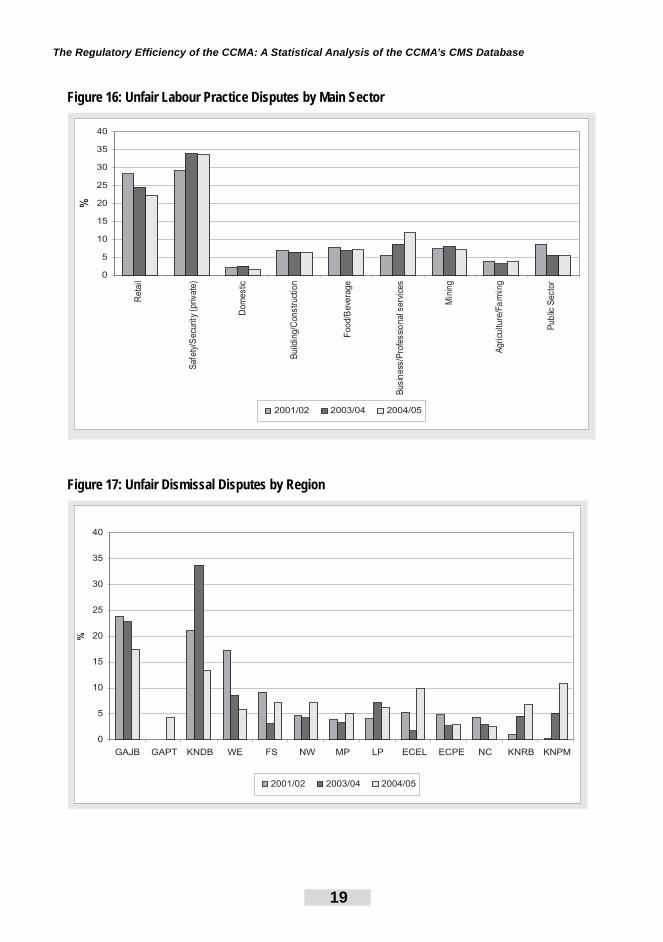
Figure 16: Unfair Labour Practice Disputes by Main Sector
Reta
il
Safe
ty/S
ecurity
(private
)
Dom
estic
Build
ing/C
on
str
uctio
n eF
oo
d/B
eve
rag
es
Bu
sin
ess/P
rof
sio
nalse
rvic
es
Min
ing
Agri
cu
lture
/Fa
rmin
g
Pub
licS
ec
tor
0
5
10
15
20
25
30
35
40
%
2001/02 2003/04 2004/05
Figure 17: Unfair Dismissal Disputes by Region
0
5
10
15
20
25
30
35
40
GAJB GAPT KNDB WE FS NW MP LP ECEL ECPE NC KNRB KNPM
%
2001/02 2003/04 2004/05
DPRU WP 06/110 Paul Benjamin and Carola Gruen
20
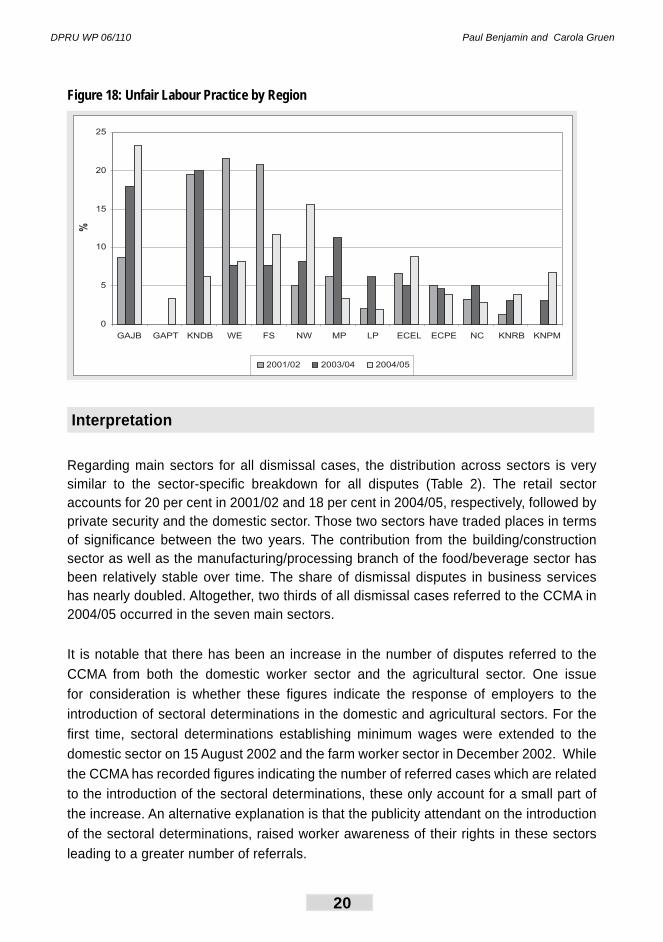
Figure 18: Unfair Labour Practice by Region
0
5
10
15
20
25
GAJB GAPT KNDB WE FS NW MP LP ECEL ECPE NC KNRB KNPM
%
2001/02 2003/04 2004/05
Interpretation
Regarding main sectors for all dismissal cases, the distribution across sectors is very similar to the sector-specifi c breakdown for all disputes (Table 2). The retail sector accounts for 20 per cent in 2001/02 and 18 per cent in 2004/05, respectively, followed by private security and the domestic sector. Those two sectors have traded places in terms of signifi cance between the two years. The contribution from the building/construction sector as well as the manufacturing/processing branch of the food/beverage sector has been relatively stable over time. The share of dismissal disputes in business services has nearly doubled. Altogether, two thirds of all dismissal cases referred to the CCMA in 2004/05 occurred in the seven main sectors.
It is notable that there has been an increase in the number of disputes referred to the
CCMA from both the domestic worker sector and the agricultural sector. One issue
for consideration is whether these fi gures indicate the response of employers to the
introduction of sectoral determinations in the domestic and agricultural sectors. For the
fi rst time, sectoral determinations establishing minimum wages were extended to the
domestic sector on 15 August 2002 and the farm worker sector in December 2002. While
the CCMA has recorded fi gures indicating the number of referred cases which are related
to the introduction of the sectoral determinations, these only account for a small part of
the increase. An alternative explanation is that the publicity attendant on the introduction
of the sectoral determinations, raised worker awareness of their rights in these sectors
leading to a greater number of referrals.
The Regulatory Effi ciency of the CCMA: A Statistical Analysis of the CCMA’s CMS Database
21
Further research would be required to ascertain whether the increase in the number of
dismissals in these two sectors is attributable to the introduction of sectoral determinations.
A 2004 paper concludes that the minimum wages for domestic workers are making a
difference despite substantial non-compliance and that fi gures show that hours of work
have decreased and earnings have increased without a negative employment response
(Hertz 2004).
An initial attempt is made to make a comparison between referrals of unfair labour
practices and unfair dismissal cases. This is done in the light of the argument advanced
by Halton Cheadle that there is “no need for the judicial regulation through the prohibition
of unfair labour practices of the selection decisions (hiring, training, promotion) and those
aspects of discipline short of dismissal (suspension, demotion and other disciplinary
measures)” (Cheadle 2005).
A comparison of Figures 14 and 16 indicates that there are signifi cant sectoral variation
in the referral of dismissal and unfair labour practice disputes. As might be expected,
unfair labour practice referrals are insignifi cant in the domestic sector. The share of unfair
labour practices referred by employees in safety/security (private) and the public sector is
signifi cantly higher than the share of dismissals referred from those sectors. This suggests
that a range of factors might contribute to the level of unfair labour practice referrals in a
particular sector.
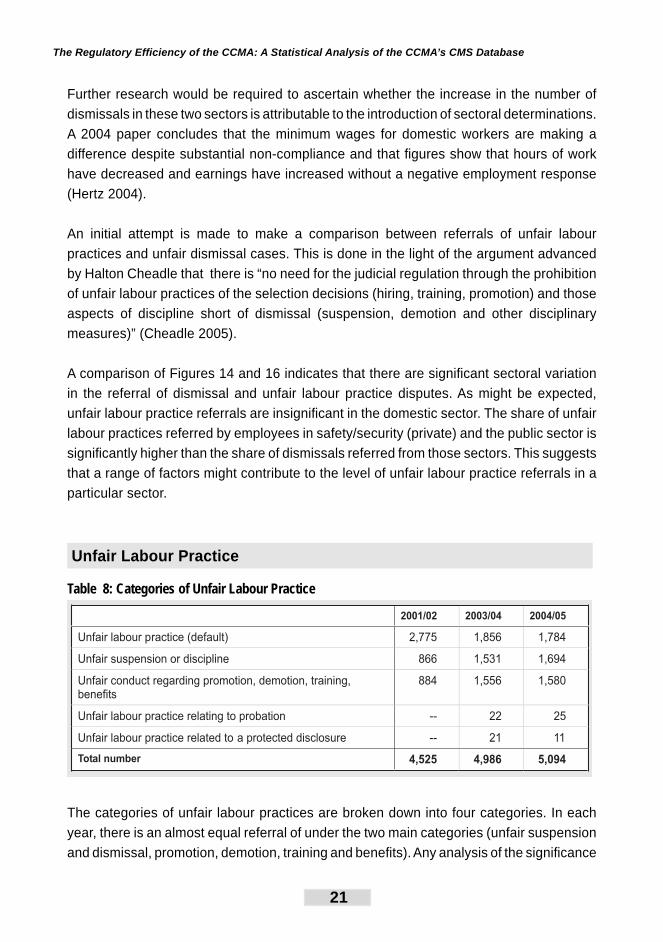
Unfair Labour Practice
Table 8: Categories of Unfair Labour Practice
2001/02 2003/04 2004/05
Unfair labour practice (default) 2,775 1,856 1,784
Unfair suspension or discipline 866 1,531 1,694
Unfair conduct regarding promotion, demotion, training,
benefits
884 1,556 1,580
Unfair labour practice relating to probation -- 22 25
Unfair labour practice related to a protected disclosure -- 21 11
Total number 4,525 4,986 5,094
The categories of unfair labour practices are broken down into four categories. In each
year, there is an almost equal referral of under the two main categories (unfair suspension
and dismissal, promotion, demotion, training and benefi ts). Any analysis of the signifi cance

DPRU WP 06/110 Paul Benjamin and Carola Gruen
22
of the unfair labour practice jurisdiction will require a further disaggregation of the data
within these broad categories.
The Regulatory Effi ciency of the CCMA: A Statistical Analysis of the CCMA’s CMS Database
23
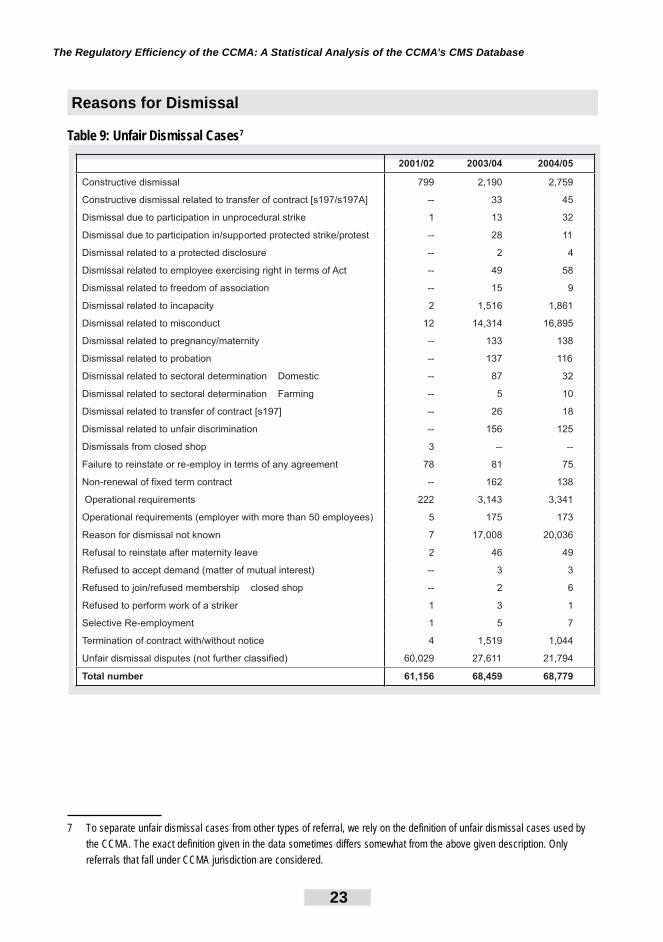
Reasons for Dismissal
Table 9: Unfair Dismissal Cases7
2001/02 2003/04 2004/05
Constructive dismissal 799 2,190 2,759
Constructive dismissal related to transfer of contract [s197/s197A] -- 33 45
Dismissal due to participation in unprocedural strike 1 13 32
Dismissal due to participation in/supported protected strike/protest -- 28 11
Dismissal related to a protected disclosure -- 2 4
Dismissal related to employee exercising right in terms of Act -- 49 58
Dismissal related to freedom of association -- 15 9
Dismissal related to incapacity 2 1,516 1,861
Dismissal related to misconduct 12 14,314 16,895
Dismissal related to pregnancy/maternity -- 133 138
Dismissal related to probation -- 137 116
Dismissal related to sectoral determination Domestic -- 87 32
Dismissal related to sectoral determination Farming -- 5 10
Dismissal related to transfer of contract [s197] -- 26 18
Dismissal related to unfair discrimination -- 156 125
Dismissals from closed shop 3 -- --
Failure to reinstate or re-employ in terms of any agreement 78 81 75
Non-renewal of fixed term contract -- 162 138
Operational requirements 222 3,143 3,341
Operational requirements (employer with more than 50 employees) 5 175 173
Reason for dismissal not known 7 17,008 20,036
Refusal to reinstate after maternity leave 2 46 49
Refused to accept demand (matter of mutual interest) -- 3 3
Refused to join/refused membership closed shop -- 2 6
Refused to perform work of a striker 1 3 1
Selective Re-employment 1 5 7
Termination of contract with/without notice 4 1,519 1,044
Unfair dismissal disputes (not further classified) 60,029 27,611 21,794
Total number 61,156 68,459 68,779
7 To separate unfair dismissal cases from other types of referral, we rely on the definition of unfair dismissal cases used by
the CCMA. The exact definition given in the data sometimes differs somewhat from the above given description. Only
referrals that fall under CCMA jurisdiction are considered.
DPRU WP 06/110 Paul Benjamin and Carola Gruen
24
The table shows that there has been a signifi cant change in method of recording. In
2003/4 and 2004/05, a number of new categories have been added to the database.
Specifi c reasons for a dismissal have been recorded in a greater number of cases.
However, a signifi cant number of cases are still recorded merely as unfair dismissals.
For this reason, no meaningful comparison can be made between the years in respect of
specifi c sub-categories.
Also, it is important to note how the type or reason of dismissal enters the CMS. The
referring party indicates on the LRA form 7.11 the nature of the dispute. This information
will enter the database. Even if new information about the type of dispute becomes
available during the hearings, the data record will not necessarily be updated. An update
of the nature of dispute might happen, but is not required. Hence, the reason for dismissal
seems inaccurately recorded and a detailed analysis is not suggested. The analysis will
only look at the aggregated (total number) of unfair dismissal cases.
The Regulatory Effi ciency of the CCMA: A Statistical Analysis of the CCMA’s CMS Database
25
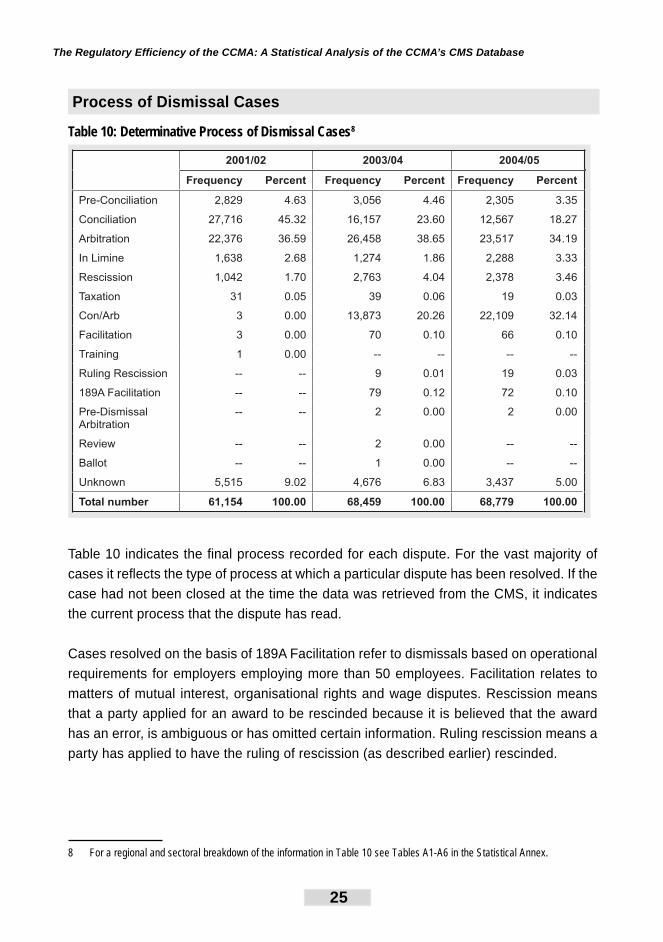
Process of Dismissal Cases
Table 10: Determinative Process of Dismissal Cases8
2001/02 2003/04 2004/05
Frequency Percent Frequency Percent Frequency Percent
Pre-Conciliation 2,829 4.63 3,056 4.46 2,305 3.35
Conciliation 27,716 45.32 16,157 23.60 12,567 18.27
Arbitration 22,376 36.59 26,458 38.65 23,517 34.19
In Limine 1,638 2.68 1,274 1.86 2,288 3.33
Rescission 1,042 1.70 2,763 4.04 2,378 3.46
Taxation 31 0.05 39 0.06 19 0.03
Con/Arb 3 0.00 13,873 20.26 22,109 32.14
Facilitation 3 0.00 70 0.10 66 0.10
Training 1 0.00 -- -- -- --
Ruling Rescission -- -- 9 0.01 19 0.03
189A Facilitation -- -- 79 0.12 72 0.10
Pre-Dismissal
Arbitration
-- -- 2 0.00 2 0.00
Review -- -- 2 0.00 -- --
Ballot -- -- 1 0.00 -- --
Unknown 5,515 9.02 4,676 6.83 3,437 5.00
Total number 61,154 100.00 68,459 100.00 68,779 100.00
Table 10 indicates the fi nal process recorded for each dispute. For the vast majority of
cases it refl ects the type of process at which a particular dispute has been resolved. If the
case had not been closed at the time the data was retrieved from the CMS, it indicates
the current process that the dispute has read.
Cases resolved on the basis of 189A Facilitation refer to dismissals based on operational
requirements for employers employing more than 50 employees. Facilitation relates to
matters of mutual interest, organisational rights and wage disputes. Rescission means
that a party applied for an award to be rescinded because it is believed that the award
has an error, is ambiguous or has omitted certain information. Ruling rescission means a
party has applied to have the ruling of rescission (as described earlier) rescinded.
8 For a regional and sectoral breakdown of the information in Table 10 see Tables A1-A6 in the Statistical Annex.
DPRU WP 06/110 Paul Benjamin and Carola Gruen
26
This table indicates a single process in respect of each case. A number of noteworthy
features:
the provision for con-arb introduced by the 2002 Amendments has
been used extensively with 20 per cent (in 2003/4) and 32 per cent (in
2004/5) of cases being dealt with through con-arb proceedings.
there has been a signifi cant rise in the number of cases in which in
limine points are taken.
there has been a signifi cant rise in the number of rescission
applications.
there are a minimal number of taxations in any year.
The signifi cance of these features is explored in greater detail below.
a)
b)
c)
d)
The Regulatory Effi ciency of the CCMA: A Statistical Analysis of the CCMA’s CMS Database
27
6. Hearings, Conciliation, Arbitration and Con-Arb
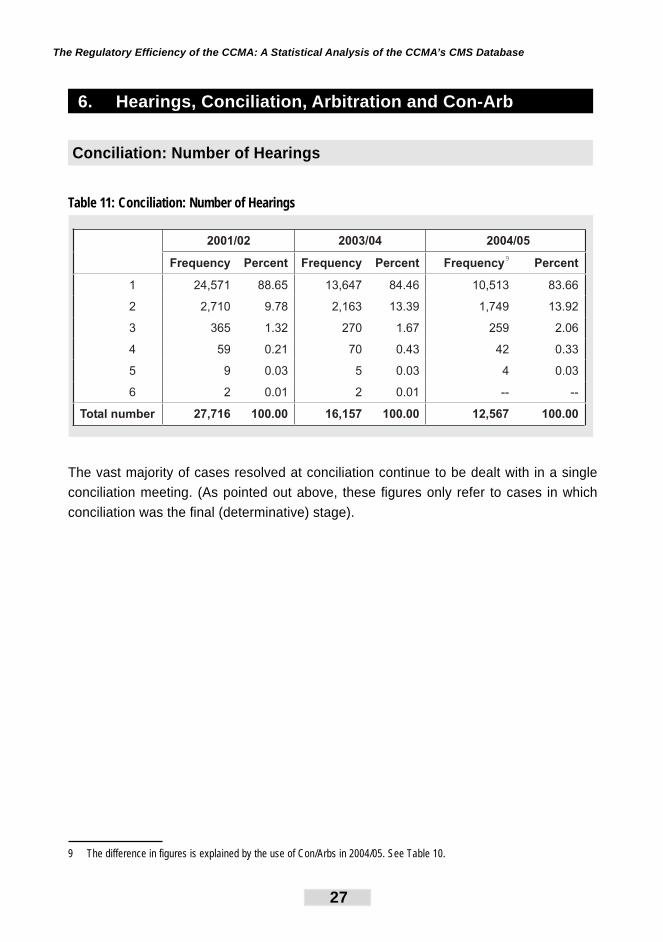
Conciliation: Number of Hearings
Table 11: Conciliation: Number of Hearings9
2001/02 2003/04 2004/05
Frequency Percent Frequency Percent Frequency9
Percent
1 24,571 88.65 13,647 84.46 10,513 83.66
2 2,710 9.78 2,163 13.39 1,749 13.92
3 365 1.32 270 1.67 259 2.06
4 59 0.21 70 0.43 42 0.33
5 9 0.03 5 0.03 4 0.03
6 2 0.01 2 0.01 -- --
Total number 27,716 100.00 16,157 100.00 12,567 100.00
The vast majority of cases resolved at conciliation continue to be dealt with in a single
conciliation meeting. (As pointed out above, these fi gures only refer to cases in which
conciliation was the fi nal (determinative) stage).
9 The difference in figures is explained by the use of Con/Arbs in 2004/05. See Table 10.
DPRU WP 06/110 Paul Benjamin and Carola Gruen
28
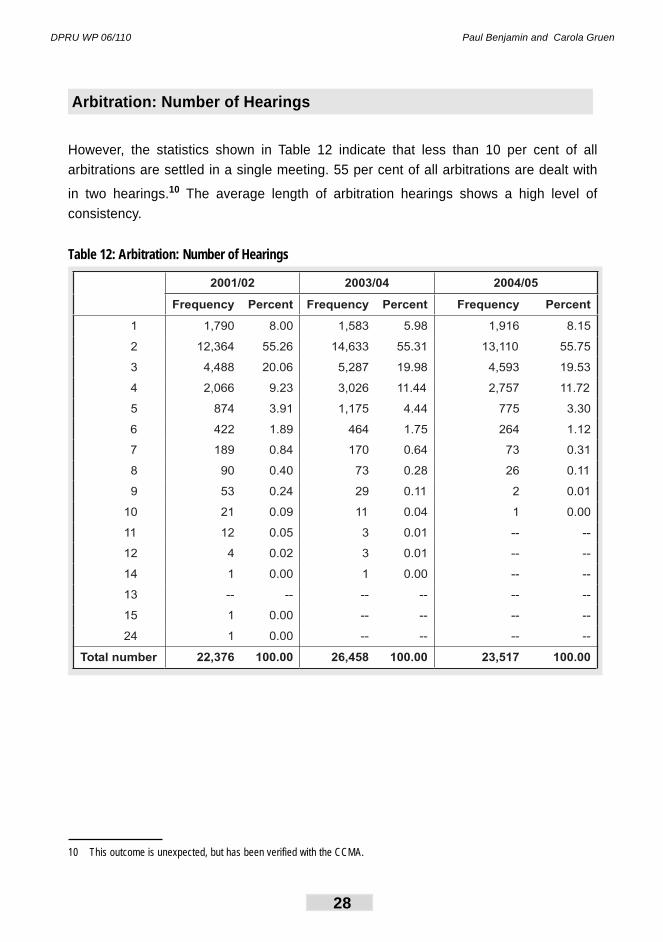
Arbitration: Number of Hearings
However, the statistics shown in Table 12 indicate that less than 10 per cent of all
arbitrations are settled in a single meeting. 55 per cent of all arbitrations are dealt with
in two hearings.10 The average length of arbitration hearings shows a high level of
consistency.
Table 12: Arbitration: Number of Hearings
2001/02 2003/04 2004/05
Frequency Percent Frequency Percent Frequency Percent
1 1,790 8.00 1,583 5.98 1,916 8.15
2 12,364 55.26 14,633 55.31 13,110 55.75
3 4,488 20.06 5,287 19.98 4,593 19.53
4 2,066 9.23 3,026 11.44 2,757 11.72
5 874 3.91 1,175 4.44 775 3.30
6 422 1.89 464 1.75 264 1.12
7 189 0.84 170 0.64 73 0.31
8 90 0.40 73 0.28 26 0.11
9 53 0.24 29 0.11 2 0.01
10 21 0.09 11 0.04 1 0.00
11 12 0.05 3 0.01 -- --
12 4 0.02 3 0.01 -- --
14 1 0.00 1 0.00 -- --
13 -- -- -- -- -- --
15 1 0.00 -- -- -- --
24 1 0.00 -- -- -- --
Total number 22,376 100.00 26,458 100.00 23,517 100.00
10 This outcome is unexpected, but has been verified with the CCMA.
The Regulatory Effi ciency of the CCMA: A Statistical Analysis of the CCMA’s CMS Database
29
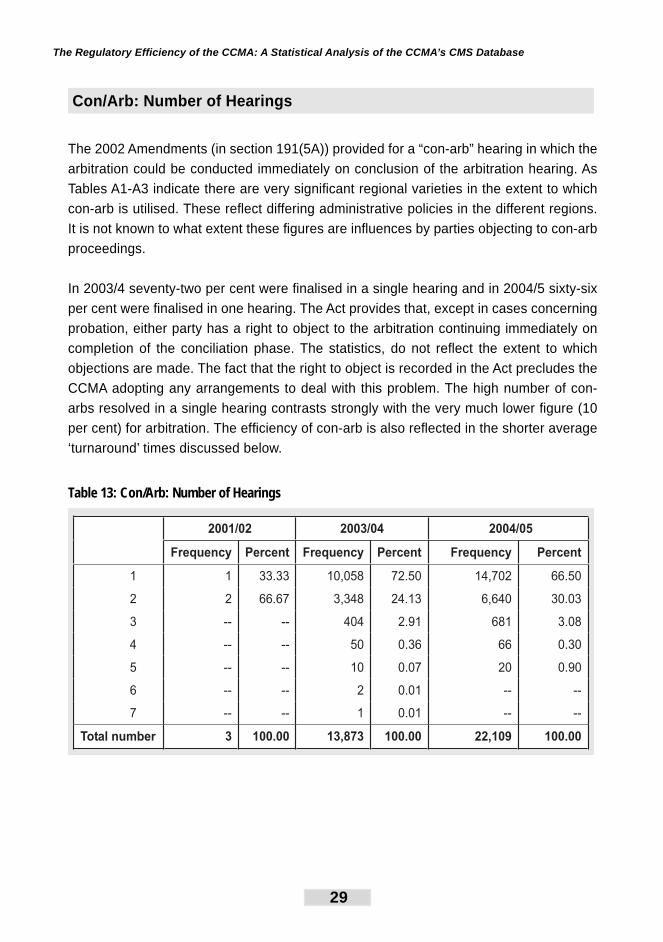
Con/Arb: Number of Hearings
The 2002 Amendments (in section 191(5A)) provided for a “con-arb” hearing in which the
arbitration could be conducted immediately on conclusion of the arbitration hearing. As
Tables A1-A3 indicate there are very signifi cant regional varieties in the extent to which
con-arb is utilised. These refl ect differing administrative policies in the different regions.
It is not known to what extent these fi gures are infl uences by parties objecting to con-arb
proceedings.
In 2003/4 seventy-two per cent were fi nalised in a single hearing and in 2004/5 sixty-six
per cent were fi nalised in one hearing. The Act provides that, except in cases concerning
probation, either party has a right to object to the arbitration continuing immediately on
completion of the conciliation phase. The statistics, do not refl ect the extent to which
objections are made. The fact that the right to object is recorded in the Act precludes the
CCMA adopting any arrangements to deal with this problem. The high number of con-
arbs resolved in a single hearing contrasts strongly with the very much lower fi gure (10
per cent) for arbitration. The effi ciency of con-arb is also refl ected in the shorter average
‘turnaround’ times discussed below.
Table 13: Con/Arb: Number of Hearings
2001/02 2003/04 2004/05
Frequency Percent Frequency Percent Frequency Percent
1 1 33.33 10,058 72.50 14,702 66.50
2 2 66.67 3,348 24.13 6,640 30.03
3 -- -- 404 2.91 681 3.08
4 -- -- 50 0.36 66 0.30
5 -- -- 10 0.07 20 0.90
6 -- -- 2 0.01 -- --
7 -- -- 1 0.01 -- --
Total number 3 100.00 13,873 100.00 22,109 100.00
DPRU WP 06/110 Paul Benjamin and Carola Gruen
30
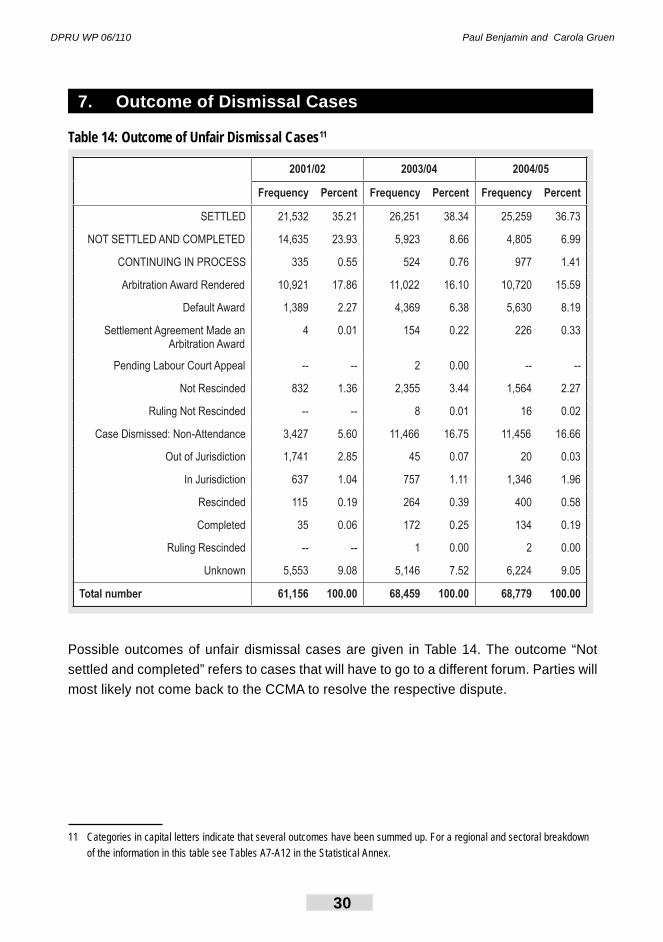
7. Outcome of Dismissal Cases
Table 14: Outcome of Unfair Dismissal Cases11
2001/02 2003/04 2004/05
Frequency Percent Frequency Percent Frequency Percent
SETTLED 21,532 35.21 26,251 38.34 25,259 36.73
NOT SETTLED AND COMPLETED 14,635 23.93 5,923 8.66 4,805 6.99
CONTINUING IN PROCESS 335 0.55 524 0.76 977 1.41
Arbitration Award Rendered 10,921 17.86 11,022 16.10 10,720 15.59
Default Award 1,389 2.27 4,369 6.38 5,630 8.19
Settlement Agreement Made an
Arbitration Award
4 0.01 154 0.22 226 0.33
Pending Labour Court Appeal -- -- 2 0.00 -- --
Not Rescinded 832 1.36 2,355 3.44 1,564 2.27
Ruling Not Rescinded -- -- 8 0.01 16 0.02
Case Dismissed: Non-Attendance 3,427 5.60 11,466 16.75 11,456 16.66
Out of Jurisdiction 1,741 2.85 45 0.07 20 0.03
In Jurisdiction 637 1.04 757 1.11 1,346 1.96
Rescinded 115 0.19 264 0.39 400 0.58
Completed 35 0.06 172 0.25 134 0.19
Ruling Rescinded -- -- 1 0.00 2 0.00
Unknown 5,553 9.08 5,146 7.52 6,224 9.05
Total number 61,156 100.00 68,459 100.00 68,779 100.00
Possible outcomes of unfair dismissal cases are given in Table 14. The outcome “Not
settled and completed” refers to cases that will have to go to a different forum. Parties will
most likely not come back to the CCMA to resolve the respective dispute.
11 Categories in capital letters indicate that several outcomes have been summed up. For a regional and sectoral breakdown
of the information in this table see Tables A7-A12 in the Statistical Annex.
The Regulatory Effi ciency of the CCMA: A Statistical Analysis of the CCMA’s CMS Database
31
Non-Attendance by Parties
It is a striking feature of the operation of the CCMA that a large number of disputes
involve failure of one of the parties to attend. Where it is the employer party who has
failed to attend this, it is refl ected as a ‘default’ award; where it is the employee party,
it is refl ected as case dismissed – non-attendance. Signifi cantly, the number of cases
falling under these two headings is very much lower for the 2001/2 eight per cent than in
the two latter years where it is approximately 25 per cent. Tables A7-A9 show that there
are very signifi cant regional variations in non-attendance by parties. The highest level of
default judgments are found in the domestic sector; with very low levels in sectors such
as ruling which are dominated by large employers. Dismissal of cases for non-attendance
by applicants is relatively consistent between sectors (Tables A10-12).
Pre-Dismissal Arbitration
The 2002 amendments to the LRA introduced a provision for pre-dismissal arbitration
where a disciplinary hearing is in effect conducted by an arbitrator’s reply by the CCMA.
This amendment was motivated by the logic that it would allow for a single hearing to
replace the internal hearing followed by an arbitration. The award made it a pre-dismissal
arbitration at the same status as that of an ordinary arbitration. As Table 10 indicates
the statistics shows the impact of this amendment has been marginal with very few pre-
dismissal arbitrations conducted in either 2003/4 or 2004. The reason for this is the
requirement for agreement between employer and employee over the hearing of a pre-
dismissal arbitration and the fact that the employer is required to pay the fees of an
arbitrator.
In Limine Points
An in limine application refers to a legal proceeding where the party seeks to have a case
dismissed on a technical basis that does not relate to the merits of the case. Instances
where in limine proceedings could be brought would be to allege that a case was brought
outside of the applicable time period or not in accordance with the appropriate procedure
or that the applicant is not an employee or was not dismissed but in fact resigned. The
CMS database refl ects the number of cases in which an in limine application disposes of
the matter (rather than how many are brought). As Table 10 indicates, there is a signifi cant
increase in the number of cases resolved in this manner.
DPRU WP 06/110 Paul Benjamin and Carola Gruen
32
Sectoral Variations
There are no sectors in which the number of in limine applications are signifi cantly
disproportionate to the number of cases in that sector. However, between the periods,
there is a substantial increase in the number of in limine applications brought in respect
of domestic workers.
Regional Variations
The distribution of in limine applications is consistent with the distribution of arbitration
hearings between the different regional offi ces.
Comment
The increasing number of in limine applications could be the result of diffi culties in the screening of cases. A further more substantive explanation could be that it is the result of increasing diffi culties in categorising employment relationships.
A series of studies by the ILO suggests that internationally disputes or uncertainty
concerning the legal nature of the employment relationship are increasingly frequent.
They attribute this to two factors: the rise of strategies to disguise employment and the
rise of objectively ambiguous employment relationships (ILO (2003 and 2005)). A research
project by Department of Labour on the changing nature of work and atypical forms of
employment changes in the labour market have taken the form of externalisation driven
by an exponential increase in the incidence of labour broking (temporary employment
services) (Department of Labour 2004).
In the light of this, consideration should be given to whether the CMS should include
fi elds to identify non-standard employment, in particular whether persons are employed
through a temporary employment service.
The Regulatory Effi ciency of the CCMA: A Statistical Analysis of the CCMA’s CMS Database
33
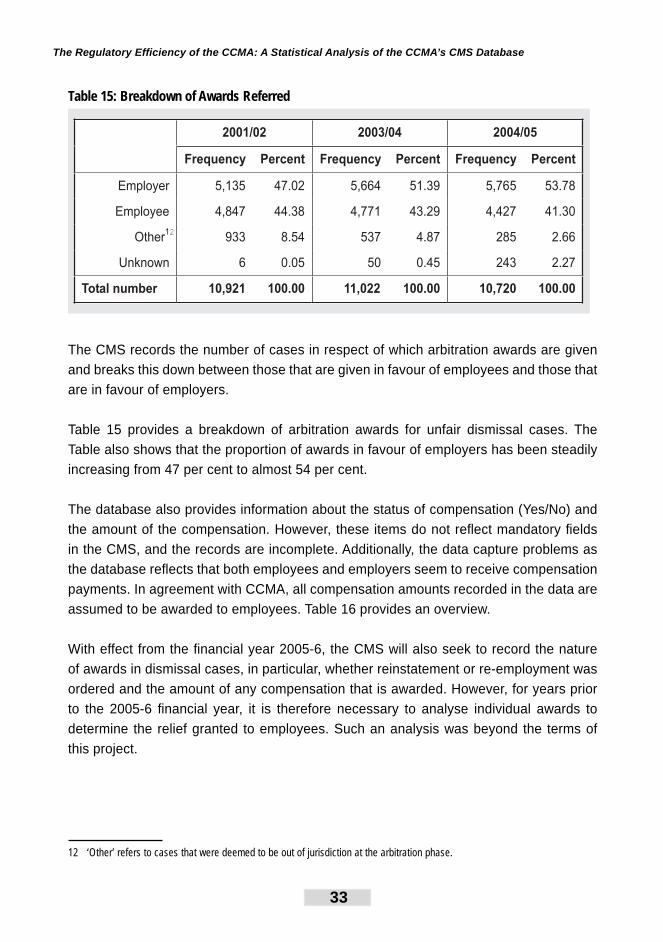
Table 15: Breakdown of Awards Referred12
2001/02 2003/04 2004/05
Frequency Percent Frequency Percent Frequency Percent
Employer 5,135 47.02 5,664 51.39 5,765 53.78
Employee 4,847 44.38 4,771 43.29 4,427 41.30
Other12
933 8.54 537 4.87 285 2.66
Unknown 6 0.05 50 0.45 243 2.27
Total number 10,921 100.00 11,022 100.00 10,720 100.00
The CMS records the number of cases in respect of which arbitration awards are given
and breaks this down between those that are given in favour of employees and those that
are in favour of employers.
Table 15 provides a breakdown of arbitration awards for unfair dismissal cases. The
Table also shows that the proportion of awards in favour of employers has been steadily
increasing from 47 per cent to almost 54 per cent.
The database also provides information about the status of compensation (Yes/No) and
the amount of the compensation. However, these items do not refl ect mandatory fi elds
in the CMS, and the records are incomplete. Additionally, the data capture problems as
the database refl ects that both employees and employers seem to receive compensation
payments. In agreement with CCMA, all compensation amounts recorded in the data are
assumed to be awarded to employees. Table 16 provides an overview.
With effect from the fi nancial year 2005-6, the CMS will also seek to record the nature
of awards in dismissal cases, in particular, whether reinstatement or re-employment was
ordered and the amount of any compensation that is awarded. However, for years prior
to the 2005-6 fi nancial year, it is therefore necessary to analyse individual awards to
determine the relief granted to employees. Such an analysis was beyond the terms of
this project.
12 ‘Other’ refers to cases that were deemed to be out of jurisdiction at the arbitration phase.
DPRU WP 06/110 Paul Benjamin and Carola Gruen
34
Sectoral Variations
The fi gures obtained form the CMS do not show any signifi cant variation between
economic sectors in the outcome of arbitrations.
Regional Variations
A break-down of arbitration outcomes by region reveals a variation in the outcome of
awards in favour of employees and employers is striking ranging from Durban (69 per
cent for employees; 29 per cent for employees) to Cape Town (47 for employees; 42 per
cent for employees). In the previous fi nancial year, the range was even greater: Durban
(71 per cent for employees; 25 per cent for employers) to Cape Town (42 per cent for
employees; 52 per cent for employers).13
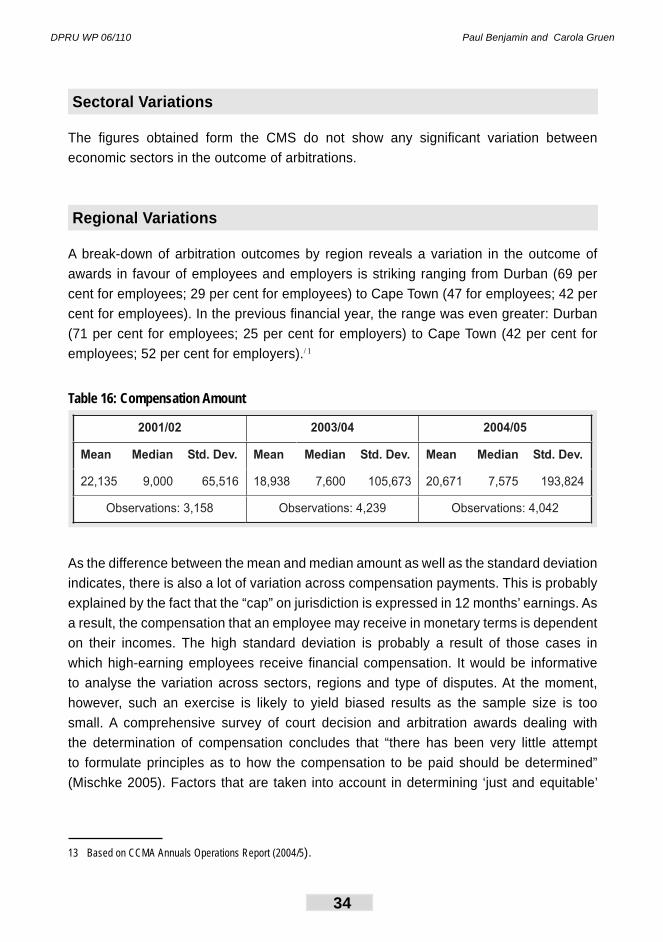
Table 16: Compensation Amount
2001/02 2003/04 2004/05
Mean Median Std. Dev. Mean Median Std. Dev. Mean Median Std. Dev.
22,135 9,000 65,516 18,938 7,600 105,673 20,671 7,575 193,824
Observations: 3,158 Observations: 4,239 Observations: 4,042
As the difference between the mean and median amount as well as the standard deviation
indicates, there is also a lot of variation across compensation payments. This is probably
explained by the fact that the “cap” on jurisdiction is expressed in 12 months’ earnings. As
a result, the compensation that an employee may receive in monetary terms is dependent
on their incomes. The high standard deviation is probably a result of those cases in
which high-earning employees receive fi nancial compensation. It would be informative
to analyse the variation across sectors, regions and type of disputes. At the moment,
however, such an exercise is likely to yield biased results as the sample size is too
small. A comprehensive survey of court decision and arbitration awards dealing with
the determination of compensation concludes that “there has been very little attempt
to formulate principles as to how the compensation to be paid should be determined”
(Mischke 2005). Factors that are taken into account in determining ‘just and equitable’
13 Based on CCMA Annuals Operations Report (2004/5).
The Regulatory Effi ciency of the CCMA: A Statistical Analysis of the CCMA’s CMS Database
35
compensation include: the employees length of service, the employee’s prospect of fi nding
alternative employment, the circumstances and consequences of the dismissal; whether
the dismissal was procedurally or substantively unfair. The employer’s circumstances,
including the size of the employer’s business is rarely used as a consideration. Mischke
suggests that the most common award of compensation is six months’ wages.
Reviews
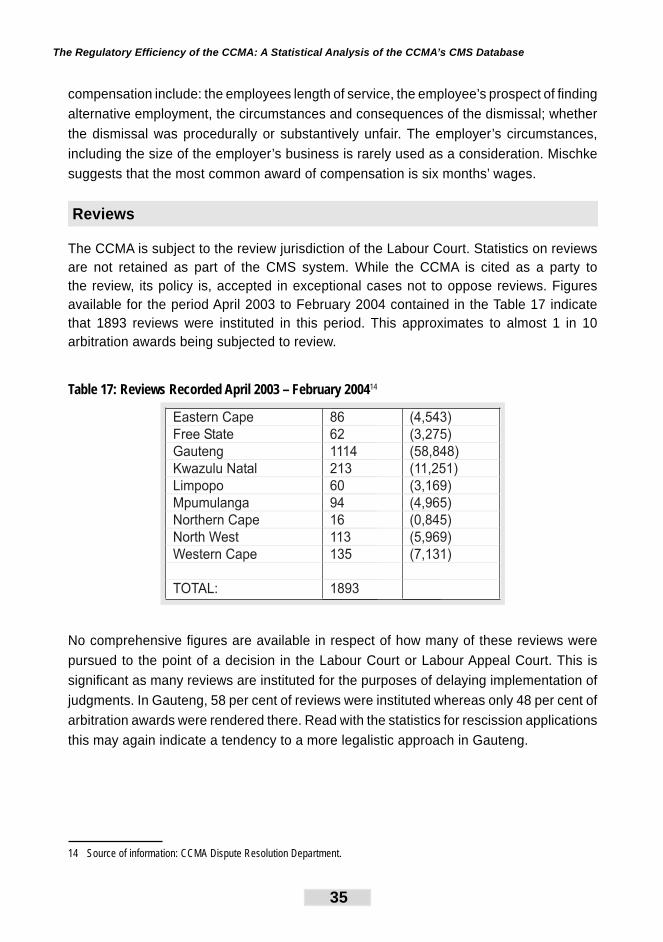
The CCMA is subject to the review jurisdiction of the Labour Court. Statistics on reviews are not retained as part of the CMS system. While the CCMA is cited as a party to the review, its policy is, accepted in exceptional cases not to oppose reviews. Figures available for the period April 2003 to February 2004 contained in the Table 17 indicate that 1893 reviews were instituted in this period. This approximates to almost 1 in 10 arbitration awards being subjected to review.
Table 17: Reviews Recorded April 2003 – February 200414
Eastern Cape 86 (4,543)
Free State 62 (3,275)
Gauteng 1114 (58,848)
Kwazulu Natal 213 (11,251)
Limpopo 60 (3,169)
Mpumulanga 94 (4,965)
Northern Cape 16 (0,845)
North West 113 (5,969)
Western Cape 135 (7,131)
TOTAL: 1893
No comprehensive fi gures are available in respect of how many of these reviews were
pursued to the point of a decision in the Labour Court or Labour Appeal Court. This is
signifi cant as many reviews are instituted for the purposes of delaying implementation of
judgments. In Gauteng, 58 per cent of reviews were instituted whereas only 48 per cent of
arbitration awards were rendered there. Read with the statistics for rescission applications
this may again indicate a tendency to a more legalistic approach in Gauteng.
14 Source of information: CCMA Dispute Resolution Department.
DPRU WP 06/110 Paul Benjamin and Carola Gruen
36
Recently Judge Dhaya Pillay in the Labour Court case of Shoprite Checkers (Pty) Ltd v
CCMA and others (Unreported; Case No.: P394/2004) in a judgment delivered on 5 May
2005 made certain wide ranging comments:
“[22] In my view there is an emerging consensus in the industrial relations
community that the systems and institutions established under the LRA eight
years ago, in particular the CCMA and the labour courts, are not functioning
optimally. Originally, these institutions were conceived as providing a quick,
effi cient and free public service. The CCMA was devised as a one stop dispute
resolution shop. Dismissals which constitute the bulk of the disputes were
meant to be resolved by a two stage process of conciliation and arbitration. An
attempt was made by introducing the con-arb in the 2002 amendment to the
LRA to make the two stage process seamless. As it is used so infrequently,
it has not succeeded in improving the effi ciency of dispute resolution.
[23] Whereas the review was intended to be exceptional, it is now fast becoming
the norm. This change was brought about somewhat unexpectedly when the
new Constitution (Act 108 of 1996), which was adopted after the LRA was
drafted, was so interpreted by the Labour Appeal Court as to introduce rationality
as an additional ground of review. However, the rationality test has become
so distorted, that it has blurred the distinction between appeals and reviews.
[24] A critical stage has been reached in our labour law jurisprudence. A
serious attempt must be made to restore dispute resolution to the two stage
process as originally intended, instead of the fi ve stage process that it is
fast becoming. If this is not done urgently the effi ciency of the CCMA and
the labour courts are at stake. Needless to say the impact of that on the
economy can only be adverse. To reverse the current trends, responsibility
rests on the litigants to be circumspect about the cases they prosecute
to avoid abusing the free dispute resolution services. Equally, the courts
have a duty to discourage appeals that present in the guise of reviews.”
The writer John Grogan has commented that the failure by the LRA to specify a time limit
for the conclusion of matters set in motion by review proceedings is a “gaping omission”
(Grogan 2005). This enables employers to utilise a review to stave off the enforcement of
awards. While the Labour court has on several occasions expressed frustration with this
practice. One of the principal causes of these delays can be the time period taken by the
CCMA or bargaining councils to fi le the record of review proceedings.
The Regulatory Effi ciency of the CCMA: A Statistical Analysis of the CCMA’s CMS Database
37
Taxation
As Table 10 indicates, the number of taxation hearings is virtually negligible. This is because arbitrators are only able to award costs against unsuccessful litigants in exceptional cases. Proposals in the 2000 LRA Amendment Bill to expand the discretion of arbitrators to make costs awards as a disincentive for the inappropriate referral of cases to the CCMA were not included in the amending Act.
Certifi cation of Awards
Section 143 of the LRA permits CCMA awards to be enforced as if they were Labour Court orders once they have been certifi ed. Prior to this amendment, a separate application in the Labour Court had to be made to enforce an award. Certifi cation is therefore required where an employer fails to comply voluntarily with an arbitration award. The number of section 143 certifi cates is not recorded as part of the CMS and comprehensive information on this issue could not be obtained. The number of certifi cations is an indication of the extent to which awards are not voluntarily complied with.
DPRU WP 06/110 Paul Benjamin and Carola Gruen
38
8. Indicators of Administrative Effi ciency15
15
Conciliation: Average Number of Days between Referral and
Activation Date
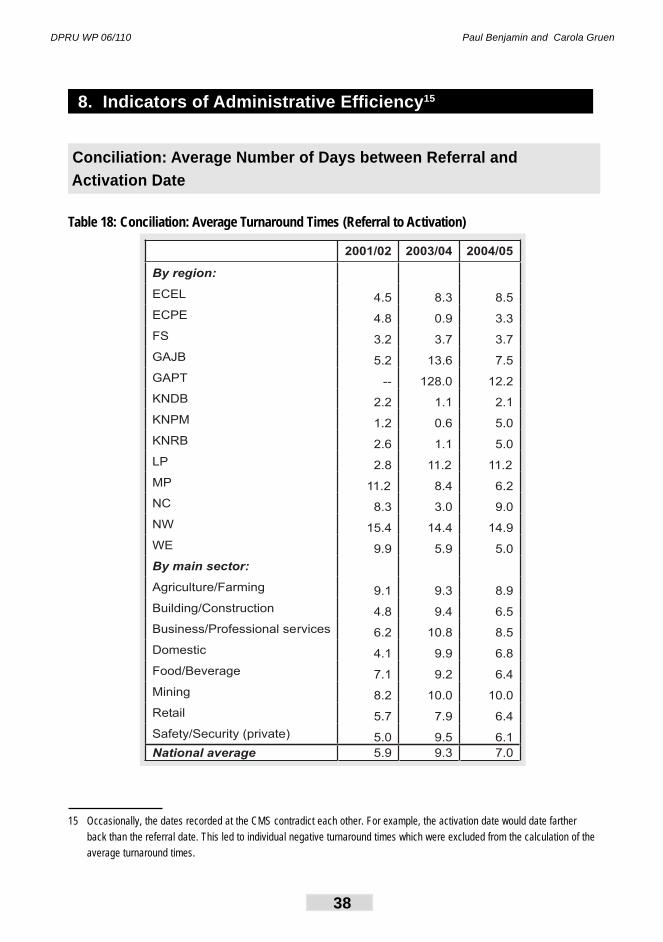
Table 18: Conciliation: Average Turnaround Times (Referral to Activation)
2001/02 2003/04 2004/05
By region:
ECEL 4.5 8.3 8.5
ECPE 4.8 0.9 3.3
FS 3.2 3.7 3.7
GAJB 5.2 13.6 7.5
GAPT -- 128.0 12.2
KNDB 2.2 1.1 2.1
KNPM 1.2 0.6 5.0
KNRB 2.6 1.1 5.0
LP 2.8 11.2 11.2
MP 11.2 8.4 6.2
NC 8.3 3.0 9.0
NW 15.4 14.4 14.9
WE 9.9 5.9 5.0
By main sector:
Agriculture/Farming 9.1 9.3 8.9
Building/Construction 4.8 9.4 6.5
Business/Professional services 6.2 10.8 8.5
Domestic 4.1 9.9 6.8
Food/Beverage 7.1 9.2 6.4
Mining 8.2 10.0 10.0
Retail 5.7 7.9 6.4
Safety/Security (private) 5.0 9.5 6.1
National average 5.9 9.3 7.0
15 Occasionally, the dates recorded at the CMS contradict each other. For example, the activation date would date farther
back than the referral date. This led to individual negative turnaround times which were excluded from the calculation of the
average turnaround times.
The Regulatory Effi ciency of the CCMA: A Statistical Analysis of the CCMA’s CMS Database
39
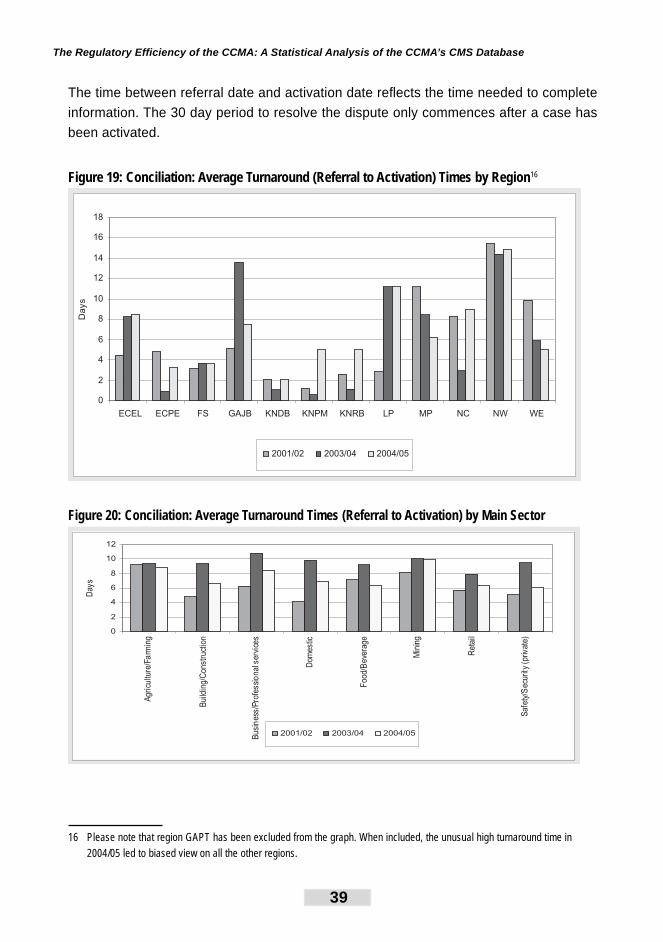
The time between referral date and activation date refl ects the time needed to complete
information. The 30 day period to resolve the dispute only commences after a case has
been activated.
Figure 19: Conciliation: Average Turnaround (Referral to Activation) Times by Region16
0
2
4
6
8
10
12
14
16
18
ECEL ECPE FS GAJB KNDB KNPM KNRB LP MP NC NW WE
Days
2001/02 2003/04 2004/05
Figure 20: Conciliation: Average Turnaround Times (Referral to Activation) by Main Sector
0
2
4
6
8
10
12
uA
gri
cult
re/F
arm
ing
Bn
uildi
g/C
onstr
uction
Busin
ess/P
rofe
ssio
nalserv
ices
Dom
estic
Food/B
evera
ge
Min
ing
Reta
il
Safe
ty/S
ecurity
(private
)
Days
2001/02 2003/04 2004/05
16 Please note that region GAPT has been excluded from the graph. When included, the unusual high turnaround time in
2004/05 led to biased view on all the other regions.
DPRU WP 06/110 Paul Benjamin and Carola Gruen
40
Conciliation: Average Number of Days between Activation and End Date
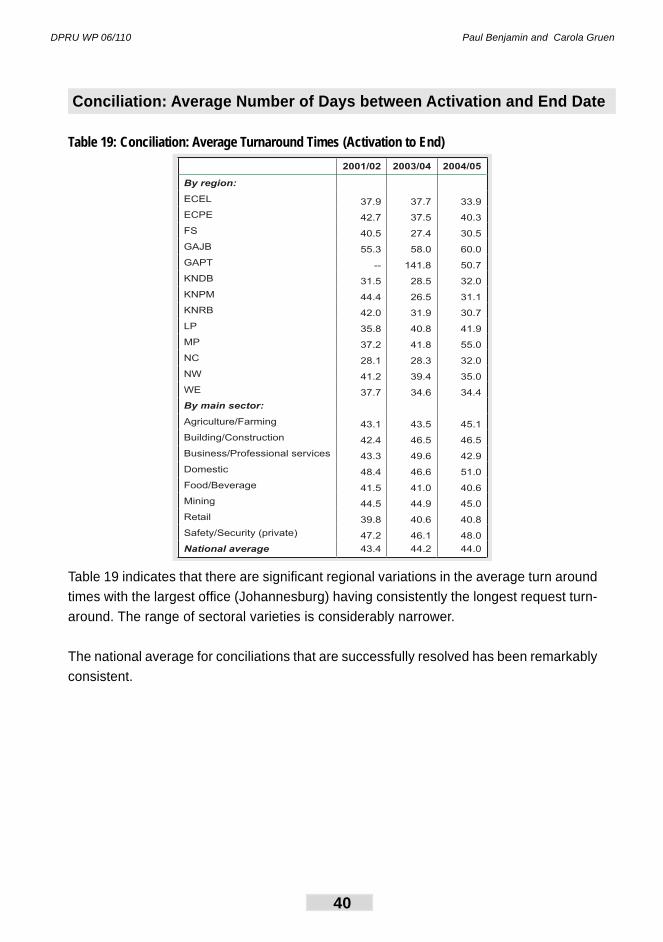
Table 19: Conciliation: Average Turnaround Times (Activation to End)
2001/02 2003/04 2004/05
By region:
ECEL 37.9 37.7 33.9
ECPE 42.7 37.5 40.3
FS 40.5 27.4 30.5
GAJB 55.3 58.0 60.0
GAPT -- 141.8 50.7
KNDB 31.5 28.5 32.0
KNPM 44.4 26.5 31.1
KNRB 42.0 31.9 30.7
LP 35.8 40.8 41.9
MP 37.2 41.8 55.0
NC 28.1 28.3 32.0
NW 41.2 39.4 35.0
WE 37.7 34.6 34.4
By main sector:
Agriculture/Farming 43.1 43.5 45.1
Building/Construction 42.4 46.5 46.5
Business/Professional services 43.3 49.6 42.9
Domestic 48.4 46.6 51.0
Food/Beverage 41.5 41.0 40.6
Mining 44.5 44.9 45.0
Retail 39.8 40.6 40.8
Safety/Security (private) 47.2 46.1 48.0
National average 43.4 44.2 44.0
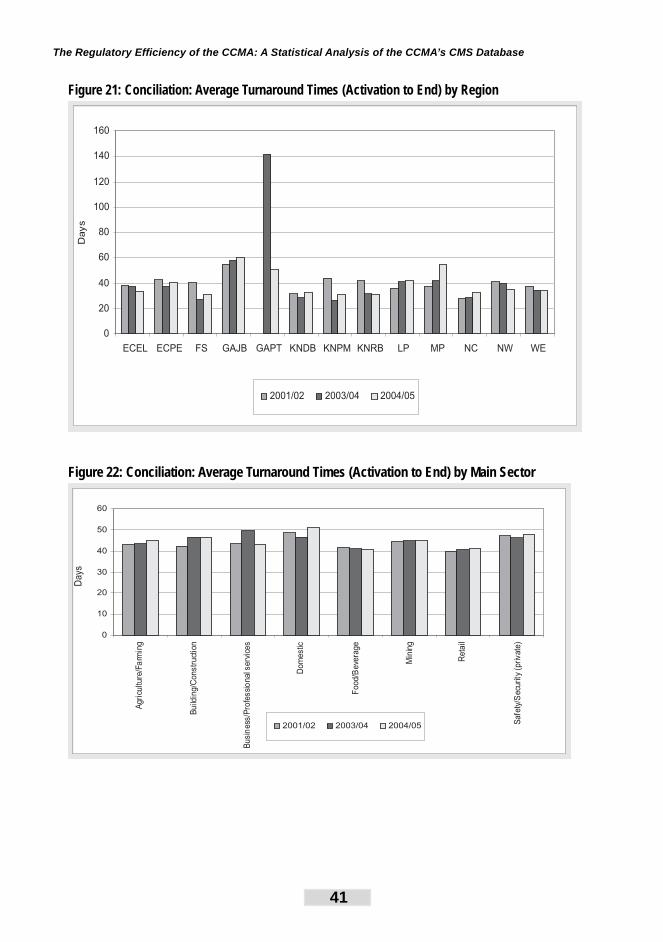
Table 19 indicates that there are signifi cant regional variations in the average turn around
times with the largest offi ce (Johannesburg) having consistently the longest request turn-
around. The range of sectoral varieties is considerably narrower.
The national average for conciliations that are successfully resolved has been remarkably
consistent.
The Regulatory Effi ciency of the CCMA: A Statistical Analysis of the CCMA’s CMS Database
41
Figure 21: Conciliation: Average Turnaround Times (Activation to End) by Region
0
20
40
60
80
100
120
140
160
ECEL ECPE FS GAJB GAPT KNDB KNPM KNRB LP MP NC NW WE
Days
2001/02 2003/04 2004/05
Figure 22: Conciliation: Average Turnaround Times (Activation to End) by Main Sector
0
10
20
30
40
50
60
2001/02 2003/04 2004/05
Da
ys
uA
gri
cult
re/F
arm
ing
Bn
uildi
g/C
onstr
uction
Busin
ess/P
rofe
ssio
nalserv
ices
Dom
estic
Food/B
evera
ge
Min
ing
Reta
il
Safe
ty/S
ecurity
(private
)
DPRU WP 06/110 Paul Benjamin and Carola Gruen
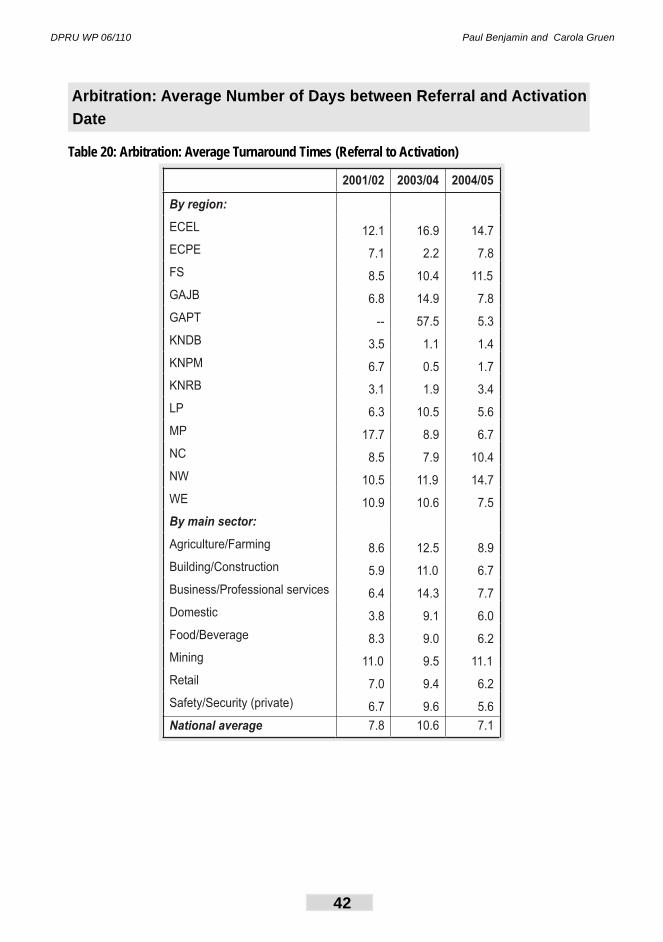
42
Arbitration: Average Number of Days between Referral and Activation
Date
Table 20: Arbitration: Average Turnaround Times (Referral to Activation)
2001/02 2003/04 2004/05
By region:
ECEL 12.1 16.9 14.7
ECPE 7.1 2.2 7.8
FS 8.5 10.4 11.5
GAJB 6.8 14.9 7.8
GAPT -- 57.5 5.3
KNDB 3.5 1.1 1.4
KNPM 6.7 0.5 1.7
KNRB 3.1 1.9 3.4
LP 6.3 10.5 5.6
MP 17.7 8.9 6.7
NC 8.5 7.9 10.4
NW 10.5 11.9 14.7
WE 10.9 10.6 7.5
By main sector:
Agriculture/Farming 8.6 12.5 8.9
Building/Construction 5.9 11.0 6.7
Business/Professional services 6.4 14.3 7.7
Domestic 3.8 9.1 6.0
Food/Beverage 8.3 9.0 6.2
Mining 11.0 9.5 11.1
Retail 7.0 9.4 6.2
Safety/Security (private) 6.7 9.6 5.6
National average 7.8 10.6 7.1
The Regulatory Effi ciency of the CCMA: A Statistical Analysis of the CCMA’s CMS Database
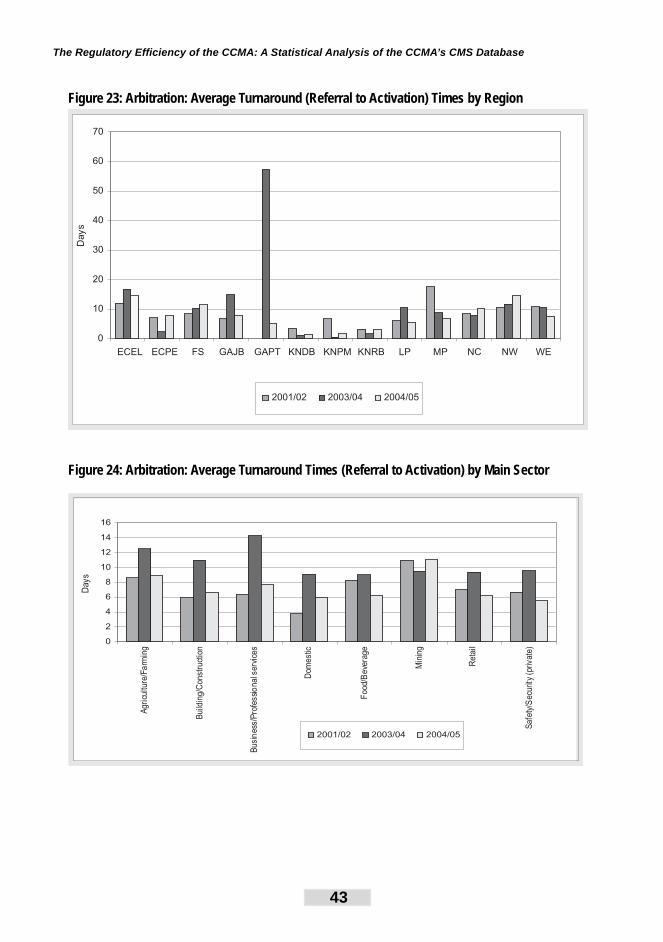
43
Figure 23: Arbitration: Average Turnaround (Referral to Activation) Times by Region
0
10
20
30
40
50
60
70
ECEL ECPE FS GAJB GAPT KNDB KNPM KNRB LP MP NC NW WE
Days
2001/02 2003/04 2004/05
Figure 24: Arbitration: Average Turnaround Times (Referral to Activation) by Main Sector
0
2
4
6
8
10
12
14
16
2001/02 2003/04 2004/05
uA
gri
cult
re/F
arm
ing
Bn
uildi
g/C
onstr
uction
Busin
ess/P
rofe
ssio
nalserv
ices
Dom
estic
Food/B
evera
ge
Min
ing
Reta
il
Safe
ty/S
ecurity
(private
)
Days
DPRU WP 06/110 Paul Benjamin and Carola Gruen
44
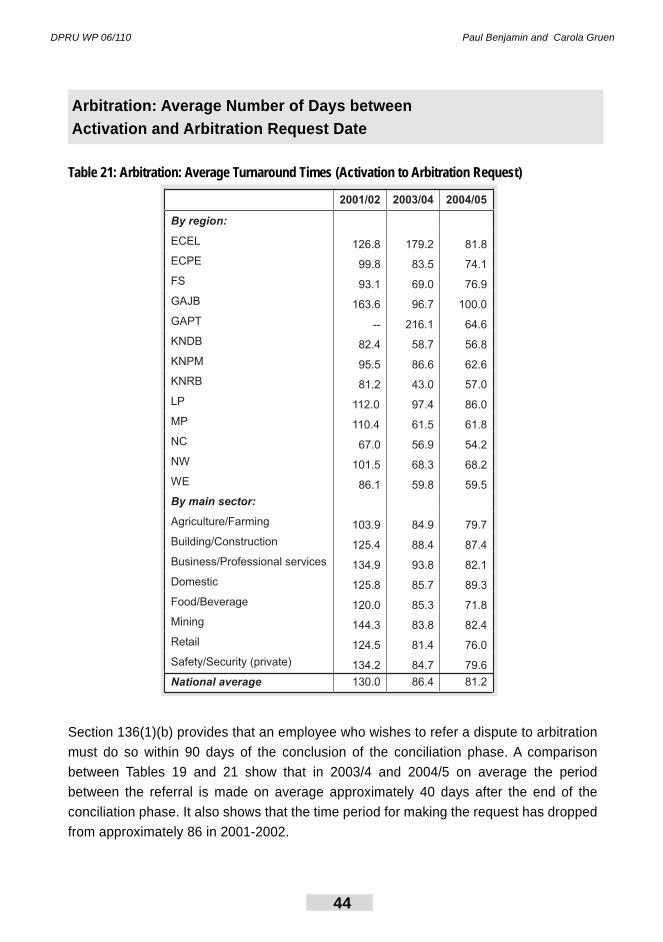
Arbitration: Average Number of Days between
Activation and Arbitration Request Date
Table 21: Arbitration: Average Turnaround Times (Activation to Arbitration Request)
2001/02 2003/04 2004/05
By region:
ECEL 126.8 179.2 81.8
ECPE 99.8 83.5 74.1
FS 93.1 69.0 76.9
GAJB 163.6 96.7 100.0
GAPT -- 216.1 64.6
KNDB 82.4 58.7 56.8
KNPM 95.5 86.6 62.6
KNRB 81.2 43.0 57.0
LP 112.0 97.4 86.0
MP 110.4 61.5 61.8
NC 67.0 56.9 54.2
NW 101.5 68.3 68.2
WE 86.1 59.8 59.5
By main sector:
Agriculture/Farming 103.9 84.9 79.7
Building/Construction 125.4 88.4 87.4
Business/Professional services 134.9 93.8 82.1
Domestic 125.8 85.7 89.3
Food/Beverage 120.0 85.3 71.8
Mining 144.3 83.8 82.4
Retail 124.5 81.4 76.0
Safety/Security (private) 134.2 84.7 79.6
National average 130.0 86.4 81.2
Section 136(1)(b) provides that an employee who wishes to refer a dispute to arbitration
must do so within 90 days of the conclusion of the conciliation phase. A comparison
between Tables 19 and 21 show that in 2003/4 and 2004/5 on average the period
between the referral is made on average approximately 40 days after the end of the
conciliation phase. It also shows that the time period for making the request has dropped
from approximately 86 in 2001-2002.
The Regulatory Effi ciency of the CCMA: A Statistical Analysis of the CCMA’s CMS Database
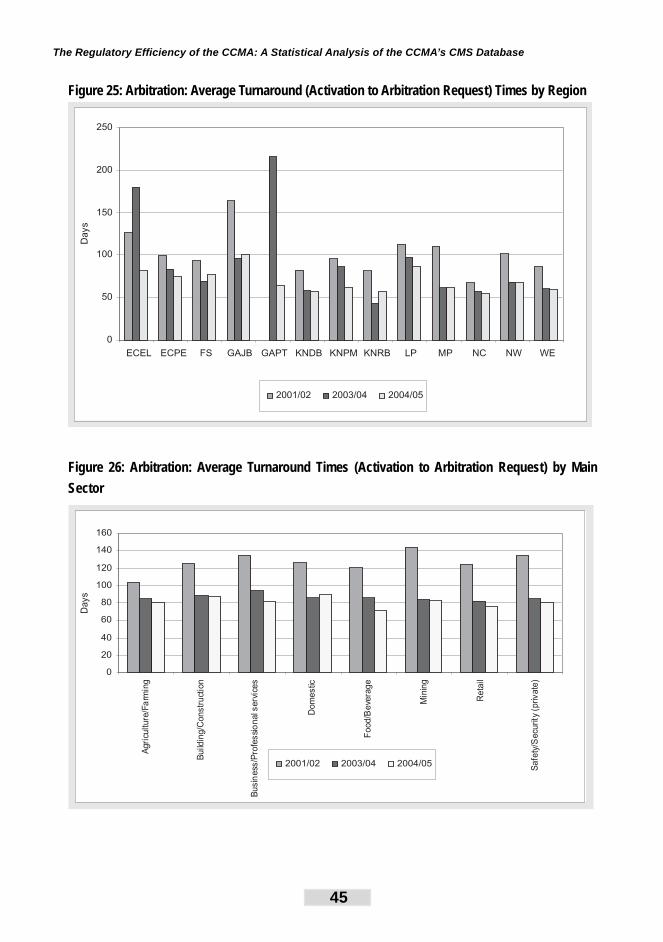
45
Figure 25: Arbitration: Average Turnaround (Activation to Arbitration Request) Times by Region
0
50
100
150
200
250
ECEL ECPE FS GAJB GAPT KNDB KNPM KNRB LP MP NC NW WE
Days
2001/02 2003/04 2004/05
Figure 26: Arbitration: Average Turnaround Times (Activation to Arbitration Request) by Main
Sector
0
20
40
60
80
100
120
140
160
2001/02 2003/04 2004/05
Days
uA
gri
cult
re/F
arm
ing
Bn
uildi
g/C
onstr
uction
Busin
ess/P
rofe
ssio
nalserv
ices
Dom
estic
Food/B
evera
ge
Min
ing
Reta
il
Safe
ty/S
ecurity
(private
)
DPRU WP 06/110 Paul Benjamin and Carola Gruen
46
Arbitration: Average Number of Days between Arbitration Request and
Award Date
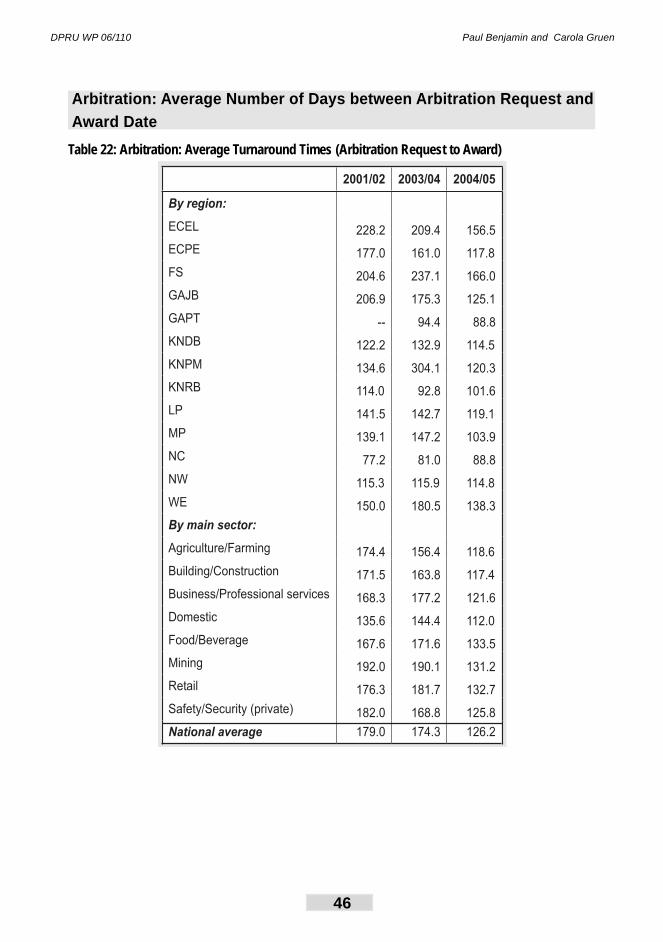
Table 22: Arbitration: Average Turnaround Times (Arbitration Request to Award)
2001/02 2003/04 2004/05
By region:
ECEL 228.2 209.4 156.5
ECPE 177.0 161.0 117.8
FS 204.6 237.1 166.0
GAJB 206.9 175.3 125.1
GAPT -- 94.4 88.8
KNDB 122.2 132.9 114.5
KNPM 134.6 304.1 120.3
KNRB 114.0 92.8 101.6
LP 141.5 142.7 119.1
MP 139.1 147.2 103.9
NC 77.2 81.0 88.8
NW 115.3 115.9 114.8
WE 150.0 180.5 138.3
By main sector:
Agriculture/Farming 174.4 156.4 118.6
Building/Construction 171.5 163.8 117.4
Business/Professional services 168.3 177.2 121.6
Domestic 135.6 144.4 112.0
Food/Beverage 167.6 171.6 133.5
Mining 192.0 190.1 131.2
Retail 176.3 181.7 132.7
Safety/Security (private) 182.0 168.8 125.8
National average 179.0 174.3 126.2
The Regulatory Effi ciency of the CCMA: A Statistical Analysis of the CCMA’s CMS Database
47
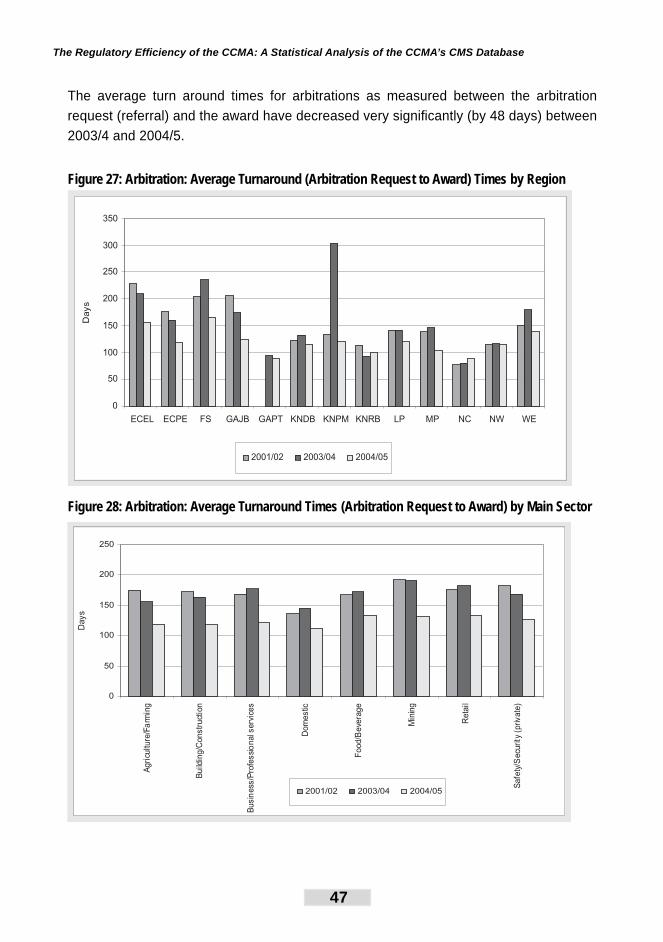
The average turn around times for arbitrations as measured between the arbitration
request (referral) and the award have decreased very signifi cantly (by 48 days) between
2003/4 and 2004/5.
Figure 27: Arbitration: Average Turnaround (Arbitration Request to Award) Times by Region
0
50
100
150
200
250
300
350
ECEL ECPE FS GAJB GAPT KNDB KNPM KNRB LP MP NC NW WE
Days
2001/02 2003/04 2004/05
Figure 28: Arbitration: Average Turnaround Times (Arbitration Request to Award) by Main Sector
uA
gri
cult
re/F
arm
ing
Bn
uildi
g/C
onstr
uction
Busin
ess/P
rofe
ssio
nalserv
ices
Dom
estic
Food/B
evera
ge
Min
ing
Reta
il
Safe
ty/S
ecurity
(private
)
0
50
100
150
200
250
Days
2001/02 2003/04 2004/05
DPRU WP 06/110 Paul Benjamin and Carola Gruen
48
Arbitration: Average Number of Days between Activation and End Date
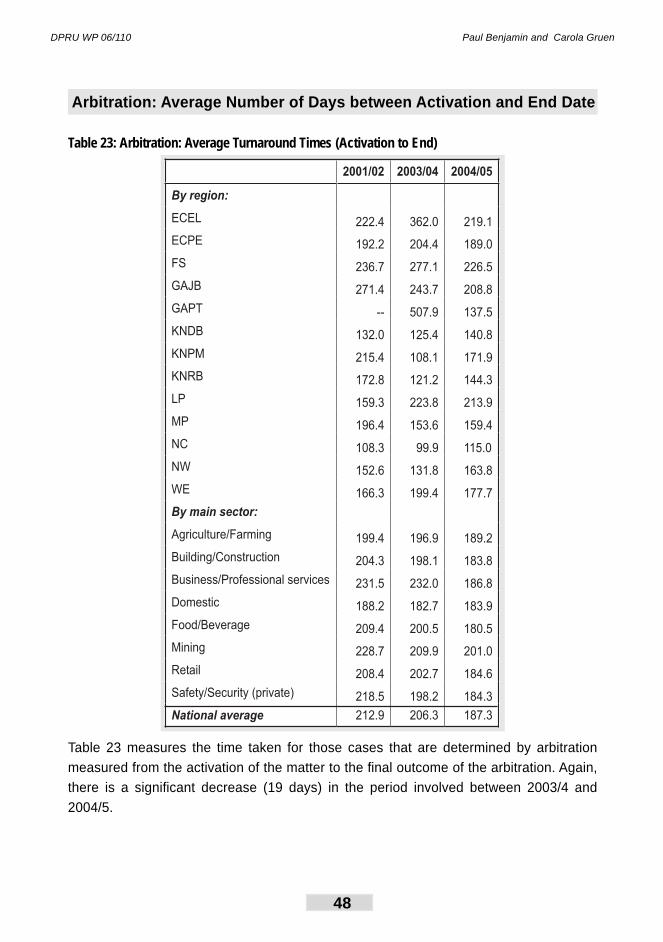
Table 23: Arbitration: Average Turnaround Times (Activation to End)
2001/02 2003/04 2004/05
By region:
ECEL 222.4 362.0 219.1
ECPE 192.2 204.4 189.0
FS 236.7 277.1 226.5
GAJB 271.4 243.7 208.8
GAPT -- 507.9 137.5
KNDB 132.0 125.4 140.8
KNPM 215.4 108.1 171.9
KNRB 172.8 121.2 144.3
LP 159.3 223.8 213.9
MP 196.4 153.6 159.4
NC 108.3 99.9 115.0
NW 152.6 131.8 163.8
WE 166.3 199.4 177.7
By main sector:
Agriculture/Farming 199.4 196.9 189.2
Building/Construction 204.3 198.1 183.8
Business/Professional services 231.5 232.0 186.8
Domestic 188.2 182.7 183.9
Food/Beverage 209.4 200.5 180.5
Mining 228.7 209.9 201.0
Retail 208.4 202.7 184.6
Safety/Security (private) 218.5 198.2 184.3
National average 212.9 206.3 187.3
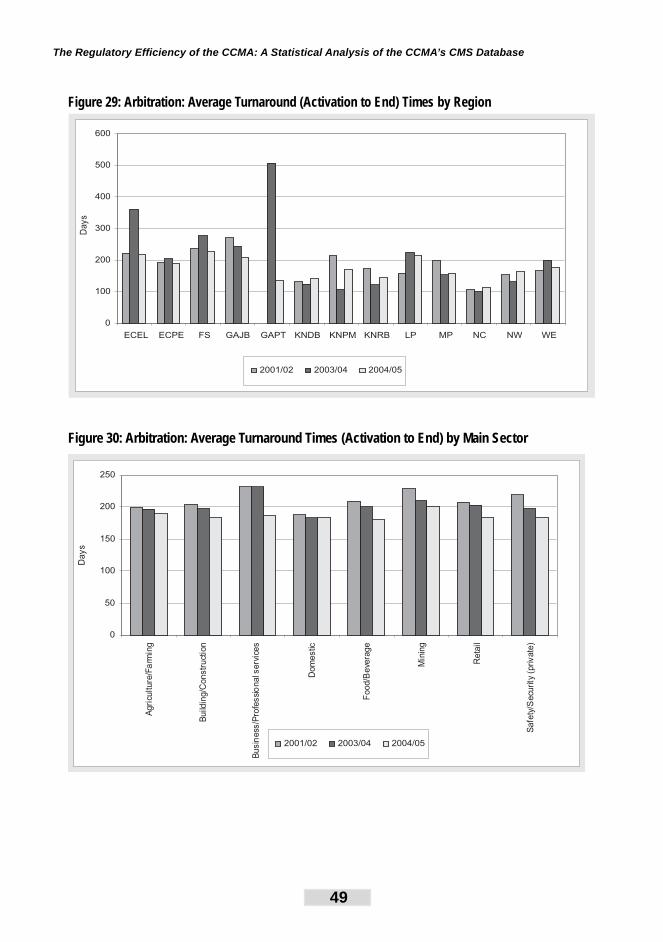
Table 23 measures the time taken for those cases that are determined by arbitration
measured from the activation of the matter to the fi nal outcome of the arbitration. Again,
there is a signifi cant decrease (19 days) in the period involved between 2003/4 and
2004/5.
The Regulatory Effi ciency of the CCMA: A Statistical Analysis of the CCMA’s CMS Database
49
Figure 29: Arbitration: Average Turnaround (Activation to End) Times by Region
0
100
200
300
400
500
600
ECEL ECPE FS GAJB GAPT KNDB KNPM KNRB LP MP NC NW WE
2001/02 2003/04 2004/05
Days
Figure 30: Arbitration: Average Turnaround Times (Activation to End) by Main Sector
0
50
100
150
200
250
Days
2001/02 2003/04 2004/05
uA
gri
cult
re/F
arm
ing
Bn
uildi
g/C
onstr
uction
Busin
ess/P
rofe
ssio
nalserv
ices
Dom
estic
Food/B
evera
ge
Min
ing
Reta
il
Safe
ty/S
ecurity
(private
)
DPRU WP 06/110 Paul Benjamin and Carola Gruen
50
Con/Arb: Average Number of Days between Referral and Activation
Date17
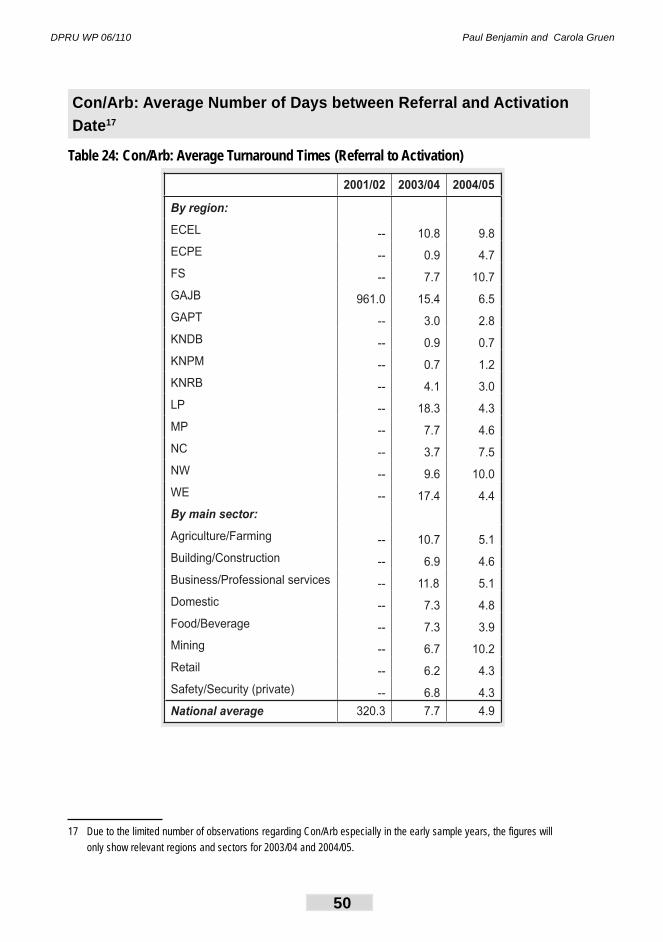
Table 24: Con/Arb: Average Turnaround Times (Referral to Activation)17
2001/02 2003/04 2004/05
By region:
ECEL -- 10.8 9.8
ECPE -- 0.9 4.7
FS -- 7.7 10.7
GAJB 961.0 15.4 6.5
GAPT -- 3.0 2.8
KNDB -- 0.9 0.7
KNPM -- 0.7 1.2
KNRB -- 4.1 3.0
LP -- 18.3 4.3
MP -- 7.7 4.6
NC -- 3.7 7.5
NW -- 9.6 10.0
WE -- 17.4 4.4
By main sector:
Agriculture/Farming -- 10.7 5.1
Building/Construction -- 6.9 4.6
Business/Professional services -- 11.8 5.1
Domestic -- 7.3 4.8
Food/Beverage -- 7.3 3.9
Mining -- 6.7 10.2
Retail -- 6.2 4.3
Safety/Security (private) -- 6.8 4.3
National average 320.3 7.7 4.9
17 Due to the limited number of observations regarding Con/Arb especially in the early sample years, the figures will
only show relevant regions and sectors for 2003/04 and 2004/05.
The Regulatory Effi ciency of the CCMA: A Statistical Analysis of the CCMA’s CMS Database
51
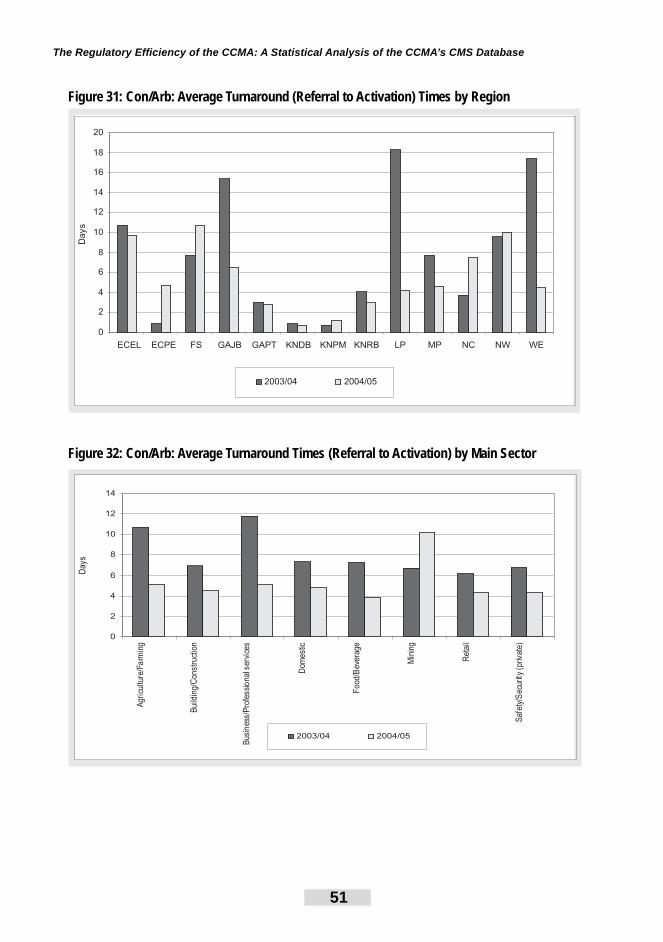
Figure 31: Con/Arb: Average Turnaround (Referral to Activation) Times by Region
0
2
4
6
8
10
12
14
16
18
20
ECEL ECPE FS GAJB GAPT KNDB KNPM KNRB LP MP NC NW WE
2003/04 2004/05
Days
Figure 32: Con/Arb: Average Turnaround Times (Referral to Activation) by Main Sector
0
2
4
6
8
10
12
14
Days
2003/04 2004/05
uA
gri
cult
re/F
arm
ing
Bn
uild
ig/C
onstr
uct
ion
Busin
ess/P
rofe
ssi
onals
erv
ices
Dom
estic
Food/B
eve
rage
Min
ing
Reta
il
Safe
ty/S
ecurity
(private
)
DPRU WP 06/110 Paul Benjamin and Carola Gruen
52
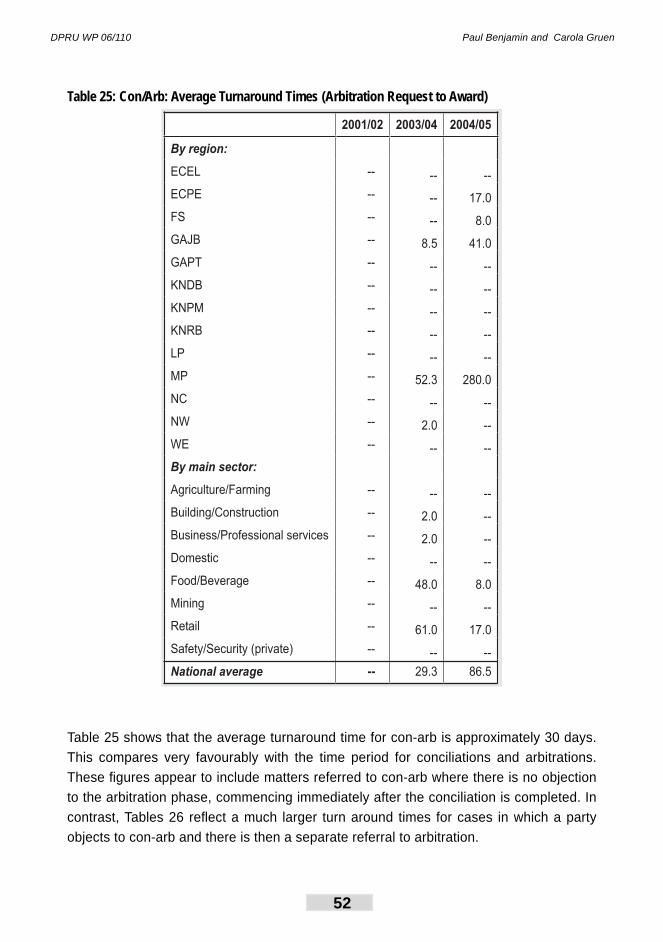
Table 25: Con/Arb: Average Turnaround Times (Arbitration Request to Award)
2001/02 2003/04 2004/05
By region:
ECEL -- -- --
ECPE -- -- 17.0
FS -- -- 8.0
GAJB -- 8.5 41.0
GAPT -- -- --
KNDB -- -- --
KNPM -- -- --
KNRB -- -- --
LP -- -- --
MP -- 52.3 280.0
NC -- -- --
NW -- 2.0 --
WE -- -- --
By main sector:
Agriculture/Farming -- -- --
Building/Construction -- 2.0 --
Business/Professional services -- 2.0 --
Domestic -- -- --
Food/Beverage -- 48.0 8.0
Mining -- -- --
Retail -- 61.0 17.0
Safety/Security (private) -- -- --
National average -- 29.3 86.5
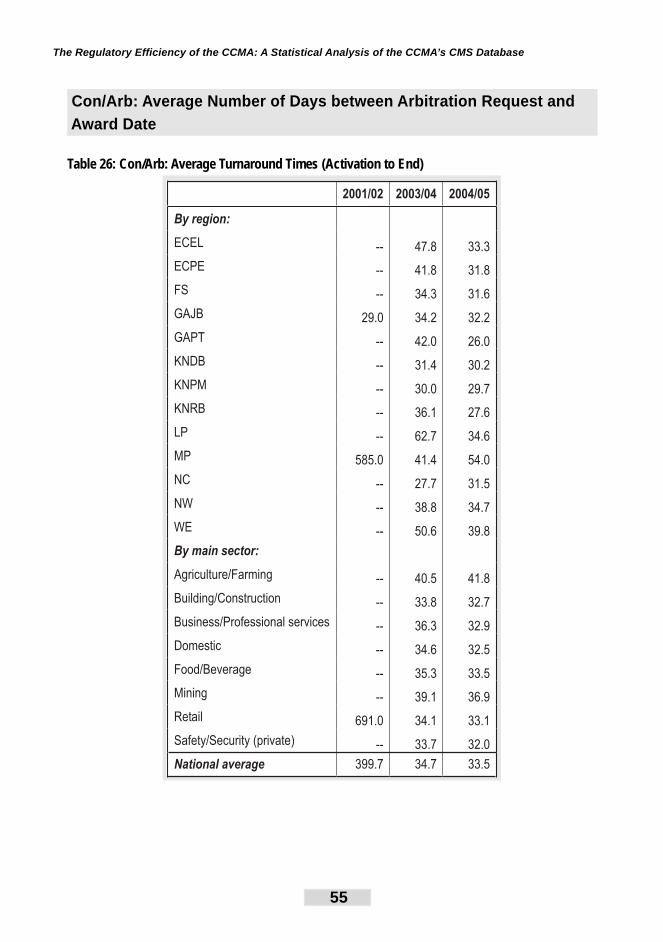
Table 25 shows that the average turnaround time for con-arb is approximately 30 days.
This compares very favourably with the time period for conciliations and arbitrations.
These fi gures appear to include matters referred to con-arb where there is no objection
to the arbitration phase, commencing immediately after the conciliation is completed. In
contrast, Tables 26 refl ect a much larger turn around times for cases in which a party
objects to con-arb and there is then a separate referral to arbitration.
The Regulatory Effi ciency of the CCMA: A Statistical Analysis of the CCMA’s CMS Database
53
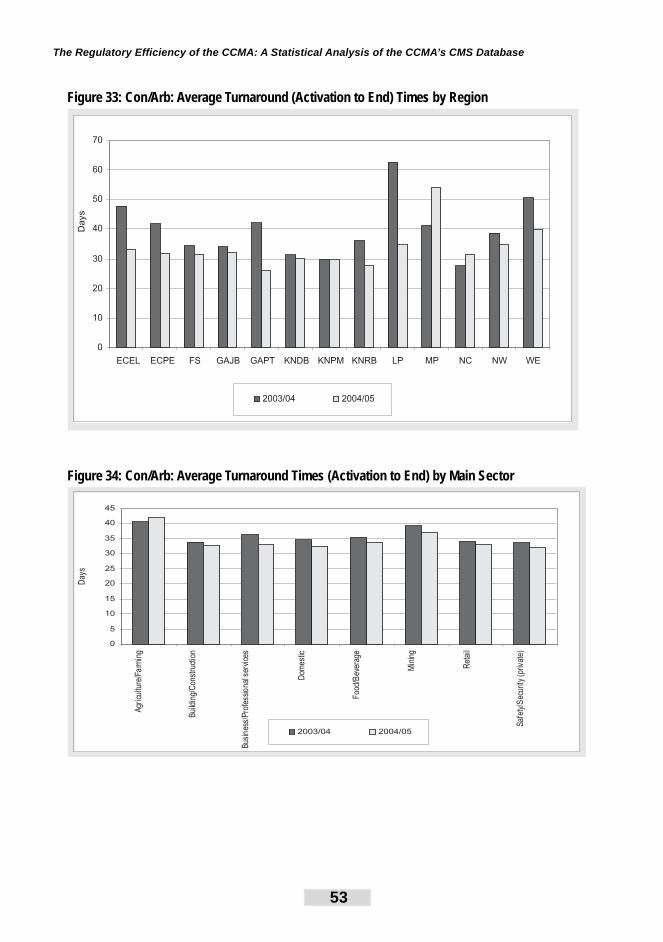
Figure 33: Con/Arb: Average Turnaround (Activation to End) Times by Region
0
10
20
30
40
50
60
70
ECEL ECPE FS GAJB GAPT KNDB KNPM KNRB LP MP NC NW WE
2003/04 2004/05
Days
Figure 34: Con/Arb: Average Turnaround Times (Activation to End) by Main Sector
0
5
10
15
20
25
30
35
40
45
Days
2003/04 2004/05
uA
gri
cult
re/F
arm
ing
Bn
uild
ig/C
onstr
uct
ion
Busin
ess
/Pro
fessi
onals
erv
ices
Dom
estic
Food/B
eve
rage
Min
ing
Reta
il
Safe
ty/S
ecu
rity
(private
)
DPRU WP 06/110 Paul Benjamin and Carola Gruen
54
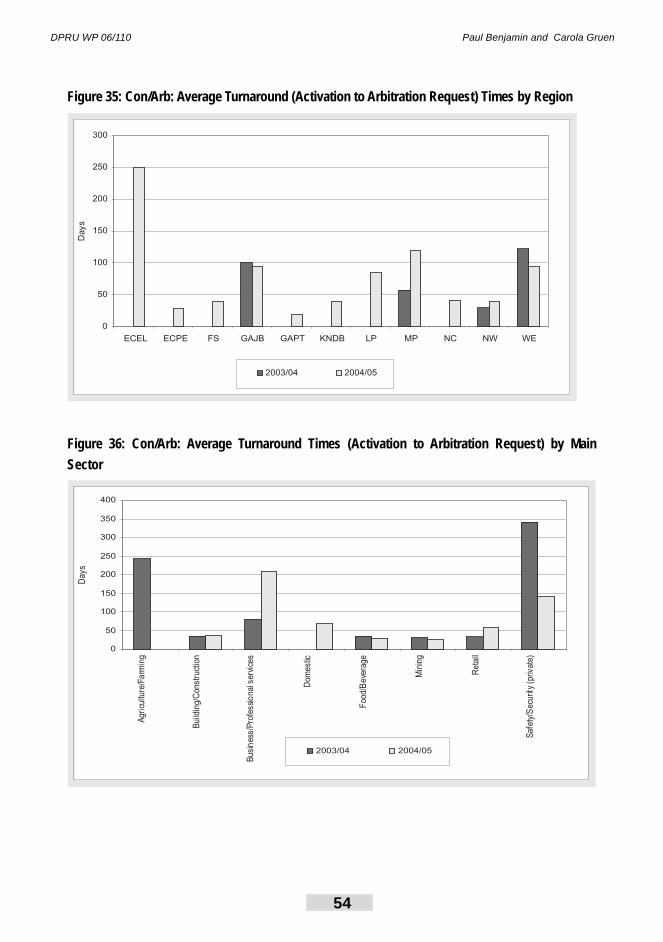
Figure 35: Con/Arb: Average Turnaround (Activation to Arbitration Request) Times by Region
0
50
100
150
200
250
300
ECEL ECPE FS GAJB GAPT KNDB LP MP NC NW WE
Days
2003/04 2004/05
Figure 36: Con/Arb: Average Turnaround Times (Activation to Arbitration Request) by Main
Sector
0
50
100
150
200
250
300
350
400
Days
2003/04 2004/05
uA
gri
cult
re/F
arm
ing
Bn
uildi
g/C
onstr
uction
Busin
ess/P
rofe
ssio
nalserv
ices
Dom
estic
Food/B
evera
ge
Min
ing
Reta
il
Safe
ty/S
ecurity
(private
)
The Regulatory Effi ciency of the CCMA: A Statistical Analysis of the CCMA’s CMS Database
55
Con/Arb: Average Number of Days between Arbitration Request and
Award Date
Table 26: Con/Arb: Average Turnaround Times (Activation to End)
2001/02 2003/04 2004/05
By region:
ECEL -- 47.8 33.3
ECPE -- 41.8 31.8
FS -- 34.3 31.6
GAJB 29.0 34.2 32.2
GAPT -- 42.0 26.0
KNDB -- 31.4 30.2
KNPM -- 30.0 29.7
KNRB -- 36.1 27.6
LP -- 62.7 34.6
MP 585.0 41.4 54.0
NC -- 27.7 31.5
NW -- 38.8 34.7
WE -- 50.6 39.8
By main sector:
Agriculture/Farming -- 40.5 41.8
Building/Construction -- 33.8 32.7
Business/Professional services -- 36.3 32.9
Domestic -- 34.6 32.5
Food/Beverage -- 35.3 33.5
Mining -- 39.1 36.9
Retail 691.0 34.1 33.1
Safety/Security (private) -- 33.7 32.0
National average 399.7 34.7 33.5
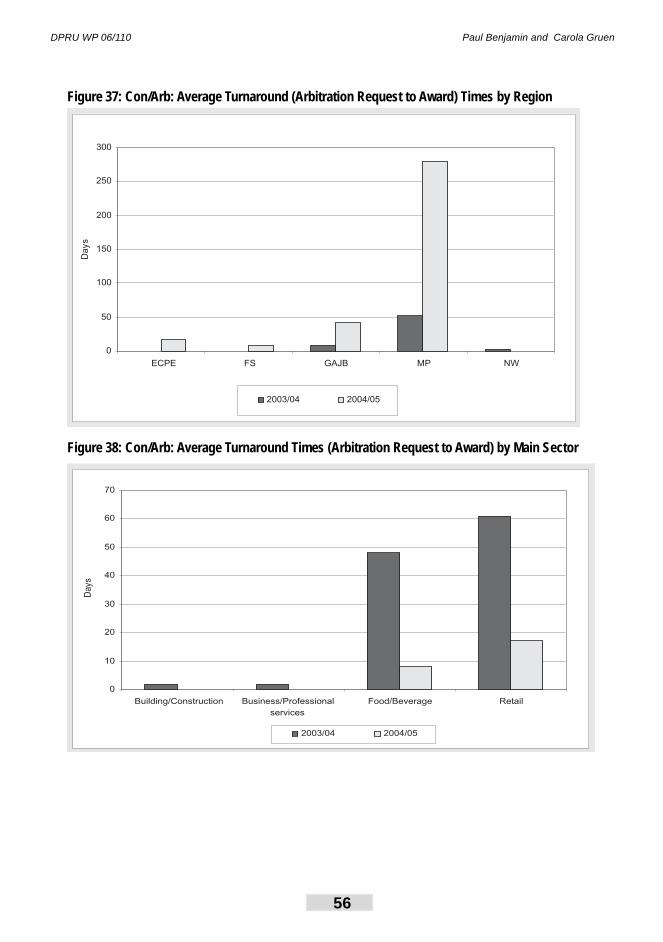
DPRU WP 06/110 Paul Benjamin and Carola Gruen
56
Figure 37: Con/Arb: Average Turnaround (Arbitration Request to Award) Times by Region
0
50
100
150
200
250
300
ECPE FS GAJB MP NW
Days
2003/04 2004/05
Figure 38: Con/Arb: Average Turnaround Times (Arbitration Request to Award) by Main Sector
0
10
20
30
40
50
60
70
Building/Construction Business/Professional
services
Food/Beverage Retail
Days
2003/04 2004/05
The Regulatory Effi ciency of the CCMA: A Statistical Analysis of the CCMA’s CMS Database
57
9. Data not Refl ected in CMS
Employee’s Length of Service
The CMS does not contain any information concerning the length of service of employees
who refer disputes to the CCMA. While an employee’s length of service may not be
of immediate relevance for the administrative purposes of the CMS, it is an issue that
is important for assessing the impact of protection against unfair dismissal on the
economy.
There is a broadly held perception that a substantial proportion of dismissal cases referred
to the CCMA concern employees with an extremely short length of service. This factor is
seen as having a particularly severe ‘chilling’ effect on decisions by employers to employ
additional employees.
Presently, the Unfair Dismissal Code of Practice LRA regulates the issue by allowing
arbitrators to accept “less compelling” reasons to establish the fairness of dismissals
during an initial probationary period of “reasonable duration”. While this does create a
certain relaxation of standards during probation, it does not provide clear guidance either
as to standards or the period in which these are applicable.
The issue of the regulation of probation enjoyed signifi cant attention during the negotiation
of the 2002 LRA Amendment Act. The Explanatory Memorandum to the 2000 LRA
Amendment Bill argued that arbitrators and judges give insuffi cient recognition to the
provisions for a probationary period in the Act and Code. The proposed changes to the Act
to set a six-month probationary period and clarify the applicable rules were not included
in the Amendment Act.18
Internationally, it is common for countries to have a threshold period during which
employees do not have protection against dismissal except for egregious reasons such
as discrimination or trade union victimisation. This is the case in the UK during the fi rst
year of employment.
It would not be unduly onerous for the CCMA to obtain information concerning the length
of service of applicants in dismissal cases either as part of the CMS or as part of special
research project.
18 For an academic commentary see Cohen (2003).
DPRU WP 06/110 Paul Benjamin and Carola Gruen
58
Earnings Level of Applicants
The CMS does not require the recording of information concerning the earnings level of
employees who refer cases to the CCMA. Again, this information is not relevant for the
administrative purposes of the CMS. However, knowledge of the income categories from
which applicants are drawn would assist to assess the economic impact of the CCMA.
It is often argued that the criticism of the CCMA advanced by employers is based on
anecdotal evidence concerning cases brought by middle and high-income employees
rather than semi-skilled and unskilled workers.
An amendment to allow the CCMA to charge arbitration fees to parties involved in disputes
concerning employers earning in excess of a defi ned earnings threshold was proposed
in the 2000 LRA Amendment Bill. The justifi cation for this proposal was that the clause
would encourage the referral of disputes concerning executives, managers and other
highly paid employees to private arbitration. However the clause did not gain the support
of the social partners.
As with the issue of length of service, it would not seem unduly onerous for the CCMA
to obtain information concerning either the income level or job category of applicants in
dismissal cases either as part of the CMS or as part of special research projects.
Size of Employer
The CMS does not contain information concerning the size of employers. As indicated,
reason for this is that the majority of information introduced into this system is obtained
from the employee at the time of instituting a dispute.
There has been no detailed study of the impact of CCMA awards on businesses classifi ed
as SMMEs. However, the case-study by Theron & Godfrey concluded that the imposition
of compensation awards on smaller businesses had a disproportionate effect.
Again, it would not seem unduly onerous for the CCMA to obtain information concerning
size of employer in dismissal cases either as part of the CMS or as part of special research
project.
The Regulatory Effi ciency of the CCMA: A Statistical Analysis of the CCMA’s CMS Database
59
Representation at the CCMA Arbitrations
The question of representation of parties at the CCMA involves a number of distinct
issues. These are:
whether lawyers should have an unfettered right to appear in arbitrations
at the CCMA;
whether the right of trade unions and employers organisations to
appear in proceedings at the CCMA are subject to abuse by “consultant”
organisations;
whether the activities of labour consultants should be regulated.
The study sought to interrogate data on representation as proceedings before the CCMA.
However, the information obtained was not reliable as representation of parties is a non-
mandatory fi eld in the CMS. In view of the signifi cance attached to this issue, it is desirable
that this information should be recorded more effectively in the future.
Legal Representation
The right to lawyers to appear in arbitrations has attracted a considerable literature
(Benjamin 1994, Buirski 1995, Smythe 2003, Collier 2003, Collier 2005). In essence, a
lawyer may only represent a party in an unfair dismissal arbitration if the other party in
the case consents or the Commissioner makes a ruling permitting legal representation
in the light of the nature of the questions of law raised by the dispute, its complexity, the
public interest and the comparative ability of the opposing parties or their representatives
to deal with the arbitration. The restriction on legal representation in the CCMA, has been
the subject of a constitutional challenge. However, to date these arguments have not
succeeded in the Labour Court.19
Collier (2005) records the results of a survey among CCMA commissioners, trade
unions, employees, employers, legal practitioners and academics on attitudes to legal
representation at disciplinary enquiries and CCMA conciliation and arbitration conducted.
Of those surveyed, 46 per cent indicated support for retaining the status quo in respect of
19 See Netherburn Engineering CC t/a Netherburn Ceramics v Mudau & Others (2003) 23 ILJ 1712; Norman Tsie Taxis v Pooe
NO & Others (2004) 25 ILJ 724 (LC) and (2005) 26 ILJ 110 (LC).
a)
b)
c)
DPRU WP 06/110 Paul Benjamin and Carola Gruen
60
legal representation at arbitrations; 41 per cent believed that legal representation should
be allowed at all arbitrations and 12 per cent believed that legal representation should not
be allowed at any representation.
Trade Unions and Employers’ Organisations
The amendment introduced in the 2002 LRA Amendment Bill confi ning registration to
“genuine trade unions and employers organisations and providing for guidelines for the
registration or de-registration of trade unions and employers organisations” has lead
to a signifi cant decrease in the number of registered trade unions in particular due to
deregistration. However, it is not known to what extent trade unions and employers that
are in fact no more than consultancies operating under the guise of trade unions or
employer’s organisation continue to operate and appear at the CCMA.
Accurate information concerning patterns of representation would give an important
indication as to the cost of disputes for employers as the engaging of lawyers or other
advisors represent a signifi cant cost factor. 20 It may also give signifi cant information as to
the reasons for particular patterns in proceedings at the CCMA.
20 As these are tax-deductible expenses, a proportion of that cost is borne by the state through reduced taxation.
The Regulatory Effi ciency of the CCMA: A Statistical Analysis of the CCMA’s CMS Database
61
10. Conclusion
In order to understand the impact of legislation it is necessary to examine the “legislative,
administrative and judicial actions which interact with regulated institutions, benefi ciary
organisations and individuals to achieve a real world response to a legislative standard”.
(Blumrosen)
This study has sought to focus on statistical indicators bearing on the administrative
effi ciency of the CCMA as well as the outcome of proceedings as a basis for assessing
its regulatory effi ciency.
One of the conclusions of this report is that there are marked differences in the patterns
of dispute resolution and the outcome of disputes in different regions. This is particularly
true of the implementation of con-arb systems as well in respect of the balance of awards
in favour of employers and employees respectively. A closer scrutiny of these differences
linked to an understanding of regional difference in institutional cultures and practices
could contribute to an improved understanding of the successes and failures of the
CCMA.
It was envisaged that the CCMA would provide “simple, non-legalistic and non-jurisdictional
procedures” for dispute resolution. As Judge Pillay has pointed out, this is not an accurate
description of the CCMA’s current operation. Indicative of this is the rising level of in
limine and rescission applications and the high level (although not fully documented) of
review applications.
The review judgments of the Labour Courts constitute the body of law that must be
complied with by the CCMA and it is essential that a mechanism should be found to revise
the Code of Good Practice: Dismissal to refl ect changes in the law.
This study sought to ascertain the extent to which an interrogation of the database of
the CCMA could produce a greater understanding of the impact of the CCMA on the
labour market. This database was designed for purposes of case-management and this
orientation is refl ected in the information contained in it. While this information gives a
picture of the operation of the CCMA, additional information is required to assess the
impact of the CCMA on particular categories of employers, to ascertain which categories
of employees utilise its services and to inform policy decisions on whether legislative
changes should be introduced.
DPRU WP 06/110 Paul Benjamin and Carola Gruen
62
It will be appropriate for the social partners to assess their information needs. An expansion
of the CMS database to collect additional information would impose additional costs and
further stretch the resources of the administration. An alternative approach would be to
conduct further research by means such as qualitative analysis, case-studies and the
analysis of individual arbitration decisions.
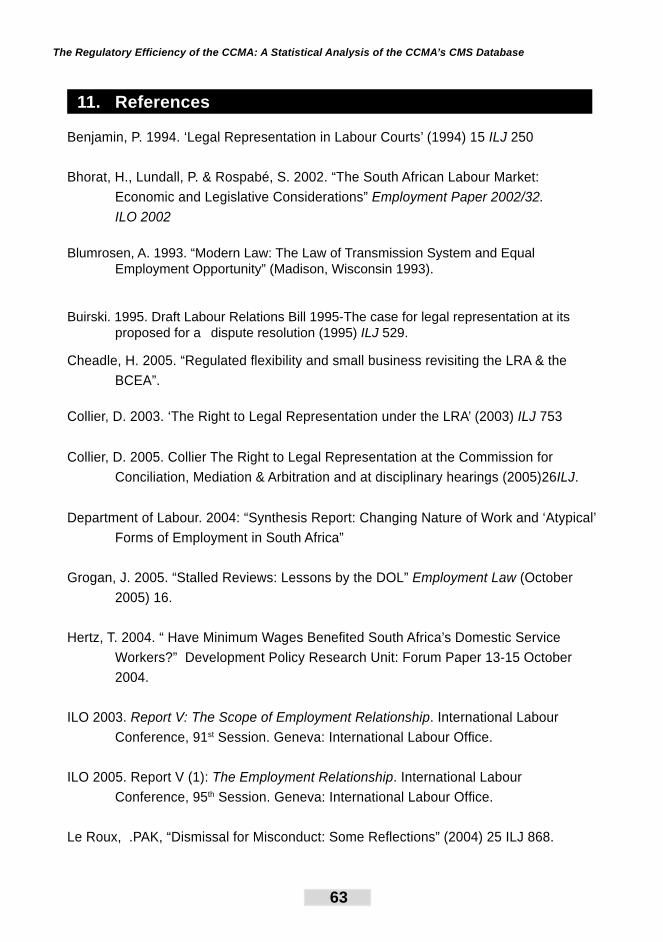
The Regulatory Effi ciency of the CCMA: A Statistical Analysis of the CCMA’s CMS Database
63
11. References
Benjamin, P. 1994. ‘Legal Representation in Labour Courts’ (1994) 15 ILJ 250
Bhorat, H., Lundall, P. & Rospabé, S. 2002. “The South African Labour Market:
Economic and Legislative Considerations” Employment Paper 2002/32.
ILO 2002
Blumrosen, A. 1993. “Modern Law: The Law of Transmission System and Equal Employment Opportunity” (Madison, Wisconsin 1993).
Buirski. 1995. Draft Labour Relations Bill 1995-The case for legal representation at its proposed for a dispute resolution (1995) ILJ 529.
Cheadle, H. 2005. “Regulated fl exibility and small business revisiting the LRA & the
BCEA”.
Collier, D. 2003. ‘The Right to Legal Representation under the LRA’ (2003) ILJ 753
Collier, D. 2005. Collier The Right to Legal Representation at the Commission for
Conciliation, Mediation & Arbitration and at disciplinary hearings (2005)26ILJ.
Department of Labour. 2004: “Synthesis Report: Changing Nature of Work and ‘Atypical’
Forms of Employment in South Africa”
Grogan, J. 2005. “Stalled Reviews: Lessons by the DOL” Employment Law (October
2005) 16.
Hertz, T. 2004. “ Have Minimum Wages Benefi ted South Africa’s Domestic Service
Workers?” Development Policy Research Unit: Forum Paper 13-15 October
2004.
ILO 2003. Report V: The Scope of Employment Relationship. International Labour
Conference, 91st Session. Geneva: International Labour Offi ce.
ILO 2005. Report V (1): The Employment Relationship. International Labour
Conference, 95th Session. Geneva: International Labour Offi ce.
Le Roux, .PAK, “Dismissal for Misconduct: Some Refl ections” (2004) 25 ILJ 868.
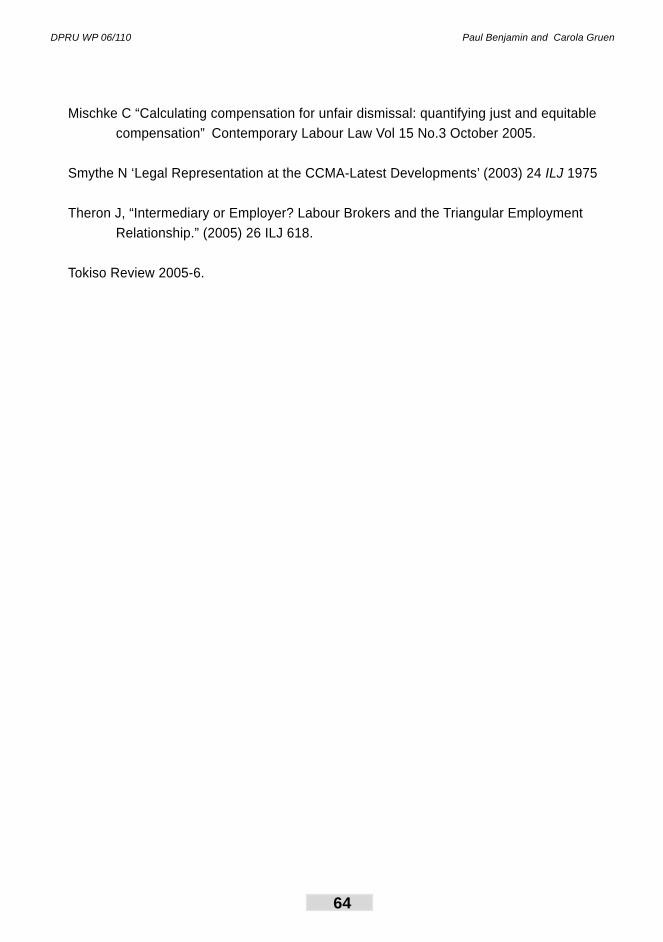
DPRU WP 06/110 Paul Benjamin and Carola Gruen
64
Mischke C “Calculating compensation for unfair dismissal: quantifying just and equitable
compensation” Contemporary Labour Law Vol 15 No.3 October 2005.
Smythe N ‘Legal Representation at the CCMA-Latest Developments’ (2003) 24 ILJ 1975
Theron J, “Intermediary or Employer? Labour Brokers and the Triangular Employment
Relationship.” (2005) 26 ILJ 618.
Tokiso Review 2005-6.
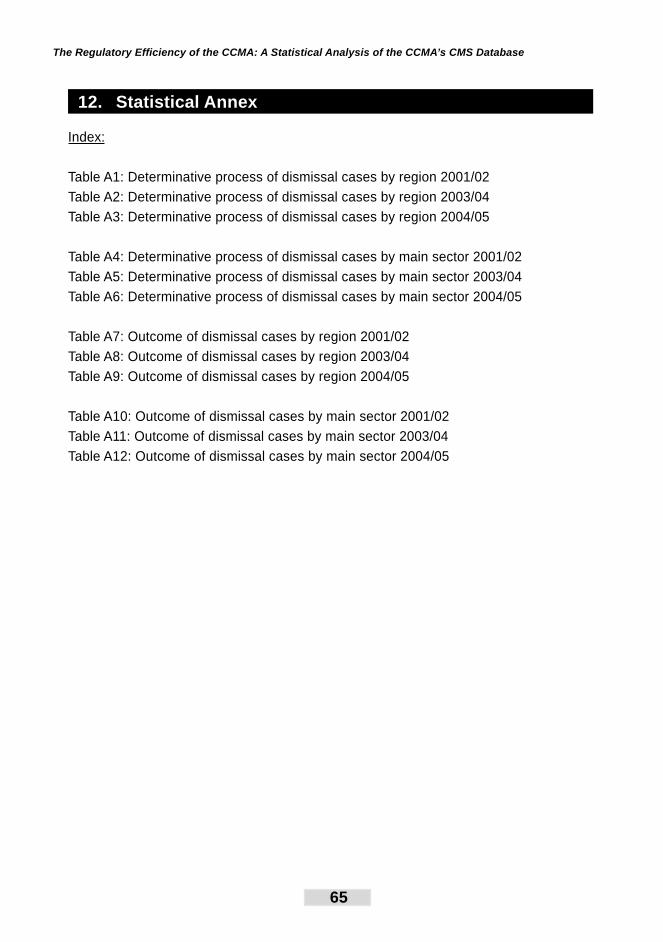
The Regulatory Effi ciency of the CCMA: A Statistical Analysis of the CCMA’s CMS Database
65
12. Statistical Annex
Index:
Table A1: Determinative process of dismissal cases by region 2001/02
Table A2: Determinative process of dismissal cases by region 2003/04
Table A3: Determinative process of dismissal cases by region 2004/05
Table A4: Determinative process of dismissal cases by main sector 2001/02
Table A5: Determinative process of dismissal cases by main sector 2003/04
Table A6: Determinative process of dismissal cases by main sector 2004/05
Table A7: Outcome of dismissal cases by region 2001/02
Table A8: Outcome of dismissal cases by region 2003/04
Table A9: Outcome of dismissal cases by region 2004/05
Table A10: Outcome of dismissal cases by main sector 2001/02
Table A11: Outcome of dismissal cases by main sector 2003/04
Table A12: Outcome of dismissal cases by main sector 2004/05
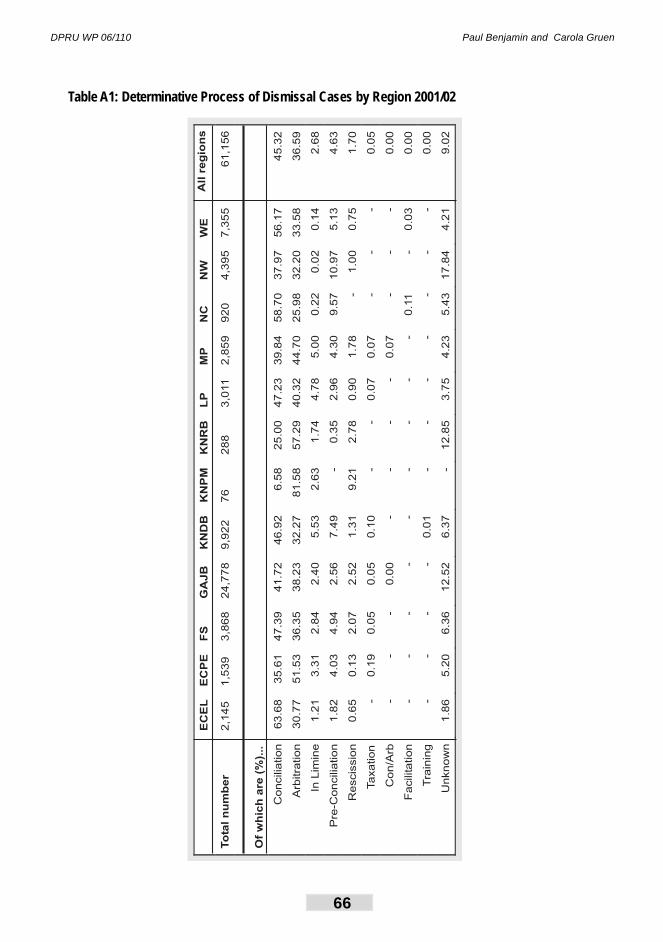
DPRU WP 06/110 Paul Benjamin and Carola Gruen
66
Table A1: Determinative Process of Dismissal Cases by Region 2001/02
EC
EL
EC
PE
FS
GA
JB
KN
DB
KN
PM
KN
RB
LP
MP
NC
NW
WE
All
reg
ion
s
To
taln
um
ber
2,1
45
1,5
39
3,8
68
24,7
78
9,9
22
76
288
3,0
11
2,8
59
920
4,3
95
7,3
55
Of
wh
ich
are
(%).
..
Concilia
tion
63.6
835.6
147.3
941.7
246.9
26.5
825.0
047.2
339.8
458.7
037.9
756.1
7
Arb
itra
tion
30.7
751.5
336.3
538.2
332.2
781.5
857.2
940.3
244.7
025.9
832.2
033.5
8
InLim
ine
1.2
13.3
12.8
42.4
05.5
32.6
31.7
44.7
85.0
00.2
20.0
20.1
4
-Co
ncilia
tio
n1
.82
4.0
34
.94
2.5
67
.49
-0.3
52.9
64.3
09.5
710.9
75.1
3
Rescis
sio
n0.6
50.1
32.0
72.5
21.3
19.2
12.7
80.9
01.7
8-
1.0
00.7
5
Taxation
-0.1
90.0
50.0
50.1
0-
-0.0
70.0
7-
--
Con/A
rb-
--
0.0
0-
--
-0.0
7-
--
Facilitation
--
--
--
--
-0.1
1-
0.0
3
Tra
inin
g-
--
-0.0
1-
--
--
--
Unknow
n1.8
65.2
06.3
612.5
26.3
7-
12.8
53.7
54.2
35.4
317.8
44.2
1
61,1
56
45.3
2
36.5
9
2.6
8
Pre
4.6
3
1.7
0
0.0
5
0.0
0
0.0
0
0.0
0
9.0
2
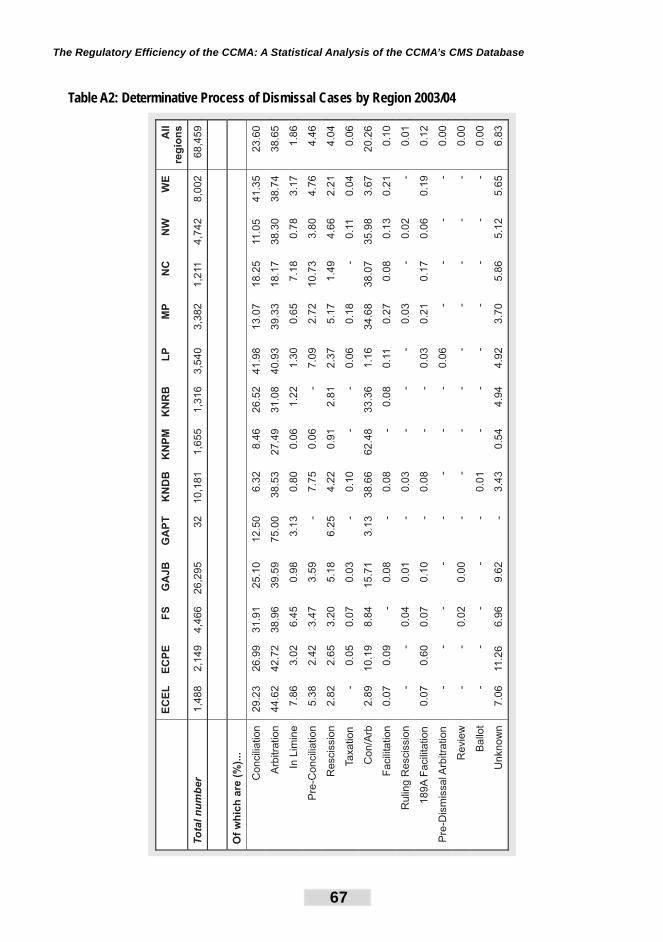
The Regulatory Effi ciency of the CCMA: A Statistical Analysis of the CCMA’s CMS Database
67
Table A2: Determinative Process of Dismissal Cases by Region 2003/04
EC
EL
EC
PE
FS
GA
JB
GA
PT
KN
DB
KN
PM
KN
RB
LP
MP
NC
NW
WE
All
reg
ion
s
To
taln
um
ber
1,4
88
2,1
49
4,4
66
26,2
95
32
10,1
81
1,6
55
1,3
16
3,5
40
3,3
82
1,2
11
4,7
42
8,0
02
68,4
59
Of
wh
ich
are
(%).
..
Concili
ation
29.2
326.9
931.9
125.1
012.5
06.3
28.4
626.5
241.9
813.0
718.2
511.0
541.3
523.6
0
Arb
itra
tion
44.6
242.7
238.9
639.5
975.0
038.5
327.4
931.0
840.9
339.3
318.1
738.3
038.7
438.6
5
InLim
ine
7.8
63.0
26.4
50.9
83.1
30.8
00.0
61.2
21.3
00.6
57.1
80.7
83.1
71.8
6
Pre
-Co
ncili
atio
n5
.38
2.4
23
.47
3.5
9-
7.7
50.0
6-
7.0
92.7
210.7
33.8
04.7
64.4
6
Rescis
sio
n2.8
22.6
53.2
05.1
86.2
54.2
20.9
12.8
12.3
75.1
71.4
94.6
62.2
14.0
4
Taxation
-0.0
50.0
70.0
3-
0.1
0-
-0.0
60.1
8-
0.1
10.0
40.0
6
Con/A
rb2.8
910.1
98.8
415.7
13.1
338.6
662.4
833.3
61.1
634.6
838.0
735.9
83.6
720.2
6
Facili
tation
0.0
70.0
9-
0.0
8-
0.0
8-
0.0
80.1
10.2
70.0
80.1
30.2
10.1
0
Rulin
gR
escis
sio
n-
-0.0
40.0
1-
0.0
3-
--
0.0
3-
0.0
2-
0.0
1
189A
Facili
tation
0.0
70.6
00.0
70.1
0-
0.0
8-
-0.0
30.2
10.1
70.0
60.1
90.1
2
Pre
-Dis
mis
sa
l Arb
itra
tion
--
--
--
--
0.0
6-
--
-0.0
0
Revie
w-
-0.0
20.0
0-
--
--
--
--
0.0
0
Ballo
t-
--
--
0.0
1-
--
--
--
0.0
0
Unknow
n7.0
611.2
66.9
69.6
2-
3.4
30.5
44.9
44.9
23.7
05.8
65.1
25.6
56.8
3
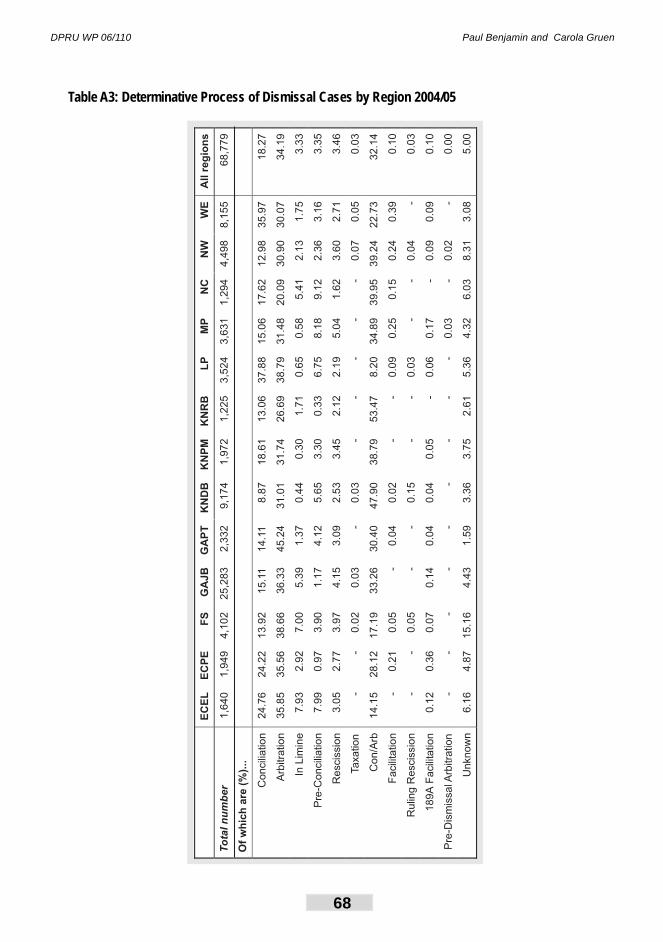
DPRU WP 06/110 Paul Benjamin and Carola Gruen
68
Table A3: Determinative Process of Dismissal Cases by Region 2004/05
EC
EL
EC
PE
FS
GA
JB
GA
PT
KN
DB
KN
PM
KN
RB
LP
MP
NC
NW
WE
All
reg
ion
s
To
taln
um
ber
1,6
40
1,9
49
4,1
02
25,2
83
2,3
32
9,1
74
1,9
72
1,2
25
3,5
24
3,6
31
1,2
94
4,4
98
8,1
55
68
,77
9
Of
wh
ich
are
(%).
..
Concili
ation
24.7
624.2
213.9
215.1
114.1
18.8
718.6
113.0
637.8
815.0
617.6
212.9
835.9
718.2
7
Arb
itra
tion
35.8
535.5
638.6
636.3
345.2
431.0
131.7
426.6
938.7
931.4
820.0
930.9
030.0
734.1
9
InLim
ine
7.9
32.9
27.0
05.3
91.3
70.4
40.3
01.7
10.6
50.5
85.4
12.1
31.7
53.3
3
Pre
-Concili
ation
7.9
90.9
73.9
01.1
74.1
25.6
53.3
00.3
36.7
58.1
89.1
22.3
63.1
63.3
5
Rescis
sio
n3.0
52.7
73.9
74.1
53.0
92.5
33.4
52.1
22.1
95.0
41.6
23.6
02.7
13.4
6
Taxation
--
0.0
20.0
3-
0.0
3-
--
--
0.0
70.0
50.0
3
Con/A
rb14.1
528.1
217.1
933.2
630.4
047.9
038.7
953.4
78.2
034.8
939.9
539.2
422.7
332.1
4
Facili
tation
-0.2
10.0
5-
0.0
40.0
2-
-0.0
90.2
50.1
50.2
40.3
90.1
0
Rulin
gR
escis
sio
n-
-0.0
5-
-0.1
5-
-0.0
3-
-0.0
4-
0.0
3
189A
Facili
tation
0.1
20.3
60.0
70.1
40.0
40.0
40.0
5-
0.0
60.1
7-
0.0
90.0
90.1
0
Pre
-Dis
mis
sa
l Arb
itra
tion
--
--
--
--
-0.0
3-
0.0
2-
0.0
0
Unknow
n6.1
64.8
715.1
64.4
31.5
93.3
63.7
52.6
15.3
64.3
26.0
38.3
13.0
85.0
0
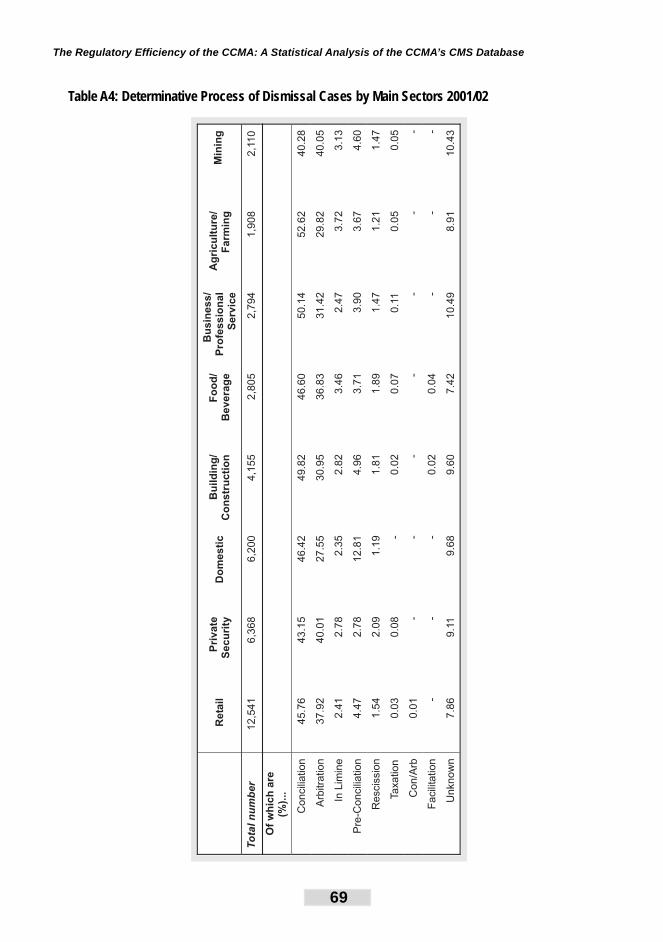
The Regulatory Effi ciency of the CCMA: A Statistical Analysis of the CCMA’s CMS Database
69
Table A4: Determinative Process of Dismissal Cases by Main Sectors 2001/02
Reta
ilP
rivate
Secu
rity
Do
mesti
cB
uild
ing
/C
on
str
ucti
on
Fo
od
/B
evera
ge
Bu
sin
ess/
Pro
fessio
nal
Serv
ice
Ag
ricu
ltu
re/
Farm
ing
Min
ing
To
taln
um
ber
12,5
41
6,3
68
6,2
00
4,1
55
2,8
05
2,7
94
1,9
08
2,1
10
Of
wh
ich
are
(%).
..
Concili
ation
45.7
643.1
546.4
249.8
246.6
050.1
452.6
240.2
8
Arb
itra
tion
37.9
240.0
127.5
530.9
536.8
331.4
229.8
240.0
5
InLim
ine
2.4
12.7
82.3
52.8
23.4
62.4
73.7
23.1
3
Pre
-Co
ncili
atio
n4.4
72.7
812.8
14.9
63.7
13.9
03.6
74.6
0
Rescis
sio
n1.5
42.0
91.1
91.8
11.8
91.4
71.2
11.4
7
Taxation
0.0
30.0
8-
0.0
20.0
70.1
10.0
50.0
5
Con/A
rb0.0
1-
--
--
--
Facili
tation
--
-0.0
20.0
4-
--
Unknow
n7.8
69.1
19.6
89.6
07.4
210.4
98.9
110.4
3
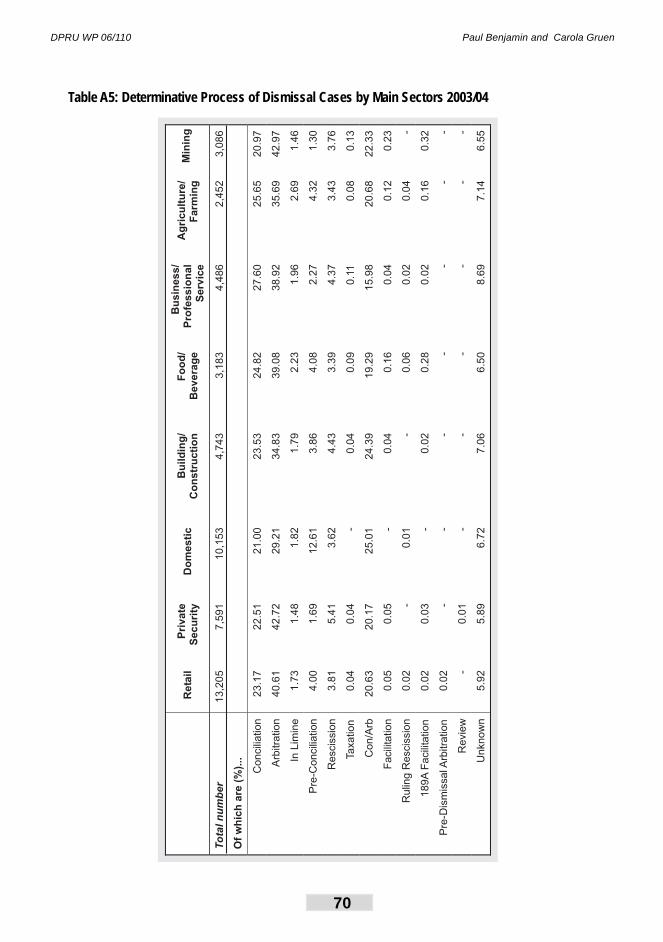
DPRU WP 06/110 Paul Benjamin and Carola Gruen
70
Table A5: Determinative Process of Dismissal Cases by Main Sectors 2003/04
Reta
ilP
rivate
Secu
rity
Do
mesti
cB
uild
ing
/C
on
str
ucti
on
Fo
od
/B
evera
ge
Bu
sin
ess/
Pro
fessio
nal
Serv
ice
Ag
ricu
ltu
re/
Farm
ing
Min
ing
To
taln
um
ber
13,2
05
7,5
91
10,1
53
4,7
43
3,1
83
4,4
86
2,4
52
3,0
86
Of
wh
ich
are
(%).
..
Concili
ation
23.1
722.5
121.0
023.5
324.8
227.6
025.6
520.9
7
Arb
itra
tion
40.6
142.7
229.2
134.8
339.0
838.9
235.6
942.9
7
InLim
ine
1.7
31.4
81.8
21.7
92.2
31.9
62.6
91.4
6
Pre
-Co
ncili
atio
n4.0
01.6
912.6
13.8
64.0
82.2
74.3
21.3
0
Rescis
sio
n3.8
15.4
13.6
24.4
33.3
94.3
73.4
33.7
6
Taxation
0.0
40.0
4-
0.0
40.0
90.1
10.0
80.1
3
Con/A
rb20.6
320.1
725.0
124.3
919.2
915.9
820.6
822.3
3
Facili
tation
0.0
50.0
5-
0.0
40.1
60.0
40.1
20.2
3
Rulin
gR
escis
sio
n0.0
2-
0.0
1-
0.0
60.0
20.0
4-
189A
Facili
tation
0.0
20.0
3-
0.0
20.2
80.0
20.1
60.3
2
Pre
-Dis
mis
sa
l Arb
itra
tion
0.0
2-
--
--
--
Revie
w-
0.0
1-
--
--
-
Unknow
n5.9
25.8
96.7
27.0
66.5
08.6
97.1
46.5
5
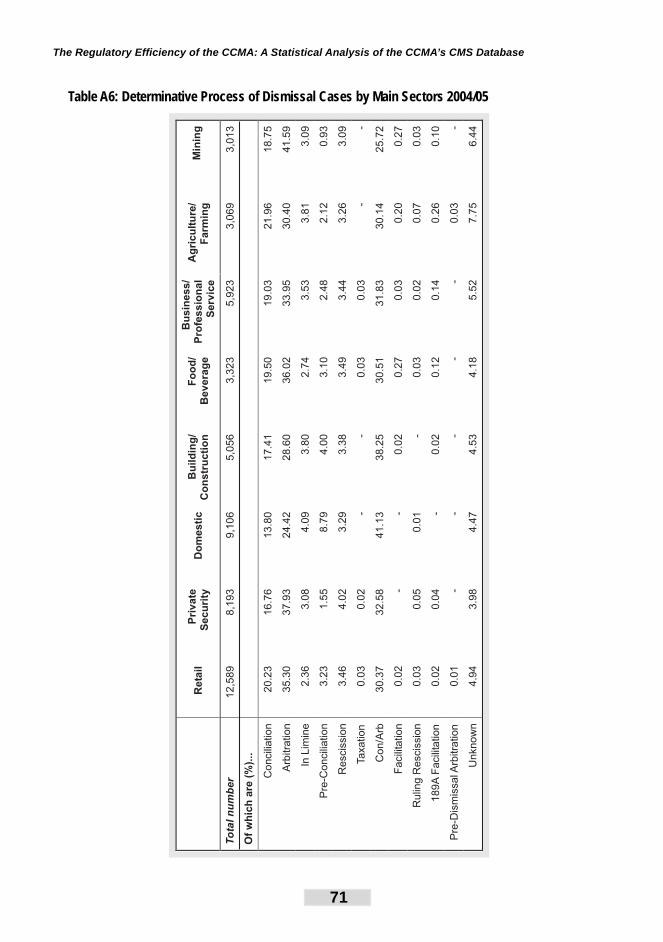
The Regulatory Effi ciency of the CCMA: A Statistical Analysis of the CCMA’s CMS Database
71
Table A6: Determinative Process of Dismissal Cases by Main Sectors 2004/05
Reta
ilP
rivate
Secu
rity
Do
me
sti
cB
uild
ing
/C
on
str
ucti
on
Fo
od
/B
evera
ge
Bu
sin
ess/
Pro
fessio
nal
Serv
ice
Ag
ricu
ltu
re/
Farm
ing
To
taln
um
ber
12,5
89
8,1
93
9,1
06
5,0
56
3,3
23
5,9
23
3,0
69
Of
wh
ich
are
(%).
..
Concili
ation
20.2
316.7
613.8
017.4
119.5
019.0
321.9
6
Arb
itra
tion
35.3
037.9
324.4
228.6
036.0
233.9
530.4
0
InLim
ine
2.3
63.0
84.0
93.8
02.7
43.5
33.8
1
Pre
-Co
ncili
atio
n3.2
31.5
58.7
94.0
03.1
02.4
82.1
2
Rescis
sio
n3.4
64.0
23.2
93.3
83.4
93.4
43.2
6
Taxation
0.0
30.0
2-
-0.0
30.0
3-
Con/A
rb30.3
732.5
841.1
338.2
530.5
131.8
330.1
4
Facili
tation
0.0
2-
-0.0
20.2
70.0
30.2
0
Rulin
gR
escis
sio
n0.0
30.0
50.0
1-
0.0
30.0
20.0
7
189A
Facili
tation
0.0
20.0
4-
0.0
20.1
20.1
40.2
6
Dis
mis
sal A
rbitra
tion
0.0
1-
--
--
0.0
3
Unknow
n4.9
43.9
84.4
74.5
34.1
85.5
27.7
5
Min
ing
3,0
13
18.7
5
41.5
9
3.0
9
0.9
3
3.0
9 -
25.7
2
0.2
7
0.0
3
0.1
0
Pre
--
6.4
4
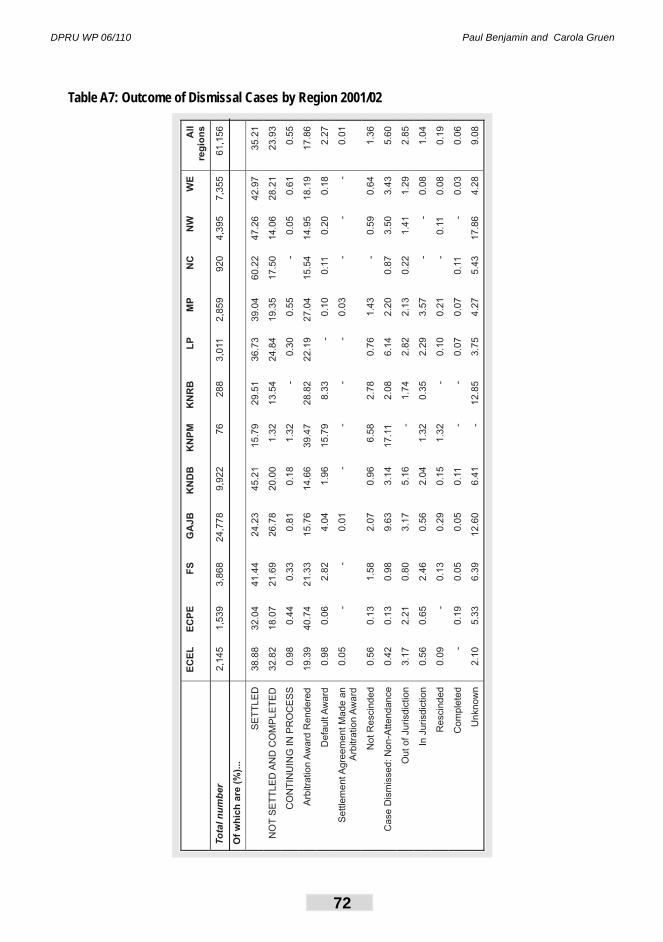
DPRU WP 06/110 Paul Benjamin and Carola Gruen
72
Table A7: Outcome of Dismissal Cases by Region 2001/02
EC
EL
EC
PE
FS
GA
JB
KN
DB
KN
PM
KN
RB
LP
MP
NC
NW
WE
All
reg
ion
s
To
taln
um
ber
2,1
45
1,5
39
3,8
68
24,7
78
9,9
22
76
288
3,0
11
2,8
59
920
4,3
95
7,3
55
61,1
56
Of
wh
ich
are
(%).
..
SE
TT
LE
D38.8
832.0
441.4
424.2
345.2
115.7
929.5
136.7
339.0
460.2
247.2
642.9
735.2
1
NO
TS
ET
TLE
DA
ND
CO
MP
LE
TE
D32.8
218.0
721.6
926.7
820.0
01.3
213.5
424.8
419.3
517.5
014.0
628.2
123.9
3
CO
NT
INU
ING
INP
RO
CE
SS
0.9
80.4
40.3
30.8
10.1
81.3
2-
0.3
00.5
5-
0.0
50.6
10.5
5
Arb
itra
tion
Aw
ard
Rendere
d19.3
940.7
421.3
315.7
614.6
639.4
728.8
222.1
927.0
415.5
414.9
518.1
917.8
6
Defa
ult
Aw
ard
0.9
80.0
62.8
24.0
41.9
615.7
98.3
3-
0.1
00.1
10.2
00.1
82.2
7
Settle
me
ntA
gre
em
entM
ade
an
Arb
itra
tion
Aw
ard
0.0
5-
-0.0
1-
--
-0.0
3-
--
0.0
1
NotR
escin
ded
0.5
60.1
31.5
82.0
70.9
66.5
82.7
80.7
61.4
3-
0.5
90.6
41.3
6
Case
Dis
mis
sed:N
on
-Attendance
0.4
20.1
30.9
89.6
33.1
417.1
12.0
86.1
42.2
00.8
73.5
03.4
35.6
0
Out
ofJurisdic
tion
3.1
72.2
10.8
03.1
75.1
6-
1.7
42.8
22.1
30.2
21.4
11.2
92.8
5
InJurisdic
tion
0.5
60.6
52.4
60.5
62.0
41.3
20.3
52.2
93.5
7-
-0.0
81.0
4
Rescin
ded
0.0
9-
0.1
30.2
90.1
51.3
2-
0.1
00.2
1-
0.1
10.0
80.1
9
Com
ple
ted
-0.1
90.0
50.0
50.1
1-
-0.0
70.0
70.1
1-
0.0
30.0
6
Unknow
n2.1
05.3
36.3
912.6
06.4
1-
12.8
53.7
54.2
75.4
317.8
64.2
89.0
8
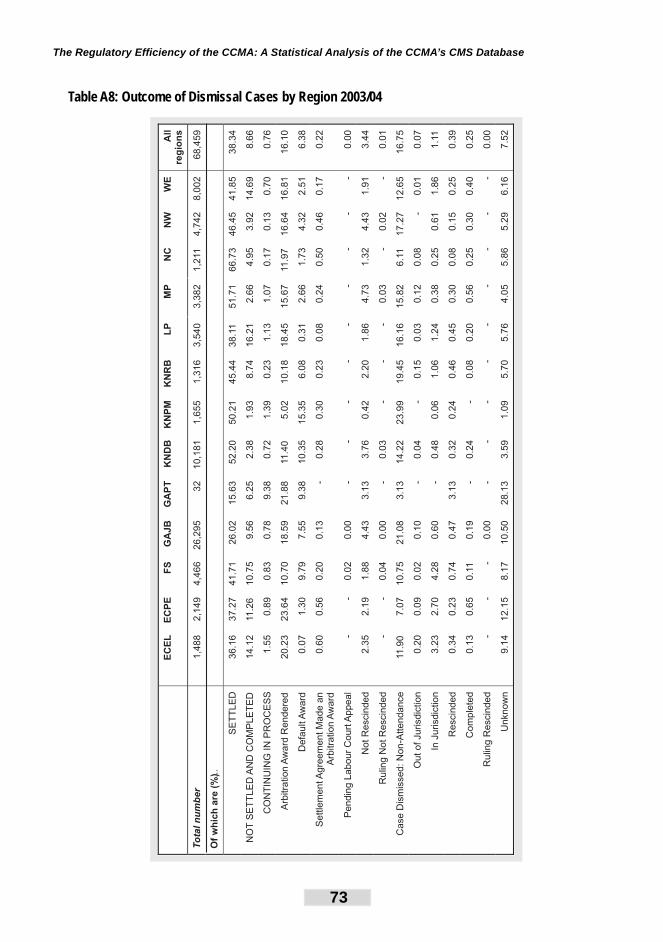
The Regulatory Effi ciency of the CCMA: A Statistical Analysis of the CCMA’s CMS Database
73
Table A8: Outcome of Dismissal Cases by Region 2003/04
EC
EL
EC
PE
FS
GA
JB
GA
PT
KN
DB
KN
PM
KN
RB
LP
MP
NC
NW
WE
All
reg
ion
s
To
taln
um
ber
1,4
88
2,1
49
4,4
66
26,2
95
32
10,1
81
1,6
55
1,3
16
3,5
40
3,3
82
1,2
11
4,7
42
8,0
02
68,4
59
Of
wh
ich
are
(%)...
SE
TT
LE
D36.1
637.2
741.7
126.0
215.6
352.2
050.2
145.4
438.1
151.7
166.7
346.4
541.8
538.3
4
NO
TS
ET
TLE
DA
ND
CO
MP
LE
TE
D14.1
211.2
610.7
59.5
66.2
52.3
81.9
38.7
416.2
12.6
64.9
53.9
214.6
98.6
6
CO
NT
INU
ING
INP
RO
CE
SS
1.5
50.8
90.8
30.7
89.3
80.7
21.3
90.2
31.1
31.0
70.1
70.1
30.7
00.7
6
Arb
itra
tion
Aw
ard
Rendere
d20.2
323.6
410.7
018.5
921.8
811.4
05.0
210.1
818.4
515.6
711.9
716.6
416.8
116.1
0
Defa
ult
Aw
ard
0.0
71.3
09.7
97.5
59.3
810.3
515.3
56.0
80.3
12.6
61.7
34.3
22.5
16.3
8
Settle
mentA
gre
em
entM
ade
an
Arb
itra
tion
Aw
ard
0.6
00.5
60.2
00.1
3-
0.2
80.3
00.2
30.0
80.2
40.5
00.4
60.1
70.2
2
Pendin
gLabour
Court
Appeal
--
0.0
20.0
0-
--
--
--
--
0.0
0
NotR
escin
ded
2.3
52.1
91.8
84.4
33.1
33.7
60.4
22.2
01.8
64.7
31.3
24.4
31.9
13.4
4
Rulin
gN
otR
escin
ded
--
0.0
40.0
0-
0.0
3-
--
0.0
3-
0.0
2-
0.0
1
Case
Dis
mis
sed:N
on
-Attendance
11.9
07.0
710.7
521.0
83.1
314.2
223.9
919.4
516.1
615.8
26.1
117.2
712.6
516.7
5
OutofJurisdic
tion
0.2
00.0
90.0
20.1
0-
0.0
4-
0.1
50.0
30.1
20.0
8-
0.0
10.0
7
InJurisdic
tion
3.2
32.7
04.2
80.6
0-
0.4
80.0
61.0
61.2
40.3
80.2
50.6
11.8
61.1
1
Rescin
ded
0.3
40.2
30.7
40.4
73.1
30.3
20.2
40.4
60.4
50.3
00.0
80.1
50.2
50.3
9
Com
ple
ted
0.1
30.6
50.1
10.1
9-
0.2
4-
0.0
80.2
00.5
60.2
50.3
00.4
00.2
5
Rulin
gR
escin
ded
--
-0.0
0-
--
--
--
--
0.0
0
Unknow
n9.1
412.1
58.1
710.5
028.1
33.5
91.0
95.7
05.7
64.0
55.8
65.2
96.1
67.5
2
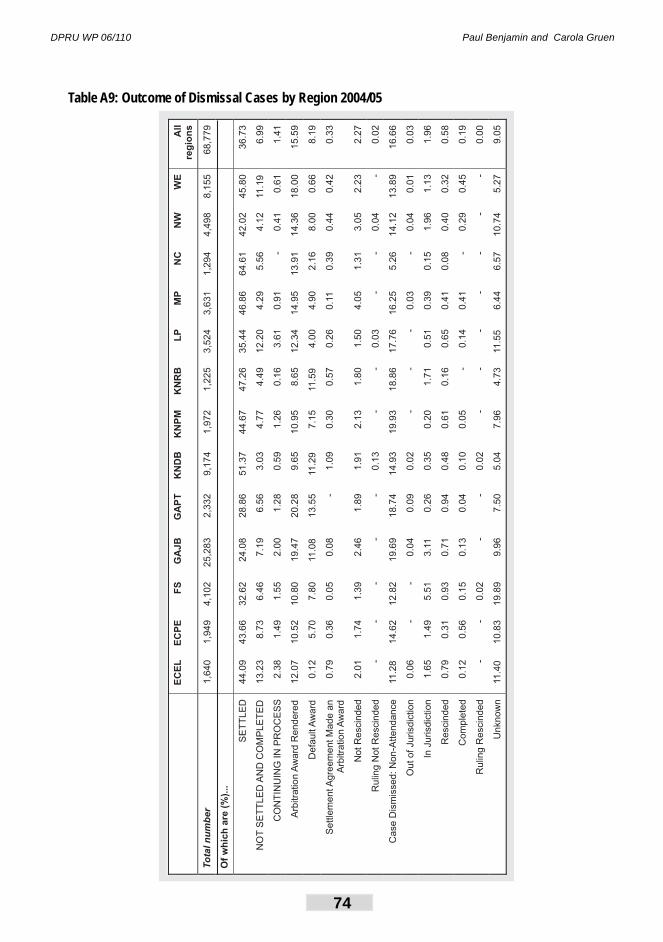
DPRU WP 06/110 Paul Benjamin and Carola Gruen
74
Table A9: Outcome of Dismissal Cases by Region 2004/05
EC
EL
EC
PE
FS
GA
JB
GA
PT
KN
DB
KN
PM
KN
RB
LP
MP
NC
NW
WE
All
reg
ion
s
To
tal
nu
mb
er
1,6
40
1,9
49
4,1
02
25
,28
32
,33
29
,17
41
,97
21
,22
53
,52
43
,63
11
,29
44
,49
88
,15
56
8,7
79
Of
wh
ich
are
(%).
..
SE
TT
LE
D4
4.0
94
3.6
63
2.6
22
4.0
82
8.8
65
1.3
74
4.6
74
7.2
63
5.4
44
6.8
66
4.6
14
2.0
24
5.8
03
6.7
3
NO
TS
ET
TL
ED
AN
DC
OM
PL
ET
ED
13
.23
8.7
36
.46
7.1
96
.56
3.0
34
.77
4.4
91
2.2
04
.29
5.5
64
.12
11
.19
6.9
9
CO
NT
INU
ING
INP
RO
CE
SS
2.3
81
.49
1.5
52
.00
1.2
80
.59
1.2
60
.16
3.6
10
.91
-0
.41
0.6
11
.41
Arb
itra
tio
nA
wa
rdR
en
de
red
12
.07
10
.52
10
.80
19
.47
20
.28
9.6
51
0.9
58
.65
12
.34
14
.95
13
.91
14
.36
18
.00
15
.59
De
fau
ltA
wa
rd0
.12
5.7
07
.80
11
.08
13
.55
11
.29
7.1
511
.59
4.0
04
.90
2.1
68
.00
0.6
68
.19
Se
ttle
me
ntA
gre
em
en
tM
ad
ea
nA
rbitra
tio
nA
wa
rd0
.79
0.3
60
.05
0.0
8-
1.0
90
.30
0.5
70
.26
0.1
10
.39
0.4
40
.42
0.3
3
No
tR
escin
de
d2
.01
1.7
41
.39
2.4
61
.89
1.9
12
.13
1.8
01
.50
4.0
51
.31
3.0
52
.23
2.2
7
Ru
ling
No
tR
escin
de
d-
--
--
0.1
3-
-0
.03
--
0.0
4-
0.0
2
Ca
se
Dis
mis
se
d:
No
n-A
tte
nd
an
ce
11
.28
14
.62
12
.82
19
.69
18
.74
14
.93
19
.93
18
.86
17
.76
16
.25
5.2
61
4.1
21
3.8
91
6.6
6
Ou
to
fJu
risd
ictio
n0
.06
--
0.0
40
.09
0.0
2-
--
0.0
3-
0.0
40
.01
0.0
3
InJu
risd
ictio
n1
.65
1.4
95
.51
3.1
10
.26
0.3
50
.20
1.7
10
.51
0.3
90
.15
1.9
61
.13
1.9
6
Re
scin
de
d0
.79
0.3
10
.93
0.7
10
.94
0.4
80
.61
0.1
60
.65
0.4
10
.08
0.4
00
.32
0.5
8
Co
mp
lete
d0
.12
0.5
60
.15
0.1
30
.04
0.1
00
.05
-0
.14
0.4
1-
0.2
90
.45
0.1
9
Ru
ling
Re
scin
de
d-
-0
.02
--
0.0
2-
--
--
--
0.0
0
Un
kn
ow
n11
.40
10
.83
19
.89
9.9
67
.50
5.0
47
.96
4.7
311
.55
6.4
46
.57
10
.74
5.2
79
.05
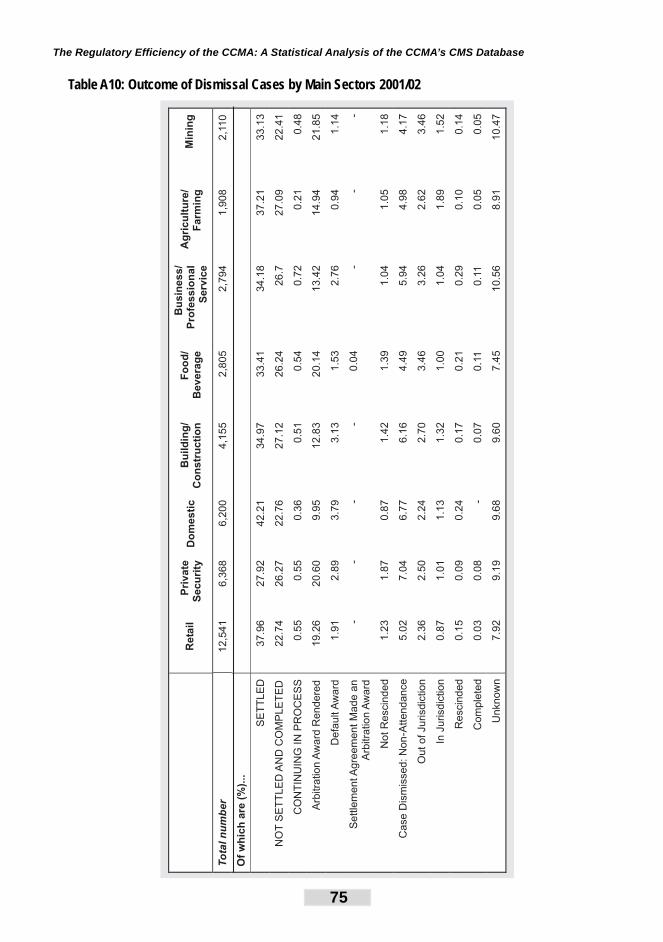
The Regulatory Effi ciency of the CCMA: A Statistical Analysis of the CCMA’s CMS Database
75
Table A10: Outcome of Dismissal Cases by Main Sectors 2001/02
Reta
ilP
riv
ate
Se
cu
rity
Do
me
sti
cB
uil
din
g/
Co
ns
tru
cti
on
Fo
od
/B
ev
era
ge
Bu
sin
es
s/
Pro
fes
sio
na
lS
erv
ice
Ag
ric
ult
ure
/F
arm
ing
To
tal
nu
mb
er
12
,54
16
,36
86
,20
04
,15
52
,80
52
,79
41
,90
8
Of
wh
ich
are
(%).
..
SE
TT
LE
D3
7.9
62
7.9
24
2.2
13
4.9
73
3.4
13
4.1
83
7.2
1
NO
TS
ET
TL
ED
AN
DC
OM
PL
ET
ED
22
.74
26
.27
22
.76
27
.12
26
.24
26
.72
7.0
9
CO
NT
INU
ING
INP
RO
CE
SS
0.5
50
.55
0.3
60
.51
0.5
40
.72
0.2
1
Arb
itra
tio
nA
wa
rdR
en
de
red
19
.26
20.6
09
.95
12
.83
20
.14
13
.42
14
.94
De
fau
ltA
wa
rd1
.91
2.8
93
.79
3.1
31
.53
2.7
60
.94
Se
ttle
me
ntA
gre
em
en
tM
ad
ea
nA
rbitra
tio
nA
wa
rd-
--
-0
.04
--
No
tR
escin
de
d1
.23
1.8
70
.87
1.4
21
.39
1.0
41
.05
Ca
se
Dis
mis
se
d:
No
n-A
tte
nd
an
ce
5.0
27.0
46
.77
6.1
64
.49
5.9
44
.98
Ou
to
fJu
risd
ictio
n2
.36
2.5
02
.24
2.7
03
.46
3.2
62
.62
InJu
risd
ictio
n0
.87
1.0
11
.13
1.3
21
.00
1.0
41
.89
Re
scin
de
d0
.15
0.0
90
.24
0.1
70
.21
0.2
90
.10
Co
mp
lete
d0
.03
0.0
8-
0.0
70
.11
0.1
10
.05
Un
kn
ow
n7
.92
9.1
99
.68
9.6
07
.45
10
.56
8.9
1
Min
ing
2,1
10
33
.13
22
.41
0.4
8
21
.85
1.1
4 -
1.1
8
4.1
7
3.4
6
1.5
2
0.1
4
0.0
5
10
.47
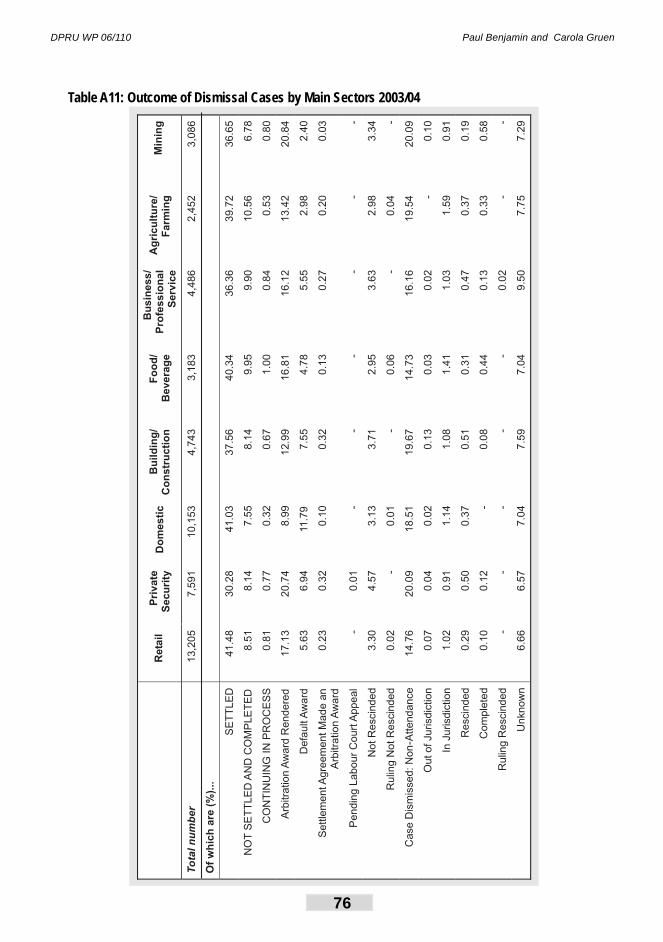
DPRU WP 06/110 Paul Benjamin and Carola Gruen
76
Table A11: Outcome of Dismissal Cases by Main Sectors 2003/04
Re
tail
Pri
va
teS
ec
uri
tyD
om
es
tic
Bu
ild
ing
/C
on
str
uc
tio
nF
oo
d/
Be
ve
rag
e
Bu
sin
es
s/
Pro
fes
sio
na
lS
erv
ice
Ag
ric
ult
ure
/F
arm
ing
Min
ing
To
tal
nu
mb
er
13,2
05
7,5
91
10
,15
34
,74
33
,18
34
,48
62
,45
23
,08
6
Of
wh
ich
are
(%).
..
SE
TT
LE
D4
1.4
83
0.2
84
1.0
33
7.5
64
0.3
43
6.3
63
9.7
23
6.6
5
NO
TS
ET
TL
ED
AN
DC
OM
PL
ET
ED
8.5
18
.14
7.5
58
.14
9.9
59
.90
10
.56
6.7
8
CO
NT
INU
ING
INP
RO
CE
SS
0.8
10
.77
0.3
20
.67
1.0
00
.84
0.5
30
.80
Arb
itra
tio
nA
wa
rdR
en
de
red
17
.13
20
.74
8.9
91
2.9
91
6.8
11
6.1
21
3.4
22
0.8
4
De
fau
ltA
wa
rd5
.63
6.9
411
.79
7.5
54
.78
5.5
52
.98
2.4
0
Se
ttle
me
ntA
gre
em
en
tM
ad
ea
nA
rbitra
tio
nA
wa
rd0
.23
0.3
20
.10
0.3
20
.13
0.2
70
.20
0.0
3
Pe
nd
ing
La
bo
ur
Co
urt
Ap
pe
al
-0
.01
--
--
--
No
tR
escin
de
d3
.30
4.5
73
.13
3.7
12
.95
3.6
32
.98
3.3
4
Ru
ling
No
tR
escin
de
d0
.02
-0
.01
-0
.06
-0
.04
-
Ca
se
Dis
mis
se
d:
No
n-A
tte
nd
an
ce
14
.76
20
.09
18
.51
19
.67
14
.73
16
.16
19
.54
20
.09
Ou
to
fJu
risd
ictio
n0
.07
0.0
40
.02
0.1
30
.03
0.0
2-
0.1
0
InJu
risd
ictio
n1
.02
0.9
11
.14
1.0
81
.41
1.0
31
.59
0.9
1
Re
scin
de
d0
.29
0.5
00
.37
0.5
10
.31
0.4
70
.37
0.1
9
Co
mp
lete
d0
.10
0.1
2-
0.0
80
.44
0.1
30
.33
0.5
8
Ru
ling
Re
scin
de
d-
--
--
0.0
2-
-
Un
kn
ow
n6
.66
6.5
77
.04
7.5
97
.04
9.5
07
.75
7.2
9
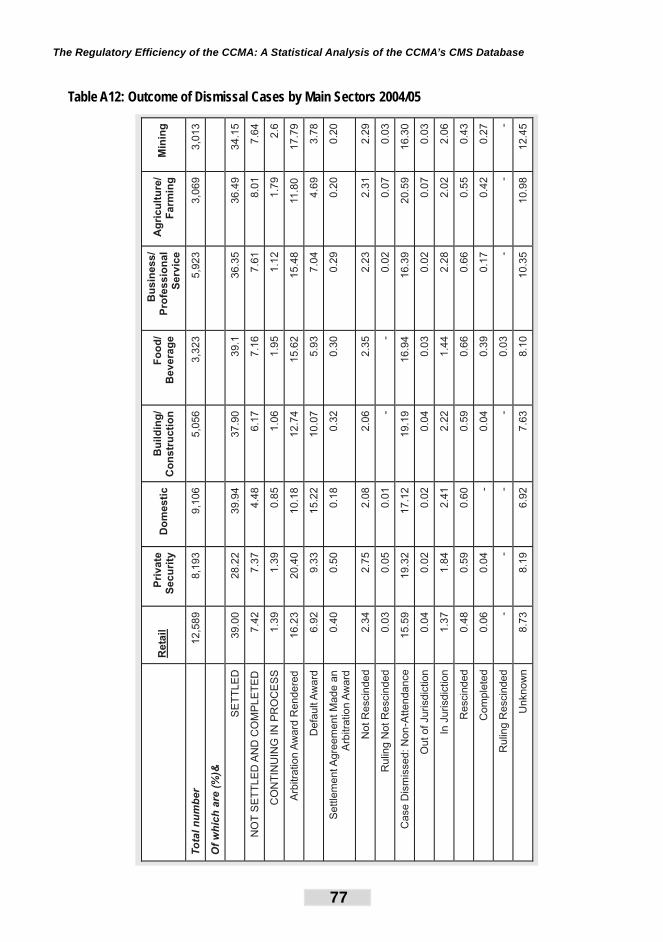
The Regulatory Effi ciency of the CCMA: A Statistical Analysis of the CCMA’s CMS Database
77
Table A12: Outcome of Dismissal Cases by Main Sectors 2004/05
Reta
ilP
rivate
Secu
rity
Do
mesti
cB
uild
ing
/C
on
str
ucti
on
Fo
od
/B
evera
ge
Bu
sin
ess/
Pro
fessio
nal
Serv
ice
Ag
ricu
ltu
re/
Farm
ing
Min
ing
To
taln
um
ber
12,5
89
8,1
93
9,1
06
5,0
56
3,3
23
5,9
23
3,0
69
3,0
13
Of
wh
ich
are
(%)&
SE
TT
LE
D39.0
028.2
239.9
437.9
039.1
36.3
536.4
934.1
5
NO
TS
ET
TLE
DA
ND
CO
MP
LE
TE
D7.4
27.3
74.4
86.1
77.1
67.6
18.0
17.6
4
CO
NT
INU
ING
INP
RO
CE
SS
1.3
91.3
90.8
51.0
61.9
51.1
21.7
92.6
Arb
itra
tion
Aw
ard
Rendere
d16.2
320.4
010.1
812.7
415.6
215.4
811.8
017.7
9
Defa
ult
Aw
ard
6.9
29.3
315.2
210.0
75.9
37.0
44.6
93.7
8
Settle
mentA
gre
em
entM
ade
an
Arb
itra
tion
Aw
ard
0.4
00.5
00.1
80.3
20.3
00.2
90.2
00.2
0
NotR
escin
ded
2.3
42.7
52.0
82.0
62.3
52.2
32.3
12.2
9
Rulin
gN
otR
escin
ded
0.0
30.0
50.0
1-
-0.0
20.0
70.0
3
Case
Dis
mis
sed:N
on
-Attendance
15.5
919.3
217.1
219.1
916.9
416.3
920.5
916.3
0
OutofJurisdic
tion
0.0
40.0
20.0
20.0
40.0
30.0
20.0
70.0
3
InJurisdic
tion
1.3
71.8
42.4
12.2
21.4
42.2
82.0
22.0
6
Rescin
ded
0.4
80.5
90.6
00.5
90.6
60.6
60.5
50.4
3
Com
ple
ted
0.0
60.0
4-
0.0
40.3
90.1
70.4
20.2
7
Rulin
gR
escin
ded
--
--
0.0
3-
--
Unknow
n8.7
38.1
96.9
27.6
38.1
010.3
510.9
812.4
5