Embed Size (px)
Citation preview
Report No. 578-EGT FILE COPYAppraisal ofthe Rehabilitation of the Suez CanalArab Republic of EgyptNovember 19, 1974
Regional Projects DepartmentEurope, Middle East, and North Africa Regional Office
Not for Public Use
Document of the International Bank for Reconstruction and DevelopmentInternational Development Association
This report was prepared for official use only by the Bank Group. It may not be published,quoted or cited without Bank Group authorization. The Bank Group does not accept responsibilityfor the accuracy or completeness of the report.
Pub
lic D
iscl
osur
e A
utho
rized
Pub
lic D
iscl
osur
e A
utho
rized
Pub
lic D
iscl
osur
e A
utho
rized
Pub
lic D
iscl
osur
e A
utho
rized
Pub
lic D
iscl
osur
e A
utho
rized
Pub
lic D
iscl
osur
e A
utho
rized
Pub
lic D
iscl
osur
e A
utho
rized
Pub
lic D
iscl
osur
e A
utho
rized
CuRRENCY ENUIVAIENTS1/
Currency Unit = Egyptian Pound (LE)US$2.40 = LE 1.00US$1.00 = LE 0.42US$2. 4 0 million LE 1 million
SYSTEM OF WEIGHTS AND MEASURES
Metric British/US
1 meter (m) = 3.28 feet (ft)1 kilometer (km) = 0.62 mile (mi)1 metric ton (m ton) = 2.20 pounds (lb)1 cubic meter (i 3 ) = 35.31 cubic feet (cu ft)
1 Suez Canal Net Regis-tered Ton = 100 cubic feet (cu ft)
= 2.83 cubic meters (m3 )
GLOSSARY OF ABBREVIATIONS
SCA - Suez Canal AuthoritySCNRT - Suez Canal Net Registered Tondwt - deadweight tongrt - gross registered ton
GOVERNMENT OF THE ARAB REPUBLIC OF EGYPTFISCAL YEAR
January 1 - December 31
1/ Adjusted as of April 30, 1974.
APPRAISAL OF
THE REHABILITATION OF THE SUEZ CANAL
ARAB REPUBLIC OF EGYPT
TABLE OF CONTENTS
Page No.
SUMMARY AND CONCLUSIONS ............ ................
I. INTRODUCTION .................... ...................
II. THE SUEZ CANAL ..................................... 2
A. General ........ ...................... ......... 2B. Past Traffic ...... ............................ 3C. Consequences of Closure of the Canal ......... . 4D. Damage to the Canal ........................... 4E. Present Situation ............................. 5
III. THE SUEZ CANAL AUTHORITY ............... . . ........... 6
A. General .... ................................. 6B. Organization and Management ... ................ 6C. Operations ......... ... . .. 7D. Insurance ....................................... 8E. Finance ............. ........................... 8F. Canal Dues ......... .. .6........ ............................ 9G. Audit ........................................ 9
IV. THE PROJECT ........ ................................ 10
A. Objectives .................................... 10B. Description .................. ................ 10C. Cost Estimate ...... ........................... 11D. Items Proposed for Bank Financing ............. 13E. Financing Plan ............................ 13F. Implementation .............. .. ................ 14G. Disbursements ................. ................ 15H. Safety Measures ...... ......................... 15I. Ecology and Urban Development .................* 16J. Future Expansion of the Canal ......... ........ 16
Messrs. P.C. de Man (Division Chief), P. Bourcier (Economist), A.J. Carmichael(Ports, Shipping, Aviation, and Pipeline Adviser), K. Strong (Consultant,Financial Analyst), I. Englestadt (Consultant), and Mrs. P. Valad (Editor)prepared this Appraisal Report.
TABLE OF CONTENTS (Cont'd) Page No.
V. FINANCIAL EVALUATION ................................ 17
A. General ........ ............ .................... 17B. Canal Dues .................. ................... 17C. Operating Results to 1967 ............. ... 18D. Operating Results Aftrr 1967 ............. 18E. Balance Sheets ................. .. .............. 19F. Financial Forecasts . ..... ................... .. 19C. Financial Covenants .. .......................... 20
VI. ECONOMIC EVALUATION ...... ........................... 20
A. General ........................................ 20B. Savings in Shipping Costs ........... 20C. Methodology ....... ........... ................... 21D. Traffic Projections and Savings in Shipping
Costs .................. ................... 22E. Rate of Return .............. ... 22F. Sensitivity Analysis . ...................... . 22
VII. AGREEMENTS REACHED AND RECOMMENDATION ..... ..... 23
ANNEXES
1. Government Receipts from the Suez Canal Authority, 1956-672. Traffic Data, 1955-663. Importers of Middle East Oil, 1968, 1970, and 19724. Suez Canal Special Closure Surcharge5. Economic Consequences of Closure of the Suez Canal, 1967-716. Suez Canal Traffic7i Savings in Shipping Costs through Reopening the Suez Canal8. Suez Canal Authority Organization Chart9. Performance Indicators10. Declaration by the Government of Egypt on the Suez Canal and
the Arrangements for its Operation11. Justification of the Suez Canal Authority's Equipment Program12. Project Cost Estimates13. Cost Estimates for Bank Financed Project Items14. Estimated Schedule of Disbursements15. Suez Canal Authority's Income Statements, 1965-72 (Actual) and
1973 (Estimated)16. Suez Canal Authority's Cash Flow Statements, 1968-72 (Actual) and
1973 (Estimated)17. Suez Canal Authority's Balance Sheets, 1965-67 (Actual) and
1973 (Estimated)18. Suez Canal Dues and Future Revenue19. Assumptions on which Suez Canal Authority's Financial
Forecasts are Based
TABLE OF CONTENTS (Cont'd)
20. Suez Canal Authority's Forecast Income Statements, 1974-8021. Suez Canal Authority's Forecast Cash Flow Statements, 1974-8022. Rate of Return Calculation
MAPS
IBRD 11106 - Transportation SystemIBRD 11107 - Suez CanalIBRD 8794 - Typical Cross Section at Km 30

APPRAISAL OF
THE REHABILITATION OF THE SUEZ CANAL
ARAB REPUBLIC OF EGYPT
SUMMARY AND CONCLUSIONS
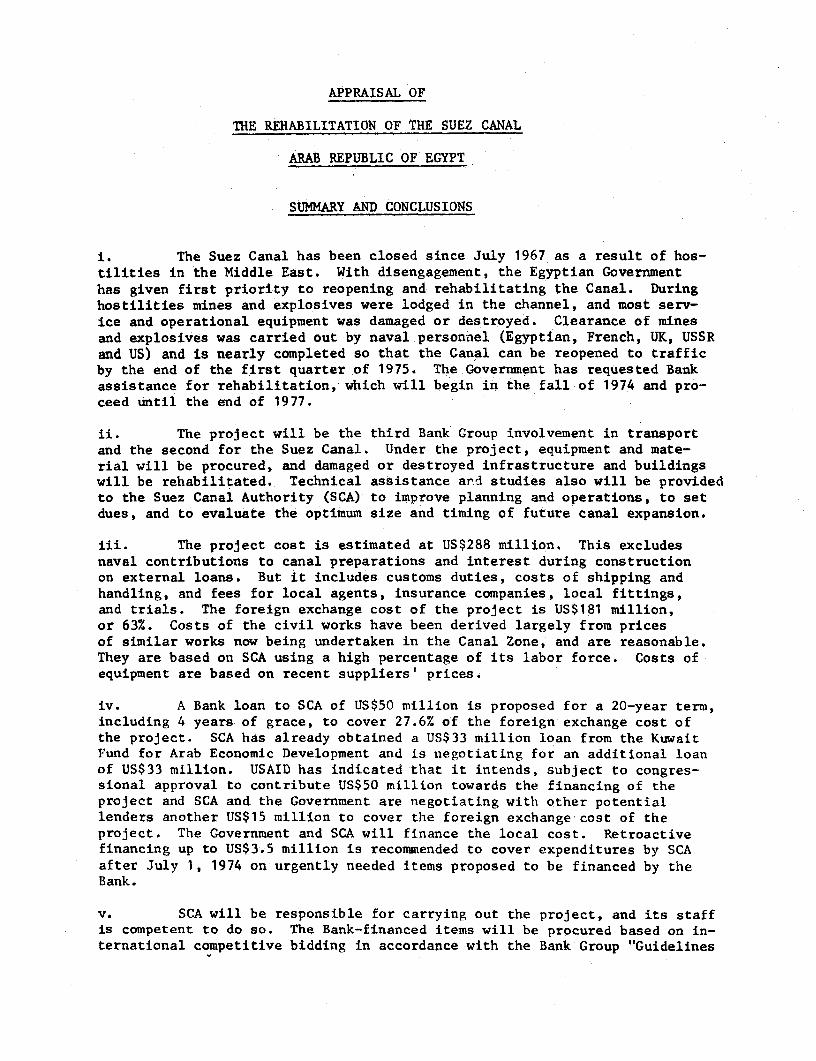
I. The Suez Canal has been closed since July 1967 as a result of hos-tilities in the Middle East. With disengagement, the Egyptian Governmenthas given first priority to reopening and rehabilitating the Canal. Duringhostilities mines and explosives were lodged in the channel, and most serv-ice and operational equipment was damaged or destroyed. Clearance of minesand explosives was carried out by naval personnel (Egyptian, French, UK, USSRand US) and is nearly completed so that the Canal can be reopened to trafficby the end of the first quarter of 1975. The Government has requested Bankassistance for rehabilitation, which will begin in the fall of 1974 and pro-ceed until the end of 1977.
ii. The project will be the third Bank Group involvement in transportand the second for the Suez Canal. Under the project, equipment and mate-rial will be procured, and damaged or destroyed infrastructure and buildingswill be rehabilitated. Technical assistance ard studies also will be providedto the Suez Canal Authority (SCA) to improve planning and operations, to setdues, and to evaluate the optimum size and timing of future canal expansion.
iii. The project cost is estimated at US$288 million. This excludesnaval contributions to canal preparations and interest during constructionon external loans. But it includes customs duties, costs of shipping andhandling, and fees for local agents, insurance companies, local fittings,and trials. The foreign exchange cost of the project is US$181 million,or 63%. Costs of the civil works have been derived largely from pricesof similar works now being undertaken in the Canal Zone, and are reasonable.They are based on SCA using a high percentage of its labor force. Costs ofequipment are based on recent suppliers' prices.
iv. A Bank loan to SCA of US$50 million is proposed for a 20-year term,including 4 years of grace, to cover 27.6% of the foreign exchange cost ofthe project. SCA has already obtained a US$33 million loan from the KuwaitFund for Arab Economic Development and is negotiating for an additional loanof US$33 million. USAID has indicated that it intends, subject to congres-sional approval to contribute US$50 million towards the financing of theproject and SCA and the Government are negotiating with other potentiallenders another US$15 million to cover the foreign exchange cost of theproject. The Government and SCA will finance the local cost. Retroactivefinancing up to US$3.5 million is recommended to cover expenditures by SCAafter July 1, 1974 on urgently needed items proposed to be financed by theBank.
v. SCA will be responsible for carrying out the project, and its staffis competent to do so. The Bank-financed items will be procured based on in-ternational competitive bidding in accordance with the Bank Group "Guidelines
- ii -
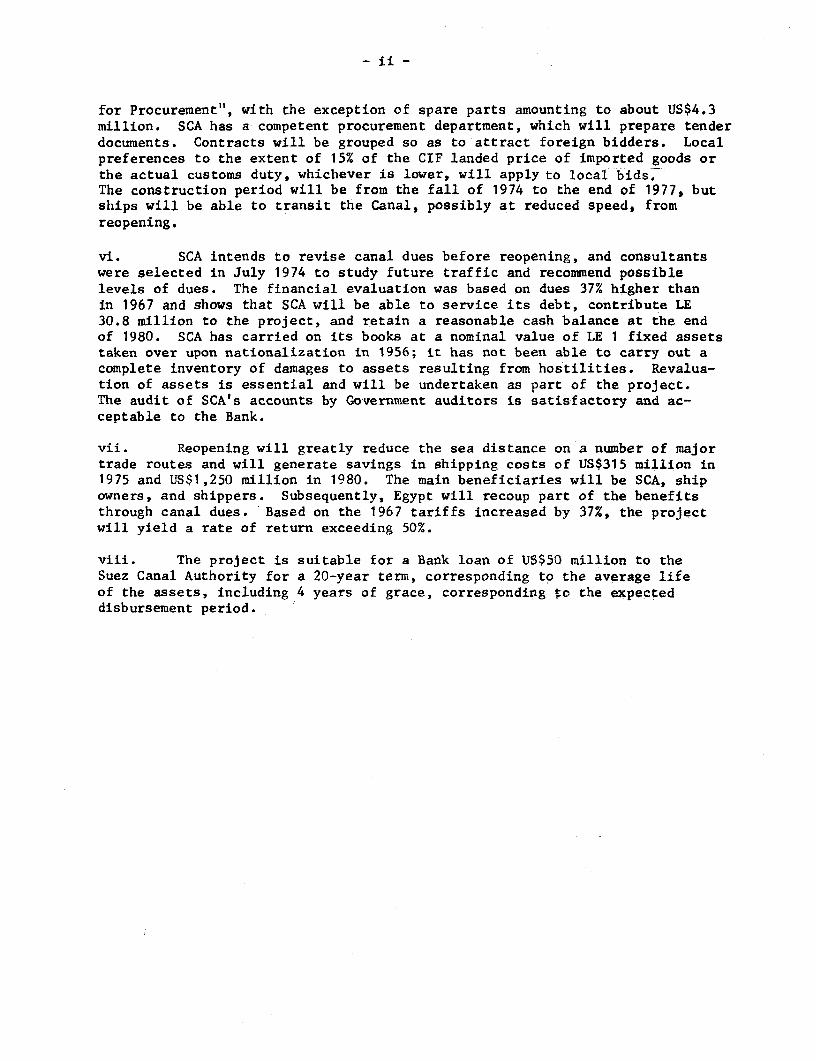
for Procurement", with the exception of spare parts amounting to about US$4.3million. SCA has a competent procurement department, which will prepare tenderdocuments. Contracts will be grouped so as to attract foreign bidders. Localpreferences to the extent of 15% of the CIF landed price of imported goods orthe actual customs duty, whichever is lower, will apply to local bids.The construction period will be from the fall of 1974 to the end of 1977, butships will be able to transit the Canal, possibly at reduced speed, fromreopening.
vi. SCA intends to revise canal dues before reopening, and consultantswere selected in July 1974 to study future traffic and recommend possiblelevels of dues. The financial evaluation was based on dues 37% higher thanin 1967 and shows that SCA will be able to service its debt, contribute LE30.8 million to the project, and retain a reasonable cash balance at the endof 1980. SCA has carried on its books at a nominal value of LE 1 fixed assetstaken over upon nationalization in 1956; it has not been able to carry out acomplete inventory of damages to assets resulting from hostilities. Revalua-tion of assets is essential and will be undertaken as part of the project.The audit of SCA's accounts by Government auditors is satisfactory and ac-ceptable to the Bank.
vii. Reopening will greatly reduce the sea distance on a number of majortrade routes and will generate savings in shipping costs of US$315 million in1975 and US$1,250 million in 1980. The main beneficiaries will be SCA, shipowners, and shippers. Subsequently, Egypt will recoup part of the benefitsthrough canal dues. Based on the 1967 tariffs increased by 37%, the projectwill yield a rate of return exceeding 50%.
viii. The project is suitable for a Bank loan of US$50 million to theSuez Canal Authority for a 20-year term, corresponding to the average lifeof the assets, including 4 years of grace, corresponding to the expecteddisbursement period.
APPRAISAL OF
THE REHABILITATION OF THE SUEZ CANAL
ARAB REPUBLIC OF EGYPT
I. INTRODUCTION
1.01 As a result of hostilities in the Middle East, the Suez Canal hasbeen closed since 1967. With disengagement, the Egyptian Government hasgiven first priority to reopening and rehabilitating the Canal. The Egyptian,French, US akLd UK Navies have almost completed removing mines and explosives,and removal of wrecks and other obstacles is well underway. The Canal is ex-pected to be clear by the end of 1974, and reopened to traffic by the end ofthe first quarter of 1975.
1.02 Most service infrastructure and operational equipment for the Canalwas damaged or destroyed during hostilities, and must be rehabilitated to per-mit ships to transit. The Suez Canal Authority (SCA) has prepared a projectfor this purpose, and the Egyptian Government has requested financial assis-tance from the Bank. A Bank mission visited Egypt in April 1974 to appraisethe project.
1.03 Rehabilitation is expected to cost US$288 million, including a for-eign exchange cost of US$181 million. To help finance the foreign exchangecost, a US$50 million Bank loan to SCA is proposed. The balance would be fi-nanced by a US$33 million loan from the Kuwait Fund for Arab Economic Devel-opment, and by borrowings of US$98 million from other sources (USAID, otherArab and external sources). The Government will finance local currency costuntil SCA resumes earning sufficient revenue.
1.04 Other Bank Group involvement in transport includes a Bank loan ofUS$56.5 million (243-UAR, December 1959) to SCA and an IDA credit of US$30million (284-UAR, February 1972) for a Railway Project. A second RailwayProject was appraised recently.
1.05 This report is based on the findings of the April 1974 appraisalmission composed of Messrs. P.C. de Man (Division Chief), P. Bourcier (Econ-omist), A.J. Carmichael (Ports, Shipping, Aviation, and Pipelines Adviser),and A.H. Clark (Financial Analyst) of the Bank, as well as Messrs. K. Strongof Hu Harries and Associates (Canada) and I. Englestadt of SC Shipping Con-sultants (Norway). Mrs. P. Valad (Editor) assisted in preparation of thereport.
-2-
II. THE SUEZ CANAL
A. General
2.01 A navigable waterway connecting the Mediterranean and Red Seas wasoriginally considered 40 centuries ago. The first canal was built in 2,000B.C. joining the Nile River and Bitter Lake, which then opened into the RedSea. The present Suez Canal was built between 1859 and 1869. Its length is160 km and its permissible draft is 11.60 m, having been increased from theoriginal 6.76 m. The Canal shortens the sea voyage between Western Europeand Asia by about 5,000 nautical mi. It was one of the most important water-ways for international traffic until closure in 1967 as the result of hostili-ties in the Middle East.
2.02 The Compagnie Maritime Universelle du Canal de Suez operated theCanal until July 26, 1956, when it was nationalized. In 1957, the Governmentset up SCA, an autonomous legal entity, to be in charge of canal operations.The first task of SCA was to clear the Canal of sunken vessels. The UnitedNations provided assistance for this operation, and costs were recouped througha surcharge imposed on ships. In addition, the Bank provided a US$56.5 millionloan (243-UAR, December 1959), to: widen and deepen the Canal; improve PortSaid operations; and supply floating equipment to replace obsolete equipmentand to meet future requirements. The project was carried out satisfactorily,and, despite closure in 1967 the loan was repaid on schedule.
2.03 Traffic through the Canal expressed in Suez Canal Net RegisteredTon (SCNRT) (para 5.02) grew between the end of World War II and 1967 at anaverage annual rate of 12%, while the number of ships passages grew at 5%,reflecting the use of larger ships. Although traffic decreased slightly im-mediately after nationalization, it recovered quickly when confidence wasestablished in the new SCA. The Canal became the principal route by whichMiddle East petroleum was transported to markets in Europe and the WesternHemisphere. In 1966, 36% of petroleum loaded in the Middle East and 14% ofworld seaborne traffic passed through the Canal. Dry cargo represented only5% of the combined loadings and unloadings of European and American ports,but 41% of loadings and unloadings of Persian Gulf ports, 32% of Red Sea andAfrican ports, and 24% of South and Southeast Asian ports. 1/
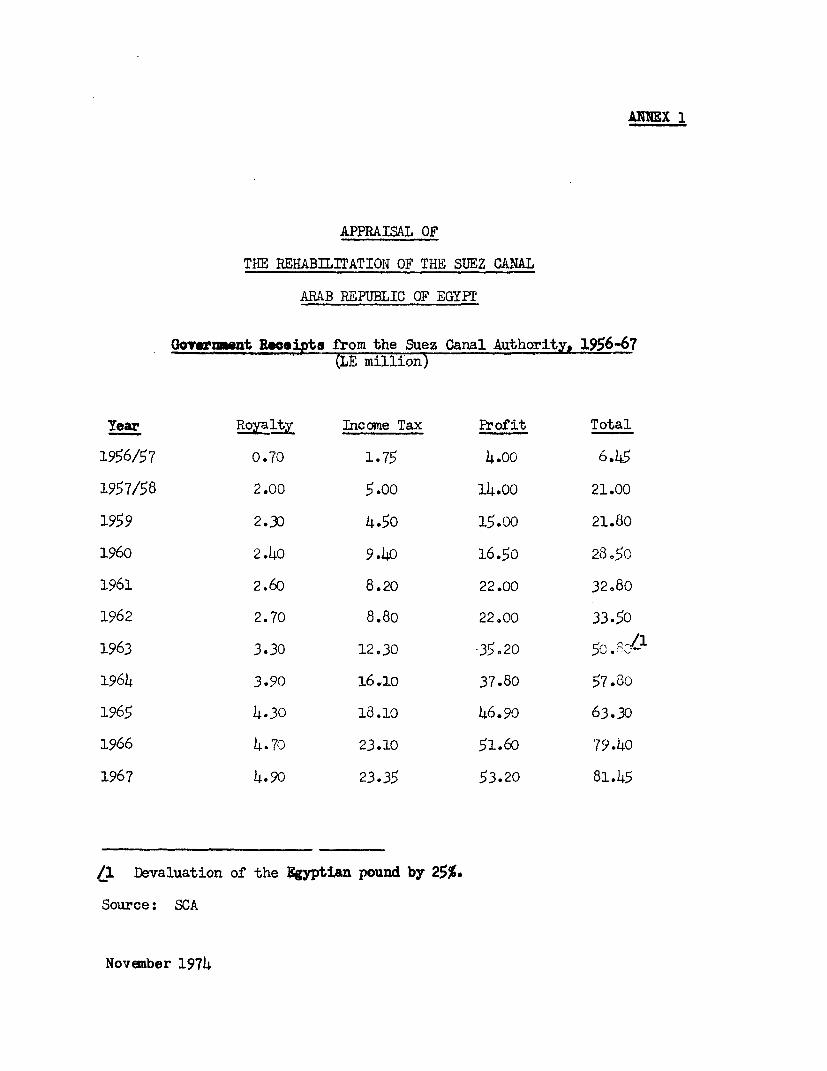
2.04 Canal operations under SCA were efficient and uninterrupted from1956 to closure in 1967. SCA became the second largest foreign exchangeearner after cotton. Proceeds from canal operations accrued directly tothe Egyptian Government as royalties and taxes paid by SCA and as transfersof profits. Foreign exchange transfers from SCA to the Government grew from
1/ United Nations Conference on Trade and Development, "The Economic Effectsof the Closure of the Suez Canal", New York, 1973.
- 3 -
US$15.5 million in 1957 to US$195.5 million in 1967, the last full year of
operation (Annex 1). In addition, the Canal generated service activities
in the Canal Zone and provided most of the income of the three cities in the
Zone (Ismaelia, Port Said, and Suez).
B. Past Traffic
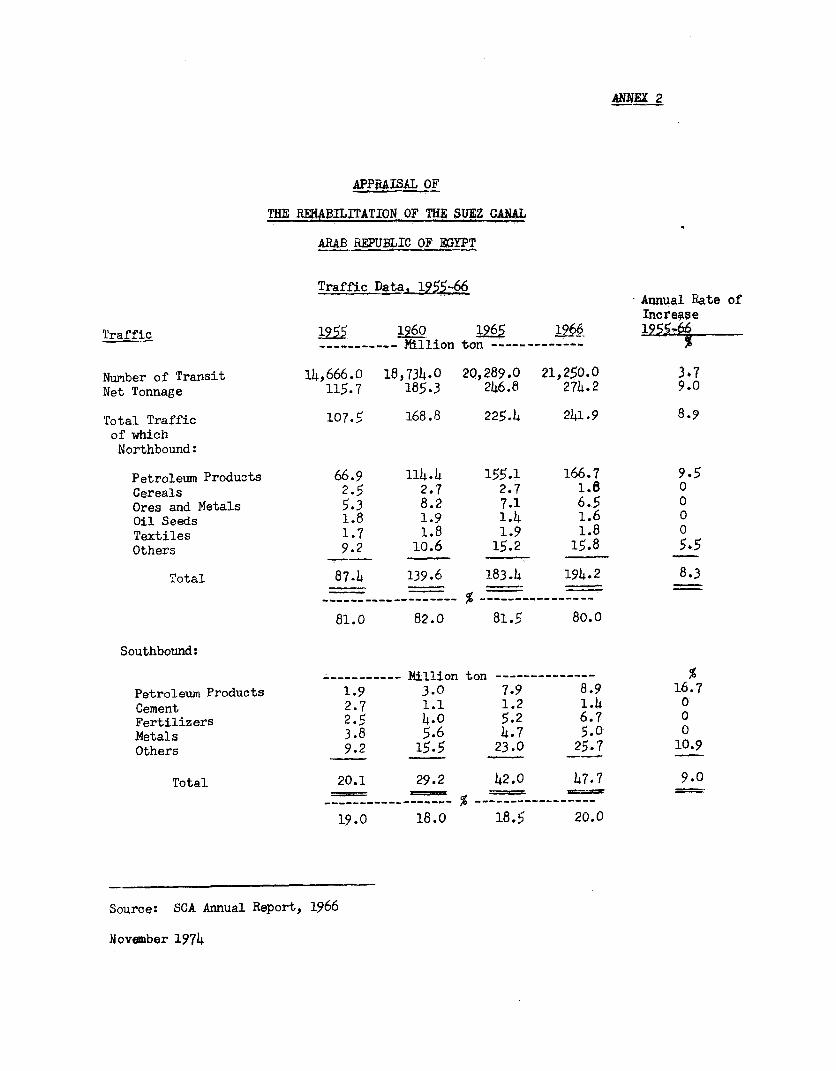
2.05 Until World War II, dry cargo accounted for abou t 75% of canal traf--
fic. This situation changed, however, in the late 1940's/early 1950's when
petroleum traffic from the Middle East to Europe started to exceed dry cargo
traffic (Annex 2). From 1955 to 1966, petroleum and dry cargo traffic grew
at an average annual rate of 8.5%, with petroleum traffic growing at 10% and
dry cargo at 5.8%. Petroleum products accounted for 63% of total tonnagein 1955 and 73% in 1966. The direction of trade was strongly imbalanced in
terms of tonnage niorthbound, but was more balanced in terms of numbers of
passages northbound and southbound. tMost nortlhbound traffic consisted of
petroleum as well as agricultural products and raw materials from South andSoutheast Asia, Australia, and the Middle East while southbound traffic con-
sisted principally of cereals from North America and manufactured goods from
Europe transported by conventional liners on fixed routes. Passenger traffic
was important before and immediately after World tJar II, but was almost non-
existent by 1967 due to the competition of air travel.
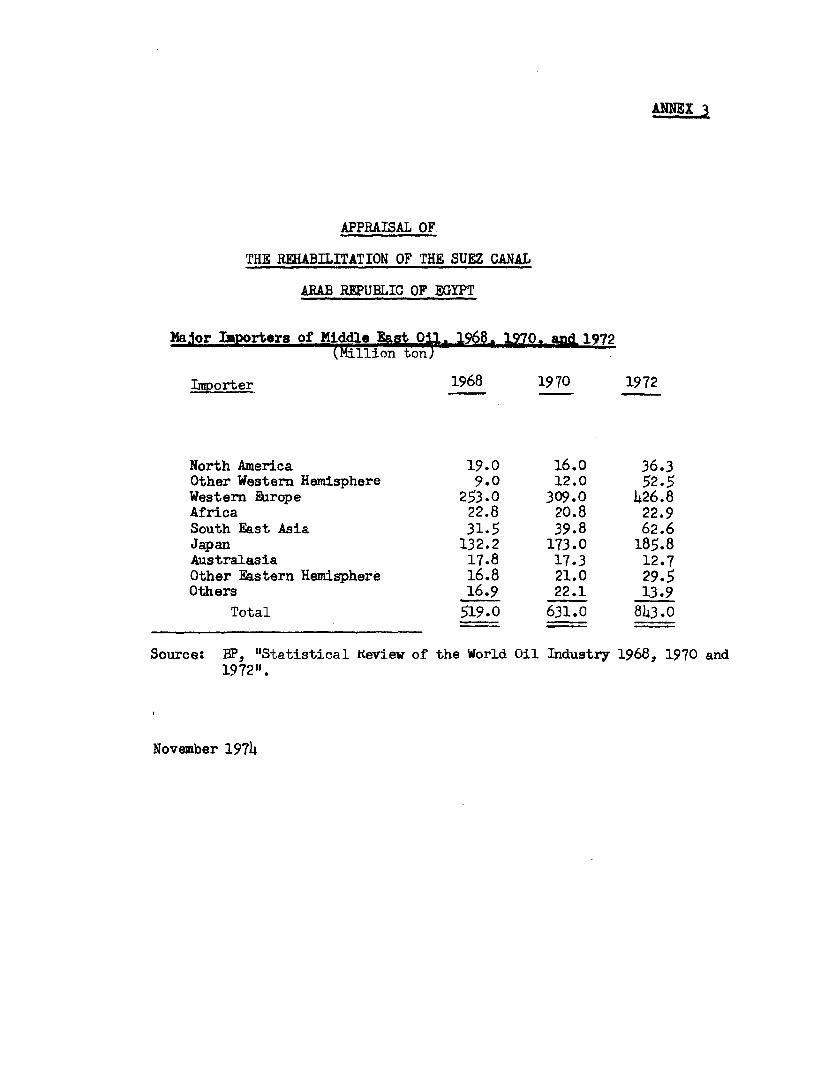
2.06 During 1966, 99% of the petroleum passing through the Canal came
from the Middle East, of which 93% went to Europe (Annex 3), 6% to £4orth
America, and 1% to Africa. Wlhile the average number of tankers passingthrough the Canal from 1962 to 1966 did not vary by more than 5.5,', the
size distribution changed considerably. In 1964 tankers of over 50,000dwt carried only 16% of petroleum traffic, but by 1966 they carried more
than 40%. These changes reflected the world trend toward large tankers.The first tanker of over 100,000 dwt was built in 1965, and for the first
time the permissible draft of the Canal became an obstacle to future traffic
development.
2.07 SCA was aware of developments in tanker size, and had prepared anexpansion program, the first phase of wlhich would have brought the permissiblecanal draft to 14.60 m in 1972, enabling tankers of up to 200,000 dwt to passin ballast and tankers of up to 125,000 dwt laden. Tenders for this stage hadbeen received on June 5, 1967, the day hostilities broke out and the Canal was
closed. It is the intention of SCA to proceed with the enlargement of the
Canal as soon as the waterway is cleared. To that effect a letter of intentwas given to a Japanese contractor to start dredging by mid-1975. In the
meanwhile, .CA has decided to carry out a study of the optimum size and tilmlingof the expansion and is in the process of selecting consultants. This studywill be financed by the Bank loan (para 4.24), terms of reterence have been
reviewed by the bank and are satisfactory. l)uring loan negotiations, iCA andthie Government agreed to afford the bank an adequate opportunity to cotmmenton the results of the study before deciding on the optimum dimensions and
phasing of the enlargement (para 4.24).
-4-
C. Consequences of Closure of the Canal
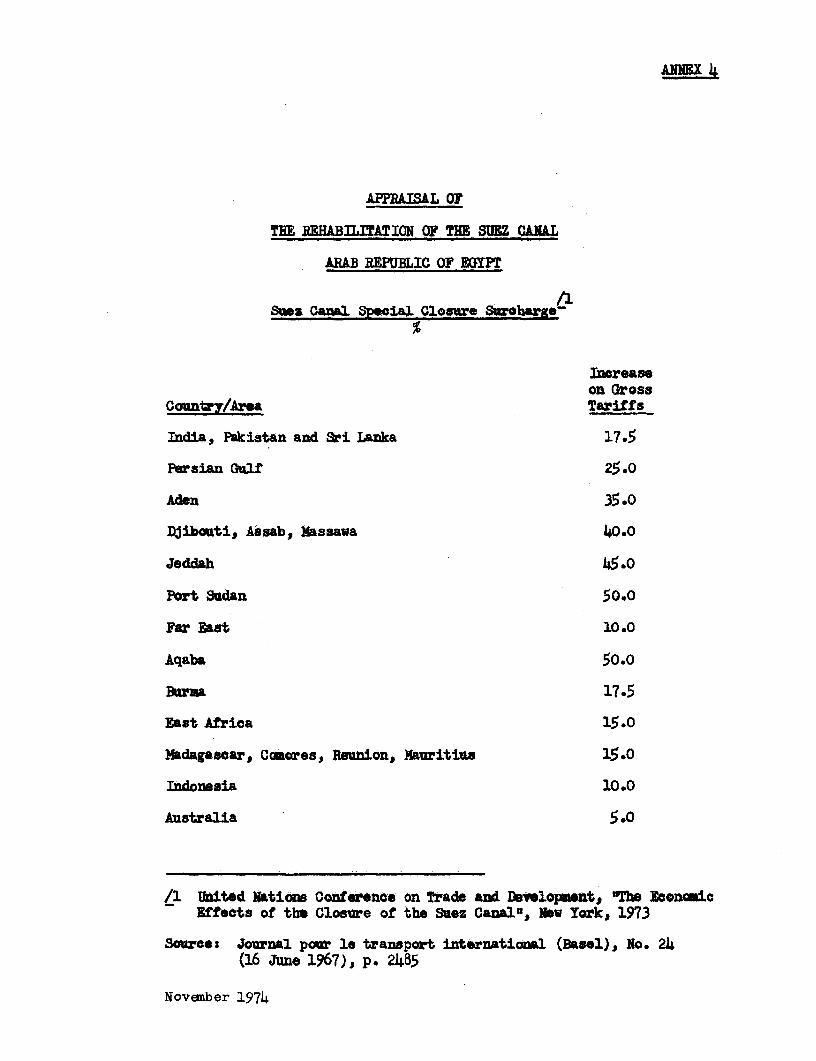
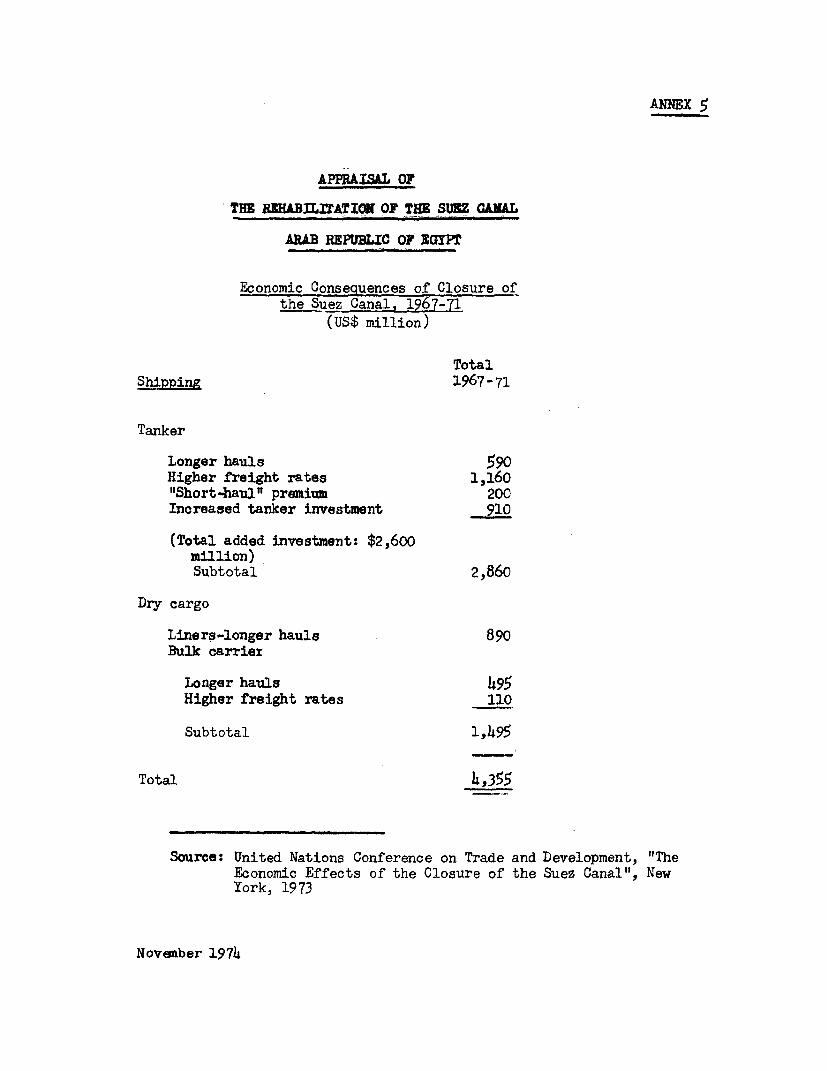
2.08 Closure of the Canal lengthened many important trade routes, creat-ing a shortage in the supply of ships for petroleum as well as dry cargo.In the short run, this affected a number of countries, as deliveries ofgoods were delayed, transport costs were increased, and alternative routeswere required. For petroleum, the effect was limited to temporary shortagesin Europe and substantial increases in freight costs reflecting longer dis-tances. But for dry cargo, the effect was more complex. Shipping linesand conferences imposed a "special closure surcharge" (Annex 4) applicableto all commodities, which on average was 25% of prevailing tariffs. Thissurcharge still exists. Similarly, dry bulk shipping rates increased dueto closure reflecting longer distances, higher costs of bunkering, and tightsupply of ships. The UN Report (para 2.03) estimates that from 1967 to 1971shipping cost increases resulting from closure of the Canal were US$4,355million, of which US$2,860 million were for tanker shipping and US$1,495million for dry cargo shipping (Annex 5).
2.09 Individual countries have felt the effects of closure of the Canal,with some having a marked decline in port traffic and otlhers having a markedincrease, necessitating improvement and expansion of port facilities to copewith diverted traffic. Egypt has lost the foreign exchange earnings fromcanal dues and some countries have experienced a temporary decline in ex-ports of products which could not support higher transport costs. The mainareas affected by closure were Southeast Asia and East Africa. The UN Reportestimates net losses from 1968 to 1970 at about US$563 mLillion.
2.10 Closure of the Canal changed the shipping industry. Reacting rapidly,the petroleum shipping industry caused additional tanker capacity to be builtin the prospect of sustained high freight rates, and the number of very largecrude carriers increased substantially. Tankers of over 125,000 ton accountedin 1966 for less than 1.5% of total fleet capacity, but in 1973 for more than45%; most tankers built since closure are unable to use the Canal fully ladenat its preclosure draft. In addition, a number of projects were prepared toprovide alternative routes to Europe for Middle East petroleum. Among themare the Suez-Mediterranean (SUMED) Pipeline from Suez to Alexandria in Egypt,expected to be completed by 1976-77 and to have an initial annual capacityof 80 million ton, and the Eilat-Ashkalon Pipeline in Israel, operating withan annual capacity of 20 million ton. Technological developments regardingdry cargo were somewhat less spectacular. Specialized larger ships werebuilt (bulk ore carriers and container ships), and most are able to use theCanal at its preclosure draft either in ballast or fully laden.
D. ])amage to the Canal
2.11 Between 1967 and 1973, the Canal was the demarcation line betweenEgyptian and Israeli armed forces. Fortifications were built on its banks.Continuous artillery duels caused damage to the Canal, although its main
structures were unharmed, and to Ismaelia, Port Said, and Suez. The chan-nel was mined, and many unexploded shells or bombs were lodged in it.
2.12 Most damage occurred in the southern part of the Canal Zone. Suezwas almost entirely destroyed--most SCA facilities were heavily damaged and
almost all floating equipment was sunk. Ismaelia was less seriously damaged,
although the water supply plant was harmed and most of SCA's buildings wereshelled. Port Said was lightly damaged and Port Fouad's shipyard was seriouslydamaged. Much of SCA's equipment in Ismaelia and Port Said was evacuatedsafely, but it now is obsolete because of lack of replacement.
E. Present Situationi
2.13 Due to closure since 1967, the Canal has lost some importance, par-ticularly for seaborne petroleum trade. However, it still has a large poten-
tial for tankers up to 150,000 dwt returning in ballast and for dry cargovessels (Chapter VII and Annexes 6 and 7). Since disengagement in the MiddleEast has made reopening possible, the Egyptian Government has undertaken to
do so, and has given first priority to the project.
2.14 The Government has also decided to construct the SUMED pipeline(para 2.10). The pipeline will not compete directly with the reopened Canal;however, it could provide an alternative to expansion of the Canal (paras 2.07and 4.22). So far, the SUMED Company and SCA have done little to coordinatetheir development plans. The Government agreed to take all necessary actionsto ensure proper coordination between the respective development plans of SCAand of the SUMED Company.
2.15 Since April 1974 the Egyptian, US, French, USSR, and UK Navies havebeen removing mines and explosives from the canal bed. This removal of minesis almost completed and the removal of wrecks and other obstacles is progress-ing satisfactorily. Meanwhile SCA personnel has started to salvage minor wrecksand to clear facilities at Ismaelia, Port Said, and Suez. Damaged or destroyedfloating and fixed equipment (para 2.12) needs to be replaced if the Canalis to be reopened to traffic and to be operated at its 1967 efficiency. SCAhas already obtained a loan of US$33 million from the Kuwait Fund for ArabEconomic Development, and is negotiating for an additional loan of US$33 mil-lion. USAID has indicated that it intends, subject to congressional approval,to contribute US$50 million toward the financing of the project and SCA and
the Government are negotiating with other potential lenders another US$15million (para 4.07). SCA and the Government have requested a Bank loan ofUS$50 million equivalent to help finance the foreign exchange cost of therehabilitation estimated at US$181 million.
-6-
III. THE SUEZ CANAL AUTHORITY
A. General
3.01 After the 1956 nationalization of the Compagnie Maritime Universelledu Canal de Suez, SCA was set up by Decree Law No. 146 of July 13, 1957 tomanage, operate, maintain and improve the Canal. SCA's by-Laws provide thatit is an autonomous legal entity administered by a Board of Directors. ThePresident of the Republic appoints the Board, the Chairman, and the DirectorGeneral. SCA is largely independent of Government rules and restrictionsgoverning public and private enterprises, and is free to follow efficientcommercial procedures. This broad delegation of power is somewhat limited,however, inasmuch as SCA's annual budget has to be reviewed by the Financeand Planning Ministries and approved by the Presidential decree (para 3.14).
3.02 Five years after the Government nationalized the Canal, it nation-alized existing companies and created new ones to provide services to SCA,which previously had been provided by private local and foreign contractors.These companies dealt with shipbuilding and repair (Suez Maritime Arsenal,Timsah Shipbuilding Co., and Canal Naval Construction), ship repair andmetallic construction (Port Said Engineering Co. and Canal Harbor Works)manufacturing of maritime equipment (Canal Rope Co.), and rental of equipmentand ship services (Canal Mooring and Projector Co.). The Government owns thecompanies, but they are financially autonomous, with separate budgets and ac-counts and independent auditors. SCA appoints their Boards of Directors,which are responsible to SCA's Department for Affiliated Companies. SCA'sfinancial liability is limited to. channeling Government loans to these com-panies. SCA receives 10% of the companies' profits after deduction of re-serves, and the balance is divided between SCA and the companies' workers ina 75:25 ratio. In 1967, SCA's income from affiliated companies amounted toLE 183,000 (US$440,000). During closure, all companies except the CanalMooring and Projector Co. shifted to general contracting and remained profitable.
B. Organization and Management
3.03 At nationalization, the Government appointed a number of top civilservants and military personnel to take over the Canal; most have remainedin office. At present, the Board of Directors consists of eight Directorsand a Chairman, who is also the Managing Director. The Government is notrepresented on the Board. The eight Directors are also the heads of themain departments, dealing with works, transit, procurement, shipyard, admin-istration, affiliated companies, engineering, and planning. In addition,three offices (Legal, Public Relations, and Follow-Up) report directly tothe Chairman.
-7-
3.04 Before closure, SCA's headquarters was in Ismaelia and each depart-ment had a branch in Port Said and Suez. Annex 8 shows the organization ofSCA. Departments are autonomous, with their own accounting and personnelsections, and appear to be working independently within their own fieldbudget. While this system did not create any particular problems in thepast, it could become a major obstacle when major rehabilitation work isto be undertaken and close coordination between departments is required.Responsibility for coordinating the tasks of various departments lies withthe Planning Department and Follow-Up Office. The Planning Department, whichis also responsible for long-term development has neither the staff nor theability to perform usefully. Recent studies conducted by SCA, and more par-ticularly those related to the future expansion of the Canal show SCA's lackof expertise in economic and financial evaluation of large investment projects.SCA agreed to employ consultants satisfactory to the Bank to assist SCA'sstaff in developing and strengthening its capabilities in financial and econo-mic planning and project evaluation.
C. Operations
3.05 Before closure, SCA controlled operations of the commercial portof Port Said but not those of Suez. It also controlled the approach ofvessels at both ends of the Canal. Navigation in the Canal was governedby Rules of Navigation, published and enforced by SCA, which defined proce-dures to be followed for approaching the entrance, forming convoys, andtransitting. These Rules were complex and strictly enforced by pilotsprovided on board. Transitting vessels were organized in convoys, twonorthbound and one southbound every 24 hours. SCA also operated all tugs,signal stations, navigational aids, etc. At closure, SCA employed about13,500 workers, staff, and labor including about 260 pilots, 60 tug masters,and 30 harbor masters.
3.06 During closure, SCA decided to retain most of its persoanel. Thisdecision was justified since it was not known when the Canal could be reopened.Most pilots, however, left SCA to work for other agencies in Egypt or abroad.SCA personnel was evacuated from the Canal Zone during hostilities, and onlynow is returning gradually.
3.07 As soon as the Canal is reopened, SCA intends to reintroduce itsformer operating procedures. SCA has contacted many former pilots and hasasked them to return to Ismaelia. The response has been favorable. SCAalso has started minor salvage and rehabilitation work. Now that SCA per-sonnel is returning to the Canal Zone, no shortage of skilled labor is ex-pected. SCA is confident that, despite heavy destruction in Port Said andSuez, it will be able to keep the Canal in operation without interruption.The magnitude of work, however, calls for qualified labor and supervisorswho may not be readily available in all disciplines. The Government hasgiven informal assurances to the Bank that it will encourage any reasonablesteps, including appropriate incentives, SCA may consider it necessary toattract and retain the services of skilled and qualified staff.
3.08 SCA staff will provide a program to train and refresh all staffrequired for handling the forecast traffic of the reopened Canal. The pro-gram is expected to begin as soon as suitable buildings are available inIsmaelia (probably before the end of 1974) and will cover 300 pilots, 58tug masters, and 28 harbor masters. Recruits will be given training coursesand existing staff will be given refresher courses. Recruits will be person-nel from the Egyptian Merchant Navy and Navy as well as civilians. Trainingwill be three to six months, depending on the candidates' proficiency. Pilotswill have a probationary period of at least one year after training. Thesearrangements were confirmed by SCA and are satisfactory. SCA agreed to employconsultants satisfactory to the Bank to assist SCA's staff in improving opera-tional procedures and has given informal assurances to the Bank that it willestablish and maintain performance indicators to control its efficiency (Annex 9).
3.09 SCA's main workshop and repair facilities are at Port Fouad andauxiliary workshops are at Port Said, Ismaelia, and Port Tewfik where SCA'sfloating equipment is maintained and repaired. SCA also operates watertreatment plants in the three Canal cities and electricity generating plantsat Port Fouad and Port Said.
D. Insurance
3.10 SCA has third party liability coverage for damage caused by itspersonnel or equipment. According to international practice, shipmastersare responsible for damage caused to moving vessels.
E. Finance
3.11 Before closure, the main source of SCA's revenues was canal dues,which until 1967 were set according to the terms of the Egyptian Government'sDeclaration of April 24, 1957 to the United Nations (Annex 10). Some subsi-diary income was also derived from affiliated companies and public distribu-tion of electricity and water. SCA pays 5% of its gross income from canaldues to the Government as a royalty and pays income tax (para 5.04), as wellas transfers the surplus after payment of royalty, taxes, and interest onoutstanding debt to the Government, although its By-Laws do not require suchtransfer.
3.12 Despite SCA's autonomy, its annual budget for current and capitalexpenditures has to be reviewed by the Finance and Planning Ministries andapproved by Presidential decree (para. 3.01). The annual budget is basedon the past year's results and includes SCA's local and foreign currencyrequirements for the next year. Within the limit of the approved budget,SCA can draw foreign exchange from the Central Bank without further approval.This procedure appears to have worked smoothly when the Canal was in opera-tion. Since closure, however, Government interference with SCA's managementhas been increasing and SCA's autonomy has been somewhat limited. The Govern-ment has given informal assurances to the Bank that it will ensure that SCA
- 9 -
carries out its operations and conducts its business without any diminutionof autonomy.
3.13 Until 1967, SCA was continuously profitable (para 5.04); transfersto the Government were substantial, amounting to US$195.5 million equivalentin 1967. With the exception of the 1959 Bank loan (US$56.5 million) and a1964 Kuwait Fund loan (US$33 million), SCA has financed its investments frominternally generated funds. During closure, when SCA lost its main sourceof income, the Government subsidized it and assumed debt service, contribut-ing US$163 million as loans from the Central Bank (para 5.05). The Govern-ment has stated that it will continue to provide the necessary local andforeign currency to cover operating costs and debt service until SCA re-sumes earning sufficient revenue (para 4.08).
F. Canal Dues
3.14 After nationalization in 1956, the Government did not change thelevel of canal dues. The Declaration to the United Nations (para 3.11) statedthat "any increase in the current rate of tolls within any twelve months, ifit takes place, shall be limited to 1%; any increase beyond that level to bethe result of negotiations". Dues were increased by 1% three times between1957 and 1967 (para 5.02). SCA intends to revise dues before reopening toreflect changes in shipping patterns and costs and inflation. For thispurpose SCA has hired consultants (Englestadt Shipping Consultants, Norway;Westinform, UK; ASCOT, France) to carry out a study of the potential trafficthrough the Canal after reopening. Terms of reference for the study aresatisfactory and the Consultants' interim report should be available beforethe end of 1974 in time for SCA to decide on new tariffs before reopening ofthe Canal.
3.15 Revised canal dues will have wide economic and political consequences.While the shipping community expects future dues to be considerably higherthan those prevailing in 1967 (most current shipping studies are based on -
dues two to three times higher), shippers would expect some savings to bepassed on to them. SCA and the Government confirmed that they were consider-ing several tariff setting alternatives, including direct negotiations withusers and that a commission had been appointed to review this question andmake recommendations on the form of consultation that should take place beforenew tariffs are published.
G. Audit
3.16 Auditors from the Government's Central Organization for Accountingand Auditing audit SCA's accounts. The Audit is satisfactory and acceptableto the Bank.
- 10 -
IV. THE PROJECT
A. Objectives
4.01 The objective of the project is to enable ships to transit theSuez Canal.
B. Description
4.02 The project is to rehabilitate the Canal and restore navigation inthe reopened Canal to its pre-1967 level of efficiency. It includes: (i)clearing and reopening the channel, (ii) procuring materials and equipment,(iii) reconstructing auxilliary facilities, and (iv) technical assistance andstudies. The major elements are:
(a) Preparation of the Channel:
(i) Provision of light salvage equipment to remove about100 minor wrecks and a causeway. This equipment willbe used later for routine salvage and maintenance op-erations.
(ii) Provision of navigational aids (buoys, radar reflectors,beacons, and marking lights) and telecommunications,radar, and radio systems for monitoring and safetyof vessels in transit.
(b) Repairs to the Channel -- Provision of dredgers as well as earth-moving, quarry, and repair equipment to replace that destroyedduring closure. The equipment will be used initially for re-pairs and subsequently for routine maintenance.
(c) Services to the Channel -- Provision of floating equipment(tug-boats, pilot vessels, motorboats, ferry boats, floatingcranes, tankers, barges, and antipollution equipment).
(d) Workshop and Shipyards Rehabilitation -- Reconstruction andreequipment of workshops and shipyards, thus permitting SCAto build small vessels and to maintain and service floatingequipment.
(e) Services -- Provision of land transport (vehicles, garages,and service stations), field equipment, cranes, oxygen andcompressed air plants, medical services, water purificationand power plants, and office equipment to replace damagedand obsolete facilities.
- 11 -
(f) Stores -- Replenishment of depleted stores, and provision ofmaterials and spare parts to maintain and service the Canalas well as shipbuilding and structural steel, pipes, ropes,cables, timber, paint, and small tools.
(g) Buildings, Houses, and Roads -- Rehabilitation of damagedbuildings and houses as well as damaged service roads.
(h) Local Work -- Relocation of evacuated workshops, repairs toelectric transmission lines, and resettlement of SCA's staff.
(i) Technical Assistance and Studies:
(i) strengthening SCA's capabilities, through technicalassistance and training, in financial and economic plan-ning, project evaluation and operational procedures;
(ii) provision of a short-term study of traffic expected touse the Canal and of the possible level of dues (para3.15); and
(iii) provision of a long-term study of optimum size andtiming of future canal enlargement.
Annex 11 gives the justification for SCA's equipment program.
C. Cost Estimate
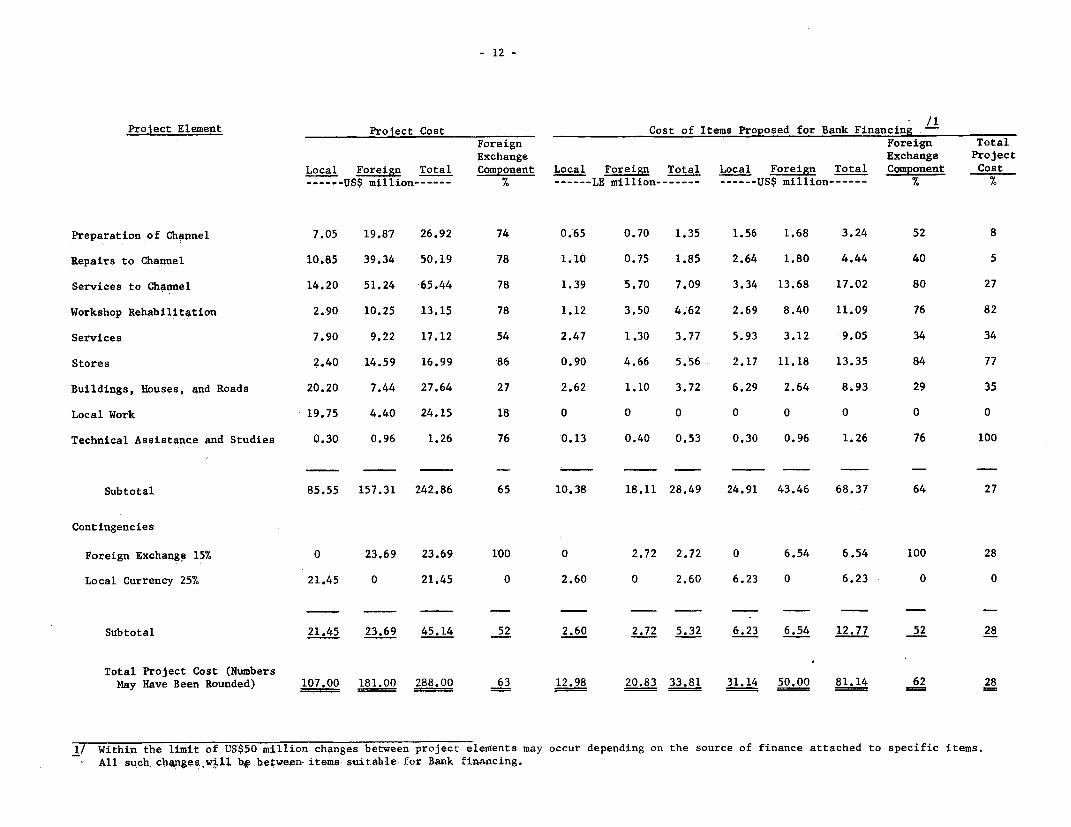
4.03 The project cost is estimated at US$288 million, of which the for-eign exchange component is US$181 million or 63%. The cost excludes contri-butions to canal preparation by the Egyptian, UK, and US Navies (paras 1.01and 2.15) and interest during construction on external loans. But, as theGovernment does not intend to waive any taxes or duties, the cost includescustoms duties up to 40%, costs of shipping and handling, and fees for localagents, insurance companies, local fittings, and trials. Annex 12 gives de-tails of the cost estimates which is summarized on page 12.
4.04 Costs of civil works have been derived largely from prices ofsimilar works that were being undertaken in the Canal Zone at appraisal time.SCA confirmed these prices. They are based on SCA using a high percentageof its labor force, which is competent, to repair revetments and constructworkshops, signalling stations and minor buildings, with local contractorsaugmenting SCA's force account as necessary. Costs of equipment are basedon recent suppliers'prices, and are reasonable.
- 12 -
ProJect Element Proiect Cost Cost of Items Proposed for Bank Financing
Foreign Foreign TotalExchange Exchange Project
Local Foreign Total Component Local Foreign Total Local Foreign Total Component Cost- US$ million ----- % ------LE million------- ------US$ million ------ % %
Preparation of Channel 7.05 19.87 26.92 74 0.65 0.70 1.35 1.56 1.68 3.24 52 8
Repairs to Channel 10.85 39.34 50.19 78 1.10 0.75 1.85 2.64 1.80 4.44 40 5
Services to Channel 14.20 51.24 65.44 78 1.39 5.70 7.09 3.34 13.68 17.02 80 27
Workshop Rehabilitation 2.90 10.Z5 13.15 78 1.12 3.50 4.62 2.69 8.40 11.09 76 82
Services 7.90 9.22 17.12 54 2.47 1.30 3.77 5.93 3.12 9.05 34 34
Stores ,2. 40 14.59 16.99 86 0.90 4.66 5.56 2.17 11.18 13.35 84 77
Buildings, Houses, and Roads 20.20 7.44 27.64 27 2.62 1.10 3.72 6.29 2.64 8.93 29 35
Local Work 19.75 4.40 24.15 18 0 0 0 0 0 0 0 0
Technical Assistance and Studies 0.30 0.96 1.26 76 0.13 0.40 0.53 0.30 0.96 1.26 76 100
Subtotal 85.55 157.31 242.86 65 10.38 18.11 28.49 24.91 43.46 68.37 64 27
Contingencies
Foreign Exchange 1.5% 0 23.69 23.69 100 0 2.72 2.72 0 6.54 6.54 100 28
Local Currency 25% 21.45 0 21.45 0 2.60 0 2.60 6.23 0 6.23 0 0
Subtotal 21.45 23.69 45.14 52 2.60 2.72 5.32 6.23 6.54 12.77 52 28
Total Project Cost (NumbersMay Have Been Rounded) 107.00 181.00 288.00 63 12.98 20.83 33.81 31.14 50.00 81.14 62 28
1/ Within the limit of US$50 million changes between project elements may occur depending on the source of finance attached to specific items.All such cb4ngepawsill b#,between- items- suitable for Bank financing.
- 13 -
4.05 Bearing in mind SCA's current information on costs of most itemsrequired for the project and the quick disbursement expected for the pro-posed Bank-financed items (para 4.16), a total price contingency allowanceof 15% on the foreign exchange component and 25% on the local currency com-ponent is considered appropriate. The 25% local currency contingency allow-ance over the project construction period is considered realistic and inkeeping with the forecast of SCA. Physical contingencies have not been in-cluded since the project will finance only procurement of equipment. Duringloan negotiations, SCA and the Bank confirmed the project cost estimate.
D. Items Proposed for Bank Financing
4.06 The Bank proposes to finance the foreign exchange cost of itemssuitable for international competitive bidding excluding those readily iden-tifiable and suitable for bilateral lending such as dredgers, dredging equip-ment, spare parts and floating cranes. The cost of the items to be financedby the Bank is US$81 million, of which US$50 million is the foreign exchangecost. Page 12 shows a summary of these items and Annex 13 shows details.,During loan negotiations, the types of items to be financed by the Bank loanwere reviewed and agreed upon by SCA.
E. Financing Plan
4.07 The financing plan is summarized below:
Source of Finance Local Foreign TotalUS$ million-------
Kuwait Fund (loan already obtained) 0 33 33IBRD (proposed) 0 50 50SCA (expected from internally generated funds) 74 0 74Minimum Government contribution 33 0 33Other assumed Foreign borrowing (second loanfrom the Kuwait Fund, USAID and other Araband external sources) 0 98 98
Total 107 181 288
The Kuwait loan is for 17 years including 2 years of grace at 4.5% interest.USAID has indicated that it intends to contribute US$50 million towards thefinancing of the project, subject to satisfactory congressional approval.The terms and conditions of the USAID loan are expected to be for 40 yearsincluding 10 years of grace at 3% interest. Other Arab and/or externalsources are expected to be on the same terms and conditions as the Kuwaitloan. The proposed Bank loan will be for 20 years including 4 years of graceat 8% interest. Local currency costs will be financed by the Government andby SCA's internally generated funds. The Government has agreed to authorizeSCA to retain that part of its earnings necessary to complete the project
- 14 -
and it has also agreed to guarantee cost overruns. Execution of satisfactoryagreements between SCA, the Government, the Kuwait Fund, USAID and otherexternal sources is a condition of effectiveness of the proposed loan.
4.08 Under these provisions (para 4.07), the Government will finance thelocal costs of the project until SCA starts to generate its own funds from canaldues in 1975. According to the financial forecasts (Chapter 5), the minimumGovernment contribution will be US$33 million (LE 13.8 million) in 1974 tocover local currency costs. In addition the Government agreed to provide SCAwith some LE 10 million (US$24 million) in 1974 as working capital to coveroperating deficits and debt service.
4.09 SCA is presently using the Kuwait Fund loan for the most urgentlyneeded items. Some items to be financed under the Bank loan also are urgentlyneeded. Retroactive financing up to US$3.5 million is, therefore, recommendedto cover expenditures by SCA incurred after July 1, 1974 on items proposed tobe financed by the Bank. The need for retroactive financing was reviewedduring loan negotiations and the amount agreed upon by SCA.
F. Implementation
Responsibility
4.10 SCA will be responsible for carrying out the project. Its wellqualified and competent engineering staff and experienced procurement de-partment is capable of preparing specifications and contract documents suit-able for international competitive bidding for procurement of the items pro-posed for Bank financing. However, SCA has agreed to employ consultants,satisfactory to the Bank, to modernize its workshops and to assist in theprocurement and installation of telecommunication systems.
Procurement
4.11 Procurement of Bank-financed items will be on the basis of inter-national competitive bidding in accordance with the Bank Group's "Guidelinesfor Procurement". Most items are replacements for existing equipment, andSCA is familiar with the specifications required. Some spare parts will beprocured directly from manufacturers, based on negotiated prices (about US$4.3million). All equipment will be provided with spare parts as recommended bythe manufacturers' guidelines for running and maintenance. Items financed byUSAID would be procured from the US, in accordance with USAID procurementprocedures. It is not yet known whether other lenders would require SCA tofollow particular procurement procedures. It is likely that SCA would useits own procurement procedures of calling competitive bids from an establishedlist of suppliers for items to be financed under the Kuwait loan.
4.12 The major items financed under the Bank loan will be procured abroad.Egypt has no regional preference treaties, and bids will be compared on a CIFbasis net of custom duties. Local manufacturers are not expected to contri-bute substantially to procurement of Bank-financed items. However, for the
- 15 -
purpose of bid comparison, preference will be given to local manufacturersto the extent of 15% of the CIF landed price of imported goods or the actualcustoms duty, whichever is lower.
4.13 SCA will undertake building and repair mainly on a force accountbasis, augmented by local contractors as required. SCA's shipyards are ex-pected to build small motorboats, ferry boats, tankers, and barges at com-petitive prices; provision for these items has been allowed in calculatingthe foreign exchange component.
Construction Schedule
4.14 The construction period will be front the fall of 1974 to the endof 1977. However, ships will be able to transit,. though possibly at reducedspeed, from the reopening date (end of April 1975). Rehabilitation of facil-ities essential to navigation will have priority, and some temporary facilitieswill be used in the early months of operation. The construction schedule wasconfirmed during loan negotiations.
G. Disbursements
4.15 Disbursements under the Kuwait Fund loan have started and are ex-pected to be completed by mid-1975. Disbursements under the proposed Bankloan are scheduled to start in the first half of 1975 and to be largely com-pleted by the end of 1977, with some minor payments of guarantee and retentionmonies in early 1978. The outstanding amount to be provided by other donors(US$98 million) must be available in the first half of 1975, and should befully distributed by the end of 1977. Annex 14 shows disbursements under theBank loan. Any surplus funds in the loan account after the project has beencompleted should be allocated to similar items.
H. Safety Measures
4.16 Because all types of ships and cargoes will transit the reopenedCanal, safe and unrestricted transit will be a first priority of SCA. Ground-ing of a single ship in any narrow stretch of the Canal will completely stoptransit. Collisions of ships with dangerous cargoes could cause fire, noxiousfumes, or pollution in any sector of the Canal and its environment. Removalof oil and dangerous cargoes from crippled ships as well as collection andtreatment of oil slicks caused by transitting ships will be provided forunder the project. SCA's safety record over the years has been excellent,and its experienced pilots and other operating staff are expected to performadequately when the Canal is reopened. The channel is stable under normalworking conditions, and the equipment to be provided under the Bank loanwill insure that first-class services on land and water are available forall SCA operations. Continuation of SCA's good performance in handling shipswill result in minimum insurance premiums for ships transitting the Canal.
- 16 -
I. Ecology and Urban Development
4.17 Reopening the Canal will not be harmful to the region's ecology.The tidal ranges at the eastern end of the Mediterranean and the northernend of the Red Sea are too small to induce any sizable movement of wateralong the Canal. The existing sweet water canal distributing fresh waterfrom the Nile River and brackish water from Lake Timsah, Great Bitter Lake,and Little Bitter Lake has existed for many years, and reopening the Canalwill not interfere with natural conditions.
4.18 Silt will be dredged, pumped to embankments east of the waterway,and allowed to settle. Clear water will percolate away or return to theCanal.
4.19 Although the Canal is virtually a complete water separation betweenAfrica and Asia and a barrier to the passage of any non-swimming animals, fewanimals in the area wish to make the journey.
4.20 The Ministry of Development is considering many schemes to developor exploit human and transit resources of the Canal Zone. These schemes in-clude: industrial, urban, or tourism development; free trade zones; andwater and power supplies. They are not yet sufficiently advanced to bedescribed in this Report.
J. Future Expansion of the Canal
4.21 As explained in para 2.10, the average size of petroleum tankershas been growing constantly during the closure of the Canal and is expectedto continue to do so until 1980. While almost all tankers in service coulduse the Canal in 1966, it is projected that only 57% and 40% would do so in1975 and 1978 respectively, if the Canal is not enlarged. At 1967 dimensions,petroleum shipment would account for 47% and 30% of total traffic in 1975 and1980 respectively, compared to 75% in 1966. The potential loss of revenuesbased on the 1967 tariffs increased by 37% (para 5.03) would be about US$150million annually and the potential loss to the world shipping community wouldbe of the order of US$250 million annually. SCA is fully aware of this andhas decided to proceed with dredging for the first stage of the enlargementas soon as the channel is reopened. To that effect SCA has recently signeda letter of intent with Japanese contractor for dredging on the most diffi-cult part of the Canal to start by mid-1975. The letter covers only part ofthe total dredging required for the first phase of the enlargement.
4.22 The first stage of the enlargement, as now envisaged, consists ofincreasing the permissible draft and wet section of the channel from 11.5 mto 16 m and from 1800 m2 to 3200 m2 respectively, by dredging some 350 millionm3 . This is expected to be completed in four years at a total cost presentlyestimated at US$720 million 1/, including additional works and facilities.
1/ Excluding interest during construction estimated at US$60 million.
- 17 -
4.23 The first stage of the enlargement will make it possible for tankersof 150,000 dwt and of 250,000 dwt to use the Canal laden and in ballast re-
spectively. It would increase potential petroleum traffic in 1980 from about100 million dwt to about 300 million dwt, of which 200 million would be inballast. According to SCA's plans, further expansion would be required after1980, to accommodate VLCC's of 200,000 ton laden and of almost any size inballast. Details of the two cross sections are given on Map IBRD 8794.
4.24 There is little doubt that the first phase of the enlargement isjustified. A preliminary study shows that under conservative tariff (para5.03) and traffic assumptions the project would yield a rate of return ofabout 15%, and therefore SCA's decision to proceed immediately with the ini-tial dredging is understandable. However, there is a need for further studiesto determine the optimum size and timing of the proposed expansion. This wasreviewed during loan negotiations and SCA agreed to hire consultants to carryout a study which among other things would: (i) review traffic projections;(ii) determine savings in shipping costs achieved by the users of the enlargedCanal under different levels of dues; and (iii) recommend the optimum sizeand phasing of the enlargement. Terms of reference were reviewed by the Bankand are satisfactory. The study should be completed by mid-1975. It wasalso agreed that the Government and SCA will consult with the Bank, whenthe results of the study are available, before deciding on the optimum sizeand phasing of the enlargement.
4.25 Although from a technical point of view it would have been preferableto wait until the study is completed before letting any dredging contract,SCA's decision not to wait until the final results of the study is acceptable,bearing in mind that the dredging contract provides for only part of the dredg-ing required for the first stage and can be adjusted to accommodate dredgingto the dimensions finally decided. Any expansion would require extensivedredging and in view of the incremental revenues to be derived from the ex-pansion it is reasonable to start as soon as possible.
V. FINANCIAL EVALUATION
A. General
5.01 SCA is a revenue earning entity whose income before 1967 was mostlyderived from dues levied on ships transitting the Canal. Additional incomewas derived from berthing, towing, supplying electricity and water to CanalZone cities, shipbuilding and repairing, and renting of equipment.
B. Canal Dues
5.02 Between 1957 and 1967, canal dues were levied on ship tonnage ex-pressed in Suez Canal Net Registered Ton (SCNRT) equivalent to 2.83 m ; theywere not based on canal operating costs and were not charged on cargo. Sur-
- 18 -
charges, called "improvement dues", also were imposed on ships with draftsexceeding 11.60 m and/or with dimensions exceeding standards established inthe Rules of Navigation as a means of recovering costs of previous expansionprograms and of additional maintenance requirements created by large ships.A 55% discount was granted to promote ships transitting in ballast, mainlytankers. Dues were payable in advance in Egyptian pounds, acquired by sell-ing convertible 'foreign exchange to the Central Bank. In 1967, dues wereLE 0.4373/SCNRT.
5.03 For the financial evaluation, 1967 dues were escalated by 37% toaccount for: (i) past inflation (29%); and (ii) annual increases in dues of1% between 1967 and 1975 (8%). However, a sensitivity analysis was carriedout to test SCA's financial viability against the 1967 level of dues increasedby only 8% (para 5.09).
C. Operating Results to 1967
5.04 Except for a decline after nationalization, SCA's earnings increasedconsistently to reach LE 98 million in 1967. Operating costs were mainlysalaries, materials, and depreciation, and were essentially fixed costs.From 1965 to 1967, they remained almost constant while revenues grew by10% in real terms. In 1967, SCA's net income after payments of royaltyand income tax to the Government was about LE 58 million, or 59% of itsrevenue. Up to 1967, SCA serviced its debt, contributed substantially tofinancing relatively minor expansion programs, and accumulated substantialcash reserves (LE 37 million by 1967).
D. Operating Results After 1967
5.05 During closure, SCA lost income from canal dues and incurred largeoperating losses because of continued salary payments to retained staff (para3.07). These losses ranged from LE 7.1 million in 1968 to LE 5.2 million in1973. The losses and SCA's debt service requirements were covered partly byGovernment loans from the Central Bank (4.5% interest, repayment period notdetermined) and partly by SCA cash reserves. By the end of 1973, the Govern-ment had contributed LE 67.9 million to SCA, and SCA had used up all its in-ternal funds. Annexes 15 and 16 show Income and Cash Flow Statements.
5.06 At December 31, 1973, SCA had an accumulated deficit of LE 27 mil-lion and long-term debt of LE 76.7 million. The long-term debt was dividedbetween loans from the Kuwait Fund (LE 7.0 million), and Government (LE 67.9million). During loan negotiations, the Government has indicated its willing-ness to forgive its loans.
- 19 -
E. Balance Sheets
5.07 Annex 17 shows balance sheets for 1965-67 (actual) and 1973 (esti-mated). No meaningful balance sheets are available for 1967-73 because somerecords were destroyed and SCA has not been able to carry out a complete in-ventory of damages to assets resulting from hostilities. Also, fixed assetstaken over upon nationalization in 1956 are still being carried on the booksat a nominal value of LE 1. A detailed inventory and revaluation of existingassets is necessary. But this would take over one year because of staff as-signments to priority reconstruction work, and could not be completed beforethe projected date of reopening. Therefore, SCA gave informal assurances thatit will, not later than December 31, 1976: (i) carry out a complete revaluationof fixed assets; (ii) adopt realistic depreciation rates reflecting the economiclife of these assets. SCA's accounting and engineering staff is competent todo this work, and technical assistance is not likely to be required.
F. Financial Forecasts
5.08 Financial forecasts are based on canal dues as defined in para 5.03and Annex 18. Costs have been projected at 1973 levels on the assumption thatfuture dues will be adjusted to account for inflation. No provision has beenmade for transfers of revenue surpluses to Government. Annex 19 gives otherassumptions.
5.09 Forecast Income Statements (Annex 20) show that annual surplusesafter payment of royalty, income tax, and interest will grow from LE 13.4 mil-lion in 1975 to LE 60.7 million in 1980; in 1967, the surplus was LE 58 million.Forecast Cash Flow Statements (Annex 21) also show that SCA will generate suf-ficient funds to service its debt, to contribute LE 30.8 million to the project(about 25% of the total project cost and 69% of the local cost), and to retaina substantial cash balance of LE 208 million at the end of 1980. However, evenif tariffs were only to be raised by 8% (i.e. 1% p.a. from the 1967 level to1975) and no adjustment made for devaluation (para 5.03), SCA would still befinancially viable; there would be annual cash surpluses from 1975 onwards andan accumulated surplus of LE 139 million at the end of 1980. The financialforecasts make provision for an investment of LE 300 million to finance thefirst phase of the enlargement (para 4.22). It has been assumed that SCAwould borrow the entire amount from external sources on relatively soft termsi.e. 25 years including 5 years of grace at 6% interest. Two other alternativeswere also considered to test the sensitivity of SCA's financial results againstdifferent financing terms: (i) 100% borrowing for 15 years including fiveyears of grace at 10%; and (ii) 60% borrowing for 25 years including fiveyears of grace at 6%. Both alternatives show that SCA's financial viabilitywould not be impaired by the enlargement of the canal and that SCA would beable to cover its costs and service its debts.
- 20 -
G. Financial Covenants
5.10 For reasons explained in para 5.07, the usual financial covenants(debt equity ratio and return on net fixed assets) will not be sought for theproject. SCA agreed that, except as the Bank shall otherwise agree it wouldnot incur any debt, unless it is shown that its net revenues for the fiscalyear in which such debt is incurred and for any succeeding fiscal year shallbe not less than 1.5 times the maximum debt service requirement for such yearon all debts of the Borrower outstanding in each such year including the debtto be incurred.
VI. ECONOMIC EVALUATION
A. General
6.01 Before 1967, the Suez Canal was one of the world's most importantshipping routes. Closure disrupted the shipping community and the economiesof a number of countries, and cost the world about US$4,355 million from 1967to 1971 (para 2.08). Reopening will greatly reduce the sea distance on anumber of major trade routes and reduce shipping costs accordingly. It alsowill generate some activities in countries having an export potential forproducts which cannot support high transport costs. These benefits willnot materialize rapidly, however, because of the time lag involved in pro-moting new agricultural and industrial schemes. Also, they may be offsetby losses in countries which benefited from closure. Therefore, only bene-fits derived from savings in shipping costs were taken into account in theeconomic evaluation.
B. Savings in Shipping Costs
6.02 Savings in shipping costs are mainly in: (i) fixed operating costs(personnel, insurance, etc.) and capital costs per unit of cargo resultingfrom faster ship turnaround time; and (ii) fuel. They were estimated fordifferent trade routes, cargoes (petroleum, bulk, general, and containerized),and ship sizes. Annex 7 summarizes the assumptions.
6.03 Global savings in shipping costs are an adequate way of measuringbenefits generated by the project, but they do not adequately reflect thedistribution of benefits among shipowners, shippers, and SCA. Theoretically,SCA could retain all benefits by charging dues equal to the savings of anyparticular ship. This, however, would not give any incentive to shipownersto divert traffic. To attract traffic, SCA will have to set dues which makeuse of the Canal competitive with use of alternative routes. Such dues willbring in revenues enabling SCA and Egypt to recoup part of the global savings;shipowners will recoup the balance. Whether part of the savings will be passedon to shippers depends on the structure of the market and competition between
- 21 -
shipowners. In the tanker market, shipowners will have little incentive topass on savings to consumers since the volume of petroleum transitting theCanal will be limited and alternative routes will be used for most shipments(Annex 7). The situation might be different for general and bulk cargo ship-ping since competition on similar routes is keen and shippers will exert pres-sure on shipping companies and conferences to obtain reduced freight rates.
C. Methodology
6.04 The economic evaluation is based dn comparison of the benefits(savings in shipping costs) and the cost of carrying out the project. Costrelated to the enlargement of the canal or benefits according to SCA as aresult of the enlargement (para 4.21) were not taken into account.
6.05 The evaluation of global savings in shipping costs was based onstudies prepared by SC Shipping Consultants (Norway) and Petroleum EconomicsLimited (UK) and reports from the Organization for Economic Cooperation andDevelopment (Energy) and the United Nations Conference on Trade and Develop-ment (Shipping). It was carried out as follows:
(a) Traffic Prolections (Annex 6). Since access to the Canal islimited to ships of a certain tonnage, the percentage of eachtrade transported on ships capable of passing through theCanal had to be determined. Separate determinations weremade for petroleum, bulk cargo, general cargo, and contain-erized cargo. Movements of goods were projected by maintrade routes as much as possible to relate them with statis-tical observations on the size of ships traditionally plyingthe routes.
(b) Savings in Shipping Costs (Annex 7). Savings in shippingcosts through use of the Canal instead of alternative routeswere calculated for each of the main trade routes and forrepresentative size groups of ships (tankers, bulk carriers,liners, and container ships). In the case of tankers, savingswere calculated assuming that shipowners will only attempt torecover fixed operating costs. This assumption was made totake into account the prospect of depleted freight rates inthe near future as a combined result of excess tanker capac-ity and of a relative decline in demand for petroleum.
(c) Traffic Build Up. The Canal is assumed to reopen by April 1975,and traffic to be progressively diverted to reach the potentiallevel by the end of 1976. This assumption was made to take intoaccount: (i) the reluctance of shipowners to change their wayof operation; (ii) some uncertainties as to the safety of navi-gation through the Canal; (iii) the time required to reorganizeand reequip port installations and agencies abandoned duringclosure.
- 22 -
D. Traffic Projections and Saving in Shipping Costs
6.06 With future dues 37% higher than in 1967 (para 5.03), traffic interms of SNCRT is expected to grow from 55 million ton in 1975 to about 170million ton in 1977 and then level off to 175 million ton by 1980. The rea-son for traffic remaining almost constant is the decrease in petroleum traf-fic, reflecting the progressive disappearance of small tankers, which offsetsthe growth in dry cargo traffic. The share of petroleum traffic (in ballastand laden) is expected to decrease from 47% in 1975 to less than 30% in 1980,with about 75% of the tankers passing southbound.
6.07 Net savings in shipping costs after deduction of canal dues wouldamount to US$315 million in 1975 and US$1,250 million in 1980. They would bedivided between tankers and dry cargo ships in a 40:60 ratio in 1975 and 30:70ratio in 1980. Under the assumption for dues (para 5.03)., revenues to SCAwould amount to about US$80 million in 1975 and to US$250 million in 1980.
E. Rate of Return
6.08 Savings achieved as a result of the project are so large that nodoubt exists about its justification. Since most of the savings would beachieved by dry cargo ships (para 6.07), the size of which is expected toremain for a long time within the limits imposed by the present cross-section of the Canal, the risk is minimum of savings being offset by rapidtechnological changes as affected tankers in the 1960's.
6.09 Assuming tariffs at the level referred to in para 6.06, SCA's in-come will amount to about 15% of global savings. The economic evaluationshows that the project would, under this assumption, yield a rate of returnwell in excess of 50%, which is extremely satisfactory (Annex 23).
F. Sensitivity Analysis
6.10 Higher dues than those taken into account (para 6.06) would resultin a reduction in global savings (gross and net) since: (i) shipowners oncertain routes would no longer have any incentive to divert traffic to theCanal; and (ii) SCA would recoup a higher percentage of gross savings throughhigher canal dues. The analysis shows that:
(a) A flat rate of US$3.3/SCNRT, or three times the 1967 level,would result in a 15% reduction in gross savings. Petroleumtraffic would be more affected than dry cargo traffic andsavings for tankers would decrease by 36% while savings fordry cargo ships would decrease by only 5%. This shows thatthe dry cargo market and, more particularly liners and trampships, is much more inelastic than the tanker market.
- 23 -
(b) Net savings, after deduction of dues, would decrease by about30%. Income to SCA would increase 1.5 times compared to theassumption in the financial evaluation, and gross SCA earningswould amount to about 45% of gross savings.
Setting such a rate for tankers would almost certainly make future expansionof the Canal unfeasible since dues would exceed savings to be achieved bytankers over 200,000 dwt using the Canal instead of the Cape of Good Hoperoute.
VII. AGREEMENTS REACHED AND RECOMMENDATION
7.01 Agreement has been reached on the principal issues referred to inthe preceding chapters and more particularly on the study of the enlargementof the Canal (para 4.24). Subject to the conditions of effectiveness describedin para 4.07, the proposed project is suitable for a Bank loan of US$50 millionto SCA for a term of 20 years corresponding to the economic life of the equip-ment, including a period of grace of 4 years corresponding to the disbursementperiod.

AEX 1
APPRAISAL OF
THE REHABILITATION OF THE SUEZ CANAL
ARAB REPUBLIC OF EGYPf
Govwment Receipts from the Suez Canal Authority, 1956-67(LE million)
Year R ty Income Tax Profit Total
1956/57 0.70 1.75 4.00 6.45
1957/58 2.00 5.00 14.00 21.00
1959 2.30 4650 15.00 21.80
1960 2.40 9.40 16.50 28550
1961 2.60 8.20 22.00 32.80
1962 2.70 8.80 22.00 33.50
1963 3.30 12.30 35 .20
1964 3.90 16.10 37.80 57.80
1965 4.30 18.10 46.90 63.30
1966 4.70 23.10 51.60 79.40
1967 4.90 23.35 53.20 81.45
/l Devaluation of the Egyptian pound by 25%.
Source: SCA
November 1974
AM?iEX 2
APPRISAL OF
THE REfWALITATION OF THE SUEZ CANAL
ARAB REPUBLIC OF EGYPT
Traffic Data, 1955-66Annual Rate ofIncrease
Traffic 19-5 l260 1965 1966 1955t66M----- Million ton -------------
Number of Transit 14,666.0 18,734.0 20s289.0 21,250.0 3.7Net Tonnage 115.7 185.3 246.8 274.2 9.0
Total Traffic 107.5 168.8 225.4 241.9 8.9of whichNorthbound:
Petroleum Products 66.9 114.4 155.1 166.7 9.5Cereals 2.5 2.7 2.7 1.B 0Ores and Metals 5.3 8.2 7.1 6.5 0Oil Seeds 1.8 1.9 1.4 1.6 0Textiles 1.7 1.8 1.9 1.8 0Others 9.2 10.6 15.2 15.8 5-5
Total 87.4 139.6 183.4 194.2 8.3
___________________ % _______________
81.0 82.0 81.5 80.0
Southbound:
--- -------- Killion ton -------------- %Petroleum Products 1.9 3.0 7.9 8.9 16.7Cement 2.7 1.1 1.2 1.4 0Fertilizers 2.5 4.0 5.2 6.7 0Metals 3.8 5.6 4.7 5.0 0Others 9.2 15.5 23.0 25.7 10.9
Total 20.1 29.2 42.0 47.7 9.0
19.0 18.0 18.5 20.0
Source: SCA Annual Report, 1966
November 1974
ANNEX 3
APPRAISAL OF.
THE REHABILITATION OF THE SUEZ CANAL
ARAB REPUBLIC OF EGYPT
MaJor Importers of Middle last Oil,96,. 19-MA an. 1972(Million toni)
Importer 1968 1970 1972
North America 19.0 16.0 36.3Other Western Hemisphere 9.0 12.0 52.5Western Earope 253.0 309.0 426.8Africa 22.8 20.8 22.9South East Asia 31.5 39.8 62.6Japan 132.2 173.0 185.8Australasia 17.8 17.3 12.7Other Eastern Hemisphere 16.8 21.0 29.5Others 16.9 22.1 13.9
Total 519.0 631.0 843.0
Source: BP, "Statistical k'eview of the World Oil Industry 1968, 1970 and1972w'.
November 1974
AM 4
APPRAISAL OF
THE RI&BlIT.ATION 0? THE SWEZ CNL
ARAB REPBLIC OF EGYPT
Suez Canam Special Closure Swharge
Increaseon Gross
Country/Area Tariffs
India, Pakistan and ri Lanka 17.5
Fersian Guaf 25.0
Aden 35.0
Djibcutij, Asab, llassaa 40.0
Jeddah 45.0
Port Sulan 50.0
Far East 10.0
Aqaba 50.0
Burma 17.5
East Africa 15.0
Madagascar, Canores, Reunion, Mauritius 15.0
Idonesmia 10.0
Australia 5.0
/1 United Nations C nce on Trade and Dvwlophetp "The Eoon¢oEffects of tbh Closure of the Suez Canal", New York, 1973
Sources Journal pom la transport intornational (Easel), No. 24(16 June 1967)., p. 2485
Novenber 1974
ANNEX 5
APPRAISAL OF
'THE EHABILTATIOR OF THE SUEZ CGEAL
ARAB REPUBLIC OF EGYPT
Economic Consequences of Closure ofthe Suez Canal, 1967-71
(US$ million)
TotalShipping 1967-71
Tanker
Longer hauls 590Higher freight rates 1,160"Short-haul" premiwma 200Increased tanker investment 910
(Total added investment: $2,600million)Subtotal 2 ,860
Dry cargo
Liners-longer hauls 890Bulk carrier
Longer hauls 495Higher freight rates 110
Subtotal 1,495
Total ._4355
Source: United Nations Conference on Trade and Development, "TheEconomic Effects of the Closure of the Suez Canal", NewYork, 1973
November 1974
ANNEX 6Page 1
APPRAISAL OF
THE REHABILITATION OF THE SUEZ CANAL
ARAB REPUBLIC OF EGYPT
Suez Canal
A. Introduction
1. In 1967, the Suez Canal was a major feature in international seabornetrade. Its closure, since July 1967, created a number of disruptions andencouraged technological changes which would probably have been postponedotherwise. The evaluation of future traffic through the Canal cannot, there-fore, be a simple extrapolation of the past; it has to take into account thechanges in vessel size in main trade routes, in commodity trading and in ship-ping costs which occurred over the past seven years. Also, to a certain extent,future traffic will be affected by the level of Suez Canal dues and a sensiti-vity analysis has to be carried out to determine the elasticity of traffic todues for different types of trade (oil, dry bulk, general cargo and containers)since savings are different for each trade.
B. Tanker Traffic
2. In 1967, about 275 million ton of goods passed the Canal, and oilcargo accounted for about two-thirds of this amount. Over the past ten years,oil traffic had been growing at an average rate of over 10% p.a. and it wasexpected that future growth will at least maintain the same pace. Changes inthe size of tankers had occurred over the past five years and mainly since1964/65, reflecting the world wide trend for larger size ships. It was ex-pected that the number of tankers of over 70,000 dwt, which could not pass theCanal fully-laden, would increase rapidly and SCA was considering an expansionprogram to accommodate tankers of 125,000 tons fully laden.
3. The Canal has now been closed for seven years and a number of impor-tant changes occurred in world supply and demand for oil and in oil transporta-tion. An evaluation of the future role of the Canal and of potential trafficthrough the Canal should, therefore, be based on: (i) projected energy supplyand demand to determine the main trade routes and volumes to be transportedalong these routes; (ii) changes in the composition and size of the worldtanker fleet to determine the number of tankers that could physically pass theCanal fully or partially laden or in ballast; and (iii) the relative cost ad-vantage to ship owners in using the Canal rather than alternative routes.
ANNEX 6Page 2
Projected Oil SUpply and Demand
4. In the later months of 1973 and early in 1974, the world oil supplyand demand picture has been shaken by a number of unprecedented events. First,oil prices, which until the early 1970's had been declining in real terms,started to increase at a very fast pace and second, the oil embargo imposedby Arab producers led consuming countries to revise their attitude towardsthe consumption of oil, and to adopt conservation programs to reduce the costof imported oil supplies. Consuming countries reappraised their future needsfor oil in the light of much higher prices and decided to develop and/or main-tain local production of fuel, which, before the crisis, were not deemed fea-sible. The present evaluation is based on: (i) supply and demand projectionsprepared by the Organization for Economic Cooperation and Development; and(ii) an analysis of past oil movements between producing and consuming coun-tries. The main results are given in Tables 1 and 2 for Western Europe andNorth America. These tables show that the annual volume of oil to be trans-ported by tankers from the Middle East to Europe and North America after localproduction and supply from other sources (North and Western Africa and Carribean)and/or by other modes (pipelines between the Middle East and the Mediterranean)have been used, should decrease from 700 million ton in 1975 to 600 million tonin 1980. Should any of these other sources fail to provide the required volumesor should the consumption in Europe and North America increase more rapidlythan presently contemplated, then the difference would have to be made up byadditional supply from the Middle East and potential traffic through the Canalwould increase accordingly.
The Evolution of the Tanker Fleet
5. The composition and size distribution of the tanker fleet is givenin Table 3 for the years 1973 and 1978. It is based on existing tankers and onorders which have been registered with ship yards. Over the next four years,it is expected that total tanker capacity will almost double with the largerincrease in sizes of over 250,000 ton. This situation results from largeorders placed during the second and third quarter of 1973 following the abro-gation of the import quota system in the US and resumption of growth in oilconsumption in Europe. Although it is expected that some orders will be can-celled or delayed, it is currently accepted that there will be a large excessof tanker capacity over the next few years which could be as much as 50 milliondwt despite accelerated scrapping and laying up. The number of tankers under125,000 dwt that could pass through the Canal laden or in ballast is expectedto account for 35% of the total tanker fleet capacity component to 53% in1973.
Tanker Costs
6. The cost of shipping oil is made up of: (i) capital costs of thetanker which depend on the initial construction costs and of the return oninvestment expected by the ship owner; (ii) fixed operating costs includingmaintenance, manning and insurance; and (iii) voyage costs including fuelcosts, port charges etc. The main assumptions used in calculating the cost
ANNEX 6Page 3
of shipping oil are given in Table 4 for different sizes of tankers. Theyare based on studies prepared recently (Spring 1974) by Petroleum Economics(Consultants UK) and SC Shipping Consultants (Norway).
Potential Traffic
7. Potential traffic through the Canal has been estimated on the basisof the size distribution of tankers on the major trade routes. This distribu-tion results from technical parameters such as draft limitation at certainports of entry (US east coast) size of refineries and possible mix of crudeoils. The estimates rely on studies carried out by SC Shipping Consultants(Norway) who have been following the tanker market for a number of years. Theconsultants' results have been achieved by tracing and counting tankers onvarious routes and are considered reasonable. It has been assumed that tankersunder 70,000 dwt would pass the Canal laden and in ballast, that tankers between70,000 dwt and 100,000 dwt would pass the Canal in ballast only and that 75%of tankers between 100,000 dwt and 125,000 dwt would pass in ballast.
8. Potential traffic estimates are given in Table 5 and show that poten-tial tanker traffic for crude oil will decrease from 40.5 million dwt in 1975to 3.0 million ton in 1980 for laden tankers and from 143.0 million ton to44.0 million ton for tankers in ballast. The main reasons for the declineare: (i) the progressive disappearance of small size tankers (35,000 dwt to70,000 dwt) which are gradually replaced by very large crude carriers; (ii)the relative decline of Middle East exports to Europe; Middle East supplywhich in 1975 is expected to cover some 70% of total European demand wouldonly account for 55% in 1980; and (iii) the construction and/or expansion ofpipelines connecting Middle East producers with the Mediterranean. However,while crude oil traffic is expected to decline, products traffic is expectedto grow following the construction of large refining capacities in the MiddleEast (Iran, Saudi Arabia...). Products traffic is expected to grow from 11.0million ton in 1975 to 25.0 million ton in 1980 for laden cargo and from 11.0million dwt to 30 million dwt for tankers in ballast.
C. Bulk Traffic
9. Bulk cargo shipping has undergone important changes since the closureof the Canal. The improvement of mechanical handling equipment, the speciali-zation of ports as well as increasing volumes of trade have promoted differentmethods of shipping. Specialized bulk carriers are more and more frequent andare plying on definite routes. The analysis of future development in bulkcommodity trading is based on studies carried out by various consultants,Westinform (UK) and principally SC Shipping Consultants (Norway). The resultsarrived at by these two firms are close and are considered reasonable. Inboth cases, they are based on surveys made along different routes and on shiptracking along these routes in order to determine the most likely pattern oftrade and the size of vessels most likely to be used on these routes.
ANNEX 6Page 4
10. The analysis was carried out as follows:
(i) identification of the major commodities (iron ore, pig iron,steel manganese, bauxite, phosphate, sulphur, fertilizers,salt, grain, soya beans, hogs and lumber, bulk and paperand pulp);
(ii) estimates of inter area trade from 1975 to 1980 for eachcomodity by origin and destination;
(iii) estimates of the percentage of each trade which would beaffected by the reopening of the Canal; and
(iv) estimates of the distribution of bulk carriers by size groupson each trade route and for the main commodities based onphysical observation of past ship movements.
11. The results of the analysis summarized in Tables 6 and 7, show thatat the 1967 level of dues, bulk cargo traffic would grow from 33 million tonin 1975 to about 40 million ton in 1980. Northbound and southbound trafficwould be divided in the ratio 60:40 in 1975 and 55:45 in 1980. No importantchanges are expected in the type of commodities. Traffic in ballast would beminimum since bulk carriers often operate on a triangular route to reduce inballast time. Total savings to shipowners would amount to US$53 million in1975 and US$50 million in 1980.
D. Potential General Cargo Traffic
Liners and Tramp Vessels
12. The evaluation of future liner and tramp vessel traffic presentssome problems since it cannot be based on the evaluation of the movement ofgoods as for oil or bulk cargo. These vessels carry mixed general cargowhich is not identifiable and, therefore, the estimate of future trafficis based on the expected number of ships passing the Canal. As for othercargo, it was derived from actual ship movements in 1973 on routes thatwould be affected by the reopening of the Canal (Europe - South East Asia,North America - Middle East and Asia, S.E. Africa - Europe and North America)
13. The results arrived and have subsequently been escalated at 6% p.a.until 1980. This rate of growth does reflect pre-closure growth through theCanal and post-closure growth on alternative routes. Although no detailedforecast was made for individual routes, because of the lack of reliable basicdata, traffic has been projected by direction of trade i.e. southbound andnorthbound. The results are summarized in Table 8 and show that liner tradeand tramp trade would account for respectively about 80% and 20% of totalgeneral cargo trade and be about equally distributed between northbound andsouthbound. The results are expressed in terms of Suez Canal Net Registered
ANNEX 6Page 5
Tons (SCNRT) and were derived from a statistical analysis of the eqviivencein SCNRT of various types of liners and tramp ships.
Container Ships
14. Container transport appeared after the Canal was closed. There is,therefore, no experience in dealing with that particular form of transport.An analysis was made by consultants of container traffic on various routeswhich would benefit from the reopening of the Canal. The main trade routesaffected are from northern or southern Europe to the Far East, Australia,India, Pakistan and the Middle East. The main problem in entrusting containercarrier traffic is to find an equivalence between the standard type measurement(dwt and grt) and the Suez Canal measurement system. Since conts1ner shipsdid not exist in 1967, such equivalent cannot be estimated by statisticalmethods and for the purpose of the analysis, it has been assumed that on grossregistered ton would be equivalent to 0.60 SCNRT. The results of the analysisare summarized in Table 9 and show that container traffic is expected to in-crease from 16 million SCNRT in 1975 to 26 million SCNRT in 1980, the trafficbeing equally balanced between northbound and southbound.
E. Others
15. It has been estimated that about 15% of the traffic will be vesselswhich have not been accounted for. This has been added to the total potentialtraffic which is summarized in Table 9.
F. Traffic Build Up
16. It is expected that the Canal will be reopened at the end of thefirst quarter of 1975. It would, however, take some time for traffic to bediverted to the Canal since shipowners may feel a certain apprehension as tothe safety of navigation and also because arrangements have to be made toobtain new bunkering facilities, offices, etc. in the new ports of call. Ithas, therefore, been estimated that traffic in the first year would be 40%of the potential traffic and 80% the second year. The results are given inTable 10.
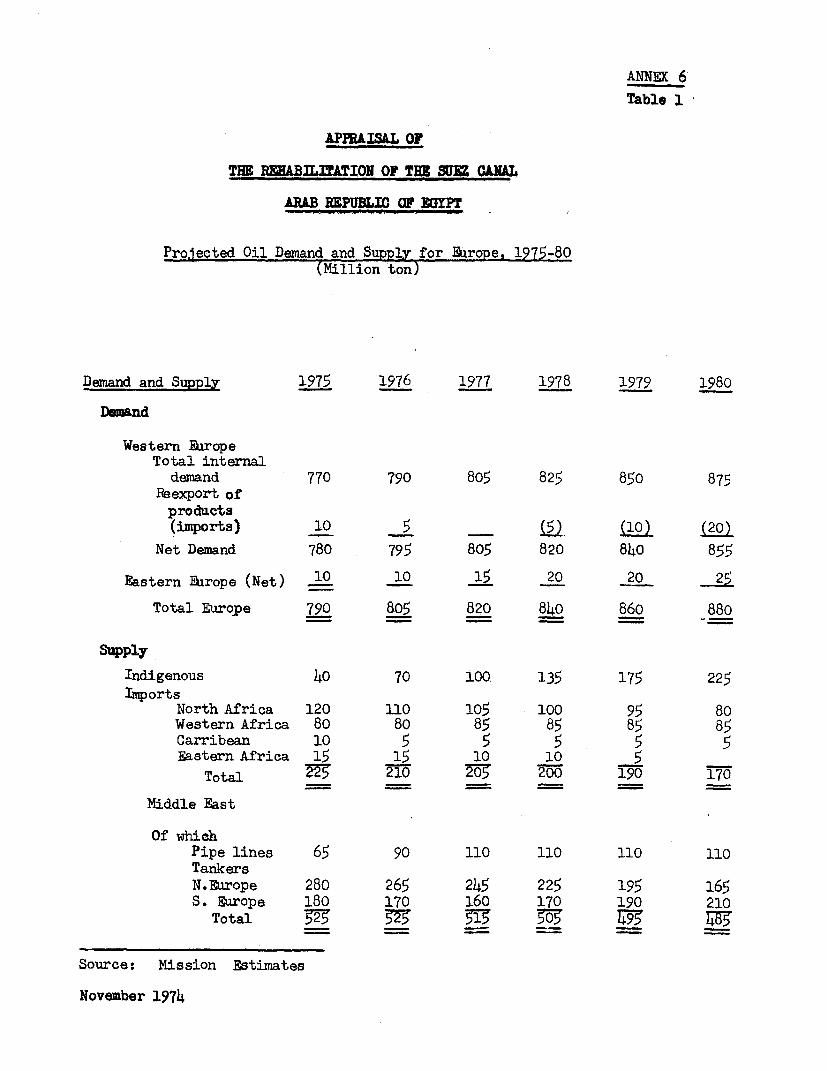
ANNEX 6Table 1
APRAISAL OF
THE RZH&BfI.TrTION OF THE SUEZ CNAL
ARAB REPUBLIC OF EGrP
Projected Oil Demand and Supply for Europe, 1975-80(Million ton)
Demand and Supply 1975 1976 1977 1978 1979 1980
Dumand
Western EuropeTotal internaldemand 770 790 805 825 850 875
Reexport ofprodlcts(imports) 10 5 (5) (10) (20)
Net Demand 780 795 805 820 840 855
Eastern Europe (Net) 10 10 15 20 20 25
Total Europe 790 805 820 840 860 880
supplyIndigenous 40 70 100. 135 175 225
ImportsNorth Africa 120 110 105 100 95 80Western Africa 80 80 85 85 85 85Carribean 10 5 5 5 5 5Eastern Africa 15 15 10 10 5
Total __ 2 200 190 170
Middle East
Of whiohPipe lines 65 90 110 110 110 110TankersN.Europe 280 265 245 225 195 165S. Europe 180 170 160 170 190 210
Total _27 _ _ _
Source: Mission Estimates
November 1974
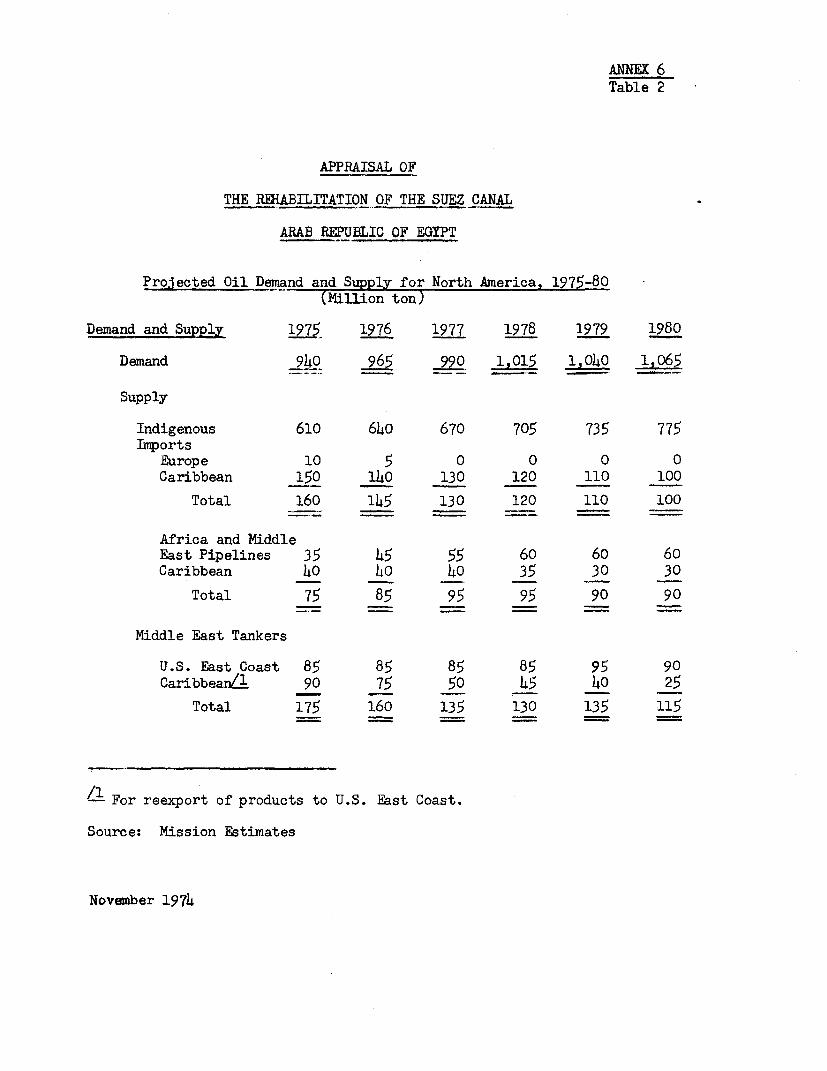
ANNEX 6Table 2
APPRAISAL OF
THE RERABILITATION OF THE SUEZ CANAL
ARAB REPUBLIC OF EGYPT
Projected il Demand and Supply for North America, 1975-80(Million ton)
Demand and Supply 1975 1976 1977 1978 1979 1980
Demand 940 965 990 1 015 1,040 1.065
Supply
Indigenous 610 640 670 705 735 775Imports
Europe 10 5 0 0 0 0
Caribbean 150 140 130 120 110 100
Total 160 145 130 120 110 100
Africa and MiddleEast Pipelines 35 45 55 60 60 60Caribbean 0 40 4O 35 30 30
Total 75 85 95 95 90 90
Middle East Tankers
U.S. East Coast 85 85 85 85 95 90Caribbearn/l 9 75 50 45 40 25
Total 175 160 135 130 135 115
For reexport of products to U.S. East Coast.
Source: Mission Estimates
November 1974
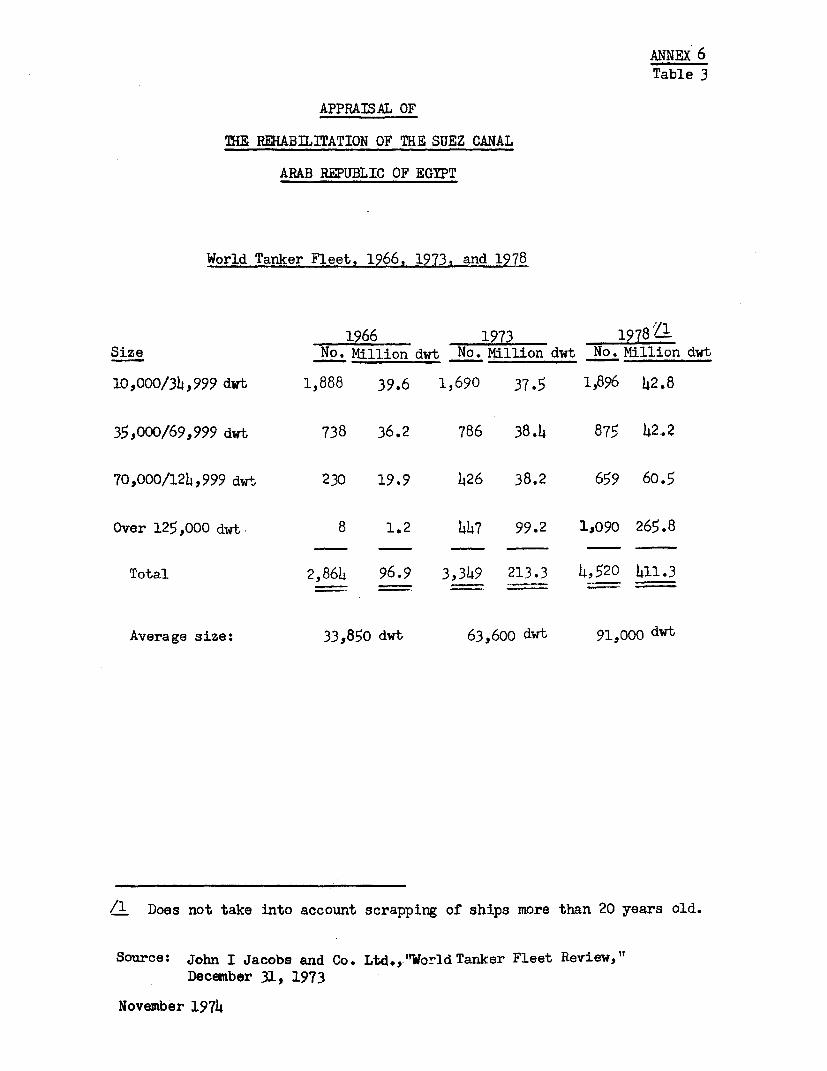
ANNEX 6Table 3
APPRAISAL OF
THE REHABILITATION OF THE SUEZ CANAL
ARAB REPUBLIC OF EGYPT
World Tanker Fleet, 1966, 1973, and 1978
1966 1973 197841Size No. Million dwt No. Million dwt No. Million dwt
10,000/3Lj,999 dwt 1,888 39.6 1,690 37.5 1,896 42.8
35,000/69,999 dwt 738 36.2 786 38.4 875 42.2
70,000/12),999 dwt 230 19.9 426 38.2 659 60.5
Over 125,000 dwt 8 1.2 447 99.2 1,090 265.8
Total 2,864 96.9 3,349 213.3 4,520 411.3
Average size: 33,850 dwt 63,600 dwt 91,000 dwt
/1 Does not take into account scrapping of ships more than 20 years old.
Source: John I Jacobs and Co. Ltd.,."World Tanker Fleet Review,"December 31, 1973
November 1974
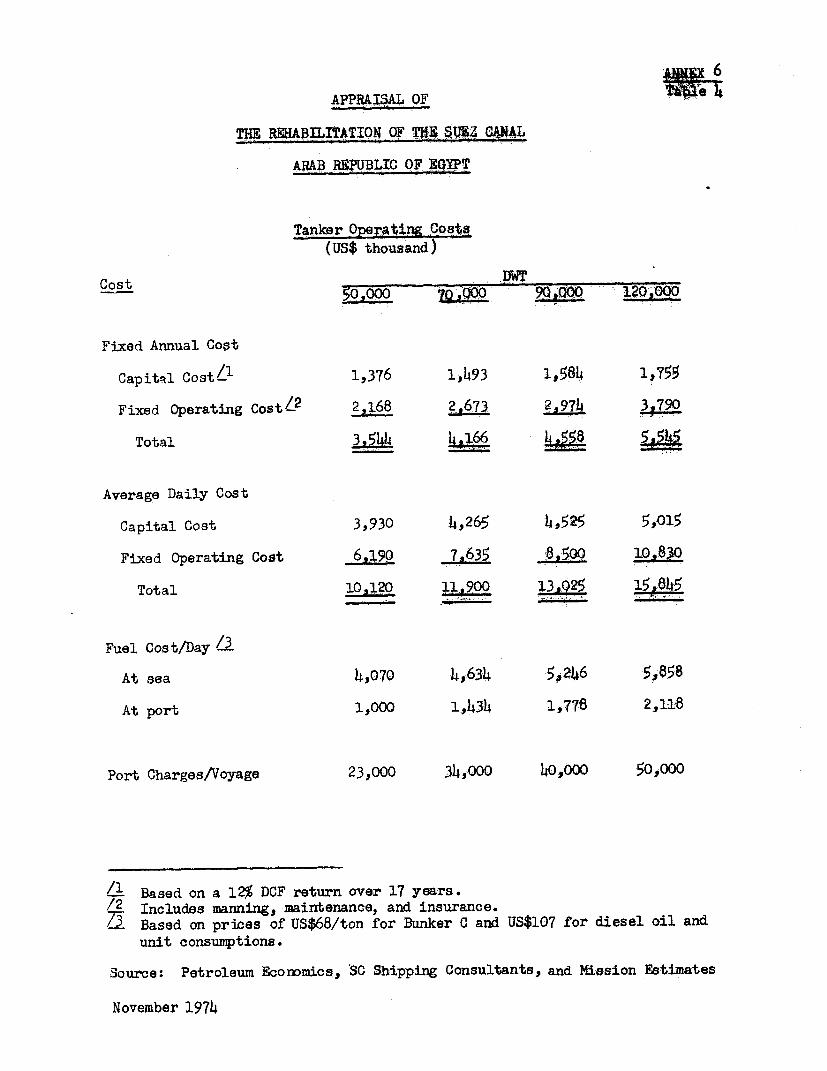
6
APPAIAL OF
THE REM{ABILITATION OF SUEZ (
ARAB RWUBLIC OF EGYT
Tanker Oprfata,t,ng Cost(US$ thousand)
Cost 5WT50,000 90QOW?~0
Fixed Anmual Cost
Capital Cost/l 1,376 l,L.93 l,581 1,755
Fixed Operating Cost/-2 2,168 2,673 2,97L 3j79O
Total 3 *5i66
Average Daily Cost
Capital Cost 3,930 4,265 b,525 5,015
Fixed Operating Cost 6,190 7,635 8,0Q 10.830
Total 10,120 1900 3,25 ___8__
Fuel Cost/Day L3
At sea 4,070 4o63h4 '546 5A58
At port 1,000 1.434 1,778 2,116
Port Charges/Voyage 23,000 3U,0OO 40OOQO 50000
/1 Based on a 12% DCF return over 17 years./2 Includes manning, maintenance, and insurance./3 Based on prices of US$68/ton for Bunker C and US$107 for diesel oil and
unit consumptions.
Source: Petroleum Economics,, SC Shipping Consultants, and Mission Estimates
November 1974
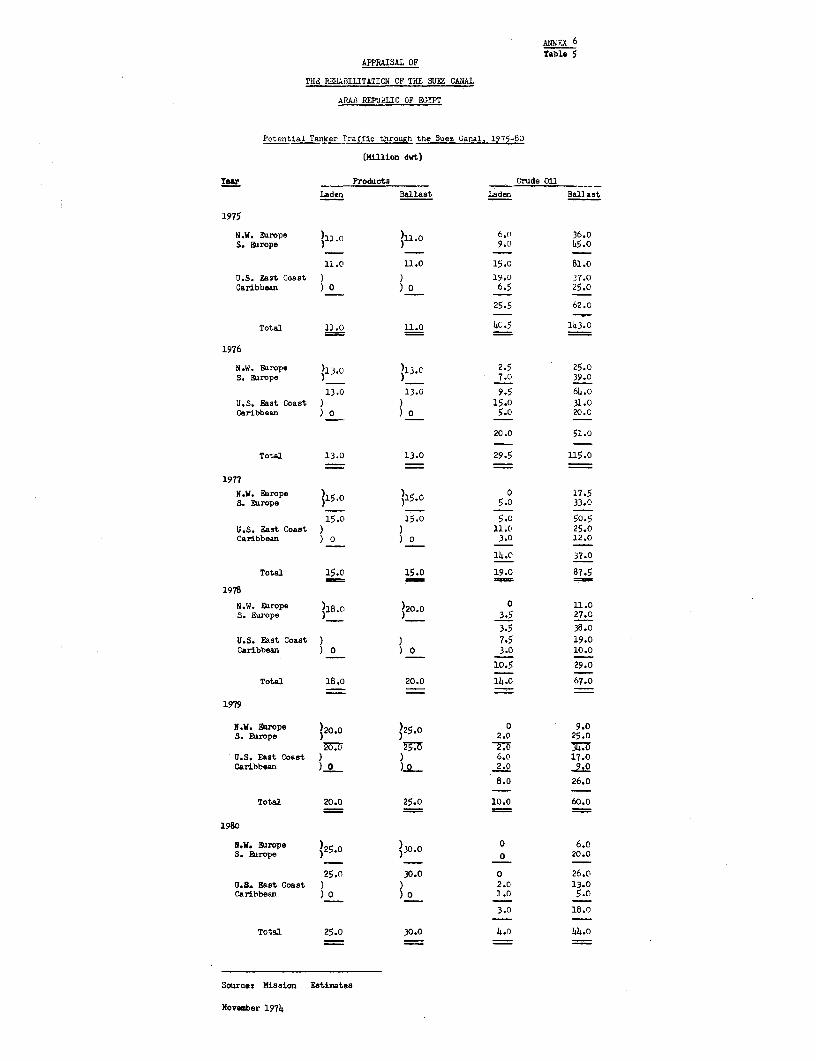
ANNEX 6
Table 5APPRAISAL OF
THE REA3BILITATION OF THE SUEZ CANAL
ARAB REPUBIJC OF EGYPT
Potential Tanker Traffic through the Suez Canal. 1975-80
(Million dwt)
rear Products Crude Oil
laden Ballast Laden Ballast
1975
N.W. Durope )11 0 )11 0 6.0 36.0S. Dlrope ) ) 9.0 45.O
11.0 11.0 15.0 81.0
U.S. East Coast ) ) 19.0 37.0Caribbean ) 0 ) ° 6.5 25.0
25.5 62.0
Total 11.0 11.0 4C.5 143.0
1976
N.W. Europe )13.O )13.C 2.5 25.0S. Earope )_ ) 7.0 39.0
13.0 13.0 9.5 64.oU.S. East Coast ) ) 15.0 31.0Caribbean ) O ) O 5.0 20.0
20.0 51.0
Total 13.0 13.0 29.5 115.0
1977
N.W. Europe 0 17.5S. Europe )15 0 15. 5.0 33.0
15.0 15.0 5.0 50.5U.S. East Coast ) ) 11.0 25.0Caribbean ) ) O 3.0 12.0
14.o 37.0
Total 15.0 15.0 19.0 87.5
1978
N.W. Earope )18.0 )20.0 0 11.0S. Europe ))3.5 27.0
3.5 38.0U.S. East Coast ) ) 7.5 19.0Caribbean ) O ) 0 3.0 10.0
10.5 29.0
Total 1B.o 20.0 14.0 67.0
1979
N.W. Dirope )20 0 0 20 9.0S. Europe ) 2.0 25.0
U.S. East Coast ) ) 6.o 17.0Caribbean ) 0 2.0 9.0
B.o 26.o
Total 20.0 25.0 10.0 60.0
1980
N.W. Durope )25O 0 6.oS. Europe )25)0 20.0
25.0 30.0 0 26.0U.3. East Coast ) ) 2.0 13.0Caribbean )O )o 1.0 5.0
3.0 18.0
Total 25.0 30.0 4.o 44.o
Source: Mission Estimates
November 1974
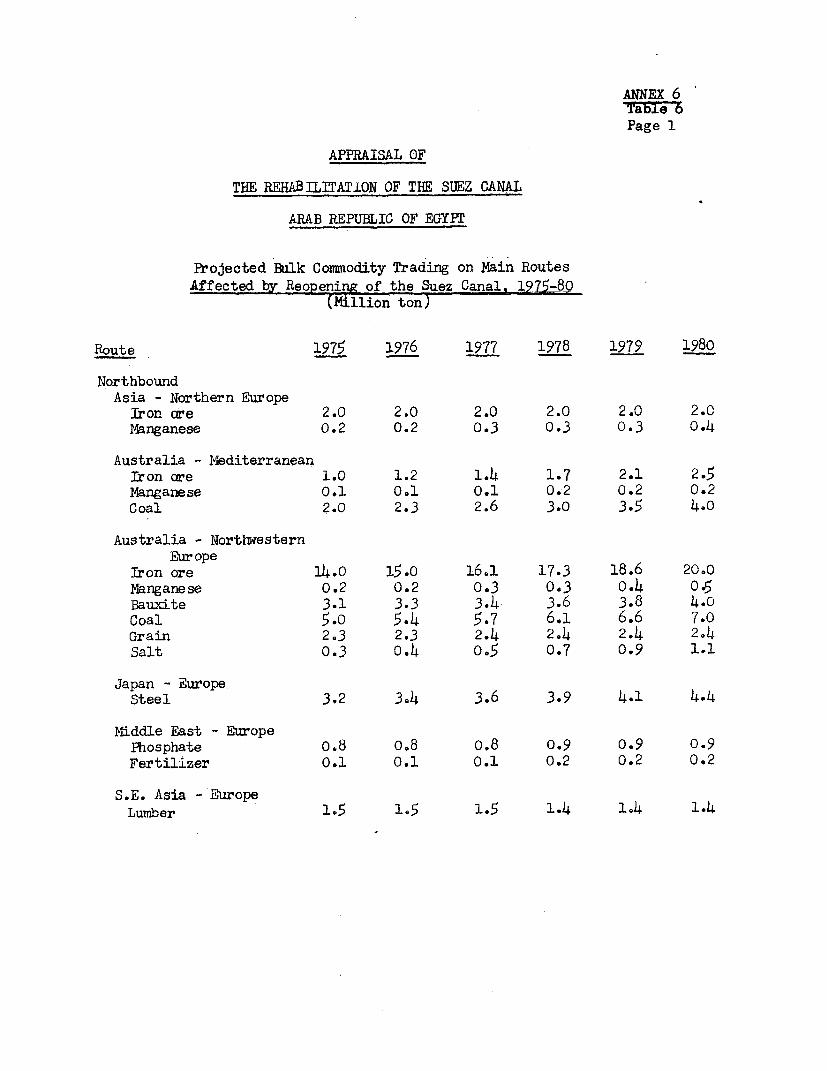
ANNEX 6Table 6Page 1
APPRAISAL OF
THE REHABILITATiON OF THE SUEZ CANAL
ARAB REPUBLIC OF EGYPT
Projected Balk Commodity Trading on Main RoutesAffected by Reopening of the Suez Canal._ i1180
(Million ton)
Route 1975 1976 1977 1978 1979 1980
NorthboundAsia - Northern Europe
Iron cEure 2.0 2.0 2.0 2.0 2.0 2.CManganese 0.2 0.2 0.3 0.3 0.3 0.4
Australia - MlediterraneanIr on core 1.0 1.2 1.4 1.7 2.1 2.-5Manganese 0.1 0.1 0.1 0.2 0.2 0.2Coal 2.0 2.3 2.6 3.0 3.5 4.0
Australia - liorthwesternEur ope
Iron ore 14.0 15.0 16.1 17.3 18.6 20.0Manganese 0.2 0.2 0.3 0.3 0.4 0.5Bauxite 3.1 3.3 3.4 3.6 3.8 4.0Coal 5.o 5.4 5.7 6.1 6.6 7.0Grain 2.3 2.3 2.4 2.4 2.4 2.4Salt 0.3 0.4 0.5 0.7 0.9 1.1
Japan - EuropeSteel 3.2 3,4 3.6 3.9 4.1 4.4
Middle East - huropePhosphate 0.8 o.8 o.8 0.9 0.9 0.9Fertilizer 0.1 0.1 0.1 0.2 0.2 0.2
S.E. Asia - EuropeLumber 1.5 1.5 1.5 1.4 1.4 1.4
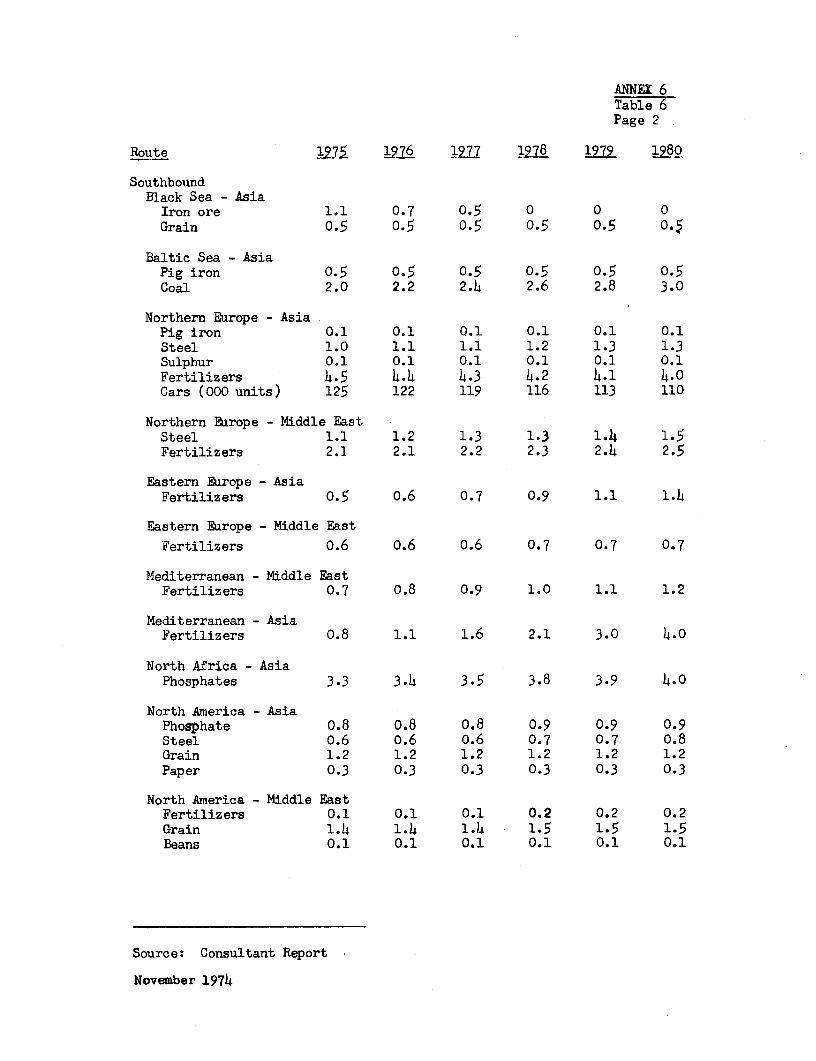
ANNEX 6Table 6Page 2
Route 1L75 16 2 1'2 1978 1979 2 20
SouthboundBlack Sea - AsiaIron ore 1.1 0.7 0.5 0 0 0Grain 0.5 0.5 0.5 0.5 0.5
Baltic Sea - AsiaPig iron 0.5 0.5 0.5 0.5 0.5 0.5Coal 2.0 2.2 2.4 2.6 2.8 3.0
Northern Europe - AsiaPig iron 0.1 0.1 0.1 0.1 0.1 0.1Steel 1.0 1.1 1.1 1.2 1.3 1.3Sulphur 0.1 0.1 0.1 0.1 0.1 0.1Fertilizers 4.5 4.4 4.3 4.2 4.1 4.0Cars (000 units) 125 122 119 116 113 110
Northern Earope - Middle EastSteel 1.1 1.2 1.3 1.3 1.4 1.5Fertilizers 2.1 2.1 2.2 2.3 2.4 2.5
Eastern Europe - AsiaFertilizers 0.5 0.6 0.7 0.9 1.1 1.4
Eastern Earope - Middle East
Fertilizers 0.6 0.6 0.6 0.7 0.7 0.7
Mediterranean - Middle EastFertilizers 0.7 0.8 0.9 1.0 1.1 1.2
Mediterranean - AsiaFertilizers 0.8 1.1 1.6 2.1 3.0 4.0
North Africa - AsiaPhosphates 3.3 3.4 3.5 3.8 3.9 4.0
North America - AsiaPhosphate 0.8 0.8 0.8 0.9 0.9 0.9Steel 0.6 0.6 0.6 0.7 0.7 0.8Grain 1.2 1.2 1.2 1.2 1.2 1.2Paper 0.3 0.3 0.3 0.3 0.3 0.3
North America - Middle EastFertilizers 0.1 0.1 0.1 0.2 0.2 0.2Grain 1.4 1.4 1.4 1.5 1.5 1.5Beans 0.1 0.1 0.1 0.1 0.1 0.1
Source: Consultant Report
November 1974
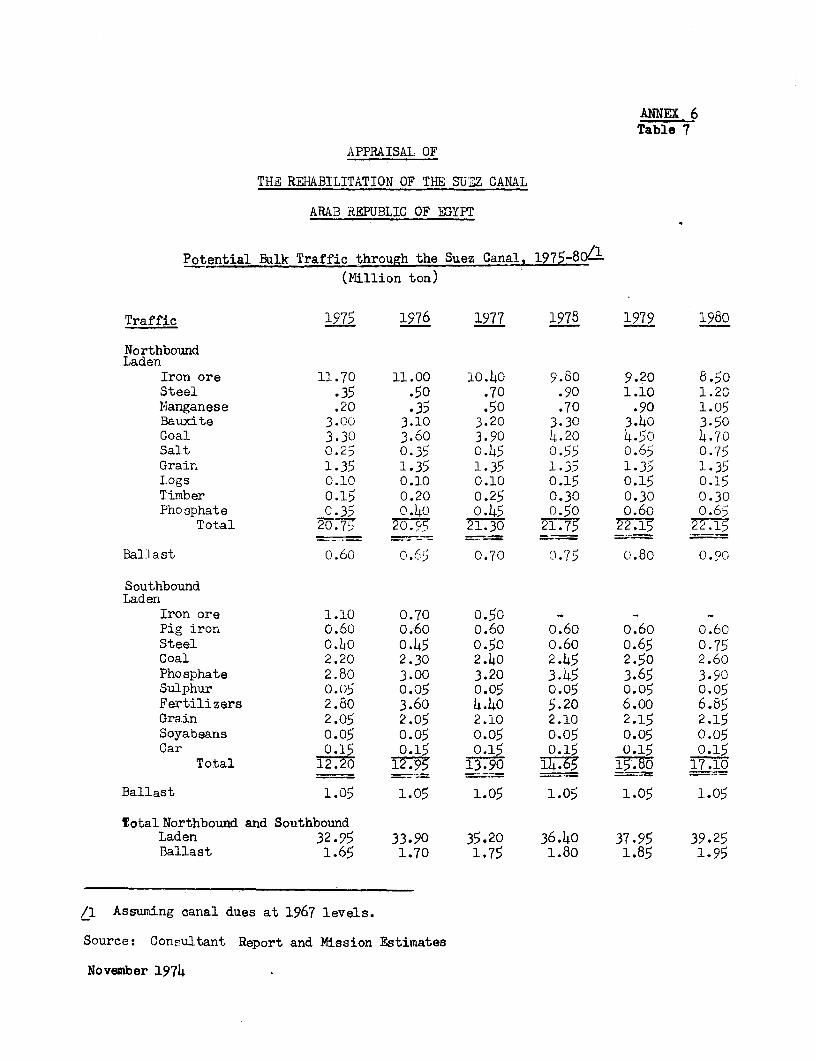
ANNEX 6Table 7
APPRAISAL OF
THE REHABILITATION OF THE SUbZ CANAL
ARAB REPUBLIC OF BaYPT
Potential Bulk Traffic through the Suez Canal, 1975-8O1.
(Million ton)
Traffic 1975 1976 1977 1978 1979 1980
NorthboundLaden
Iron ore 11.70 11.00 10.40 9.80 9.20 8.50Steel .35 .50 .70 .90 1.10 1.20Manganese .20 .35 .50 .70 .90 1.05Bauxite 3.00 3.10 3.20 3.30 3.40 3.50Coal 3.30 3.60 3.90 4.20 4.50 4.70Salt 0.27 0.35 0.45 0.55 o.65 0.75Grain 1.35 1.35 1.35 1.35 1.35 1.35Logs 0.10 0.10 0.10 0.15 0.15 0.15Timber 0.15 0.20 0.25 0.30 0.30 0.30Phosphate C.35 0.40 0.45 0.50 o.60 0.65
Total 7U77 20.95 21.30 21.75 22.15 22.1
Ballast o.60 0.65 0.70 0.75 o.80 0.90
SouthboundLaden
Iron ore 1.10 0.70 0.50 - --
Pig iron 0.60 o.60 o.60 o.60 o.60 0.60Steel 0.40 0.45 0.50 o.60 o.65 0.75Coal 2.20 2.30 2.40 2.45 2.50 2.60Phosphate 2.80 3.00 3.20 3.45 3.65 3.90Sulphur 0.05 0.05 0.05 0.05 0.05 0.05Fertilizers 2.80 3.60 4.40 5.20 6.00 6.85Grain 2.05 2.05 2.10 2.10 2.15 2.15Soyabeans 0.05 0.05 0.05 0°05 0.05 0.05Car 0.15 0.15 0.15 0.15 0.15 0.15
Total 12.20 12.95 13.90 146 ____ 17.10
Ballast 1.05 1.05 1.05 1.05 1.05 1.05
Total Northbound and SouthboundLaden 32.95 33.90 35.20 36.40 37.95 39.25Ballast 1.65 1.70 1.75 1.80 1.85 1.95
/1 Assuming canal dues at 1967 levels.
Source: ConFultant Report and Mission Estimates
November 1974
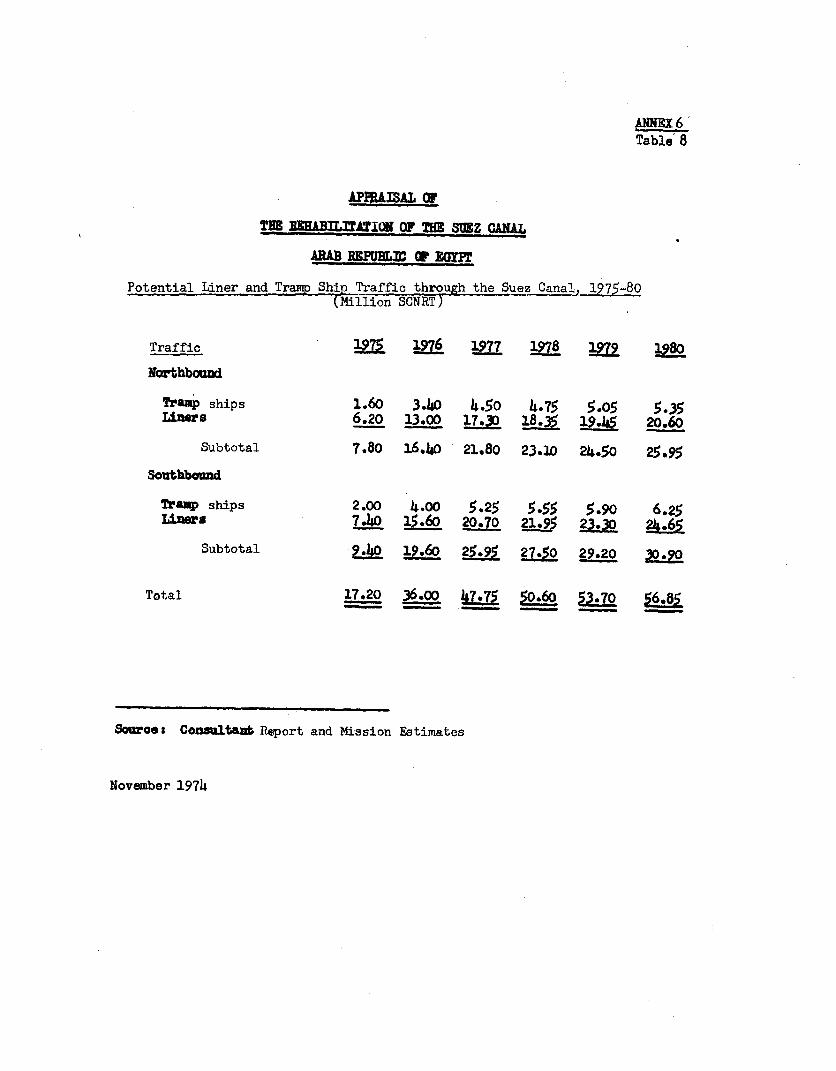
Table' 8
APPAAIBA CW
TEB MRURAIMLTATION OF TO SU3Z CANAL
AMAB REPU1 W 1
Potential Liner and Tram Ship Traffic through the Suez Canal, 197Z-80
Traffic 19 1976 1977 1978 919 198
Northbound
TraMp ships 1.60 3.40 4.5o 4.75 5.05 5.35LIners 6.20 13.00 17.30 18.35 19.45 20.60
Subtotal 7.80 16.40 21.80 23.10 24.50 25.95
Southbound
Tramp ships 2.00 4.oo 5.25 5.55 5.90 6.25TAMnsa 7-40 35.60 20.70 21.96 23-30 24-65
Subtotal j4O 19.60 25.95 2 _ 90 20 3090
Total 17.20 36.00 i7 53-70 56.8
Sourcet Consultant Report and Mission Estimates
November 1974
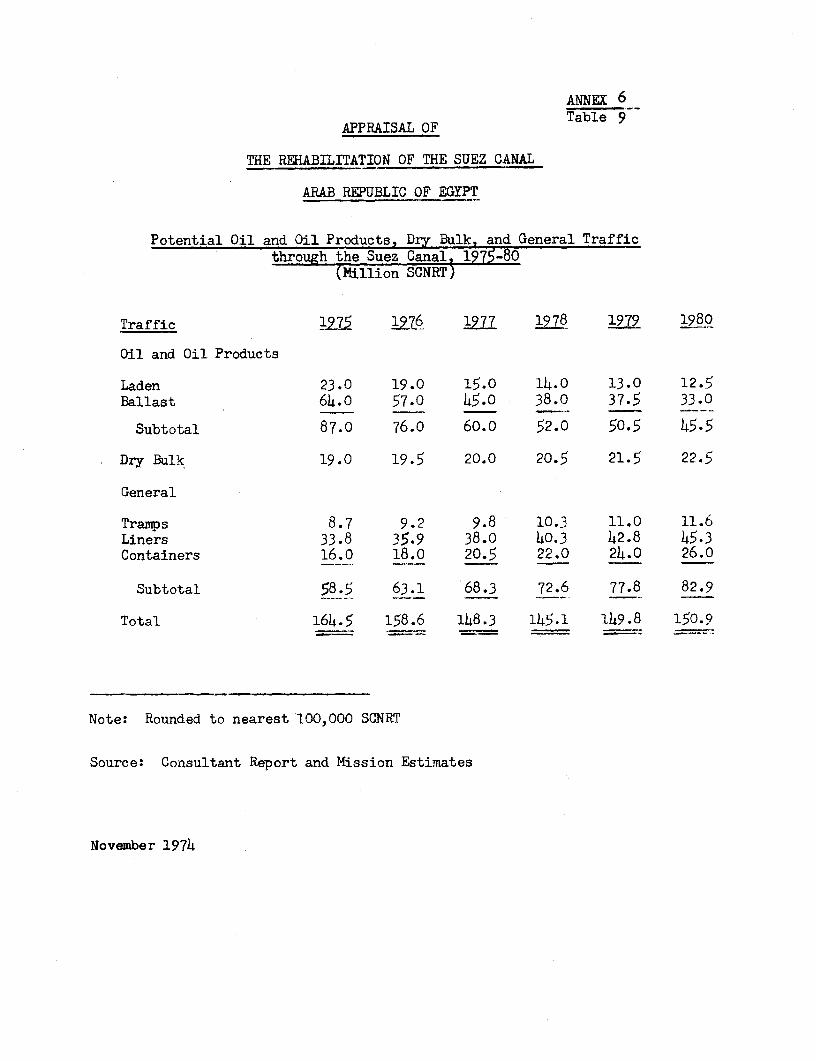
ANNEX 6Table 9
APPRAISAL OF
THE REHABILITATION OF THE SUEZ CANAL
ARAB REPUBLIC OF EGYPT
Potential Oil and Oil Products, Dry Bulk, and General Trafficthrough the Suez Canal, 1975-80
(Million SCNRT)
Traffic 1975 1976 1977 1978 1979 1980
Oil and Oil Products
Laden 23.0 19.0 15.0 14.0 13.0 12.5Ballast 64.0 57.0 45.0 38.0 37.5 33.0
Subtotal 87.0 76.0 60.0 52.0 50.5 45.5
Dry Bulk 19.0 19.5 20.0 20.5 21.5 22.5
General
Tramps 8.7 9.2 9.8 10.3 11.0 11.6Liners 33.8 35.9 38.0 40.3 42.8 45.3Containers 16.0 18.0 20.5 22.0 24.0 26.0
Subtotal 58.5 63.1 68.3 72.6 77.8 82.9
Total 164.5 158.6 148.3 145.1 149.8 150.9
Note: Rounded to nearest 100,000 SCNRT
Source: Consultant Report and Mission Estimates
November 1974
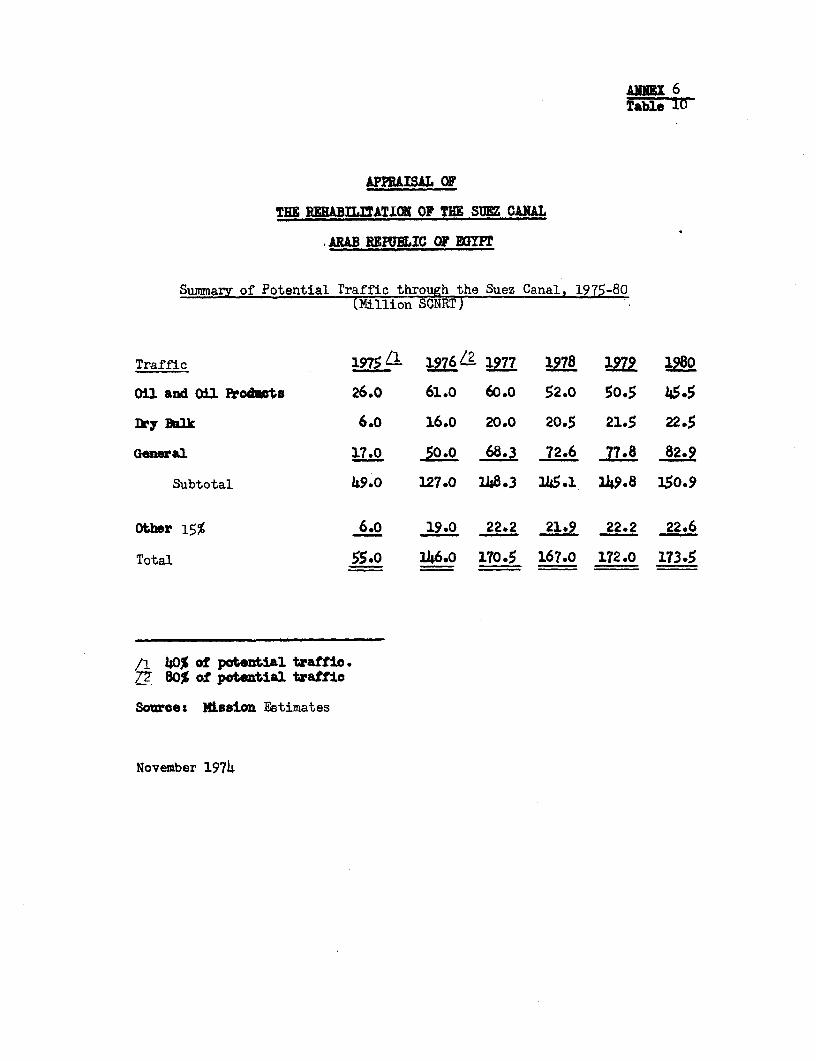
AM=i 6Table 10
APPRAISAL OF
THE REBA2BThJATION O THI SUEZ CANAL
.BA RE31IC OF EGYFT
Summary, of Potential Traffic through the Suez Canal, 1975-80(Million SCNRT)
Traffic 19 75 L 1976 L2 1977 1978 1979 31980
01 and Oil Prodwots 26.0 61.0 60.0 52.0 50.5 45.5
Digy Bulk 6.o 16.0 20.0 20.5 21.5 22.5
General 17.0 50.0 68.3 72.6 77.8 82.9
Subtotal 49.0 127.0 1148.3 245.1 149.8 150.9
0other 15% 6.o 19.0 22.2 21.9 22.2 22.6
Total 55.0 146.0 170.5 167.0 172.0 173.5
/1 40% of potential traffic./7 80% of potential traffic
Souxs: Mission Estimates
November 1974
ANNEX 7Page 1
APPRAISAL OF
THE REHABILITATION OF THE SUEZ CANAL
ARAB REPUBLIC OF EGYPT
Savings in Shipping Costs through Reopening the Suez Canal
A. Introduction
1. The reopening of the Suez Canal will considerably shorten sea routesbetween North America, the Caribbean, Europe and countries located southeastof Suez. Shorter distances will result in savings in shipping costs: (i) byreducing capital and fixed operating costs per unit of cargo due to fasterturnovers of ships; and (ii) by reducing voyage costs and mostly fuel costs.Savings, however, would be different for various type of ships and variousroutes and have to be estimated separately (para. B).
B. Savings in Shipping Costs
Tankers
2. Savings have been calculated on the basis of ship operating costs(Annex 6, Table 4) and voyage parameters for the most representative sizegroups and routes. The results are summarized in Table 1. Two assumptionswere made:
(i) Tanker market will remain stable over the next few years andsupply and demand would be balanced. Freight rates would thenreflect full cost recovery (capital and fixed operating costs).
(ii) The tanker supply will exceed the demand and freight rates will below for the next 3 to 5 years, and could be based, at least fora while, on fixed operating costs recovery only.
As explained in Annex 6, it is likely that there would be an excess in thetanker supply, if growth in oil demand slow down as it is presently expected.However, any increase in oil demand would result in additional shipments fromthe Middle East and would absorb some of the foreseen excess capacity.
Bulk Carriers, Liners, Tramps and Container Carriers
3. Savings have been calculated on the basis of calculations made byconsultants (SC Shipping Consultants (Norway)) that are considered reasonable.A summary of savings on the main trade routes for liners and tramp ships andcontainer carriers are given in Table 2 and 3 respectively.
ANNEX 7Page 2
Global Savings
4. Global gross savings (before payment of any Canal dues) are summa-
rized on Table 4 for each of the main categories. For tankers, savings based
on fixed operating costs have been taken into account. Table 4 also shows
global net savings after payment of Canal dues under the assumptions spelled
out in para 6 of Annex 19. They have been calculated taking into account the
reduction in the volume of traffic which would be induced by higher Canal
dues.
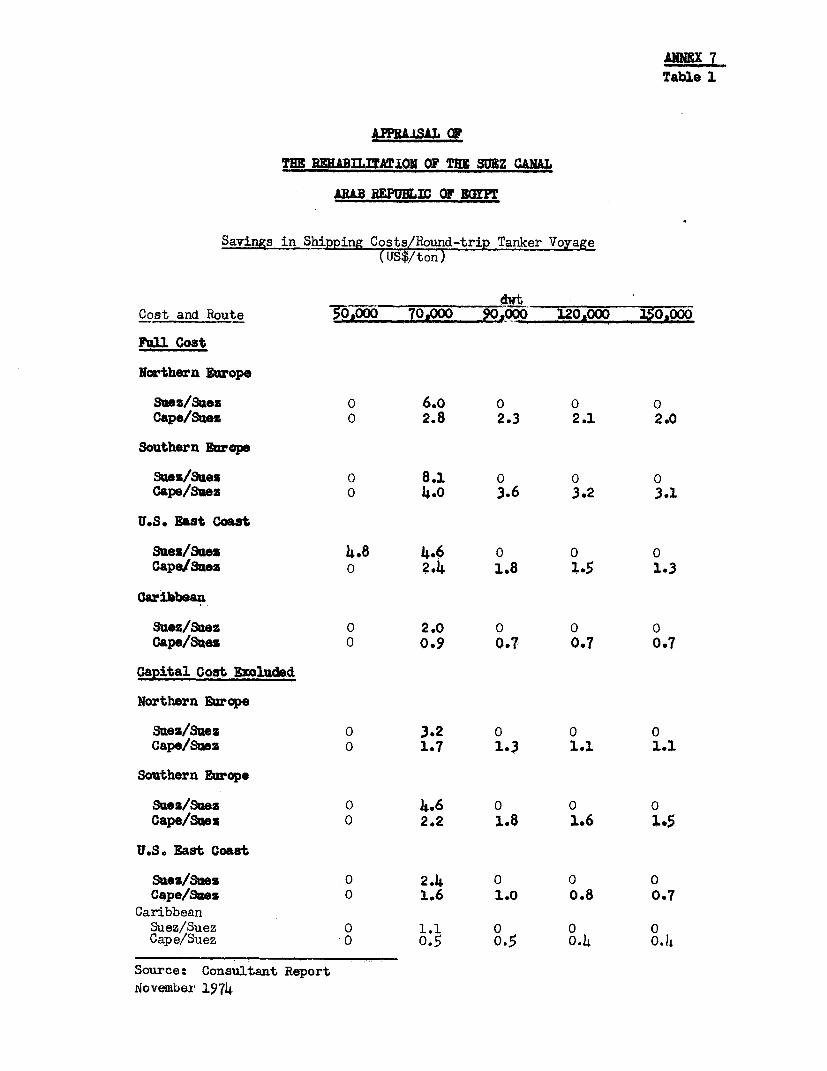
ANNEX 7Table 1
APPRAiSAL (V
THE REHAIEITATION 0 TB SUEZ CANAL
ARAB REPULIC OF EGYPT
Savings in Shipping Costs/Round-trip Tanker Voyage(US$/ton)
dwtCost and Route 50,000 70,000 _ 90,00 2000 $0,0
Full Coat
Northern wurope
Sues/Suez 0 6.o 0 0 0Cape/Sues 0 2.8 2.3 2.1 2.0
Southern Europe
SezX/Sues 0 8.1 0 0 0Gape/Suez 0 4-0 3.6 3.2 3.1
u.S. East Coast
Sues/Suez 4.8 4.6 0 0 0Cape/S&ez o 2.4 1.8 1.5 1.3
Caribbean
Suez/Suez 0 2.0 0 0 0Cape/Suez 0 0.9 0.7 0.7 0.7
Capital Coat Exoaqld
Northern Eurcpe
Sues/Suez 0 3.2 0 0 0Cape/Suez 0 1.7 1.3 1.1 1.1
Southern Europe
Suez/Suez 0 4.6 0 0 0Cape/Suez 0 2.2 1.8 1.6 1.5
U.S. East Coast
Suez/Sues 0 2.4 0 0 0Cape/Sues 0 1.6 1.0 0.8 0.7
CaribbeanSuez/Suez 0 1.1 0 0 0Cape/Suez 0 o.5 0.5 0.4 0.4
Source: Consultant Report1iovember 1974
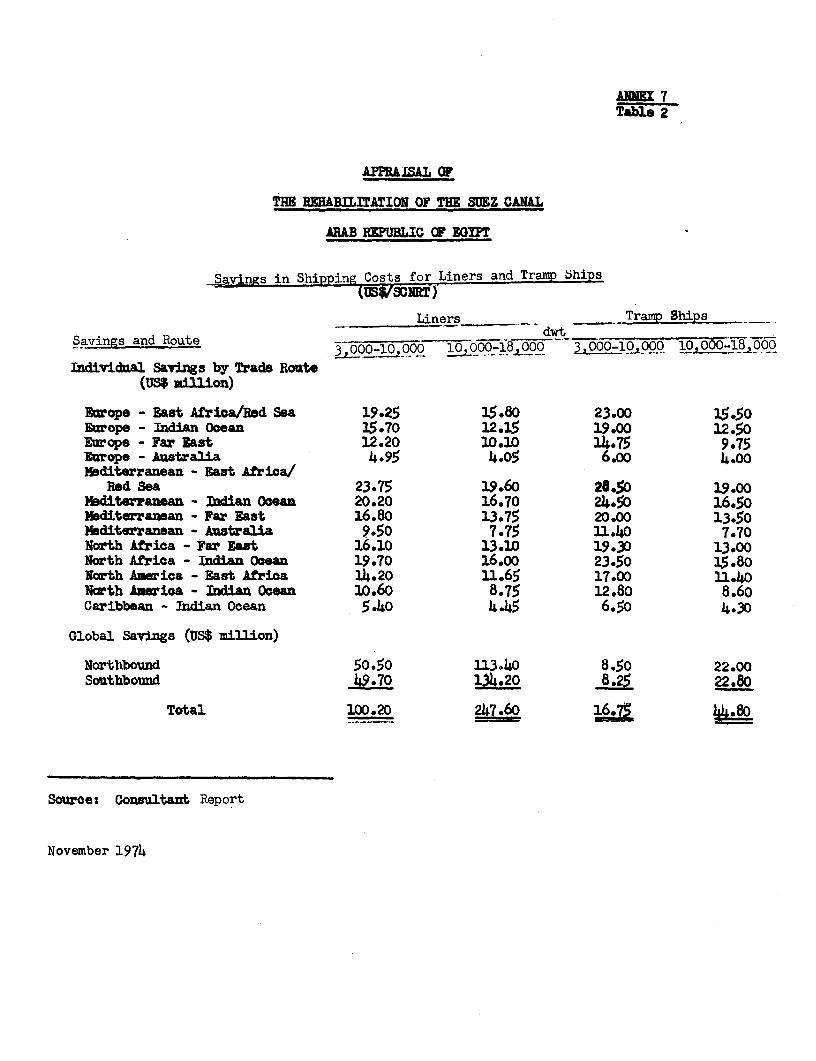
ANNEX 7Table 2
APPRLASAL OF
THE REIHABIIrATION OF THE SUEZ CANAL
ARAB REPUBLIC CF EGYPT
Savings in Shipping Costs for Liners and Traimp ships
Liners Tramp Ships
Savings and Route -21 d°wtThOi
Individual Savings by Trade Route(US9 mil Ion)
Ebrope - East Africa/Red Sea 19.25 15.80 23.00 15.50Enrope - Indian Ooean 15.70 12.15 19.00 12.50-Europe - Far Bast 12.20 10.10 14.75 9.75Europe - Anstralia 4.95 4.o5 6.oo 4.00Mediterranean - East Africa/
Red Sea 23.75 19.60 28.50 19.00MbditerraDean - IiUan Ocean 20.20 16.70 24.50 16.50Mediterranean - Far East 16.80 13.75 20.00 13.50Maditerranean - Australia 9.50 7.75 11.40 7.70North Africa - Far East 16.10 13.10 19.30 13.00North Africa - Indian Ocean 19.70 16.00 23.50 15.80North America - East Africa 14.20 11.65 17.00 11340North Amerioa - Indian Ocean 10.60 8.75 12.80 8.60Caribbean - lndian Ocean 5.40 4445 6.50 4.3o
Global Savings (US$ million)
Northbound 50.50 113,40 8.50 22.00Southbound 49.70 1A.20 8.25 22.80
Total 100.20 247.60
Souroes Consultant Report
November 1974
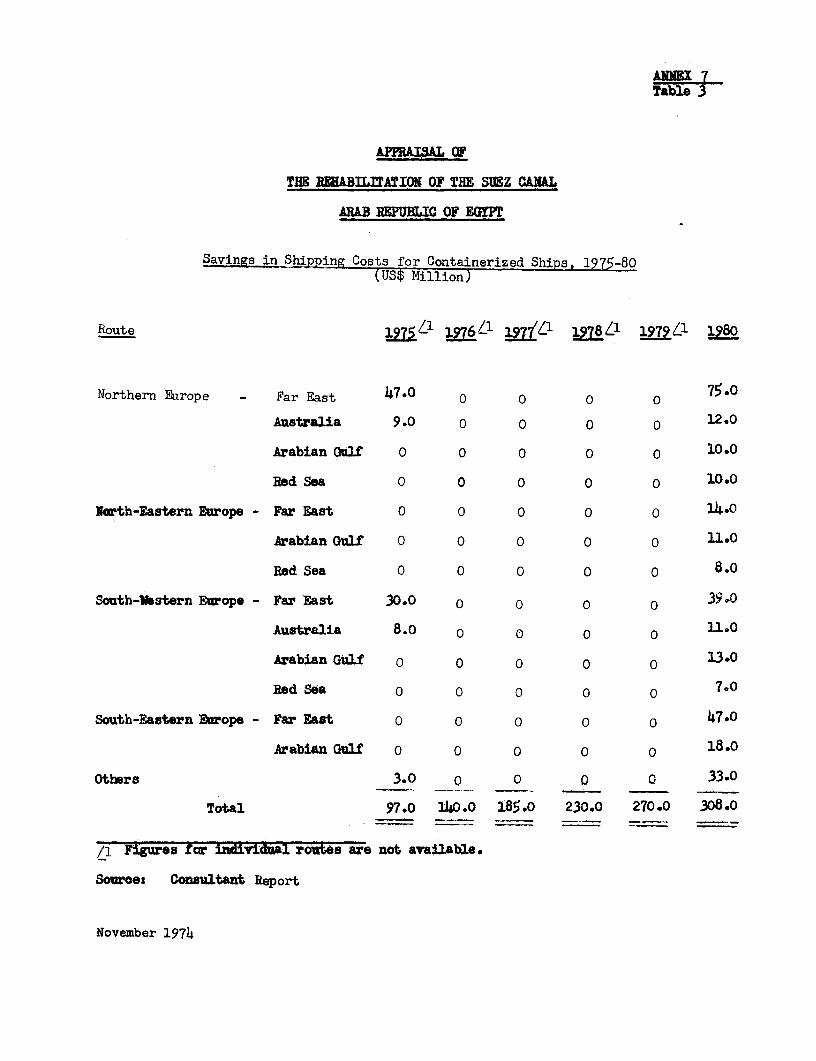
AM=~Table 3
APPRAISAL OF
THE RU&Bl.flATION OF THE SUEZ CANAL
ARAB REPUBLIC OF EGYPT
Savings in Shipping Costs for Containerized Ships, 1975-80(US$ Million)
Route 1975Z-1 1l76-- f /1 1978 9 '1 980
Northern Europe - Far East 47 ° o o o o 75 °
Australia 9.0 0 a a 0 12.0
Arabian Gulf 0 0 0 0 0 10.0
Red Sea 0 0 0 0 0 10.0
North-Eastern Europe - Far East 0 0 0 0 0 14.0
Arabian Gulf 0 0 0 0 0 a1.o
Red Sea 0 0 0 0 0 8.0
South-Western Europe - Par East 30.0 0 O 0 O 39e0
Australia 8.0 0 0 0 0 U-.0
Arabian Gulf C 0 O O 0 13.0
Red Sa 0 0 0 0 0 7 0
South-Eastern Europe - Far East 0 0 0 C 0 47-0
Arabian Gulf O C 0 O 0 18.0
Otb1rs 3.0 _ a 33.0
Total 97.0 340o.0 185.0 230.0 270.0 308.0
/1 Figures fcr Eii aIl rotes are not available.
Sources Consultant Report
November 1974
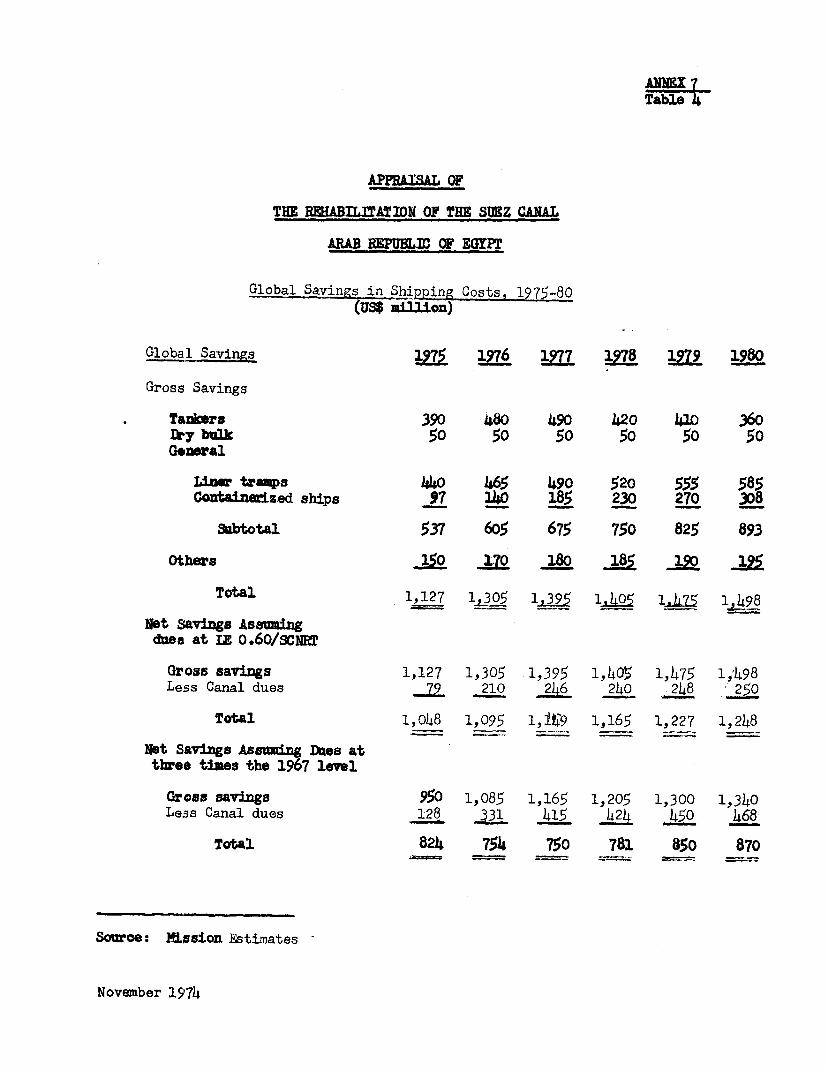
AM1
APPRAISAL OF
THEB REABILITATIDN OF THE SUEZ CANIAL
ARAB REPUBLIC OF EGYPT
Global Savi.nsin pping Costs, 1975-80(US$ zillion)
Global Savings 1275 1976 1977 1 1979 198.0
Gross Savings
Tankers 390 480 490 420 410 360Dry bak 50 50 50 5° 50 50G.nral
in tramps 440 465 490 520 555 585Coutainerized ships 97 140 185 230 270 308
9abtotal 537 605 675 750 825 893
Others 170 18 ; 125
Total 1,127 1,305 1,395 l0 1l_7 1 4l98
Net Savings AssumingiWes at IE o.60/scmc
Gross savings 1,127 1,305 1,395 1,405 1,475 1,498Less Canal dues 79 210 246 240 248 250
Total 1,048 1,095 1,IW9 1,165 1,227 1,248
Net Savings ssuing D11s. attbree times the 1967 level
Gross savings 950 1,085 1,165 1,205 1,300 1,340Less Canal dues 128 33 415 424 450 468
Total 824 754 750 781 850 870
Source: Mission Estimates
November 1974
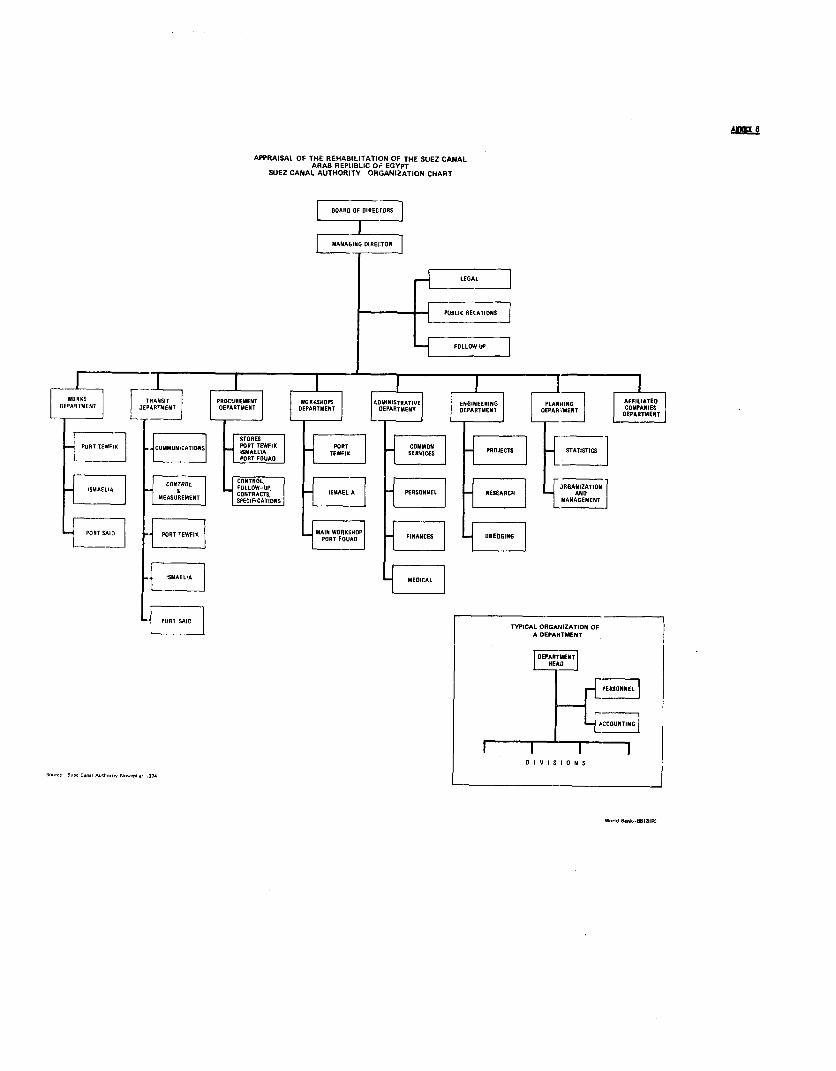
A 8
APPRAISAL OF THE REHABILITATION OF THE SUEZ CANALARAB REPUBLIC OF EGYPT
SUEZ CANAL AUTHORITY. ORGANIZATION CHART
B OARD OF DIREC3~
L EGAL |
AD ~ ~ IIO DIRECTORS
1 ~ ~~~~~~~~~~~~~~~~~~~~~~~ .1CA FI 'L
WORKS V TRANSIT PROCUREMENT WORKSHOPS ! TRAT ENINEERINO TYPICAL 0 GANIZATION OFA DEPARTMENT
L L DEPARTMENT~~~~~~~~~~~~~~~~~~~~~~~~EPRrMN
PORT PODAD
H:
I I O W S I A N S
WoNd B..k-88131R)
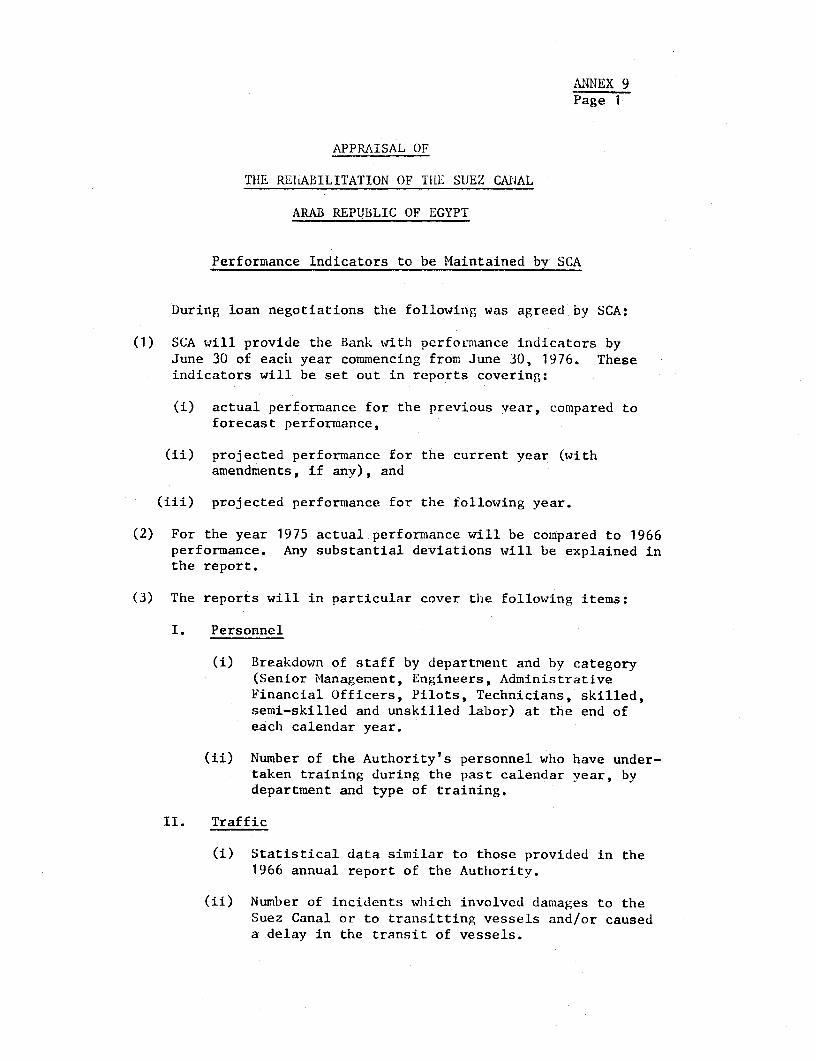
ANNEX 9Page 1
APPRAISAL OF
TIIE REIHiABILITATION OF TIIE SUEZ CAIiAL
ARAB REPUBLIC OF EGYPT
Performance Indicators to be Maintained by SCA
During loan negotiations the following was agreed by SCA:
(1 ) SCA will provide the Bank with perfocrnance indicators byJune 30 of each year commencing from June 30, 1976. Theseindicators will be set out in reports covering:
(i) actual performance for the previous vear, compared toforecast performance,
(ii) projected performance for the current year (withamendments, if any), and
(iii) projected performance for the following year.
(2) For the year 1975 actual performance will be compared to 1966performance. Any substantial deviations will be explained inthe report.
(3) The reports will in particular cover the following items:
I. Personnel
(i) Breakdown of staff by department and by category(Senior Management, Engineers, AdministrativeFinancial Officers, Pilots, Technicians, skilled,semi-skilled and unskilled labor) at the end ofeach calendar year.
(ii) Number of the Authority's personnel who have under-taken training during the past calendar year, bydepartment and type of training.
II. Traffic
(i) Statistical data similar to those provided in the1966 annual report of the Authority.
(ii) Number of incidents whichi involved damages to theSuez Canal or to transitting vessels and/or causeda delay in the transit of vessels.
ANNEX 9Page 2
III. ,quipment
(i) List of floating, equipment in use at the end of eachcalendar year and more particular dredgers, floatingcranes, tugs and pilot launches.
(ii) Availability factor (number of days in service duringthe past calendar year) for the equipment referred toin III(i) above and breakdown of the down time foreach type of equipment.
(iii) Total volume of maintenance dredging and of capitaldredging for access channels and the Suez Canal duringthe past calendar year.
IV. Shipyards
Activity report of the shipyards for ship building main-tenance and-repair.
V. Studies
List of studies related to the Suez Canal or to the transitvessels carried out during the past calendar year by theAuthQrity or its external agencies..
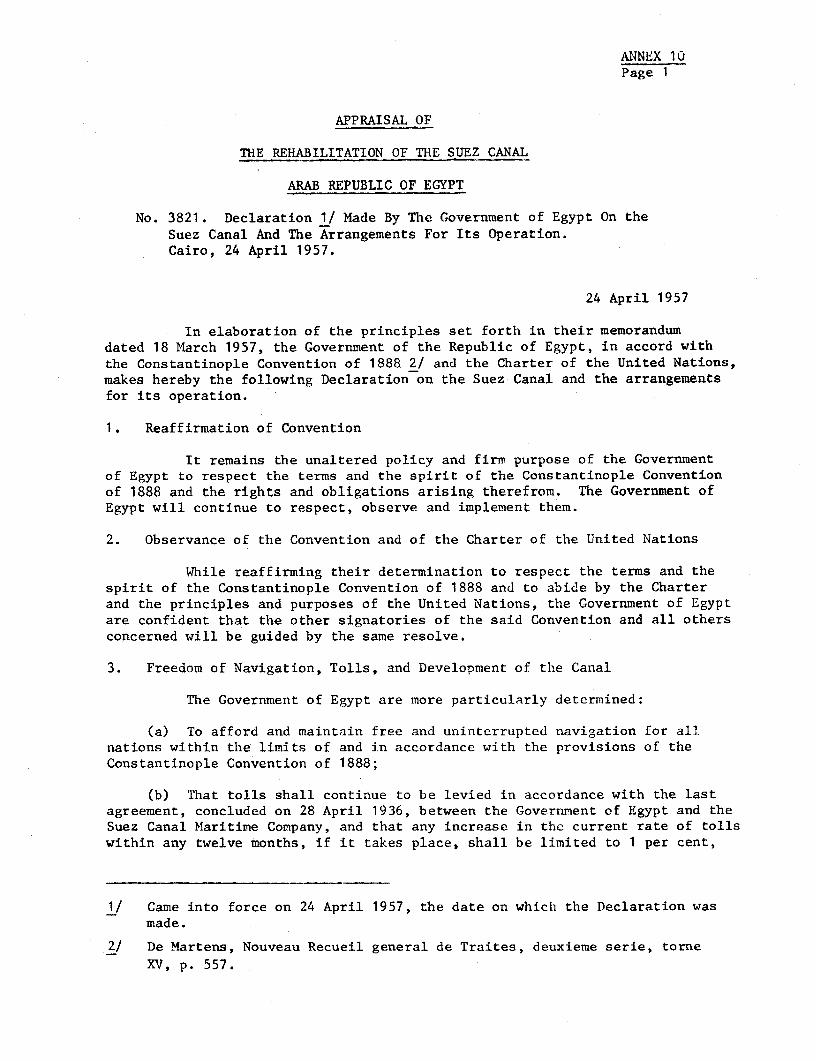
ANiNEX 10Page 1
APPRAISAL OF
THE REHABILITATION OF THE SUEZ CANAL
ARAB REPUBLIC OF EGYPT
No. 3821. Declaration 1/ Made By The Government of Egypt On theSuez Canal And The Arrangements For Its Operation.Cairo, 24 April 1957.
24 April 1957
In elaboration of the principles set forth in their memorandumdated 18 March 1957, the Government of the Republic of Egypt, in accord withthe Constantinople Convention of 1888 2/ and the Charter of the United Nations,makes hereby the following Declaration on the Suez Canal and the arrangementsfor its operation.
1. Reaffirmation of Convention
It remains the unaltered policy and firm purpose of the Governmentof Egypt to respect the terms and the spirit of the Constantinople Conventionof 1888 and the rights and obligations arising therefrom. The Government ofEgypt will continue to respect, observe and implement them.
2. Observance of the Convention and of the Charter of the United Nations
While reaffirming their determination to respect the terms and thespirit of the Constantinople Convention of 1888 and to abide by the Charterand the principles and purposes of the United Nations, the Government of Egyptare confident that the other signatories of the said Convention and all othersconcerned will be guided by the same resolve.
3. Freedom of Navigation, Tolls, and Development of the Canal
The Government of Egypt are more particularly determined:
(a) To afford and maintain free and uninterrupted navigation for all.nations within the limits of and in accordance with the provisions of theConstantinople Convention of 1888;
(b) That tolls shall continue to be levied in accordance with the lastagreement, concluded on 28 April 1936, between the Government of Egypt and theSuez Canal Maritime Company, and that any increase in the current rate of tollswithin any twelve months, if it takes place, shall be limited to 1 per cent,
1/ Came into force on 24 April 1957, the date on which the Declaration wasmade.
2/ De Martens, Nouveau Recueil general de Traites, deuxieme serie, torneXV, p. 557.
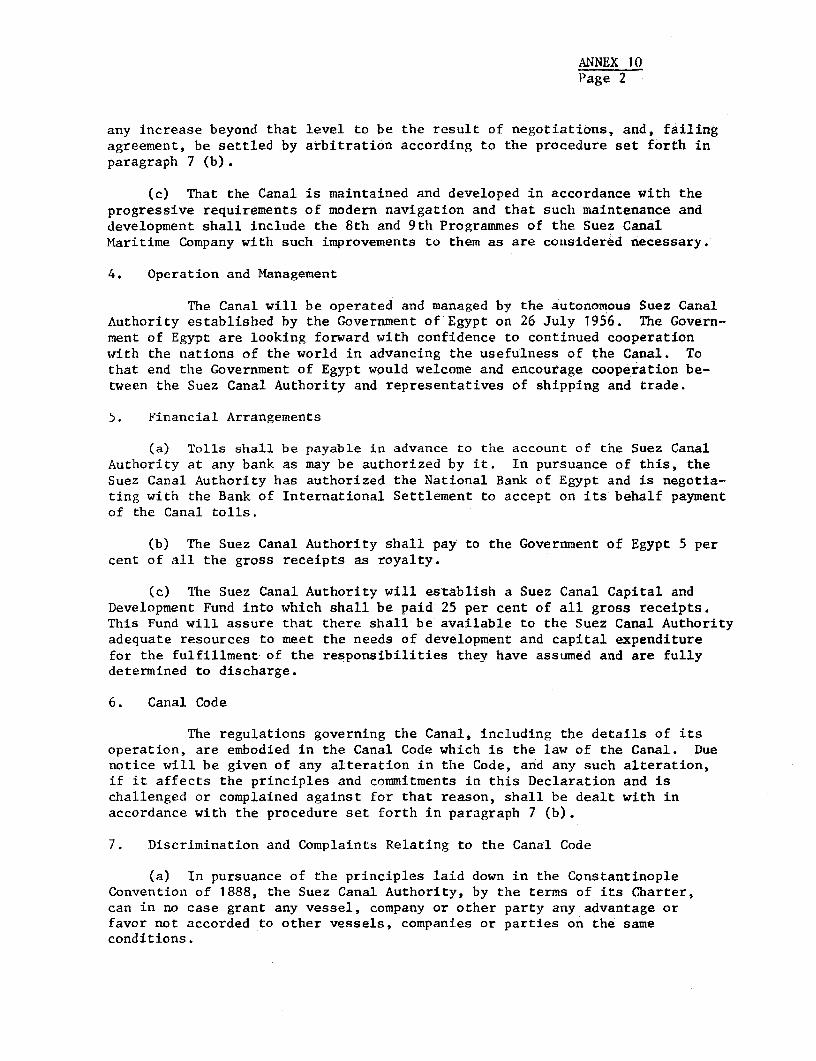
ANNEX 10Page 2
any increase beyond that level to be the result of negotiations, and, failingagreement, be settled by arbitration according to the procedure set forth inparagraph 7 (b).
(c) That the Canal is maintained and developed in accordance with theprogressive requirements of modern navigation and that such maintenance anddevelopment shall include the 8th and 9th Programmes of the Suez CanalMaritime Company with such improvements to them as are considered necessary.
4. Operation and Management
The Canal will be operated and managed by the autonomous Suez CanalAuthority established by the Government of Egypt on 26 July 1956. The Govern-ment of Egypt are looking forward with confidence to continued cooperationwith the nations of the world in advancing the usefulness of the Canal. Tothat end the Government of Egypt would welcome and encourage cooperation be-tween the Suez Canal Authority and representatives of shipping and trade.
5. Financial Arrangements
(a) Tolls shall be payable in advance to the account of the Suez CanalAuthority at any bank as may be authorized by it. In pursuance of this, theSuez Canal Authority has authorized the National Bank of Egypt and is negotia-ting with the Bank of International Settlement to accept on its behalf paymentof the Canal tolls.
(b) The Suez Canal Authority shall pay to the Governnent of Egypt 5 percent of all the gross receipts as royalty.
(c) The Suez Canal Authority will establish a Suez Canal Capital andDevelopment Fund into which shall be paid 25 per cent of all gross receipts.This Fund will assure that there shall be available to the Suez Canal Authorityadequate resources to meet the needs of development and capital expenditurefor the fulfillment of the responsibilities they have assumed and are fullydetermined to discharge.
6. Canal Code
The regulations governing the Canal, including the details of itsoperation, are embodied in the Canal Code which is the law of the Canal. Duenotice will be given of any alteration in the Code, and any such alteration,if it affects the principles and commitments in this Declaration and ischallenged or complained against for that reason, shall be dealt with inaccordance with the procedure set forth in paragraph 7 (b).
7. Discrimination and Complaints Relating to the Canal Code
(a) In pursuance of the principles laid down in the ConstantinopleConvention of 1888, the Suez Canal Authority, by the terms of its Charter,can in no case grant any vessel, company or other party any advantage orfavor not accorded to other vessels, companies or parties on the sameconditions.
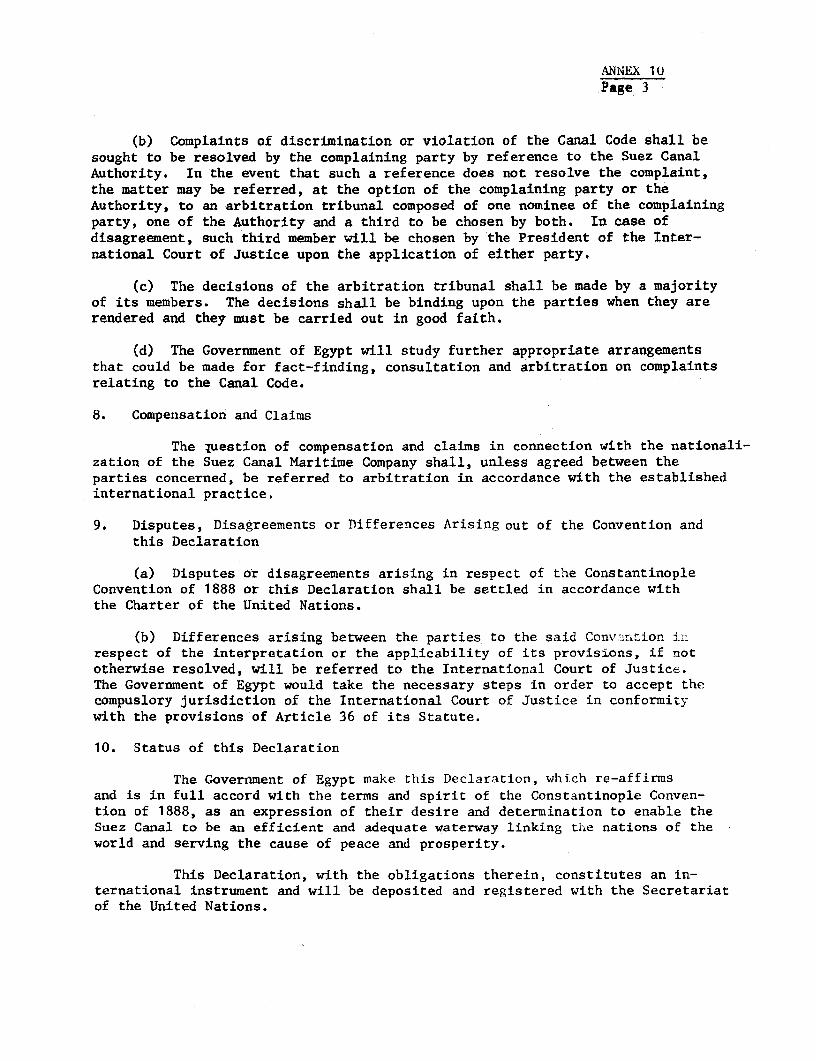
ANNEX 10Page 3
(b) Complaints of discrimination or violation of the Canal Code shall besought to be resolved by the complaining party by reference to the Suez CanalAuthority. In the event that such a reference does not resolve the complaint,the matter may be referred, at the option of the complaining party or theAuthority, to an arbitration tribunal composed of one nominee of the complainingparty, one of the Authority and a third to be chosen by both. In case ofdisagreement, such third member will be chosen by the President of the Inter-national Court of Justice upon the application of either party.
(c) The decisions of the arbitration tribunal shall be made by a majorityof its members. The decisions shall be binding upon the parties when they arerendered and they must be carried out in good faith.
(d) The Government of Egypt will study further appropriate arrangementsthat could be made for fact-finding, consultation and arbitration on complaintsrelating to the Canal Code.
8. Compensation and Claims
The luestion of compensation and claims in connection with the nationali-zation of the Suez Canal Maritime Company shall, unless agreed between theparties concerned, be referred to arbitration in accordance with the establishedinternational practice.
9. Disputes, Disagreements or Differences Arising out of the Convention andthis Declaration
(a) Disputes or disagreements arising in respect of the ConstantinopleConvention of 1888 or this Declaration shall be settled in accordance withthe Charter of the United Nations.
(b) Differences arising between the parties to the said Convs-ntion iarespect of the interpretation or the applicability of its provisions, if nototherwise resolved, will be referred to the International Court of Justice.The Government of Egypt would take the necessary steps in order to accept thecompuslory jurisdiction of the International Court of Justice in conformitywith the provisions of Article 36 of its Statute.
10. Status of this Declaration
The Government of Egypt make this Declaration, which re-affirmsand is in full accord with the terms and spirit of the Constantinople Conven-tion of 1888, as an expression of their desire and determination to enable theSuez Canal to be an efficient and adequate waterway linking the nations of theworld and serving the cause of peace and prosperity.
This Declaration, with the obligations therein, constitutes an in-ternational instrument and will be deposited and registered with the Secretariatof the United Nations.
ANNEX 1UPage 4
LETTER FROM THE MINISTER FOR FOREIGN AFFAIRS OF EGYPTTO THE SECRETARY GENERAL OF THE UNITED NATIONS
MINISTERE DES AFFAIRES ETRANGERESCABINET DU MINISTRE 1/
24th April 1957
Your Excellency,
The Government of Egypt are pleased to announce that the Suez Canalis now open for normal traffic and will thus once again serve as a link be-tween the natios of the world in the cause of peace and prosperity.
The Government of Egypt wish to acknowledge with appreciation andgratitude the efforts of the States and peoples of the world who contributedto the restoration of the Canal for normal traffic, and of the United Nationswhose exertions made it possible that the clearance of the Canal be accom-plished peacefully and in a short time.
On 18 March 1957, the Government of Egypt set forth in a memorandumbasic principles relating to the Suez Canal and the arrangements for its oper-ation. The memorandum contemplated a further detailed statement on the sub-ject. In pursuance of the above, I have the honor to enclose a copy of,theDeclaration made today by the Government of Egypt in fulfillment of theirparticipation in the Constantinople Convention of 1888, noting their under-standing of the Security Council resolution of 13 October 1956 2/ and in linewith their statements relating to it before the Council.
I have the honor to invite Your Excellency's attention to the lastparagraph of the Declaration which provides that it will be deposited andregistered with the SEcretariat of the United Nations. The Declaration, withthe obligations therein, constitutes an international instrument and theGovernment of Egypt request that you kindly receive and register it accordingly.
1/ Ministry for Foreign Affairs.Office of the Minister.
2/ United Nations, Official Records of the Security Council, Eleventh Year,Supplement for October, November and December 1956, p. 47.No. 3821
ANNEX 10Page 5
I avail myself of this opportunity to renew to Your Excellency theassurances of my highest consideration.
Yours sincerely,
Mahmoud FAWZIMinister of Foreign Affairs of Egypt
His Excellency M. Dag HammarskjoldSecretary-General of the United NationsNew York
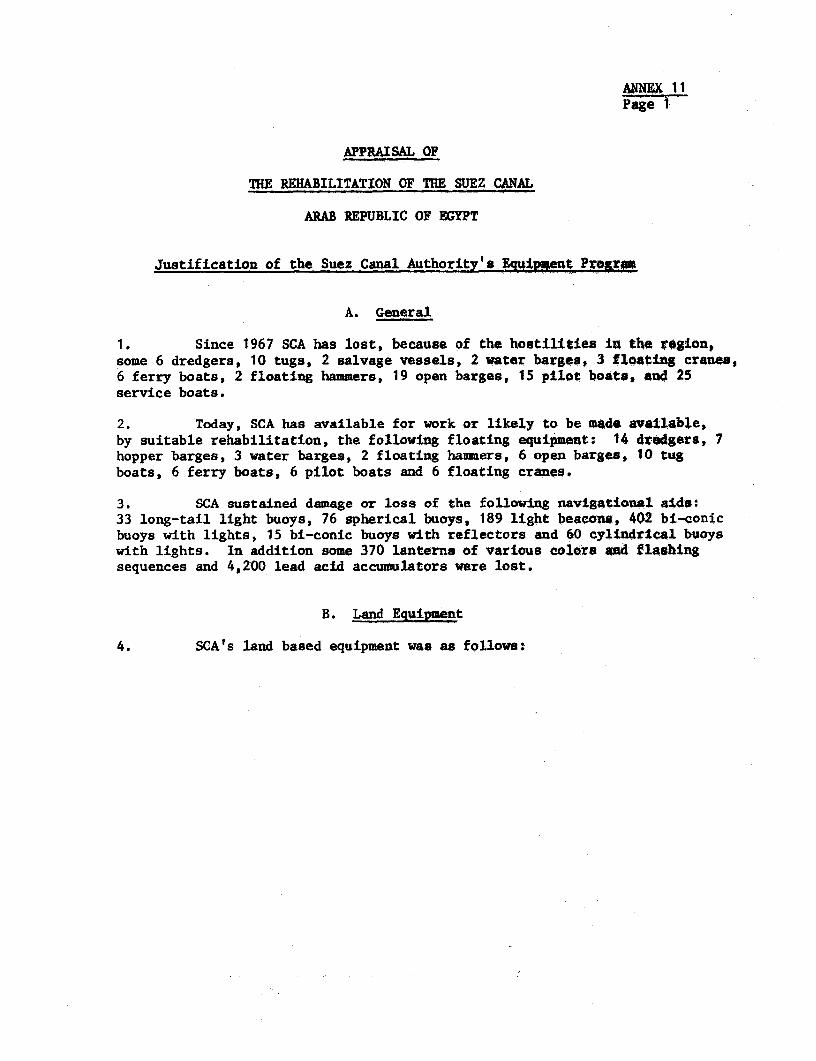
ANNEX IIPage
APPRAISAL OF
THE REHABILITATION OF THE SUEZ CANAL
ARAB REPUBLIC OF EGYPT
Justification of the Suez Canal Authority's Euidpwent Pogrs4
A. General
1. Since 1967 SCA has lost, because of the hostilities in the rogion,some 6 dredgers, 10 tugs, 2 salvage vessels, 2 water barges, 3 floating cranes,6 ferry boats, 2 floating hammers, 19 open barges, 15 pilot boats, and 25service boats.
2. Today, SCA has available for work or likely to be made available,by suitable rehabilitation, the following floating equipment: 14 dvodgers, 7hopper barges, 3 water barges, 2 floating hammers, 6 open barges, 10 tugboats, 6 ferry boats, 6 pilot boats and 6 floating cranes.
3. SCA sustained damage or loss of the following navigational aids:33 long-tail light buoys, 76 spherical buoys, 189 light beacons, 402 bi-conicbuoys with lights, 15 bi-conic buoys with reflectors and 60 cylindrical buoyswith lights. In addition some 370 lanterns of various colors and flashingsequences and 4,200 lead acid accumulators were lost.
B. Land Equipment
4. SCA's land based equipment was as follows:
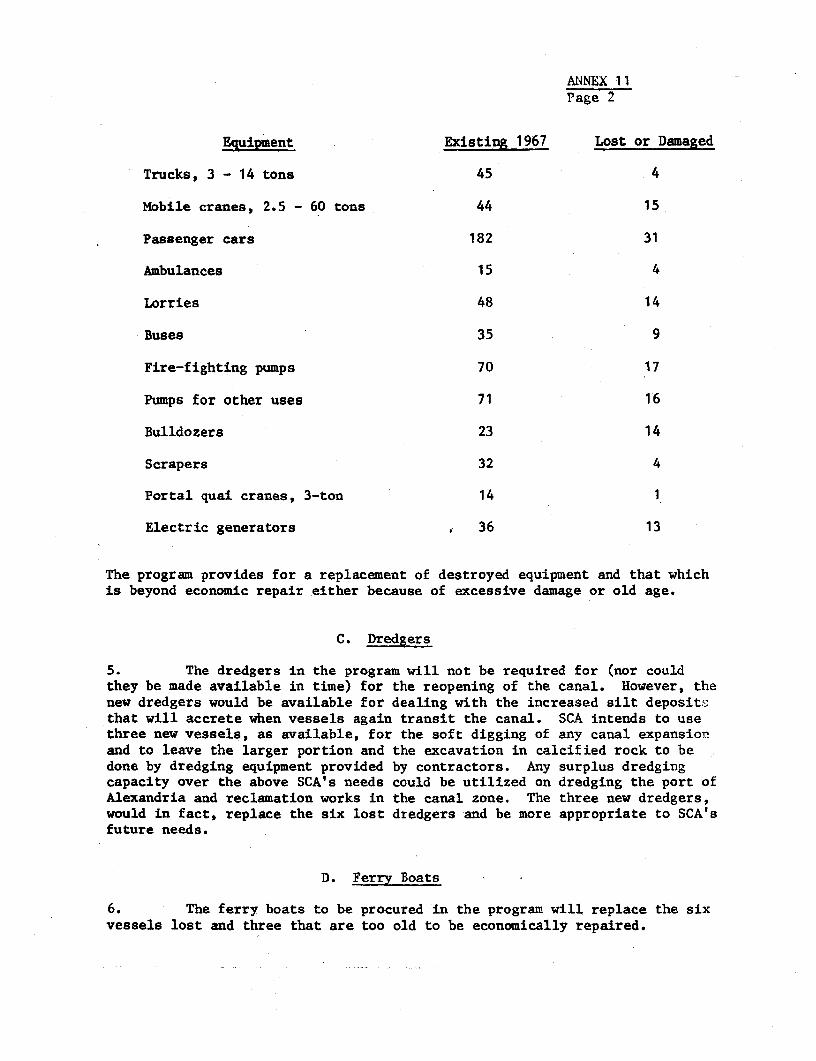
ANNEX 11Page 2
Equipment Existing 1967 Lost or Damaged
Trucks, 3 - 14 tons 45 4
Mobile cranes, 2.5 - 60 tons 44 15
Passenger cars 182 31
Ambulances 15 4
Lorries 48 14
Buses 35 9
Fire-fighting pumps 70 17
Pumps for other uses 71 16
Bulldozers 23 14
Scrapers 32 4
Portal quai cranes, 3-ton 14 1
Electric generators 36 13
The program provides for a replacement of destroyed equipment and that whichis beyond economic repair either because of excessive damage or old age.
C. Dredgers
5. The dredgers in the program will not be required for (nor couldthey be made available in time) for the reopening of the canal. However, thenew dredgers would be available for dealing with the increased silt depositsthat will accrete when vessels again transit the canal. SCA intends to usethree new vessels, as available, for the soft digging of any canal expansionand to leave the larger portion and the excavation in calcified rock to bedone by dredging equipment provided by contractors. Any surplus dredgingcapacity over the above SCA's needs could be utilized on dredging the port ofAlexandria and reclamation works in the canal zone. The three new dredgers,would in fact, replace the six lost dredgers and be more appropriate to SCA'sfuture needs.
D. Ferry Boats
6. The ferry boats to be procured in the program will replace the sixvessels lost and three that are too old to be economically repaired.
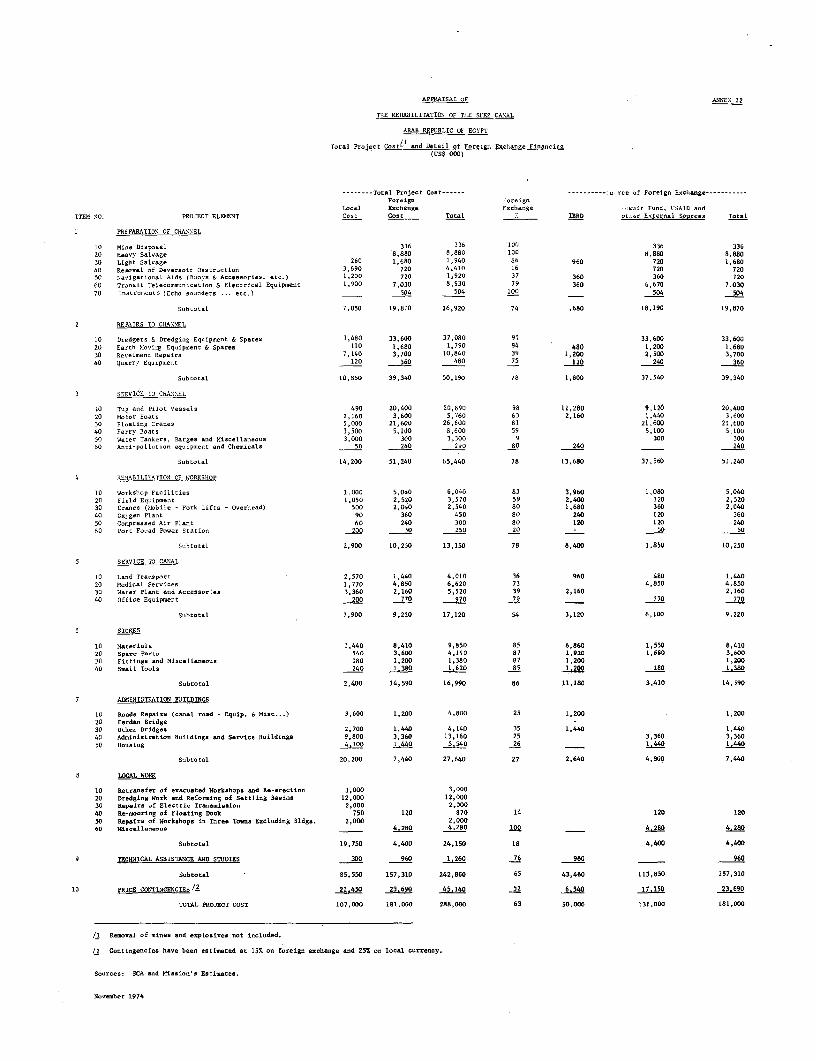
APPRAISAL OF ANNEX 12
TOE REHABILITATION OF TIIE SUEZ CANAL
ARAB REPUBLIC OF EGYPT
Total Project Cont-L and Detail of Foreign Exchange Financing(USE 000)
-------- Total Prject Cost ------ -e f Foreign Esi9ang-----------
Lan1 Eranhonag E-change -- eait Fund, LSAID ond
ITEM N0. PROF ECT ELEMENT Cost Cost Total _B 1RD ot-,r Enternol S-orcen Tot-l
I PREPARATION OF CRANNEL
10 Mine Disponal 336 336 100 336 336
20 HActVY Salage 8,880 0,0 100 8.880 8.880
30 Light Salvage 260 1,680 1,940 86 960 720 1,680
40 Re-aV.i of Deversoir Shatra- tion 3,690 720 4,410 16 720 720
50 NovgStSlongl AIds (nuots & A..easorles. etc.) 1,200 720 1,920 37 360 360 720
60 Transit Teletoteu,ioctioo & Electrical Equipment 1,900 7,030 8,930 79 360 6,670 7,030
70 Instrunects (Echo sound-r . etc.) 504 504 100 504 504
Scbtgtol 7,050 19,870 26,920 74 .680 18,190 19,870
2 REPAIRS TO CHANTEL
10 )redgers & Dredging Equipment & Spares 3,480 33,600 37,080 91 33,600 33,600
20 Earth MovilO Equipment & Spares 110 1,680 1,790 94 480 1,200 1,680
30 Rlettme-t Repairs 7,140 3,700 10,840 39 1,200 2,500 3,700
40 Quorry Equipment 120 360 480 75 120 240 360
Suhbotal 10,850 39,340 50,190 78 1,800 37,540 39,340
3 SEEVICE IT CHATTEL
EL Tug and Pilot Vesails 490 20,400 20,890 98 11,280 9,120 20,400
20 Motor loots 2,160 3,600 5,760 63 2,160 1,440 3,600
30 Floating Craus 5, 000 21,600 26,600 81 21.600 21,600
40 Ferry BTots 3,500 5.100 8,600 59 5,100 51100
50 Otete Tenkots, Barges and Miscellaunous 3,000 300 3,300 9 300 300
60 A-ti-pollution quipme-t and Chemicals 50 240 200 -0 240 240
Su.botal 14,200 51,240 65,440 78 13,680 37,560 51,240
4 7TEhABILITATION CF WOROitHOQ
10 Workshop Facilitien 1001 5,040 6,040 83 3,960 1.080 5,040
20 Field Equipment 1,050 2.520 3,570 59 2,400 120 2,52030 Crones (Mobile - Fork Lifta - Overhead) 500 2,040 2,540 80 1,680 360 2,040
40 ot-gao Plout 90 360 450 80 240 120 360
50 Compressed Air Plant 60 240 300 0 120 120 240
60 Port F_oda PFove St.tion 200 50 250 20 - 50 50
Subtotal 2,900 10,250 13,150 78 8,400 1,850 10,250
5 SERVICE S0 CANAL
10 Land Transport 2,570 1,440 4,010 36 960 480 1,440
20 Medical Servings 1,770 4,850 6,620 73 4,850 4,850
30 Water Plant and Accessories 3 360 2,160 5,520 39 2,160 2,160
40 Office Eqaipment 200 770 970 79 770 770
Subtota1 7,900 9,220 17,120 54 3,120 6,100 9,220
6 IOtRE5
10 Materials 1,440 8,410 9,850 85 6,860 1,550 8,41020 Spare Parts 540 3,600 4,140 87 1,920 1,6SO 3,600
30 Fittings and Miscellameous 180 1,200 1,380 87 1,200 1,200
40 Smell Tools 240 1,380 1,620 8 1,200 180 1.380
Subtotal 2,400 14,590 16,990 86 11,180 3,410 14,590
7 ADiINISTRATION BUILDINGS
10 Roads Repatr- (canal road - Equip. 6 WEa.) 3,600 1,200 4,800 25 1,200 1,200
20 Ferdan Bridge
30 Other Bridges 2,700 1,440 4,140 35 1,440 1,44040 Adoioistrstioo BOildinga and Service Bnildings 9,800 3,360 13,160 25 3.360 3,360
50 Hoosing 4,10Q 1 440 5,540 26 1,440 1.440
Subtotal 20,200 7,440 27,640 27 2,640 4,800 7,440
8 LOCAL WORK
10 Retr-asfer of enacosted Workahops ad Re-seention 3,000 3,000
20 Oredgima Work and Reforisg of Sitling Basin 12,000 12,000
30 Rspsirs of Electnin Tr-n-issio 2,000 2,OOO
40 Re-mooring of Fleating Donk 750 120 870 14 120 120
50 Repairs of Workshops in Three Tens Excluding RldgS. 2,000 2,000
60 Miseellanson. 4 280 4,280 100 4280 4 280
Suhbttoa 19,750 4,400 24,150 18 4,400 4,400
9 TECHNICAL ASSISTANCE AND STOTDIE 300 960 1,260 76 960 960
Sobtota1 85,550 157,310 242,860 65 43,460 113,850 157,310
10 PRICE CONTRNGENCIES /2 21,450 23.690 45,140 52 6,540 17.150 23 690
TOTAL PROJECT COST 107,000 181,000 288,000 63 50,000 131,000 181,000
LI Removal of mimes snd emplosinna mnt inclded.
L2 Cosotigesnies have been eatimated at 157. on foreign e-chsoge and 25% or lonel cnrrecy.
So--nes SCA and Missioms Estimates.
No-mber 1974
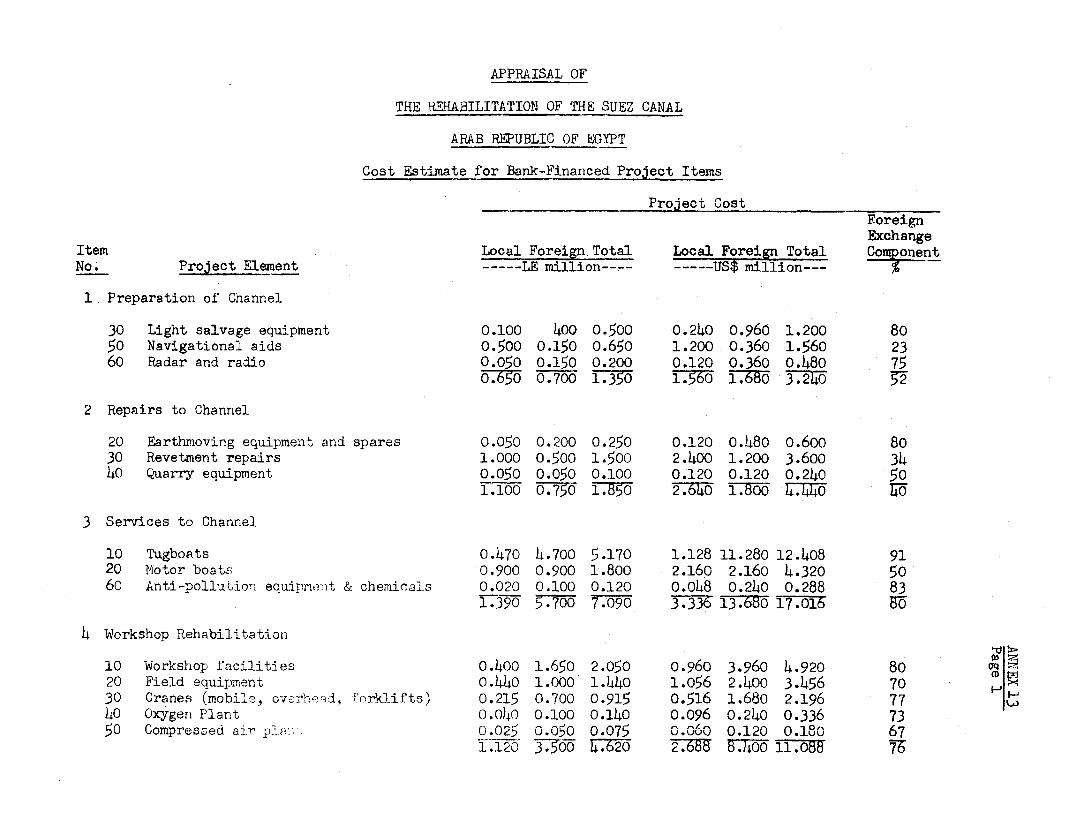
APPRAISAL OF
THE REHABILITATION OF THE SUEZ CANAL
ARAB REPUBLIC OF EGYPT
Cost Estimate for Bank-Financed Project Items
Project CostForeignExchange
Item Local Foreign Total Local Foreign Total Comonent
No. Project Element - LE million ---- US$ million---
1 Preparation of Channel
30 Light salvage equipment 0.100 400 0.500 0.240 0.960 1.200 80
50 Navigational aids 0.500 0.150 0.650 1.200 0.360 1.560 23
60 Radar and radio 0.050 0.150 0.200 0.120 0.360 o.480 750.650 0.700 1.35 56 1.68 3.240
2 Repairs to Channel
20 Earthmoving equipment and spares 0.050 0.200 0.250 0.120 o.480 o.600 80
30 Revetment repairs 1.000 0.500 1.500 2.400 1.200 3.600 3440 Quarry equipment 0.050 0.050 0.100 0.120 0.120 0.240 50
1.100 0.750 1.850 2.640 1800 4.440 Ii
3 Services to Channel
10 Tugboats 0.470 4.700 5.170 1.128 11.280 12.408 9120 Motor boats 0.900 0.900 1.800 2.160 2.160 4.320 50
60 Anti-pollution equipment & chemicals 0.020 0.100 0.120 o.o48 0.240 0.288 831.390 5.700 7.090 3.336 13.650 17.016 85
4 Workshop Rehabilitation
10 Workshop faciliti-es 0.400 1.650 2.050 o.960 3.960 4.920 80
20 Field equipment 0.440 1.000 1.440 1.056 2.1400 3.456 7030 Cranes (mobile, overhfnd_, fnrklifts) 0.215 0.700 0.915 0.516 1.680 2.196 77 w40 Oxygen Plant 0.040 0.100 0.140 0.096 0.240 0.336 7350 Compressed air p.I;-w 0o.025 0.05G 0.075 o.o60 0.120 0.180 67
1.120 3.50 4.620 2.688.400 11.088 76
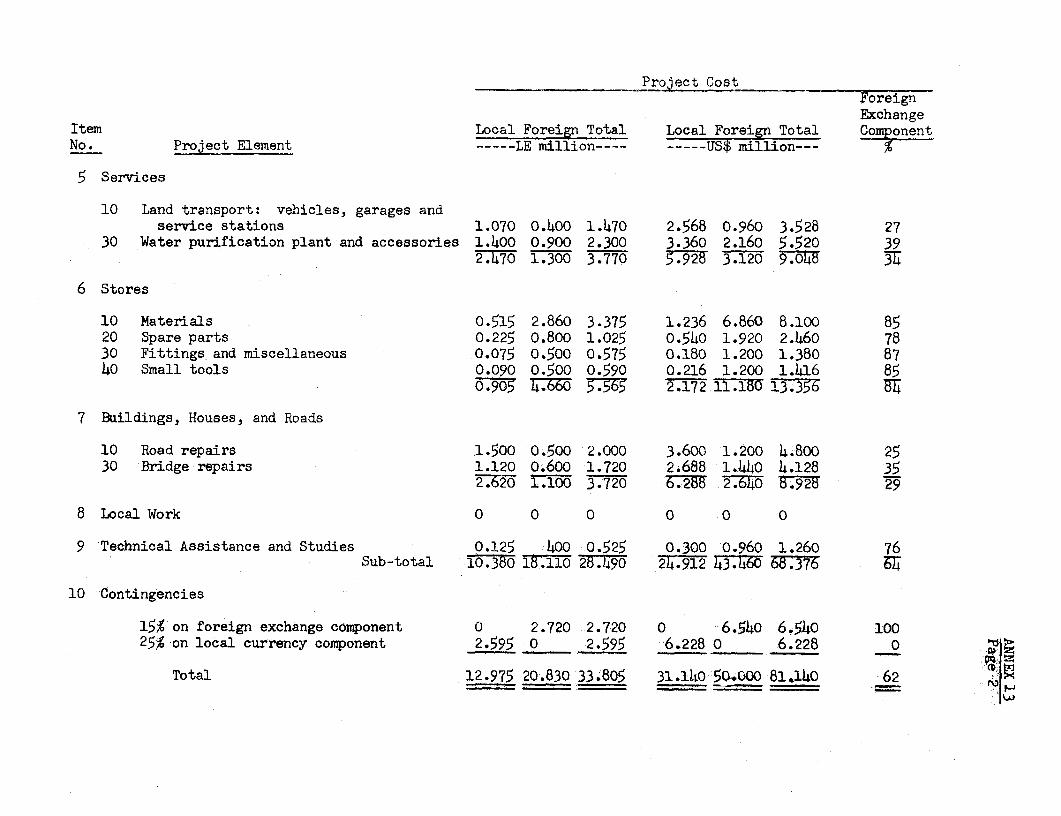
Project CostForeignExchange
Item Local Foreign Total Local Foreign Total ComponentNo. Project Element ----LE million-- --- US$ million--- %
5 Services
10 Land transport: vehicles, garages andservice stations 1.070 o.4oo 1.470 2.568 o.960 3.528 27
30 Water purification plant and accessories 1.400 0.900 2.300 3.360 2.160 5.520 3921770 1.300 3.770 5.928 3.120 9.0[o45
6 Stores
10 Materials 0.515 2.860 3.375 1.236 6.860 8.100 8520 Spare parts 0.225 0.800 1.025 0.540 1.920 2.460 7830 Fittings and miscellaneous 0.075 0.500 0.575 0.180 1.200 1.380 8740 Small tools 0.090 o.500 0.590 0.216 1.200 1.416 85
0.905 7.W 7365 2.172 11.180 13.356 BE
7 Buildings, Houses, and Roads
10 Road repairs 1.500 0.500 2.000 3.600 1.200 4.800 2530 Bridge repairs 1.120 o.600 1.720 2.688 1.440 4.128 35
2:0 1.1006 3.720 6.2 .2.640 5.925 :79
8 Local Work 0 0 0 0 0 0
9 Technical Assistance and Studies 0.125 400 0.525 0.300 0.960 1.260 76Sub-total 10.380 18.110 28.490 24.9-12 43.4 68.376 ES7
10 Contingencies
15% on foreign exchange component 0 2.720 2.720 0 6.540 6.540 10025% on local currency component 2.595 0 2.595 6.228 0 6.228 0
Total 12.975 20.830 33.805 31.140 5.0;00 8i*140 62
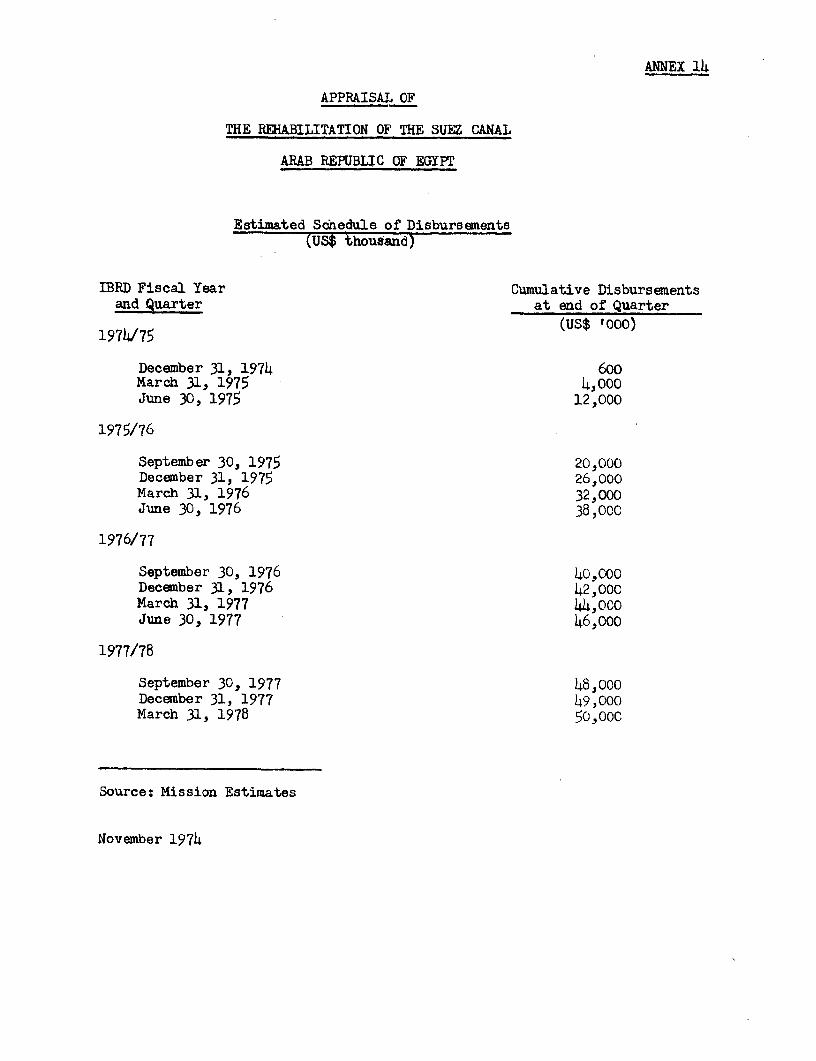
ANNEX 14
APPRAISAL OF
THE REHABILITATION OF THE SUEZ CANAL
ARAB REPUBLIC CF EGYPT
Estimated Schedule of Disbursements(US$ thousand)
IBRD Fiscal Year Cumulative Disbursementsand Quarter at end of Quarter
1974/75 us'0)
December 31, 1974 600March 31, 1975 4,o000June 30, 1975 12,000
1975/76
September 30, 1975 20,000December 31, 1975 26,000March 31, 1976 32,,000June 30, 1976 38,OOC
1976/77
September 30, 1976 40,000December 31, 1976 42,oooMarch 31, 1977 44,000June 30, 1977 46 ,000
1977/78
September 30, 1977 483000December 31, 1977 49,000March 31, 1978 50,ooC
Source: Mission Estimates
November 1974
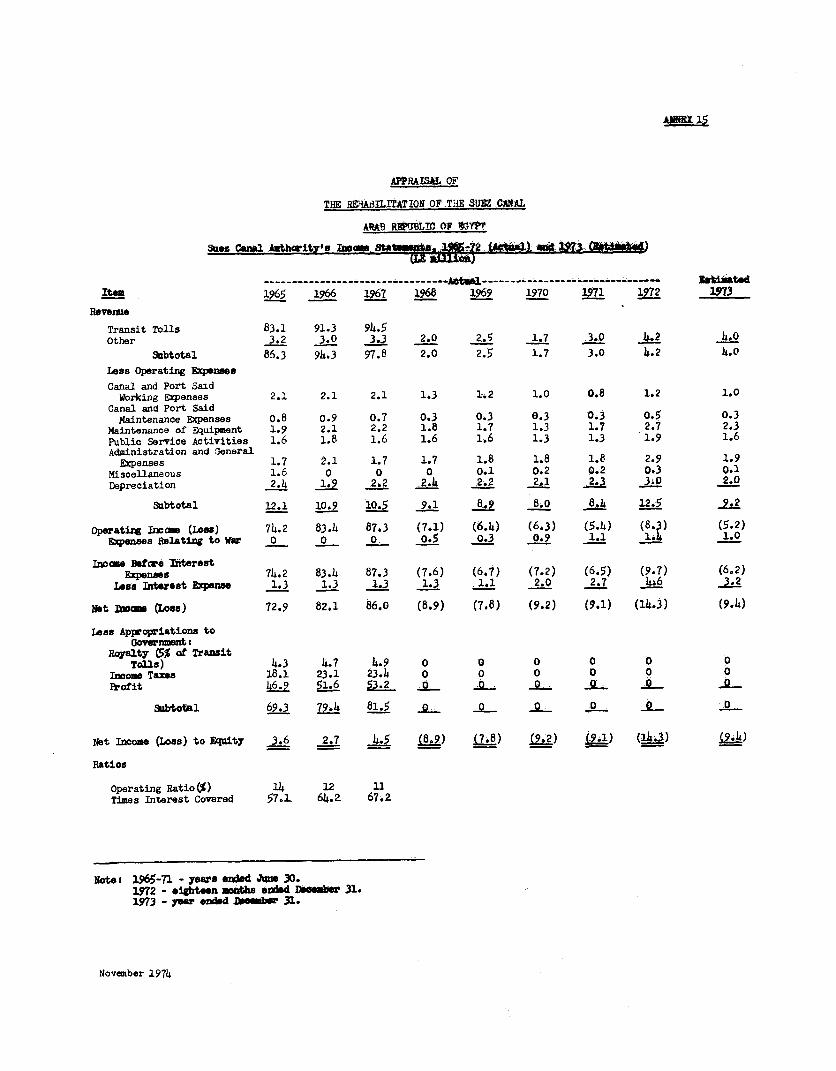
APPRAISAL OF
TuE RS1{A.ILITATION OF TiA SUEZ CANAL
ARAB REFIBLTC OF *.T!
Suez Canal Authcrity's Iaons ^Ma . U L, C a4 ) = 973 WI t tmi)
----------------------- --------- aria l--------------- - ---------- -Item 1965 1966 1967 1968 1969 1970 1971 1972 1973
Revenue
Transit Tolls 83.1 91.3 94.5Other 3.2 3.0 3.3 2.0 2.- 1.7 3.0 4.2 4.0
Subtotal 86.3 94.3 97.8 2.0 2.5 1.7 3.0 4.2 4.0Less Operating ExpenBes
Canal and Port SaidWorking Expenses 2.1 2.1 2.1 1.3 1.2 1.0 0.8 1.2 1.0
Canal and Port SaidMaintenance Expenses 0.8 0.9 0.7 0.3 0.3 0.3 0.3 0.5 0.3
Maintenance of Equipment 1.9 2.1 2.2 1.8 1.7 1.3 1.7 2.7 2.3Public Service Activities 1.6 1.8 1.6 1.6 1.6 1.3 1.3 1.9 1.6Administration and General
Expenses 1.7 2.1 1.7 1.7 1.8 1.8 1.8 2.9 1.9Miscellaneous 1.6 0 0 0 0.1 0.2 0.2 0.3 0.1Depreciation 2.4 1.9 2.2 2.h 2.2 2.1 _2.3 3;0 2.0
Subtotal 12.1 10.9 10.5 9.1 8M 8.0 8a4 12.5 9.2
Operating Income (Loam) 74.2 83.4 87.3 (7.1) (6.4) (6.3) (5.4) (8.3) (5.2)Expenses Relating to war 0 0 0. 0.5 0.3 0.9 1.1 1.4 1.0
Incoe Bafore InterostExpenses 74.2 83.4 87.3 (7.6) (6.7) (7.2) (6.5) (9.7) (6.2)
Lses Interest Expose 1.3 1.3 1.3 1.3 1.1 2.0 2.7 _4.6 3.2
Not floom (Losa) 72.9 82.1 86.0 (8.9) (7.8) (9.2) (9.1) (14.3) (9.4)
jales Appropriations toOovensent I
Royalty (5% of TransitTons) 4.3 4.7 4.9 0 0 0 0 0 0
Inoo Taxes 18.1 23.1 23.4 0 0 0 0 0Pr ofit 146.9 5i.6 .2 o _0_ 0 0: Q0
Subtotal 69.3 79.4 81.5 aQ o 0 0
Nat incoae (Lons) to Equity 3.6 2.7 4.5 (8.9) (7.8) (14.3) (9.4)
Ratios
operating Ratio($) 14 12 11Times Interest Covered 57.) 64.2 67.2
Note: 1965-71 - years ez*sd Juw 30.1972 - eighteen Ntu *ndesd DBasebr 31.1973 - yr endsd Domb 31.
November 1974
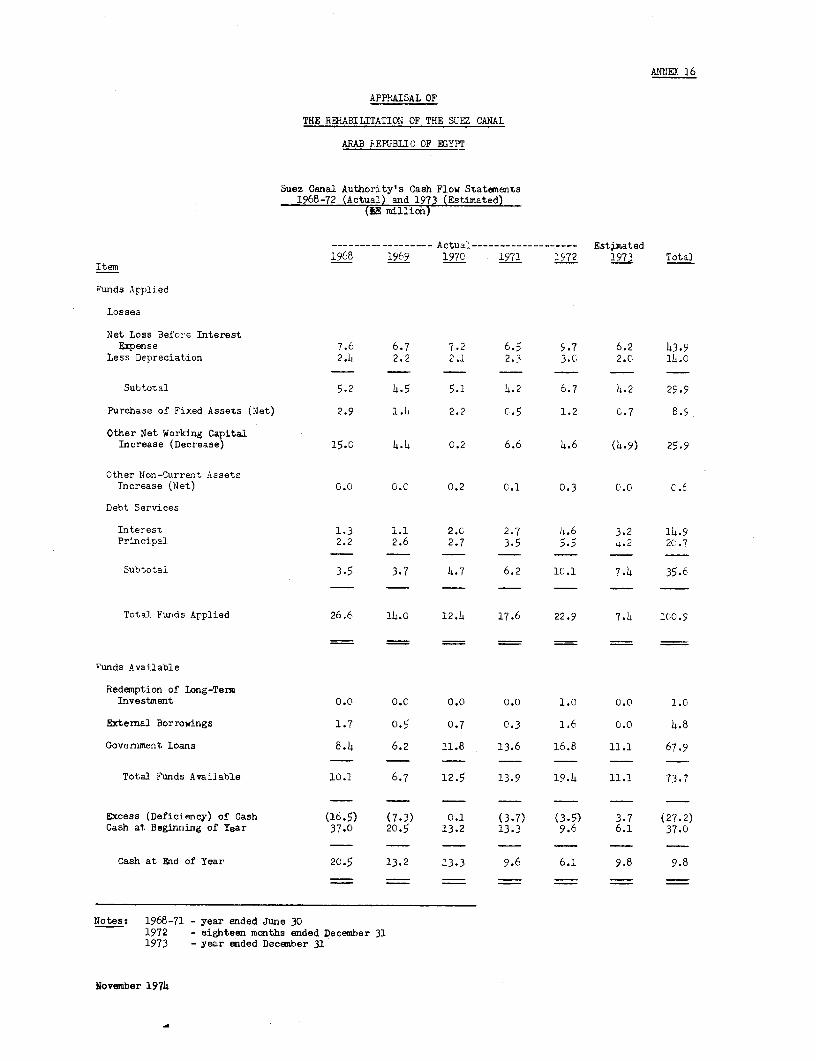
ANNEX. 16
APPRAISAL OF
THE REHABILITATION OF THE SUEZ CANAL
ARAB FEPUBLIC OF EGYPT
Suez Canal Authority's Cash Flow Statements1968-72 (Actual) and 1973 (Estimated)
(MEr million)
-- - -----Actual------------------- Estimated1968 1969 197C 19 1972 1973 Total
Item
Funds Applied
Losses
Net Loss Before InterestExpense 7.6 6.7 7.2 6.5 9.7 6.2 43.9
Less Depreciation 2.4 2.2 2.1 2.3 3.C 2.C 14t.C
Subtotal 5.2 4.5 5.1 4.2 6.7 4.2 29.9
Purchase of Fixed Assets (Net) 2.9 1.4 2.2 C.5 1.2 G.7 B.9
Other Net Working CapitalIncrease (Decrease) 15.0 4.4 0.2 6.6 4.6 (4.9) 25.9
Other Non-Current AssetsIncrease (Net) 0.0 C.C 0.2 C.1 0.3 0.0 C.6
Debt Services
Interest 1.3 1.1 2.C 2.7 4.6 3.2 14.9Principal 2.2 2.6 2.7 3.5 5.5 4.2 20.7
Subtotal 3.5 3.7 4.7 6.2 lt .1 7.4 35.6
Total Funds Applied 26.6 14.0 12.4 17.6 22.9 7.4 1(0:.5
Funds Available
Redemption of Long-TeimInvestment 0.0 0.0 0.0 0.0 1.0 0.0 1.0
Extermal Borrowings 1.7 0.5 0.7 0.3 1.6 0.0 4.8
Government Loans 8.4 6.2 11.8 13.6 16.8 11.1 67.9
Total Funds Available 10.1 6.7 12.5 13.9 19.4 11.1 73.7
Excess (Deficiency) of Cash (16.5) (7.3) 0.1 (3.7) (3.5) 3.7 (27.2)Cash at Beginning of Year 37.0 20.5 13.2 13.3 9.6 6.1 37.0
Cash at End of Year 20.5 13.2 13.3 9.6 6.1 9.8 9.8
Notes: 1968-71 - year ended June 301972 - eighteen months ended December 311973 - year ended December 31
November 1974
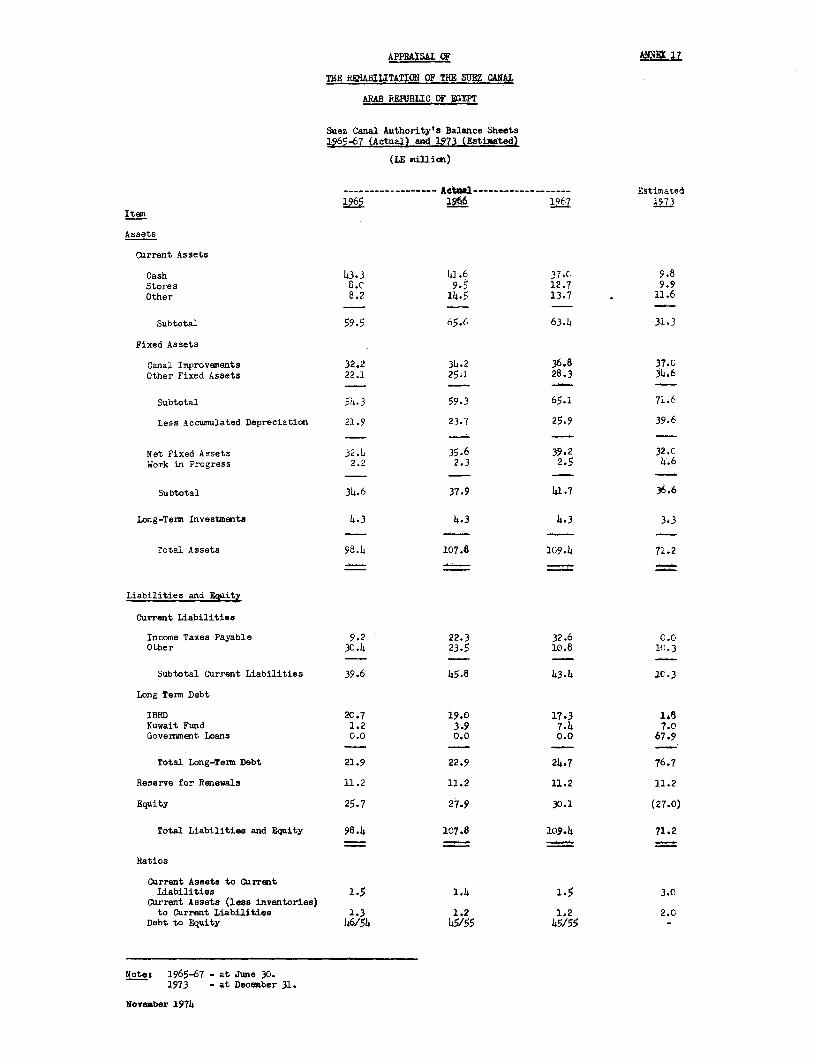
APPRAISAL OF ANSX 17
THE REHABILITATION OF THE SUEZ CANAL
ARAB REFUBLIC OF EGYPT
Suez Canal Authority's Balance Sheets1965-67 (Actual) and 1973 (Estimated)
(LE mi11ion)
------------------ Actual------------------- Estim.ated1965 126 197 97'73
Item
Assets
Current Assets
Cash 43.3 41.6 37.C 9.8Stores 8.C 9.5 12.7 9.9Other 8.2 14.5 13.7 11.6
Subtotal 59.5 65.6 63.4 31.3
Fixed Assets
Canal Improvements 32.2 34.2 36.8 37.0Other Fixed Assets 22.1 25.1 28.3 i4.6
Subtotal 5i.3 59.3 65.1 71.6
Less Accumulated Depreciation 21.9 23.7 25.9 39.6
Net Fixed Assets 32.4 35.6 39.2 32.CWork in Progress 2.2 2.3 2.5 4.6
Subtotal 34.6 37.9 41:.7 36.6
Long-Tenr Investments 4.3 4.3 4.3 3.3
Total Assets 98.4 107.8 1C9.4 71.2
Liabilities and Eouity
Current Liabilities
Income Taxes Payable 9.2 22.3 32.6 0.0Other 30.4 23.5 10.8 1(.3
Subtotal Current Liabilities 39.6 45.8 43.4 1C.3
Long Tenm Debt
IBRD 20.7 19.0 17.3 1.8Kuwait Fund 1.2 3.9 7.4 7.0Government Loans 0.0 0.0 0.0 67.9
Total Long-Term Debt 21.9 22.9 24.7 76.7
Reserve for Renewals 11.2 11.2 11.2 11.2
Equity 25.7 27.9 30.1 (27.0)
Total Liabilities and Equity 98.4 107.8 109.4 71.2
Ratios
Current Assets to CurrentLiabilities 1.5 1.4 1.5 3.0
Current Assets (less inventories)to Current Liabilities 1.3 1.2 1.2 2.0
Debt to Equity 46/54 45/55 45/55 -
Notes 1965-67 - at June 30.1973 - at December 31.
November 1974
ANNEX 18Page 1
APPRAISAL OF
THE REHABILITATION OF THE SUEZ CANAL
ARAB REPUBLIC OF EGYPT
Suez Canal Dues and Future Revenue
A. General
1. As explained in Chapter VII and Annex 6 and 7 a number of importantchanges occured in the shipping industry since 1967. While most of the changesoccured in the transport of oil, dry bulk and general cargo were affected aswell. The future role of the canal has, therefore, to be evaluated in thelight of existing and potential markets which could be affected by its re-opening. The volume of traffic which would pass the canal in the future dependson two main parameters: (i) the physical condition of the canal, draft, width,permissible length and speed; and (ii) the level of canal dues to be paidby shipowners. Since this project is only concerned with the restoration ofthe canal to its preclosure conditions, the physical conditions are well defined(Chapter IV). Regarding the level of dues to be collected the question ismore complex since it is the first time that canal dues would have to be setup after a long interruption of canal operations.
B. Unit of Measurement
2. SCA has traditionally applied a single rate per Suez Canal NetRegistered Ton (SCNRT), a unit of measurement equivalent to 100 c.ft. ofspace, whatever the type of the ship. Discounts were offered for ship inballast and surcharges were imposed to account for ship specifications overand above Suez Canal permissible dimensions (beam, draft, length...). Whilethis approach had the advantage of simplicity; once a ship is measured and onrecords, billing was quite easy, it does present a number of difficulties forthe future. Traffic projections are derived from movements of goods andexpressed in metric tons, long tons, or deadweight tons, which have later tobe converted into SCNRT. This is uneasy since there are no real equivalencebetween the various units. For the purpose of the study the following con-version factor derived from statistical analysis has been used.
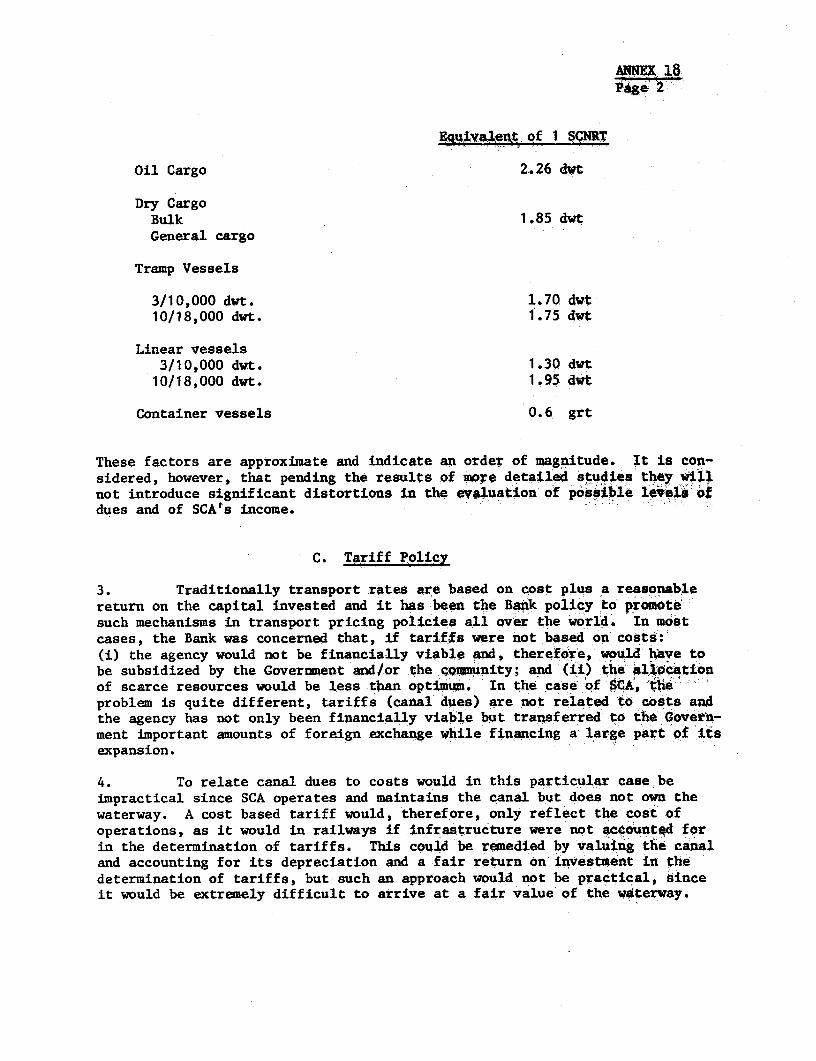
ANNEX 18,Page 2 7
§uivaket of 1 SCNRT
Oil Cargo 2.26 dwt
Dry CargoBulk 1.85 dwtGeneral cargo
Tramp Vessels
3/10,000 dwt. 1.70 dwt10/18,000 dwt. 1.75 dwt
Linear vessels3/10,000 dwt. 1.30 dwt10/18,000 dwt. 1.95 dvt
Container vessels 0.6 grt
These factors are approximate and indicate an order of magnitude. It is con-sidered, however, that pending the results of more detailed studies thy wilnot introduce significant distortions in the evaluation of possible levels ofdues and of SCA's income.
C. Taff Policy
3. Traditionally transport rates are based on cost plus a reasonable
return on the capital invested and it has been the Bank policy to promote
such mechanisms in transport pricing policies all over the world. In mostcases, the Bank was concerned that, if tariffs were not based on costs:
(i) the agency would not be financially viable and, therefore, would hAve to
be subsidized by the Government and/or the cQmmunity; and (ii) the alipcatiionof scarce resources would be less than optimum. In the case of SCk, ihe
problem is quite different, tariffs (canal dues) are not related to CoStS and
the agency has not only been financially viable but transferred to thet Gwveth-ment important amounts of foreign exchange while financing a large part of ifs
expansion.
4. To relate canal dues to costs would in this particular case beimpractical since SCA operates and maintains the canal but does not own thewaterway. A cost based tariff would, therefore, only reflect the cost ofoperations, as it would in railways if infrastructure were not accountqd forin the determination of tariffs. This could be remedied by valuing the canaland accounting for its depreciation and a fair return on investment in thedetermination of tariffs, but such an approach would not be practical, sinceit would be extremely difficult to arrive at a fair value of the waterway.
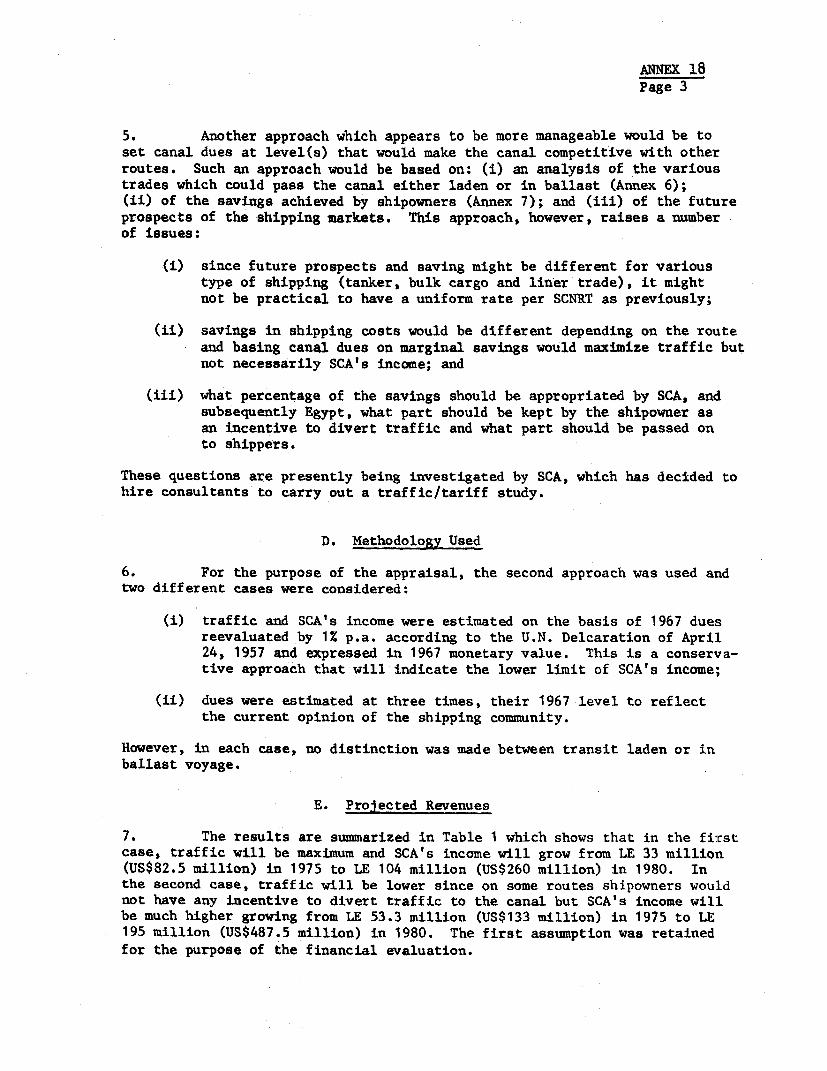
AmNEX 18Page 3
5. Another approach which appears to be more manageable would be toset canal dues at level(s) that would make the canal competitive with otherroutes. Such an approach would be based on: (i) an analysis of the varioustrades which could pass the canal either laden or in ballast (Annex 6);(ii) of the savings achieved by shipowners (Annex 7); and (iii) of the futureprospects of the shipping markets. This approach, however, raises a numberof issues:
(i) since future prospects and saving might be different for varioustype of shipping (tanker, bulk cargo and liner trade), it mightnot be practical to have a uniform rate per SCNRT as previously;
(ii) savings in shipping costs would be different depending on the routeand basing canal dues on marginal savings would maximize traffic butnot necessarily SCA's income; and
(iii) what percentage of the savings should be appropriated by SCA, andsubsequently Egypt, what part should be kept by the shipowner asan incentive to divert traffic and what part should be passed onto shippers.
These questions are presently being investigated by SCA, which has decided tohire consultants to carry out a traffic/tariff study.
D. Methodology Used
6. For the purpose of the appraisal, the second approach was used andtwo different cases were considered:
(i) traffic and SCA's income were estimated on the basis of 1967 duesreevaluated by 1% p.a. according to the U.N. Delcaration of April24, 1957 and expressed in 1967 monetary value. This is a conserva-tive approach that will indicate the lower limit of SCA's income;
(ii) dues were estimated at three times, their 1967 level to reflectthe current opinion of the shipping community.
However, in each case, no distinction was made between transit laden or inballast voyage.
E. Projected Revenues
7. The results are summarized in Table 1 which shows that in the firstcase, traffic will be maximum and SCA's income will grow from LE 33 million(US$82.5 million) in 1975 to LE 104 million (US$260 million) in 1980. Inthe second case, traffic will be lower since on some routes shipowners wouldnot have any incentive to divert traffic to the canal but SCA's income willbe much higher growing from LE 53.3 million (US$133 million) in 1975 to LE195 million (US$487.5 million) in 1980. The first assumption was retainedfor the purpose of the financial evaluation.
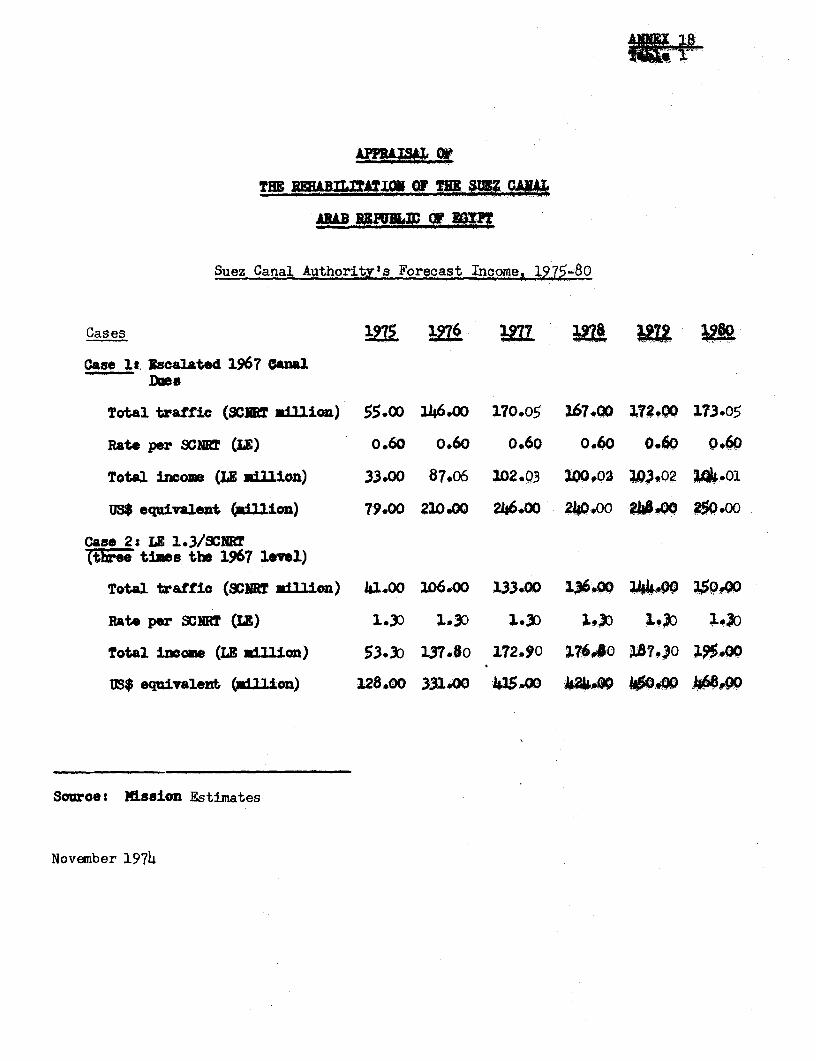
1~ 1B
.I ~ ~ ~ ~ ~ ,W
Suez Canal Authority's Forecast Income, 1975-80
Cases 1
Case 1t. IscalAted 1967 CaalDtoe
Total traffic (SCIRT aiflion) 55.00 146.00 170.05 167.00 17 173.o0
Rate per SCNI" (I,) o.60 0.60 0.60 0.60 0.60 0.60
Total income (LI milion) 33.00 87.06 102.03 100.0 1;,02 .01
US$ equivalent (mLlion) 79.00 210.00 246*00 20.0 9.40 2Q50.00
Case 2: LE 1.3/SCNIR(tbree time the 1967 level)
Total traffio (SCOT million) 41.00 106.00 133.00 lJ69WQ Z4)0 )s0,Qo
Rate per SCNT (L5) 1.30 1.3) 1.3D 1-.3 1.) 1Xo
Total incame (LE million) 53.30 137o80 172.90 13760 167.30 i9.5Q
ll$ equivalent (million) 128.00 331.00 435.(X 44k& W40 a6#90
Source: Misaion Estimates
November 1974
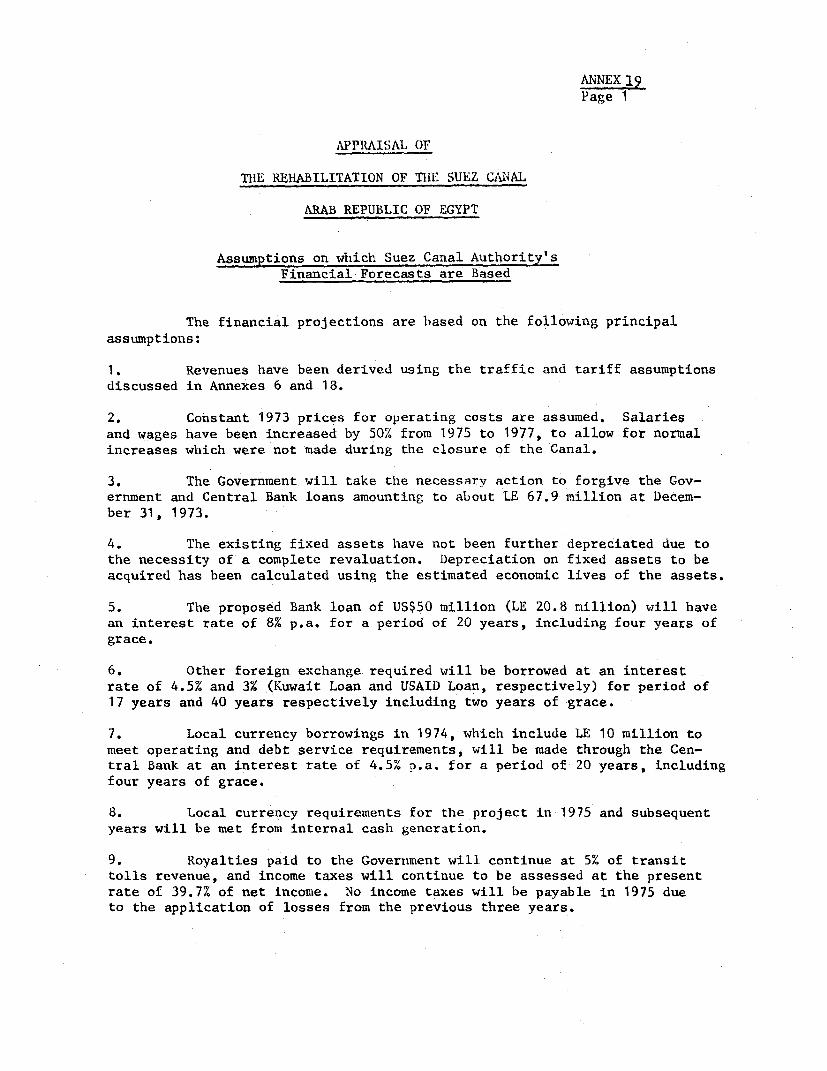
ANNEX I9Page 1
APPRAISAL OF
THIE REHABILITATION OF TILE SUEZ CANAL
ARAB REPUBLIC OF EGYPT
Assumptions on which Suez Canal Authority'sFinancial Forecasts are Based
The financial projections are based on the following principalassumptions:
1. Revenues have been derived using the traffic and tariff assumptionsdiscussed in Annexes 6 and 18.
2. Constant 1973 prices for operating costs are assumed. Salariesand wages have been increased by 50% from 1975 to 1977, to allow for normalincreases which were not made during the closure of the Canal.
3. The Government will take the necessary action to forgive the Gov-ernment and Central Bank loans amounting to about LE 67.9 million at Decem-ber 31, 1973.
4. The existing fixed assets have not been further depreciated due tothe necessity of a complete revaluation. Depreciation on fixed assets to beacquired has been calculated using the estimated economic lives of the assets.
5. The proposed Bank loan of US$50 million (LE 20.8 million) will havean interest rate of 8% p.a. for a period of 20 years, including four years ofgrace.
6. Other foreign exchange required will be borrowed at an interestrate of 4.5% and 3% (Kuwait Loan and USAID Loan, respectively) for period of17 years and 40 years respectively including two years of grace.
7. Local currency borrowings in 1974, which include LE 10 million tomeet operating and debt service requirements, will be made through the Cen-tral Bank at an interest rate of 4.5% p.a. for a period of 20 years, includingfour years of grace.
8. Local currency requirements for the project in 1975 and subsequentyears will be met from internal cash generation.
9. Royalties paid to the Government will continue at 5% of transittolls revenue, and income taxes will continue to be assessed at the presentrate of 39.7% of net income. No income taxes will be payable in 1975 dueto the application of losses from the previous three years.
ANNEX 19Page 2
10. No attempt has been made to allocate the cash shown to be accumu-lated on the forecast cash flow statements (Annex 20). It is a matter ofannual negotiation between SCA and the Government and will be either heldinternally by SCA for future capital investments or distributed to theGovernment.
11. The first phase of the future expansion was included in the fore-casts which assume 100% borrowing for 25 years including 5 years of grace at6%, the first revenue from the expansion accruing in 1980.
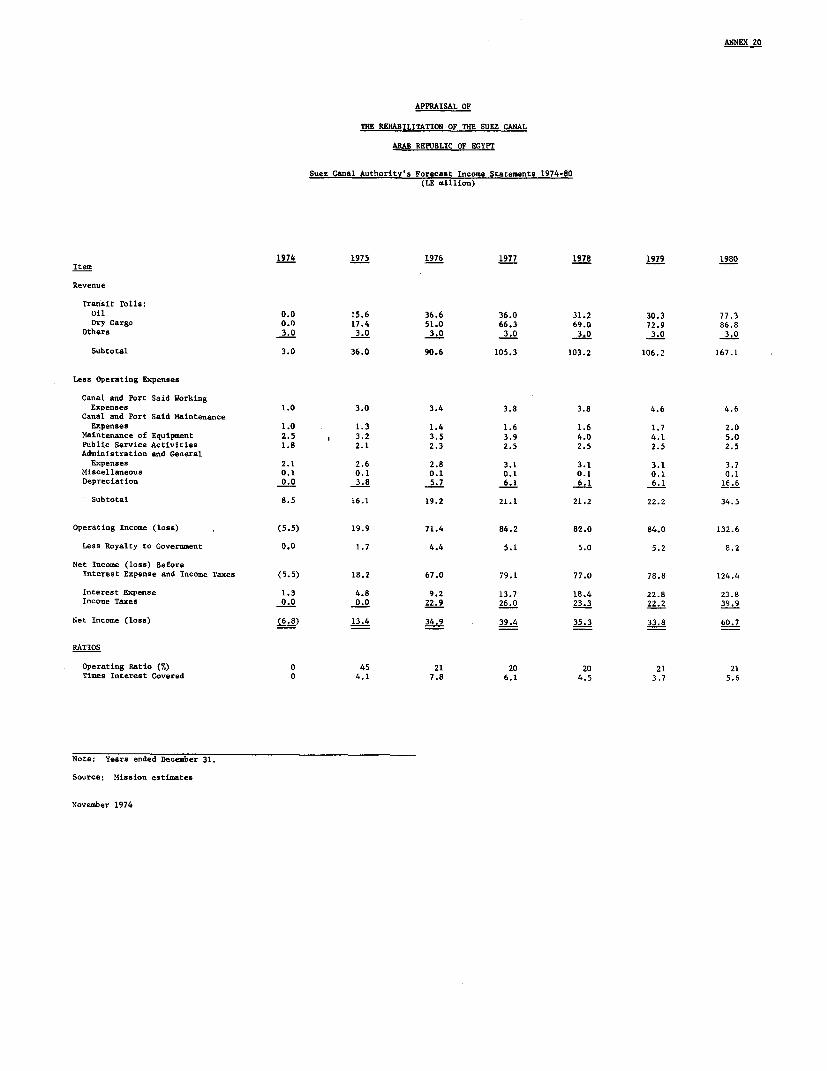
ANNEX 20
APPRAISAL OF
THE REHABILITATION OF THE SUEZ CANAL
ARAB REPUBLIC OF EGYPT
Suez Canal Authority s Forecast Income Statements 1974-80(LE million)
1974 1975 1976 1977 1978 1979 1980
Item
Revenue
Transit Tolls:Oil 0.0 15.6 36.6 36.0 31.2 30.3 77.3
Dry Cargo 0.0 17.4 51.0 66.3 69.0 72.9 86.8
Others 3.0 3.0 3.0 3.0 3.0 3.0 3.0
Subtotal 3.0 36.0 90.6 105.3 103.2 106.2 167.1
Less Operating Expenses
Canal and Port Said WorkingExpenses 1.0 3.0 3.4 3.8 3.8 4.6 4.6
Canal and Port Said MaintenanceExpenses 1.0 1.3 1.4 1.6 1.6 1.7 2.0
Maintenance of Equipment 2.5 4 3.2 3.5 3.9 4.0 4.1 5.0
Public Service Activities 1.8 2.1 2.3 2.5 2.5 2.5 2.5Administration and General
Expenses 2.1 2.6 2.8 3.1 3.1 3.1 3.7
Miscellaneous 0.1 0.1 0.1 0.1 0.1 0.1 0.1
Depreciation 0.0 3.8 5.7 6.1 6.1 6.1 16.6
Subtotal 8.5 16.1 19.2 21.1 21.2 22.2 34.5
Operating Income (loss) (5.5) 19.9 71.4 84.2 82.0 84.0 132.6
Less Royalty to Government 0.0 1.7 4.4 5.1 5.0 5.2 6.2
Net Income (loss) BeforeInterest Expense and Incomae Taxes (5.5) 18.2 67.0 79.1 77.0 76.8 124.4
Interest Expense 1.3 4.8 9.2 13.7 18.4 22.8 23.8Income Taxes 0.0 0.0 22.9 26.0 23.3 22.2 39.9
Net Income (loss) (6.8) 13.4 34.9 39.4 35.3 33.8 60.7
RATIOS
Operating Ratio (7.) 0 45 21 20 20 21 21
Times Interest Covered 0 4.1 7.8 6.1 4.5 3.7 5.6
Note: Years ended December 31.
Source: Mission estimates
November 1974
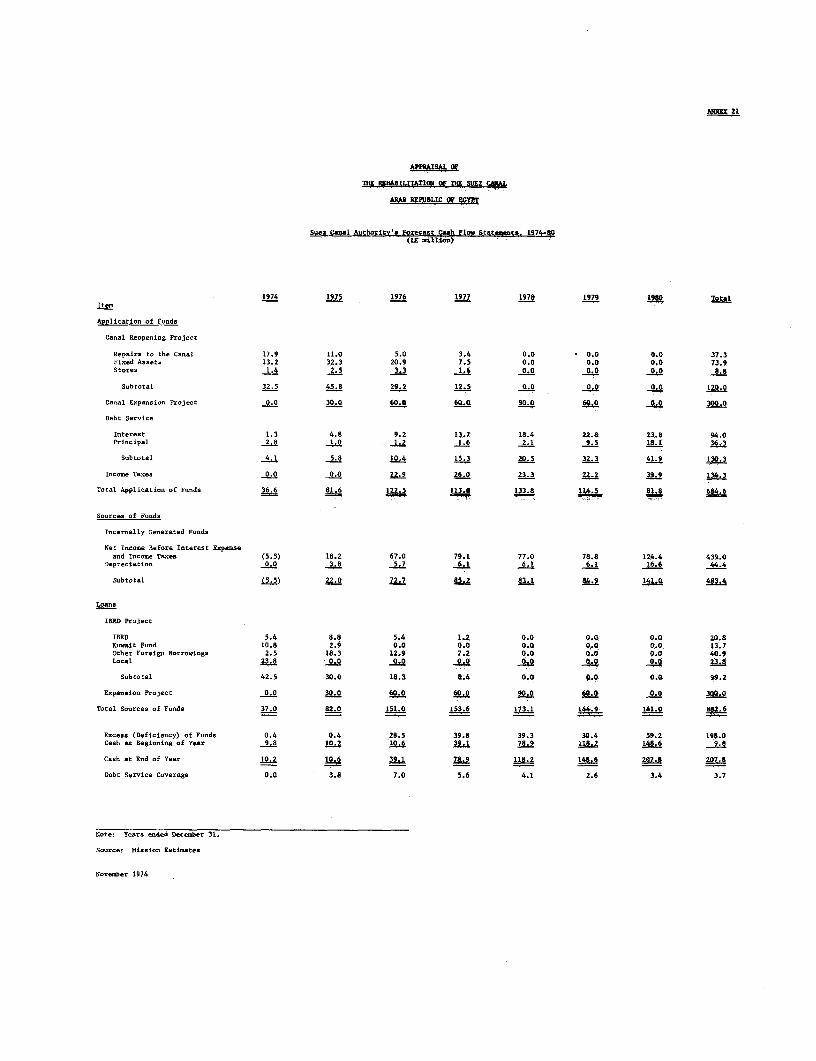
ANNEX 21
"PAFP.15 OF
1151 RIWail;IUT7a.I OF 281 SUEZ CM L
ARS REPUBLIC OF EFGYP
Sues Canal Authority's Fo#ecast Ch Flo,. Stat#t. 1974-80
1974 1975 1976 1977 1978 1979 TM lotalItem
Application of Funds
Canal Reopening Project
Repairs to the CoonS 17.9 11.0 5.0 3.4 0.0 0.0 0.0 37.3Fixed Assets 13.2 32.3 20.9 7.5 0.0 0.0 0.0 73.9Stores 1.4 2.5 3.3 1.6 0.0 0.0 0.0 8.8
Subtotal 32.3 45.8 29.2 12.5 0.0 0.0 0.0 120.0
Canal Enpansion Project 0.0 30.0 60.0 60.51 90.0 60.0 . 300.0
Debt Service
Interest 1.3 4.8 9.2 13.7 18.4 22.8 23.8 94.0Principal 2.8 1.0 1.2 1.6 2.1 9.5 18.$ 36.3
Subtotal 4.1 5.8 10.4 15.3 20.5 32.3 41.9 130.3
Income Tanes 0.0 0.0 22.9 26.0 23.3 22.2391.9 134.3
Total Applic-tion of Funds 36.6 6 122.5 133-8 ;
Sources of Funds
Internally Generated Punds
Net Income 3efore Interest Expeuseand Income Tanes (5.5) 18.2 67.0 79.1 77.0 78.8 1Z4.4 439.0
Depreciation 0.0 3.8 5.7 6.1 6.1 6.1 16.6 44-4
Subtotal (5.5) 72.7 y @ 2 84.9 483.4
Loans
IBRD Project
I8RD 5.4 8.8 5.4 1.2 0.0 0.Q 0.0 20.8Kuwait Fond 10.8 2.9 0.0 0.0 0.0 O0. 0.0 13.7Other Foreign Borrowings 2.5 18.3 12.9 7.2 0.O 0.0 0.0 40.9Local 23.8 0.0 0.0 0.0 Q ,0 2 3
Subtotal 42.5 30.0 18.3 8.4 0.0 0 .0 0.0 99.2
Expausion Project 0.0 30.0 60.0 60.0 9,0. 30Q0
Total Sources of Funds 37.0 82.0 151.0 153.6 173.1 9449 14LO 886
Encess (Deficiency) of FPnds 0.4 0.4 28.5 39.8 39.3 30.4 59.2 198.0Cash at Beginning of Year 9.8 10.2 10.6 39.1 78.9 11S.2 148.6 9
Cash at Ed of Year 10.2 39.1 78-9 118.2 148.6 207.8 207.8
Debt Service Coverage 0.0 3.8 7.0 5.6 4.1 2.6 3.4 3.7
Note: Years ended December 31.
Sources Mission Estimates
November 1974
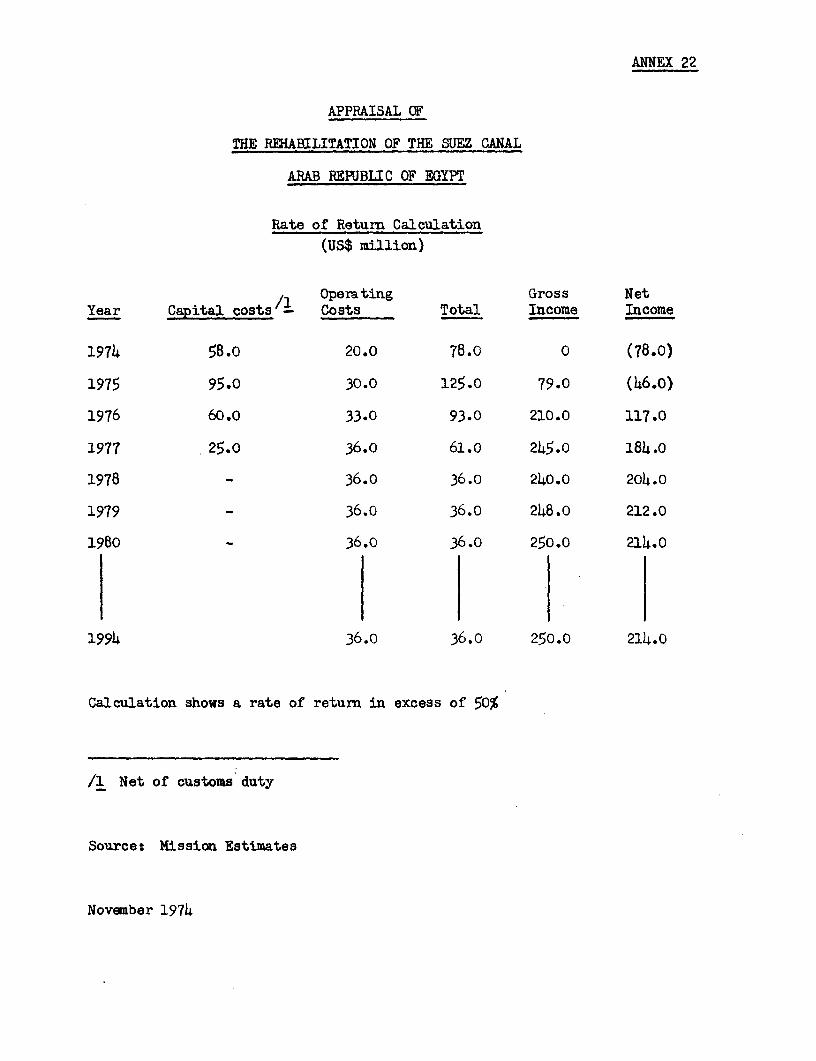
ANNEX 22
APPRAISAL OF
THE REHABILITATION OF THE SUEZ CANAL
ARAB REPUBLIC OF EGYPT
Rate of Return Calculation(US$ million)
c I Operating Gross NetYear Capital cCosts Total Income Income
1974 58.o 20.0 78.0 0 (78.0)
1975 95.O 30.0 125.0 79.0 (46.0)
1976 60.0 33.0 93.0 210.0 117.0
1977 25.0 36.o 61.0 245.0 184.0
1978 - 36.0 36.o 240.0 204.0
1979 36.0 36.0 248.0 212.0
1980 36.0 36.0 250.0 214.0
1994 36.0 36.0 250.0 214.0
Calculation shows a rate of return in excess of 50%
/1 Net of customs duty
Source: Mission Estimates
November 1974

I
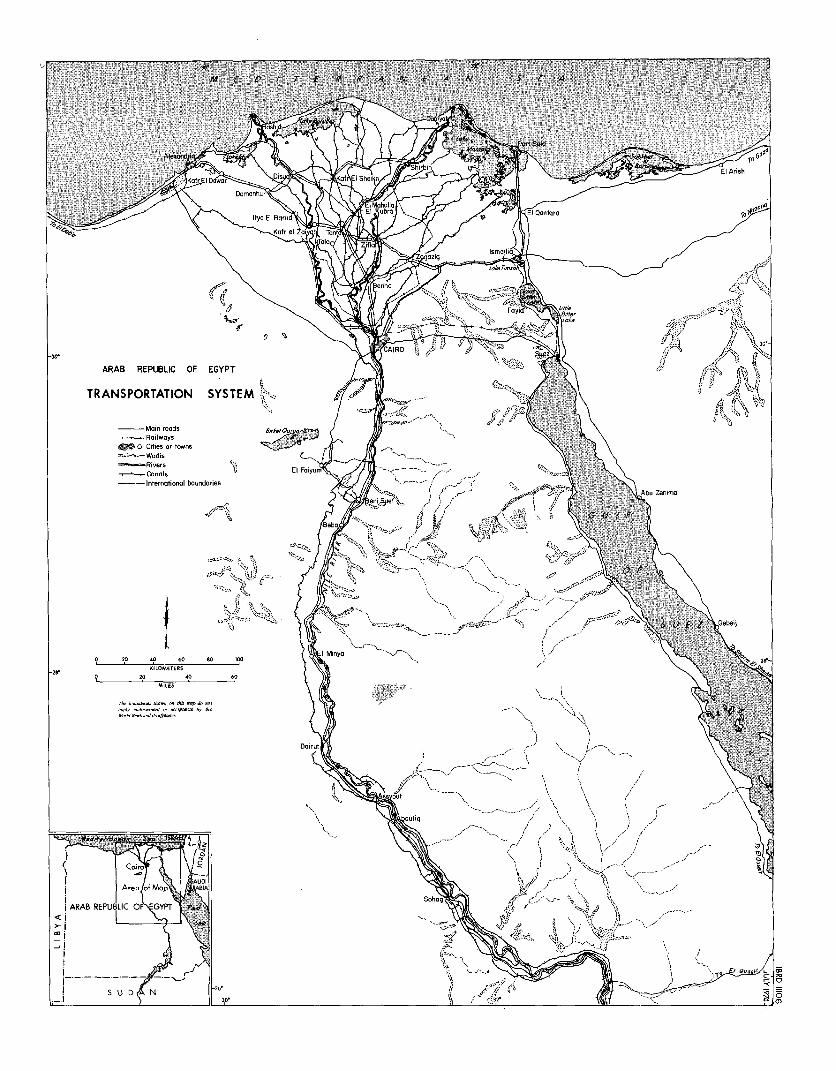
A *I- E e / A -E A N S- A
s D ' X~ ~~~ ~~~~~~~~~~~~~~~~~~~~~~~~~~~~~~~~~~~~~~~~~~~~~~~~~~~~~~~~~~~~~~~~~~~~~~~~~~~~~~~~~~~~~~~~~~~~~~~~~~~~~~~~~~~~~~~~~~R ( rS iEl Arish
Elotra
bil~~~~~~~~~~~~~~~~- Fay i
ARAB REPUBLIC OF EGYPT
TRANSPORTATION SYSTEM A21
-Main roods- Railways r ,i
t- 0 ciies or town,Wadis
~~RIoers ~~~~~~El Foym-,-'---Conals
--- Iterationl boundaries_ss {i/%as X W t<, CAs~~~~~~~~~~~~~~~~~~~~~b entmrz
aebo -.- *
0 20 '10 6p 15R~s 2.0
\ ',=,£;:2LX < ¢~~~~~~~gS <5.4 'I<
KI LOMETERESo2r 20 40 00
MILES
r-- {g/ ,--v*> t30n 10-.---------
qr~~~~~b rb OerR bb tMinya on 5-' nbr 0
'to~~~~~~~~~~~~~~~~~~~~ui
I ARAB REPUI LIC 0 GYPT ,
S U D N 2OD3o'

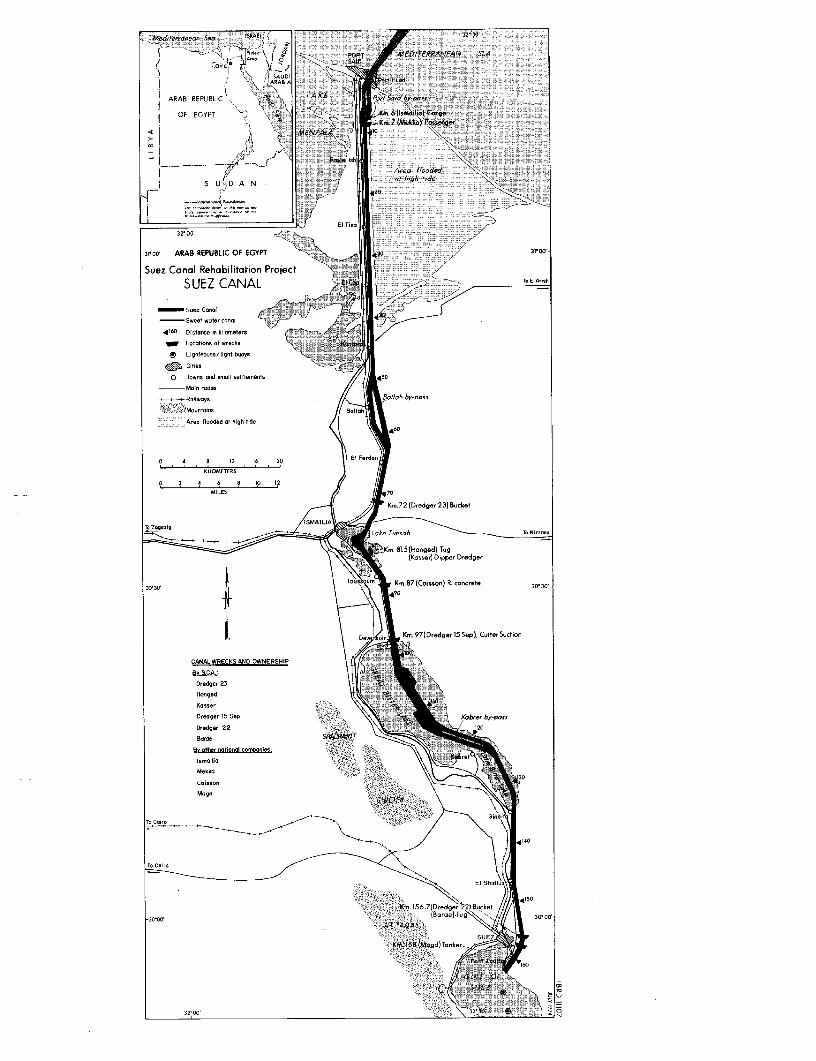
_ ~~~~~~32' 30'Medoterffanea SRa lSOAEL, D
Ar. POR< ;'\ t T MEW i/rERRARTEAN SEAg 4 W\~~ ~~A-,,}O \- s {
j 0060;\J/ lsRAU A Pod FPrd
ARAB REPUBLIC XE
OF EGYPT 6 < \ LA tI Sold yn
AD |M,F1 .S AUENZ;LAn} TD FX M
ZI~~~~~~~~~~~~~~~~~~.I_j ____,IXr'_ !2I , h
31j ARAB REPULIC ArOo floodedY 1S USDAN Ir /othb;gbide .
;X El Tine
-31-00' ARAB REPUBLIC OP EGYPT ;, 0 /310
Suez Canal Rehabilitation Project
SUEZ CANAL T.ElA..h
Sez CanalSweet watr canal
4160 DWSitece in ki oeters
W Loctions ot wrecks
* Lighthro.../light buoys
C Cities
O Tours and sm-all sttlonnent.
- Main rends;U Rurloys Bulb by-pans- ooroinrmolu
Aron flooadad at hlgh t do
0 4 a 12 1o 20 lFre
KILOMETERS
0, 2 T4 6 a 10 12MILES 7 0
Kl. m72 (Dredger 23) Bucker
\<St2EKm g815 jIHorged) TU9\ N < {~~K-wse) Dipper Dredg.r
30300 To mp K,m 87 (crJisso) R. c..crete 3
|D K..97(Dredgerl55ep) CurtrS.cfchn
CANAL WRECKS AND OWNERSHIP | 1 :[ )
Dredger 23| ; _ :
Hanged 7' , w 3
Dredger 15 Sep b 'j 9 _ \ /o re .-p-sDredger 22 0\Lk^-120
Hy_ptrKer nrt,oEl -ompoce 5 3
Mekko 9 v ~~~~~~~~~~~~~~~~~~~~~~~30
_ X XneX ]~~~~~~~~~~~~~~~~~~~~~~~~~~~~~~~~40
El Shal
-30-00'~ , '5° 30 00-
i t E >fiT49/iti ~~~601 - .r. ' YlYI i 8F ,

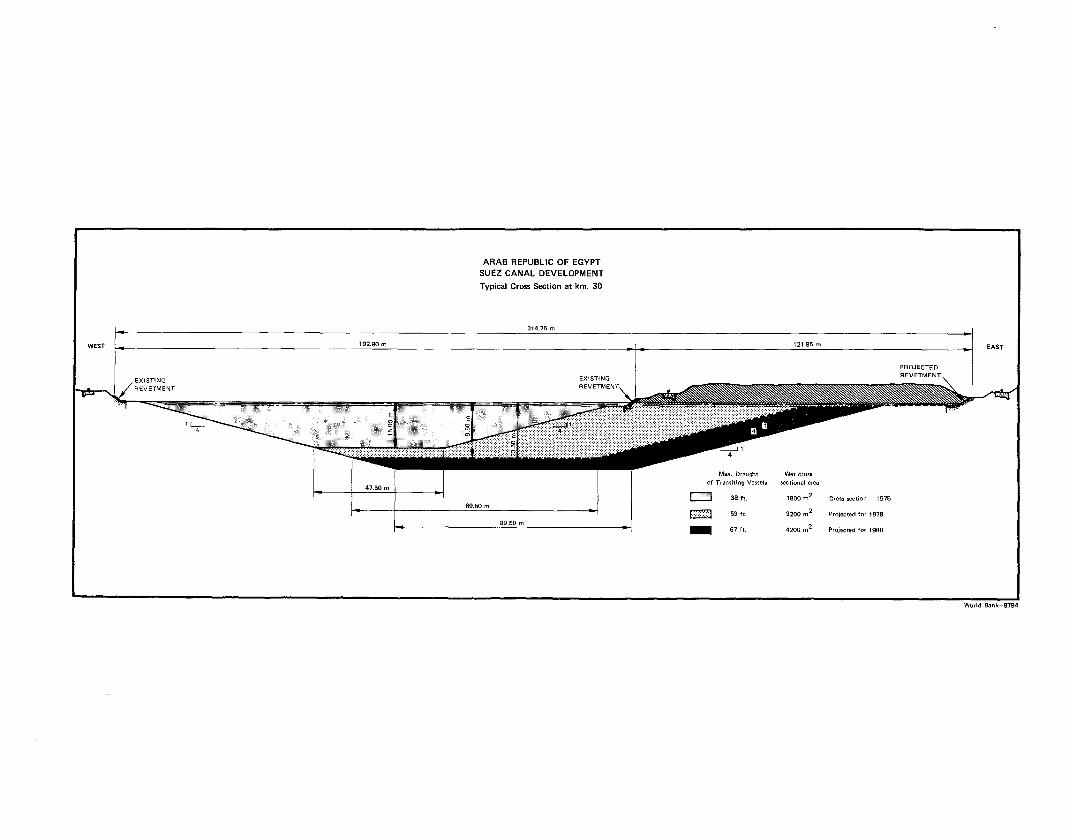
ARAB REPUBLIC OF EGYPTSUEZ CANAL DEVELOPMENT
Typical Cross Section at km. 30
314.75 t
WEST 192.90
121.95 EAST
EXISTING
EXISTING REVETMENT
REVETMENT
REVETMENT>
. *~~~~~~~~~~~~~~~~~~~~~~~~~~~~
,...., ... .,.- _
~~~~~~~~~~~~~~~~~~~~~~~ . °. .. .....:
4
Max- Draught Wet cross
-47.60 ~~~~~~~~~~~~~~~~~~~~~~~~~~~~f Tr-oititg V-ssl -ttitl tr.oa
38 ft 1800 t2
Cross stction-1975
53 ft 3200 so2
Projected f.t 1978
_t 89.50 m67 ft. 4200 o
2Projiectd for 1980
WorId 8ank-8794