Embed Size (px)
Citation preview
THE RELATIONSHIP BETWEEN DIVERSITY MANAGEMENT AND
ORGANISATIONAL CLIMATE
by
TSEDILE ETHEL TJALE
submitted in partial fulfillment of the requirements for
the degree of
MASTER OF ADMINISTRATION
in the subject
INDUSTRIAL AND ORGANISATIONAL PSYCHOLOGY
at the
UNIVERSITY OF SOUTH AFRICA
SUPERVISORS: PROF N MARTINS AND MR H VON DER OHE
JUNE 2005
ACKNOWLEDGEMENTS
The completion of this study would not have been possible without the support of my
family, particularly my parents, partner, and my friends. I would like to thank them for
their encouragement.
The assistance, support, time and patience, which my supervisors (Prof Nico Martins
and Mr Hartmut Von der Ohe) have dedicated to this dissertation. I am humbled by their
dedication.
I would also like to thank the Centre for Industrial and Organisational Psychology at
UNISA for allowing me to use their data, Mr Andries Masinge for the statistical
assistance he rendered, the editor (Lauma Cooper) for the critical reading and language
editing, and the Lord my savior, without whom this wouldn’t have come to pass.
■ 1! 1! I- it: il . i !
0 0 0 1 9 1 6 4 9 8
DECLARATION
I, the undersigned, hereby declare that this dissertation entitled, ‘The relationship
between diversity management and organisational climate”, is my own work, and that all
the sources that I have used or quoted have been indicated and acknowledged by
means of complete references.
Tsedile E. Tjale Date
iii
TABLE OF CONTENTS
Acknowledgements i
Declaration ii
List of figures x
List of tables xi
Summary xiii
Key terms xiv
CHAPTER 1: INTRODUCTIOM TO THE STUDY
1.1 Introduction 1
1.2 Background to and motivation for the study 1
1.3 Problem statement 3
1.4 Objectives of the study 4
1.4.1 General objective 4
1.4.2 Specific objectives 4
1.5 The paradigm perspective 5
1.5.1 Assumptions 5
1.5.1.1 Humanistic assumptions 5
1.5.2 Research hypotheses 6
1.6 Research design 7
1.7 Empirical research 8
1.8 Outline of the study 8
1.9 Chapter summary 9
iv
CHAPTER 2: ORGANISATIONAL CLIMATE
2.1 Introduction 10
2.2 Conceptualisation of organisational climate 10
2.3 Defining organisational climate 12
2.4 The relationship between organisational climate
organisational culture 13
2.4.1 A comparison between organisational climate and
organisational culture 14
2.4.1.1 Conceptual considerations 14
2.4.1.2 Methodological considerations 16
2.5 The relationship between organisational climate
and job satisfaction 19
2.6 Dimensions of organisational climate 21
2.7 Elements in the organisation contributing to a positive
organisational climate 26
2.8 Chapter summary 27
CHAPTER 3: DIVERSITY MANAGEMENT
3.1 Introduction 28
3.2 Defining diversity management 28
3.3 Approaches to diversity management 30
3.3.1 Approaches identified by Svehla (1994) 30
3.3.1.1 Affirmative action 30
3.3.1.2 Valuing differences 31
3.3.1.3 Diversity management 31
3.3.2 The integrated approach to diversity 31
3.3.3 Perspectives identified by Lorbiecki (2001) 33
33
33
33
34
35
36
37
37
37
37
38
38
38
39
39
39
40
40
40
41
41
41
43
45
45
47
47
49
v
Resistance
Discrimination and fairness
Access and legitimacy
Learning and effectiveness
Carr-Ruffino’s approaches to diversity management (1999)
Approach utilised in South Africa
Positive and negative effects of managing diversity
Positive effects of managing diversity
Problem-solving and decision-making
Creativity and innovation
Organisational flexibility
Human talent
Marketing strategy
Reducing costs
Perceived negative effects of managing diversity
Devaluation of employees
Diversity impairs organisational effectiveness
Women lack commitment to employment
The disabled drive up employment costs
Older workers have little potential for payback
The relationship between diversity management,
employment equity and affirmative action
Clarification of concepts
Comparison between diversity management,
employment equity and affirmative action
Models of diversity management
Managing cultural diversity: a proactive approach
An integrative model of effective diversity management
CEO initiation and continuation
Transformation of the human resources function
vi
3.6.2.3 Individual level outcomes and attitudes towards diversity 49
3.6.2.4 Organisational outcomes and public recognition 50
3,6.2.5 Ethical outcomes 50
3.6.3 A model for managing culturally diverse organisations 50
3.6.3.1 Motivational process 52
3.6.3.2 The interaction process 52
3.6.3.3 The visioning process 52
3.6.3.4 The learning process 53
3.6.4 Change model for work on diversity 53
3.6.4.1 Leadership 55
3.6.4.2 Research and measurement 55
3.6.4.S Education 55
3.6.4.4 Alignment of management systems 55
3.6.4.5 Follow up 56
3.7 Organisational climate and diversity management 56
3.7.1 Positive climate for diversity model, Hicks-Clarke
and lies (2000) 60
3.8 Chapter summary 62
CHAPTER 4: EMPIRICAL RESEARCH
4.1 Introduction 63
4.2 Objectives of the study 63
4.3 Sample identified 63
4.3.1 Race composition of the sample 64
4.3.2 Composition of the gender group in the sample 65
4.3.3 Composition of the age group in the sample 65
4.3.4 Composition of the years of service in the sample 66
4.3.5 Composition of the employment status groups in the sample 67
4.4 The research instrument 67
4.4.1 Rationale and background 68
4.4.2
vii
Objective of the research instrument 68
4.4.3 Contents of the questionnaire 68
4.4.4 Dimensions measured 69
4.4.5 Validity and reliability of the questionnaire 70
4.4.5.1 Validity 70
4.4.S.2 Reliability 71
4.4.6 Justification for using the instrument 73
4.5 Data collection 73
4.6 Data analysis and statistical analysis method 73
4.6.1 Factor analysis 74
4.6.2 Item analysis 75
4.6.3 Correlation 75
4.6.4 T-tests 75
4.6.5 One-way ANOVA 76
4.6.6 Effect size and power of a test 76
4.6 Chapter summary 77
CHAPTER 5: DATA ANALYSIS AND iNTERPRETATSOM
5.1 Introduction 78
5.2 Factor analysis 78
5.2.1 Naming of factors 80
5.2.2 Naming of the second order factors for factor 1 83
5.2.3 Discussion of results: factor analysis 84
5.3 Reliability 85
5.3.1 Discussion of the results: reliability analysis 86
5.4 Correlation 87
5.4.1 Correlation between diversity management
and all organisational climate dimensions 87
5.4,2 Correlation between diversity management
and the individual organisational climate dimensions 89
viii
5.5 T-tests 93
5.5.1 Effect size and power of the t-test 93
5.5.2 Difference between males and females on their view of
diversity 93
5.6 One-way ANOVA 94
5.6.1 One-way ANOVA between diversity management
and the age groups 95
5.6.2 One-way ANOVA between diversity management
and years of service 96
5.6.3 One-way ANOVA between diversity management
and race 98
5.6.4 One-way ANOVA between diversity management
and employment status 101
5.7 Integration and interpretation of the results 105
5.8 Chapter summary 107
CHAPTER 6:'CONCLUSIONS, LIMITATIONS AND RECOMMENDATIONS
6.1 Introduction 108
6.2 Conclusions 108
6.2.1 Conceptualisation of organisational climate 108
6.2.2 Conceptualisation of diversity management 109
6.2.3 Integration of the concepts organisational
climate and diversity management 110
6.2.4 The relationship between organisational climate
and diversity management 111
6.3 Limitations 112
6.4 Recommendations 113
6.5 Chapter summary 115
REFERENCE LIST 116
ix
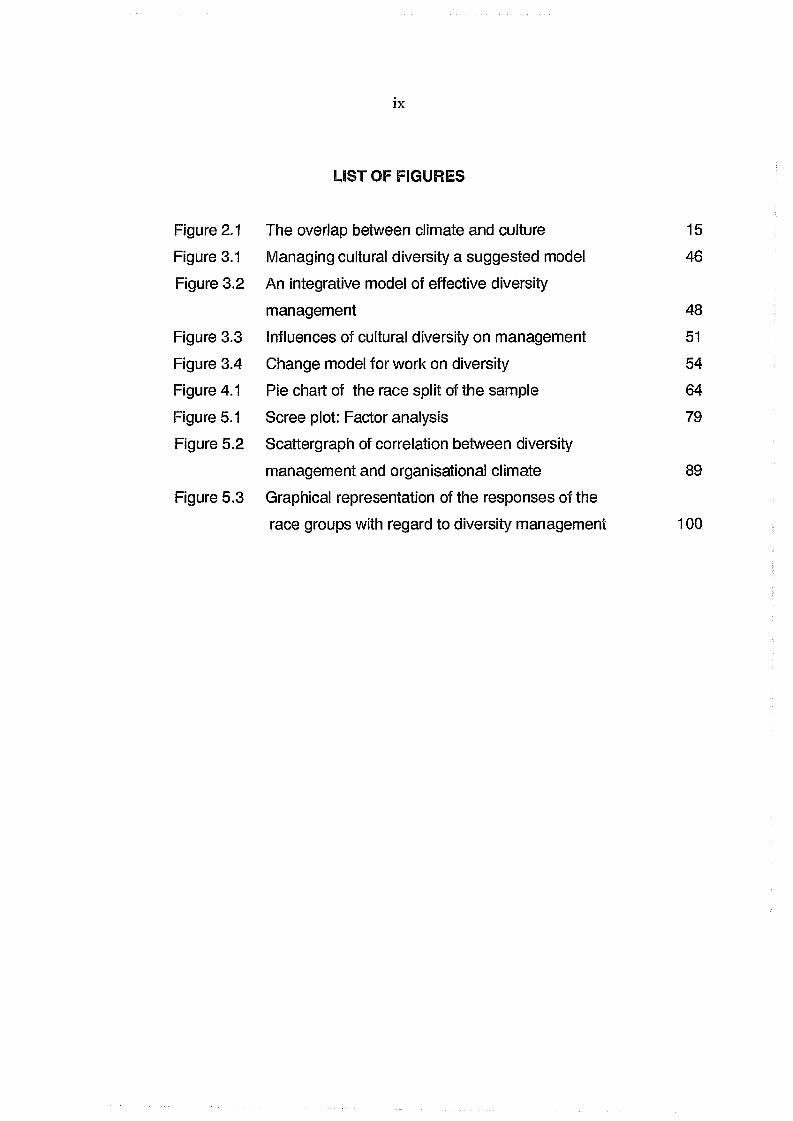
LIST OF FIGURES
Figure 2.1 The overlap between climate and culture 15
Figure 3.1 Managing cultural diversity a suggested model 46
Figure 3.2 An integrative model of effective diversity
management 48
Figure 3.3 Influences of cultural diversity on management 51
Figure 3.4 Change model for work on diversity 54
Figure 4.1 Pie chart of the race split of the sample 64
Figure 5.1 Scree plot: Factor analysis 79
Figure 5.2 Scattergraph of correlation between diversity
management and organisational climate 89
Figure 5.3 Graphical representation of the responses of the
race groups with regard to diversity management 100
24
25
35
44
64
65
66
66
67
72
80
85
86
88
90
94
x
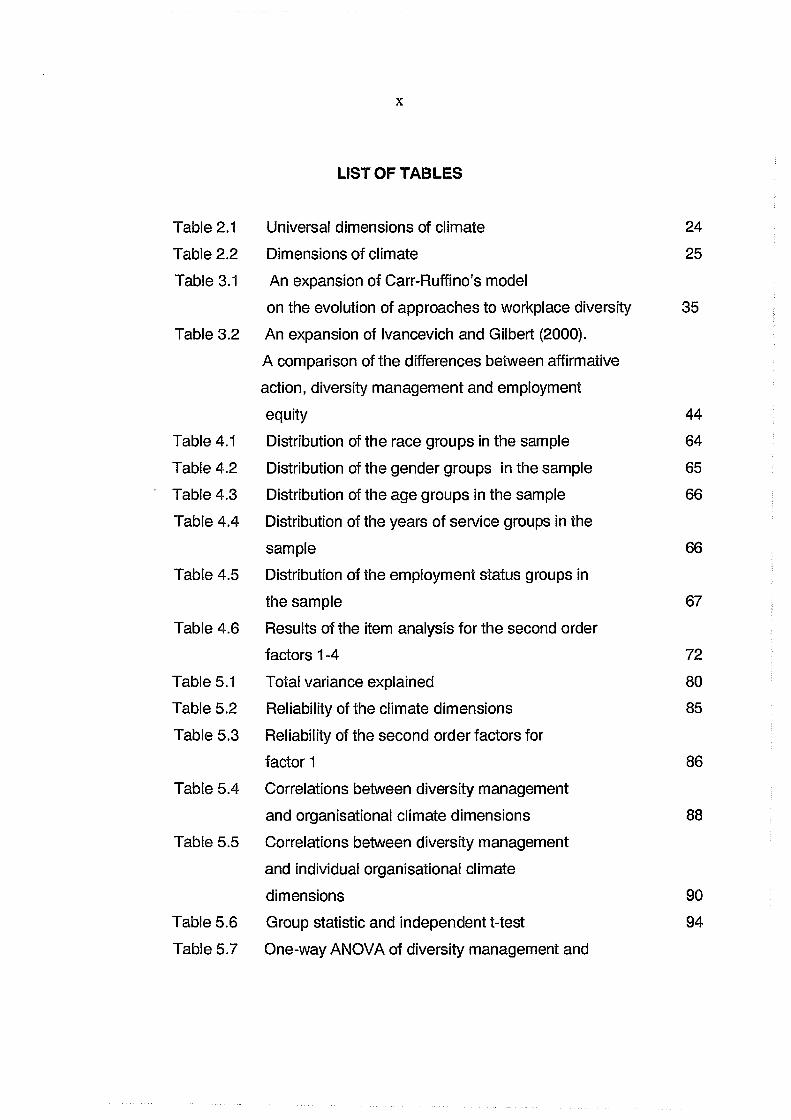
LIST OF TABLES
Universal dimensions of climate
Dimensions of climate
An expansion of Carr-Ruffino’s model
on the evolution of approaches to workplace diversity
An expansion of Ivancevich and Gilbert (2000),
A comparison of the differences between affirmative
action, diversity management and employment
equity
Distribution of the race groups in the sample
Distribution of the gender groups in the sample
Distribution of the age groups in the sample
Distribution of the years of service groups in the
sample
Distribution of the employment status groups in
the sample
Results of the item analysis for the second order
factors 1 “4
Total variance explained
Reliability of the climate dimensions
Reliability of the second order factors for
factor 1
Correlations between diversity management
and organisational climate dimensions
Correlations between diversity management
and individual organisational climate
dimensions
Group statistic and independent t-test
One-way ANOVA of diversity management and
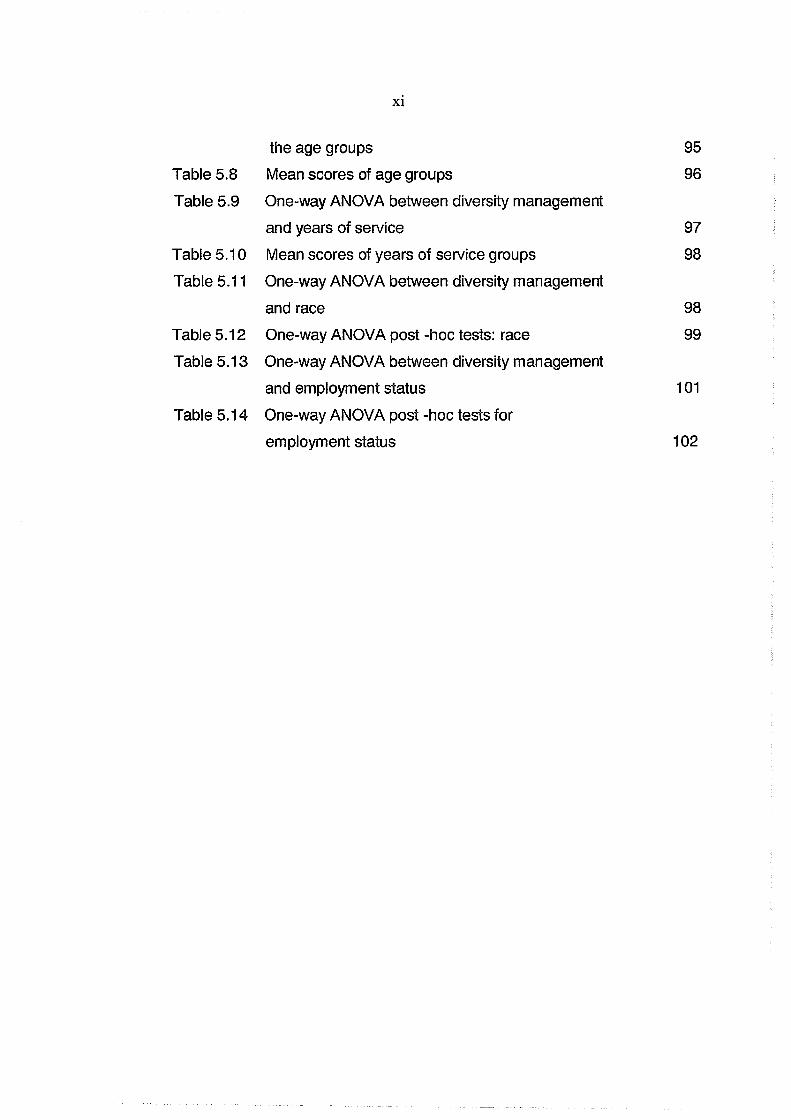
xi
the age groups 95
Table 5.8 Mean scores of age groups 96
Table 5.9 One-way ANOVA between diversity management
and years of service 97
Table 5.10 Mean scores of years of service groups 98
Table 5.11 One-way ANOVA between diversity management
and race 98
Table 5.12 One-way ANOVA post -hoc tests: race 99
Table 5.13 One-way ANOVA between diversity management
and employment status 101
Table 5.14 One-way ANOVA post -hoc tests for
employment status 102
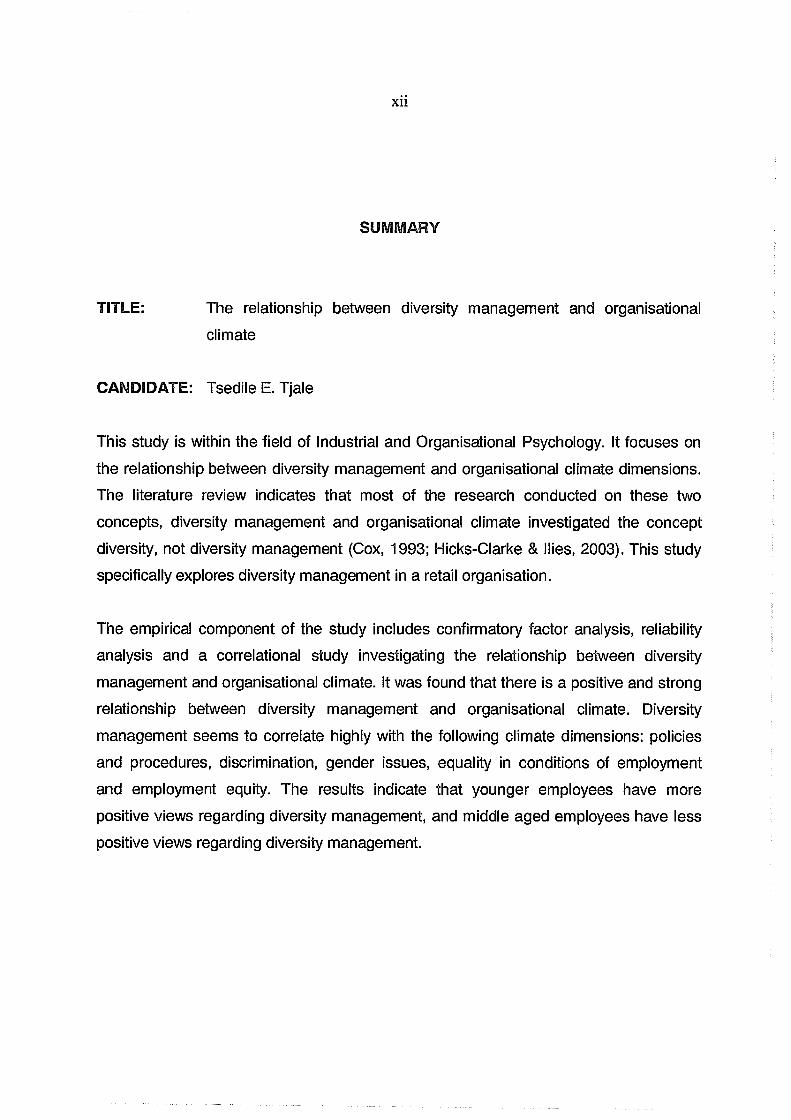
SUMMARY
TITLE: The relationship between diversity management and organisational
climate
CAMDiDATE: Tsedile E, Tjale
This study is within the field of Industrial and Organisational Psychology. It focuses on
the relationship between diversity management and organisational climate dimensions.
The literature review indicates that most of the research conducted on these two
concepts, diversity management and organisational climate investigated the concept
diversity, not diversity management (Cox, 1993; Hicks-Clarke & Hies, 2003). This study
specifically explores diversity management in a retail organisation.
The empirical component of the study includes confirmatory factor analysis, reliability
analysis and a correlational study investigating the relationship between diversity
management and organisational climate. It was found that there is a positive and strong
relationship between diversity management and organisational climate. Diversity
management seems to correlate highly with the following climate dimensions: policies
and procedures, discrimination, gender issues, equality in conditions of employment
and employment equity. The results indicate that younger employees have more
positive views regarding diversity management, and middle aged employees have less
positive views regarding diversity management.
Key Terms:
Organisational climate; diversity management; organisational culture; job satisfaction;
affirmative action; valuing differences; employment equity; discrimination; fairness;
diversity management models.
CHAPTER 1
INTRODUCTION TO THE STUDY
1.1 INTRODUCTION
This study focuses on the relationship between diversity management and
organisational climate. Diversity management and organisational climate will be defined
and the integration of the two concepts investigated.
An empirical study will be carried out that explores the relationship between diversity
management and organisational climate. The purpose of this investigation is to
determine whether there is a relationship between the two concepts and to determine
the impact of diversity management on the perceptions of employees in the
organisation.
This study will further investigate the perceptions of diversity management of the
following biographical groups: race group, gender group, age group, years of service
group and employment status group.
1.2 BACKGROUND TO AND MOTIVATION FOR THE STUDY
South Africa is a heterogeneous society, and the diversity in the society has a spillover
effect in organisations. This is more the case since the inception of the democratic
government that introduced legislation such as Employment Equity Act No. 55 of 1998.
According to section 2 of this Act, its aim is to ensure equal representation and
treatment of the previously disadvantaged in the workplace. Managers are facing
challenges of a diverse workforce (Certo, 1994). According to Hays-Thomas (2004:13),
demographic trends indicate that more women, previously disadvantaged populations
and older people have entered the workforce since 2000. This has brought about the
need for organisations to manage diversity. This is clearly indicated in a validation study
1
conducted by Martins and Von der Ohe (2003) of a climate instrument. During the
validation process it was decided to add diversity as a dimension, as it reflects the
changing work environment (demographics).
This phenomenon is not only a reality in South Africa but is occurring throughout the
world. Diversity management has become very important in most countries over the last
twenty years (Lauring & Ross, 2004; Robbins, 2001). Although the rest of the world has
been aware of the need for organisations to manage diversity, this has only recently
become a reality in South Africa. Diversity management is one of the most important
and broad-based challenges facing a diverse workforce (Robbins, 2001). The debate on
diversity management has moved from an initial focus of overcoming discriminatory
employment practices to a business case view that justifies diversity management and
employment equity opportunity programmes as increasing organisational efficiency and
competitive advantage (Lauring & Ross, 2004).
The concept “diversity management” evolved from affirmative action where the
emphasis was on the legal obligation placed on organisations to ensure representation
of the previously disadvantaged (minorities), and affirmative action was regarded as a
recruitment tool. This was followed by the valuing differences approach to diversity
management, which emphasises the importance of understanding, respecting and
valuing the differences among employees (Harrington, 1993; Svehla, 1994). According
to Thomas (1997:42) valuing of differences is regarded as “a generic approach aimed at
bringing about greater understanding and acceptance of people who are different,
enhancement of interpersonal relationships and the minimisation of blatant expression
of racism and sexism”. The diversity management approach investigated in this study
focuses on using the first two approaches, namely affirmative action and valuing
differences to maximise the benefits of a diverse workforce (Lauring & Ross, 2004).
2
The focus of the current study is to determine the relationship between diversity
management and organisational climate. It is assumed that if organisations attempt to
manage diversity as a process that is driven from the top, it will have a positive effect on
the climate of the organisation. Climate provides organisations with information of how
persons within those organisations perceive the organisations and the environment, and
transforms them into psychologically meaningful sub-units. Organisations can attempt to
manage diversity, but do those efforts have a positive effect on the way the employees
perceive the organisation?
1.3 PROBLEM STATEMENT
Hansen (2003), Thomas, Mack and Montegliani (2004) and Von Bergen, Soper and
Foster (2002) are of the opinion that the value added by a diverse workforce is
unfounded, contending that diversity just adds new faces of people that are unable to
perform their tasks. This might be due to their lack of experience and disability, and this
leads to loss in earnings for the organisation. The argument here is: are their allegations
speculative or is this only happening in those organisations that do not manage
diversity?
The researcher makes the assumption that those organisations that actively manage
diversity as a strategically driven approach by trained professionals will reap the
benefits, one of which is a positive impact on the climate of the organisation.
Cox (1993), Hicks-Clarke and lies (2000) and Kossek and Zonia (1993) studied the
relationship between diversity and organisational climate and found that for diversity to
work in organisations, a positive climate needs to be in place. Kossek and Zonia (1993)
contend that climates are influenced by equal opportunities policies, access to
resources and opportunities in the organisation, and how individuals and groups view
those policies. Certo (1994) asserts that management of diversity leads to an
organisational climate that is receptive to a diverse workforce. Managers in
organisations need to recognise and value the differences among members of a
3
workforce and actively seek to create a working environment that enables each person
to maximise his or her potential (Dobbs, 1996). It appears there is a link between
diversity management and organisational climate. As a result the researcher will explore
the nature of the relationship between diversity management and organisational climate.
The researcher builds on the work of Hicks-Clarke and lies (2000), which focused on
creating a positive climate for diversity, by focusing on the management of diversity.
This study will enable practitioners to develop interventions that will assist them in
devising effective programmes in diversity management that will impact positively on the
subgroups in a diverse workforce.
1.4 OBJECTIVES OF THE STUDY
The general objective of this study is to explore the relationship between diversity
management and organisational climate.
1.4.1 General objective
To explore and to determine the relationship between diversity management and
organisational climate.
1.4.2 Specific objectives
The specific literature objectives of this research are to:
• conceptualise “organisational climate”
• conceptualise “diversity management5
• theoretically integrate the concepts “organisational climate” and “diversity
management”.
4
The specific empirical objectives of this study are to:
• determine the relationship between organisational climate and diversity
management
• determine whether there are any differences between the different biographical
groups such as gender, race, age, years of service and employment status with
regard to their views of diversity management in their organisation.
1.5 THE PARADIGM PERSPECTIVE
Mouton and Marais (1988) regard a paradigm as a collection of meta-theoretical,
theoretical and methodological beliefs that have been selected from the intellectual
climate and the market of intellectual resources of a particular discipline. The present
study is in the field of Industrial and Organisational Psychology. In this study the
researcher adopted the humanistic perspective.
1.5.1 Assumptions
1.5.1.1 Humanistic assumptions
The humanistic perspective is based on the following assumptions (Meyer, More &
Viljoen, 1989):
• The individual is an integrated whole.
The current study focuses on the perceptions of individuals in an organisation as a
collective. It goes beyond exploring the views of individuals of that unit, taking into
consideration the impact of the collective on the individual.
5
• The individual is a dignified human being.
Human beings have qualities that distinguish them from other objects such as stones
and trees. The current study is interested in the population sample’s opinions and
perceptions.
• Human nature is positive.
People are basically good and their destructive behaviour is due to environmental
influences such as unemployment, poverty, favouritism, discrimination and racism.
• The individual has conscious processes.
Individuals’ decisions are dictated by conscious processes. This is the focus of the
study and a climate questionnaire will be used to obtain information about the way the
employees perceive the organisation.
The individual is an active being.
Individuals are active participants in life, make choices and are responsible for the
course their life takes. Hence the respondents’ inputs will be obtained by asking them
their perceptions and those of their supervisors.
1.5.2 Research hypotheses
Hypothesis 1
H 0: There is no relationship between diversity management and organisational
climate.
H 1: There is a positive relationship between diversity management and
organisational climate
6
The current study assumes that there is a positive relationship between organisational
climate and diversity management. According to Hicks-Clarke and lies (2000), an
organisation that actively manages diversity will result in a more effective organisation.
• Organisations are made up of people. For organisations to thrive, they need
employees.
Alternative Hypothesis
H 0: There is no difference in the views of the following biographical groups with
regard to diversity management in the organisation: gender, race, age, years of
service and employment status.
H 1: There is a difference in the views of the following biographical groups with regard
to diversity management in the organisation: gender, race, age, years of service
and employment status.
1.6 RESEARCH DESIGM
Mouton and Marais (1988) regard research design as the process of organising the
collection, analysis and interpretation of information.
The research variables in this study are diversity management and organisational
climate. Diversity management in this study is considered to be the independent
variable and organisational climate is the dependent variable. The type of research is
explorative and descriptive. The unit of analysis in this study is the individual, though in
an organisation setting. In ensuring the validity of the study factor analysis was
conducted and to warrant reliability of the study internal consistency of the study was
determined. In meeting the main objective of the study a correlation study was
conducted, T-test was conducted to determine the views of males and females on
diversity management, One-way ANOVA was conducted on the following biographical
groups to determine their views on diversity management, employment status, race,
7
age and years of service. Data for this study was collected by the Centre for Industrial
and Organisational Psychology at the University of South Africa (Unisa) as part of a
project they undertook. The aim of the project was to validate a climate questionnaire.
Factor analysis and item analysis were conducted.
1.7 EMPIRICAL RESEARCH
The researcher will conduct a literature review on organisational climate, diversity
management, and the integration of the two concepts.
The study will be explorative and descriptive. It would involve data analysis, the
reporting the findings, interpretation of the findings, arriving at conclusions, discussing
the limitations of the study, and making recommendations based on the findings and for
further research.
1.8 OUTLIME OF THE STUDY
Chapter 1 describes the purpose of the study, the background to the problem and the
research design and methodology.
Chapter 2 conceptualises organisational climate.
Chapter 3 conceptualises diversity management and the integration of the concepts,
organisational climate and diversity management.
Chapter 4 describes the quantitative research conducted.
Chapter 5 presents the findings of the study.
Chapter 6 concludes the study, discusses its limitations and makes recommendations
for future study.
8
1.9 CHAPTER SUMMARY
This chapter introduced the study, outlined the problem and stated the objectives of the
study. The research design and methodology were also discussed. Chapter 2 deals with
the literature review on the concept “organisational climate”.
9
CHAPTER 2
ORGANISATIONAL CLIMATE
2.1 INTRODUCTION
The construct climate is important to an organisation because it provides information on
how people in the organisation perceive the organisation and the environment, and
transforms this information into psychologically meaningful sub-units (Guion, 1973;
McMurray, 2003; Reichers & Scheinder, 1990). Lindell and Brandt (2000) state that
climate affects climate outcomes at individual and organisational level.
This chapter will focus on the theoretical discussion of organisational climate, by trying
to conceptualise organisational climate through defining organisational climate, its
dimensions, the relationship between organisational climate and culture, the relationship
between organisational climate and job satisfaction, and elements contributing to a
positive organisational climate.
2.2 CONCEPTUALISATION OF ORGANISATIONAL CLIMATE
Forehand and Gilmer (as cited in James & Jones,1974) identified three mutually
exclusive approaches to organisational climate, namely the multiple measurement
organisational attribute, perceptual measurement organisational attribute, and
perceptual measurement individual attribute approaches.
The first approach is the multiple measurement organisational attribute approach, which
regards organisational climate as a set of organisational characteristics or main effects.
Organisational climate variables are both independent variables that can be
manipulated and dependent variables that form a basis of organisational comparisons.
Forehand and Gilmer (as cited in James & Jones, 1974) describe organisational climate
according to the multiple measurement organisational attribute approach as
10
characteristics that describe an organisation and distinguish the organisation from other
organisations, are relatively enduring over time and influence the behaviour of people in
the organisation. According to this approach, perceptual measures of individual
responses are captured by means of a questionnaire and are acceptable provided
individual differences (different perceptions of individuals in the same organisation) are
avoided or at least controlled.
The second approach is the perceptual measurement organisational attribute approach,
which views organisational climate strictly as a set of perceptual variables based upon
individual perceptions of the organisational situation. For example, questionnaires are
used to collect information that reflects the influence of the individual’s characteristics,
such as personality and aptitude, as well as the influence of the individual’s previous
experiences in the organisation, such as success and lack of success (Forehand &
Gilmer as cited in James & Jones, 1974).
The perceptual measurement organisational attribute approach is a variable that may
be used to represent the differences between organisations or the organisation’s
subunits and therefore is employed as an organisational main effect. The perceptual
measurement organisational attribute approach regards organisational climate as a set
of characteristics specific to a particular organisation that may be induced from the way
the organisation deals with its members and its environment. For individual members in
an organisation, climate takes the form of a set of attitudes and expectations that
describe the organisation in terms of constant characteristics. The dimensions used by
the perceptual measurement organisational attribute approach are individual autonomy,
degree of structure imposed upon the position, reward orientation and consideration,
warmth and support (Forehand & Gilmer as cited in James & Jones, 1974).
The third approach is the perceptual measurement individual attribute approach, which
views organisational climate as a perceptual measure based upon the interaction
between the actual situation and individual characteristics. The perceptual
measurement individual attribute approach regards organisational climate as a purely
11
individual attribute, namely an intervening set of variables where the place of
intervention is between the actual situation and individual behaviour and attitudes. A
major emphasis of this approach is that it is not the objective situation that is of major
importance in determining behaviour and attitudes, but rather the individual’s perception
of the situation that determines his or her reaction to it. According to the perceptual
measurement individual attribute approach organisational climate is regarded as a
situation where the perceptions of individuals are taken into consideration, not how
others might choose to describe the perceptions (Scheinder as cited in James & Jones,
1974).
Research in this area is often concerned with the micro-aspect of climate, namely
perceptions of the job. The level of explanation is often the prediction of the individual’s
behaviour and attitudes rather than the differences between organisations or sub-units
(Forehand & Gilmer as cited in James & Jones, 1974).
2.3 DEFINING ORGANISATIONAL CLIMATE
Forehand and Gilmer as cited in Tustin (1988) define organisational climate as “a set of
characteristics that distinguish the organisation from other organisations, these
characteristics are enduring over time and they influence the behaviour of people in the
organisation”.
Reichers and Scheinder (1990:22) consider organisational climate to be broadly defined
“as the shared perception of the way things are done around here”. More precisely
climate is the shared perception of organisational policies, practices and procedures
both formal and informal.
□twin and Stringer as cited in Al-Shammari (1992) regard organisational climate as a
“set of measurable properties of the work environment, perceived directly by people
who live and work in this environment and assumed to influence their motivation and
12
behaviour”. Scheinder, Bowen and Ehrhart (2000:23) define climate as “a set of
behaviours and attitudes, but existing as an abstraction of those behaviours and
attitudes”. Lindell and Brandt (2000) state that the conceptualisation of climate implies
that it can be multidimensional concepts with dimensions that are found in other
organisations. Schmidt, Wood and Lugg (2003:4) define climate as “individual
descriptions of the social setting or context which the person is a part of and as such
climate is a collection of an individual’s perceptions about a wide range of concepts
within a particular context”.
For the purposes of this study, then, organisational climate will refer to a set of
characteristics that describe an organisation and its sub-systems which can be
perceived positively or negatively by its members from the way the organisation deals
with its members, behaviour in the organisation, structures, processes, policies and its
internal and external environment.
2.4 THE RELATIONSHIP BETWEEN ORGANISATIONAL CLIMATE AND
ORGANISATIONAL CULTURE
There is no general consensus on the relationship between organisational climate and
organisational culture. Ashe, Joyce and Scolum and James and Jones (both cited in
Reichers & Scheinder, 1990) argue that climate is a separate phenomenon from culture.
Maxwell and Thomas (1991), McMurrary (2003) and Turnipseed (1988) maintain that
there is blurring between organisational culture and organisational climate caused by
issues such as belief systems which are regarded as central to organisational climate.
Belief systems are derived from the prevailing value systems, which are associated with
organisational culture. The argument here is that climate and culture are the same.
13
2.4.1 A comparison between organisational climate and organisational culture
2.4.1.1 Conceptual considerations
Scheirt (1985:6) defines culture as “learned responses to the group’s problems of
survival and internal integration”, These responses are subconscious, taken for granted
and shared by members of the social unit. Culture is regarded as the way of perceiving,
thinking and feeling in relation to the group’s problems (Schein, 1985). Schein (1985:9)
describes organisational culture as:
a pattern of basic assumptions that a given group invented, discovered or
developed in learning to cope with its problems of external adaptation and
internal integration and that have worked well enough to be considered valid and
therefore to be taught to new members as the correct way to perceive, think and
feel as related to those problems.
Climate refers to members’ perceptions of the way things are, but the perception
includes the idea; meaning is attached to the perceived event or thing. Hicks-Clarke and
lies (2000:2) assert that climate “is the atmosphere that employees perceive is created
in their organisation by practices, procedures and rewards”. Employees cluster their
organisational experiences and events into meanings, and this forms the basis of
organisational climate (Hicks-Clarke & lies, 2000).
Organisational climate is a moderately enduring characteristic of an organisation while
culture is a highly enduring characteristic of an organisation. Culture evolves slowly,
climate evolves out of the same elements as culture but in terms of organisational
realities, more shallow, due to the fact that it forms quickly and changes easily (Hick-
Clarke & lies, 2000; Moran & Volkwein, 1992). McMurray (2003) indicates that culture is
likely to persist over time and climate is the assessment of these elements at any given
moment, (see figure 2.1).
14
Climate is measured through perceptual data. It indicates that the construct is one in
which the traces of the unique characteristics of the perceiver are still evident in the
analysis. Culture is thoroughly embedded in a kind of collective unconsciousness that
exists apart from the reflected variations of individuals in that culture (Moran &
Volkwein, 1992).
Moran and Volkwein (1992) regard organisational climate as an organisationally created
response, which an interacting group of individuals who are informed and constrained
by a common organisational culture make demands on the organisation and
contingences arising in the organisation’s internal and external environments.
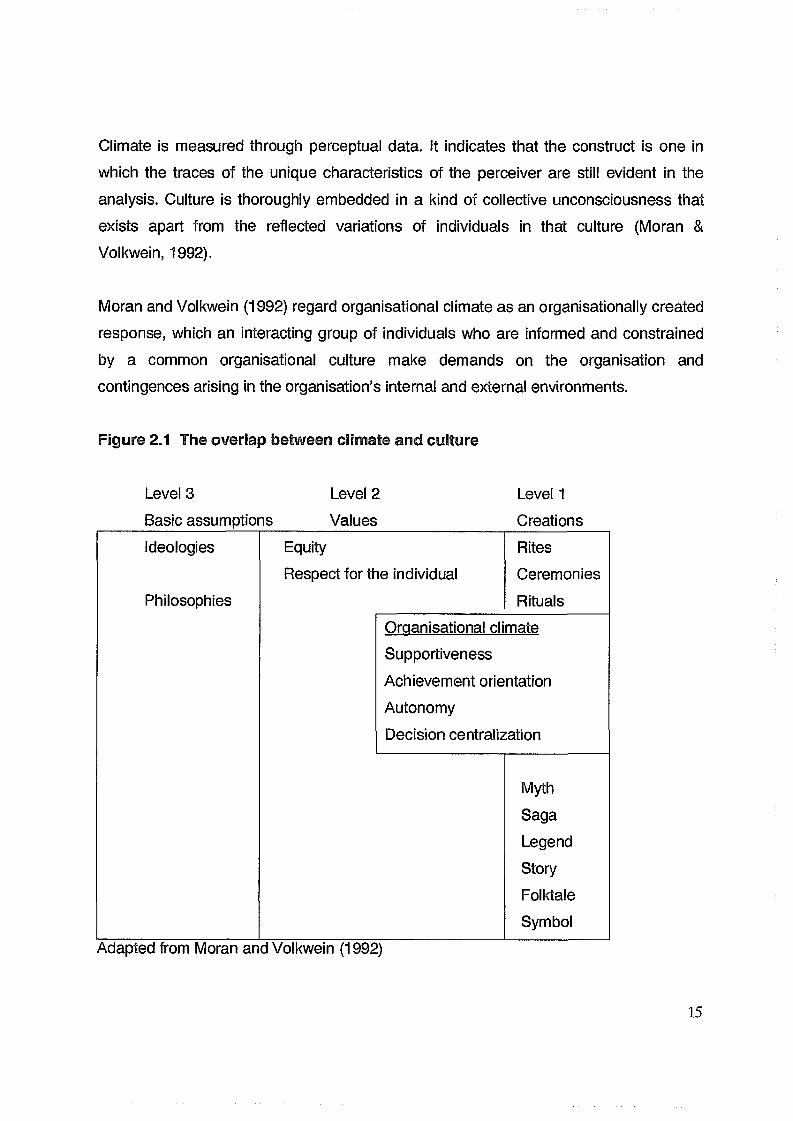
Figure 2.1 The overlap between climate and culture
Level 3 Level 2 Level 1
Basic assumptions Values Creations
Ideologies
Philosophies
Equity
Respect for the individual
Rites
Ceremonies
Rituals
Oraanisational climate
Supportiveness
Achievement orientation
Autonomy
Decision centralization
Myth
Saga
Legend
Story
Folktale
Symbol
Adapted from Moran and Volkwein (1992)
15
Figure 2.1 indicates that climate intersects culture (at level 1 and part of level 2),
creations and values which are immediately experienced by the individual. Climate
exists at a level of awareness at which the perceiver can express reactions to
immediate organisational realities (Moran & Volkwein, 1992).
Climate is the way in which structures of culture are demonstrated in the interplay
between situational contingencies, interacting group members and the culture itself.
Culture itself is also dynamic; it changes slowly (unlike organisational climate) because
of this interplay (Moran & Volkwein, 1992).There is a clear overlap between the two
concepts. Climate and culture are in a reciprocal process, the one causing the other in
an endless cycle over time (McMurray, 2003; Moran & Volkwein, 1992).
Moran and Volkwein (1992) regard climate and culture as related terms. The climate of
an organisation is heavily influenced by its culture and the perception of organisation
practices by individuals in the organisation.
O’Reilly, Chapman and Caldwell (1991) found that the dimensions in organisational
culture profile were similar in many respects to the dimensions of climate. Wallace,
Hunt and Richards (1999) indicate that there is a relationship between culture, climate
and managerial values.
The researcher concludes that there is a relationship between organisational climate
and organisational culture, but these two constructs are not the same and
acknowledges that climate evolved from culture, hence they are reciprocally related.
2.4.1.2 Methodological considerations
Sparrow and Gaston (1996) indicate that climate in the researcher’s frame of reference
is regarded as a psychological schema based on latent personal values, for example
individual or personal constructs, which can be aggregated across organisations.
16
The unit of theory in climate research is the individual and shared psychological fields
that give way to common sets of standards and expectations for behaviour. In climate
research, the level of analysis varies from the individual through to aggregate measures
of consensus at the work group, division or organisational level. The elements of
analysis for climate researchers are shared and learned perceptions that result from
formal and informal organisational policies, practices and procedures, goals and the
means of their attainment. Climate researchers tap into the consciousness of these
learned responses and acquired meanings (Sparrow & Gaston, 1996)
Culture researchers’ frame of reference is group understandings (interpreted schema or
ways of perceiving, thinking or feeling in relation to a group’s problems). The level of
analysis in culture research is always the collective group. Culture focuses on deeper
levels of analysis, such as the shared meanings, assumptions and values that underlie
these organisational policies. Organisational culture taps into sub-consciousness
(Sparrow & Gaston, 1996).
Turnipseed (1988) indicates that climate is a quantifiable concept whereas
organisational culture is qualitative by nature therefore less tangible. Climate
researchers use quantitative procedures to conduct research. Despite this Reichers and
Scheinder (1990) suggests that climate should also be measured using qualitative
methods that may result in richer, more useful descriptions of organisations.
Culture is measured using qualitative procedures such as in-depth interviews. Culture
researchers have rarely advocated or used quantitative approaches to study this
concept (Reichers & Scheinder, 1990). Denison (1996) also indicates that culture has
long been studied qualitatively using field observations and climate studied
quantitatively using survey data. Reichers and Scheinder (1990) states that, quantitative
procedures should be used together with qualitative methods to study both these
concepts.
17
According to Reichers and Scheinder (1990), ciimate and culture could benefit from a
continued focus on practical application. These two concepts are important because in
combination they can specify, and fairly predict the context of human behaviour in
organisations. Analysis of the context allows researchers to describe, explain and even
predict behaviour in a variety of circumstances.
Scheinder, Bowen and Ehrhart (2000) state that culture can be studied using qualitative
methods and is based on values and assumptions that people have of the organisation.
Culture originates from the disciplines of Social Anthropology and Sociology. Climate
lends itself more to quantitative methodology and is based on the consensus of
perceptions of the people in the organisation. Climate originates from the discipline of
psychology (Scheinder, Bowen & Ehrhart, 2000).
McMurray (2003) explored the relationship between organisational climate and
organisational culture. Climate was surveyed using a quantitative questionnaire, and
with culture an inductive approach was followed, as it was important to obtain
organisational members’ interpretations of significant events.
Culture is regarded as being at a higher level of abstraction and culture captures
additional direct and indirect influences on behaviour. Climate is at a lower level of
abstraction, and this justifies the use of qualitative and quantitative methods,
respectively (McMurray, 2003).
In the light of the above, the researcher is of the opinion that when researching
organisational culture and organisational climate it should not be limited to a specific
method.
18
2.5 THE RELATIONSHIP BETWEEN ORGANISATIONAL CLIMATE AND JOB
SATISFACTION
The relationship between organisational climate and job satisfaction is debated among
researchers in the field of Industrial and Organisational Behaviour. Guion (1973), states
that there is an overlap between organisational climate and job satisfaction. Guion
(1973) regards climate as an indistinct construct from job satisfaction, to the extent that
Guion claims that organisational climate borrowed from established measures
(instruments) of job satisfaction.
Johannesson (as cited in Tustin, 1988) states that firstly, instead of attempting to write
items that are unique to climate, climate researchers have borrowed items from
established satisfaction measures and this has resulted in similar measures being used
to evaluate job satisfaction and climate. Secondly, redundancy may exist because of
identical methods of measurement being employed for perception of climate and job
satisfaction.
In an attempt to investigate Johannesson’s claim, Lafollatte and Sims (as cited in
Tustin, 1988) sampled 1161 employees of a major medical centre and found that
correlations between organisational climate, job satisfaction and job performance vary
extremely. As a result Johannesson’s conclusion of redundancy is premature and
judgemental. In defence of climate research, Al-Shammari (1992) indicates that there is
evidence to suggest that while climate and job satisfaction concepts tend to be related,
but they are different constructs. Al-Shammari (1992) states that individuals with
different work values are more satisfied in different types of climate, and that individuals’
satisfaction with various aspects of their work depend on certain combinations of
climate components.
In an attempt to resolve the issue raised by Guion (1973), that organisational climate is
indistinct from job satisfaction, Scheinder and Synder (as cited in Tustin, 1988)
19
distributed an organisational climate and job satisfaction instrument to 522 managerial
and non-managerial employees from 55 life insurance companies. One of the main
findings was that there was a higher level of agreement among employees about the
climate of their organisation than about their level of job satisfaction. This means that if
climate and job satisfaction were the same thing, the level of agreement between these
two concepts would be the same. The above research attempts to prove that
organisational climate and job satisfaction are related, but are not the same construct.
This is further proven by Joyce and Slocum (as cited in Tustin, 1988) as they provided a
useful way of distinguishing climate from job satisfaction based on the idea of affect.
According to Joyce and Slocum (as cited in Tustin, 1988), organisational climate is
regarded as a perceptual description of work setting and job satisfaction as an affective
evaluation aspect of work setting. These two constructs refer to the aspect of work
settings, and that the process of describing and evaluating these two constructs are
different. For example, in measuring job satisfaction the scale used would use words
like ‘favourable” versus “unfavourable”, “good” versus “bad” and “positive” versus
“negative”. In measuring climate perceptions the words used in job satisfaction scales
are avoided instead a climate scale uses words such as “high” versus “low”. Climate is
regarded as the perceptual description of the work environment whereas job satisfaction
is a person’s affective evaluative response to aspects of their job.
The researcher concludes that a measuring instrument measuring climate can also
measure elements of job satisfaction as a dimension of organisational climate. The
reverse of the situation may not be the case, as climate encompasses more
dimensions, which represent perceptions of work environment in totality. In the light of
the above discussion, the two concepts “organisational climate” and “job satisfaction”
are related but are not the same construct. Job satisfaction can be measured as one the
dimensions of climate.
20
2.6 DIMENSIONS OF ORGANISATIONAL CLIMATE
Organisational climate is a set of characteristics of an organisation and its subsystems,
which can be perceived positively or negatively by its members from the way the
organisation deals with its members, behaviour in the organisation, structures,
processes, policies and its internal and external environment. These characteristics are
organised into dimensions which are measured by an organisational climate instrument.
Dimensions of organisational climate as found in the literature are discussed below.
Joyce and Slocum (as cited in Tustin, 1988) identified six dimensions of climate which
represent a useful method for measuring organisational climate:
• leadership facilitation and support
• workgroup co-operation, friendliness and warmth
• conflict and ambiguity
• professional and organisational esprit
• job challenge, importance and variety, and
• mutual trust.
Boeyens (1985:54) identified the following aspects of organisational climate:
• structure
• responsibility
• reward
e risks
• warmth
• support
• standards
• conflict
• decision making
• organisation identity or identification.
21
Boeyens (1985:52) identified the following three broad categories of organisational
climate:
• Structural aspects of the organisation such as decision-making rules, hierarchy,
policy regarding rewards, performance standards and responsibility.
• Leadership functioning relating to support, confidence and trust in the leadership
provided.
• Work groups and the degree of support, pressure, communication, acceptance, and
help with work procedures existing within the group.
Apart from these three broad categories, Boeyens (1985) identified other dimensions
identified by research which have resulted in four broad categories, namely:
• organisational structure, for example decision-making rules, hierarchy,
bureaucratisation, technology, autonomy, rewards, responsibility, ambiguity and
organisation structure
• job challenge, for example motivational conditions, opportunities to perform, growth
and advancement
• leadership, for example support, interaction, goal emphasis, work facilitation,
confidence and trust
• work group, for example co-operation, friendliness, reaction to pressure,
communication, and conflict resolution.
Furnham and Gunter (1993) identified the following eight dimensions of organisational
climate:
• organisational clarity
• decision-making structure
• organisational integration
• management style
• performance orientation
® organisational vitality
22
° compensation
® human resource development.
Furnham and Gunter (1993) later developed a climate questionnaire with the following
fourteen dimensions of organisational climate:
• role clarity
• respect
• communication
• reward system
° career development
• planning and decision making
8 innovation
• relationships
• teamwork and support
s quality of service
• conflict management
® commitment and morale
• learning and training
• direction
Martins and Martins (2001) identified eight dimensions of the universe of psychological
climate perceptions: autonomy, cohesion, trust, pressure, support, recognition, fairness
and innovation. Table 2.1 represents the eight universal dimensions of climate.
23
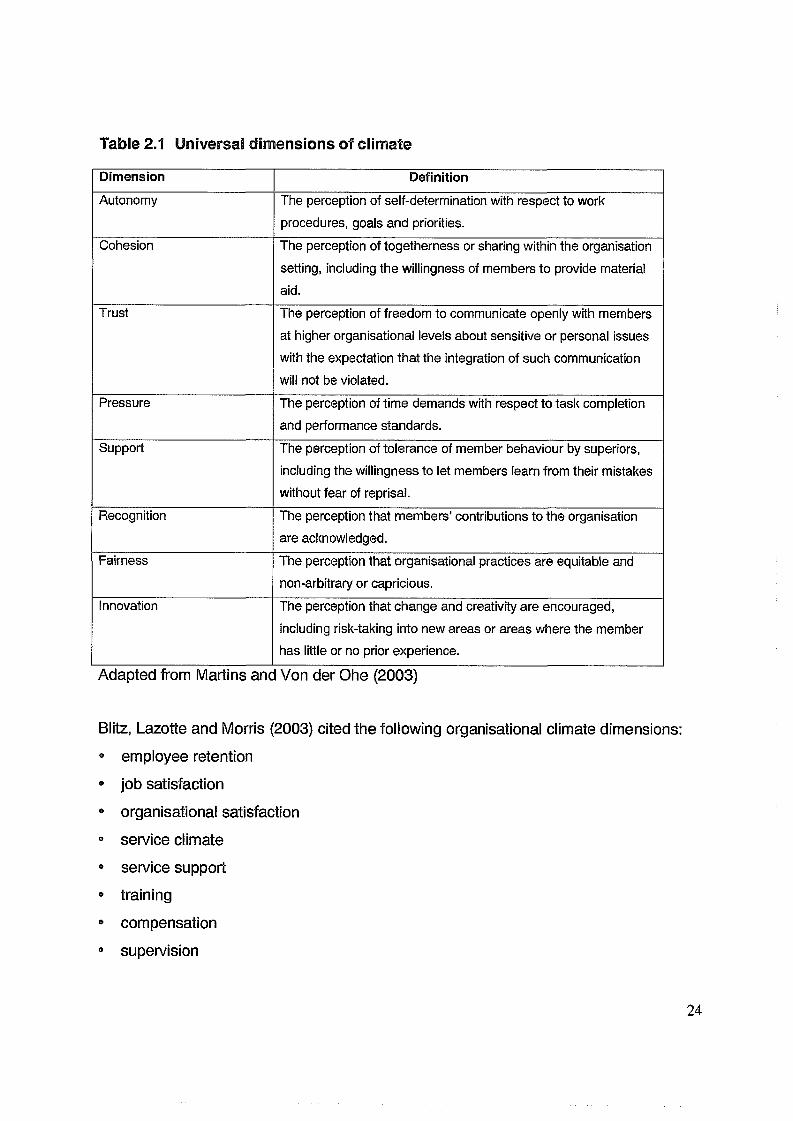
Table 2.1 Universal dimensions of climate
Dimension Definition
Autonomy The perception of self-determination with respect to work
procedures, goals and priorities.
Cohesion The perception of togetherness or sharing within the organisation
setting, including the willingness of members to provide material aid.
Trust The perception of freedom to communicate openly with members
at higher organisational levels about sensitive or personal issues
with the expectation that the integration of such communication will not be violated.
Pressure The perception of time demands with respect to task completion
and performance standards.
Support The perception of tolerance of member behaviour by superiors,
including the willingness to let members learn from their mistakes without fear of reprisal.
Recognition The perception that members’ contributions to the organisation are acknowledged.
Fairness The perception that organisational practices are equitable and non-arbitrary or capricious.
Innovation The perception that change and creativity are encouraged,
including risk-taking into new areas or areas where the member has little or no prior experience.
Adapted from Martins anc Von der Ohe (2003)
Blitz, Lazotte and Morris (2003) cited the following organisational climate dimensions:
• employee retention
• job satisfaction
• organisational satisfaction
® service climate
• service support
• training
• compensation
° supervision
24
• external service value.
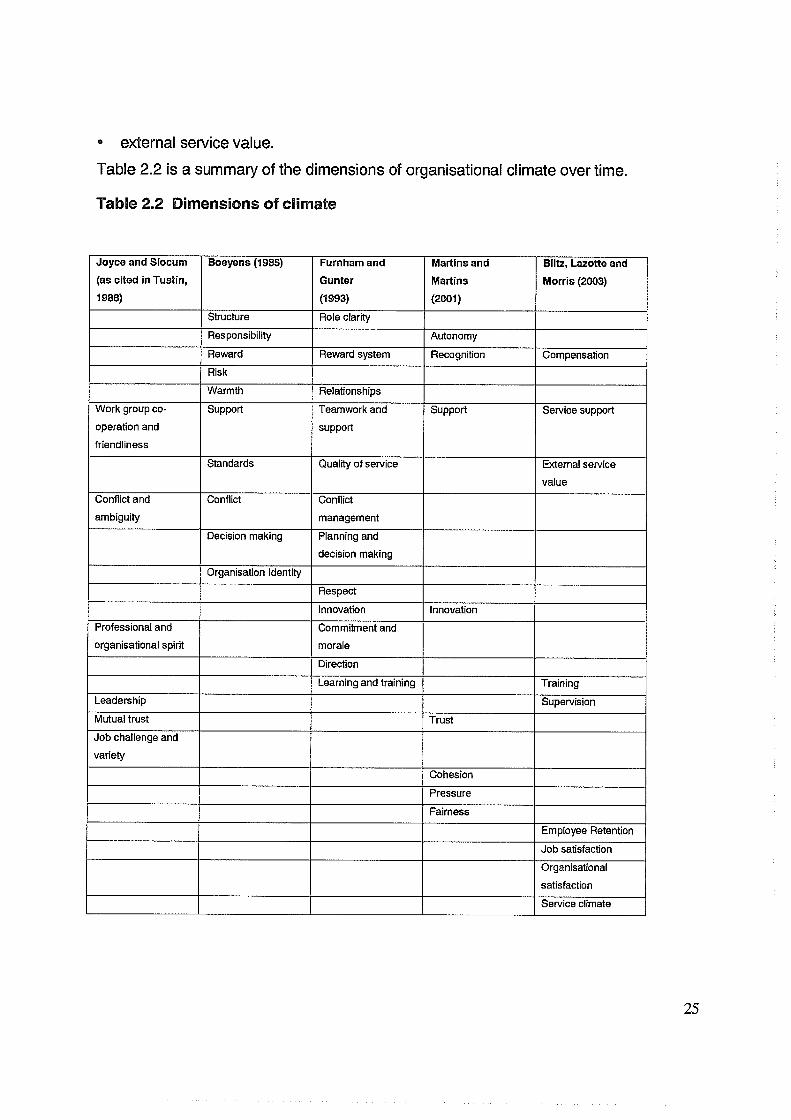
Table 2.2 is a summary of the dimensions of organisational climate overtime.
Table 2.2 Dimensions of climate
Joyce and Slocum
(as cited in Tustin,
1988)
Boeyens (1985) Furnham and
Gunter
(1993)
Martins and
Martins
(2001)
Blitz, Lazotto and
Morris (2003)
Structure Role clarity
Responsibility Autonomy
Reward Reward system Recognition CompensationRisk
Warmth Relationships
Work group co
operation and
friendliness
Support Teamwork and
supportSupport Service support
Standards Quality of service External service
valueConflict and
ambiguity
Conflict Conflict
management
Decision making Planning and
decision making
Organisation Identity
Respect
Innovation Innovation
Professional and
organisational spiritCommitment and
morale
Direction
Learning and training TrainingLeadership SupervisionMutual trust Trust
Job challenge and
variety
Cohesion
Pressure
Fairness
Employee Retention
Job satisfaction
Organisational
satisfaction
Service climate
According to table 2.2 the following dimensions, rewards, teamwork, support and
conflict appear to be common in most of the studies. The researcher is of the opinion
that climate dimensions will vary from one organisation to another, depending on the
nature of the organisation.
2.7 ELEMENTS IN THE ORGANISATION CONTRIBUTING TO A POSITIVEORGANISATIONAL CLIMATE
Mullins (1989) argues that a healthy organisational climate might be expected to exhibit
such characteristics as:
• the integration of organisational goals and personal goals
• a flexible structure with a network of the researcher, control and communication and
with autonomy for individual members
• mutual trust, consideration and support among different levels of the organisation
• recognition of individual differences and attributes, and of people’s needs and
expectations at work
• attention to job design and the quality of working life
• challenging and responsible jobs with high performance standards
• equitable systems of rewards based on positive reinforcement
• opportunities for personal development, career progression and advancement
• justice in treatment, and fair personnel and industrial relations policies and practices
• the open discussion of conflict, with emphasis on the settlement of differences
without delay or confrontation
• democratic functioning of the organisation with full opportunities for genuine
consultation and participation
• a sense of identity with and loyalty to the organisation and a feeling of being needed
and as an important member of the organisation.
26
Management has the responsibility of creating an organisational climate in which people
are motivated to work willingly and effectively. If organisational climate is to be
improved, then attention should be given to the above features.
2.8 CHAPTER SUMMARY
This chapter conceptualised the concept “organisational climate”. The relationship
between organisational climate and organisational culture was investigated and it was
found that the two concepts are closely related but not identical. The same conclusion
was reached after investigating the relationship between organisational climate and job
satisfaction. Dimensions or characteristics of organisational climate were discussed and
integrated. It was concluded that the dimensions used to measure climate in a given
organisation would be determined by the nature of the organisation. Elements in the
organisation that contribute to a good organisational climate were also discussed.
Organisational climate is an encompassing construct, which has a number of
dimensions, which are determined by the nature and the external environment of the
organisation. Through investigating organisational climate, measures can be
implemented to improve the performance of the organisation. The subsequent chapter
deals with the literature review on the concept diversity management.
27
CHAPTER 3
DIVERSITY MANAGEMENT
3.1 INTRODUCTION
This chapter conceptualises diversity management by defining it, discussing
approaches to diversity management, benefits of diversity management, positive and
negative effects of diversity management, the relationship between diversity
management, employment equity and affirmative action, models of diversity
management and the relationship between diversity management and organisational
climate.
Cox (2001) states that diversity has many interpretations and is not broad enough to
mean any difference between people nor so narrow as to be limited to gender and race.
Diversity is not another name for affirmative action or a synonym for equal employment
opportunity (Cox, 2001; Riccucci, 2002).
3.2 DEFINING DIVERSITY MANAGEMENT
In order to fully appreciate the complexity of diversity, it is helpful to divide diversity into
two categories: primary diversity, which consists of elements of diversity over which one
has no control, and secondary diversity, which consists of elements of diversity that are
subject to choice or those that one can control. Examples of primary diversity are age,
ethnicity, gender, physical abilities, qualities, race, sexual orientation and personality
orientation. Examples of secondary diversity are educational background, geographical
location, income, marital status, parental status, religious beliefs and work experience
(Svehla,1994).
28
Daniel (1994:14) describes diversity management as a process for developing an
environment:
9 that fosters awareness, value and acceptance of individual differences,
• that gives employees opportunities and judges them fairly on their talents and
contributions,
• thereby attempting to address expectations and to remove or reduce biases and
stereotypical behaviour.
According to Jenner (1994), diversity management looks at the diverse needs of the
employees not the cultural diversity of employees. It is regarded as managing the
human resources needs. Arrendondo (1996:17) defines diversity management as “a
strategic organisational approach to workforce diversity development, organisational
culture change and empowerment of the workforce”. Thomas (1997:41) considers
diversity management “a way of thinking of the objective of creating an environment that
will enable all employees to reach their full potential in pursuit of organisational
objectives”. Diversity management represents a shift away from the activities and
assumptions of affirmative action which focus on recruitment and upward mobility of the
minority to management practices that are inclusive, reflecting the workforce diversity
and its potential. Diversity management is an ideal pragmatic approach, in which
participants anticipate and plan for change, do not fear human differences or perceive
them as a threat and view the workplace as a forum for individuals’ growth and change
in skills and performance with direct cost benefits to the organisation (Thomas 1997).
Gilbert, Stead and Ivancevich (1999:61) define diversity management as “a voluntary
organisational program designed to create greater inclusion of all individuals in informal
social networks and formal company programs”.
Ivancevich and Gilbert (2000:75) define diversity management as “the systematic and
planned commitment by organisations to recruit, retain, reward and promote a
heterogeneous mix of employees”.
29
Cox (2001:4) defines diversity management as “understanding the effects of diversity
and implementing behaviours, work practices, and policies that respond to them in an
effective way”.
Taking the above definitions into consideration, diversity management is regarded as a
strategic process that an organisation undertakes to create an environment where
differences and similarities are acknowledged, valued and utilised to reach
organisational goals, using integration rather than assimilation to create a multicultural
organisation. This includes culture, working methods or styles, age, gender, work
experience, race, values, norms, religious affiliations, disability and the number of years
in the organisation.
3.3 APPROACHES TO DIVERSITY MANAGEMENT
3.3.1 Approaches identified by Svehla (1994)
Svehla (1994:20) identified three approaches to diversity management, namely
affirmative action, valuing differences and managing diversity.
3.3.1.1 Affirmative action
Affirmative action’s goal is to right the wrongs of the past, to fill positions with potential
candidates and to open up the playing field to all applicants, regardless of race,
ethnicity, sex, physical ability (Svehla,1994). The emphasis is on quantitative data with
progress monitored by statistical reports and analysis mandated by equal employment
opportunity laws. Affirmative action is regarded as a recruitment tool to bring formerly
disadvantaged workers into the workforce and help them fit into the corporate culture
(Harrington, 1993).
30
One of affirmative action’s failures is that it is universally resisted by management staff,
who feel it limits their autonomy in decision making and has created fears of reverse
discrimination (Svehla, 1994).
3.3.1.2 Valuing differences
According to Svehla (1994), this approach emphasises the appreciation of differences
and the creation of an environment in which everyone feels valued and accepted.
Thomas (1997) states that valuing of differences focuses on a generic approach that
aims to bring about greater understanding and acceptance of people who are different,
enhancement of interpersonal relationships and minimising of blatant expressions of
racism and sexism. The failure of this approach has in part been due to the resistance
to change by management and employees in the organisation. Progress on measuring
valuing differences is usually measured by employee and management focus groups
and surveys to measure the degree of acceptance and understanding of a changing
workforce (Harrington, 1993).
3.3.1.3 Diversity management
Sveha (1994:22) defines diversity management as “a strategically driven process with
the emphasis on building specific skills, creating policies that bring out the best in every
employee, and assessing marketing issues as a result of the changing workforce and
customer demographics. Its goal is to create a level playing field through the
assessment, identification and modelling of behaviours and policies that are seen as
contributing to organisational goals and objectives.” There seems to be resistance to
diversity initiatives as people are negative towards change efforts (Svehla, 1994).
3.3.2 The integrated approach to diversity
Wah (1999) identified an integrated approach to diversity that is being used by a
company called Allstate. Primarily for Allstate, the concept diversity is not limited to
31
ethnicity and gender but includes diversity with regard to age, religion, sexual
orientation and disability, for example.
Wah (1999) stated that Allstate resolved to penetrate its day-to-day functions with the
concept of diversity. A number of processes have been established to bring the
concept and strategy alive. These processes go beyond recruiting a diverse mix of
employees to encompass a proactive retention strategy, ongoing training and
education, a rigorous feedback mechanism and community outreach programmes.
During the recruiting process diversity initiatives are meant to ensure there are qualified
candidates for every position, at all levels of the company. Allstate ensures that the
integrated diversity strategy is aimed at retaining the best employees; as a result it
builds diversity into its performance model. Every new employee receives diversity
training within the first six months of employment. Diversity training focuses on
managing behaviours rather than changing employees1 belief system. After the initial
training the diversity education team provides additional support to managers on how to
sustain a diverse and trustful work environment (Wah, 1999). Diversity is constantly
measured. For a truly diverse environment, diversity needs to be communicated and to
sustain it, takes constant monitoring and evaluation. As a result a structured
measurement and feedback system is implemented that helps foster diversity beyond
the recruitment stage. One method used is a Quarterly Leadership Measurement
System (QLMS) (Wah, 1999).
Allstate has created community outreach programmes whose ultimate aim is to capture
a larger market share. These programmes include financial and expert contribution to
ethnic, local and other organisation programmes (Wah, 1999).
32
3.3.3 Perspectives identified by Lorbiecki (2001)
Lorbiecki (2001:350) identified four perspectives on diversity management, namely
resistance, discrimination and fairness, access and legitimacy, and learning and
effectiveness.
3.3.3.1 Resistance
This approach was developed in the 1950’s and 1960’s, when established majorities
feared that they might be displaced in the workplace by minorities. According to this
approach, any embodiment of visible forms of difference was perceived by the
established majority (White males) to be a threat. Organisations reacted by protecting
their status quo as a means of preserving homogeneity (Lorbiecki, 2001).
3.3.3.2 Discrimination and fairness
In the UK, the Sex Discrimination Acts of 1975 and 1976 could be regarded as a social
response to redress the disadvantaged position of women and minority groups in Britain
at the time. This perspective was later known as the discrimination and fairness
perspective/approach. In this perspective, typical interventions involved the auditing of
sources of direct and indirect discrimination, and positive or affirmative intervention
action aimed at making good historical imbalances in access to opportunity (Lorbiecki,
2001).
3.3.3.3 Access and legitimacy
The access and legitimacy perspective places primary emphasis on acknowledging,
accepting, appreciating, understanding and valuing a huge array of differences including
able-bodiedness , age, class, culture, ethnicity, experience, gender, race, values and
ways of working (Dass & Parker, 1999; Thomas & Ely, 1996). According to Lorbiecki
(2001), it emphasises the need to create a culture or climate in which differences can
33
find expression so that organisations can match employees’ demographic
characteristics to those found in the community.
3.3.3.4 Learning and effectiveness
Thomas and Ely (1996) recognise that the weakness in the access and legitimacy
perspective can be resolved if diversity management can be approached from the
learning and effectiveness perspective. A major weakness of the access and legitimacy
approach is that women and the previously disadvantaged people are either
encouraged or expected to fit in, or they are ghettoized by their differences into jobs that
relate specifically to their background, for example by interfacing only with clients or
customers of their same identity group. Emphasizing differences is held particularly
limiting because it is based on the flawed assumption that the only virtue members of
identity groups have to offer is the knowledge of their own people (Thomas & Ely,
1996:80). The learning and effectiveness perspective indicates that for diversity
management initiatives to be successful, the work gets diversified not just the
employees (Dass & Parker,1999) .This involves diversifying structures, processes and
the culture of the organisation. This can be achieved if diversity management becomes
systematic, depending on the organisation interventions such as action research,
organisational development and total quality management can be implemented (Dass &
Parker, 1999).
The systematic change required by the learning perspective might be difficult to achieve
because organisational learning in most companies tends to be oriented towards the
interest of management. A learning approach could be seen as a manipulated tool to
increase management control thus increasing the chances of resistance to changes
related to diversity (Dass & Parker, 1999). Lorbiecki (2001:355) indicates that “the major
strength of this approach is that it pays much greater attention to the need to diversify
work rather than people, bringing diversity into the core of organisational processes”.
34
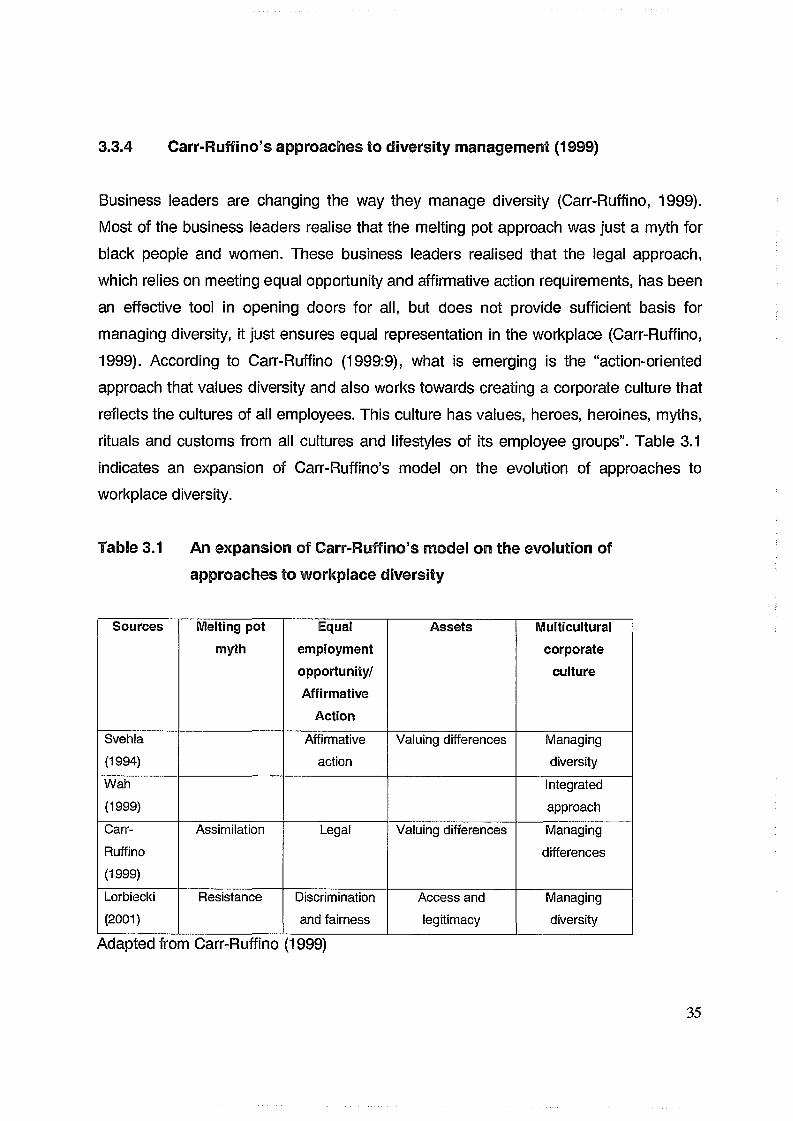
3.3.4 Carr-Ruffino’s approaches to diversity management (1999)
Business leaders are changing the way they manage diversity (Carr-Ruffino, 1999).
Most of the business leaders realise that the melting pot approach was just a myth for
black people and women. These business leaders realised that the legal approach,
which relies on meeting equal opportunity and affirmative action requirements, has been
an effective tool in opening doors for all, but does not provide sufficient basis for
managing diversity, it just ensures equal representation in the workplace (Carr-Ruffino,
1999). According to Carr-Ruffino (1999:9), what is emerging is the “action-oriented
approach that values diversity and also works towards creating a corporate culture that
reflects the cultures of all employees. This culture has values, heroes, heroines, myths,
rituals and customs from all cultures and lifestyles of its employee groups”. Table 3.1
indicates an expansion of Carr-Ruffino’s model on the evolution of approaches to
workplace diversity.
Table 3.1 An expansion of Carr-Ruffino’s model on the evolution of
approaches to workplace diversity
Sources Melting potmyth
Equalemploymentopportunity/Affirmative
Action
Assets Multiculturalcorporate
culture
Svehla(1994)
Affirmativeaction
Valuing differences Managing
diversityWah
(1999)Integrated
approach
Carr-
Ruffino(1999)
Assimilation Legal Valuing differences Managing
differences
Lorbiecki
(2001)
Resistance Discrimination
and fairness
Access and
legitimacy
Managingdiversity
Adapted from Carr-Ruffino (1999)
35
3.3.5 Approach utilised in South Africa
According to Thomas (2002) most South African companies already introduced
strategies of affirmative action to achieve employment equity. It is argued that the face
of the South African workforce is changing, and becoming diverse. Despite these
changes it is believed that this process is not happening rapidly enough and the
management structures are still white male dominated.
Thomas (2002) identified the following strategic concerns regarding employment equity:
• Race classifications will be heightened and regarded as reverse discrimination. The
result thereof would be a decrease in employee loyalty and a lack of retention of
skilled employees.
• People from previously disadvantaged groups who still require training and
development, have unrealistic short term expectations that will further increase racial
and social conflict within companies (Thomas, 2002).
Thomas (2002) further identified some operational concerns:
• Companies in an attempt to adhere to legislation are making token appointments
and this result in a decline in the levels of service,
• Employment equity and affirmative action measures are not regarded as strategic
business issues; therefore management is not committed to them.
® There is lack of commitment to performance management that could be used as a
tool for training and development of employees.
It appears from the above discussion that a majority of South African companies are still
managing diversity according to the employment equity or affirmative action approach
as indicated in table 3.1.
36
3.4 POSITIVE AND NEGATIVE EFFECTS OF MANAGING DIVERSITY
3.4.1 Positive effects of managing diversity
A properly managed diversity management strategy in an organisation can have the
following value-adding benefits:
3.4.1.1 Problem-solving and decision-making
Diverse groups have a broader and richer base of experience from which to approach a
problem. Carr-Ruffino (1999:13) indicates that culturally diverse groups have the
potential to solve problems better because of the following factors:
• a greater variety of perspectives;
• a higher level of critical analysis of alternatives;
• lower probability of groupthink and therefore a higher probability of generating
creative solutions.
According to Carr-Ruffino (1999), these benefits increase organisational productivity.
Cox (2001) indicates that diversity improves decision-making. Nemeth (as cited in Cox,
2001) found that groups with heterogeneous views were better at critically analysing
decision issues and alternatives than those with homogenous views.
3.4.1.2 Creativity and innovation
In diverse groups creativity increases, as the people in the groups have a broader range
of ideas to choose from. This enhances organisational activities, such as process
improvement, advertising, product design and quality improvement (Carr-Ruffino, 1999;
Cox, 2001; Vernon, Bergman, Bowler, Engel, Zeino, Rentsch & Woehr, 2003). The
above is only possible if the relationships within the group are strong. Creativity and
innovation increases if the relationships within the groups are strong.
37
3A. 1.3 Organisational flexibility
In organisations where there is diversity, their ability to adapt and accommodate
diversity should lead to greater organisational flexibility (Cox 2001). Cox (2001:8)
identified two ways diversity can assist in making an organisation more flexible:
• Through changes in the patterns of employees’ cognitive structures; that is, their
typical ways of organising and responding to information. For example, there is
evidence that women tend to have more tolerance for ambiguity than men, a quality
that has been linked to both higher levels of cognitive complexity and the ability to
perform ambiguous tasks, and
• Studies on bilingual and monolingual cultural groups in various nations have shown
that bilingual individuals tend to have higher levels of cognitive flexibility and
divergent thinking than monolinguals.
3.4.1 A Human talent
Cox (2001) states that those organisations that are effective at attracting, retaining and
using people from only one or two social-cultural groups will be at a disadvantage
compared to those that are equally effective with people from a variety of backgrounds.
Carr-Ruffino (1999) states that in order to retain qualified employees, they want their
individual and group needs recognised and met. They want control over their own
destiny, to have a say in decisions that affect them, and more flexibility in terms of
employment and rewards. People are less likely to stay with employers who don’t meet
their needs.
3.4.1.5 Marketing strategy
A well-managed diverse workforce can facilitate selling goods and services to a diverse
market in the following ways:
• Firstly, there is the public relations value of being identified as an organisation that
manages diversity well.
38
• Secondly, marketing efforts may gain from the experiences and perspective of a
diverse workforce, which can be valuable in building sales. This can assist
organisations in understanding cultural effects on buying decisions and in mapping
strategies to respond to them.
* Thirdly, broadly representative employees can help create strategies to enhance
customer relations when working with clients from diverse cultural backgrounds
(Carr-Ruffino, 1999; Cox, 2001).
3.4.1.6 Reducing costs
According to Carr-Ruffino (1999), companies that manage a diverse workforce save
money in defending grievances, complaints and lawsuits regarding discrimination and
sexual harassment cases. In addition to lost time and legal fees for dealing with such
problems, there are other costs such as job-related stress, lowered morale, lowered
productivity and resulting in absenteeism and turnover.
3.4.2 Perceived negative effects of managing diversity
Hansen (2003:28) is of the opinion that diversity management has more negative
effects on the organisation than positive effects. Hansen (2003) gives the example of
Xerox, this organisation conceived the first workplace equality efforts 40 years ago, and
draws 30 percent of its workforce from racial minorities and wins awards for its diversity
programmes, yet despite these efforts it still faces multiple discrimination lawsuits. Cox
(2001) maintains that diversity management creates unnecessary costs for
organisations. Hansen (2003) states that diversity management programmes are more
successful with respect to gender rather than racial and ethnic issues. Discussed below
are negative effects of managing diversity in organisations.
3.4.2.1 Devaluation of employees
An error that contributes to the devaluation of employees is equating diversity with
39
affirmative action. Affirmative action is considered to have racist assumptions. It creates
the impression that individuals are hired or promoted based on quotas or as a result of
other affirmative action policies, the individuals are perceived to be token appointments,
and are not hired or promoted on performance or ability alone (Von Bergen, Soper &
Foster, 2002). In a New York study, Von Bergen, Soper and Foster (2002) found that
women who believe that they were hired on gender rather than ability tend to devalue
their own performance, and choose less demanding tasks and devalue other women in
the organisation.
3A.2.2 Diversity impairs organisational effectiveness
There are people who believe that a minority workforce offers very little to the
organisation as a whole in terms of increased knowledge, skills and activities. They
believe that making the organisation look different adds little to organisational
effectiveness. Diversity due to race will create interpersonal dynamics among workers
and thus threaten their productivity, and employees of colour are believed not to
contribute meaningfully to productivity (Thomas, Mack & Montagliani, 2004).
3A.2.3 Women lack commitment to employment
Female employees are still viewed with a degree of suspicion. Women of childbearing
age are often regarded as more likely to leave their jobs than their male counterparts.
Women are regarded as an economic risk because they are ill more often than men and
they tend to quit their jobs once they marry and/ or have children. It is believed that
women face more work-family conflict than men (Thomas et a!., 2004).
3.4.2A The disabled drive up employment costs
There is a belief that disabled employees’ physical limitations cause them to miss work
more than non-disabled workers, produce poorer quality of work and drive up the costs
of healthcare premiums (Thomas et al., 2004). Employers have traditionally resisted
40
hiring persons with disabilities partly because of the belief that they pose safety risks,
increase health costs, have higher absence and lower productive capacity than non
disabled workers (Thomas et al., 2004).
3.4.2.5 Older workers have little potential for payback
Thomas et al. (2004) state that the cost associated with hiring and training older
workers will outweigh the benefits of their employment. The arguments are, older
employees are perceived as producing lower quality of work and they will not be in their
jobs long enough to make a substantial impact or contribution to the organisation.
3.5 THE RELATIONSHIP BETWEEN DIVERSITY MANAGEMENT,
EMPLOYMENT EQUITY AND AFFIRMATIVE ACTION
The concept diversity management is often equalled, confused or incorrectly related
with affirmative action and employment equity (Cox, 2001; Jenner, 1994; Maier, 2002;
Thomas, 1996; Yakura, 1996).
3.5.1 Clarification of concepts
Diversity management is a corporate managerially initiated strategy. It can be proactive
and is based on operational reality to optimise the use and contributions of an
increasingly diverse national workforce (Ivancevich & Gilbert, 2000). Cox (1993)
describes an organisational continuum in terms of diversity initiative implementation
compromising of three types: monolithic, plural and multicultural.
In monolithic organisations, the extent of commitment to affirmative action is the
existence of an affirmative action plan. In plural organisations, minorities may be more
aggressively recruited and promoted but they are ultimately expected to assimilate into
the dominant culture. The plural organisation supports affirmative action to the exclusion
of initiatives that promote true employee integration.
41
The multicultural organisation represents the ideal, a place where differences are
appreciated and used to gain competitive advantage. Multicultural organisations are
believed to promote both attitudinal and structural integration of minorities and to
effectively manage corporate diversity.
Affirmative action is a reactive process and is based on governmental law and moral
imperatives in order to right the wrongs of the past in the workplace. According to Agocs
and Burr (1996), affirmative action is a policy that deals directly with de facto or
systematic discrimination and focuses on increasing the representation of designated
groups through targeted hiring. Affirmative action puts interventions in place that involve
preferential treatment of members of target groups in appointments, development and
promotions.
Employment equity creates an environment of equal opportunity in the workplace. The
purpose of the Employment Equity Act 55 of 1998 (Republic of South Africa) is to attain
equality in the workplace through the elimination of unfair discrimination and through
affirmative action strategies. Agocs and Burr (1996) state that employment equity can
be seen as a two-fold response to inequality, designed not only to improve numerical
representation of formerly disadvantaged groups in all occupational categories and
levels, but also to provide fair employment systems free of unfair bias and
discrimination.
Diversity management is regarded as a strategic process that an organisation
undertakes to create an environment where differences and similarities are
acknowledged, valued and utilised to reach organisational goals, using integration
rather that assimilation to create a multicultural organisation. This includes culture,
working methods or styles, age, gender, work experience, race, values, norms, religious
affiliations and number of years in the organisation.
42
3.5.2 Comparison between diversity management, employment equity and
affirmative action
According to Yakura (1996), in contrast to affirmative action and employment equity,
diversity management bears less legal and moral connotations and is regarded as a
business initiative addressing diversity in the workplace. Thomas and Robertshaw
(1999) state that diversity management is not opposed to the concepts affirmative
action or employment equity, but rather as a voluntary organisational change
programme that helps to implement employment equity in the workplace. The goal of
affirmative action and employment equity is to help create a diverse workforce; diversity
management is needed in order to achieve upward mobility, healthy integration among
the workforce and ultimately lead to greater organisational performance (Thomas &
Robertshaw, 1999).
Riccucci (2002) regards equal employment opportunity as policies aimed at preventing
employment discrimination. Equal Employment Opportunity policies and laws were
developed in response to discriminatory practices against persons based on race,
gender, religion, national origin, disability, age and so forth. Equal Employment
Opportunity law is regarded as passive in a sense that it only requires employers to
refrain from discriminating against protected-class members. On the other hand,
affirmative action requires employers to take positive steps towards employing,
promoting, and retaining qualified women, people of other races and other protected
class people (Riccucci, 2002). Affirmative action continues to be an important tool for
the promotion of the disadvantaged to upper-level positions in the workplace. Diversity
measures go beyond entry-level hiring to ensuring that every section of the
organisational hierarchy is diversified and that the workplace is free from hostilities and
harassment that often arise in a highly diverse workforce. Table 3.2 displays a
comparison of these three concepts as discussed above.
43
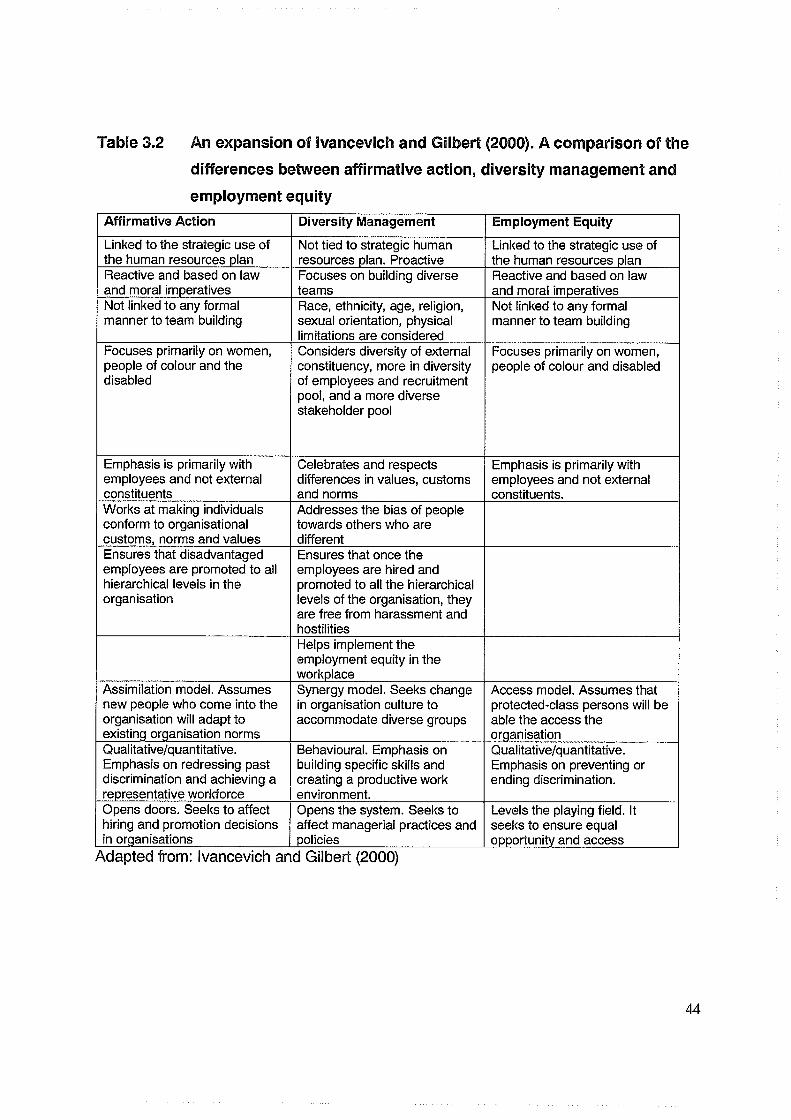
Table 3.2 An expansion of Ivancevich and Gilbert (2000). A comparison of the
differences between affirmative action, diversity management and
employment equityAffirmative Action Diversity Management Employment EquityLinked to the strategic use of the human resources plan
Not tied to strategic human resources plan. Proactive
Linked to the strategic use of the human resources plan
Reactive and based on law and moral imperatives
Focuses on building diverse teams
Reactive and based on law and morai imperatives
Not linked to any formal manner to team building
Race, ethnicity, age, religion, sexual orientation, physical limitations are considered
Not linked to any formal manner to team building
Focuses primarily on women, people of colour and the disabled
Considers diversity of external constituency, more in diversity of employees and recruitment pool, and a more diverse stakeholder pool
Focuses primarily on women, people of colour and disabled
Emphasis is primarily with employees and not external constituents
Celebrates and respects differences in values, customs and norms
Emphasis is primarily with employees and not external constituents.
Works at making individuals conform to organisational customs, norms and values
Addresses the bias of people towards others who are different
Ensures that disadvantaged employees are promoted to all hierarchical levels in the organisation
Ensures that once the employees are hired and promoted to ali the hierarchical levels of the organisation, they are free from harassment and hostilitiesHelps implement the employment equity in the workplace
Assimilation model. Assumes new people who come into the organisation will adapt to existing organisation norms
Synergy model. Seeks change in organisation culture to accommodate diverse groups
Access model. Assumes that protected-class persons will be able the access the organisation
Qualitative/quantitative. Emphasis on redressing past discrimination and achieving a representative workforce
Behavioural, Emphasis on building specific skills and creating a productive work environment.
Qualitative/quantitative. Emphasis on preventing or ending discrimination.
Opens doors. Seeks to affect hiring and promotion decisions in organisations
Opens the system. Seeks to affect managerial practices and policies
Levels the playing field. It seeks to ensure equal opportunity and access
Adapted from: Ivancevich and Gilbert (2000)
44
3.6 MODELS OF DIVERSITY MANAGEMENT
3.6.1 Managing cultural diversity: a proactive approach
Motwani, Harper, Subramanian and Douglas (1992) developed a model for managing
cultural diversity depicted in figure 3.1. This model explains how a manager can
successfully implement a program of recruiting and managing a diversified workforce.
The first phase of the model, a manager must develop a complete understanding of the
labour resources available in the labour market and the labour pool that exists within the
organisation. In the second phase the manager should understand the short-term and
long-term operational goals of the company and what types of jobs and skills will be
required in the future to achieve organisational goals. In the third phase, referred to as
the programming phase, diversity management focuses on setting both short-term and
long-term goals to achieve a more responsive environment to the changes that are
taking place. In the short term the manager may only be able to achieve minimum
affirmative action goals, create awareness among employees of the stereotypes they
may possess and the harm this may cause to the organisation, and may also start at
this stage to affirmatively recruit minorities, women and others. In the long run the
culture of the organisation must be changed to create a management system and
employee group, which goes beyond tolerance to appreciation of cultural differences.
The fourth phase of this model involves making specific assignment of responsibilities,
setting quarterly deadlines and review dates, making managers accountable with “no
excuses” and tying the goals to performance evaluation of managers. The final phase of
the model involves evaluating the human resources department’s management of the
overall diversity management program. This is done to determine if the programme is
achieving its specified goals and if it is not achieving specified goals the department
must redesign its programme to make it more effective (Motwani et al., 1992).
45
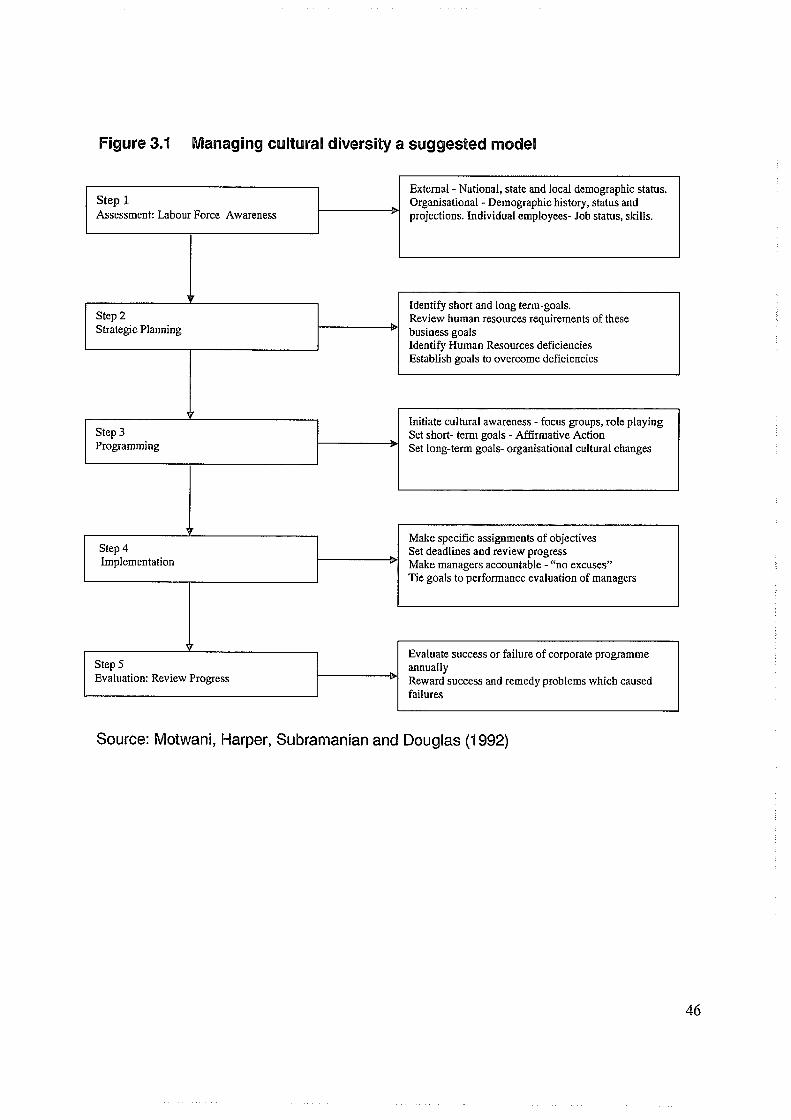
Figure 3.1 Managing cultural diversity a suggested model
Source: Motwani, Harper, Subramanian and Douglas (1992)
46
3.6.2 An integrative model of effective diversity management
Gilbert et al. (1999) developed an integrative model of diversity management. This
model integrates components of existing models with interview data and anecdotes
from actual business practice.
The model depicted in figure 3.2 suggests that specific factors are responsible for
positive diversity results. According to the model, Chief Executive Officer (CEO)
initiation and continuation leads to transformation of the human resource function,
positive individual level outcomes for minority and majority individuals, and positive
attitudes towards diversity. Benefits of effectively managed diversity, in turn, affect
important organisational outcomes.
3.6.2.1 CEO initiation and continuation
Gilbert et al. (1999) regard organisations that view valuing differences as a total cultural
change rather than an isolated component of organisational policy designed to satisfy
governmental mandates as diversity leaders in the industry. CEO’s of these
organisations believe that diversity management makes sense both from a perspective
of justice and a perspective of improving bottom line. The diversity programme at Xerox
was initiated at the top and managerial attention to increased workforce diversity was
mandated. The transformational leadership skills of the CEO’s of J.C. Penny’s and
Xerox acted as catalysts to organisational change. J.C. Penrfy’s and Xerox changed
their mission statements and strategic plans to incorporate diversity related goals, and
subsequently demonstrated their commitment to diversity through initiating
organisational cultural change. Other CEO’s who now advocate valuing diversity as a
corporate goal came to that realisation as a result of legal battles (Gilbert et al., 1999).
Lawsuits need not be the motivating factor for firms to act. The then CEO of Procter and
Gamble, John Pepper was committed to increasing organisational diversity as a means
of attracting,the best talent and serving diverse markets (Gilbert et al., 1999).
47
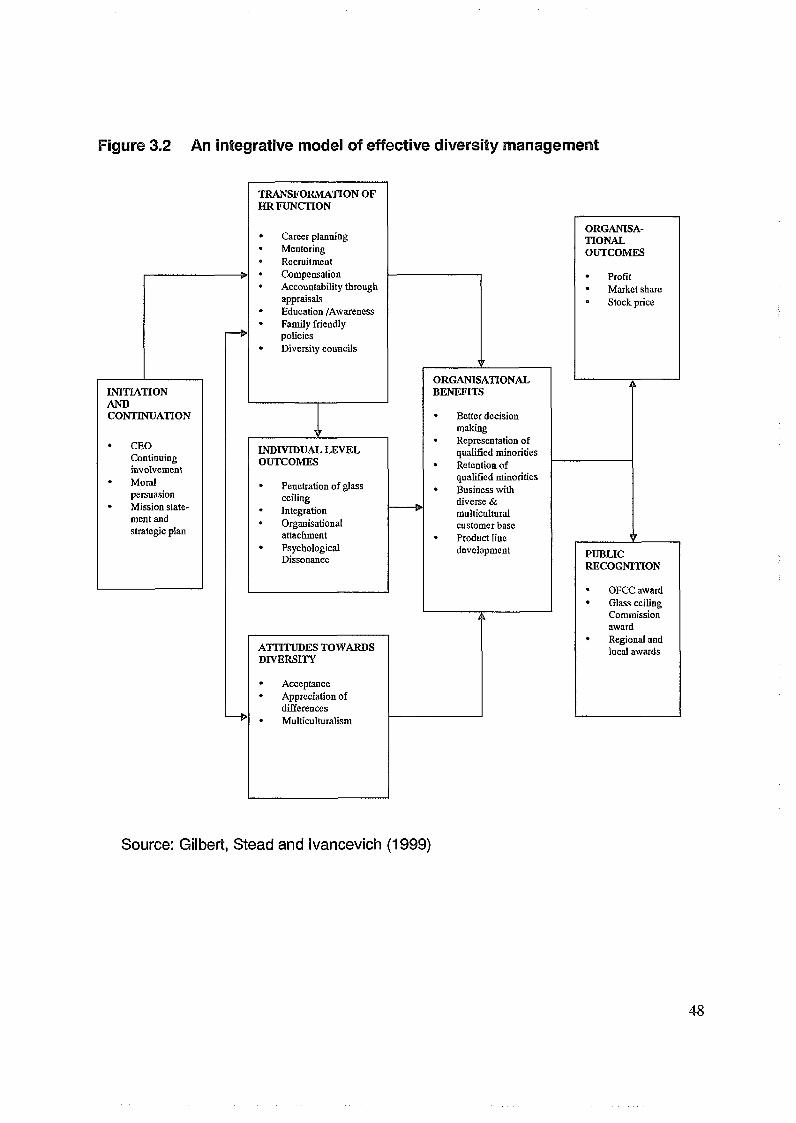
Figure 3.2 An integrative model of effective diversity management
INITIATION
ANDCONTINUATION
CEO
Continuinginvolvement
• Moral
persuasion
• Mission state
ment and strategic plan
TRANSFORMATION OF H R FUNCTION
• Career planning
• Mentoring
• Recruitment
• Compensation
• Accountability through
appraisals
• Education /Awareness
• Family friendly policies
• Diversity councils
INDIVIDUAL LEV EL OUTCOMES
• Penetration of glass ceiling
• Integration
• Organisational attachment
• Psychological Dissonance
ATTITUDES TOWARDS DIVERSITY
• Acceptance
• Appreciation of differences
• Multiculturalism
ORGANISATIONAL
BENEFITS
• Better decision making
• Representation of qualified minorities
• Retention of qualified minorities
• Business with diverse & multicultural customer base
• Product line
development
ORGANISATIONALOUTCOMES
• Profit
• Market share
• Stock price
PUBLICRECOGNITION
OFCC award
• Glass ceiling Commission
award
• Regional and
local awards
Source: Gilbert, Stead and Ivancevich (1999)
3.6.2.2 Transformation of the human resource function
According to figure 3.2, diversity as a strategic imperative will result in structural
organisational changes, specifically in augmentation of the human resource function. A
study in which in-depth interviews with managerial personnel from sixteen organisations
uncovered 52 diversity practices and twenty-three accountability practices used in the
organisation, which were trying to promote a culture of valuing differences. These
initiatives suggest that a one or two-day diversity training programme is insufficient to
create the cultural change necessary for minority individuals to feel fully integrated in
the workplace (Gilbert et al., 1999). Under the umbrella of diversity management, the
entire personnel or human resources systems are modified to promote employee
inclusion (e.g. compensation, performance appraisal, mentoring, and career pathing)
(Gilbert etal., 1999).
3.6.2.3 individual level outcomes and attitudes toward diversity
The intent of diversity management is to foster enhanced employee integration. Jackson
and Ruderman (1995) argue that integration is based on valuing differences, as
opposed to assimilation, which results from organisational compliance. Integration,
according to Jackson and Ruderman (1995) will become a sought after organisational
strategy for the following reasons:
° Employees are less willing to assimilate into a dominant organisational culture.
• Some factors may be beyond assimilation.
Jackson and Ruderman (1995) further suggest that assimilation of diverse employees
may actually be dysfunctional, resulting in an inability to attract and retain qualified
people. Taking care of all people in a way that values them as individuals and values
the special contributions that they make is integral to engaging all people as valued and
contributing members of the business team.
49
3.6.2A Organisational outcomes and public recognition
Wright, Ferris, Hiller and Kroll (1995) examined the impact on corporate stock returns of
Office of Federal Compliance Programmes (OFCCP) award winners versus those sued
for discrimination. Findings indicated that labour awards were positively associated with
stock returns. The visionary stance of CEO’s committed to diversity has manifested
itself in award winning programs and in national recognition of diversity leaders. Xerox
is the first recipient of the Glass Ceiling Commission award, officially named the
Perkins-Dole National Award for Diversity and Excellence in American Executive
Management. Pfeffer (1995) indicated that it might have been too early to assess long
term benefits of these awards and honours, as widespread positive public recognition
will likely be associated with increased sales, and a perception that winners have
obtained a source of competitive advantage.
3.6.2.5 Ethical outcomes
A process of ethical decision making and an ethical decision-making checklist both
provide a consistent strategy that includes taking ethical principles (an ethics screen)
into consideration. These decision models provide ways to include diversity
management in business decisions. Both the corporate mission statement and the code
of ethics can be a valuable source for building an ethics screen, management needs to
make a conscious effort to use ethical decision making, as words without action will not
bring about diversity management (Gilbert et al., 1999).
3.6.3 A model for managing culturally diverse organisations
Rijamampianina (as cited in Rijamampianina & Maxwell, 2002) developed a model for
managing culturally diverse organisations. Rijamampianina indicates that managers
have attempted to initiate organisational changes in the structures and policies of the
organisation, but it suggests that managers could be more effective were they to focus
their efforts on organic processes.
50
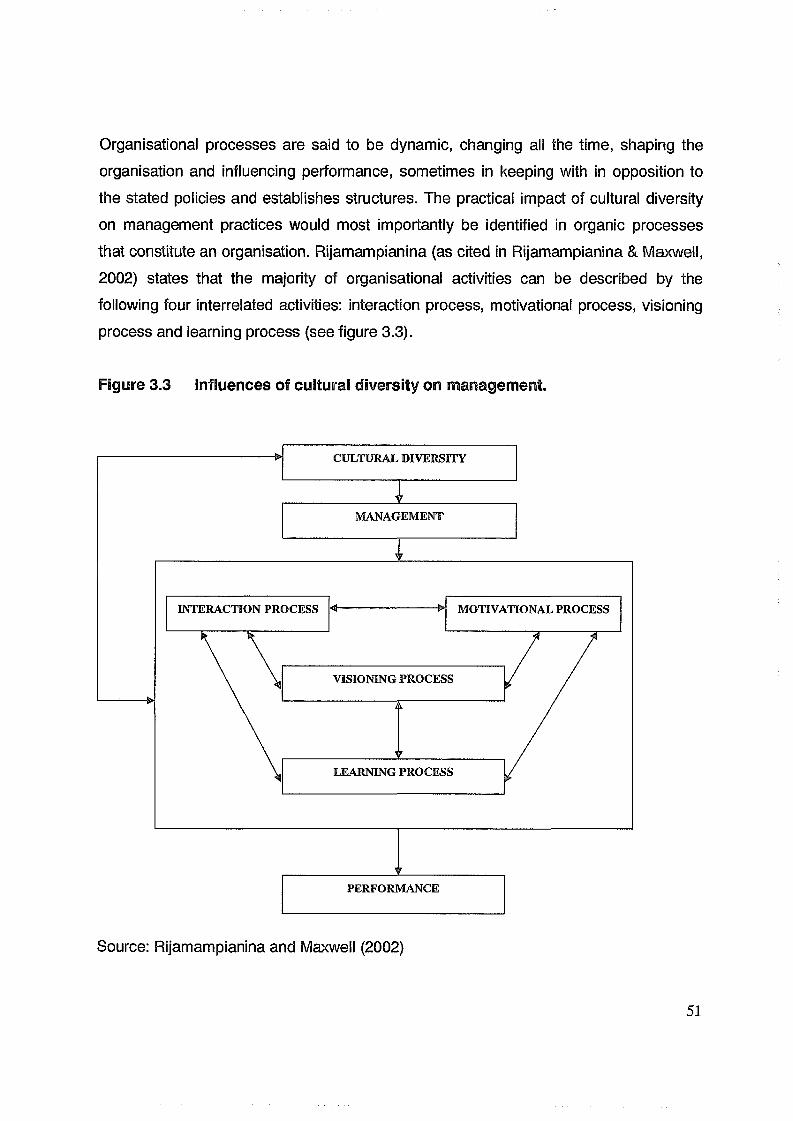
Organisational processes are said to be dynamic, changing all the time, shaping the
organisation and influencing performance, sometimes in keeping with in opposition to
the stated policies and establishes structures. The practical impact of cultural diversity
on management practices would most importantly be identified in organic processes
that constitute an organisation. Rijamampianina (as cited in Rijamampianina & Maxwell,
2002) states that the majority of organisational activities can be described by the
following four interrelated activities: interaction process, motivational process, visioning
process and learning process (see figure 3.3).
Figure 3.3 Influences of cultural diversity on management.
Source: Rijamampianina and Maxwell (2002)
51
3.6.3.1 Motivational process
Employees are impacted upon by a variety of internal and external motivating forces,
which predispose those employees to think and act as they do under various
circumstances. People’s motivational patterns differ. This is more the case in
multicultural organisations where motivational forces are likely to differ more than in
homogeneous contexts.
3.6.3.2 The interaction process
Employees are said to have predetermined assumptions about the world, roles within
the organisation and a set of values by which they judge all their experiences. The
interaction process is said to be a process by which employees have their views of the
world, by which they generate an understanding of their colleague’s assumptions,
attitudes and values and their mental models. Such sharing generates the basis of
mutual respect, constructive conflict and trust. Employees in a homogenous work
context cannot be said to share a common set of mental models, and this is more the
case in multicultural work context, where employees have vastly different mental
models.
3.6.3.3 The visioning process
Even though an organisation has a vision and mission, this does not necessarily mean
that employees in the organisation will share a common understanding of the vision of
the organisation nor will they necessarily support the vision. The visioning process is
one that involves all employees in defining and redefining the essential purpose of the
organisation in such a way that it generates a level of understanding of the vision and a
level of commitment in pursuing the vision. The visioning process can only be effective if
the motivation and interaction process are effective. It requires a minimum level of
52
shared understanding about the organisation and a minimum level of alignment of the
motivational forces acting on employees.
3.6.3.4 The learning process
Learning in this context refers to learning that is specifically related to the empowerment
of employees in a manner critical to their success in meeting the challenges they face at
work. The learning can be formal or informal, specific to a work task or related more
generally to the work environment or based on verbal or written communication. The
learning process focuses on empowering employees with the skills that are critical to
their success in meeting the challenges they face at work. A healthy learning process is
largely dependent on the healthy motivation and interaction processes. Rijamampianina
(as cited in Rijamampianina & Maxwell, 2002) states that the above processes are
interrelated and that successful management of these processes leads to high levels of
organisational performance. In order to achieve high performance in any organisation,
managers need to create organisations that:
• share business successes and failures with employees (the motivation process)
• welcome and encourage mental model sharing (interaction process)
• support vision creation with employees (visioning process), and
• encourage core competence development Rijamampianina (as cited in
Rijamampianina & Maxwell, 2002).
3.6.4 CHANGE MODEL FOR WORK ON DIVERSITY
Cox (2001) developed a model for organisational change as a response to the
challenge of diversity (see figure 3.4). According to Cox (2001), an effective change
effort should include all elements depicted in figure 3.4. Change effort cycles through all
the elements and is continually assessed and refined over time in a process of
continued loop learning.
53
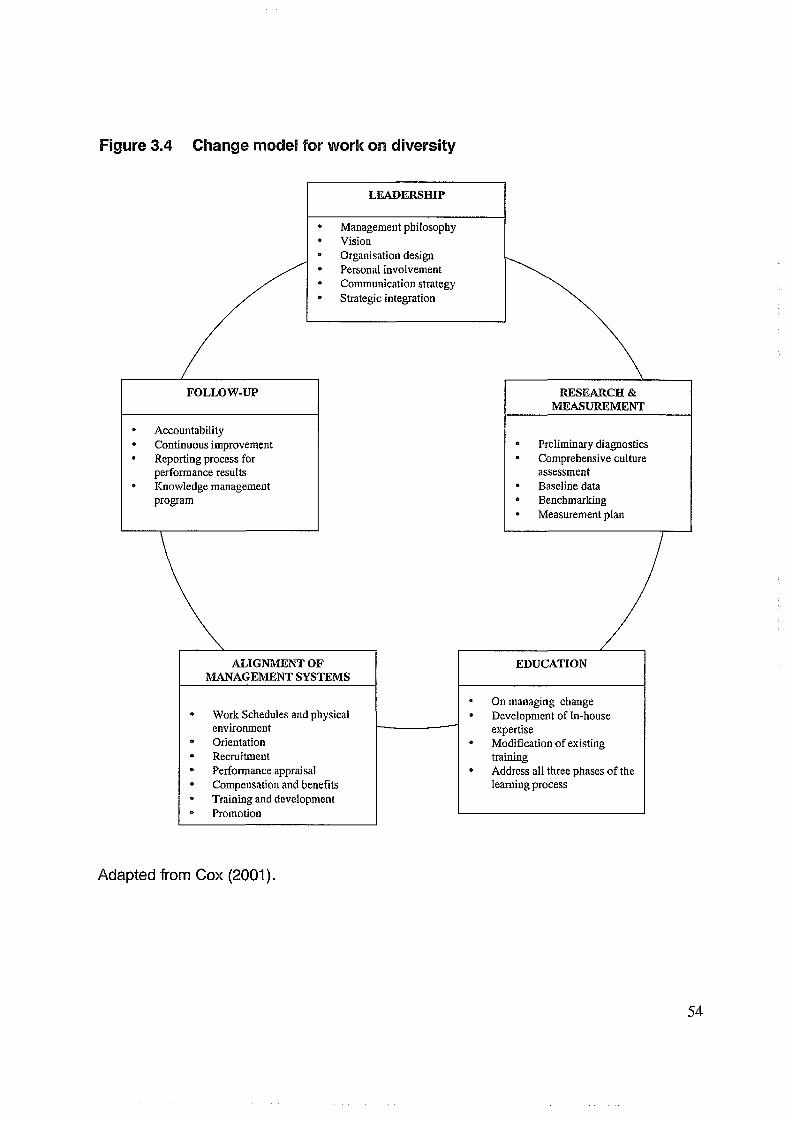
Figure 3.4 Change model for work on diversity
Adapted from Cox (2001).
54
3.6.4.1 Leadership
Cox (2001:18) regards leadership as “behavior that establishes direction or a goal for
change (a vision), provides a sense of urgency and the importance of the vision
facilitates the motivation of others and cultivates necessary conditions for the
achievement of the vision”. Leadership is regarded as central to any change effort,
without it the organisation lacks direction.
3.6A.2 Research and measurement
Cox (2001:20) regards research as a purposeful collection of data by which we can
answer questions about some environmental element or phenomenon. In the context of
organisational change, measurement means the use of research to keep record of the
progress of a change initiative. According to this model, successful organisational
change work must be well informed by relevant data, with results being systematically
measured at intervals during the process.
3.6.4.3 Education
Any change effort brings with it an element of learning. Education helps people to learn
new information and skills in order to survive in the changing world of work (Cox, 2001).
3.6.4.4 Alignment of management systems
Cox (2001:21) describes management systems as “any organisational policy, practice,
rule or procedure”. This also addresses the major human resources activities like
recruitment, promotion and development. AH these systems must be aligned with the
goals of leveraging diversity. In order to achieve this alignment of systems there is a
need for a fairly deep understanding of diversity and its effects.
55
3.6.4.5 Follow up
This component involves implementing action, establishing accountability for results and
capturing and recycling the learning so that the action steps become more precise. This
component overlaps with the other four components, but is linked more to the research
and measurement component (see figure 3.4) (Cox, 2001). This model by Cox (2001)
can be used in organisations that intend implementing diversity management strategies.
It indicates that it all starts with the leadership of the organisation for the diversity
initiative to work. Then the focus has to be on assessment of the current state of the
organisation, an intervention involving education about the change taking place
becomes necessary. Following this intervention there needs to be an alignment of
systems to the intervention and finally a foilow up or monitoring system needs to be in
place to monitor the change.
The model by Motwani, Harper, Subramanian and Douglas (1992), emphasises the role
of manager in managing diversity, and the human resources division carries all the
responsibility for the success of the programme. Models by Cox (2001), Gilbert, Stead
and Ivancevich (1999) and Rijamapianina and Maxwell (2002), denote that in recent
years organisations attempting to manage diversity recognise the importance of
leadership in the whole endeavour. Hence leadership initiates diversity management
programmes and their consistent support programme is emphasised.
3.7 ORGANISATIONAL CLIMATE AND DIVERSITY MANAGEMENT
This study investigates the relationship between organisational climate and diversity
management; therefore the literature explored these two concepts. Subsequently a
literature integration of the concepts diversity management and organisational climate is
discussed.
56
Hayes, Bartle and Major (2002) suggest that in order to create organisations that are
effective with diverse employee base, the organisational climate must be appropriate.
Hayes et al. (2002) indicate that diversity management moves beyond the isolated
implementation programs (e.g. diversity and sensitivity training) to the development of a
system-wide approach that involves alignment of organisational culture, reward systems
and policies and procedures. This view is also shared by Cox (2001).
Hayes et al. (2002) indicates that it is difficult to alter climate. Firstly climate for
opportunity can differ across individuals making it complicated to understand and
manage. The complexity of cognitive biases makes the task of managing perceptions a
challenge, while differences in values across individuals can make the establishment of
“fair” policies and procedures impossible.
Secondly, this theory supports the idea that an individual’s immediate work group is
important in the development of a climate for opportunity. For example behavior of
superior or co-worker will have a disproportionate influence on work group member’s
perceptions about the organisation. Levinson (1965) suggests that employees view
actions by agents of the organisation as actions of the organisation itself. For example,
an organisation may adopt an official policy against discrimination within the
organisation and the actions of a racist or a sexist supervisor will clearly undermine this
policy.
Diversity management efforts should be based on the principles of the systems theory.
According to Cox (2001) organisations are social systems. The following are the three
main categories of climate that must be examined when aligning systems in order to
manage diversity: time, space and people as listed below.
Time Factors
• Length of typical workday
9 Days of work per week
• Use of overtime
57
® Time-off policies (vacation, leave, personal days)
• Retirement policies
• Level of work schedule flexibility
Space Factors
• Cleanliness of workspace
• Extent to which physical barriers separate people at work
• Presence of class distinctions in specifications of physical spaces at work
People Process Factors
• Recruiting practices
• Promotion practices
e Compensation policies
• Performance appraisal practices
• Career development and succession planning practices.
Only a few factors within these categories will be discussed:
• Time-off policies
Time-off policies specify that employees are able to take paid and unpaid time off from
work. There is an increasing presence of participation of women in the workforce and
dual career couples. The most fundamental implication of these trends is that if your
organisation has more liberal time-off policies it would be a better position to attract,
retain and motivate a diverse workforce (Cox, 2001).
• Presence of class distinctions
A principle that is virtually universal in human systems is the tendency to organise social
groups into status hierarchies. In most societies we find clearly identifiable hierarchies
of gender, socio-economic class, work specialisation and race. An organisation’s
58
climate becomes more diversity friendly when it avoids or removes policies and
practices that tend to reinforce the existence of such hierarchies (Cox, 2001).
• Recruiting practices
The hiring practices of organisations’ need to reflect or foster diversity. New entrants in
the organisation must align better with diversity management. By reflecting diversity in
selection tools, this allows for the selection of recruits that deal easily with diversity
issues (Cox, 2001).
• Performance management
In addition to the elements of the performance management process, the diversity
management competency must be added, evaluated and rated. To include this,
competency specific behaviours should be indicated, that the organisation wants to
encourage from employees in order to foster a climate that is supportive of diversity
(Cox, 2001).
• Career development factors
This can be achieved by addressing the following issues:
• Job posting: advertising jobs so that people from all walks of life can see them and
apply. Also ensure that the screening process is fair which increases the diligent
consideration of all job applicants.
® Annual Development Planning: Personal development plans can be used for
development towards current jobs and it can also be used to a pool of qualified
members of unrepresentative employees for the development of future expected job
vacancies.
59
. Succession planning
It involves identifying individuals in an organisation who are potential replacements for
people occupying key jobs and ensuring that they get the development they need to fill
these jobs. Diversity can be brought into this process by ensuring that the profile of
succession planning candidates are representative of diversity dimensions like gender,
race and work specialisation. Secondly the organisation needs to ensure that possible
successors for key jobs are diversity competent (Cox, 2001).
3.7.1 Positive climate for diversity model, Hicks-Clarke and lies (2000)
The positive climate for diversity model (PCFD) was developed by Hicks-Clarke and lies
(2000). This model is based on the works of Kossek and Zonia (1993) and Cox (1993),
who developed a model of diversity based on the argument that, in order to have a
positive climate for diversity, then there must be a demographic mix of people at
management level in an organisation.
Kossek and Zonia (1993) propose that there is a relationship between climate and
diversity. They argue that in organisations, power is still held by white males and this
has created a homogeneous culture. Organisational climate seems to be influenced by
the power each group has. Kossek and Zonia (1993) postulate that removing the
barriers between the groups in the organisations would help remove prejudices. Kossek
and Zonia (1993) maintain that climates of organisations are affected by equal
opportunity policies, access to resources and opportunities in the organisation and by
how individuals and groups view these policies. Cox (1993) proposed a model of
creating a climate that is conducive to diversity, the interactional model of cultural
diversity. This model links human resources diversity to climate. In his model Cox
(1993) argues that an organisation which develops a climate which encourages and
supports all employees and in which all employees have equal opportunities will be
better positioned than their competitors, as their employees will be more motivated and
creative.
60
According to the positive climate for diversity (PCFD) model the following climate factors
are relevant to creating a positive climate for diversity. Firstly, individual characteristics
such as gender and managerial level, secondly, elements such as organisational
policies and thirdly the outcomes of the PCFD including job satisfaction and career
commitment at individual level, and at organisational level outcomes such as greater
efficiency, productivity and customer service may then flow from these positive
individual outcomes (Hicks-Clarke & lies, 2000). This model hypothesises that diversity
climate will affect a variety of individual level outcomes especially individual career and
organisational attitudes and perceptions. According to Hicks-Clarke and lies (2000),
diversity climate is said to include policy support for diversity and the perception of
organisational commitment, job satisfaction, career future satisfaction and satisfaction
with the manager. These factors are moderated by a variety of variables, such as
gender, ethnicity, age, marital status, care responsibilities, ability/disability and
management level. The primary aim of Hicks-Clarke and lies’s study was to explore the
impacts of diversity climate (as assessed by policy support for diversity and recognition
of equity i.e. organisational justice, support for diversity and recognition of need for
diversity) on a variety of individual career and organisational attitudes and perceptions,
such as organisational commitment, career satisfaction and satisfaction with manager
and career planning.
The secondary aim was to explore whether these impacts were moderated by age,
gender, ethnicity, managerial level, marital status, care responsibilities, disability/ability
and management level. The result of the study showed that the managerial attitudes
and perceptions towards a positive climate for diversity became more positive as
management level increased. The need for diversity at management levels in the
organisation also showed a significant difference with women believing that it was more
needed than men, but men believed the organisation supported diversity initiatives. In
general, the results of this study showed that a positive climate for diversity is strongly
related to the presence of positive organisational, job and career attitudes. The study by
Hicks-Clarke and flies (2000) recommends that in order for organisations to create a
61
positive climate for diversity they should consider elements such as diversity policies
and procedures. Hicks-Clarke and llles’s model highlights those elements of climate that
impact positively on diversity. Hicks-Clarke and files (2000) indicate that there is a
relationship between organisational climate and diversity.
3.8 CHAPTER SUMMARY
The concept diversity management was clarified and defined and the different
approaches to diversity management discussed. Various concepts and models were
also discussed and the relationship between diversity management and organisational
climate was addressed. Chapter 4 deals with the empirical research.
62
CHAPTER 4
EMPIRICAL RESEARCH
4.1 INTRODUCTION
Organisational climate and diversity management were discussed in chapters two and
three, respectively. This chapter will empirically examine the relationship between
organisational climate and diversity management.
4.2 OBJECTIVES OF THE STUDY
The primary objective of this study was to explore the relationship between
organisational climate and diversity management. The empirical objectives of this study
were to:
• determine the relationship between organisational climate and diversity
management.
• determine whether there are any differences between the different biographical
groups such as gender, race, age, years of service and employment status with
regards to their views of diversity management in their organisation.
4.3 SAMPLE IDENTIFIED
A sample of 4 549 employees of one South African retail company was used. This data
was made available by the Centre of Industrial and Organisational Psychology at the
University of South Africa (Unisa). The participants ranged from top management to
operational employees, covering all the biographical subgroups such as race, age,
years of service, employment status/level, gender and disability groups.
63
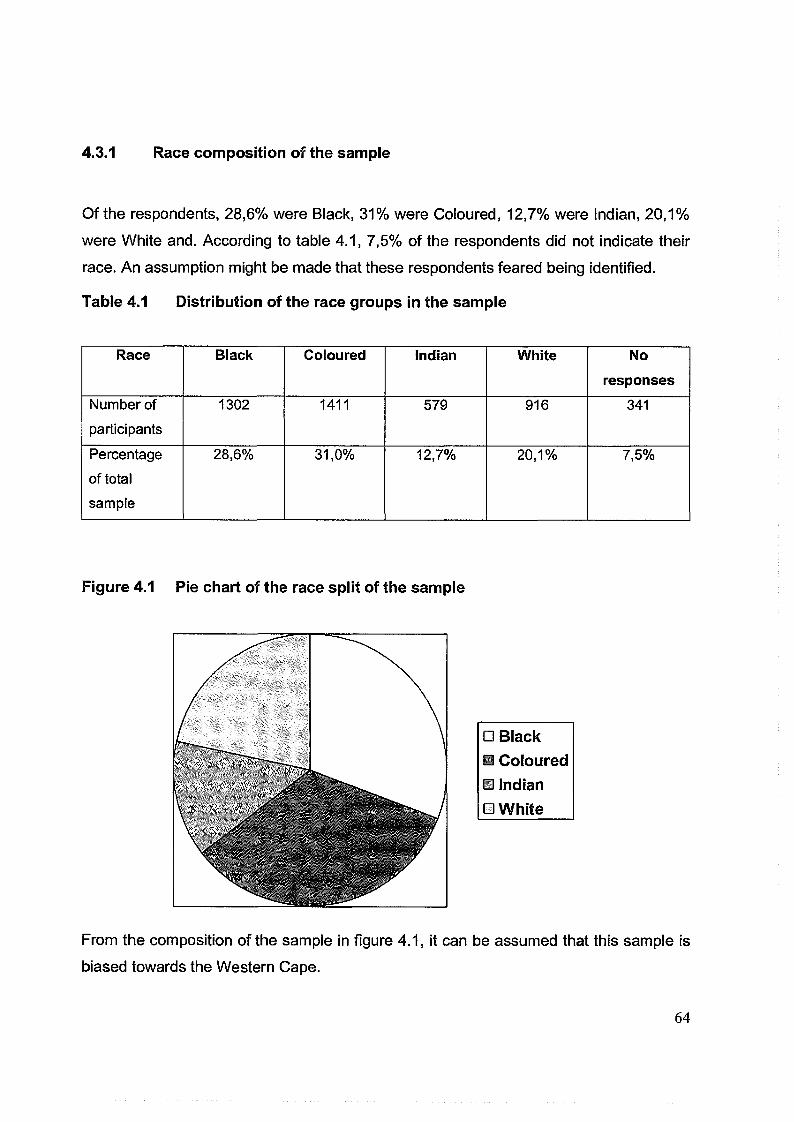
4.3.1 Race composition of the sample
Of the respondents, 28,6% were Black, 31% were Coloured, 12,7% were Indian, 20,1%
were White and. According to table 4.1, 7,5% of the respondents did not indicate their
race. An assumption might be made that these respondents feared being identified.
Table 4.1 Distribution of the race groups in the sample
Race Black Coloured Indian White No
responses
Number of
participants
1302 1411 579 916 341
Percentage
of total
sample
28,6% 31,0% 12,7% 20,1% 7,5%
Figure 4.1 Pie chart of the race split of the sample
□ Black■ Coloured H Indian□ White
From the composition of the sample in figure 4.1, it can be assumed that this sample is
biased towards the Western Cape.
64
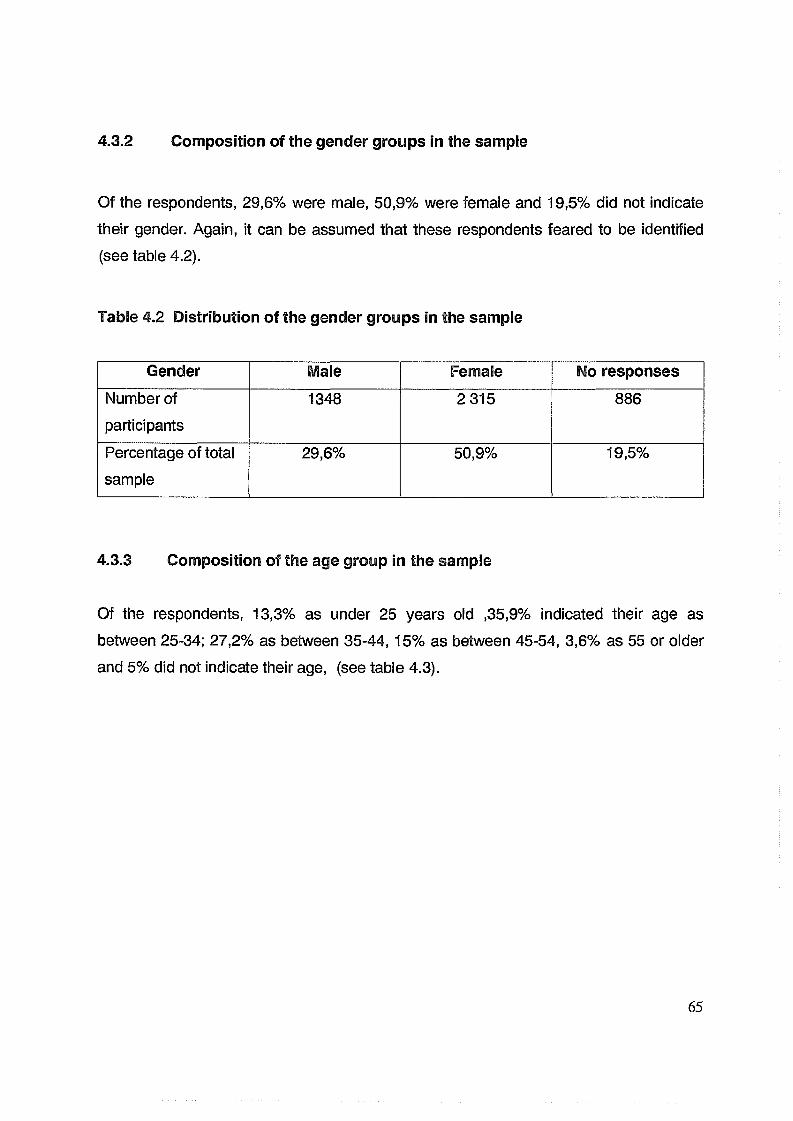
4.3.2 Composition of the gender groups in the sample
Of the respondents, 29,6% were male, 50,9% were female and 19,5% did not indicate
their gender, Again, it can be assumed that these respondents feared to be identified
(see table 4.2).
Table 4.2 Distribution of the gender groups in the sample
Gender Male Female No responses
Number of
participants
1348 2 315 886
Percentage of total
sample
29,6% 50,9% 19,5%
4.3.3 Composition of the age group in the sample
Of the respondents, 13,3% as under 25 years old ,35,9% indicated their age as
between 25-34; 27,2% as between 35-44,15% as between 45-54, 3,6% as 55 or older
and 5% did not indicate their age, (see table 4.3).
65
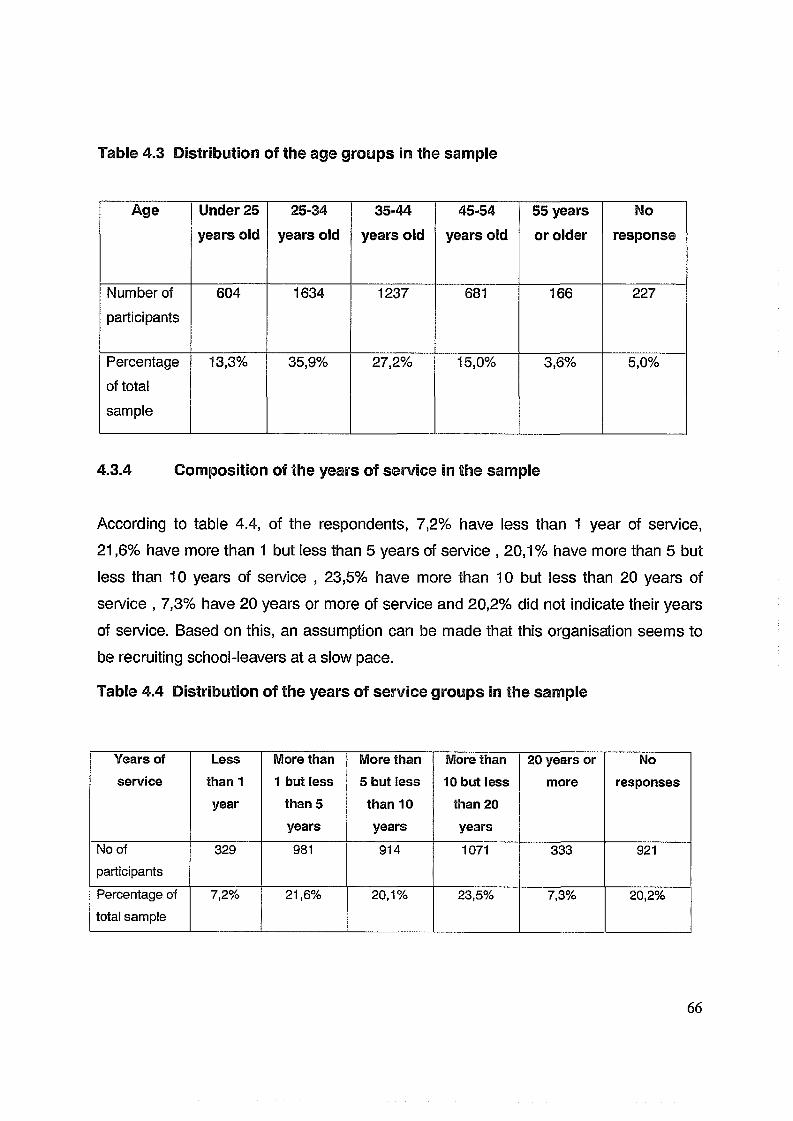
Table 4.3 Distribution of the age groups in the sample
Age Under 25 years old
25-34
years old35-44
years old45-54
years old55 years or older
Noresponse
Number of
participants
604 1634 1237 681 166 227
Percentage
of total
sample
13,3% 35,9% 27,2% 15,0% 3,6% 5,0%
4.3.4 Composition of the years of service in the sample
According to table 4.4, of the respondents, 7,2% have less than 1 year of service,
21,6% have more than 1 but less than 5 years of service , 20,1% have more than 5 but
less than 10 years of service , 23,5% have more than 10 but less than 20 years of
service , 7,3% have 20 years or more of service and 20,2% did not indicate their years
of service. Based on this, an assumption can be made that this organisation seems to
be recruiting school-leavers at a slow pace.
Table 4.4 Distribution of the years of service groups in the sample
Years of service
Less
than 1 year
More than
1 but less than 5
years
More than 5 but iess
than 10
years
More than
10 but less
than 20
years
20 years ormore
Noresponses
No ofparticipants
329 981 914 1071 333 921
Percentage of total sample
7,2% 21,6% 20,1% 23,5% 7,3% 20,2%
66
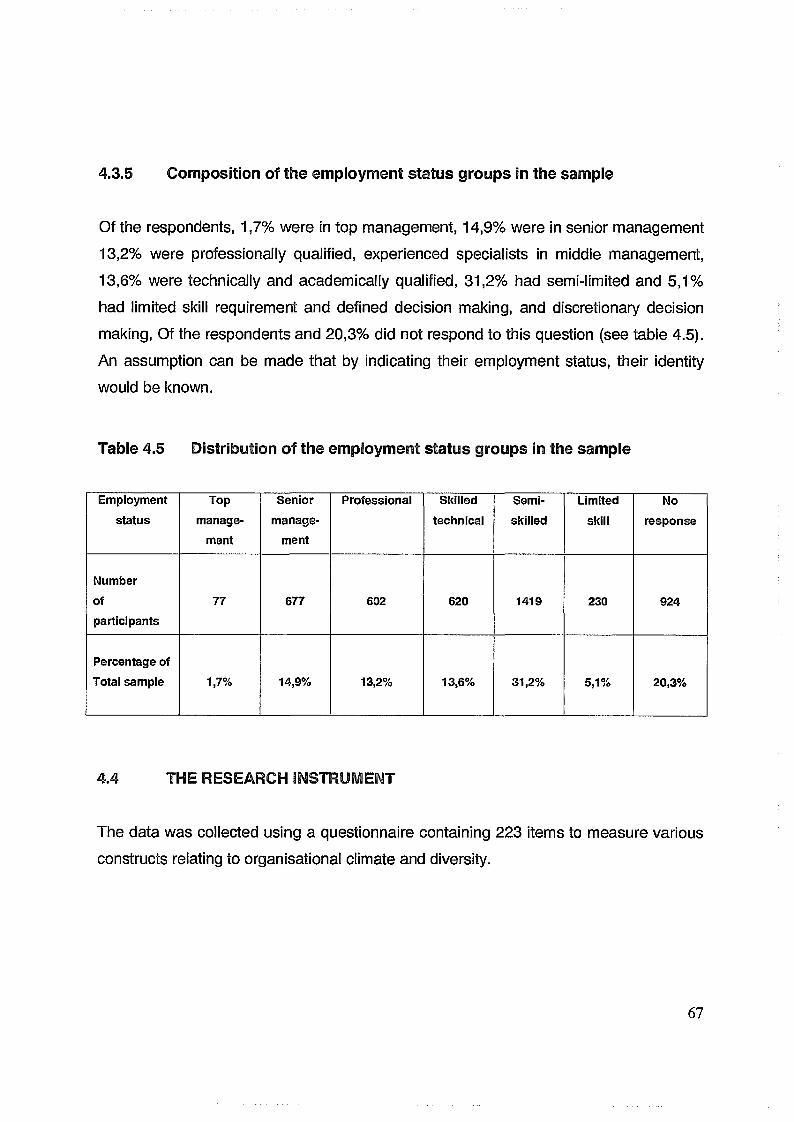
4.3.5 Composition of the employment status groups in the sample
Of the respondents, 1,7% were in top management, 14,9% were in senior management
13,2% were professionally qualified, experienced specialists in middle management,
13,6% were technically and academically qualified, 31,2% had semi-limited and 5,1%
had limited skill requirement and defined decision making, and discretionary decision
making, Of the respondents and 20,3% did not respond to this question (see table 4.5).
An assumption can be made that by indicating their employment status, their identity
would be known.
Table 4.5 Distribution of the employment status groups in the sample
Employmentstatus
Topmanage
ment
Seniormanage
ment
Professional Skilledtechnical
Semiskilled
Limited
skillNo
response
Numberofparticipants
77 677 602 620 1419 230 924
Percentage of Total sample 1,7% 14,9% 13,2% 13,6% 31,2% 5,1% 20,3%
4.4 THE RESEARCH INSTRUMENT
The data was collected using a questionnaire containing 223 items to measure various
constructs relating to organisational climate and diversity.
67
4.4.1 Rationale and background
In the years 2000/2001 the Centre for Industrial and Organisational Psychology at
UNISA conducted research to assist an organisation to identify its climate.
A sample of 4549 employees from a listed retail organisation consisting of seven
subsidiary companies with branches all over South Africa participated in the survey.
This questionnaire was developed and validated in a study in 2003. Kays and Cotiis (as
cited in Martins & Von der Ohe, 2003) categorised various dimensions labels and
through this process, eight dimensions of the universe of psychological climate
perceptions were identified, namely autonomy, cohesion, trust, pressure, support,
recognition, fairness and innovation. Of the thirteen dimensions that emerged from the
factor analysis in Martins and Von der Ohe’s study, diversity items were found under
policies and procedures, fairness of organisational practices and employment equity
(Martins & Von der Ohe, 2003).
4.4.2 Objective of the research instrument
The overall objective of the research instrument was to validate an organisational
climate questionnaire that was adapted and used during a phase of organisational and
environmental change (Martins & Von der Ohe, 2003).
4.4.3 Contents of the questionnaire
The questionnaire consisted of two sections. Section 1 focused on organisational
climate dimensions. These dimensions were measured on a scale of 1 to 5, ranging
from 1 strongly disagree, 2 disagree, 3 unsure, 4 agree to 5 strongly agree. Section 2
focused on the biographical information of the participants, such as age, years of
service with the organisation, employment status, business unit/branch, gender, race
and disability.
68
4.4.4 Dimensions measured
Martins and Von der Ohe’s (2003) questionnaire measured thirteen dimensions of
climate which are discussed below.
• Management and leadership style: This dimension includes managerial
functions, such as coaching, role of senior management, means to achieve
objectives and information sharing.
e Policies and procedures: This dimension focuses on the fairness of a number of
policies and procedures, such as recruitment, selection, promotions, succession
planning, diversity, HIV/AIDS and retention. All these procedures can influence
perception of fairness and equality in an organisation.
9 Attracting and retaining: This dimension grouped all the aspects of the reasons
why people join a company and why they stay, such as equal opportunities,
management quality, job security, advancement opportunities and work/life
balance.
• Fairness of organisational practices: This dimension focuses on different issues
that may be perceived as fair/unfair in an organisation, such as equality, gender,
racism, affirmative action, discipline and grievances.
• Training and development: This dimension focuses on elements of training and
development, such as providing training programmes, career development and
the application of training.
• Organisational values: This dimension focuses on the values of the organisation.
• Work environment: This dimension focuses on working conditions and set-up of
work environment that may influence employees5 job satisfaction or
effectiveness.
9 Recognition and rewards: This dimension focuses on rewards for and recognition
of good performance.
69
• Teamwork: This dimension focuses on aspects that impact on effective
teamwork, such as team trust, co-operation and motivation.
• Strategic focus: This dimension focuses on the overall satisfaction with
organisational vision and mission and their alignment with departmental and
individual objectives.
• Performance management: This dimension measures satisfaction with all
aspects of performance management, such as the performance agreement,
understanding of the process of, and training in performance management.
• Employment equity: This dimension focuses on the expectations and implication
of employment equity and processes needed to support it, such as diversity
management.
• Discrimination concerning promotions: This dimension focuses on discrimination
relating to promotions of the different races, gender, disability and age groups.
4,4.5 Validity and reliability of the questionnaire
4.4.5.1 Validity
Whiston (2000:68) describes validity as “concern with what the instrument measures
and how well it does the task”. Harriman (1980: 211) describes validity as “the degree to
which a psychological test or measure actually predicts the criterion or whatever it is
intended to measure”. Validation is the process of improving the predictive values of a
test or measure (Harriman, 1980).
Factor analysis was conducted to assess whether the instrument/measurement
measures substantive constructs. The principal component analysis (PCA) was used
with the aim of identifying minimal set of factors that accounted for a major portion of the
total variance of the original items, and the intercorrelations matrix was rotated
according to the varimax methods (Martins & Von der Ohe, 2003). The results of the
principal components analysis (PCA) showed that only seven items of the 223 items
had factor loadings of lower than 0,30 (Martins & Von der Ohe, 2003). A second order
70
factor analysis was conducted on factor 1, and four sub-factors were identified with
eigenvalues of greater than 1,00 (Martins & Von der Ohe, 2003).
According to Hair, Anderson, Tathem and Black (1995), all factors with eigenvalues of
1,00 or greater should be retained. This was applied in the current study. The above
results indicate that the factors identified in this measurement are valid.
4A.5.2 Reliability
Whiston (2000) explains reliability as the degree to which an instrument’s scores are
free from errors of measurement. Harriman (1980) describes reliability as the extent to
which a test or series of observations is dependable, self-consistent and stable. The
reliability of this questionnaire was determined by means of item analysis, using
Cronbach’s Alpha coefficient (Martins & Von der Ohe, 2003). The reliability score
ranges from (0,00 to 1,00) and 1,00 being a perfect reliability (Whiston, 2000).
The internal consistency of the thirteen dimensions varies from 0,8566 to 0,9723 (see
table 4.6).
71
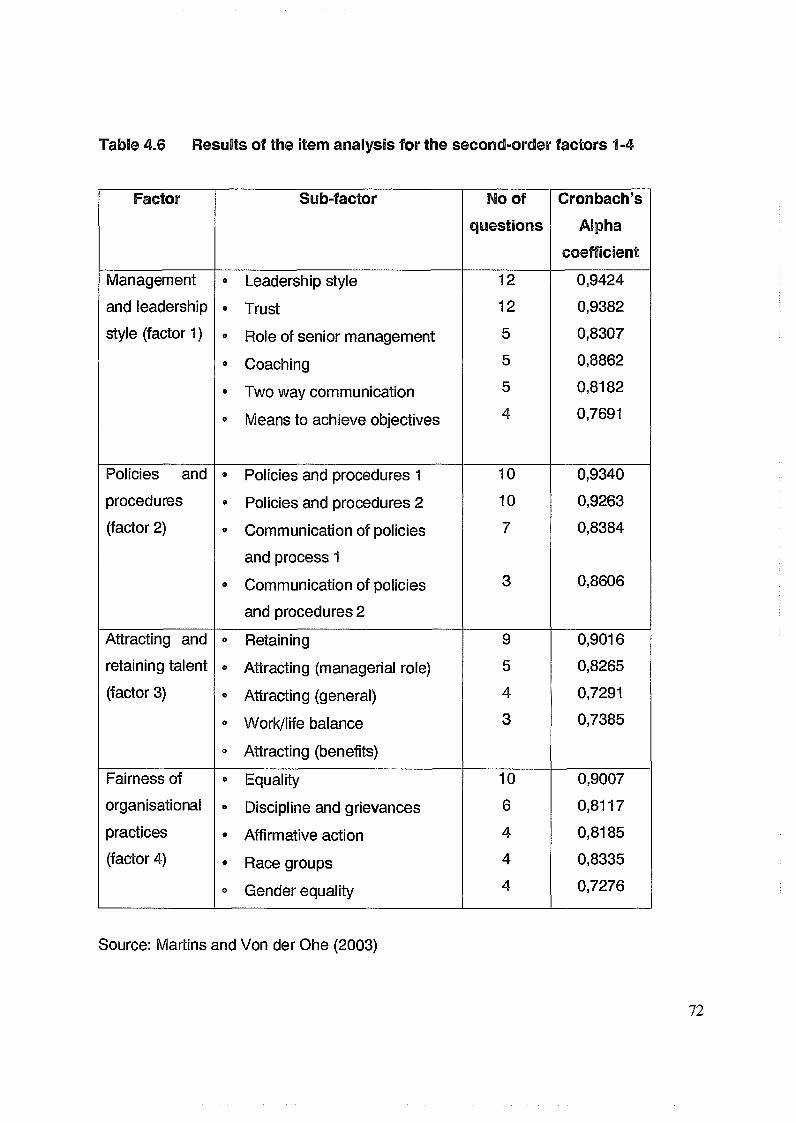
Table 4.6 Results of the item analysis for the second-order factors 1-4
Factor Sub-factor No of
questions
Cronbach’s
Alphacoefficient
Management 0 Leadership style 12 0,9424
and leadership 0 Trust 12 0,9382
style (factor 1) o Role of senior management 5 0,8307
© Coaching 5 0,8862
e Two way communication 5 0,8182
o Means to achieve objectives 4 0,7691
Policies and 0 Policies and procedures 1 10 0,9340
procedures & Policies and procedures 2 10 0,9263
(factor 2) o Communication of policies
and process 1
7 0,8384
0 Communication of policies
and procedures 2
3 0,8606
Attracting and © Retaining 9 0,9016
retaining talent o Attracting (managerial role) 5 0,8265
(factor 3) o Attracting (general) 4 0,7291
©
©
Work/life balance
Attracting (benefits)
3 0,7385
Fairness of 0 Equality 10 0,9007
organisational © Discipline and grievances 6 0,8117
practices © Affirmative action 4 0,8185
(factor 4) e Race groups 4 0,8335
© Gender equality 4 0,7276
Source: Martins and Von der Ohe (2003)
The above results indicate that the factors on these measures have an extremely good
reliability index.
4.4.6 JUSTIFICATION FOR USING THE INSTRUMENT
The current study focused on determining the relationship between organisational
climate and diversity management. The climate instrument developed by Martins and
Von der Ohe (2003) has items that measure both variables of the study: organisational
climate and diversity management.
Martins and Von der Ohe (2003) collected data, analysed the factors and the reliability
of the instrument (see section 4.4.5.2). A sample from the same retail company was
used, which is smaller than the one of the original study by Martins and Von der Ohe
(2003). This instrument was suitable for this study as it had been adapted to suit the
changing work environment of the retail company concerned. Dimensions adapted were
leadership style, diversity, organisational values, fairness of policies and procedures
were added (Martins & Von der Ohe, 2003).
4.5 DATA COLLECTION
In this study, the researcher used data collected by the Centre for industrial and
Organisational Psychology at UNISA. Data was analysed using the methodology
described below.
4.6 DATA ANALYSIS AND STATISTICAL ANALYSIS METHOD
The current study focused on the variables organisational climate as the dependent
variable and diversity management as independent variable. The statistical package
used was the Statistical Package for the Social Sciences (SPSS).
73
The following data analysis methods were used in the study to interpret the data:
1) A confirmatory factor analysis
2) Item analysis to identify the reliability index of the instrument
3) Correlation between the factors measuring diversity and those measuring
organisational climate
4) T-test results between males and females, their view on diversity
5) One-way ANOVA results between the employment status groups, their view on
diversity
6) One-way ANOVA results between the race groups, their view on diversity
7) One-way ANOVA results between age groups on their view of diversity
8) One-way ANOVA results between the years of service of the employees, their view
on diversity.
4.6.1 Factor analysis
In order to determine the validity of the current study factor analysis was conducted.
Harriman (1980:60) defines factor analysis as “ a procedure for analysing the
intercorrelations among arrays of scores in order to determine those factors, real or
hypothetical involved” . Factor analysis was conducted to ensure that organisational
climate and diversity management factors are measured by the instrument. This
involved supporting the factors analysis results found in Martins and Von der Ohe
(2003).
In order to do this, Principal Component Analysis (PCA) was used, and to determine
intercorrelations, the Varimax method and covariances were used. The Principal
Component Analysis (PCA) was used because it maximizes the sum of variances of
required loadings of the factor matrix. This method indicates a clear positive or negative
association between the variable and the factor or lack of relationship thereof (Hair,
Anderson, Tathem & Black, 1995).
74
The varimax method was used because it is an orthogonal rotation method which
minimises the number of variables that have high loadings on each factor, thus it
simplifies the interpretation of the factors. The latent root criterion which specifics that all
factors with eigenvalues of unity (1,00) or greater should be retained, was used. In the
present study ail factor loadings with less than 0,30 were considered not significant.
4.6.2 Item analysis
In determining the reliability of the study, internal consistency was determined. Due to
the scale used in the measuring instrument, Cronbach’s Alpha coefficient was used to
determine the reliability, taking into consideration the variance of each item. The range
is between (0,00 to 1,00) with 1,00 indicating a perfect reliability (Whiston, 2000).
4.6.3 Correlation
Tilley (1990:2) describes correlation as “ the relationship where changes in one variable
are associated with, but not necessarily directly cause or produce changes in another
variable” . In supporting the main aim of the empirical study, a correlation between
organisational climate and diversity was conducted. The study focused on the two
characteristics of correlation, namely the type and strength of the relationship. To
determine the type of relationship between these two variables the linear or non-linear
relationship between them was determined. The best descriptor for this investigation is
the correlation coefficient. The study also determined the strength of the relationship
between the variables of the study.
4.6.4 T-tests
Dyer (1995) states that a T-test is a powerful parametric procedure, which compares the
means of the two sets of scores in order to determine whether the differences between
them are significant at the chosen level of probability. The independent subject’s version
was used. The t-statistic was used for analysis, which reflects the magnitude of the
75
difference between the means. In partially meeting the second empirical aim of the
study, namely to determine whether any differences existed between males and
females on their view of diversity, the significance level of the T-test was set at 0,05.
4.6.5 One-way ANOVA
In meeting the second empirical aim of the study, namely to determine whether any
differences existed between the different biographical groups, such as age, race, years
of service and employment status, with regard to their view of diversity in their
organisation, one-way ANOVA was used to determine between and within groups
differences. The Bonferroni alpha was used to determine any significant differences
between the groups whilst conducting the post hoc analysis. This statistic focuses on
the variability between the group means. The Bonferroni test was chosen because
when only the One-way ANOVA is conducted, it does not indicate clearly which specific
sub-groups are significant or not significant. According to Howell (1995), the Bonferroni
test is an acceptable compromise between the Fisher and Scheffe tests. The main
advantage of using the Bonferroni test is that it allows the researcher to compare the
means of the data collected. This study focused on the variance of scores within groups
and between the groups. In performing the one-way ANOVA, the null-hypothesis was
tested.
4.6.6 Effect size and power of a test
Due to the large sample size of the study, it was decided to determine the effect size of
the sample in order to establish the level of errors in the sample. Howell (1995:270)
defines effect size as “ the difference between two populations means divided by the
standard deviation of either population” . Effect size is also regarded as the probability of
rejecting the null hypothesis (Graziano & Raulin, 2000). It is important to look beyond
the level of significance in our interpretation to also look at the effect size.
76
Power is regarded by Howeli (1999) as the probability of correctly rejecting a false null
hypothesis. The power of an instrument is very high if it is in the 0, 80’s and low if it is in
the 0, 30’s.
4.7 CHAPTER SUMMARY
This chapter discussed the methodology by focusing on the objectives of the study,
sample, instrument and data collection. Chapter 5 discusses the data analysis and
interpretation, and the results of the present study.
77
CHAPTER 5
DATA ANALYSIS AND INTERPRETATION
5.1 INTRODUCTION
Chapter 4 discussed the research methodology in examining the relationship between
diversity management and organisational climate. This chapter describes the data
analysis and interpretation.
5.2 FACTOR ANALYSIS
Factor analysis was done with the aim of extracting the minimum number of factors
representative of the data.
The latent root criterion (see chapter 4) was supported by the Scree-tail test, an
approach used to identify the optimum number of factors that can be extracted before
the amount of unique variance begins to dominate the common variance structure. The
shape of the resulting curve is used to evaluate the cut-off point. The point at which the
curve first begins to straighten out indicates the maximum number of factors to extract
(Hair, Anderson, Tathem & Black, 1995). In determining the number of factors to
extract, eigenvalues were set at 1,0 together with the Scree-test criterion. The results
are represented in figure 5.1.
78
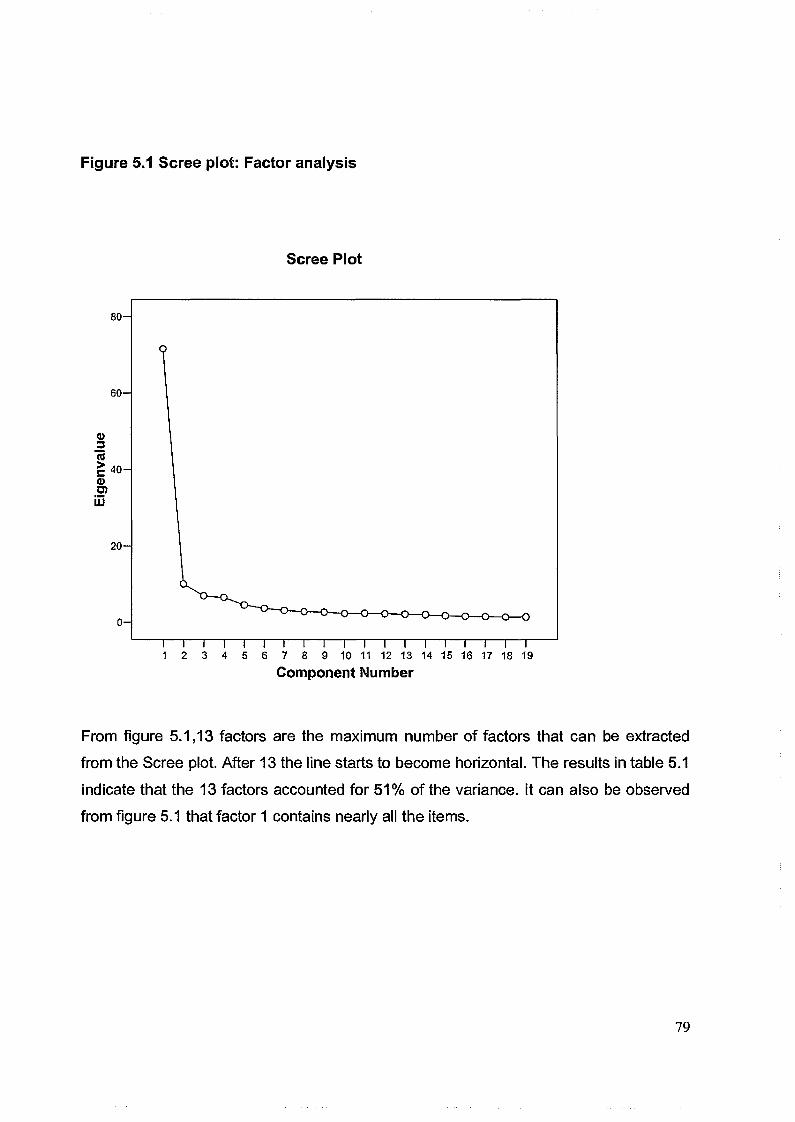
Figure 5.1 Scree plot: Factor analysis
Scree Plot
Component Number
From figure 5.1,13 factors are the maximum number of factors that can be extracted
from the Scree plot. After 13 the line starts to become horizontal. The results in table 5.1
indicate that the 13 factors accounted for 51% of the variance, it can also be observed
from figure 5.1 that factor 1 contains nearly all the items.
79
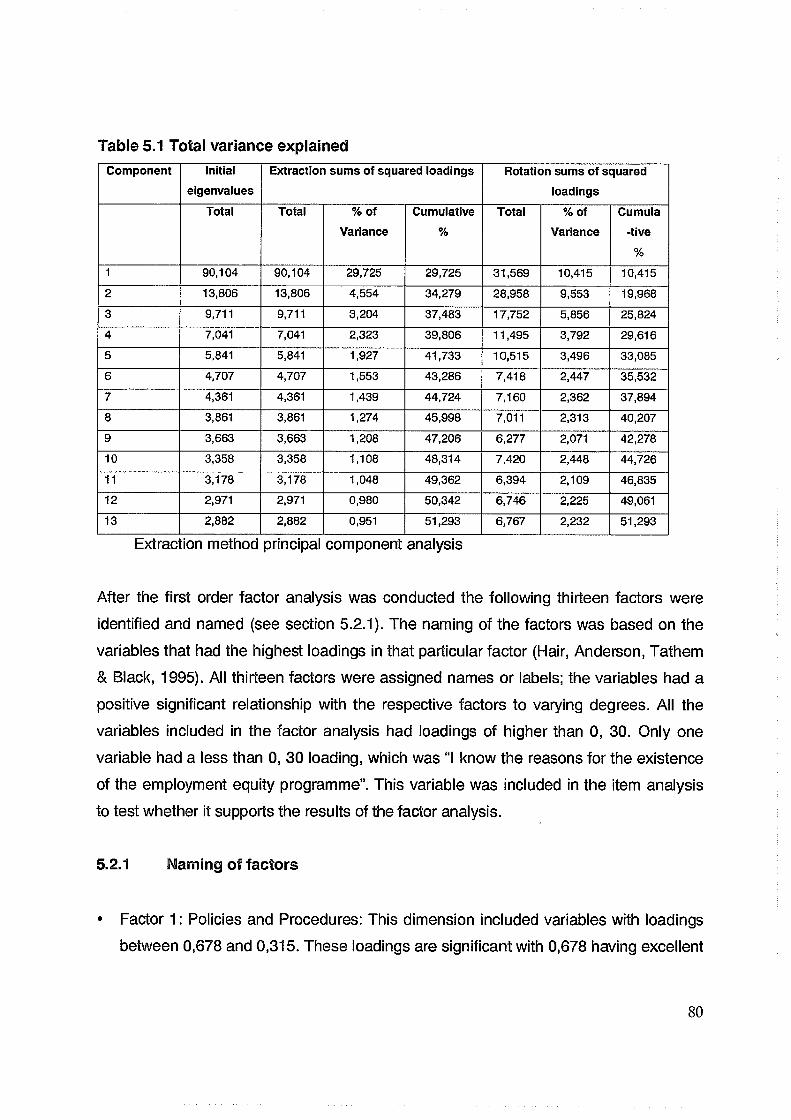
Table 5.1 Total variance explainedComponent Initial
eigenvalues
Extraction sums of squared loadings Rotation sums of squared
loadings
Total Total %Of
Variance
Cumulative
%
Total %Of
Variance
Cumula
-tive
%
1 90,104 90,104 29,725 29,725 31,569 10,415 10,415
2 13,806 13,806 4,554 34,279 28,958 9,553 19,968
3 9,711 9,711 3,204 37,483 17,752 5,856 25,824
4 7,041 7,041 2,323 39,806 11,495 3,792 29,616
5 5,841 5,841 1,927 41,733 10,515 3,496 33,085
6 4,707 4,707 1,553 43,286 7,418 2,447 35,532
7 4,361 4,361 1,439 44,724 7,160 2,362 37,894
8 3,861 3,861 1,274 45,998 7,011 2,313 40,207
9 3,663 3,663 1,208 47,206 6,277 2,071 42,278
10 3,358 3,358 1,108 48,314 7,420 2,448 44,726
11 3,178 3,178 1,048 49,362 6,394 2,109 46,835
12 2,971 2,971 0,980 50,342 6,746 2,225 49,061
13 2,882 2,882 0,951 51,293 6,767 2,232 51,293
Extrac ion method principal component analysis
After the first order factor analysis was conducted the following thirteen factors were
identified and named (see section 5.2.1). The naming of the factors was based on the
variables that had the highest loadings in that particular factor (Hair, Anderson, Tathem
& Black, 1995). All thirteen factors were assigned names or labels; the variables had a
positive significant relationship with the respective factors to varying degrees. All the
variables included in the factor analysis had loadings of higher than 0, 30. Only one
variable had a less than 0, 30 loading, which was “I know the reasons for the existence
of the employment equity programme”. This variable was included in the item analysis
to test whether it supports the results of the factor analysis.
5.2.1 Naming of factors
e Factor 1: Policies and Procedures: This dimension included variables with loadings
between 0,678 and 0,315. These loadings are significant with 0,678 having excellent
80
loading and 0,315 having moderate loading. This dimension includes policies and
procedures on issues such as discrimination, recruitment, selection succession
planning, HIV/AIDS, discipline and retention. It also encompasses diversity
management and initiatives. The highest loading variable on this factor was “Unfair
discrimination regarding promotions towards Blacks”.
• Factor 2: Management and leadership: This dimension had variables loading
between 0,773; which is extremely good and 0,335 which has moderate loading.
This dimension deals with the management style in the organisation, the support the
management gives to employees, and overall the way management relates to
employees. The highest loading variable on this factor was “My immediate
manager’s style is participative”.
• Factor 3: Attraction and retention: This factor had items loading between 0,678 and
0,462 which are significant. The dimension deals with attraction and retention factors
in the organisation that make employees come and stay with the organisation. The
highest loading variable on this factor was “equal opportunity is a factor in my
decision to come to the company”.
• Factor 4: Employee development: This dimension had items loading between 0,724
and 0,507 which are highly significant. This dimension covered training,
development, the type of training offered and the opportunities to go for training. It
also dealt with the career development within the organisation. The highest loading
variable on this factor was “Organisation A provides training programmes that meet
my personal development needs”.
• Factor 5: Organisation values: This dimension had items loading between 0,631 and
0,440 which are highly significant. This dimension includes the way things are done
in the organisation and the organisation’s values. The highest loading variable on
this factor was “Organisation A treats all staff like family”.
• Factor 6: Strategic Focus: This dimension has items loading between 0,469 and
0,309 which are significant. This dimension includes the direction of the
organization, its goals and objectives, the buy-in of the employees into the strategy
of the organisation. The highest loading variable on this factor was”! know the values
of the company”.
81
• Factor 7: Information management: This dimension had items loading between
0,540 and 0,412 which are significant. The dimension includes the way the
organisation distributes information, if it is effective or not and the sources that they
use. The highest loading variable on this factor was "the following source supplies
me with sufficient information about Organisation A and my work environment: Early
morning training sessions (EMT’s)”.
• Factor 8: Relationships: This dimension had items loading from 0,694 to 0,306 which
are significant. This dimension includes support in and between departments, trust in
the organisation and teamwork among employees. The highest loading variable on
this factor was “in my department we motivate and support each other”.
• Factor 9: Employment equity: This dimension had items loading between 0,534 and
0,412 which are significant. This dimension includes how employees view
employment equity, its impact on them and whether they support it or not. The
highest loading variable on this factor was “Whites do not have any fears because of
employment equity”.
• Factor 10: Physical environment: This dimension had items loading between 0,701
and 0,393 which ranges from being highly significant to significant. This dimension
includes the state of recreational facilities, canteens and the physical-working
environment. The highest loading variable on this factor was “the canteen is always
in a clean and hygienic state”.
• Factor 11: Technology: This dimension had items loading between 0,580 and 0,336
which were significant. This dimension includes resources needed to accomplish
tasks, including technology, equipment, work methods and clear job descriptions.
The highest loading variable on this factor was “the resource I use to carry out my
work is sufficient”.
• Factor 12: Performance management: This dimension had items loading between
0,619 and 0,468 which range from being highly significant to being significant. This
dimension includes knowledge about the performance management system and
how regularly it is done. The highest loading variable on this factor was “I have been
trained or prepared in the performance management system”.
• Factor 13: Rewards: This dimension had items loading between 0,715 and 0,434,
82
which ranges from being highly significant to being significant. This dimension
includes salary, how market-related it is, benefits, promotion prospects and
incentives schemes. The highest loading variable on this factor was “my salary
matches the responsibilities I have”.
5.2.2 Naming of the second order factors for factor 1
A secondary factor analysis on factor 1 was done. Eight factors emerged in the second
order factor analysis. The second variable in the study, diversity management, did not
come out as a factor in the original factor analysis, it loaded as the second highest
variable in factor 1, after the secondary factor analysis (see section 5.2.1). The sub
factors were named according to the principle of the highest loading variable in that
particular factor (Hair, Anderson, Tathem & Black, 1995). All the variables in the second
factor analysis had factor loadings of higher than 0, 30 except for one, “I know how
employment equity will affect me”, had a factor loading of 0,297. In total, eight sub
factors were identified and they are discussed below:
Diversity management: The following sub-dimension deals with diversity in the
workplace, how it is managed, it focuses on the different cultures in the organisation,
the relations between the different cultures, the way jobs are assigned to all the races in
the organisation, the level at which the organisation is genuine at trying to improve race
relations in the organisation and the accommodation of the different ethnic cultures in
the organisation.
Policy and procedures on job-related issues: This sub-dimension focuses on the
fairness of policy and procedures on performance and evaluation, job assignments,
training and development, corporate culture and retention measures.
Policy and procedures on recruitment and selection: This sub-dimension focuses on
fairness of selection, recruitment, advertising of positions, job classification and grading,
promotions, and transfers.
83
Employee relations: This sub-dimension focuses on how seriously management takes
its employees, It deals with issues of whether management takes issues that matter to
employees seriously, the ideas that they come up with and the fairness with which they
treat their employees.
Discrimination: This sub-dimension deals with discrimination in the organisation, in
terms of promotion for the different races, people with disabilities, women and specific
age groups.
Gender issues: This sub-dimension deals with the way the organisation treats women,
regarding sexual harassment, opportunities for advancement and also the extent to
which the organisation regards them as an asset.
Favouritism: This sub-dimension deals with issues of favouritism and tokenism, the
extent to which these practices are prevalent in the organisation.
Equality in conditions of employment: This sub-dimension deals with the extent to which
employees on the same level receive equal working conditions, equal benefits and pay.
5.2.3 Discussion of results: factor analysis
The results obtained from the factor analysis are indicative of dimensions in
organisational climate. With regard to the focus of the study, namely the relationship
between organisational climate and diversity, the results of the original factor analysis
found thirteen organisational climate dimensions, and diversity management was not
one of them. Diversity management emerged as a sub-factor in factor 1, policies and
procedures with the first item of diversity loading at 0,532, which is very significant. The
seven sub-dimensions seem to measure fairness in the organisation. The factor
employment equity emerged as factor to be measured in future climate surveys
especially in the South African context and in other international organisations. The
84
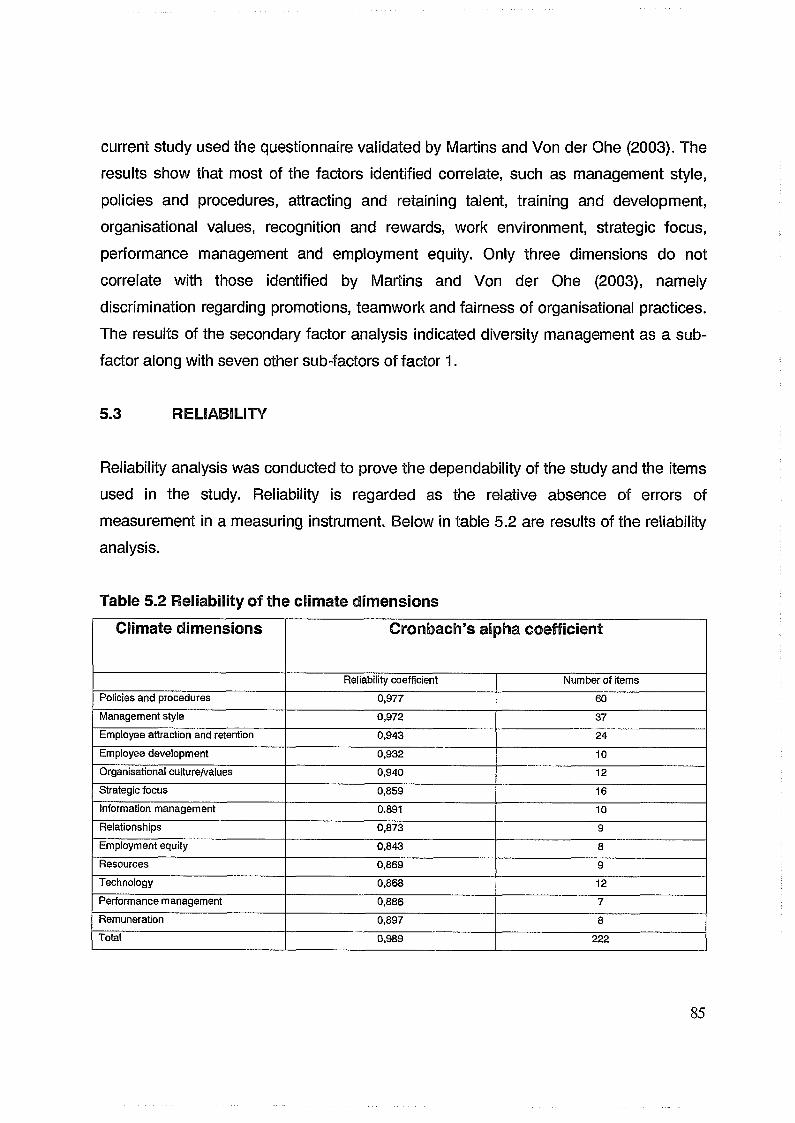
current study used the questionnaire validated by Martins and Von der Ohe (2003). The
results show that most of the factors identified correlate, such as management style,
policies and procedures, attracting and retaining talent, training and development,
organisational values, recognition and rewards, work environment, strategic focus,
performance management and employment equity. Only three dimensions do not
correlate with those identified by Martins and Von der Ohe (2003), namely
discrimination regarding promotions, teamwork and fairness of organisational practices.
The results of the secondary factor analysis indicated diversity management as a sub
factor along with seven other sub-factors of factor 1.
5.3 RELIABILITY
Reliability analysis was conducted to prove the dependability of the study and the items
used in the study. Reliability is regarded as the relative absence of errors of
measurement in a measuring instrument. Below in table 5.2 are results of the reliability
analysis.
Table 5.2 Reliability of the climate dimensions
Climate dimensions Cronbach’s alpha coefficient
Reliability coefficient Number of items
Policies and procedures 0,977 60
Management style 0,972 37
Employee attraction and retention 0,943 24
Employee development 0,932 10Organisational culture/values 0,940 12
Strategic focus 0,859 16
Information management 0.891 10Relationships 0,873 9
Employment equity 0,843 8
Resources 0,869 9
Technology 0,868 12
Performance management 0,886 7
Remuneration 0,897 8
Total 0,989 222
85
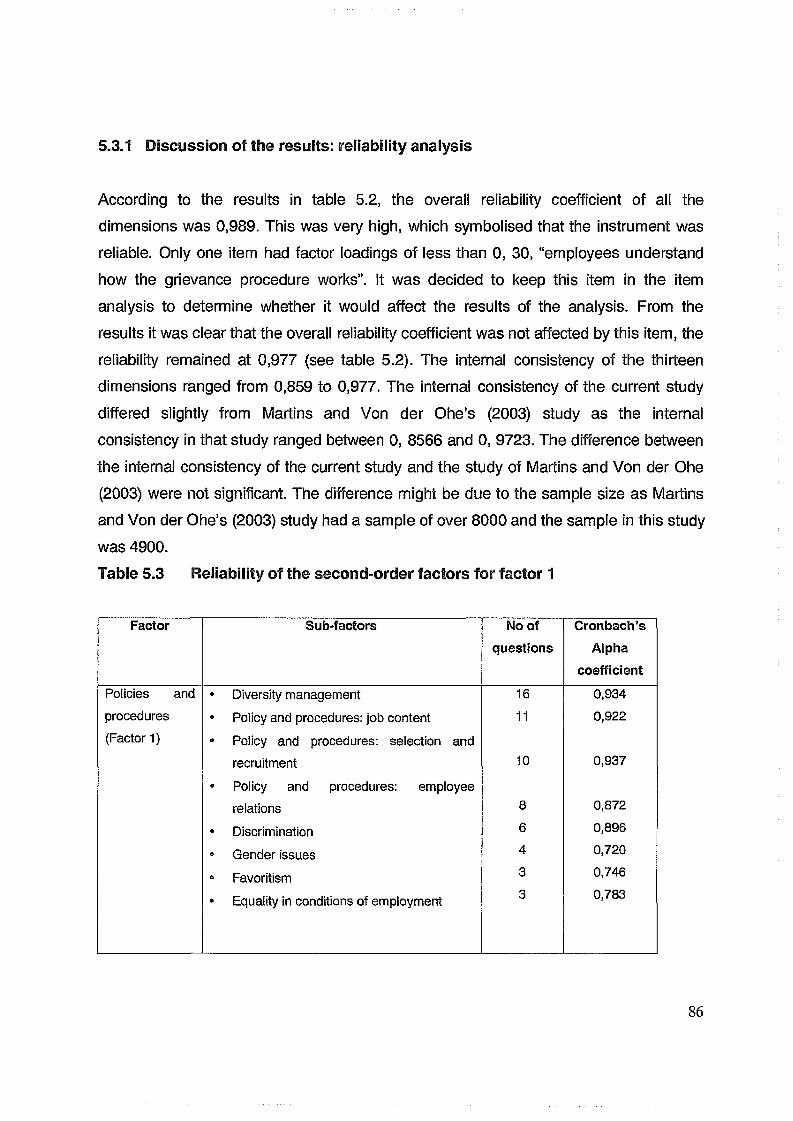
5.3.1 Discussion of the results: reliability analysis
According to the results in table 5.2, the overall reliability coefficient of all the
dimensions was 0,989. This was very high, which symbolised that the instrument was
reliable. Only one item had factor loadings of less than 0, 30, “employees understand
how the grievance procedure works”. It was decided to keep this item in the item
analysis to determine whether it would affect the results of the analysis. From the
results it was clear that the overall reliability coefficient was not affected by this item, the
reliability remained at 0,977 (see table 5.2). The internal consistency of the thirteen
dimensions ranged from 0,859 to 0,977. The internal consistency of the current study
differed slightly from Martins and Von der Ohe’s (2003) study as the internal
consistency in that study ranged between 0, 8566 and 0, 9723. The difference between
the internal consistency of the current study and the study of Martins and Von der Ohe
(2003) were not significant. The difference might be due to the sample size as Martins
and Von der Ohe’s (2003) study had a sample of over 8000 and the sample in this study
was 4900.
Table 5.3 Reliability of the second-order factors for factor 1
Factor Sub-factors No of questions
Cronbach’sAlpha
coefficientPolicies and o Diversity management 16 0,934procedures 0 Policy and procedures: job content 11 0,922(Factor 1) © Policy and procedures: selection and
recruitment 10 0,937
© Policy and procedures: employee
relations 8 0,872
9 Discrimination 6 0,896
e Gender issues 4 0,720
a Favoritism 3 0,746
0 Equality in conditions of employment 3 0,783
86
From table 5.3 it is clear that sub-factors diversity management, policy and procedures:
job content, policy and procedures: selection and recruitment, policy and procedures:
employee relations, discrimination and gender issues were reliable. The sub-factors
gender issues, favouritism and equality in conditions of employment had a reliability of
below 0, 80, which indicated that their reliability is lower, still acceptable as they are
above 0, 70.
5.4 CORRELATION
The main empirical aim of the study was to determine the relationship between
organisational climate and diversity management. In order to establish the relationship
between diversity management and organisational climate, a correlational study was
carried out.
5.4.1 Correlation between diversity management and all organisational
climate dimensions
The level of significance was set at 0, 01 level (2-tailed). According to the results in
table 5.4, there was a relationship between diversity management and all the other
organisational climate dimensions identified from factor analysis conducted in section
5.2.1. The correlation coefficient between diversity management and all the other
organisational climate dimensions was 0,775, which was high. This correlation
coefficient indicated that the relationship between these two dimensions is strong and
positive.
87
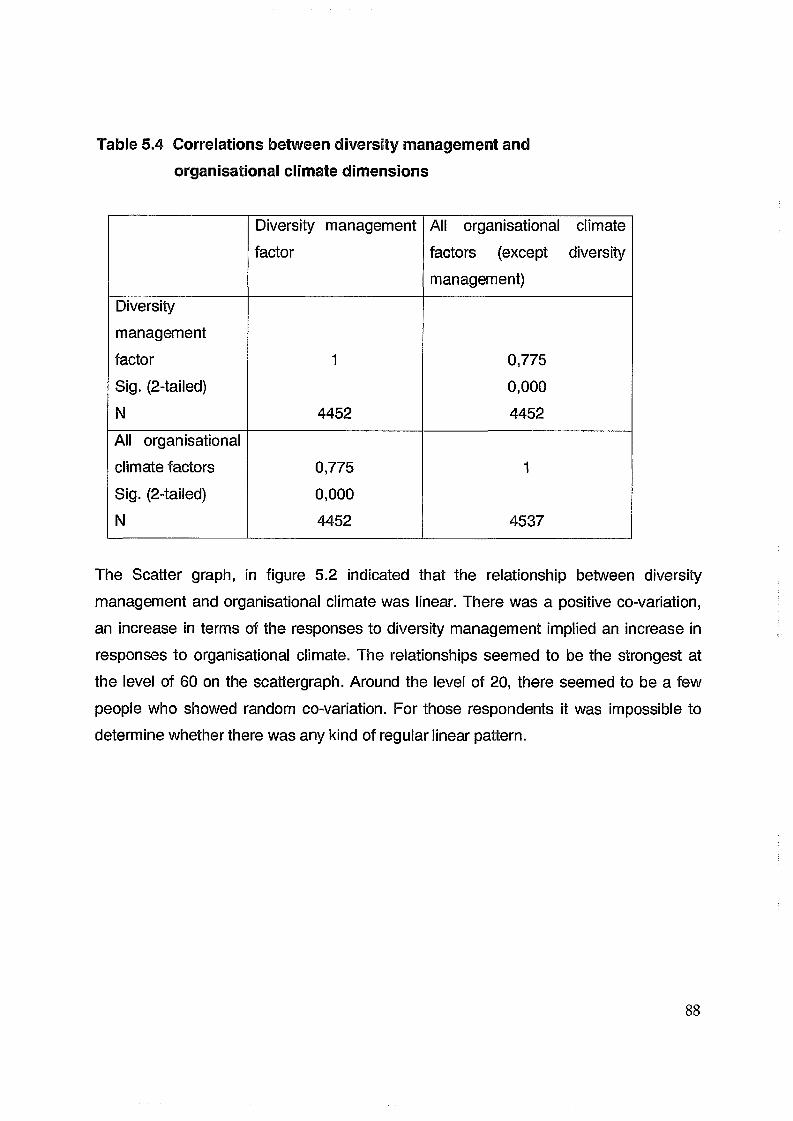
Table 5.4 Correlations between diversity management andorganisational climate dimensions
Diversity management
factor
All organisational climate
factors (except diversity
management)
Diversity
management
factor 1 0,775
Sig. (2-tailed) 0,000
N 4452 4452
All organisational
climate factors 0,775 1
Sig. (2-tailed) 0,000
N 4452 4537
The Scatter graph, in figure 5.2 indicated that the relationship between diversity
management and organisational climate was linear. There was a positive co-variation,
an increase in terms of the responses to diversity management implied an increase in
responses to organisational climate. The relationships seemed to be the strongest at
the level of 60 on the scattergraph. Around the level of 20, there seemed to be a few
people who showed random co-variation. For those respondents it was impossible to
determine whether there was any kind of regular linear pattern.
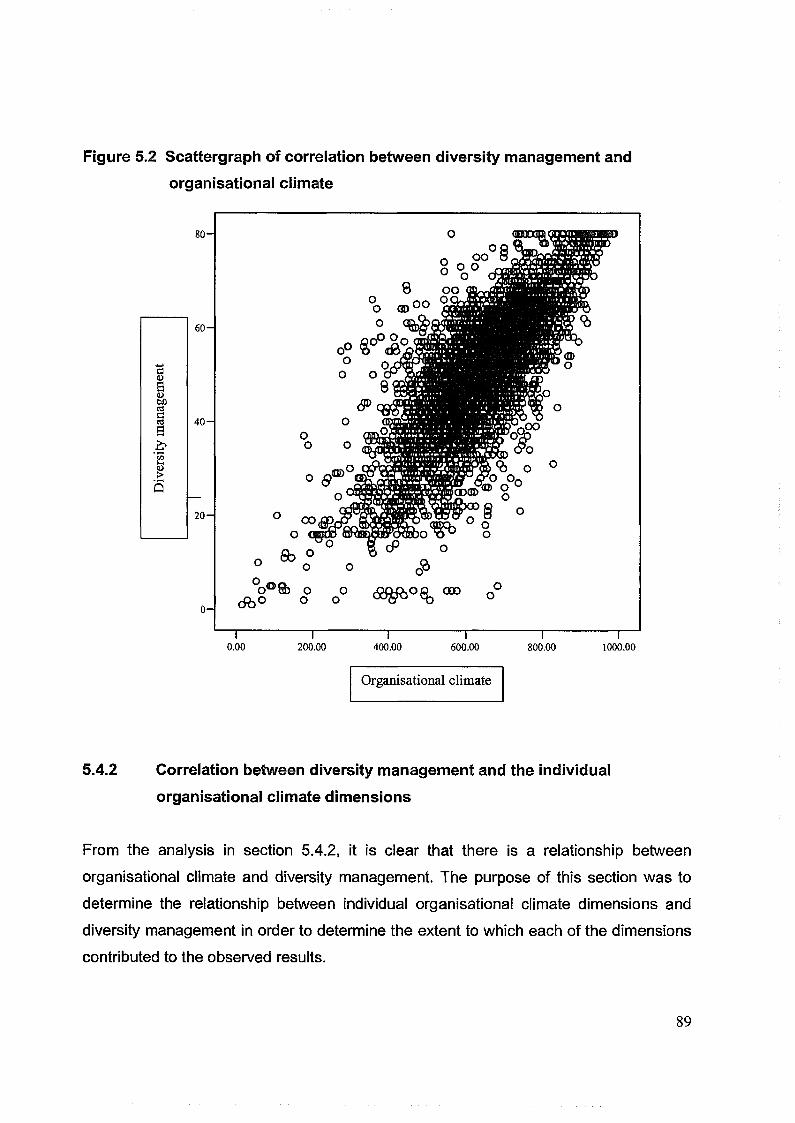
Figure 5.2 Scattergraph of correlation between diversity management andorganisational climate
a<L>B<DtoS3GcOB
8 0 -
6 0 -
4 0 -
20-
0-
o° § °°«a°o
6b °
o6b° ° 000 oc
0.00T
200.00 400.00 600.00 800.00 1000.00
Organisational climate
5.4.2 Correlation between diversity management and the individual
organisational climate dimensions
From the analysis in section 5.4.2, it is clear that there is a relationship between
organisational climate and diversity management. The purpose of this section was to
determine the relationship between individual organisational climate dimensions and
diversity management in order to determine the extent to which each of the dimensions
contributed to the observed results.
89
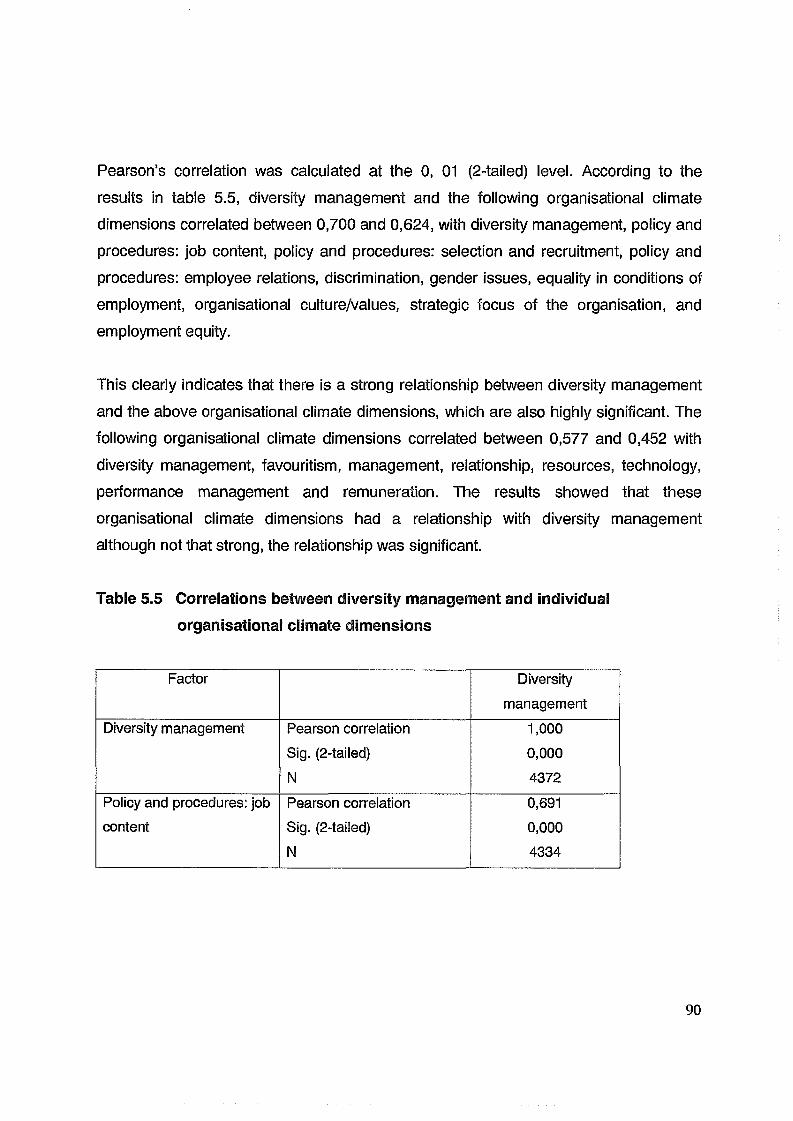
Pearson’s correlation was calculated at the 0, 01 (2-tailed) level. According to the
results in table 5.5, diversity management and the following organisational climate
dimensions correlated between 0,700 and 0,624, with diversity management, policy and
procedures: job content, policy and procedures: selection and recruitment, policy and
procedures: employee relations, discrimination, gender issues, equality in conditions of
employment, organisational culture/values, strategic focus of the organisation, and
employment equity.
This clearly indicates that there is a strong relationship between diversity management
and the above organisational climate dimensions, which are also highly significant. The
following organisational climate dimensions correlated between 0,577 and 0,452 with
diversity management, favouritism, management, relationship, resources, technology,
performance management and remuneration. The results showed that these
organisational climate dimensions had a relationship with diversity management
although not that strong, the relationship was significant.
Table 5.5 Correlations between diversity management and individual organisational climate dimensions
Factor Diversity
management
Diversity management Pearson correlation 1,000
Sig. (2-tailed) 0,000
N 4372
Policy and procedures: job Pearson correlation 0,691
content Sig. (2-tailed) 0,000
N 4334
90
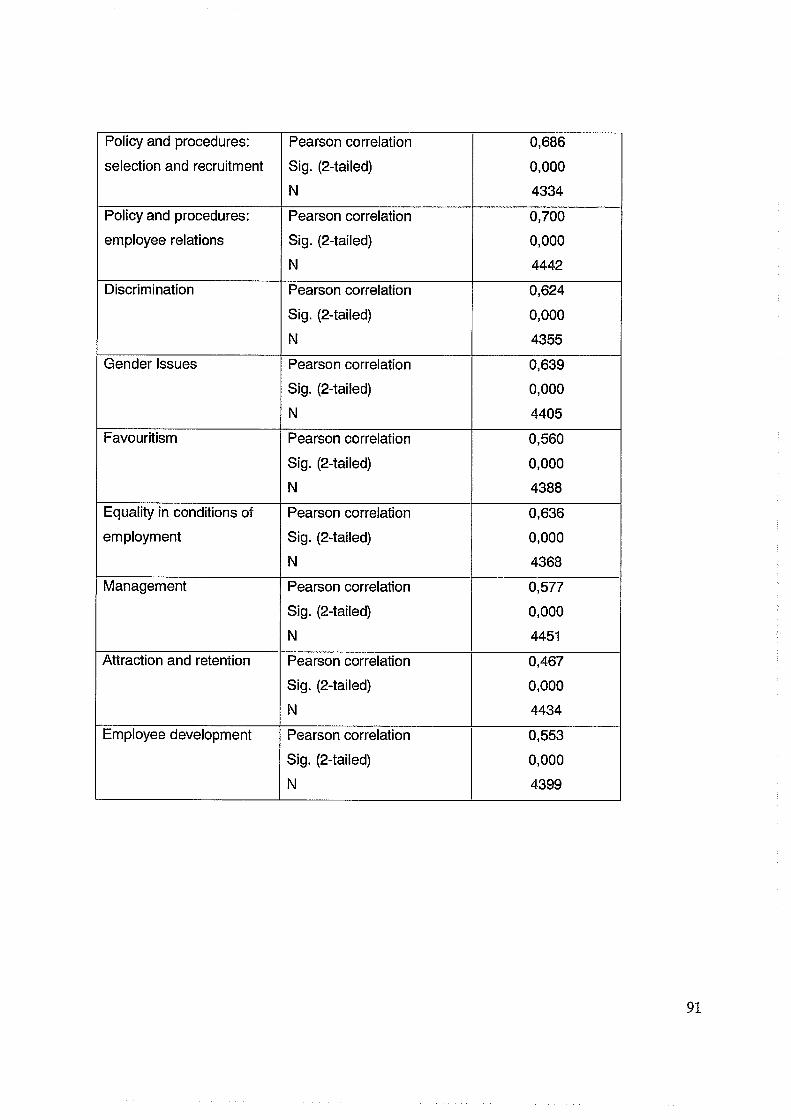
Policy and procedures: Pearson correlation 0,686
selection and recruitment Sig. (2-tailed) 0,000
N 4334
Policy and procedures: Pearson correlation 0,700
employee relations Sig. (2-tailed) 0,000
N 4442
Discrimination Pearson correlation 0,624
Sig. (2-tailed) 0,000
N 4355
Gender Issues Pearson correlation 0,639
Sig. (2-tailed) 0,000
N 4405
Favouritism Pearson correlation 0,560
Sig. (2-tailed) 0,000
N 4388
Equality in conditions of Pearson correlation 0,636
employment Sig. (2-tailed) 0,000
N 4368
Management Pearson correlation 0,577
Sig. (2-tailed) 0,000
N 4451
Attraction and retention Pearson correlation 0,467
Sig. (2-tailed) 0,000
N 4434
Employee development Pearson correlation 0,553
Sig. (2-tailed) 0,000
N 4399
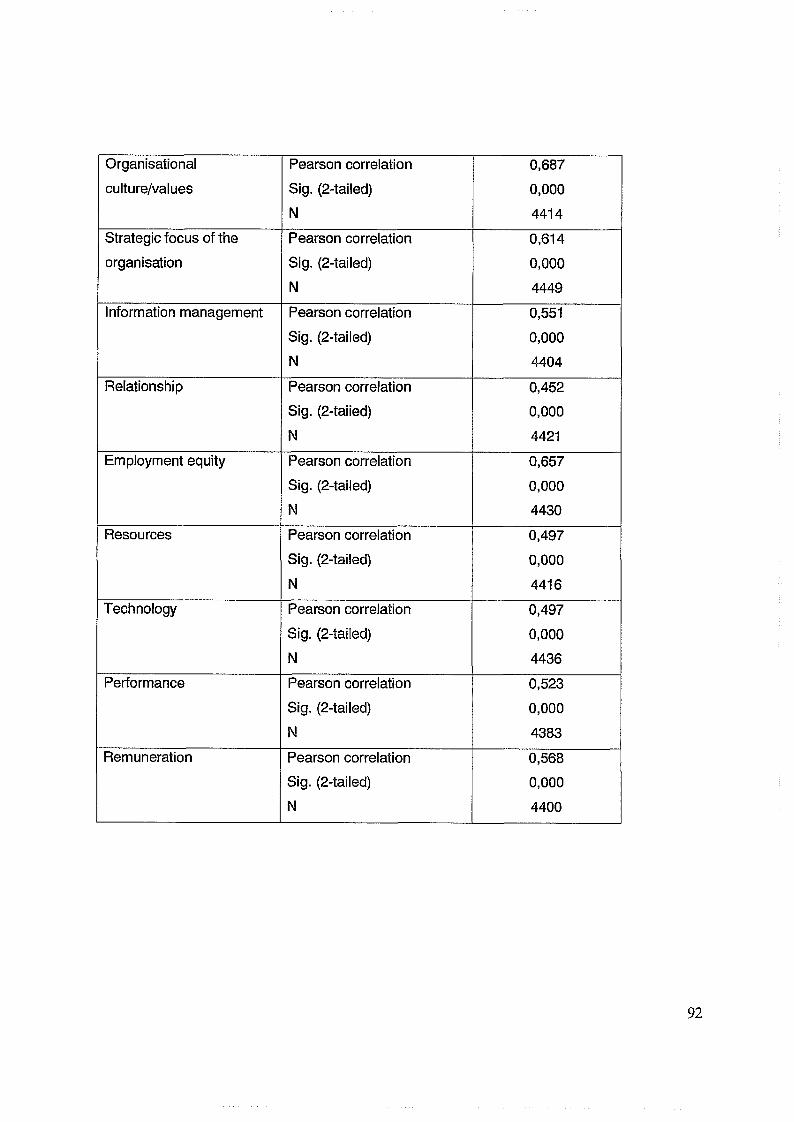
Organisational Pearson correlation 0,687
culture/values Sig. (2-tailed) 0,000
N 4414
Strategic focus of the Pearson correlation 0,614
organisation Sig. (2-tailed) 0,000
N 4449
Information management Pearson correlation 0,551
Sig. (2-tailed) 0,000
N 4404
Relationship Pearson correlation 0,452
Sig. (2-taiied) 0,000
N 4421
Employment equity Pearson correlation 0,657
Sig. (2-tailed) 0,000
N 4430
Resources Pearson correlation 0,497
Sig. (2-tailed) 0,000
N 4416
Technology Pearson correlation 0,497
Sig. (2-tailed) 0,000
N 4436
Performance Pearson correlation 0,523
Sig. (2-tailed) 0,000
N 4383
Remuneration Pearson correlation 0,568
Sig. (2-tailed) 0,000
N 4400
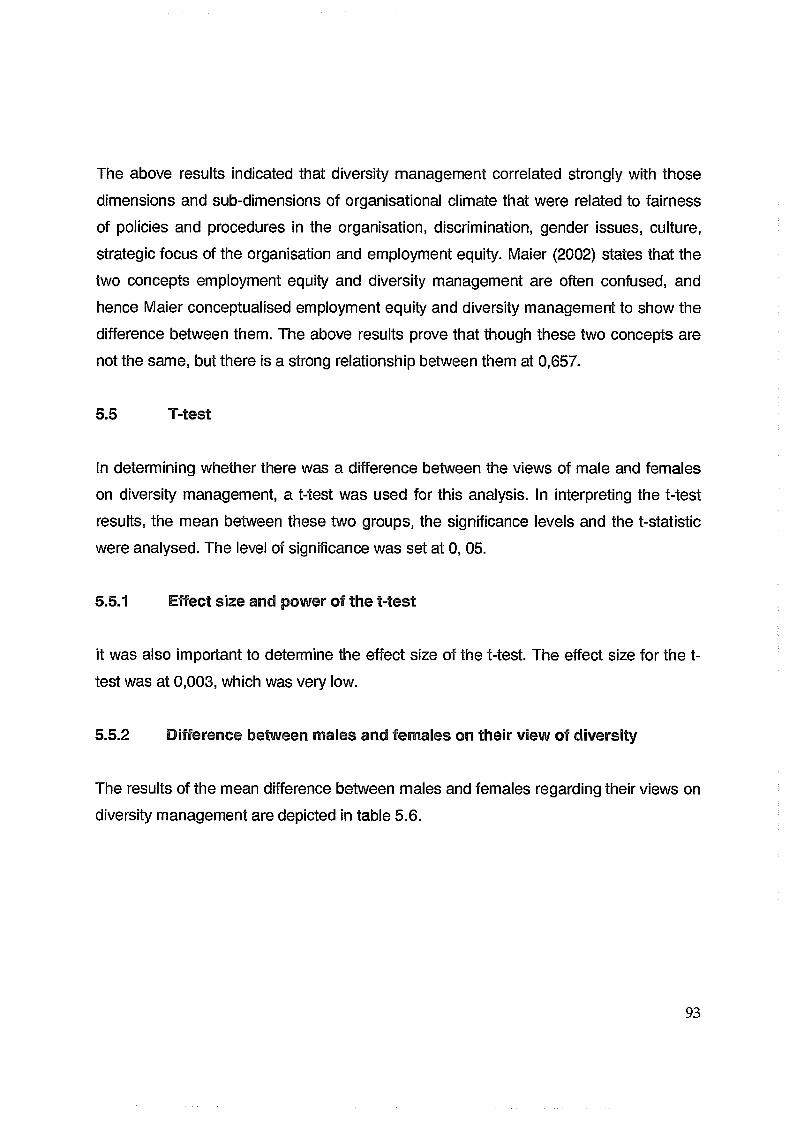
The above results indicated that diversity management correlated strongly with those
dimensions and sub-dimensions of organisational climate that were related to fairness
of policies and procedures in the organisation, discrimination, gender issues, culture,
strategic focus of the organisation and employment equity. Maier (2002) states that the
two concepts employment equity and diversity management are often confused, and
hence Maier conceptualised employment equity and diversity management to show the
difference between them. The above results prove that though these two concepts are
not the same, but there is a strong relationship between them at 0,657.
5.5 T-test
In determining whether there was a difference between the views of male and females
on diversity management, a t-test was used for this analysis. In interpreting the t-test
results, the mean between these two groups, the significance levels and the t-statistic
were analysed. The level of significance was set at 0, 05.
5.5.1 Effect size and power of the t-test
it was also important to determine the effect size of the t-test. The effect size for the t-
test was at 0,003, which was very low.
5.5.2 Difference between males and females on their view of diversity
The results of the mean difference between males and females regarding their views on
diversity management are depicted in table 5.6.
93
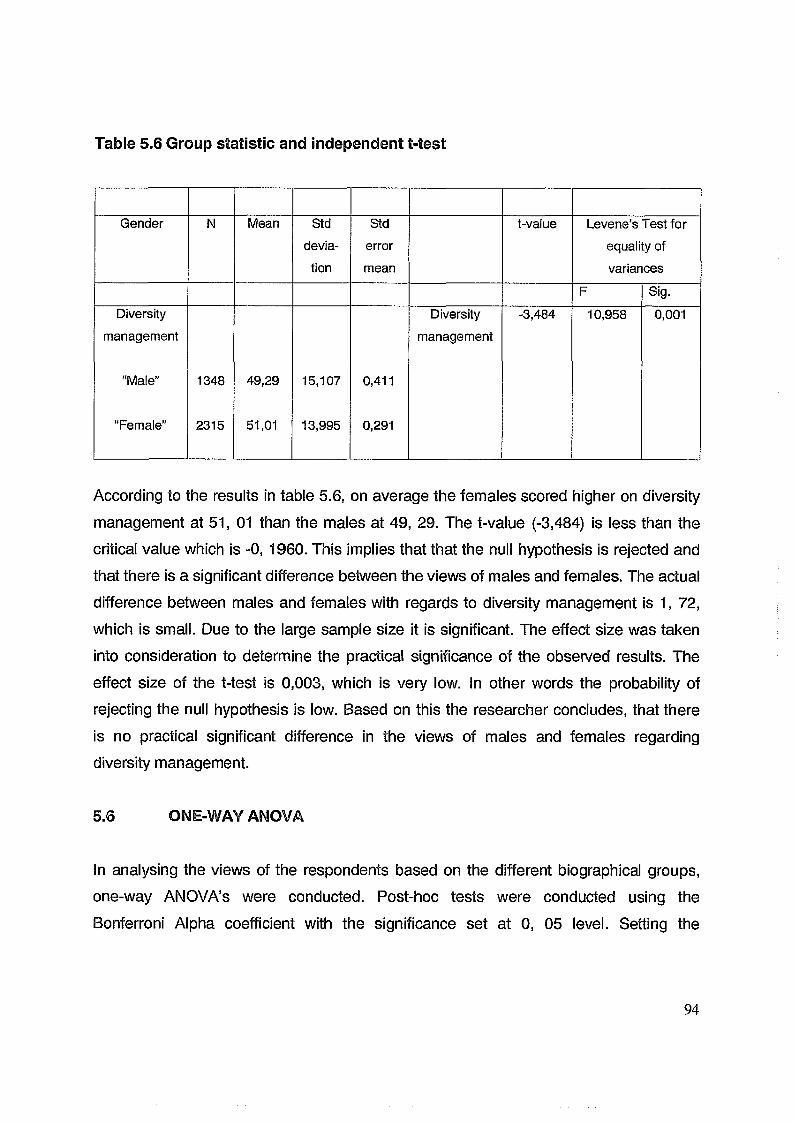
Table 5.6 Group statistic and independent t-test
Gender N Mean Stddeviation
Stderror
mean
t-vaiue Levene’s Test for
equality of variances
p Sig.Diversity
management
“Male”
“Female”
1348
2315
49,29
51,01
15,107
13,995
0,411
0,291
Diversity
management
-3,484 10,958 0,001
According to the results in table 5.6, on average the females scored higher on diversity
management at 51, 01 than the males at 49, 29. The t-value (-3,484) is less than the
critical value which is -0, 1960. This implies that that the null hypothesis is rejected and
that there is a significant difference between the views of males and females. The actual
difference between males and females with regards to diversity management is 1, 72,
which is small. Due to the large sample size it is significant. The effect size was taken
into consideration to determine the practical significance of the observed results. The
effect size of the t-test is 0,003, which is very low. In other words the probability of
rejecting the null hypothesis is low. Based on this the researcher concludes, that there
is no practical significant difference in the views of males and females regarding
diversity management.
5.6 ONE-WAY ANOVA
In analysing the views of the respondents based on the different biographical groups,
one-way ANOVA’s were conducted. Post-hoc tests were conducted using the
Bonferroni Alpha coefficient with the significance set at 0, 05 level. Setting the
94
significance level at 0, 05 reduced type I errors, which were the probability of rejecting
the null hypothesis when it should be accepted.
5.6.1 One-way ANOVA between diversity management and the age
groups
The overall comparison of the five sub-groups under age Indicated (see table 5.7) that
they were significant at 0,000, which was below 0, 05.
Table 5.7 One-way ANOVA of diversity management and the age groups
Diversity management
Sum of
squares
df Mean
squares
F Sig.
Between
groups
Within
groups
Total
3991,652
787893,28
791884,93
4
4279
4283
997,913
184,130
5,420 0,000
Table 5.7 indicated that the differences between the different age groups were
significant. According to the results in Table 5.8, the differences between the views of
the employees were small. Employees who are “less than 25 years old” held the most
positive views regarding diversity management in the organisation, followed by
employees who were 45 years and older, and the middle age group had slightly less
positive views.
95
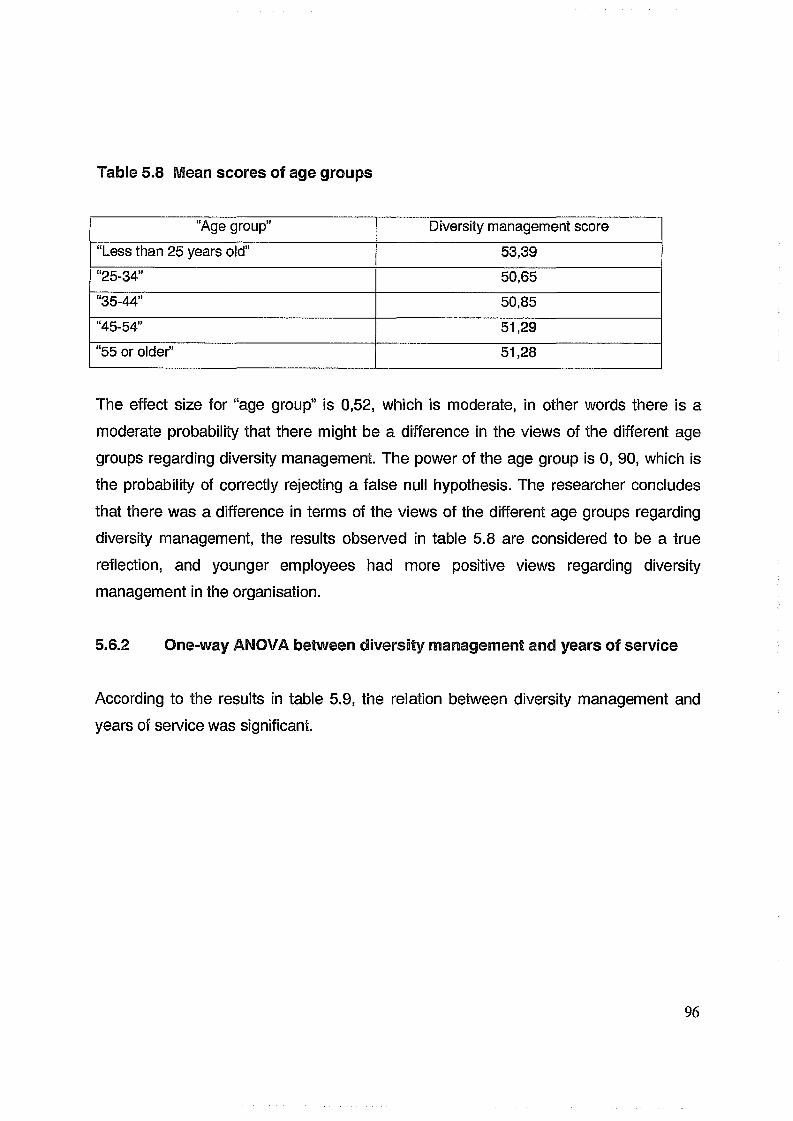
Table 5.8 Mean scores of age groups
"Age group” Diversity management score
“Less than 25 years old” 53,39
“25-34” 50,65
“35-44” 50,85
“45-54” 51,29
“55 or older55 51,28
The effect size for “age group” is 0,52, which is moderate, in other words there is a
moderate probability that there might be a difference in the views of the different age
groups regarding diversity management. The power of the age group is 0, 90, which is
the probability of correctly rejecting a false null hypothesis. The researcher concludes
that there was a difference in terms of the views of the different age groups regarding
diversity management, the results observed in table 5.8 are considered to be a true
reflection, and younger employees had more positive views regarding diversity
management in the organisation.
5.6.2 One-way ANOVA between diversity management and years of service
According to the results in table 5.9, the relation between diversity management and
years of service was significant.
96
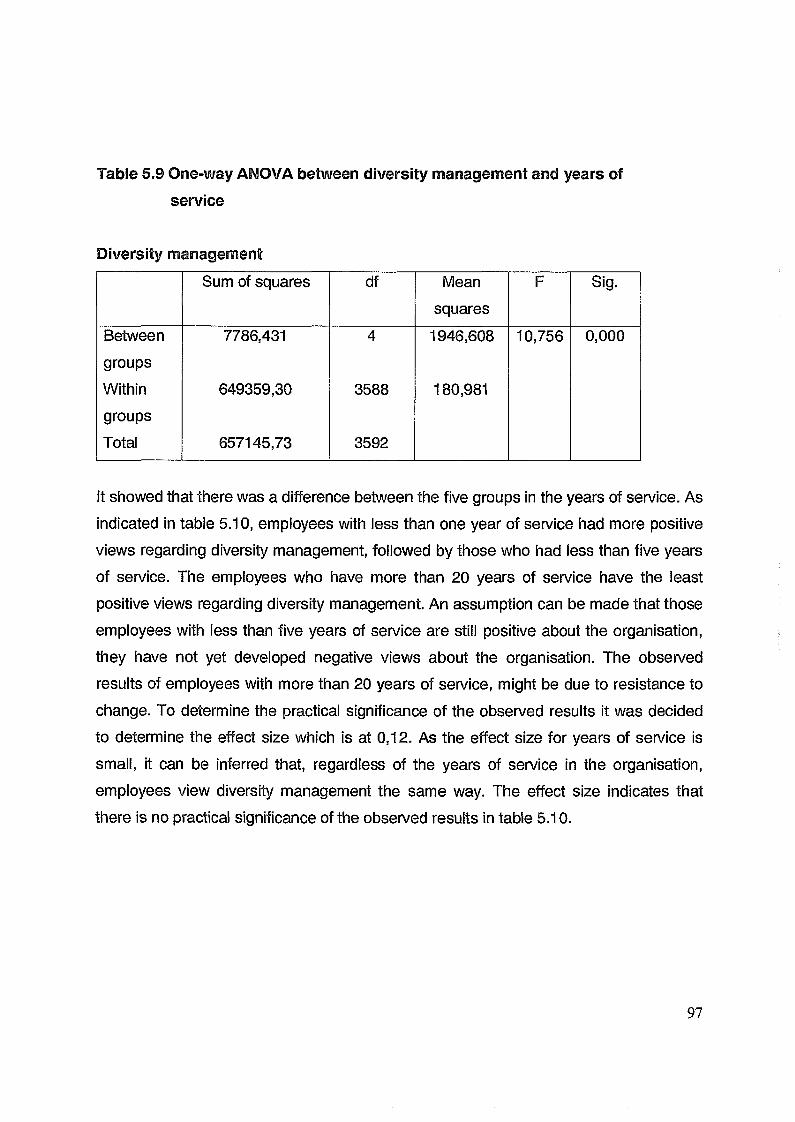
Table 5.9 One-way ANOVA between diversity management and years of
service
Diversity management
Sum of squares df Mean
squaresF
Sig.
Between 7786,431 4 1946,608 10,756 0,000
groups
Within 649359,30 3588 180,981
groups
Total 657145,73 3592
It showed that there was a difference between the five groups in the years of service. As
indicated in table 5.10, employees with less than one year of sen/ice had more positive
views regarding diversity management, followed by those who had less than five years
of service. The employees who have more than 20 years of service have the least
positive views regarding diversity management. An assumption can be made that those
employees with less than five years of service are still positive about the organisation,
they have not yet developed negative views about the organisation. The observed
results of employees with more than 20 years of service, might be due to resistance to
change. To determine the practical significance of the observed results it was decided
to determine the effect size which is at 0,12. As the effect size for years of service is
small, it can be inferred that, regardless of the years of service in the organisation,
employees view diversity management the same way. The effect size indicates that
there is no practical significance of the observed results in table 5.10.
97
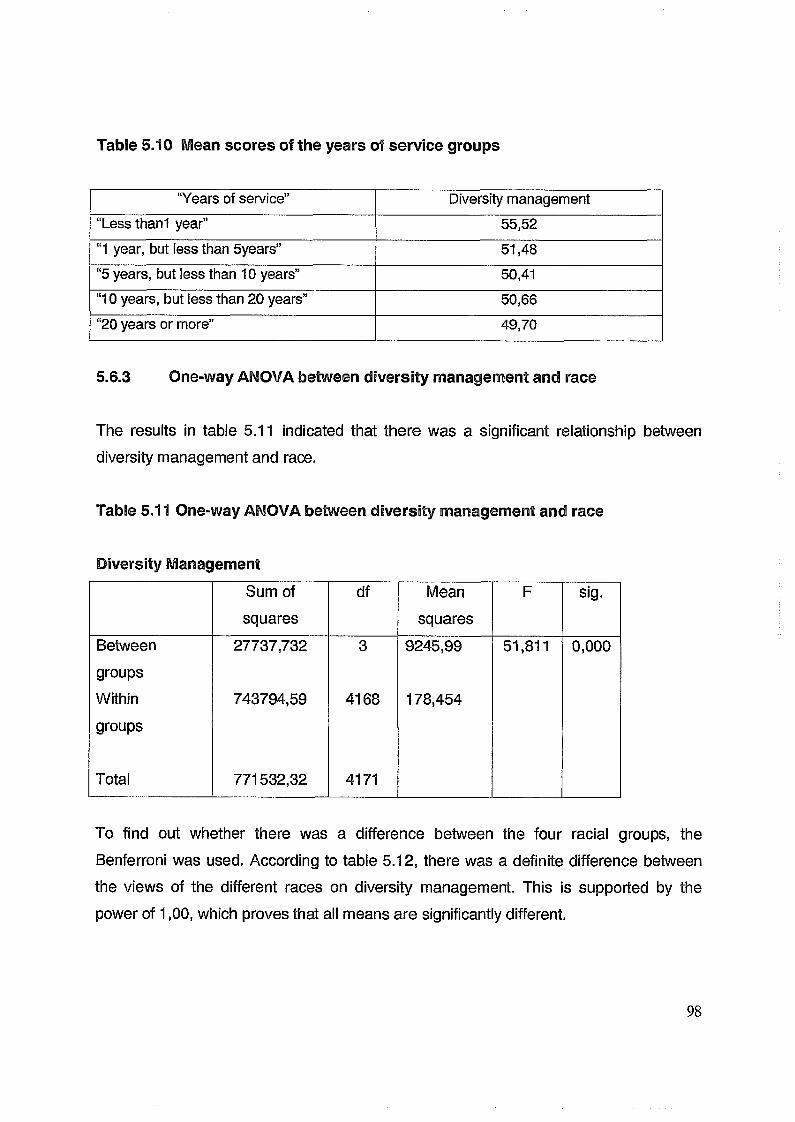
Table 5.10 Mean scores of the years of service groups
‘Years of service” Diversity management
“Less thanl year” 55,52
“1 year, but less than 5years” 51,48
“5 years, but less than 10 years” 50,41
“10 years, but less than 20 years” 50,66
“20 years or more” 49,70
5.6.3 One-way ANOVA between diversity management and race
The results in table 5.11 indicated that there was a significant relationship between
diversity management and race.
Table 5.11 One-way ANOVA between diversity management and race
Diversity Management
Sum of
squares
df Mean
squares
F sig.
Between 27737,732 3 9245,99 51,811 0,000
groups
Within 743794,59 4168 178,454
groups
Total 771532,32 4171
To find out whether there was a difference between the four racial groups, the
Benferroni was used. According to table 5.12, there was a definite difference between
the views of the different races on diversity management. This is supported by the
power of 1,00, which proves that all means are significantly different.
98
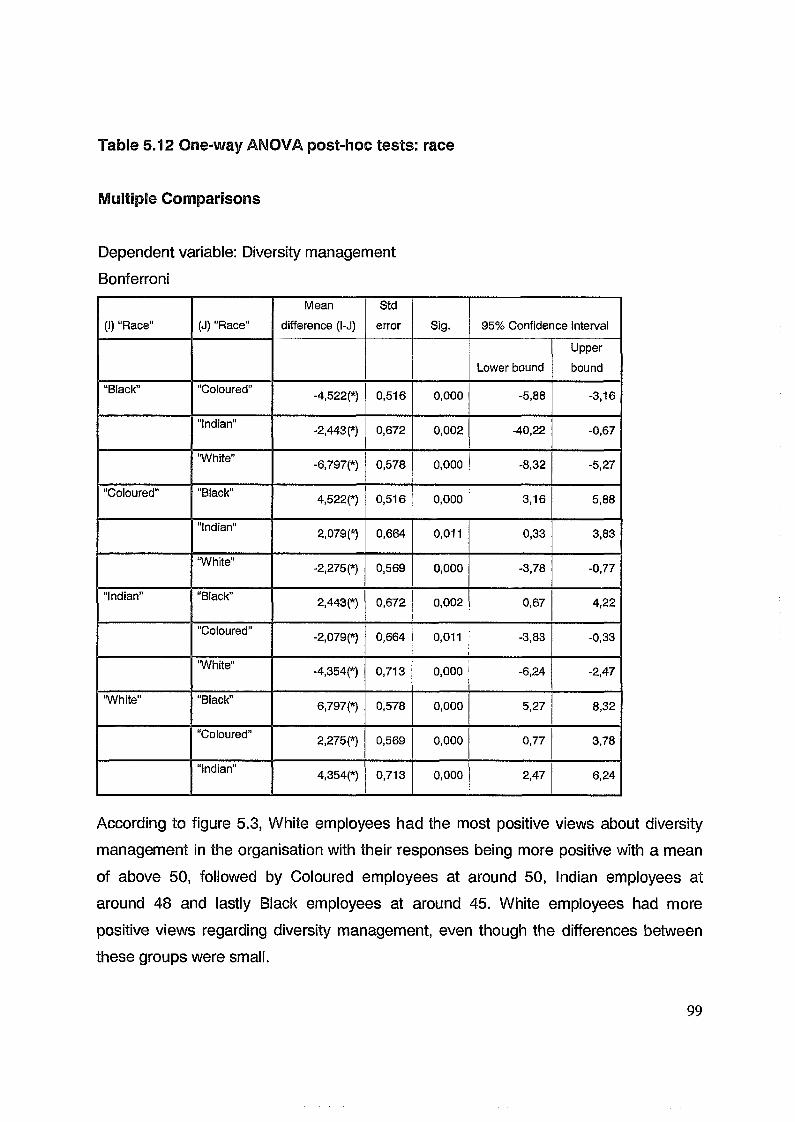
Table 5.12 One-way ANOVA post-hoc tests: race
Multiple Comparisons
Dependent variable: Diversity management
Bonferroni
(I) "Race" (J) “Race”
Mean
difference (l-J)
Std
error Sig. 95% Confidence interval
Lower bound
Upper
bound
“Black” “Coloured" -4,522(*) 0,516 0,000 -5,88 -3,16
"Indian” -2,443(*) 0,672 0,002 -40,22 -0,67
‘White" -6,797(*) 0,578 0,000 -8,32 -5,27
“Coloured” “Black" 4,522(*) 0,516 0,000 3,16 5,88
"Indian” 2,079(*) 0,664 0,011 0,33 3,83
‘White” -2,275(*) 0,569 0,000 -3,78 -0,77
“Indian” “Black” 2,443(*} 0,672 0,002 0,67 4,22
“Coloured" -2,079(*) 0,664 0,011 -3,83 -0,33
'White” -4,354(*) 0,713 0,000 -6,24 -2,47
‘White” “Black” 6,797(*) 0,578 0,000 5,27 8,32
“Coloured” 2,275(*) 0,569 0,000 0,77 3,78
“Indian" 4,354(*) 0,713 0,000 2,47 6,24
According to figure 5.3, White employees had the most positive views about diversity
management in the organisation with their responses being more positive with a mean
of above 50, followed by Coloured employees at around 50, Indian employees at
around 48 and lastly Black employees at around 45. White employees had more
positive views regarding diversity management, even though the differences between
these groups were small.
99
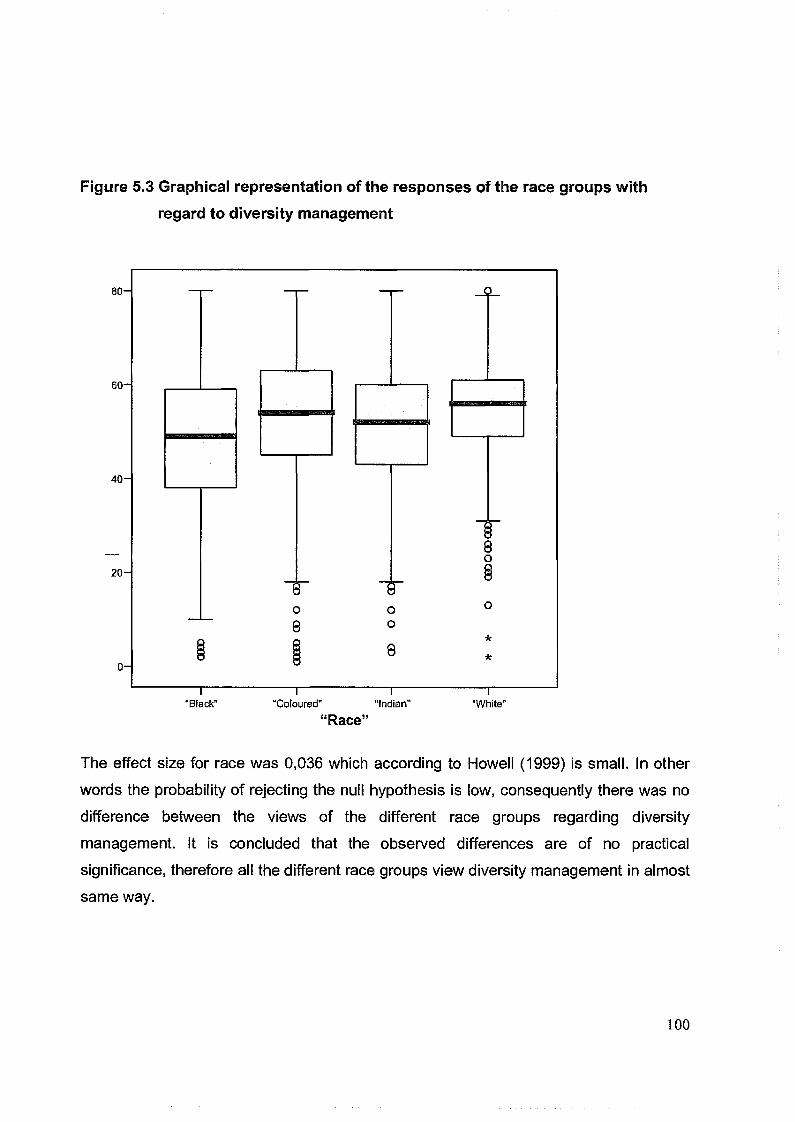
Figure 5.3 Graphical representation of the responses of the race groups with
regard to diversity management
80
60
40
20
0
The effect size for race was 0,036 which according to Howell (1999) is small. In other
words the probability of rejecting the null hypothesis is low, consequently there was no
difference between the views of the different race groups regarding diversity
management. It is concluded that the observed differences are of no practical
significance, therefore all the different race groups view diversity management in almost
same way.
8
—\—“Black" “Coloured" “Indian”
“Race”“White"
100
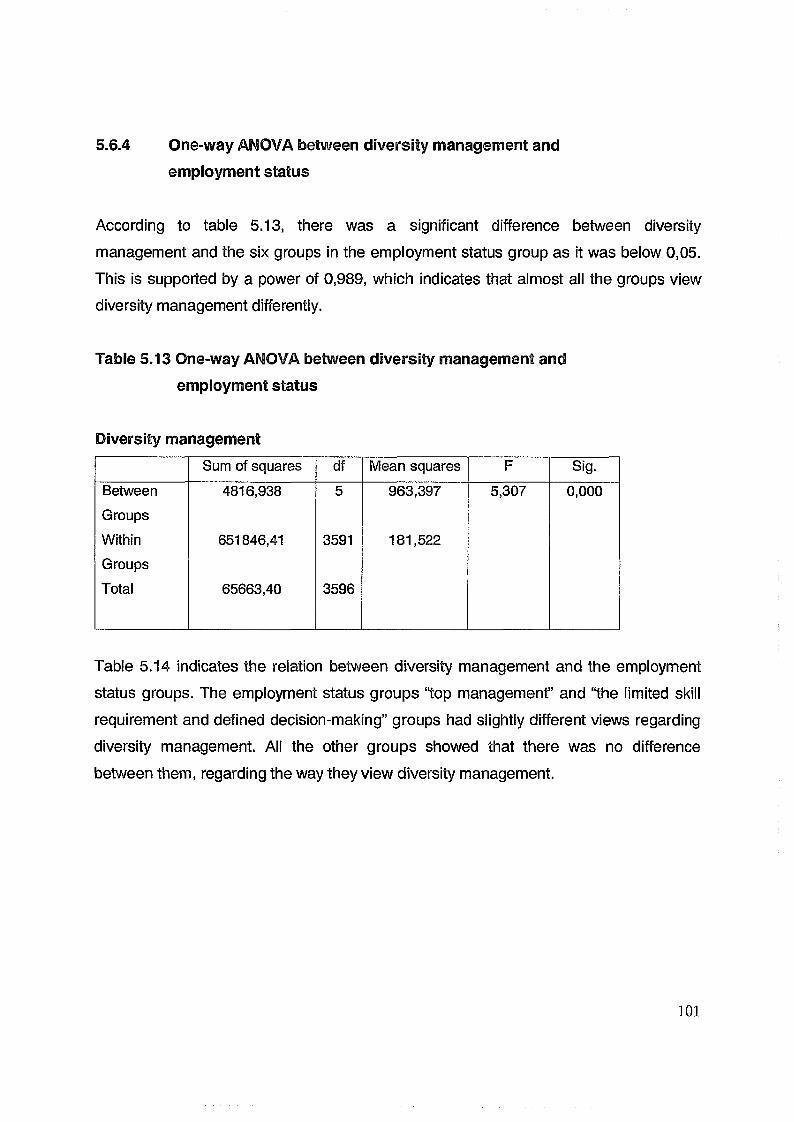
5.6.4 One-way ANOVA between diversity management and
employment status
According to table 5.13, there was a significant difference between diversity
management and the six groups in the employment status group as it was below 0,05.
This is supported by a power of 0,989, which indicates that almost all the groups view
diversity management differently.
Table 5.13 One-way ANOVA between diversity management and
employment status
Diversity managementSum of squares df Mean squares F Sig.
Between
Groups
Within
Groups
Total
4816,938
651846,41
65663,40
5
3591
3596
963,397
181,522
5,307 0,000
Table 5.14 indicates the relation between diversity management and the employment
status groups. The employment status groups “top management’ and “the limited skill
requirement and defined decision-making” groups had slightly different views regarding
diversity management. All the other groups showed that there was no difference
between them, regarding the way they view diversity management.
101
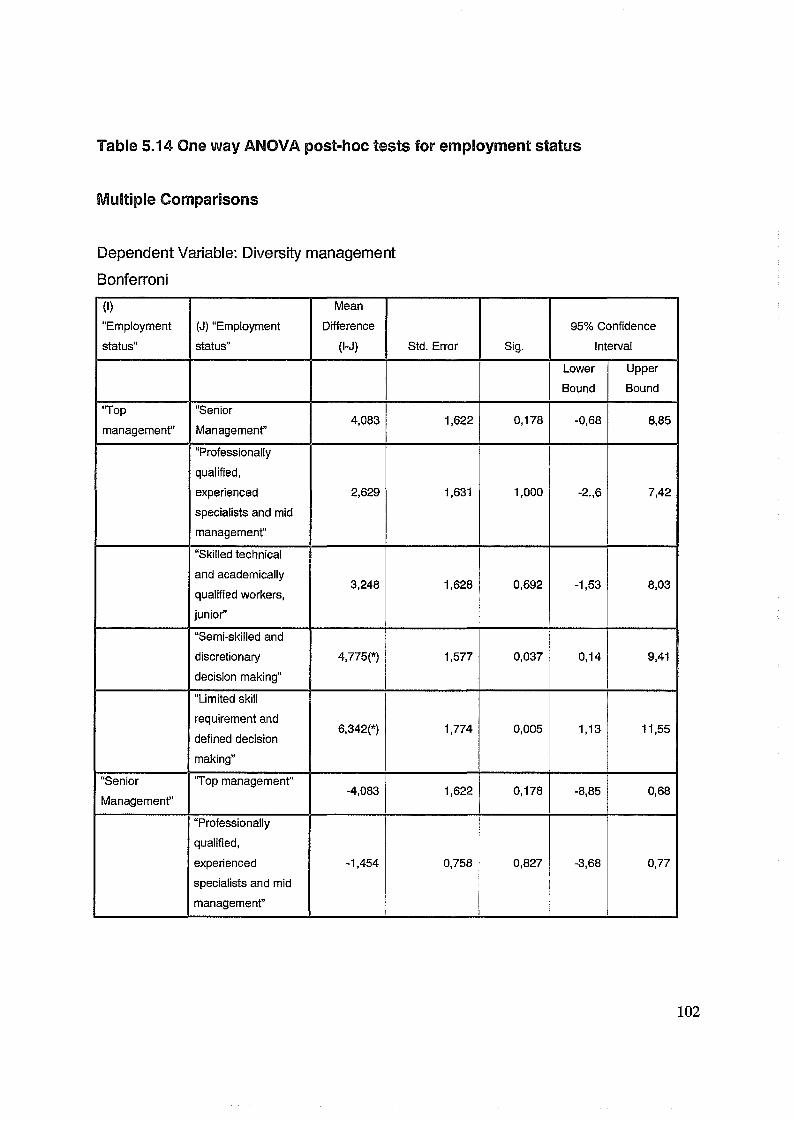
Table 5.14 One way ANOVA post-hoc tests for employment status
Multiple Comparisons
Dependent Variable: Diversity management
Bonferroni
(1)"Employment
status”
(J) “Employment
status”
Mean
Difference
(l-J) Std. Error Sig.
95% Confidence
Interval
Lower
Bound
Upper
Bound
'Top
management"
"Senior
Management”4,083 1,622 0,178 -0,68 8,85
“Professionally
qualified,
experienced
specialists and mid
management”
2,629 1,631 1,000 -2.,6 7,42
“Skilled technical
and academically
qualified workers,
junior”
3,248 1,628 0,692 -1,53 8,03
“Semi-skilled and
discretionary
decision making"
4,775(*) 1,577 0,037 0,14 9,41
"Limited skill
requirement and
defined decision
making”
6,342{*) 1,774 0,005 1,13 11,55
“Senior
Management’
'Top management'-4,083 1,622 0,178 -8,85 0,68
“Professionally
qualified,
experienced
specialists and mid
management”
-1,454 0,758 0,827 -3,68 0,77
102
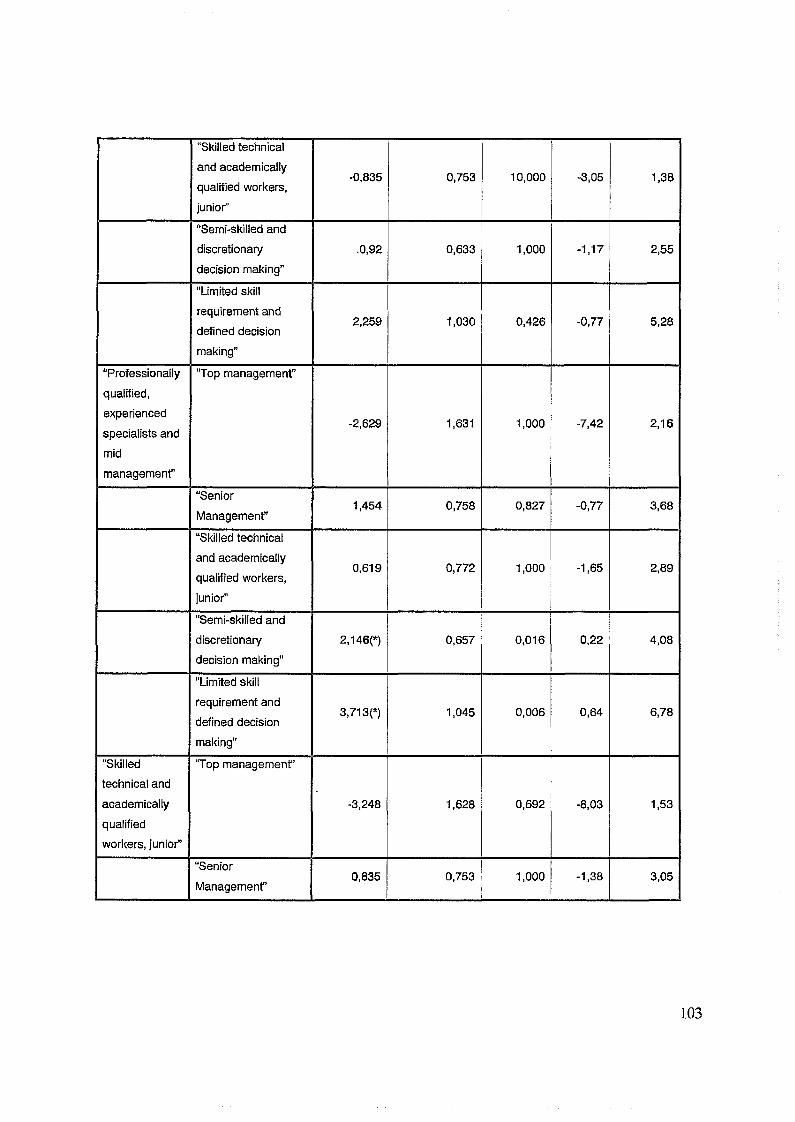
“Skilled technical
and academically
qualified workers,
junior"
-0,835 0,753 10,000 -3,05 1,38
“Semi-skilled and
discretionary
decision making”
.0,92 0,633 1,000 -1,17 2,55
“Limited skill
requirement and
defined decision
making”
2,259 1,030 0,426 -0,77 5,28
"Professionally
qualified,
experienced
specialists and
mid
management”
‘Top management”
-2,629 1,631 1,000 -7,42 2,16
“Senior
Management’1,454 0,758 0,827 -0,77 3,68
“Skilled technical
and academically
qualified workers,
junior”
0,619 0,772 1,000 -1,65 2,89
“Semi-skilled and
discretionary
decision making”
2,146{*) 0,657 0,016 0,22 4,08
"Limited skill
requirement and
defined decision
making”
3,713(*) 1,045 0,006 0,64 6,78
“Skilled
technical and
academically
qualified
workers, junior"
‘Top management’
-3,248 1,628 0,692 -8,03 1,53
“Senior
Management’0,835 0,753 1,000 -1,38 3,05
103
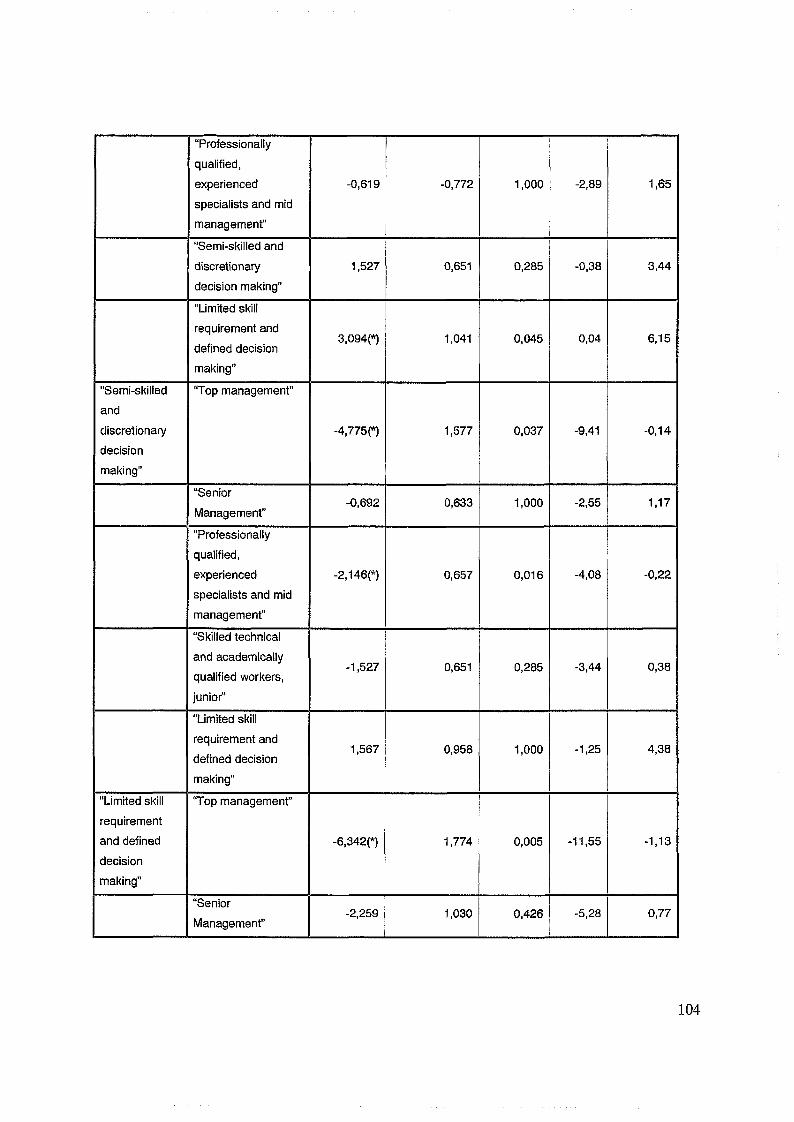
“Professionally
qualified,
experienced
specialists and mid
management”
-0,619 -0,772 1,000 -2,89 1,65
"Semi-skilled and
discretionary
decision making"
1,527 0,651 0,285 -0,38 3,44
“Limited skill
requirement and
defined decision
making”
3,094{*) 1,041 0,045 0,04 6,15
"Semi-skilled
and
discretionary
decision
making"
‘Top management”
-4,775(*) 1,577 0,037 -9,41 -0,14
“Senior
Management”-0,692 0,633 1,000 -2,55 1,17
“Professionally
qualified,
experienced
specialists and mid
management”
-2,146(*) 0,657 0,016 -4,08 -0,22
"Skilled technical
and academically
qualified workers,
junior”
-1,527 0,651 0,285 -3,44 0,38
"Limited skill
requirement and
defined decision
making”
1,567 0,958 1,000 -1,25 4,38
“Limited skill
requirement
and defined
decision
making”
‘Top management’
-6,342(*) 1,774 0,005 -11,55 -1,13
“Senior
Management”-2,259 1,030 0,426 -5,28 0,77
104
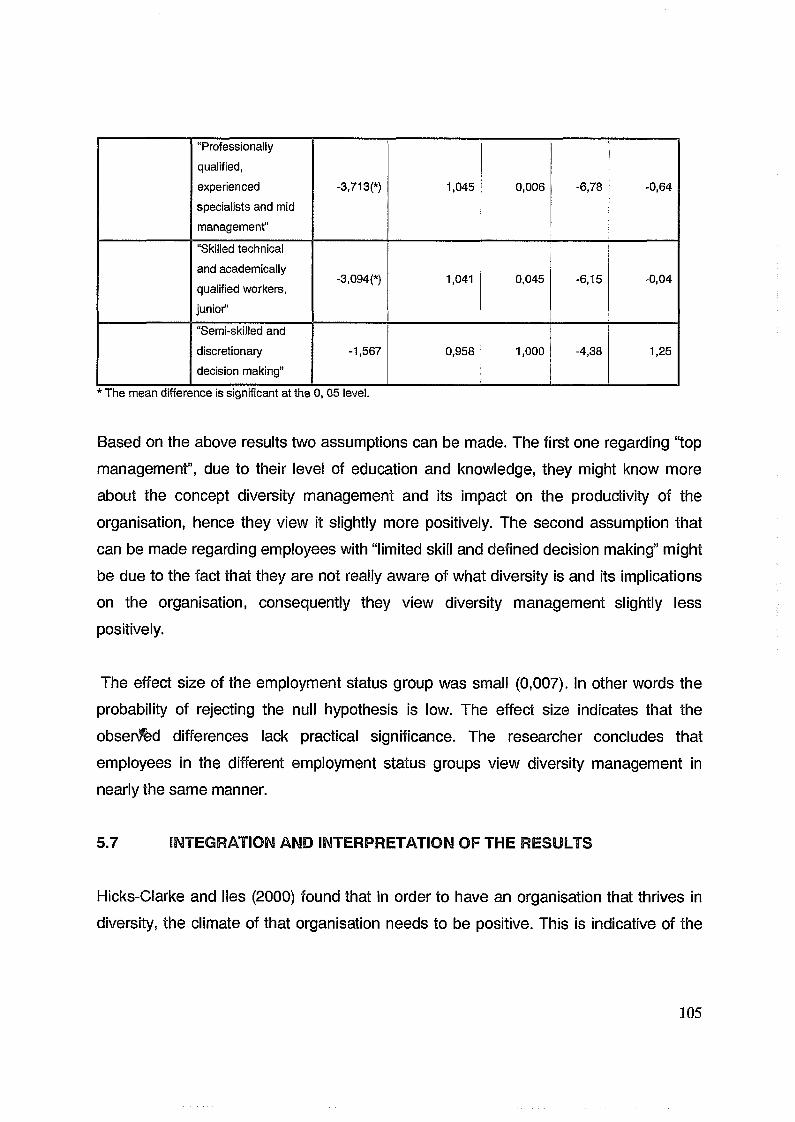
“Professionally
qualified,
experienced
specialists and mid
management”
-3,713(*) 1,045 0,006 -6,78 -0,64
“Skilled technical
and academically
qualified workers,
junior”
-3,094(*) 1,041 0,045 -6,15 -0,04
"Semi-skilled and
discretionary
decision making”
-1,567 0,958 1,000 ~4,38 1,25
* The mean difference is significant at t ie 0, 05 level.
Based on the above results two assumptions can be made. The first one regarding “top
management”, due to their level of education and knowledge, they might know more
about the concept diversity management and its impact on the productivity of the
organisation, hence they view it slightly more positively. The second assumption that
can be made regarding employees with “limited skill and defined decision making” might
be due to the fact that they are not really aware of what diversity is and its implications
on the organisation, consequently they view diversity management slightly less
positively.
The effect size of the employment status group was small (0,007). In other words the
probability of rejecting the null hypothesis is low. The effect size indicates that the
obsenfed differences lack practical significance. The researcher concludes that
employees in the different employment status groups view diversity management in
nearly the same manner.
5.7 INTEGRATION AND INTERPRETATION OF THE RESULTS
Hicks-Clarke and lies (2000) found that in order to have an organisation that thrives in
diversity, the climate of that organisation needs to be positive. This is indicative of the
105
fact that there is a relationship between organisational climate and diversity
management.
In the current study, the dimensions organisational climate and diversity management
were singled out. A factor analysis was conducted to indicate the factors in the study.
An initial and a second-order factor analysis were conducted using the principal
component analysis. The results showed that diversity management and organisational
climate were measured by this instrument which was validated by Martins and Von der
Ohe (2003).
In meeting the first empirical aim of the study it was discovered that there was a positive
and strong relationship between organisational climate and diversity management. The
overall correlation coefficient between diversity management and organisational climate
was 0,775. The current study supports the results of Kossek and Zonia (1993), and
indicates that there is a relationship between diversity and how individuals in an
organisation view the climate of the organisation. Kossek and Zonia (1993) maintained
that climate of organisations is affected by equal opportunity policies, access to
resources and opportunities in the organisation and how individuals and groups view
these policies. Martins and Von der Ohe (2003) in their study revealed that diversity
items were found under the dimensions policies and procedures, fairness, organisation
practices and employment equity. The current study also supports the findings of
Kossek and Zonia (1993), Maier (2002) and Martins and Von der Ohe (2003), as the
results clearly indicate that diversity management strongly correlates with fairness of
policies and procedures, discrimination, gender issues, culture, strategic focus and
employment equity.
The second aim of the study was to determine whether there were any differences
between the following biographical groups: age, gender, race, employment status and
years of service with regard to their views of diversity management
106
Hicks-Clarke and illes (2000) found that managerial attitudes towards and perceptions
of positive climate for diversity became more positive as the management level
increased. According to the results of the current study it was discovered that there
were no differences in the views of the different employment status/ employment levels
groups with regards to diversity management.
Hicks-Clarke and Illes (2000) also discovered that in relation to gender, men viewed
diversity initiatives being supported more positively than women. The current study
revealed that there were no differences in the views of males and females regarding
diversity management.
The results of this study further indicated that the different race groups viewed diversity
management in the same way, and this was also the case with the years of service
group. The results indicate that younger employees, who are less than 25 years of age,
had more positive views regarding diversity management. Middle aged employees
between the ages of “25 to 44” had the least positive views regarding diversity
management.
The researcher concludes that there is a positive and strong relationship between
diversity management and organisational climate.
5.8 CHAPTER SUMMARY
This chapter discussed the analysis and the interpretation of the data. Chapter 6
concludes the study, discusses the limitations of the study and makes
recommendations for future research.
107
CHAPTER 6
CONCLUSIONS, LIMITATIONS AND RECOMMENDATIONS
6.1 INTRODUCTION
in concluding this study, the researcher discusses the objectives and limitations of the
study and makes recommendations for future research.
6.2 CONCLUSIONS
The researcher’s objective was to conceptualise organisational climate and diversity
management and to determine whether there is a theoretical relationship between these
two concepts.
Secondly, the researcher determined the relationship between organisational climate
and diversity management, and if any differences exist between the different
biographical groups with regard to their views on diversity management. Finally, the
researcher aimed to make recommendations for further research.
6.2.1 Conceptualisation of organisational climate
The literature review indicates that there is no consensus on the definition of
organisational climate (Helliriegel & Slocum, 1974; Schmidt, Wood & Lugg, 2003).
The researcher defined organisational climate as a set of characteristics about an
organisation and its sub-systems that can be perceived positively or negatively by its
members from the way the organisation deals with its members, behaviour in the
organisation, structures, processes, policies and its internal and external environment.
108

It is also discovered that the concepts organisational climate and job satisfaction are
related but are not the same. Job satisfaction can be measured as one of the
dimensions of organisational climate. In the current study during factor analysis, job
satisfaction did not emerge as a dimension. This being the case it does not refute the
researcher’s conclusion in section 2.5 that job satisfaction can be measured as a
dimension of organisational climate.
In addition, there is no consensus on the relationship between organisational climate
and organisational culture (Hicks-Clarke & Illes, 2000; Moran & Volkwein, 1992;
Scheinder, Bowen & Ehrhart, 2000). The researcher is of the opinion that organisational
climate and organisational culture are related, organisational climate evolved from
organisational culture, and organisational climate can also influence organisational
culture.
6.2.2 Conceptualisation of diversity management
The literature review indicated that diversity management is synonymous with
affirmative action and employment equity (Cox, 2001; Harrington, 1993; Maier, 2002;
Svehla, 1994; Thomas, 1996; Yakura, 1996). Due to the confusion created by these
concepts the researcher decided to conceptualise diversity management and the
different approaches used to manage it. Svehla (1994) identified three approaches to
diversity: affirmative action, valuing differences, and diversity management. Models of
managing diversity management were also discussed, which revealed that more recent
models of managing diversity recognised the importance of leadership in managing
diversity. The current study also highlights this, as strategic focus correlated strongly
with diversity management, and management and leadership correlated moderately
with diversity management.
The researcher regards diversity management as a strategic process that an
organisation undertakes to create an environment where differences and similarities are
acknowledged, valued and utilised to reach organisational goals, using integration
109
rather than assimilation to create a multicultural organisation. This includes culture,
working methods or styles, age, gender, work experience, race, values, norms, religious
affiliations and number of years in the organisation.
6.2.3 Integration of the concepts organisational climate and diversity
management
Studies identified were those of Cox (1993), Kossek and Zonia (1993), Hayes et al.
(2002) and Hicks-Clarke and I lies (2000).
Hayes et al. (2002) assert that to create organisations that are effective with a diverse
employee base, the organisational climate must be appropriate. This indicates that it is
not sufficient to have a diverse workforce, there is also a need for organisations to
create the right organisational climate to complete it. Hicks-Clarke and llles (2000),
postulate that for diversity management to be successful organisations need to develop
a positive climate for diversity.
Kossek and Zonia (1993) indicate that there is a relationship between climate and
diversity. They argue that power in organisations is still held by white males, diversity
management is regarded as unimportant in these organisations. In order to make all
employees feel part of the organisation, diversity should be reflected in the policies of
these organisations.
Cox (1993) developed an interactional model of cultural diversity that links human
resources diversity to climate. According to Cox (1993), an organisation that develops a
climate which encourages and supports all employees and in which all employees have
equal opportunities will be better positioned than their competitors as their employees
will be more motivated and creative. Hicks-Clarke and llles (2000) developed a positive
climate for diversity (PCFD) model. According to this model, a diversity climate affects
the way employees perceive their organisation, from the individual level to the
organisational level. The model indicates that organisations wishing to create a positive
110
climate for diversity should consider the specific elements that develop a positive
climate for diversity, such as diversity policies and procedures.
6.2.4 The relationship between organisational climate and diversitymanagement
The study found that there is a positive and strong relationship between diversity
management and organisational climate and all the other factors of organisational
climate. Therefore the null hypothesis had to be rejected.
The following organisational climate dimensions correlated strongly, between 0,700 and
0,624, with diversity management: policies and procedures: job content, policies and
procedures: selection and recruitment, policies and procedures: employee relations,
discrimination, gender issues, equality in conditions of employment, organisational
culture/values, strategic focus of the organisation and employment equity. Hicks-Clarke
and I lies (2000) state that organisations that want to create a positive climate for
diversity need to implement policies that deal effectively with the issues of diversity.
The above results indicate that if policies and procedures of an organisation are
regarded as fair, there is gender balance, there is no discrimination and employment
equity is managed properly therefore employees will view the climate of the organisation
in a more positive manner. The strong relationship between diversity management and
employment equity, has implications for South African organisations that do not have
employment equity plans in place, the researcher is inclined to conclude that employees
in those organisation will view diversity management less positively.
The following dimensions correlated with diversity management, between 0,577 and
0,452, which had a medium significance: favouritism, management and leadership,
attraction and retention, employee development, information management,
relationships, resources, technology, performance management and remuneration.
Carr-Ruffino (1999) and Tsui and Porter (as cited in Cox, 2001), state that organisations
111
that are managing their diverse workforce would be effective in attracting and retaining
human talent.
The second hypothesis of the research study revealed that the null hypothesis was not
rejected for the following groups: gender, race, employment status and years of service.
The null hypothesis had to be rejected for the age group, as it was discovered there is
a difference between the views of the different age groups with regards to their views on
diversity management Employees under 25 years old hold more positive views
regarding diversity management, followed by those who are “55 and older” . Employees
in the middle age group, between “25 and 44” years of age had the least positive views
regarding diversity management. The researcher assumes that younger employees are
more open to change hence their positive views regarding diversity management in this
particular organisation.
It is therefore concluded that there is a relationship between organisational climate and
diversity management. Cox (1993), Hicks-Clarke and Illes (2000) and Kossek and Zonia
(1993) focused on the presence of diversity in the organisation, not the management of
diversity. This study found that the relationship between diversity management and
organisational climate is viewed differently by the different age groups and the following
biographical groups: gender, race, employment status and years of service, view
diversity almost the same way.
The researcher expected the different biographical groups to have different views
regarding diversity management, in this regard the study did not meet the researcher’s
expectations.
6.3 LIMITATIONS
Firstly, only one organisation was used to conduct the study. The results of this study
are only representative of the retail sector, and not of the South African workforce
112
broadly, Secondly, what was observed in this retail company might have different
results if applied in other organisations or sectors, such as the government sector.
The large sample size exposed the study to errors during the completion of the
questionnaire by the candidates or during data capturing.
Only a few studies have been conducted on these two concepts; the focus of the
previous studies was largely on the presence of diversity rather than the management
of diversity. This made it difficult to refer to previous studies during the interpretation
phase.
Despite the above limitations, it can be concluded that there is a strong and positive
relationship between diversity management and organisational climate and that younger
employees view diversity management more positively that older employees.
6.4 RECOMMENDATIONS
The current study focused on a sample of the population in the retail industry. It is
recommended that research be undertaken on larger samples. This could involve
obtaining a sample from all the sectors of employment in South Africa.
The biographical mix of the sample might have had an effect on the observed results,
hence it is recommended that a study that is truly representative of the South African
population be used.
In the literature review in an attempt to conceptualise diversity management, the
researcher found literature that dealt with managing diversity and the difference
between this concept and diversity management needs to be clarified. It is
recommended that further research be done to clarify the confusion existing over the
two concepts.
113
Organisational culture emerged as a factor during factor analysis. The literature review
established that there is a relationship between organisational climate and
organisational culture, and climate evolves from culture. Further research should be
undertaken to determine whether it is possible that culture can evolve from
organisational climate. Also a study can be conducted to determine the relationship
between diversity management and organisational culture.
Hicks-Clarke and Mies’s (2000) PCDF model was used in analysing the statistical results
(only a part of the model was used). It was difficult to find a model that deals with these
two concepts according to the nature of the study. This led the researcher to use only a
part of the model. It is therefore recommended that a model of organisational climate be
developed with diversity management as a prominent factor in the model. Diversity is
the presence of employees who are different from one another in terms of race, gender
and culture, for example. Diversity management is a strategy-driven process, which
involves active integration of diverse people, with the aim of achieving better
organisational goals.
The study found that younger employees under the age of 25 view diversity
management more positively than any other age group. Further research can be
conducted to determine those factors that prompt younger employees to view diversity
management more positively and use this, to improve on the diversity management
strategy of the organisation.
South African companies can use their leadership support and strategic focus of the
organisation as starting point, in ensuring the sustainability of diversity management
programmes. In addition ensuring that policies and procedures in the organisations are
fair, there should be strategies in place to deal with discrimination, gender issues,
equality in condition of employment and the organisational culture and values that
support diversity management. Employment equity is regarded as a precondition in
order to manage diversity effectively in organisations.
114
6.5 CHAPTER SUMMARY
South Africa is a new democracy that recently celebrated ten years of freedom. Issues
such as diversity management have become important in organisations. South African
organisations are at different phases of dealing with a diverse workforce. For those
organisations that have passed the affirmative action and the valuing differences
phases, it is important to know the impact of their diversity management initiatives, as
this is no longer a moral issue but a bottom line, business issue. Those organisations
that are still in the affirmative action/ employment equity phase are to be encouraged to
work towards implementing diversity management initiatives.
The present study explored the relationship between organisational climate and
diversity management. It is imperative that organisations understand the nature of the
relationship and the impact of diversity management on organisational climate, as this
will not only achieve the legal requirements of the government, but it will also ensure
that it adds value to the organisation by increasing productivity. Industrial psychologists
are in the best position to help organisations achieve this outcome.
115
REFERENCE LIST
Agocs, C. & Burr, C. (1996). Employment equity, affirmative action and managing
diversity: assessing the differences. International Journal of Manpower, 17(4-5), 30-45.
Al-Shammari, M.M. (1992). Organizational climate. Leadership and Organization
Development Journal, 13(6), 30-32.
Arrendondo, P. (1996). Successful diversity management initiatives. Thousand Oaks,
CA: Sage.
Blitz, D.L., Lazotte, D.V. & Morris, S.B. (2003). Investigating multilevel effects of climate
constructs in linkage research. Paper presented at the Annual Conference for the
Society of Industrial and Organisational Psychology, Orlando, Florida.
Boeyens, M.J. (1985). The synergistic nature of organisational climate. Unpublished
D.Litt et Phil dissertation. Pretoria: University of South Africa.
Carr-Ruffino, N. (1999). Diversity success strategies. Woburn, MA: Butterworths-
Heinemann.
Certo, S.C. (1994). Modern management: diversity, quality, ethics and global
environment. (6th ed.). Boston, MA: Allyn and Bacon.
Cox, T. (1993). Cultural diversity in organisations: theory and practice. San Francisco,
CA: Barrett-Kehler.
Cox, T. (2001). Creating the multicultural organization. San Francisco, CA: Jossey-
Bass.
116

Daniel, R. (1994). Diversity is good for business. Human Resources Management,
10(4), 14-19.
Dass, P. & Parker, B. (1999). Strategies for managing human resources diversity: from
resistance to learning. The Academy of Management Executive, 73(2), 68-80.
Denison, D.R. (1996). What is the difference between organizational culture and
organizational climate? A native’s point of view on a decade of paradigm wars.
Academy of Management Review, 21(3), 619-654.
Dobbs, M.F. (1996). Managing diversity lessons from the private sector. Public
Personnel Management, 25(3), 351 -367.
Dyer, C. (1995). Beginning research in Psychology: a practical guide to research
methods and statistics. Cambridge, MA: Blackwell.
Employment Equity Act, no 55 (1998). Government Gazette, 413 (20626).
Furnham, A. & Gunter, B. (1993). Corporate assessment: auditing a company’s
personality. London: Routledge.
Gilbert, J.A., Stead, B.A. & Ivancevich, J.M. (1999). Diversity Management: a new
organisational paradigm. Journal of Business Ethics, 21(1), 61-70.
Graziano, A.M. & Raulin, M.L. (2000). Research methods: a process of inquiry. Tokyo:
Allyn and Bacon.
Guion, R.M. (1973). A note on organisational climate. Organisational Behaviour and
Human Performance, 9 ,120-125.
117
Hair, J.F. (jr.), Anderson, R.E., Tathem, R.L. & Black, W.C. (1995). Multivariate data
analysis: with readings ( 4th ed.). Englewood Cliffs, NJ: Prentice- Hall.
Hansen, F. (2003). Diversity business case doesn't add up. Workforce, 82(4), 28-32.
Hayes, R.C., Bartle, S.A. & Major, D.A. (2002). Climate for opportunity: A conceptual
model. Human Resource Management Review, 12(3), 445-468.
Hays-Thomas, R. (2004). Why now? The contemporary focus on managing diversity, in
M.S. Stockdale & F.J. Crosby (Eds.,), The psychology and management of workplace
diversity (pp. 4-30). Oxford: Blackwell Publishing.
Harriman, P.L. (1980). Handbook of Psychological Terms. Totowa, NJ: Littlefield,
Adams.
Harrington, L. (1993). Why managing diversity is so important. Distribution Radnor,
92(11), 88-91.
Helliriegel, D & Slocum, J.W. (Jr). (1974). Organizational climate: measures, research
and contingencies. Academy of Management Journal, 17, 255-280.
Hicks-Clarke, D. & lies, P. (2000). Climate for diversity and its effects on career and
organisational attitudes and perceptions. Personnel Review, 29(3), 324-345.
Howell, D.C. (1995). Fundamental statistics for the behavioral sciences (3rd ed.).
Belmont, C A : Duxbury Press.
Howell, D.C. (1999). Fundamental statistics for the behavioural sciences (4th ed.).
Johannesburg: Duxbury Press.
118
Ivancevich, J.M. & Gilbert, J.A. (2000). Diversity management: time for a new approach.
Public Personnel Management, 29(1), 75-92.
Jackson, S.E. & Ruderman, M.N. (1995). Introduction: perspectives for understanding
diverse work teams. In S. Jackson & M. Ruderman (Eds), Diversity in work teams:
Research paradigms for a changing workplace (pp. 1-16). District of Columbia,
Washington DC: American Psychological Association.
James, L.R. & Jones, A.P. (1974). Organizational climate: construct global concept or
tautology. Texas: Christian University, Institute of Behavioral Research.
Jenner, L. (1994). Diversity management: what does it mean? HR Focus, 71 (1), 11.
Kossek, E.E. & Zonia, S. (1993). Assessing diversity climate: afield study of reactions
to employer efforts to promote diversity. Journal of Organisational Behavior,14, 61 -81.
Lauring, J. & Ross, C. (2004). Research notes: cultural diversity and organisational
efficiency, New Zealand Journal of Employment Relations, 20(1), 89-104.
Levinson, H. (1965). Reciprocation: the relationship between man and organization.
Administrative Science Quarterly 9, 370-390.
Lindell, M.K. & Brandt, C.J. (2000). Climate quality and climate consensus as mediators
of the relationship between antecedents and outcomes. Journal of Applied Psychology,
85(3), 331-348.
Lorbiecki, A. (2001). Changing views on diversity management. Management Learning,
32(2), 345-361.
Maier, C. (2002). Leading diversity: a conceptual framework. Bamberg: University of
Switzerland.
119
Martins, E.C. & Martins, N. (2001). Organisational survey as a tool for change. Part two:
A case study. HR Future, 1 (4), 46-49.
Martins, N. & Von der Ohe, H. (2003). Organisational climate measurement: new and
emerging dimensions during a period of transformation. South African Journal of Labour
Relations, Spring/Summer, 41-59.
Maxwell, T.W. & Thomas, A.R. (1991). Inductive measures of psychological climate.
Human Relations, 44(3), 265-285.
McMurray, A.J. (2003). The relationship between organisational climate and
organisational culture. Journal of American Academy of Business, 3(1/2) 1 -8.
Meyer, W.F., Moore, C. & Viljoen, H.G. (1989). Personality theories from Freud to
Frankl. Johannesburg: Lexicon.
Moran, E.T. & Volkwein, J.F. (1992). The cultural approach to the formation of
organisational climate. Human Relations, 45 (1) 19-46.
Motwani, J., Harper, E., Subramanian, R & Douglas, C. (1992). Managing the diversified
workforce. In M.H. Abdelsamad, W.I. Sauser (Eds) , The proceedings SAM
International Management Conference: Managing the diverse workforce (pp. 5-12).
Vinton, VA: Society for Advanced Management.
Mouton, J. & Marais, H.C. (1988). Basic concepts in the methodology of social
sciences. Pretoria:: Human Sciences Research Council Publishers.
Mullins, L.J. (1989). Management and organizational behaviour. London: Pitman.
120
O’Reilly, C., Chapman, J. & Caldwell, O.F. (1991). People and organisation culture: a
profile comparison approach to assessing person-organisation fit. Academy of
Management Journal, 34(3), 487-516.
Pfeffer, J. (1995). Producing sustainable competitive advantage through the effective
management of people. Academy of Management Executive, 9 , 55-69.
Reichers, A.E. & Scheinder, B. (1990). Climate and culture an evolution of constructs. In
B Scheinder (Ed.,), Organizational climate and culture (pp.5-39). Oxford: Jossey Bass.
Riccucci, N.M. (2002). Managing diversity in public sector workforces. Cambridge, MA:
West view Press.
Rijamampianina, R. & Maxwell, T. (2002). The sharing principle: a way of managing
multicultural organisations. South African Journal of Management 33(2), 1-11.
Robbins, S.P. (2001). Organizational behavior. (9th ed.). Englewood Cliffs, NJ: Prentice-
Hall.
Schein, E.H. (1985). Organisational culture and leadership: a dynamic view. San
Francisco: Jossey-Bass.
Scheinder, B., Bowen, D.E. & Ehrhart, M.G. (2000). Climate for service of a construct.
In N.M. Ashkanasy, C.P.M. Wilderom & M.F. Peterson (Eds), Handbook of
organisational climate and culture (pp.21 -36). London: Sage.
Schmidt, L.L., Wood, J. & Lugg, D.J. (2003). A hierarchical model of team climate in an
extreme environment. Paper presented at the 18th Annual Conference for the Society
for Industrial and Organizational Psychology, Orlando, Florida.
121
Sparrow, P.R. & Gaston, K. (1996). Generic climate maps: A strategic Application of
climate survey data. Journal of Organizational Behavior, 17(6) ,679-698.
Svehla, T. (1994). Diversity management: a key to future success. Frontiers of Health
Services Management, 11(2), 3-33.
Thomas, R.R. (1996). Redefining diversity. HR Focus, 73(4), 6-7.
Thomas, D.A. & Ely, R.J. (1996). Making difference matter: a new paradigm for
managing diversity. Harvard Business Review, 74(5), 79-90.
Thomas, R.R. (1997). The concept of managing diversity. From the Bureaucrat to the
Public Manager, 25 (4), 41-44.
Thomas, A. & Robertshaw, D. (1999). Achieving employment equity: a guide to
effective strategies. Randburg: Knowledge Resources.
Thomas, A. (2002). Employment equity in South Africa: Lessons from the global school.
International Journal o f Manpower, 23(3), 237-256.
Thomas, K.M., Mack, D.A. & Montegliani, A. (2004). The arguments against diversity:
are they valid? In M.S. Stockdale & F.J. Crosby (Eds), The psychology and
management of workplace diversity (pp. 31-51). Oxford: Blackwell.
Tilley, A. (1990). An introduction to psychological research and statistics. Queensland:
Pineapple Press.
Turnipseed, D. (1988). An integrated, interactive model of organisational climate, culture
and effectiveness. Leadership and Organisation, 9(5), 17-21.
122
Tustin, C. (1988). The role of individual variables in organisational climate discrepancy.
Unpublished M. Com thesis. Pretoria: University of South Africa.
Vernon,R.N., Bergman, S.M., Bowler, MC, Engel E.A., Zelno, J.A., Rentsch, J.R. &
Woehr, D.J. (2003). Similarity versus diversity: the impact of personality congruence on
teams. Paper presented at the 18th Annual Conference for the Society of Industrial and
Organizational Psychology, Orlando, Florida.
Von Bergen, C.W., Soper, B. & Foster, T. (2002). Unintended negative effects of
diversity management. Public Personnel Management, 31(2), 239-251.
Wah, L. (1999). Diversity at Allstate: a competitive weapon. Management Review, 88
(7), 24-30.
Wallace, J., Hunt, J. & Richards, C. (1999).The relationship between organizational
culture, organizational climate and managerial values. The International Journal of
Public Sector Management, 12(7), 548-559.
Whiston, S.C. (2000). Principles and applications of assessment in counselling.
Belmont, CA: Brooks/Cole Thompson.
Wright, P, Ferris, S.P., Hiller, J.S. & Kroll, M, (1995). Competitiveness through
management of diversity: effects on stock price valuation. Academy of Management
Journal, 38, 272-287.
Yakura, E.K. (1996). EEO Law and Managing Diversity. In E.E. Kossek & S.A. Lobel
(Eds), Managing diversity: human resource strategies for transforming the workplace
(pp. 25-50). Oxford: Blackwell.
123