Embed Size (px)
Citation preview
Page | i
The relationship between employee
perceptions of a corporate brand and
employee engagement
Candice Mann
Student number: 12099709
Tel: 082-405-4713
A research project submitted to the Gordon Institute of Business Science, University of
Pretoria, in partial fulfilment of the requirements for the degree of Master of Business
Administration.
26 September 2012
Copyright © 2013, University of Pretoria. All rights reserved. The copyright in this work vests in the University of Pretoria. No part of this work may be reproduced or transmitted in any form or by any means, without the prior written permission of the University of Pretoria.
©© UUnniivveerrssiittyy ooff PPrreettoorriiaa
Page | ii
ABSTRACT
Secondary data defines employee engagement as “a workplace approach designed to
ensure that employees are committed to their organisation’s goals and values, motivated
to contribute to organisational success and are able at the same time to enhance their
own sense of well-being” (Guest, 2009). Corporate branding is defined as “the systematic
planned management of behaviours, communication, and symbolism in order to attain a
favourable and positive reputation with target audiences of an organisation” (Foster,
Punjaisri & Cheng, 2010). This research paper has three research questions which
examine the relationship between employee perception of a corporate brand and
employee engagement; what impact strong corporate brands have on employee
engagement and lastly examines demographical factors that may impact employee
engagement.
The study design was non-probability and convenience sampling was used. Statistical
tools that were used in this study included t-test, correlation analysis, Cronbach’s alpha
test and factor analysis. The data was collected from seven organisations namely: MTN,
BMW, Absa, McDonalds, KFC, Eskom and Pep which are located within South Africa.
The questionnaire was delivered to a 150 respondents across seven organisations.
The research results indicate that corporate brand variables: brand awareness, brand
loyalty, perceived brand quality, brand leadership, perceived brand value, brand
personality, brand organisation and brand differentiation, have a positive influence on
employee engagement.
The findings from this research can contribute to the body of knowledge within the
domain of improving employee engagement within organisations, which will result in
increased profitability, reduced turnover, improved working environment and enhanced
employee satisfaction. The primary audience for the study will be the academic
community and more specifically individuals interested in marketing and general business
and managerial practices.
Keywords: Employee engagement, corporate branding
Page | iii
DECLARATION
I declare that this research project is my own work. It is submitted in partial fulfilment of
the requirements for the degree of Master of Business Administration at the Gordon
Institute of Business Science, University of Pretoria. It has not been submitted before for
any degree or examination in any other University. I further declare that I have obtained
necessary authorisation and consent to carry out this research.
Name: Candice Mann
Date: 26 September 2012
Signature: X
Page | iv
ACKNOWLEDGEMENTS
To my supervisor Karl Hofmeyr: Thank you for your expertise, guidance, understanding
and assistance. It was a pleasure working with you.
To my father, Jordan Mann: Thank you for your financial assistance and for providing me
with direction and encouragement. You have always believed in me and you have given
me a life changing opportunity which I could not have done without you. I owe you my
eternal gratitude.
To my mother, Sonja Mann: Thank you for your love, support and encouragement
throughout the MBA program. I am forever grateful.
To all my Gibs MBA class mates: Thank you for all the good times we shared together. I
have made some incredible friends and wish you all the best on your journey to success.
To Prof. Nick Binedell: Thank you for giving me the privilege to study at the best business
school in Africa, it has been one of the best experiences of my life.
To my editor, Leah Marais and my statistician, Honest Muchabaiwa: Thank you for your
support and guidance.
Thank God for the wisdom and perseverance that he has bestowed upon me during this
MBA program and throughout my life.
Page | v
CONTENTS
ABSTRACT .................................................................................................................................................. II
DECLARATION ...........................................................................................................................................III
ACKNOWLEDGEMENTS............................................................................................................................. IV
LIST OF TABLES ....................................................................................................................................... VIII
LIST OF APPENDICES ................................................................................................................................. IX
1. INTRODUCTION TO THE RESEARCH PROBLEM ........................................................................................ 1
1.1 RESEARCH TITLE ........................................................................................................................................... 1
1.2 RESEARCH PROBLEM ..................................................................................................................................... 1
1.3 PURPOSE OF THE STUDY ................................................................................................................................ 2
1.4 SIGNIFICANCE OF THE STUDY .......................................................................................................................... 3
1.5 DEFINITION OF TERMS................................................................................................................................... 3
1.5.1 Employee engagement .................................................................................................................... 3
1.5.2 Perception ....................................................................................................................................... 4
1.5.3 Brand ............................................................................................................................................... 5
2. LITERATURE REVIEW ............................................................................................................................... 6
2.1 INTRODUCTION............................................................................................................................................ 6
2.2 EMPLOYEE ENGAGEMENT .............................................................................................................................. 6
2.2.1 Employee engagement – Definition and key drivers ....................................................................... 6
2.2.2 Employee engagement model ......................................................................................................... 8
2.3 BRANDING................................................................................................................................................ 10
2.3.1 Corporate Branding ....................................................................................................................... 10
2.3.2 Brand Awareness ........................................................................................................................... 11
2.3.3 Brand Loyalty................................................................................................................................. 11
2.3.4 Perceived Quality of a Brand ......................................................................................................... 12
2.3.5 Brand Leadership ........................................................................................................................... 12
2.3.6 Brand Value ................................................................................................................................... 13
2.3.7 Brand Personality .......................................................................................................................... 14
2.3.8 Organisational Brands ................................................................................................................... 15
2.3.9 Brand Differentiation .................................................................................................................... 19
2.3.10 Brand Positioning ........................................................................................................................ 19
2.4 PERCEPTION ............................................................................................................................................. 20
2.4.1 Perception – Definition .................................................................................................................. 20
2.4.2 Employee identification ................................................................................................................. 21
3. RESEARCH QUESTIONS ......................................................................................................................... 22
4. RESEARCH METHODOLOGY .................................................................................................................. 23
4.1 RESEARCH DESIGN ...................................................................................................................................... 23
4.2 POPULATION AND SAMPLE ........................................................................................................................... 24
4.2.1 Population ..................................................................................................................................... 24
4.2.2 Sample and sampling method ....................................................................................................... 25
4.3 THE RESEARCH INSTRUMENT ........................................................................................................................ 26
4.4 QUESTIONNAIRE PROCESS ............................................................................................................................ 28
4.4.1 Questionnaire ................................................................................................................................ 29
4.5 DATA ANALYSIS PROCESS ............................................................................................................................. 30
4.6 RESEARCH ASSUMPTIONS ............................................................................................................................ 30
4.7 LIMITATIONS OF THE STUDY ......................................................................................................................... 30
Page | vi
4.8 VALIDITY AND RELIABILITY ............................................................................................................................ 31
5. RESEARCH RESULTS .............................................................................................................................. 32
5.1 SAMPLE ................................................................................................................................................... 32
5.2 SECTION A: DEMOGRAPHIC INFORMATION ..................................................................................................... 32
5.2.1 Companies ..................................................................................................................................... 32
5.2.2 Gender ........................................................................................................................................... 33
5.2.3 Highest education qualification..................................................................................................... 33
5.2.4 Years employed at current job ...................................................................................................... 34
5.3 SECTION B: EMPLOYEE ENGAGEMENT ............................................................................................................ 34
5.3.1 Do you know what is expected of you at work? ............................................................................ 34
5.3.2 Do you have the material and equipment you need to do your work right? ................................. 35
5.3.3 At work, do you have the opportunity to do what you do best every day? ................................... 36
5.3.4 In the last seven days have you received recognition or praise for doing good work? ................. 36
5.3.5 Does your supervisor or someone at work, seem to care about you as a person? ....................... 37
5.3.6 Is there someone at work who encourages your development? ................................................... 37
5.3.7 At work, do your opinions seem to count? .................................................................................... 38
5.3.8 Does the mission/purpose of your company make you feel your job is important? ..................... 38
5.3.9 Are your associates (fellow employees) committed to doing quality work? ................................. 39
5.3.10 Do you have a best friend at work? ............................................................................................. 40
5.3.11 In the last six months, has someone at work talked to you about your progress? ..................... 40
5.3.12 In the past year, have you had the opportunity at work to learn and grow?.............................. 41
5.4 RESEARCH QUESTIONS ................................................................................................................................ 41
5.4.1 Research Question 1 – Is there a positive correlation between employee perception of a
corporate brand and employee engagement? ....................................................................................... 41
5.4.1.1 Cronbach’s Alpha Test ............................................................................................................................. 41
5.4.1.2 Factor Analysis ........................................................................................................................................ 43
5.4.1.3 Correlation Analysis ................................................................................................................................ 44 5.4.2 Research Question 2 – Do companies with a strong established corporate brand have employees
with high engagement? ......................................................................................................................... 50
5.4.2.1 Summed scale ......................................................................................................................................... 51
5.4.2.2 T-Tests used to assess brand strength vs. employee brand perception ................................................. 56 5.4.3 Research Question 3 – Do demographical factors influence employee engagement? ................. 57
5.4.3.1 Gender t-tests ......................................................................................................................................... 57
5.4.3.2 Gender vs brand perception T-Tests ....................................................................................................... 58 6. DISCUSSION OF RESULTS ...................................................................................................................... 60
6.1 INTRODUCTION.......................................................................................................................................... 60
6.2 RESEARCH QUESTIONS ................................................................................................................................ 61
6.3 RESEARCH QUESTION 1: IS THERE A POSITIVE CORRELATION BETWEEN EMPLOYEE PERCEPTION OF A CORPORATE BRAND
AND EMPLOYEE ENGAGEMENT? .......................................................................................................................... 61
6.3.1 Corporate Brand ............................................................................................................................ 61
6.3.2 Brand Awareness ........................................................................................................................... 62
6.3.2 Brand Loyalty................................................................................................................................. 63
6.3.3 Perceived Brand Quality ................................................................................................................ 64
6.3.4 Brand Leadership ........................................................................................................................... 66
6.3.5 Perceived brand value ................................................................................................................... 67
6.3.6 Brand Personality .......................................................................................................................... 68
6.3.7 Brand Organisation ....................................................................................................................... 69
Page | vii
6.3.8 Brand Differentiation .................................................................................................................... 70
6.3.9 Summary ....................................................................................................................................... 71
6.4 RESEARCH QUESTION 2: DO COMPANIES WITH A STRONG ESTABLISHED CORPORATE BRAND HAVE EMPLOYEES WITH HIGH
ENGAGEMENT? ............................................................................................................................................... 71
6.4.1 Summary ....................................................................................................................................... 72
6.5 RESEARCH QUESTION 3: DO DEMOGRAPHICAL FACTORS INFLUENCE EMPLOYEE ENGAGEMENT? ................................ 73
6.5.1 Summary ....................................................................................................................................... 74
7. CONCLUSION AND RECOMMENDATIONS ............................................................................................. 75
7.1 INTRODUCTION.......................................................................................................................................... 75
7.2 MANAGERIAL IMPLICATIONS ........................................................................................................................ 75
7.3 LIMITATIONS OF THE RESEARCH AND SUGGESTIONS FOR FUTURE STUDY ................................................................ 78
7.4 SUMMARY ................................................................................................................................................ 78
8. REFERENCE LIST .................................................................................................................................... 80
9. APPENDICES ......................................................................................................................................... 86
APPENDIX 1: QUESTIONNAIRE FOR ABSA ....................................................................................................... 86
APPENDIX 2: SECTION C OF QUESTIONNAIRE FOR MTN ................................................................................ 91
APPENDIX 3: SECTION C OF QUESTIONNAIRE FOR MCDONALDS ................................................................... 93
APPENDIX 4: SECTION C OF QUESTIONNAIRE FOR KFC .................................................................................. 95
APPENDIX 5: SECTION C OF QUESTIONNAIRE FOR ESKOM ............................................................................ 97
APPENDIX 6: SECTION C OF QUESTIONNAIRE FOR PEP .................................................................................. 99
APPENDIX 7: SECTION C OF QUESTIONNAIRE FOR BMW ............................................................................. 101
Page | viii
LIST OF TABLES
Table 1: Profile of respondents at well established brands in South Africa 25
Table 2: Employee Engagement Questions 26
Table 3: Corporate Brand Questions 27
Table 4: Company 32
Table 5: Gender 33
Table 6: Education Qualification 33
Table 7: Years Employed at Current Job 34
Table 8: Do You Know what is Expected of You at Work? 35
Table 9: Material and Equiptment To Do Work Right 35
Table 10: Opportunity to do your Best Every Day 36
Table 11: Recognition or Praise Received for Good Work 36
Table 12: Supervisor or Someone at Work Caring for you as a Person 37
Table 13: Someome at Work Encouraging your Development 38
Table 14: Do your Opinions Count at Work? 38
Table 15: Mission/Purpose of your company makes the job more important 39
Table 16: Associates (fellow employees) committed to doing quality work 39
Table 17: Best Friend at Work 40
Table 18: Progress at Work 40
Table 19: Opportunity to Learn and Grow 41
Table 20: Cronbach’s Alpha Test 42
Table 21: Factor Analysis 43
Table 22: Brand Awareness Correlation Analysis 44
Table 23: Brand Loyalty Correlation Analysis 45
Table 24: Perceived Brand Quality Correlation Analysis 46
Table 25: Brand Leadership Correlation Analysis 46
Table 26: Perceived Brand Value Correlation Analysis 47
Table 27: Brand Personality Correlation Analysis 48
Table 28: Brand Organisation Correlation Analysis 48
Table 29: Brand Differentiation Correlation Analysis 49
Table 30: T-Tests Regarding Brand Strength and Employee Engagement 50
Table 31: Corporate Branding Summated Scale 52
Table 32: Brand Awareness 52
Table 33: Brand Loyalty 53
Table 34: Perceived Brand Quality 53
Table 35: Brand Leadership 54
Table 36: Perceived Brand Value 54
Table 37: Brand Personality 55
Table 38: Brand Organisation 55
Table 39: Brand Differentiation 56
Table 40: Brand Strength vs Employee Brand Perception T-Tests 56
Table 41: Gender T-Tests Conducted on Employee Engagement Attributes 57
Table 42: Gender vs Brand Perception T-Tests 58
Table 43: Previous Research Summary 60
Table 44: Employee Engagement Questions 71
Page | ix
LIST OF APPENDICES
Appendix 1: Questionnaire for Absa 86
Appendix 2: Section C of questionnaire for MTN 91
Appendix 3: Section C of questionnaire for McDonalds 93
Appendix 4: Section C of questionnaire for KFC 95
Appendix 5: Section C of questionnaire for Eskom 97
Appendix 6: Section C of questionnaire for Pep 99
Appendix 7: Section C of questionnaire for BMW 101
Page | 1
1. INTRODUCTION TO THE RESEARCH PROBLEM
The relationship between employee perceptions of a corporate brand and employee
engagement.
Considerable research has been done into employee engagement which is defined as
“a workplace approach designed to ensure that employees are committed to their
organisation’s goals and values, motivated to contribute to organisational success and
are able at the same time to enhance their own sense of well-being” (Guest, 2009).
Low levels of employee engagement are destructive in an organisation as it leads to
dissatisfaction, poor productivity, absenteeism and employee turnover (Richards,
2012). Low employee engagement levels result in a disconnection between
employees, peers, jobs, managers and the organisation. According to the United
States Strategic Reward Survey by Watson Wyatt and WorldatWork, the levels of
employee engagement have decreased by 9% from 2009 to 2010 (Richards, 2012),
costing United States organisations between $250 and $350 billion a year (Rath &
Conchie, 2009).
The Gallup Organisation has also found that 20% of United States employees are
disengaged. The Corporate Leadership Council (2002) has conducted a survey
whereby 50,000 employees at 59 global organisations were researched; the study
found that 10% of employees were disengaged. A similar study done with more than
85,000 employees from 16 countries found that 24% of employees were disengaged
(Towers Perrin, 2006). In order to ensure optimum employee engagement, an in-depth
understanding regarding the cause and effects of low employee engagement need to
be analysed.
A survey conducted by Akron’s Centre for Organisational Research has found that
employees with low engagement levels have characteristics such as: dissatisfaction,
employee attrition, low tolerance levels, inconsistency and low goodwill (Zaineb, 2010).
Low employee engagement thus has a negative impact on the organisation as the
Page | 2
organisation loses top talent and the success of the organisation is jeopardised
(Zaineb, 2010).
Ma and Lai (2010) believe that organisations should therefore focus on building a
strong corporate brand, “the systematic planned management of behaviours,
communication, and symbolism in order to attain a favourable and positive reputation
with target audiences of an organisation” (Foster, Punjaisri & Cheng, 2010), as it
improves employee performance and attitudes which enhance the firm’s
competitiveness. This however requires a strong workforce within the organisation,
Fiona Harris and Leslie de Chernatony (2001) state that corporate branding involves
internal factors within the organisation such as paying more attention to employees.
There are three factors that affect brand perceptions and performance. These factors
involve the similarity of brand team members, shared values and communication
(Harris & de Chernatony, 2001). However, employees are likely to differ in their
perceptions of their brand’s identity as perception is created through one’s past
experiences and current information provided by the stimuli (Harris & de Chernatony,
2001). Thus employees from different levels within an organisation have different
information and decision criteria (Harris & de Chernatony, 2001).
In summary, low employee engagement still exists within many organisations which
jeopardises the success of the organisation. Ma and Lai (2010) believe that building a
strong corporate brand will improve employee attitudes and performance. With this
said, the integration of employee engagement and corporate branding has largely been
overlooked.
The purpose of this study is to determine whether employee perception of a corporate
brand have an effect on employee engagement. This study will broaden our knowledge
on some of the causes of poor employee engagement as well as provide us with a
better understanding as to what degree employee perception of a corporate brand has
an influence on employee engagement. It may also provide a way of formulating a
treatment or solution that can be presented to facilitate overcoming low employee
engagement.
Page | 3
The three objectives for this research are:
i. To determine if a corporate brand is effective in raising employee engagement
as perceived by employees.
ii. To evaluate how the levels of employee engagement impact a corporate brand.
iii. To investigate what factors within a corporate brand impact employee
engagement.
The study fills a gap in that extensive research has been done regarding employee
engagement with little emphasis on employee perceptions of a corporate brand.
Therefore there is a gap regarding the correlation between the two topics, which
provides for a great opportunity to research this topic in more depth.
This is a relevant topic to acquire research on and will benefit students, organisations
and employees as this research aims to increase profitability, reduce turnover, and
improve the working environment and employee satisfaction. The primary audience for
the study will be the academic community and more specifically individuals interested
in marketing and general business and managerial practices.
In order to completely understand the research topic – the relationship between
employee perception of a corporate brand and employee engagement, one needs to
understand the terms. The following definitions have been provided: employee
engagement, perception and branding.
1.5.1 Employee engagement
The term ‘employee engagement’ has been around for a long time and therefore
numerous developments and changes have been accorded throughout the years. The
most appropriate definition would emerge from an organisation whereby practical
examples of employee engagement are seen on a daily basis (Robertson-Smith &
Markwick, 2009). The following definitions are from organisations within the public and
private sector:
Page | 4
“An outcome measured or seen as a result of people being committed to something or
someone in the business – a very best effort that is willingly given” – Vodaphone.
(Stuff, 2008)
“The degree to which employees are satisfied with their jobs, feel valued, and
experience collaboration and trust. Engaged employees will stay with the company
longer and continually find smarter, more effective ways to add value to the
organisation. The end result is a high performing company where people are flourishing
and productivity is increased and sustained.” – Johnson and Johnson. (Catteeuw,
Flynn & Vonderhorst, 2007)
“The extent to which employees commit to something or someone in their
organisation, how hard they work and how long they stay as a result of that
commitment.” (Corporate Leadership Council, 2004)
“An emotional attachment to the organisation, pride and a willingness to be an
advocate of the organisation, a rational understanding of the organisation’s strategic
goals, values, and how employees fit and motivation and willingness to invest
discretionary effort to go above and beyond” – Nokia Siemens Network. (Nokia
Siemens Network, 2008)
The eight key drivers of employee engagement are (Soldati, 2007):
Trust and integrity
Nature of the job
Line of sight between employee performance and company performance
Career growth opportunities
Pride about the company
Co-workers/team members
Employee development
Employee relationships with their manager
1.5.2 Perception
Perception is defined as the process whereby individuals take unrefined sensations
from their surroundings and interpret them, by using knowledge, experience and
understanding of the world in order for sensations to become significant sensations
(Bernstein, Penner, Clarke-Stewart & Roy, 2006).
Page | 5
Each individual interprets a situation differently and may come up with different
meanings of reality. However, Sharma (2011) states that individuals react to the
“perception of reality rather than the reality itself”. It is therefore important to
understand employees’ perceptions of an organisation as it will help the understanding
of employees’ organisational behaviour better (Sharma, 2011).
Employees working for an organisation will experience different perceptions compared
to those who work for an alternative organisation. It is this reason why organisations
control employees with rules and regulations and ensure organisational culture and
cooperation to guarantee optimal performance within the organisation (Sharma, 2011).
1.5.3 Brand
A brand is defined as: “a name, term, sign, symbol, or design, or a combination of
them, intended to identify the goods or services of one seller or group of sellers and to
differentiate them from those of competitors” (American Marketing Association, 1960).
Page | 6
2. LITERATURE REVIEW
This literature review consists of secondary data – “data that have already been
collected for purposes other than the problem at hand” (Molhatra, 2010). The type of
secondary data used for this study consisted of published sources such as academic
journals, dissertations and academic articles.
The objective of the literature review was to provide information regarding employee
engagement, branding and perception. Specific concepts and perspectives are
discussed in this chapter with reference to a wide range of secondary data.
2.2.1 Employee engagement – Definition and key drivers
Employee engagement is defined as: “a workplace approach designed to ensure that
employees are committed to their organisation’s goals and values, motivated to
contribute to organisational success and are able at the same time to enhance their
own sense of well-being” (Guest, 2009). According to Konrad (2006) employee
engagement involves three factors: emotional, behavioural and cognitive. The
emotional factor is determined by how employees feel about their colleagues, leaders
and organisation (Konrad, 2006). The behavioural factor is determined by the quality of
work employees produce (Konrad, 2006). The cognitive factor is determined by the
beliefs of employees regarding the organisation, its leaders and its culture (Konrad,
2006).
The relationship between employee perception of a corporate brand and employee
engagement focuses on the cognitive and emotional factors of employee engagement
as this involves employees’ perceptions of an organisation and more specifically the
perceptions of an organisation’s brand.
According to Lockwood (2007) the key lever for employee engagement is employees’
emotional commitment to their job. The level of emotional commitment is determined
by factors such as the extent to which employees gain “enjoyment, meaning, pride or
inspiration” from someone or something within an organisation (Lockwood, 2007).
Page | 7
Emotional commitment is found to deliver stronger performance than rational
commitment and therefore studying employees’ emotional commitment would be
beneficial to any organisation as it will reduce employee turnover, increase customer
satisfaction, employee productivity and profits (Attridge, 2009).
MacLeod and Clarke (2009) identify four “enablers” that contribute to employee
engagement. The first enabler is leadership through storytelling which explains to
employees the goals of the organisation and why certain goals have been put into
place. This will help employees understand how their role contributes to the success of
the organisation. The second enabler that contributes to employee engagement is
supportive managers; managers need to motivate, challenge and support employees.
The third enabler is an employee voice, employees should feel comfortable to express
their opinions and employees should be given the opportunity to take part in the
decision-making process. The last enabler is integrity – the values of the organisation
need to be aligned with the behaviours of the organisation.
The Gallup Organisation, a consulting firm that specialises in employee engagement,
has done extensive research, and has interviewed more than 10 million employees and
managers across 114 countries in 41 different languages. The results from the
research revealed 12 statements, better known as the Q12, that predict employee and
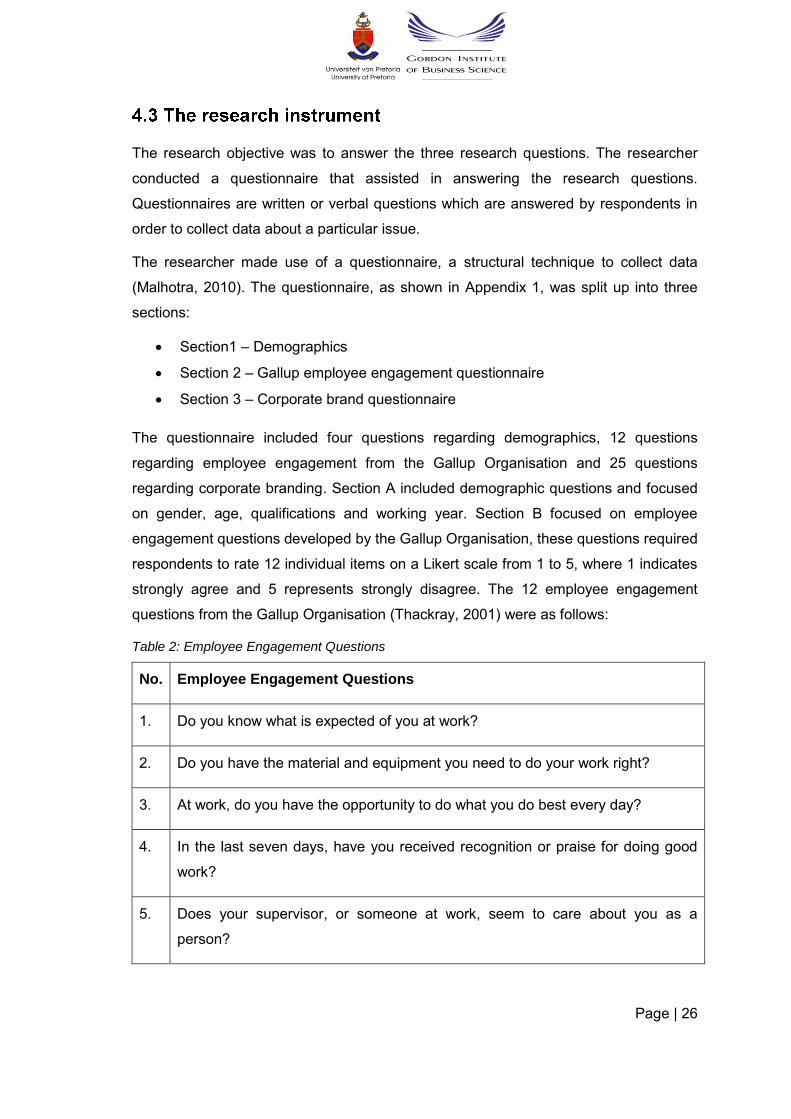
workgroup performance (Gallup, 2012). These are:
i. I know what is expected of me at work – Gallup’s research reveals that many
successful organisations have set the correct goals and outcomes for their
employees to follow and have provided a platform to measure performance.
ii. I have the materials and equipment I need to do my work right – Gallup
suggests that organisations need to find out what employees need in order to
accomplish goals and objectives.
iii. At work I have the opportunity to do what I do best every day – It is important
that the organisation acknowledges employees’ strengths and weaknesses, in
order to help employees work on their strengths.
iv. In the last seven days, I have received recognition or praise for doing good
work – Gallup suggests that employees should receive praise and recognition
once a week, this will encourage positive behaviour.
v. My supervisor, or someone at work, seems to care about me as a person –
Good organisations have good managers. Managers need to have good
Page | 8
relationships with their employees so that employees can share information with
them.
vi. There is someone at work who encourages my development – Organisations
need to help employees find their strengths by providing constant feedback and
creative development opportunities.
vii. At work, my opinions seem to count – Organisations need to provide different
channels of communication and managers need to maintain those channels to
ensure employees use them effectively.
viii. The mission/purpose of my company makes me feel my job is important –
Gallup states that organisations need to ensure employees understand the
mission statement of the business and the ways in which employees contribute
to the organisation as this statement defines how motivated employees are.
ix. My associates (fellow employees) are committed to doing quality work –
Managers need to communicate the standards of the business as this will
increase accountability and trust amongst employees.
x. I have a best friend at work – Managers need to encourage an open
communication policy. Employees who have good friends at work tend to share
values, watch out for each other and trust each other more than employees who
do not have good friends at work.
xi. In the last six months, someone at work talked to me about my progress –
Gallup states that feedback improves performance therefore managers need to
ensure that goals, objectives and achievement levels are clearly structured so
that employees have something to aspire to.
xii. This last year, I have had the opportunities at work to learn and grow –
Organisations need to provide employees with educational programmes.
According to the Gallup Organisation, “only a sheer 33% of employees are actively
engaged, 49% not engaged, and 18% actively disengaged.” To improve employee
engagement levels, Gallup suggests following the above 12 mentioned statements.
2.2.2 Employee engagement model
The Gallup Organisation has devised a four dimensional model of employee
engagement as illustrated in Figure 1 that attempts to measure core sets of employee
emotions.
Page | 9
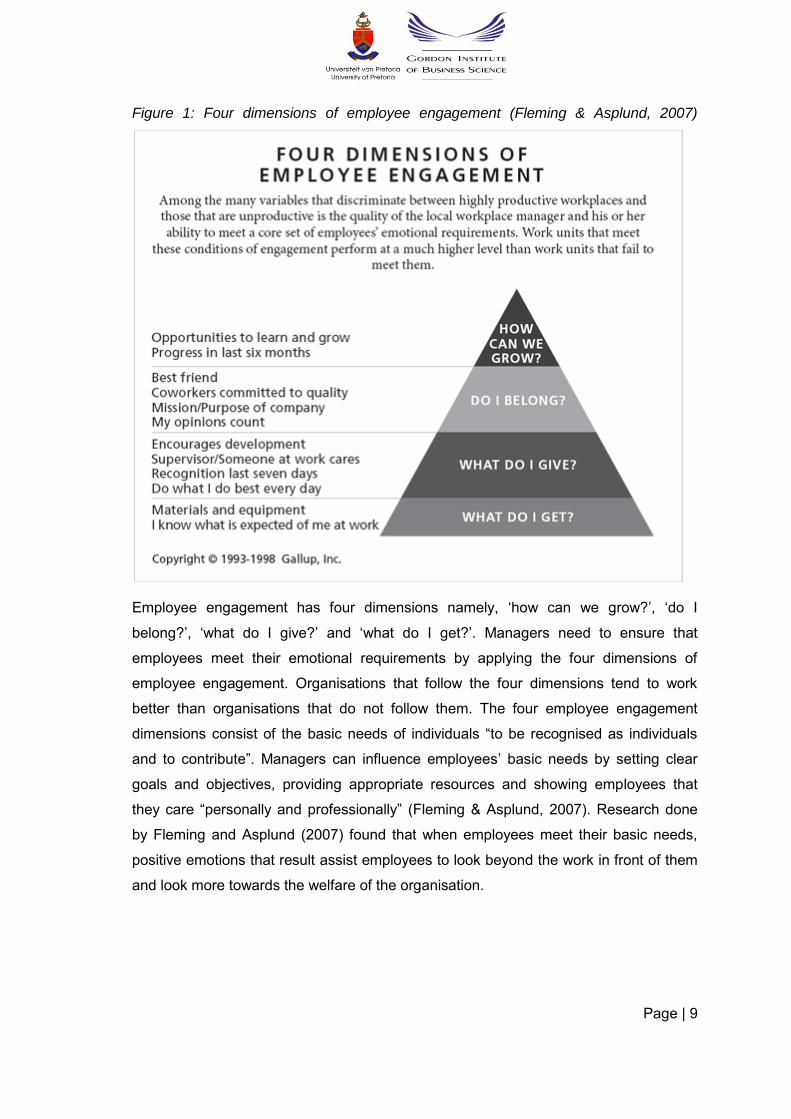
Figure 1: Four dimensions of employee engagement (Fleming & Asplund, 2007)
Employee engagement has four dimensions namely, ‘how can we grow?’, ‘do I
belong?’, ‘what do I give?’ and ‘what do I get?’. Managers need to ensure that
employees meet their emotional requirements by applying the four dimensions of
employee engagement. Organisations that follow the four dimensions tend to work
better than organisations that do not follow them. The four employee engagement
dimensions consist of the basic needs of individuals “to be recognised as individuals
and to contribute”. Managers can influence employees’ basic needs by setting clear
goals and objectives, providing appropriate resources and showing employees that
they care “personally and professionally” (Fleming & Asplund, 2007). Research done
by Fleming and Asplund (2007) found that when employees meet their basic needs,
positive emotions that result assist employees to look beyond the work in front of them
and look more towards the welfare of the organisation.
Page | 10
2.3.1 Corporate Branding
Corporate branding stresses the importance of employees’ behaviours and attitudes
and has given rise to internal branding and employee branding, as both emphasise the
importance of aligning employees’ beliefs and values with the corporate brand.
Branding consists of the delivery of a message to potential and existing customers, it is
essential that organisations clearly define their corporate brand. Corporate branding
concerns “the systematic planned management of behaviours, communication, and
symbolism in order to attain a favourable and positive reputation with target audiences
of an organisation” (Foster, Punjaisri & Cheng, 2010).
Perception plays a major role in a corporate brand, as external stakeholders judge
employees’ behaviour. Harris and de Chernatony (2001) state that: “employees have
the potential to make or break the corporate brand”. It is therefore critical that every
employee within an organisation understands what the corporate brand values stand
for. Foster et al (2010) refers to corporate identity as the organisation’s ethos, aims and
values, which represents the corporate brand and links the organisation with its
customers.
Knox and Bickerton (2003) identified six conventions of corporate branding: brand
context (vision, image, culture and competitive landscape), brand construction/
corporate brand positioning framework (organisational attributes, performance, portfolio
and network benefits), brand confirmation/articulating the brand position (corporate
language), brand consistency (consistent corporate communication), brand continuity
(business processes that impact the corporate brand and customer value) and lastly,
brand conditioning (brand monitoring, development and renewal).
Hatch and Schultz (2001) state that a corporate brand needs three elements in order to
be successful. The three elements are referred to as “strategic starts” and comprise of
vision, culture and image. (1) The vision of the organisation is top management’s
aspirations, (2) the culture refers to how employees feel about an organisation, these
include attributes such as values, behaviours and attitudes, and (3) the image of the
organisation refers to how stakeholders perceive the organisation.
According to van Haaften (2009) corporate branding encapsulates brand vision, brand
values, brand personality and brand positioning. In conclusion, a corporate brand
Page | 11
provides a sustainable competitive advantage (SCA) in an organisation by providing
economic value to products and services.
This study used eight corporate brand constructs, these were: brand awareness, brand
loyalty, perceived brand quality, brand leadership, perceived brand value, brand
personality, brand organisation and brand differentiation.
2.3.2 Brand Awareness
Aaker (1996) claims that brand awareness is becoming more challenging and believes
organisations that distribute messages across different non-traditional media such as
TV, newspaper, radio, Internet, direct marketing, trade shows and event sponsorship,
are organisations that will create brand awareness.
Brand awareness plays an important role in brand equity. In order for brand equity to
exist in the minds of consumers, brand awareness needs to take place. Brand
awareness needs to neglect brand recall and focus on how likely customers are to
recommend your products or services to others (Weber, 2009).
Kotler and Keller (2006) state that brand awareness is the ability of individuals to recall
a brand in detail which assists with acquiring a product or service. Brand awareness
involves brand recall and brand recognition; brand recall is the most important and
occurs outside the organisation as opposed to brand recognition which happens inside
the organisation (Kotler & Keller, 2006).
2.3.3 Brand Loyalty
Brand loyalty has aroused vast interest amongst the academic field as they believe
brand loyalty is one of the most important attributes when consumers choose a brand.
According to Durkin (2010) loyalty begins with employees and she believes once
employees are loyal to the brand they work for, customers will automatically become
brand loyal, “cultivating a strong brand following”. Kotler, Brown, Adam, Burton and
Armstrong (2007) state that one should not confuse brand loyalty, the commitment of a
brand and the ability to make repeat purchases, with “habit, indifference, a low price or
unavailability of other brands”.
Employees are loyal because they want to build a sustainable relationship with their
employer. The economic downturn may also be a result of employee loyalty as some
companies refuse to recruit new employees to save costs, making it difficult for
Page | 12
individuals to find a new position. Michalowicz (2012) states that employees are loyal
due to three “secrets”:
Evaluate – Employers need to recruit individuals who are naturally loyal.
Loyalty cannot be taught and therefore it has to be present in the individual’s
character. The seven organisations that took part in this study, must have
recruited naturally loyal individuals, as employee loyalty was high across all
seven organisations.
Reciprocate – To encourage loyalty amongst employees, leaders need to be
loyal to their employees and provide financial and non-financial rewards such
as: respect and praise, employee of the month awards, work flexibility and
listening to suggestions and feedback. The employee engagement
questionnaire revealed that on average employees rated recognition, praise
and feedback highly, which substantiates Michalowicz’s argument that explains
why employees are loyal.
Simplify – Employers must remove all barriers that prevent employees from
achieving goals and objectives. Employees that find it easier to get a job done
are more loyal than employees that have many barriers. When asked the
question: “Do you have the material and equipment you need to do your work
right?” employees on average responded that they do have the correct material
and equipment to do work right which explains why they are loyal to the brand
they work for.
2.3.4 Perceived Quality of a Brand
Perceived quality of a brand is defined as an “intangible element or simply a feeling
towards a brand, which would not only be constrained within the performance, feature,
price, and other quality dimensions of the brand” (Tsang, Lee & Li, 2011). Gronroos
(1988) points out that when experience meets expectations, consumers tend to
perceive the quality of the brand to be good. This implies that organisations need to
meet expectations of both consumers and employees, as this will create a good
perception about the organisation’s brand.
2.3.5 Brand Leadership
De Chernatony, McDonald and Wallace (2011) define brand leadership by the
profitability of an organisation and believe that organisations that have a higher market
Page | 13
share have higher profits. Leading brands also have lower costs due to the principle of
economies of scale. For the purpose of this study brand leadership is measured
according to three elements: innovation in comparison to competitors, popularity in
comparison to competitors and lastly, brand leadership in comparison to competitors.
Burkitt and Zealley (2006, as cited in De Chernatony, McDonald and Wallace, 2011)
exploded research regarding the characteristics of high performing brands and
discovered that they all have three common characteristics: measure and evaluate
marketing activities and outcomes, recruit and train individuals with analytical skills and
lastly, focus on business outcomes and link the data to common key performance
indicators.
Brand leadership is therefore defined as managers that have distinctive talents that are
focused on fulfilling customers and investors’ expectations. The leadership brand is
entrenched into the culture of the organisation through its “policies and its requirements
for employees” (Ulrich & Smallwood, 2007). Building a leadership brand requires
organisations to follow five principles (Ulrich & Smallwood, 2007). The first principle is
to set strategies that will meet the goals and objectives of an organisation and to recruit
the correct employees. The second principle is to ensure that managers internalise
high expectations that are perceived by customers. The third principle is to evaluate
leaders according to external perceptions. The fourth principle is to provide leadership
skills to leaders within organisations so that they can fulfil external expectations. The
last principle states that organisations need to track the leadership brand over the long
term (Ulrich & Smallwood, 2007).
2.3.6 Brand Value
“Brand equity is the value of the brand” (Kotler et al., 2007). Marketers and researchers
use various views to study brand equity. Kotler and Keller (2009) define brand equity
as: “the added value endowed on products and services, reflected in how consumers
think, feel, and act with respect to the brand, as well as the prices, market share, and
profitability the brand commands for the firm.”
Organisations build brand equity by creating the correct brand knowledge structures
with the right target market (Kotler & Keller, 2009). There are three main sets of brand
equity drivers: brand elements (brand names, URLs, logos, symbols, characters,
spokespeople, slogans, jingles, packages and signage), the products and services and
all the accompanying marketing activities and supporting marketing programmes and
Page | 14
lastly, there associations indirectly transferred to the brand by linking it to some other
entity (a person, place or thing).
Aaker believes that brand equity consists of five assets: perceived quality, brand
awareness, brand association, brand loyalty and other proprietary brand assets (Aaker,
1996). However, Brasco and Mahajan (in Pappu et al. 2005) classify brand equity into
two categories. The first category consists of the financial consideration, which talks
about the brand equity value for the organisation. The second category consists of the
consumer perspective which talks about the brand equity value for the consumer.
According to research done by the Performance Improvement Council (2012) engaged
employees have enormous impact in positively affecting brand value. According to
research done by the Gallup Organisation, strong brands with high employee
engagement levels have 3.9 times the earnings per share compared to organisations
with low employee engagement levels (Performance Improvement Council, 2012).
Another study done by Towers and Watson indicates that employee engagement has a
positive influence on financial performance; there is a 5.75% difference with regards to
operating margins and 3.44% difference in net profit margins (Performance
Improvement Council, 2012).
2.3.7 Brand Personality
Brand personality is human attributes that are applied to a brand and acts as a form of
competitive advantage within organisations by building trust, commitment and strong
relationships between the organisation and the consumer (Sorensen, 2011). Jennifer
Aaker identified that there are five brand personality traits: (1) sincerity, (2) excitement,
(3) competence, (4) sophistication, and (5) ruggedness. Brands have their own
personality traits, so consumers choose brands based on their preferences and
personality traits and consumers tend to look at how their personality is aligned with
that of the brand (Lin, 2010). Organisations need to create a long and lasting brand
personality as it encourages brand loyalty from target customers (Lin, 2010).
Corporate brand personality is about employee perception of the actions, words and
values of an organisation and can be characterised into three attributes: affective,
cognitive and conative. These three attributes are distinctive personality traits that are
used to guide employees within an organisation and influence how employees will view
the organisation. The first attribute is affective or the “heart” of an organisation, which
talks about “passionate and compassionate”. The first attribute states that
Page | 15
organisations need to be “passionate” about serving their customers and
accomplishing objectives and “compassionate” about their community. The second
attribute is cognitive or the “mind” of an organisation, which talks about “creativity and
disciplined”. The second attribute states that organisations need to be “creative” in the
ways they meet customers’ needs and requirements yet still be “disciplined” to stay on
track. The third attribute is conative or the “body” of an organisation, which talks about
“agile and collaborative”. The third attribute states that organisations need to be “agile”
in order to adapt to change in the market and establish a “collaborative” approach that
will work well to align common goals of an organisation (Keller & Richey, 2006).
2.3.8 Organisational Brands
“A brand is a name, term, sign, symbol or design, or a combination of them intended to
identify the goods or services of one seller and differentiate them from those of
competition” (American Marketing Association, 1960). Branding is vital when
conducting business as it acts as a form of competitive advantage and survival (Tsang,
Lee & Li, 2011). A brand is a differentiating factor that distinguishes one product or
service from another. Kotler and Keller (2009) support the views of Tsang, Lee and Li
(2011) and suggest that the brand’s product performance may be different functionally,
tangibly or rationally, creating a differentiation amongst competitors. According to
research done in the past 30 years, the definition of branding has changed significantly.
Branding tends to focus more on corporate agendas which supports value creation
through the use of strategic tools (Urde, 1999).
Brand organisation looks beyond the brand, a name, term, sign, symbol or design used
to differentiate goods or services from competitors (American Marketing Association,
1960) and instead measures to what extent organisations are socially responsible, its
corporate citizenship and if an organisation cares about its customers. Andriof,
Waddock, Husted and Rahman (2002) state that corporate citizenship not only
increases corporate reputation, but also acts as a form of competitive advantage which
benefits an organisation financially. In order to increase corporate reputation,
organisations need to take part in five activities: “retain employees to avoid
redundancies, assist in the development of employment programmes for the
unemployed in the local region, focus on increasing the use of recyclable materials in
their manufacturing processes, become industry leaders in developing environmentally
Page | 16
sustainable business practices and lastly subsidise and maintain services to rural
communities.” (Andriof, Waddock, Husted & Rahman, 2002).
According to research done by Bhattacharaya, Sen and Korschun (2008), corporate
citizenship has a positive influence on employee engagement and in order to increase
employee engagement levels organisations need to focus on improving corporate
citizenship, caring for the well-being of the organisation’s stakeholders and the
environment (Glavas & Piderit, 2009). The result reveals a favourable response which
indicates that employees from the seven organisations believe that their organisation
has corporate citizenship. According to Ketvirtis (2012), the most important attributes of
corporate citizenship as perceived by employees are: energy efficiency initiatives,
social innovation opportunities and employee charitable contribution-matching
programmes.
Well established brands in South Africa:
Absa
The Absa Group Limited (Absa), listed on the Johannesburg Stock Exchange (JSE) is
one of the largest financial institutions in South Africa. Absa offers its consumers an
array of services such as: business, retail, corporate and investment banking, wealth
and insurance management products and services. Absa operates not only in South
Africa but also other African countries such as: Mozambique, Tanzania, Namibia,
Nigeria and Botswana.
Absa focuses on five core values: value the people that are employed by Absa and
treat them in an appropriate manner, display integrity in all actions, surpass the needs
of customers, take responsibility for work done and lastly display leadership. In order
for Absa to accomplish its goal of being the number one bank in South Africa and
Africa in terms of profitability and equity, Absa needs to enter into new markets and
seek new business opportunities, understand customer needs and requirements and
meet all financial needs of customers.
The Absa brand was reinvented in 1998 with the goal in mind to create one brand with
multiple financial services, a “one-stop shop which offers simple, uncomplicated
banking relationships, value for money, stability, convenience and superior customer
service”. The new visual identity emphasises the letter A, as the A means “Alpha” and
represents a “new beginning”. The colour red was decided upon as red has a
psychological connotation and resembles excitement and energy and is distinctively
Page | 17
different from Absa’s four competitors. The Absa brand stands for “union, fusion and
wholeness” and is rated the number one banking brand and coolest banking brand in
South Africa for the 6th consecutive year (Absa, 2012).
BMW
BMW is one of the largest car manufacturers in the world today and produces several
lines of cars, ranging from the 1 series to the X line. The popularity of the BMW car is
due to their award-winning website, whereby individuals can design the interior and
exterior of the car they wish to purchase. The popularity of the BMW car is also due to
their high profile image campaigns, such as the James Bond promotion. “BMW’s
strategy is to keep its products in the introduction and growth stages by periodically
introducing new models in each of its product lines. In fact, BMW does not like to have
any products in the maturity and decline stage of the product life cycle, explains
McDowell. A declining product does not do the brand image any justice and that is why
BMW works hard at managing the growth aspect” (Stealing Share, 2010).
According to a study that was released in May 2012 by market research company
Milward Brown, BMW is the most valuable automotive brand according to an annual
ranking of the world’s top brands (Cunningham, 2012).
McDonalds
McDonalds is a fast food company that was established in 1940, by two brothers who
wanted to provide convenience to consumers. McDonalds is the largest fast food chain
around the world and have done an excellent job with making the brand recognisable.
McDonalds takes part in a number of marketing campaigns, which has led McDonalds
to win numerous awards. In 2011 McDonalds ranked 16th as the employer brand by the
Employer Branding Institution and ranked 15th in India’s 100 most valuable brands
study done by 4P’s Magazine (Awards & Accolades, 2010). “In 2011, the total brand
value of McDonalds increased by $4,019 million to $24,211 million. McDonalds has
further improved its brand rating from a –AAA in 2010 to AAA in 2011 and increased in
its brand ranking from 18 to 17 within the Brand Finance Global 500 2011” (Brand
Directory, 2011).
MTN
MTN is a multinational telecommunication company which operates in 10 countries
across Africa. MTN has been rated the country’s most valuable brand according to the
Sunday Times Top Brands Award in the Business to Consumer (B2C) category and is
Page | 18
the most preferred brand in the telecommunications sector (MTN, 2011). The MTN
brand is valued at $4.7 billion, almost double its rivalry. The MTN has received a
number of awards including, a gold Loerie for the Ayoba campaign, AfricaCom Best
Marketing Campaign for the Ayoba campaign, Sunday Times Marketing Personality of
the Year, Serame Taukobong, and various Virgin Active Sport Industry Awards such as
the FIFA World Cup and Last Fan Standing Award (MTN, 2011). MTN aims to expand
across the globe by focusing on maintaining the five MTN brand values: integrity
(consistently doing what is right), leadership (providing vision and guidance), innovation
(finding new ways of doing things), can-do (anything is possible) and relationships
(MTN, 2010).
KFC
KFC is the largest, most popular, chicken restaurant chain which operates in 109
countries across the world and has a total of 5 200 restaurants and every day KFC
receives 12 million consumers (KFC, 2012). The annual Sunday Times Top Brands
survey announced in 2011 that KFC won third place in the overall favourite brand
category (Khan, 2011).
Less preferred brands in South Africa
Pep Stores
The Pep brand was established in the 1950’s in the Northern Cape, Pep offered
individuals durable and quality goods at discounted prices (Irwin, 2002). Pep is the
largest single brand retailer which operates in 11 countries across Southern Africa,
targeting the lower to middle income bracket and offering customers: textiles, footwear,
household goods, clothing and cellular products (Irwin, 2002). Pep has 1400 stores in
operation with total employment of 14 000 employees (Irwin, 2002).
Eskom
Eskom generates, transmits and distributes 95% of South Africa’s electricity (Eskom,
2012). Eskom has insufficient generation capacity to meet the demand of their
customers, so load shedding has been introduced to “prevent instability of the country’s
interconnected generation network which would result in uncontrolled nation-wide
blackouts” (eThekwini Municipality, 2011). Load shedding has damaged Eskom’s brand
and is viewed as a less preferred brand.
Page | 19
2.3.9 Brand Differentiation
Differentiated marketing is a marketing strategy that focuses on establishing new
market segments by providing new product offerings to consumers (Kotler et al., 2007).
By offering consumers a wide range of products and services, market differentiation
hopes to increase sales, market share and profitability (Kotler et al., 2007). Dibb and
Simkin (1997) have developed a segmentation process that involves three stages:
marketing analysis, strategy development and marketing programmes. When starting
out the segmentation process organisations need to establish clear objectives, as this
will provide a clear direction of issues to be addressed and issues to be researched.
The segmentation process is an ongoing cycle, which begins with the analysis strategic
link, this link talks about marketing intelligence and states that individuals in charge of
making strategic decisions should understand the marketing intelligence. The next link
is the strategic programme link, which states that organisations need to develop
programmes that reflect the strategy and the appropriate target market. The last link is
the programmes analysis link, which states that organisations should develop
marketing programmes that not only fulfil marketing strategies but also change the
status quo. The results will change consumers’ perception and behaviour and therefore
further research needs to be undertaken to monitor consumers and competitors (Dibb
and Simkin, 1997).
2.3.10 Brand Positioning
Brand positioning is actions that position the brand in the minds of consumers. More
specifically, brand positioning is the reason why consumers choose brands over
competitors. Kotler and Keller (2006) define brand positioning as an “act of designing
the company’s offering and image to occupy a distinct place in the minds of the target
market.”
In order to position the brand in the minds of the consumers, Trout (1995) suggests
that a mental model should be used. There are five mental models that can be applied
when positioning a brand:
Minds are limited – minds only remember new information if it matches one’s
current mind set.
Minds hate confusion – when positioning a brand, one needs to reveal the most
powerful attributes and keep the message simple in order for consumers to
remember the brand.
Page | 20
Minds are insecure – Consumers are more emotional and rely on people for
advice when making a purchasing decision.
Minds do not change – Consumers’ minds are sensitive and do not change
easily, it is therefore essential the brands are perceived correctly by consumers.
Minds can lose focus – Consumers may lose focus when brands have too many
line extensions. When there are many line extensions, brands lose consistency
and do not focus on key attributes of the brand.
In order to create the desired positioning strategy for a brand, Kapferer (2007)
identified four determinations: (1) definition of the target market, (2) definition of the
frame of reference and subjective category, (3) consumer benefits or promise, and (4)
reason to believe.
Corporate Image
A brand image is related to the perceptions of reality that are associated with a
particular brand (Aaker, 1991). Banutu-Gomez, Coyle, Edenhoech, Fallucca, Minetti
and Sarin (2009) believe that employees’ perception of an organisation should run
parallel to that of the customer. Brand image, an organisation’s image and employee
trust have a direct impact on customer value through customers’ perceptions of service
quality (Banutu-Gomez, Coyle, Edenhoech, Fallucca, Minetti and Sarin, 2009).
Research has however found that employees’ perception of an organisation is not
always parallel with that of the customer (Banutu-Gomez, Coyle, Edenhoech, Fallucca,
Minetti and Sarin, 2009).
2.4.1 Perception – Definition
Perception is defined as the process whereby individuals take unrefined sensations
from their surroundings and interpret them, by using knowledge, experience and
understanding of the world in order for sensations to become significant sensations
(Bernstein, Penner, Clarke-Stewart & Roy, 2006).
There are three main approaches when understanding perception: computational,
constructivist and ecological approaches. A computational approach is defined as an
approach that involves the nervous system translating raw sensory data into an
Page | 21
experience, the constructivist approach involves sensory information that constructs
reality and lastly the ecological approach believes that humans have an innate ability to
perceive stimuli without high level analysis (Bernstein, Penner, Clarke-Stewart & Roy,
2006). Employees within an organisation will therefore use sensory information,
nervous system and environmental influencers when constructing a perception about
the brand of the organisation they work for.
According to Tsang, Lee and Li (2011) there are three possible factors of employees’
perception based on previous studies: employee commitment, employee identification
and service quality. Employee commitment describes the degree of employees’
emotional relationship with a brand, which controls their readiness to exert brand
citizenship behaviour (Burmann & Zeplin, 2005). According to Burmann and Zeplin
(2005) the level of brand awareness contributes toward employees’ commitment to a
brand.
2.4.2 Employee identification
Employee identification is defined as the “acceptance of social influence due to a sense
of belongingness to the group, determining the brand experience and a perception of
being intertwined with the group’s fate, i.e., its success or failure are perceived as one’s
own” (Burmann & Zeplin, 2005). Research has found that employees are more
committed to an organisation if they feel a sense of belonging to the brand. Little and
Dean (2006) found that service quality capability has a direct correlation with employee
commitment levels. Thus service quality capabilities, employee commitment and
employee identification within organisations are vital when improving employee
perception of a corporate brand.
Page | 22
3. RESEARCH QUESTIONS
In order to explore the relationship between employee perception of a corporate brand
and employee engagement, research objectives were combined with literature
reviewed and the following questions were proposed as relevant to the research:
Research question 1:
Is there a positive correlation between employee perception of a corporate brand and
employee engagement?
Research question 2:
Do companies with a strong established corporate brand have employees with high
engagement?
Research question 3:
Do demographical factors influence employee engagement and brand perception?
Page | 23
4. RESEARCH METHODOLOGY
The aim of the research was to obtain a better understanding of what role employees’
perception of a corporate brand play with regard to employee engagement. Most
research related to this topic neglected employees’ perception of a corporate brand
when measuring employee engagement. As a result little prior research had been done
in this field and therefore it was important to undertake explanatory research.
Explanatory research was used to identify and obtain information on the characteristics
of the issue as it described the casual relationship between two variables (Saunders,
Lewis & Thornhill, 2009).
Applied research was used as it intended to solve practical problems of contemporary
society, rather than to acquire knowledge for knowledge's sake. The aim of the
researcher was to improve employee engagement through employee perception of a
corporate brand.
The data collected was quantitative and statistical techniques were used to summarise
the information. A quantitative research design was chosen as the research attempted
to finalise the results and prove or disprove the hypothesis of the study (Shuttleworth,
2008). A quantitative research design filtered out any bias and therefore the results can
be seen as real (Shuttleworth, 2008). Based on the aims of the research, a
questionnaire was used to gain data.
This study identified the correlation between two variables: perception of a corporate
brand and employee engagement. With this approach the researcher took an objective
position and the approach treated phenomena as hard and real. The researcher
favoured the Gallup Organisation’s employee engagement questionnaire and a
corporate brand assessment questionnaire. The researcher attempted to test
hypotheses with a view to predict, control and generalise. This approach concentrated
on measuring, collecting and analysing numerical data and applying statistical tests.
The Gallup Organisation has identified 12 pointers that positively impact an
organisation’s “outcome and profitability” with employee satisfaction (Thackray, 2001).
The pointers, also known as the “Q12”, were divided up into four categories: “customer
satisfaction/loyalty, profitability, productivity and employee turnover” (Thackray, 2001).
Page | 24
There are a variety of consulting organisations that offer employee engagement
surveys, such as Blessing White, Hewitt, Sirota, Towers Perrin, Valtera and Whatson
Wyatt Worldwide (Attridge, 2009). However, according to Harter, Schmidt and Keyes
(2003) the Gallup Organisation’s survey is one of the most influential approaches when
determining employee engagement within an organisation. The Gallup Organisation
has been conducting research over the past 30 years with reference to employee
perception of managerial efforts across numerous industries (Attridge, 2009).
4.2.1 Population
The study recruited 150 employees, both male and female and of varying ages, from
seven organisations in South Africa and 29 questionnaires were given to MTN
employees, 25 to McDonalds, Absa and Pep employees, 23 to BMW employees, 15 to
KFC employees and 8 to Eskom employees. The questionnaire comprised of three
sections. Section A involved four demographic questions, section B involved 12
employee engagement questions and section C involved 25 corporate branding
questions. The data collected were from the Gauteng region, with a limited
geographical reach.
The researcher made use of a non-probability sampling, “sampling techniques that do
not use chance selection procedures. Rather they rely on the personal judgement of
the researcher” (Malhotra, 2010). Non-probability sampling is however not
representative of the entire population and therefore cannot be generalised.
Convenience sampling techniques were used as the population of the seven
organisations are of a large nature. It would be extremely challenging to collect the
names of all the employees working for each organisation, as organisations have
privacy policies in place, which restrict the access to employees’ personal details. Thus
convenience sampling techniques were used as it collects data from convenient
elements and where immediate access is available (Malhotra, 2010).
The sample consisted of 150 employees who comprised of employees from
organisations in South Africa with a well-established brand and less preferred brand.
The researcher chose seven South African brands: BMW, Absa, MTN, McDonalds,
KFC, Pep Store and Eskom. As defined in Chapter 2, the researcher used both
Page | 25
personal judgement and convenience to gain randomness amongst the population.
Demographical questions were asked and recorded regarding employees’ personal
details and perceptions of the brand they are employed at. The questionnaires were
recorded on paper.
4.2.2 Sample and sampling method
The sample plan was defined as the process involved in the selection of units from the
population to be included in the sample (Bernstein et al., 2006). The sampling method
that was used is convenience sampling as the population is too large to include every
individual. Convenience sampling is quick, economical, and simple and the subjects
are willingly available (Saunders et al., 2009).
An experimental research method was used, but more specifically a non-equivalent
group comparison was used, as this study compares a group that has been exposed to
the stimuli – employees who work at well-established South African brands.
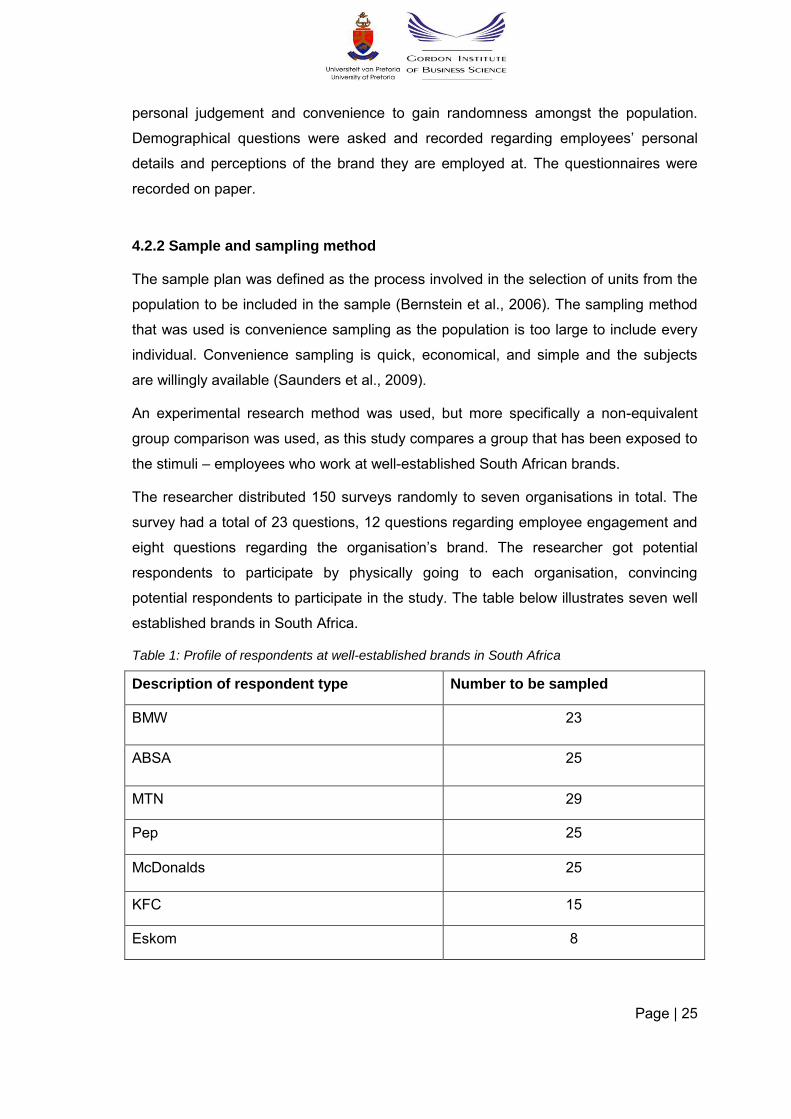
The researcher distributed 150 surveys randomly to seven organisations in total. The
survey had a total of 23 questions, 12 questions regarding employee engagement and
eight questions regarding the organisation’s brand. The researcher got potential
respondents to participate by physically going to each organisation, convincing
potential respondents to participate in the study. The table below illustrates seven well
established brands in South Africa.
Table 1: Profile of respondents at well-established brands in South Africa
Description of respondent type Number to be sampled
BMW 23
ABSA 25
MTN 29
Pep 25
McDonalds 25
KFC 15
Eskom 8
Page | 26
The research objective was to answer the three research questions. The researcher
conducted a questionnaire that assisted in answering the research questions.
Questionnaires are written or verbal questions which are answered by respondents in
order to collect data about a particular issue.
The researcher made use of a questionnaire, a structural technique to collect data
(Malhotra, 2010). The questionnaire, as shown in Appendix 1, was split up into three
sections:
Section1 – Demographics
Section 2 – Gallup employee engagement questionnaire
Section 3 – Corporate brand questionnaire
The questionnaire included four questions regarding demographics, 12 questions
regarding employee engagement from the Gallup Organisation and 25 questions
regarding corporate branding. Section A included demographic questions and focused
on gender, age, qualifications and working year. Section B focused on employee
engagement questions developed by the Gallup Organisation, these questions required
respondents to rate 12 individual items on a Likert scale from 1 to 5, where 1 indicates
strongly agree and 5 represents strongly disagree. The 12 employee engagement
questions from the Gallup Organisation (Thackray, 2001) were as follows:
Table 2: Employee Engagement Questions
No. Employee Engagement Questions
1. Do you know what is expected of you at work?
2. Do you have the material and equipment you need to do your work right?
3. At work, do you have the opportunity to do what you do best every day?
4. In the last seven days, have you received recognition or praise for doing good
work?
5. Does your supervisor, or someone at work, seem to care about you as a
person?
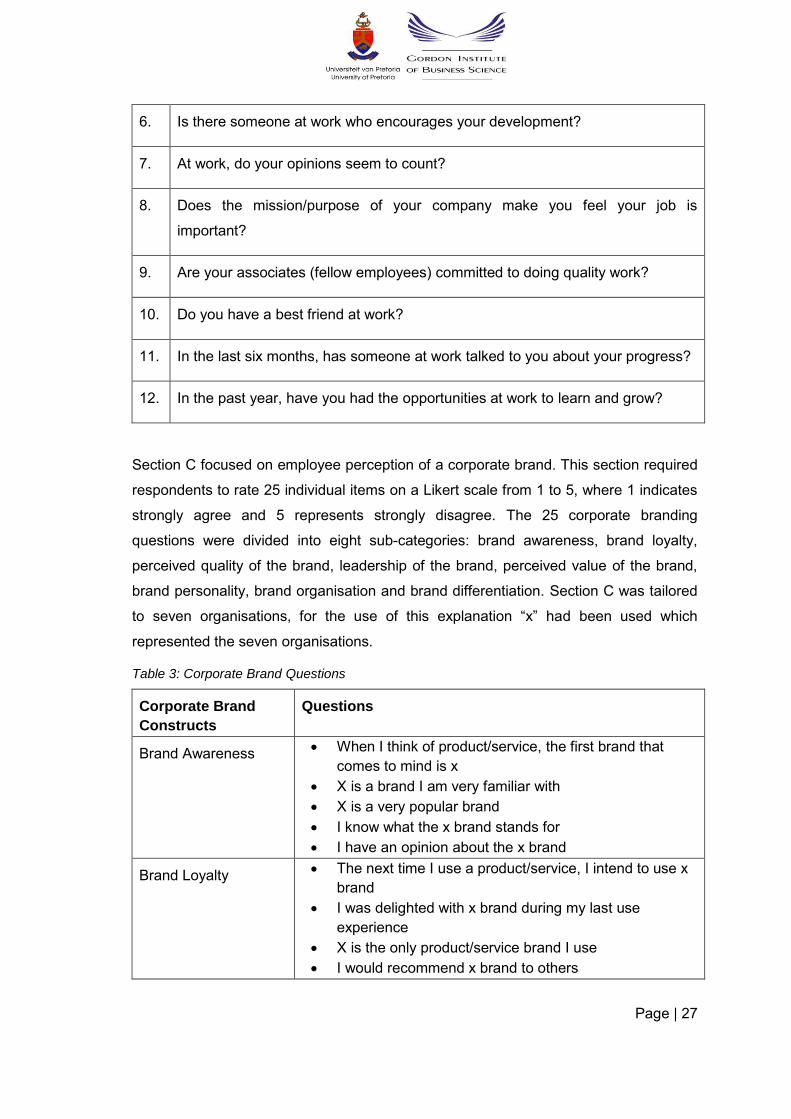
Page | 27
6. Is there someone at work who encourages your development?
7. At work, do your opinions seem to count?
8. Does the mission/purpose of your company make you feel your job is
important?
9. Are your associates (fellow employees) committed to doing quality work?
10. Do you have a best friend at work?
11. In the last six months, has someone at work talked to you about your progress?
12. In the past year, have you had the opportunities at work to learn and grow?
Section C focused on employee perception of a corporate brand. This section required
respondents to rate 25 individual items on a Likert scale from 1 to 5, where 1 indicates
strongly agree and 5 represents strongly disagree. The 25 corporate branding
questions were divided into eight sub-categories: brand awareness, brand loyalty,
perceived quality of the brand, leadership of the brand, perceived value of the brand,
brand personality, brand organisation and brand differentiation. Section C was tailored
to seven organisations, for the use of this explanation “x” had been used which
represented the seven organisations.
Table 3: Corporate Brand Questions
Corporate Brand
Constructs
Questions
Brand Awareness When I think of product/service, the first brand that
comes to mind is x
X is a brand I am very familiar with
X is a very popular brand
I know what the x brand stands for
I have an opinion about the x brand
Brand Loyalty The next time I use a product/service, I intend to use x
brand
I was delighted with x brand during my last use
experience
X is the only product/service brand I use
I would recommend x brand to others
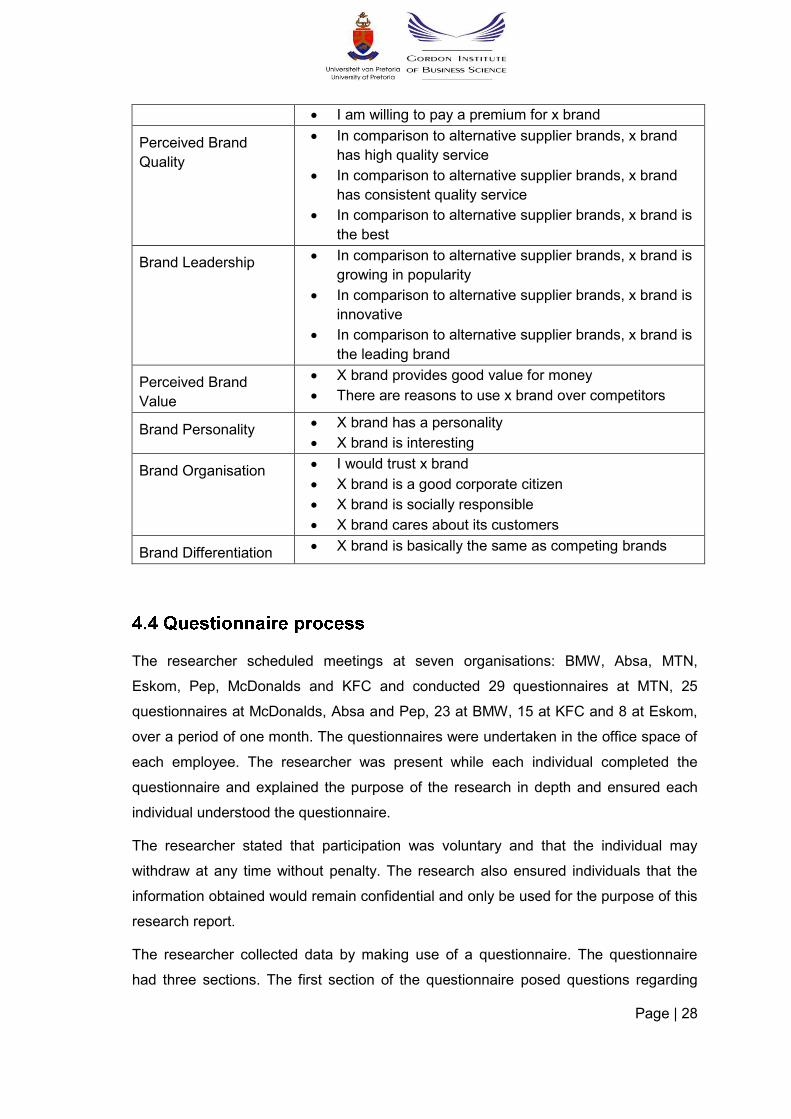
Page | 28
I am willing to pay a premium for x brand
Perceived Brand
Quality
In comparison to alternative supplier brands, x brand
has high quality service
In comparison to alternative supplier brands, x brand
has consistent quality service
In comparison to alternative supplier brands, x brand is
the best
Brand Leadership In comparison to alternative supplier brands, x brand is
growing in popularity
In comparison to alternative supplier brands, x brand is
innovative
In comparison to alternative supplier brands, x brand is
the leading brand
Perceived Brand
Value
X brand provides good value for money
There are reasons to use x brand over competitors
Brand Personality X brand has a personality
X brand is interesting
Brand Organisation I would trust x brand
X brand is a good corporate citizen
X brand is socially responsible
X brand cares about its customers
Brand Differentiation X brand is basically the same as competing brands
The researcher scheduled meetings at seven organisations: BMW, Absa, MTN,
Eskom, Pep, McDonalds and KFC and conducted 29 questionnaires at MTN, 25
questionnaires at McDonalds, Absa and Pep, 23 at BMW, 15 at KFC and 8 at Eskom,
over a period of one month. The questionnaires were undertaken in the office space of
each employee. The researcher was present while each individual completed the
questionnaire and explained the purpose of the research in depth and ensured each
individual understood the questionnaire.
The researcher stated that participation was voluntary and that the individual may
withdraw at any time without penalty. The research also ensured individuals that the
information obtained would remain confidential and only be used for the purpose of this
research report.
The researcher collected data by making use of a questionnaire. The questionnaire
had three sections. The first section of the questionnaire posed questions regarding
Page | 29
demographics, the second section referred to the Gallup employee engagement
questions and the third section posed questions regarding brand assessment.
Once the questionnaires were collected, the researcher made sure all the questions
were answered to avoid response error. The researcher thanked each respondent for
his/her time and for participating in the study. The questionnaire took about five
minutes to complete.
4.4.1 Questionnaire
Malhotra (2010) identified the advantages and disadvantages of using a questionnaire
to collect data.
The advantages are:
A standardised questionnaire will enhance speed, correctness, comparability
and ease of data processing.
Questionnaires are more objective as the process of collection is standardised.
Questionnaires allow for a large sample size.
Costs are generally lower than most forms of data collection.
A well-designed questionnaire may increase the response rate.
The results of the questionnaire can be easily quantified, making it easier for
the researcher to compare and contrast.
The disadvantages are:
The development of questions that individuals can and will answer is difficult.
Response error is high due to the fact that individuals may interpret the
question incorrectly and thus give the incorrect answer.
Questionnaire design may be challenging as there is no theory guaranteeing an
optimal questionnaire. Questionnaire design is based on one’s experience.
Participants may become bored, lazy and tired resulting in an incomplete
questionnaire. The research needs to therefore ensure participants are
engaged by providing a well-designed questionnaire.
Lacks validity.
Page | 30
The collection of the data was made possible through employee engagement and
corporate brand assessment questionnaires. This study used statistical analysis as the
goal was simple as the researcher wished to make the strongest possible conclusion
from limited amounts of data. The researcher interpreted the findings through the use
of SPSS’s graphical outcome. The researcher also used explanatory research, “studies
that establish casual relationships between variables” (Saunders et al., 2009).
The data analysis had the goal in mind to answer the three research questions. The
data analysis was divided into two groups: demographics and research questions.
Demographics – This segment comprised of section 1 of the research questions
and consisted of questions such as range of age, gender, organisation they are
working for, working year, department, and level of agreement on the perceived
brand of the organisation they are working for. The information was recorded on
paper which was later captured into SPSS for analysis.
Research questions – This segment comprised of section 1: Gallup employee
engagement questionnaire and section 2: Brand assessment questionnaire.
Hard copies of the recorded responses were captured into SPSS for analysis.
The findings are explained in further detail in Chapter 6 of this research report.
Employees who work for organisations with a well-established brand in South Africa
will have higher employee engagement levels. Thus employees who work for
organisations with a well-established brand in South African will be more productive
and less absent, resulting in minimal turnover for the organisation. This study aimed to
control the findings by implementing well-perceived brands into organisations to
increase profitability, reduce turnover, and improve working environment and employee
satisfaction.
The limitation for this study was that the participants were only given one employee
engagement and branding assessment questionnaire with limited number of questions
and from the responses the researcher concluded if there was a correlation.
Page | 31
Using a quantitative research design required the researcher to plan effectively in order
to make sure that the study is completed on time with the appropriate resources.
Timing and planning are vital when undertaking a quantitative research design
(Shuttleworth, 2008). A quantitative research design also brings uncertainty to the
study as it tends to produce either proven or unproven results which then need to be
statistically analysed (Shuttleworth, 2008).
The researcher made use of a questionnaire. Malhotra (2010) points out that the
development of questions that individuals can and will answer is difficult. The response
error of questionnaires is high due to the fact that individuals may interpret the question
incorrectly and thus give the incorrect answer. Questionnaire design may also be
extremely challenging as there is no theory guaranteeing an optimal questionnaire.
Participants may become bored, lazy and tired resulting in an incomplete
questionnaire. The research needed to therefore ensure participants were engaged by
providing a well-designed questionnaire.
The researcher made use of non-probability convenience sampling. The researcher
undertook convenience sampling as the population was too large; however this created
a limitation as the sample was not representative of the entire population, which may
result in sampling bias (Lund & Lund, 2010). Convenience sampling is not
representative of the entire population and therefore may not have the ability to
develop any accurate results (Malhotra, 2010).
This study portrayed validity as the test scores were interpreted correctly and used
appropriately through the use of statistical analysis (Bernstein et al., 2006). There were
similar tests done on this study which also increased the study’s validity. The study
portrayed reliability as the test can be repeated and one will find the same results
(Bernstein et al., 2006).
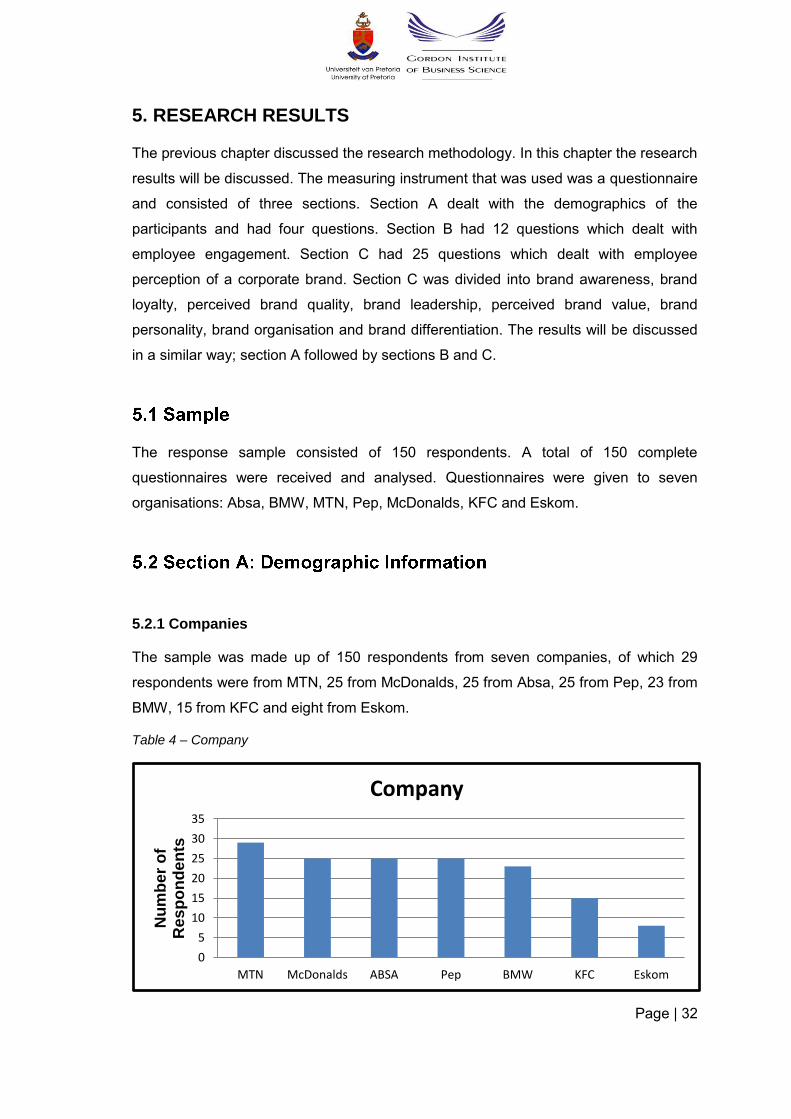
Page | 32
5. RESEARCH RESULTS
The previous chapter discussed the research methodology. In this chapter the research
results will be discussed. The measuring instrument that was used was a questionnaire
and consisted of three sections. Section A dealt with the demographics of the
participants and had four questions. Section B had 12 questions which dealt with
employee engagement. Section C had 25 questions which dealt with employee
perception of a corporate brand. Section C was divided into brand awareness, brand
loyalty, perceived brand quality, brand leadership, perceived brand value, brand
personality, brand organisation and brand differentiation. The results will be discussed
in a similar way; section A followed by sections B and C.
The response sample consisted of 150 respondents. A total of 150 complete
questionnaires were received and analysed. Questionnaires were given to seven
organisations: Absa, BMW, MTN, Pep, McDonalds, KFC and Eskom.
5.2.1 Companies
The sample was made up of 150 respondents from seven companies, of which 29
respondents were from MTN, 25 from McDonalds, 25 from Absa, 25 from Pep, 23 from
BMW, 15 from KFC and eight from Eskom.
Table 4 – Company
0
5
10
15
20
25
30
35
MTN McDonalds ABSA Pep BMW KFC Eskom
Nu
mb
er
of
Res
po
nd
en
ts
Company
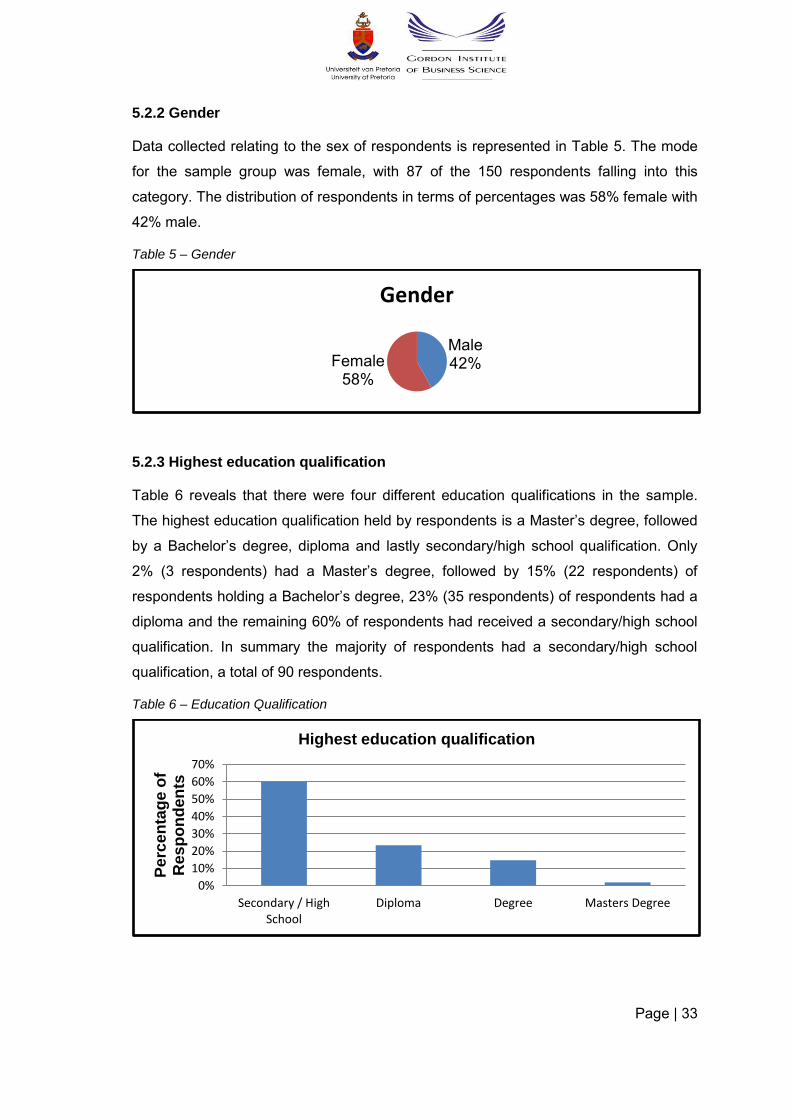
Page | 33
5.2.2 Gender
Data collected relating to the sex of respondents is represented in Table 5. The mode
for the sample group was female, with 87 of the 150 respondents falling into this
category. The distribution of respondents in terms of percentages was 58% female with
42% male.
Table 5 – Gender
5.2.3 Highest education qualification
Table 6 reveals that there were four different education qualifications in the sample.
The highest education qualification held by respondents is a Master’s degree, followed
by a Bachelor’s degree, diploma and lastly secondary/high school qualification. Only
2% (3 respondents) had a Master’s degree, followed by 15% (22 respondents) of
respondents holding a Bachelor’s degree, 23% (35 respondents) of respondents had a
diploma and the remaining 60% of respondents had received a secondary/high school
qualification. In summary the majority of respondents had a secondary/high school
qualification, a total of 90 respondents.
Table 6 – Education Qualification
Male 42% Female
58%
Gender
0%
10%
20%
30%
40%
50%
60%
70%
Secondary / High School
Diploma Degree Masters Degree
Pe
rce
nta
ge o
f R
es
po
nd
en
ts
Highest education qualification
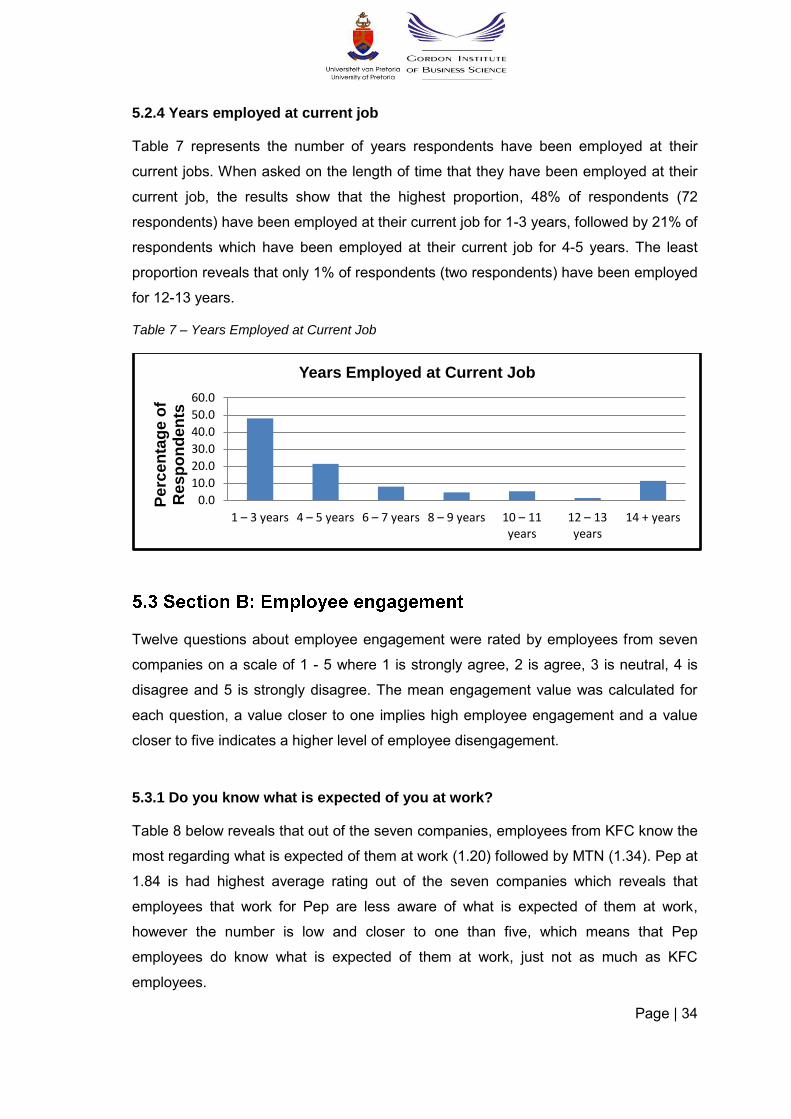
Page | 34
5.2.4 Years employed at current job
Table 7 represents the number of years respondents have been employed at their
current jobs. When asked on the length of time that they have been employed at their
current job, the results show that the highest proportion, 48% of respondents (72
respondents) have been employed at their current job for 1-3 years, followed by 21% of
respondents which have been employed at their current job for 4-5 years. The least
proportion reveals that only 1% of respondents (two respondents) have been employed
for 12-13 years.
Table 7 – Years Employed at Current Job
Twelve questions about employee engagement were rated by employees from seven
companies on a scale of 1 - 5 where 1 is strongly agree, 2 is agree, 3 is neutral, 4 is
disagree and 5 is strongly disagree. The mean engagement value was calculated for
each question, a value closer to one implies high employee engagement and a value
closer to five indicates a higher level of employee disengagement.
5.3.1 Do you know what is expected of you at work?
Table 8 below reveals that out of the seven companies, employees from KFC know the
most regarding what is expected of them at work (1.20) followed by MTN (1.34). Pep at
1.84 is had highest average rating out of the seven companies which reveals that
employees that work for Pep are less aware of what is expected of them at work,
however the number is low and closer to one than five, which means that Pep
employees do know what is expected of them at work, just not as much as KFC
employees.
0.0
10.0
20.0
30.0
40.0
50.0
60.0
1 – 3 years 4 – 5 years 6 – 7 years 8 – 9 years 10 – 11 years
12 – 13 years
14 + years
Pe
rce
nta
ge o
f R
es
po
nd
en
ts
Years Employed at Current Job
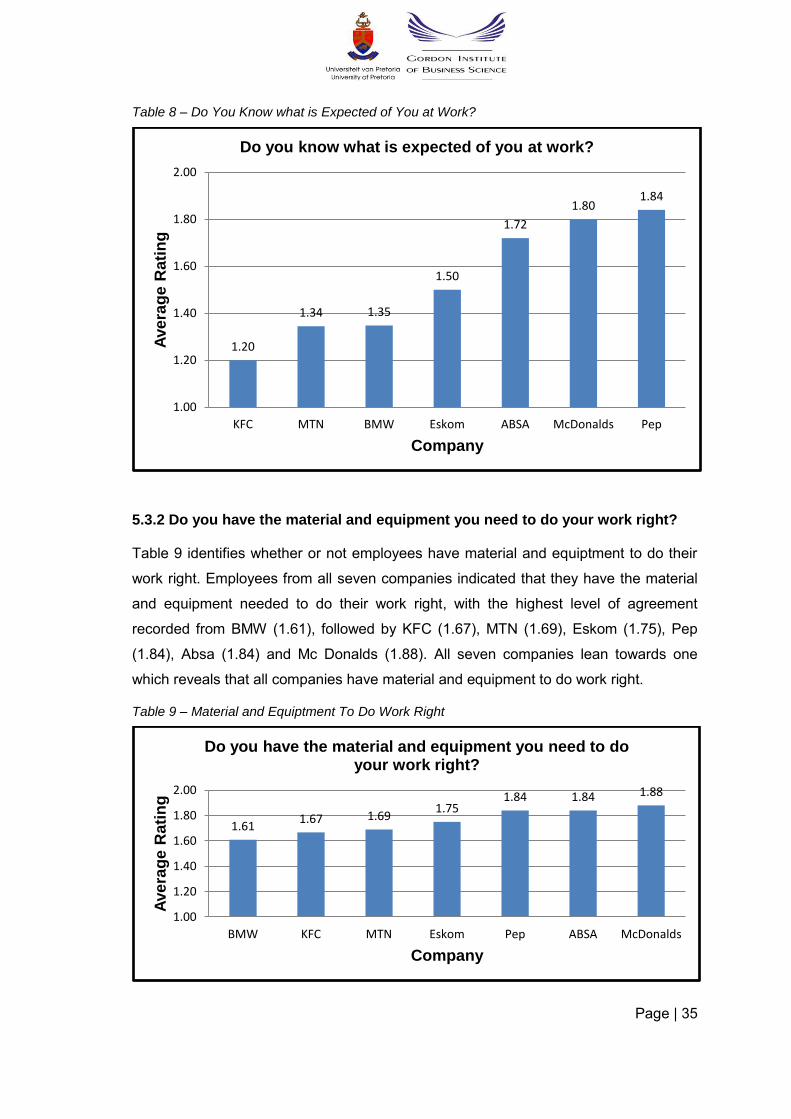
Page | 35
Table 8 – Do You Know what is Expected of You at Work?
5.3.2 Do you have the material and equipment you need to do your work right?
Table 9 identifies whether or not employees have material and equiptment to do their
work right. Employees from all seven companies indicated that they have the material
and equipment needed to do their work right, with the highest level of agreement
recorded from BMW (1.61), followed by KFC (1.67), MTN (1.69), Eskom (1.75), Pep
(1.84), Absa (1.84) and Mc Donalds (1.88). All seven companies lean towards one
which reveals that all companies have material and equipment to do work right.
Table 9 – Material and Equiptment To Do Work Right
1.20
1.34 1.35
1.50
1.72
1.80 1.84
1.00
1.20
1.40
1.60
1.80
2.00
KFC MTN BMW Eskom ABSA McDonalds Pep
Ave
rag
e R
ati
ng
Company
Do you know what is expected of you at work?
1.61 1.67 1.69
1.75 1.84 1.84 1.88
1.00
1.20
1.40
1.60
1.80
2.00
BMW KFC MTN Eskom Pep ABSA McDonalds
Ave
rag
e R
ati
ng
Company
Do you have the material and equipment you need to do your work right?
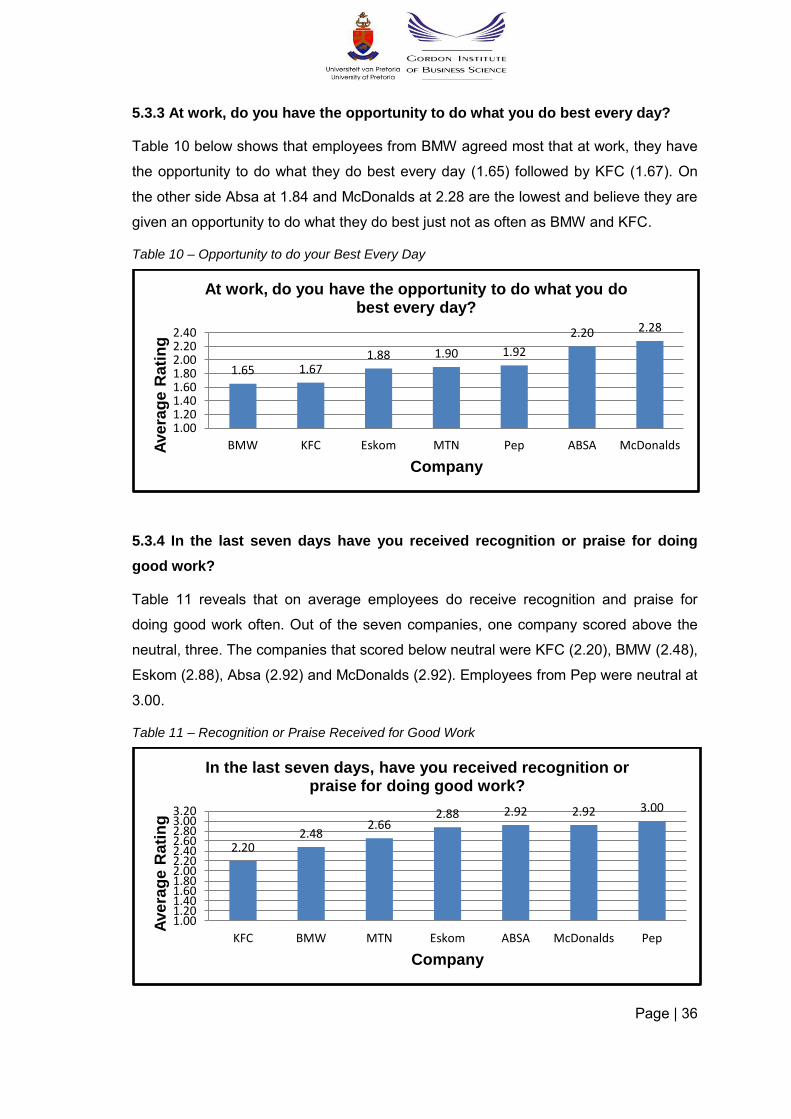
Page | 36
5.3.3 At work, do you have the opportunity to do what you do best every day?
Table 10 below shows that employees from BMW agreed most that at work, they have
the opportunity to do what they do best every day (1.65) followed by KFC (1.67). On
the other side Absa at 1.84 and McDonalds at 2.28 are the lowest and believe they are
given an opportunity to do what they do best just not as often as BMW and KFC.
Table 10 – Opportunity to do your Best Every Day
5.3.4 In the last seven days have you received recognition or praise for doing
good work?
Table 11 reveals that on average employees do receive recognition and praise for
doing good work often. Out of the seven companies, one company scored above the
neutral, three. The companies that scored below neutral were KFC (2.20), BMW (2.48),
Eskom (2.88), Absa (2.92) and McDonalds (2.92). Employees from Pep were neutral at
3.00.
Table 11 – Recognition or Praise Received for Good Work
1.65 1.67 1.88 1.90 1.92
2.20 2.28
1.00 1.20 1.40 1.60 1.80 2.00 2.20 2.40
BMW KFC Eskom MTN Pep ABSA McDonalds Ave
rag
e R
ati
ng
Company
At work, do you have the opportunity to do what you do best every day?
2.20 2.48
2.66 2.88 2.92 2.92 3.00
1.00 1.20 1.40 1.60 1.80 2.00 2.20 2.40 2.60 2.80 3.00 3.20
KFC BMW MTN Eskom ABSA McDonalds Pep
Ave
rag
e R
ati
ng
Company
In the last seven days, have you received recognition or praise for doing good work?
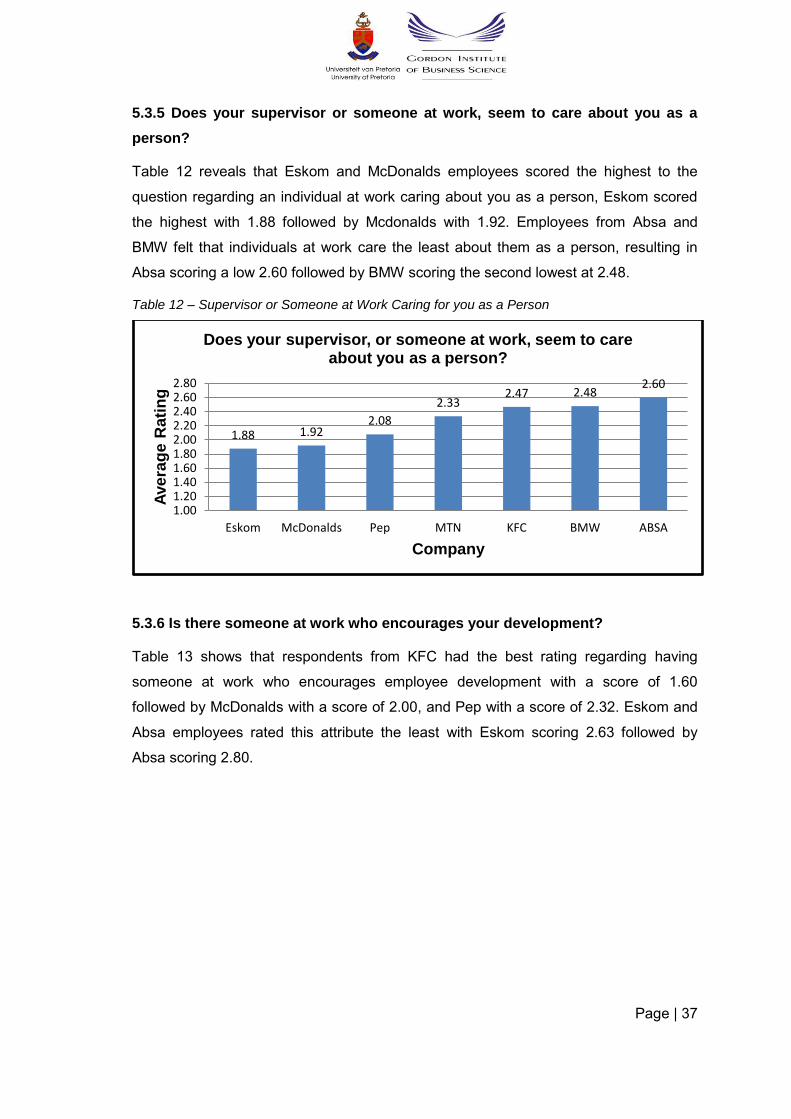
Page | 37
5.3.5 Does your supervisor or someone at work, seem to care about you as a
person?
Table 12 reveals that Eskom and McDonalds employees scored the highest to the
question regarding an individual at work caring about you as a person, Eskom scored
the highest with 1.88 followed by Mcdonalds with 1.92. Employees from Absa and
BMW felt that individuals at work care the least about them as a person, resulting in
Absa scoring a low 2.60 followed by BMW scoring the second lowest at 2.48.
Table 12 – Supervisor or Someone at Work Caring for you as a Person
5.3.6 Is there someone at work who encourages your development?
Table 13 shows that respondents from KFC had the best rating regarding having
someone at work who encourages employee development with a score of 1.60
followed by McDonalds with a score of 2.00, and Pep with a score of 2.32. Eskom and
Absa employees rated this attribute the least with Eskom scoring 2.63 followed by
Absa scoring 2.80.
1.88 1.92 2.08
2.33 2.47 2.48
2.60
1.00 1.20 1.40 1.60 1.80 2.00 2.20 2.40 2.60 2.80
Eskom McDonalds Pep MTN KFC BMW ABSA
Ave
rag
e R
ati
ng
Company
Does your supervisor, or someone at work, seem to care about you as a person?
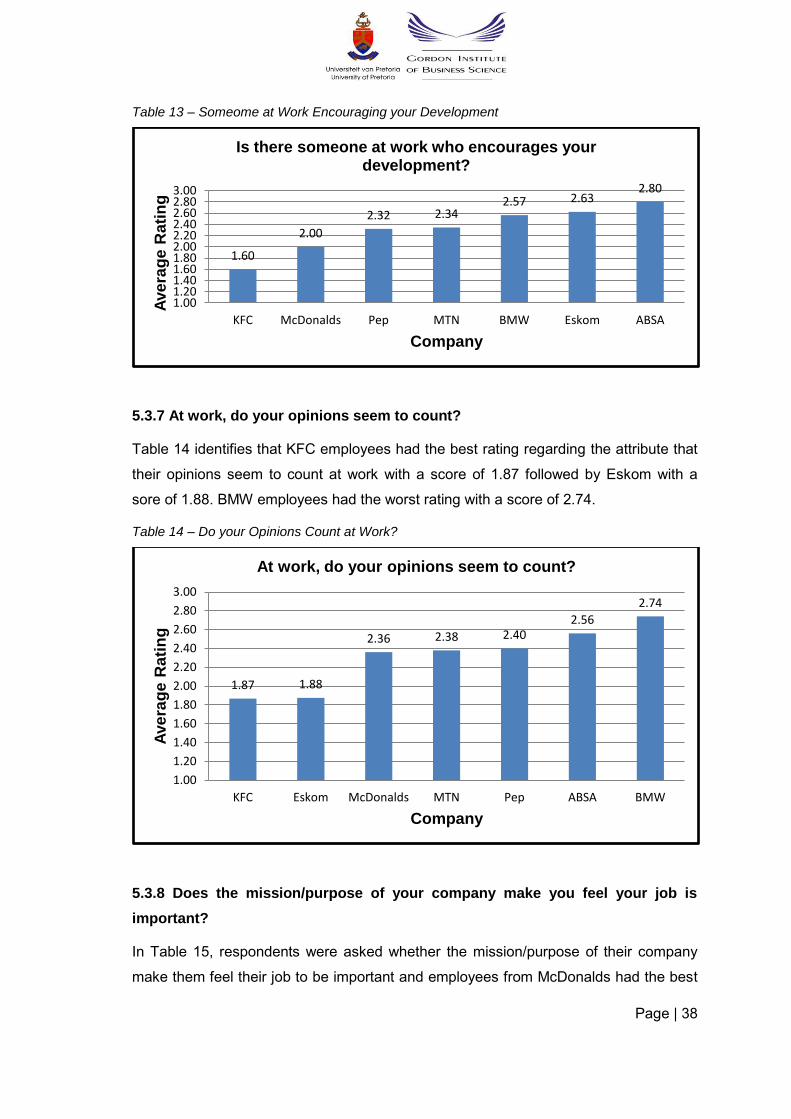
Page | 38
Table 13 – Someome at Work Encouraging your Development
5.3.7 At work, do your opinions seem to count?
Table 14 identifies that KFC employees had the best rating regarding the attribute that
their opinions seem to count at work with a score of 1.87 followed by Eskom with a
sore of 1.88. BMW employees had the worst rating with a score of 2.74.
Table 14 – Do your Opinions Count at Work?
5.3.8 Does the mission/purpose of your company make you feel your job is
important?
In Table 15, respondents were asked whether the mission/purpose of their company
make them feel their job to be important and employees from McDonalds had the best
1.60
2.00
2.32 2.34 2.57 2.63
2.80
1.00 1.20 1.40 1.60 1.80 2.00 2.20 2.40 2.60 2.80 3.00
KFC McDonalds Pep MTN BMW Eskom ABSA
Ave
rag
e R
ati
ng
Company
Is there someone at work who encourages your development?
1.87 1.88
2.36 2.38 2.40 2.56
2.74
1.00
1.20
1.40
1.60
1.80
2.00
2.20
2.40
2.60
2.80
3.00
KFC Eskom McDonalds MTN Pep ABSA BMW
Ave
rag
e R
ati
ng
Company
At work, do your opinions seem to count?
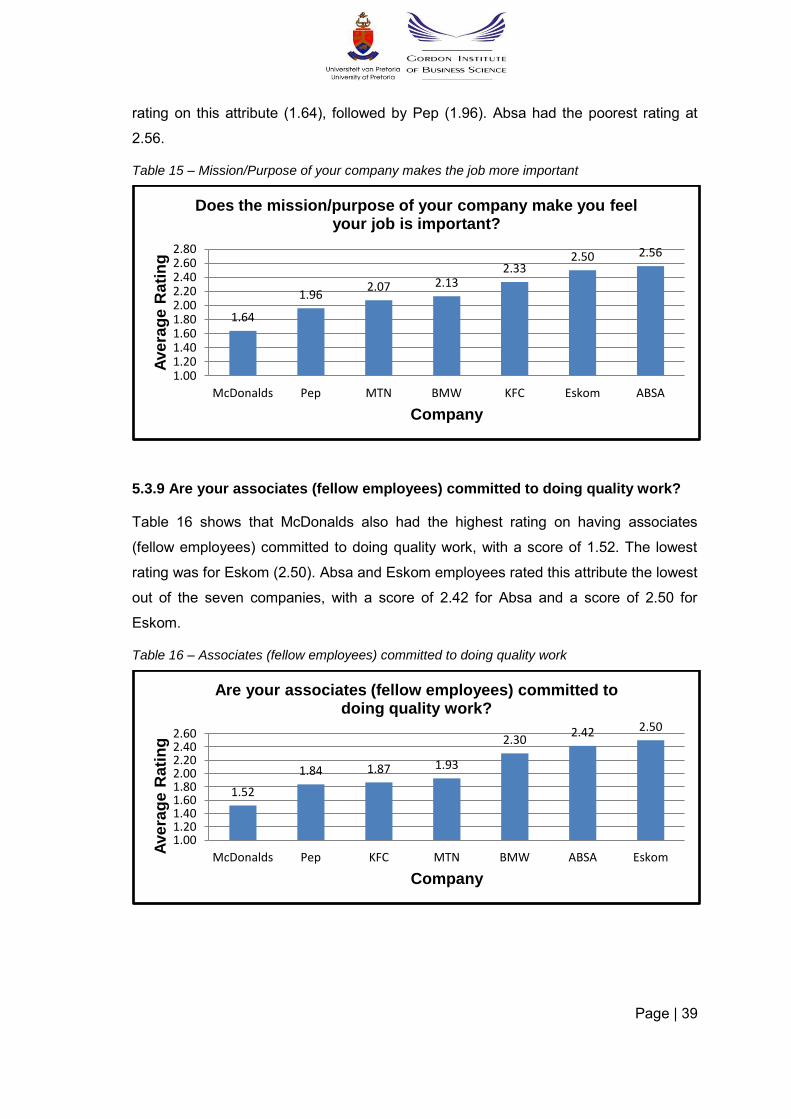
Page | 39
rating on this attribute (1.64), followed by Pep (1.96). Absa had the poorest rating at
2.56.
Table 15 – Mission/Purpose of your company makes the job more important
5.3.9 Are your associates (fellow employees) committed to doing quality work?
Table 16 shows that McDonalds also had the highest rating on having associates
(fellow employees) committed to doing quality work, with a score of 1.52. The lowest
rating was for Eskom (2.50). Absa and Eskom employees rated this attribute the lowest
out of the seven companies, with a score of 2.42 for Absa and a score of 2.50 for
Eskom.
Table 16 – Associates (fellow employees) committed to doing quality work
1.64
1.96 2.07 2.13
2.33 2.50 2.56
1.00 1.20 1.40 1.60 1.80 2.00 2.20 2.40 2.60 2.80
McDonalds Pep MTN BMW KFC Eskom ABSA
Ave
rag
e R
ati
ng
Company
Does the mission/purpose of your company make you feel your job is important?
1.52
1.84 1.87 1.93
2.30 2.42 2.50
1.00 1.20 1.40 1.60 1.80 2.00 2.20 2.40 2.60
McDonalds Pep KFC MTN BMW ABSA Eskom
Ave
rag
e R
ati
ng
Company
Are your associates (fellow employees) committed to doing quality work?
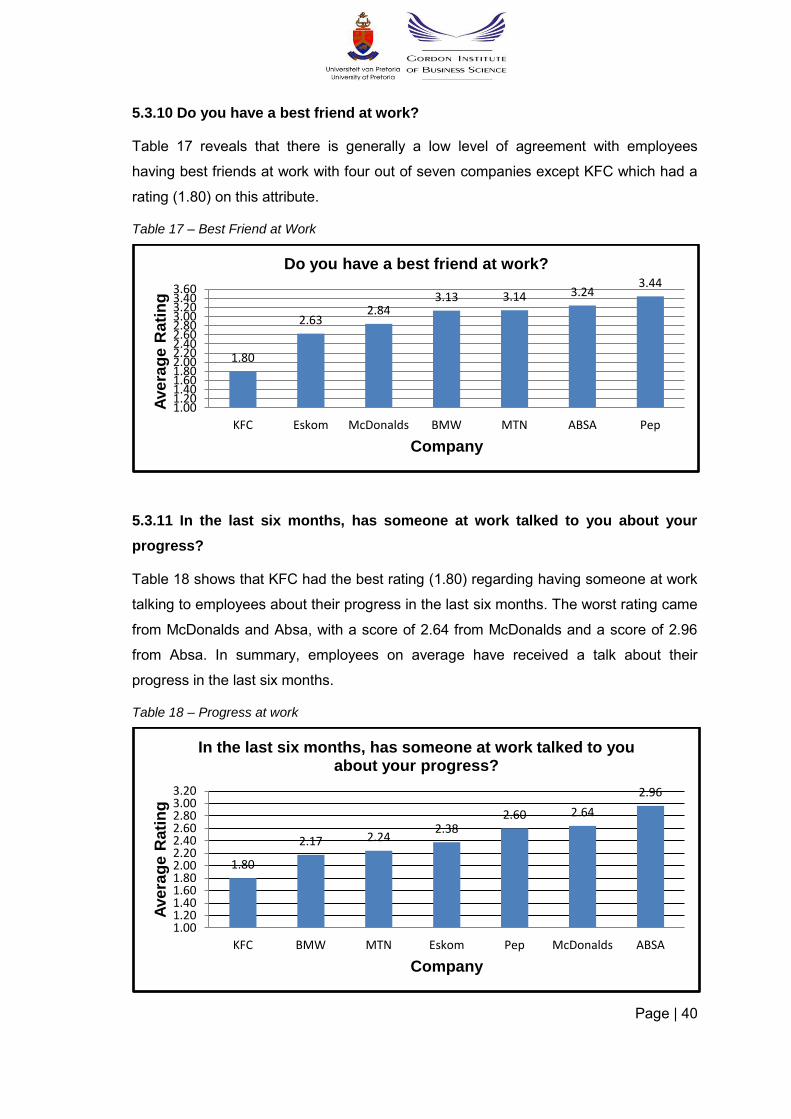
Page | 40
5.3.10 Do you have a best friend at work?
Table 17 reveals that there is generally a low level of agreement with employees
having best friends at work with four out of seven companies except KFC which had a
rating (1.80) on this attribute.
Table 17 – Best Friend at Work
5.3.11 In the last six months, has someone at work talked to you about your
progress?
Table 18 shows that KFC had the best rating (1.80) regarding having someone at work
talking to employees about their progress in the last six months. The worst rating came
from McDonalds and Absa, with a score of 2.64 from McDonalds and a score of 2.96
from Absa. In summary, employees on average have received a talk about their
progress in the last six months.
Table 18 – Progress at work
1.80
2.63 2.84
3.13 3.14 3.24 3.44
1.00 1.20 1.40 1.60 1.80 2.00 2.20 2.40 2.60 2.80 3.00 3.20 3.40 3.60
KFC Eskom McDonalds BMW MTN ABSA Pep
Ave
rag
e R
ati
ng
Company
Do you have a best friend at work?
1.80
2.17 2.24 2.38
2.60 2.64
2.96
1.00 1.20 1.40 1.60 1.80 2.00 2.20 2.40 2.60 2.80 3.00 3.20
KFC BMW MTN Eskom Pep McDonalds ABSA
Ave
rag
e R
ati
ng
Company
In the last six months, has someone at work talked to you about your progress?
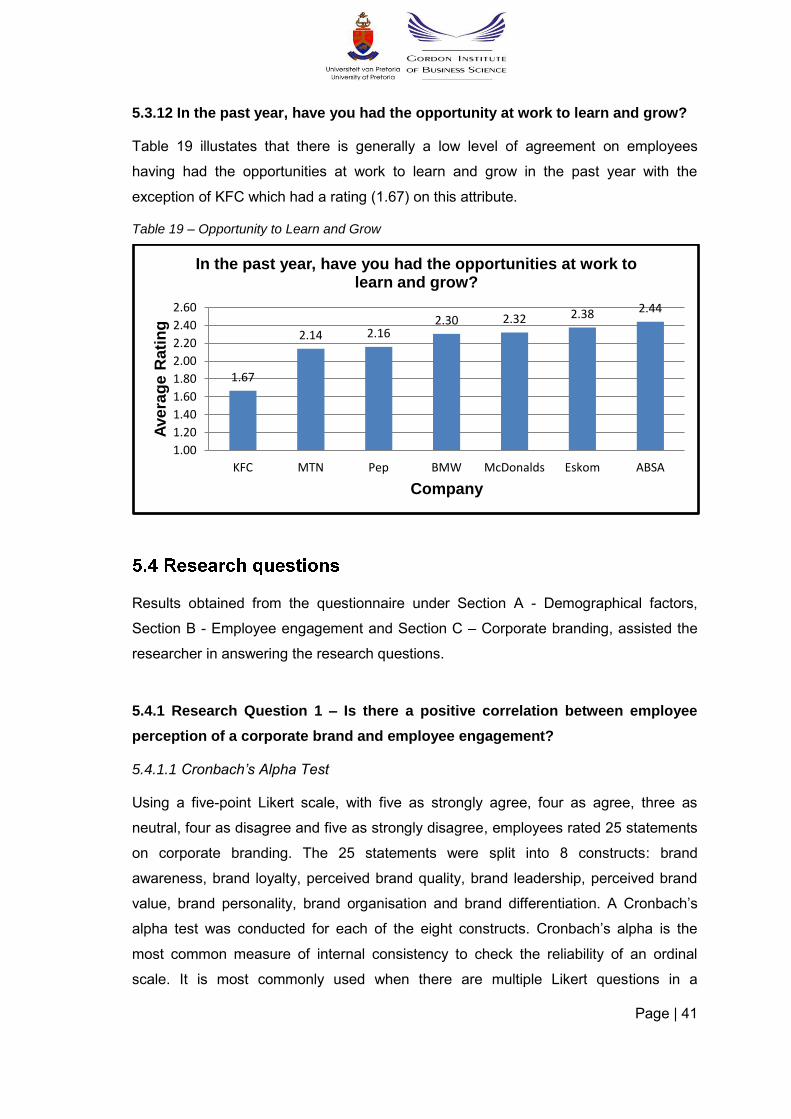
Page | 41
5.3.12 In the past year, have you had the opportunity at work to learn and grow?
Table 19 illustates that there is generally a low level of agreement on employees
having had the opportunities at work to learn and grow in the past year with the
exception of KFC which had a rating (1.67) on this attribute.
Table 19 – Opportunity to Learn and Grow
Results obtained from the questionnaire under Section A - Demographical factors,
Section B - Employee engagement and Section C – Corporate branding, assisted the
researcher in answering the research questions.
5.4.1 Research Question 1 – Is there a positive correlation between employee
perception of a corporate brand and employee engagement?
5.4.1.1 Cronbach’s Alpha Test
Using a five-point Likert scale, with five as strongly agree, four as agree, three as
neutral, four as disagree and five as strongly disagree, employees rated 25 statements
on corporate branding. The 25 statements were split into 8 constructs: brand
awareness, brand loyalty, perceived brand quality, brand leadership, perceived brand
value, brand personality, brand organisation and brand differentiation. A Cronbach’s
alpha test was conducted for each of the eight constructs. Cronbach’s alpha is the
most common measure of internal consistency to check the reliability of an ordinal
scale. It is most commonly used when there are multiple Likert questions in a
1.67
2.14 2.16 2.30 2.32 2.38 2.44
1.00
1.20
1.40
1.60
1.80
2.00
2.20
2.40
2.60
KFC MTN Pep BMW McDonalds Eskom ABSA
Ave
rag
e R
ati
ng
Company
In the past year, have you had the opportunities at work to learn and grow?
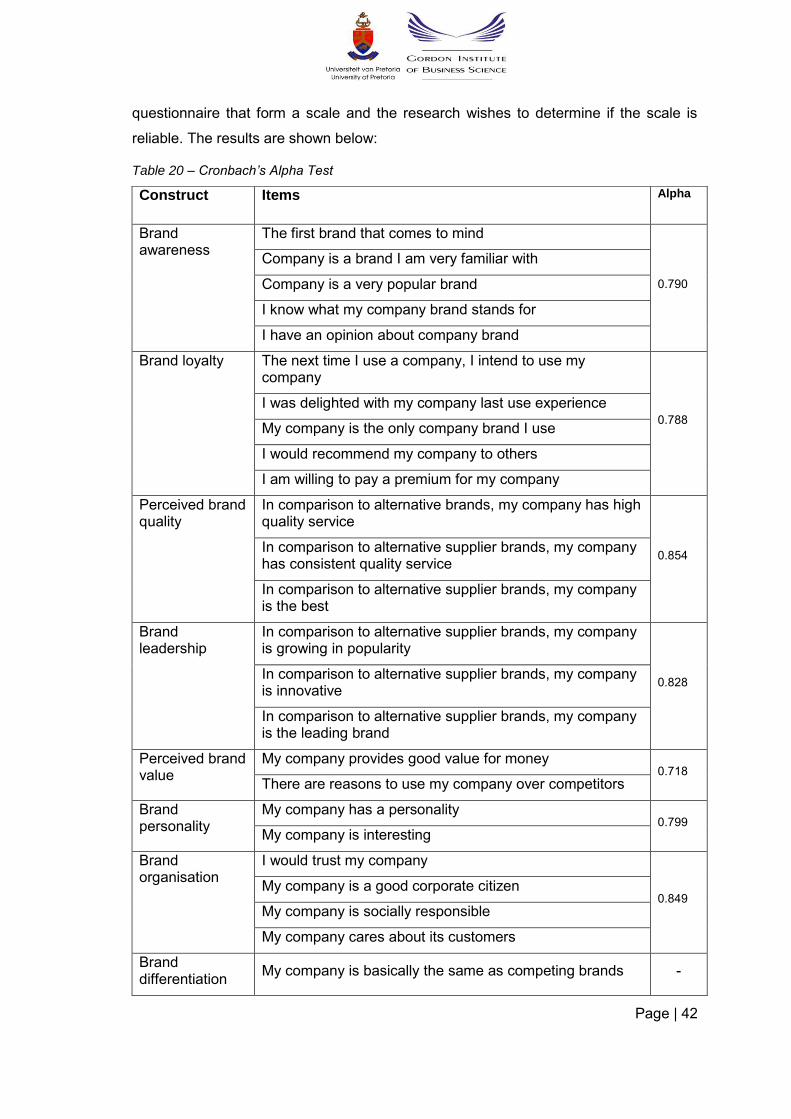
Page | 42
questionnaire that form a scale and the research wishes to determine if the scale is
reliable. The results are shown below:
Table 20 – Cronbach’s Alpha Test
Construct Items Alpha
Brand awareness
The first brand that comes to mind
0.790
Company is a brand I am very familiar with
Company is a very popular brand
I know what my company brand stands for
I have an opinion about company brand
Brand loyalty The next time I use a company, I intend to use my company
0.788
I was delighted with my company last use experience
My company is the only company brand I use
I would recommend my company to others
I am willing to pay a premium for my company
Perceived brand quality
In comparison to alternative brands, my company has high quality service
0.854 In comparison to alternative supplier brands, my company has consistent quality service
In comparison to alternative supplier brands, my company is the best
Brand leadership
In comparison to alternative supplier brands, my company is growing in popularity
0.828 In comparison to alternative supplier brands, my company is innovative
In comparison to alternative supplier brands, my company is the leading brand
Perceived brand value
My company provides good value for money 0.718
There are reasons to use my company over competitors
Brand personality
My company has a personality 0.799
My company is interesting
Brand organisation
I would trust my company
0.849 My company is a good corporate citizen
My company is socially responsible
My company cares about its customers
Brand differentiation
My company is basically the same as competing brands -
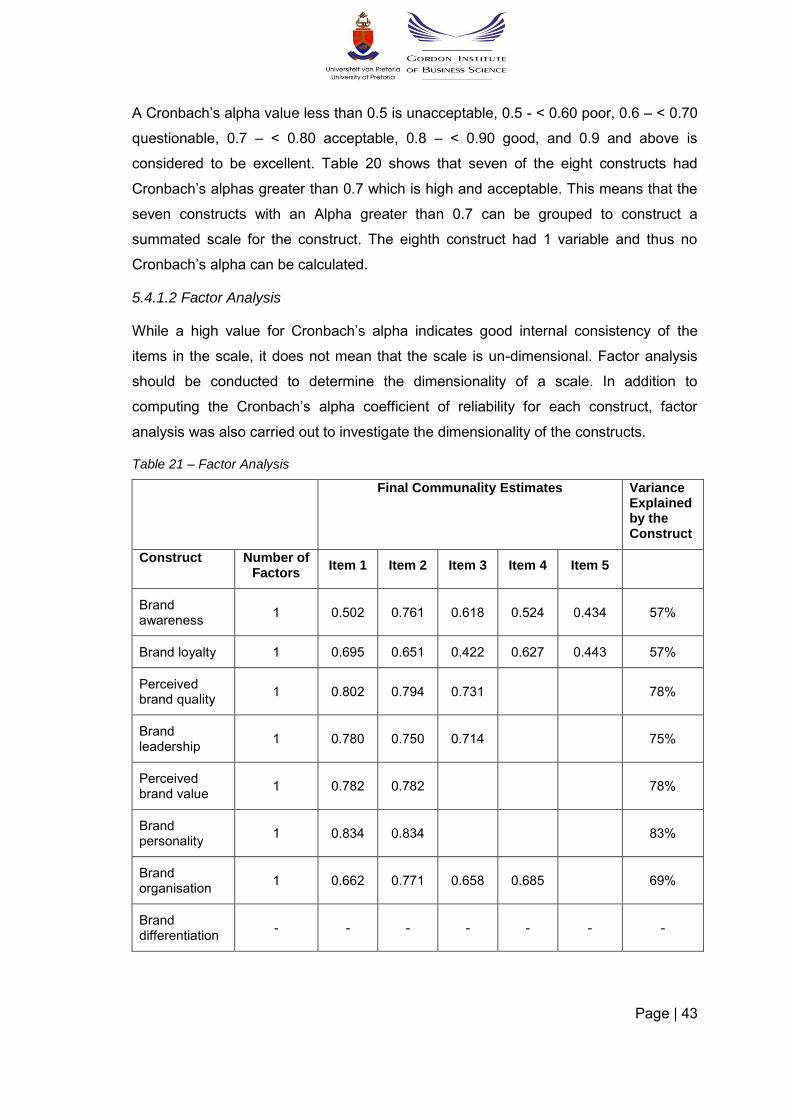
Page | 43
A Cronbach’s alpha value less than 0.5 is unacceptable, 0.5 - < 0.60 poor, 0.6 – < 0.70
questionable, 0.7 – < 0.80 acceptable, 0.8 – < 0.90 good, and 0.9 and above is
considered to be excellent. Table 20 shows that seven of the eight constructs had
Cronbach’s alphas greater than 0.7 which is high and acceptable. This means that the
seven constructs with an Alpha greater than 0.7 can be grouped to construct a
summated scale for the construct. The eighth construct had 1 variable and thus no
Cronbach’s alpha can be calculated.
5.4.1.2 Factor Analysis
While a high value for Cronbach’s alpha indicates good internal consistency of the
items in the scale, it does not mean that the scale is un-dimensional. Factor analysis
should be conducted to determine the dimensionality of a scale. In addition to
computing the Cronbach’s alpha coefficient of reliability for each construct, factor
analysis was also carried out to investigate the dimensionality of the constructs.
Table 21 – Factor Analysis
Final Communality Estimates Variance Explained by the Construct
Construct Number of Factors
Item 1 Item 2 Item 3 Item 4 Item 5
Brand awareness
1 0.502 0.761 0.618 0.524 0.434 57%
Brand loyalty 1 0.695 0.651 0.422 0.627 0.443 57%
Perceived brand quality
1 0.802 0.794 0.731 78%
Brand leadership
1 0.780 0.750 0.714 75%
Perceived brand value
1 0.782 0.782 78%
Brand personality
1 0.834 0.834 83%
Brand organisation
1 0.662 0.771 0.658 0.685 69%
Brand differentiation
- - - - - - -
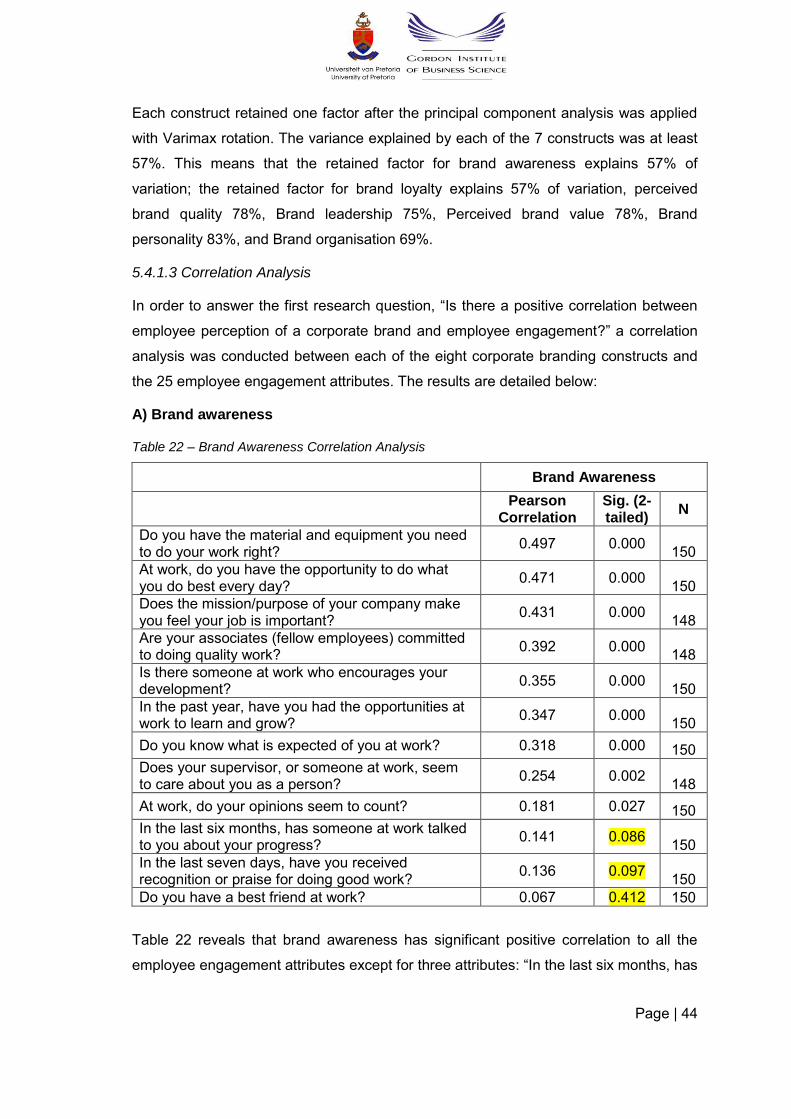
Page | 44
Each construct retained one factor after the principal component analysis was applied
with Varimax rotation. The variance explained by each of the 7 constructs was at least
57%. This means that the retained factor for brand awareness explains 57% of
variation; the retained factor for brand loyalty explains 57% of variation, perceived
brand quality 78%, Brand leadership 75%, Perceived brand value 78%, Brand
personality 83%, and Brand organisation 69%.
5.4.1.3 Correlation Analysis
In order to answer the first research question, “Is there a positive correlation between
employee perception of a corporate brand and employee engagement?” a correlation
analysis was conducted between each of the eight corporate branding constructs and
the 25 employee engagement attributes. The results are detailed below:
A) Brand awareness
Table 22 – Brand Awareness Correlation Analysis
Brand Awareness
Pearson
Correlation Sig. (2-tailed)
N
Do you have the material and equipment you need to do your work right?
0.497 0.000 150
At work, do you have the opportunity to do what you do best every day?
0.471 0.000 150
Does the mission/purpose of your company make you feel your job is important?
0.431 0.000 148
Are your associates (fellow employees) committed to doing quality work?
0.392 0.000 148
Is there someone at work who encourages your development?
0.355 0.000 150
In the past year, have you had the opportunities at work to learn and grow?
0.347 0.000 150
Do you know what is expected of you at work? 0.318 0.000 150
Does your supervisor, or someone at work, seem to care about you as a person?
0.254 0.002 148
At work, do your opinions seem to count? 0.181 0.027 150
In the last six months, has someone at work talked to you about your progress?
0.141 0.086 150
In the last seven days, have you received recognition or praise for doing good work?
0.136 0.097 150
Do you have a best friend at work? 0.067 0.412 150
Table 22 reveals that brand awareness has significant positive correlation to all the
employee engagement attributes except for three attributes: “In the last six months, has
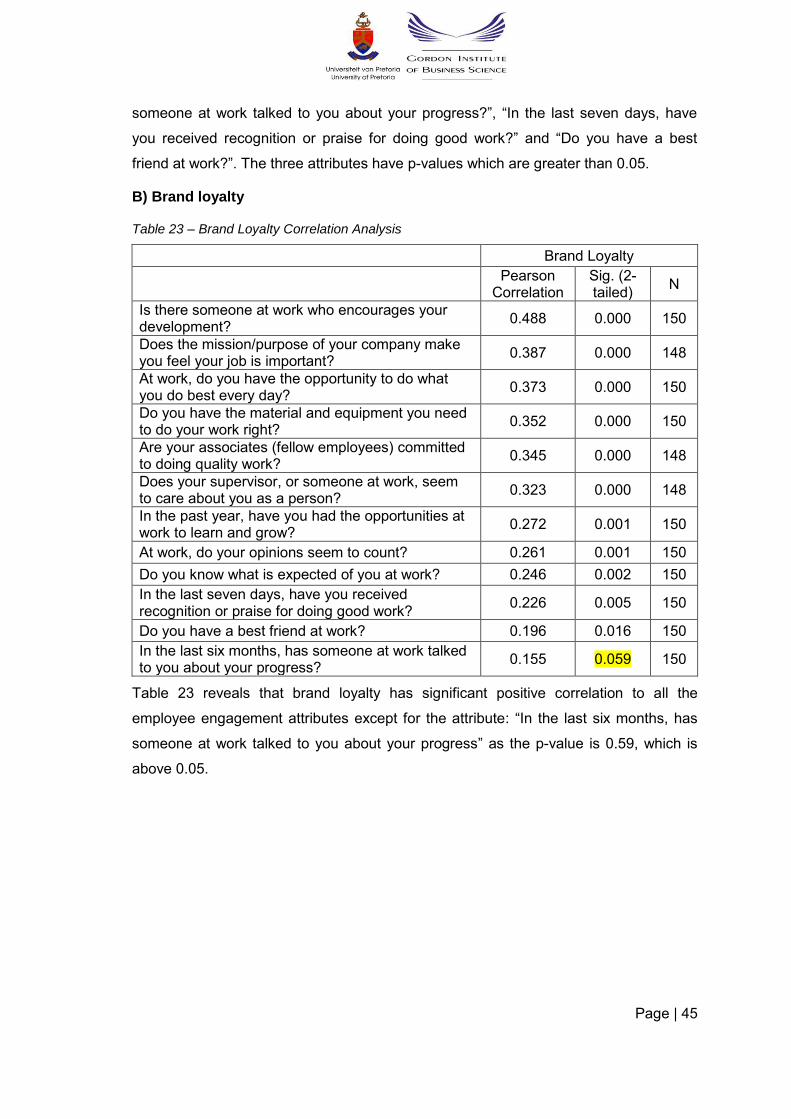
Page | 45
someone at work talked to you about your progress?”, “In the last seven days, have
you received recognition or praise for doing good work?” and “Do you have a best
friend at work?”. The three attributes have p-values which are greater than 0.05.
B) Brand loyalty
Table 23 – Brand Loyalty Correlation Analysis
Brand Loyalty
Pearson
Correlation Sig. (2-tailed)
N
Is there someone at work who encourages your development?
0.488 0.000 150
Does the mission/purpose of your company make you feel your job is important?
0.387 0.000 148
At work, do you have the opportunity to do what you do best every day?
0.373 0.000 150
Do you have the material and equipment you need to do your work right?
0.352 0.000 150
Are your associates (fellow employees) committed to doing quality work?
0.345 0.000 148
Does your supervisor, or someone at work, seem to care about you as a person?
0.323 0.000 148
In the past year, have you had the opportunities at work to learn and grow?
0.272 0.001 150
At work, do your opinions seem to count? 0.261 0.001 150
Do you know what is expected of you at work? 0.246 0.002 150
In the last seven days, have you received recognition or praise for doing good work?
0.226 0.005 150
Do you have a best friend at work? 0.196 0.016 150
In the last six months, has someone at work talked to you about your progress?
0.155 0.059 150
Table 23 reveals that brand loyalty has significant positive correlation to all the
employee engagement attributes except for the attribute: “In the last six months, has
someone at work talked to you about your progress” as the p-value is 0.59, which is
above 0.05.
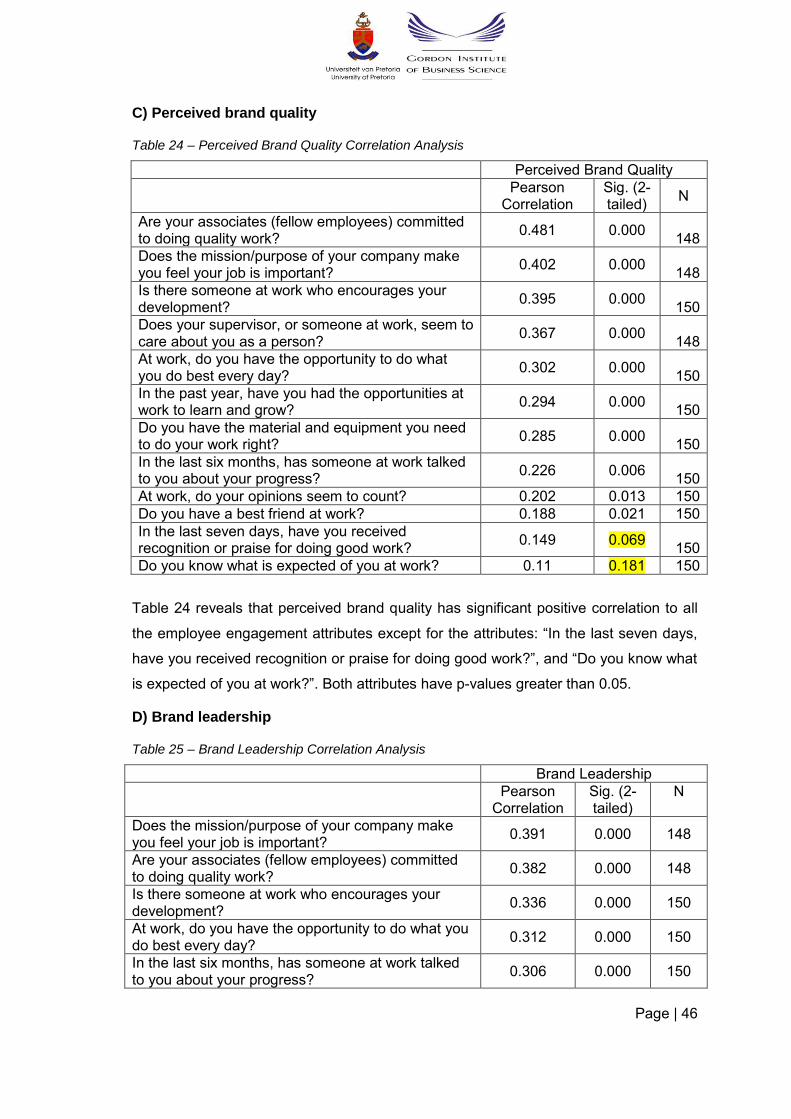
Page | 46
C) Perceived brand quality
Table 24 – Perceived Brand Quality Correlation Analysis
Perceived Brand Quality
Pearson
Correlation Sig. (2-tailed)
N
Are your associates (fellow employees) committed to doing quality work?
0.481 0.000 148
Does the mission/purpose of your company make you feel your job is important?
0.402 0.000 148
Is there someone at work who encourages your development?
0.395 0.000 150
Does your supervisor, or someone at work, seem to care about you as a person?
0.367 0.000 148
At work, do you have the opportunity to do what you do best every day?
0.302 0.000 150
In the past year, have you had the opportunities at work to learn and grow?
0.294 0.000 150
Do you have the material and equipment you need to do your work right?
0.285 0.000 150
In the last six months, has someone at work talked to you about your progress?
0.226 0.006 150
At work, do your opinions seem to count? 0.202 0.013 150
Do you have a best friend at work? 0.188 0.021 150
In the last seven days, have you received recognition or praise for doing good work?
0.149 0.069 150
Do you know what is expected of you at work? 0.11 0.181 150
Table 24 reveals that perceived brand quality has significant positive correlation to all
the employee engagement attributes except for the attributes: “In the last seven days,
have you received recognition or praise for doing good work?”, and “Do you know what
is expected of you at work?”. Both attributes have p-values greater than 0.05.
D) Brand leadership
Table 25 – Brand Leadership Correlation Analysis
Brand Leadership
Pearson
Correlation Sig. (2-tailed)
N
Does the mission/purpose of your company make you feel your job is important?
0.391 0.000 148
Are your associates (fellow employees) committed to doing quality work?
0.382 0.000 148
Is there someone at work who encourages your development?
0.336 0.000 150
At work, do you have the opportunity to do what you do best every day?
0.312 0.000 150
In the last six months, has someone at work talked to you about your progress?
0.306 0.000 150
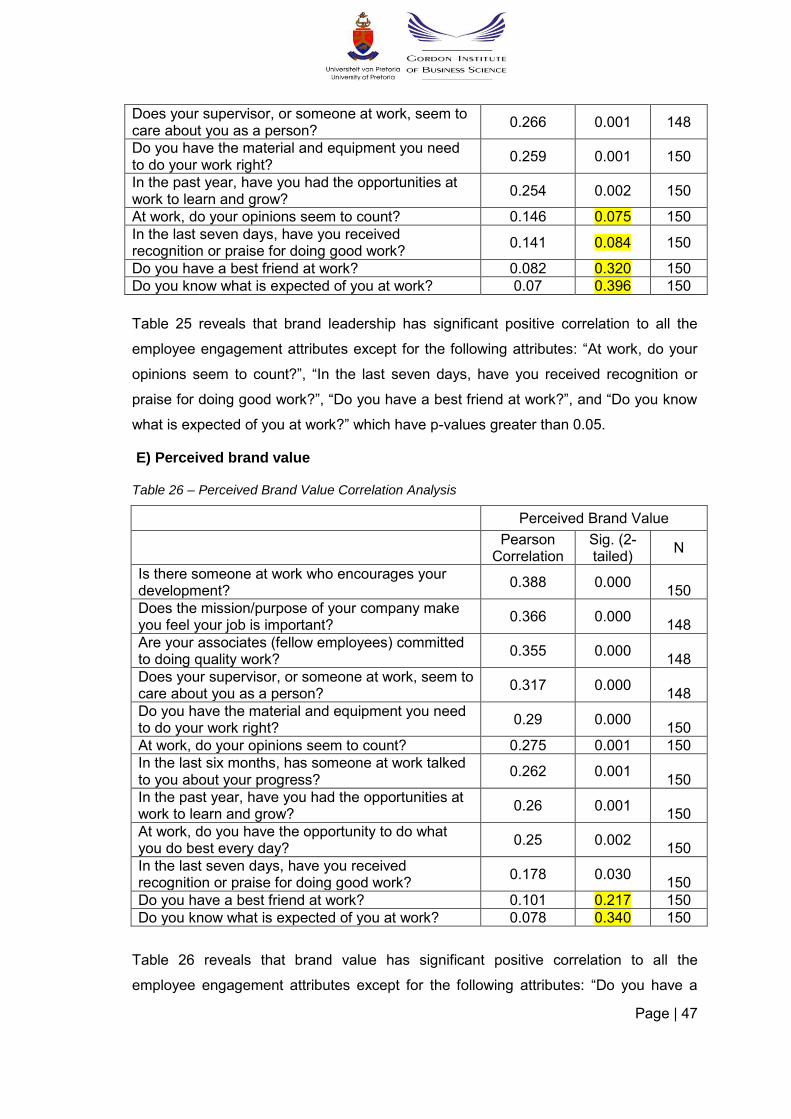
Page | 47
Does your supervisor, or someone at work, seem to care about you as a person?
0.266 0.001 148
Do you have the material and equipment you need to do your work right?
0.259 0.001 150
In the past year, have you had the opportunities at work to learn and grow?
0.254 0.002 150
At work, do your opinions seem to count? 0.146 0.075 150
In the last seven days, have you received recognition or praise for doing good work?
0.141 0.084 150
Do you have a best friend at work? 0.082 0.320 150
Do you know what is expected of you at work? 0.07 0.396 150
Table 25 reveals that brand leadership has significant positive correlation to all the
employee engagement attributes except for the following attributes: “At work, do your
opinions seem to count?”, “In the last seven days, have you received recognition or
praise for doing good work?”, “Do you have a best friend at work?”, and “Do you know
what is expected of you at work?” which have p-values greater than 0.05.
E) Perceived brand value
Table 26 – Perceived Brand Value Correlation Analysis
Perceived Brand Value
Pearson
Correlation Sig. (2-tailed)
N
Is there someone at work who encourages your development?
0.388 0.000 150
Does the mission/purpose of your company make you feel your job is important?
0.366 0.000 148
Are your associates (fellow employees) committed to doing quality work?
0.355 0.000 148
Does your supervisor, or someone at work, seem to care about you as a person?
0.317 0.000 148
Do you have the material and equipment you need to do your work right?
0.29 0.000 150
At work, do your opinions seem to count? 0.275 0.001 150
In the last six months, has someone at work talked to you about your progress?
0.262 0.001 150
In the past year, have you had the opportunities at work to learn and grow?
0.26 0.001 150
At work, do you have the opportunity to do what you do best every day?
0.25 0.002 150
In the last seven days, have you received recognition or praise for doing good work?
0.178 0.030 150
Do you have a best friend at work? 0.101 0.217 150
Do you know what is expected of you at work? 0.078 0.340 150
Table 26 reveals that brand value has significant positive correlation to all the
employee engagement attributes except for the following attributes: “Do you have a
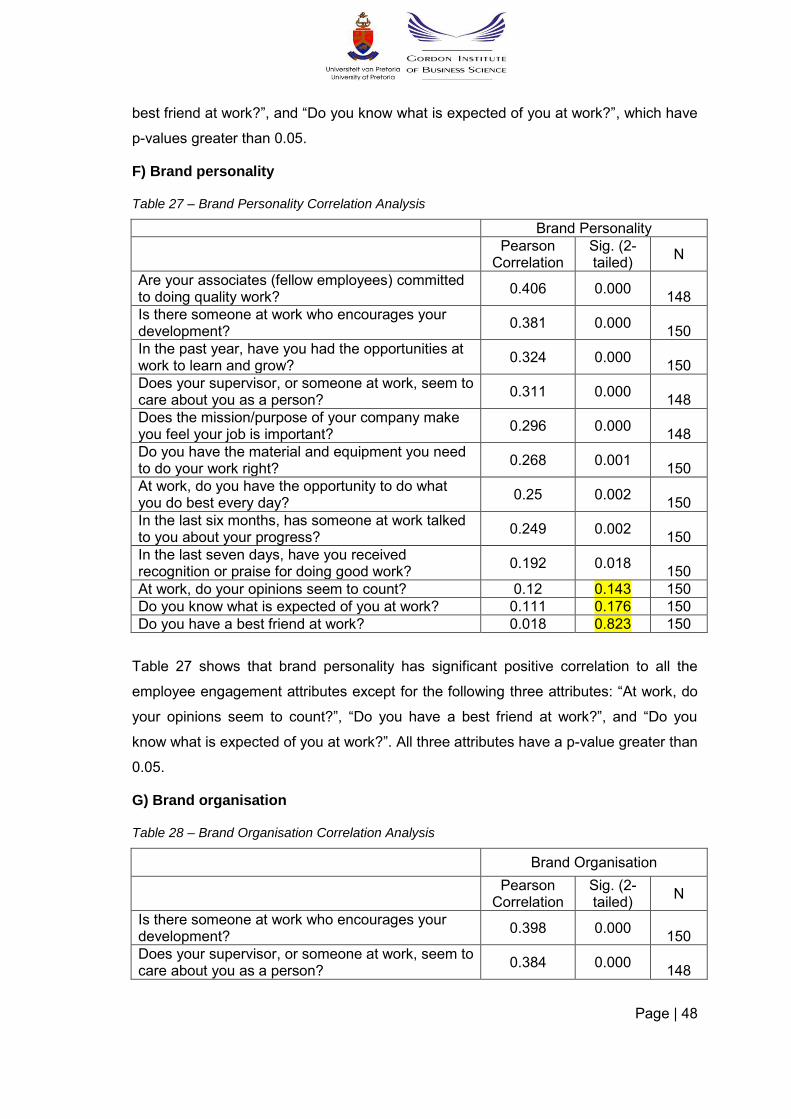
Page | 48
best friend at work?”, and “Do you know what is expected of you at work?”, which have
p-values greater than 0.05.
F) Brand personality
Table 27 – Brand Personality Correlation Analysis
Brand Personality
Pearson
Correlation Sig. (2-tailed)
N
Are your associates (fellow employees) committed to doing quality work?
0.406 0.000 148
Is there someone at work who encourages your development?
0.381 0.000 150
In the past year, have you had the opportunities at work to learn and grow?
0.324 0.000 150
Does your supervisor, or someone at work, seem to care about you as a person?
0.311 0.000 148
Does the mission/purpose of your company make you feel your job is important?
0.296 0.000 148
Do you have the material and equipment you need to do your work right?
0.268 0.001 150
At work, do you have the opportunity to do what you do best every day?
0.25 0.002 150
In the last six months, has someone at work talked to you about your progress?
0.249 0.002 150
In the last seven days, have you received recognition or praise for doing good work?
0.192 0.018 150
At work, do your opinions seem to count? 0.12 0.143 150
Do you know what is expected of you at work? 0.111 0.176 150
Do you have a best friend at work? 0.018 0.823 150
Table 27 shows that brand personality has significant positive correlation to all the
employee engagement attributes except for the following three attributes: “At work, do
your opinions seem to count?”, “Do you have a best friend at work?”, and “Do you
know what is expected of you at work?”. All three attributes have a p-value greater than
0.05.
G) Brand organisation
Table 28 – Brand Organisation Correlation Analysis
Brand Organisation
Pearson
Correlation Sig. (2-tailed)
N
Is there someone at work who encourages your development?
0.398 0.000 150
Does your supervisor, or someone at work, seem to care about you as a person?
0.384 0.000 148
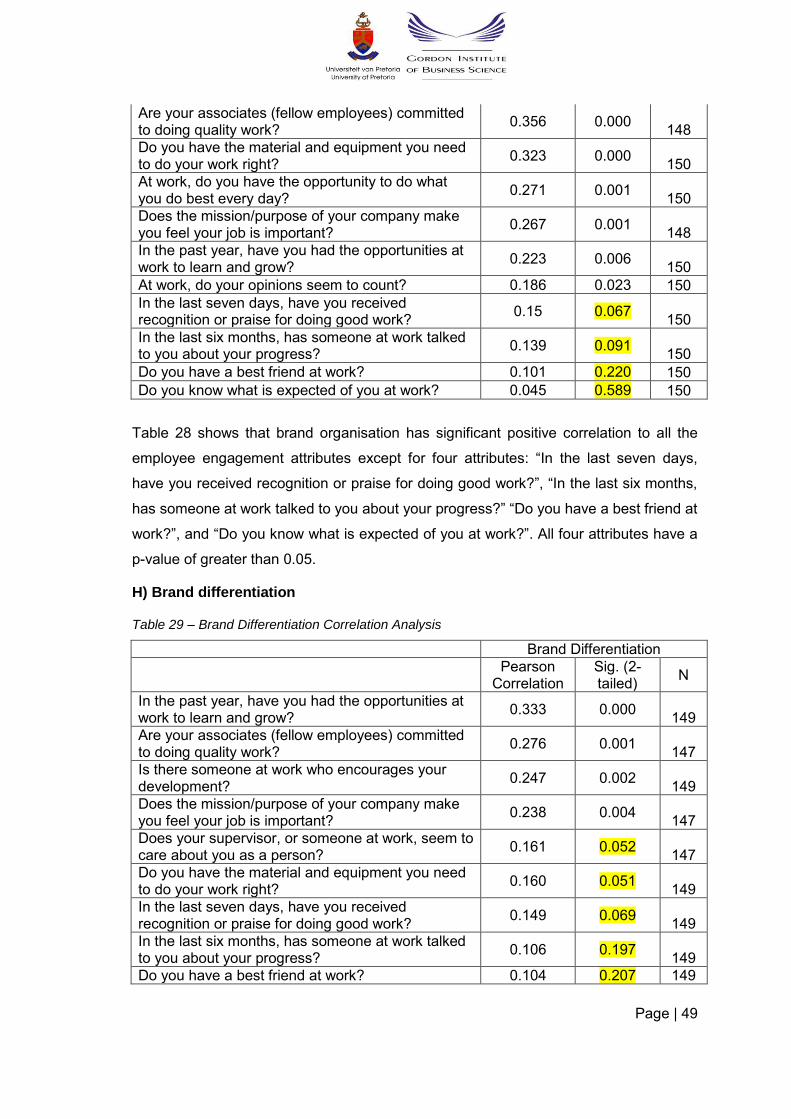
Page | 49
Are your associates (fellow employees) committed to doing quality work?
0.356 0.000 148
Do you have the material and equipment you need to do your work right?
0.323 0.000 150
At work, do you have the opportunity to do what you do best every day?
0.271 0.001 150
Does the mission/purpose of your company make you feel your job is important?
0.267 0.001 148
In the past year, have you had the opportunities at work to learn and grow?
0.223 0.006 150
At work, do your opinions seem to count? 0.186 0.023 150
In the last seven days, have you received recognition or praise for doing good work?
0.15 0.067 150
In the last six months, has someone at work talked to you about your progress?
0.139 0.091 150
Do you have a best friend at work? 0.101 0.220 150
Do you know what is expected of you at work? 0.045 0.589 150
Table 28 shows that brand organisation has significant positive correlation to all the
employee engagement attributes except for four attributes: “In the last seven days,
have you received recognition or praise for doing good work?”, “In the last six months,
has someone at work talked to you about your progress?” “Do you have a best friend at
work?”, and “Do you know what is expected of you at work?”. All four attributes have a
p-value of greater than 0.05.
H) Brand differentiation
Table 29 – Brand Differentiation Correlation Analysis
Brand Differentiation
Pearson
Correlation Sig. (2-tailed)
N
In the past year, have you had the opportunities at work to learn and grow?
0.333 0.000 149
Are your associates (fellow employees) committed to doing quality work?
0.276 0.001 147
Is there someone at work who encourages your development?
0.247 0.002 149
Does the mission/purpose of your company make you feel your job is important?
0.238 0.004 147
Does your supervisor, or someone at work, seem to care about you as a person?
0.161 0.052 147
Do you have the material and equipment you need to do your work right?
0.160 0.051 149
In the last seven days, have you received recognition or praise for doing good work?
0.149 0.069 149
In the last six months, has someone at work talked to you about your progress?
0.106 0.197 149
Do you have a best friend at work? 0.104 0.207 149
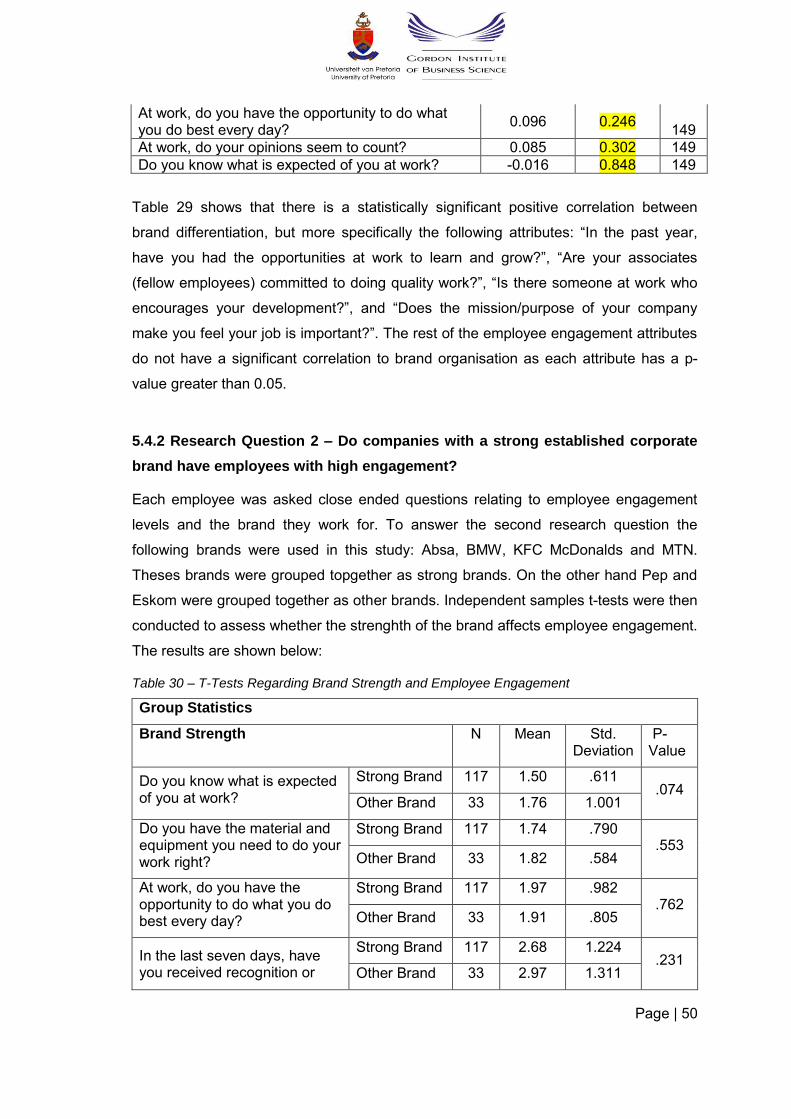
Page | 50
At work, do you have the opportunity to do what you do best every day?
0.096 0.246 149
At work, do your opinions seem to count? 0.085 0.302 149
Do you know what is expected of you at work? -0.016 0.848 149
Table 29 shows that there is a statistically significant positive correlation between
brand differentiation, but more specifically the following attributes: “In the past year,
have you had the opportunities at work to learn and grow?”, “Are your associates
(fellow employees) committed to doing quality work?”, “Is there someone at work who
encourages your development?”, and “Does the mission/purpose of your company
make you feel your job is important?”. The rest of the employee engagement attributes
do not have a significant correlation to brand organisation as each attribute has a p-
value greater than 0.05.
5.4.2 Research Question 2 – Do companies with a strong established corporate
brand have employees with high engagement?
Each employee was asked close ended questions relating to employee engagement
levels and the brand they work for. To answer the second research question the
following brands were used in this study: Absa, BMW, KFC McDonalds and MTN.
Theses brands were grouped topgether as strong brands. On the other hand Pep and
Eskom were grouped together as other brands. Independent samples t-tests were then
conducted to assess whether the strenghth of the brand affects employee engagement.
The results are shown below:
Table 30 – T-Tests Regarding Brand Strength and Employee Engagement
Group Statistics
Brand Strength N Mean Std. Deviation
P-Value
Do you know what is expected of you at work?
Strong Brand 117 1.50 .611 .074
Other Brand 33 1.76 1.001
Do you have the material and equipment you need to do your work right?
Strong Brand 117 1.74 .790 .553
Other Brand 33 1.82 .584
At work, do you have the opportunity to do what you do best every day?
Strong Brand 117 1.97 .982 .762
Other Brand 33 1.91 .805
In the last seven days, have you received recognition or
Strong Brand 117 2.68 1.224 .231
Other Brand 33 2.97 1.311
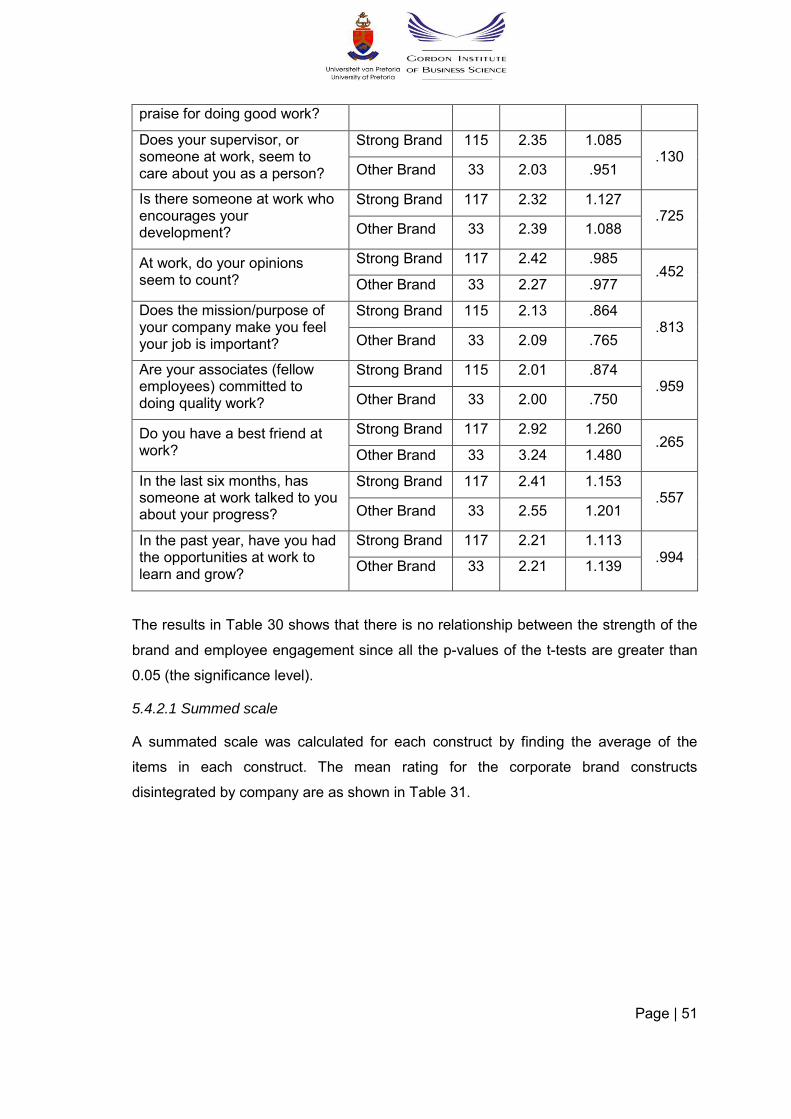
Page | 51
praise for doing good work?
Does your supervisor, or someone at work, seem to care about you as a person?
Strong Brand 115 2.35 1.085 .130
Other Brand 33 2.03 .951
Is there someone at work who encourages your development?
Strong Brand 117 2.32 1.127 .725
Other Brand 33 2.39 1.088
At work, do your opinions seem to count?
Strong Brand 117 2.42 .985 .452
Other Brand 33 2.27 .977
Does the mission/purpose of your company make you feel your job is important?
Strong Brand 115 2.13 .864 .813
Other Brand 33 2.09 .765
Are your associates (fellow employees) committed to doing quality work?
Strong Brand 115 2.01 .874 .959
Other Brand 33 2.00 .750
Do you have a best friend at work?
Strong Brand 117 2.92 1.260 .265
Other Brand 33 3.24 1.480
In the last six months, has someone at work talked to you about your progress?
Strong Brand 117 2.41 1.153 .557
Other Brand 33 2.55 1.201
In the past year, have you had the opportunities at work to learn and grow?
Strong Brand 117 2.21 1.113 .994
Other Brand 33 2.21 1.139
The results in Table 30 shows that there is no relationship between the strength of the
brand and employee engagement since all the p-values of the t-tests are greater than
0.05 (the significance level).
5.4.2.1 Summed scale
A summated scale was calculated for each construct by finding the average of the
items in each construct. The mean rating for the corporate brand constructs
disintegrated by company are as shown in Table 31.
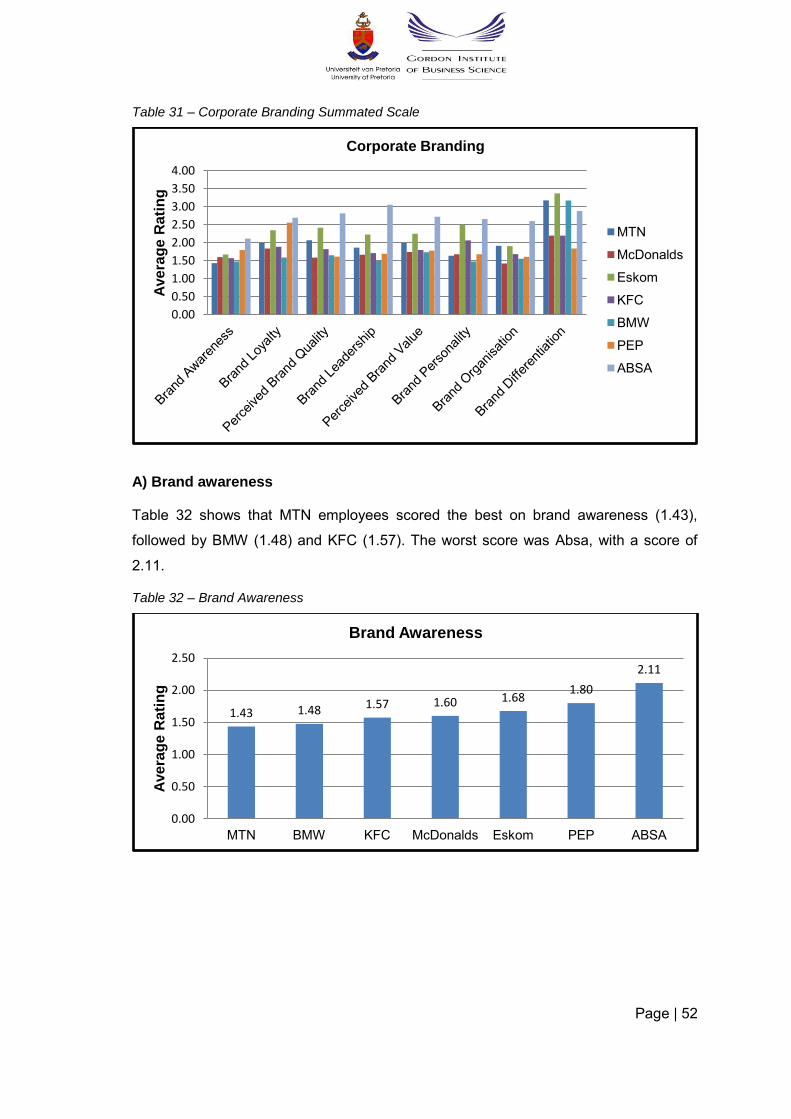
Page | 52
Table 31 – Corporate Branding Summated Scale
A) Brand awareness
Table 32 shows that MTN employees scored the best on brand awareness (1.43),
followed by BMW (1.48) and KFC (1.57). The worst score was Absa, with a score of
2.11.
Table 32 – Brand Awareness
0.00
0.50
1.00
1.50
2.00
2.50
3.00
3.50
4.00 A
ve
rag
e R
ati
ng
Corporate Branding
MTN
McDonalds
Eskom
KFC
BMW
PEP
ABSA
1.43 1.48 1.57 1.60 1.68 1.80
2.11
0.00
0.50
1.00
1.50
2.00
2.50
MTN BMW KFC McDonalds Eskom PEP ABSA
Ave
rag
e R
ati
ng
Brand Awareness
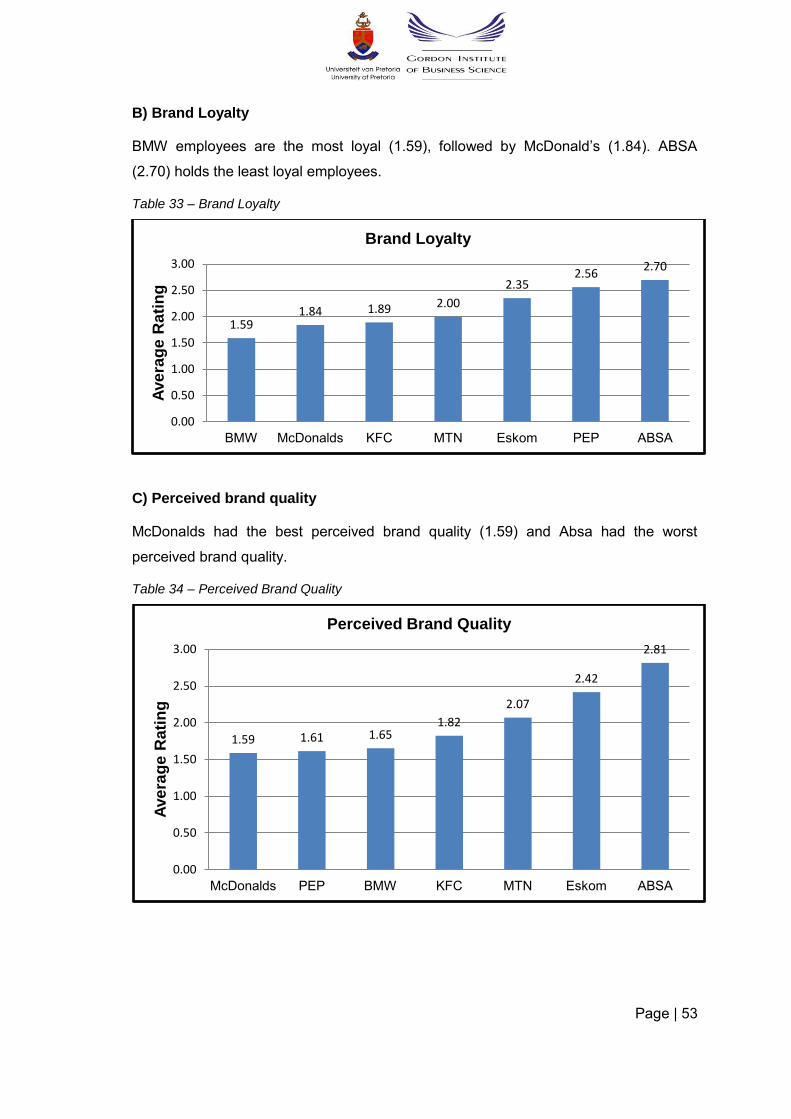
Page | 53
B) Brand Loyalty
BMW employees are the most loyal (1.59), followed by McDonald’s (1.84). ABSA
(2.70) holds the least loyal employees.
Table 33 – Brand Loyalty
C) Perceived brand quality
McDonalds had the best perceived brand quality (1.59) and Absa had the worst
perceived brand quality.
Table 34 – Perceived Brand Quality
1.59 1.84 1.89 2.00
2.35 2.56
2.70
0.00
0.50
1.00
1.50
2.00
2.50
3.00
BMW McDonalds KFC MTN Eskom PEP ABSA
Ave
rag
e R
ati
ng
Brand Loyalty
1.59 1.61 1.65 1.82
2.07
2.42
2.81
0.00
0.50
1.00
1.50
2.00
2.50
3.00
McDonalds PEP BMW KFC MTN Eskom ABSA
Ave
rag
e R
ati
ng
Perceived Brand Quality
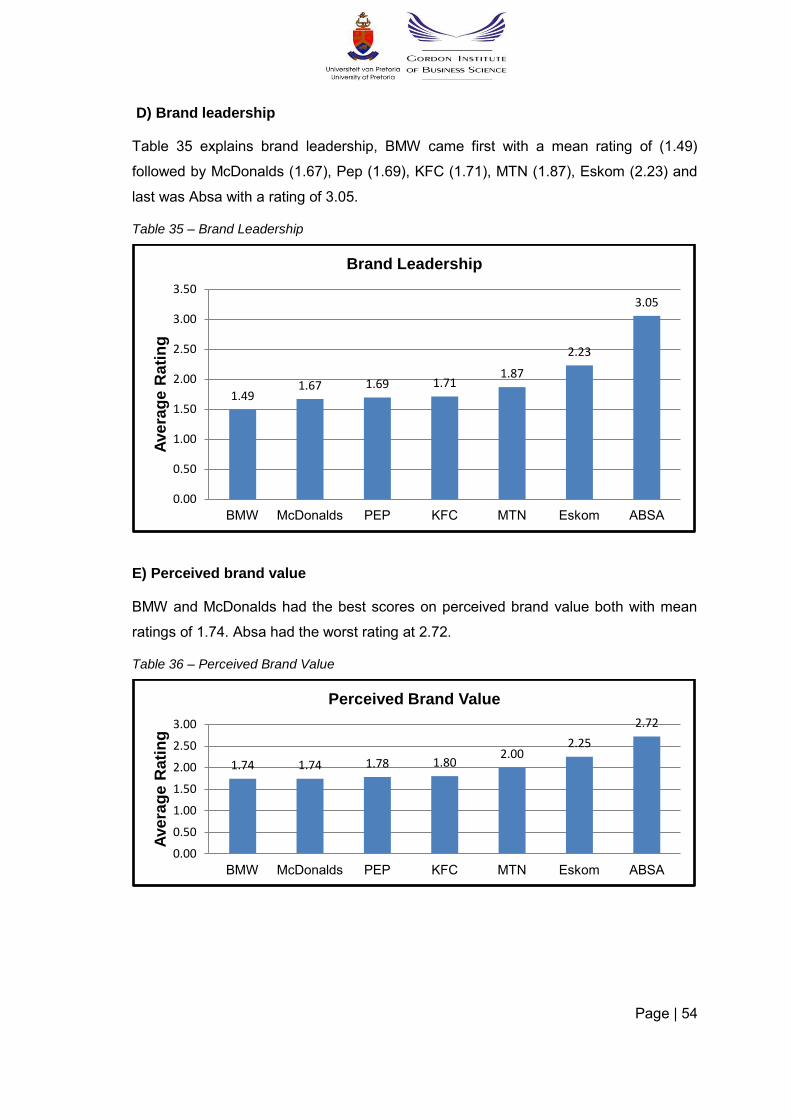
Page | 54
D) Brand leadership
Table 35 explains brand leadership, BMW came first with a mean rating of (1.49)
followed by McDonalds (1.67), Pep (1.69), KFC (1.71), MTN (1.87), Eskom (2.23) and
last was Absa with a rating of 3.05.
Table 35 – Brand Leadership
E) Perceived brand value
BMW and McDonalds had the best scores on perceived brand value both with mean
ratings of 1.74. Absa had the worst rating at 2.72.
Table 36 – Perceived Brand Value
1.49 1.67 1.69 1.71
1.87
2.23
3.05
0.00
0.50
1.00
1.50
2.00
2.50
3.00
3.50
BMW McDonalds PEP KFC MTN Eskom ABSA
Ave
rag
e R
ati
ng
Brand Leadership
1.74 1.74 1.78 1.80 2.00
2.25
2.72
0.00
0.50
1.00
1.50
2.00
2.50
3.00
BMW McDonalds PEP KFC MTN Eskom ABSA
Ave
rag
e R
ati
ng
Perceived Brand Value
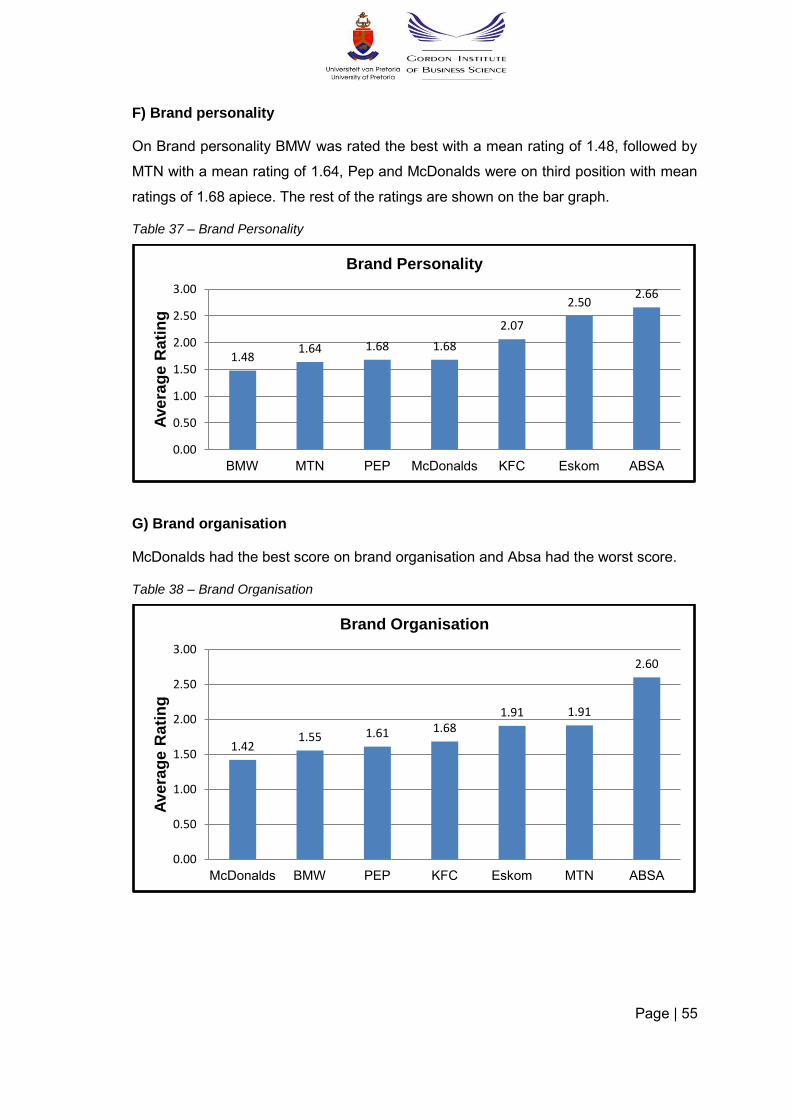
Page | 55
F) Brand personality
On Brand personality BMW was rated the best with a mean rating of 1.48, followed by
MTN with a mean rating of 1.64, Pep and McDonalds were on third position with mean
ratings of 1.68 apiece. The rest of the ratings are shown on the bar graph.
Table 37 – Brand Personality
G) Brand organisation
McDonalds had the best score on brand organisation and Absa had the worst score.
Table 38 – Brand Organisation
1.48 1.64 1.68 1.68
2.07
2.50 2.66
0.00
0.50
1.00
1.50
2.00
2.50
3.00
BMW MTN PEP McDonalds KFC Eskom ABSA
Ave
rag
e R
ati
ng
Brand Personality
1.42 1.55 1.61 1.68
1.91 1.91
2.60
0.00
0.50
1.00
1.50
2.00
2.50
3.00
McDonalds BMW PEP KFC Eskom MTN ABSA
Ave
rag
e R
ati
ng
Brand Organisation
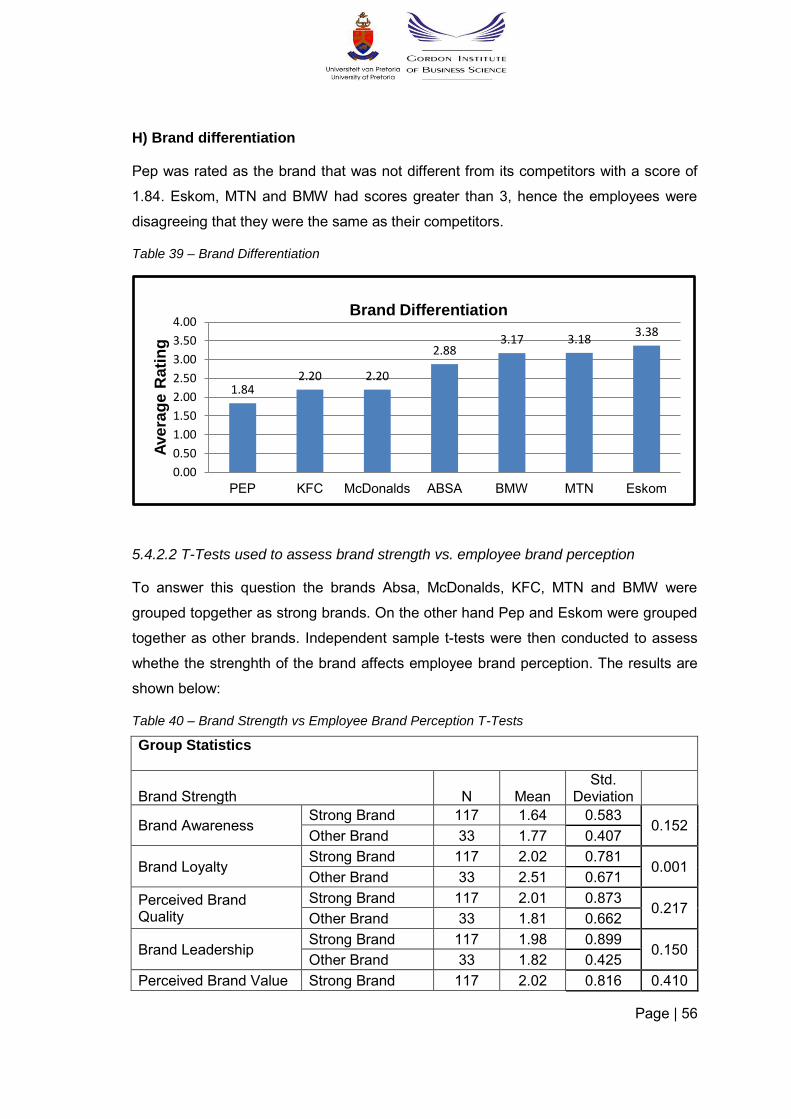
Page | 56
H) Brand differentiation
Pep was rated as the brand that was not different from its competitors with a score of
1.84. Eskom, MTN and BMW had scores greater than 3, hence the employees were
disagreeing that they were the same as their competitors.
Table 39 – Brand Differentiation
5.4.2.2 T-Tests used to assess brand strength vs. employee brand perception
To answer this question the brands Absa, McDonalds, KFC, MTN and BMW were
grouped topgether as strong brands. On the other hand Pep and Eskom were grouped
together as other brands. Independent sample t-tests were then conducted to assess
whethe the strenghth of the brand affects employee brand perception. The results are
shown below:
Table 40 – Brand Strength vs Employee Brand Perception T-Tests
Group Statistics
Brand Strength N Mean Std.
Deviation
Brand Awareness Strong Brand 117 1.64 0.583
0.152 Other Brand 33 1.77 0.407
Brand Loyalty Strong Brand 117 2.02 0.781
0.001 Other Brand 33 2.51 0.671
Perceived Brand Quality
Strong Brand 117 2.01 0.873 0.217
Other Brand 33 1.81 0.662
Brand Leadership Strong Brand 117 1.98 0.899
0.150 Other Brand 33 1.82 0.425
Perceived Brand Value Strong Brand 117 2.02 0.816 0.410
1.84 2.20 2.20
2.88 3.17 3.18
3.38
0.00
0.50
1.00
1.50
2.00
2.50
3.00
3.50
4.00
PEP KFC McDonalds ABSA BMW MTN Eskom
Ave
rag
e R
ati
ng
Brand Differentiation
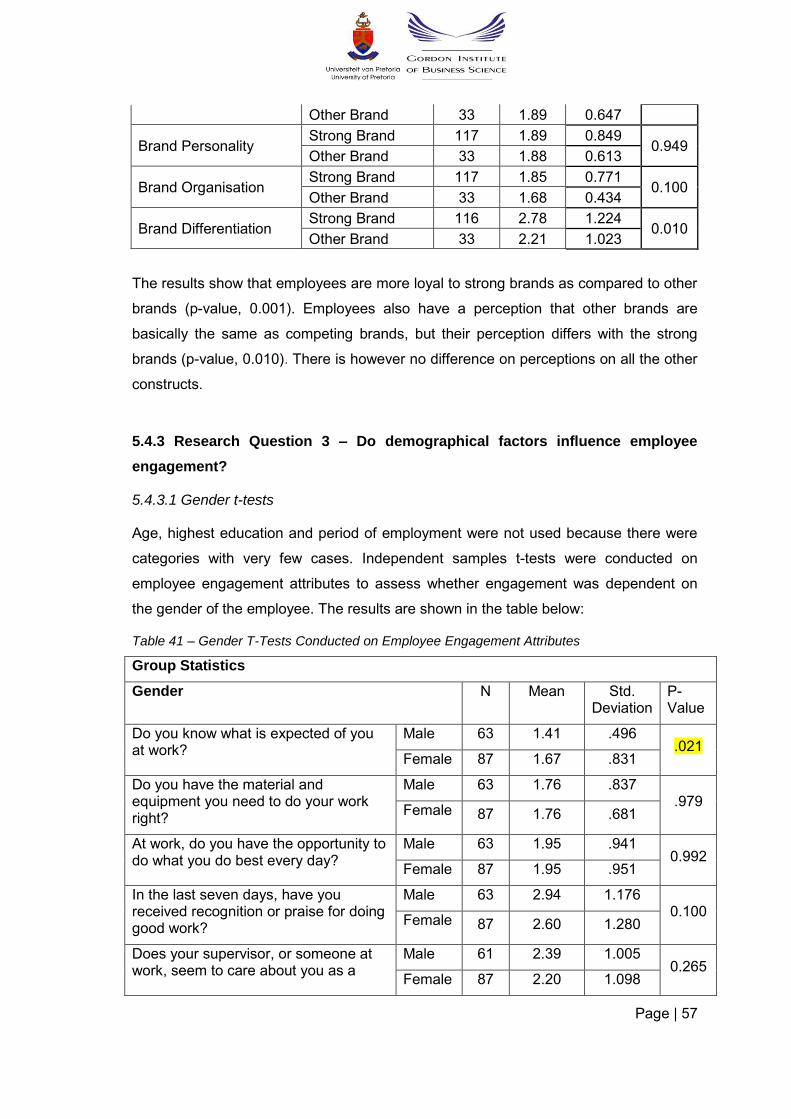
Page | 57
Other Brand 33 1.89 0.647
Brand Personality Strong Brand 117 1.89 0.849
0.949 Other Brand 33 1.88 0.613
Brand Organisation Strong Brand 117 1.85 0.771
0.100 Other Brand 33 1.68 0.434
Brand Differentiation Strong Brand 116 2.78 1.224
0.010 Other Brand 33 2.21 1.023
The results show that employees are more loyal to strong brands as compared to other
brands (p-value, 0.001). Employees also have a perception that other brands are
basically the same as competing brands, but their perception differs with the strong
brands (p-value, 0.010). There is however no difference on perceptions on all the other
constructs.
5.4.3 Research Question 3 – Do demographical factors influence employee
engagement?
5.4.3.1 Gender t-tests
Age, highest education and period of employment were not used because there were
categories with very few cases. Independent samples t-tests were conducted on
employee engagement attributes to assess whether engagement was dependent on
the gender of the employee. The results are shown in the table below:
Table 41 – Gender T-Tests Conducted on Employee Engagement Attributes
Group Statistics
Gender N Mean Std. Deviation
P-Value
Do you know what is expected of you at work?
Male 63 1.41 .496 .021
Female 87 1.67 .831
Do you have the material and equipment you need to do your work right?
Male 63 1.76 .837 .979
Female 87 1.76 .681
At work, do you have the opportunity to do what you do best every day?
Male 63 1.95 .941 0.992
Female 87 1.95 .951
In the last seven days, have you received recognition or praise for doing good work?
Male 63 2.94 1.176 0.100
Female 87 2.60 1.280
Does your supervisor, or someone at work, seem to care about you as a
Male 61 2.39 1.005 0.265
Female 87 2.20 1.098
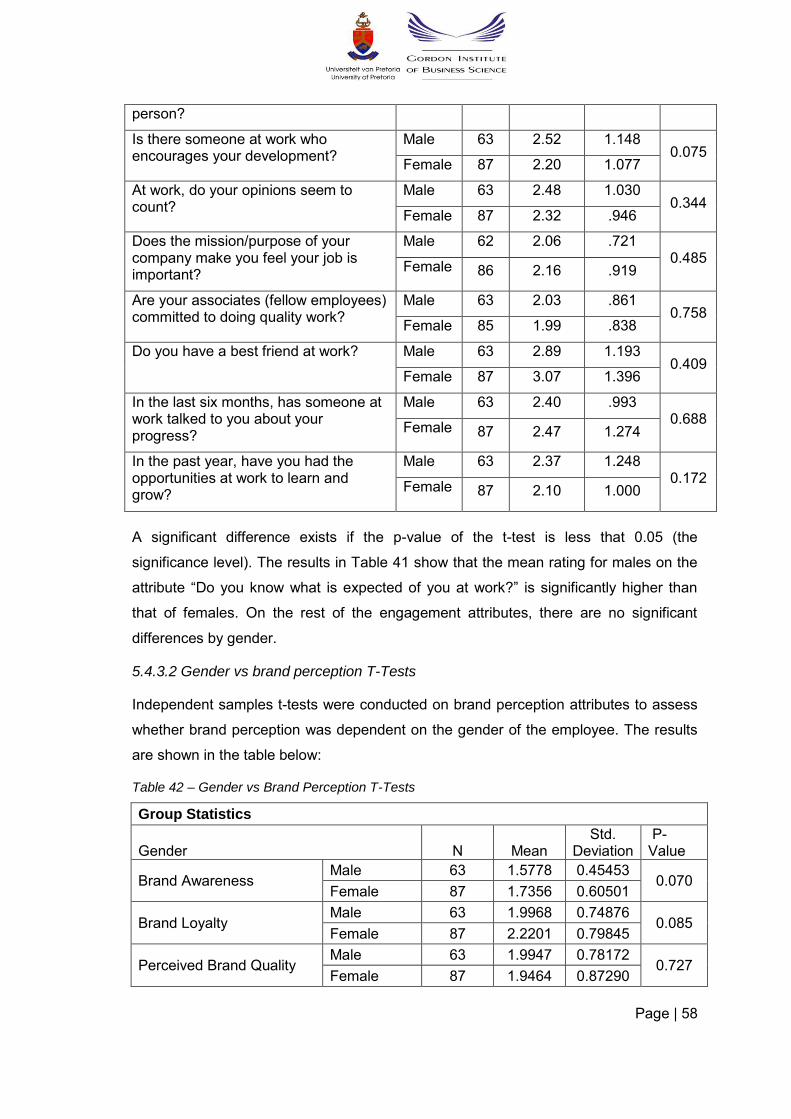
Page | 58
person?
Is there someone at work who encourages your development?
Male 63 2.52 1.148 0.075
Female 87 2.20 1.077
At work, do your opinions seem to count?
Male 63 2.48 1.030 0.344
Female 87 2.32 .946
Does the mission/purpose of your company make you feel your job is important?
Male 62 2.06 .721 0.485
Female 86 2.16 .919
Are your associates (fellow employees) committed to doing quality work?
Male 63 2.03 .861 0.758
Female 85 1.99 .838
Do you have a best friend at work? Male 63 2.89 1.193 0.409
Female 87 3.07 1.396
In the last six months, has someone at work talked to you about your progress?
Male 63 2.40 .993 0.688
Female 87 2.47 1.274
In the past year, have you had the opportunities at work to learn and grow?
Male 63 2.37 1.248 0.172
Female 87 2.10 1.000
A significant difference exists if the p-value of the t-test is less that 0.05 (the
significance level). The results in Table 41 show that the mean rating for males on the
attribute “Do you know what is expected of you at work?” is significantly higher than
that of females. On the rest of the engagement attributes, there are no significant
differences by gender.
5.4.3.2 Gender vs brand perception T-Tests
Independent samples t-tests were conducted on brand perception attributes to assess
whether brand perception was dependent on the gender of the employee. The results
are shown in the table below:
Table 42 – Gender vs Brand Perception T-Tests
Group Statistics
Gender N Mean Std.
Deviation P-Value
Brand Awareness Male 63 1.5778 0.45453
0.070 Female 87 1.7356 0.60501
Brand Loyalty Male 63 1.9968 0.74876
0.085 Female 87 2.2201 0.79845
Perceived Brand Quality Male 63 1.9947 0.78172
0.727 Female 87 1.9464 0.87290
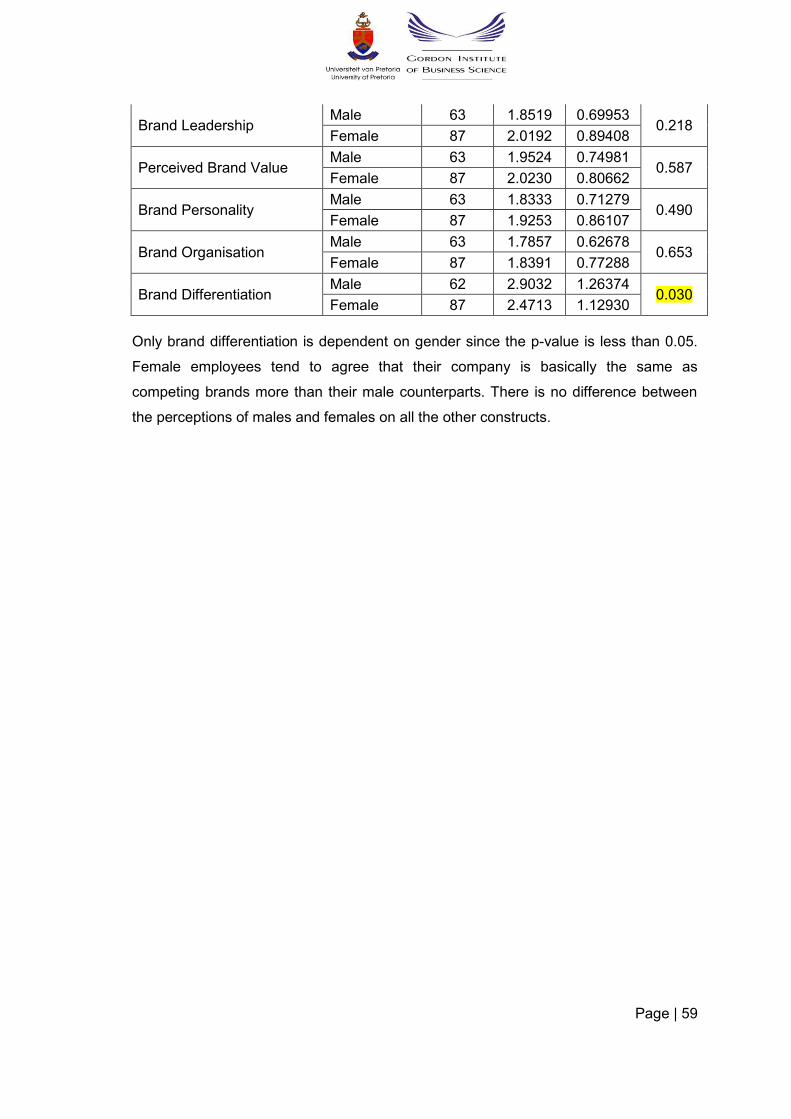
Page | 59
Brand Leadership Male 63 1.8519 0.69953
0.218 Female 87 2.0192 0.89408
Perceived Brand Value Male 63 1.9524 0.74981
0.587 Female 87 2.0230 0.80662
Brand Personality Male 63 1.8333 0.71279
0.490 Female 87 1.9253 0.86107
Brand Organisation Male 63 1.7857 0.62678
0.653 Female 87 1.8391 0.77288
Brand Differentiation Male 62 2.9032 1.26374
0.030 Female 87 2.4713 1.12930
Only brand differentiation is dependent on gender since the p-value is less than 0.05.
Female employees tend to agree that their company is basically the same as
competing brands more than their male counterparts. There is no difference between
the perceptions of males and females on all the other constructs.
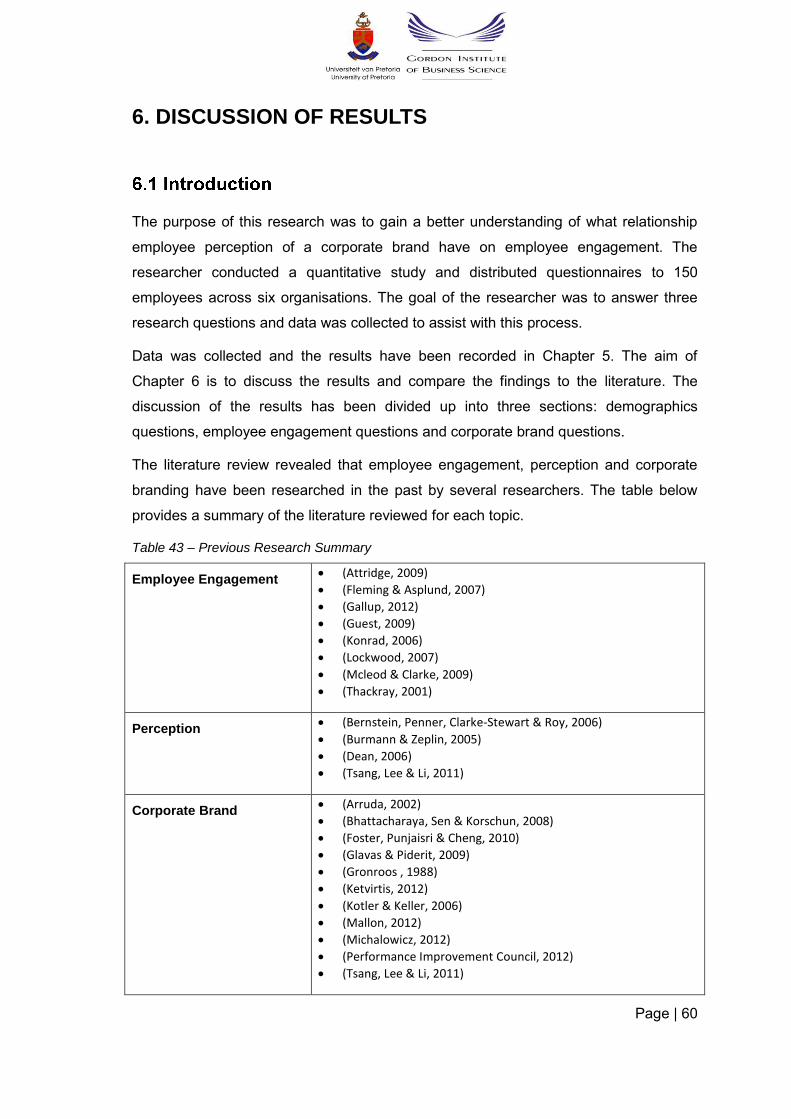
Page | 60
6. DISCUSSION OF RESULTS
The purpose of this research was to gain a better understanding of what relationship
employee perception of a corporate brand have on employee engagement. The
researcher conducted a quantitative study and distributed questionnaires to 150
employees across six organisations. The goal of the researcher was to answer three
research questions and data was collected to assist with this process.
Data was collected and the results have been recorded in Chapter 5. The aim of
Chapter 6 is to discuss the results and compare the findings to the literature. The
discussion of the results has been divided up into three sections: demographics
questions, employee engagement questions and corporate brand questions.
The literature review revealed that employee engagement, perception and corporate
branding have been researched in the past by several researchers. The table below
provides a summary of the literature reviewed for each topic.
Table 43 – Previous Research Summary
Employee Engagement (Attridge, 2009)
(Fleming & Asplund, 2007)
(Gallup, 2012)
(Guest, 2009)
(Konrad, 2006)
(Lockwood, 2007)
(Mcleod & Clarke, 2009)
(Thackray, 2001)
Perception (Bernstein, Penner, Clarke-Stewart & Roy, 2006)
(Burmann & Zeplin, 2005)
(Dean, 2006)
(Tsang, Lee & Li, 2011)
Corporate Brand (Arruda, 2002)
(Bhattacharaya, Sen & Korschun, 2008)
(Foster, Punjaisri & Cheng, 2010)
(Glavas & Piderit, 2009)
(Gronroos , 1988)
(Ketvirtis, 2012)
(Kotler & Keller, 2006)
(Mallon, 2012)
(Michalowicz, 2012)
(Performance Improvement Council, 2012)
(Tsang, Lee & Li, 2011)
Page | 61
The previous research discussed in the above table speaks about individual topics and
does not integrate the findings of Chapter 5 with the literature reviewed. Therefore this
chapter aims to link the findings of Chapter 4 with the literature reviewed in Chapter 2.
The researcher posed three research questions with the intention of gaining a better
understanding as to what role employee perception of a corporate brand has on
employee engagement. The primary objective of this section is to focus on the results
from Chapter 4 and the literature in Chapter 2.
Research Question 1: Is there a positive correlation between employee perception of
a corporate brand and employee engagement?
Research Question 2: Do companies with a strong established corporate brand have
employees with high engagement?
Research Question 3: Do demographical factors influence employee engagement?
6.3.1 Corporate Brand
Corporate branding stresses the importance of employees’ behaviours and attitudes
and has given rise to internal branding and employee branding, as both emphasise the
importance of aligning employees’ beliefs and values with the corporate brand.
Corporate branding concerns “the systematic planned management of behaviours,
communication, and symbolism in order to attain a favourable and positive reputation
with target audiences of an organisation” (Foster, Punjaisri & Cheng, 2010). The
corporate branding construct was further operationalised by means of a model with the
key variables that make up the construct being depicted as: brand awareness, brand
loyalty, perceived brand quality, brand leadership, perceived brand value, brand
personality, brand organisation and brand differentiation.
Page | 62
6.3.2 Brand Awareness
Section C comprised of five brand awareness questions: “the first brand that comes to
mind”, “x company is a brand I am very familiar with”, “x company is a very popular
brand”, “I know what x company stands for” and lastly, “I have an opinion about x
company’s brand”. The brand awareness construct measured the ability of employees
to recall the brand they work for in detail which assists with acquiring a product or
service. Brand awareness involves brand recall and brand recognition; brand recall is
the most important and occurs outside the organisation as opposed to brand
recognition which happens inside the organisation (Kotler & Keller, 2006).
The results show that the mean value is 1.67 indicating a favourable response. The
findings of this research therefore indicate that within companies, employees are brand
aware. Arruda (2002) states that employees are exposed to the brand they work for
and automatically become brand aware and absorb everything related to the brand.
Once the brands objectives are discussed, employees will generate brand awareness.
A good Brand Communications Programme consists of six steps (Arruda, 2002):
i. Brand Awareness – Employees need to understand the organisation’s brand
through a collaborative effort with the marketing department, human resource
department and the operations team. The more employees become exposed to
brand communication the more aware they will become.
ii. Education – Deepen employees’ understanding of the brand by communicating
brand values and qualities.
iii. Buy In – Create brand objectives and goals for each employee.
iv. Actions – Employees should participate in brand contests as this will
encourage employees to take full responsibility of the brand. “This is where the
true spirit of brand evangelism becomes evident”.
v. Results – Show your employees the results of their actions, this will motivate
them to rally to the cause. Strong brand equals more money.
vi. Recognition – The best way to reinforce positive brand actions is to recognise
and reward success.
Three tests were conducted: a Cronbach’s alpha test, factor analysis and correlation
analysis. A Cronbach’s alpha test was conducted on brand awareness in order to
check the reliability of an ordinal scale. The results show that brand awareness has a
Cronbach’s alpha of 0.790 which means that the five brand awareness questions have
Page | 63
good internal consistency and reliability. A factor analysis determines the variance of
brand awareness. The results show that brand awareness has a variance of 57%.
The last test done was a correlation analysis which aims to answer the first research
question. According to Table 22 brand awareness has significant positive correlation to
most employee engagement attributes except for three attributes: “In the last six
months has someone at work talked to you about your progress?”, “In the last seven
days have you received recognition or praise for doing good work?” and “Do you have
a best friend at work?”. These three attributes have p-values which are greater than
0.05. Therefore the findings reveal that there is a positive correlation between
employee perception of brand awareness and employee engagement.
6.3.2 Brand Loyalty
Section C comprised of five brand loyalty questions: “the next time I use a company I
intend to use my company”, “I was delighted with my last use experience with my
company”, “my company is the only company brand I use”, “I would recommend my
company to others” and lastly “I am willing to pay a premium for my company”. The
brand loyalty construct measured employees’ commitment level to the brand they work
for and their ability to repeat purchases over time.
The results show that the mean value is 2.13 indicating a favourable response. The
findings of this research therefore indicate that within companies, employees are loyal
to the brand they work for. As previously discussed in Chapter 2, employees are loyal
because they want to build a sustainable relationship with their employer. The
economic downturn may also be a result of employee loyalty as some companies
refuse to recruit new employees to save costs, making it difficult for individuals to find a
new position. Michalowicz (2012) states that employees are loyal due to three
“secrets”:
Evaluate – Employers need to recruit individuals who are naturally loyal.
Loyalty cannot be taught and therefore it has to be present in the individual’s
character. The seven organisations that took part in this study, must have
recruited naturally loyal individuals, as employee loyalty was high across all
seven organisations.
Reciprocate – To encourage loyalty amongst employees, leaders need to be
loyal to their employees and provide financial and non-financial rewards such
as: respect and praise, employee of the month award, work flexibility and
Page | 64
listening to suggestions and feedback. The employee engagement
questionnaire revealed that on average employees rated recognition, praise
and feedback highly, which substantiates Michalowicz’s argument that explains
why employees are loyal.
Simplify – Employers must remove all barriers that prevent employees from
achieving goals and objectives. Employees that find it easier to get a job done
are more loyal than employees that have many barriers. When asked the
question “Do you have the material and equipment you need to do your work
right?” employees on average responded that they do have the correct material
and equipment to do work right which explains why they are loyal to the brand
they work for.
Three tests were conducted: a Cronbach’s alpha test, factor analysis and correlation
analysis. A Cronbach’s alpha test was conducted on brand loyalty in order to check the
reliability of an ordinal scale. The results show that brand loyalty has a Cronbach’s
alpha of 0.788 which means that the five brand loyalty questions have good internal
consistency and reliability. A factor analysis determines the variance of brand loyalty.
The results show that brand loyalty has a variance of 57%.
The last test done was a correlation analysis which aims to answer the first research
question, according to Table 23 brand loyalty has significant positive correlation to
most employee engagement attributes except for one attribute: “In the last six months
has someone at work talked to you about your progress?”. This attribute has p-values
which are greater than 0.05. Therefore the findings reveal that there is a positive
correlation between employee perception of brand loyalty and employee engagement.
6.3.3 Perceived Brand Quality
Section C comprised of three questions regarding the perceived brand quality of the
company they work for, the questions that were asked were as follows: “in comparison
to alternative brands my company has high quality service”, “in comparison to
alternative supplier brands my company has consistent quality service”, and lastly “in
comparison to alternative supplier brands my company is the best”. The perceived
brand quality construct measured “intangible elements or simply a feeling towards a
brand, which would not only be constrained within the performance, feature, price, and
other quality dimensions of the brand” (Tsang, Lee & Li, 2011). Gronroos (1988) points
out that when experience meets expectations, consumers tend to perceive the quality
Page | 65
of the brand to be good. This implies that organisations need to meet expectations
whether it be consumers or employees as this will create a good perception about the
organisation’s brand.
The results show that the mean value is 1.99 indicating a favourable response. The
findings of this research therefore indicate that within companies, employees perceive
the quality of the brand they work for to be good. As discussed in the literature review,
Mallon (2012) states that there are six tips that help with the disparity of the brand and
how employees perceive the brand:
Audit Internal Communications – Organisations need to align their
communication material with their brand identity and promise.
Train Employees – Educate employees once they are hired and reinforce the
message throughout their journey.
Establish a Social Media Policy – To prevent a branding crisis via social
media, organisations need to establish rules and regulations regarding what is
allowed to be shared with the public.
Regularity Reassess – Organisations need to ensure that employees
understand the brand and have the appropriate resources to deliver the brand
promise.
Reward Performance – Organisations need to reward employees that deliver
the brand’s promise to customers as this will create encouragement amongst
employees.
Give Employees a Voice – Employees should be encouraged to create new
ideas on how to deliver brand communication messages. Employees feel a
sense of belonging and importance when they get the opportunity to express
their opinions and ideas.
Three tests were conducted: a Cronbach’s alpha test, factor analysis and correlation
analysis. A Cronbach’s alpha test was conducted on brand quality in order to check the
reliability of an ordinal scale. The results show that brand quality has a Cronbach’s
alpha of 0.854 which means that the three brand quality questions have good internal
consistency and reliability. A factor analysis determines the variance of brand quality.
The results show that brand quality has a variance of 78%.
The last test done was a correlation analysis which aims to answer the first research
question, according to Table 24 brand quality has significant positive correlation to
Page | 66
most employee engagement attributes except for four attributes: “At work do your
opinions seem to count?”, “In the last seven days have you received recognition or
praise for doing good work?”, Do you have a best friend at work?”, and “Do you know
what is expected of you at work?”. These four attributes have p-values which are
greater than 0.05. Therefore the findings reveal that there is a positive correlation
between employee perception of brand quality and employee engagement.
6.3.4 Brand Leadership
Section C comprised of three questions regarding brand leadership. The questions that
were asked were as follows: “in comparison to alternative supplier brands my company
is growing in popularity”, “in comparison to alternative supplier brands my company is
innovative”, and lastly “in comparison to alternative supplier brands my company is the
leading brand”. The brand leadership construct measured three elements: innovation in
comparison to competitors, popularity in comparison to competitors and lastly brand
leadership in comparison to competitors.
The results show that the mean value is 1.96 indicating a favourable response. The
findings of this research therefore indicate that within companies, employees believe
the brand they work for has high leadership in terms of popularity, innovation and
leadership. Brand leadership is therefore defined as managers that have distinctive
talents that are focused on fulfilling “customers and investors” expectations. The
leadership brand is entrenched into the culture of the organisation through its “policies
and its requirements for employees” (Ulrich & Smallwood, 2007). Building a leadership
brand requires organisations to follow five principles (Ulrich & Smallwood, 2007). The
first principle is to set strategies that will meet the goals and objectives of an
organisation and to recruit the correct employees. The second principle is to ensure
that managers internalise high expectations that are perceived by customers. The third
principle is to evaluate leaders according to external perceptions. The fourth principle is
to provide leadership skills to leaders within organisations so that they can fulfil
external expectations. The last principle states that organisations need to track the
leadership brand over the long term (Ulrich & Smallwood, 2007).
Three tests were conducted: a Cronbach’s alpha test, factor analysis and correlation
analysis. A Cronbach’s alpha test was conducted on brand leadership in order to check
the reliability of an ordinal scale. The results show that brand leadership has a
Cronbach’s alpha of 0.828 which means that the three brand leadership questions
Page | 67
have good internal consistency and reliability. A factor analysis determines the
variance of brand leadership. The results show that brand leadership has a variance of
75%.
The last test done was a correlation analysis which aims to answer the first research
question, according to Table 25 brand leadership has significant positive correlation to
most employee engagement attributes except for one attribute: “In the last six months,
has someone at work talked to you about your progress”. The attribute has a p-values
which are greater than 0.05. Therefore the findings reveal that there is a positive
correlation between employee perception of brand leadership and employee
engagement.
6.3.5 Perceived brand value
Section C comprised of two questions regarding the perceived brand value of the
company employee’s work for. The questions that were asked were as follows: “my
company provides good value for money” and “my company is the leading brand”. The
perceived brand value construct measured the added value endowed on products and
services, reflected in how employees think, feel, and act with respect to the brand, as
well as the prices, market share, and profitability the brand commands for the firm
(Kotler and Keller, 2009).
The results show that the mean value is 2.00 indicating a favourable response. The
findings of this research therefore indicate that within companies, employees believe
the brand they work for has high value. Respondents have high employee engagement
levels which could have increased the value of the brand they work for. According to
research done by the Performance Improvement Council (2012) engaged employees
have enormous impact in positively affecting brand value. According to research done
by the Gallup Organisation, strong brands with high employee engagement levels have
3.9 times the earnings per share compared to organisation with low employee
engagement levels (Performance Improvement Council, 2012). Another study done by
Towers and Watson indicates that employee engagement has a positive influence on
financial performance; there is a 5.75% difference with regards to operating margins
and 3.44% difference in net profit margins (Performance Improvement Council, 2012).
Three tests were conducted: a Cronbach’s alpha test, factor analysis and correlation
analysis. A Cronbach’s alpha test was conducted on brand value in order to check the
reliability of an ordinal scale. The results show that brand value has a Cronbach’s alpha
Page | 68
of 0.718 which means that the two brand value questions have good internal
consistency and reliability. A factor analysis determines the variance of brand value.
The results show that brand value has a variance of 78%.
The last test done was a correlation analysis which aims to answer the first research
question, according to Table 26 brand value has significant positive correlation to most
employee engagement attributes except for two attributes: “Do you have a best friend
at work?” and “Do you know what is expected of you at work?”. These two attributes
have p-values which are greater than 0.05. Therefore the findings reveal that there is a
positive correlation between employee perception of brand value and employee
engagement.
6.3.6 Brand Personality
Section C comprised of two questions regarding brand personality: “my company has a
personality” and “my company is interesting”. The brand personality construct
measured human attributes that are applied to a brand. Brand personality forms a
competitive advantage within organisations by building trust, commitment and strong
relationships between the organisation and the consumer (Sorensen, 2011). Jennifer
Aaker identified five brand personality traits: (1) sincerity, (2) excitement, (3)
competence, (4) sophistication, and (5) ruggedness.
The results show that the mean value is 2.00 indicating a favourable response. The
findings of this research therefore indicate that within companies, employees believe
the brand they work for has a strong personality. Corporate brand personality is about
employee perception of the actions, words and values of an organisation and can be
characterised into three attributes: affective (the “heart” of an organisation), cognitive
(the “mind” of an organisation) and conative (the “body” an organisation) (Keller &
Richey, 2006). These three attributes are distinctive personality traits that are used to
guide employees within an organisation and influence how employees will view the
organisation (Keller & Richey, 2006). With this said, the favourable response from the
results may mean that all seven organisations used the three corporate brand
personality attributes in order to alter employees’ perceptions about the brand they
work for.
Three tests were conducted: a Cronbach’s alpha test, factor analysis and correlation
analysis. A Cronbach’s alpha test was conducted on brand personality in order to
check the reliability of an ordinal scale. The results show that brand personality has a
Page | 69
Cronbach’s alpha of 0.799 which means that the two brand personality questions have
good internal consistency and reliability. A factor analysis determines the variance of
brand personality. The results show that brand personality has a variance of 83%.
The last test done was a correlation analysis which aims to answer the first research
question. According to Table 27 brand personality has significant positive correlation to
most employee engagement attributes except for three attributes: “At work do your
opinions seem to count?”, “Do you have a best friend at work?”, and “Do you know
what is expected of you at work?”. These three attributes have p-values which are
greater than 0.05. Therefore the findings reveal that there is a positive correlation
between employee perception of brand personality and employee engagement.
6.3.7 Brand Organisation
Section C comprised of four questions regarding the brand’s organisation. The
questions that were asked were: “I would trust my company”, “my company is a good
corporate citizen”, “my company is socially responsible” and lastly “my company cares
about its customers”. The brand organisation construct looked beyond the brand, a
name, term, sign, symbol or design used to differentiate goods or services from
competitors (American Marketing Association, 1960) and instead measured to what
extent the organisation was socially responsible, its corporate citizenship and if the
organisation cares for its customers.
The results show that the mean value is 1.81 indicating a favourable response. The
findings of this research therefore indicate that within companies, employees believe
the brand they work for has a strong organisational brand in terms of corporate
citizenship, social responsibility and caring for its customers. According to research
done by Bhattacharaya, Sen and Korschun (2008), corporate citizenship has a positive
influence on employee engagement and in order to increase employee engagement
levels organisations need to focus on improving corporate citizenship, caring for the
well-being of an organisations stakeholders and the environment (Glavas & Piderit,
2009). The result reveal a favourable response which indicates employees from the
seven organisations believe that their organisation has corporate citizenship, according
to Ketvirtis (2012) the most important attributes of corporate citizenship as perceived by
employees are energy efficiency initiatives, social innovation opportunities and
employee charitable contribution matching programmes.
Page | 70
Three tests were conducted: a Cronbach’s alpha test, factor analysis and correlation
analysis. A Cronbach’s alpha test was conducted on brand organisation in order to
check the reliability of an ordinal scale. The results show that brand organisation has a
Cronbach’s alpha of 0.849 which means that the four brand personality questions have
good internal consistency and reliability. A factor analysis determines the variance of
brand organisation. The results show that brand organisation has a variance of 69%.
The last test done was a correlation analysis which aims to answer the first research
question, according to Table 28 brand organisation has significant positive correlation
to most employee engagement attributes except for four attributes: “In the last seven
days have you received recognition or praise for doing good work?”, “In the last six
months has someone at work talked to you about your progress?”, “Do you have a best
friend at work?” and lastly “Do you know what is expected of you at work?”. These four
attributes have p-values which are greater than 0.05. Therefore the findings reveal that
there is a positive correlation between employee perception of brand organisation and
employee engagement.
6.3.8 Brand Differentiation
Section C comprised of only one brand differentiation question. The question that was
asked was: “my company is basically the same as competing brands”. The brand
differentiation construct measured the ability of the organisation to establish new
market segments by providing new product offerings to consumers (Kotler et al., 2007).
The results show that the mean value is 2.69 indicating a favourable response. The
findings of this research therefore indicate that within companies, employees believe
the brand they work is the same as competing brands. The findings reveal that
organisations lack differentiation, Aaker (2004) supports the findings by stating that
organisations find it difficult to differentiate themselves from competitors because it is
challenging to find appropriate features that add value to a brand and because it is
costly to differentiate. The results reveal that the seven organisations can differentiate
themselves further by offering a wide range of products and a variety of marketing
variations, to increase sales and ultimately increase profitability (Kotler et al., 2007).
The Cronbach’s alpha test and the factor analysis test could not be conducted on
brand organisation as this construct only has one variable.
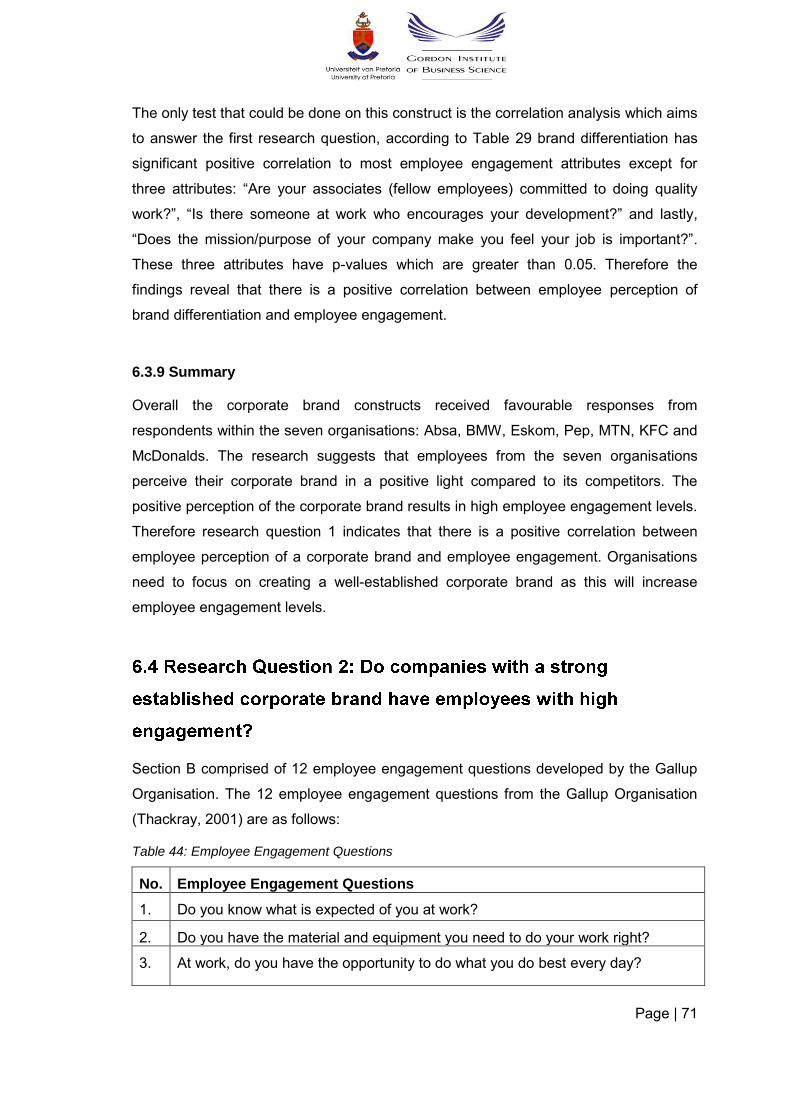
Page | 71
The only test that could be done on this construct is the correlation analysis which aims
to answer the first research question, according to Table 29 brand differentiation has
significant positive correlation to most employee engagement attributes except for
three attributes: “Are your associates (fellow employees) committed to doing quality
work?”, “Is there someone at work who encourages your development?” and lastly,
“Does the mission/purpose of your company make you feel your job is important?”.
These three attributes have p-values which are greater than 0.05. Therefore the
findings reveal that there is a positive correlation between employee perception of
brand differentiation and employee engagement.
6.3.9 Summary
Overall the corporate brand constructs received favourable responses from
respondents within the seven organisations: Absa, BMW, Eskom, Pep, MTN, KFC and
McDonalds. The research suggests that employees from the seven organisations
perceive their corporate brand in a positive light compared to its competitors. The
positive perception of the corporate brand results in high employee engagement levels.
Therefore research question 1 indicates that there is a positive correlation between
employee perception of a corporate brand and employee engagement. Organisations
need to focus on creating a well-established corporate brand as this will increase
employee engagement levels.
Section B comprised of 12 employee engagement questions developed by the Gallup
Organisation. The 12 employee engagement questions from the Gallup Organisation
(Thackray, 2001) are as follows:
Table 44: Employee Engagement Questions
No. Employee Engagement Questions
1. Do you know what is expected of you at work?
2. Do you have the material and equipment you need to do your work right?
3. At work, do you have the opportunity to do what you do best every day?
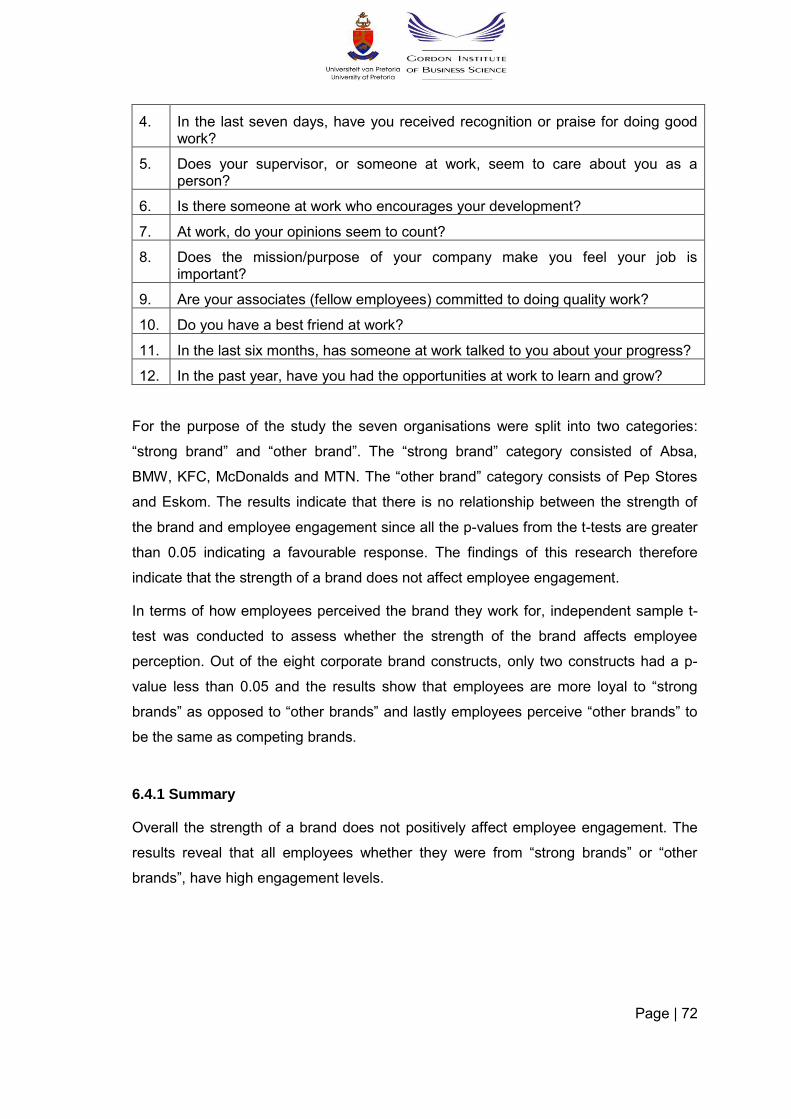
Page | 72
4. In the last seven days, have you received recognition or praise for doing good work?
5. Does your supervisor, or someone at work, seem to care about you as a person?
6. Is there someone at work who encourages your development?
7. At work, do your opinions seem to count?
8. Does the mission/purpose of your company make you feel your job is important?
9. Are your associates (fellow employees) committed to doing quality work?
10. Do you have a best friend at work?
11. In the last six months, has someone at work talked to you about your progress?
12. In the past year, have you had the opportunities at work to learn and grow?
For the purpose of the study the seven organisations were split into two categories:
“strong brand” and “other brand”. The “strong brand” category consisted of Absa,
BMW, KFC, McDonalds and MTN. The “other brand” category consists of Pep Stores
and Eskom. The results indicate that there is no relationship between the strength of
the brand and employee engagement since all the p-values from the t-tests are greater
than 0.05 indicating a favourable response. The findings of this research therefore
indicate that the strength of a brand does not affect employee engagement.
In terms of how employees perceived the brand they work for, independent sample t-
test was conducted to assess whether the strength of the brand affects employee
perception. Out of the eight corporate brand constructs, only two constructs had a p-
value less than 0.05 and the results show that employees are more loyal to “strong
brands” as opposed to “other brands” and lastly employees perceive “other brands” to
be the same as competing brands.
6.4.1 Summary
Overall the strength of a brand does not positively affect employee engagement. The
results reveal that all employees whether they were from “strong brands” or “other
brands”, have high engagement levels.
Page | 73
Section A of the questionnaire asked respondents questions regarding their gender,
education qualification, and years employed at their current job. With regards to the
respondent’s gender, the results reflect that out of the 150 respondents, 87
respondents were female and the remaining 63 respondents were male. Based on the
large sample size, generalisations and inference can be made that employees who
work with customers were predominantly female.
There are slightly more women than men in service businesses and companies that
require employees to communicate face-to-face with customers. The reason for this is
that women possess social skills and qualities such as, “caring, communicating and
making people feel good”, and organisations now find these qualities highly important
and therefore employ females to deal with customers (Belt, Richardson & Webster,
2002).
In terms of highest education qualification, the results in Table 6 reflect that the most
respondents were individuals with secondary/high school qualifications. Only three
respondents stated that they have a Master’s degree which agrees with the literature
that states that individuals refuse to study further due to the costs of purchasing a
Master’s degree and the time that it will take to complete a Master’s degree.
The results from Table 7 – Years employed at current job, indicate the range as
between 1 and 14 years, with the most common response being employed at current
job between 1 to 3 years. 1% of respondents stated that they have been employed at
their current job for 12 to 13 years which agrees with Kenny from Forbes magazine, as
she states that the annual rate of turnover is about 15%, which is classified as normal
and healthy and one does not need to worry (Schreiner, 2012).
Independent sample t-tests were conducted on employee engagement attributes to
assess whether engagement was dependent on demographic factors. The results
show that the only demographic factor that could be used was gender as the other
demographic factors had very few cases. The results of the gender reveal that 11
employee engagement attributes had no significant difference by gender, the only
attribute that had a significant difference was the attribute that asked respondents “Do
you know what is expected of you at work?”, males had a p-value that was significantly
Page | 74
higher than females. Therefore the research reveals that females know more regarding
what is expected of them at work than males.
6.5.1 Summary
Overall demographic factors do not play a role in employee engagement.
Page | 75
7. CONCLUSION AND RECOMMENDATIONS
Corporate branding was defined by Foster, Punjaisri & Cheng (2010) as “the
systematic planned management of behaviours, communication, and symbolism in
order to attain a favourable and positive reputation with target audiences of an
organisation”. Harris and de Chernatony (2001) state that: “employees have the
potential to make or break the corporate brand”. It is therefore critical that every
employee within an organisation understands what the corporate brand values stand
for. This research investigated the impact of employees’ perception of a corporate
brand on employee engagement. The research questions tested the correlation
between employee engagement and corporate branding, the strength of a corporate
brand on employee engagement and demographical factors that may impact employee
engagement.
The research findings have considerable impact on organisations, especially in human
resources and marketing departments, which focus on improving employee
engagement and corporate branding. The implications of this study are found within the
discovery of the positive correlation between employee engagement and corporate
branding. The research discovered that if employees have a positive perception about
the corporate brand they work for, their employee engagement levels increase.
In terms of corporate branding, brand managers should focus on improving the
underlying variable: brand awareness, brand loyalty, perceived brand quality, brand
leadership, perceived brand value, brand personality, brand organisation and brand
differentiation to improve the corporate branding within organisations.
Brand awareness measures the ability of employees to recall the brand they work for in
detail which assists with acquiring a product or service (Kotler & Keller, 2006). Arruda
(2002) states that once the brands objectives are discussed, employees will generate
brand awareness. A good Brand Communications Programme consists of six steps
(Arruda, 2002): brand awareness (employees need to understand the organisation’s
Page | 76
brand through a collaborative effort with the marketing department, human resource
department and the operations team), education (deepen employees’ understanding of
the brand by communicating brand values and qualities), buy in (create brand
objectives and goals for each employee), actions (employees should participate in
brand contests as this will encourage employees to take full responsibility of the brand),
results (show your employees the results of their actions, this will motivate them to rally
to the cause) and lastly, recognition (the best way to reinforce positive brand actions is
to recognise and reward success).
Brand loyalty measured employees’ commitment level to the brand they work for and
their ability to repeat purchases over time. In terms of the brand loyalty construct, the
following three “secrets” can be used to increase brand loyalty (Michalowicz, 2012):
Evaluate (employers need to recruit individuals who are naturally loyal), reciprocate (to
encourage loyalty amongst employees, leaders need to be loyal to their employees and
provide financial and non-financial rewards) and simplify (employers must remove all
barriers that prevent employees from achieving goals and objectives).
Perceived brand quality measured “intangible elements or simply a feeling towards a
brand, which would not only be constrained within the performance, feature, price, and
other quality dimensions of the brand” (Tsang, Lee & Li, 2011). Mallon (2012) states
that there are six tips that help with the disparity of the brand and how employees
perceive the brand: audit internal communications, train employees, establish a social
media policy, regularity reassess, reward performance and lastly, give employees a
voice.
Brand leadership is defined in terms of the profitability of an organisation.
Organisations that have a higher market share have higher profits. Leading brands also
have lower costs due to the principle of economies of scale (De Chernatony, McDonald
and Wallace, 2011). Burkitt and Zealley (2006, as cited in De Chernatony, McDonald
and Wallace, 2011) exploded research regarding the characteristics of high performing
brands and discovered that they all have three common characteristics: measure and
evaluate marketing activities and outcomes, recruit and train individuals with analytical
skills and lastly focus on business outcomes and link the data to common key
performance indicators.
Perceived brand value is defined as, “the added value endowed on products and
services, reflected in how consumers think, feel, and act with respect to the brand, as
well as the prices, market share, and profitability the brand commands for the firm.”
Page | 77
(Kotler and Keller, 2009). Organisations build brand equity by creating the correct
brand knowledge structures with the right target market (Kotler & Keller, 2009). There
are three main sets of brand equity drivers: brand elements (brand names, URLs,
logos, symbols, characters, spokespeople, slogans, jingles, packages and signage),
the products and services and all the accompanying marketing activities and
supporting marketing programmes and lastly, other associations indirectly transferred
to the brand by linking it to some other entity (a person, place or thing).
Brand personality measured human attributes that are applied to a brand. Jennifer
Aaker identified five brand personality traits that are essential for a brand: (1) sincerity,
(2) excitement, (3) competence, (4) sophistication, and (5) ruggedness. Organisations
need to create a long and lasting brand personality as it encourages brand loyalty from
target customers (Lin, 2010).
Brand organisation looked beyond the brand, a name, term, sign, symbol or design
used to differentiate goods or services from competitors (American Marketing
Association, 1960) and instead measured to what extent the organisation was socially
responsible, its corporate citizenship and if the organisation cares for its customers.
Andriof, Waddock, Husted and Rahman (2002) state that corporate citizenship not only
increases corporate reputation but also acts as a form of competitive advantage which
benefits an organisation financially. In order to increase corporate reputation,
organisations need to take part in five activities: “retain employees to avoid
redundancies, assist in the development of employment programmes for the
unemployed in the local region, focus on increasing the use of recyclable materials in
their manufacturing processes, become industry leaders in developing environmentally
sustainable business practices and lastly subsidise and maintain services to rural
communities.”
Brand differentiation measured the ability of the organisation to establish new market
segments by providing new product offerings to consumers (Kotler et al., 2007). Dibb
and Simkin (1997) have developed a segmentation process that involves three stages:
marketing analysis, strategy development and marketing programmes. When starting
out the segmentation process, organisations need to establish clear objectives, as this
will provide a clear direction of issues to be addressed and issues to be researched.
The segmentation process is an ongoing cycle, which begins with the analysis strategic
link, this link talks about marketing intelligence and states that individuals in charge of
making strategic decisions should understand the marketing intelligence. The next link
Page | 78
is the strategic programme link, which states that organisations need to develop
programmes that reflect the strategy and the appropriate target market. The last link is
the programmes analysis link, which states that organisations should develop
marketing programmes that not only fulfil marketing strategies but also change the
status quo. The results will change consumers’ perception and behaviour and therefore
further research needs to be undertaken to monitor consumers and competitors (Dibb
and Simkin, 1997).
This research on the perception of corporate branding and employee engagement was
conducted within seven organisations, of which only two were categorised as “other
brands” and the remaining five organisations were categorised as “strong brands”. This
needs to be considered when generalising the results across other organisations, as
only 33 respondents out of the 150 respondents were from “other brands”. Further the
researcher made use of non-probability convenience sampling: all employees that were
employed by the seven organisations, irrespective of their position within the
organisation, were potential respondents.
This study has a geographical reach limited to Johannesburg, South Africa. The study
was thus limited to 150 respondents. In terms of the research instrument, a self-
selection bias may be present within this study as employees may feel strongly about
the corporate brand constructs and employee engagement levels when measured in
terms of the organisation they work for.
Future research should investigate what brands in South Africa are least preferred
according to consumers, as there is little research in this field. In order to make an
effective comparison between “strong brands” and “other brands”, future research
should improve the response rate of “other brands” or less preferred brands in South
Africa and have an even split between the two categories.
Corporate branding was described as “the systematic planned management of
behaviours, communication, and symbolism in order to attain a favourable and positive
reputation with target audiences of an organisation” (Foster, Punjaisri & Cheng, 2010).
This study focused on identifying if employee perception of a corporate brand could
Page | 79
positively affect employee engagement. The research discovered that if organisations
develop a well-established corporate brand in terms of brand awareness, brand loyalty,
perceived brand quality, brand leadership, perceived brand value, brand personality,
brand organisation and brand differentiation, employee engagement levels will
positively increase and ultimately improve employee performance and attitudes, which
will enhance the firm’s competitiveness and minimise absenteeism and employee
turnover.
Page | 80
8. REFERENCE LIST
Aaker, D. A. (2004). Brand portfolio strategy: Creating relevance, differentiation,
energy, leverage and clarity. USA: The Free Press.
Aaker, D. A. (1996). Building strong brands. New York: The Free Press.
Aaker, D. A. (1991). Managing brand equity. New York: The Free Press.
Absa. (2012). All about ABSA. Retrieved from http://www.absa.co.za
Andriof, J., Waddock, S., Husted, B., & Rahman, S. S. (2002). Unfolding stakeholder
thinking: Theory, responsibility and engagement with a foreword by R. Edward
Freeman. UK: Greenleaf.
American Marketing Association. (1960). Marketing definitions: A glossary of marketing
terms. Chicago, IL: Author.
Arruda, W. (2002). More than employees: Brand evangelists. Retrieved from
http://www.reachcc.com/reachdotcom.nsf/bdf8f1dec3dadac0c1256aa700820c2c/2a0bb
ea191bfe06cc1256b4200719d06!OpenDocument
Attridge, M. (2009). Measuring and managing employee work engagement: A review of
the research and business literature. Journal of Workplace Behavioural Health, 24(4),
383-398, doi: 10.1080/15555240903188398
Awards & Accolades. (2010). Award list: Year 2011. Retrieved from
http://www.mcdonaldsindia.com/aboutus/awards-and-accolades.html
Banutu-Gomez, M. B., Coyle, P. T., Edenhoech, S. J., Fallucca, K. A., Minetti, C. M., &
Sarin, M. M. (2009). International branding effectiveness: The global image of Nestle’s
brand name and employee perception of strategies and brands. Journal of Global
Business Issues, 3(2), 17-24.
Belt, V., Richardson, R., & Webster, J. (2002). Women, social skills and interactive
service work in telephone call centres. New Technology, Work and Employment 17(1),
20-21. doi:0268-1072
Bernstein, D. A., Penner, L. A., Clarke-Stewart, A. C., & Roy, E. J. (2006). Psychology
(7th ed.). New York: Houghton Mifflin Company.
Bhattacharya, C. B., Sen, S., & Korschun, D. (2008). Using corporate social
responsibility to win the war for talent. MIT Sloan Management Review, 49(2), 37-44.
Page | 81
Brand Directory. (2011). McDonald’s brand performance. Retrieved from
http://brandirectory.com/profile/mcdonalds/
Burmann, C., & Zeplin, S. (2005). Building brand commitment: A behavioural approach
to internal brand management. Journal of Brand Management, 12(4), 297-300.
Catteeuw, F., Flynn, E., & Vonderhorst, J. (2007). Employee engagement: Boosting
productivity in turbulent times. Organization Development Journal, 25(2), 151-157.
Corporate Leadership Council. (2002). Building the high-performance workforce [White
Paper]. Washington, DC: Author.
Corporate Leadership Council. (2004). Driving performance and retention through
employee engagement. Washington, DC: Corporate Executive Board.
Cunningham, E. (2012). BMW crowned most valuable brand. Retrieved from
http://www.iol.co.za/motoring/cars/bmw/bmw-crowned-most-valuable-brand-
1.1302830#.UAU0mlKpOSo
De Chernatony, L., McDonald, M., & Wallace, E. (2001). Creating powerful brands (4th
edition). UK: Elsevier.
Dibb, S., & Simkin, L. (1997). A program for implementing market segmentation.
Journal of Business & Industrial Marketing, 12(1), 51-65.
Durkin, D. (2010, April14). Brand loyalty starts from the inside: an interview with Diane
Durkin [Web log post]. Retrieved from http://www.businesspundit.com/brand-loyalty-
start-from-the-inside-an-interview-with-diane-durkin/
Erate. (2011). Bottom 10 companies on erate. Retrieved from
http://www.erate.co.za/BottomRated.aspx
Eskom. (2012). Company information. Retrieved from
http://www.eskom.co.za/c/40/company-information/
eThekwini Municipality. (2011). Information on lad shedding. Retrieved from
http://www.durban.gov.za/City_Services/electricity/Load_Shedding/Pages/default.aspx
Fleming, J. H., & Asplund, J. (2007). Human sigma: Managing the employee-customer
encounter
Fleming, J.H., Coffman, C., & Harter, J. K. (2005). Manage your human sigma. Harvard
Business Review, 83(7/8), 106-114.
Page | 82
Gallup. (2012). Gallup Q12 employee engagement findings. Retrieved from
http://paulsohn.org/gallups-q12-employee-engagement-findings/
Glavas, A., & Piderit, S. K. (2009). How does doing good matter?: Effects of corporate
citizenship on employees. Journal of Corporate Citizenship, 1(36), 51-70.
Gronroos, C. (1988). Service quality: The six criteria of good perceived service quality.
Review of Business, 9(3), 10-13.
Harris, F., & de Chernatony, L. (2001). Corporate branding and corporate brand
performance. The European Journal of Marketing, 35(3), 441-435.
Hatch, M. J., & Schultz, M. (2001). Are the strategic stars aligned for your corporate
brand? Harvard Business Review, 79(2), 128-134.
Harter, J. K., Schmidt, F. L., & Keyes, C. L. M. (2003). Well-being in the work place and
its relationship to business outcomes: A review of the Gallup studies. In C. L. M. Keyes
& J. Haidt (Eds.), Flourishing: Positive psychology and the life well-lived (pp.205-224).
Washington, DC: American Psychological Association.
Irwin, R. (2002). Pep recharged. Retrieved from
http://www.brandchannel.com/features_profile.asp?pr_id=100
Keller, K. L., & Richey, K. (2006). The importance of corporate brand personality traits
to a successful 21st century business. Journal of Brand Management, 1(14), 74-81.
doi:10.1057/palgrave.bm.2550055
Ketvirtis, S. (2012). How corporate citizenship impacts employee engagement.
Retrieved from http://www.sesp.northwestern.edu/msloc/knowledge-
lens/stories/2012/how-corporate-citizenship-impacts-employee-engagement.html
KFC. (2012). Company info. Retrieved from http://www.kfc.co.za/company_info/
Khan, Y. (2011). Sunday Times top brands awards 2011, all the top brands in South
Africa. Retrieved from http://pcbunny.co.za/2011/08/06/sunday-times-top-brands-
awards-2011-all-the-top-brands-in-south-africa/
Konrad, A. M. (2006, March/April). Engaging employees through high involvement work
practices. Ivey Business Journal Online, 1-6. Retrieved from
www.iveybusinessjournal.com
Kotler, P., Brown, L., Adam, S., Burton, S., Armstrong, G. (2007). Marketing 7th Edition.
Australia: Pearson Education Australia.
Page | 83
Lin, L. Y. (2010). The relationship of consumer personality trait, brand personality and
brand loyalty: an empirical study of toys and video games buyers. Journal of Product &
Brand Management, 19(1), 4-17.
Little, M. M., & Dean, A. M. (2006). Links between service climate, employee
commitment and employees service quality capability. Managing Service Quality,
16(5), 460-476.
Lockwood, N. R. (2007). Leveraging employee engagement for competitive advantage:
HR’s strategic role. The Society of Human Research Management, 1-10.
Lund, A., & Lund, M. (2010). Simple random sampling. Retrieved from
http://dissertation.laerd.com/articles/simple-random-sampling-an-overview.php
Ma, K. L., & Lai, I. K. W. (2010). Framework development for workforce perception on
organisational identity as antecedent for job satisfaction and behavioural reactions.
Retrieved January 18, 2012, from academic-papers.org/ocs2/session/Papers/B7/912-
2018-1-DR.doc
Mallon, S. (2012). How do your employees see your brand? Retrieved from
www.b2binsights.com/how-do-your-employees-see-your-brand/
McLeod, D., & Clarke, N. (2009). Engaging for success: Enhancing performance
through employee engagement. UK: Crown.
Michalowicz, M. (2012). The 3 secrets to extremely loyal employees. Retrieved from
http://www.openforum.com/articles/the-3-secrets-to-extremely-loyal-employees
MTN. (2010). MTN brand values. Retrieved from
http://www.mtn.com/MTNGROUP/About/Pages/BrandValues.aspx
MTN. (2011). MTN brand rated as most valuable on continent. Retrieved from
http://www.mtn.co.za/AboutMTN/Press%20Room/Current%20Press%20Releases/Febr
uary2011/Pages/MTNbrandratedasmostvaluableonContinent.aspx
Nokia Siemens Network. (2008). Employee engagement. Retrieved May 1, 2012, from
www.nokiasiemensnetworks.com/global/AboutUs/Careers/Why+join+us/Employee+En
gagement.htm?languagecode=en
Pappu, et al. (2005). Consumer-based brand equity and country-of-origin relationships-
some empirical evidence. Journal of Product & Brand Management. Volume 14,
number 3.
Page | 84
Performance Improvement Council. (2012). Employee engagement and its impact on
brand value. Retrieved from www.eim-
inc.com/Libraries/pdfs/EmployeeEngagementPIC.sflb.ashx
Rath, T., & Cronchie, B. (2009). Strengths based leadership: Great leaders, teams and
why people follow. New York: Gallup Press.
Reichheld, F., & Sasser, W. E. (1990). Zero defections. Harvard Business Review,
68(1), 105-11.
Richards, L. (2012). Effects of low employee morale. Retrieved January 9, 2012, from
http://smallbusiness.chron.com/effects-low-employee-morale-1768.html
Robertson-Smith, G., & Markwick, C. (2009). Employee engagement: A review of
current thinking. United Kingdom: Institution for Employment Studies.
Saunders, M., Lewis, P., & Thornhill, A. (2009). Research methods for business
students (5th ed.). United Kingdom: Pearson Education Limited.
Schreiner, E. (2012. What is healthy employee turnover rate? Retrieved from
http://smallbusiness.chron.com/healthy-employee-turnover-rate-12145.html
Shuttleworth, M. (2008). Quantitative research design. Retrieved from
http://www.experiment-resources.com/quantitative-research-design.html
Soldati, P. (2007). Employee engagement: what exactly is it. Retrieved January 10,
2012, from http://www.management-issues.com/2007/3/8/opinion/employee-
engagement-what-exactly-is-it.asp
Spark, J. (2004). Recognise your brands true value. Executive Business Brief, 9(2), 6-
7.
Stealing Share. (2010). BMW brand study. Retrieved from
http://www.stealingshare.com/content/1148328698453.htm
Stuff, R. (2008). Vodaphone’s entertaining employee-engagement strategy. IRS
Employment Review, 896.
Thackray, J. (2001, March 15). Feedback for real. Gallup Management Journal.
Retrieved November 15, 2006, from http://gmj.gallup.com.
The Sunday Times. (2011). All the 2011 Sunday Times top brands. Retrieved from
http://www.bizcommunity.com/Article/196/82/62638.html
Page | 85
Towers Perrin. (2008). 2007-2008 Towers Perrin global engagement workforce study
[White Paper]. Stamford, CT: Author.
Tsang, N. K. F., Lee, L. Y. S., & Li, F. X. H. (2011). An examination of the relationship
between employee perception and hotel brand equity. Journal of Travel and Tourism
Marketing, 28(5), 481-497, doi: 10.1080/10548408.2011.588108
Ulrich, D., & Smallwood, N. (2007). Harvard business review: Building a leadership
brand. Retrieved from http://hbr.org/2007/07/building-a-leadership-brand/ar/1
Urde, M. (1999). Brand orientation: a mind set for building brands into strategic
resources. Journal of Marketing Management, 15(1), 117-133.
Zaineb, A. (2010). The drawbacks of low employee engagement. Retrieved January 9,
2012, from http://blog.commlabindia.com/elearning/low-employee-engagement
Weber, L. (2009). Marketing to the social web. John Wiley & Sons: New York.
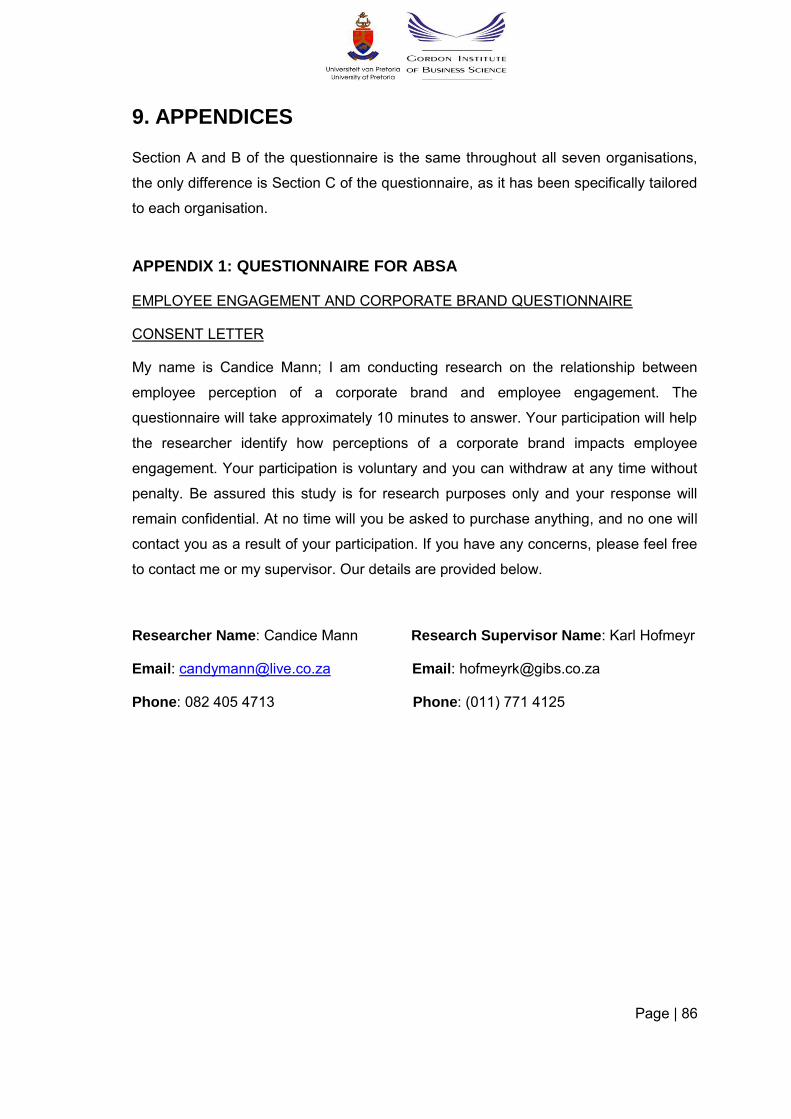
Page | 86
9. APPENDICES
Section A and B of the questionnaire is the same throughout all seven organisations,
the only difference is Section C of the questionnaire, as it has been specifically tailored
to each organisation.
APPENDIX 1: QUESTIONNAIRE FOR ABSA
EMPLOYEE ENGAGEMENT AND CORPORATE BRAND QUESTIONNAIRE
CONSENT LETTER
My name is Candice Mann; I am conducting research on the relationship between
employee perception of a corporate brand and employee engagement. The
questionnaire will take approximately 10 minutes to answer. Your participation will help
the researcher identify how perceptions of a corporate brand impacts employee
engagement. Your participation is voluntary and you can withdraw at any time without
penalty. Be assured this study is for research purposes only and your response will
remain confidential. At no time will you be asked to purchase anything, and no one will
contact you as a result of your participation. If you have any concerns, please feel free
to contact me or my supervisor. Our details are provided below.
Researcher Name: Candice Mann Research Supervisor Name: Karl Hofmeyr
Email: [email protected] Email: [email protected]
Phone: 082 405 4713 Phone: (011) 771 4125
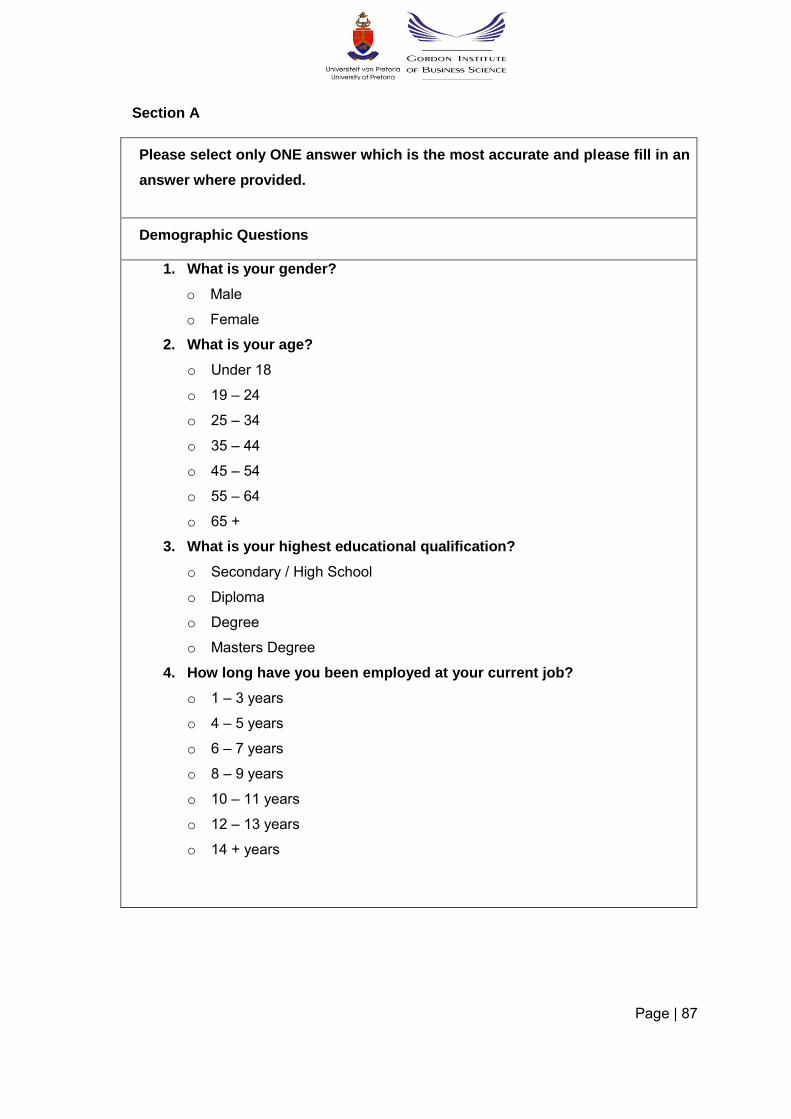
Page | 87
Section A
Please select only ONE answer which is the most accurate and please fill in an
answer where provided.
Demographic Questions
1. What is your gender?
o Male
o Female
2. What is your age?
o Under 18
o 19 – 24
o 25 – 34
o 35 – 44
o 45 – 54
o 55 – 64
o 65 +
3. What is your highest educational qualification?
o Secondary / High School
o Diploma
o Degree
o Masters Degree
4. How long have you been employed at your current job?
o 1 – 3 years
o 4 – 5 years
o 6 – 7 years
o 8 – 9 years
o 10 – 11 years
o 12 – 13 years
o 14 + years
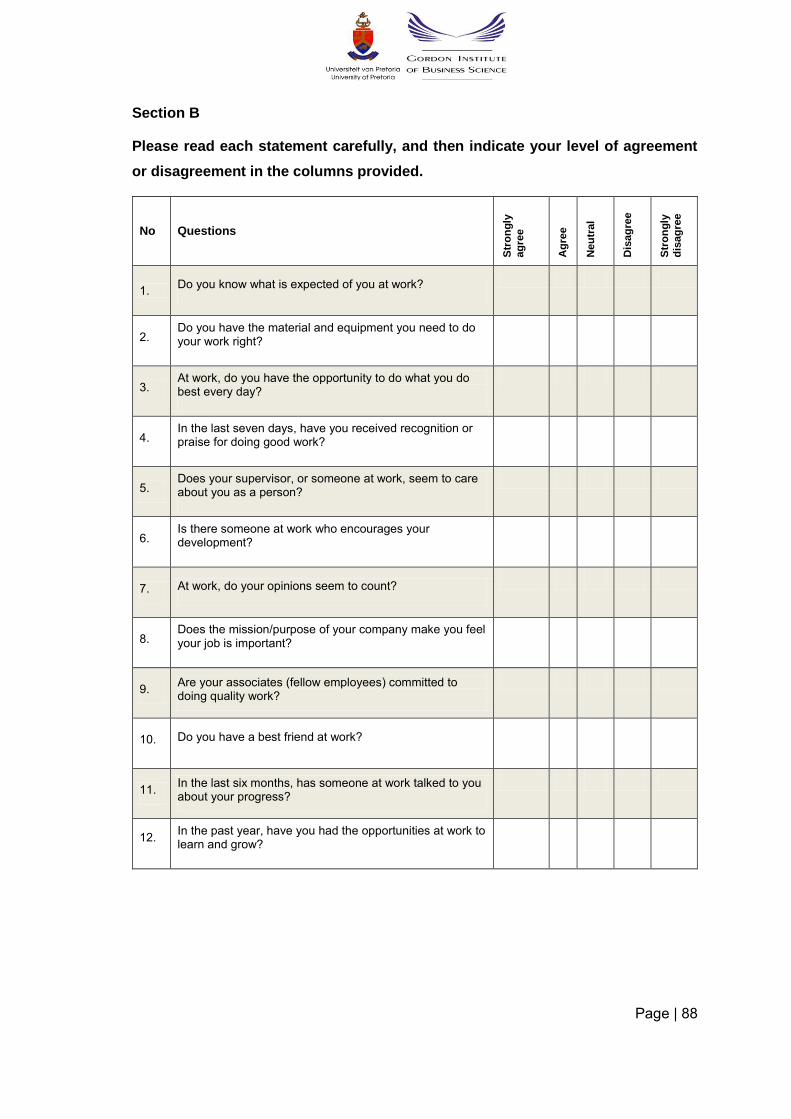
Page | 88
Section B
Please read each statement carefully, and then indicate your level of agreement
or disagreement in the columns provided.
No Questions
Str
on
gly
ag
ree
Ag
ree
Neu
tral
Dis
ag
ree
Str
on
gly
dis
ag
ree
1. Do you know what is expected of you at work?
2. Do you have the material and equipment you need to do your work right?
3. At work, do you have the opportunity to do what you do best every day?
4. In the last seven days, have you received recognition or praise for doing good work?
5. Does your supervisor, or someone at work, seem to care about you as a person?
6. Is there someone at work who encourages your development?
7. At work, do your opinions seem to count?
8. Does the mission/purpose of your company make you feel your job is important?
9. Are your associates (fellow employees) committed to doing quality work?
10. Do you have a best friend at work?
11. In the last six months, has someone at work talked to you about your progress?
12. In the past year, have you had the opportunities at work to learn and grow?
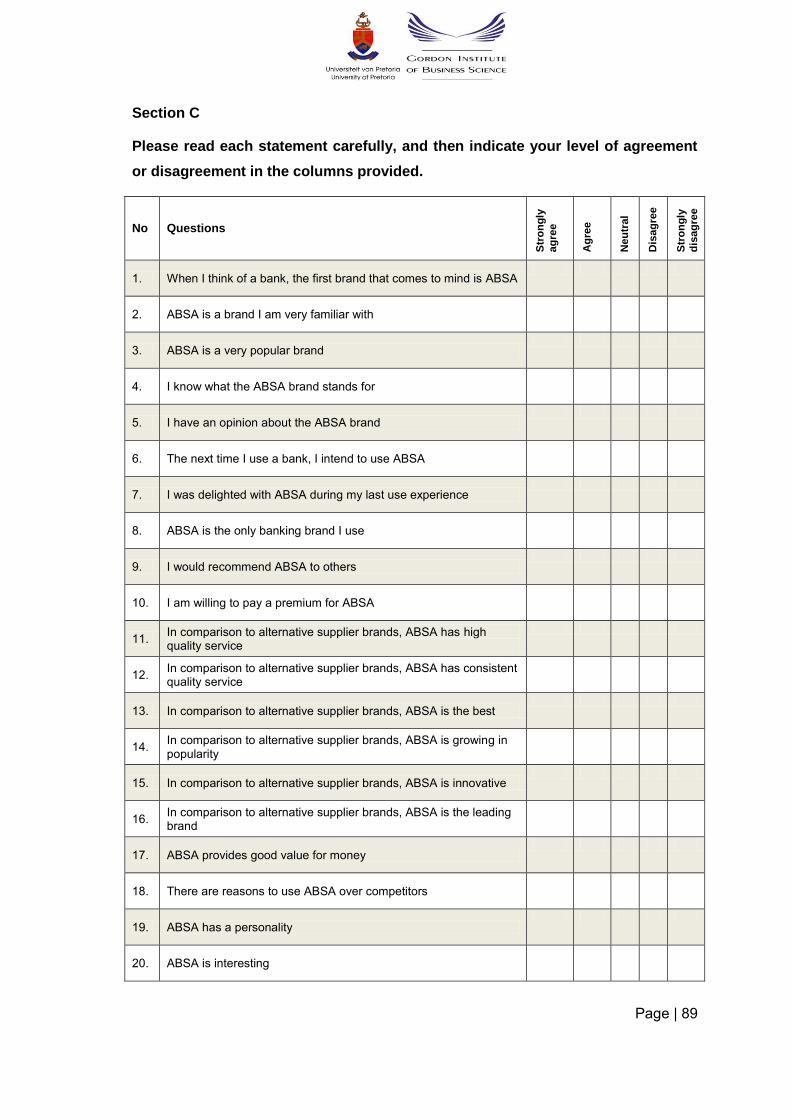
Page | 89
Section C
Please read each statement carefully, and then indicate your level of agreement
or disagreement in the columns provided.
No Questions
Str
on
gly
ag
ree
Ag
ree
Neu
tral
Dis
ag
ree
Str
on
gly
dis
ag
ree
1. When I think of a bank, the first brand that comes to mind is ABSA
2. ABSA is a brand I am very familiar with
3. ABSA is a very popular brand
4. I know what the ABSA brand stands for
5. I have an opinion about the ABSA brand
6. The next time I use a bank, I intend to use ABSA
7. I was delighted with ABSA during my last use experience
8. ABSA is the only banking brand I use
9. I would recommend ABSA to others
10. I am willing to pay a premium for ABSA
11. In comparison to alternative supplier brands, ABSA has high quality service
12. In comparison to alternative supplier brands, ABSA has consistent quality service
13. In comparison to alternative supplier brands, ABSA is the best
14. In comparison to alternative supplier brands, ABSA is growing in popularity
15. In comparison to alternative supplier brands, ABSA is innovative
16. In comparison to alternative supplier brands, ABSA is the leading brand
17. ABSA provides good value for money
18. There are reasons to use ABSA over competitors
19. ABSA has a personality
20. ABSA is interesting
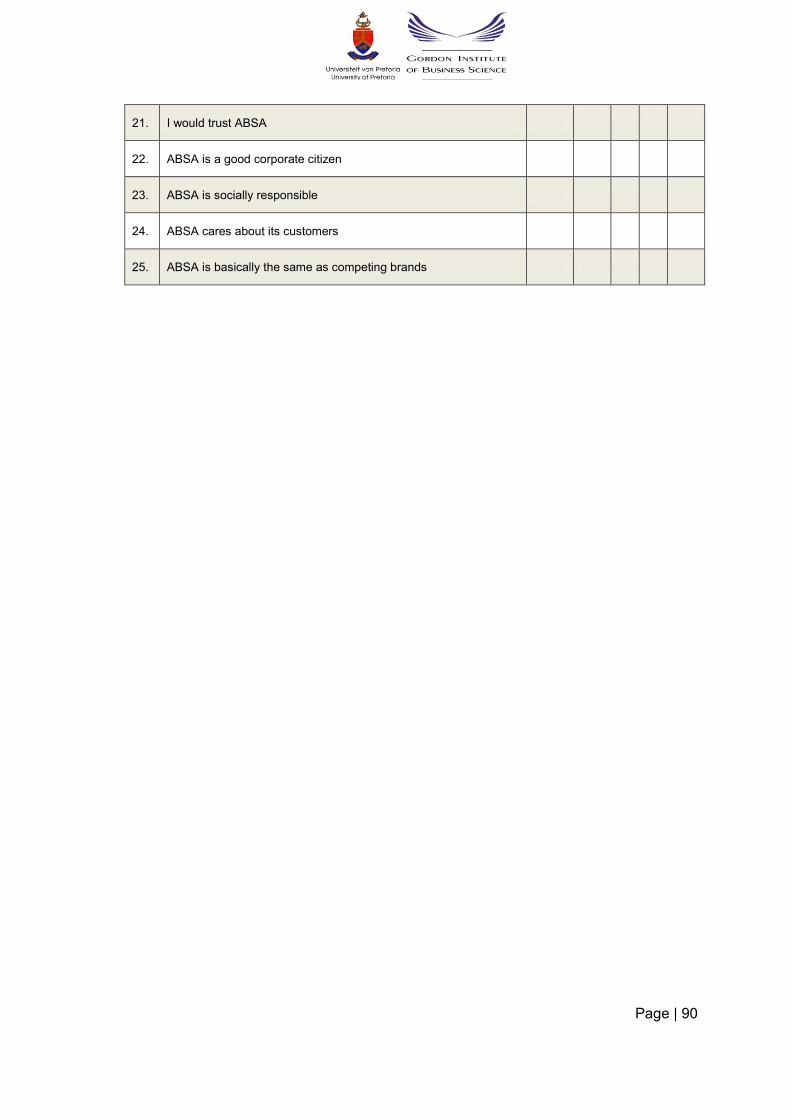
Page | 90
21. I would trust ABSA
22. ABSA is a good corporate citizen
23. ABSA is socially responsible
24. ABSA cares about its customers
25. ABSA is basically the same as competing brands
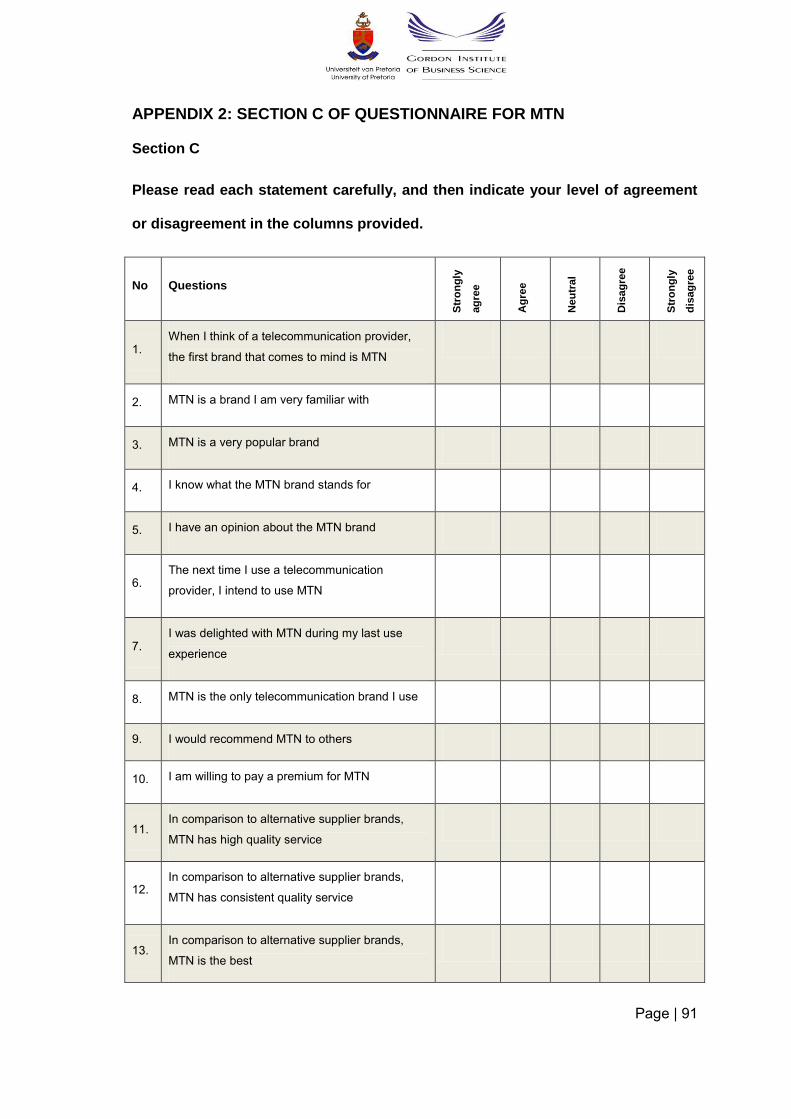
Page | 91
APPENDIX 2: SECTION C OF QUESTIONNAIRE FOR MTN
Section C
Please read each statement carefully, and then indicate your level of agreement
or disagreement in the columns provided.
No Questions
Str
on
gly
ag
ree
Ag
ree
Neu
tral
Dis
ag
ree
Str
on
gly
dis
ag
ree
1. When I think of a telecommunication provider,
the first brand that comes to mind is MTN
2. MTN is a brand I am very familiar with
3. MTN is a very popular brand
4. I know what the MTN brand stands for
5. I have an opinion about the MTN brand
6. The next time I use a telecommunication
provider, I intend to use MTN
7. I was delighted with MTN during my last use
experience
8. MTN is the only telecommunication brand I use
9. I would recommend MTN to others
10. I am willing to pay a premium for MTN
11. In comparison to alternative supplier brands,
MTN has high quality service
12. In comparison to alternative supplier brands,
MTN has consistent quality service
13. In comparison to alternative supplier brands,
MTN is the best
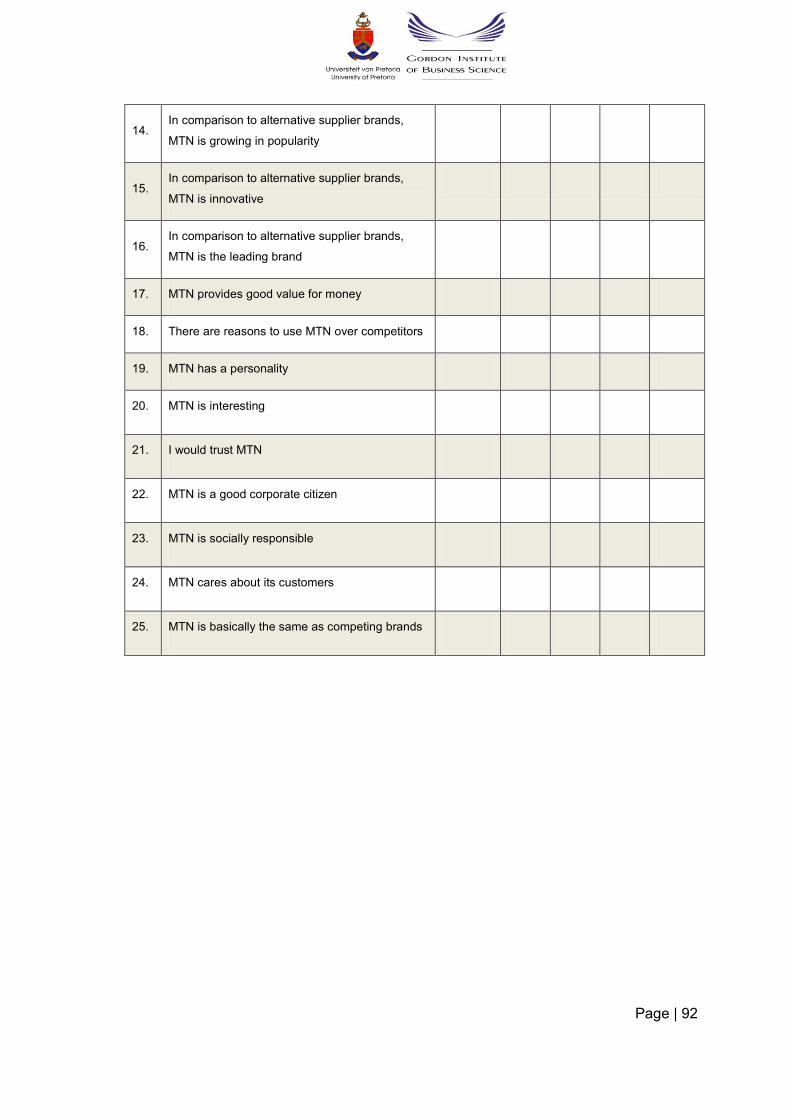
Page | 92
14. In comparison to alternative supplier brands,
MTN is growing in popularity
15. In comparison to alternative supplier brands,
MTN is innovative
16. In comparison to alternative supplier brands,
MTN is the leading brand
17. MTN provides good value for money
18. There are reasons to use MTN over competitors
19. MTN has a personality
20. MTN is interesting
21. I would trust MTN
22. MTN is a good corporate citizen
23. MTN is socially responsible
24. MTN cares about its customers
25. MTN is basically the same as competing brands
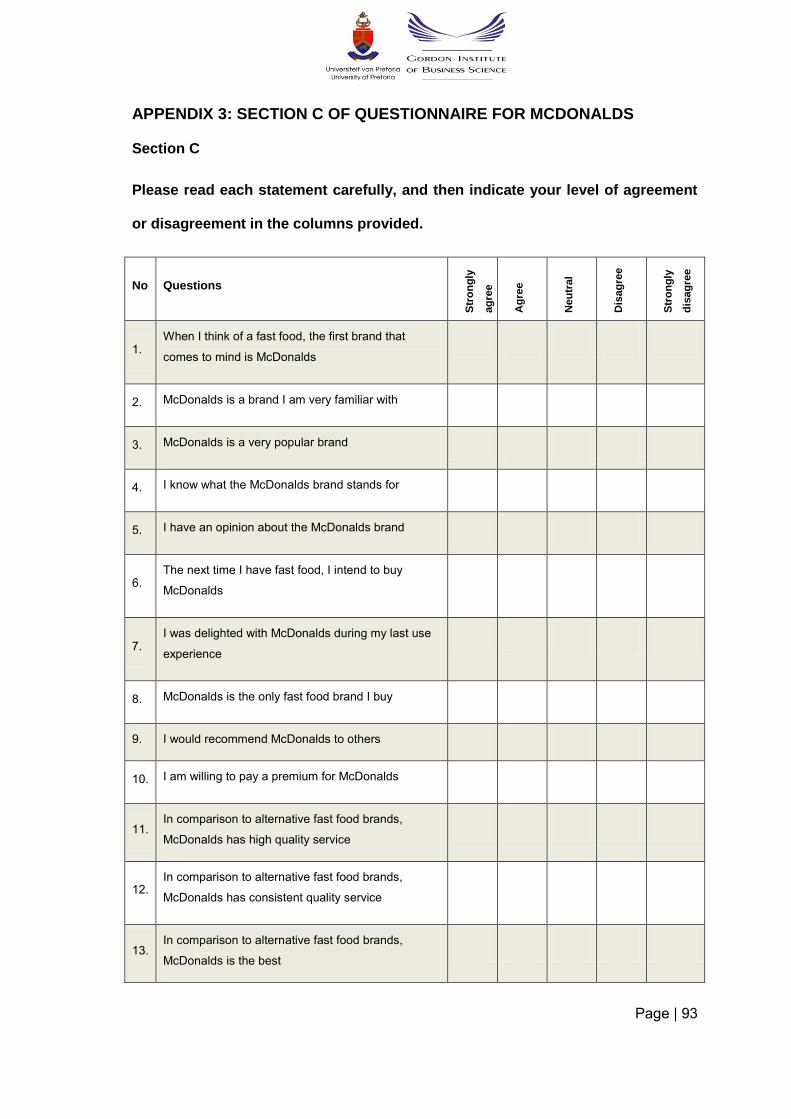
Page | 93
APPENDIX 3: SECTION C OF QUESTIONNAIRE FOR MCDONALDS
Section C
Please read each statement carefully, and then indicate your level of agreement
or disagreement in the columns provided.
No Questions
Str
on
gly
ag
ree
Ag
ree
Neu
tral
Dis
ag
ree
Str
on
gly
dis
ag
ree
1. When I think of a fast food, the first brand that
comes to mind is McDonalds
2. McDonalds is a brand I am very familiar with
3. McDonalds is a very popular brand
4. I know what the McDonalds brand stands for
5. I have an opinion about the McDonalds brand
6. The next time I have fast food, I intend to buy
McDonalds
7. I was delighted with McDonalds during my last use
experience
8. McDonalds is the only fast food brand I buy
9. I would recommend McDonalds to others
10. I am willing to pay a premium for McDonalds
11. In comparison to alternative fast food brands,
McDonalds has high quality service
12. In comparison to alternative fast food brands,
McDonalds has consistent quality service
13. In comparison to alternative fast food brands,
McDonalds is the best
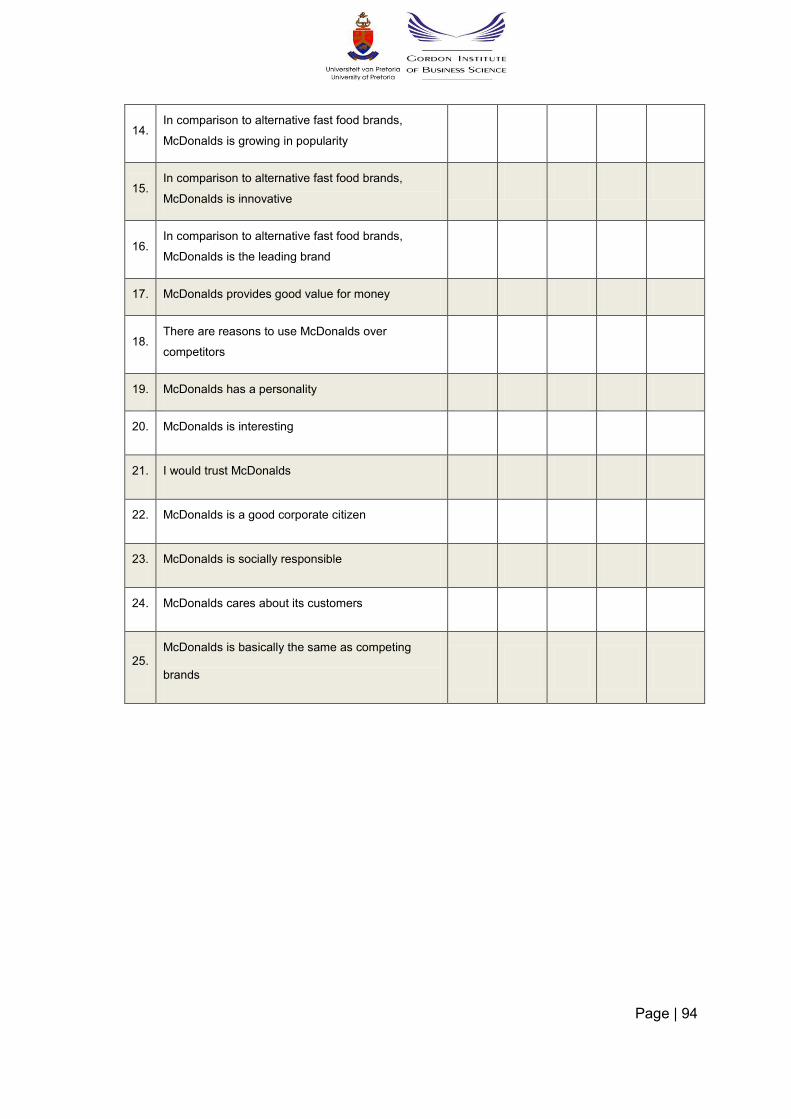
Page | 94
14. In comparison to alternative fast food brands,
McDonalds is growing in popularity
15. In comparison to alternative fast food brands,
McDonalds is innovative
16. In comparison to alternative fast food brands,
McDonalds is the leading brand
17. McDonalds provides good value for money
18. There are reasons to use McDonalds over
competitors
19. McDonalds has a personality
20. McDonalds is interesting
21. I would trust McDonalds
22. McDonalds is a good corporate citizen
23. McDonalds is socially responsible
24. McDonalds cares about its customers
25. McDonalds is basically the same as competing
brands
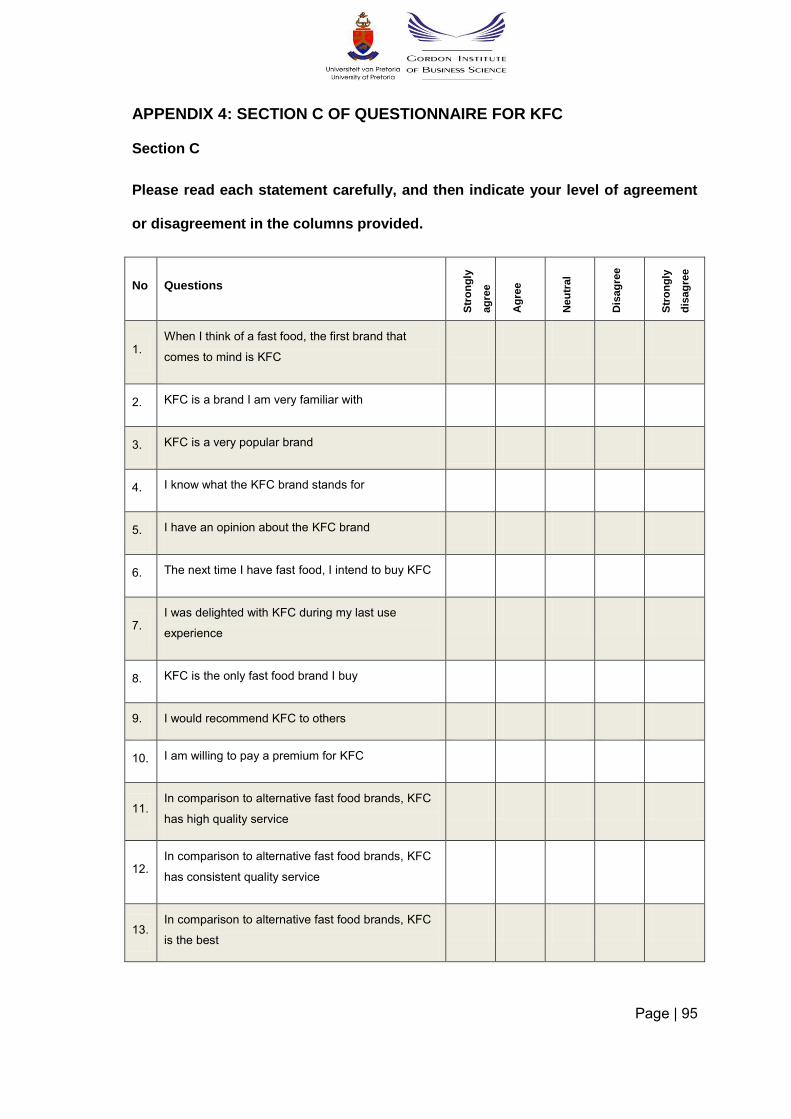
Page | 95
APPENDIX 4: SECTION C OF QUESTIONNAIRE FOR KFC
Section C
Please read each statement carefully, and then indicate your level of agreement
or disagreement in the columns provided.
No Questions
Str
on
gly
ag
ree
Ag
ree
Neu
tral
Dis
ag
ree
Str
on
gly
dis
ag
ree
1. When I think of a fast food, the first brand that
comes to mind is KFC
2. KFC is a brand I am very familiar with
3. KFC is a very popular brand
4. I know what the KFC brand stands for
5. I have an opinion about the KFC brand
6. The next time I have fast food, I intend to buy KFC
7. I was delighted with KFC during my last use
experience
8. KFC is the only fast food brand I buy
9. I would recommend KFC to others
10. I am willing to pay a premium for KFC
11. In comparison to alternative fast food brands, KFC
has high quality service
12. In comparison to alternative fast food brands, KFC
has consistent quality service
13. In comparison to alternative fast food brands, KFC
is the best

Page | 96
14. In comparison to alternative fast food brands, KFC
is growing in popularity
15. In comparison to alternative fast food brands, KFC
is innovative
16. In comparison to alternative fast food brands, KFC
is the leading brand
17. KFC provides good value for money
18. There are reasons to use KFC over competitors
19. KFC has a personality
20. KFC is interesting
21. I would trust KFC
22. KFC is a good corporate citizen
23. KFC is socially responsible
24. KFC cares about its customers
25. KFC is basically the same as competing brands
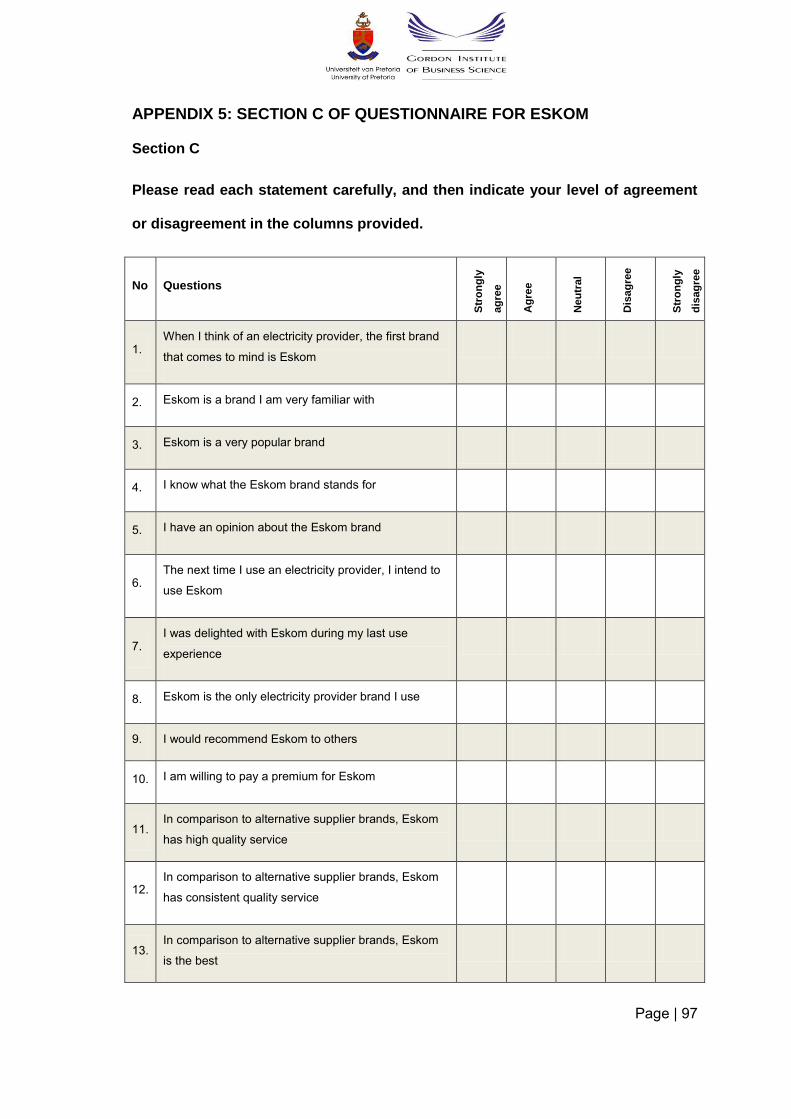
Page | 97
APPENDIX 5: SECTION C OF QUESTIONNAIRE FOR ESKOM
Section C
Please read each statement carefully, and then indicate your level of agreement
or disagreement in the columns provided.
No Questions
Str
on
gly
ag
ree
Ag
ree
Neu
tral
Dis
ag
ree
Str
on
gly
dis
ag
ree
1. When I think of an electricity provider, the first brand
that comes to mind is Eskom
2. Eskom is a brand I am very familiar with
3. Eskom is a very popular brand
4. I know what the Eskom brand stands for
5. I have an opinion about the Eskom brand
6. The next time I use an electricity provider, I intend to
use Eskom
7. I was delighted with Eskom during my last use
experience
8. Eskom is the only electricity provider brand I use
9. I would recommend Eskom to others
10. I am willing to pay a premium for Eskom
11. In comparison to alternative supplier brands, Eskom
has high quality service
12. In comparison to alternative supplier brands, Eskom
has consistent quality service
13. In comparison to alternative supplier brands, Eskom
is the best
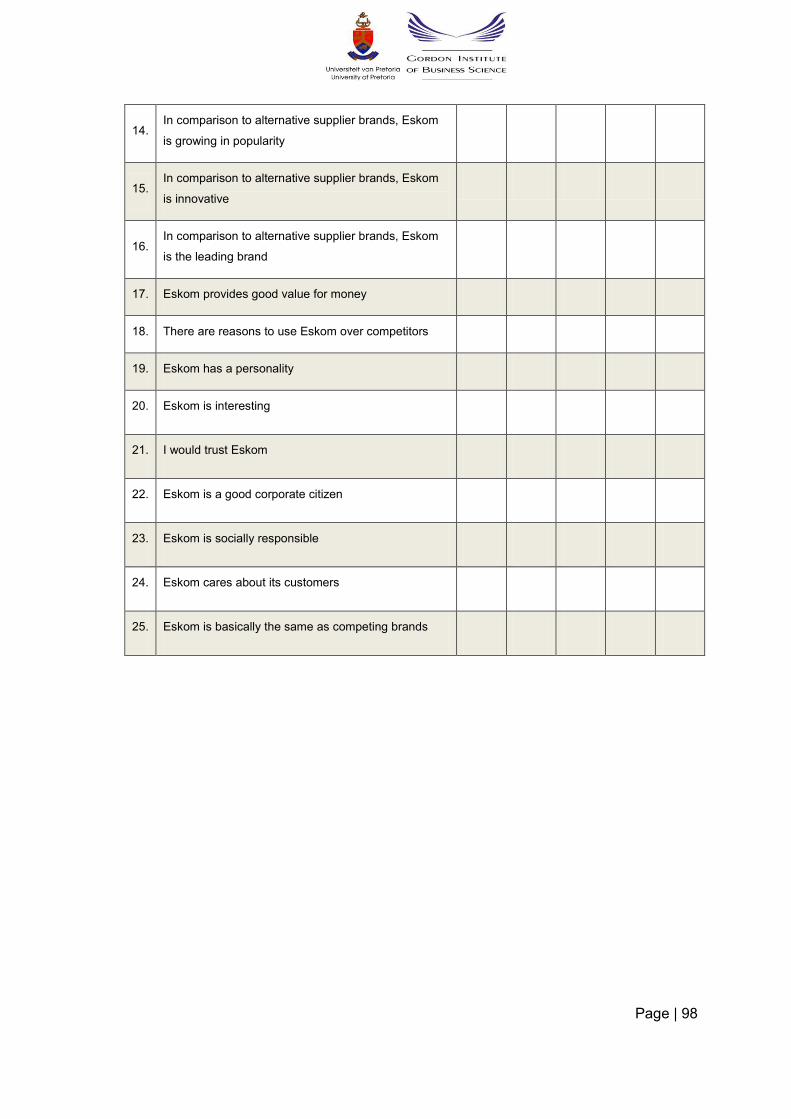
Page | 98
14. In comparison to alternative supplier brands, Eskom
is growing in popularity
15. In comparison to alternative supplier brands, Eskom
is innovative
16. In comparison to alternative supplier brands, Eskom
is the leading brand
17. Eskom provides good value for money
18. There are reasons to use Eskom over competitors
19. Eskom has a personality
20. Eskom is interesting
21. I would trust Eskom
22. Eskom is a good corporate citizen
23. Eskom is socially responsible
24. Eskom cares about its customers
25. Eskom is basically the same as competing brands
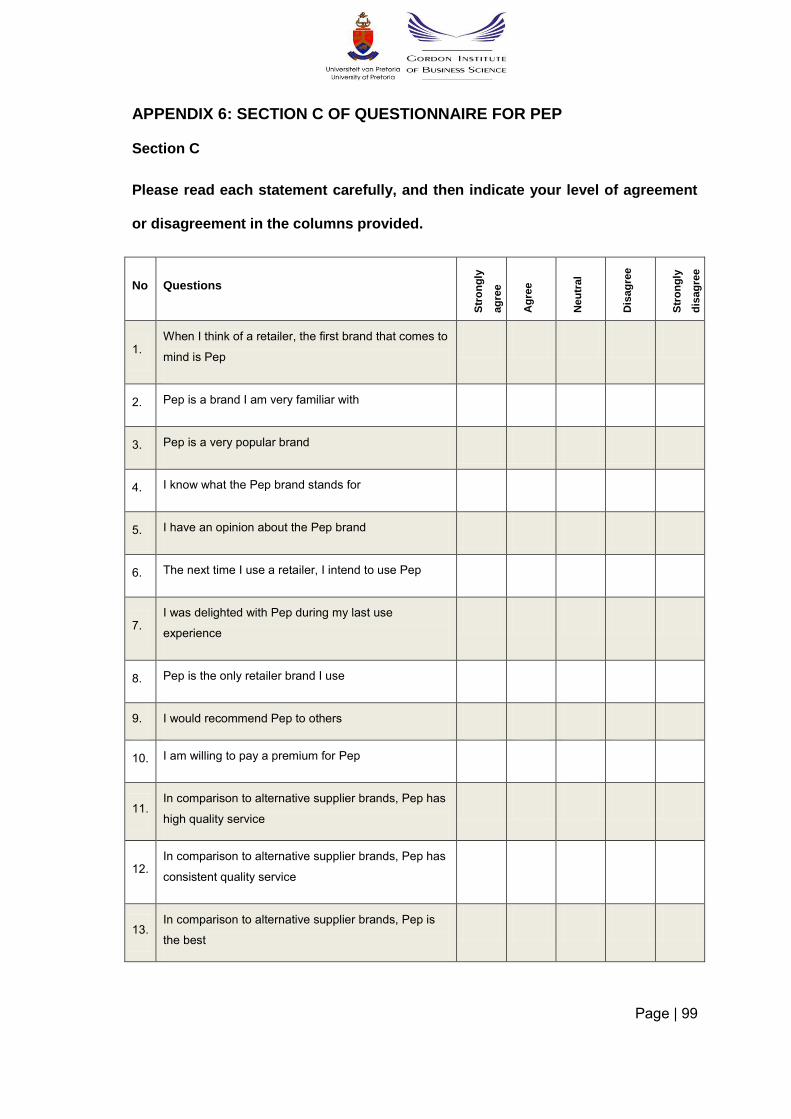
Page | 99
APPENDIX 6: SECTION C OF QUESTIONNAIRE FOR PEP
Section C
Please read each statement carefully, and then indicate your level of agreement
or disagreement in the columns provided.
No Questions
Str
on
gly
ag
ree
Ag
ree
Neu
tral
Dis
ag
ree
Str
on
gly
dis
ag
ree
1. When I think of a retailer, the first brand that comes to
mind is Pep
2. Pep is a brand I am very familiar with
3. Pep is a very popular brand
4. I know what the Pep brand stands for
5. I have an opinion about the Pep brand
6. The next time I use a retailer, I intend to use Pep
7. I was delighted with Pep during my last use
experience
8. Pep is the only retailer brand I use
9. I would recommend Pep to others
10. I am willing to pay a premium for Pep
11. In comparison to alternative supplier brands, Pep has
high quality service
12. In comparison to alternative supplier brands, Pep has
consistent quality service
13. In comparison to alternative supplier brands, Pep is
the best
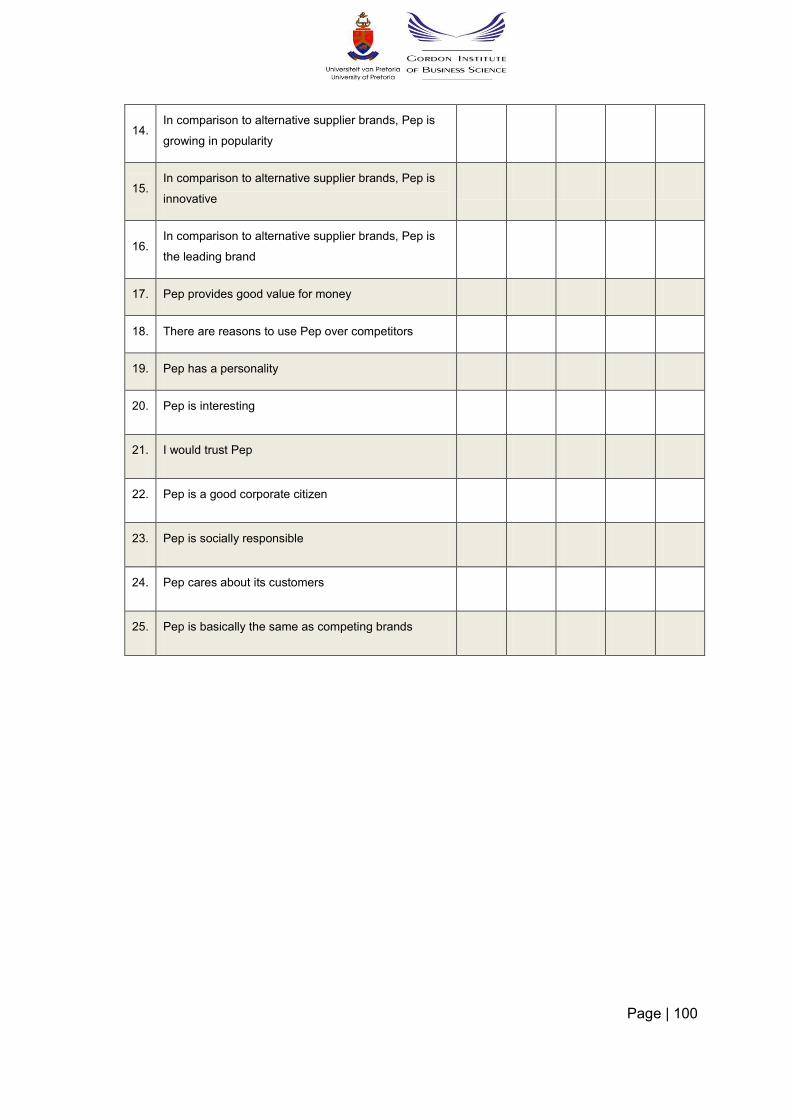
Page | 100
14. In comparison to alternative supplier brands, Pep is
growing in popularity
15. In comparison to alternative supplier brands, Pep is
innovative
16. In comparison to alternative supplier brands, Pep is
the leading brand
17. Pep provides good value for money
18. There are reasons to use Pep over competitors
19. Pep has a personality
20. Pep is interesting
21. I would trust Pep
22. Pep is a good corporate citizen
23. Pep is socially responsible
24. Pep cares about its customers
25. Pep is basically the same as competing brands
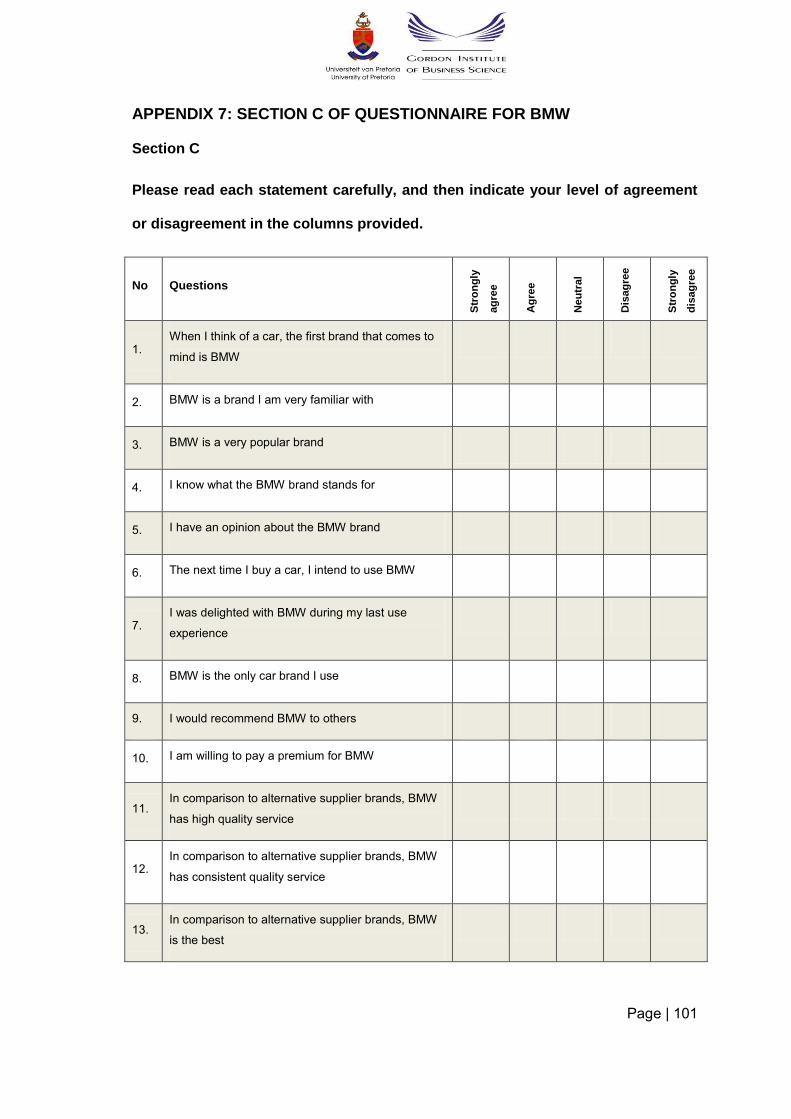
Page | 101
APPENDIX 7: SECTION C OF QUESTIONNAIRE FOR BMW
Section C
Please read each statement carefully, and then indicate your level of agreement
or disagreement in the columns provided.
No Questions
Str
on
gly
ag
ree
Ag
ree
Neu
tral
Dis
ag
ree
Str
on
gly
dis
ag
ree
1. When I think of a car, the first brand that comes to
mind is BMW
2. BMW is a brand I am very familiar with
3. BMW is a very popular brand
4. I know what the BMW brand stands for
5. I have an opinion about the BMW brand
6. The next time I buy a car, I intend to use BMW
7. I was delighted with BMW during my last use
experience
8. BMW is the only car brand I use
9. I would recommend BMW to others
10. I am willing to pay a premium for BMW
11. In comparison to alternative supplier brands, BMW
has high quality service
12. In comparison to alternative supplier brands, BMW
has consistent quality service
13. In comparison to alternative supplier brands, BMW
is the best

Page | 102
14. In comparison to alternative supplier brands, BMW
is growing in popularity
15. In comparison to alternative supplier brands, BMW
is innovative
16. In comparison to alternative supplier brands, BMW
is the leading brand
17. BMW provides good value for money
18. There are reasons to use BMW over competitors
19. BMW has a personality
20. BMW is interesting
21. I would trust BMW
22. BMW is a good corporate citizen
23. BMW is socially responsible
24. BMW cares about its customers
25. BMW is basically the same as competing brands