Embed Size (px)
Citation preview
1
THE RELATIONSHIP BETWEEN MARKETING
MIX TOWARDS CONSUMER PURCHASING
DECISION of PRO PLAN
(A CASE STUDY AT PEKAYON PETSHOP
BEKASI)
By
Alvin Javier Djari
011200800007
A thesis presented to the Faculty of Economics
President University in partial fulfillment of the
requirements for Bachelor Degree in Economics Major
in International Business
December 2011
2
CHAPTER I
INTRODUCTION
This chapter will discuss the introduction of this thesis that consist of the
background of the study, the company profile, problem indentified, statement of
the problem, research objectives, significance of the study, theoretical framework,
scope and limitations of the study, assumptions and hypothesis and definitions of
terms.
1.1 Background of the Study
In recent years, many companies throughout the world have created their
own marketing mix activity to compete with their competitors. The company has
to be able to make the right marketing mix with the current market condition and
also with their targeted market. The targeted market as the indicator of the
succesfull marketing mix strategy should be clearly defined, because the target
market is the focus for all marketing mix activity.
As can be seen now in Indonesia, the pet food business is aggressively
growing in the past 6 (six) years, it can be seen through the pet population itself
that is increasing and also the pet lovers especially dogs and cats are increasing
too1. Below is the figure of the pet population in Indonesia for the past six years.
1 The data was taken in Nestle Purina Petcare Intranet during the Internship Program,
February 2011
3
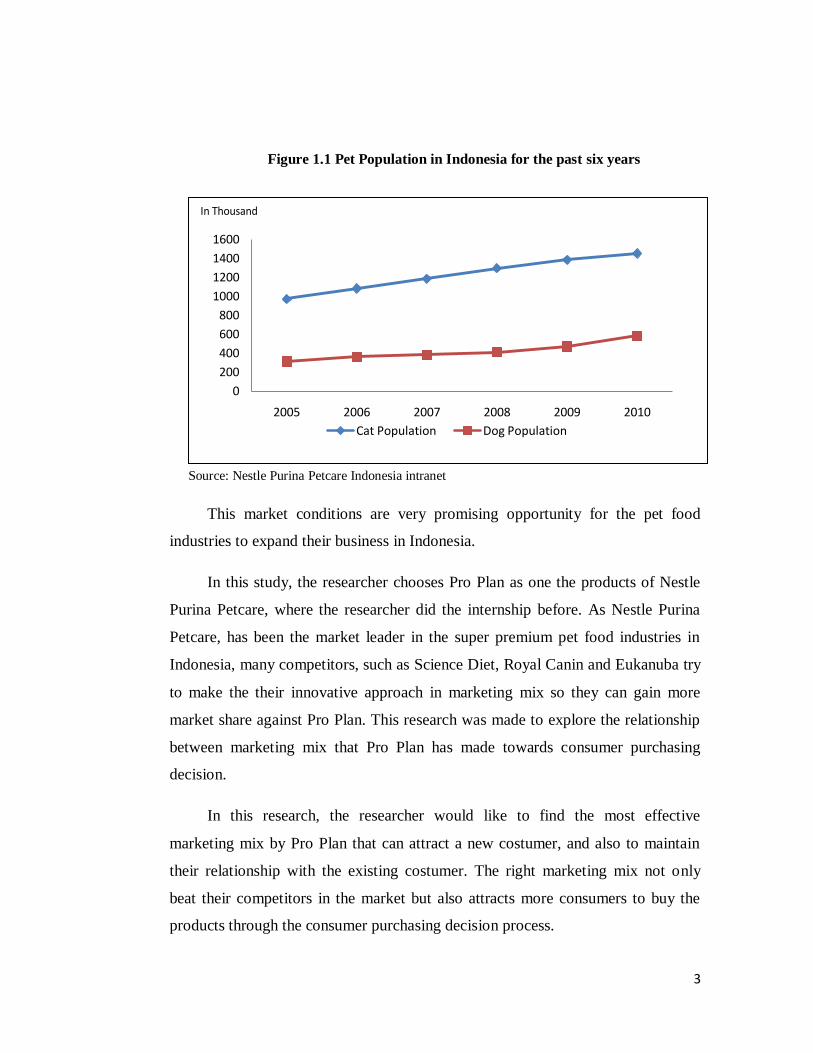
Figure 1.1 Pet Population in Indonesia for the past six years
Source: Nestle Purina Petcare Indonesia intranet
This market conditions are very promising opportunity for the pet food
industries to expand their business in Indonesia.
In this study, the researcher chooses Pro Plan as one the products of Nestle
Purina Petcare, where the researcher did the internship before. As Nestle Purina
Petcare, has been the market leader in the super premium pet food industries in
Indonesia, many competitors, such as Science Diet, Royal Canin and Eukanuba try
to make the their innovative approach in marketing mix so they can gain more
market share against Pro Plan. This research was made to explore the relationship
between marketing mix that Pro Plan has made towards consumer purchasing
decision.
In this research, the researcher would like to find the most effective
marketing mix by Pro Plan that can attract a new costumer, and also to maintain
their relationship with the existing costumer. The right marketing mix not only
beat their competitors in the market but also attracts more consumers to buy the
products through the consumer purchasing decision process.
0
200
400
600
800
1000
1200
1400
1600
2005 2006 2007 2008 2009 2010
Cat Population Dog Population
In Thousand
4
1.2 Company Profile
Nestle Purina Petcare
Nestlé Purina Pet Care Company is the pet food division of Swiss-based
Nestlé S.A., following its acquisition of the American Ralston Purina Company on
December 12, 2001 and subsequent merger with Nestlé's Friskies Pet Care
Company. As a wholly owned subsidiary, it is headquartered at the General Office
in St. Louis, Missouri, United States. The animal feed business became the subject
of an acquisition bid by Swiss-based Nestlé, whose Friskies brand was the other
leading brand of pet food in the U.S. Nestlé S.A. and U.S. Ralston Purina
Company announced in January 2001 that they had entered into a definitive
merger agreement. Under the agreement, Nestlé acquired all of the outstanding
shares of Ralston .
In Indonesia, the pet food industry begins in 2002 where pedigree, Whiskas
was the only product in the market under Mars Company. Purina joined the market
in 2005. Even though Purina was late in terms of joining the market .but since
2007 Purina took over the market leader from Mars Company and being the
biggest pet food product purchased by consumers whether in pet shops or
Groceries in Indonesia. Vision of Nestle Purina itself is to making pets live better.
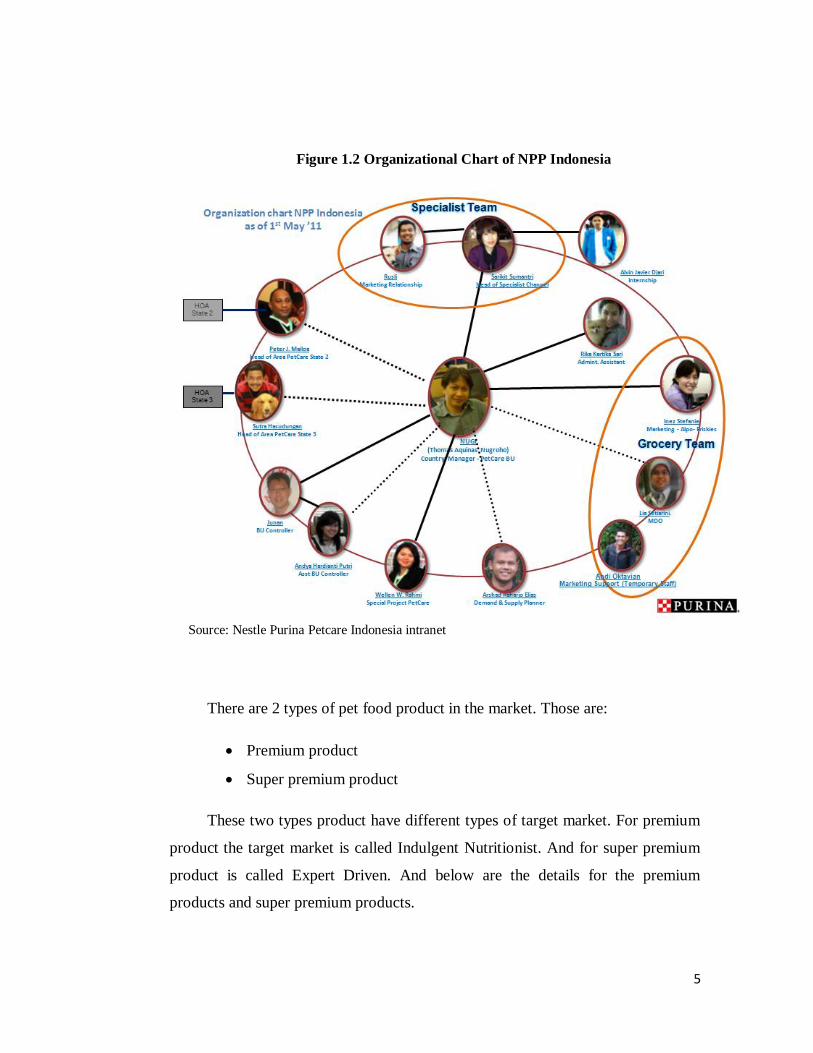
Their mission is to leading pet food business in Indonesia. Below is the
organizational chart where the researcher has done the internship in Nestle Purina
Pet care Indonesia.
5
Figure 1.2 Organizational Chart of NPP Indonesia
Source: Nestle Purina Petcare Indonesia intranet
There are 2 types of pet food product in the market. Those are:
Premium product
Super premium product
These two types product have different types of target market. For premium
product the target market is called Indulgent Nutritionist. And for super premium
product is called Expert Driven. And below are the details for the premium
products and super premium products.
6
1.2.1 Premium product
Premium product is sold through big retailers or KA (Key Account) like
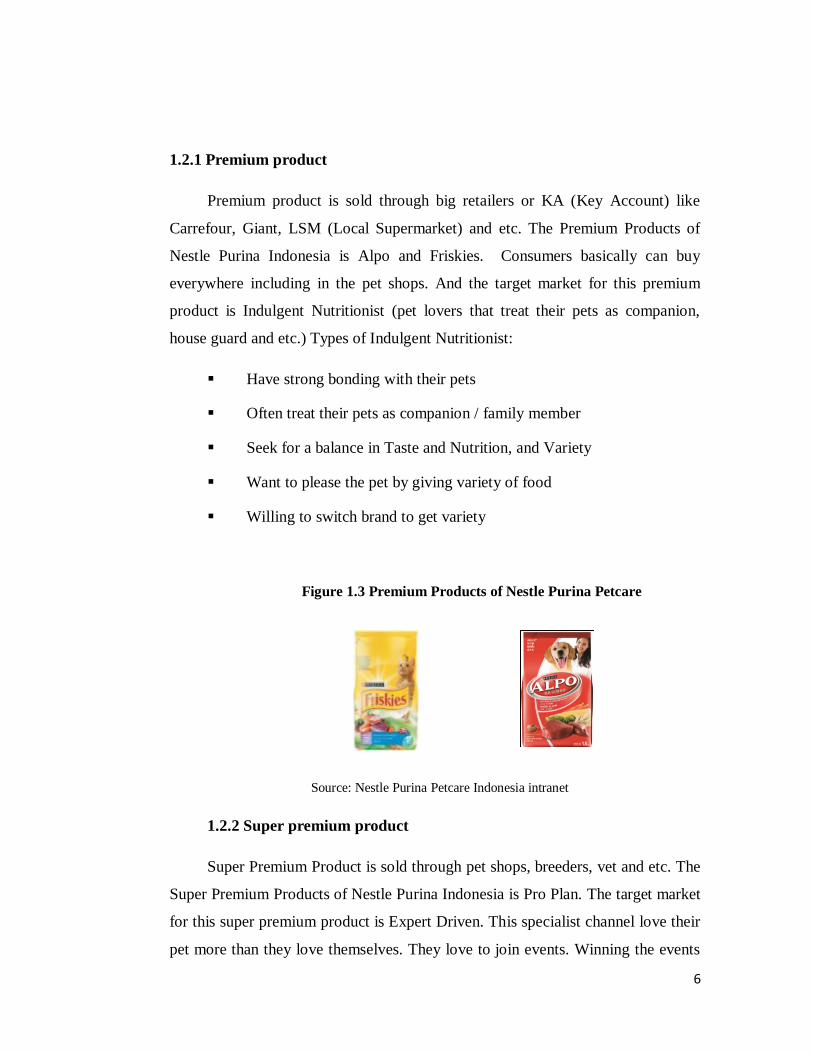
Carrefour, Giant, LSM (Local Supermarket) and etc. The Premium Products of
Nestle Purina Indonesia is Alpo and Friskies. Consumers basically can buy
everywhere including in the pet shops. And the target market for this premium
product is Indulgent Nutritionist (pet lovers that treat their pets as companion,
house guard and etc.) Types of Indulgent Nutritionist:
Have strong bonding with their pets
Often treat their pets as companion / family member
Seek for a balance in Taste and Nutrition, and Variety
Want to please the pet by giving variety of food
Willing to switch brand to get variety
Figure 1.3 Premium Products of Nestle Purina Petcare
Source: Nestle Purina Petcare Indonesia intranet
1.2.2 Super premium product
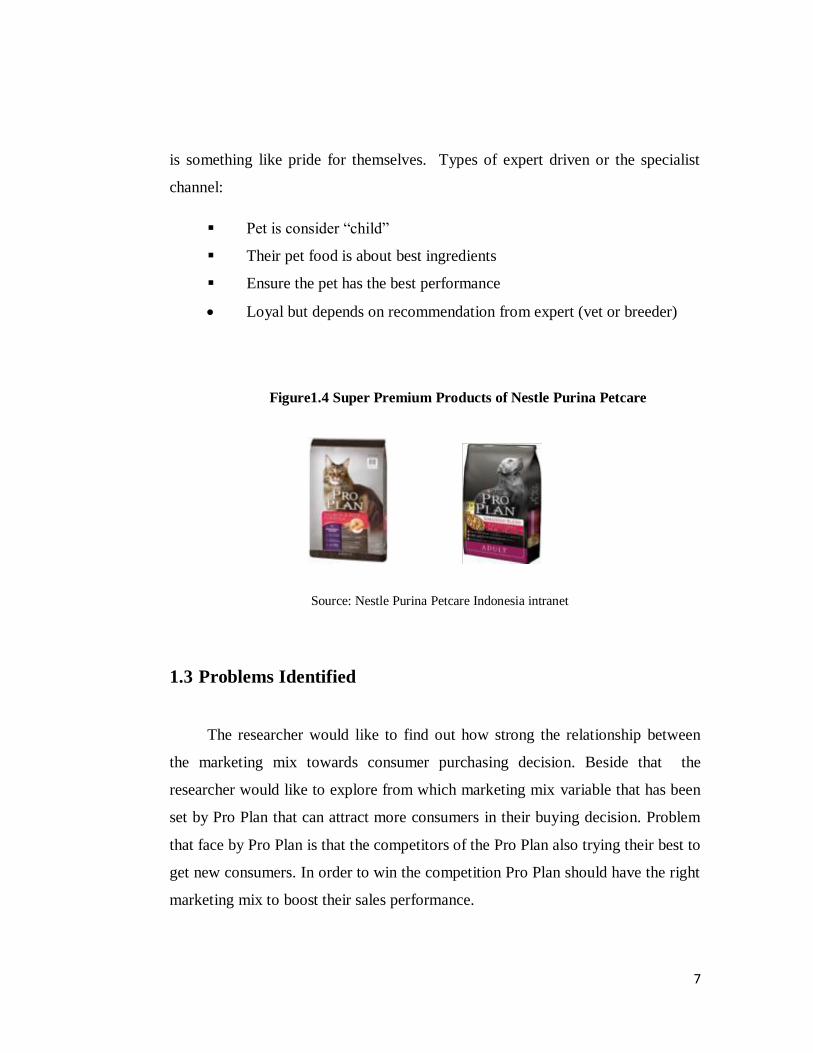
Super Premium Product is sold through pet shops, breeders, vet and etc. The
Super Premium Products of Nestle Purina Indonesia is Pro Plan. The target market
for this super premium product is Expert Driven. This specialist channel love their
pet more than they love themselves. They love to join events. Winning the events
7
is something like pride for themselves. Types of expert driven or the specialist
channel:
Pet is consider ―child‖
Their pet food is about best ingredients
Ensure the pet has the best performance
Loyal but depends on recommendation from expert (vet or breeder)
Figure1.4 Super Premium Products of Nestle Purina Petcare
Source: Nestle Purina Petcare Indonesia intranet
1.3 Problems Identified
The researcher would like to find out how strong the relationship between
the marketing mix towards consumer purchasing decision. Beside that the
researcher would like to explore from which marketing mix variable that has been
set by Pro Plan that can attract more consumers in their buying decision. Problem
that face by Pro Plan is that the competitors of the Pro Plan also trying their best to
get new consumers. In order to win the competition Pro Plan should have the right
marketing mix to boost their sales performance.
8
1.4 Statement of the Problem
Understanding the right marketing mix is one of the key successes in
running a business in order to increase the sales revenue of the company.
Therefore, the company should be able to understand the needs of their consumer
in this case of Pro Plan, Purina should be able to understand the needs of their
consumers, in this case the Pet owner. The researcher stated the following
problems to understand more the relationship between the marketing mix and the
consumer purchasing decision.
Question:
1. Is there any relationship between marketing mix variable toward consumer
purchasing decision?
2. What is the most significance variable of marketing mix that influencing
consumer to buy Pro Plan?
Rationale: The research was done in order to help the companies to choose the
best marketing mix to maintain the relationship with existing consumers and to
attract new consumers.
1.5 Research Objectives
The research objectives are to identify how strong the relationship between
marketing mix of Pro Plan towards the consumer purchasing decision and to
identify which marketing mix variables that has the most significance influence in
buying Pro Plan, because there are many types several marketing mix variables
that Pro Plan does in each area of promotion, price, place and also their product.
9
1.6 Significance of Study
The significant of this study are:
1. For the researcher, this research is to know how strong the relationship
between marketing mix towards the consumer purchasing decisions and also
which variables of marketing mix that can attract more consumers to buy Pro
Plan.
2. For the company, this research is to improve the management in case of their
marketing mix in order to increase their sales revenue.
3. For other party, this study could be used as reference to do a further analysis
in the future and as input to gain more knowledge, particularly in effective
marketing mix.
1.7 Theoretical Framework
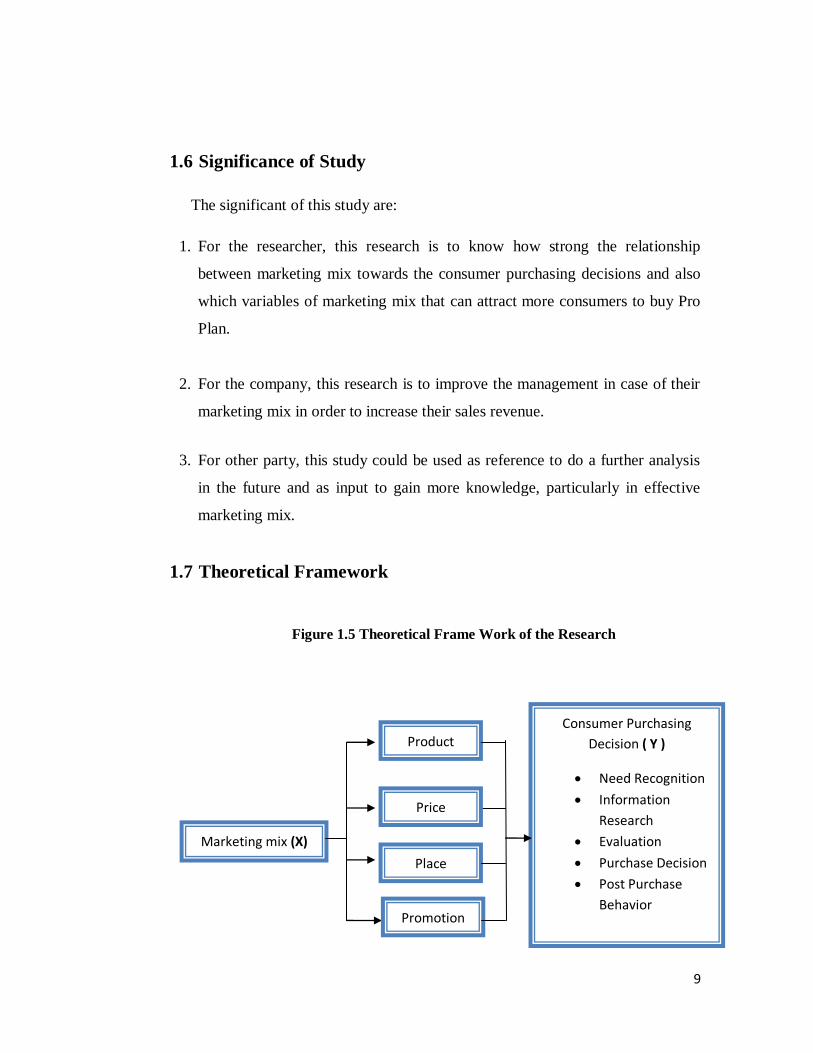
Figure 1.5 Theoretical Frame Work of the Research
Marketing mix (X)
Consumer Purchasing
Decision ( Y )
Need Recognition
Information
Research
Evaluation
Purchase Decision
Post Purchase
Behavior
Product
Price
Place
Promotion
10
The figure above illustrates that through the marketing mix 4Ps (promotion,
price, place, products) will influencing the consumer purchasing decision of the
consumer itself to buy the products
1.8 Scope and Limitations of the Study
The scope of this research is only use the consumer who purchases Pro Plan
in pet shops in Pekayon pet shop. The researcher chooses the Pekayon pet shop
because from the research that has been done before with the Pro Plan sales team,
the researcher get the information that Pro Plan products in that pet shop has given
a big contribution in NPP sales. The total number of population that is taken from
the pet shop is only 50 consumers. This research only discusses the Pro Plan
marketing mix towards the consumer purchasing decision.
1.9 Assumption and Hypothesis
This research was done in Pekayon Pet shop, which assumes the
effectiveness of the marketing mix Pro Plan towards the consumer purchasing
decision. This assumption is based on researcher knowledge having joined NPP
team for seven months. The hypotheses are as follow as:
H0: There is no correlation between marketing mix Pro Plan with consumer
purchasing decision
H1: There is a correlation between marketing mix Pro Plan with consumer
purchasing decision
11
1.10 Definition of Terms
NPP : Nestle Purina Petcare
Pro Plan : Brand pet food in super premium segments produced by
Nestle Purina Petcare
Pet shop : A shop that sell pets, pets food, and pets accessories
12
CHAPTER II
LITERATURE REVIEW
This chapter will consist of any theories that are related with the problem
statement. This chapter consists of marketing, marketing mix strategy and
consumer purchasing decision theory.
2.1 Marketing
Marketing has been identified by so many experts in so many different ways.
According to Philip Kotler, (2006) marketing is the business function that
identifies unfulfill needs and wants, defines and measures their magnitude and
potential profitability, determines which target markets the organization can best
serve, decides on appropriate products, services, and programs to serve these
chosen markets, and calls upon everyone in the organization to think and serve the
consumer.
While the other expertise said that marketing is not only much broader than
selling, it is not a specialized activity at all It encompasses the entire business. It is
the whole business seen from the point of view of the final result, that is, from the
consumer's point of view. Concern and responsibility for marketing must therefore
permeate all areas of the enterprise 2.
2 Drucker, P. F. (1954), The practice of management. New York: Harper & Brothers. p.38-39
13
Philip Kotler (2001) in his book explained that marketing people are
involved in marketing 10 types of entities :
1. Goods. Physical goods constitute the bulk of most countries’ production and
marketing effort. The United States produces and markets billions of physical
goods, from eggs to steel to hair dryers. In developing nations, goods—
particularly food, commodities, clothing, and housing—are the mainstay of
the economy.
2. Services. Services include airlines, hotels, and maintenance and repair
people, as well as professionals such as accountants, lawyers, engineers, and
doctors. Many market offerings consist of a variable mix of goods and
services.
3. Experiences. By orchestrating several services and goods, one can create,
stage, and market experiences.
4. Events. Marketers promote time-based events, such as the Olympics, trade
shows, sports events, and artistic performances.
5. Persons. Celebrity marketing has become a major business. Artists,
musicians, CEOs, physicians, high-profile lawyers and financiers, and other
professionals draw help from celebrity marketers
6. Places. Cities, states, regions, and nations compete to attract tourists,
factories,company headquarters, and new residents. Place marketers include
economic development specialists, real estate agents, commercial banks, local
business associations, and advertising and public relations agencies.
7. Properties. Properties are intangible rights of ownership of either real
property (real estate) or financial property (stocks and bonds). Properties are
14
bought and sold, and this occasions a marketing effort by real estate agents
(for real estate) and investment companies and banks (for securities).
8. Organizations. Organizations actively work to build a strong, favorable
image in the mind of their publics. Universities, museums, and performing
arts organizations boost their public images to compete more successfully for
audiences and funds.
9. Informations. The production, packaging, and distribution of information is
one of society’s major industries. Among the marketers of information are
schools and universities; publishers of encyclopedias, nonfiction books, and
specialized magazines; makers of CDs; and Internet Web sites
10. Ideas. Every market offering has a basic idea at its core. In essence, products
and services are platforms for delivering some idea or benefit to satisfy a core
need.
2.2. Marketing Mix Strategy
The term "marketing mix" was coined in 1953 by Neil Borden in
his American Marketing Association presidential address. And finally A
prominent marketer, E. Jerome McCarthy, proposed a Four P’s (product, price,
promotion and place) classification in 1960, which has seen wide use3. They are
often designed to influence consumer decision-making. Each element of the
marketing mix can affect consumers in many ways 4 . When the company markets
their products, they have to create a succesfull mix of the right product, sold at the
right price, in the right place, and using the most suitable promotion.
3 http://en.wikipedia.org/wiki/Marketing_mix 4 Peter, P.J. & Donnelly, J.H. (2007). Marketing management: Knowledge and skills (8th ed.).
New York: McGraw- Hill. p.89
15
According to Kotler, Philip (2003) in his book marketing insights from A to
Z describes that Marketing mix as the set of tools that management can use to
influence sales. Besides using the 4P’s as the consideration when market the
Products, the marketers should consider with 4C’s from the consumer point of
views before setting the 4P’s5, those 4C’s are:
4C’s 4P’s
Consumer Value => Product
Consumer Costs => Price
Convenience => Place
Communication => Promotion
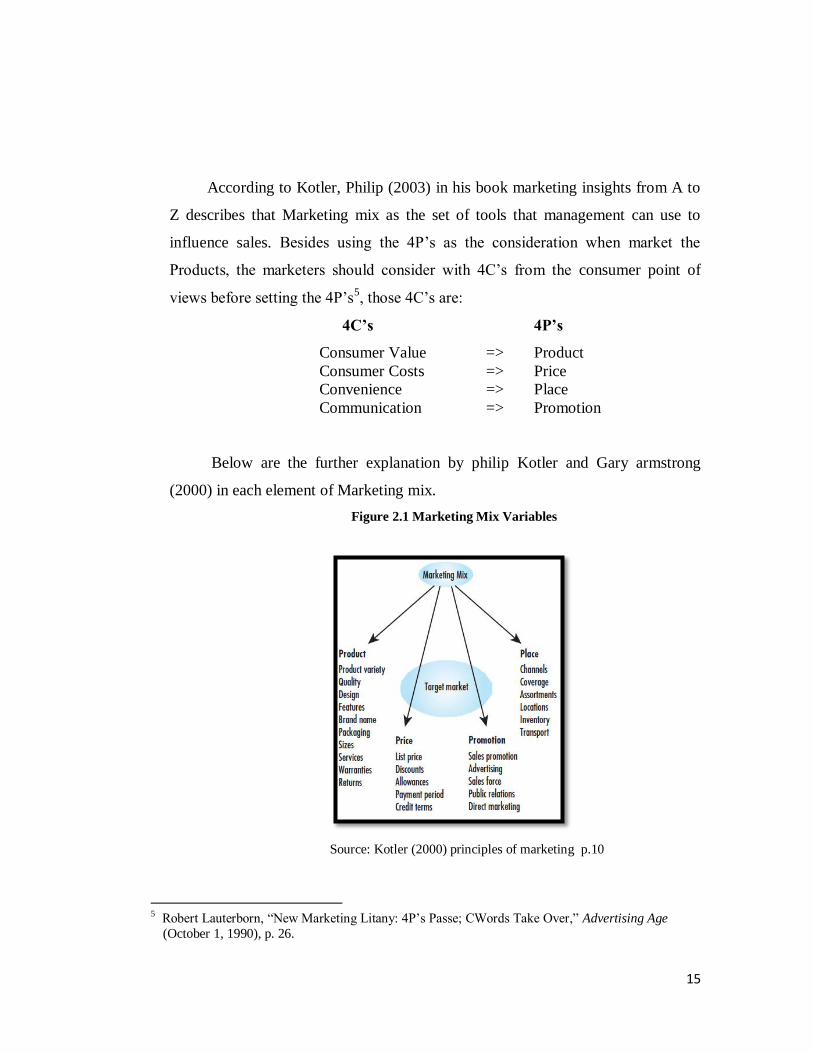
Below are the further explanation by philip Kotler and Gary armstrong
(2000) in each element of Marketing mix.
Figure 2.1 Marketing Mix Variables
Source: Kotler (2000) principles of marketing p.10
5 Robert Lauterborn, ―New Marketing Litany: 4P’s Passe; CWords Take Over,‖ Advertising Age
(October 1, 1990), p. 26.
16
2.2.1. Product strategy
Based on Kotler and Armstrong (2010) they defined a product as anything
that can be offered to a market for attention, acquisition, use, or consumption that
might satisfy a want or need. They further explained that product is a key element
in the overall market offering. This offering becomes the basis upon which the
company builds profitable consumer relationships.
According to Jain (2000) the desired position for a product may be
determined using the following procedure:
1. Analyze product attributes that are salient to consumers.
2. Examine the distribution of these attributes among different market segments.
3. Determine the optimal position for the product in regard to each attribute,
taking into consideration the positions occupied by existing brands.
4. Choose an overall position for the product (based on the overall match between
product attributes and their distribution in the population and the positions of
existing brands).
2.2.2. Pricing strategy
Price is the amount of money consumers must pay to obtain the product.
Based on Kotler and Armstrong (2010), setting the right price is one of the
marketer’s most difficult tasks. The price strategy is a challenge for companies
because of deregulation, strong global competition, and conservative buyers, slow
progress in market. But finding and implementing the right pricing strategy is
critical to success 6.
6 David W. Cravens, Nigel F. Piercy, Strategic Marketing, Eight Edition, p.39
17
Based on Jain (2000) the Pricing strategies are divided into eight parts:
1. Pricing strategies for new products
Pricing strategies for new products divided into two parts those are:
a) Skimming pricing
Skimming pricing means we setting a relatively high price during the
initial stage of a product’s
b) Penetration Pricing
Penetration pricing means we setting a relatively low price during the
initial stages of a product’s life
2. Pricing strategies for established products.
Pricing strategies for established products are divided into three parts,
those are :
a) Maintaining the price
The objectives to maintain the price is to maintain the position in the
marketplace (examples: market share, profitability).
b) Reducing the price
The objectives to reducing the price are to act defensively and cut price
to meet the competition, to act offensively and attempt to beat the
competition. And the last is to respond to a consumer need created by a
change in the environment.
c) Increasing the price
The objectives are to maintain profitability during an inflationary
period, to take advantage of product differences, real or perceived. and
to segment the current served market.
18
3. Price-flexibility strategy.
Price-flexibility strategy divided into two parts, those are : one-price Strategy
and flexible-pricing Strategy
a) One – Price strategy is the strategies that charging the same price to all
consumers under similar conditions and for the same quantities. It is to
simplify pricing decisions, and to maintain goodwill among consumers.
b) Flexible- Pricing Strategy is the strategies that charging different prices
to different consumers for the same product and quantity. It is to
maximize short-term profits and build traffic by allowing upward and
downward adjustments in price depending on competitive conditions
and how much the consumer is willing to pay for the product.
4. Product line – pricing strategy.
Product line means pricing a product line according to each product’s effect on
and relationship with other products in that line, whether competitive or
complementary. The objective is to maximize profits from the whole line, not
just certain members of it.
5. Leasing strategy.
Leasing Strategy means an agreement by which an owner (lessor) of an asset
rents that asset to a second party (lessee). The lessee pays a specified sum of
money, which includes principal and interest, each month as a rental payment.
6. Bundling-pricing strategy
Bundling-pricing strategy means an inclusion of an extra margin in the price to
cover a variety of support functions and services needed to sell and maintain the
product throughout its useful life.
7. Price-Leadership strategy.
This strategy is used by the leading firm in an industry in making major pricing
moves, which are followed by other firms in the industry.
19
8. Pricing strategy to build market share.
This strategy is setting the lowest price possible for a new product, and the
objective is to seek such a cost advantage that it cannot ever be profitably
overcome by any competitor.
2.2.3. Place/distribution strategy
Kotler and Armstrong (2010), define place or distribution as a set of
interdependent organizations involved in the process of making a product available
for use or consumption by consumers. Place strategy in retail stores includes more
than the question of how consumers access the stores, it also includes the
availability of products in such stores (Kotler, 2000).
Based on Jain (2000) there are three strategic alternatives in designing the
distribution strategy, as follow as:
1. Exclusive distribution
Exclusive distribution means that one particular retailer serving a given area is
granted sole rights to carry a product. For example, coach leather goods are
distributed exclusively through select stores in an area. Thus, a company
considering an exclusive distribution strategy should review its decision in the
light of two ground rules, those are:
a) Whether the volume of the product in question is a substantial part of
the total volume for that product type.
b) Whether the exclusive dealership excludes competitive products from a
substantial share of the market.
20
2. Intensive distribution
The inverse of exclusive distribution is intensive distribution. Intensive
distribution makes product available at all possible retail outlets. This may
mean that the product is carried at a wide variety of different and also
competing retail institutions in a given area. The distribution of convenience
goods is most consistent with this strategy.
3. Selective distribution
Between exclusive and intensive distribution, there is selective distribution.
Selective distribution is the strategy in which several but not all retail outlets in
a given area distribute a product. Shopping goods—goods that consumers seek
on the basis of the most attractive price or quality characteristics—are
frequently distributed through selective distribution
2.2.4. Promotion strategy
Promotion means activities that communicate the merits of the product and
persuade target consumers to buy it. The promotions strategy itself includes
personal and non-personal communication activities. Activities that communicate
the merits of the overall product, which includes:
• Personal Selling/ sales force
Based on Jain (2000) Personal selling refers to face to face interaction
with the transmission. Personal selling involves communication in both
directions, from the source of destination and back.
• Advertising / mass or nonpersonal selling.
Advertising is any paid form of nonpersonal presentation and promotion
of ideas, goods, or services by an identified sponsor. (Principles of
Marketing, 13E, Kotler and Armstrong, 2010). Ads can be a cost-
21
effective way to disseminate messages, whether to build a brand
preference or to educate people.
• Sales Promotion.
Sales promotion is Trade deals, samples, coupons, premiums, tie-ins, p-
o-p, displays, sweepstakes, allowances, trade shows, sales rep contests,
events/experiences and more.
• Direct Marketing (also referred to as action or direct response
advertising)--online, direct mail, database management, catalogs,
telemarketing, and direct-response ads. Includes Interactive/Internet/web
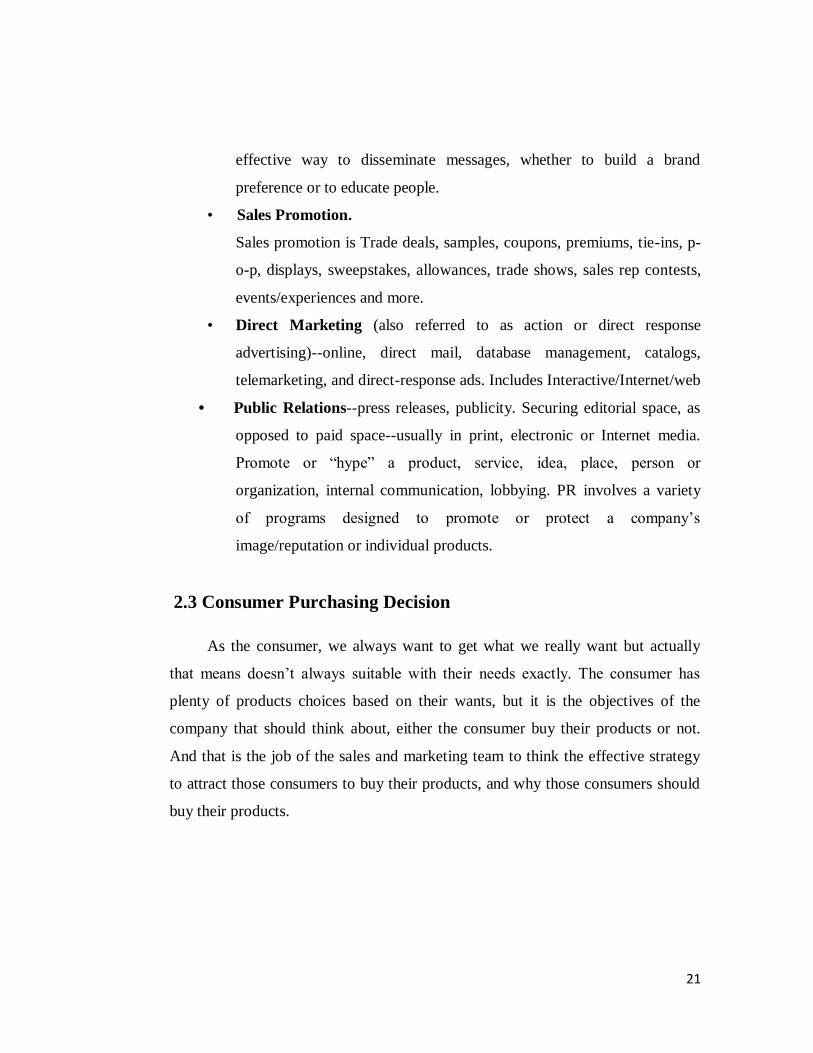
• Public Relations--press releases, publicity. Securing editorial space, as
opposed to paid space--usually in print, electronic or Internet media.
Promote or ―hype‖ a product, service, idea, place, person or
organization, internal communication, lobbying. PR involves a variety
of programs designed to promote or protect a company’s
image/reputation or individual products.
2.3 Consumer Purchasing Decision
As the consumer, we always want to get what we really want but actually
that means doesn’t always suitable with their needs exactly. The consumer has
plenty of products choices based on their wants, but it is the objectives of the
company that should think about, either the consumer buy their products or not.
And that is the job of the sales and marketing team to think the effective strategy
to attract those consumers to buy their products, and why those consumers should
buy their products.
22
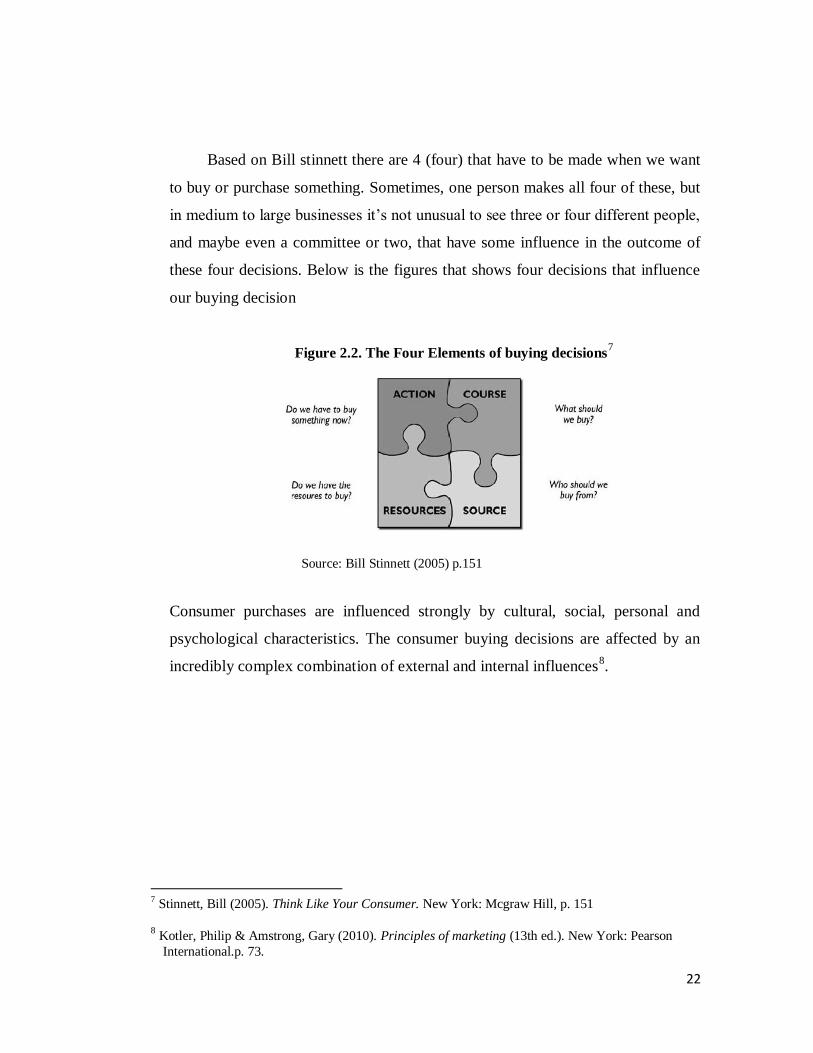
Based on Bill stinnett there are 4 (four) that have to be made when we want
to buy or purchase something. Sometimes, one person makes all four of these, but
in medium to large businesses it’s not unusual to see three or four different people,
and maybe even a committee or two, that have some influence in the outcome of
these four decisions. Below is the figures that shows four decisions that influence
our buying decision
Figure 2.2. The Four Elements of buying decisions7
Source: Bill Stinnett (2005) p.151
Consumer purchases are influenced strongly by cultural, social, personal and
psychological characteristics. The consumer buying decisions are affected by an
incredibly complex combination of external and internal influences8.
7 Stinnett, Bill (2005). Think Like Your Consumer. New York: Mcgraw Hill, p. 151 8 Kotler, Philip & Amstrong, Gary (2010). Principles of marketing (13th ed.). New York: Pearson
International.p. 73.
23
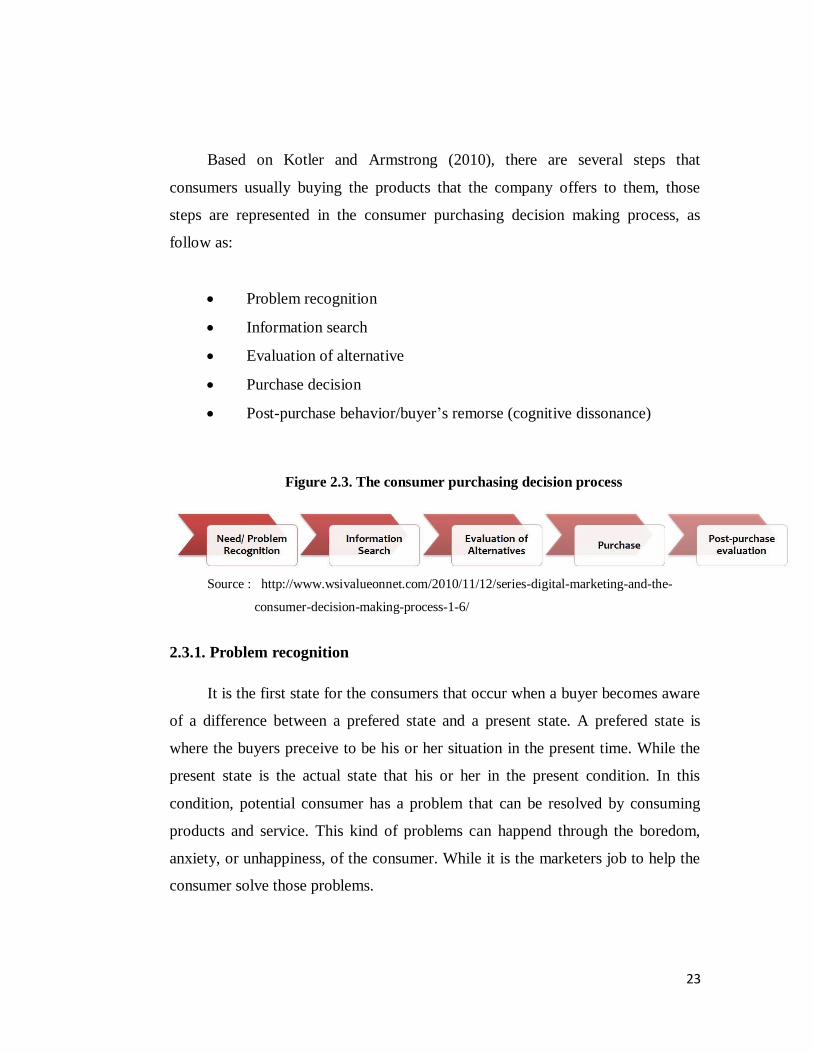
Based on Kotler and Armstrong (2010), there are several steps that
consumers usually buying the products that the company offers to them, those
steps are represented in the consumer purchasing decision making process, as
follow as:
Problem recognition
Information search
Evaluation of alternative
Purchase decision
Post-purchase behavior/buyer’s remorse (cognitive dissonance)
Figure 2.3. The consumer purchasing decision process
Source : http://www.wsivalueonnet.com/2010/11/12/series-digital-marketing-and-the-
consumer-decision-making-process-1-6/
2.3.1. Problem recognition
It is the first state for the consumers that occur when a buyer becomes aware
of a difference between a prefered state and a present state. A prefered state is
where the buyers preceive to be his or her situation in the present time. While the
present state is the actual state that his or her in the present condition. In this
condition, potential consumer has a problem that can be resolved by consuming
products and service. This kind of problems can happend through the boredom,
anxiety, or unhappiness, of the consumer. While it is the marketers job to help the
consumer solve those problems.
24
2.3.2. Information search
This is the second stage in buyers decision process, in which the consumer is
likely to search for more information about the products that they needed; the
consumer may simply have heightened attention or may go into active information
search.
Consumers can obtain information from any of several sources. These
include personal sources (family, friends, neighbors, acquintances), commercial
sources (advertising, sales people, dealer web sites, packaging, displays), public
sources (mass media, consumer rating organizations, internet searches), and
experiential sources (handling, examining, using the product). This relative
influence of these information sources vary with the product and the buyer.
2.3.3. Evaluation alternatives
This third stage of buying decision process means that after the consumers
collect all the infromation about the products from the searching then they
evaluates each of alternatives for the products brands that that could potentially
fulfill their needs. Sometimes there is a consumers that use a carefull calculations
and logical thinking when evaluating the alternatives. But in the other times some
consumers make buying decisions rely on their friends or the salespeople buying
advice without using their own calculations in decides the alternatives of the
products brands. For consumers of pet foods in this stage, they will evaluate the
alternatives of each brand of pet foods.
2.3.4. Purchase decision
It is the stage that indicate the buyers decision about which product to
purchase based on the alternatives that they have evaluate before. In this stage
represents the activities that occur during the final decision making and actual
purchase of products.
25
2.3.5. Post purchase behavior
The buyers decision process in which consumers take further action after
purchasing the product, based on their level of satisfaction or dissatisfaction. In
this final stage of the purchasing decision, this stage can be critical importance to
both consumer and to the future marketing sales potential. Consumer may buy or
not buy the product in the future. In this stage also the marketing should get
feedback from the consumer about their products, to either improve the product or
analyze what missing in the product.
2.4 The Relationship between Marketing Mix Strategy towards
Consumer Purchasing Decision
The relationship between marketing mix strategy towards is very close.
Cause with the right marketing mix strategy will create the consumer purchasing
decision to buy the products that they needs. The marketing mix as one of the
stimulus or supporting factors toward the consumer purchasing decision.
Marketing mix variable that are consist of product, price, promotion and place
have an important task to influence the consumer purchasing decision. While
setting the right and appropriate marketing mix, it will support the consumer
response to do the purchasing decision.
26
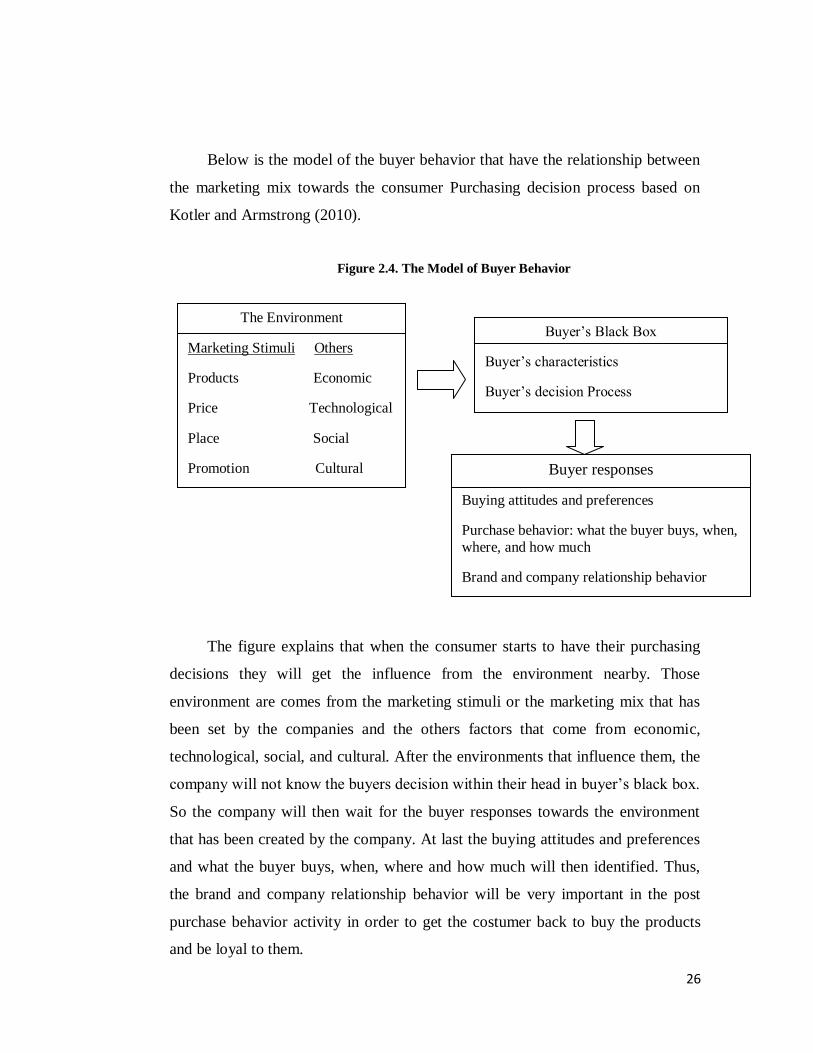
Below is the model of the buyer behavior that have the relationship between
the marketing mix towards the consumer Purchasing decision process based on
Kotler and Armstrong (2010).
Figure 2.4. The Model of Buyer Behavior
The figure explains that when the consumer starts to have their purchasing
decisions they will get the influence from the environment nearby. Those
environment are comes from the marketing stimuli or the marketing mix that has
been set by the companies and the others factors that come from economic,
technological, social, and cultural. After the environments that influence them, the
company will not know the buyers decision within their head in buyer’s black box.
So the company will then wait for the buyer responses towards the environment
that has been created by the company. At last the buying attitudes and preferences
and what the buyer buys, when, where and how much will then identified. Thus,
the brand and company relationship behavior will be very important in the post
purchase behavior activity in order to get the costumer back to buy the products
and be loyal to them.
The Environment
Marketing Stimuli Others
Products Economic
Price Technological
Place Social
Promotion Cultural
Buyer’s Black Box
Buyer’s characteristics
Buyer’s decision Process
Buyer responses
Buying attitudes and preferences
Purchase behavior: what the buyer buys, when,
where, and how much
Brand and company relationship behavior
27
CHAPTER III
RESEARCH METHODOLOGY
This chapter will discuss about the methodology that is used for this
research. This chapter consist of research method, research framework, research
instrument, sampling design and statistical treatment.
3.1 Research Method
A research methodology defines what the activity of research is, how to
proceed, how to measure progress, and what constitutes success. Research
methodologies consist of two method that is qualitative method and quantitative
method. Qualitative research is viewed as more restrictive in testing hypotheses
because it is extremely expensive and time consuming, and typically limited to a
single set of research subjects. Qualitative research is often used as a method of
exploratory research as a basis for later quantitative research hypotheses. While
the quantitative research is a systematic empirical investigation of quantitative
properties and phenomena and their relationships. Asking a narrow question and
collecting numerical data to analyze utilizing statistical methods. The quantitative
research designs are experimental, correlation, and survey (or descriptive).
In this research method, the researcher will describe the procedure that
would be use in the process of making this research. The processes are by using
sampling design, and selecting respondents and set of questionnaire, validation and
reliability process. After all the data that has been collected through the
questionnaire, the researcher then will process the data using the statistical tool.
This research is a quantitative research in which the researcher used
correlation analytic method which describes the degree of relationship between
28
two variables. The purpose of quantitative researcher is often used for theory
testing, requiring that the researcher maintain a distance from the researcher so as
not to bias result9.
This research will analyze the relationship between two variables. The
independent variable will be the marketing mix that has been implemented by Pro
Plan while the dependent variable is consumer purchasing decision. This research
will use the regression analysis to find the correlation between the independent
variables and the dependent variables.
This research will only use the primary data. The primary data was taken
from the distributed questionnaire. It seemed to be the most appropriate
methodology to be utilized because the researcher could gather the availability of
the information and to measure the accuracy and consistency of the data.
3.2 Research Framework
The research framework consist of problem statements, literature study,
questionnaire, collect the primary data, validity & reliability testing, process the
data, analysis interpretation of data, conclusion and recommendation. Below are
the more explanation of the research framework.
a. Problem statement
This research will start from the problem statement that is there any
relationship between marketing mix variable toward consumer purchasing
decision, and what are the most significance variable of marketing mix
that influencing consumer to buy Pro Plan.
9 Cooper, Donald & Schindler, Pamela S. (2006). Marketing Research, 4th edition, New York: Mcgraw
Hill, p. 216.
29
b. Literature Study
After getting the statement of the problem, the researcher then continue to
find any theories that are relevant to the studies of the problem
statements.
c. Questionnaire
The next action is the researcher conduct the pre test questionnaire,
whether the questionnaire can be accepted by the respondents. After
conduct the pre test questionnaire the researcher then makes the
questionnaire and spread the questionnaire to the respondents.
d. Collecting the primary data
After get the questionnaire from the respondents, the researcher then
calculate the data from the questionnaire.
e. Validity & reliability testing
Then, the researcher conduct the validity and reliability testing by using
SPSS
f. Process the data
After through the validity and reliability testing then the researcher
process the data to find the correlation between variable X and Y by using
SPSS
g. Analysis and interpretation of data
The researcher then will continue to analyze and interpret the data that
has been calculated by SPSS.
30
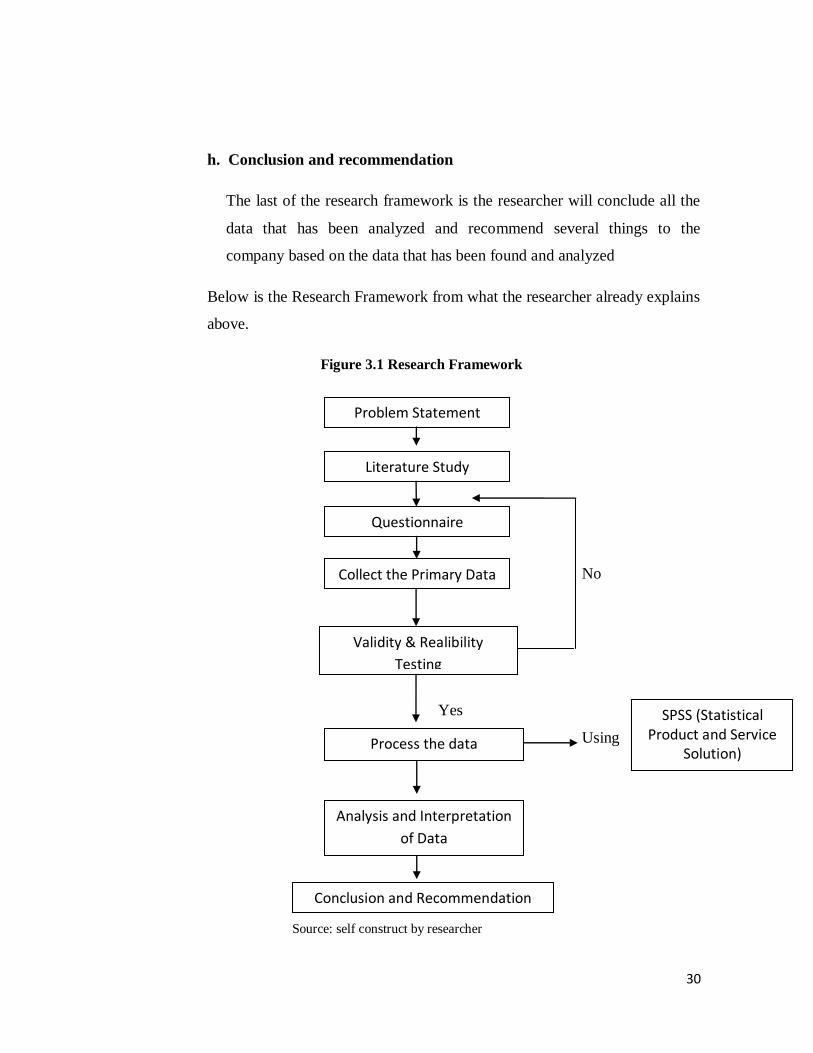
h. Conclusion and recommendation
The last of the research framework is the researcher will conclude all the
data that has been analyzed and recommend several things to the
company based on the data that has been found and analyzed
Below is the Research Framework from what the researcher already explains
above.
Figure 3.1 Research Framework
No
Yes
Using
Source: self construct by researcher
Problem Statement
Literature Study
Questionnaire
Validity & Realibility
Testing
Collect the Primary Data
Process the data
Analysis and Interpretation
of Data
Conclusion and Recommendation
SPSS (Statistical Product and Service
Solution)
31
3.3 Research Instrument
3.3.1. Data collection tools
The researcher used a survey as a method in collecting data. Survey can be
defined as a structured questionnaire given to a sample of a population and
designed to elicit specific information from respondents10
.The research then will
use questionnaire to gather all the data. The reason of choosing questionnaire is
faster and cheaper to gather the data. Researcher can also complete the survey as
the targeted time as well as in the lowest cost.
The questionnaire will identified the relationship between marketing mix
variables towards consumer purchasing decision by using close ended questions,
so the respondents need to choose several answer provided. The questionnaire
divided into three parts. The first part is about respondent’s profile, second part is
about the variable x which is the marketing mix components; those are product,
price, place, promotion, and the last part will explain about the consumer
purchasing decision variables.
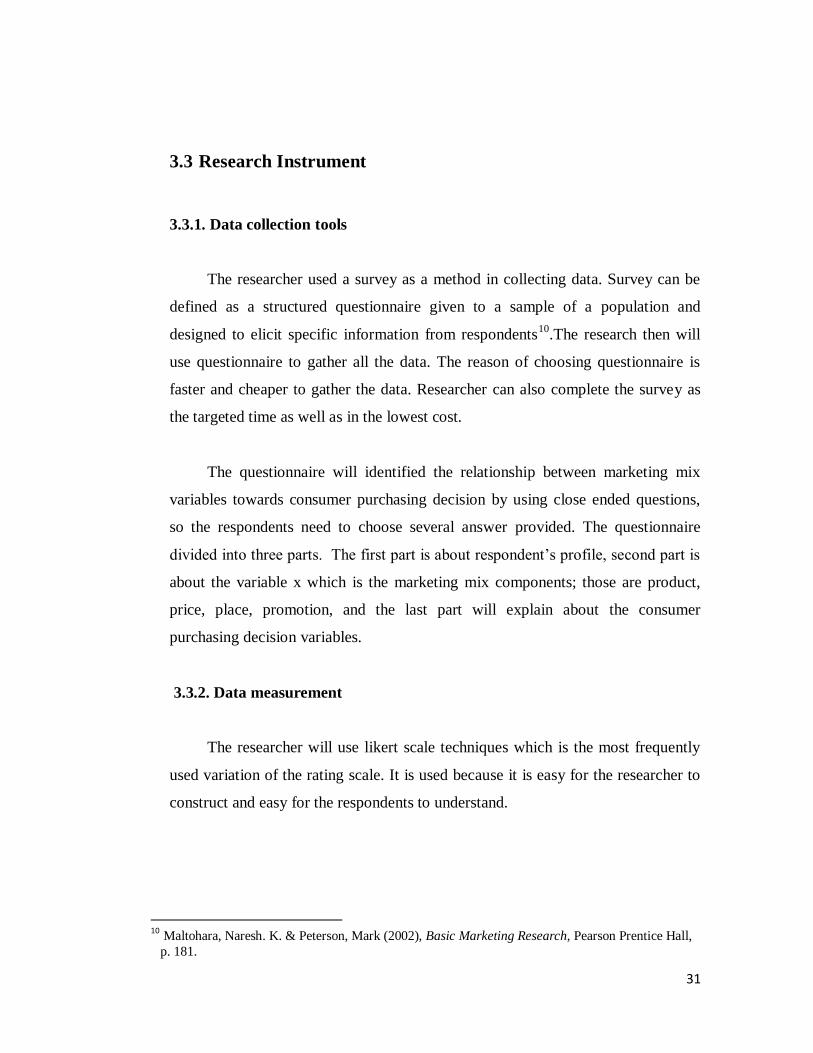
3.3.2. Data measurement
The researcher will use likert scale techniques which is the most frequently
used variation of the rating scale. It is used because it is easy for the researcher to
construct and easy for the respondents to understand.
10
Maltohara, Naresh. K. & Peterson, Mark (2002), Basic Marketing Research, Pearson Prentice Hall,
p. 181.
32
Table 3.1 Likert Scale
Scale Rating
1 Strongly disagree
2 Disagree
3 Neutral
4 Agree
5 Strongly agree
Source : Adapted from Cooper and Schindler (2006)
3.4. Sampling Design
3.4.1. Size of the population
Based on Cooper and Schindler, (2006, p.434) population is defined as the
total collection of elements about which we wish to make some inferences. Size
of the population in this study is people who buy Pro Plan in the Pekayon pet shop.
Research limit the scope of research, only people who come and buy Pro Plan in
Pekayon pet shop only.
3.4.2. Sampling techniques applied
According to Cooper and Schindler ,(2006, p.321) sample is a part of the
target population, carefully selected to represent that population. In this research,
the researcher would like to use purposive sampling. Purposive sampling is a non
probability sample that conforms to certain criteria (Cooper and Schindler ,2006,
p.424).
33
Purposive sampling divided into two types which are, Judgment sampling
and quota sampling. In this research, the researcher would like to use Judgment
sampling. Judgment sampling is purposive sampling where the researcher arbitrary
selects sample units to conform to some criterion. (Cooper and Schindler,2006,
p.424).
According to the central limit theorem the sample means will be distributed
around the population, mean approximately in a normal distribution. Many
statisticians consider a sample of 30 or more to be large enough for the central
limit theorem to be employed11
.
Based on the theory above, the researcher then selects 50 people as the
respondents for this research due to time and cost limitation. Determining the
sample size for non-probability sample is usually subjective and arbitrary by the
researcher based on the researcher experience and judgment or the amount of
resources available.
3.5. Statistical Treatment
3.5.1. Pre testing
Before finalizing the questionnaire, pre testing was conducted on the entire
questionnaire. Pre testing refers to testing the questionnaire on a small sample of
respondents for the purpose of improving the questionnaire by identifying the
questionnaire and eliminating potential problems before using it in the actual
survey ( Maholtra and Peterson, 2002, p.307). The pre testing was conducted to 20
respondents within people who buy Pro Plan in Pekayon Pet shop.
11
Lind, Douglas A., Marchal, William G., & Mason, Rober D. (2003), Statistical Techniques in
Business and Economics, 11th edition, p. 278
34
3.5.2. Validity
The content validity of a measuring instrument is the extent to which it
provides adequate coverage of the investiagte questions guiding the study (Cooper
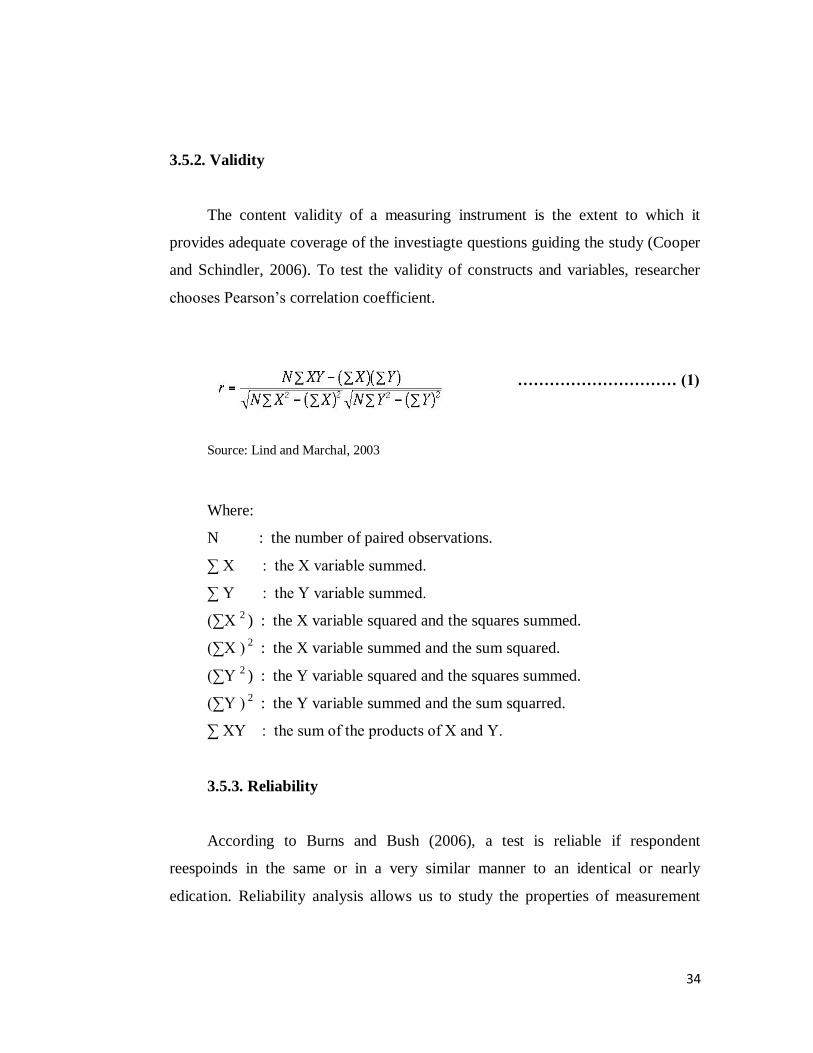
and Schindler, 2006). To test the validity of constructs and variables, researcher
chooses Pearson’s correlation coefficient.
………………………… (1) ...
Source: Lind and Marchal, 2003
Where:
N : the number of paired observations.
∑ X : the X variable summed.
∑ Y : the Y variable summed.
(∑X 2 ) : the X variable squared and the squares summed.
(∑X ) 2
: the X variable summed and the sum squared.
(∑Y 2 ) : the Y variable squared and the squares summed.
(∑Y ) 2
: the Y variable summed and the sum squarred.
∑ XY : the sum of the products of X and Y.
3.5.3. Reliability
According to Burns and Bush (2006), a test is reliable if respondent
reespoinds in the same or in a very similar manner to an identical or nearly
edication. Reliability analysis allows us to study the properties of measurement

35
scales and the items that make them up12
. In this case the researcher will using
Cronbach alpha to do the reliability testing.
…………………..…...…….…. (2)
Source: http://en.wikipedia.org.wiki/cronbach’s_alpha
Where:
α : ( Cronbach alpha) instrument reliability
r : average of correlation between items
K : number of times
3.5.4. Sample mean
The sample mean is used to identify what is the mean of each answer in each
variable. Thus, the researcher will use the formula below to find the mean.
X =∑ X
𝑛 ………………………..…...…….…………………. (3)
Source : Lind and Marchal, 2003.
Where :
X : sample mean
n : number in the sample
∑ X : total number in each variable
12
Lind, Douglas A., Marchal, William G., & Mason, Rober D. (2003), Statistical Techniques in
Business and Economics, 11th edition, p. 278
36
3.5.5. Testing the hypothesis
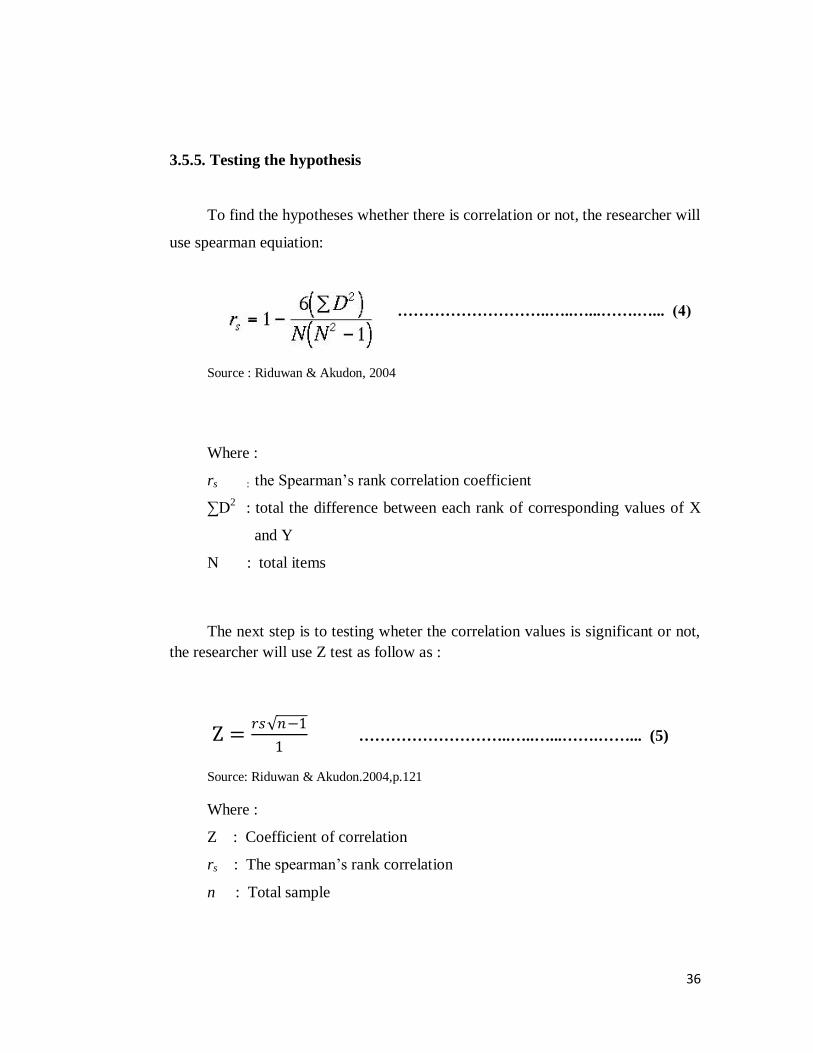
To find the hypotheses whether there is correlation or not, the researcher will
use spearman equiation:
………………………..…..…...…….…... (4)
Source : Riduwan & Akudon, 2004
Where :
rs : the Spearman’s rank correlation coefficient
∑D2 : total the difference between each rank of corresponding values of X
and Y
N : total items
The next step is to testing wheter the correlation values is significant or not,
the researcher will use Z test as follow as :
Z =𝑟𝑠 𝑛−1
1 ………………………..…..…...…….……... (5)
Source: Riduwan & Akudon.2004,p.121
Where :
Z : Coefficient of correlation
rs : The spearman’s rank correlation
n : Total sample
37
3.6. Limitations
The researcher will use statistical data through questionnaire that will be
spread out to the people who buying Pro Plan in Pekayon pet shop only. The
reason of choosing statistical data of questionnaire is because of the accurately and
easy to get. Statistical data is involved into one category to test the hypothesis. The
category is to test the relationship of marketing mix Pro Plan to consumer
purchasing decision. The statistical data is developed by Statistical Product and
Service Solution (SPSS) software to construct data which are got from the
questionnaire.
38
CHAPTER IV
ANALYSIS OF DATA AND
INTERPRETATION OF RESULTS
This chapter will discuss concerning the analysis of the data gathered during
research. It will answer each problems that stated in the statement of problems.
This chapter consist of the respondent data, descriptive analysis of data, the
relationship between marketing mix and consumer purchasing decision, hypothesis
testing, and the descriptive analysis of most significant marketing mix variables.
4.1 Respondent Data
Respondent data will consist of the data about the respondents gender, age,
length of using Pro Plan, expense and the frequency rate of buying Pro Plan within
one month.
4.1.1 Gender
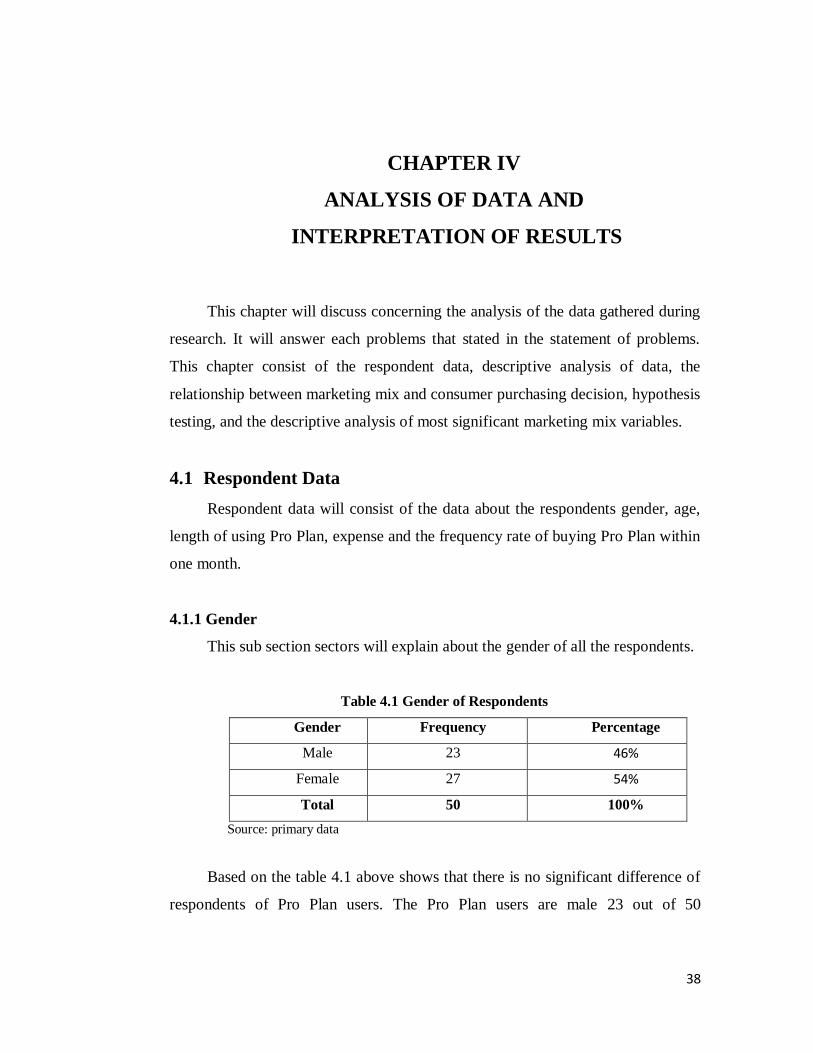
This sub section sectors will explain about the gender of all the respondents.
Table 4.1 Gender of Respondents
Gender Frequency Percentage
Male 23 46%
Female 27 54%
Total 50 100%
Source: primary data
Based on the table 4.1 above shows that there is no significant difference of
respondents of Pro Plan users. The Pro Plan users are male 23 out of 50
39
respondents (46%) and the rest is female 27 out of 50 respondents (54%). So
gender is not really the issue of using pet foods.
4.1.2 Age
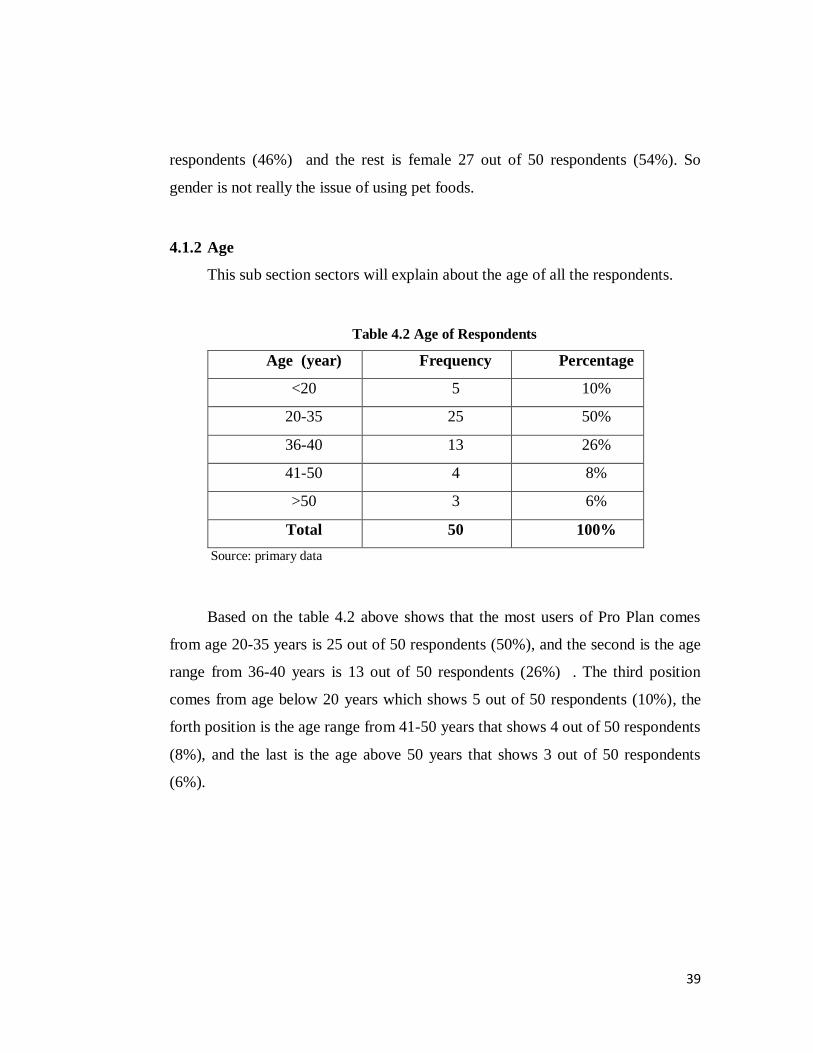
This sub section sectors will explain about the age of all the respondents.
Table 4.2 Age of Respondents
Age (year) Frequency Percentage
<20 5 10%
20-35 25 50%
36-40 13 26%
41-50 4 8%
>50 3 6%
Total 50 100%
Source: primary data
Based on the table 4.2 above shows that the most users of Pro Plan comes
from age 20-35 years is 25 out of 50 respondents (50%), and the second is the age
range from 36-40 years is 13 out of 50 respondents (26%) . The third position
comes from age below 20 years which shows 5 out of 50 respondents (10%), the
forth position is the age range from 41-50 years that shows 4 out of 50 respondents
(8%), and the last is the age above 50 years that shows 3 out of 50 respondents
(6%).
40
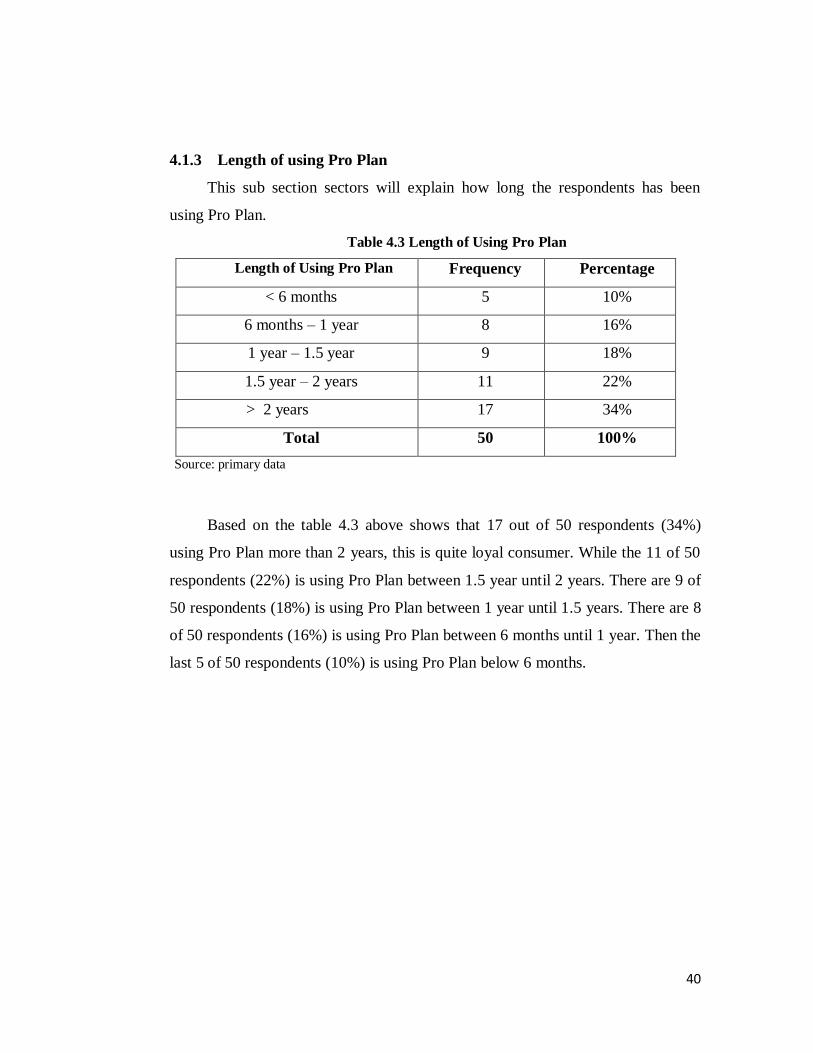
4.1.3 Length of using Pro Plan
This sub section sectors will explain how long the respondents has been
using Pro Plan.
Table 4.3 Length of Using Pro Plan
Length of Using Pro Plan Frequency Percentage
< 6 months 5 10%
6 months – 1 year 8 16%
1 year – 1.5 year 9 18%
1.5 year – 2 years 11 22%
> 2 years 17 34%
Total 50 100%
Source: primary data
Based on the table 4.3 above shows that 17 out of 50 respondents (34%)
using Pro Plan more than 2 years, this is quite loyal consumer. While the 11 of 50
respondents (22%) is using Pro Plan between 1.5 year until 2 years. There are 9 of
50 respondents (18%) is using Pro Plan between 1 year until 1.5 years. There are 8
of 50 respondents (16%) is using Pro Plan between 6 months until 1 year. Then the
last 5 of 50 respondents (10%) is using Pro Plan below 6 months.
41
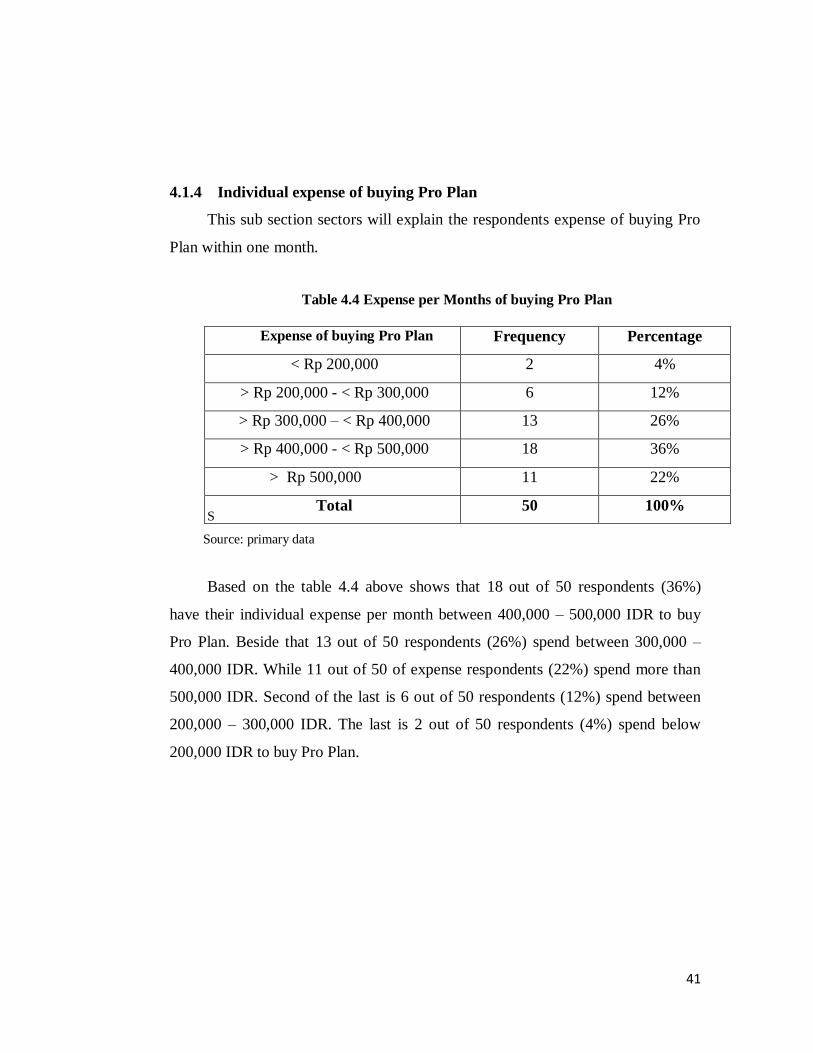
4.1.4 Individual expense of buying Pro Plan
This sub section sectors will explain the respondents expense of buying Pro
Plan within one month.
Table 4.4 Expense per Months of buying Pro Plan
S
Source: primary data
Based on the table 4.4 above shows that 18 out of 50 respondents (36%)
have their individual expense per month between 400,000 – 500,000 IDR to buy
Pro Plan. Beside that 13 out of 50 respondents (26%) spend between 300,000 –
400,000 IDR. While 11 out of 50 of expense respondents (22%) spend more than
500,000 IDR. Second of the last is 6 out of 50 respondents (12%) spend between
200,000 – 300,000 IDR. The last is 2 out of 50 respondents (4%) spend below
200,000 IDR to buy Pro Plan.
Expense of buying Pro Plan Frequency Percentage
< Rp 200,000 2 4%
> Rp 200,000 - < Rp 300,000 6 12%
> Rp 300,000 – < Rp 400,000 13 26%
> Rp 400,000 - < Rp 500,000 18 36%
> Rp 500,000 11 22%
Total 50 100%
42
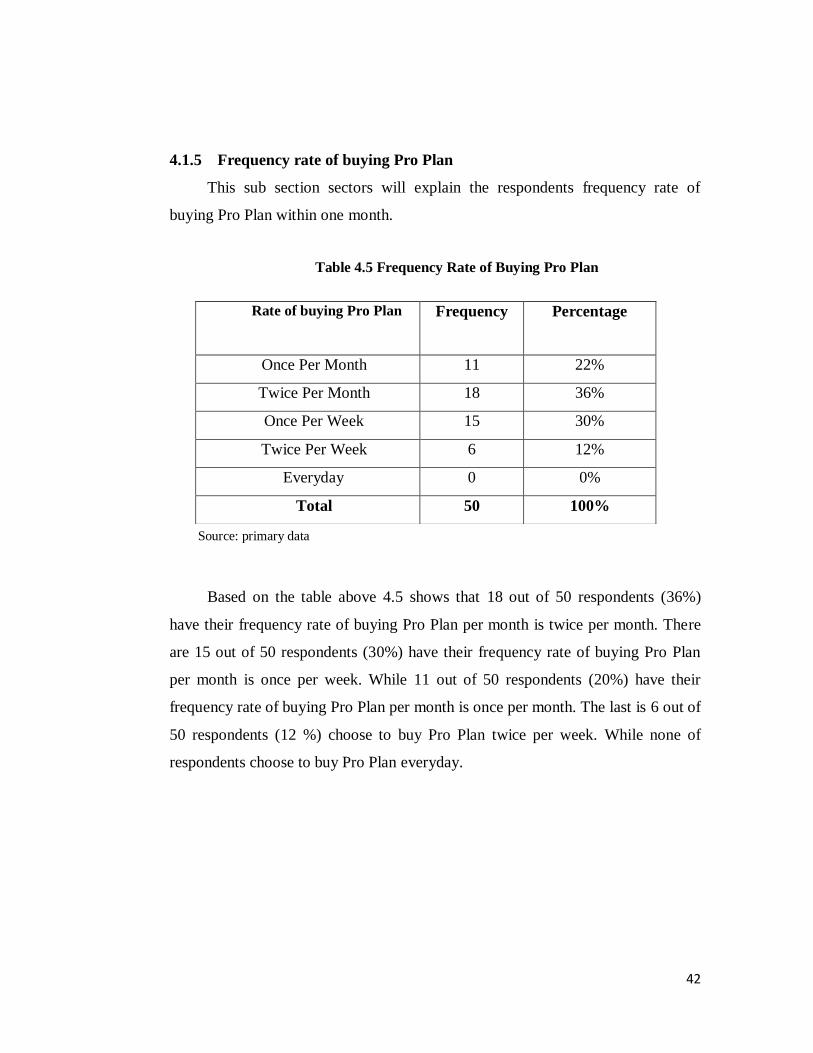
4.1.5 Frequency rate of buying Pro Plan
This sub section sectors will explain the respondents frequency rate of
buying Pro Plan within one month.
Table 4.5 Frequency Rate of Buying Pro Plan
Source: primary data
Based on the table above 4.5 shows that 18 out of 50 respondents (36%)
have their frequency rate of buying Pro Plan per month is twice per month. There
are 15 out of 50 respondents (30%) have their frequency rate of buying Pro Plan
per month is once per week. While 11 out of 50 respondents (20%) have their
frequency rate of buying Pro Plan per month is once per month. The last is 6 out of
50 respondents (12 %) choose to buy Pro Plan twice per week. While none of
respondents choose to buy Pro Plan everyday.
Rate of buying Pro Plan
Frequency Percentage
Once Per Month 11 22%
Twice Per Month 18 36%
Once Per Week 15 30%
Twice Per Week 6 12%
Everyday 0 0%
Total 50 100%
43
4.2. Descriptive Analysis
Through this descriptive analysis of data, the researcher will explain how the
validity testing and the reliability testing has been done.
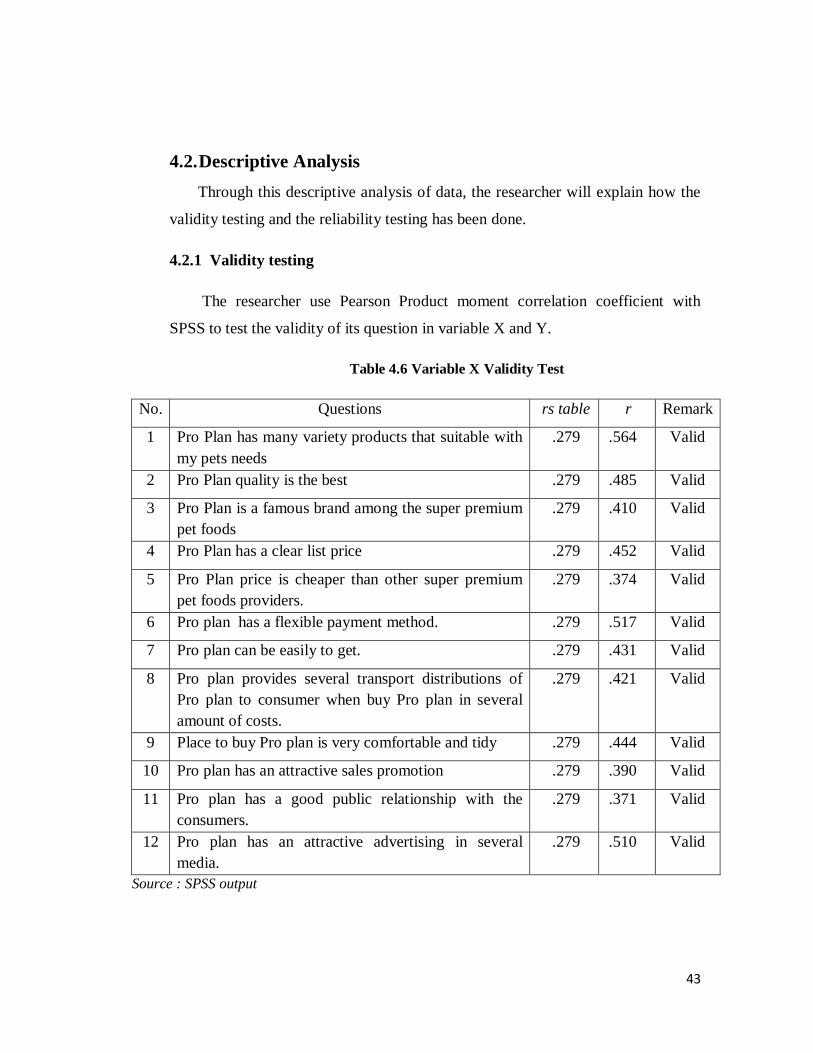
4.2.1 Validity testing
The researcher use Pearson Product moment correlation coefficient with
SPSS to test the validity of its question in variable X and Y.
Table 4.6 Variable X Validity Test
No. Questions rs table r Remark
1 Pro Plan has many variety products that suitable with
my pets needs
.279 .564 Valid
2 Pro Plan quality is the best .279 .485 Valid
3 Pro Plan is a famous brand among the super premium
pet foods
.279 .410 Valid
4 Pro Plan has a clear list price .279 .452 Valid
5 Pro Plan price is cheaper than other super premium
pet foods providers.
.279 .374 Valid
6 Pro plan has a flexible payment method. .279 .517 Valid
7 Pro plan can be easily to get. .279 .431 Valid
8 Pro plan provides several transport distributions of
Pro plan to consumer when buy Pro plan in several
amount of costs.
.279 .421 Valid
9 Place to buy Pro plan is very comfortable and tidy .279 .444 Valid
10 Pro plan has an attractive sales promotion .279 .390 Valid
11 Pro plan has a good public relationship with the
consumers.
.279 .371 Valid
12 Pro plan has an attractive advertising in several
media.
.279 .510 Valid
Source : SPSS output
44
The table 4.6 above the researcher has conclude that all of the 12 questions to
test marketing mix variables (X) are valid, because all the r computations are
bigger than rs table .279.
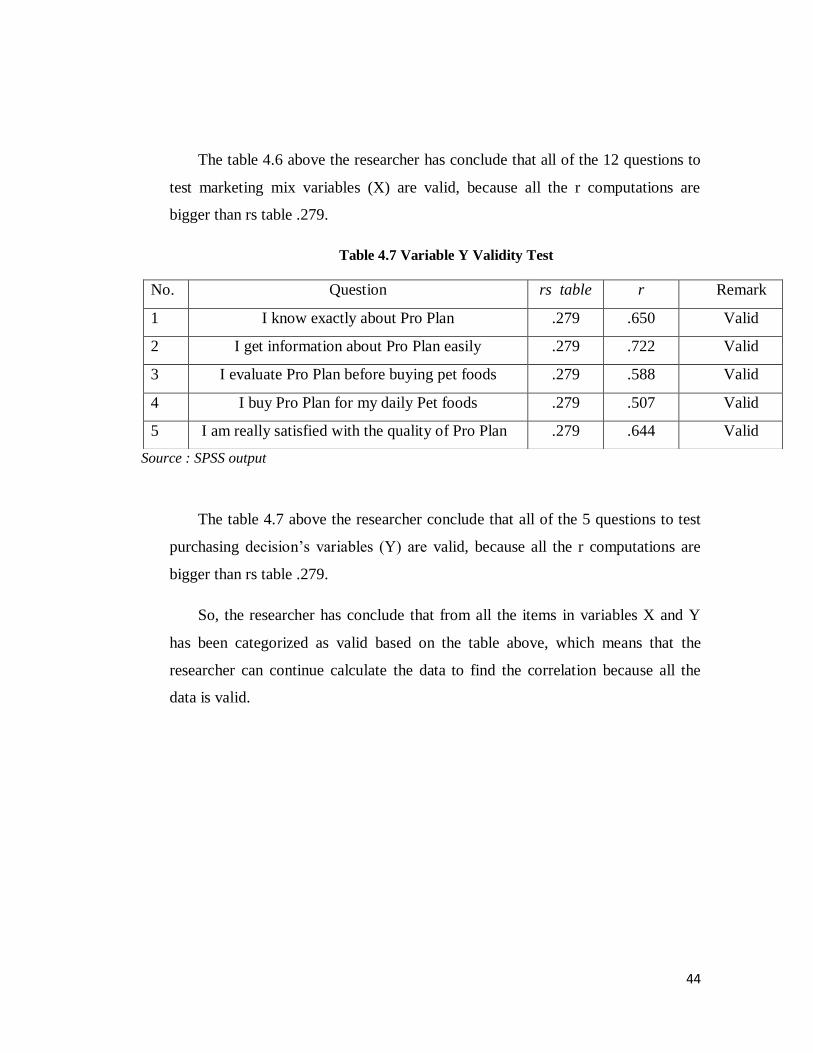
Table 4.7 Variable Y Validity Test
Source : SPSS output
The table 4.7 above the researcher conclude that all of the 5 questions to test
purchasing decision’s variables (Y) are valid, because all the r computations are
bigger than rs table .279.
So, the researcher has conclude that from all the items in variables X and Y
has been categorized as valid based on the table above, which means that the
researcher can continue calculate the data to find the correlation because all the
data is valid.
No. Question rs table r Remark
1 I know exactly about Pro Plan .279 .650 Valid
2 I get information about Pro Plan easily .279 .722 Valid
3 I evaluate Pro Plan before buying pet foods .279 .588 Valid
4 I buy Pro Plan for my daily Pet foods .279 .507 Valid
5 I am really satisfied with the quality of Pro Plan .279 .644 Valid
45
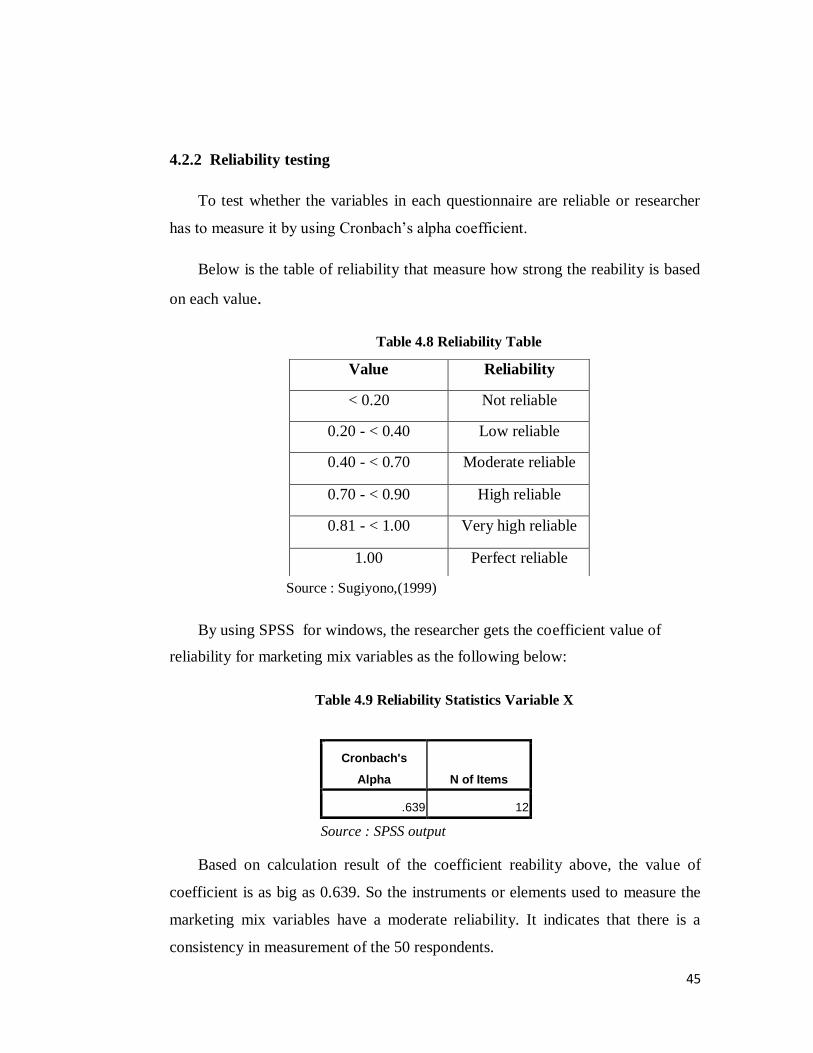
4.2.2 Reliability testing
To test whether the variables in each questionnaire are reliable or researcher
has to measure it by using Cronbach’s alpha coefficient.
Below is the table of reliability that measure how strong the reability is based
on each value.
Table 4.8 Reliability Table
Source : Sugiyono,(1999)
By using SPSS for windows, the researcher gets the coefficient value of
reliability for marketing mix variables as the following below:
Table 4.9 Reliability Statistics Variable X
Source : SPSS output
Based on calculation result of the coefficient reability above, the value of
coefficient is as big as 0.639. So the instruments or elements used to measure the
marketing mix variables have a moderate reliability. It indicates that there is a
consistency in measurement of the 50 respondents.
Value Reliability
< 0.20 Not reliable
0.20 - < 0.40 Low reliable
0.40 - < 0.70 Moderate reliable
0.70 - < 0.90 High reliable
0.81 - < 1.00 Very high reliable
1.00 Perfect reliable
Cronbach's
Alpha N of Items
.639 12
46
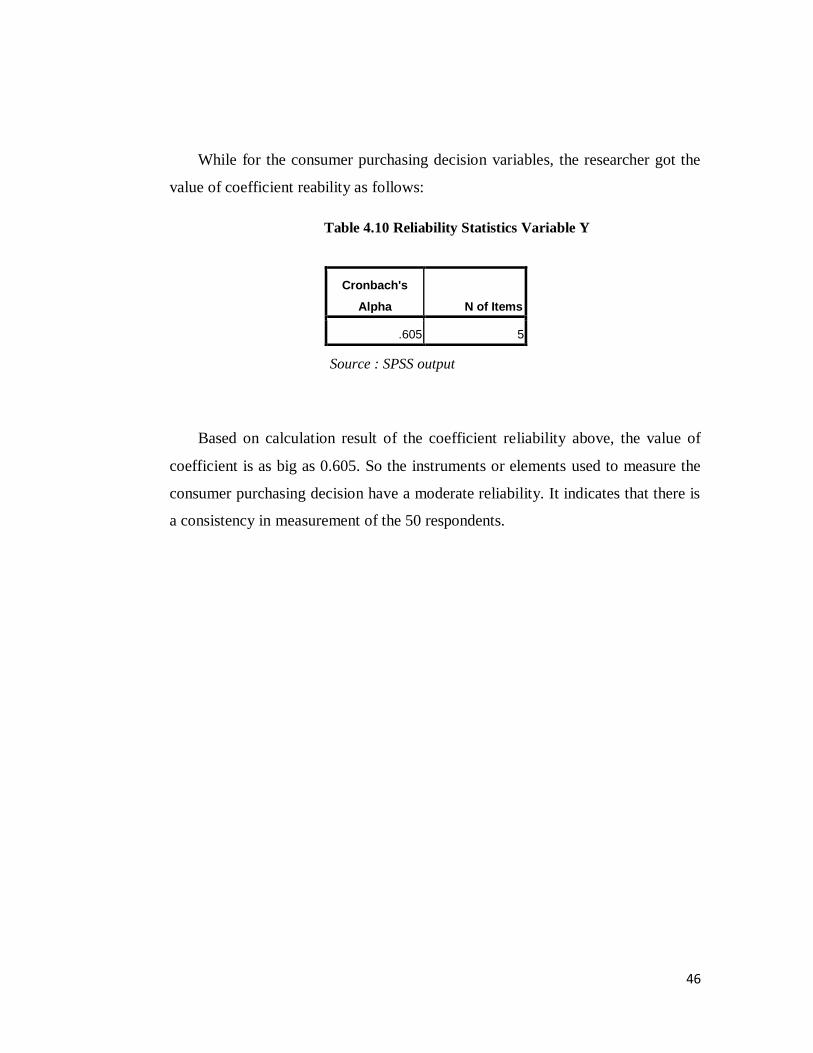
While for the consumer purchasing decision variables, the researcher got the
value of coefficient reability as follows:
Table 4.10 Reliability Statistics Variable Y
Source : SPSS output
Based on calculation result of the coefficient reliability above, the value of
coefficient is as big as 0.605. So the instruments or elements used to measure the
consumer purchasing decision have a moderate reliability. It indicates that there is
a consistency in measurement of the 50 respondents.
Cronbach's
Alpha N of Items
.605 5
47
4.3. The Relationship between Marketing Mix (X) and Consumer
Purchasing Decision (Y)
The relationship between marketing mix variables and consumer purchasing
decision of Pro Plan can be seen through the spearman’s rank correlation test. To
see the relationship between two variables, the researcher has to use hypothesis
test below:
H0 : = 0 (marketing mix variables has no relationship towards consumer
purchasing decision of Pro Plan)
H1 : ≠ 0 (marketing mix variables has a relationship towards consumer
purchasing decision of Pro Plan)
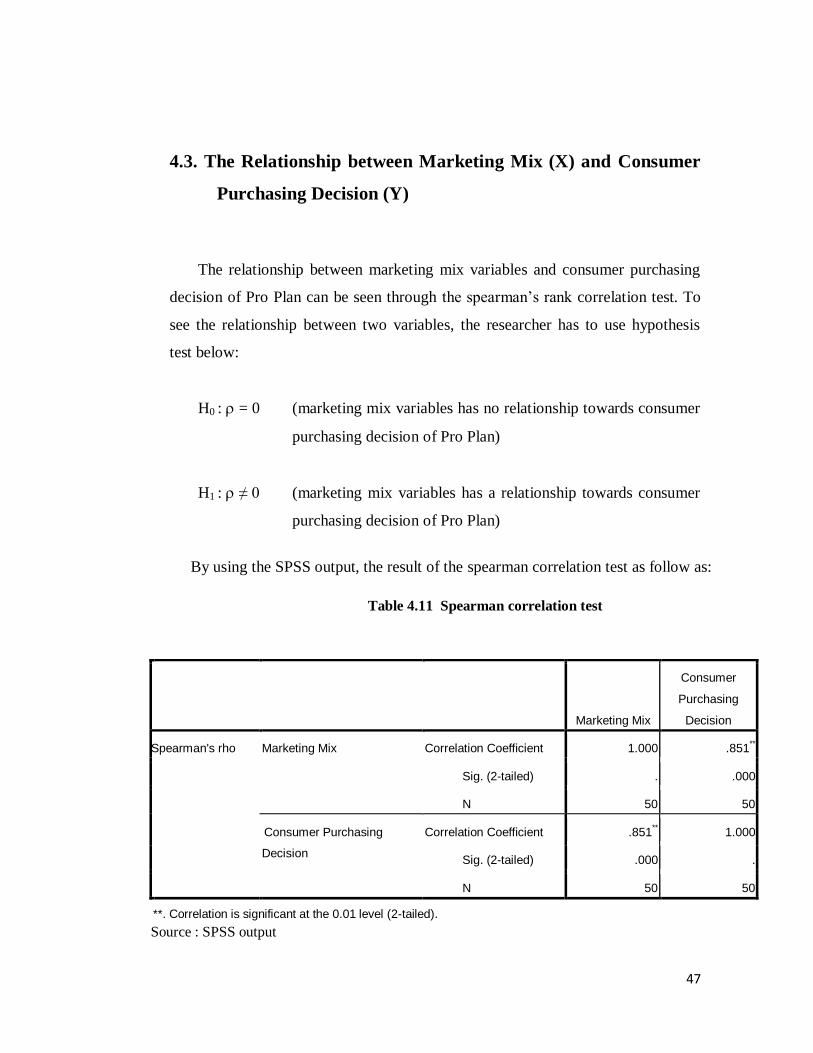
By using the SPSS output, the result of the spearman correlation test as follow as:
Table 4.11 Spearman correlation test
Marketing Mix
Consumer
Purchasing
Decision
Spearman's rho Marketing Mix Correlation Coefficient 1.000 .851**
Sig. (2-tailed) . .000
N 50 50
Consumer Purchasing
Decision
Correlation Coefficient .851** 1.000
Sig. (2-tailed) .000 .
N 50 50
**. Correlation is significant at the 0.01 level (2-tailed).
Source : SPSS output
48
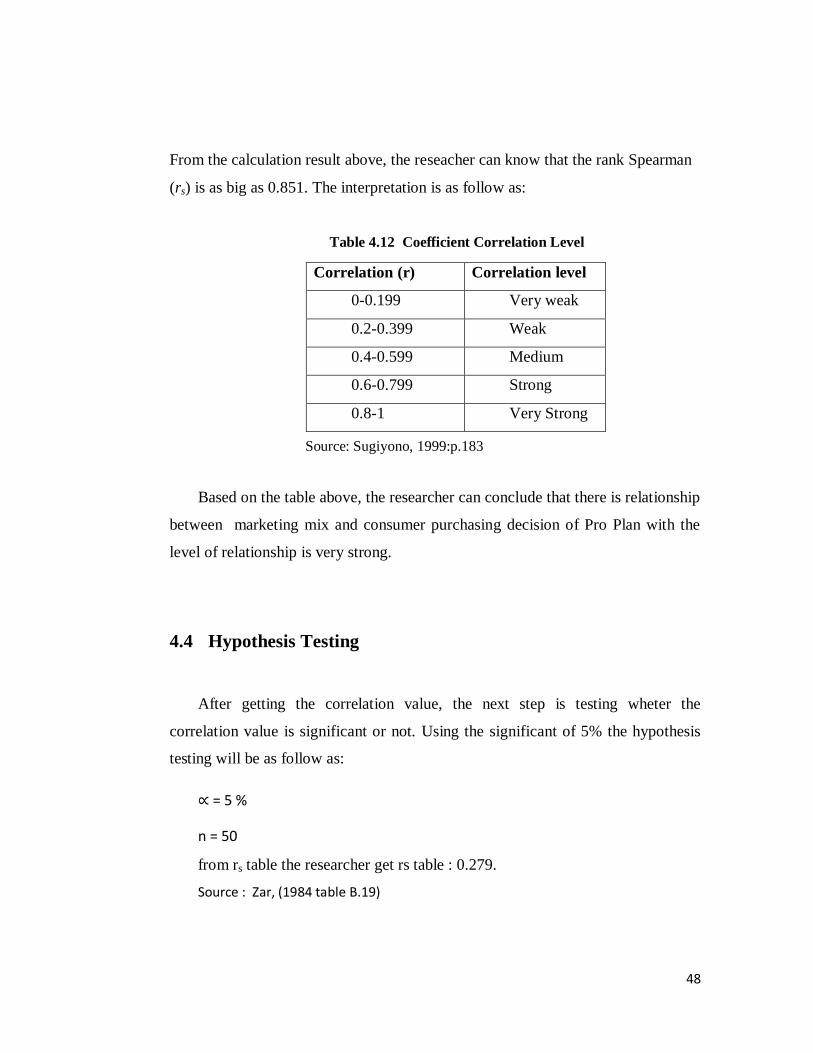
From the calculation result above, the reseacher can know that the rank Spearman
(rs) is as big as 0.851. The interpretation is as follow as:
Table 4.12 Coefficient Correlation Level
Source: Sugiyono, 1999:p.183
Based on the table above, the researcher can conclude that there is relationship
between marketing mix and consumer purchasing decision of Pro Plan with the
level of relationship is very strong.
4.4 Hypothesis Testing
After getting the correlation value, the next step is testing wheter the
correlation value is significant or not. Using the significant of 5% the hypothesis
testing will be as follow as:
∝ = 5 %
n = 50
from rs table the researcher get rs table : 0.279.
Source : Zar, (1984 table B.19)
Correlation (r) Correlation level
0-0.199 Very weak
0.2-0.399 Weak
0.4-0.599 Medium
0.6-0.799 Strong
0.8-1 Very Strong
49
H0 : rs = 0 (marketing mix variables has no relationship towards consumer
purchasing decision of Pro Plan)
H1 : rs ≠ 0 (marketing mix variables has a relationship towards consumer
purchasing decision of Pro Plan)
Criteria test: reject H0 if rs > rs table
0.851 > 0.279, so H0 rejected and H1 accepted
Based on the correlation rank Spearman value before, so the researcher got the Z
score as big as:
Z =𝑟𝑠 𝑛 − 1
1
Z =0.851 50−1
1 : 5.957
The Z table with the significant of 5 % can be found that the Z table will be 1.96
If Z score > Z table, it means accept H1
Z score > Z table, it means accept H1
The result is 5.957 > 1.96, so H1 accepted, and it is means that there is significance
correlation between marketing mix towards consumer purchasing decision of Pro
Plan.
50
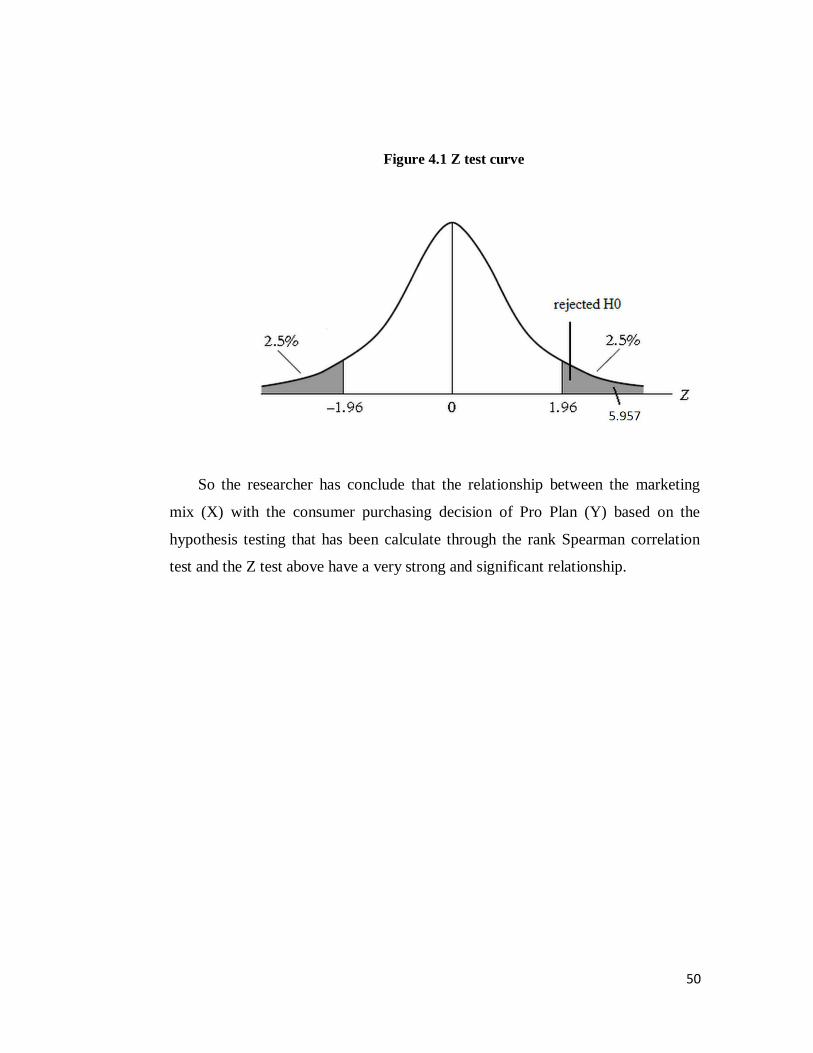
Figure 4.1 Z test curve
So the researcher has conclude that the relationship between the marketing
mix (X) with the consumer purchasing decision of Pro Plan (Y) based on the
hypothesis testing that has been calculate through the rank Spearman correlation
test and the Z test above have a very strong and significant relationship.
51
4.5. Descriptive Analysis of Most Significant Marketing Mix
Variables
4.5.1 Most significant variables in Product Factor
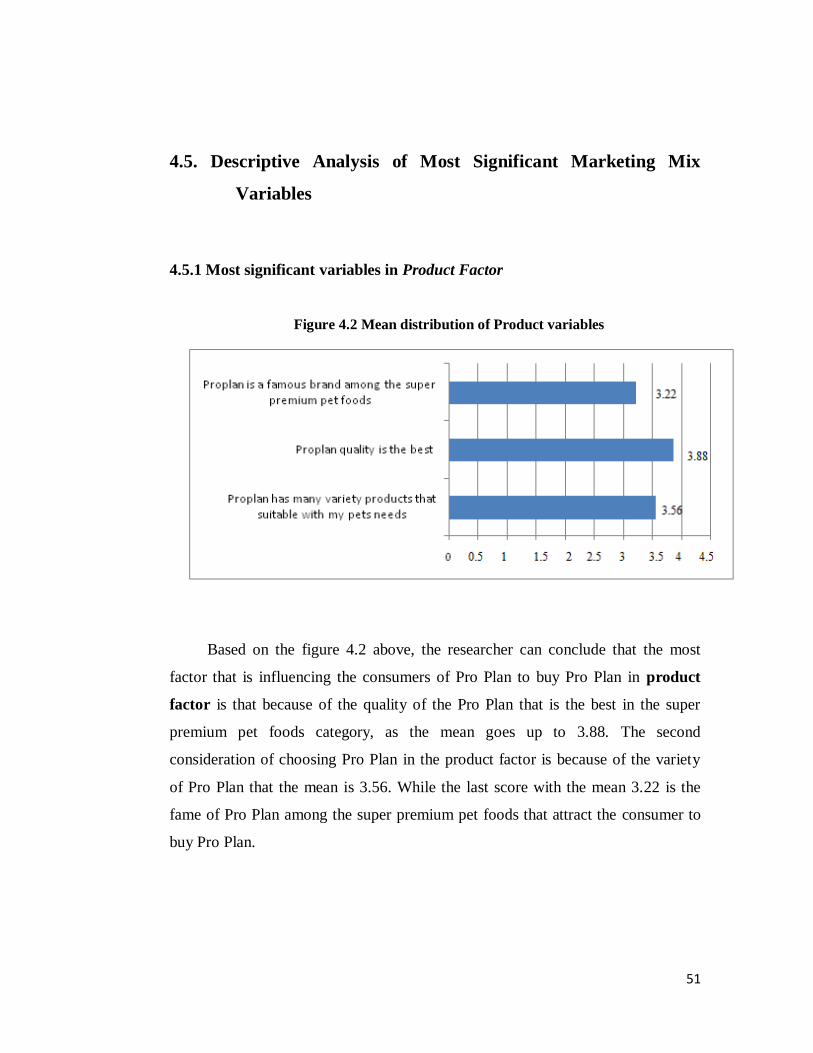
Figure 4.2 Mean distribution of Product variables
Based on the figure 4.2 above, the researcher can conclude that the most
factor that is influencing the consumers of Pro Plan to buy Pro Plan in product
factor is that because of the quality of the Pro Plan that is the best in the super
premium pet foods category, as the mean goes up to 3.88. The second
consideration of choosing Pro Plan in the product factor is because of the variety
of Pro Plan that the mean is 3.56. While the last score with the mean 3.22 is the
fame of Pro Plan among the super premium pet foods that attract the consumer to
buy Pro Plan.
52
4.5.2 Most significant variables in Price Factor
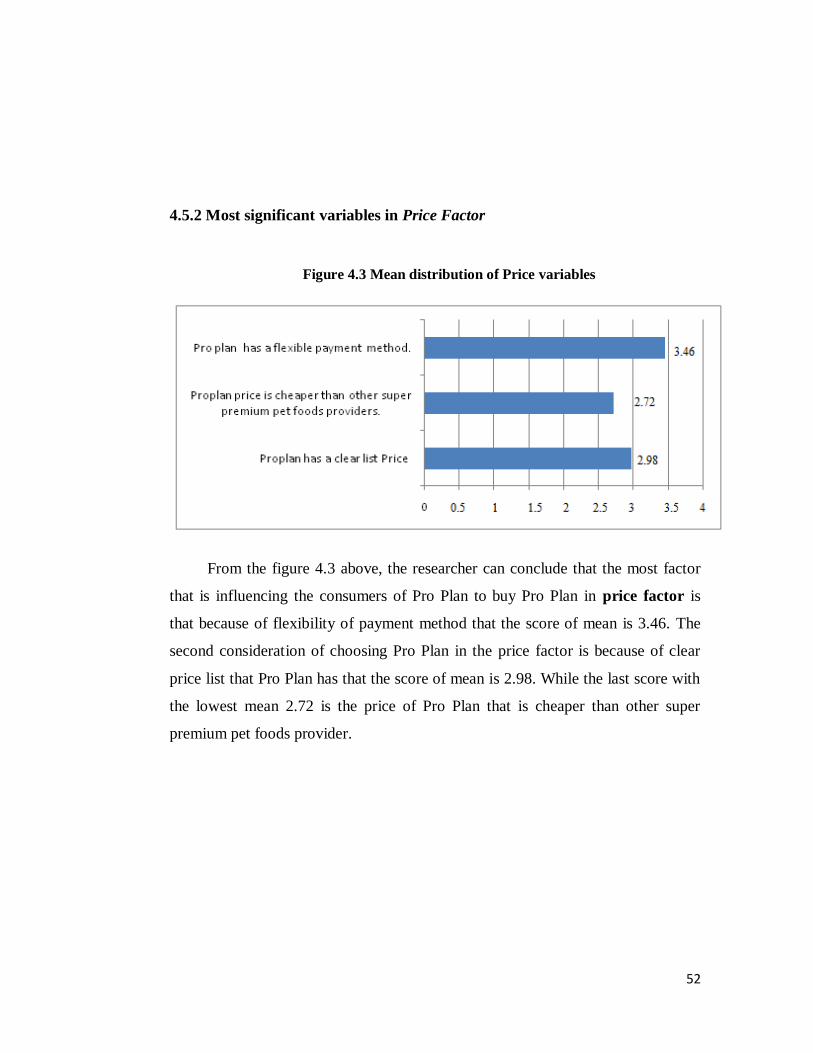
Figure 4.3 Mean distribution of Price variables
From the figure 4.3 above, the researcher can conclude that the most factor
that is influencing the consumers of Pro Plan to buy Pro Plan in price factor is
that because of flexibility of payment method that the score of mean is 3.46. The
second consideration of choosing Pro Plan in the price factor is because of clear
price list that Pro Plan has that the score of mean is 2.98. While the last score with
the lowest mean 2.72 is the price of Pro Plan that is cheaper than other super
premium pet foods provider.
53
4.5.3 Most significant variables in Place/Distribution Factor
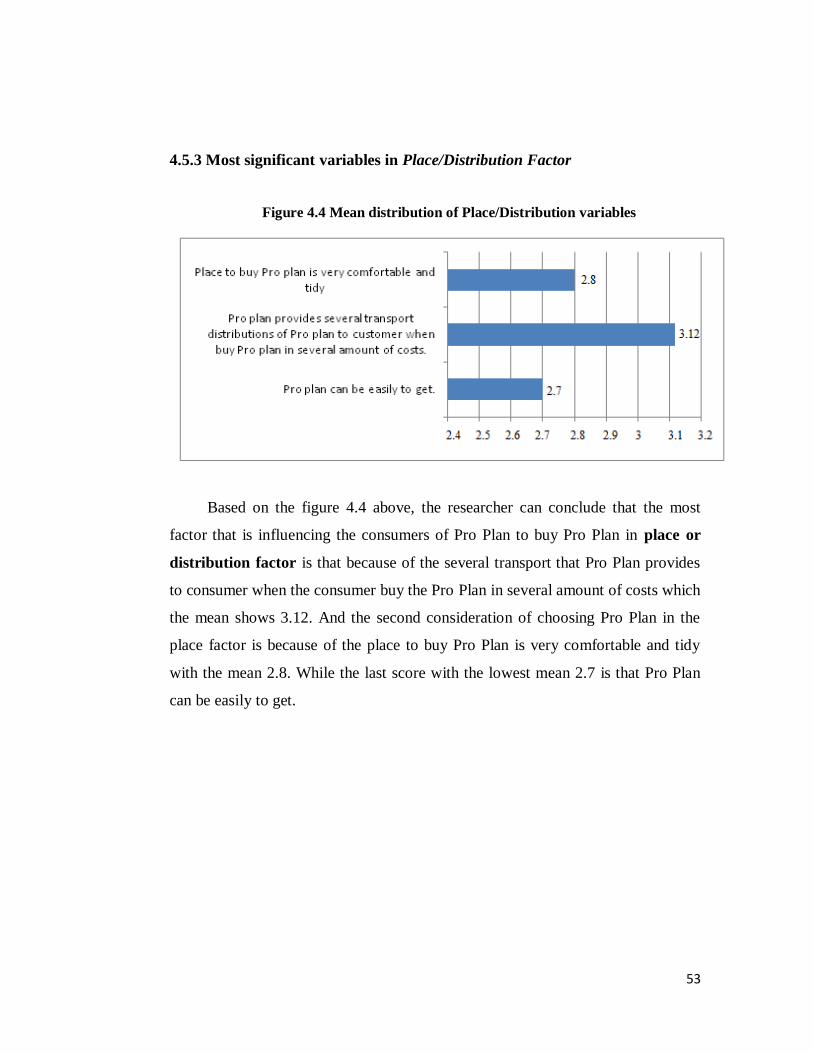
Figure 4.4 Mean distribution of Place/Distribution variables
Based on the figure 4.4 above, the researcher can conclude that the most
factor that is influencing the consumers of Pro Plan to buy Pro Plan in place or
distribution factor is that because of the several transport that Pro Plan provides
to consumer when the consumer buy the Pro Plan in several amount of costs which
the mean shows 3.12. And the second consideration of choosing Pro Plan in the
place factor is because of the place to buy Pro Plan is very comfortable and tidy
with the mean 2.8. While the last score with the lowest mean 2.7 is that Pro Plan
can be easily to get.
54
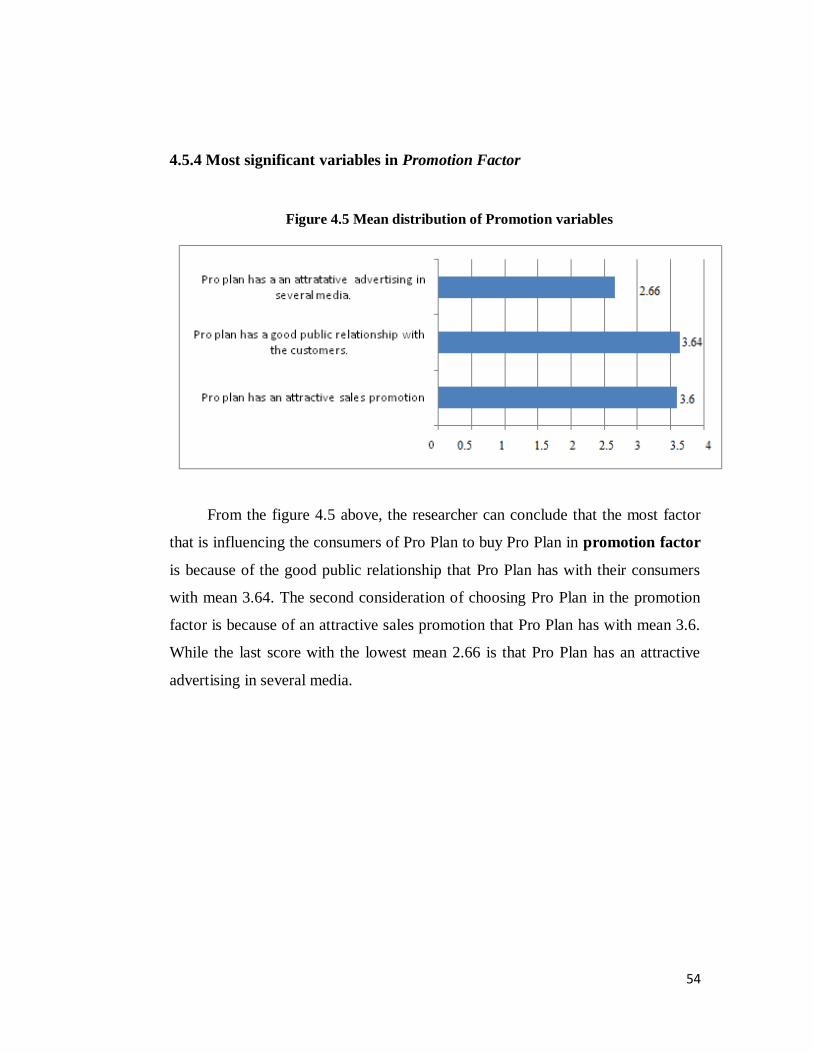
4.5.4 Most significant variables in Promotion Factor
Figure 4.5 Mean distribution of Promotion variables
From the figure 4.5 above, the researcher can conclude that the most factor
that is influencing the consumers of Pro Plan to buy Pro Plan in promotion factor
is because of the good public relationship that Pro Plan has with their consumers
with mean 3.64. The second consideration of choosing Pro Plan in the promotion
factor is because of an attractive sales promotion that Pro Plan has with mean 3.6.
While the last score with the lowest mean 2.66 is that Pro Plan has an attractive
advertising in several media.
55
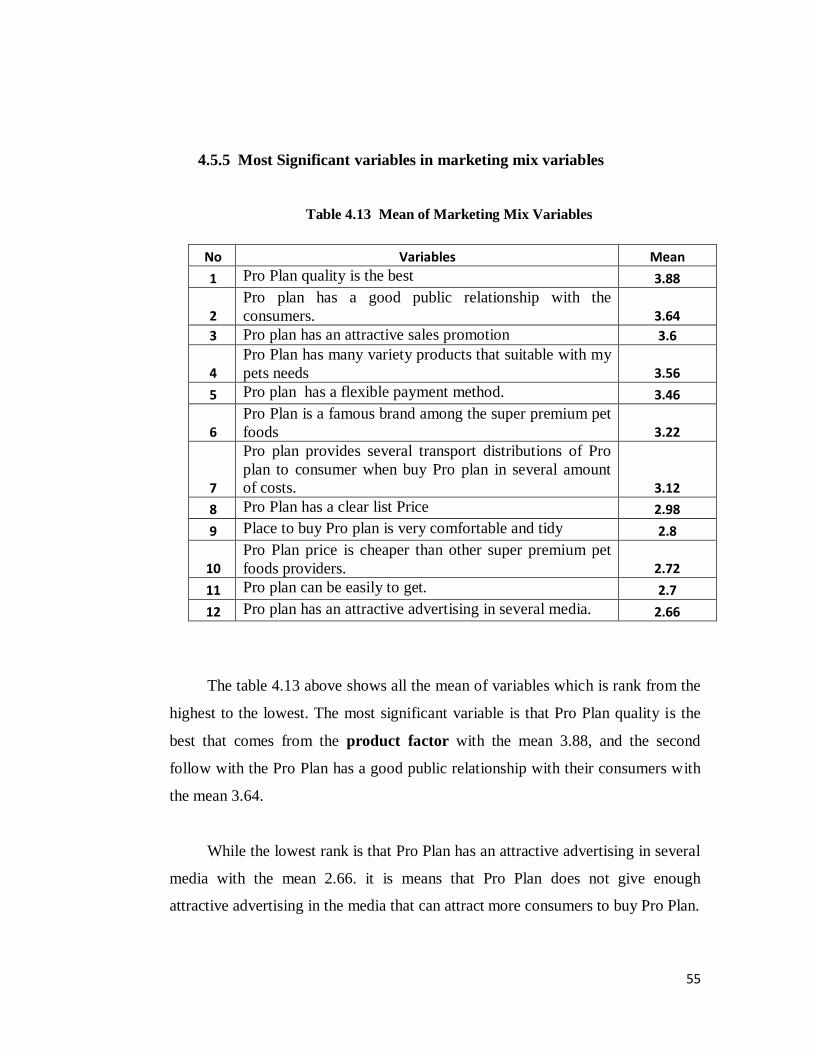
4.5.5 Most Significant variables in marketing mix variables
Table 4.13 Mean of Marketing Mix Variables
No Variables Mean
1 Pro Plan quality is the best 3.88
2 Pro plan has a good public relationship with the
consumers. 3.64
3 Pro plan has an attractive sales promotion 3.6
4 Pro Plan has many variety products that suitable with my
pets needs 3.56
5 Pro plan has a flexible payment method. 3.46
6 Pro Plan is a famous brand among the super premium pet
foods 3.22
7
Pro plan provides several transport distributions of Pro
plan to consumer when buy Pro plan in several amount
of costs. 3.12
8 Pro Plan has a clear list Price 2.98
9 Place to buy Pro plan is very comfortable and tidy 2.8
10 Pro Plan price is cheaper than other super premium pet
foods providers. 2.72
11 Pro plan can be easily to get. 2.7
12 Pro plan has an attractive advertising in several media. 2.66
The table 4.13 above shows all the mean of variables which is rank from the
highest to the lowest. The most significant variable is that Pro Plan quality is the
best that comes from the product factor with the mean 3.88, and the second
follow with the Pro Plan has a good public relationship with their consumers with
the mean 3.64.
While the lowest rank is that Pro Plan has an attractive advertising in several
media with the mean 2.66. it is means that Pro Plan does not give enough
attractive advertising in the media that can attract more consumers to buy Pro Plan.
56
CHAPTER V
CONCLUSIONS AND RECOMMENDATIONS
5.1 Conclusions
This chapter will evaluate the problems that have been answered by the
research and give the conclusion and the recommendation. Based on the research
results and problem analysis, the conclusions as follows as:
1. The objective of this thesis is to find the relationship between the
marketing mix variables (X) towards the consumer purchasing decision
(Y) of Pro Plan and to find the most significant variables of Marketing
Mix of Pro Plan by taking the data from 50 questionaire that distributed in
Pekayon pet shop Bekasi. The calculation is using the rank Spearman
correlation and z test to do the hypothesis testing. Using the hypothesis as
H0 (marketing mix variables has no relationship towards consumer
purchasing decision of Pro Plan) and H1 marketing mix variables has a
relationship towards consumer purchasing decision of Pro Plan.
2. Based on the hypothesis testing, the calculation result for the relationship
rank of spearman (rs) is as big as 0.841 which mean that the H1 accepeted.
The score as big as 0.841 has been categorized as a very strong
relationship between the marketing mix variables towards consumer
purchasing decision of Pro Plan. Based on Z test of in significant level of
5% the score is 5.957 that bigger than Z table. It means that the
relationship is significant.
57
3. The marketing mix variables that has the most significance influence by
the consumer of Pro Plan is from the product variables which shows the
highest mean, that is 3.88 the best quality of Pro Plan and the second
position is from the promotion variables which show 3.66 mean that is the
good public relationship that Pro Plan has with their consumer. The third
position is come from the price variables that is the flexibility payment
method of Pro Plan that show 3.46 mean.
5.2 Recommendations
Through this research, the researcher has found some findings regarding to
the marketing mix variables of Pro Plan towards the consumer purchasing
decision. Based on those findings, the company in this case Purina can consider
the following recommendations:
1. The marketing mix variables of Pro Plan that has the lowest rank should
further be noticed by Purina. It can be seen the lowest rank is the media
promotion of Pro Plan by Purina that is not attractive enough to attract the
costumer to buy the Products, and also the second rank from the lowest
mean is the place to buy Pro Plan should be reachable by the costumer.
The third rank is the price of Pro Plan that is more expensive then the
competitor.
2. The rest of marketing mix variables that Pro Plan have should be
balanced. Purina should see not only from the quality of the best produt
that they have which has the most significant among the marketing mix
variables. They should also consider the other things from the other
variables of marketing mix such as the third place of the lowest mean in
the marketing mix variables that is the promotion on how they attract the
costumer to buy Pro Plan towards an attractive advertising in several
58
media. The place or the distribution of the Pro Plan should be reachable
by the costumers. The third lowest mean also should be consider is the
price of the Pro Plan that is more expensive than the other pet foods
competitor. It means Pro Plan should make a competitive price towards
their competitor. The right balanced between each of marketing mix
variables will make Pro Plan can outstanding their position towards their
competitor in the super premium segments of pet foods and get more
consumers to buy their products to increase their sales revenue.
59
BIBLIOGRAPHY
BOOKS:
Burns, Alvin C. and Bush, Ronald F. (2002). Marketing Research. New York:
Person Education International
Cooper, Donald & Schindler, Pamela S. (2006). Marketing Research, 4th edition,
New York: Mcgraw Hill.
David W. Cravens, Nigel F. Piercy. (2005) Strategic Marketing, Eight Edition.
Irwin/ McGraw Hill.
Drucker, P. F. (1954), The practice of management. New York: Harper &
Brothers.
Kotler, Philip & Amstrong, Gary (2000). Principles of marketing (10th ed.). New
York: Pearson International.
Kotler, Philip & Amstrong, Gary (2003). Marketing Insights from A to Z. New
Jersey: John Wiley & Sons, Inc.
Kotler, Philip & Amstrong, Gary (2010). Principles of marketing (13th ed.). New
York: Pearson International.
Lind, Douglas A., Marchal, William G., Mason, Robert D. (2003). Statistical
Techniques in Business and Economics. Boston:McGraw Hill.
Maltohara, Naresh. K. & Peterson, Mark (2002), Basic Marketing Research,
Pearson Prentice Hall.
Peter, P.J. & Donnelly, J.H. (2007). Marketing management: Knowledge and skills
(8th ed.). New York: McGraw- Hill.
Riduwan & Akudon. (2004). Rumus dan data dalam analisis statistika.
Bandung:Alfabeta.
Stinnett, Bill (2005). Think Like Your Consumer. New York: Mcgraw Hill,
Sugiyono, (2000). Metode Penelitian Bisnis. Bandung:Alfabeta.
Zar, J.H. 1984. Biostatistical analysis. 2nd edition. Englewood Cliffs, NJ:
Prentice-Hall.
60
INTERNET
Nestle Purina Indonesia Intranet
http://en.wikipedia.org/wiki/Marketing_mix
http://www.cs.indiana.edu/mit.research.how.to/section3.12.html
http://www.beetl.ru/en/service/forclients/ConsumerPromotion/
http://en.wikipedia.org.wiki/cronbach’s_alpha
http://en.wikipedia.org/wiki/Nestl%C3%A9_Purina_PetCare
http://www.wsivalueonnet.com/2010/11/12/series-digital-marketing-and-the-
consumer-decision-making-process-1-6/
61
APPENDICES
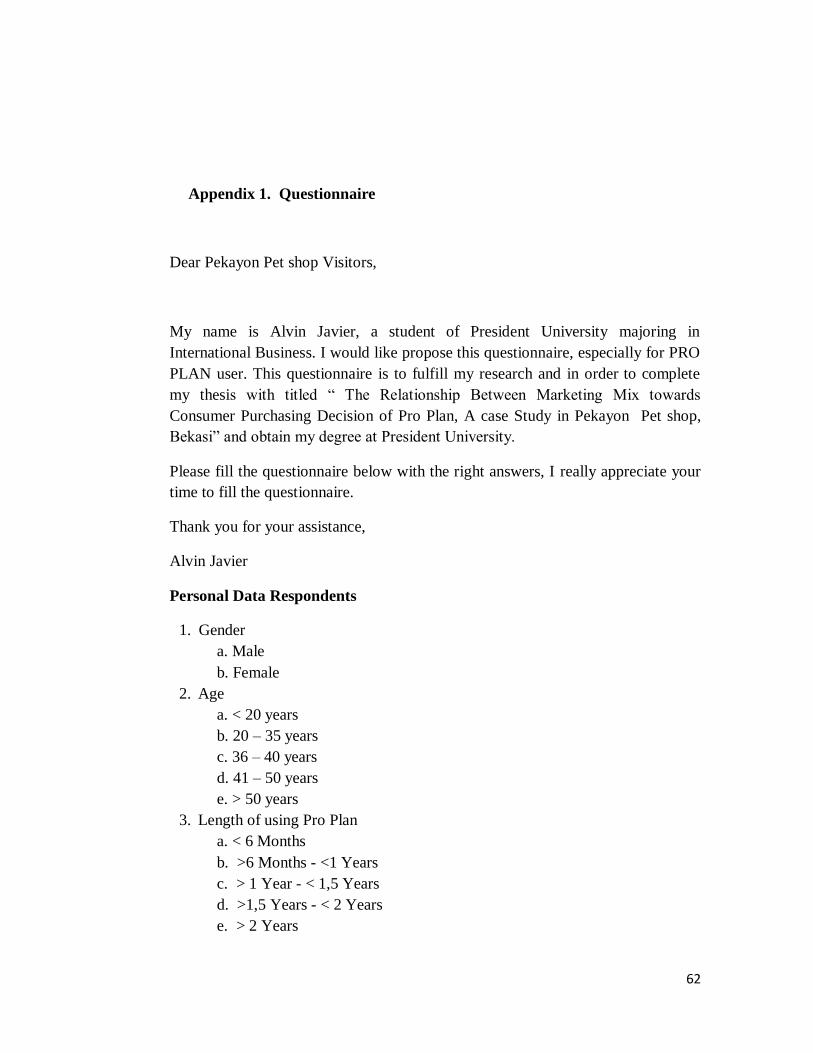
Appendix 1. Questionnaire
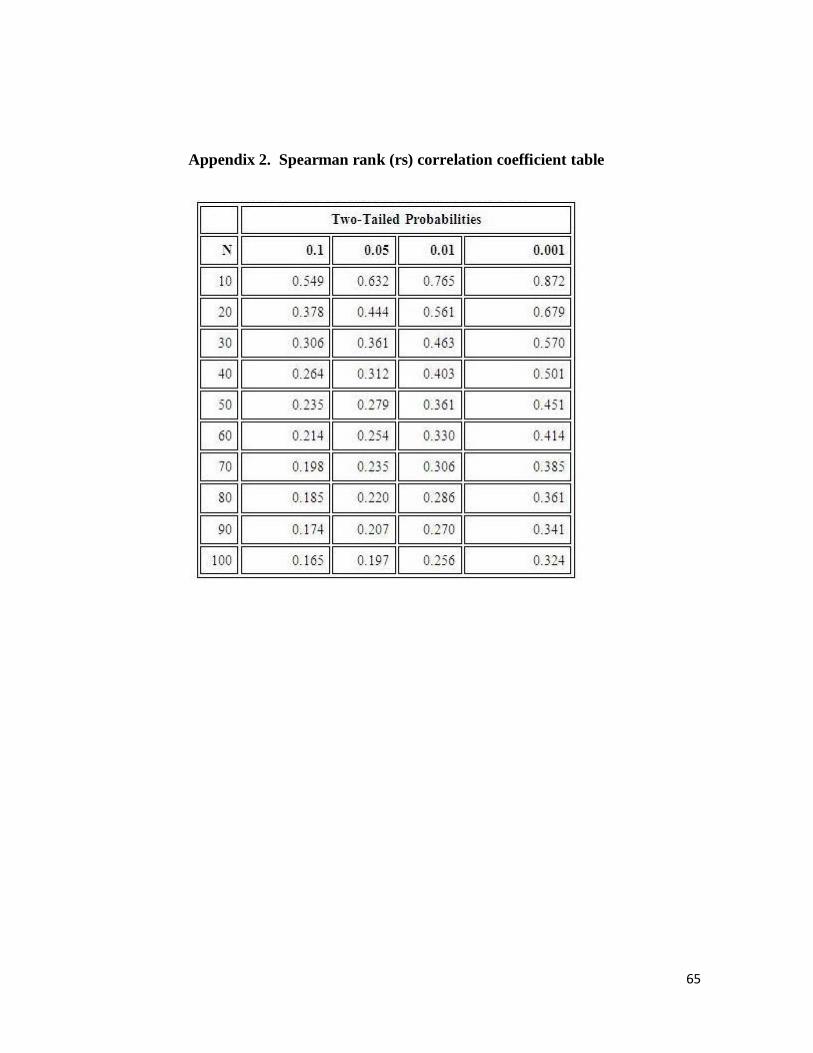
Appendix 2. Spearman rank (rs) correlation coefficient table
Appendix 3.1 Validity Variable X
Appendix 3.2 Validity Variable Y
Appendix 4.1 Reliability Variable X
Appendix 4.2 Reliability Variable Y
Appendix 5. Table to help calculate the Rank Spearman Correlation
62
Appendix 1. Questionnaire
Dear Pekayon Pet shop Visitors,
My name is Alvin Javier, a student of President University majoring in
International Business. I would like propose this questionnaire, especially for PRO
PLAN user. This questionnaire is to fulfill my research and in order to complete
my thesis with titled ― The Relationship Between Marketing Mix towards
Consumer Purchasing Decision of Pro Plan, A case Study in Pekayon Pet shop,
Bekasi‖ and obtain my degree at President University.
Please fill the questionnaire below with the right answers, I really appreciate your
time to fill the questionnaire.
Thank you for your assistance,
Alvin Javier
Personal Data Respondents
1. Gender
a. Male
b. Female
2. Age
a. < 20 years
b. 20 – 35 years
c. 36 – 40 years
d. 41 – 50 years
e. > 50 years
3. Length of using Pro Plan
a. < 6 Months
b. >6 Months - <1 Years
c. > 1 Year - < 1,5 Years
d. >1,5 Years - < 2 Years
e. > 2 Years
63
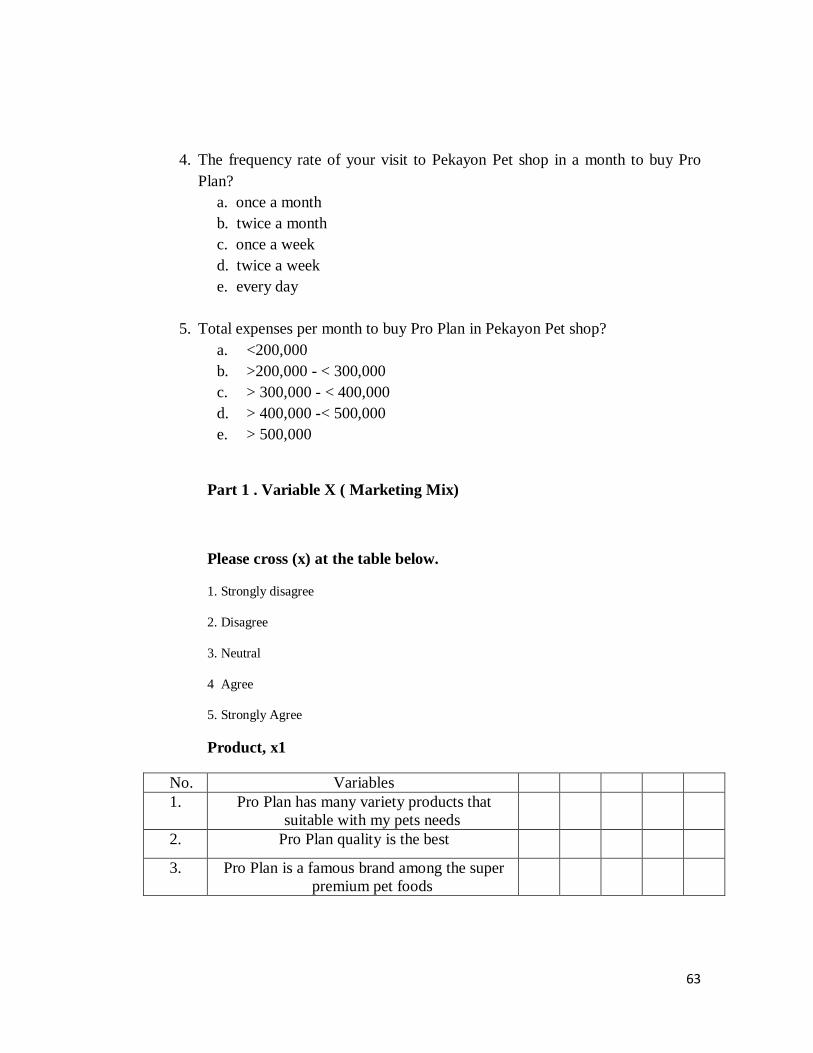
4. The frequency rate of your visit to Pekayon Pet shop in a month to buy Pro
Plan?
a. once a month
b. twice a month
c. once a week
d. twice a week
e. every day
5. Total expenses per month to buy Pro Plan in Pekayon Pet shop?
a. <200,000
b. >200,000 - < 300,000
c. > 300,000 - < 400,000
d. > 400,000 -< 500,000
e. > 500,000
Part 1 . Variable X ( Marketing Mix)
Please cross (x) at the table below.
1. Strongly disagree
2. Disagree
3. Neutral
4 Agree
5. Strongly Agree
Product, x1
No. Variables 1 2 3 4 5
1. Pro Plan has many variety products that
suitable with my pets needs
2. Pro Plan quality is the best
3. Pro Plan is a famous brand among the super
premium pet foods
64
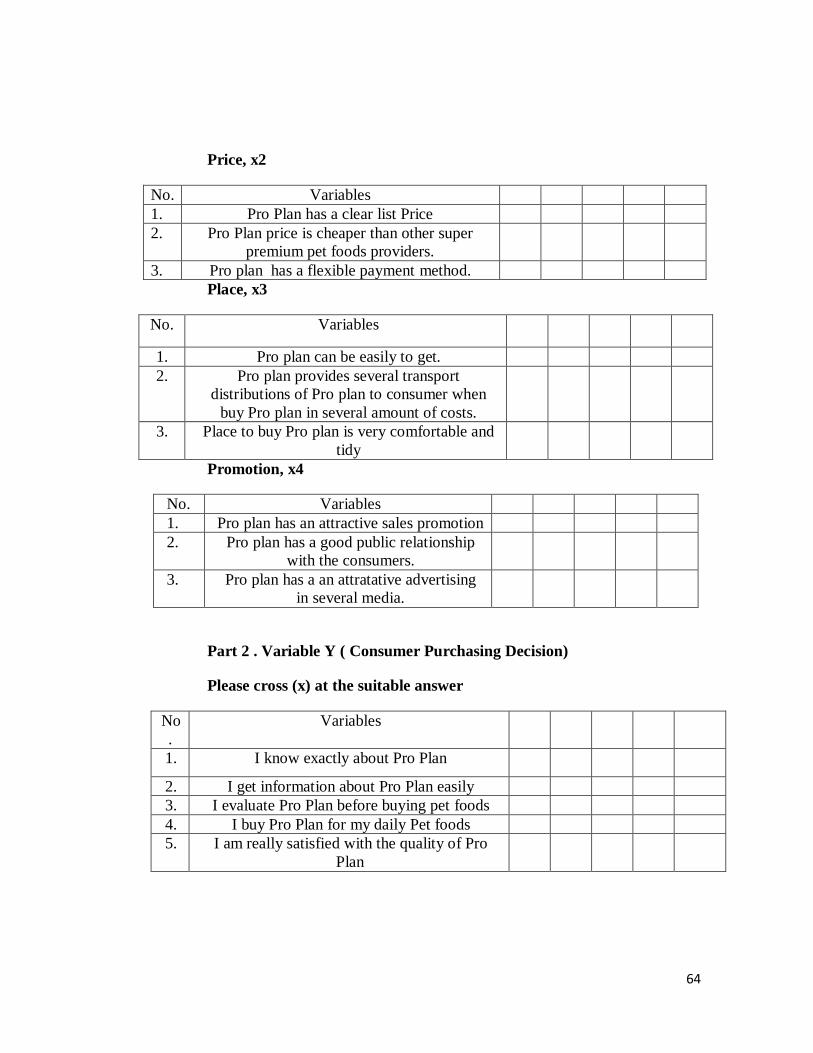
Price, x2
No. Variables 1 2 3 4 5
1. Pro Plan has a clear list Price
2. Pro Plan price is cheaper than other super
premium pet foods providers.
3. Pro plan has a flexible payment method.
Place, x3
No. Variables 1 2 3 4 5
1. Pro plan can be easily to get.
2. Pro plan provides several transport
distributions of Pro plan to consumer when
buy Pro plan in several amount of costs.
3. Place to buy Pro plan is very comfortable and
tidy
Promotion, x4
No. Variables 1 2 3 4 5
1. Pro plan has an attractive sales promotion
2. Pro plan has a good public relationship
with the consumers.
3. Pro plan has a an attratative advertising
in several media.
Part 2 . Variable Y ( Consumer Purchasing Decision)
Please cross (x) at the suitable answer
No
.
Variables 1 2 3 4 5
1. I know exactly about Pro Plan
2. I get information about Pro Plan easily
3. I evaluate Pro Plan before buying pet foods
4. I buy Pro Plan for my daily Pet foods
5. I am really satisfied with the quality of Pro
Plan
65
Appendix 2. Spearman rank (rs) correlation coefficient table