Embed Size (px)
Citation preview

1
The relationship between national development and the effect of school
and student characteristics on educational achievement. A cross-
country exploration.
Abstract Since the publication of two controversial studies in the 80’s, in which Heyneman and Loxley
suggested that the level of economic development of a country had an effect on the degree
to which school and student factors influence educational achievement, numerous works
have further investigated the so-called Heyneman-Loxley (HL) effect. Roughly, these works
can be organized into two streams, one that defends the prevalence of the HL effect in the
current macro-socioeconomic context and a second one that denies it. The debate is far from
over and no overwhelming evidence has been provided from any research stream. By
carrying out Multi-level regression analysis this paper assess the effects of country
development and inequality on learning in reading, using data from PIRLS 2006. The results
suggest the existence of an ameliorating effect of higher levels of country development on
learning through two different ways: 1) directly, on the mean results of countries; 2) indirectly,
by reducing the inequality associated to schools’ socioeconomic status, the rural sector, and
school’s resources. The findings also confirm the dominance of socioeconomic variables
over organizational or institutional ones in explaining student achievement differences, at
least at the aggregate level of analysis. These results add to the production of knowledge for
the design of context-specific policies by increasing our understanding on how broader socio-
economic and political constraints on schools affect their performance.

2
Introduction The relationships between education and economic development have been intensively
studied in cross-national comparative research. At risk of oversimplify, it can be said that
there is a consistent relationship at the country-level between educational opportunities (i.e.:
coverage rates; mean years of schooling) and economic growth and development (Quote); or
even that the raising of educational levels is necessary to sustain and promote the economic
development of a country (Quote). These conclusions made social scientists and policy
makers slouch towards education systems, as they were considered to be the most suitable
institutions for the production of the skills, and even values and attitudes required for
development.
In most developed and developing countries, the expansion of educational systems over the
last century has been the result of a combination of sustained efforts by the state, and
demands from different groups of society. This process of educational growth can be easily
verified in most countries around the world, although with great differences in the rates of
inclusion of social strata, institutional features, and equality of opportunities. Even when
universal coverage rates (especially at the primary and secondary levels), were the most
evident results, soon it was obvious that mass access to education was not enough for
countries to compete internationally in a globalized, knowledge-based economy. Raising the
quality of educational outcomes was also emerged as a necessary feature (Hanushek &
Woessmann, 2007).
The expansion of the coverage rates of education systems around the world and the focus
on its quality motivated the production of a host of studies identifying and analyzing those
factors associated to educational outcomes (commonly measured as the students’ scores in
standardized tests). One of the first and most influential results of these studies pointed out
that student background and socioeconomic status were much more important in
determining educational outcomes than were school-related factors (Coleman et al., 1966;
Peaker, 1971).
A plethora of studies confirming the results of the so-called Coleman and Plowden Reports
(i.e. Coleman et al., 1966; Peaker, 1971) turned these findings in one of the most persistent
generalizations in the studies carried out in this line of inquiry (Heyneman, 2004). However, a
great majority of these works were based on analysis of data form a few developed
3
countries. Taking this fact into consideration, Heyneman and Loxley (1983) contradicted
these previously widely-accepted results by carrying out a study using data from a sample of
countries from Asia, Africa, Latin America and the Middle East. Their results suggested that
the level of economic development of a country (measured as the Gross Domestic Product -
GDP) had an effect on the degree to which school and student background influence
educational achievement. Roughly, they found that the lower the GDP of a nation, the more
influence schools seemed to have on educational outcomes. At that time, this finding was
thought to represent good news (Fernandez and Blanco 2004), because it seemed to
indicate that schools could make a bigger difference in developing countries. The opportunity
for raising educational quality seemed to be clear.
Since then, numerous works have further investigated the interactions among school
characteristics, students’ background and levels of national economic development (see for
example Fuller, B. 1986; Riddell, A. 1989; Baker et al, 2002; Hanushek, E. and Luque, J.,
2003). Roughly, these works can be organized into two streams, one that defends the
prevalence of the effect of the level of economic development of countries on the extent to
which school and students’ background factors influence achievement, and a second one
that denies it. The debate is far from over and no overwhelming evidence has been provided
from any research stream. It can be also questioned whether these differences in the size of
school effects can be interpreted as good news or, conversely, they show the great impact of
socioeconomic differences at the school level.
This work contributes to the debate by doing a cross-country exploration of the relationship
between national development and the effect of school and family background characteristics
on educational achievement. In this way, the general objective is to test for the existence of
inequity patterns at the country and school levels regarding student achievement in PIRLS
2006.
As mentioned before, the countries included in the sample and the data analyzed comes
from the IEA’s study PIRLS 2006. Different specifications of three-level Hierarchal Linear
Regression Models are used to explore the relationship between national levels of
development (measured through the Index of Human Development 2006) and the relevant
variables at the school level, as well as between school characteristics and student
socioeconomic status.

4
To accomplish this objective, the paper is composed by five sections apart from this
introduction. In section two, in order to frame the contribution of this work, a brief summary of
the state of the debate about the size and consistency of the school and family background
effects on educational achievement across different countries is presented. Section three
focuses on the specific research questions and hypotheses to be tested. Section four
describes the datasets, variables and methods used for the analysis. The following two
sections of the paper correspond to the presentation of results and their discussion in terms
of their contribution to the debate. Finally, some concluding ideas from both the theoretical
and policy points of view are drawn.
School and family background effects on educational achievement across nations. The Heyneman-Loxley effect The debate fueled by the results of the so-called Coleman Report (Coleman, et al., 1966) in
the USA regarding the relative importance of school and family background factors on
students achievement motivated the emergence of a host of studies replicating this analysis
with data from different countries. Most of these replications confirmed the results of
Coleman and colleagues (i.e. the influence of family background is more important than
school characteristics in explaining the variance on educational achievement). However, in a
comparison of the factors associated to academic achievement in Uganda and other more
industrialized societies, Heyneman (1976) found contradictory evidence. The results for the
Uganda case and the fact that most of the empirical evidence confirming the Coleman
Report conclusions steamed, so far, from studies carried out in developed countries, lead the
author to consider the possibility that the relative influence of school and family background
on academic achievement would vary across countries; and further, that this variation would
be related to the countries level of economic development.
At the beginning of the 80s Heyneman, this time with Loxley, published two significant
papers in which, by using data from countries with a range of national average income, they
confirmed the hypothesis derived from the analysis of the Uganda’s education system
(Heyneman & Loxley, 1982; 1983). That is, on the one hand, that the relative influence of
school characteristics and family background on educational achievement varied across
countries; and on the other, that this variation seemed to be conditioned by the level of
economic development of the countries. These findings set up the bases for the

5
establishment of a prolific branch of comparative education, which results encouraged the
policies of production of human capital as instruments for the development of the poorest
countries (Heyneman S. P., 2004).
In the discussion of their results Heyneman and Loxley offer five possible explanations for
the correlations identified. The first three strictly refer to methodological shortcomings that
could cast doubts on the validity of the findings, while the last two are related to the social
mechanisms that would generate the observed results. The present work is restricted to the
scrutiny of the last two as they are particularly relevant to its objectives.
The first of these explanations refers that in less-developed nations schooling is a scarce
good, and that this scarcity, in combination with the individual social trajectories induced by a
labour market highly segregated into a formal-urban and an agricultural-informal sectors,
increases the social value assigned to it regardless of family background. That is, in a labour
market with these characteristics, higher probabilities of social mobility would be associated
to the formal urban sector, which in turn would have higher entry requirements related to
schooling than to socioeconomic status, for example. Therefore, whenever students have
access to schooling and regardless of their family background, would be motivated to make
larger efforts to attain achievement.
The second explanation refers to the ability of wealthier countries to provide higher levels of
school resources throughout their education systems. This would result in less differentiated
levels of resources for all schools and, in turn, in higher minimum levels of school quality for
all children. In less-wealthy nations, due to the existence of higher levels of economic
inequality and therefore stronger associations between families’ SES and school resources,
the differences in the level of resources across schools would be significantly higher.
However, the social scenario in which Heyneman and Loxley obtained their results has gone
through major changes in the last three decades. The logic of educational growth as a
project funded by nation-states has been widely spread around the world (Heyneman S. P.,
2004). As a consequence, a clear long-term trend in expansion of mass education can be
observed in both developed and developing countries. Enrollment rates and public

6
expenditure in education have been consistently growing across both groups of nations
(Baker & Holsinger, 1996).
Consequently, the HL effect would be expected to decrease because of the reduction of the
extreme scarcity of schooling in developing countries. Additionally, the observed long-term
expansion of educational expenditure and the consequent increase of the minimum levels of
schools resources across less-developed nations, if widespread, would also lead to a decline
in the HL effect (Baker, Goesling, & LeTendre, 2002, p. 297).
Although we recognize that the consequences of the expansion of education systems around
the world could contribute to lessen the HL effect to some extent, our position supports the
hypothesis of the resilience of the HL effect in the current macro social context. At least
three reasons could be argued for this.
The first one is that even though it is clear that there has been an expansion of education
systems in most developing countries, developed countries are clearly ahead in this trend
(Tsang, 1995). In fact, the overall levels of expenditure and enrolment among wealthier
countries continues to be considerably larger compared with the developing ones is also well
documented (Baker, Goesling, & LeTendre, 2002).
Second, even though educational expansion policies have been good at raising school
enrollment levels, the expansion of the education systems has not been homogeneous with
respect to their results; social inequities within the educational systems have prevailed.
Research carried out in several countries of Latin America, for example, shows that when
large sectors of the most marginalized population (that accounts for most of the increment in
the coverage rate, especially in developing countries) were incorporated into education
systems, the inequalities in educational achievement became more intense and more evident
(Fernández, 2003; Muñoz-Izquierdo & Villarreal, 2005; Sandoval-Hernandez, 2007). That is,
schooling might have been expanded to reach large proportions of the population, but quality
schooling is still a scarce good in developing countries. In developing countries school
results seem to be highly dependent on their students’ background characteristics.

7
A third reason to hypothesize the prevalence of the HL effect concerns the increase of
minimal levels of school resources in developing countries derived from the expansion of
educational expenditure. That is, even when it is clear that there has been a generalized
increase in the level of school resources, this trend has not favored all schools equally.
Differences in the level of school resources are still evident, as the expansion of public mass
education, at least in Latin America, has systematically favored urban and medium class
sectors (e.g. more and better resourced schools –in terms of physical and human resources).
Under these circumstances, the difference between rural and urban sectors, and between
schools’ SES become decisive. This would contribute to increase the effect of schools on
educational achievement.
Whereas Heyneman and Loxley’s main arguments to explain the relationship between
development and school effects were the scarcity of educational opportunities in developing
countries and its consequent increase of the motivation to do well in school; our hypothesis
are based on the notion that, in developing countries, social inequality is reproduced more
effectively within the educational systems. From this perspective, the HL effect should not be
interpreted as evidence of larger margins for schools to influence educational outcomes in
developing countries, but rather as the opposite. The larger size of the school effects in such
countries should be attributed to the effect of schools SES, and not to schools‘ organizational
or pedagogical characteristics.
Research questions / Objectives Drawing along these lines, the main objectives of this work are: first, to test for the existence
of a direct relationship between development, economic inequality, and learning results at
the national level; and second, to explore how different levels of national development and
economic inequality influence the school and family background effects on student
performance.
For the first objective it is expected to corroborate the existence of the HL effect using more
recent and varied data than previous studies. Concerning the second objective, it is expected
that greater differences in school effects would be associated with greater differences in the
social composition of schools, thus giving partial support to our main thesis.
8
The existence of a significant relationship between the level of national development and
academic achievement would imply that there are factors at the national level which have an
effect on the academic performance of students, even after controlling for individual
socioeconomic characteristics and school quality. These factors could be represented by the
public resources offered by the nation-state to its citizens, at least by those that could affect
directly or indirectly the educational achievement of the population (e.g. access to different
options of formal and informal education, availability of life-long learning alternatives,
availability of public libraries, access to health services, mass media communications, etc.).
Economic inequality, in turn, could have a direct effect on learning if lower levels of national
development are coupled with the institutionalization of socio-politic dynamics that negatively
affect the quality of schooling (e.g. corruption, corporatism, lack of accountability, etc.).
It is further assumed that higher levels in the provision of these resources and a more
homogeneous distribution of them (conditions frequently found in developed countries) would
contribute to ameliorate the differences in academic performance associated to the variation
in the socioeconomic composition of schools (SES mean). Conversely, in less-developed
societies, the opposite conditions imply that the principal or unique mean to access
education (especially for those students coming from lower socioeconomic strata) is school.
Therefore, the variance in student performance between schools would be more important in
developing countries than in the developed ones. Moreover, higher levels of inequality would
be associated to highly segmented education systems, in which inequalities in the allocation
of school resources (e.g. material inputs, quality of teaching stock, effective teaching and
school management practices) are not adequately compensated by public policies or publicly
available resources.
In brief, schools in developing, unequal countries would be assumed to reproduce the pre-
existent social inequalities, trend that would be reinforced by the absence of effective public
policy interventions or publicly available resources to reverse it. Thus, in less-developed
countries, the differences between schools, both academic and socioeconomic, would
explain greater proportions of the variation in student achievement than in the more
developed ones. Conversely, higher levels of national development would contribute to
reduce the associations between socioeconomic school composition, school resources, and
achievement.

9
Data, Variables and Methods
Data
This study relies on data from the Progress in International Reading Literacy Study (PIRLS),
a testing and data collection program conducted by the International Association for the
Evaluation of Educational Achievement (IEA) in 2006. The main objective of this initiative is
to help countries make informed decisions about reading education, by providing
internationally comparative data about students’ reading achievement in primary school (the
fourth grade in most participating countries). PIRLS in 2006 was implemented in 40
countries, including Belgium with 2 educational systems and Canada with 5 provinces,
making a total of 45 participants in total (Mullis, Martin, Kennedy, & Foy, 2007, p. 18)1. Due
to missing values limitations, the data from Luxembourg were not included in the analysis;
therefore the sample considered in this work is composed by 44 of the 45 participants. The
final database used for the analysis includes information on more than 210,000 students and
7440 schools.
Dependent variable
In the 2006 PIRLS International Report (Mullis, Martin, Kennedy, & Foy, 2007, p. 308)
achievement scales were produced for each of the two reading purposes (reading for literary
experience and reading for information) and for two processes of comprehension (retrieving
and straightforward inferencing, and interpreting, integrating, and evaluating), that are
considered in the test, as well as for reading overall. The dependent variable used for our
analysis corresponds to the last one.
Student reading achievement was summarized using item response theory (IRT) modeling
techniques that produce a score by averaging the responses of each student to the items
that he/she took in a way that takes into account the difficulty and discriminating power of
each item. Two features of IRT modeling are especially relevant for a survey like PIRLS, on
the one hand, it allows for the estimation of a student’s score in a test even if he or she did
1 The full list of participants in PIRLS 2006 is: Bulgaria, Canada (Ontario), Canada (Quebec), England, France, Germany, Hong Kong SAR, Hungary, Iceland, Islamic Rep. of Iran, Israel, Italy, Latvia, Lithuania, Rep. of Macedonia, Rep. of Moldova, Morocco, Netherlands, New Zealand, Norway, Romania, Russian Federation, Scotland, Singapore, Slovak Republic, Slovenia, Sweden and United States.

10
not answered all the items in the test; and on the other, it provides a common scale on which
performance can be compared across countries (Foy, Galia, & Li, 2007).
To provide student scores PIRLS uses the achievement distribution to impute the
achievement of each student conditional on his or her item responses and background
characteristics. To quantify any error in the imputation process, PIRLS datasets report five
plausible values for each student, implying that any calculation has to be done five times.
The average of the results of these five analyses is then taken as the best estimate of the
statistic in question, and the difference between them reflects the imputation error (Mullis,
Martin, Kennedy, & Foy, 2007, p. 308).
Finally, it is also relevant to mention that the PIRLS mean achievement scale across those
countries was set at 500 units and the standard deviation at 100. Additionally, since the
countries varied in size, each country was weighted to contribute equally to the mean and
standard deviation of the scale.
Independent variables
The information collected by PIRLS 2006 also includes a wide range of background
information about students’ home and school experiences in learning to read. Students’
parents, teachers, and head-teachers, as well as the students themselves answered
questionnaires covering various aspects of home literacy support, school environment, and
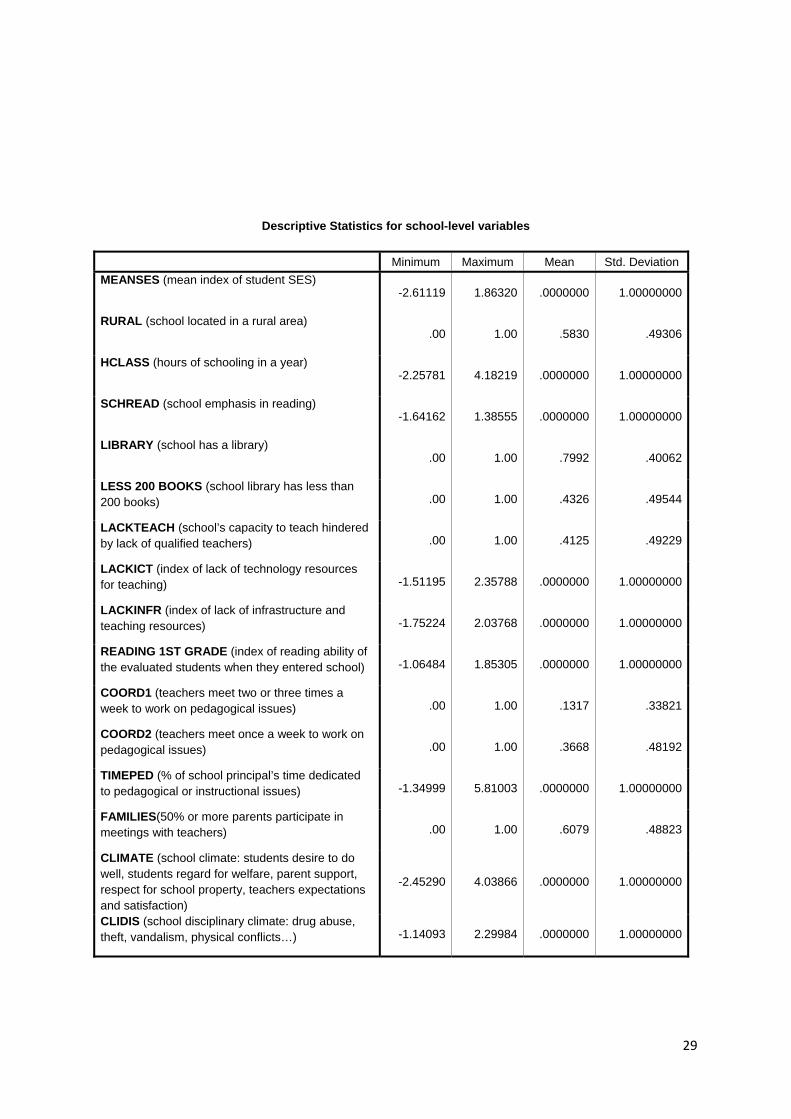
classroom instruction. A full list of the variables used in this work, including main descriptive
statistics, can be consulted in Appendix A.
Several procedures were used to construct the variables for the analysis. Some of them are
factor indexes that comprise information from simpler variables, while the rest are dummy
variables. Three different datasets were defined: one at the student-level, one at the school-
level, and the other at the country level. The database at the student-level includes
information about the student socio-economical status (SES), sex, school’s perceived
climate, homework, reading practices and dispositions, the use of computers, internet, and
TV. At the school level, the database included information on school mean socioeconomic
status, location (urban/rural setting), resources (library, number of books, lack of material and

11
human resources), time devoted to teaching, emphasis on reading, climate, coordination
among teachers, and participation of families in meetings. At the country-level, the variables
used were Human Development Index for 2006 and Gini index for the same year.
Methods
Hierarchal linear modeling (HLM) constitutes the main analysis technique used in the
analysis of the data. The decision of using HLM was made considering several criteria. The
first one can be described as empirical, theoretical and technical isomorphism (Cortes &
Ruvalcaba, 1993). That is to say that the structure of the empirical data and the theories
available to explain the hypothesis to be tested represent a good match with the analysis
technique to be used. As it is known, educational data is characterized for having a multilevel
structure, where student attainment is conditioned by individual characteristics, by school
characteristics that are common to all students in the same institution, and for characteristics
of the education system that are common to all schools and students (Bryk y Raudenbush
1992). Therefore, in the educational research context, HLM allows for more robust
estimations and more rigorous hypothesis testing than those derived from Ordinary Least
Squares regression.
Another reason is that HLM are especially appropriate for the central objectives of this work:
on the one hand, they allow for the estimation of the effect of aggregate nation-level
variables (e.g. Index of Human Development, Gini Index) on school-level effects on
educational achievement; on the other hand, they allow for the estimation of interaction
effects between variables at different levels (e.g. the interaction between IHD and school
SES). In theoretical terms, this allows to test if development and equality at the country level
affect the reproduction of inequalities at the school level.
As suggested by Bryk & Raudenbush (1992), models were specified in stages of increasing
complexity, from “null” models to “means-and-slopes-as-outcomes” models. The first stage of
the analysis consisted then in specifying a “null” model with no explanatory variables. This
model provided an estimate of two intra class correlation (ICC): the proportion of variance in
learning between schools and between countries. In the second, third, and fourth stages,
fixed effect models were estimated respectively at the students, schools, and country levels.
The fifth stage included theoretically relevant random effects for selected variables at the
student level (namely, student SES) and, in the following stage, their interactions with school-

12
level variables. The seventh model included random effects for variables at the school level,
and the last model specified their interactions with country-level variables. Additionally, in
order to do an exploratory analysis of the relationship between national development and the
levels of intra-school variance, bi-variated correlation tests were used.
Results
Variance partition
As mentioned above, the first step in the HLM strategy was the estimation of the partition of
total variance in student achievement into the three levels considered in the analysis (i.e.
student, school and country levels). The objective is to estimate the extent to which the
differences in student academic performance are explained by differences between students,
between schools and between countries.
The graph 1 shows that there are important differences in the proportions of the variance
explained by each level. The greatest proportion corresponds to the differences between
countries (almost one half), followed by the differences between individuals (34.7%), and the
differences between schools (19.5%).
13
According to these first results, it might be thought that the differences associated to
education systems across countries can be crucial in explaining the variation of academic
results, and therefore that there is an significant opportunity for the design and application of
high-impact policies at the nation level. However, in the next paragraphs it will be made clear
that this is a far too optimistic conclusion.
Percentage of variance explained by different models
As previously mentioned, the strategy of analysis followed in this work consisted in the
progressive estimation of models including variables from the three levels of analysis. As
explicative variables from each are included in the model, the amount of variance –in the
three levels– is significantly reduced in comparison to the null model. Even when in theory it
would be expected that the inclusion of an independent variable in a model produced a
reduction of the variance only in the level to which it belongs, this is not the case for the data
analyzed in here (see graph 2). The reason is that neither student characteristics
homogeneously distributed between schools, neither school characteristics are
homogeneously distributed between countries.
Along these lines, graph 2, show results for five different models. In the first model the only
explanatory variable is socioeconomic level (SES) at the student level. As it can be
observed, this variable only explains 2.8% of the variance at the student level, but explains
almost 16% of the school level and 21% of the country level variance.
In the second model (complete model at the student level), the inclusion of student
dispositions, perceptions and practices as explanatory variables explains 15.7% of the
variance at the same level, while the variance between both, schools and countries is
reduced in more than a third.

14
2.815.7 15.7 15.7 15.715.8
38.355.3 58.8 58.8
2134.2
72.3 76.187.2
level‐1 model (SES) level‐1 model (complete)
level‐2 model (SES) level‐2 model (complete)
level‐3 model (HDI)
Graph 2 ‐ Proportional reduction of variance compared with null model
reduction in level 1 variancereduction in level 2 variancereduction in level 3 variance
In the third model, the school average of the students` SES is added as the only explanatory
variable at the school level. As it can be observed in graph 2, the reduction of the variance in
this level reaches 55%, while at the country level it exceeds 75%.
Because of its relevance for the objectives of this work, special attention has to be paid to the
last result. Thus, it is important to point out that the large proportion of the variance attributed
to the country level in the null model, has been reduced in around 75% before including any
variable of this level into the model. That would imply the greatest proportion of what, in
principle, could be considered as “country effect” is actually a compositional effect of the
unequal distribution of student and school characteristics. However, it is also important to
consider that it is still possible that this unequal distribution of student and school
characteristics obey to societal or institutional features at the national level.
Finally, when the only explanatory variable at the country level is the Human Development
Index (HDI), the variance at this level represents just the 13% of the original one. Even
though this result is not as optimistic as the one reported from the null model, this can still be
considered as a good margin for the action of educational policies at the national level.

15
The structure of the factors associated to student reading achievement
Next, we analyze the results of the regression model for the total sample (Table 1). First, we
briefly present the results for the student level, and the analysis of the results at the school
and country level.
Student level
As it has been said, at the individual level, the model explains just the 15.7% of the total
variance. This is not an odd result when information regarding some important variables is
not available (e.g. cognitive skills). Three groups of variables were tested in this model:
student characteristic variables (SES and gender); variables related to the practices and
dispositions of students towards reading; and variables regarding the characteristics of the
schools. The results are showed in the last rows of table 1.

16
Table 1
Regression coefficients for the final model
Country level HDI 2006 0.221***
School level Mean SES 0.224*** Rural - 0.081*** HDI 2006 0.079*** Reading 1st grade 0.034* Library 0.055** Less 200 books - 0.019 HDI 2006 0.038** Families 0.058**
Individual level SES 0.119*** Mean SES 0.038** Disciplinary problems - 0.030** Like reading 0.230*** Does not read - 0.085*** Magazines - 0.027*** Novels 0.046** Watching TV - 0.069*** Internet - 0.110*** Reading by him/herself 0.101*** Library use 0.043* Negative climate - 0.040** Reading homework 0.052* Intercept -0.162**
Source: Own calculations bases on PIRLS 2006, total sample except for Luxemburg (***) p<0.001; (**) p<0.01; (*) p<0.05 Standard errors of the coefficients in brackets
The variables that showed a positive association with student performance are: student SES
(SES), if the student reported to like reading (like reading), how often the student read novels
or books (novels), if the school carries out reading-alone practices (reading by him/herself),
and to a lesser extent, the frequency of use of the school library (library), and the frequency
of reading homework (reading homework). In turn, the variables that observed a negative
association are: if the student declared not to read (does not read), how often the student
read comics and magazines (magazines), how often the student watches TV (watching TV),
how often the student uses internet (internet), and the perception of a negative school
climate (negative climate). Most of these coefficients report the expected directions in their
association with the dependent variable: a greater subjective disposition towards reading,

17
and frequent reading practices are associated to higher reading achievement, both when
promoted by school and when they represent students’ initiative.
It is important to point out that the students’ practices and dispositions, as a group of
variables, explain the greatest amount of the total variance, approximately 2/3 of the total
explained variance. In contrast, the student SES explains just the 3% of the level 1 variance.
Three coefficients are especially important because of their possible policy and theory
implications. The first one is the positive effect that frequent reading activities in class would
have on reading achievement. At least at this early schooling level, reading-oriented activities
seem to have an effect on educational attainment. In the second place, attention is drawn to
the fact that the frequency of reading magazines and of the use of Internet has a negative
coefficient. Contrary to the commonly held belief in the positive effects of exposition to texts
in different formats, our results suggest that prolonged exposition to texts in a non-traditional
format would have a negative association to academic attainment.
Finally, we would like to mention the variables that did not fit in the model, but that because
of their role in the theory were initially considered. The index of out-of-school reading
practices (readpr), the index of quality of peer relationships (climate), parental support for
reading homework (help), and the use of computers at home (computer 1 and computer 2)
did not showed a significant association to student outcomes. Because of space restrictions
it is not possible to explain these results here.
School level model
The school model presents a complex structure because of the interactions with the country
individual SES. Six variables showed significant coefficients in the expected direction, but
their weight in the global explanation is considerably different.
At the outcast, the factor that demonstrates the strongest effect on educational achievement
is average school SES (mean SES). The fact that the average school SES reported larger
effect size than the individual SES has been well documented in the literature. From our

18
point of view there are at least three non-excluding explanations for this association.
Deciding between these hypotheses goes beyond the objectives of this work, yet they might
represent one of the most interesting avenues for the study of how educational inequalities
are produced between education systems.
The first hypothesis holds that as the average family SES is higher in a community, its
probability of attracting the resources needed for their schools to offer quality education is
also higher. The wealthier families are able to get more economical resources for their
schools, as they have greater capacity to exert politic pressure; they live in nice areas,
because high quality teachers have more chances to choose the school they want to work in,
their schools also end up having the best teachers. These differences are not only evident in
the dichotomy private/public, but also within the public sector. In this fashion, the schools that
have the intake with the higher SES would also be higher levels of educational resources.
The second hypothesis posits that the school SES is an indicator of the cultural, economic
and social capital of the students’ families, as well as an indicator of the value families assign
to education. Therefore, higher levels of school SES would be associated to higher
probabilities of the existence of norms, values and role models adapted to the demands of
formal education. In this way, family and territorial networks would act as a mechanism to
foster the gains of the available educational resources and, thus academic achievement. In
this manner, students’ practices and dispositions would be conditioned by an educational
ethos more or less common to all students in the school. Furthermore, it would also be more
probable to find linguistic codes and rules of production of symbols more adequate to the
pedagogic discourse of formal education.
Finally, the third hypothesis involves the teachers’ expectations regarding students’
academic attainment. In this case, the effect of SES on achievement would be explained by
the fact that teachers build their expectations and set their teaching goals based on their
evaluation of the students’ average educability. This evaluation would be influenced by social
prejudices and stigmas, but also by the teachers’ experience, for whom it is more difficult to
educate low than high SES students. Therefore, teachers facing low SES students would
lower their expectations, motivation and goals, affecting in this way the academic
performance of all their students.

19
The rest of the school factors with significant coefficients do not add much to the explanation
of the global model, nevertheless it is important to mention them. Schools located in rural
areas (rural) and school libraries with less than 200 books (less 200 books) are negatively
associated to achievement. In turn, the level of reading skills of the students in grade one, as
judged by the head teacher; if the school has a library and the index of parents’ participation
in school activities, is positively associated to student achievement.
What is important to point out here, is that in comparison to the variance reduction
associated to the school SES, the percentage of explained variance added by the five
variables fitted into the model is rather low. This finding suggest that, at least when a large
number of countries is included into the analysis, the results tend to confirm the classic
finding of Coleman: once it has been controlled for the socioeconomic factors at the
individual and school levels, schools have a relatively small margin to influence on student
attainment. It seems that, as it was claimed by Basil Bernstein four decades ago, school
cannot compensate for society.
However, it is important to draw attention to the fact that two school factors were found to
significantly modify the effect of student SES on achievement. That is to say, that these two
factors are associated to changes in the reproduction of social inequality at the student
level2. The first one is the school SES that, in line with what has been found in other research
works, increases the effect of the student SES. That is, the slope of the individual SES tends
to become steeper as the school SES is higher. Although, all students in a school seem to
benefit from a high school SES, students with high SES take more advantage of these
favorable conditions. This finding adds to the hypothesis that students benefit of high levels
of school SES in a differentiated way depending on their own social, economic and cultural
capitals.
The other significant school factor is the index of disciplinary problems (disciplinary
problems). Even though this index did not show a direct effect on the student attainment, it
did have an effect through its negative association with the student SES slope. Although we
do not have a sound explanation for this finding, it might be thought that students with higher
2 As it can be seen in graph 3, the level of statistical explanation reached by this random effect is relatively low (15%), yet significant.
20
SES are more affected by the reduction of effective teaching time due disciplinary problems
in classroom. As it can be observed, not all the equity effects favor school outcomes.
Before discussing the results of the model at the national level, it is necessary to mention the
variables that did not show significant effects at this level. Any of the following variables
showed significant effects on the student achievement: teaching hours per year (hclass),
school emphasis on teaching reading (schread), the indexes of resource shortages –
technological, infrastructure and trained teachers (lackict, lackinfr and lackteach), two
indexes of school climate (climate and clidis), grequency of teachers coordinators meetings
(coord1 and coord2), and the time used by the head teacher in pedagogical issues
(timeped). In summary, neither the factors related to school management nor school climate
showed significant effects in the global model.
Country level model
The last part of the analysis consisted in fitting the model at the country level to test two main
hypotheses. The first one was that the country levels of economic equity and well-being have
positive and significant effects on student attainment; and second, that these variables
influence student attainment through their interaction with school effects. In general terms, it
is postulated that as the levels of well-being and equity are higher, the inequalities
associated to school factors reduce3.
Bi-variated correlations between national development and school differentiation
A first basic way to approximate this phenomenon consists in analyzing the correlation
between country HDI and the level of intra-school variance. In an exploratory fashion, we
used one-way analysis of variance (ANOVA) to estimate the between schools variance in
reading achievement for each country. The same procedure was followed to estimate the
between school variance in the students’ SES, the results of this analysis were used as a
variable at the country level to approximate the social segmentation in schools.
3 In other words, the second hypothesis implies that the interaction coefficients between country level and school level variables will have the opposite sign of the school variable coefficients, thus compensating their differentiating effect.

21
Table 2
Bivariate Correlations between HDI_2006 and relative variance components at the school level
HDI_2006 % Variance in reading test at
school level
% Variance in student SES at
school level
HDI_2006 1 -.62* -.57*
% Variance in reading test at
school level 1 .73*
Source: Own calculations based on PIRLS 2006, total sample except for Luxemburg
Table 2 presents the bi-variated correlations between the variables described above. As it
can be seen, there are high negative correlations between IDH and the percentages of the
variance at the school level, both in reading and in student SES. This provides empirical
evidence to support the hypothesis that the higher the level of development of a country, the
lower the social differences between its schools and the lower the relative difference of their
results. That is, a high national economic development is associated with low levels of socio-
academic differentiation between schools.
It is also interesting to point at the fact that there is a strong association between the social
segmentation indicator and the school level of variance in reading achievement. As it was
established in the previous section, this might be explained by the strong effect that the
school socio-economic context exert on student achievement. According to these results,
schools in less-developed countries are considerably segmented in social and academic
terms. This finding may suggest that school factors and school socio-economic context were
able to explain greater percentages of the variance as the level of development of a country
is lower. However, because of restrictions of space, it is not possible to test such hypothesis
in this work.
Coefficients in the country level model
Similarly than the preliminary correlation analysis, the results of the regression model provide
evidence to support, at least partially, the hypothesis set for this work. As it was established
in the hypotheses, the IDH shows a positive association with the national average of
achievement. As it was explained in the previous section, this finding might be explained

22
through the strong effect that school SES has on student achievement. Although in previous
stages of the modeling strategy the country variance had been reduced in 76%, when the
IDH is fitted into the model, the percentage of explained variance increase by 11 percent
points, reaching a total of 87%. It is important to mention that even though there is still a
considerably percentage of the variance that remains unexplained at the country level, it is a
percentage rather small.
According to the literature, this remaining variance could be explained by institutional
characteristics of the education systems and / or their policies; however we do not have
robust enough variables to measure these factors. In any case, it is our intuition that most of
these institutional characteristics would not show statistically significant effects. Drawing on a
sociological perspective centered on the persistence of social inequalities, we suggest that
the most important effects of national characteristics on educational achievement obey to the
social structure and the type of well-fare regime operating in each country.
Next, we present the results for the interaction models between school factors and country
level characteristics. In the first model, only the interaction between school SES and HDI was
fitted. As predicted by our hypothesis the coefficient was negative, suggesting that the HDI
could compensate for the effects of social differentiation between schools. However its level
of significance was p=0.088. Interesting results emerged when the interactions with the
remaining coefficients were introduced into the model: the interaction coefficients showed to
be significant for the rural and less than 200 books variables. Additionally, the interaction
between IHD and school SES became clearly non-significant (p>0.4)4.
The negative effect showed by the variable rural in the last model remains significant, but the
introduction of HDI into the model explains 92% of its original variance (this can be observed
in graph 3). That would mean that the level of national development manages to effectively
explain the differences between rural and urban sectors, being higher when lower is the level
of development.
4 The interaction coefficient between HDI and level of reading skills (Reading 1st grade) was not significant either.

23
In turn, a similar trend is observed with the negative effect of the lack of books in school: the
interaction with the HDI shows a positive and significant coefficient. This would indicate that
the negative slope is dimmed as the level of country development is higher. In this case, the
percentage of the variance explained for this variable by the IDH is 34% (graph 3); and its
coefficient that in a previous model (not shown here) was positive and significant, is not
significant anymore. In other words, it can be claimed that the negative effect associated to
the lack of resources is only evident when it interacts with country level of development (i.e.
the availability of public extra-school resources in society).
In substantive terms, these results suggest that the level of development of the countries
contributes to ameliorate the educational inequalities associated to school social
segregation, though in an indirect way. The higher the level of national well-being, the
strongest its moderation of the negative effects associated to rural settings and lack of school
resources (observed through the provision of school books).
Source: Own calculations based on PIRLS 2006, total sample except for Luxemburg

24
Discussion This presentation attempted to assess the impact of country development and economic
inequality on the reading learning of a large sample of primary students from more than 40
countries. Our main hypothesis states that there are both direct and indirect effects of
development and inequality. Development affects learning directly by providing students and
families with a set of resources which are helpful for developing learning abilities, despite the
quality of formal education received by each student. To the extent that these resources are
more or less publicly available, development would also affect learning indirectly, by reducing
the effects of inequalities in school SES and resources. Economic inequality affects learning
directly by allowing the institutionalization of socio-political dynamics within the educational
systems that lower educational quality (e.g.: corruption, particularistic behavior, political use
of educational policies). The indirect effects of inequality are produced through the strong
effects that social segregation of schools exerts on learning, affecting school resources,
teachers’ expectations, and so forth.
The results support, at least partially, some of these statements. Firstly, we found strong,
negative correlations between HDI, social segregation and academic differentiation among
schools, thus giving partial support to the Heyneman-Loxley findings (but not necessarily
supporting their explanations for those findings). Secondly, a positive and statistically
significant association between HDI and national mean score on the reading test was found.
Thirdly, we found that the negative school-level associations between rural schools, few
books at school, and learning, are significantly smoothed by countries’ development. In
conclusion, countries’ development appears to have significant direct and indirect effects on
learning, increasing mean scores and reducing inequalities related to school resources.
Inequality, on the other hand, does not show any kind of effects (at least when measured
using the Gini index).
We have also corroborated some of the previous findings of educational research on learning
inequalities. Specifically, the relative strength of SES effects at the school level, compared
with the strictly organizational school effects, was corroborated. Another interesting finding is
the small amount of variance remaining at the country level after controlling for the effects of
development. Although these are very general results and more detailed, country-specific
analysis must be carried on, they are important because they seem to corroborate Basil

25
Bernsteins’ statement: education cannot compensate for society. School resources,
educational policies and reforms, do not seem to have a decisive impact on educational
results, particularly under high levels of poverty and inequality. It seems almost impossible to
raise the quality of education significantly without sustained levels of economic growth and
equality of opportunity.
The results presented here are far from definitive. It could be questioned, for example, if
measures such as HDI and the Gini index are the most appropriate to measure development
and inequality. In addition, we do not have direct measures of the availability of extra-scholar
educational resources, or systematic measures for educational policies. Also, educational
institutions are not considered in our analysis, while other studies have shown that they
might have an impact on learning. Variables at the individual and school level could also be
questioned, either because of the way they are constructed (SES index does not take into
account parent’s educational level), or because they are missing from the database (for
example, if the school belongs to the private or the public sector).
As we mentioned at the beginning, the findings presented here are just the first steps of a
research program that needs to advance in at least two tracks. Firstly, data from different
sources and different years should be analyzed (PISA, TIMSS, SERCE, etc.), to reach more
robust conclusions. Secondly, it is necessary to carry on separate national-level analysis to
compare “what works” at the school level in each country, how student and school-SES
inequalities impact on achievement, how much variance can those factors account for, and
how do these results relate with more precise measures of national development, equality,
resources, an institutions.

26
Works Cited Alvarez, J., Garcia-Moreno, V., & Patrinos, H. A. (2007). Institutional effects as determinants of learning outcomes: exploring state variations in Mexico. Policy Research Working Paper Series No. 4286. Washington, DC: The World Bank.
Baker, D. P., & Holsinger, D. B. (1996). Human Capital Formation and School Expansion in Asia. International Journal of Comparative Sociology , 37 (1-2), 159-173.
Baker, D. P., Goesling, B., & LeTendre, G. K. (2002). Socio-economic status, school quality and national economic development: A cross-national analysis of the "Heyneman-Loxley" effect on mathematics and science achievement. Comparative Education Review , 46 (3), 291-313.
Bryk, A. y Raudenbush, S. (1992). Hierachical Linear Analysis. Thousand Oaks: Sage.
Buchmann, C., & Hannum, E. (2001). Education and Stratification in Developing Countries: A Review of Theories and Research. Annual Review of Sociology , 27, 77-102.
Coleman, J. S., Campbell, E. Q., Hobson, C. J., McPartland, J., Mood, A. M., Weinfeld, F. D., y otros. (1966). Equality of Educational Opportunity. Washington, D.C: U.S. Government Printing Office.
Cortes, F., & Ruvalcaba, R. (1993). Consideraciones sobre el uso de la estadistica en las ciencias sociales. Estar a la moda o pensar un poco. En Mendez, & Gonzalez-Casannova (Edits.), Matematicas y Ciencias Sociales. Mexico, D.F.: Miguel Angel Porrua.
Fernández, T. (2003). Tres estudios sobre determinantes sociales del rendimiento escolar. Mexico: Instituto Nacional para la evaluación de la Educación.
Fernandez, T., & Blanco, E. (2004). ¿Cuánto importa la escuela? El caso de México en el contexto de América Latina. Revista Electrónica Iberoamericana sobre Calidad, Eficacia y Cambio en Educación , 2 (1).
Foy, P., Galia, J., & Li, I. (2007). Scaling the PIRLS 2006 reading assessment data. En M. Martin, I. Mullis, & A. Kennedy (Edits.), PIRLS 2006 technical report. Chestnut Hill: Boston College.
Fuller, B. (1986). Raising School Quality in Developing Countries: What Investments Boost Learning? World Bank Discussion Papers 2. Washington, D.C.: World Bank World Bank.
Hanushek, E. A., & Luque, J. (2003). Efficiency and Equity in Schools around the World. Economics of Education Review , 20 (5), 481-502.
Hanushek, E. A., & Raymond, M. E. (2005). Does school accountability lead to improved student performance? Journal of Policy Analysis and Management , 24 (2), 297-327.
Hanushek, E. A., & Raymond, M. E. (2004). The effect of school accountability systems on the level and distribution of student achievement. Journal of the European Economic Association , 2 (2/3), 406-415.

27
Hanushek, E. A., & Woessmann, L. (2007). Educational Quality and Economic Growth. World Bank, Washington, D.C.
Heyneman, S. (1976). Influences on Academic Achievement. A comparison of Results from Uganda and More Industrialized Societies. Sociology of Education , 49 (1), 200-211.
Heyneman, S. P. (2004). The use of cross-national comparisons for local Education Policy. Curriculum Inquiry , 34 (3), 345-352.
Heyneman, S., & Loxley, W. (1982). Influences on academic achievement across high and low income countries: a re-analysis of IEA data. Sociology of Education , 55 (1), 13-21.
Heyneman, S., & Loxley, W. (1983). The effect of primary school quality on academic achievement across twenty-nine high and low income countries. American Journal of Sociology , 88 (6), 1162-1194.
Hofman, R., Hofman, W., & Gray, J. (2008). Comparing key dimenssions of schooling: towards a typology of European school systems. Comparative Education , 44 (1), 93-110.
Levacic, R. (2007). The relationship between student attainment and school resources. En T. Townsend (Ed.), International Handbook of School Effectiveness and Improvement (Vol. 1, págs. 395-410). Dordrecht, The Netherlands: Springer.
Mullis, I. V., Martin, M. O., Kennedy, A. M., & Foy, P. (2007). PIRLS 2006 International Report. Chestnut Hill: TIMSS & PIRLS International Study Center, Lynch School of Education, Boston College.
Muñoz-Izquierdo, C., & Villarreal, G. (2005). Un marco referencial para interpretar los efectos educativos de los programas compensatorios. Research Conferenece: Poverty and poverty reduction strategies: mexican and international experience. Monterrey: The Kennedy School of Government, Harvard University; Escuela de Graduados en Administración Pública y Política Pública, ITESM.
Rassool, N., & Morley, L. (2000). School Effectiveness and the Displacement of Equity Discourses in Education. Race Ethnicity and Education , 3 (3), 237-258.
Riddell, A. R. (1989). An alternative approach to the study of school effectiveness in Third World Countries. Comparative Education Review , 33 (4), 481-497.
Riddell, A. R. (1988). School Effectiveness in Secondary Education in Zimbawe: A Multilevel Analysis. PhD Dissertation, University of London, Institute of Education.
Sandoval-Hernandez, A. (2007). La equidad en la distribución de oportunidades educativas en México. Un estudio con base en los datos del EXANI-I. Revista Electrónica Iberoamericana sobre Calidad, Eficacia y Cambio en Educación , 5 (1), 22-42.
Thrupp, M. (1998). Exploring the politics of blame: school inspection and its contestation in New Zeland and England. Comparative Education , 34 (2), 195-208.
Tsang, M. C. (1995). Public and Private Costs of Education in Developing Countries. En M. Carnoy (Ed.), Internationa Elncyclopedia of Economics of Education (págs. 393-398). Oxford: Pergamon.

28
Wößmann, L. (2003). Schooling Resources, Educational Institutions, and Student Performance:The International Evidence. Oxford Bulletin of Economics and Statistics , 65 (2), 117-170.
Appendix A Descriptive Statistics for student-level variables Minimum Maximum Mean Std. Deviation GIRL (female student)
.00 1.00 .4942 .49997
SES (index of student socio-economic status) -2.19018 1.25262 .0000000 1.00000000
READPR (index of reading practices outside the school) -2.44746 1.72072 .0000000 1.00000000
MAGAZINES (index of frequency reading comics, magazines, and newspapers) -2.31238 2.85133 .0000000 1.00000000
READING BY HIM/HERSELF (student reads by him/herself in class very every day or almost) .00 1.00 .6664 .47148
CLIMATE (index of school climate perceived by the student: care, respect, help among students, safeness, teachers care)
-3.98758 1.35362 .0000000 1.00000000
NEGATIVE CLIMATE (index of bullying and stealing at school) -1.21110 2.10770 .0000000 1.00000000
READING HOMEWORK (student is assigned homework that implies reading at least once a week)
.00 1.00 .7853 .41060
NOVELS (student reads novels or books with histories at least once a week) .00 1.00 .6355 .48130
LIBRARY (student uses school library at least once a week) .00 1.00 .6915 .46186
LIKES READING (student disagrees with the statement “I only read if I have to”) .00 1.00 .4838 .49974
HELP (student receives help from parents to do reading-relate homework) .00 1.00 .3648 .48136
WATCHING TV (student watches TV 3 or more hours a day) .00 1.00 .2880 .45283
DOES NOT READ (student declares not reading) .00 1.00 .2535 .43504
COMPUTER1 (student uses computer at home every day) .00 1.00 .2709 .44441
COMPUTER2 (student uses computer at home once a week) .00 1.00 .3865 .48695
INTERNET (index of frequency in the use of internet) -1.10715 2.41854 .0000000 1.00000000
29
Descriptive Statistics for school-level variables Minimum Maximum Mean Std. Deviation MEANSES (mean index of student SES)
-2.61119 1.86320 .0000000 1.00000000
RURAL (school located in a rural area) .00 1.00 .5830 .49306
HCLASS (hours of schooling in a year) -2.25781 4.18219 .0000000 1.00000000
SCHREAD (school emphasis in reading) -1.64162 1.38555 .0000000 1.00000000
LIBRARY (school has a library) .00 1.00 .7992 .40062
LESS 200 BOOKS (school library has less than 200 books) .00 1.00 .4326 .49544
LACKTEACH (school’s capacity to teach hindered by lack of qualified teachers) .00 1.00 .4125 .49229
LACKICT (index of lack of technology resources for teaching) -1.51195 2.35788 .0000000 1.00000000
LACKINFR (index of lack of infrastructure and teaching resources) -1.75224 2.03768 .0000000 1.00000000
READING 1ST GRADE (index of reading ability of the evaluated students when they entered school) -1.06484 1.85305 .0000000 1.00000000
COORD1 (teachers meet two or three times a week to work on pedagogical issues) .00 1.00 .1317 .33821
COORD2 (teachers meet once a week to work on pedagogical issues) .00 1.00 .3668 .48192
TIMEPED (% of school principal’s time dedicated to pedagogical or instructional issues) -1.34999 5.81003 .0000000 1.00000000
FAMILIES(50% or more parents participate in meetings with teachers) .00 1.00 .6079 .48823
CLIMATE (school climate: students desire to do well, students regard for welfare, parent support, respect for school property, teachers expectations and satisfaction)
-2.45290 4.03866 .0000000 1.00000000
CLIDIS (school disciplinary climate: drug abuse, theft, vandalism, physical conflicts…) -1.14093 2.29984 .0000000 1.00000000

30