Embed Size (px)
Citation preview
Vol.:(0123456789)
The Geneva Papers on Risk and Insurance - Issues and Practicehttps://doi.org/10.1057/s41288-021-00237-3
The relationship between net promoter score and insurers’ profitability: an empirical analysis at the customer level
Jonas R. Jahnert1 · Hato Schmeiser1
Received: 6 September 2020 / Accepted: 30 April 2021 © The Author(s) 2021
AbstractThis paper examines the relationship between customer satisfaction and profitability at the level of the individual customer. In many industries, investigations detect a positive, decreasing relationship between customer satisfaction and firm profitabil-ity. The insurance industry has rarely been the object of such investigations. Pooser and Browne (2018) started this discussion by examining U.S. insurers at the firm level. We provide reasons why the positive satisfaction–profitability relationship might be reversed, particularly in the case of the insurance industry. We conduct an array of OLS regressions with customer-level data. Our results reveal a strong positive relationship between customer satisfaction and profitability. The effect is considerably large and also robust when investigating the effect of several customer characteristics on this relationship. We recommend that the increase in profitability is induced by a strong positive correlation between customer satisfaction and pre-mium income, while satisfaction is not associated with the combined ratio.
Keywords Profitability of customer relationship · Net promoter score · Customer satisfaction
Introduction
This paper empirically investigates the relationship between customer satisfaction and insurer profitability. An increase in customer satisfaction is often mentioned as a major strategic management goal or when setting targets for sales managers. More than a third of all companies use customer satisfaction measures to deter-mine their managers’ compensation (Ittner and Larcker 1998, p. 3). It is therefore
* Jonas R. Jahnert [email protected]
Hato Schmeiser [email protected]
1 Institute of Insurance Economics, University of St. Gallen, Tannenstrasse 19, 9000 St. Gallen, Switzerland
J. R. Jahnert, H. Schmeiser
of great importance to better understand the impact of customer satisfaction on the most important firm target measures, such as profitability.
Outside the insurance industry, the prior literature on this relationship is exten-sive. Most research concludes that there exists a positive, non-linear, decreas-ing relationship between customer satisfaction and the provider’s profitabil-ity (Anderson et al. 1994; Ittner and Larcker 1998; Gupta and Zeithaml 2006). However, the magnitude of this relationship varies across different industries and countries. Hence, the results of a particular situation cannot be applied directly to other industries or countries (Anderson et al. 2004; Gupta and Zeithaml 2006).
It appears to be intuitive that customers repurchase a good or service if they are satisfied with it. As long as the repurchased product or service exhibits a positive contribution margin, the company increases its profits with each additional unit sold. In other industries, this debate began three decades ago. For the insurance industry, this discussion only began in 2018 (Pooser and Browne 2018). Pooser and Browne’s dataset consists of firm-wide measures for several auto insurance companies in the U.S. market. In our investigation, we possess a unique dataset on the customer level from a Swiss non-life insurer.
To date, most research in this field is conducted by analysing customer satis-faction indices focusing on firm-wide customer satisfaction (Ittner and Larcker 1998; Anderson et al. 2004; Pooser and Browne 2018). Though this procedure allows for industry-wide general statements, it cannot account for the fact that there might be heterogeneous groups of customers disclosing diverse behaviours. In the insurance industry, the different behaviours of various customer groups have an even greater impact on the cost, and hence the profit structure. Conse-quently, we believe it is important to investigate the relationship between satisfac-tion and profitability in the insurance industry at the customer level. Looking at firm-level data omits the possibility that some satisfied customers impact firm-wide satisfaction in an extremely positive manner while exposing extreme losses at the same time.
Moreover, customers in the insurance industry might not behave similarly to customers from other industries in terms of how satisfaction evolves and how profit emerges. Coming from a theoretical insurance perspective, the willing-ness to pay (WTP) for insurance will, ceteris paribus, differ depending on the policyholder’s private information with respect to her individual risk type. If this information is unknown by the insurer and hence a fixed premium is applied for heterogeneous risk types, policyholders with a higher WTP (high-risk type) would receive a greater utility from signing the insurance contract compared to the lower risk type. It could be assumed that this utility from purchasing insur-ance coverage is a major factor when it comes to customer satisfaction. Besides, in the insurance industry, the individual behaviour and personal characteristics of customers highly affect the profits of the insurer. Customer characteristics are not fully disclosed to the insurer. Hence, insurers have to deal with moral hazard and adverse selection. As a result of these fundamental differences, we find it important to conduct an insurance-specific examination of this relationship. In summary, there could be major discrepancies between empirical findings and the-oretical considerations with respect to this topic.
The relationship between net promoter score and insurers’…
The results of our investigation suggest, despite all counterarguments, that cus-tomer satisfaction is strongly positively associated with profitability per customer. These results are found to be robust in terms of magnitude and significant across dif-ferent customer groups separated by customer and claims characteristics. This study does not find evidence for the non-linearity of the relationship, as found in other industries. Instead, it suggests that customer satisfaction enhances profitability. This is due to the positive relationship between satisfaction and the premium income of customers and not due to a negative relationship between satisfaction and adminis-tration and/or claims costs.1 In this respect, policyholders seem to behave in a simi-lar way to customers in other industries.
The rest of this paper is structured as follows. The next section provides a lit-erature review, which will develop the importance of the addressed relationship and display an array of research from both a general and an insurance-specific perspec-tive. Then, we build the theoretical, insurance-specific basis of this topic and derive four hypotheses. This is followed by sections containing a description of the dataset and methodology, the quantitative analysis and robustness checks. The final section draws conclusions and provides recommendations for future research.
Literature review
The relationship between customer satisfaction and profitability: general findings
Companies do care about customer satisfaction. One of the first studies in this area (Waters 1931) investigates customers’ attitudes towards the salesman. Since then, many academic papers have been published concerning the various con-sequences and implications of customer satisfaction. The primary correlation scholars are concerned about is the relationship between customer satisfaction and profitability. In general, the literature detects a strong positive correlation between customer satisfaction and profitability (Anderson et al. 1997; Anderson and Mittal 2000; Gruca and Rego 2005; Ittner and Larcker 1998; Kotler 1991). Ittner and Larcker (1998) and Anderson and Mittal (2000) add to this finding and state that the relationship is non-linear (asymmetric) and decreases with the level of satisfaction. This finding has two primary implications.
Firstly, a 1% decrease in customer satisfaction has a larger negative impact on profitability when compared to the positive effect of a 1% increase in customer satisfaction (asymmetry). Anderson and Mittal (2000) state that a 1% decrease in the Swedish Customer Satisfaction Barometer (SCSB) results in a 5.08% drop in return on investment (ROI), while a 1% increase in the SCSB only results in a 2.37% rise in ROI. Secondly, for high levels of satisfaction, the positive correla-tion completely vanishes (Ittner and Larcker 1998). In these extreme cases, the
1 By claims we mean the indemnity payment to the policyholder. This number is in general smaller than the incurred loss (e.g. because of deductibles).
J. R. Jahnert, H. Schmeiser
costs of satisfying customers exhibit extra returns. Additional research shows that the magnitude of the relationship between satisfaction and profitability depends on the degree of customisation or standardisation in a specific industry (Andersen et al. 1997). This relationship might also be subject to cultural (Anis and Tausif 2018) and, more broadly, contextual factors (Chen 2009). Therefore, a lot of country- and industry-specific research has been conducted.
The comprehensive work of Gupta and Zeithaml (2006, pp. 725–726) reviews and outlines the existing body of knowledge regarding this relationship. Their study develops three generalisations of the satisfaction–profitability relation-ship. Firstly, an improvement in customer satisfaction has substantial positive consequences for the financial performance of firms. Secondly, this relationship is asymmetric and non-linear. Thirdly, the magnitude of this relationship fluctu-ates across industries and across firms within the same industry.
The literature reveals multiple metrics to measure satisfaction and profitabil-ity: Anderson et al. (2004) employ the American Customer Satisfaction Index (ACSI) to measure satisfaction and Tobin’s Q to quantify profitability. Their results show that a 1% increase in ACSI increases firms’ Tobin’s Q by 1.016%. Anderson et al. (1994) find that a 1% change in SCSB impacts a company’s ROI by 11%. The results of Anderson et al. (1997) show an elasticity between SCSB and ROI of 0.14 to 0.27. Gruca and Rego (2005) analyse 105 firms across 23 industries. In this sample, a 1% rise in ACSI is followed by growth in the subse-quent year’s cash flow of USD 55 million per company.
Profitability is not the only measure of importance. Customer satisfaction is also positively associated with customer loyalty (Hult et al. 2019), revenue, larger price margins and profits (Ittner and Larcker 1998), shareholder value (Anderson et al. 2004) and willingness to pay (Homburg et al. 2005). Further-more, Hallowell (1996) investigates U.S. retail banks, employing a similar meth-odology to the one used in this paper. He concludes that customer satisfaction is positively correlated with customer loyalty, which again correlates positively with various firm-wide profitability measures.
These results provide evidence that the effect of satisfaction on profitability is not only positive and statistically significant, it is also relevant in terms of the magnitude. Furthermore, an industrial and geographical focus is found to be important when investigating the satisfaction–profitability relationship.
Relationship between customer satisfaction and profitability: insurance companies
Scholars have recently started to investigate this relationship in the context of insur-ance. This section discusses papers that investigate a similar relationship in the insurance industry and one paper that assesses the same relationship examined in this paper—but in a different manner.
Durvasula et al. (2004) examine repurchasing intentions for Singaporean life insurance and conclude that satisfaction is positively correlated with repurchas-ing intentions. Taking this result further, Wu and Lin (2009) find that, in the U.S.
The relationship between net promoter score and insurers’…
property and casualty (P&C) business, customers who are actively renewing their insurance contracts are more profitable and constitute better risks than customers who tend to frequently switch their insurer. D’Arcy and Doherty (1990) come to similar conclusions. Both investigate U.S. auto insurers and show that loss ratios dramatically fall with policy age due to insurers lowballing strategies to gain new customers. Therefore, it is important to bind profitable customers to an insurance company for as long as possible. These switching barriers are extensively discussed by Colgate and Lang (2001), who investigate the reasons why customers that intend to switch their insurance provider finally do not leave the company. Further, Guillen et al. (2012) examine factors to determine customer loyalty. They conclude that the factors explaining insurance customer loyalty vary over time.
Pooser and Browne (2018) are the first to investigate the satisfaction–profitabil-ity relationship for the insurance sector. The examined dataset contains a customer satisfaction index (CSI), provided by J.D. Power, a private marketing research com-pany. J.D. Power surveys U.S. citizens on a voluntary basis about their satisfaction with their auto insurance and builds a firm-wide satisfaction measure for many dif-ferent insurance companies. As profitability measures, the researchers firstly assume a company’s total combined, loss and expense ratios. These ratios include the total portfolio of the insurer and not only the auto business. Secondly, they rebuild the auto-only combined loss and expense ratio of the insurers on their own, based on publicly available data. In the last step of their examination, they solely look at data from insurance companies whose total premium income is made up of at least 50% auto premia. With these three sets of data, they run ordinary least squares (OLS) regressions, controlling for several firm-specific variables.
The study by Pooser and Browne reveals negative correlations between customer satisfaction and combined/expense ratios at the firm level, as well as no correla-tion with insurers’ loss ratios. These results hold for all three datasets, at least to a significance level of 10%. The authors conclude that there is a positive relation-ship between satisfaction and profitability in the U.S. insurance industry. Pooser and Browne (2018) suggest that satisfied customers continuously prolong their con-tracts. As the acquisition costs of new customers are significant and can be as high as the average contribution margin of several years, customer retention should be an important goal of insurance companies.
This examination only looks at average customer satisfaction. Consequentially, the individual behaviour of customers cannot be assessed when applying this approach. As the distribution of customer satisfaction plays an important role in assessing this relationship, this should be considered in the investigation. Otherwise, a few extremely satisfied customers could influence the overall satisfaction tremen-dously, while exposing a highly negative profitability. Therefore, it is very important to investigate various customer groups to validate whether or not the overall results hold for different customer segments.
Usually, insurers calculate their premiums such that all customers will make an expected profit. From the ex-post perspective, the firm-wide average profit is rather stable and, in general, quite comparable between non-life insurers, as many coun-tries possess competitive insurance markets. However, individual profit ratios per customer fluctuate heavily. From the insurer’s perspective, most customers possess
J. R. Jahnert, H. Schmeiser
positive profitability, while few have an extremely negative individual profitability. Consequently, if satisfaction was meant to explain profitability, it should explain the average profitability of an insurer and the large variation in profitability between individual customers.
All in all, Pooser and Browne’s (2018) results provide a good understanding of how satisfaction and profitability are interrelated in the insurance industry. Still, a deeper look at the individual customer level can be helpful to broaden the perception of this relationship.
To summarise, the literature on the relationship between customer satisfaction and profitability is vast and many aspects and specific areas have been covered. All of the general research concludes that customer satisfaction has a strong and posi-tive impact on firm profitability. However, the assessment of individual industries is mandatory. Due to the common discernment that customer satisfaction is generally value-enhancing, many companies use customer satisfaction measures to determine the compensation of executives and employees (Ittner and Larcker 1998). Further-more, profitability is a major goal of many insurance companies, next to growth and safety. However, the non-life insurance industry has rarely been the focus of these investigations and a positive relationship is often just assumed by practitioners without robust insurance-specific evidence. Therefore, it is of great importance to investigate the link between customer satisfaction and profitability in the insurance industry.
Derivation of hypotheses
At first glance, a positive relationship between satisfaction and profitability seems intuitive. Even though this relationship is proven for many industries, the insurance sector is subject to structural differences and, according to the theory of insurance demand, a negative relationship appears reasonable to assume. According to insur-ance theory, there are reasons why both satisfaction and profitability may show dif-ferent trends when compared to other industries.
Insurance theory founded on normative-rational decision making is based on the comparison between the premium demanded and the policyholder’s claim distribu-tion transferred to the insurer. High-risk policyholders tend to have a higher WTP for a given insurance contract than low-risk policyholders. For them, the difference between WTP and demanded premium (based on a heterogeneous portfolio of high- and low-risk policyholders) is generally larger than for policyholders with lower risks, resulting in a greater utility when closing an insurance contract. One could expect that this greater increase in utility positively influences customer satisfaction. This does not require that the policyholder experiences claim events as this can be purely based on ex-ante expectations. It is also worth mentioning that the event of a claim is usually a negative experience for customers and may lead to financial consequences on the policyholder’s side if full insurance coverage has not been pur-chased. However, if customers never experience a loss over many years, they might start to question the need for the insurance contract. As well as the possible influ-ence of the difference between WTP and premium paid, one would certainly expect

The relationship between net promoter score and insurers’…
that customer satisfaction depends on several other factors, such as trust, branding or service quality.
In many industries, companies know their product costs in great detail and can calculate their contribution margin for a specific product unit precisely in advance. Elsewhere, the costs and margin structure are deterministic and usually remain equal ex-ante and ex-post. In the insurance industry, product costs, which are mainly based on losses, are ex-ante stochastic. Therefore, ex-post, there is a large discrep-ancy between the premiums paid and the loss payments received for almost any poli-cyholder. This can lead to customers either paying premiums for a long time without receiving any ‘paybacks’ or receiving large indemnities compared to the premiums paid. This may influence customer satisfaction–even if the insurance product’s pric-ing is, in general, based on the expected claims per contract. There may be cus-tomers who mainly compare premiums with the received indemnity payments over past periods. For them, satisfaction and insurer profitability might be negatively correlated.
Contrary to this line of reasoning, particular insurance contracts (like auto insur-ance) are compulsory or required to obtain mortgages from a bank (like homeowner fire insurance). At least some policyholders are not able to evaluate if they are high or low risk. Incurring accidents are mainly unintentional and are not welcomed by policyholders for many reasons.
Additionally, the effects of moral hazard and adverse selection might influence the cost structure of the insurer. The customer’s behaviour (‘moral hazard’) could impact the loss distribution, and hence the expected cost structure and expected prof-itability of the insurer (Arrow 1963; Pauly 1974). Due to adverse selection, rational customers might select insurance tariffs not designed for their loss distribution, as customers carry private information, significantly impacting their loss distribution (Rothschild and Stiglitz 1976; Jensen and Meckling 1976). Furthermore, insurers cannot fully prevent moral hazard and adverse selection (Biener et al. 2018). The fact is that customers can influence their own payout immensely after having signed the insurance contract. This puts them in a completely different situation than with other industries. In contrast to this argument, research rather describes individuals as longing to be ‘good citizens’ and wanting to behave in line with society’s goals (Almond and Verba 1963).
These arguments may make the benefit of insurance different from services and products provided in other industries. In consequence, the relationship between cus-tomer satisfaction and profitability might also vary.
There are several arguments for either a positive or a negative relationship between customer satisfaction and profitability. Due to a lack of previous research in the insurance industry, we assume in our hypotheses that the satisfaction–profit-ability relationship is negative for insurance companies, but we also consider the possibility of a positive relationship. A negative relationship would not imply that customers are satisfied because of claims; rather, this assumption is founded on the theoretical argument that high-risk policyholders might be satisfied with the fact that they are able to purchase insurance for a comparably low premium in relation to their WTP.
J. R. Jahnert, H. Schmeiser
Based on these theoretical foundations, we derive four hypotheses on the rela-tionship between satisfaction and profitability in the Swiss non-life insurance mar-ket. Supported by the reasons discussed in this section, in the insurance industry, the effect of customer satisfaction on insurer profitability might be opposite to what prior research on other industries has shown. Therefore, we derive the following hypothesis:
Hypothesis I In the non-life insurance industry, satisfaction has a negative effect on insurer profitability2 per customer.
This first hypothesis investigates the overall relationship, which is already impor-tant for management decisions. However, there might be further customer and claim characteristics that influence this relationship. Therefore, we assess this con-nection in more depth. In line with Gupta and Zeithaml’s (2006) second generalisa-tion, which expects that the cost of satisfying customers to the extreme surpasses the additional profit, we formulate the hypothesis that the relationship is even more negative for highly satisfied customers.
Hypothesis II In the non-life insurance industry, for promoters, the satisfaction–prof-itability relationship is more negative than the general relationship.
After the two main hypotheses, we intend to investigate two further special fea-tures of the customer satisfaction–profitability relationship in the insurance industry: in the event of a claim, the contribution margin usually shrinks drastically. At the same time, customers experience the value of insurance and they receive a monetary return—even though the indemnity is generally below the policyholder’s original loss. Consequentially, the third hypothesis states that the relationship between sat-isfaction and profitability becomes more negative as the claims-to-contracts ratio increases. As the number of claims3 typically depends on the number of contracts a policyholder holds, we employ the CCR here.
Hypothesis III In the non-life insurance industry, the satisfaction–profitability rela-tionship becomes more negative as the claims-to-contracts ratio increases.
Hypothesis IV concerns the costs that customers induce to insurers. According to Hypothesis I, customer satisfaction influences profitability negatively. This might either stem from increased costs or decreased premium volume. Following the pre-vious argument, only the first scenario is logical. Hypothesis IV narrows down this expectation by stating that this negative relationship between customer satisfaction
2 Profitability is defined as the average, annual contribution margin per customer, calculated as net pre-miums (after reinsurance) minus net claims (after reinsurance) minus reserves and provisions for the signing and prolonging of the contracts. Due to insufficient data, claims handling costs and other admin-istrative costs are not considered here.3 The number of claims is the sum of all claims the policyholder reports to the insurance company over the last five years.
The relationship between net promoter score and insurers’…
and profitability is induced by a positive association between customer satisfaction and the costs per customer.
Hypothesis IV In the non-life insurance industry, customer satisfaction is positively associated with the combined ratio per customer for the insurer.
Data and methodology
The insurer
The investigated insurer is a major player in the Swiss insurance market. The com-pany is ranked among the top eight Swiss insurance organisations in terms of P&C premium income in 2018 (Eidgenössische Finanzmarktaufsicht FINMA 2019). Via a separate legal entity, the insurance company also offers life insurance and belongs to an internationally operating insurance group.
Variables and observations
Survey procedures and timespan
The entire dataset contains 48,320 anonymised observations. The satisfaction data was collected during the period between April 2017 and February 2019. Profitability and claims data cover the five-year period from March 2014 through February 2019. The dataset comprises records for each profitability and claim variable for every sin-gle year of the five one-year periods. All other data are one-point-of-time pictures from the end of February 2019. The process involves all customers who have been in contact with the insurer automatically being asked a question concerning their satisfaction. These touchpoints range across the whole customer relationship. They can be divided into six categories: from general contact with the customer via phone or in person, contract changes, changes of address via customer service and claim-related contact points.
The number of observations vary between 1140 and 7908 for the different touch-points. It may seem possible that the reason for getting in contact with the insurer may influence customer satisfaction or profitability. The varying number of observa-tions is not the consequence of a selection, it occurs by chance. As our dataset con-stitutes the full available dataset of the insurer, the varying number of observations is induced by the definition of the touchpoint conducted by the insurer. The custom-ers do not actively decide which touchpoint they get attached to, but their external circumstances do. Therefore, the distribution of observations between the touch-points influences neither the results nor the validity of our investigation. Moreover, no customers are accidentally excluded from the survey. It can be assumed that the customers in the dataset were randomly added. Furthermore, the results are compa-rable over the complete timeline, because the methodology has not changed during the observation period. Nevertheless, there might be ‘silent’ customers who do not
J. R. Jahnert, H. Schmeiser
make any requests or claims, or have any contact with the insurer; these customers do not appear in the dataset.
Dependent variable
The profitability per customer is measured by the average Contribution Margin over the recorded five years, considering only the non-life business. We employ the annual average over this timespan to control for extreme values. Still, large outliers occur. Hence, we winsorise the contribution margin such that the outliers outside the 1 and 99 percentiles were corrected to the value of the 1 and 99 percentiles, respec-tively. The insurer does not calculate the contribution margin for customers who signed their first contract less than five years ago. For these customers, the insurer considers this information as irrelevant, because information revealed within a hori-zon of less than five years is found to be unreliable. As such, we cannot consider these customers as part of our investigation. The contribution margin is calculated as all net premiums (after reinsurance) minus all net claims (after reinsurance) minus reserves and provisions for the signing and prolonging of the contracts. However, claims handling or other administrative costs are not considered in this calculation and are not separately available to us.
Independent variable
The measure for satisfaction is the answer given by customers to the net promoter score (NPS) question. This is measured on an 11-point Likert scale ranging from 0 to 10. Missing entries are not deleted but are filled with the average NPS-Score of the respective touchpoint. If one customer is asked the NPS-question multiple times within one touchpoint, the multiple entries are merged and the average NPS score is entered. Consequently, the variable NPS-Score in the final dataset contains decimal figures.
Excursion on the net promoter score
The NPS, introduced by Reichheld (2003), is a widely accepted measure of a com-pany’s customer satisfaction and customer willingness to recommend. Reichheld (2003) conducted research to construct a metric that is superior to existing satis-faction and loyalty measures in terms of simplicity, comparability and being bet-ter able to explain company growth. In contrast to many prior measures of satis-faction or loyalty, Reichheld (2003) narrows down the customer evaluation to one single question, namely “How likely is it that you would recommend company X to a friend or colleague?” (Reichheld 2003, p. 50). An 11-point Likert scale is used, where 0 = not likely at all and 10 = extremely likely. This is the measure of satisfac-tion we are using in the analysis of this paper. In the next step, all customers who give an answer between 0 and 6 are labeled as ‘detractors’. Customers who give an answer of 7 or 8 are labeled as ‘passively satisfied’ and those who answer 9 or 10 are considered ‘promoters’. To calculate the NPS, the percentage of the detractors is subtracted from the percentage of the promoters. This results in a score between
The relationship between net promoter score and insurers’…
− 100 and + 100. Reichheld (2003) found a strong correlation between NPS and future growth rates.
Though in theory the NPS narrowly measures the willingness to recommend, in practice it has become one of the most common measures of customer satisfaction as it is easy to raise, easy to understand and provides a comparable metric to firms. Insurance companies in particular employ the NPS as the most relevant customer satisfaction indicator, often published in their (annual) reports, to benchmark their customer satisfaction against competitors. For example, global insurers like Allianz (2021), Swiss Life AG (2018) or Zurich Insurance Group (2021) employ the NPS as a surrogate for customer satisfaction. Although scientific studies have shown that the NPS score does not perfectly correlate with detailed customer satisfaction indices (Haan et al. 2015, p. 199), insurance companies often prefer the NPS methodology over more sophisticated ones as an approximation of customer satisfaction. Also, critics mention that the NPS methodology considers all individuals within one cat-egory (detractors, passives, promoters) as equal. This argument does not hamper our analysis, as we employ the actual NPS score in our research.
Control variables
The database includes several variables for the characteristics of the customer and the relationship between the customer and the insurer. The dataset contains six dif-ferent dummy variables that signal through which Touchpoint the customer con-tacted the insurer. The variable Sex indicates the gender of the customer (0 if the customer is female and 1 if male). The Age of the customer is measured in years. In all regression models, the logarithm of age in years is used. Another control variable is Family Status. This dummy control equals 1 if the respective customer is married or in a registered partnership and 0 in all other cases.
Switzerland has four official national languages. Besides Italian and Romansh, German and French are the most common. Knowing the mother tongue of a cus-tomer is not only a good indication of the place of origin, but also offers informa-tion about cultural heritage. Therefore, the dummies German and French constitute further controls. Moreover, five variables (e.g. Customer 5–10y) indicate the dura-tion of the customer relationship. The dataset only reflects the non-life business of the insurer. Some customers do have life insurance contracts with the investigated insurer, but provided by a separate legal entity. These customers exhibit a value of 1 for the dummy variable Life Insurance. The number of paid claims is firstly considered as the number of paid claims during the last five years (Claims 5y), as the contribution margin is calculated throughout this timespan. Secondly, as recent claims might influence the strength of the current satisfaction level, the number of paid claims during the last year constitutes a second control variable (Claims 1y). The final control is the number of non-life insurance contracts the customer obtained in February 2019 (Contracts).
The only variable used in the investigation that was not received from the insurer is the degree of urbanisation (Urbanization). For this, an official Europe-wide clas-sification scheme was applied. We obtain the data from the Swiss federal office for
J. R. Jahnert, H. Schmeiser
statistics and attach the score according to every customer’s postal code (Statistik Schweiz—Bundesamt fuer Statistik 2019).
Cleansing of the dataset
The original dataset contains 48,320 anonymised data entries, which include corpo-rate customers. These 5230 entries are removed completely. Observations showing an age of below 18 years or an unknown age (203) are also erased. Moreover, 1603 observations are erased as no postal code is available. Customers with life insurance contracts only (1180) are deleted. In total, 1395 customers answered the NPS ques-tion within the same touchpoint multiple times. These observations are merged into one observation and show the average NPS score. However, 10,511 observations are deleted, because the customer signed their contract less than five years ago and no contribution margins were calculated by the insurer. If an observation contains miss-ing entries regarding other relevant variables, these observations (155) are erased, except for the case where only the NPS score is missing. In these 440 cases, the NPS score is estimated using the average NPS score of the referring touchpoint. After cleansing the dataset, 28,016 observations remain.
Methodology
We investigate the described hypotheses in several steps. For the first hypothesis, we run four linear OLS regression models and perform t-tests to assess whether the NPS score is significant at the 5% level, and hence impacts the contribution margin. For the purpose of illustration, the regression equation is as follows:
Firstly, we investigate the univariate relationship by calculating a univariate OLS regression model without any controls (Table 2, Model I). Next, we subsequently add several sets of controls. The first controls we employ concern the touchpoint, which initiated the sending of the NPS question to the customer (Table 2, Model II). As there are six touchpoints, we create six dummy variables, where 1 represents the customer receiving the NPS question through this touchpoint and 0 otherwise. Because Touchpoint 4 exhibits the most observations, we exclude this dummy to avoid homoscedasticity. In the subsequent model (Table 2, Model III), we add all other relevant customers, insurance internal and relational controls. We perform t-tests to examine whether the NPS score is significant at the 5% level, and hence impacts the contribution margin. Additionally, we assess the goodness of fit of all regression models. Hallowell (1996, p. 37) examines the same relationship in the banking industry with a similar set of control variables. As his results reveal an R2 between 0.12 and 0.20, we expect a minimum R2 of 0.12 for the model to be consid-ered acceptable. Furthermore, we assess whether these results are robust in several subsamples of the dataset we create according to different customer characteristics.
To investigate the second (Table 2, Model IV) and third (Table 2, Model VI) hypotheses, we introduce matching interaction terms to our regression models,
ContributionMargini = � + �1NPS − Scorei + �2 Set of Controlsi + ei
The relationship between net promoter score and insurers’…
which aim to capture the differences in the satisfaction–profitability relationship. For the analysis of Hypothesis IV (Table 2, Model VII), we introduce the new varia-ble Combined Ratio, which is the collected premium volume minus the contribution margin over the premium volume for each customer. We use this Combined Ratio as the dependent variable and run an OLS regression with the same independent vari-ables as before.
Analysis
Descriptive analysis
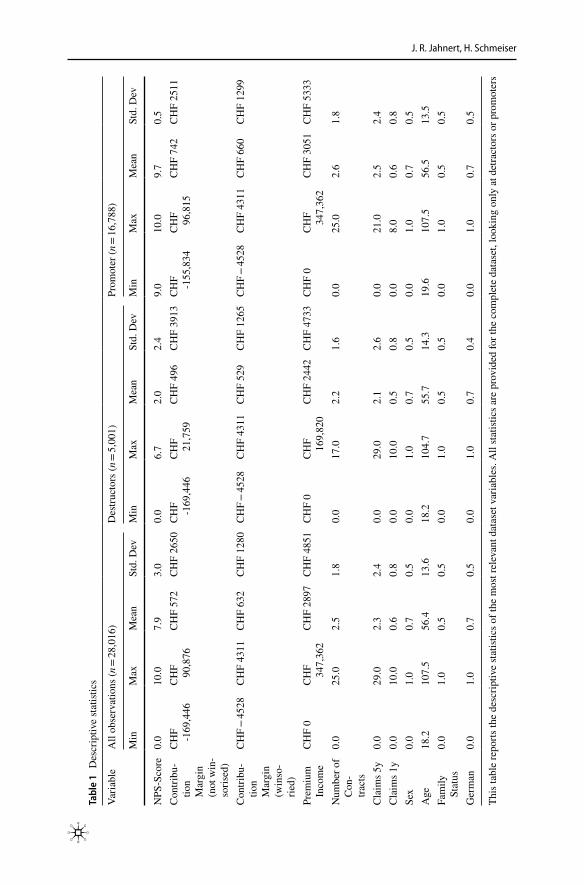
Table 1 shows the descriptive statistics for the main variables in the dataset, firstly for the complete dataset, secondly for the detractors only, and thirdly for the pro-moters only. Considering the full dataset, the complete range of the NPS score is represented, while the mean is 7.9. The minimum premium income is at CHF 0 per year. This is due to the fact that the dataset includes customers who answer the NPS question, but cancel all their contracts in the meantime, until the cut-off date. The unwinsorised contribution margin has a mean of CHF 572 per year and the win-sorised contribution margin has an average of CHF 632 per year. Comparing the values of these variables for all customers with the statistics for only the detrac-tors or promoters, a clear tendency in line with the intuition is recognisable: for the group of detractors, the average contribution margin, premium income and number of contracts are constantly lower than for the group of promoters. However, the aver-age number of claims over the last five years and in the previous year are higher for the promoters.
Because 66% of customers own more than one contract (up to a maximum of 25 contracts per customer and 2.5 contracts on average) and the claim horizon is five years, 76% of all customers have experienced at least one claim in the investi-gated period. Nevertheless, the examined insurer confirms that the constitution of the socio-demographic statistics of this dataset is representative of their entire cus-tomer portfolio.
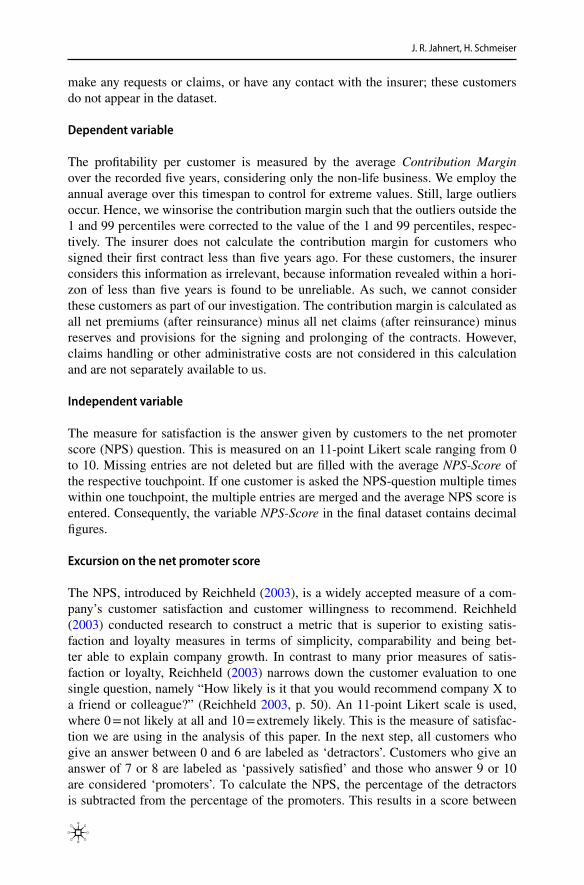
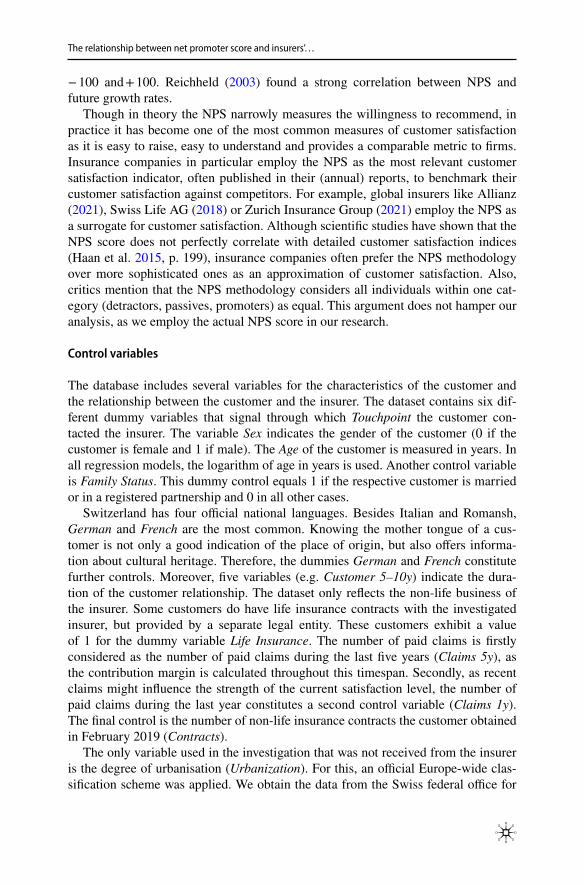
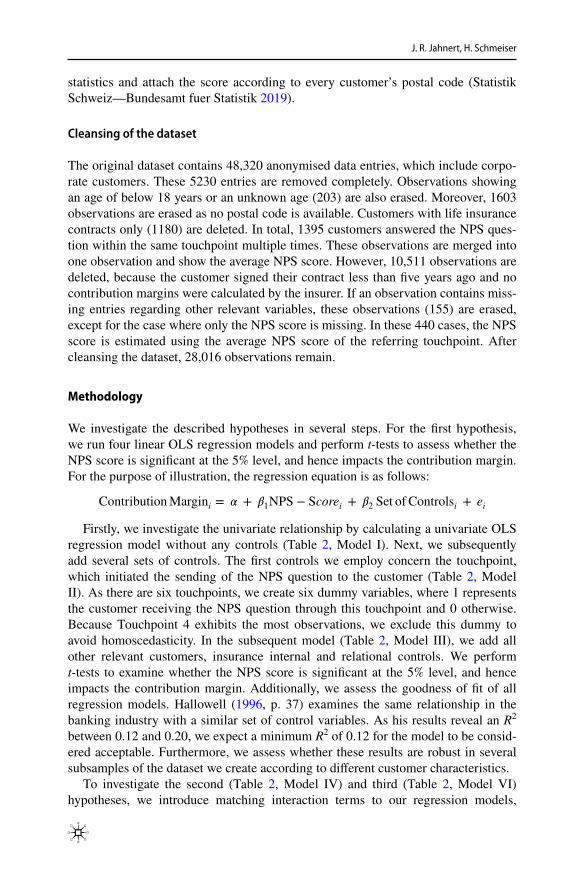
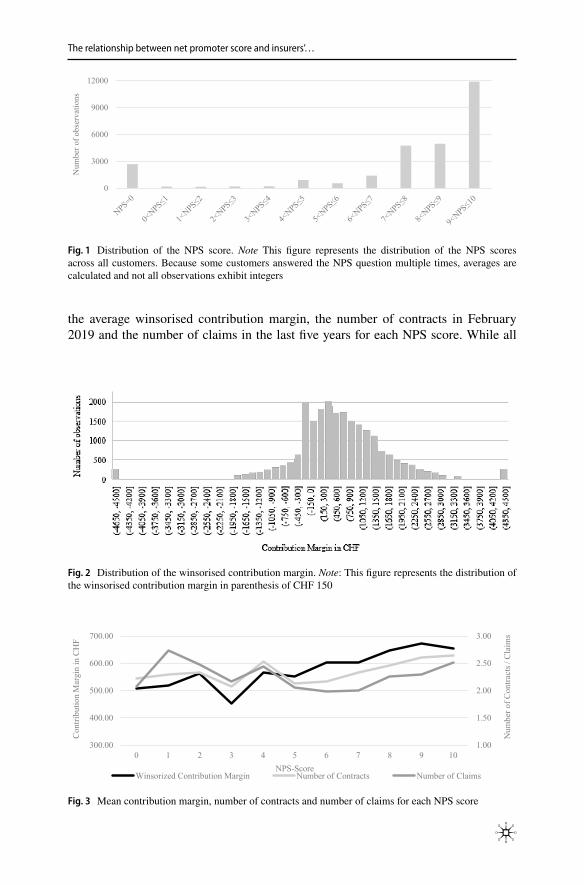
Looking at the distribution of the NPS score (Fig. 1)4, a score larger than 9 and smaller than or equal to 10 occurs most frequently, with 11,902 observations. NPS scores between 7 and 8, and 8 and 9 are chosen around 4800 times for both ranges. NPS scores between 0 and 4 are reported very seldomly. The dataset reveals a firm-wide NPS of 42. The contribution margin (Fig. 2) displays a right-skewed distri-bution, where most of the customers contribute a positive margin to the insurers’ profits. Most observations are located in the lower positive range. There is a peak of observations on the negative side of the scale, right below CHF 0. Figure 3 reports
4 Due to this particular distribution of the NPS score, it seems likely that the distribution of the error terms of the regression do not follow the Gauss–Markov assumption of normally distributed error terms. Though the distribution of the error terms looks very similar to a normal distribution (mean of 0.00), the slightly fat tails lead to the fact that the Shapiro–Wilk test rejects this assumption to the 1% level. However, this test is very sensitive to small deviations, especially in large samples, and we argue that this deviation from the assumptions does not have any significant impact on the presented results.
J. R. Jahnert, H. Schmeiser
Tabl
e 1
Des
crip
tive
stat
istic
s
This
tabl
e re
ports
the
desc
riptiv
e st
atist
ics o
f the
mos
t rel
evan
t dat
aset
var
iabl
es. A
ll st
atist
ics a
re p
rovi
ded
for t
he c
ompl
ete
data
set,
look
ing
only
at d
etra
ctor
s or p
rom
oter
s
Varia
ble
All
obse
rvat
ions
(n =
28,0
16)
Des
truct
ors (
n = 5,
001)
Prom
oter
(n =
16,7
88)
Min
Max
Mea
nSt
d. D
evM
inM
axM
ean
Std.
Dev
Min
Max
Mea
nSt
d. D
ev
NPS
-Sco
re0.
010
.07.
93.
00.
06.
72.
02.
49.
010
.09.
70.
5C
ontri
bu-
tion
Mar
gin
(not
win
-so
rised
)
CH
F -169
,446
CH
F 90,8
76C
HF
572
CH
F 26
50C
HF -169
,446
CH
F 21,7
59C
HF
496
CH
F 39
13C
HF -155
,834
CH
F 96,8
15C
HF
742
CH
F 25
11
Con
tribu
-tio
n M
argi
n (w
inso
-rie
d)
CH
F −
4528
CH
F 43
11C
HF
632
CH
F 12
80C
HF
− 45
28C
HF
4311
CH
F 52
9C
HF
1265
CH
F −
4528
CH
F 43
11C
HF
660
CH
F 12
99
Prem
ium
In
com
eC
HF
0C
HF 347,
362
CH
F 28
97C
HF
4851
CH
F 0
CH
F 169,
820
CH
F 24
42C
HF
4733
CH
F 0
CH
F 347,
362
CH
F 30
51C
HF
5333
Num
ber o
f C
on-
tract
s
0.0
25.0
2.5
1.8
0.0
17.0
2.2
1.6
0.0
25.0
2.6
1.8
Cla
ims 5
y0.
029
.02.
32.
40.
029
.02.
12.
60.
021
.02.
52.
4C
laim
s 1y
0.0
10.0
0.6
0.8
0.0
10.0
0.5
0.8
0.0
8.0
0.6
0.8
Sex
0.0
1.0
0.7
0.5
0.0
1.0
0.7
0.5
0.0
1.0
0.7
0.5
Age
18.2
107.
556
.413
.618
.210
4.7
55.7
14.3
19.6
107.
556
.513
.5Fa
mily
St
atus
0.0
1.0
0.5
0.5
0.0
1.0
0.5
0.5
0.0
1.0
0.5
0.5
Ger
man
0.0
1.0
0.7
0.5
0.0
1.0
0.7
0.4
0.0
1.0
0.7
0.5
The relationship between net promoter score and insurers’…
the average winsorised contribution margin, the number of contracts in February 2019 and the number of claims in the last five years for each NPS score. While all
0
3000
6000
9000
12000N
um
ber
of
ob
serv
ati
on
s
Fig. 1 Distribution of the NPS score. Note This figure represents the distribution of the NPS scores across all customers. Because some customers answered the NPS question multiple times, averages are calculated and not all observations exhibit integers
Fig. 2 Distribution of the winsorised contribution margin. Note: This figure represents the distribution of the winsorised contribution margin in parenthesis of CHF 150
1.00
1.50
2.00
2.50
3.00
300.00
400.00
500.00
600.00
700.00
0 1 2 3 4 5 6 7 8 9 10
Nu
mber
of
Contr
acts
/ C
laim
s
FH
Cni
nigra
Mn
oitu
birtn
oC
NPS-ScoreWinsorized Contribution Margin Number of Contracts Number of Claims
Fig. 3 Mean contribution margin, number of contracts and number of claims for each NPS score

J. R. Jahnert, H. Schmeiser
Tabl
e 2
Reg
ress
ion
resu
lts
Varia
ble
Mod
el I
Mod
el II
Mod
el II
IM
odel
IVM
odel
VM
odel
VI
Mod
el V
IIM
odel
VII
I
Dep
ende
nt V
ari-
able
Con
tribu
tion
Mar
gin
Con
tribu
tion
Mar
gin
Con
tribu
tion
Mar
gin
Con
tribu
tion
Mar
gin
Con
tribu
tion
Mar
gin
Con
tribu
tion
Mar
gin
Com
bine
d R
atio
Prem
ium
Inco
me
Con
stan
t50
5.07
***
400.
460*
**11
9.55
359
.622
61.1
6658
.718
1.02
6 −
608.
084*
**(2
3.83
0)(1
5.75
0)(0
.904
)(0
.499
)(0
.460
)(0
.443
)(0
.894
)(−
5.06
5)N
PS-S
core
15.9
9***
21.4
50**
*11
.228
***
12.6
26**
*12
.593
***
14.3
39**
* −
0.01
511
.444
***
(6.3
98)
(8.5
02)
(5.1
41)
(4.0
32)
(4.0
19)
(5.9
21)
(− 0.
801)
(5.7
75)
Touc
hpoi
nt 1
(d)
290.
20**
* −
17.4
7445
.547
*45
.381
*43
.713
* −
0.17
8 −
34.9
16**
*(1
2.42
5)(−
0.78
6)(1
.953
)(1
.945
)(1
.874
)(−
0.88
6)(−
1.73
2)To
uchp
oint
2 (d
) −
18.2
9 −
92.4
04**
− 31
.798
− 31
.662
− 35
.612
− 0.
331
− 89
.408
***
(− 0.
456)
(− 2.
574)
(− 0.
868)
(− 0.
865)
(− 0.
972)
(− 0.
980)
(− 2.
745)
Touc
hpoi
nt 3
(d)
143.
24**
*15
.317
74.3
73**
*74
.583
***
71.5
28**
* −
0.34
5 −
119.
009*
**(6
.342
)(0
.731
)(3
.399
)(3
.406
)(3
.267
)(−
1.82
7)(−
6.26
0)To
uchp
oint
5 (d
)27
0.17
***
− 64
.616
***
− 3.
788
− 3.
741
− 7.
768
− 0.
117
− 78
.444
***
(11.
281)
(− 2.
886)
(− 0.
162)
(− 0.
160)
(− 0.
332)
(− 0.
581)
(− 3.
862)
Touc
hpoi
nt 6
(d)
− 33
6.39
***
− 44
3.65
9***
− 43
3.05
0***
− 43
3.10
2***
− 43
4.37
4***
0.76
8***
− 13
3.26
7***
(− 14
.415
)(−
21.3
64)
(− 20
.804
)(−
20.8
06)
(− 20
.870
)(4
.288
)(−
7.07
3)Se
x (d
)83
.573
***
83.1
43**
*83
.095
***
82.9
91**
*0.
077
96.0
03**
*(5
.644
)(5
.614
)(5
.610
)(5
.607
)(0
.603
)(7
.147
)A
ge (l
n) −
4.12
2 −
6.02
6 −
6.03
1 −
5.25
6 −
0.06
616
4.89
9***
(− 0.
138)
(− 0.
201)
(− 0.
202)
(− 0.
176)
(− 0.
254)
(6.0
76)
Fam
ily S
tatu
s (d)
113.
117*
**11
4.82
5***
114.
794*
**11
3.00
0***
− 0.
194
75.3
42**
*(8
.062
)(8
.186
)(8
.183
)(8
.051
)(−
1.60
1)(5
.919
)G
erm
an (d
)1.
619
− 1.
814
− 1.
692
− 0.
343
0.13
6 −
199.
777*
**(0
.054
)(−
0.06
0)(−
0.05
6)(−
0.01
1)(0
.522
)(−
7.29
5)Fr
ench
(d)
− 50
.667
− 51
.833
− 51
.748
− 49
.873
0.47
2* −
139.
999*
**(−
1.57
2)(−
1.60
9)(−
1.60
6)(−
1.54
8)(1
.694
)(−
4.78
9)
The relationship between net promoter score and insurers’…
Tabl
e 2
(con
tinue
d)
Varia
ble
Mod
el I
Mod
el II
Mod
el II
IM
odel
IVM
odel
VM
odel
VI
Mod
el V
IIM
odel
VII
I
Cus
tom
er 5
–10y
(d
) −
18.1
65 −
19.3
59 −
19.4
28 −
18.3
03 −
0.15
711
0.70
4***
(− 0.
757)
(− 0.
807)
(− 0.
810)
(− 0.
763)
(− 0.
755)
(5.0
86)
Cus
tom
er
11–1
6y (d
) −
15.3
38 −
15.0
28 −
15.0
88 −
14.4
800.
233
34.9
86(−
0.63
5)(−
0.62
3)(−
0.62
5)(−
0.60
0)(1
.114
)(1
.598
)C
usto
mer
17
–22y
(d)
42.4
14*
40.9
90*
40.9
73*
40.3
83*
− 0.
061
46.1
63**
(1.7
98)
(1.7
38)
(1.7
37)
(1.7
13)
(− 0.
300)
(2.1
57)
Cus
tom
er ≥
29y
(d)
35.9
8837
.713
*37
.728
*36
.278
0.00
0 −
35.3
59*
(1.5
79)
(1.6
55)
(1.6
56)
(1.5
92)
(0.0
02)
(− 1.
710)
Life
Insu
ranc
e (d
) −
504.
752*
** −
503.
228*
** −
503.
265*
** −
505.
829*
**0.
384*
* −
796.
494*
**(−
29.0
58)
(− 28
.971
)(−
28.9
72)
(− 29
.094
)(2
.311
)(−
50.5
41)
Cla
ims 5
y −
188.
101*
** −
196.
053*
** −
196.
048*
** −
186.
430*
**0.
166*
**14
4.81
1***
(− 56
.027
)(−
61.9
48)
(− 61
.944
)(−
42.5
27)
(6.1
08)
(47.
541)
Cla
ims 1
y −
30.7
67**
*74
.132
***
74.0
96**
*77
.923
***
− 0.
292*
*27
.121
***
(− 3.
053)
(4.2
92)
(4.2
90)
(4.5
02)
(− 1.
961)
(2.9
66)
Urb
aniz
atio
n20
.748
**20
.732
**20
.750
**20
.726
**0.
029
14.3
75(2
.112
)(2
.111
)(2
.113
)(2
.111
)(0
.345
)(1
.613
)C
ontra
cts
384.
281*
**38
4.43
1***
384.
417*
**37
6.56
7***
− 0.
177*
**60
0.84
6***
(81.
953)
(81.
974)
(81.
964)
(71.
252)
(− 4.
336)
(141
.237
)Pr
omot
er
(d) ×
NPS
-Sc
ore
− 1.
444
− 1.
566
(− 0.
725)
(− 0.
767)
Det
ract
or (d
) x
NPS
-Sco
re −
1.49
9(−
0.27
7)
J. R. Jahnert, H. Schmeiser
Tabl
e 2
(con
tinue
d)
Varia
ble
Mod
el I
Mod
el II
Mod
el II
IM
odel
IVM
odel
VM
odel
VI
Mod
el V
IIM
odel
VII
I
Cla
ims/
Con
-tra
cts ×
NPS
-Sc
ore
− 2.
980*
**
(− 3.
187)
R20.
0014
0.02
830.
277
0.27
70.
277
0.27
70.
004
0.58
2A
djus
ted
R20.
0014
0.02
810.
276
0.27
60.
276
0.27
60.
003
0.58
2O
bser
vatio
ns28′0
1628′0
1628′0
1628′0
1628′0
1628′0
1628′0
1628′0
16
This
tabl
e re
ports
the
resu
lts o
f the
OLS
regr
essi
on o
f the
NPS
scor
e on
the
cont
ribut
ion
mar
gin
in M
odel
I. S
ubse
quen
tly, a
dditi
onal
sets
of c
ontro
l var
iabl
es a
re a
dded
to
Mod
els
II a
nd II
I. M
odel
s IV
thro
ugh
VI r
epor
t the
regr
essi
on re
sults
with
a s
peci
al fo
cus
on c
usto
mer
s w
ith e
xtra
-hig
h or
ext
ra-lo
w le
vels
of s
atis
fact
ion,
dep
endi
ng o
n th
e cu
stom
er’s
cla
ims-
to-c
ontra
cts r
atio
. Fur
ther
mor
e, M
odel
VII
repo
rts th
e re
sults
of t
he re
gres
sion
of t
he N
PS sc
ore
on th
e co
mbi
ned
ratio
of t
he c
usto
mer
s. M
odel
VII
I re
ports
the
resu
lts o
f the
OLS
regr
essi
on o
f the
NPS
sco
re o
n th
e pr
emiu
m in
com
e. V
aria
ble
nam
es c
onta
inin
g an
‘x’ i
ndic
ate
an in
tera
ctio
n te
rm b
etw
een
the
resp
ectiv
e va
riabl
es. D
umm
y va
riabl
es a
re in
dica
ted
by (d
) and
the
loga
rithm
ic o
pera
tors
by
(ln),
t-val
ues a
re in
par
enth
eses
*p <
0.10
; **p
< 0.
05; *
**p <
0.01
The relationship between net promoter score and insurers’…
three variables disclose no systematic behaviour for the low NPS scores, a positive trend is visible for NPS scores of 6 and above.
Regression analysis
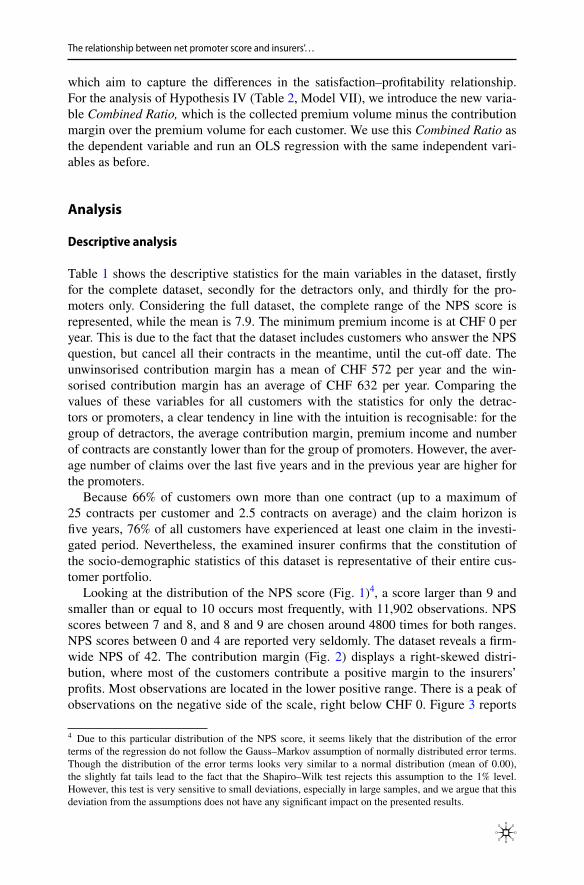
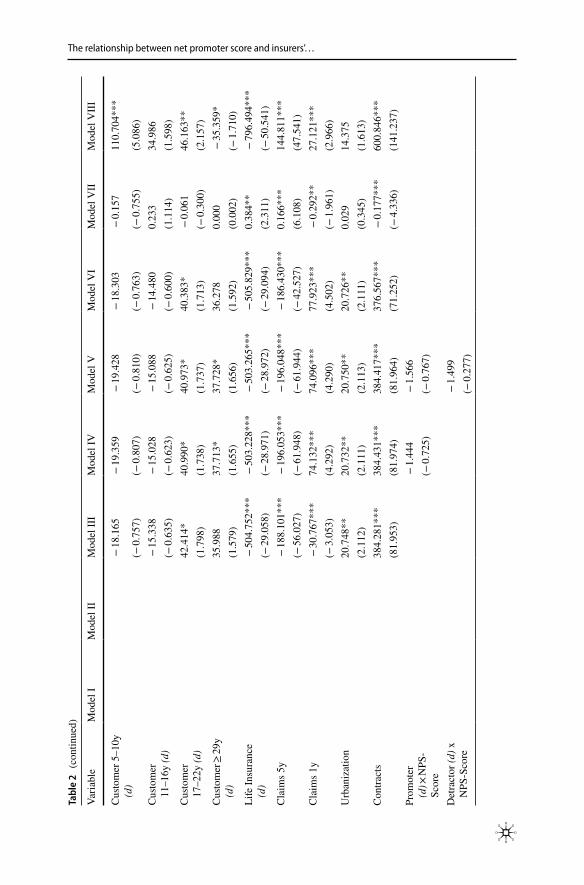
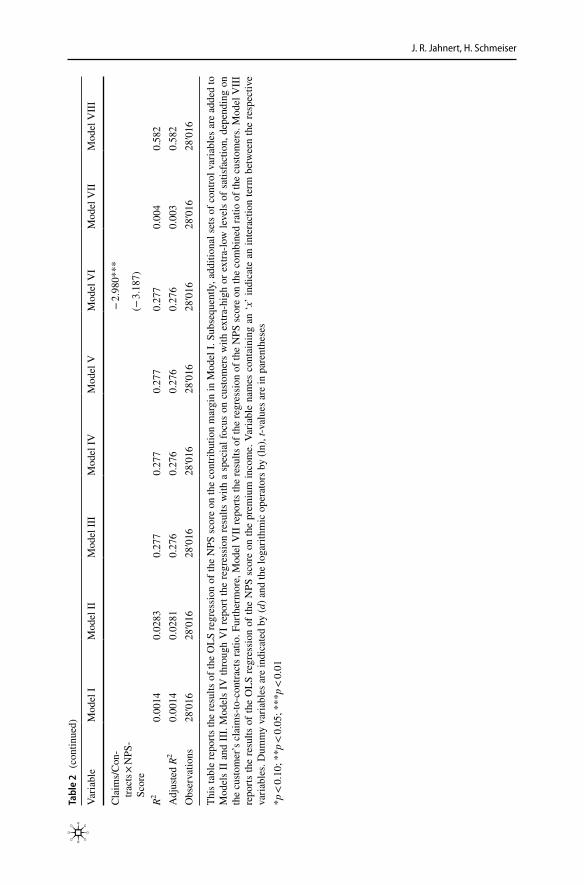
Table 2 reports the results of the OLS regression models we run to analyse the sat-isfaction–profitability relationship per customer. The univariate regression in Model I suggests a significant (to the 1% level) and positive relationship between the NPS score and the contribution margin. The effect size is considerably substantial, as one point in the NPS score accounts for almost CHF 16 in the contribution margin per customer and year. Model II adds control variables for the touchpoint between the customer and insurer, which initiates the NPS question. This setting enlarges the NPS score coefficient to CHF 21.45. This coefficient is significant to the 1% level and most of the controls in this model seem to be significant for explaining the con-tribution margin.
Model III additionally controls for the following customer specifics: Sex, Age, Family Status, German, French, Length of the Customer Relationship, Life Insur-ance, Claims 5y, Claims 1y, as well as Urbanization and Number of Contracts. These controls have a severe impact on the model fit, in general, and on the NPS score coefficients in particular. The NPS score coefficient almost halves, while its significance remains at the 1% level. Still, a coefficient of 11.23 suggests that cus-tomer satisfaction has a relevant, positive influence on the customers’ contribution margin. Additionally, Model III can be considered a good fit as the R2 reaches a value of 0.276 and, therefore, exhibits the benchmark of 0.12 (c.f. Hallowell 1996). Henceforth, we consider Model III to be the main model of our analysis.
The previously presented results do not support the first hypothesis. The find-ings concordantly provide strong evidence that satisfaction is positively correlated with the profitability per customer in the non-life insurance industry. The positive and significant results support the outcome of Pooser and Browne (2018) in that customer satisfaction is profit enhancing for insurers. Furthermore, by splitting the dataset according to the six touchpoints and running separate OLS regressions, a positive relationship is revealed for all six touchpoints individually. Nevertheless, this positive relationship could only be valid at the general level; certain customer groups might behave differently. To collect further evidence and gain insight into this relationship, we continue to investigate the subsequent hypotheses to test whether, for some groups, this result might disappear or even become negative.
Following Hypothesis II, we expect that the relationship between satisfaction and profitability would become more negative or, at least, become less strong, for high levels of satisfaction. The regression results of Model IV are in line with this expectation. The interaction term Promoter x NPS-Score exhibits a coefficient of − 1.444. Hence, for promoters, the relationship between satisfaction and profit-ability seems to be less positive than for passives and detractors. The coefficient is, by far, not significant at the 5% level. We therefore have to reject Hypothesis
J. R. Jahnert, H. Schmeiser
II, as this result does not provide enough evidence that the satisfaction–profit-ability relationship of the promoters differs significantly from that of the other customers.
In Model V, we test the non-linearity, as proposed by Ittner and Larcker (1998), in more depth. This is accomplished by including the interaction terms for the pro-moters and the detractors. However, no significant coefficients are identified. We conclude that, within our insurance company sample, we cannot provide any evi-dence for the non-linearity of the bespoken relationship, as found in other industries.
Model VI of Table 2 investigates Hypothesis III. This hypothesis states that sat-isfaction–profitability evolves more negatively the higher the number of claims declared by customers to the insurer. Since the number of claims is highly dependent on the number of contracts a customer holds, we examine this hypothesis with the claims-to-contracts ratio per customer. The regression results support this hypoth-esis with significance to the 1% level, as the interaction term of claims per contract and the NPS score displays a negative sign. Still, the total relationship remains posi-tive in the most considerable cases. If a customer receives more than four claims per contract, the satisfaction–profitability relationship becomes negative. Therefore, the more claims customers experience, the less positive is the relationship between sat-isfaction and profitability. Hence, we conditionally accept Hypothesis III.
The last hypothesis assumes that customer satisfaction and costs for the insurer are positively correlated. Model VII assesses this relationship, but cannot detect any relationship between the satisfaction and the combined ratio at all. As the coefficient of the NPS score is slightly negative at − 0.015 and shows a t-value of − 0.801, we do not accept Hypothesis IV.
In addition to the investigated hypotheses, we made one supplementary obser-vation, that the contribution margin is basically computed from two parts: the premium income and the different cost positions for each customer, where all positions only consider the non-life business.
As customer satisfaction seems to have a positive relationship with the contri-bution margin but not with the combined ratio (Hypothesis IV), customer satis-faction should be positively related to premium income. Either these customers accept higher prices when prolonging a contract or buy additional insurance prod-ucts. Due to our previous results, we expect that satisfaction is not significantly associated with the costs and the increase in the contribution margin is empow-ered by a positive relationship between the NPS score and premium income. Indeed, the regression results of Model VIII in Table 2 show a large and signifi-cant relationship between the NPS score and premium income per customer.
Worth mentioning is the size of the coefficient. With a value of 11.444, this is extremely close to the value of our main model (Table 2, Model III). Additionally, the t-value of 5.775 is also in the area of the main model (t-value of 5.141) and the model fit doubled in comparison to Model III of Table 2. Firstly, this outcome
ContributionMargini = Premium Incomei −(
Claimsi + Administrationi + Provisionsi + Reservesi)
ContributionMargini = Premium Incomei−Costsi
The relationship between net promoter score and insurers’…
supports the positive relationship between satisfaction and profitability. Secondly, it can be derived that the effect of customer satisfaction on profitability is almost com-pletely rooted in a rise in premium income.
The Appendix further examines possible variables impacting the satisfac-tion–profitability relationship (Appendix, Models I to IV). A significant difference in the satisfaction–profitability relationship cannot be found for either of the cus-tomer groups, considering sex, family status, language and age. Hence, these regres-sions offer additional evidence for the steadiness of the preceding results.
In summary, this analysis provides strong evidence of the fact that customer sat-isfaction and customer profitability are positively associated based on our sample from the non-life insurance industry. This result is only driven by a volume effect, as a greater NPS score is strongly positively associated with a larger premium volume. The hypothesis that satisfaction rises with the combined ratio does not hold true. Furthermore, this result is widely constant throughout various groups of customers. Contrary to other industries, no indications for the non-linearity of the relationship are found. However, the dataset does not comprise any information about customers having no interaction with the insurer in the investigated timeframe, as well as cus-tomers signing their first contract with the insurer within the last five years.
Robustness tests
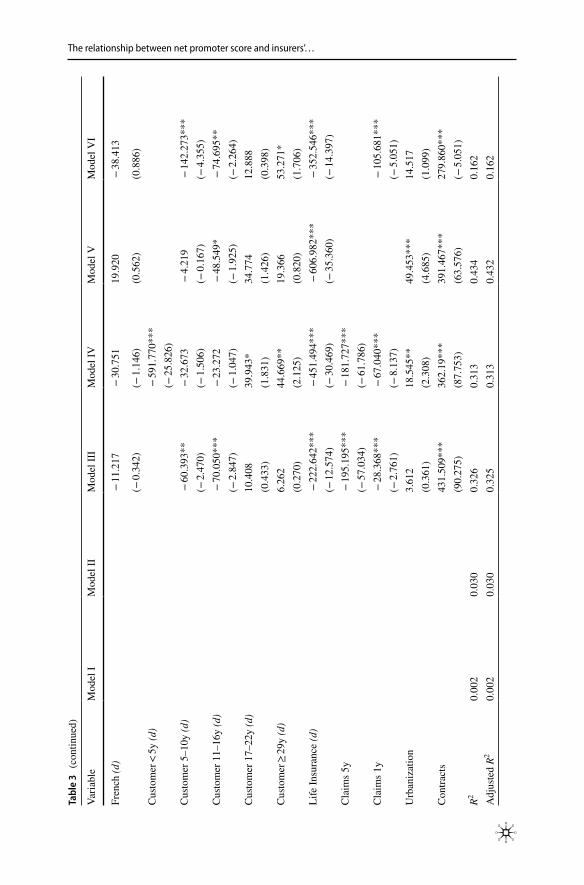
To provide additional evidence to our result, we execute three further tests of robust-ness. Firstly, we exchange the non-life contribution margin with the total contribu-tion margin that a customer provides to the insurer (Table 3, Model I to III). Sec-ondly, we use estimates of the average, yearly contribution margin of customers having signed their first contract within the last five years and add them to the com-plete dataset (Table 3, Model IV). In a last step, we investigate whether the investi-gated relationship still remains positive when dividing the data into customers with and without claims during the last five years.
The NPS score has subsequently been recorded to a situation specific to the non-life business. However, this score should still be representative of the customers’ sat-isfaction with the whole company. As customers with life insurance contracts only are excluded from the beginning, this additional analysis is still exclusively valid for non-life customers and not for the total customer base. The regression models in Table 3 subsequently add the same sets of controls to the model as for Table 2, Models I to III. The results of these regression models are very similar to the analy-sis of the non-life contribution margin only. The coefficients, as well as the t-values, emerge in parallel to the results in Table 2, Models I to III, and also add evidence that when adding the contribution margin of the life business to the contribution margin of the non-life business, customer satisfaction is promoting profitability in the insurance sector.
Furthermore, Model IV adds customers who signed their first contract with the insurer within the last five years to the dataset. As stated previously, these contri-bution margins are not exactly calculated by the insurer. However, the estimates of the potential average, yearly contribution margin per customer do exist. Including

J. R. Jahnert, H. Schmeiser
Tabl
e 3
Res
ults
of t
he ro
bustn
ess t
ests
Varia
ble
Mod
el I
Mod
el II
Mod
el II
IM
odel
IVM
odel
VM
odel
VI
Dep
ende
nt V
aria
ble
Tota
l Con
tribu
tion
Mar
gin
Tota
l Con
tribu
tion
Mar
gin
Tota
l Con
tribu
tion
Mar
gin
Con
tribu
tion
Mar
gin
(incl
. Cus
-to
mer
< 5y
)
Con
tribu
tion
Mar
gin
(if C
laim
s 5y =
0)C
ontri
butio
n M
argi
n (if
C
laim
s 5y >
0)
Con
stan
t60
6.72
1***
470.
621*
** −
474.
137*
**21
1.05
0**
383.
043*
* −
530.
801*
**(2
7.11
1)(1
7.55
4)(−
3.51
5)(2
.155
)(2
.390
)(−
2.95
0)N
PS-S
core
18.0
35**
*23
.598
***
10.1
50**
*8.
390*
**7.
593*
**15
.032
***
(6.8
30)
(8.8
63)
(4.5
59)
(4.8
57)
(3.4
82)
(4.9
48)
Touc
hpoi
nt 1
(d)
367.
767*
**12
.831
− 10
.038
− 10
8.52
1***
207.
053*
**(1
4.92
4)(0
.566
)(−
0.54
2)(−
3.30
7)(6
.434
)To
uchp
oint
2 (d
)22
.770
− 55
.263
− 71
.551
** −
133.
795*
**11
1.39
4*(0
.538
)(−
1.51
0)(−
2.44
1)(−
3.51
0)(1
.820
)To
uchp
oint
3 (d
)12
8.94
5***
16.1
5639
.234
** −
72.4
70**
105.
513*
**(5
.411
)(0
.756
)(2
.346
)(−
2.19
9)(3
.665
)To
uchp
oint
5 (d
)35
5.06
9***
− 34
.180
− 50
.706
***
− 13
7.19
9***
132.
989*
**(1
4.05
2)(−
1.49
8)(−
2.72
3)(−
4.12
1)(4
.197
)To
uchp
oint
6 (d
) −
303.
627*
** −
435.
22**
* −
402.
874*
** −
35.1
44 −
466.
011*
**(−
12.3
32)
(− 20
.560
)(−
23.4
72)
(− 0.
633)
(− 18
.495
)Se
x (d
)88
.734
***
72.0
3***
89.1
86**
*79
.731
***
(5.8
79)
(6.0
44)
(5.8
76)
(3.9
11)
Age
(ln)
136.
997*
** −
10.6
99 −
70.8
3**
79.4
92*
(4.4
92)
(− 0.
492)
(− 2.
225)
(1.9
54)
Fam
ily S
tatu
s (d)
104.
586*
**92
.795
***
60.8
21**
*92
.086
***
(7.3
12)
(7.8
64)
(4.1
15)
(4.8
10)
Ger
man
(d)
31.9
2814
.094
58.2
66*
18.3
46(1
.038
)(0
.560
)(1
.778
)(0
.450
)
The relationship between net promoter score and insurers’…
Tabl
e 3
(con
tinue
d)
Varia
ble
Mod
el I
Mod
el II
Mod
el II
IM
odel
IVM
odel
VM
odel
VI
Fren
ch (d
) −
11.2
17 −
30.7
5119
.920
− 38
.413
(− 0.
342)
(− 1.
146)
(0.5
62)
(0.8
86)
Cus
tom
er <
5y (d
) −
591.
770*
**(−
25.8
26)
Cus
tom
er 5
–10y
(d)
− 60
.393
** −
32.6
73 −
4.21
9 −
142.
273*
**(−
2.47
0)(−
1.50
6)(−
0.16
7)(−
4.35
5)C
usto
mer
11–
16y
(d)
− 70
.050
***
− 23
.272
− 48
.549
* −
74.6
95**
(− 2.
847)
(− 1.
047)
(− 1.
925)
(− 2.
264)
Cus
tom
er 1
7–22
y (d
)10
.408
39.9
43*
34.7
7412
.888
(0.4
33)
(1.8
31)
(1.4
26)
(0.3
98)
Cus
tom
er ≥
29y
(d)
6.26
244
.669
**19
.366
53.2
71*
(0.2
70)
(2.1
25)
(0.8
20)
(1.7
06)
Life
Insu
ranc
e (d
) −
222.
642*
** −
451.
494*
** −
606.
982*
** −
352.
546*
**(−
12.5
74)
(− 30
.469
)(−
35.3
60)
(− 14
.397
)C
laim
s 5y
− 19
5.19
5***
− 18
1.72
7***
(− 57
.034
)(−
61.7
86)
Cla
ims 1
y −
28.3
68**
* −
67.0
40**
* −
105.
681*
**(−
2.76
1)(−
8.13
7)(−
5.05
1)U
rban
izat
ion
3.61
218
.545
**49
.453
***
14.5
17(0
.361
)(2
.308
)(4
.685
)(1
.099
)C
ontra
cts
431.
509*
**36
2.19
***
391.
467*
**27
9.86
0***
(90.
275)
(87.
753)
(63.
576)
(− 5.
051)
R20.
002
0.03
00.
326
0.31
30.
434
0.16
2A
djus
ted
R20.
002
0.03
00.
325
0.31
30.
432
0.16
2

J. R. Jahnert, H. Schmeiser
Tabl
e 3
(con
tinue
d)
Varia
ble
Mod
el I
Mod
el II
Mod
el II
IM
odel
IVM
odel
VM
odel
VI
Obs
erva
tions
28′0
1628′0
1628′0
1635′7
246′
755
21′2
61
This
tabl
e re
ports
the
resu
lts o
f the
robu
stnes
s te
sts. M
odel
s I t
o II
I pro
vide
the
resu
lts o
f the
OLS
regr
essi
ons,
with
the
tota
l (no
n-lif
e an
d lif
e) c
ontri
butio
n m
argi
n pe
r cu
stom
er a
s th
e de
pend
ent v
aria
ble.
The
und
erly
ing
data
of M
odel
IV a
lso
incl
ude
custo
mer
s w
ith a
cus
tom
er re
latio
nshi
p of
less
than
5 y
ears
. In
Mod
els
V a
nd V
I, th
e da
ta a
re sp
lit in
to c
usto
mer
s with
and
with
out c
laim
s. D
umm
y va
riabl
es a
re in
dica
ted
by (d
) and
the
loga
rithm
ic o
pera
tors
by
(ln);
the
t-val
ues a
re in
par
enth
eses
*p <
0.10
; **p
< 0.
05; *
**p <
0.01
The relationship between net promoter score and insurers’…
this customer group is important, because these customers might reveal divergent behaviour. On the one hand, many of them might change their insurer more often than the average, because of high claims; on the other hand, their contribution mar-gin is rather low, by definition, as the costs for their acquisition have just recently occurred. Nevertheless, this group of customers is important and makes up 21% of the dataset. In addition, we test the robustness of the positive relationship by assess-ing the customers with and without claims during the last five years separately. The results of Models V and VI in Table 3 show that the relationship remains positive and significant for both groups.
In summary, the results of these three robustness checks, based on our sample, add further evidence to the main result of this paper, i.e. that customer satisfaction is enhancing profitability at the customer level in the insurance industry.
Conclusions
The literature finds that, for many industries, customer satisfaction affects the profit-ability per customer positively. Even though there are several, mostly theory-based, reasons why this relationship may be different in the insurance industry, insurance has rarely been the subject of investigations in this field. This paper is the first to investigate this topic based on customer-level data and looking at all major business lines of a non-life insurance company. The data we analyse stems from a large Swiss insurance company and comprises customer satisfaction data, contribution margins and a rich array of control variables at the single customer level.
Contrary to theory-based arguments, but in line with the prior general literature from other industries, we find strong evidence that customer satisfaction measured by the NPS score positively affects insurers’ profitability. Furthermore, the effect is considerably large, indicating that customer satisfaction is a meaningful variable for explaining profitability at the customer level in our dataset. The result is robust in size and remains significant for high levels of customer satisfaction, customers with and without claims and various other customer characteristics. No evidence for the non-linearity of the relationship is found, however, though we construct one theoret-ical case where the satisfaction–profitability relationship turns negative. This occurs when the claims-to-contracts ratio exceeds a value of four. Moreover, we find that customer satisfaction is not correlated with the combined ratio per customer but is strongly positively correlated with the generated premium income. Hence, the posi-tive relationship stems from a pure volume effect, as customer satisfaction increases the premium volume per policyholder.
Our results demonstrate that the results of the general marketing literature are widely applicable to insurance companies. Customer satisfaction is a relevant driver of insurance profitability. Therefore, insurance companies are right to consider cus-tomer satisfaction a goal of their organisation and to make management compensa-tion dependent on customer satisfaction. Our analysis indicates that it is worthwhile for insurance companies to invest in customer satisfaction, while we perceive the parameters driving customer satisfaction within the insurance industry as insuffi-ciently investigated.
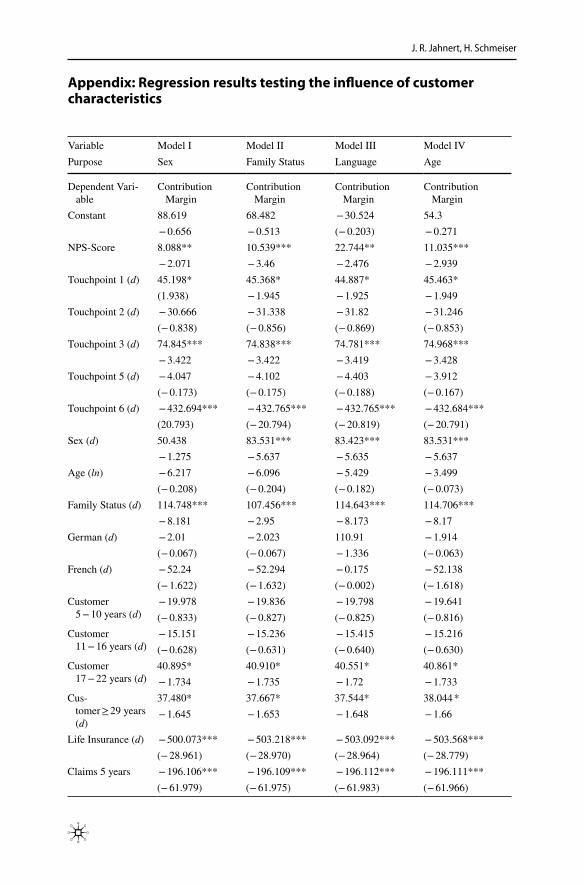
J. R. Jahnert, H. Schmeiser
Appendix: Regression results testing the influence of customer characteristics
Variable Model I Model II Model III Model IVPurpose Sex Family Status Language Age
Dependent Vari-able
Contribution Margin
Contribution Margin
Contribution Margin
Contribution Margin
Constant 88.619 68.482 − 30.524 54.3 − 0.656 − 0.513 (− 0.203) − 0.271
NPS-Score 8.088** 10.539*** 22.744** 11.035*** − 2.071 − 3.46 − 2.476 − 2.939
Touchpoint 1 (d) 45.198* 45.368* 44.887* 45.463*(1.938) − 1.945 − 1.925 − 1.949
Touchpoint 2 (d) − 30.666 − 31.338 − 31.82 − 31.246(− 0.838) (− 0.856) (− 0.869) (− 0.853)
Touchpoint 3 (d) 74.845*** 74.838*** 74.781*** 74.968*** − 3.422 − 3.422 − 3.419 − 3.428
Touchpoint 5 (d) − 4.047 − 4.102 − 4.403 − 3.912(− 0.173) (− 0.175) (− 0.188) (− 0.167)
Touchpoint 6 (d) − 432.694*** − 432.765*** − 432.765*** − 432.684***(20.793) (− 20.794) (− 20.819) (− 20.791)
Sex (d) 50.438 83.531*** 83.423*** 83.531*** − 1.275 − 5.637 − 5.635 − 5.637
Age (ln) − 6.217 − 6.096 − 5.429 − 3.499(− 0.208) (− 0.204) (− 0.182) (− 0.073)
Family Status (d) 114.748*** 107.456*** 114.643*** 114.706*** − 8.181 − 2.95 − 8.173 − 8.17
German (d) − 2.01 − 2.023 110.91 − 1.914(− 0.067) (− 0.067) − 1.336 (− 0.063)
French (d) − 52.24 − 52.294 − 0.175 − 52.138(− 1.622) (− 1.632) (− 0.002) (− 1.618)
Customer 5 − 10 years (d)
− 19.978 − 19.836 − 19.798 − 19.641(− 0.833) (− 0.827) (− 0.825) (− 0.816)
Customer 11 − 16 years (d)
− 15.151 − 15.236 − 15.415 − 15.216(− 0.628) (− 0.631) (− 0.640) (− 0.630)
Customer 17 − 22 years (d)
40.895* 40.910* 40.551* 40.861* − 1.734 − 1.735 − 1.72 − 1.733
Cus-tomer ≥ 29 years (d)
37.480* 37.667* 37.544* 38.044 * − 1.645 − 1.653 − 1.648 − 1.66
Life Insurance (d) − 500.073*** − 503.218*** − 503.092*** − 503.568***(− 28.961) (− 28.970) (− 28.964) (− 28.779)
Claims 5 years − 196.106*** − 196.109*** − 196.112*** − 196.111***(− 61.979) (− 61.975) (− 61.983) (− 61.966)
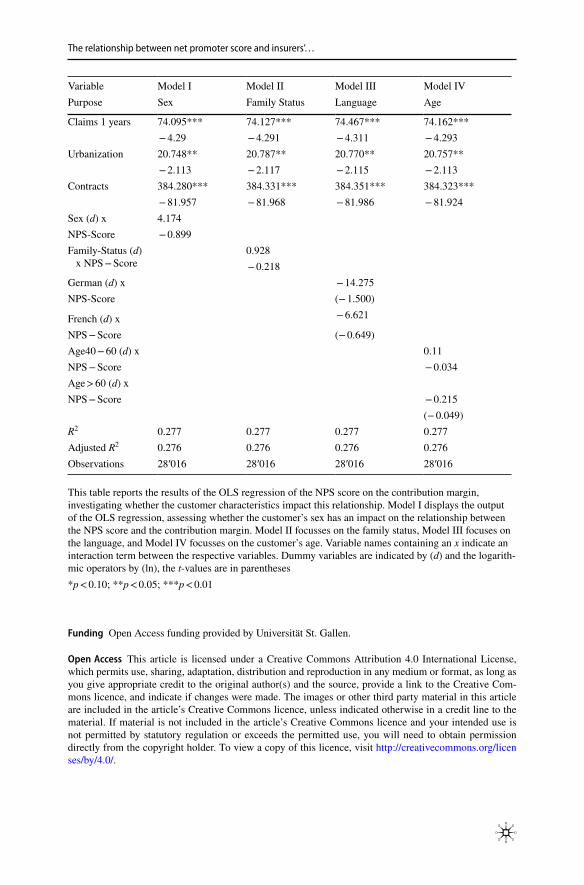
The relationship between net promoter score and insurers’…
Variable Model I Model II Model III Model IVPurpose Sex Family Status Language Age
Claims 1 years 74.095*** 74.127*** 74.467*** 74.162*** − 4.29 − 4.291 − 4.311 − 4.293
Urbanization 20.748** 20.787** 20.770** 20.757** − 2.113 − 2.117 − 2.115 − 2.113
Contracts 384.280*** 384.331*** 384.351*** 384.323*** − 81.957 − 81.968 − 81.986 − 81.924
Sex (d) x 4.174NPS-Score − 0.899Family-Status (d)
x NPS − Score0.928 − 0.218
German (d) x − 14.275NPS-Score (− 1.500)
− 6.621French (d) xNPS − Score (− 0.649)Age40 − 60 (d) x 0.11NPS − Score − 0.034Age > 60 (d) xNPS − Score − 0.215
(− 0.049)R2 0.277 0.277 0.277 0.277Adjusted R2 0.276 0.276 0.276 0.276Observations 28′016 28′016 28′016 28′016
This table reports the results of the OLS regression of the NPS score on the contribution margin, investigating whether the customer characteristics impact this relationship. Model I displays the output of the OLS regression, assessing whether the customer’s sex has an impact on the relationship between the NPS score and the contribution margin. Model II focusses on the family status, Model III focuses on the language, and Model IV focusses on the customer’s age. Variable names containing an x indicate an interaction term between the respective variables. Dummy variables are indicated by (d) and the logarith-mic operators by (ln), the t-values are in parentheses*p < 0.10; **p < 0.05; ***p < 0.01
Funding Open Access funding provided by Universität St. Gallen.
Open Access This article is licensed under a Creative Commons Attribution 4.0 International License, which permits use, sharing, adaptation, distribution and reproduction in any medium or format, as long as you give appropriate credit to the original author(s) and the source, provide a link to the Creative Com-mons licence, and indicate if changes were made. The images or other third party material in this article are included in the article’s Creative Commons licence, unless indicated otherwise in a credit line to the material. If material is not included in the article’s Creative Commons licence and your intended use is not permitted by statutory regulation or exceeds the permitted use, you will need to obtain permission directly from the copyright holder. To view a copy of this licence, visit http:// creat iveco mmons. org/ licen ses/ by/4. 0/.
J. R. Jahnert, H. Schmeiser
References
Allianz, S.E. 2021. Supplementary Information for Ratings. Retrieved January 25, 2021, from Infor-mation Ratings - Customer Satisfaction: https:// www. allia nz. com/ en/ susta inabi lity/ artic les/ infor mation- ratin gs. html.
Almond, G.A., and S. Verba. 1963. The Civic Culture. Princeton: Princeton University Press, NJ.Anderson, E.W., and V. Mittal. 2000. Strengthening the satisfaction-profit chain. Journal of Service
Research 3: 107–120.Anderson, E.W., C. Fornell, and D.R. Lehmann. 1994. Customer satisfaction, market share, and profit-
ability: Findings from Sweden. Journal of Marketing 58: 53–66.Anderson, E.W., C. Fornell, and S.K. Mazvancheryl. 2004. Customer satisfaction and shareholder value.
Journal of Marketing 68: 172–185.Anderson, E.W., C. Fornell, and R.T. Rust. 1997. Customer Satisfaction, Productivity and Profitability:
Differences Between Goods and Services. Marketing Science 16: 129–145.Anis, A., and M.R. Tausif. 2018. Service Quality, Customers’ Satisfaction, and Profitability: An Empiri-
cal Study of Saudi Arabian Insurance Sector. Investment Management and Financial Innovations 15: 232–247.
Arrow, K.J. 1963. Uncertainty and the Welfare Economics of Medical Care. American Economic Review 53: 941–973.
Arrow, K.J. 1974. Optimal Insurance and Generalized Deductibles. Scandinavian Actuarial Journal 1974: 1–42.
Arrow, K.J. 1996. The Theory of Risk-Bearing: Small and Great Risks. Journal of Risk and Uncertainty 12: 103–111.
Biener, C., M. Eling, A. Landmann, and S. Pradhan. 2018. Can Group Incentives Alleviate Moral Haz-ard? The Role of Pro-social Preferences. European Economic Review 101: 230–249.
Bolton, R.N., and K.N. Lemon. 1999. A Dynamic Model of Customers’ Usage of Services: Usage as an Antecedent and Consequence of Satisfaction. Journal of Marketing Research 26: 171–186.
Boulding, W., R. Staelin, A. Kaira, and V. Zeithaml. 1993. A Dynamic Process Model of Service Quality: From Expectations to Behavioral Intentions. Journal of Marketing Research 30: 7–27.
Chen, C.X. 2009. Who Really Matters? Revenue Implications of Stakeholder Satisfaction in a Health Insurance Company. The Accounting Review 84: 1781–1804.
Colgate, M., and B. Lang. 2001. Switching Barriers in Consumer Markets: An Investigation of the Finan-cial Services Industry. Journal of Consumer Marketing 18: 332–347.
D’Arcy, S.P., and N.A. Doherty. 1990. Adverse Selection, Private Information, and Lowballing in Insur-ance Markets. The Journal of Business 63: 145–164.
De Haan, E., P.C. Verhoef, and T. Wiesel. 2015. The Predictive Ability of Different Customer Feedback Metrics for Retention. International Journal of Research in Marketing 32: 195–206.
Durvasula, S., S. Lysonski, S.C. Mehta, and B.P. Tang. 2004. Forging Relationships with Services: The Antecedents that have an Impact on Behavioural Outcomes in the Life Insurance Industry. Journal of Financial Services Marketing 8: 314–326.
Eidgenössische Finanzmarktaufsicht FINMA. 2019. Versicherungsbranche im Überblick. Retrieved November 12, 2019, from https:// www. finma. ch/ de/ dokum entat ion/ finma- publi katio nen/ beric hte/ versi cheru ngsbe richt/.
Golovkova, A., J. Eklof, A. Malova, and O. Podkorytova. 2019. Customer satisfaction index and finan-cial performance: A European cross country study. International Journal of Bank Marketing 37: 479–491.
Gruca, T.S., and L.L. Rego. 2005. Customer satisfaction, cash flow and shareholder value. Journal of Marketing 69: 115–130.
Guillen, M., J. Nielsen, and T.H. Perez-Marin. 2012. Time-varying effects in the analysis of customer loyalty: A case Study in insurance. Expert Systems with Applications 39: 3531–3558.
Gupta, S., and V. Zeithaml. 2006. Customer metrics and their impact on financial performance. Market-ing Science 6: 718–739.
Hallowell, R. 1996. The relationships of customer satisfaction, customer loyalty, and profitability: An empirical study. International Journal of Service Industry Management 7: 27–42.
Homburg, C., N. Koschate, and W.D. Hoyer. 2005. Do satisfied customers really pay more? A study of the relationship between customer satisfaction and willingness to pay. Journal of Marketing 69: 84–96.
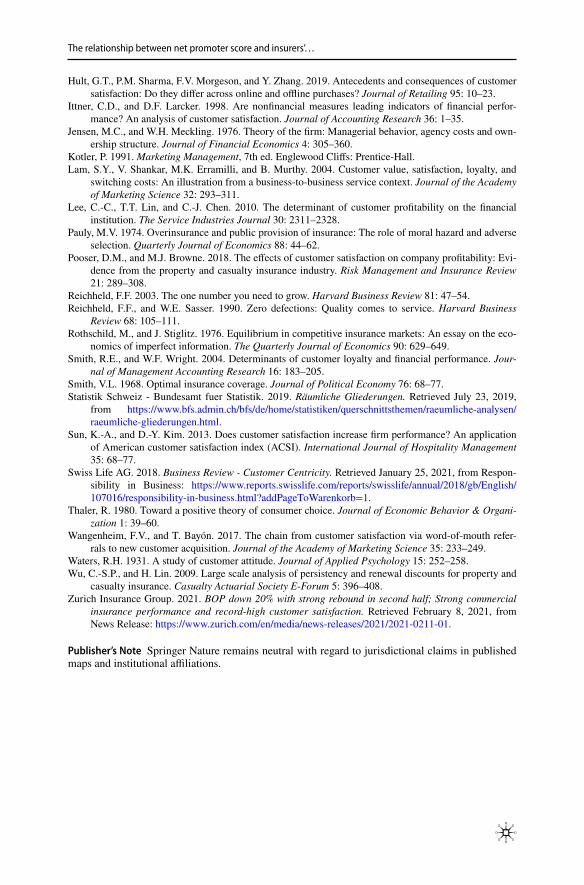
The relationship between net promoter score and insurers’…
Hult, G.T., P.M. Sharma, F.V. Morgeson, and Y. Zhang. 2019. Antecedents and consequences of customer satisfaction: Do they differ across online and offline purchases? Journal of Retailing 95: 10–23.
Ittner, C.D., and D.F. Larcker. 1998. Are nonfinancial measures leading indicators of financial perfor-mance? An analysis of customer satisfaction. Journal of Accounting Research 36: 1–35.
Jensen, M.C., and W.H. Meckling. 1976. Theory of the firm: Managerial behavior, agency costs and own-ership structure. Journal of Financial Economics 4: 305–360.
Kotler, P. 1991. Marketing Management, 7th ed. Englewood Cliffs: Prentice-Hall.Lam, S.Y., V. Shankar, M.K. Erramilli, and B. Murthy. 2004. Customer value, satisfaction, loyalty, and
switching costs: An illustration from a business-to-business service context. Journal of the Academy of Marketing Science 32: 293–311.
Lee, C.-C., T.T. Lin, and C.-J. Chen. 2010. The determinant of customer profitability on the financial institution. The Service Industries Journal 30: 2311–2328.
Pauly, M.V. 1974. Overinsurance and public provision of insurance: The role of moral hazard and adverse selection. Quarterly Journal of Economics 88: 44–62.
Pooser, D.M., and M.J. Browne. 2018. The effects of customer satisfaction on company profitability: Evi-dence from the property and casualty insurance industry. Risk Management and Insurance Review 21: 289–308.
Reichheld, F.F. 2003. The one number you need to grow. Harvard Business Review 81: 47–54.Reichheld, F.F., and W.E. Sasser. 1990. Zero defections: Quality comes to service. Harvard Business
Review 68: 105–111.Rothschild, M., and J. Stiglitz. 1976. Equilibrium in competitive insurance markets: An essay on the eco-
nomics of imperfect information. The Quarterly Journal of Economics 90: 629–649.Smith, R.E., and W.F. Wright. 2004. Determinants of customer loyalty and financial performance. Jour-
nal of Management Accounting Research 16: 183–205.Smith, V.L. 1968. Optimal insurance coverage. Journal of Political Economy 76: 68–77.Statistik Schweiz - Bundesamt fuer Statistik. 2019. Räumliche Gliederungen. Retrieved July 23, 2019,
from https:// www. bfs. admin. ch/ bfs/ de/ home/ stati stiken/ quers chnit tsthe men/ raeum liche- analy sen/ raeum liche- glied erung en. html.
Sun, K.-A., and D.-Y. Kim. 2013. Does customer satisfaction increase firm performance? An application of American customer satisfaction index (ACSI). International Journal of Hospitality Management 35: 68–77.
Swiss Life AG. 2018. Business Review - Customer Centricity. Retrieved January 25, 2021, from Respon-sibility in Business: https:// www. repor ts. swiss life. com/ repor ts/ swiss life/ annual/ 2018/ gb/ Engli sh/ 107016/ respo nsibi lity- in- busin ess. html? addPa geToW arenk orb=1.
Thaler, R. 1980. Toward a positive theory of consumer choice. Journal of Economic Behavior & Organi-zation 1: 39–60.
Wangenheim, F.V., and T. Bayón. 2017. The chain from customer satisfaction via word-of-mouth refer-rals to new customer acquisition. Journal of the Academy of Marketing Science 35: 233–249.
Waters, R.H. 1931. A study of customer attitude. Journal of Applied Psychology 15: 252–258.Wu, C.-S.P., and H. Lin. 2009. Large scale analysis of persistency and renewal discounts for property and
casualty insurance. Casualty Actuarial Society E-Forum 5: 396–408.Zurich Insurance Group. 2021. BOP down 20% with strong rebound in second half; Strong commercial
insurance performance and record-high customer satisfaction. Retrieved February 8, 2021, from News Release: https:// www. zurich. com/ en/ media/ news- relea ses/ 2021/ 2021- 0211- 01.
Publisher’s Note Springer Nature remains neutral with regard to jurisdictional claims in published maps and institutional affiliations.