Embed Size (px)
Citation preview
THE RELATIONSHIP BETWEEN STRUCTURAL AND TECTONIC EVOLUTION AND MINERALIZATION AT THE COLES HILL URANIUM DEPOSTI, PITTSYLVANIA COUNTY, VIRGINIA
John Wyatt
Thesis submitted to the faculty of the Virginia Polytechnic Institute and State University in partial fulfillment of the requirements for the degree of
MASTER OF SCIENCE In
GEOSCIENCES
Committee Members: Robert J. Bodnar, Co-Chairman Richard D. Law, Co-Chairman
Joseph G. Aylor William S. Henika
October 7, 2009 Blacksburg, Virginia
Keywords: uranium deposit, structure, tectonics, Coles Hill
THE RELATIONSHIP BETWEEN STRUCTURAL AND TECTONIC EVOLUTION AND MINERALIZATION AT THE COLES HILL URANIUM DEPOSIT, PITTSYLVANIA COUNTY, VIRGINA
John Wyatt
ABSTRACT
The role of structure and tectonics in the formation of hydrothermal ore deposits
and the localization of high-grade mineralization associated with fractures is well
documented. In this study we have characterized the structural setting associated with
uranium mineralization in the Coles Hill uranium deposit by relating the observed
metamorphic and structural features (mylonitic foliation and fractures) to regional
tectonic activity.
Drill cores and outcrops observed in this study show that NE/SW oriented
fractures appear to be related to Mesozoic movement along the Chatham Fault. NW/SE
oriented fractures cross cut and offset the NE/SW oriented fractures by1 to 2 cm and
therefore post-date the NE/SW oriented fractures. NW/SE fracture orientations and
parallel to the NW/SE regional cross faults and are suggested to relate to the formation of
the cross faults during post Triassic basin inversion. Uranium mineralization is located
within horizontal to shallowly dipping fractures suggesting uplift and erosion to form
possible tension veins.
The cross faults with NW/SE orientations created pathways in which uranium
bearing hydrothermal fluids could migrate from the Triassic basin shales westward into
the adjacent highly fractured crystalline rocks, precipitating uranium due to oxidation-
reduction reactions.

iii
ACKNOWLEDGEMENTS
First and foremost I would like to thank Virginia Uranium Inc. for funding my research
and allowing access to data and resources during this study.
I thank the Geosciences Department for funding. I also thank the office staff and
especially Connie Lowe for all her advice and hard work.
I thank the Virginia Museum of Natural History, Martinsville for allowing me
access to research materials for this study and especially to Jason Lunze.
Special thanks to my committee members, Dr. Joesph G. Aylor, Mr. William S.
Henika and Dr. Richard D. Law for all of their discussions that have improved this study.
I would like to thank my mother Carolyn Wyatt, my father Harold Wyatt and my
brother Kevin Bennett for their support and prayers over the past year and half. My
advisor, Dr. Robert J. Bodnar for his extensive knowledge and I am very grateful for his
support and time.
I would like to thank all my fellow graduated students and friends for their help
during the difficult times and especially, Christy Bernard, Theresa Detrie, Marilyn
Duncan, Rosario Esposito, Samuel Fortson, John Gannon, Ellen Gilliland, Stephanie
Humphries, Eric Kazlaukas, Lindsay Kolbus, Matthew Steele-MacInnis, Ann Maddox,
Crystal Mayhew, Daniel Moncada, Kathleen McFadden, Nathan Reed, Aaron Reffett,
Ben Roth, Pilar Lecumberri Sanchez, Majken Schimmel and Pavithra Sekhar.
Dedicated to Mindy Schweiger who has taught me courage and the true meaning
of determination.
iv
TABLE OF CONTENTS
ABSTRACT....................................................................................................................... ii ACKNOWLEDGEMENTS ............................................................................................ iii
Table of Contents ............................................................................................................. iv Table of Figures ................................................................................................................ v
INTRODUCTION ............................................................................................................ 1 GEOLOGIC EVOLUTION IN THE VICINITY OF COLES HILL AND WESTERN PIEDMONT ................................................................................................. 2 METHODS ........................................................................................................................ 5
RESULTS .......................................................................................................................... 8 INTERPRETATION ...................................................................................................... 10
REFERENCES CITED.................................................................................................. 13 APPENDEX A .................................................................................................................27 APPENDEX B .................................................................................................................28 APPENDEX C .................................................................................................................36 APPENDEX D .................................................................................................................37 APPENDEX E .................................................................................................................43 APPENDEX F .................................................................................................................45 APPENDEX G .................................................................................................................47 APPENDEX H .................................................................................................................50 APPENDEX I ..................................................................................................................51 APPENDEX J ..................................................................................................................52
v
TABLE OF FIGURES
Figure 1. Location map of the Coles Hill uranium deposit. ............................................ 15 Figure 2. Simplified geological map showing the Bowens Creek Fault (BC), Chatham
Fault (CF) and major lithotectonic untis in the vicinity of Coles Hill. Map moodified from Viginia Division of Mineral Resources (1993) and Henika et al. (1981).................................................................................................................... 16
Figure 3. Simplified geological map in the immediate vicinity of Coles Hill showing the location of the north (N) and south (S) ore bodies. Map modified from Henika et al. (1981)............................................................................................................... 17
Figure 4. Regional geological map showing the locations of three drill holes and five outcrops. Map modified from Henika et al. (1981). ............................................. 18
Figure 5. Photographs of five outcrops showing the dominant fracture strikes represented by blue (NW) and red (NE) tape. SPG 223 (N 36°51.991’ W 79°18.718’) and GTA 894 (N 36°52.333’ W 79°16.9021’) are located within the mylonitized gneiss. SPG 231 (N 36°52.322’ W 79°17.976’), SPG 311 (N 36°52.322’ W 79°16.843’) and MA 711 (N 36°52.618’ W 79°14.895’) are located within the Triassic basin. Map image copyright by Google Earth (2009), copyright Europa Technologies (2009) and copyright Commonwealth of Virginia (2009). .................................. 19
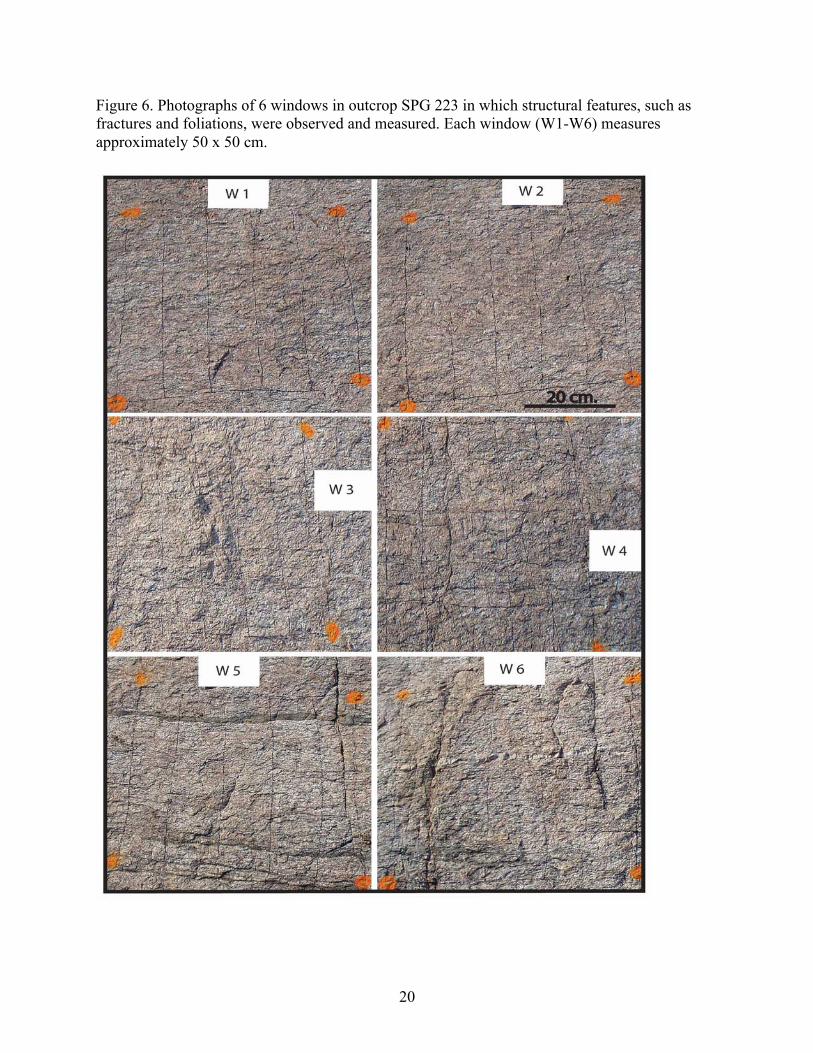
Figure 6. Photographs of 6 windows in outcrop SPG 223 in which structural features, such as fractures and foliations, were observed and measured. Each window (W1-W6) measures approximately 50 x 50 cm. ............................................................ 20
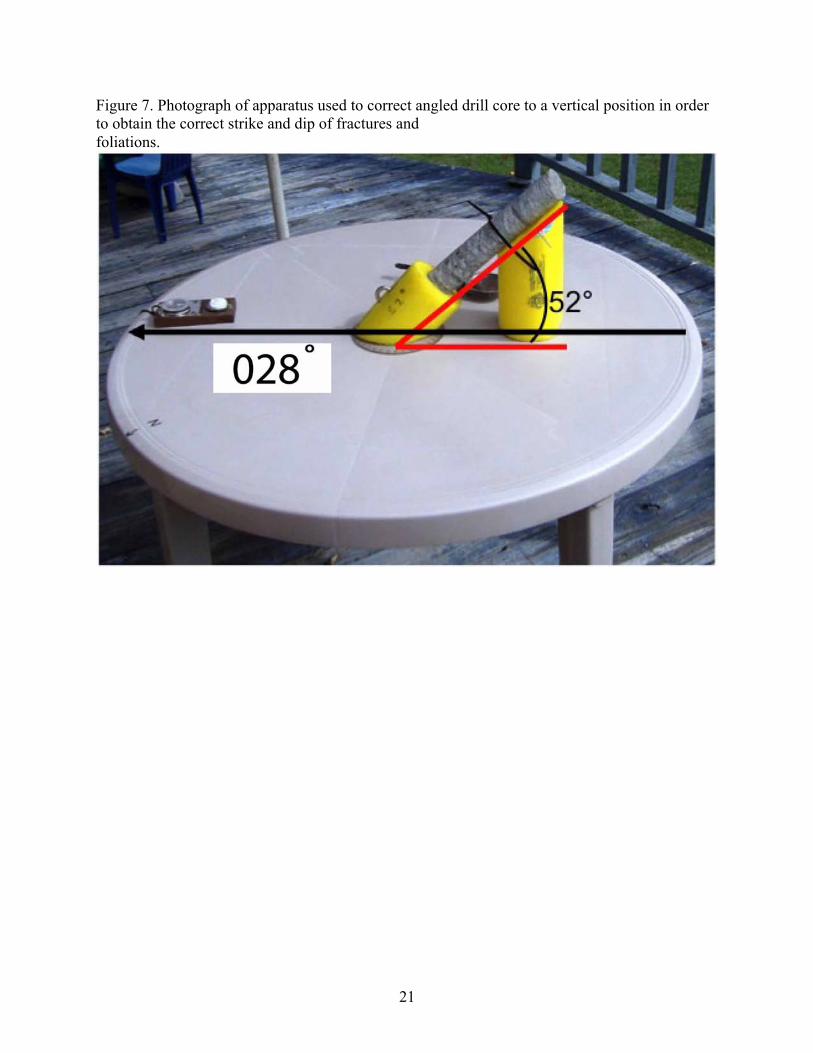
Figure 7. Photograph of apparatus used to correct angled drill core to a vertical position in order to obtain the correct strike and dip of fractures and foliations. .............................................................................................................................. 21
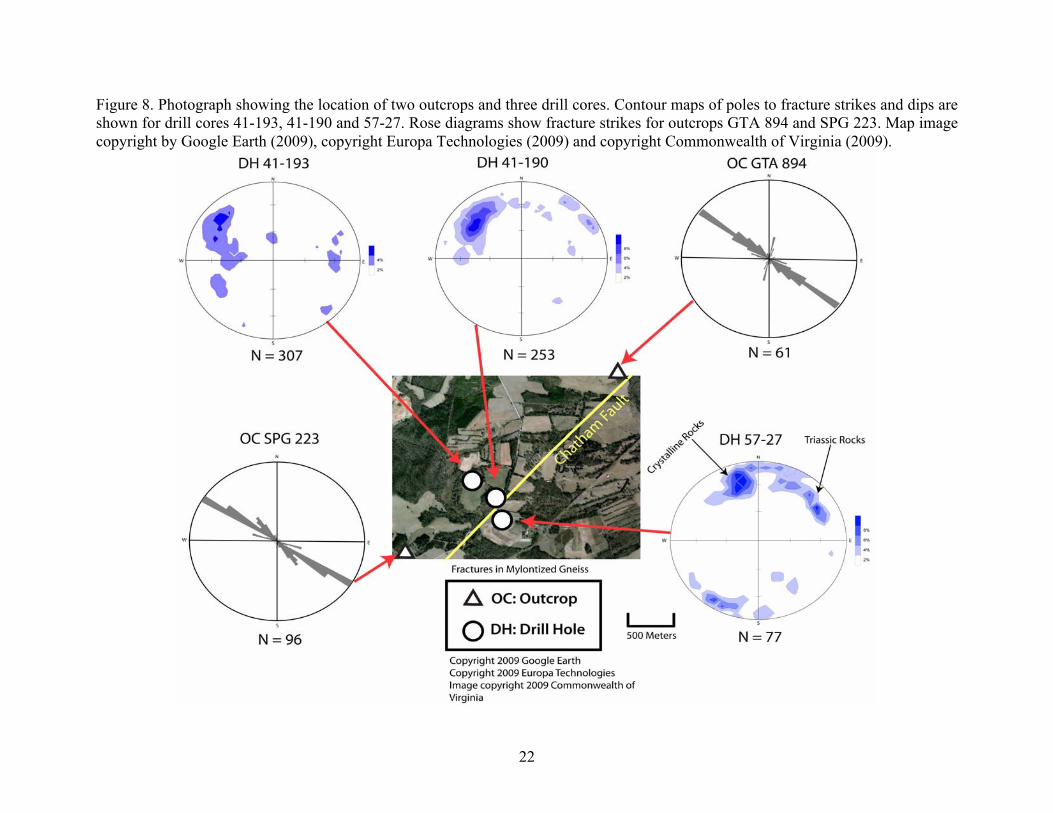
Figure 8. Photograph showing the location of two outcrops and three drill cores. Contour maps of poles to fracture strikes and dips are shown for drill cores 41-193, 41-190 and 57-27. Rose diagrams show fracture strikes for outcrops GTA 894 and SPG 223. Map image copyright by Google Earth (2009), copyright Europa Technologies (2009) and copyright Commonwealth of Virginia (2009). ............................................................................................................................ 22
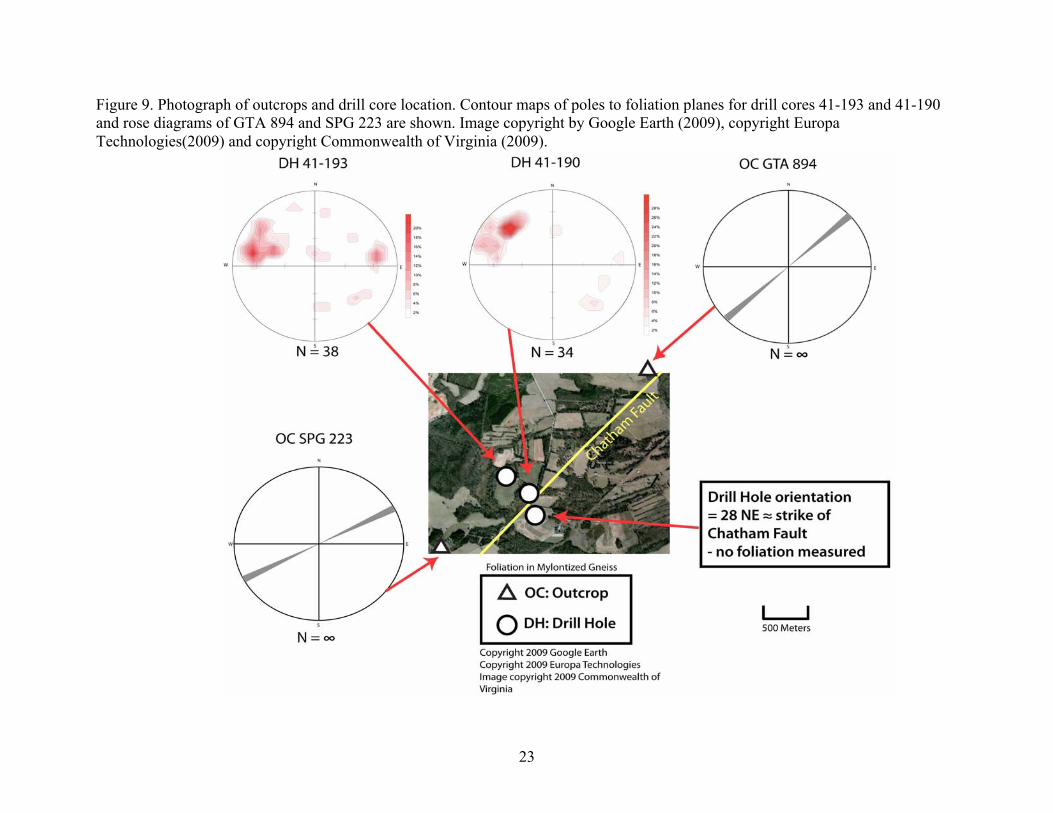
Figure 9. Photograph of outcrops and drill core location. Contour maps of poles to foliation planes for drill cores 41-193 and 41-190 and rose diagrams of GTA 894 and SPG 223 are shown. Image copyright by Google Earth (2009), copyright Europa Technologies (2009) and copyright Commonwealth of Virginia (2009). .............................................................................................................................. 23
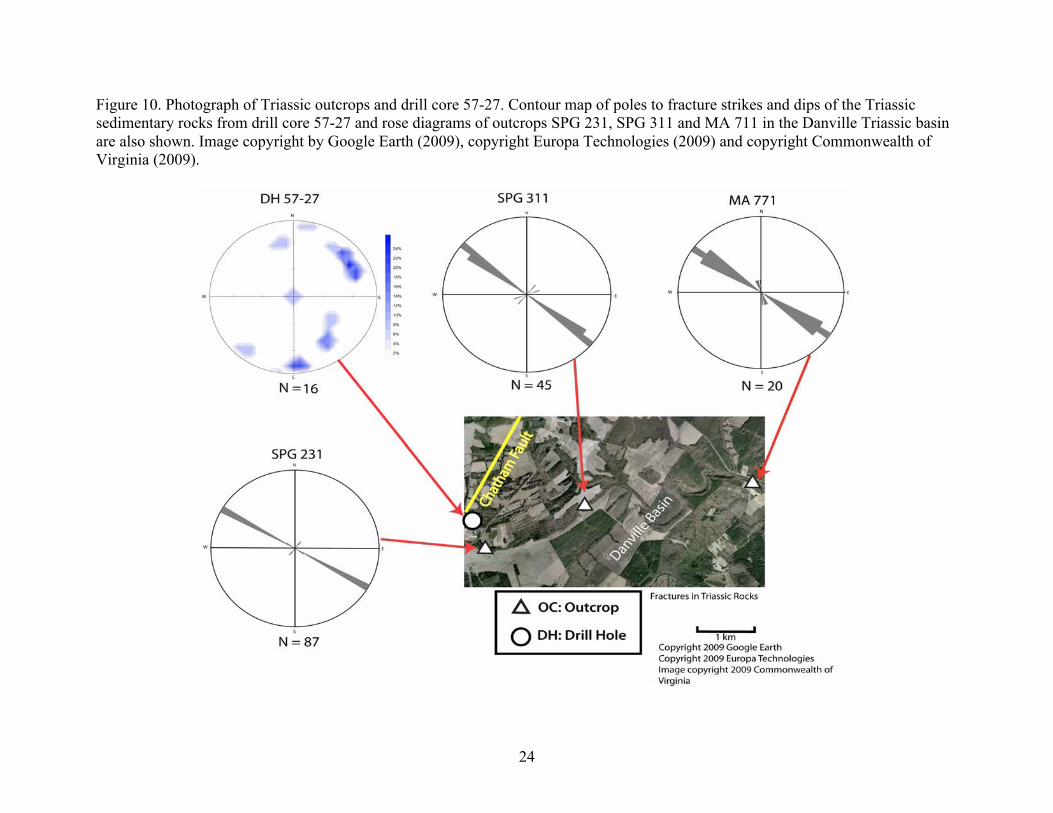
Figure 10. Photograph of Triassic outcrops and drill core 57-27. Countour map of poles to fracture strikes and dips of the Triassic sedimentary rocks from drill core 57-27 and rose diagrams of outcrops SPG 231, SPG 311 and MA 711 in the Danville Triassic basin are also shown. Image copyright by Google Earth (2009), copyright Europa Technologies (2009) and copyright Commonwealth of Virginia (2009).................................................................................................................... 24
vi
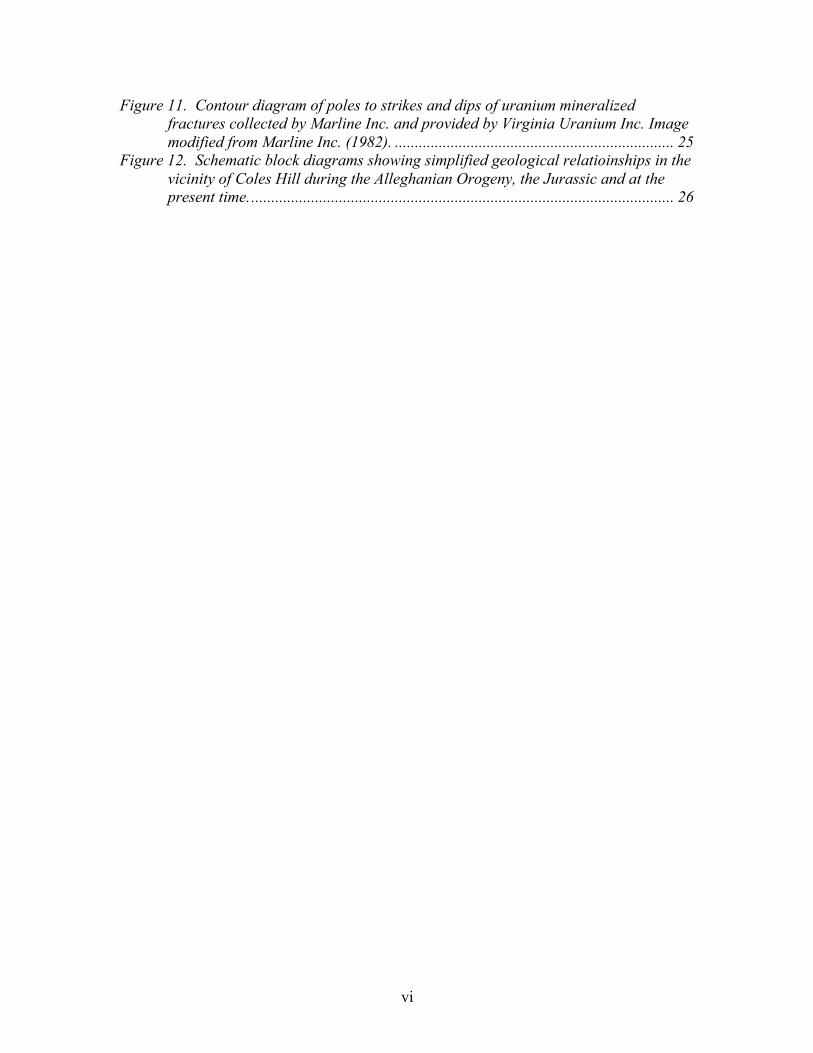
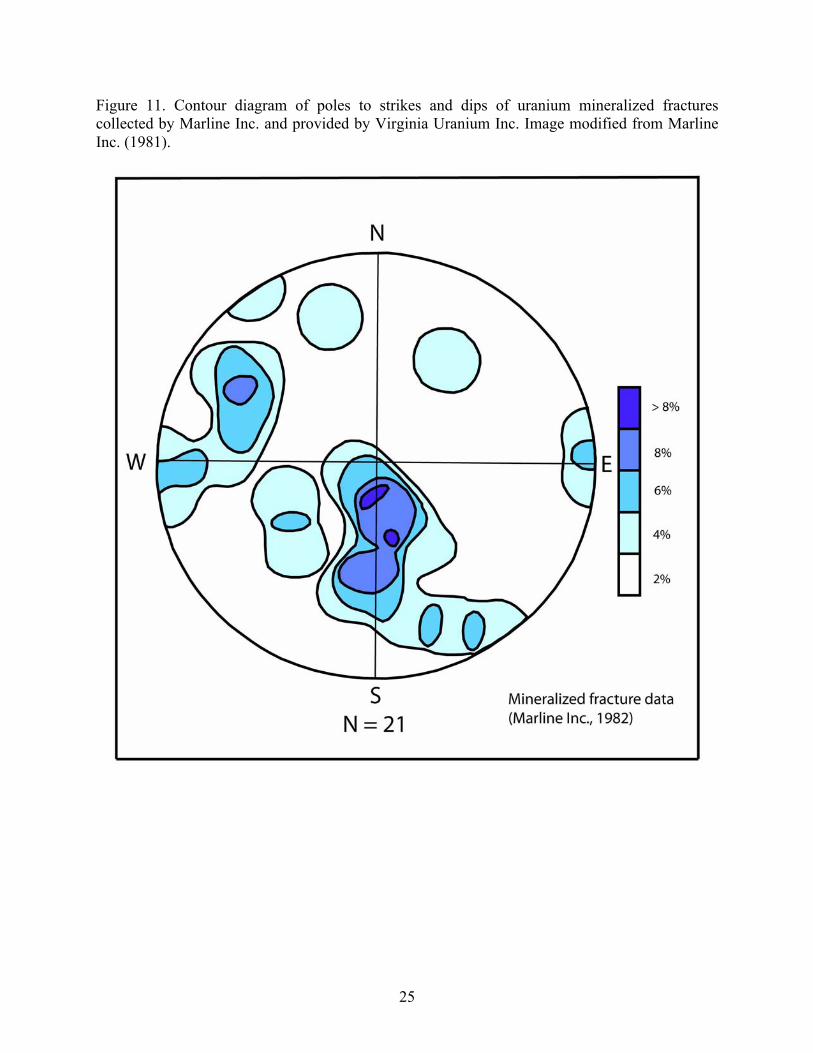
Figure 11. Contour diagram of poles to strikes and dips of uranium mineralized fractures collected by Marline Inc. and provided by Virginia Uranium Inc. Image modified from Marline Inc. (1982). ...................................................................... 25
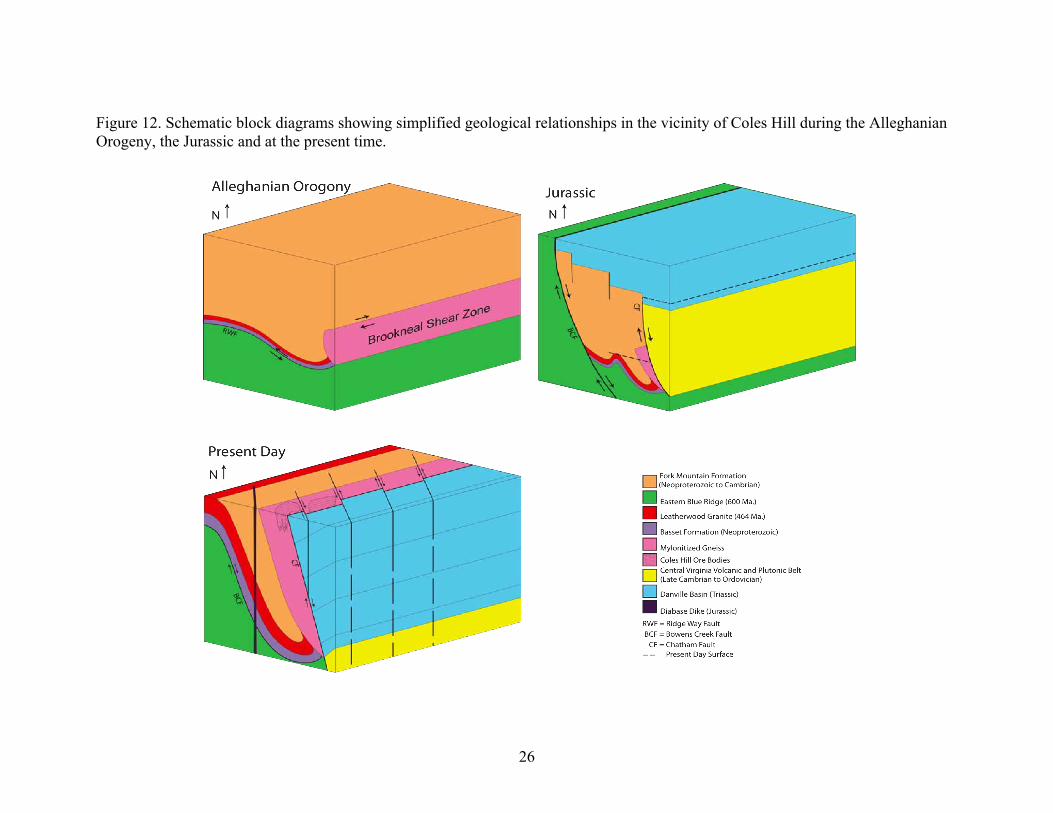
Figure 12. Schematic block diagrams showing simplified geological relatioinships in the vicinity of Coles Hill during the Alleghanian Orogeny, the Jurassic and at the present time........................................................................................................... 26
1
INTRODUCTION
The important role of structure and tectonics in the formation of hydrothermal ore
deposits is well documented (Baudemont and Fedorowich, 1996; Jianwei et al., 2002; Cox, 2005;
Safonov et al., 2007; Ford and Blenkinsop, 2008). Of particular relevance to ore forming systems
is the localization of high-grade mineralization associated with intersecting fractures (Baudemont
and Fedorowich, 1996). In hydrothermal uranium deposits intersecting fractures may represent
areas in which oxidizing fluids and reducing fluids mix to precipitate high-grade uranium
mineralization (Craw, 2000; Cox, 2005). In this study we have characterized the structural
setting associated with uranium mineralization in the Coles Hill uranium deposit and have
related the observed metamorphic and structural features (mylonitic foliations and fracture sets)
to regional tectonic activity.
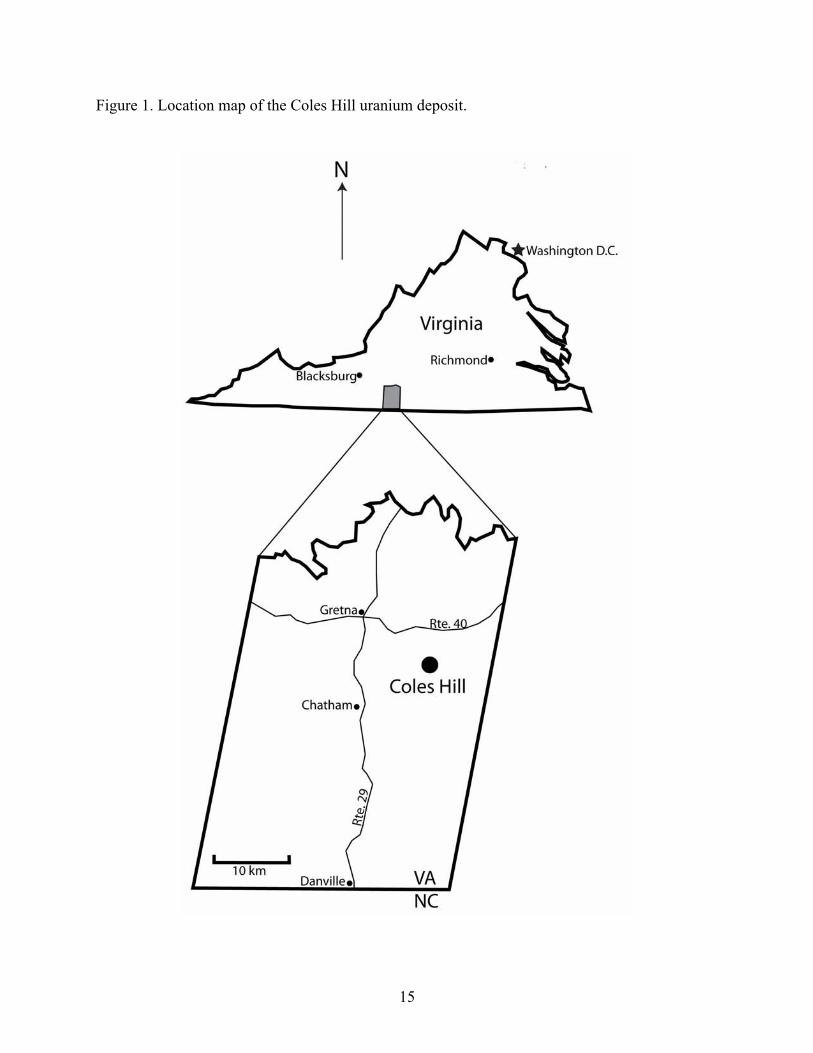
The Coles Hill uranium deposit, located in south central Virginia in Pittsylvania County
(Figure 1) is considered the largest undeveloped uranium deposit in the United States (Aylor et
al., 2009). The Coles Hill uranium deposit is thought to be a hydrothermally derived deposit
(Aylor et al., 2009) that is associated with major regional scale structural and tectonic features.
To better understand the origin of the deposit a detailed structural study of outcrops, drill core
and hand samples was conducted to determine the relative chronology of the structural and
tectonic events and their possible relationship to mineralization.
2
GEOLOGICAL EVOLUTION IN THE VICINITY OF COLES HILL AND
WESTERN PIEDMONT
The earliest tectonic event associated with formation of the southern Appalachians is the
breakup of the supercontinent of Rhodina at about 670 to 640 Ma. to form the Iapetus Ocean
(Carter et al., 2006). During the subsequent closing of the Iapetus Ocean at about 550 Ma, a
westward inclined subduction zone formed and produced a volcanic arc along the east coast of
Laurentia, which is now part of present day North America (Gates, 1981; Carter et al., 2006). As
subduction continued and Iapetos closed a volcanic arc collided with continental North America
and this mountain building event is known as the Taconic Orogeny (540 to 440 Ma) (Gates,
1981; Hibbard et al., 2003; Carter et al., 2006). Today the Basset and Fork Mountain formations
form the Smith River Allochthon in southern Virginia (Conley et al., 1973). The Smith River
Allochthon is approximately 250 km long and approximately 50 km wide (Carter et al., 2006)
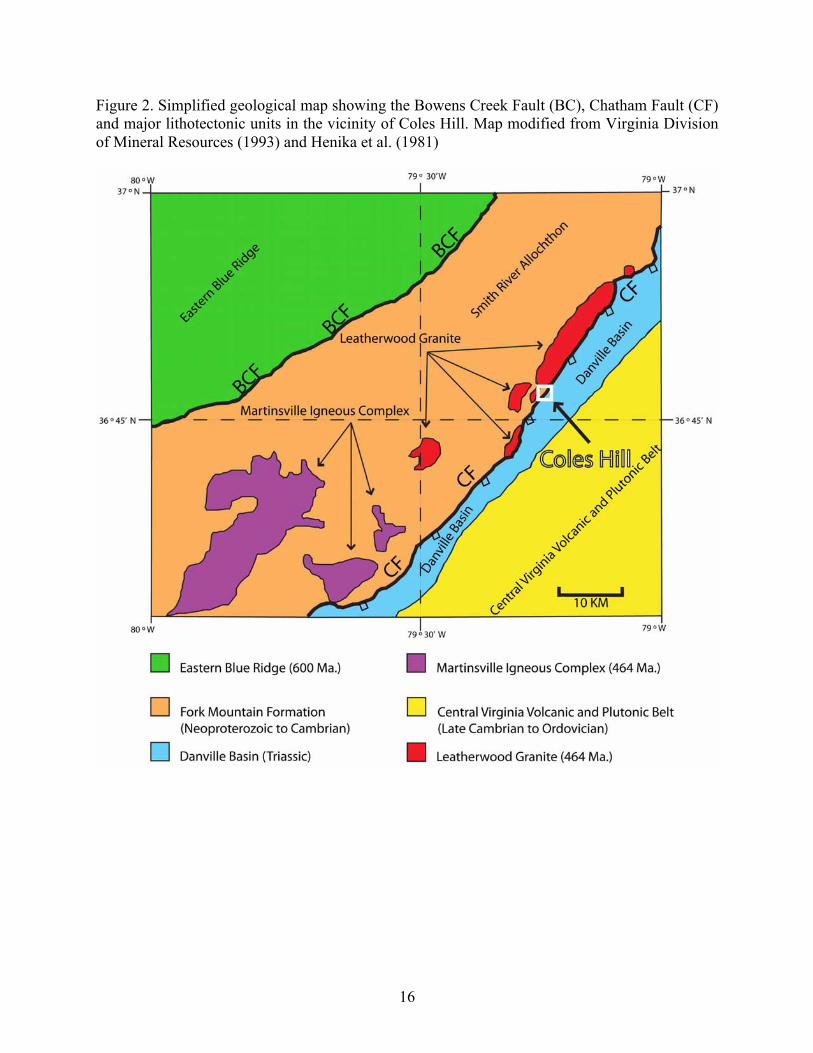
and the Coles Hill deposit is located on its eastern edge (Figure 2). The western boundary of the
Smith River Allochthon is represented by the Bowens Creek Fault and it is bounded on the east
by the Chatham Fault (Hibbard et al., 2003). The Smith River Allochthon forms a thin skinned
sheet like structure that has been thrust westward along the Ridgeway fault (Carter et al., 2006).
Generally, the Bassett Formation consists of quartzo-feldspathic biotite gneiss, amphibolite and
quartzite, and the Fork Mountain Formation comprises biotite paragneiss, aluminous mica schist,
quartzite, calcsilicate rocks and amphibolite (Henika, 2002).
Intrusion of plutons of the Rich Acres Gabbro and the Leatherwood Granite of the
Martinsville Igneous Complex into the Smith River Allochthon occurred at 464 to 457 Ma
(Lineberger, 1983). The dominant fabric in these rocks is a metamorphic mylonitic foliation that
strikes NE/SW. This metamorphic foliation is contemporaneous with the Alleghanian Orogenty
3
and possibly the Brookneal Shear Zone (Gates, 1981), however we are unable to determine if
there is a genetic link between foliation and the Brookneal Shear Zone. For simplicity, in the
discussion to follow we correlate the timing of foliation with the formation of the Brookneal
Shear Zone during the Alleghanian Orogoney (350 Ma.) (Gates, 1981; Lineberger, 2003). During
continued closing of the Iapetus Ocean, at 375 Ma, Avalonia collided with Laurentia resulting in
the Acadian Orogeny (Henika et al., 1981; Hibbard et al., 2003). Finally, during the
Carboniferous at 350 to 300 Ma, Gondwana collided with Laurentia to produce the
supercontinent of Pangaea and a third mountain building event known as the Alleghanian
Orogeny (Hibbard et al., 2003). Foliation associated with the Alleghanian Orogeny formed sub-
parallel to the previously developed foliation in the Leatherwood (Gates, 1981).
During the Mesozoic, from 250 to 130 Ma, the NE/SW trending Danville Triassic basin
formed as a result of the eventual break up of Pangaea, when the present day Atlantic Ocean was
formed (Figure 2) (Hibbard et al., 2003). The basin fill is composed of shales, siltstone,
sandstones and conglomerates (Henika et al., 1981). Before erosion to the present day land
surface the Triassic basin sediments may have extended westward to the Bowens Creek Fault.
During later westward-directed plate motion, the Triassic basin underwent a process known as
basin inversion that created a topographical high on the eastern edge of the basin (Schlische et
al., 2002) and hydraulic gradients from east to west that would promote the migration of fluids
towards the Chatham Fault. Evidence of uplift along Mesozoic basins was documented north of
Coles Hill in the Taylorsville basin as indicated by faster cooling of the eastern edge of the basin
then the western edge (Tseng et al., 1999). This suggested fluid flow from the east to the west
(Tseng et al., 1999). Mesozoic diabase dikes and cross faults were interpreted to be associated
with contraction of the Mesozoic basins (Tseng et al., 1999). This event produced the present day
4
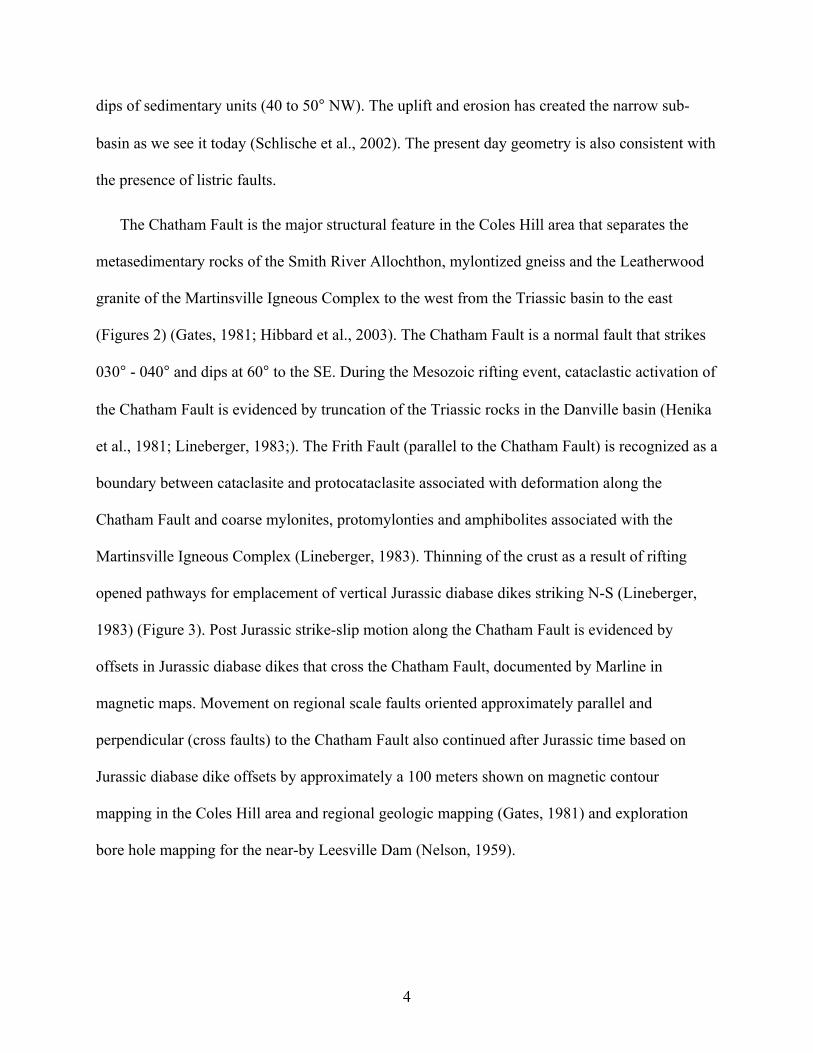
dips of sedimentary units (40 to 50° NW). The uplift and erosion has created the narrow sub-
basin as we see it today (Schlische et al., 2002). The present day geometry is also consistent with
the presence of listric faults.
The Chatham Fault is the major structural feature in the Coles Hill area that separates the
metasedimentary rocks of the Smith River Allochthon, mylontized gneiss and the Leatherwood
granite of the Martinsville Igneous Complex to the west from the Triassic basin to the east
(Figures 2) (Gates, 1981; Hibbard et al., 2003). The Chatham Fault is a normal fault that strikes
030° - 040° and dips at 60° to the SE. During the Mesozoic rifting event, cataclastic activation of
the Chatham Fault is evidenced by truncation of the Triassic rocks in the Danville basin (Henika
et al., 1981; Lineberger, 1983;). The Frith Fault (parallel to the Chatham Fault) is recognized as a
boundary between cataclasite and protocataclasite associated with deformation along the
Chatham Fault and coarse mylonites, protomylonties and amphibolites associated with the
Martinsville Igneous Complex (Lineberger, 1983). Thinning of the crust as a result of rifting
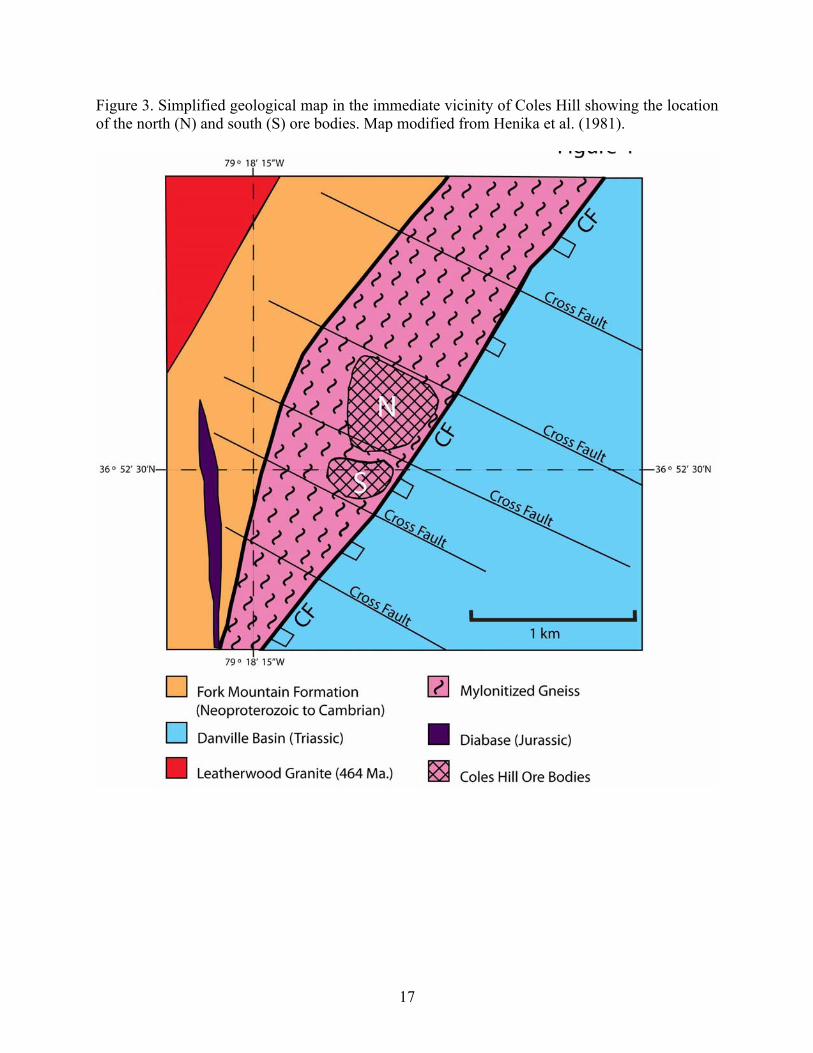
opened pathways for emplacement of vertical Jurassic diabase dikes striking N-S (Lineberger,
1983) (Figure 3). Post Jurassic strike-slip motion along the Chatham Fault is evidenced by
offsets in Jurassic diabase dikes that cross the Chatham Fault, documented by Marline in
magnetic maps. Movement on regional scale faults oriented approximately parallel and
perpendicular (cross faults) to the Chatham Fault also continued after Jurassic time based on
Jurassic diabase dike offsets by approximately a 100 meters shown on magnetic contour
mapping in the Coles Hill area and regional geologic mapping (Gates, 1981) and exploration
bore hole mapping for the near-by Leesville Dam (Nelson, 1959).
5
METHODS
In this study the structural setting associated with uranium mineralization in the Coles
Hill deposit has been characterized. To accomplish this, structural discontinuities, including
mylonitic foliation and multiple fracture orientations were measured in outcrops and drill core
(Figure 4). Structural trend discontinuity orientations were obtained and reported in azimuth 0 -
180°.
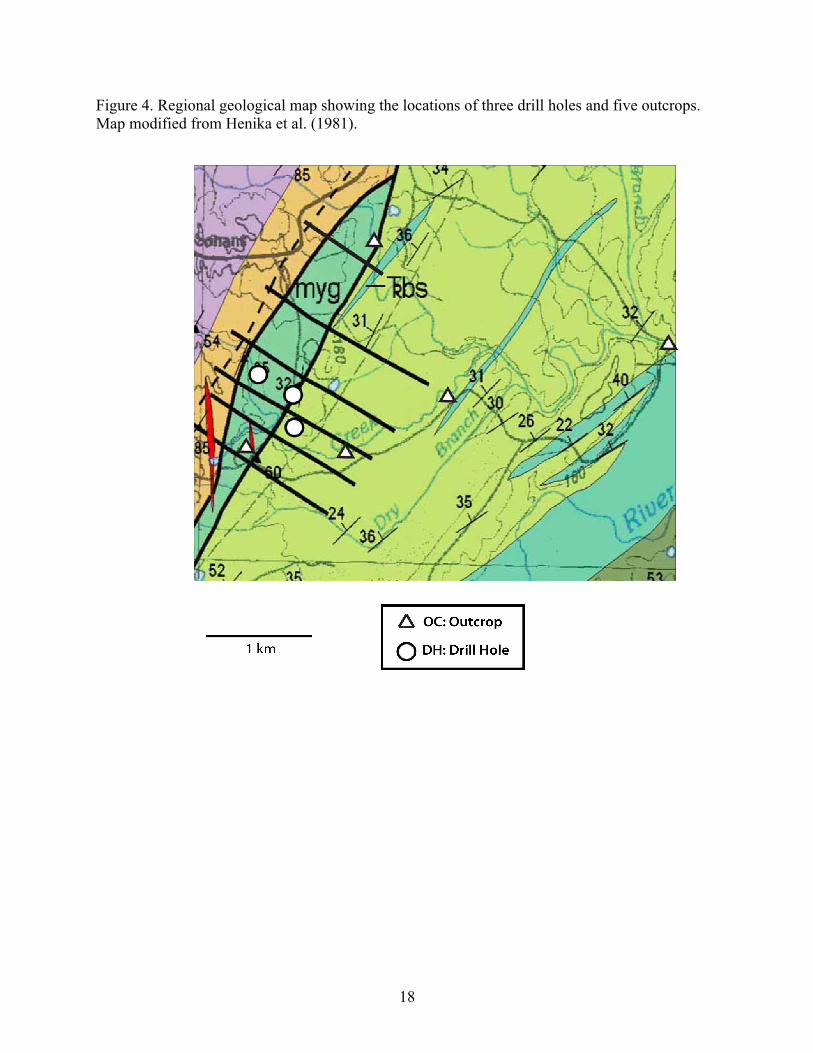
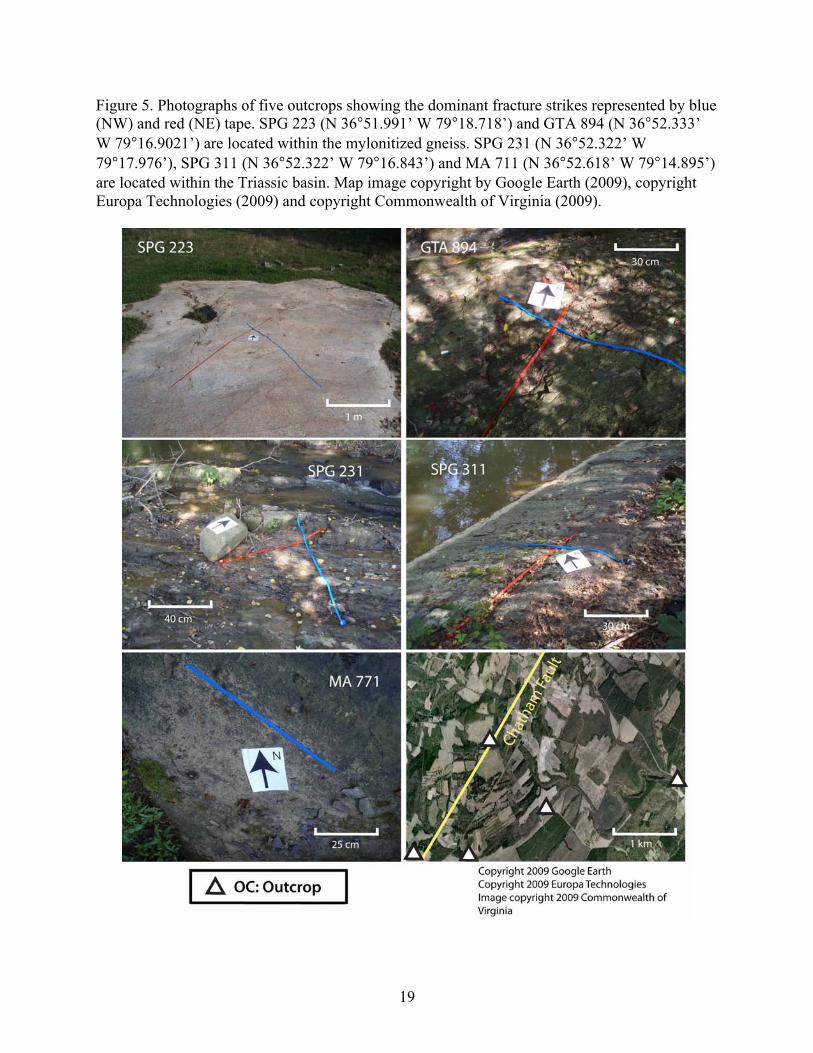
Five large pavement outcrops (Figures 4,5) were selected, and these are located at
different distances from the two major structural features in the Coles Hill area, namely the
Chatham fault and cross faults that are oriented perpendicular to the Chatham Fault. This
approach was used to test whether structural discontinuities at Coles Hill could be related to
these major structural events and if the intensity of fractures varies as a function of distance from
the Chatham Fault and/or cross faults. Outcrop fracture orientations were examined to test for
relationships with the major structural features in the area. Only strikes were measured in
outcrops. Outcrop SPG 223 near the Frith House was located in the mylonitic gneiss unit and
approximately 20 meters from the nearest surface exposure of one of the cross faults and 400
meters from the nearest surface exposure of the Chatham Fault. Outcrop GTA 894 in the
mylonitic gneiss within Whitethorn Creek was located 300 meters from the nearest surface
exposure of a cross fault and 20 meters from the surface exposure of the Chatham Fault.
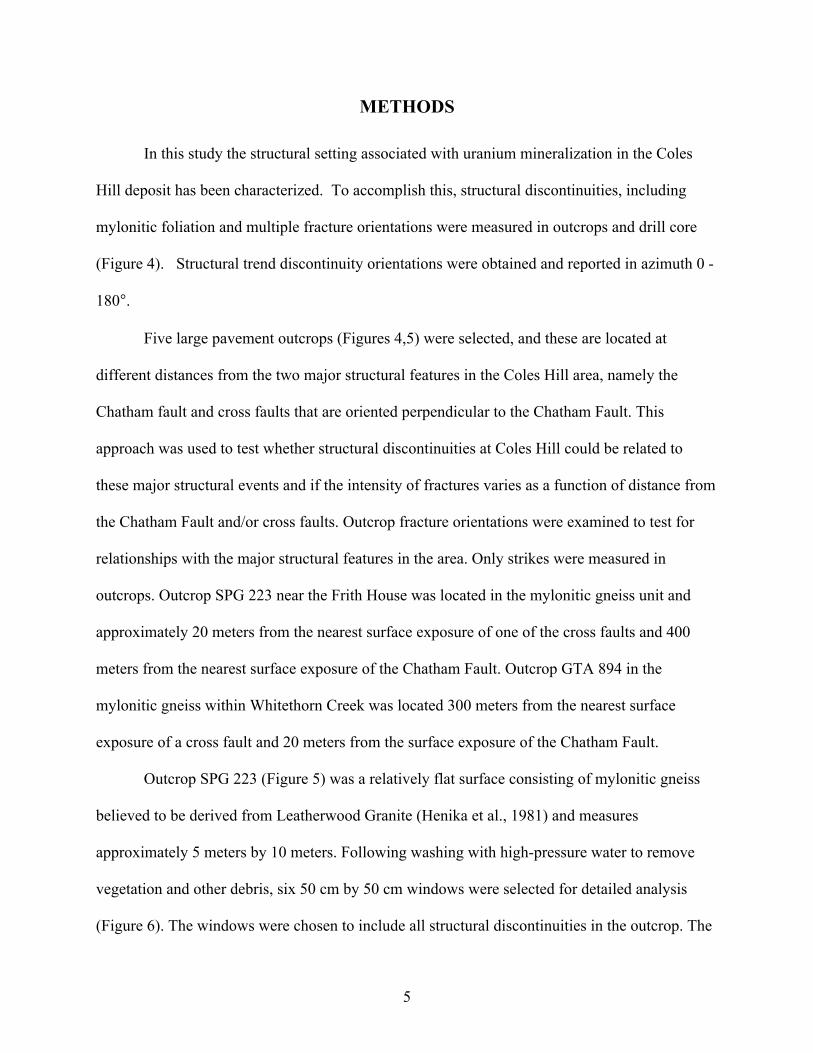
Outcrop SPG 223 (Figure 5) was a relatively flat surface consisting of mylonitic gneiss
believed to be derived from Leatherwood Granite (Henika et al., 1981) and measures
approximately 5 meters by 10 meters. Following washing with high-pressure water to remove
vegetation and other debris, six 50 cm by 50 cm windows were selected for detailed analysis
(Figure 6). The windows were chosen to include all structural discontinuities in the outcrop. The
6
orientation of every discontinuity (fractures, planes of foliation, and orientations of quartz veins)
within each window was measured. Windows 1 and 2 contain few fractures but many foliation
planes were observed and measured. Windows 3 and 4 contain high densities of both fractures
and foliation planes. Windows 5 and 6 contain abundant unltramylonite and quartz veins and
fractures.
Outcrop GTA 894 also consisted of mylonitic gneiss believed to be derived from
Leatherwood granite (Henika et al., 1981) and measured approximately 3 by 5 meters. Owing to
the smaller size of outcrop GTA 894 the entire outcrop was selected and every observable
structural feature was measured, including fractures, quartz veins and foliation planes.
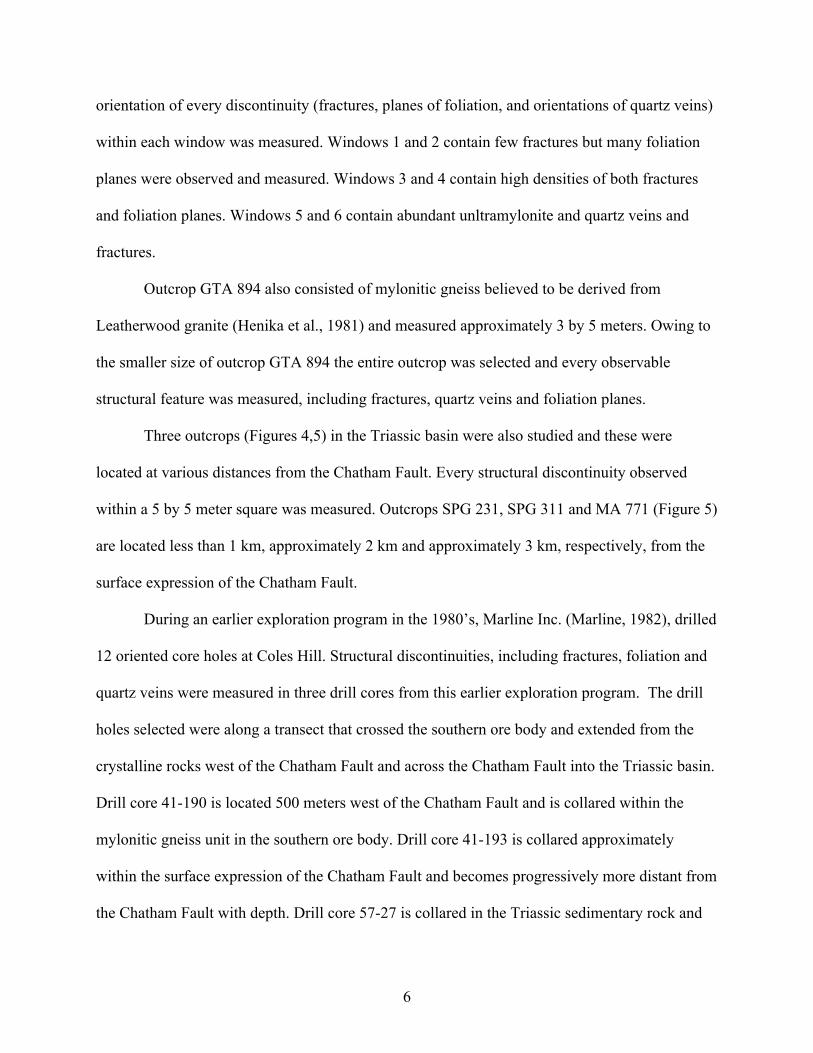
Three outcrops (Figures 4,5) in the Triassic basin were also studied and these were
located at various distances from the Chatham Fault. Every structural discontinuity observed
within a 5 by 5 meter square was measured. Outcrops SPG 231, SPG 311 and MA 771 (Figure 5)
are located less than 1 km, approximately 2 km and approximately 3 km, respectively, from the
surface expression of the Chatham Fault.
During an earlier exploration program in the 1980’s, Marline Inc. (Marline, 1982), drilled
12 oriented core holes at Coles Hill. Structural discontinuities, including fractures, foliation and
quartz veins were measured in three drill cores from this earlier exploration program. The drill
holes selected were along a transect that crossed the southern ore body and extended from the
crystalline rocks west of the Chatham Fault and across the Chatham Fault into the Triassic basin.
Drill core 41-190 is located 500 meters west of the Chatham Fault and is collared within the
mylonitic gneiss unit in the southern ore body. Drill core 41-193 is collared approximately
within the surface expression of the Chatham Fault and becomes progressively more distant from
the Chatham Fault with depth. Drill core 57-27 is collared in the Triassic sedimentary rock and
7
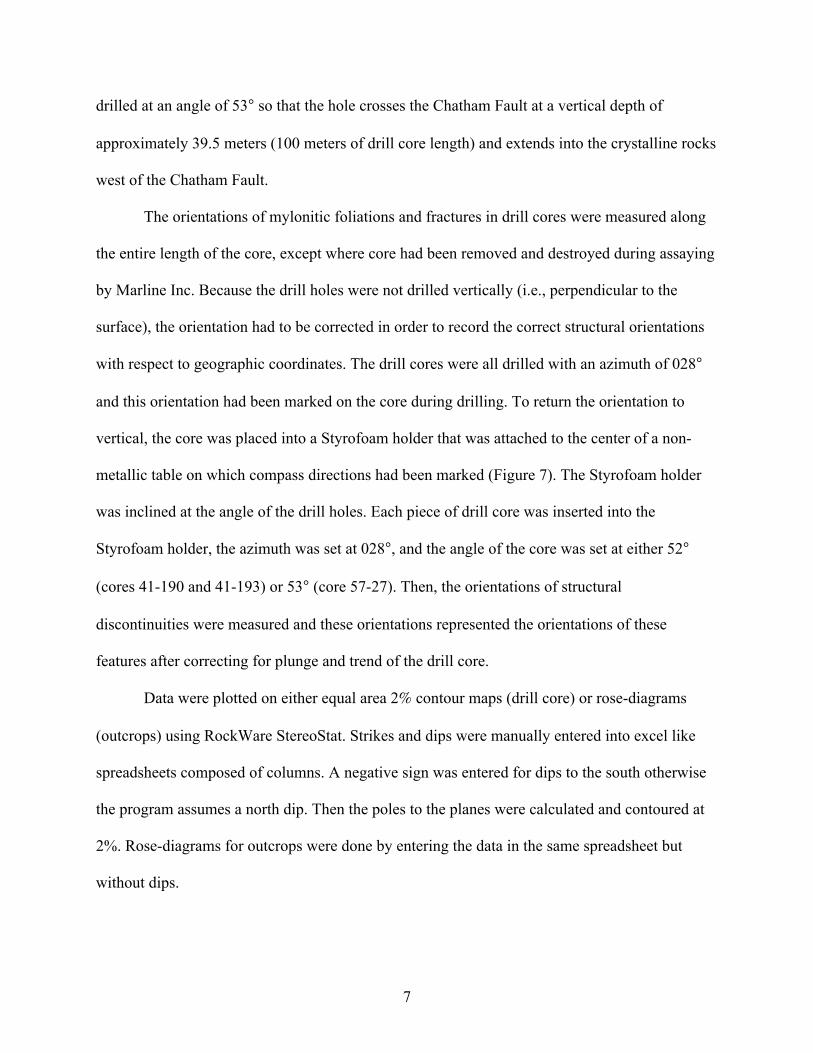
drilled at an angle of 53° so that the hole crosses the Chatham Fault at a vertical depth of
approximately 39.5 meters (100 meters of drill core length) and extends into the crystalline rocks
west of the Chatham Fault.
The orientations of mylonitic foliations and fractures in drill cores were measured along
the entire length of the core, except where core had been removed and destroyed during assaying
by Marline Inc. Because the drill holes were not drilled vertically (i.e., perpendicular to the
surface), the orientation had to be corrected in order to record the correct structural orientations
with respect to geographic coordinates. The drill cores were all drilled with an azimuth of 028°
and this orientation had been marked on the core during drilling. To return the orientation to
vertical, the core was placed into a Styrofoam holder that was attached to the center of a non-
metallic table on which compass directions had been marked (Figure 7). The Styrofoam holder
was inclined at the angle of the drill holes. Each piece of drill core was inserted into the
Styrofoam holder, the azimuth was set at 028°, and the angle of the core was set at either 52°
(cores 41-190 and 41-193) or 53° (core 57-27). Then, the orientations of structural
discontinuities were measured and these orientations represented the orientations of these
features after correcting for plunge and trend of the drill core.
Data were plotted on either equal area 2% contour maps (drill core) or rose-diagrams
(outcrops) using RockWare StereoStat. Strikes and dips were manually entered into excel like
spreadsheets composed of columns. A negative sign was entered for dips to the south otherwise
the program assumes a north dip. Then the poles to the planes were calculated and contoured at
2%. Rose-diagrams for outcrops were done by entering the data in the same spreadsheet but
without dips.
8
RESULTS
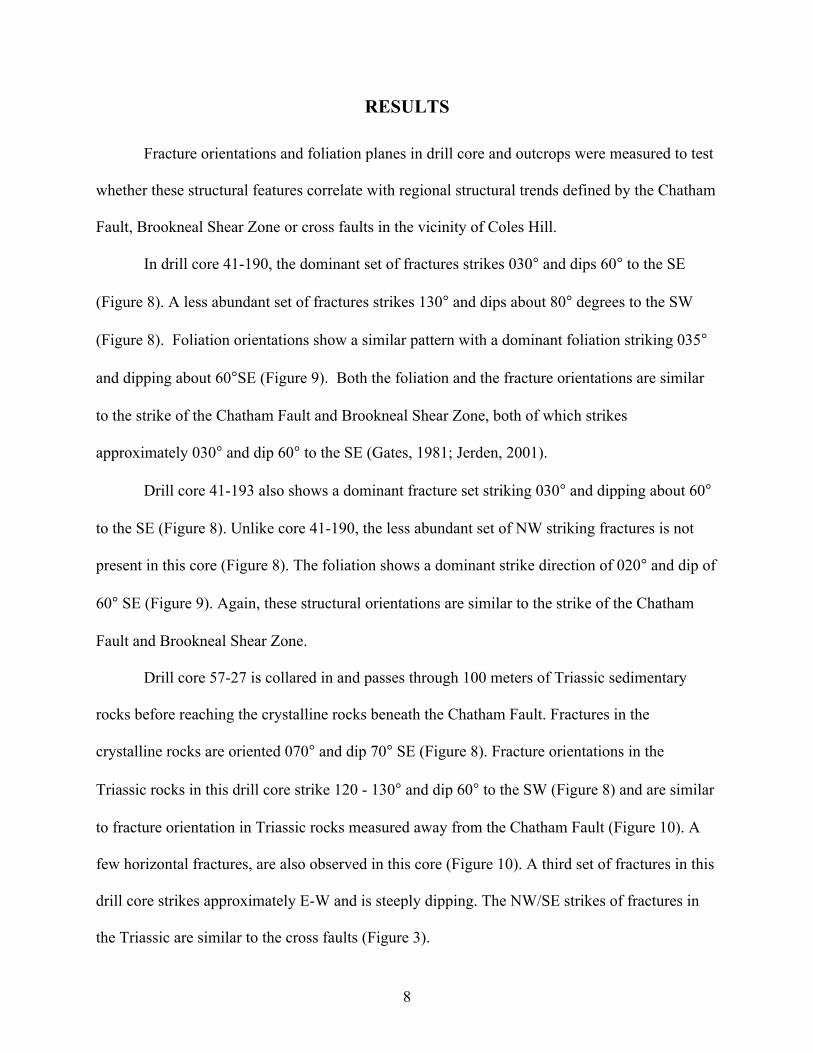
Fracture orientations and foliation planes in drill core and outcrops were measured to test
whether these structural features correlate with regional structural trends defined by the Chatham
Fault, Brookneal Shear Zone or cross faults in the vicinity of Coles Hill.
In drill core 41-190, the dominant set of fractures strikes 030° and dips 60° to the SE
(Figure 8). A less abundant set of fractures strikes 130° and dips about 80° degrees to the SW
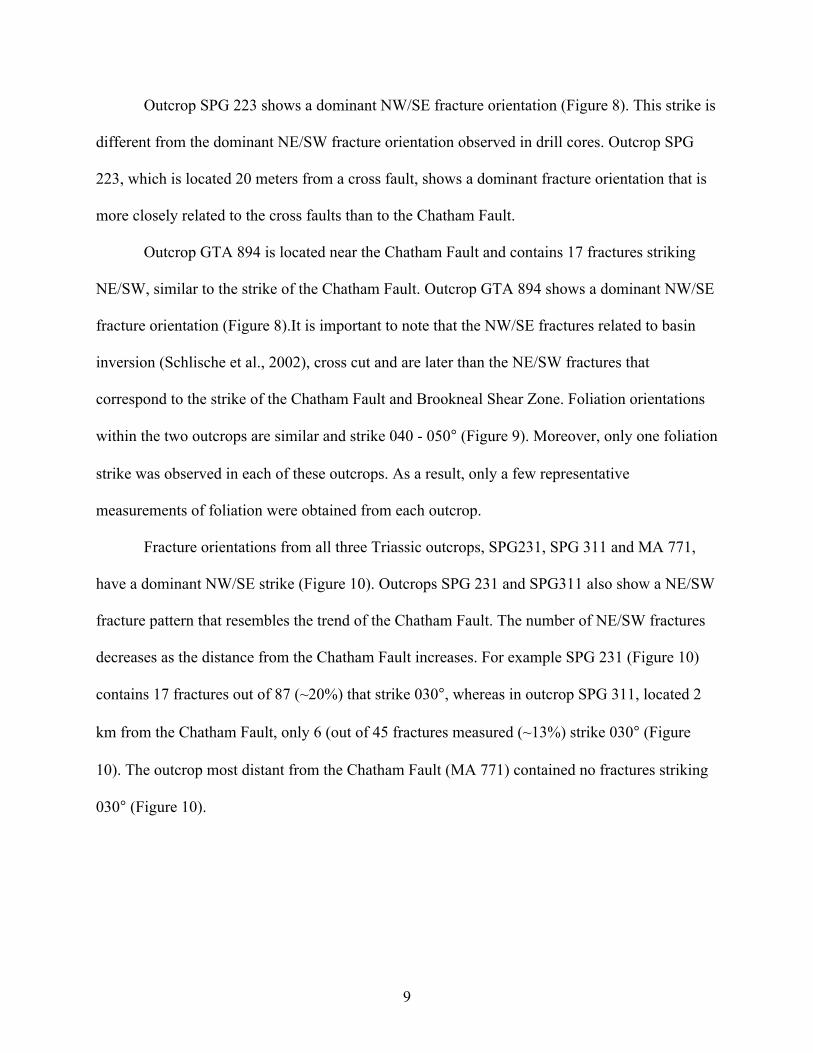
(Figure 8). Foliation orientations show a similar pattern with a dominant foliation striking 035°
and dipping about 60°SE (Figure 9). Both the foliation and the fracture orientations are similar
to the strike of the Chatham Fault and Brookneal Shear Zone, both of which strikes
approximately 030° and dip 60° to the SE (Gates, 1981; Jerden, 2001).
Drill core 41-193 also shows a dominant fracture set striking 030° and dipping about 60°
to the SE (Figure 8). Unlike core 41-190, the less abundant set of NW striking fractures is not
present in this core (Figure 8). The foliation shows a dominant strike direction of 020° and dip of
60° SE (Figure 9). Again, these structural orientations are similar to the strike of the Chatham
Fault and Brookneal Shear Zone.
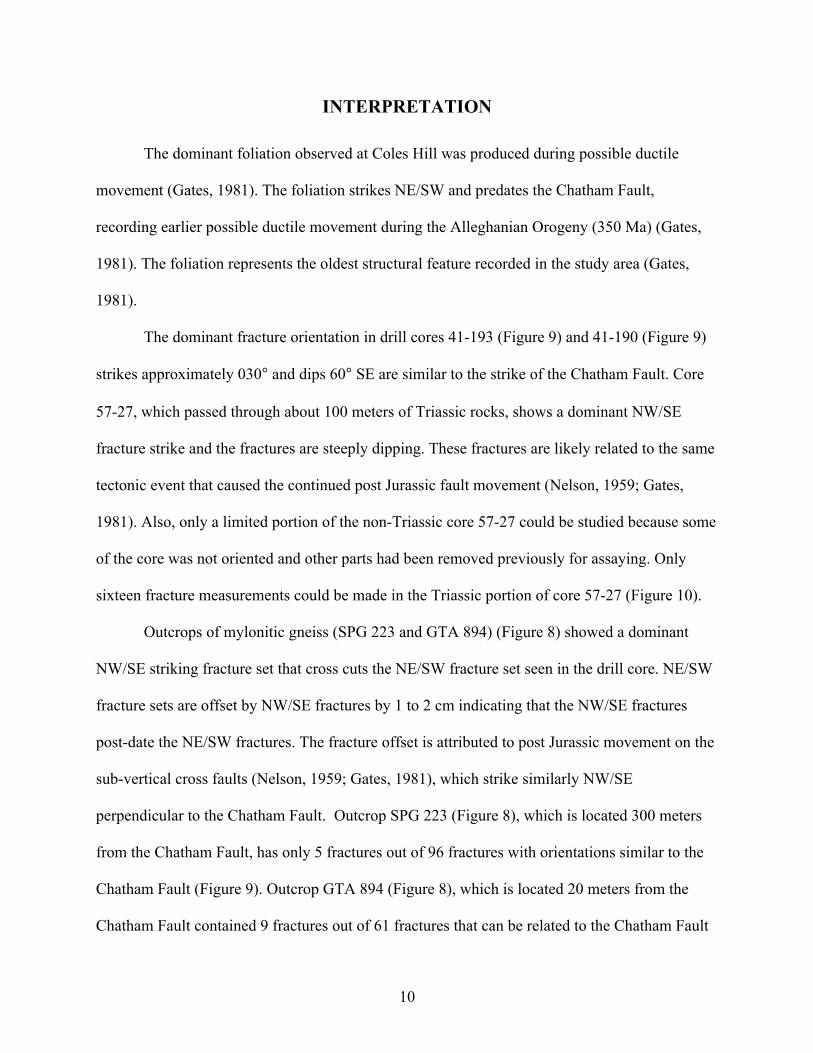
Drill core 57-27 is collared in and passes through 100 meters of Triassic sedimentary
rocks before reaching the crystalline rocks beneath the Chatham Fault. Fractures in the
crystalline rocks are oriented 070° and dip 70° SE (Figure 8). Fracture orientations in the
Triassic rocks in this drill core strike 120 - 130° and dip 60° to the SW (Figure 8) and are similar
to fracture orientation in Triassic rocks measured away from the Chatham Fault (Figure 10). A
few horizontal fractures, are also observed in this core (Figure 10). A third set of fractures in this
drill core strikes approximately E-W and is steeply dipping. The NW/SE strikes of fractures in
the Triassic are similar to the cross faults (Figure 3).
9
Outcrop SPG 223 shows a dominant NW/SE fracture orientation (Figure 8). This strike is
different from the dominant NE/SW fracture orientation observed in drill cores. Outcrop SPG
223, which is located 20 meters from a cross fault, shows a dominant fracture orientation that is
more closely related to the cross faults than to the Chatham Fault.
Outcrop GTA 894 is located near the Chatham Fault and contains 17 fractures striking
NE/SW, similar to the strike of the Chatham Fault. Outcrop GTA 894 shows a dominant NW/SE
fracture orientation (Figure 8).It is important to note that the NW/SE fractures related to basin
inversion (Schlische et al., 2002), cross cut and are later than the NE/SW fractures that
correspond to the strike of the Chatham Fault and Brookneal Shear Zone. Foliation orientations
within the two outcrops are similar and strike 040 - 050° (Figure 9). Moreover, only one foliation
strike was observed in each of these outcrops. As a result, only a few representative
measurements of foliation were obtained from each outcrop.
Fracture orientations from all three Triassic outcrops, SPG231, SPG 311 and MA 771,
have a dominant NW/SE strike (Figure 10). Outcrops SPG 231 and SPG311 also show a NE/SW
fracture pattern that resembles the trend of the Chatham Fault. The number of NE/SW fractures
decreases as the distance from the Chatham Fault increases. For example SPG 231 (Figure 10)
contains 17 fractures out of 87 (~20%) that strike 030°, whereas in outcrop SPG 311, located 2
km from the Chatham Fault, only 6 (out of 45 fractures measured (~13%) strike 030° (Figure
10). The outcrop most distant from the Chatham Fault (MA 771) contained no fractures striking
030° (Figure 10).
10
INTERPRETATION
The dominant foliation observed at Coles Hill was produced during possible ductile
movement (Gates, 1981). The foliation strikes NE/SW and predates the Chatham Fault,
recording earlier possible ductile movement during the Alleghanian Orogeny (350 Ma) (Gates,
1981). The foliation represents the oldest structural feature recorded in the study area (Gates,
1981).
The dominant fracture orientation in drill cores 41-193 (Figure 9) and 41-190 (Figure 9)
strikes approximately 030° and dips 60° SE are similar to the strike of the Chatham Fault. Core
57-27, which passed through about 100 meters of Triassic rocks, shows a dominant NW/SE
fracture strike and the fractures are steeply dipping. These fractures are likely related to the same
tectonic event that caused the continued post Jurassic fault movement (Nelson, 1959; Gates,
1981). Also, only a limited portion of the non-Triassic core 57-27 could be studied because some
of the core was not oriented and other parts had been removed previously for assaying. Only
sixteen fracture measurements could be made in the Triassic portion of core 57-27 (Figure 10).
Outcrops of mylonitic gneiss (SPG 223 and GTA 894) (Figure 8) showed a dominant
NW/SE striking fracture set that cross cuts the NE/SW fracture set seen in the drill core. NE/SW
fracture sets are offset by NW/SE fractures by 1 to 2 cm indicating that the NW/SE fractures
post-date the NE/SW fractures. The fracture offset is attributed to post Jurassic movement on the
sub-vertical cross faults (Nelson, 1959; Gates, 1981), which strike similarly NW/SE
perpendicular to the Chatham Fault. Outcrop SPG 223 (Figure 8), which is located 300 meters
from the Chatham Fault, has only 5 fractures out of 96 fractures with orientations similar to the
Chatham Fault (Figure 9). Outcrop GTA 894 (Figure 8), which is located 20 meters from the
Chatham Fault contained 9 fractures out of 61 fractures that can be related to the Chatham Fault
11
(Figure 9). It is clear that the intensity of Chatham Fault related fractures decreases with
distance from the fault.
The three outcrops in the Triassic basin, SPG 231, SPG 311 and MA 771 (Figure 10),
have a dominant NW/SE fracture set strikes approximately 120° and a less abundant 030°
striking set. Starting from outcrop SPG 231, which is closest to the Chatham Fault and moving
eastward away from the fault, the number of fractures that have a NE/SW strike decreases to
zero. We conclude that movement along the Chatham Fault continued after formation of the
Triassic basin (Henika et al., 1981). Also the NW/SE fracture set, as previously seen in the
mylonitic gneiss unit, cross cuts and post dates the NE/SW Chatham Fault related fractures,
indicating that these fractures were active in post Triassic times.
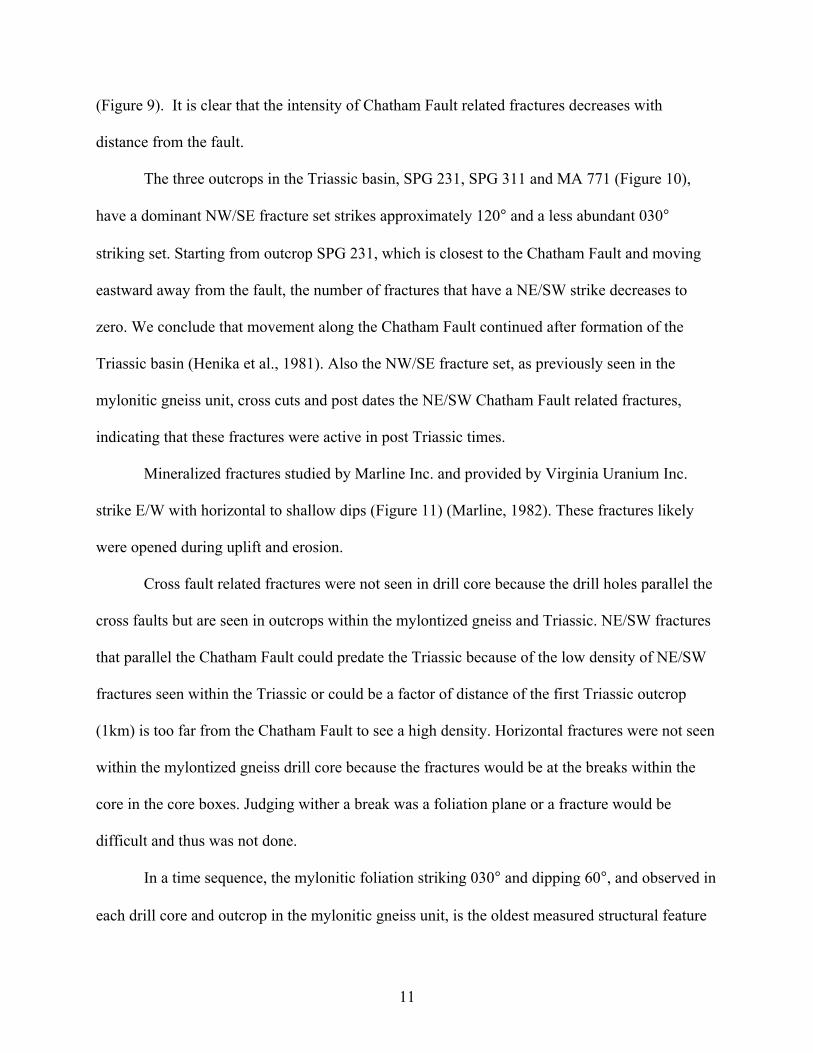
Mineralized fractures studied by Marline Inc. and provided by Virginia Uranium Inc.
strike E/W with horizontal to shallow dips (Figure 11) (Marline, 1982). These fractures likely
were opened during uplift and erosion.
Cross fault related fractures were not seen in drill core because the drill holes parallel the
cross faults but are seen in outcrops within the mylontized gneiss and Triassic. NE/SW fractures
that parallel the Chatham Fault could predate the Triassic because of the low density of NE/SW
fractures seen within the Triassic or could be a factor of distance of the first Triassic outcrop
(1km) is too far from the Chatham Fault to see a high density. Horizontal fractures were not seen
within the mylontized gneiss drill core because the fractures would be at the breaks within the
core in the core boxes. Judging wither a break was a foliation plane or a fracture would be
difficult and thus was not done.
In a time sequence, the mylonitic foliation striking 030° and dipping 60°, and observed in
each drill core and outcrop in the mylonitic gneiss unit, is the oldest measured structural feature
12
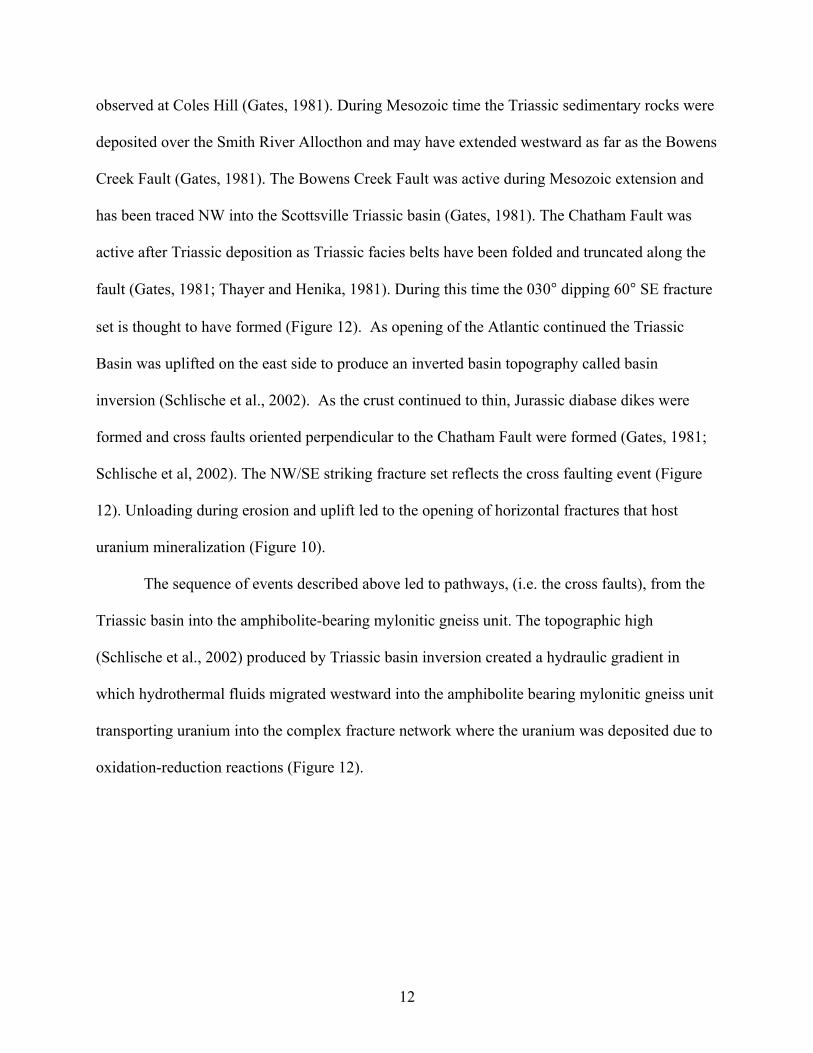
observed at Coles Hill (Gates, 1981). During Mesozoic time the Triassic sedimentary rocks were
deposited over the Smith River Allocthon and may have extended westward as far as the Bowens
Creek Fault (Gates, 1981). The Bowens Creek Fault was active during Mesozoic extension and
has been traced NW into the Scottsville Triassic basin (Gates, 1981). The Chatham Fault was
active after Triassic deposition as Triassic facies belts have been folded and truncated along the
fault (Gates, 1981; Thayer and Henika, 1981). During this time the 030° dipping 60° SE fracture
set is thought to have formed (Figure 12). As opening of the Atlantic continued the Triassic
Basin was uplifted on the east side to produce an inverted basin topography called basin
inversion (Schlische et al., 2002). As the crust continued to thin, Jurassic diabase dikes were
formed and cross faults oriented perpendicular to the Chatham Fault were formed (Gates, 1981;
Schlische et al, 2002). The NW/SE striking fracture set reflects the cross faulting event (Figure
12). Unloading during erosion and uplift led to the opening of horizontal fractures that host
uranium mineralization (Figure 10).
The sequence of events described above led to pathways, (i.e. the cross faults), from the
Triassic basin into the amphibolite-bearing mylonitic gneiss unit. The topographic high
(Schlische et al., 2002) produced by Triassic basin inversion created a hydraulic gradient in
which hydrothermal fluids migrated westward into the amphibolite bearing mylonitic gneiss unit
transporting uranium into the complex fracture network where the uranium was deposited due to
oxidation-reduction reactions (Figure 12).
13
REFERENCES CITED
Aylor, J., Beard, J., Bodnar, R., 2009. Coles Hill, Chatham, Virginia uranium deposit.
Geological Society of America Abstract. 41, 48. Baudemont, D., Fedorowich, J., 1996. Structural Control of Uranium Mineralization at
the Dominique-Peter Deposit, Saskatchewan, Canada. Economic Geology 91, 855-874. Carter, B., Hibbard, J., Tubrett, M., Sylvester, P., 2006,. Detrital zircon geochronology of
the Smith River Allochthon and the Lynchburg Group, southern Appalachians: Implications for Neoproterozoic- Early Cambrian paleogeography. Precambrian Geology, 1-26.
Conley, F., and Henika, W., 1973, Geology of the Snow Creek, Martinsville East, Price, and
Spray Quadrangles: Virginia Division of Mineral Re- sources Report of Investigations 33, 71.
Cox, S, 2005. Coupling between Deformation, Fluid Pressures, and Fluid Flow in Ore-
Producing Hydrothermal Systems at Depth in the Crust. Economic Geology 100th
Anniversary Volume, 39-75. Craw, D., 2000., Fluid flow at fault intersections in an active oblique collision zone,
Southern Alps, New Zealand. Journal of Geochemical Exploration 69-70, 523-526. Ford A., Blenkinsop T., 2008. Combining fractal analysis of mineral deposit clustering
weights of evidence to evaluate patterns of mineralization: Application to copper deposits of the Mount Isa Inlier, NW Queensland, Australia. Ore Geology Reviews 33, 435-450.
Gates, A., 1981. Geology of the western boundary of the Charlotte belt at Brookneal, Va.,
Masters Thesis, Virginia Tech. Heinrich, C., 2007. Fluid-fluid interactions in magmatic-hydrothermal ore formation.
Minearalogical Society of America 65, 363-387. Henika, W., Thayer, P.,1981, Geologic map of the Spring Garden Quadrangle,
Virginia. Virginia Division of Mineral Resources 48, scale 1:24,000. Henika, W., 2002, Geologic map of the Virginia portion of the Danville 30x60 minute
quadrangle: Virginia Division of Mineral Resources Publication 166, , scale 1:100,000. Hibbard, J., Stewart K., Henika, W., 2000. Framing the Piedmont Zone in North Carolina
and Southern Virginia. Fieldtrip Guide book for the 50th SE GSA meeting, Geological Society of America, Raliegh, 1-26.
14
Hibbard, J., Tracy, R., Henika, W., 2003. Smith River allochthon: A southern Appalachian peri-Gondwanan terrane emplaced directly on Laurentia?. Geology March, 215 – 218.
Jerden, J., 2001. Origin of uranium mineralization at Coles Hill, Virginia (USA) and its
natural attenuation within an oxidizing rock-soil-groundwater system. Ph.D. Thesis, Virginia Tech.
Jianwei, L., Meifu, Z., Xianfu, L., Zhaoren, F., Zijin, L., 2002. Structural control on
uranium mineralization South China: Implications for fluid flow in continental strike-slip faults. Science in China 45, 851-864.
Lineberger, D.,1983. Geology of the Chatham Fault Zone, Pittsylvania County, Virginia.
Masters Thesis Chapel Hill U.N.C. Marline Inc., 1982. Mineralized Fracture Study Report, Coles Hill, Pittsylvania County, Virginia. Nelson, W., 1959. Final geological report on the lower development of the Smith
Mountain Combination Hydroelectric Project Mt. Airy Dan Site on the Roanoke River, Virginia. Appalachian Power Company, October 1959.
Safonov, Y., Gorbunov, G., Pek, A., Volkov, V., Zlobina, T., Kravchenko, G.,
Malinovsky, E., 2007. Structure of ore fields and deposits: current status and outlook for further development. Geology of Ore Deposits, 5, 343-371.
Schlische, R., Withjack, M., Olsen, P., 2002. Relative Timing of CAMP, Rifting ,
Continental Breakup, and Basin Inversion: Tectonic Significance. American Geophysical Union Monograph 1-28.
Tseng, H., Burruss, R., Onstott, T., Omar, G., 1999. Paleofluid-flow circulation within a
Triassic rift basin: Evidence from oil inclusions and thermal histories, Geological Society of America Bulletin, February 1999. 275-290.
Virginia Division of Mineral Resources, 1993, Geologic Map of Virginia with expanded
explanation: Virginia Department of Mines, Minerals and Energy 1:500,000 scale, 80.
15
Figure 1. Location map of the Coles Hill uranium deposit.
16
Figure 2. Simplified geological map showing the Bowens Creek Fault (BC), Chatham Fault (CF) and major lithotectonic units in the vicinity of Coles Hill. Map modified from Virginia Division of Mineral Resources (1993) and Henika et al. (1981)
17
Figure 3. Simplified geological map in the immediate vicinity of Coles Hill showing the location of the north (N) and south (S) ore bodies. Map modified from Henika et al. (1981).
18
Figure 4. Regional geological map showing the locations of three drill holes and five outcrops. Map modified from Henika et al. (1981).
19
Figure 5. Photographs of five outcrops showing the dominant fracture strikes represented by blue (NW) and red (NE) tape. SPG 223 (N 36°51.991’ W 79°18.718’) and GTA 894 (N 36°52.333’ W 79°16.9021’) are located within the mylonitized gneiss. SPG 231 (N 36°52.322’ W 79°17.976’), SPG 311 (N 36°52.322’ W 79°16.843’) and MA 711 (N 36°52.618’ W 79°14.895’) are located within the Triassic basin. Map image copyright by Google Earth (2009), copyright Europa Technologies (2009) and copyright Commonwealth of Virginia (2009).
20
Figure 6. Photographs of 6 windows in outcrop SPG 223 in which structural features, such as fractures and foliations, were observed and measured. Each window (W1-W6) measures approximately 50 x 50 cm.
21
Figure 7. Photograph of apparatus used to correct angled drill core to a vertical position in order to obtain the correct strike and dip of fractures and foliations.
22
Figure 8. Photograph showing the location of two outcrops and three drill cores. Contour maps of poles to fracture strikes and dips are shown for drill cores 41-193, 41-190 and 57-27. Rose diagrams show fracture strikes for outcrops GTA 894 and SPG 223. Map image copyright by Google Earth (2009), copyright Europa Technologies (2009) and copyright Commonwealth of Virginia (2009).
23
Figure 9. Photograph of outcrops and drill core location. Contour maps of poles to foliation planes for drill cores 41-193 and 41-190 and rose diagrams of GTA 894 and SPG 223 are shown. Image copyright by Google Earth (2009), copyright Europa Technologies(2009) and copyright Commonwealth of Virginia (2009).
24
Figure 10. Photograph of Triassic outcrops and drill core 57-27. Contour map of poles to fracture strikes and dips of the Triassic sedimentary rocks from drill core 57-27 and rose diagrams of outcrops SPG 231, SPG 311 and MA 711 in the Danville Triassic basin are also shown. Image copyright by Google Earth (2009), copyright Europa Technologies (2009) and copyright Commonwealth of Virginia (2009).
25
Figure 11. Contour diagram of poles to strikes and dips of uranium mineralized fractures collected by Marline Inc. and provided by Virginia Uranium Inc. Image modified from Marline Inc. (1981).
26
Figure 12. Schematic block diagrams showing simplified geological relationships in the vicinity of Coles Hill during the Alleghanian Orogeny, the Jurassic and at the present time.
27
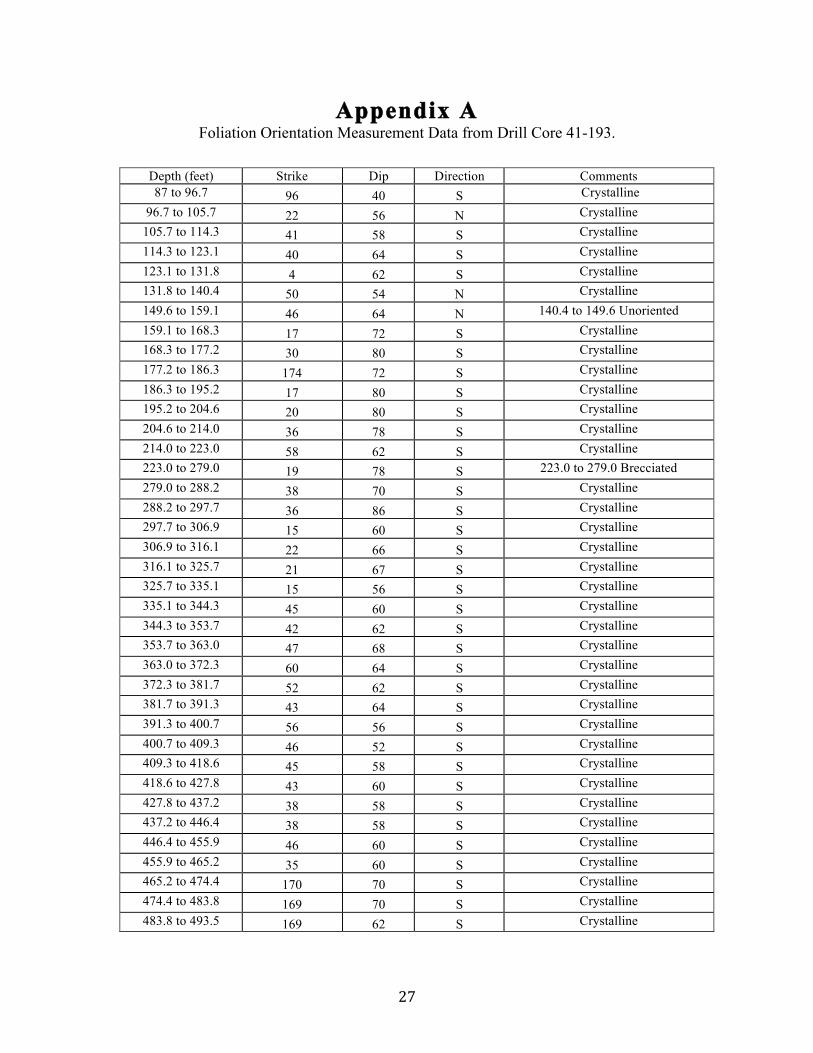
Appendix A Foliation Orientation Measurement Data from Drill Core 41-193.
Depth (feet) Strike Dip Direction Comments 87 to 96.7 96 40 S Crystalline
96.7 to 105.7 22 56 N Crystalline 105.7 to 114.3 41 58 S Crystalline 114.3 to 123.1 40 64 S Crystalline 123.1 to 131.8 4 62 S Crystalline 131.8 to 140.4 50 54 N Crystalline 149.6 to 159.1 46 64 N 140.4 to 149.6 Unoriented 159.1 to 168.3 17 72 S Crystalline 168.3 to 177.2 30 80 S Crystalline 177.2 to 186.3 174 72 S Crystalline 186.3 to 195.2 17 80 S Crystalline 195.2 to 204.6 20 80 S Crystalline 204.6 to 214.0 36 78 S Crystalline 214.0 to 223.0 58 62 S Crystalline 223.0 to 279.0 19 78 S 223.0 to 279.0 Brecciated 279.0 to 288.2 38 70 S Crystalline 288.2 to 297.7 36 86 S Crystalline 297.7 to 306.9 15 60 S Crystalline 306.9 to 316.1 22 66 S Crystalline 316.1 to 325.7 21 67 S Crystalline 325.7 to 335.1 15 56 S Crystalline 335.1 to 344.3 45 60 S Crystalline 344.3 to 353.7 42 62 S Crystalline 353.7 to 363.0 47 68 S Crystalline 363.0 to 372.3 60 64 S Crystalline 372.3 to 381.7 52 62 S Crystalline 381.7 to 391.3 43 64 S Crystalline 391.3 to 400.7 56 56 S Crystalline 400.7 to 409.3 46 52 S Crystalline 409.3 to 418.6 45 58 S Crystalline 418.6 to 427.8 43 60 S Crystalline 427.8 to 437.2 38 58 S Crystalline 437.2 to 446.4 38 58 S Crystalline 446.4 to 455.9 46 60 S Crystalline 455.9 to 465.2 35 60 S Crystalline 465.2 to 474.4 170 70 S Crystalline 474.4 to 483.8 169 70 S Crystalline 483.8 to 493.5 169 62 S Crystalline
28
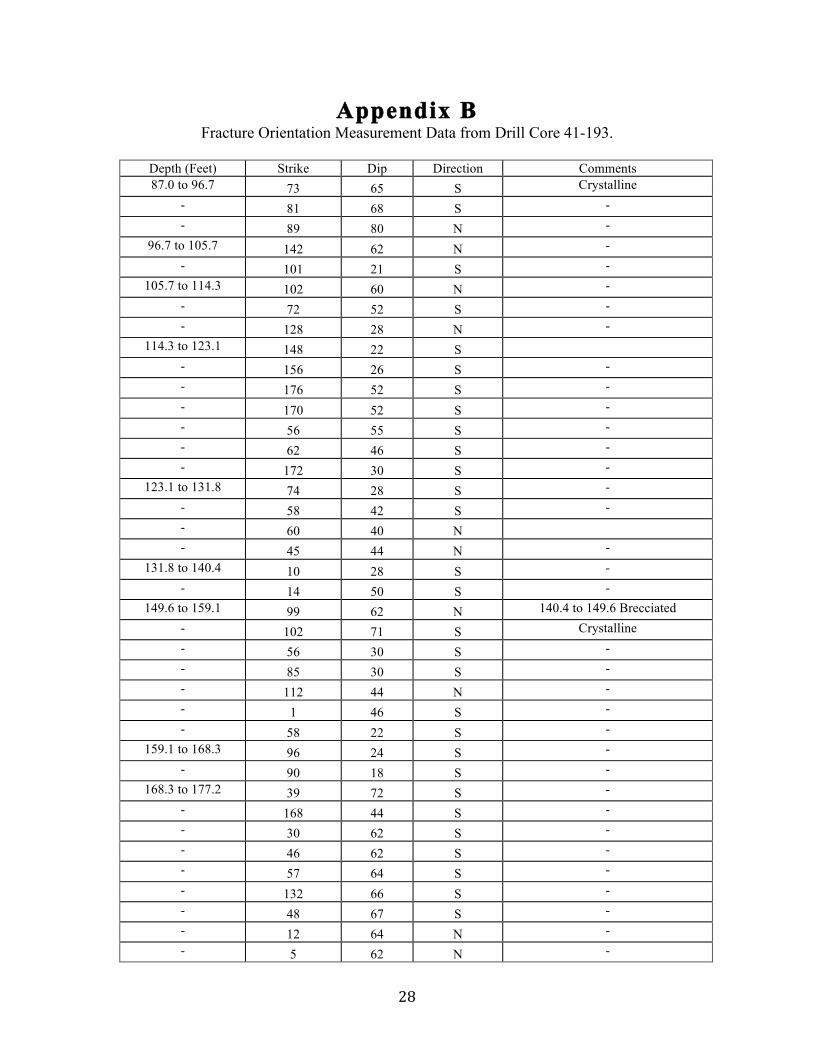
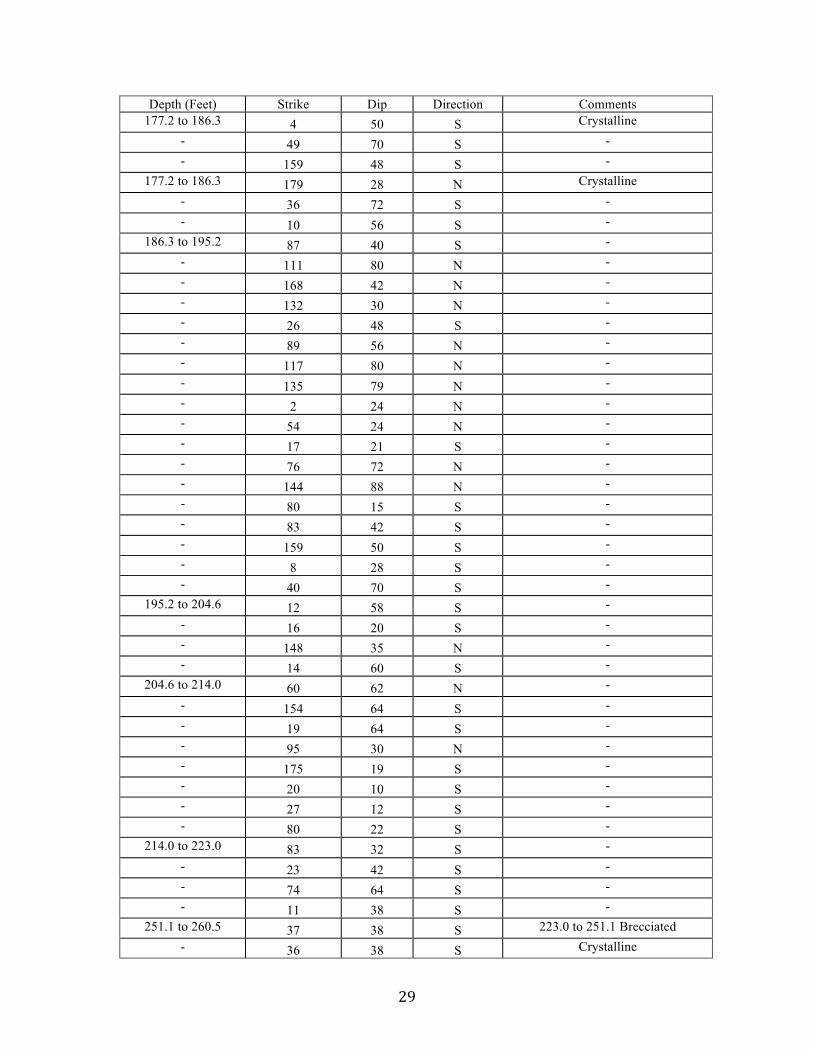
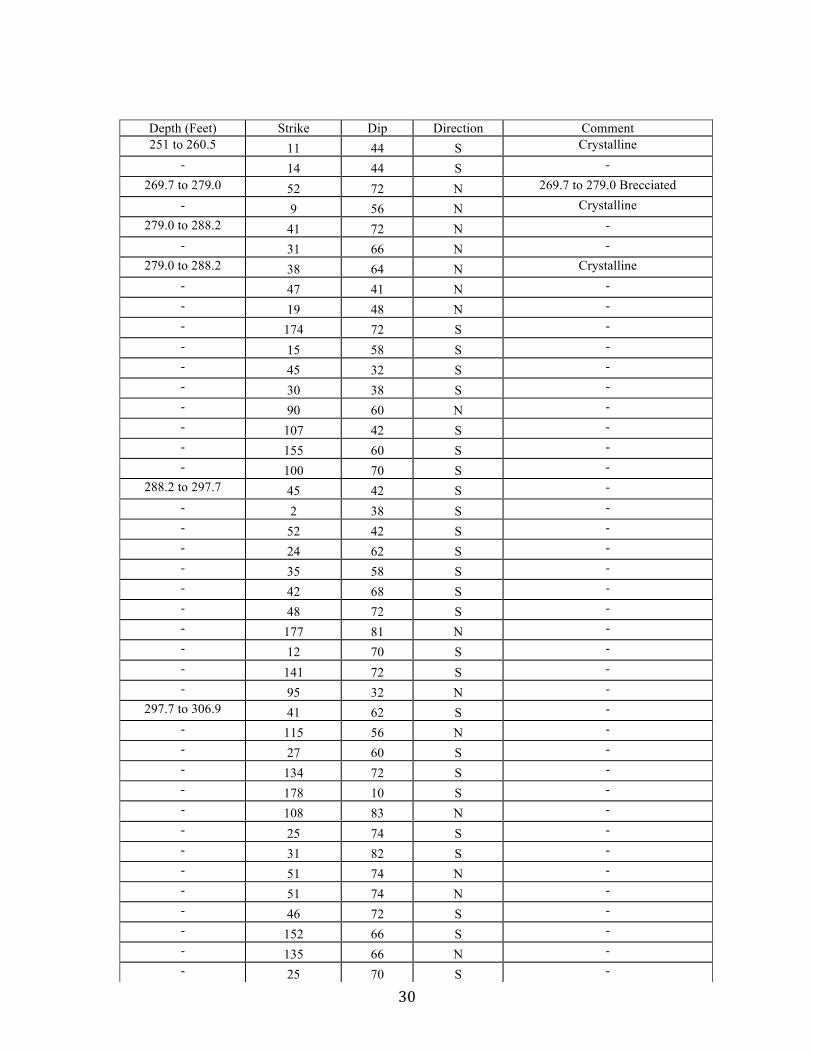
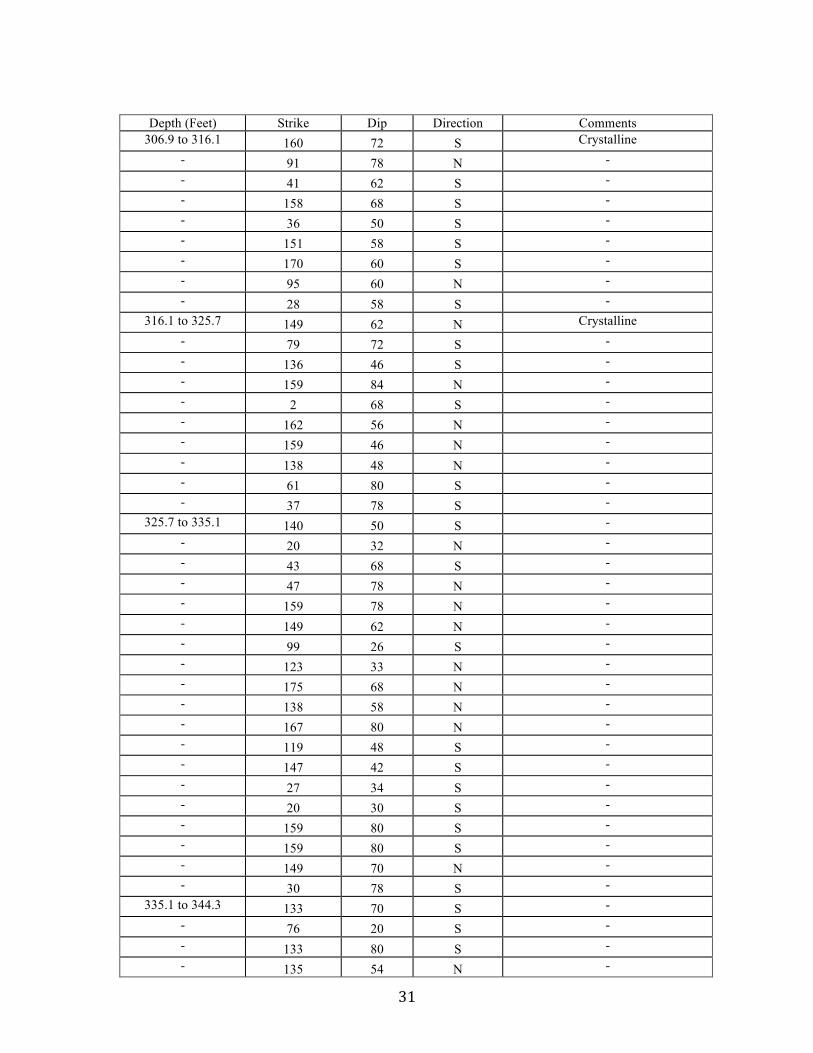
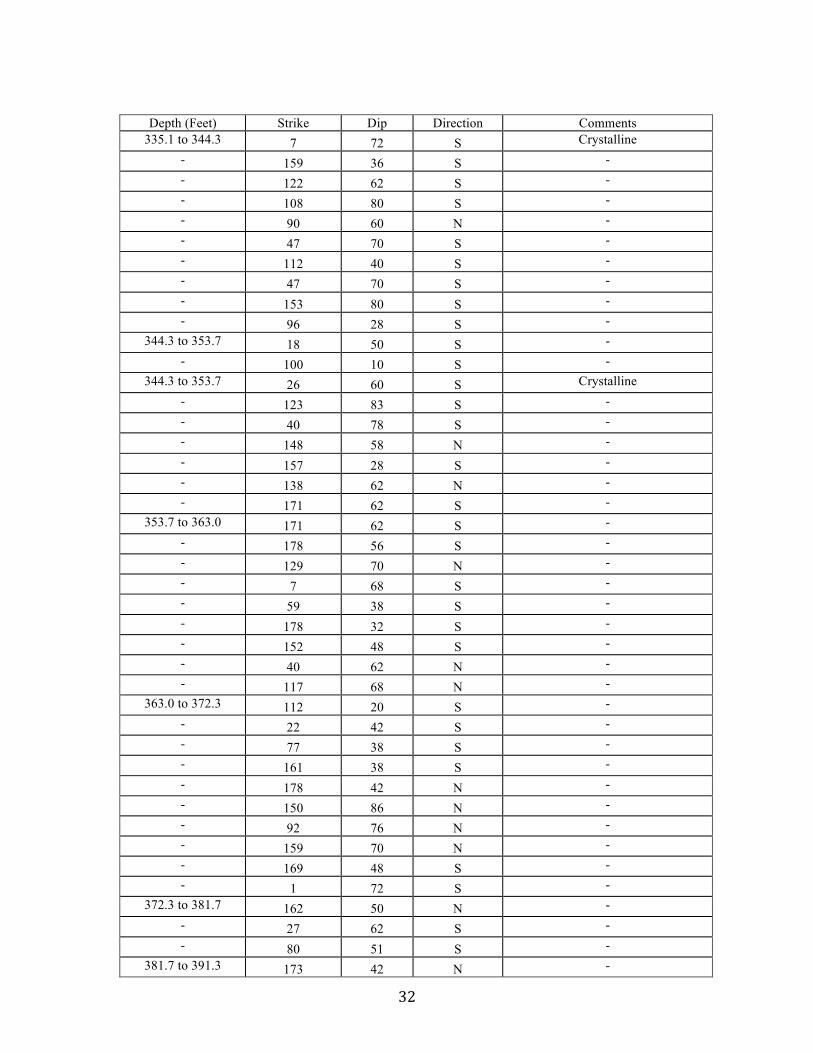
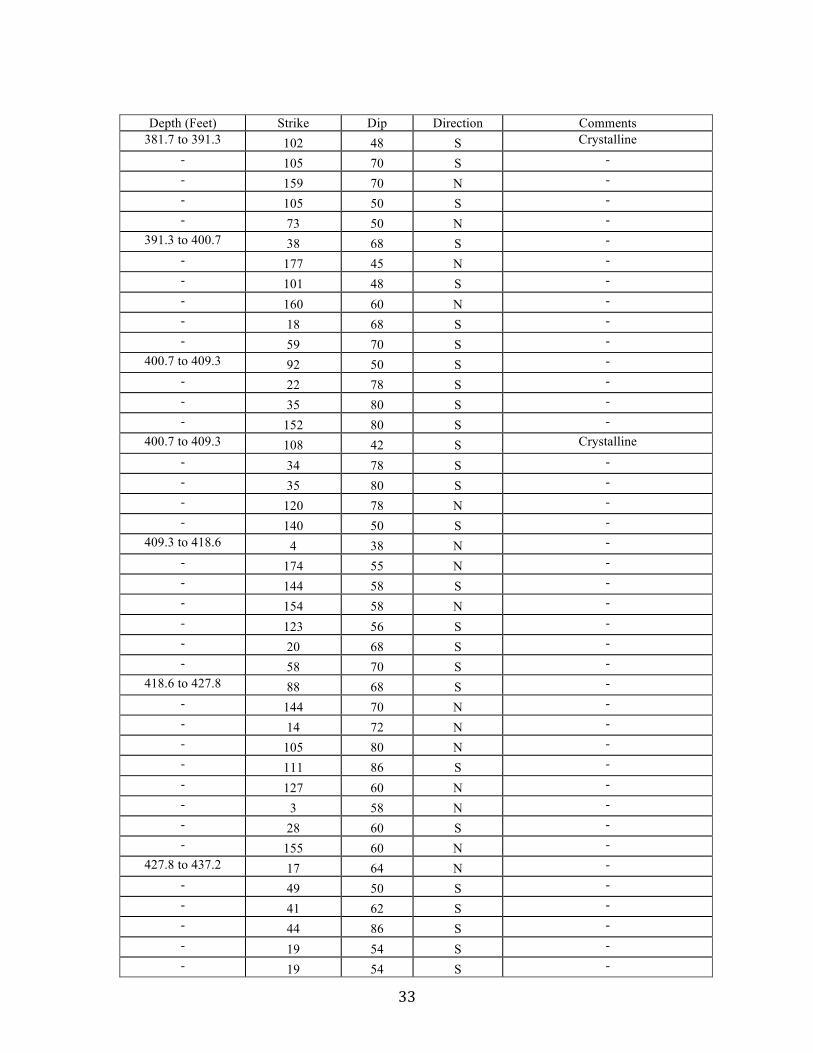
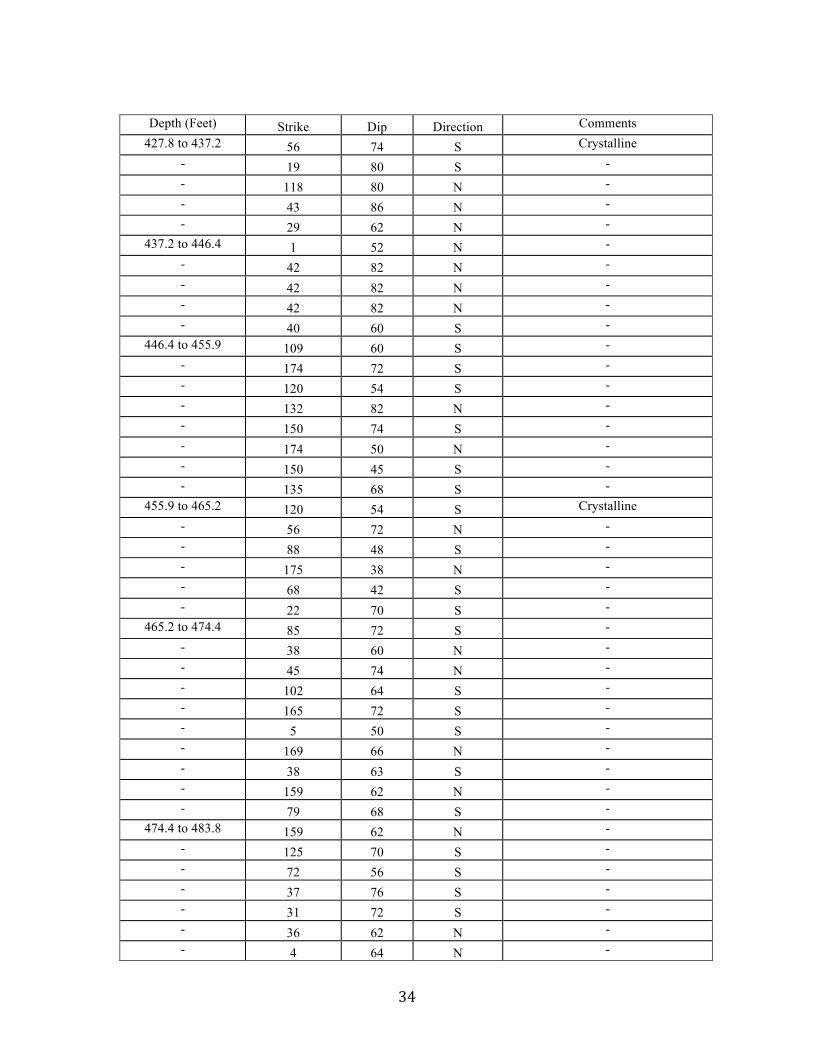
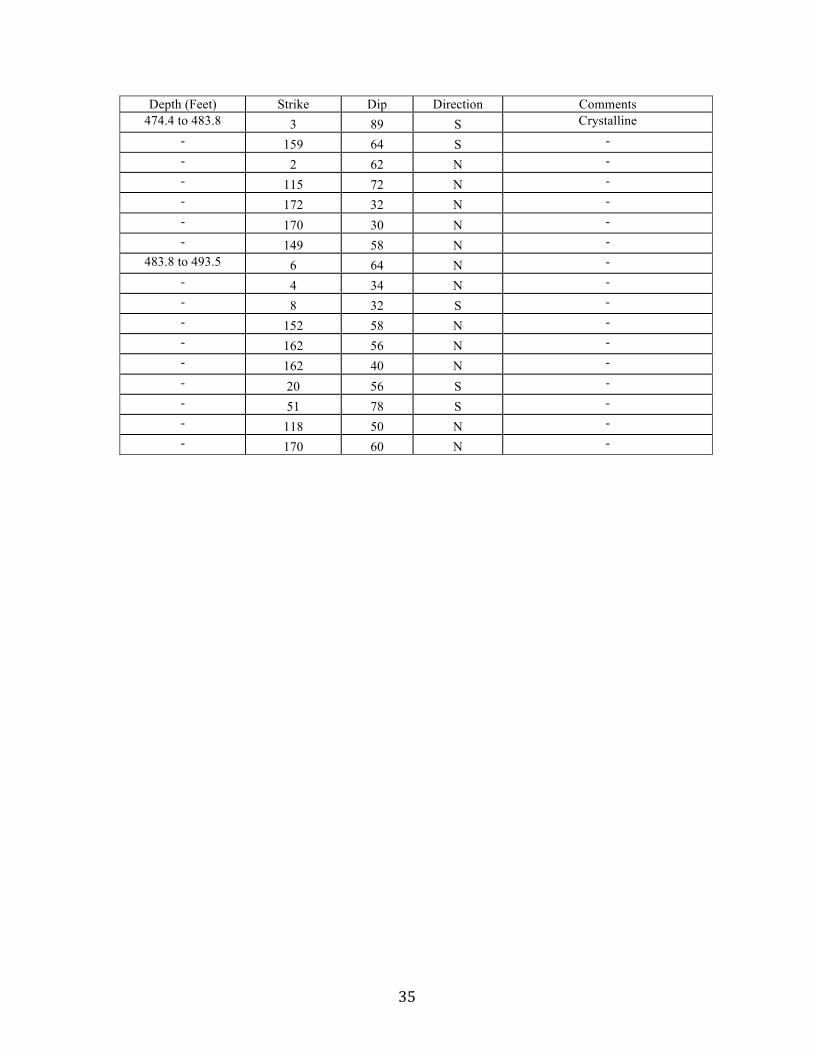
Appendix B Fracture Orientation Measurement Data from Drill Core 41-193.
Depth (Feet) Strike Dip Direction Comments 87.0 to 96.7 73 65 S Crystalline
- 81 68 S - - 89 80 N -
96.7 to 105.7 142 62 N - - 101 21 S -
105.7 to 114.3 102 60 N - - 72 52 S - - 128 28 N -
114.3 to 123.1 148 22 S - 156 26 S - - 176 52 S - - 170 52 S - - 56 55 S - - 62 46 S - - 172 30 S -
123.1 to 131.8 74 28 S - - 58 42 S - - 60 40 N - 45 44 N -
131.8 to 140.4 10 28 S - - 14 50 S -
149.6 to 159.1 99 62 N 140.4 to 149.6 Brecciated - 102 71 S Crystalline - 56 30 S - - 85 30 S - - 112 44 N - - 1 46 S - - 58 22 S -
159.1 to 168.3 96 24 S - - 90 18 S -
168.3 to 177.2 39 72 S - - 168 44 S - - 30 62 S - - 46 62 S - - 57 64 S - - 132 66 S - - 48 67 S - - 12 64 N - - 5 62 N -
29
Depth (Feet) Strike Dip Direction Comments 177.2 to 186.3 4 50 S Crystalline
- 49 70 S - - 159 48 S -
177.2 to 186.3 179 28 N Crystalline - 36 72 S - - 10 56 S -
186.3 to 195.2 87 40 S - - 111 80 N - - 168 42 N - - 132 30 N - - 26 48 S - - 89 56 N - - 117 80 N - - 135 79 N - - 2 24 N - - 54 24 N - - 17 21 S - - 76 72 N - - 144 88 N - - 80 15 S - - 83 42 S - - 159 50 S - - 8 28 S - - 40 70 S -
195.2 to 204.6 12 58 S - - 16 20 S - - 148 35 N - - 14 60 S -
204.6 to 214.0 60 62 N - - 154 64 S - - 19 64 S - - 95 30 N - - 175 19 S - - 20 10 S - - 27 12 S - - 80 22 S -
214.0 to 223.0 83 32 S - - 23 42 S - - 74 64 S - - 11 38 S -
251.1 to 260.5 37 38 S 223.0 to 251.1 Brecciated - 36 38 S Crystalline
30
Depth (Feet) Strike Dip Direction Comment 251 to 260.5 11 44 S Crystalline
- 14 44 S - 269.7 to 279.0 52 72 N 269.7 to 279.0 Brecciated
- 9 56 N Crystalline 279.0 to 288.2 41 72 N -
- 31 66 N - 279.0 to 288.2 38 64 N Crystalline
- 47 41 N - - 19 48 N - - 174 72 S - - 15 58 S - - 45 32 S - - 30 38 S - - 90 60 N - - 107 42 S - - 155 60 S - - 100 70 S -
288.2 to 297.7 45 42 S - - 2 38 S - - 52 42 S - - 24 62 S - - 35 58 S - - 42 68 S - - 48 72 S - - 177 81 N - - 12 70 S - - 141 72 S - - 95 32 N -
297.7 to 306.9 41 62 S - - 115 56 N - - 27 60 S - - 134 72 S - - 178 10 S - - 108 83 N - - 25 74 S - - 31 82 S - - 51 74 N - - 51 74 N - - 46 72 S - - 152 66 S - - 135 66 N - - 25 70 S -
31
Depth (Feet) Strike Dip Direction Comments
306.9 to 316.1 160 72 S Crystalline - 91 78 N - - 41 62 S - - 158 68 S - - 36 50 S - - 151 58 S - - 170 60 S - - 95 60 N - - 28 58 S -
316.1 to 325.7 149 62 N Crystalline - 79 72 S - - 136 46 S - - 159 84 N - - 2 68 S - - 162 56 N - - 159 46 N - - 138 48 N - - 61 80 S - - 37 78 S -
325.7 to 335.1 140 50 S - - 20 32 N - - 43 68 S - - 47 78 N - - 159 78 N - - 149 62 N - - 99 26 S - - 123 33 N - - 175 68 N - - 138 58 N - - 167 80 N - - 119 48 S - - 147 42 S - - 27 34 S - - 20 30 S - - 159 80 S - - 159 80 S - - 149 70 N - - 30 78 S -
335.1 to 344.3 133 70 S - - 76 20 S - - 133 80 S - - 135 54 N -
32
Depth (Feet) Strike Dip Direction Comments
335.1 to 344.3 7 72 S Crystalline - 159 36 S - - 122 62 S - - 108 80 S - - 90 60 N - - 47 70 S - - 112 40 S - - 47 70 S - - 153 80 S - - 96 28 S -
344.3 to 353.7 18 50 S - - 100 10 S -
344.3 to 353.7 26 60 S Crystalline - 123 83 S - - 40 78 S - - 148 58 N - - 157 28 S - - 138 62 N - - 171 62 S -
353.7 to 363.0 171 62 S - - 178 56 S - - 129 70 N - - 7 68 S - - 59 38 S - - 178 32 S - - 152 48 S - - 40 62 N - - 117 68 N -
363.0 to 372.3 112 20 S - - 22 42 S - - 77 38 S - - 161 38 S - - 178 42 N - - 150 86 N - - 92 76 N - - 159 70 N - - 169 48 S - - 1 72 S -
372.3 to 381.7 162 50 N - - 27 62 S - - 80 51 S -
381.7 to 391.3 173 42 N -
33
Depth (Feet) Strike Dip Direction Comments
381.7 to 391.3 102 48 S Crystalline - 105 70 S - - 159 70 N - - 105 50 S - - 73 50 N -
391.3 to 400.7 38 68 S - - 177 45 N - - 101 48 S - - 160 60 N - - 18 68 S - - 59 70 S -
400.7 to 409.3 92 50 S - - 22 78 S - - 35 80 S - - 152 80 S -
400.7 to 409.3 108 42 S Crystalline - 34 78 S - - 35 80 S - - 120 78 N - - 140 50 S -
409.3 to 418.6 4 38 N - - 174 55 N - - 144 58 S - - 154 58 N - - 123 56 S - - 20 68 S - - 58 70 S -
418.6 to 427.8 88 68 S - - 144 70 N - - 14 72 N - - 105 80 N - - 111 86 S - - 127 60 N - - 3 58 N - - 28 60 S - - 155 60 N -
427.8 to 437.2 17 64 N - - 49 50 S - - 41 62 S - - 44 86 S - - 19 54 S - - 19 54 S -
34
Depth (Feet) Strike Dip Direction Comments
427.8 to 437.2 56 74 S Crystalline - 19 80 S - - 118 80 N - - 43 86 N - - 29 62 N -
437.2 to 446.4 1 52 N - - 42 82 N - - 42 82 N - - 42 82 N - - 40 60 S -
446.4 to 455.9 109 60 S - - 174 72 S - - 120 54 S - - 132 82 N - - 150 74 S - - 174 50 N - - 150 45 S - - 135 68 S -
455.9 to 465.2 120 54 S Crystalline - 56 72 N - - 88 48 S - - 175 38 N - - 68 42 S - - 22 70 S -
465.2 to 474.4 85 72 S - - 38 60 N - - 45 74 N - - 102 64 S - - 165 72 S - - 5 50 S - - 169 66 N - - 38 63 S - - 159 62 N - - 79 68 S -
474.4 to 483.8 159 62 N - - 125 70 S - - 72 56 S - - 37 76 S - - 31 72 S - - 36 62 N - - 4 64 N -
35
Depth (Feet) Strike Dip Direction Comments 474.4 to 483.8 3 89 S Crystalline
- 159 64 S - - 2 62 N - - 115 72 N - - 172 32 N - - 170 30 N - - 149 58 N -
483.8 to 493.5 6 64 N - - 4 34 N - - 8 32 S - - 152 58 N - - 162 56 N - - 162 40 N - - 20 56 S - - 51 78 S - - 118 50 N - - 170 60 N -
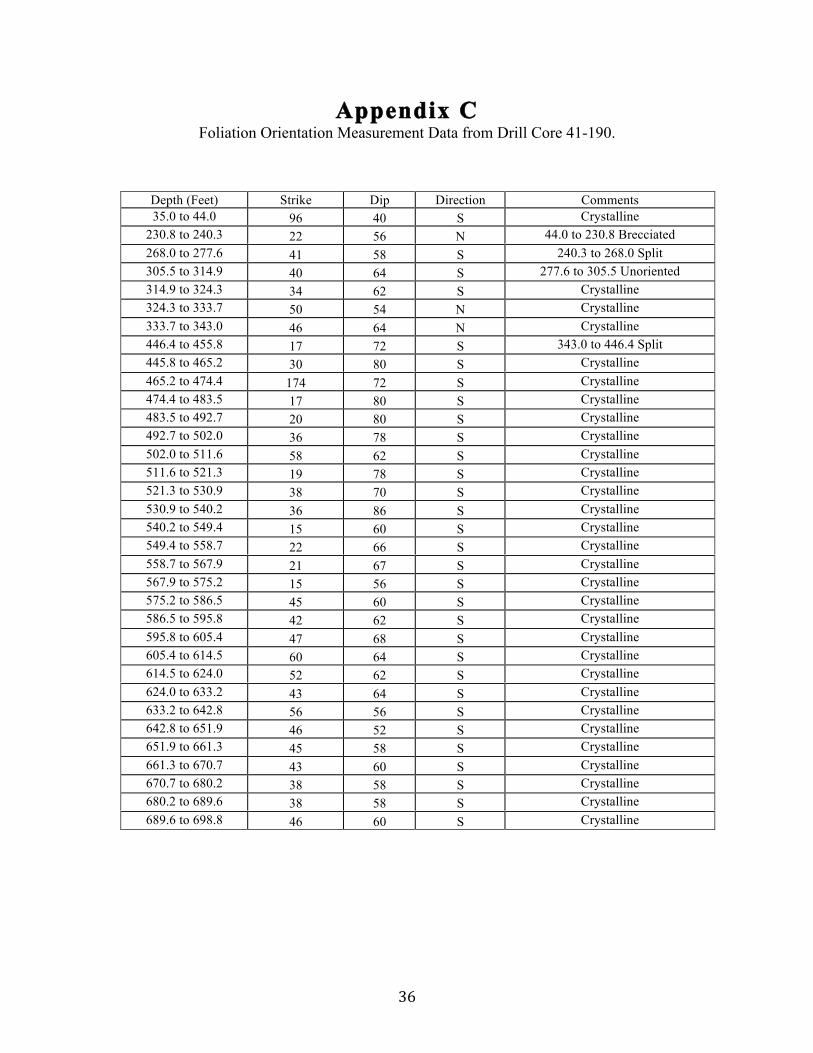
36
Appendix C Foliation Orientation Measurement Data from Drill Core 41-190.
Depth (Feet) Strike Dip Direction Comments 35.0 to 44.0 96 40 S Crystalline
230.8 to 240.3 22 56 N 44.0 to 230.8 Brecciated 268.0 to 277.6 41 58 S 240.3 to 268.0 Split 305.5 to 314.9 40 64 S 277.6 to 305.5 Unoriented 314.9 to 324.3 34 62 S Crystalline 324.3 to 333.7 50 54 N Crystalline 333.7 to 343.0 46 64 N Crystalline 446.4 to 455.8 17 72 S 343.0 to 446.4 Split 445.8 to 465.2 30 80 S Crystalline 465.2 to 474.4 174 72 S Crystalline 474.4 to 483.5 17 80 S Crystalline 483.5 to 492.7 20 80 S Crystalline 492.7 to 502.0 36 78 S Crystalline 502.0 to 511.6 58 62 S Crystalline 511.6 to 521.3 19 78 S Crystalline 521.3 to 530.9 38 70 S Crystalline 530.9 to 540.2 36 86 S Crystalline 540.2 to 549.4 15 60 S Crystalline 549.4 to 558.7 22 66 S Crystalline 558.7 to 567.9 21 67 S Crystalline 567.9 to 575.2 15 56 S Crystalline 575.2 to 586.5 45 60 S Crystalline 586.5 to 595.8 42 62 S Crystalline 595.8 to 605.4 47 68 S Crystalline 605.4 to 614.5 60 64 S Crystalline 614.5 to 624.0 52 62 S Crystalline 624.0 to 633.2 43 64 S Crystalline 633.2 to 642.8 56 56 S Crystalline 642.8 to 651.9 46 52 S Crystalline 651.9 to 661.3 45 58 S Crystalline 661.3 to 670.7 43 60 S Crystalline 670.7 to 680.2 38 58 S Crystalline 680.2 to 689.6 38 58 S Crystalline 689.6 to 698.8 46 60 S Crystalline
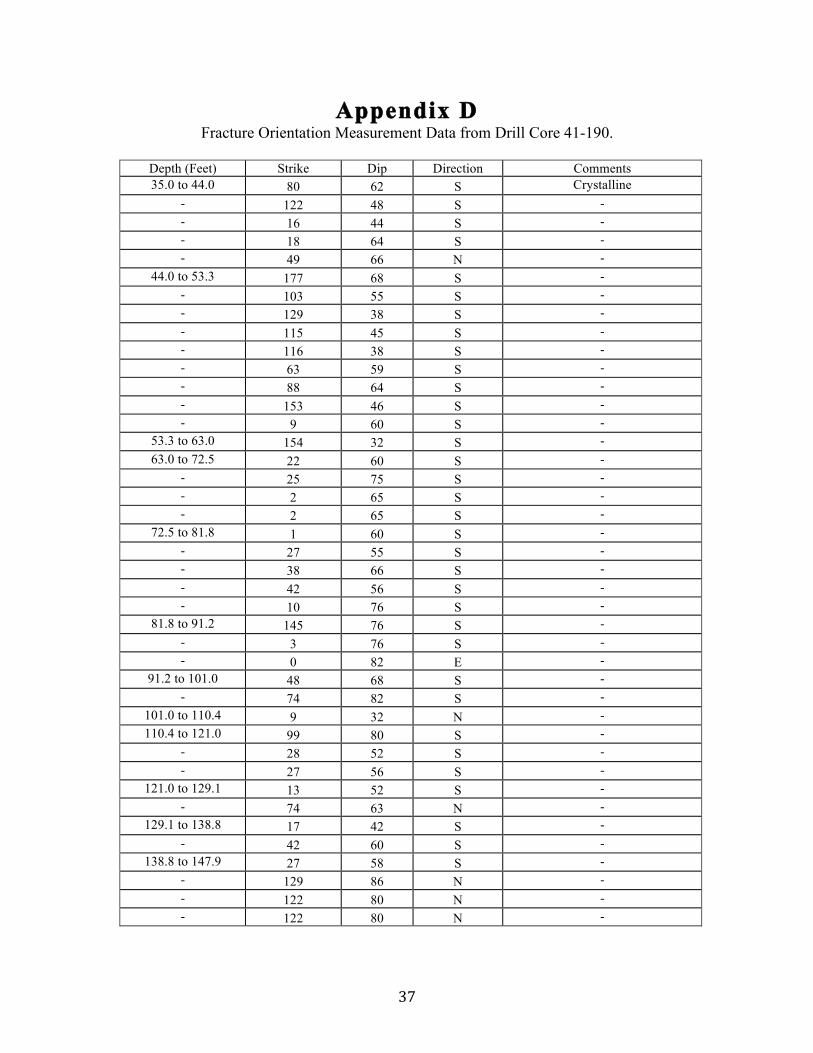
37
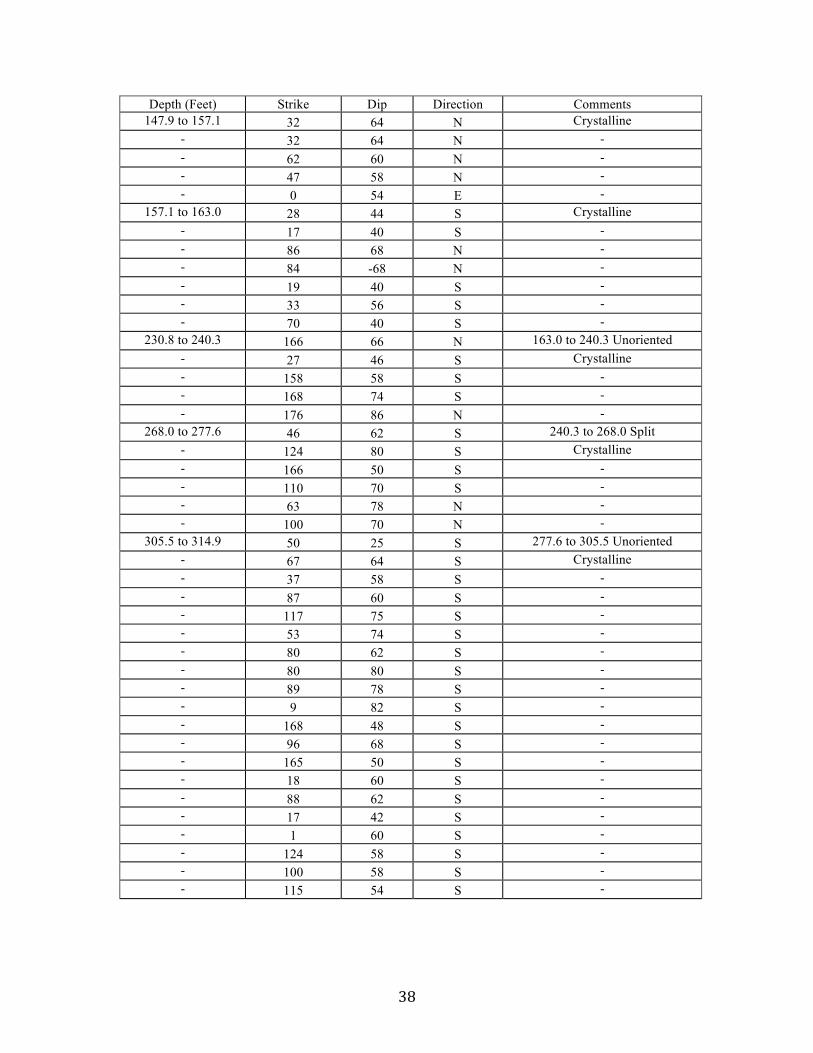
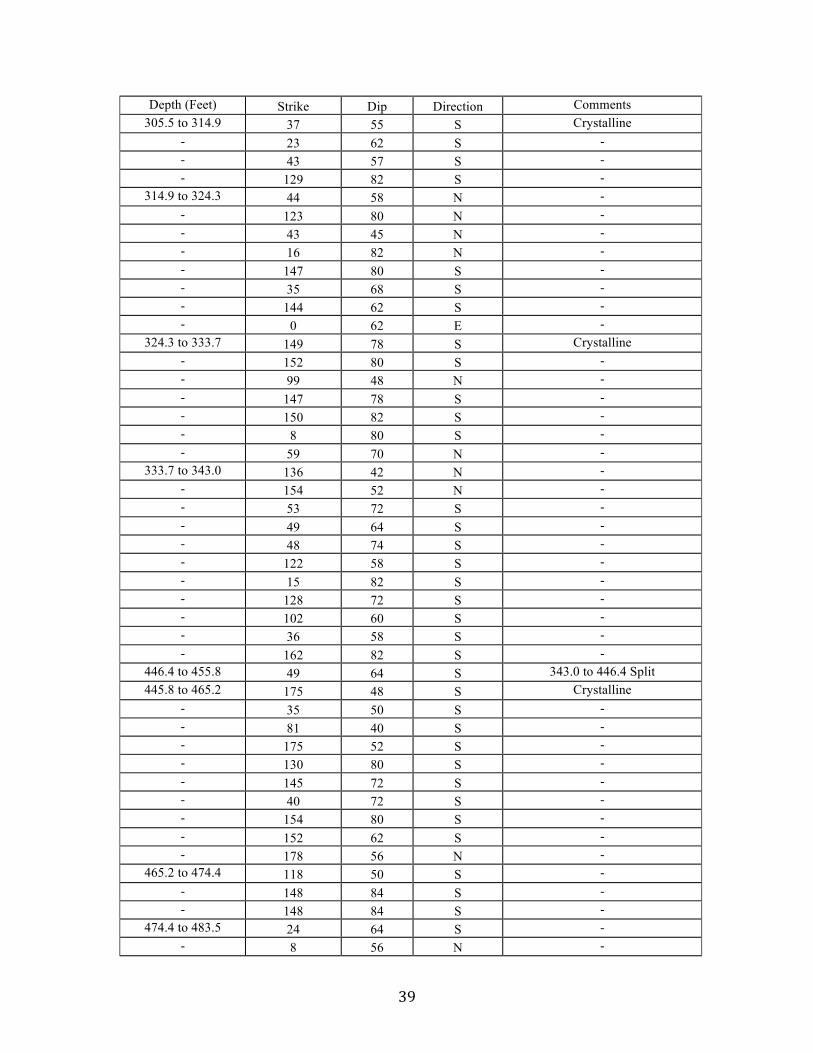
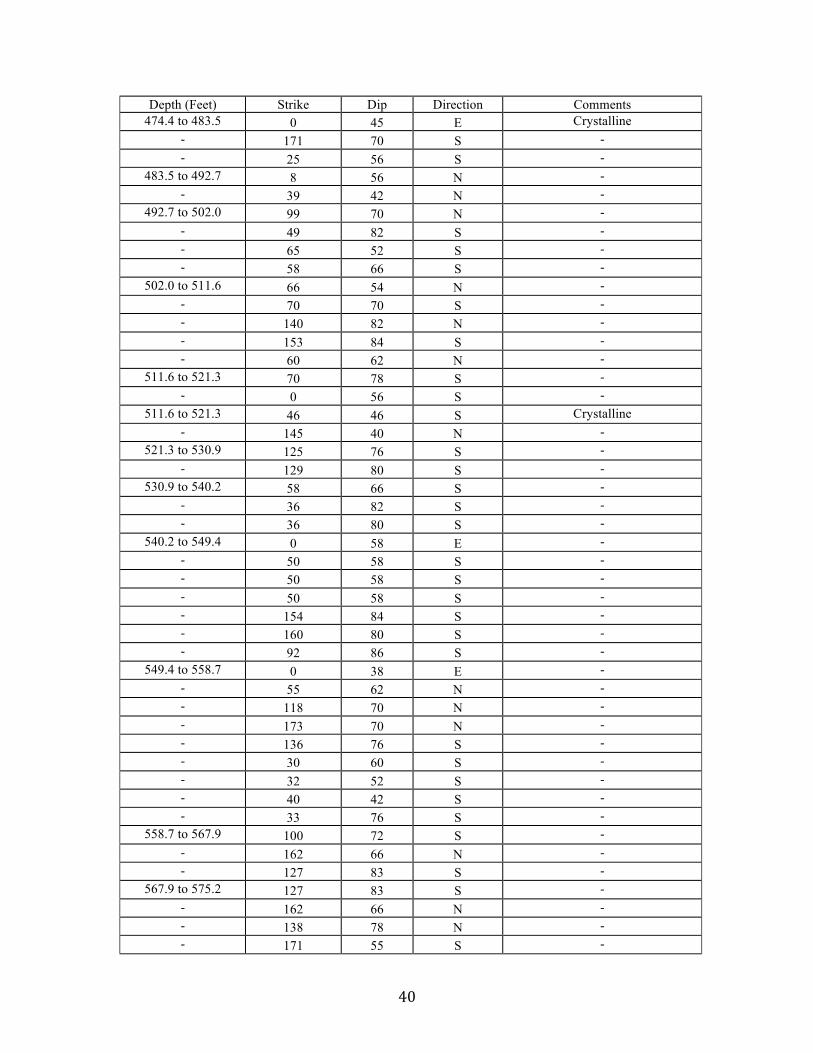
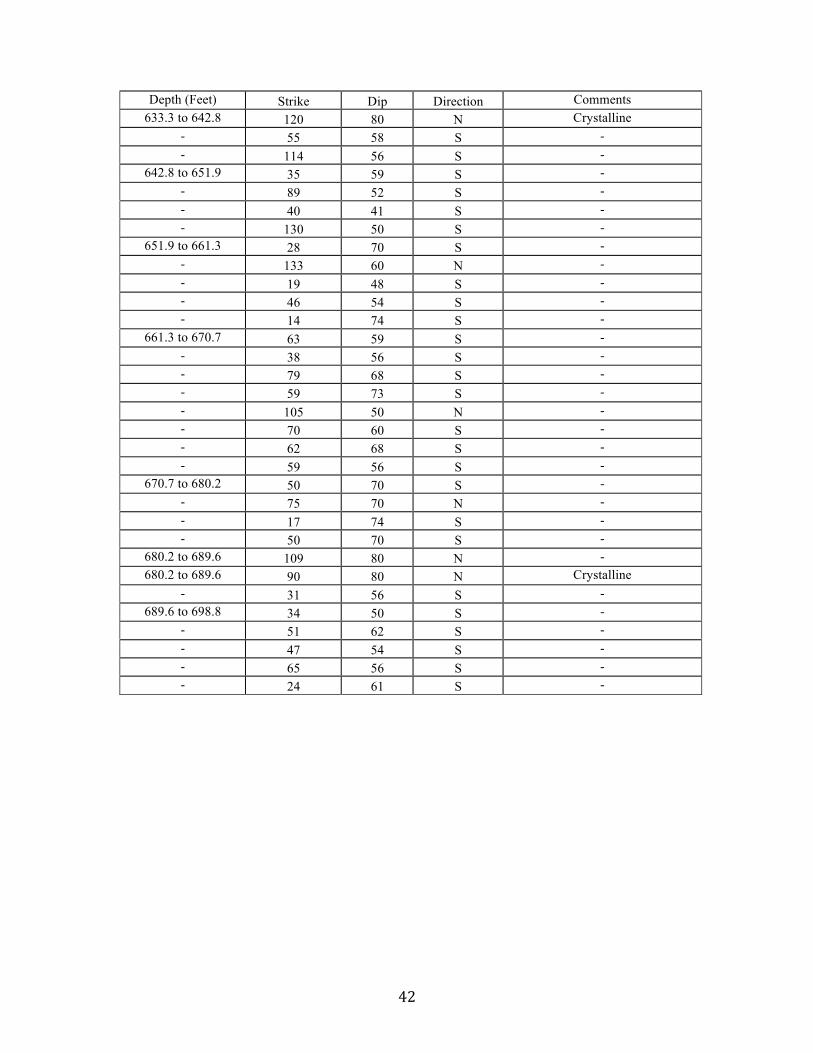
Appendix D Fracture Orientation Measurement Data from Drill Core 41-190.
Depth (Feet) Strike Dip Direction Comments 35.0 to 44.0 80 62 S Crystalline
- 122 48 S - - 16 44 S - - 18 64 S - - 49 66 N -
44.0 to 53.3 177 68 S - - 103 55 S - - 129 38 S - - 115 45 S - - 116 38 S - - 63 59 S - - 88 64 S - - 153 46 S - - 9 60 S -
53.3 to 63.0 154 32 S - 63.0 to 72.5 22 60 S -
- 25 75 S - - 2 65 S - - 2 65 S -
72.5 to 81.8 1 60 S - - 27 55 S - - 38 66 S - - 42 56 S - - 10 76 S -
81.8 to 91.2 145 76 S - - 3 76 S - - 0 82 E -
91.2 to 101.0 48 68 S - - 74 82 S -
101.0 to 110.4 9 32 N - 110.4 to 121.0 99 80 S -
- 28 52 S - - 27 56 S -
121.0 to 129.1 13 52 S - - 74 63 N -
129.1 to 138.8 17 42 S - - 42 60 S -
138.8 to 147.9 27 58 S - - 129 86 N - - 122 80 N - - 122 80 N -
38
Depth (Feet) Strike Dip Direction Comments 147.9 to 157.1 32 64 N Crystalline
- 32 64 N - - 62 60 N - - 47 58 N - - 0 54 E -
157.1 to 163.0 28 44 S Crystalline - 17 40 S - - 86 68 N - - 84 -68 N - - 19 40 S - - 33 56 S - - 70 40 S -
230.8 to 240.3 166 66 N 163.0 to 240.3 Unoriented - 27 46 S Crystalline - 158 58 S - - 168 74 S - - 176 86 N -
268.0 to 277.6 46 62 S 240.3 to 268.0 Split - 124 80 S Crystalline - 166 50 S - - 110 70 S - - 63 78 N - - 100 70 N -
305.5 to 314.9 50 25 S 277.6 to 305.5 Unoriented - 67 64 S Crystalline - 37 58 S - - 87 60 S - - 117 75 S - - 53 74 S - - 80 62 S - - 80 80 S - - 89 78 S - - 9 82 S - - 168 48 S - - 96 68 S - - 165 50 S - - 18 60 S - - 88 62 S - - 17 42 S - - 1 60 S - - 124 58 S - - 100 58 S - - 115 54 S -
39
Depth (Feet) Strike Dip Direction Comments 305.5 to 314.9 37 55 S Crystalline
- 23 62 S - - 43 57 S - - 129 82 S -
314.9 to 324.3 44 58 N - - 123 80 N - - 43 45 N - - 16 82 N - - 147 80 S - - 35 68 S - - 144 62 S - - 0 62 E -
324.3 to 333.7 149 78 S Crystalline - 152 80 S - - 99 48 N - - 147 78 S - - 150 82 S - - 8 80 S - - 59 70 N -
333.7 to 343.0 136 42 N - - 154 52 N - - 53 72 S - - 49 64 S - - 48 74 S - - 122 58 S - - 15 82 S - - 128 72 S - - 102 60 S - - 36 58 S - - 162 82 S -
446.4 to 455.8 49 64 S 343.0 to 446.4 Split 445.8 to 465.2 175 48 S Crystalline
- 35 50 S - - 81 40 S - - 175 52 S - - 130 80 S - - 145 72 S - - 40 72 S - - 154 80 S - - 152 62 S - - 178 56 N -
465.2 to 474.4 118 50 S - - 148 84 S - - 148 84 S -
474.4 to 483.5 24 64 S - - 8 56 N -
40
Depth (Feet) Strike Dip Direction Comments 474.4 to 483.5 0 45 E Crystalline
- 171 70 S - - 25 56 S -
483.5 to 492.7 8 56 N - - 39 42 N -
492.7 to 502.0 99 70 N - - 49 82 S - - 65 52 S - - 58 66 S -
502.0 to 511.6 66 54 N - - 70 70 S - - 140 82 N - - 153 84 S - - 60 62 N -
511.6 to 521.3 70 78 S - - 0 56 S -
511.6 to 521.3 46 46 S Crystalline - 145 40 N -
521.3 to 530.9 125 76 S - - 129 80 S -
530.9 to 540.2 58 66 S - - 36 82 S - - 36 80 S -
540.2 to 549.4 0 58 E - - 50 58 S - - 50 58 S - - 50 58 S - - 154 84 S - - 160 80 S - - 92 86 S -
549.4 to 558.7 0 38 E - - 55 62 N - - 118 70 N - - 173 70 N - - 136 76 S - - 30 60 S - - 32 52 S - - 40 42 S - - 33 76 S -
558.7 to 567.9 100 72 S - - 162 66 N - - 127 83 S -
567.9 to 575.2 127 83 S - - 162 66 N - - 138 78 N - - 171 55 S -

41
Depth (Feet) Strike Dip Direction Comments 567.9 to 575.2 38 66 S Crystalline
- 136 82 S - - 36 80 S - - 57 78 S - - 47 76 S -
575.2 to 586.5 40 70 S - - 0 26 E - - 116 62 S - - 131 18 S -
586.5 to 595.8 34 90 S - - 65 62 S - - 39 64 S - - 62 63 S - - 154 50 S - - 36 66 S - - 58 78 N - - 30 68 S - - 47 60 S -
595.8 to 605.4 32 62 S - - 81 58 S -
595.8 to 605.4 50 68 S Crystalline - 44 60 S -
605.4 to 614.5 62 72 S - - 62 72 S - - 62 72 S - - 30 50 S - - 66 68 S - 66 68 N - - 147 78 N - - 46 78 S -
614.5 to 634.0 77 76 S - - 56 66 S - - 39 60 S - - 105 60 S - - 39 58 S - - 59 50 N - - 46 55 N - - 46 55 N -
624.0 to 633.2 32 70 S - - 113 66 S - - 57 54 S - - 28 74 S - - 110 42 S - - 53 58 S -
633.2 to 642.8 42 54 S -
42
Depth (Feet) Strike Dip Direction Comments 633.3 to 642.8 120 80 N Crystalline
- 55 58 S - - 114 56 S -
642.8 to 651.9 35 59 S - - 89 52 S - - 40 41 S - - 130 50 S -
651.9 to 661.3 28 70 S - - 133 60 N - - 19 48 S - - 46 54 S - - 14 74 S -
661.3 to 670.7 63 59 S - - 38 56 S - - 79 68 S - - 59 73 S - - 105 50 N - - 70 60 S - - 62 68 S - - 59 56 S -
670.7 to 680.2 50 70 S - - 75 70 N - - 17 74 S - - 50 70 S -
680.2 to 689.6 109 80 N - 680.2 to 689.6 90 80 N Crystalline
- 31 56 S - 689.6 to 698.8 34 50 S -
- 51 62 S - - 47 54 S - - 65 56 S - - 24 61 S -
43
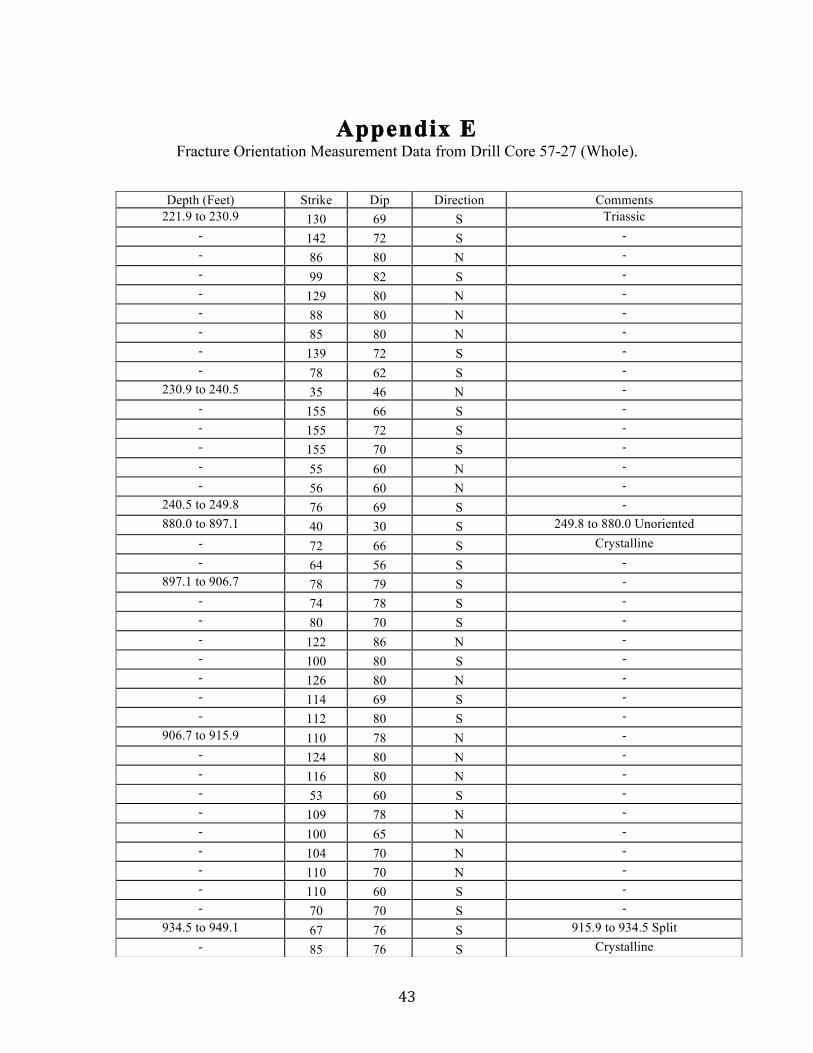
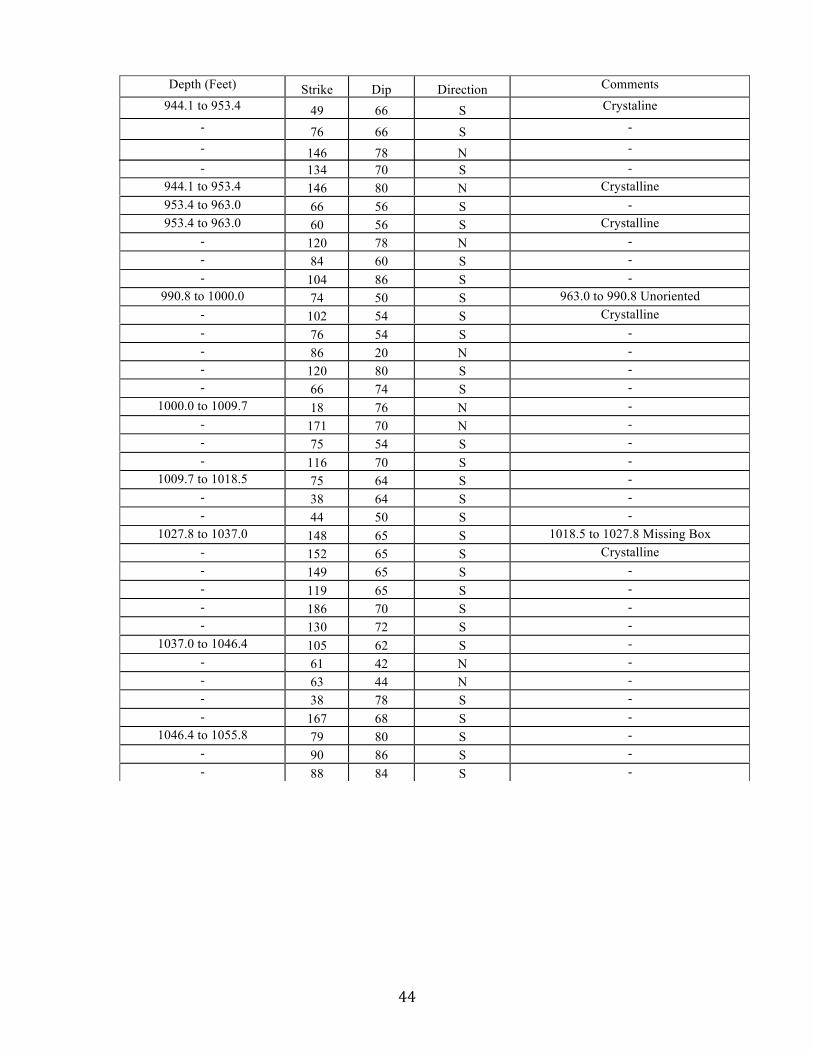
Appendix E
Fracture Orientation Measurement Data from Drill Core 57-27 (Whole).
Depth (Feet) Strike Dip Direction Comments 221.9 to 230.9 130 69 S Triassic
- 142 72 S - - 86 80 N - - 99 82 S - - 129 80 N - - 88 80 N - - 85 80 N - - 139 72 S - - 78 62 S -
230.9 to 240.5 35 46 N - - 155 66 S - - 155 72 S - - 155 70 S - - 55 60 N - - 56 60 N -
240.5 to 249.8 76 69 S - 880.0 to 897.1 40 30 S 249.8 to 880.0 Unoriented
- 72 66 S Crystalline - 64 56 S -
897.1 to 906.7 78 79 S - - 74 78 S - - 80 70 S - - 122 86 N - - 100 80 S - - 126 80 N - - 114 69 S - - 112 80 S -
906.7 to 915.9 110 78 N - - 124 80 N - - 116 80 N - - 53 60 S - - 109 78 N - - 100 65 N - - 104 70 N - - 110 70 N - - 110 60 S - - 70 70 S -
934.5 to 949.1 67 76 S 915.9 to 934.5 Split - 85 76 S Crystalline
44
- 134 70 S - 944.1 to 953.4 146 80 N Crystalline 953.4 to 963.0 66 56 S - 953.4 to 963.0 60 56 S Crystalline
- 120 78 N - - 84 60 S - - 104 86 S -
990.8 to 1000.0 74 50 S 963.0 to 990.8 Unoriented - 102 54 S Crystalline - 76 54 S - - 86 20 N - - 120 80 S - - 66 74 S -
1000.0 to 1009.7 18 76 N - - 171 70 N - - 75 54 S - - 116 70 S -
1009.7 to 1018.5 75 64 S - - 38 64 S - - 44 50 S -
1027.8 to 1037.0 148 65 S 1018.5 to 1027.8 Missing Box - 152 65 S Crystalline - 149 65 S - - 119 65 S - - 186 70 S - - 130 72 S -
1037.0 to 1046.4 105 62 S - - 61 42 N - - 63 44 N - - 38 78 S - - 167 68 S -
1046.4 to 1055.8 79 80 S - - 90 86 S - - 88 84 S -
Depth (Feet) Strike Dip Direction Comments 944.1 to 953.4 49 66 S Crystaline
- 76 66 S - - 146 78 N -
45
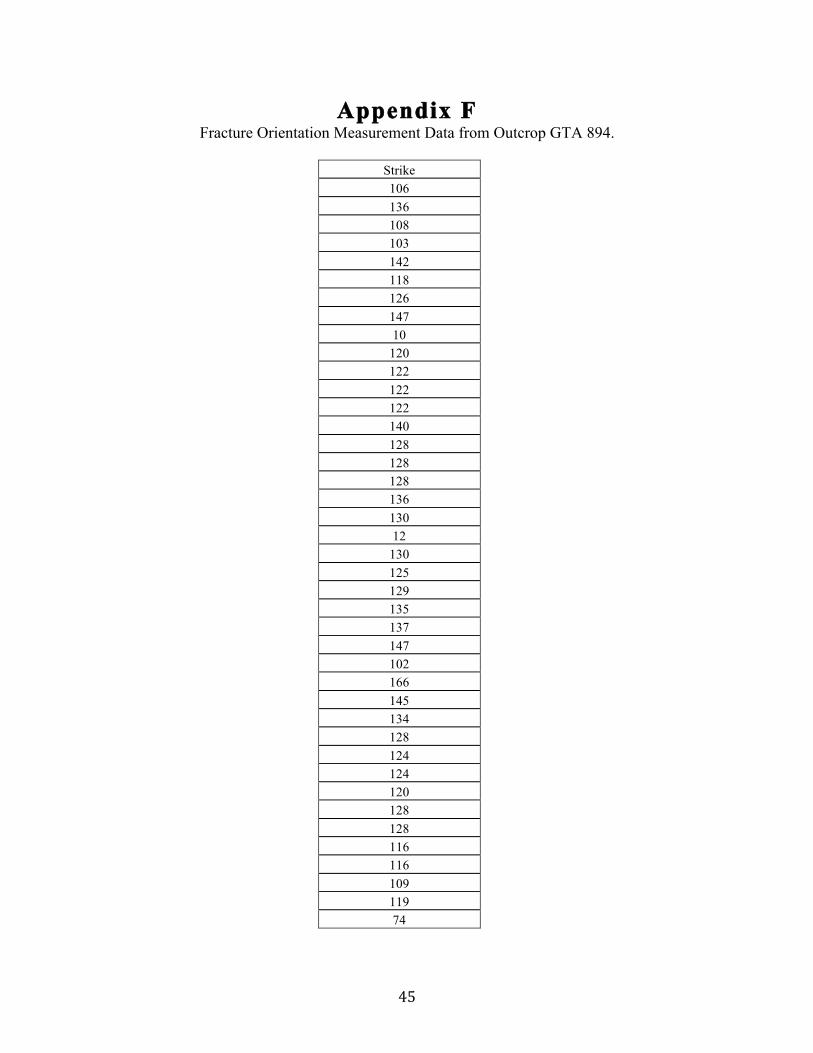
Appendix F Fracture Orientation Measurement Data from Outcrop GTA 894.
Strike 106 136 108 103 142 118 126 147 10
120 122 122 122 140 128 128 128 136 130 12
130 125 129 135 137 147 102 166 145 134 128 124 124 120 128 128 116 116 109 119 74
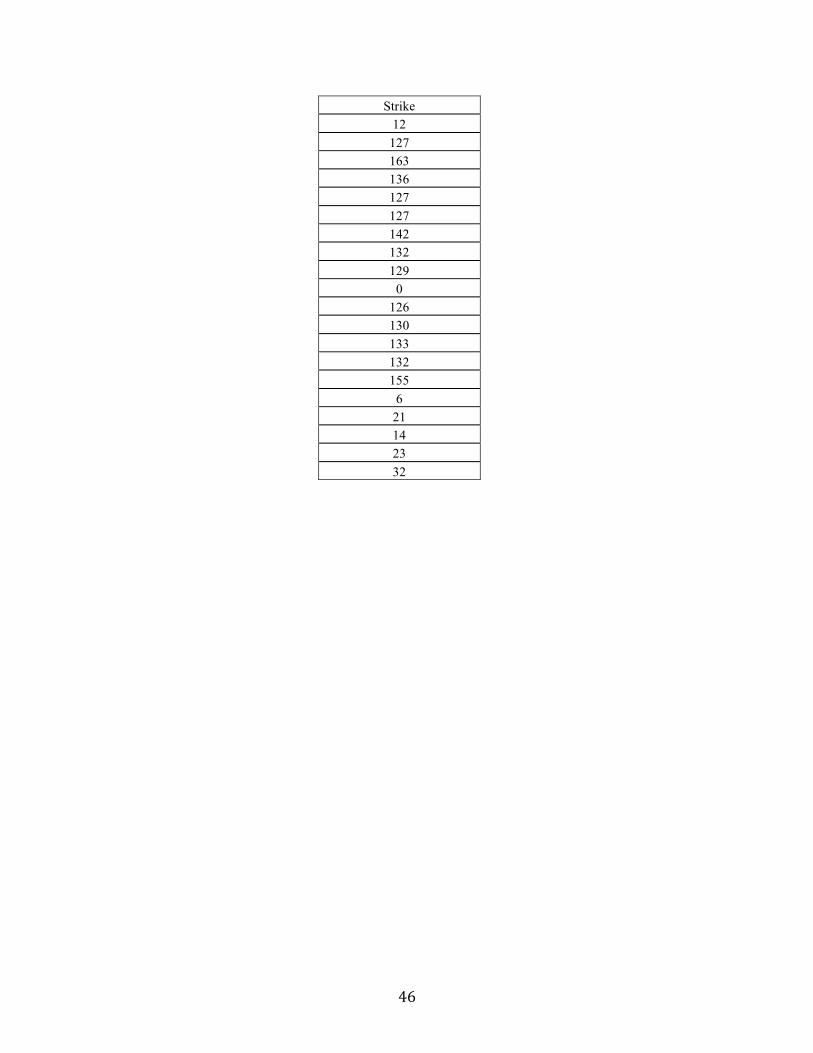
46
Strike 12
127 163 136 127 127 142 132 129
0 126 130 133 132 155
6 21 14 23 32
47
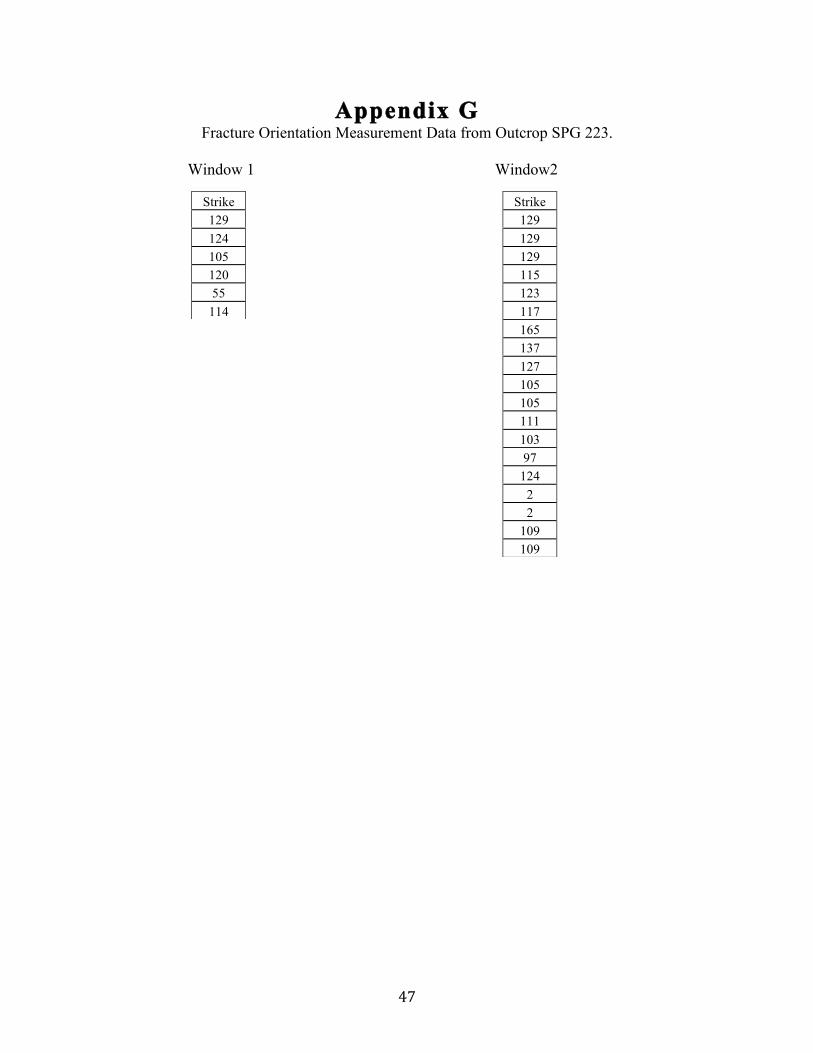
Appendix G Fracture Orientation Measurement Data from Outcrop SPG 223.
Window 1 Window2
Strike 129 124 105 120 55
114
Strike 129 129 129 115 123 117 165 137 127 105 105 111 103 97
124 2 2
109 109
48
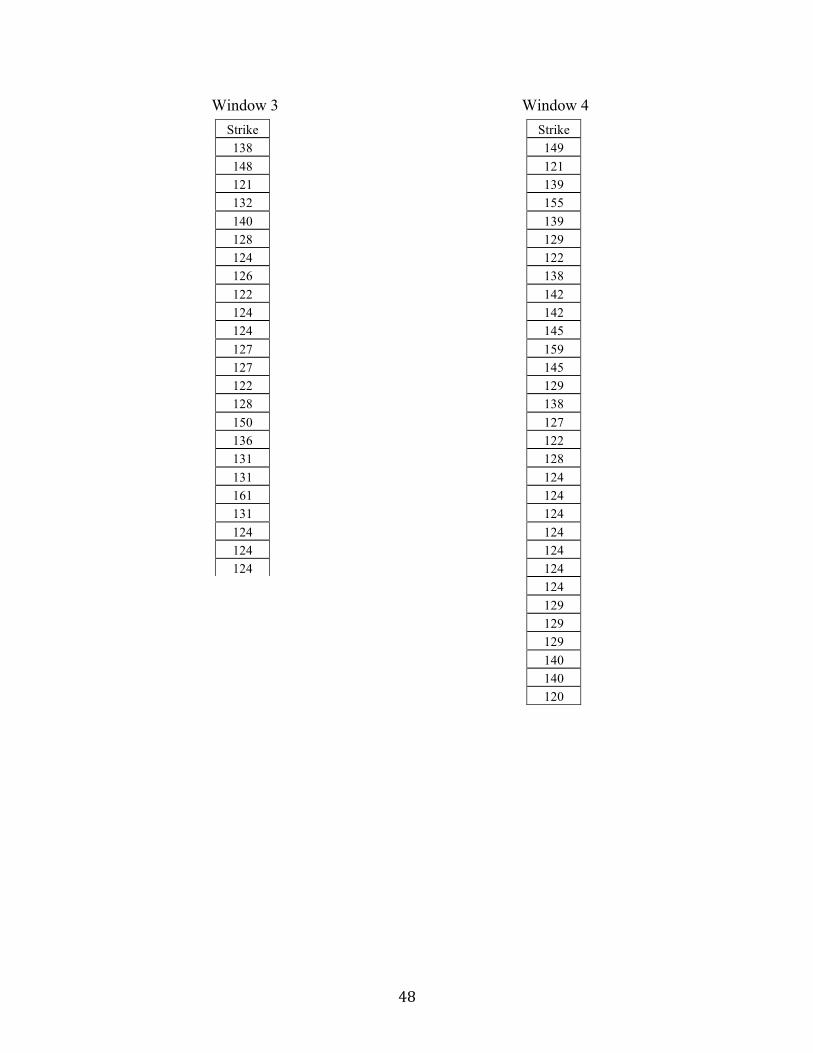
Window 3 Window 4
Strike 149 121 139 155 139 129 122 138 142 142 145 159 145 129 138 127 122 128 124 124 124 124 124 124 124 129 129 129 140 140 120
Strike 138 148 121 132 140 128 124 126 122 124 124 127 127 122 128 150 136 131 131 161 131 124 124 124
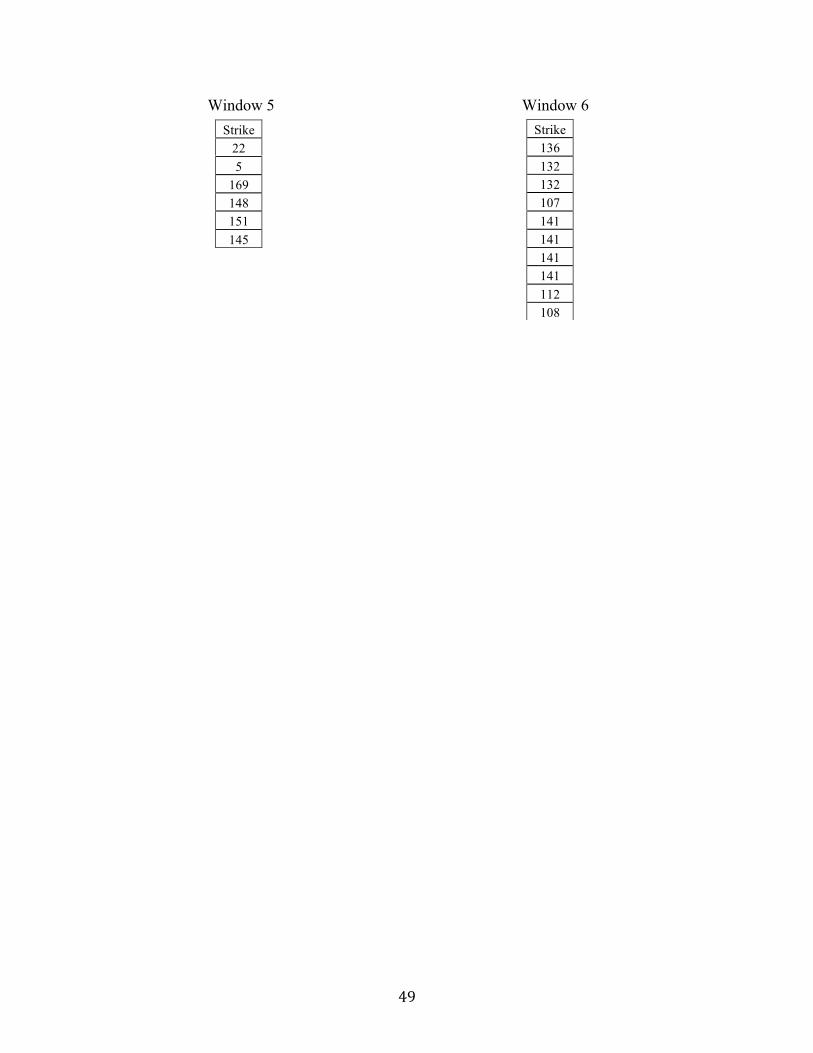
49
Window 5 Window 6
Strike 22 5
169 148 151 145
Strike 136 132 132 107 141 141 141 141 112 108
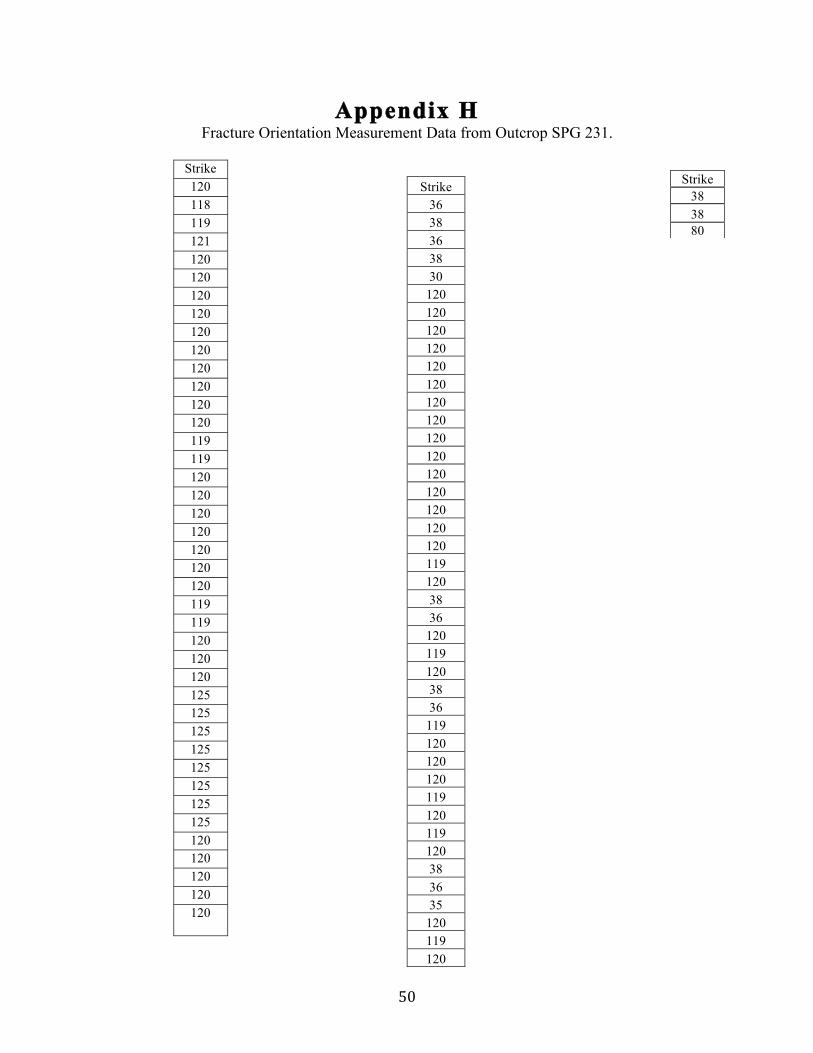
50
Appendix H Fracture Orientation Measurement Data from Outcrop SPG 231.
Strike 120 118 119 121 120 120 120 120 120 120 120 120 120 120 119 119 120 120 120 120 120 120 120 119 119 120 120 120 125 125 125 125 125 125 125 125 120 120 120 120 120
Strike 36 38 36 38 30
120 120 120 120 120 120 120 120 120 120 120 120 120 120 120 119 120 38 36
120 119 120 38 36
119 120 120 120 119 120 119 120 38 36 35
120 119 120
Strike 38 38 80
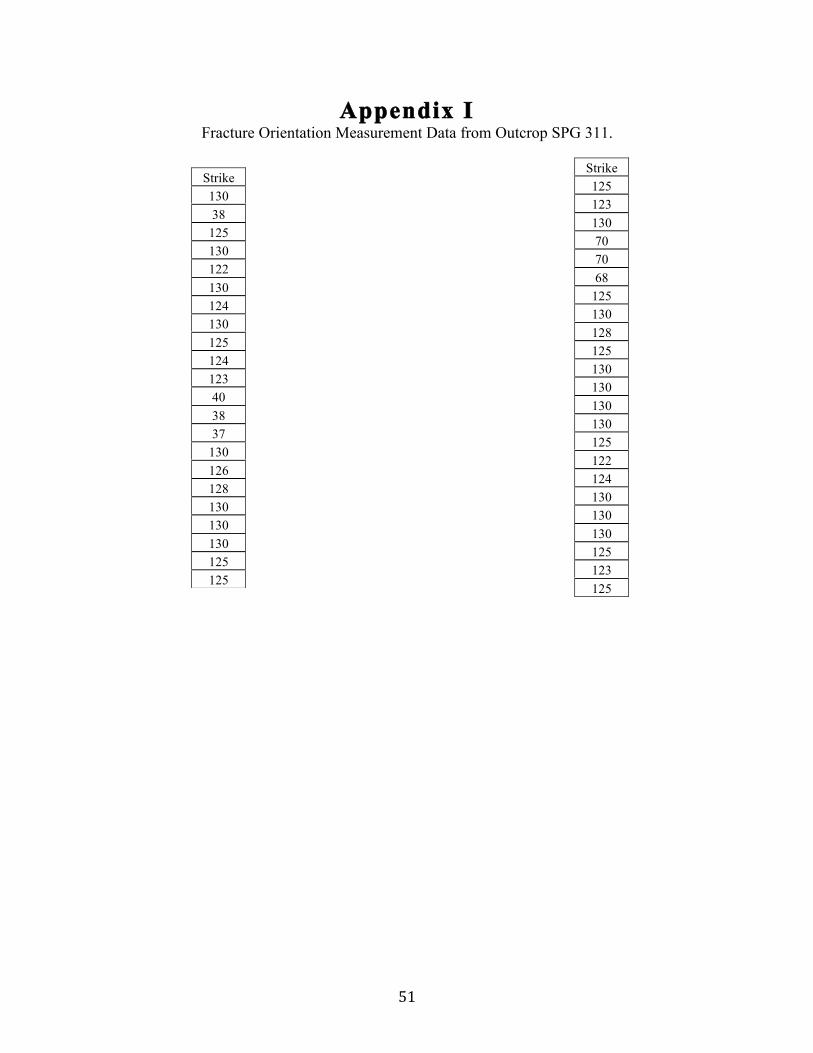
51
Appendix I Fracture Orientation Measurement Data from Outcrop SPG 311.
Strike 130 38
125 130 122 130 124 130 125 124 123 40 38 37
130 126 128 130 130 130 125 125
Strike 125 123 130 70 70 68
125 130 128 125 130 130 130 130 125 122 124 130 130 130 125 123 125
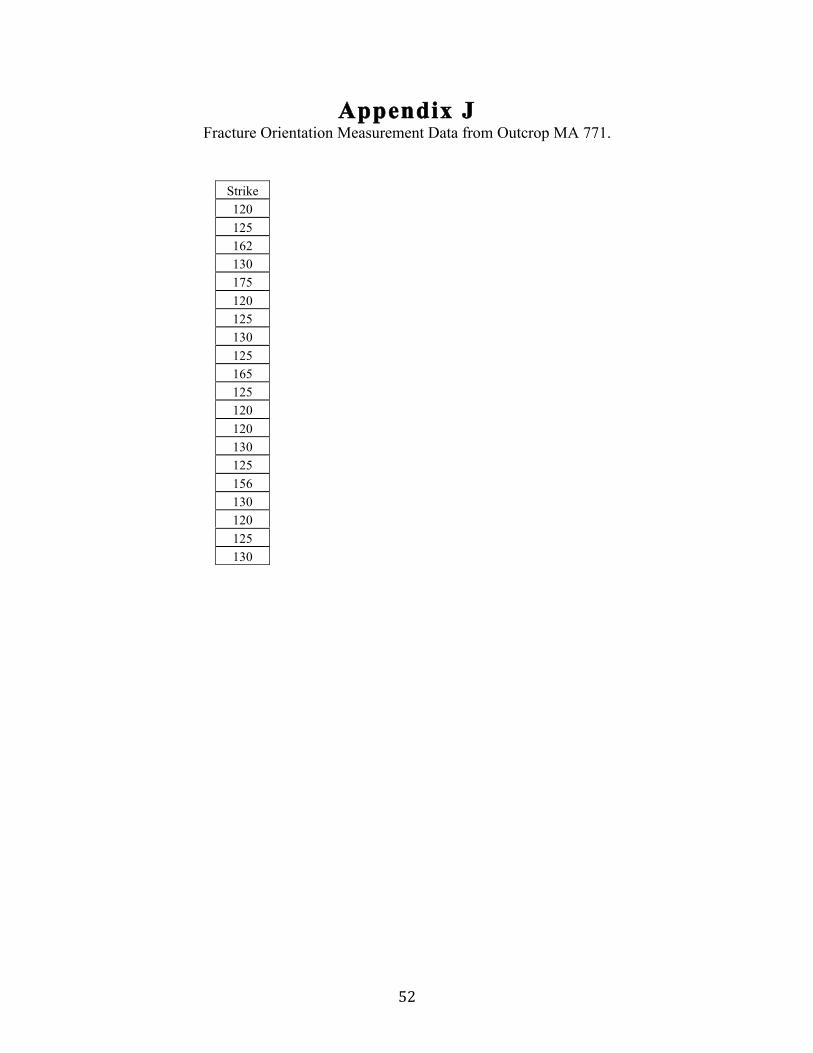
52
Appendix J Fracture Orientation Measurement Data from Outcrop MA 771.
Strike 120 125 162 130 175 120 125 130 125 165 125 120 120 130 125 156 130 120 125 130