Embed Size (px)
Citation preview
The Relationship between systematic risk and stock returns in Tehran Stock Exchange using the capital
asset pricing model (CAPM)
Mohsen Mehrara1,a, Zabihallah Falahati1,b, Nazi Heydari Zahiri2,c
1Faculty of Economics, University of Tehran, Kargar-e-shomali, Po Box 14166-6445, Tehran, Iran
2Sari University of Agricultural Sciences and Natural Resources, Sari, Mazandaran Province, Iran
a,b,cE-mail address: [email protected] , [email protected] , [email protected]
ABSTRACT
One of the most important issues in the capital market is awareness of the level Risk of
Companies, especially “systemic risk (unavoidable risk)” that could affect stock returns, and can play
a significant role in decision-making. The present study examines the relationship between stock returns
and systematic risk based on capital asset pricing model (CAPM) in Tehran Stock Exchange. The
sample search includes panel data for 50 top companies of Tehran Stock Exchange over a five year
period from 1387 to 1392. The results show that the relationship between systematic risk and stock
returns are statistically significant. Moreover, the nonlinear (quadratic) function outperforms the linear
one explaining the relationship between systematic risk and stock returns. It means that the assumption
of linearity between systematic risk and stock returns is rejected in the Tehran Stock Exchange. So we
can say that the capital asset pricing model in the sample is rejected and doesn’t exist linear relationship
between systematic risk and stock returns in the sample.
Keywords: Systematic Risk; Non Systematic Risk; Capital Asset Pricing Model; Panel Data; Stock
Exchange
1. INTRODUCTION
Stock Exchange as the pulse of economy is consideration economic analysis. Means of a
formal capital market in which companies buy and sell stock or bonds or private institutions,
under the rules and regulations are made. Also with Competitive environment as economic
instruments, that makes it profitable companies able to finance the deal by selling shares and
vice versa so that unprofitable companies are automatically excluded. And market can pay
optimal allocation of resources and Securities market within the framework of a market
mechanism that can operate in a more efficient allocation of financial resources. The evidence
shows that countries with developed capital markets (stock) could be higher economic growth
(Tehran stock exchange site).
The fact that investors are replace their money with one or more sheets of the stock that
future returns is high to be suffered and it seems essential to consider another factor such as
International Letters of Social and Humanistic Sciences Online: 2014-02-08ISSN: 2300-2697, Vol. 21, pp 26-35doi:10.18052/www.scipress.com/ILSHS.21.26© 2014 SciPress Ltd., Switzerland
SciPress applies the CC-BY 4.0 license to works we publish: https://creativecommons.org/licenses/by/4.0/
risk besides return. Investors have been seeking greater returns and abhor risk. In exchange for
bearing more risk and expected higher returns can be earned (Fischer, 1991).
One of the most important issues in the capital market is awareness the level Risk of
Companies, especially “systemic risk (unavoidable risk)” that could affect stock returns, and
can play a significant role in decision-making. It is believed that stock returns is a function of
systemic risk and systemic risk represents the rate of change for per shares than Rate of return
on the stock market (Jahan Khani and Colleagues, 1374).
This paper is a response to this require that pricing in Tehran stock exchange so that The
linear relationship between risk and return based on the CAPM model assumptions is true or
not? This study attempts to present the theoretical cornerstones relationship between systematic
risk and return in the stock market during the years 1392-1387 to examine in the Tehran Stock
Exchange. The reason for chose this period is using data from more up to date and consistent
with economic conditions. Would be more logical than interpretation of the intervals farther
the capabilities of today's economic conditions. In the second section of this paper represent
the background of investigation and then Definitions and Theoretical Principles research on
the relationship between risk and return and the capital asset pricing model was introduced.
The next section introduces the research methodology and finally Conclusions and suggestions
for future research in this area have been provided for those interested.
2. BACKGROUND OF INVESTIGATION
Sizova, Bollerslev, Osterrieder, Tauchen (2011): They investigate the relationship
between risk and return, Also Fractional Cointegration based on daily data for the S&P 500
and the VIX volatility index, Their series were divided into different components. Their finding
indicate that the relationship between volatility and the volatility-risk reward is strongly direct
and positive. They also find thet a fractionally cointegrated VAR. in addition they find that
corresponding the qualitative conceptions from that same theoretical and their study represent
variance risk premium estimated as the long-run equilibrium relationship within the
fractionally cointegrated system results in non-trivial return predictability over longer
interdaily and monthly return horizons.
Pollet, Kräussl, Jegadeesh (2010): They investigate the risk and returns of PE investments
and LPEs using the market Prices of FOFs that invest in unlisted private equity funds. Their
findings indicate that the market expects for PE to earn abnormal return is approximately 0.5
percent and for LPEs is approximately close zero after fees. Private equity fund returns are
negatively related to the credit expand and positively related to Gross Domestic Product
growth. In addition they find that both listed and unlisted PE has betas near to one.
Chudhary, Chudhary (2010): in this paper they examined the relationship between stock
returns and systematic risk based on capital asset pricing model (CAPM) in the Bombay Stock
Exchange. The sample search is 287 top companies of bombay (BSE) Stock Exchange that the
data were collected over a thirteen years period from January 1996 to December 2009. Their
findings (about intercept and slop of CAPM equation that states intercept should be equal from
zero and slop should be excess returns) rely on negate hypotheses of capital asset pricing model
and offer evidence against the CAPM. In addition, this paper investigated whether the CAPM
adequately captures all-important determinants of returns including the residual variance of
stocks. The results represent that residual risk has no effect on the expected returns of
portfolios.
International Letters of Social and Humanistic Sciences Vol. 21 27

McCurdy, G. Morgan (2011): They investigate equilibrium model for the inter temporal
evolution of the basis in foreign currency markets. The weights are specified in a hedged by
the prices of futures and spot contracts position and by Internal and external interest rates.
Evaluating this hedged position using an inter temporal asset pricing model leads to a testable
equilibrium model of the futures basis. Systematic risk will be commensurate to the conditional
covariance of the basis with a generalized discount factor. Empirical implementation uses a
conditional (CAPM) in which both the quantity and the price of covariance risk are free to vary
over time. However, for this application, the estimated inter temporal risk is insignificantly
different from zero the risk in the futures market offsets that in the spot, providing an effective
hedge.
3. THEORETICAL FOUNDATIONS OF STUDY
3. 1. Capital Asset Pricing Model (CAPM)
The Capital Asset Pricing Model (CAPM) in finance literature divided two parts: single
factor and multifactor that attempts to explain the relationship between the systematic risk of
an asset and its corresponding expected return. The capital asset pricing model based on
simplifying assumptions, of which can be expressed as follows: The first assumption is that
Investor purpose is the maximizing of expected utility from final wealth. Second, all investors
have homogeneous expects about the risk/reward trade-offs in the market. The third assumption
is that Information simultaneously and freely available to all investors and investors can’t be
affected stock prices by buying and selling stock. The fourth assumption is that Taxes,
transaction costs, there is no limit to short sell or other market constraints. Investors are
considered to maintain diversified portfolios, as the market does not reward investors for
bearing diversifiable risk. Consequently, the CAPM implies that if a security’s beta is known,
it may to calculate the parallel expected return. The relationship is known as the Security
Market Line (SML) equation and the measure of systematic risk in the CAPM is called Beta.
𝑅𝑗 − 𝑅𝑓 = 𝛼𝑗 + 𝛽𝑗(𝑅𝑚 − 𝑅𝑓) + 𝜀𝑗
If we include time effects in the model will be:
Rit − Rft = α + βj(Rmt-Rft)+ εit ; t = 1,…
If the model with it’s assumption was correct then 𝛼𝑖 significantly isn’t different from zero,
and then we have:
H0 : αi = 0 i = 1, … , N
where N: is the number of securities.
Rit − Rft = βj(Rmt − Rft) + εit ; t = 1, … , T
𝑅𝑖𝑡 = expected return for i share.
Rft = risk free rate. βj = beta(systematic risk).
28 Volume 21
Rmt = return on the market.
The equation represent the risk premium on asset j to the risk premium on the market:
This relationship is clarified by the parameter beta. Assets having risk premium that Oscillate
less than one-for-one with the market (𝛽𝑗 ≺ 1) are called defensive assets; they offer a means
of escaping from systematic risk of the market as a whole. Being attractive to investors in this
respect, they command a relatively low expected return over the riskless assets. Assets having
risk premium that oscillate more than one-for-one with the market (𝛽𝑗 ≻ 1) are called
aggressive assets; Investors must receive a higher expected return to tempt them to take on this
additional risk. Assets that oscillate one-for-one with the market (𝛽𝑗 = 1) are said to be neutral;
Over-or under weighting the market portfolio by the neutral asset does not affect the risk of
portfolio, and so neutral assets receive the same expected risk premium as the market.
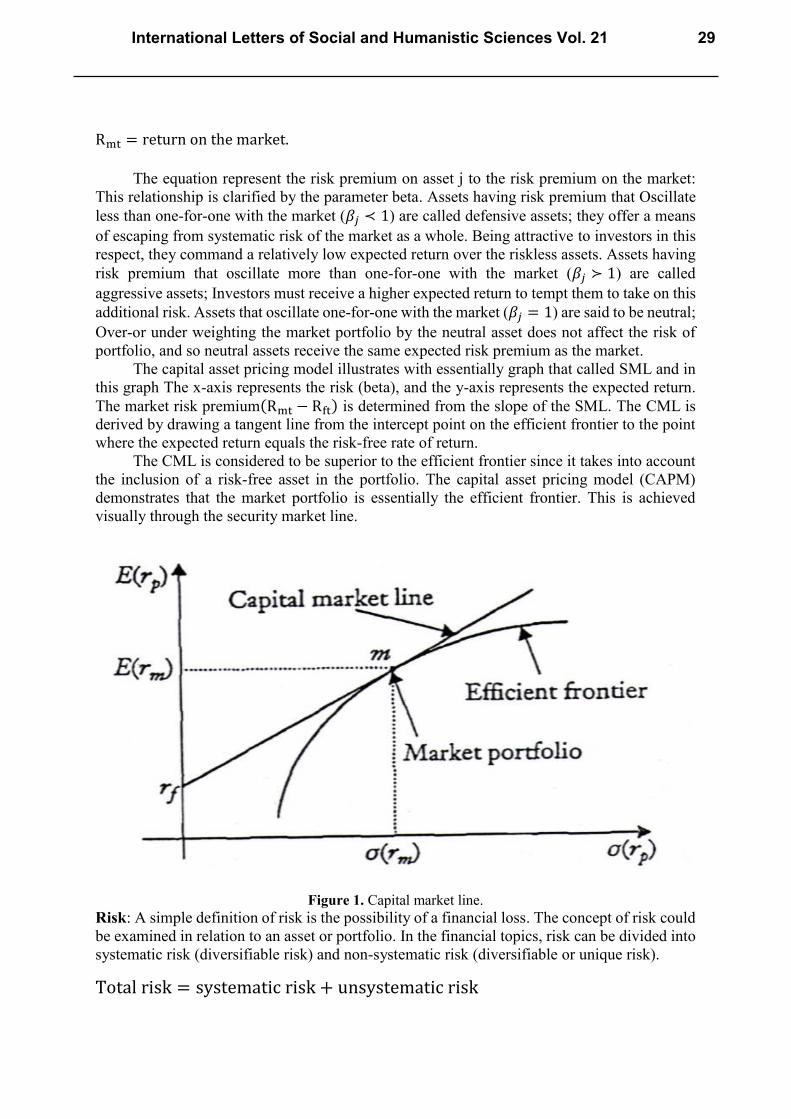
The capital asset pricing model illustrates with essentially graph that called SML and in
this graph The x-axis represents the risk (beta), and the y-axis represents the expected return.
The market risk premium(Rmt − Rft) is determined from the slope of the SML. The CML is
derived by drawing a tangent line from the intercept point on the efficient frontier to the point
where the expected return equals the risk-free rate of return.
The CML is considered to be superior to the efficient frontier since it takes into account
the inclusion of a risk-free asset in the portfolio. The capital asset pricing model (CAPM)
demonstrates that the market portfolio is essentially the efficient frontier. This is achieved
visually through the security market line.
Figure 1. Capital market line.
Risk: A simple definition of risk is the possibility of a financial loss. The concept of risk could
be examined in relation to an asset or portfolio. In the financial topics, risk can be divided into
systematic risk (diversifiable risk) and non-systematic risk (diversifiable or unique risk).
Total risk = systematic risk + unsystematic risk
International Letters of Social and Humanistic Sciences Vol. 21 29
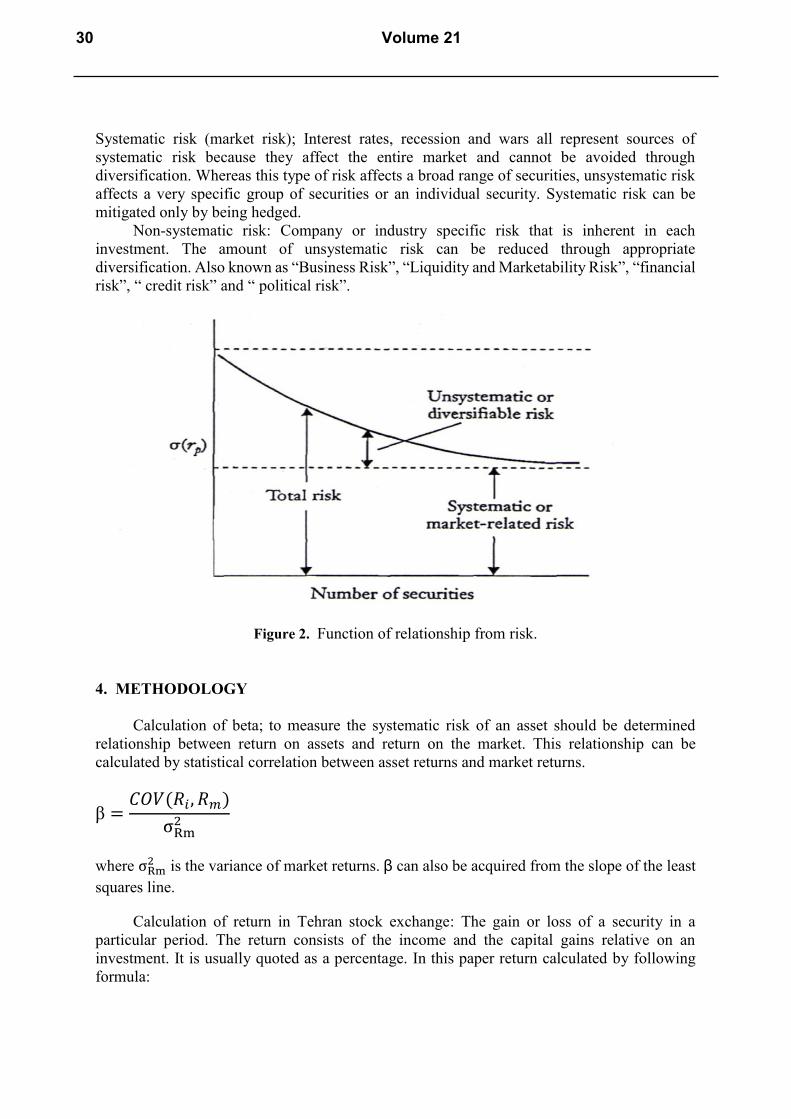
Systematic risk (market risk); Interest rates, recession and wars all represent sources of
systematic risk because they affect the entire market and cannot be avoided through
diversification. Whereas this type of risk affects a broad range of securities, unsystematic risk
affects a very specific group of securities or an individual security. Systematic risk can be
mitigated only by being hedged.
Non-systematic risk: Company or industry specific risk that is inherent in each
investment. The amount of unsystematic risk can be reduced through appropriate
diversification. Also known as “Business Risk”, “Liquidity and Marketability Risk”, “financial
risk”, “ credit risk” and “ political risk”.
Figure 2. Function of relationship from risk.
4. METHODOLOGY
Calculation of beta; to measure the systematic risk of an asset should be determined
relationship between return on assets and return on the market. This relationship can be
calculated by statistical correlation between asset returns and market returns.
β =𝐶𝑂𝑉(𝑅𝑖 , 𝑅𝑚)
σRm2
where σRm2 is the variance of market returns. β can also be acquired from the slope of the least
squares line.
Calculation of return in Tehran stock exchange: The gain or loss of a security in a
particular period. The return consists of the income and the capital gains relative on an
investment. It is usually quoted as a percentage. In this paper return calculated by following
formula:
30 Volume 21
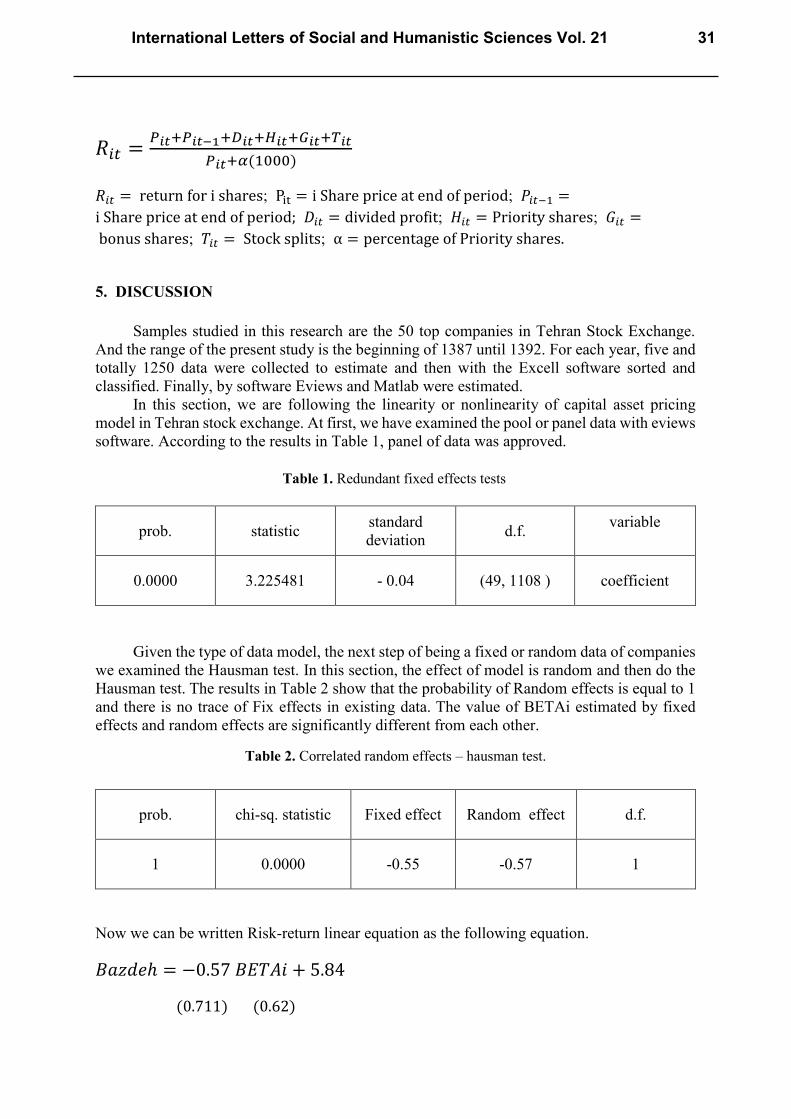
𝑅𝑖𝑡 =𝑃𝑖𝑡+𝑃𝑖𝑡−1+𝐷𝑖𝑡+𝐻𝑖𝑡+𝐺𝑖𝑡+𝑇𝑖𝑡
𝑃𝑖𝑡+𝛼(1000)
𝑅𝑖𝑡 = return for i shares; Pit = i Share price at end of period; 𝑃𝑖𝑡−1 =
i Share price at end of period; 𝐷𝑖𝑡 = divided profit; 𝐻𝑖𝑡 = Priority shares; 𝐺𝑖𝑡 =
bonus shares; 𝑇𝑖𝑡 = Stock splits; α = percentage of Priority shares.
5. DISCUSSION
Samples studied in this research are the 50 top companies in Tehran Stock Exchange. And the range of the present study is the beginning of 1387 until 1392. For each year, five and
totally 1250 data were collected to estimate and then with the Excell software sorted and
classified. Finally, by software Eviews and Matlab were estimated.
In this section, we are following the linearity or nonlinearity of capital asset pricing
model in Tehran stock exchange. At first, we have examined the pool or panel data with eviews
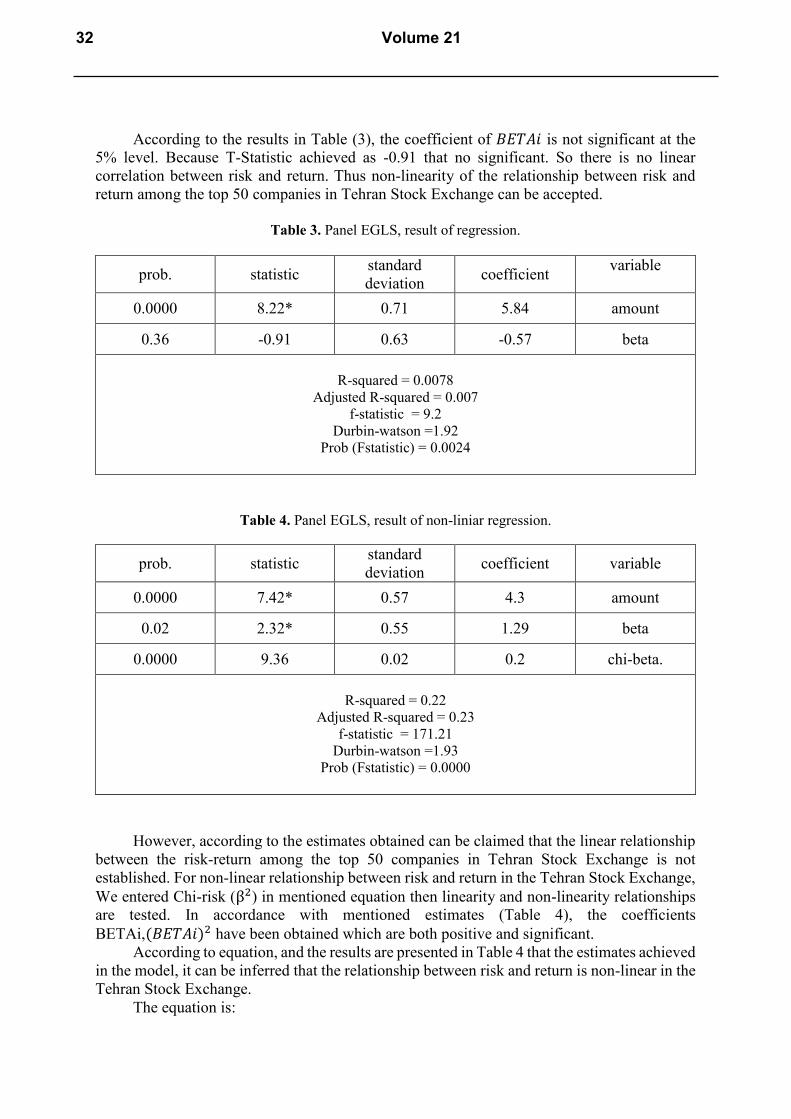
software. According to the results in Table 1, panel of data was approved.
prob. statistic standard
deviation d.f.
variable
0.0000 3.225481 - 0.04 (49, 1108 ) coefficient
Given the type of data model, the next step of being a fixed or random data of companies
we examined the Hausman test. In this section, the effect of model is random and then do the
Hausman test. The results in Table 2 show that the probability of Random effects is equal to 1
and there is no trace of Fix effects in existing data. The value of BETAi estimated by fixed
effects and random effects are significantly different from each other.
prob. chi-sq. statistic Fixed effect Random effect d.f.
1 0.0000 -0.55 -0.57 1
Now we can be written Risk-return linear equation as the following equation.
𝐵𝑎𝑧𝑑𝑒ℎ = −0.57 𝐵𝐸𝑇𝐴𝑖 + 5.84
(0.711) (0.62)
Table 1. Redundant fixed effects tests
Table 2. Correlated random effects – hausman test.
International Letters of Social and Humanistic Sciences Vol. 21 31
According to the results in Table (3), the coefficient of 𝐵𝐸𝑇𝐴𝑖 is not significant at the
5% level. Because T-Statistic achieved as -0.91 that no significant. So there is no linear
correlation between risk and return. Thus non-linearity of the relationship between risk and
return among the top 50 companies in Tehran Stock Exchange can be accepted.
Table 3. Panel EGLS, result of regression.
prob. statistic standard
deviation coefficient
variable
0.0000 8.22* 0.71 5.84 amount
0.36 -0.91 0.63 -0.57 beta
R-squared = 0.0078
Adjusted R-squared = 0.007
f-statistic = 9.2
Durbin-watson =1.92
Prob (Fstatistic) = 0.0024
Table 4. Panel EGLS, result of non-liniar regression.
prob. statistic standard
deviation coefficient variable
0.0000 7.42* 0.57 4.3 amount
0.02 2.32* 0.55 1.29 beta
0.0000 9.36 0.02 0.2 chi-beta.
R-squared = 0.22
Adjusted R-squared = 0.23
f-statistic = 171.21
Durbin-watson =1.93
Prob (Fstatistic) = 0.0000
However, according to the estimates obtained can be claimed that the linear relationship
between the risk-return among the top 50 companies in Tehran Stock Exchange is not
established. For non-linear relationship between risk and return in the Tehran Stock Exchange,
We entered Chi-risk (β2) in mentioned equation then linearity and non-linearity relationships
are tested. In accordance with mentioned estimates (Table 4), the coefficients
BETAi,(𝐵𝐸𝑇𝐴𝑖)2 have been obtained which are both positive and significant.
According to equation, and the results are presented in Table 4 that the estimates achieved
in the model, it can be inferred that the relationship between risk and return is non-linear in the
Tehran Stock Exchange.
The equation is:
32 Volume 21
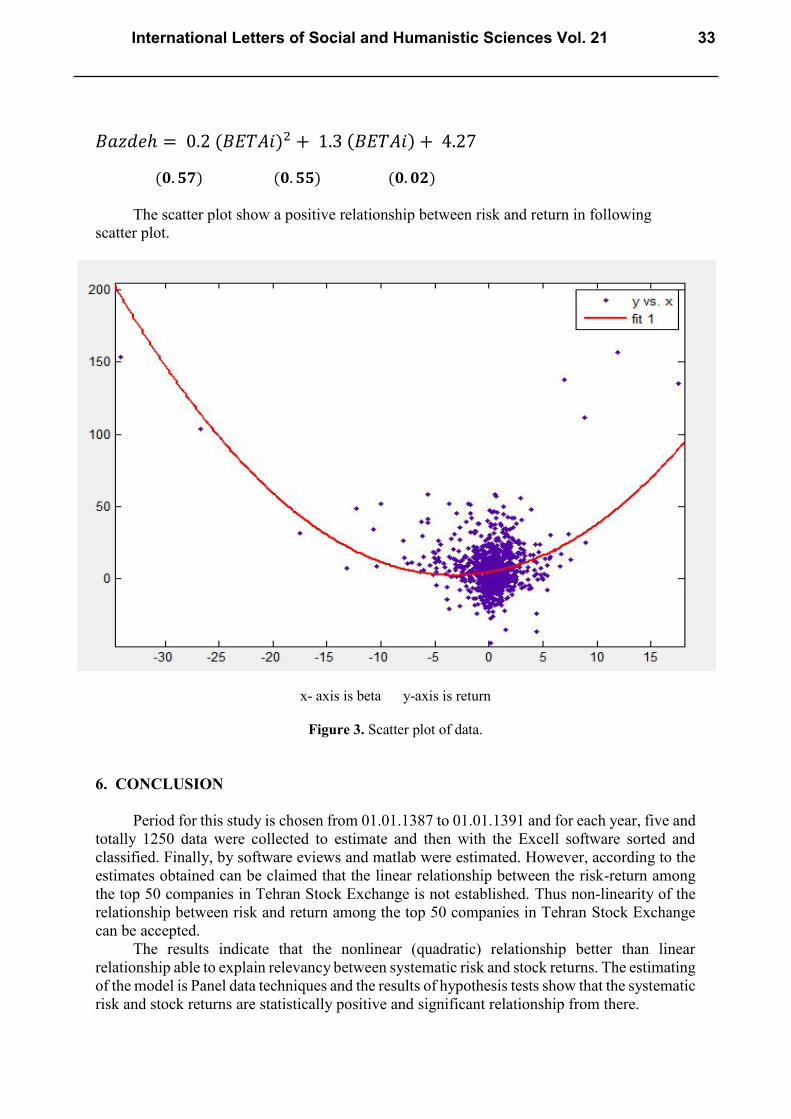
𝐵𝑎𝑧𝑑𝑒ℎ = 0.2 (𝐵𝐸𝑇𝐴𝑖)2 + 1.3 (𝐵𝐸𝑇𝐴𝑖) + 4.27
(𝟎. 𝟓𝟕) (𝟎. 𝟓𝟓) (𝟎. 𝟎𝟐)
The scatter plot show a positive relationship between risk and return in following
scatter plot.
x- axis is beta y-axis is return
Figure 3. Scatter plot of data.
6. CONCLUSION
Period for this study is chosen from 01.01.1387 to 01.01.1391 and for each year, five and
totally 1250 data were collected to estimate and then with the Excell software sorted and
classified. Finally, by software eviews and matlab were estimated. However, according to the
estimates obtained can be claimed that the linear relationship between the risk-return among
the top 50 companies in Tehran Stock Exchange is not established. Thus non-linearity of the
relationship between risk and return among the top 50 companies in Tehran Stock Exchange
can be accepted. The results indicate that the nonlinear (quadratic) relationship better than linear
relationship able to explain relevancy between systematic risk and stock returns. The estimating
of the model is Panel data techniques and the results of hypothesis tests show that the systematic
risk and stock returns are statistically positive and significant relationship from there.
International Letters of Social and Humanistic Sciences Vol. 21 33
References
[1] Bollerslev T., Osterrieder D., Sizova N., Tauchen G., Journal of Financial Economics
(2013) 409-424.
[2] Choudhary K., Choudhary S., Eurasian Journal of Business and Economics 3(6) (2010)
127-138.
[3] Gujarati B. (2003). Basic Econometrics, 6th.
[4] Fischer, D. E., & Jordan, R. J. (1991). Security analysis and portfolio management.
Englewood cliffs: Prentice Hall.
[5] Elton E. J., Gruber M. J., Journal of Banking & Finance 21(11) (1997) 1743-1759.
[6] Frank J. Fabozzi, CFA, Edwin H. Neave, Guofu Zhou (2012). Financial Economics. John
Wiley & Sons, Inc, pp. 287-316.
[7] Jensen M., & Scholes M. (1972). The capital asset pricing model: Some empirical tests.
Available from the Social Science Research Network eLibrary at :
http://papers.ssrn.com/abstract=908569
[8] Harrington D. R. (1987). Modern portfolio theory, the capital asset pricing model, and
arbitrage pricing theory: A user's guide. Prentice-Hall.
[9] Jahankhani A., & Pinches G. E., The nonstationarity of systematic risk for bonds. BEBR
1978, No. 497.
[10] Stewart K. G. (2005). Introduction to applied econometrics. Belmont, CA: Thomson
Brooks/Cole, pp. 203-205.
[11] McCurdy T. H., & Morgan I. G. (1999). Intertemporal Risk in the Foreign Currency
Futures Basis. Canadian Journal of Administrative Sciences / Revue Canadienne des
Sciences de l'Administration 16(3) (1999) 172-184.
[12] Maheu J. M., & McCurdy T. H. (2005). The long-run relationship between market risk
and return. University of Toronto, Department of Economics Working Papers.
[13] Jegadeesh N., Kräussl R., & Pollet J. (2009). The Risk and Return Characteristics of
Private Equity Using Market Prices. Working paper. Available from the Social Science
Research Network eLibrary at:
http://papers.ssrn.com/sol3/papers.cfm?abstract_id=1344895
[14] Raei R., & Talangi A. (2008). Advanced investment management. Fourth Printing, pp.
123-178.
[15] Hamid S., Prakash A. J., Anderson G. A., Journal of Business Finance &
Accounting 21(2) (1994) 293-297.
[16] Mohsen Mehrara, Amin Haghnejad, Jalal Dehnavi, Fereshteh Jandaghi Meybodi,
International Letters of Social and Humanistic Sciences 3 (2014) 1-19.
[17] Mohsen Mehrara, Hamid Abrishami, Mostafa Boroujli, Mahan Amin, International
Letters of Social and Humanistic Sciences 11 (2013) 76-83.
[18] Mohsen Mehrara, International Letters of Social and Humanistic Sciences 9 (2013) 59-
64.
34 Volume 21

[19] Mohsen Mehrara, Maysam Musai, International Letters of Social and Humanistic
Sciences 8 (2013) 1-7.
[20] Mohsen Mehrara, Masoumeh zirak, International Letters of Social and Humanistic
Sciences 2 (2013) 32-38.
( Received 17 December 2013; accepted 09 January 2014 )
International Letters of Social and Humanistic Sciences Vol. 21 35