Embed Size (px)
Citation preview

Eastern Kentucky UniversityEncompass
Online Theses and Dissertations Student Scholarship
January 2014
The Relationship Between Teachers' PerceptionsOf Student Management With Out-Of-SchoolSuspensions And High School Graduation RatesCaryn Letcher HuberEastern Kentucky University
Follow this and additional works at: https://encompass.eku.edu/etd
Part of the Educational Administration and Supervision Commons
This Open Access Dissertation is brought to you for free and open access by the Student Scholarship at Encompass. It has been accepted for inclusionin Online Theses and Dissertations by an authorized administrator of Encompass. For more information, please contact [email protected].
Recommended CitationHuber, Caryn Letcher, "The Relationship Between Teachers' Perceptions Of Student Management With Out-Of-School SuspensionsAnd High School Graduation Rates" (2014). Online Theses and Dissertations. 278.https://encompass.eku.edu/etd/278


THE RELATIONSHIP BETWEEN TEACHERS’PERCEPTIONS OF STUDENT
MANAGEMENT WITH OUT-OF-SCHOOL SUSPENSIONS AND HIGH SCHOOL
GRADUATION RATES
By
CARYN LETCHER HUBER
Master of Arts
College of Notre Dame
Baltimore, Maryland
2005
Bachelor of Arts
University of Kentucky
Lexington, Kentucky
1995
Submitted to the Faculty of the Graduate School
Eastern Kentucky University
in partial fulfillment of the requirements
for the degree of
DOCTOR OF EDUCATION
December, 2014

ii
Copyright © Caryn Huber, 2014
All Rights Reserved

iii
DEDICATION
I wish to dedicate this research to my long family lineage of ambitious women. Starting
with my great-grandmother, Lula Pearl who graduated from Eastern Kentucky State
College in July, 1957 as an elementary teacher. Following her example in purpose and
passion for children, my grandmother, Nancy Jane, who raised and cared for several
youngsters. My mother Rebecca Elaine, who currently provides care for others as a nurse,
friend and devoted family member . This paper is also dedicated to my daughter, Lydia
Beatrice who I envision to follow in our footsteps.
“Education is a fundamental principle of what made America a success. We can’t afford
to throw any young people away.” Benjamin Carson
iv
ACKNOWLEDGEMENTS
I wish to acknowledge the support of my family through this academic process.
There were many evenings and weekends when my sister and brother-in-law, mother, and
husband, carried my share of parenting and domestic engineering duties. I thank them for
their patience and unconditional support.
I also wish to thank my mother and grandmother for their inspiring actions and
their principles. Their unconditional encouragement and backing has provided me with
limitless opportunities.
I acknowledge my colleagues and mentors throughout my education career. At
each stage of my professional growth in education, I have been fortunate enough to work
with a team of educators whose motivation has never waned to improve the education
experience for all students. That passion and motivation propelled me to invest in my
practice and the vocation of education. I am extremely lucky to have worked with people
who enjoy what they do every day.
I wish to thank my dissertation committee for their guidance and support; Dr.
Reynolds for genuine words of encouragement and validation; Dr. Biggins for his time
and availability during the whirlwind; and Dr. James Bliss for his support throughout my
studies and his thoughtful feedback at each stage of my learning. Most importantly, I am
indebted to Dr. Charles Hausman for his dedication and tireless support through this
process as my mentor.

v
ABSTRACT
THE RELATIONSHIP BETWEEN TEACHERS’PERCEPTIONS OF STUDENT
MANAGEMENT WITH OUT-OF-SCHOOL SUSPENSIONS AND HIGH SCHOOL
GRADUATION RATES
Teachers’ perceptions contribute to who is removed from the classroom (Fenning
& Rose, 2007). The Kentucky Department of Education use a teacher self-report
instrument called the Teaching, Empowering, Leading and Learning (TELL) survey to
assess teaching conditions in eight areas to predict teacher satisfaction, employment
trajectories and ultimately guide school improvement. The New Teacher Center found a
correlation exists between the Managing Student Conduct construct of the TELL
Kentucky Survey responses and student achievement (National Teacher Center, 2013).
This study investigates the relationship between Managing Student Conduct construct
with Graduation Rates and Out-of-School Suspension. Graduation Rate is one of five
components that make up the Next Generation of Learners, which encompasses 70% of
the Unbridled Learning assessment accountability model (other components include
Achievement, Gap, Growth and College/Career Ready). Kentucky Unbridled Learning
assessment model is the alternative to the standard NCLB and approved by the U.S.
Department of Education. The results of this study found a negative correlation between
Managing Student Conduct and Out-of-School Suspension and a weak positive
correlation between Managing Student Conduct and Graduation Rates. In addition to the
original questions, a post hoc multi-regression analysis was conducted and found that
although non-white and poverty were strong predictors of Out-of-School Suspension,
poverty was the strongest predictor of Graduation Rates. The results instigate future
studies in the areas of cultural responsive teaching, alignment of school expectations and
instructional cultural relevancy.
KEYWORDS: graduation rates, dropout, out-of-school suspension, discipline,
teacher perceptions, minority students, school enrollment, free and
reduced lunch, Kentucky TELL survey, student achievement

vi
TABLE OF CONTENTS
CHAPTER PAGE
I. INTRODUCTION ......................................................................................................1
Unbridled Learning ............................................................................................1
Graduation Rate: Adjusted Cohort and Average Freshman ............................3
Out-of-School Suspensions in Kentucky Schools ............................................4
Rationale for the Study ..............................................................................................4
Problem Statement .....................................................................................................6
Research Questions .....................................................................................................7
II. LITERATURE REVIEW ..........................................................................................8
Drop Outs ...................................................................................................................9
Impact ............................................................................................................... 9
At-risk Factors: Race, SES and Disability Interrelated .................................11 School Characteristics 14
School Characteristics .....................................................................................12
Out-of-School Suspensions ......................................................................................15
At-risk Factors: Race, SES and Disability Interrelated .................................16
Perceptions of School Environment ........................................................................ 18
Student Perception ..........................................................................................18
Teacher Perception ..........................................................................................19
Perception of Administration Support ............................................................21
Purpose of Study ......................................................................................................22
III. METHODOLGY .....................................................................................................23
Research Questions ..................................................................................................23
Context ..................................................................................................................... 23
Data Collection .........................................................................................................23
Sample .............................................................................................................25
Variables and Measures ...........................................................................................25
Dependent Variables .......................................................................................26
Predictor Variables ..........................................................................................26
Research Design ......................................................................................................28

vii
Reliability and Validity of the TELL Survey .................................................28
Data Analysis ..................................................................................................28
Limitations of Study ........................................................................................29
IV. RESULTS ............................................................................................................... 30
Review of Data Collection and Analysis ................................................................32
Teachers’ Perceptions with Suspension and Graduation ................................32
V. DISCUSSION ..........................................................................................................42
Study Findings .........................................................................................................44
Implications ............................................................................................................. 46
Cultural Social Dominance Approach ............................................................46
Positive Based Supports ..................................................................................49
Future Research ..............................................................................................51
REFERENCES .................................................................................................................54
CURRICULUM VITAE ................................................................................................... 68

viii
LIST OF TABLES
Table Page
3.1 Descriptive Statistics ................................................................................................25
3.2 Reliability of Managing Student Conduct ............................................................... 27
4.1 Means of Managing Student Conduct Items ............................................................31
4.2 Mean Percentage of Students Suspended ................................................................ 32
4.3 Correlation of Managing Student Conduct with Students Suspended ..................... 32
4.4 Correlations of Managing Student Conduct Items Students Suspended .................33
4.5 Mean Graduation Rates ...........................................................................................34
4.6 Correlation of Managing Student Conduct with Graduation Rates .........................35
4.7 Correlation of Managing Student Conduct Items with Graduation Rates ............... 35
4.8 Correlations of Percentage of Students Suspended with Graduation Rates ............37
4.9 Probability of Variance of Percentage of Students Suspended ................................37
4.10 Regression of Students Suspended with Predictors ..................................................38
4.11 Coefficients of Students Suspended with Predictors ................................................39
4.12 Probability of Variance in Graduation Rates ...........................................................39
4.13 Regression of Graduation Rates with Predictors ......................................................40
4.14 Coefficients of Graduation Rates with Predictors ....................................................41

TEACHER PERCEPTIONS
1
CHAPTER I: INTRODUCTION
Since the inception of the No Child Left Behind Act (NCLB) by the Bush
Administration in 2001, educational institutions have been required to demonstrate
Adequate Yearly Progress (AYP). Across the nation, state schools were mandated to
implement a transparent assessment system to measure students’ academic proficiency
and disaggregate by race, gender, disability and social-economic status (SES). The
reauthorization of the 1965 Elementary and Secondary Education Act (ESEA) led to an
overhaul of state curricular standards, assessments, instructional practices and a targeted
focus on students identified in achievement gaps. Federal funding recipients became
accountable to parents whom have the power of school choice if the schools assessment
measures exhibit persistently low achievement (U.S. Department of Education, 2013).
Unbridled Learning
In 2009, the Kentucky General Assembly enacted Senate Bill 1 (SB 1), which
required a new public school assessment program beginning in the 2011-12 school year.
School districts adopted the Unbridled Learning assessment accountability model for
public schools, replacing the Commonwealth Accountability Testing System (CATS),
which provided accountability information and a NCLB “score” and a state “score”. In
February 2012, shortly after the Obama administration announced states could develop an
alternative to the standard NCLB model, the U. S. Department of Education approved
Kentucky’s Unbridled Learning accountability model. The Unbridled Learning
accountability model allows Kentucky to report assessment that meet federal and state
requirements with one “score” on the School Report Card.

TEACHER PERCEPTIONS
2
At the high school level, the Kentucky School Report Card’s overall score is
based on three weighted components: Next Generation Learners (70%), Next-Generation
Instructional Programs and Support (20%) and beginning in school year 2014-2015,
Next-Generation Professionals (10%). Currently, the Next Generation Learners Score is
based on several data sources: Kentucky Performance Rating for Educational Progress
(K-PREP); End-of-Course (EOC) exams; ACT, PLAN, EXPLORE; and other non-test
measures such as graduation rates, achievement gaps, college/career readiness, and
student academic growth. In addition, the School Report Card compiles Learning
Environment data regarding teacher qualifications, student safety, and parent
involvement and student demographics. Collectively, the School Report Card
communicates to the public and parents the school’s performance as dictated in the
Kentucky regulation 703 KAR 5:140. The 2011-2012 State/District/School Report Cards
provided the baseline data from which the state, district and individual schools developed
Annual Measurable Objectives (AMO). The AMOs are similar to AYP but are more
specific to Unbridled Learning indicators of meeting the goal of “College and/or Career
Ready for All” (Kentucky Department of Education, 2013).
Additional information is collected by the Kentucky State Department of
Education (KDE) via the TELL (Teaching, Empowering, Leading and Learning) survey,
which assesses teaching conditions in eight areas: Community Engagement and
Support; and Teacher Leadership; School Leadership; Managing Student Conduct; Use of
Time; Professional Development; Facilities and Resources; Instructional Practices and
Support; New Teacher Support (National Teacher Center, 2013). In 2011, the TELL
survey was administered electronically to all public school teachers in the state of

TEACHER PERCEPTIONS
3
Kentucky over a period of four weeks. The TELL survey results are intended to be
included in schools’ Comprehensive School Improvement Plans (CSIP), which are driven
by targeted goals based on data from the School Report Card (Kentucky Department of
Education, 2013). The CSIP is the blueprint for schools, districts and states to ensure
accountability from all stakeholders to support the efforts to decrease achievement gap
and prepare all students to be career and/or college ready.
Graduation Rate: Adjusted Cohort and Average Freshman
Beginning in 2013, Kentucky is now using a more reliable measure of graduation
rates called the Four-Year Adjusted Cohort Graduation rate, which allows Kentucky to
have intrastate reliability and a corresponding measure with other states. The four-year
adjusted cohort graduation rate is calculated by dividing the number of students who
graduate within four years with a regular diploma by the number of students that
compose the adjusted cohort for the graduation class. The adjusted cohort for the
graduation class is calculated by adding any students who transfer into to the cohort
(students entering grade 9 for the first time) later during grade 9 and the next three years
and subtracting students who transfer out during the same year (U.S. Department of
Education, 2013).
Kentucky was one of the three states that did not report the Four Year Adjusted
Cohort Graduation rate for the 2010-2011school year to the U.S. Department of
Education. However, the data used in the current survey is the Kentucky School Report
Card from 2011-2012 and the Tell Survey from 2011, which represents data collected
during 2010

TEACHER PERCEPTIONS
4
Based on the 2011-2012 Kentucky School Report Card, 77.8% of all students
graduated (Kentucky Department of Education, 2013). The Average Freshman
Graduation Rate (AFGR) is based on the estimated percentage of students who graduate
on time and is calculated by estimating the enrollment of the freshman class and the
number of awarded regular diplomas four years later. Kentucky’s 2012 AFGR is the
actual 2011 AFGR and since data are lagged a year, it represents the 2010 graduation
rate. Therefore, only approximately 78% of all high school students graduated on time in
2010.
Out-of-School Suspension in Kentucky Schools
The Kentucky State Report Card also reports Out-of-School suspensions to
describe the schools’ safety within the learning environment. On the 2012-2013 State
Report Card, Kentucky schools suspended 7.5 percent of White students, 24.8 percent of
Black students, 6.9 percent of Hispanic students and 1.9 percent of Asian Students. This
trend correlates with the overrepresentation of minority students receiving exclusionary
discipline consequences on a national level (Gonzalez & Szecsy, 2004; Fenning & Rose,
2007).
Rationale for the Study
The New Teacher Center (NTC) found that a strong correlation exists between
the TELL Kentucky Survey responses on the Managing Student Conduct construct and
student achievement. Following the Community Support and Involvement construct,
Student Conduct was the next highest significantly correlated variable with student
achievement as indicated by combined math and reading scores (r=. 313) at the high
school level (National Teacher Center, 2013)
TEACHER PERCEPTIONS
5
During a time when accountability and data driven performance are the crucial
funding determinants for states’ school systems, statistics should help leaders and
policymakers prescribe best practices and interventions. Given the inconsistent outcomes
across the state, Kentucky students are not receiving equitable opportunities or equitable
treatment. The Kentucky School Report Cards give a plethora of data on students such as
academic performance, behavior and demographics, but the report provides minimal
information on teachers.
Teachers’ perceptions contribute to who is removed from the classroom (Fenning
& Rose, 2007), but when school administrators support teachers through collaboration on
discipline and through professional development opportunities, out-of-school suspensions
decrease (Ohlson, 2009). High school suspension rates are positively correlated with
high school dropout rates (Lee, Cornell, Gregory, & Fan, 2011). One measurable
outcome of the strategic efforts to prepare all students for success and college/career
readiness is the high school graduation rates.
It is critical to study Kentucky school dropout rate and out-of-school suspension
rates as it relates to students academic proficiency and those students who fall in the
achievement gap. Students, who are suspended from school miss access to curriculum,
perform poorly in the classroom and more likely to dropout (Norguera, 2001; Townsend,
2000; Velez, 1989). Students who do not graduate are more susceptible to a poor Quality
of Life, as defined by physical wellbeing, material wellbeing, social wellbeing, emotional
wellbeing, and development and activity (Felce and Perry, 1995). There are correlations
between high school dropouts and incarceration (Harlow, 2003) and economic hardships
(Thorstensen, 2004) for the individual and society.
TEACHER PERCEPTIONS
6
Problem Statement
The overall state graduation rate does not reflect a homogeneous rate of
graduation across the state. The individual school districts’ 2012 AFGR vary between
76% (Bullitt County) to 86.1 (Warren County) despite having a comparable enrollment
size (approximately 13,000). In addition, graduation rates and the out-of school
suspension percentages follow similar trends. For example, Bullitt County percentages
of out-of-school suspension on the 2011-2012 school report by race were 7.1% for White
students, 23.9% for Black students and 2.2% for Hispanic students; Warren percentages
of out-of school suspension on the 2011-2012 school report card by race were 2.4% for
White students, 7.6% for Black students and 1.1% for Hispanic students. These
examples demonstrate that racial/ethnic minority students have a higher chance of being
suspended from school than White students, a pattern found in the national studies
(Kremien, Leone, & Achilles, 2006; Kremien, Leone, & Achilles, 2006; Kremien, Leone,
& Achilles, 2006; Kremien, Leone, & Achilles, 2006).
These difference in suspension rate by race/ethnicity hold despite school size. For
example, Jefferson County’s district enrollment per the 2011-2012 is 94,921 and the
AFGR is 67.8%. The out-of school suspension rate by race was 9.4% for White students,
27.8% for Black students and 7.5% for Hispanic students. Fayette County’s district
enrollment per the 2011-2012 is 37,275 and the AFGR is 77.8%. The out-of school
suspension rate by race was 8.5% for White students, 34.2% for Black students and
10.0% for Hispanic students. Although district enrollment was different, the racial
demographics for each school district were comparable.

TEACHER PERCEPTIONS
7
The Kentucky 2011 TELL Survey assessed teachers’ working conditions in their
school and specifically asks their perceptions on managing student conduct. The data
from each school’s Kentucky TELL survey can be linked to graduation data and out-of-
school suspension by matching the data to the School’s Report Card. This study
investigates the relationship between school characteristics, student characteristics and
teachers’ perception of student management with graduation rates out-of-school
suspension.
Research Questions
The following research questions are addressed:
1. What is the relationship between student characteristics, school characteristics and
teacher perceptions of student management with graduation rates?
2. What is the relationship between student characteristics, school characteristics and
teacher perceptions of student management with out-of-school suspensions?
The predictors that will be investigated in this study with the exception of
Geography are listed in Figure 1.1 Geography was not a variable included due to this
study’s limited sample size and the high rate of rural districts in the state of Kentucky
provides only a small variance.
Figure 1.1. Predictors and OSS and AFGR

TEACHER PERCEPTIONS
8
CHAPTER II: LITERATURE REVIEW
High school begins with the ninth grade year when grades count toward college
acceptance, content is expounded upon and structure is less imposed (Newman, Newman,
Myers, Smith, & Lohman, 2000). An increase in student population generally means
perceived diminishing relationships between teachers and students and students and their
peers which impacts self-esteem, mental stability and social anxiety (DeWit, Karioja,
Rye, & Shain, 2011). The demands of high school academics increase significantly with
content complexity (McCallumore & Sparapani, 2010), while the students’ perception of
academic supports diminish (Butts & Cruzeiro, 2005) for the individual student. The
move from middle school to high school is documented as a major transition in the lives
of adolescents as they navigate through formal educational training (Neild, Stoner-eby, &
Furstenberg, 2008).
Students who transition to larger high schools may experience academic loss
(Alspaugh, 1998) and students that experience low academic achievements tend to never
earn a high school diploma (Suh & Suy, 2011). According to The Silent Epidemic:
Perspectives of High School Dropouts (2006) students reported that failing in school,
poor preparation for high school, low teacher expectations, less imposed structure and
lack of motivation were academic reasons for dropping out. In addition, students who are
suspended are more likely to drop out (Velez, 1989; Norguera, 2001; Townsend, 2000)
and at-risk for grade retention and involvement in the juvenile justice system
(Costendbader & Markson, 1998; King, 1993).

TEACHER PERCEPTIONS
9
Dropouts
Impact
The forecasts for a high school dropout are a desperate life for the individual and
challenging problems for society (Day & Ndwburger, 2002). “An individual’s
educational attainment is one of the most important determinants of their life chances in
terms of employment, income, health status, housing, and many other amenities” (The
Costs and Benefits of an Excellent Education for All of America’s Children, 2007, p. 2).
Dropouts do not have the earning potential to have a high Quality of Life. The average
income for a high school dropout is over 10,000 less than a high school graduate and over
35,000 less than a college graduate. ). Poverty limits structured economic opportunities
(Tickamey and Duncan, 1990) and correlates with chronic health issues and increased
risky health-related behaviors (“Children in Poverty”, 2012).
Society loses human capital when a young person dropouts out of high school and
the local education institution is a resource for human capital and can be a non-factor or a
major factor in individual promotion. For every male between the ages of 24 and 35 that
does not have a high school degree, the estimated loss in tax revenue is $944 billion and
costs society, an estimated $24 billion in public welfare and crime (Thorstensen, 2004).
Flora and Flora (2013) describe human capital as “the characteristics and potential of
individuals determined by the intersection of nature and nurture (education, skills, health
and self-esteem)” (p.11 ).

TEACHER PERCEPTIONS
10
Another negative outcome is the correlation between incarceration and the drop
out rates. In 1997, more than 64 percent of inmates in the nation’s state and federal
prisons and local jails had not graduation from high school (Harlow, 2003). In The
Consequences of Dropping out of High School, Suma et. al (2009), reported that 6.3 % of
the nation’s 16-24 year olds that were intitutionalized in 2006-2007 were high school
dropouts who lacked a GED. The report also highlighted that during the 2006-2007 time
period 1 out 10 males incarcerated were high school dropouts.
According to the centers for Disease Control and Prevention, teenage pregnancies
are associated with high school dropout. Due to the the increased health care, foster care
and limited income of teen mothers, teen births cost taxpayers nearly 11 billion dollars in
2008. (Center for Disease Control and Prevention, 2012). The National Campaign to
Prevent Teen Preganancy reports that children of teen mothers underperform in areas of
school readiness and have increased risk of dropping out of high school compared to
children of other mothers. Also, school achivement reduces the risk of teen pregnancy-
teens who stay in school and plan to attend college are at a lower risk of teen pregnancy.
(The National Campaign to Prevent Teen Pregnancy, 2010)
The loss of human capital not only impacts the invididual but also the local
economy which ultimately depends on a successful education program for community

TEACHER PERCEPTIONS
11
At-risk Factors: Race, SES and Disability Interrelated
Demographic factors, which include a students’ race, socioeconomic background,
gender and disability eligibility under the Individual Disability Education Act (IDEA) are
considered risks of dropping out of high school (Natriello, McDill, & Pallas, 1990;
Rumberger, 1987; Suh, Suh, & Houston, 2007; Suh & Suy, 2011; Hess, 2000). The
Trends in High School Dropout and Completion Rates in the United States: 1972–2009
Compendium Report found the dropout rate for African American and Hispanic students
is twice that of White students and students from low-family income status have dropout
rate five times higher than students from high- family income status (Chapman, Laird,
Ifill, & KewalRamani, 2011). These findings were based on national event dropout rates-
event dropout rates are defined by students who did not return to school the following
year and did not earn a diploma or GED.
National status dropout rate is defined by young people between the ages of 16-
24 who are not enrolled and do not have a high school degree. Based on the National
status dropout rate, Hispanics have a dropout rate (17.6%) three times higher than
Caucasians (5.5%), and almost twice higher than the African American dropout rate
(9.3%) (Chapman, Laird, Ifill, & KewalRamani, 2011; Carpenter & Ramirez, , 2007).
Amongst students with disabilities, the status drop out rate is double the status dropout
rate as their non-disable peers (Chapman, Laird, Ifill, & KewalRamani, 2011; Day &
Ndwburger, 2002; Wagner, 1995). students with learning disabilities and
emotional/behavior disabilities are among the highest at 30% and 50% respectively
(Wagner, et al., 1991).

TEACHER PERCEPTIONS
12
The Child Trends’ calculation of the status dropout percentage rate of youth ages
16-24 by gender in 2012 indicates that out of all the dropouts 55.7% are male and 44.2%
are female (Child Trends Data Bank, 2013).
School Characteristics
School size. Another factor influencing high school dropout’s rates is school size.
Large school enrollment is associated with higher dropout rates. (Lehr, Johnson, Bremer,
Cosio, & Thompson, 2004) and lower dropout rates in smaller schools (Werblow &
Duesbery, 2009; Cotton, 1996), supporting an earlier study that found dropout rates were
double in large schools compared to small schools (Pittman & Haughwout, 1987)
However, the dropout rates are significantly higher in larger schools when compared to
smaller schools (Rumberger & Thomas, 2000), but there was not a significant difference
in dropout rates between small schools and medium schools (Rumerger & Palardy, 2005).
Green and Winters (2006) found that by decreasing school size and school districts could
increase graduation rates. Large schools also have more disciplinary issues (Heaviside,
Rowand, Williams, Farris, & Westat, 1996-97) and correspondingly, suspension rates are
higher in urban schools with high enrollment (Skiba R. , Michael, Nardo, & Peterson,
2002)
Geography. Graduation rates are lowest in the largest cities and students who
reside in suburban areas are two times more likely to graduate compared to their peers
living in urban areas (Swanson, 2008). Rumberger and Thomas (2000) found in their
study using data from the National Educational Longitudinal Study of 1988 (NES:88),
that dropout rates were higher in urban schools compared to suburban.

TEACHER PERCEPTIONS
13
Suh and Suh (2011) investigated the decline in dropout rate over that last three
decades using the 1980s and 2000s National Longitudinal Survey of Youth (NLSY) and
found that while a students’ demographic factors (race, SES and gender) and suspension
were associated with an increase in dropout rate, the students’ residence in a metropolitan
area were associated with an decrease. (Natriello, McDill, & Pallas, 1990; Rumberger,
1987). Whereas race, SES, and gender continue to be the predictors that increase the
dropout rate, geographical factors such as region has impacted the dropout trend over the
last three decades. In a decomposition analysis, metropolitan high schools in East and
North Central regions were found to have lower dropout rates than rural high schools in
the South and West Regions. (Suh & Suy, 2011)
Generally, poverty rates are higher in rural areas than urban areas and parents’
occupation hardships are the leading cause for rural children living in impoverished
conditions (Brown & Swanson, 2003). Coinciding with metropolitan cities and rural
impovershed towns are high dropout rates. (Balfanz & Legters, 2004)
Poverty rates are higher in non-metro areas than metro areas and the highest age
group living in poverty is rural children at 24.4% (Rural Income, Poverty, and Welfare:
Poverty Demographics, 2011). Poverty is the nature of over 50% of our children’s
environment and for those living in non-metro areas; poverty limits structured economic
opportunities (Tickamey and Duncan, 1990) According to USDA, Economic Research
Service, 67.6 % of non-metro African Americans are poor and live in high-poverty
counties compared to 20% metro African Americans who are poor living in high- poverty
counties. However, the trend for the percent of non-metro poor living in high-poverty
counties versus the percent of metro poor living in high-poverty county for all races is the

TEACHER PERCEPTIONS
14
same for other races but not as drastic. For Whites, non-metro is 27% versus metro at
11.9% and for Hispanic, non-metro is 39.6% versus metro at 18.4%.
The following Figure 2.2, shows the adverse consequences of an inequitable
education system.
Figure 2.2.The Ripple Effect of Poverty.
Demographics. In addition, to school size and geography, school-wide
demographics such as poverty and ethnicity composition are associated to dropout rates.
A high percentage of poverty and a low percentage of white students are correlated to an
increase in dropout rate (Christle, Jolivette, & Nelson, 2007; Balfanz & Legters, 2004;
Rumberger & Thomas, 2000). However, the effect of school size on minority students’
dropout rates is different for Hispanics and African American Students. Although
Hispanics have a higher graduation rates in smaller schools than larger schools (Darling-
Hammond, Peter, & Milliken, 2006; Greeney & Slate, 2012; Cotton, 1996), there is not a
significant difference in graduation rates for African American students (Slate & Jones,
2006; Greeney & Slate, 2012). Smaller schools can mitigate the impact of poverty on
school outcomes (Howley & Howley, 2004) and in juxtaposition, large school located in
impoverished communities are associated with increase dropout rates (Felter, 1989).

TEACHER PERCEPTIONS
15
Gardner, Ritblatt and Beatty (2000), found in their study that controlling for SES, smaller
schools had lower dropout rates than larger schools.
Out-of- School Suspension
School suspension is the strongest predictor of dropout, (Suh, Suh, & Houston,
2007; Suh & Suy, 2011; Christle, Jolivette, & Nelson, 2007) and studies have found that
student alienation; poor academic achievement and grade retention are strongly
associated with school suspension (Constenbader & Markson, 1994; Skiba, Peterson, &
Williams, 1997). Insinuating a school to prison pipeline for students who experience
multiple suspensions and expulsion (Fenning & Rose, 2007).
Students who require disciplinary actions and exhibit deviant behaviors are
associated to rates of dropout (Battin-Pearson, Newcomb, Abbott, Hill, Catalano, &
Hawkins, 2000; Christle, Jolivette, & Nelson, 2007). Out-of-school suspension is a
punishment for a range of misbehaviors that violate board policy (assault, drugs,
weapons, etc.,) or rules in the school conduct (non-compliance, disruptive behavior,
verbal aggression, etc.) however, suspension is not an effective discipline tool
(Costendbader & Markson, 1998; McFadden, Marsh, Price, & Hwang, 1992; Skiba R. ,
2000). According to the Center on Juvenile and Criminal Justice, the majority of the out-
of-school suspensions do not involve dangerous behavior (Brooks, Schiraldi, &
Ziedenberg, 1999). Furthermore, studies have found that most common misbehaviors
that result in suspension are defiance and disrespect (Skiba, Peterson, & Williams, 1997).

TEACHER PERCEPTIONS
16
At-risk Factors: Race, SES and Disability Interrelated
Race and Disability. The dropout rate disparity between whites and non-whites
and students with disability and their non-disabled peers, mirrors the disproportionate
number of minority students (Constenbader & Markson, 1994; Dupper & Bosch, 1996)
and the imbalanced number of students with disabilities that are suspended from school
(Allman & Slate, 2013). Minority students are suspended at a higher rate than Caucasian
students (Costendbader & Markson, 1998; Dupper & Bosch, 1996; Bowditch, 1993), and
Losen (2011) reports that suspensions among non-white students have double and the
racial discipline gap have tripled since 1972. Studies have found an overrepresentation of
African American students (Brooks, Schiraldi, & Ziedenberg, 1999; Skiba, Michael,
Nardo, & Peterson, 2000; Skiba & Peterson, 1999) and specifically, African American
males (Mendez, Knoff, & Ferron, 2002).
The frequency of K-12 suspensions increases as the school level increases for all
students but for students with disabilities it increases more than five times at the
secondary level as oppose to just doubling like their peers without disabilities. In
addition, the racial discipline gap grows exponentially (Losen & Martinez, 2013; ). In
Gonzalez’s study (2006), 46% of African American secondary students with disabilities
were suspended or expelled at least once during their school years. The over
representation of minority students suspended from school is also evident within the
group of students with disabilities with a gap of 9.97 percentage points between Black
students with disabilities and White students with disabilities between the ages of 3- 21
(Losen, 2011).

TEACHER PERCEPTIONS
17
Males with disabilities have the highest level of suspension rates at 38 percent
compared to their non-disabled male peers at 28% and their female peers with disabilities
at 22% (Gonzalez , 2006). Students with emotional and/or behavior disabilities are
suspended more frequently than students without disabilities (Morrison & D'Incau, 1997;
Mellard & Seybert, 1996; Gonzalez P. , 2006; Krezmien, Leone, & Achilles, 2006).
Achilles, Mclauglin and Cronniger (2007) found African American students with
learning disabilities were more likely to be suspended compared to students of other races
with same disabilities
SES. Student from low SES backgrounds are being suspended more frequently
than students from a high SES background (Nicholas, Ludwin, & Iadicola, 1999; Skiba,
Peterson, & Williams, 1997; Bowditch, 1993). According to the “Kids Count” data
center, in 2012, 23% of children 18 and younger are considered impoverished (living
below the poverty level as defined by the U.S. Office of Management and Budget). In
2012, the breakdown of children living in poverty comprised 40% of Black or African
American, 34% of Hispanic or Latino, 15% of Asian or Pacific Islander and 14% of Non-
Hispanic or White. In the last five years, African American and Hispanic percentage of
impoverished children has increased 6%- double the increase of Asian or White
percentage at 3%.
Research highlights conflicting findings whether poverty is a contributing factor
or a sole contributing factor. Mendez and Knoff (2003) assert that low SES is not a
primary predictor of out-school suspensions alone. In their study, 78% of Black and 72
% of Hispanics were low-SES but fewer Hispanic students received out-school-
suspensions. Wu et. al (1982), also found that SES alone is not significantly correlated to

TEACHER PERCEPTIONS
18
suspension rates but other studies show that poverty is significantly related to high
suspension rates when controlling for race and disability. (Achilles, Mclauglin, &
Cronniger, 2007; Christle, Jolivett, & Nelson, 2004). However, numerous studies report
the significant impact of demographics such as race, SES and gender on suspension rates
when combined.
In 2000, the United States Department of Education reported that 71.5% of all
suspensions were males (Atkins, et al., 2002). Multiple studies have confirmed the DOE
statistics, finding that gender is significantly correlated with suspension rates with a
disproportionate number of males receiving out-of-school suspensions (Mendez, Knoff,
& Ferron, 2003; Engec, 2006; Skiba R. , 2000). Impoverished, African American males
are more likely to be suspended then any other group (Skiba R. , 2000; Kremien, Leone,
& Achilles, 2006). School characteristics such as school climate and inconsistent
classroom management are possible influencing variables for imbalanced suspension
rates (Engec, 2006; Mendez & Knoff, 2003; Townsend, 2000).
Perceptions of School Environment
Student Perceptions
Gregory, Cornell, & Fan (2011)investigated the relationship between suspensions
for black and white high school students and school climate. The researchers assessed
school-wide climate in regards of school structure and support (authoritative
teaching/parenting characteristics) through surveys completed by over 500 ninth graders
across of 199 schools in the state of Virginia. The surveys incorporated, The Supportive
School Climate Scale of Austin and Duerr (2006), The Academic Press Scale (Midgley et
al., 2000) and Experience of School Rules (NCES, 2005) and ascertained the school

TEACHER PERCEPTIONS
19
climate from the students’ perceptions. The schools that were seen indifferent- low
structure (demandingness) and low support (responsiveness), by students had the largest
racial disciplinary gap and schools that lacked authoritative characteristics- high support
(relationships) and high structure (expectations) had the highest school wide suspension
rates for Black and White students. The study did find that school enrollment, poverty,
and urbanity were not found to be significant predictors of disproportion suspension rates
between Black and White students nor a predictor of Black students suspensions.
Figure 2.3 below illustrates the concept that inequitable education is inherent in
school sytems with diverse learners which leades to discipline and academic problems.
Those discipline and academic problems can lead to student dropout or inadvertently a
push out school
Figure 2.3. The Circular Relationship
Teacher Perceptions
Another study conducted by Gregory & Ripski, (2008) assessed the perception of
classroom environment from both students and teachers experiences. High school
students that had received in-school suspension referrals completed a survey about their
At-Risk Students
Inequitable Education
Out-of-School Suspension
Achievement Gap
Dropout/Push-Out

TEACHER PERCEPTIONS
20
own behavior using the Defiance Scale and a survey about trust in teacher authority using
an adapted trust scale. The teachers rated the referred students using a defiance subscale
of the Swanson, Nolan, and Pelham measure (SNAP-IV) and completed a semi-
Structured interview regarding typical discipline problems and their discipline practices.
The investigators found that teachers who used a relationship approach to discipline had
lower defiance from students and students perceived themselves as more engaged in
classroom of teachers that used a relationship approach to discipline. The authors also
purport, “…teacher beliefs about discipline may be detectable in how they interact with
students” (p. 346). The investigators findings showed an association between teachers
who discussed the importance of relationships in discipline practices were more likely to
have students who perceived them as trustworthy authority figures.
The reality of the school environment is held by teacher perceptions. A
school climate built upon shared values upheld by teachers may influence student
learning (Bryk & Driscoll, 1988), and a positive school climate is associated with school
effectiveness (Borger, Lo, Oh, & Walberg, 1985). Supporting the importance of teacher
perception of student conduct, Gregg (1995), highlighted student discipline and
classroom management are primary concerns for high school teachers as oppose to
pedagogical content. In addition, classroom management is an area that teachers would
like to receive more training (Maag, 2002).

TEACHER PERCEPTIONS
21
Perception of Administration Support
Newmann and Wehlage (1989), found that a strong sense of school community is
linked to small size schools, orderly student behavior, and administrators are responsive
to teacher concerns. Specifically, orderly behavior by students is perceived as a critical
factor influencing teachers’ efficacy. Teachers perceive themselves as a strong influence
on student behavior (Tillery, Varjas, & Collins, 2010). Caprara et. al, (2006) found that
teachers’ with perceived self-confidence in their classroom management capabilities is
associated with job satisfaction. For beginning teachers especially, classroom discipline
is the perceived most serious problem (Veenman, 1984) and it is also a source of stress
and decreased job satisfaction (Turk, Meeks, & Turk, 1982; Burke, Greenglass, &
Schwarzer, 1996; Clunies-Ross, Little, & Kienhuis, 2008).
Riehl and Sipple (1996) define school climate as a level of administrative support,
teacher influence and autonomy, and collegiality. Also, related to school climate is school
community, which is defined by Royal and Rossi (1999)
“…communication is open, participation is widespread,
teamwork is prevalent, and diversity is incorporated. Staff
members and students share a vision for the future of the school, a
common sense of purpose, and a common set of values. They care
about, trust, and respect each other, and they recognize each
other’s efforts and accomplishments.” p. 260.
In a study conducted by Litt and Turk (1985), discipline problems were not a
major contributor to stress but role conflict such as, “…amount of work versus quality of
TEACHER PERCEPTIONS
22
work, job demands versus needs of pupils, and conflicts with school personnel,
particularly with colleagues.” (p.183). The study also found that teachers who perceived
their principals to be aware of the school problems and interested in teachers’ welfare and
professional development are satisfied with their job (Litt & Turk, 1985). Schonfeld
(2001), found that a negative school climate causes poor morale in new teachers shortly
after hiring. The lack of supervisor support is also related to a negative work
environment, whereas the presence of supervisor support is linked to concurrent self-
esteem and future motivation in new teachers (Schonfeld, 2001).
Purpose of the Study
The purpose of this study is to illuminate relationships in data collected through
the Kentucky State Report Cards and the Kentucky TELL Survey. The data banks obtain
valuable information on outcomes and perceptions that can provide information that
guides strategic planning and interventions. The results of this study will provide insight
to the inequities within Kentucky schools.

TEACHER PERCEPTIONS
23
CHAPTER III: METHODOLOGY
Research Questions
The following research questions are addressed:
1. What is the relationship between student characteristics, school characteristics and
teacher perceptions of student management with graduation rates?
2. What is the relationship between student characteristics, school characteristics and
teacher perceptions of student management with out-of-school suspensions?
Context
The sample size includes 202 Kentucky high schools excluding dependent
districts, alternative schools and specialized schools. In order for a school to be included
in the sample, they had to be public and grades 9-12. Based on the 2011- 2012 Kentucky
State Report Card, the total student population was 649, 688 and 188,770 students were
enrolled in grades 9-12. The overall composition of student demographics in Kentucky
schools include 14.6% non-white, 51.4 % male and 48.6 % female, and 367,113 students
receive Free or Reduced lunch. The overall AGR for the 2011-2012 (actual 2010-2011
due to the one-year lag) graduation rate was 77.8% for the state and 5.3 % students
received out-of-school suspensions but 9.3% behavior incidents resulted in out-of-school
suspensions.
Data Collection
Kentucky State Report Cards. The Kentucky State and District Report Cards
are required by Kentucky statue KRS 158.6453 and regulation 703 KAR 5:140 to report
test performance, teacher qualifications, student safety and incorporate addition data as
required under the NCLB Act.

TEACHER PERCEPTIONS
24
TELL Survey. The TELL survey is an online anonymous survey given to every
licensed school-based educator to assess teaching conditions at the school, district and
state level. The survey is voluntary and can only be taken once. Each school-based
educator is given an access code to help keep anonymity; responses cannot be connected
to the individual. TELL survey reports are released for schools that reach at least a 50%
response rate and a minimum of 5 teachers. Results from the survey provide decision-
making data in the areas of facilities and resources, professional development,
collaboration and instruction. In addition, the New Teacher Center (NTC) report that
teaching conditions, student achievement and teacher retention are positively associated.
Tell survey response. On the 2011 Kentucky Tell Survey, 37,381 (88.9%)
Kentucky teachers anonymously self-reported teaching and learning conditions based on
eight constructs: Time, Facilities and Resources, Community Support and Involvement,
Managing Student Conduct, Teacher Leadership, School Leadership, Professional
Learning, and Instructional Practices and Support. By school level, 10,341(70.3%) high
school teachers responded to the 2011Kentucky Tell Survey and the Average Rate of
Agreement on Managing Student Conduct construct amongst the high school teachers
was 73%. On the individual statements , which comprise the Managing Students
Construct, four out of the seven statements received less that 80% average agreement
from high school teachers . The following statements were: “Students at this school
follow rules of conduct”, 71.4%; School administrators consistently enforces rules for
student conduct”, 70%; “School administrators support teachers’ efforts to maintain
discipline in the classroom”, 79.6%; and lastly, “Teachers consistently enforce rules for
student conduct”, 77.6%.

TEACHER PERCEPTIONS
25
Sample
The sample size includes 201 Kentucky high schools excluding dependent
districts, alternative schools and specialized schools. In order for a school to be included
in the sample and they had to be public and grades 9-12. On the 2011 Kentucky Tell
Survey, 10,341(70.3%) high school teachers anonymously self-reported teaching and
learning conditions based on eight constructs: Time, Facilities and Resources,
Community Support and Involvement, Managing Student Conduct, Teacher Leadership,
School Leadership, Professional Learning, and Instructional Practices and Support
Table 3.1 Descriptive Statistics
Descriptive Statistics
N Minimum Maximum Mean Std. Deviation
Total Enrollment 201 101 2107 837.93 428.69
Percent Eligible for Free/Reduced Lunch 200 .05 .88 .53 .17
Percentage of Non-White Students 201 .30 91.00 13.48 16.00
Percentage of Teachers with 201 18 70 48.24 8.58
Percentage of Teachers with Rank I 201 9 70 33.28 11.49
Average Years of Teaching Experience 201 5.7 17.9 11.72 2.03
Variables and Measures
School characteristics, student characteristics and outcomes for each school
included in this study were collected from the 2011-2012 Kentucky School Report Card
using the Kentucky Department of Education website. The Learning Environment

TEACHER PERCEPTIONS
26
section reports students’ characteristics and safety information such as out-of-school
suspension.
Dependent Variables
Graduation Rate. The graduation rate is determined by AFGR and is reported
under the Accountability section of the report card.
Suspension Rate. The suspension rate is the total percentage of students
suspended at each school based on the calculation used in Kentucky Report Cards under
Safety tab within the Learning Environment section .
Predictor Variables
School size. Total enrollment of each school
Race. Percentage of non-white students
SES. Mean percentage of students receiving free or reduced lunch at school.
Disability. Percentage of students receiving services under IDEA
Managing Student Conduct. Teachers’ perceptions on managing student
conduct is reported on the Kentucky Teaching, Empowering, Leading and Learning
(TELL) survey every year. The TELL survey is an on-line survey about the working
conditions of Kentucky schools and completed anonymously by public teachers from
across the state. Managing student conduct is one construct of the eight assessed.
Managing student conduct asks educators to rate their level of agreeability using a likert
on seven statements. The liker scale is a mean score for all teachers at a school at the

TEACHER PERCEPTIONS
27
school level. The likert scale ranged from “Strongly disagree”, “Disagree” , “Agree”,
and “Strongly agree”.
1. Students at this school understand expectations for their conduct.
2. Students at this school follow rules of conduct.
3. Policies and procedures about student conduct are clearly understood by the
faculty.
4. School administrators consistently enforce rules for student conduct.
5. School administrators support teachers’ efforts to maintain discipline in the
classroom.
6. Teachers consistently enforce rules for student conduct.
7. The faculty works in a school environment that is safe.
Table 3-2 Reliability of Managing Student Conduct
Reliability Statistics
Cronbach's Alpha N of Items
.961 7

TEACHER PERCEPTIONS
28
Research Design
Secondary data obtained from the 2011-2012 Kentucky School Report Cards and
the 2011 Kentucky Tell Survey will be analyzed with simple linear regressions.
Specifically, the secondary data includes: graduation rates, out-of-school suspension
rates, percent of students who receive free/reduce lunch, percentage of non-white
students, percentage of students with Individual Education Plans (IEP), total enrollment,
and the mean scores of teachers’ perceptions of managing student conduct as report on
the 2011 TELL survey.
Reliability and Validity of TELL Survey
The Tell survey was analyzed for construct validity using a statistical measurement
model called the Rasch Rating Scale Model and National Teacher Center reports “that
the TELL survey holds up to a number of tests of its technical validity” (National
Teacher Center, 2011, p. 3). Construct validity means that survey questions measure the
eight constructs . Survey reliability means the survey has internal consistency.
Cronbach’s alphas were calculated on the eight major constructs of the TELL survey to
test reliability. Each of the constructs had an alpha coefficient above 0.848. Specifically,
Managing Student Conduct was reliable with an alpha at .904 (National Teacher Center,
2011).
Data Analyses
Descriptive statistics were calculated including the means and standard deviation
of graduation Rates, out-of-school suspension and the TELL survey managing student
conduct responses. Simple linear regressions are employed to determine if teacher

TEACHER PERCEPTIONS
29
perception of managing student conduct, school characteristics (size) and student
characteristics (SES, race and disability) predict graduation rates and out of school.
Limitations of the Study
One limitation to this is the reliability of self-report by the students and the
teachers. At the high school level, students don’t apply for free and reduce lunch. High
school students may choose not to turn in the form, may bring their own lunch or may be
enrolled in a co-op class and eat off school grounds. The percentage of students that
qualify for free and reduce lunch is most likely under-represented on the Kentucky
School Report card. The Tell Survey data are self-reported based on the individual’s
perception and may not reflect reality.
Another limitation of this study is the use of school level data and all schools are
counted as equal. School level data mask individual sentiments.
TEACHER PERCEPTIONS
30
CHAPTER IV: RESULTS
The purpose of this research was to determine if a correlational relationship exists
between student characteristics, school characteristics, and teacher perceptions with
graduation rates and out-of-school suspension in the state of Kentucky’s public high
schools; specifically, teacher perceptions towards students’ code of conduct.
Review of Data Collection and Analysis
Secondary data obtained from the 2011-2012 Kentucky School Report Cards and
the TELL Survey. The secondary data included: graduation rates, out-of-school
suspension rates, percent of students who receive free/reduce lunch, percentage of non-
white students, total enrollment, and the mean scores of teachers’ perceptions of
managing student conduct as report on the 2011 TELL survey.
Descriptive statistics were calculated including the means and standard deviation
of graduation Rates, out-of-school suspension and the TELL survey managing student
conduct responses. Simple linear regressions were employed to determine if teacher
perception of managing student conduct, school characteristics (size) and student
characteristics (SES, race and disability) predict graduation rates and out of school.
Teachers’ Perceptions with Suspension and Graduation
The means of managing student conduct taken from the 2011 TELL Survey
consists of seven statements. Managing student conduct asks educators to rate their level
of agreeability using a likert on seven statements. The liker scale is a mean score for all

TEACHER PERCEPTIONS
31
teachers at a school at the school level. The likert scale ranged from “Strongly disagree”,
“Disagree”, “Agree”, and “Strongly agree”. (see Table 4.1)
Table 4.1 Means of Managing Student Conduct Items
Descriptive Statistics
N Mean Std. Deviation
The faculty works in a school environment that is safe. 201 3.19 .28
School administrators consistently support teachers' efforts
to maintain discipline in the classroom.
201 2.92 .42
Policies and procedures about student conduct are clearly
understood by the faculty.
201 2.92 .29
Students at this school understand expectations for their
conduct.
201 2.89 .36
School administrators consistently enforce rules for student
conduct.
201 2.63 .46
Teachers consistently enforce rules for student conduct. 201 2.60 .28
Students at this school follow rules of conduct. 201 2.55 .39
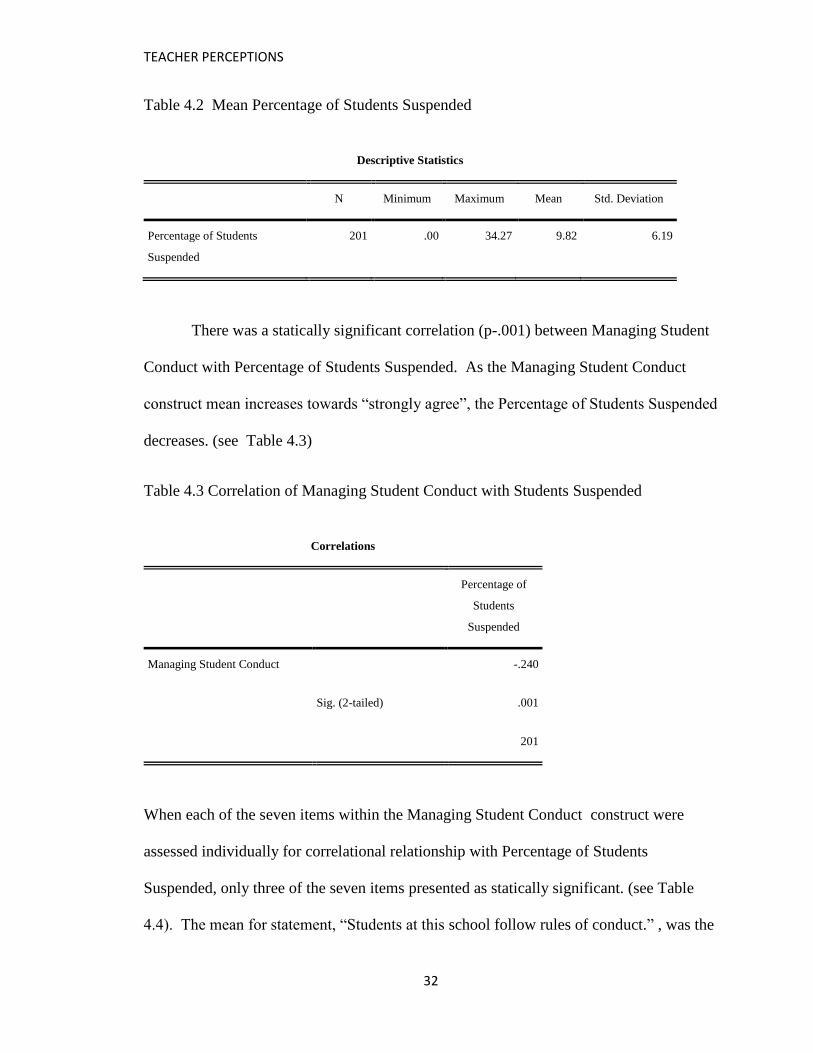
Using descriptive statistics, the mean percentage of students suspended (M =9.82, SD =
6.19) from 201 Kentucky public high schools (see Table 4.2).
TEACHER PERCEPTIONS
32
Table 4.2 Mean Percentage of Students Suspended
Descriptive Statistics
N Minimum Maximum Mean Std. Deviation
Percentage of Students
Suspended
201 .00 34.27 9.82 6.19
There was a statically significant correlation (p-.001) between Managing Student
Conduct with Percentage of Students Suspended. As the Managing Student Conduct
construct mean increases towards “strongly agree”, the Percentage of Students Suspended
decreases. (see Table 4.3)
Table 4.3 Correlation of Managing Student Conduct with Students Suspended
Correlations
Percentage of
Students
Suspended
Managing Student Conduct -.240
Sig. (2-tailed) .001
201
When each of the seven items within the Managing Student Conduct construct were
assessed individually for correlational relationship with Percentage of Students
Suspended, only three of the seven items presented as statically significant. (see Table
4.4). The mean for statement, “Students at this school follow rules of conduct.” , was the

TEACHER PERCEPTIONS
33
strongest predictor of out-of-school suspension (r= -.372, p= .000), followed by, “The
faculty work in a school environment that is safe.”, (r= -.313, p= .000 ), and “Students at
this school understand expectations for their conduct.”, (r= -.257, , p= .000). The other
four items are unrelated.
Table 4.4 Correlations of Managing Student Conduct Items with Students Suspended
Correlations
Percentage of
Students
Suspended
Students at this school understand expectations for their
conduct.
-.257
Sig. (2-tailed) .000
201
Students at this school follow rules of conduct.
-.372
Sig. (2-tailed) .000
201
Policies and procedures about student conduct are clearly
understood by the faculty.
-.145
Sig. (2-tailed) .040
201
School administrators consistently enforce rules for student
conduct.
-.165
Sig. (2-tailed) .019
201

TEACHER PERCEPTIONS
34
Table 4.4 (continued).
Percentage of
Students
Suspended
School administrators consistently support teachers' efforts to
maintain discipline in the classroom.
-.188
Sig. (2-tailed) .008
201
Teachers consistently enforce rules for student conduct.
-.078
Sig. (2-tailed) .270
201
The faculty works in a school environment that is safe.
-.313
Sig. (2-tailed) .000
201
The next set of analysis explored correlations between Managing Student Conduct
and Graduation Rates. Using descriptive statistics, the mean high school graduation rate
(M=78.93, SD = 8.80 ) was calculated (see Table 4.5) from 201 Kentucky public high
schools.
Table 4.5 Mean Graduation Rates
Descriptive Statistics
N Minimum Maximum Mean Std. Deviation
Graduation Rate 201 40 100 78.93 8.80

TEACHER PERCEPTIONS
35
The results of a linear regression analysis between Managing Student Conduct and
Graduation Rates show a weak relationship (r = .207, p = .003) (see Table 4.6).
Table 4.6 Correlation of Managing Student Conduct with Graduation Rates
Correlations
Graduation Rate
Managing Student Conduct .207
Sig. (2-tailed) .003
201
However, when the seven items within Managing Student Conduct construct are
analyzed individually with Graduation rates, one item shows a moderate correlation and
two show a weak correlation. The item, “Students at this school follow rules of
conduct.”, has a moderate positive relationship with graduation rates (r =.310, p =.000).
“Students at this school understand expectations for their conduct.” (r = .230, p = .001)
and “The faculty work in a school environment that is safe.” (r = .241, p = .001), show a
weak positive correlation. There is no correlation between remaining items and
graduation rates (see Table 4.7).
Table 4.7 Correlations of Managing Student Conduct Items with Graduate Rates
Correlations
Graduation Rate
Students at this school understand expectations for their
conduct.
Pearson Correlation .230
Sig. (2-tailed) .001
N 201

TEACHER PERCEPTIONS
36
Table 4.7 (continued).
Graduation Rate
Students at this school follow rules of conduct.
Pearson Correlation
.310
Sig. (2-tailed) .000
N 201
Policies and procedures about student conduct are clearly
understood by the faculty.
Pearson Correlation .139
Sig. (2-tailed) .050
N 201
School administrators consistently enforce rules for student
conduct.
Pearson Correlation .143
Sig. (2-tailed) .042
N 201
School administrators consistently support teachers' efforts to
maintain discipline in the classroom.
Pearson Correlation .184
Sig. (2-tailed) .009
N 201
Teachers consistently enforce rules for student conduct. Pearson Correlation .054
Sig. (2-tailed) .447
N 201
The faculty works in a school environment that is safe. Pearson Correlation .241
Sig. (2-tailed) .001
N 201

TEACHER PERCEPTIONS
37
The results of the single linear regression model between Percentage of Students
Suspended with Graduation Rates show a statistically significant negative correlation (r =
`.475, p = .000) (see Table 4.8)
Table 4.8 Correlations of Percentage of Students Suspended with Graduation Rates
Correlations
Graduation Rate
Percentage of
Students
Suspended
Graduation Rate Pearson Correlation 1 -.475**
Sig. (2-tailed) .000
N 201 201
Percentage of Students
Suspended
Pearson Correlation -.475** 1
Sig. (2-tailed) .000
N 201 201
**. Correlation is significant at the 0.01 level (2-tailed).
Student characteristics, school characteristics and teacher perceptions as
predictors of out-of-school suspension. As a whole, these predictors account for 32.6%
of variance in Percentage of Students Suspended (R2 =.316, p = .000) (see Tables 4.9
and 4.10)
Table 4.9 Probability of Variance of Percentage of Students Suspended
Model R R Square
Adjusted R
Square
Std. Error of the
Estimate
1 .562a .316 .302 5.15974
a. Predictors: (Constant), Percentage of Non-White Students, Percent Eligible
for Free/Reduced Lunch, Managing Student Conduct, Total Enrollment

TEACHER PERCEPTIONS
38
Table 4.10 Regression of Students Suspended with Predictors
ANOVAa
Model Sum of Squares df Mean Square F Sig.
1 Regression 2400.348 4 600.087 22.540 .000b
Residual 5191.465 195 26.623
Total 7591.813 199
a. Dependent Variable: Percentage of Students Suspended
b. Predictors: (Constant), Percentage of Non-White Students, Percent Eligible for Free/Reduced Lunch,
Managing Student Conduct, Total Enrollment
Managing Student Conduct, Percent Eligible for Free/Reduced Lunch and
Percentage of Non-White Students are significant predictors of Percentage of Students
Suspended. There is a positive relationships between the two predictors low SES and
minorities with out-of-school suspension and an inverse relationship between perception
of student behavior and out-of-school suspension. The higher the free and reduced lunch
enrollment and minority students, the higher out-of-school suspension. The lower the
agreeability amongst the teachers regarding managing student behavior, the higher out-
of-school suspension. The most powerful to least powerful predictors are Percentage of
Non-White Students (β = .381 ), Percent Eligible for Free/Reduce Lunch (β = .318) and
Managing Student Conduct (β = - .140). Total Enrollment is a non-significant predictor
(p = .369). (see Table 4.11)

TEACHER PERCEPTIONS
39
4.11 Coefficients of Students Suspended with Predictors
Coefficientsa
Model
Unstandardized Coefficients
Standardized
Coefficients
t Sig. B Std. Error Beta
1 (Constant) 9.919 4.059 2.444 .015
Managing Student Conduct -2.670 1.157 -.140 -2.308 .022
Total Enrollment -.001 .001 -.064 -.900 .369
Percent Eligible for
Free/Reduced Lunch
11.763 2.537 .318 4.637 .000
Percentage of Non-White
Students
.147 .025 .381 5.938 .000
a. Dependent Variable: Percentage of Students Suspended
Student characteristics, school characteristics and teacher perceptions as
predictors of high school completion. As a whole, these predictors account for 27.7% of
variance in Graduation Rates (R2 =.277 p = .000) (see Tables 4.12 and 4.13)
Table 4.12 Probability of Variance in Graduation Rates
Model R R Square
Adjusted R
Square
Std. Error of the
Estimate
1 .526a .277 .262 7.573
a. Predictors: (Constant), Percentage of Non-White Students, Percent Eligible
for Free/Reduced Lunch, Managing Student Conduct, Total Enrollment

TEACHER PERCEPTIONS
40
Table 4.13 Regression of Graduation Rate with Predictors
ANOVAa
Model Sum of Squares df Mean Square F Sig.
1 Regression 4282.868 4 1070.717 18.671 .000b
Residual 11182.476 195 57.346
Total 15465.344 199
a. Dependent Variable: Graduation Rate
b. Predictors: (Constant), Percentage of Non-White Students, Percent Eligible for Free/Reduced
Lunch, Managing Student Conduct, Total Enrollment
Total Enrollment, Percent Eligible for Free/Reduced Lunch and Percentage of
Non-White Students are significant predictors of Graduation Rate. There is an inverse
relationship between the school size, low SES and minorities with high school
completion . The lower the school enrollment, free and reduced lunch enrollment and
minority students, the higher probability of high school completion. The most powerful to
least powerful predictors are Percent Eligible for Free/Reduce Lunch (β = -.435)
Percentage of Non-White Students (β = -.220), and Total Enrollment (β = - .219).
Managing Student Conduct is a non-significant predictor (p = .130). (see Table 4.14)

TEACHER PERCEPTIONS
41
Table 4.14 Coefficients of Graduation Rates with Predictors
Coefficientsa
Model
Unstandardized Coefficients
Standardized
Coefficients
t Sig. B Std. Error Beta
1 (Constant) 89.254 5.957 14.984 .000
Managing Student Conduct 2.581 1.698 .095 1.520 .130
Total Enrollment -.005 .002 -.219 -3.000 .003
Percent Eligible for
Free/Reducaed Lunch
-22.957 3.723 -.435 -6.167 .000
Percentage of Non-White
Students
-.121 .036 -.220 -3.327 .001
a. Dependent Variable: Graduation Rate

TEACHER PERCEPTIONS
42
CHAPTER V: DISCUSSION
As outlined in the introduction, a large body of research has illuminated that
both student characteristics and school characteristics influence obtainment of a high
school diploma (Balfanz & Legters, 2004; Carpenter & Ramirez, , 2007; Chapman,
Laird, Ifill, & KewalRamani, 2011; Christle, Jolivette, & Nelson, 2007; Felter, 1989;
Gleason & Dynarski, 2002; Jordon, Lara, & McParland, 1996; Murray & Naranjo, 2008).
The overarching theme of this investigation confirm that improvised students and
minority students in Kentucky are less likely to graduate from high school and more
likely to be suspended from high school. The data also indicates that as the percentages
of students suspended in Kentucky increase, the graduation rate in Kentucky decreases.
Study Findings
Research Question 1: What is the relationship between student characteristics,
school characteristics and teacher perceptions of student management with graduation
rates? An ANOVA analysis showed that school size, managing student conduct,
minority status and low SES, collectively predicts the probability of the obtainment of a
high school diploma in the state of Kentucky (R =.526, p = .000). Upon closer
examination at the coefficients individually, only a three had a significant impact on
graduation rate. The percentage of eligible students for free/reduce lunch was the
strongest predictor (β= -.435, p = .000) of Graduation Rate and over twice as influential
as Percentage of Non-White Students (β = -.220, p= .001) and total enrolment (β = -.219,
p = .003). Students from low SES were considered the most at-risk for dropping out of
high school. School size had a weak negative correlation with high school completion,
which given the school demographics of Kentucky, this researcher is curious if the school

TEACHER PERCEPTIONS
43
size is more a reflection of geography (rural vs. metro); given the research
aforementioned in the literature review, majority of rural areas are impoverished
compared to metro areas. (Suy, 2011). In Kentucky, 85 of the 120 counties are
considered rural (United States of Department of Agriculture, 2013) and 26.5 % of our
kids live in poverty (The Annie E. Casey Foundation, 2013). In this study, school size
does not mitigate the effects of poverty, countering Howley & Howely’s (2004) results,
therefore a future question would be “Does geography exacerbate or mitigate the
effectives of poverty?”
Research Question 2: What is the relationship between student characteristics,
school characteristics and teacher perceptions of student management with out-of-school
suspensions? An ANOVA analysis showed that school size, managing student conduct,
minority status and low SES, collectively predicted the probability of out-of-school
suspension (R =. 562, p =.000). Only three predictors individually display statistically
significant correlation with Percentage of Student Suspended. Percentage of Non-White
Students (β = .381, p = .000) and Percentage of Eligible Free/Reduce Lunch Students (β
= .318, p = .000) has a moderate positive relationship with out-of-school suspension
following the national trend of who is suspended from schools. (Christle, Jolivette, &
Nelson, 2007; Petras, Masyn, Buckley, Ialongo, & Kellam, 2011; Raffaele Mendez &
Knoff, 2003) The predictor Total Enrollment was not a statistically significant predictor,
indicating that whether or not the high school is low enrollment or high enrollment, is not
a risk factor for the percentage of students suspended from school. Managing Student
Conduct (β = -.140, p = .022) had a weak but statistically significant negative correlation
to out-of-school suspension. The fewer teachers agree to the items on the Managing

TEACHER PERCEPTIONS
44
Student Conduct construct, the more likely the percentages of students were suspended
from school.
It can be inferred that students culturally different or in the minority demonstrated
behaviors that school deem an expulsive offense. As stated earlier in the literature
review, the cause of the students suspended can range from board violations (weapons,
drugs, fights) to code of conduct violations (profanity, insubordination, disrespect)
(Raffaele Mendez & Knoff, 2003). This researcher is curious if the staff demographics
reflect the students’ demographics and the nature of the behavior infraction, which
resulted in a suspension. Based on the teachers’ perception of Managing Student
Conduct, schools that have teachers who believe student conduct is not well managed, are
the schools with students that exhibit expulsive behaviors. This findings pose additional
questions regarding the circumstance in which school expectations are developed,
delivered and enforced. Do the students not know the school/classroom expectations? If
the students know the expectations, are the expectations aligned with home values and
share beliefs? Are the expectations taught in accordance with the school context and do
teachers and administrator enforce these expectations consistently to all students?
Post-Hoc: TELL Survey- Managing Student Conduct Construct. Based on the
results of this study, it appears that Managing Student Conduct construct is a more
powerful predictor of the Percentage of Students Suspended (r = -.240, p = .001) than the
Graduation Rate (r = .207, p = .003). Precisely, among the seven statements within the
Managing Student Construct, only three statements significantly correlated with student
suspension rate and the high school completion rate. Interestingly, the same three
statements: “Students at this school understand expectations for their conduct.” (M=

TEACHER PERCEPTIONS
45
2.89, SD = .36); “Students at this school follow rules of conduct.” (M = 2.55, SD = .39);
and “The faculty work in a school environment that is safe.” (M = 3.19; SD = .28); were
the most powerful predictors with both dependent variables. The seven items that made-
up the Managing Student Construct was coded for perceptions, which were considered
internal to teacher control or external to teacher control. The three statements mentioned
above as significantly correlated with the dependent variables, Percentage of Students
Suspended and Graduation Rates, were coded as external. The other four statements,
“Policies and procedures about student conduct are clearly understood by the faculty.”
(M= 2.92, SD = .29); “School administrators consistently enforce rules for student
conduct.” (M= 2.63, SD = .46); “School administrators consistently support teachers’
efforts to maintain discipline in the classroom.” (M= 2.92, SD = .42); and “Teachers
consistently enforce rules for student conduct.” (M= 2.60, SD = .26), were coded as
internal to teacher control and were not correlated with the dependent variables.
Based on the correlations of Managing Student Conduct Items with Percentage of
Students Suspended, it can be interpreted that teachers who self reported that students in
their school did not follow school rules -worked in schools with higher rates of
suspension (r = -372, p = .000). Teachers who felt they taught in an unsafe environment
- worked in schools with higher rates of suspension (r =. -313, p = .000) and teachers who
believed that students do not understand expectations - work in a school with higher
suspension rates (r = .257, p = .000). Based on this study’s results, it can also be
concluded that the minority and impoverished students are most like to be suspended and
their teachers assume they do not understand the rules nor follow the rules (see Table
4.11) and subsequently less likely to graduate (see Table 4.8)
TEACHER PERCEPTIONS
46
The correlations between Managing Student Conduct items and Graduation Rate
present similar results to the other dependent variable Percentage of Students suspended
but not in magnitude. Based on the responses of the teachers from the TELL Survey,
teachers who agree that students follow schools rules, also work in schools with a higher
graduation rate (r = .310, p = .000). There is also a weak but statistically significant
correlation between graduation rate and teachers who report that their school is a safe
environment (r = .241, p = .001) and the students understand school rules (r = .230, p =.
001). It can be concluded that not only students’ scholastic skills correlate with high
school success, but also their ability to understand and follow school expectations as
perceived by their teachers.
Implications
Cultural Social Dominance Approach
The multiple regression analysis showed that race was the most powerful
predictor of out-of-school suspension (β= .381). A school with predominately white
educators inherently creates a culture based on white middle-class systems, expectations
and social norms, which reflect a white middle-class home environment. As evident of
the recruiting efforts to hire minority teachers in the state of Kentucky and across the
nation, Kentucky and American schools are predominately led by white educators in
administration and white females in the classroom (U.S. Department of Education, 2012).
The luxury of ignorance allows many dominant culture educators to
remain unaware of the intense “socio-cultural misalignment between
home and school” (Comer, 1988, p. 44) that is experienced by students
from poor and racially diverse backgrounds. Even for those children of

TEACHER PERCEPTIONS
47
color who are successful, school is often experienced as a foreign
environment (Aronson, 2004; Steele, 2004)…..On the other hand, for me
and for most of my White middle-class colleagues, the neighborhood
school in the suburbs was a direct reflection of our home environment.
(Howard, 2006, p. 120).
Social Dominance can also be viewed from a gender context as well. In an
example from The Future of Affirmative Action: Reclaiming the Innovative Ideal by
Sturm and Guiner, female law students did not feel comfortable meeting with their
professors outside of class, nor participating in class discussion. The class culture did not
enable equal participation from both male and female students, despite the uniform
treatment to both sexes. “The existing culture normalizes only one approach to
performance and, in the process, reinforces the capacity of some people to be fairly
evaluated and to perform” and “Sameness may not be fairness in this context” (1996, p.
985). Although, this study did not investigate the relationship between gender and Out-
of-School Suspension and Graduation Rate, the line of reasoning follows that the culture
of a classroom or school may be based on the values and social norms of the school
leaders as oppose to the student population. The students that come from a different
background from those in charge, may experience defeat the moment they walk through
the school or classroom doors.
Minority students that resist schooling are associated with acculturative
adjustment problems in school and experience a cultural distance between home and
school, Jacob and Jordan, 1993. Despite, high-aspirations of minority families and
communities, the structural discrimination contribute to the underachievement of

TEACHER PERCEPTIONS
48
minority students. Structural discrimination in the classroom from the minority side,
such as the language used in the teachers’ instructions, the structuring of school tasks
based on the teacher’s social and/or cultural background may exclude diverse learners
(Phalet, Andriessen, & Lens, 2004).
Poverty was the strongest predictor of high school completion in this study. A
student who is eligible for free/reduce lunch family’s values may different greatly from
their teachers’ values, impacting their ability to understand and follow the classroom or
school wide norms and expectations. Cultural Responsive Teaching (CRT) involves
delivery of instruction using pedagogical approaches that incorporates characteristics of
diverse learners’ cultural background within the students’ frame of reference based on
personal experience and perspective (Gay, 2002). Diverse learner’s cultural background
includes learning styles, communication styles, socializations, traditions, and values.
For example, at this researcher’s school, an African American female student who
qualifies for free/reduced lunch took an apple in a Styrofoam container from the lunch
line. Once at the cashier, the cafeteria worker told her that she would be charge extra for
the apple (based on the definition of a complete breakfast which meets specific caloric
and nutritional guidelines). The student put the apple in the Styrofoam bowl back where
she got it form. The Caucasian female cafeteria manager, harshly corrected her that if
you “touch it, it is yours”. The now agitated student yelled back and left the cafeteria.
I received the referral for her disrespectful behavior and non-compliance. When I
conferenced with this student who is a senior with a part-time job and attends Certified
Nursing Certification vocation program, she explained that she did not know the rule.
She stated, “In my house, we don’t waste food”. Still agitated, she went on to say, “Last

TEACHER PERCEPTIONS
49
year or my first year here, I would have cussed her out- she is lucky I didn’t go-off on
her”. I agree with her comment. Fortunately the young lady’s maturity has allowed her
enough self-regulation to manage her emotions and make good choices following her
feeling of being accosted. The student also shared with me, in her own words, how
valuable the vocational program was to her and she did not want to mess that up and fall
behind in her classes.
I took this “teachable moment” to explain the reasoning behind the rule the
cafeteria manger was enforcing and alternative ways to respond. We discussed social
skills such as tone, facial expressions; gestures and word choice. Using business
appropriate mannerism, the student could have self-advocated instead of negatively
reacting by a) asking why the apple is an extra charge; b) explain personal perspective
that the apple was not handled, only the Styrofoam bowl was touched; c) since the rule
was unknown, are there alternatives to throwing it away? The non-academic “school
appropriate” behaviors many times are not taught in school but are expected which force
students to learn through negative interactions further disengaging students.
Positive Based Supports
The descriptive statistics of my study show that students are being suspended
multiple times (5.3% of the students are responsible for 9.3% of the behaviors), which
validates earlier research that suspension does not change behavior (Costendbader &
Markson, 1998; McFadden, Marsh, Price, & Hwang, 1992; ). However, literature
supports school-wide pro-social behavior supports (Sugai & Horner, 2002; Putnam,
Horner, & Algozzine). Establishing consistent and shared school wide expectations
removes ambiguity in the learning environment and eliminates assumptions about

TEACHER PERCEPTIONS
50
expected behavior. One way to align teacher and student expectations is to teach
expectations and the social skills to meet those expectations (Burke, Ayres, & Hagan-
Burke, 2004). As mentioned early, the teacher responses that had the most powerful
correlation with out-of-school suspension and graduation rates, were those that were
student driven. For example, “Students at this school follow rules of conduct.” and
“Students at this school understand expectations for their conduct.” Schools cannot
choose the demographics of their students, but they can provide an effective “host
environment” that establishes consistent systems and procedures that both staff and
students can follow (Sugai, et al., 2000). The “host environment”, should state clear
expectations along with teaching and practicing the pro-social behaviors and providing
positive or corrective feedback. (Sugai & Horner, 2002).
Literature supports the ineffectiveness and the inherent discriminatory practices of
reactive punishment for behavior infractions such as exclusionary consequences (Atkins,
et al., 2002). Prevention based practices focus on creating school-wide structures,
routines and practices that promote pro-social behavior for the majority of the students
across settings. Frameworks such as PBIS, High Five and CHAMPS, emphasize
systematic procedures to evaluate the schools needs, implement evidence-based practices,
link academic and behavior outcomes and continual assessment of data. The mean
agreement data on the managing student conduct construct shows a relatively low mean
for teachers consistently enforcing school rules. Pro-social school-wide programs such as
the ones mentioned above, contain fidelity systems to oversee fidelity to manage
consistency and integrity of the school-wide structure.

TEACHER PERCEPTIONS
51
The results that emerged from this correlational study between the school
demographics and school characteristics with out-of-school suspension (Costendbader &
Markson, 1998; Losen & Martinez, 2013; Skiba R. , Michael, Nardo, & Peterson, 2000;
Sullivan, Klingbeil, & Van Norman, 2013) and high school drop out (Battin-Pearson,
Newcomb, Abbott, Hill, Catalano, & Hawkins, 2000; Balfanz & Legters, 2004; Ream &
Rumberger, 2008; Stillwell & Sable, 2013; Suh, Suh, & Houston, 2007) mimic previous
studies mentioned in the literature review. However, this study in addition to school
demographics and school characteristic, this investigation also looked at teachers’
perceptions regarding management of students’ discipline with out-of-school suspension
and high school completion. The outcome of this predictor, Managing Student Conduct,
on the Percentage of Students Suspended and Graduation rates, pose interesting
conclusions and additional questions.
Future Research
Currently, schools have the option to implement Positive Based Intervention
Supports (PBIS), which is a school-wide proactive behavior program that focuses on the
fidelity of school systems and best practices (Sugai & Horner, 2002). It would be
interesting to conduct a correlational study between the schools that implement PBIS and
the ones that do not. Does the PBIS program reduce the school’s overall percentage rate
of suspensions and if there is a reduction in suspension, is there an increase in graduation
rate? PBIS requires that students are taught the rules and expectations (previously agreed
upon by staff, students and parents), demonstrate understanding and through systematic
evaluation and data based problem solving, the school problem areas are identified. The
current research regarding PBIS and academic outcomes are limited in scope and require

TEACHER PERCEPTIONS
52
additional replicated studies to support the linkage to secondary school academic
outcomes. (Putnam, Horner, & Algozzine)
Another area to explore as it relates to student outcomes is teacher characteristics
such as years of experience, Professional Development (time and type) and
demographics. Kentucky schools are implementing a new teacher evaluation under the
Teacher Professional Growth Evaluation System (TPGES). In order to measure teacher
effectiveness, the Kentucky State Department of Education adopted Charlotte
Danielson’s Framework for Teaching to guide and organize the professional practice into
four domains: Planning and Preparation; Classroom Environment; Instruction and
Professional Responsibility. (Kentucky Department of Education, 2014). All the data
collected through the TPGES will be stored in the Continuous Instructional Improvement
Technology System (CIITS.) In addition to housing the teacher evaluation information,
CIITS, will house student-level demographics and provide educators access to connect
student performance with teacher effectiveness (Kentucky Department of Education,
2014). Investigators can use this warehouse of student and teacher demographics to
study correlations with student outcomes based individual level data as oppose to school
level data.
Lastly, it is the hope of this researcher, that this study will start conservations at
the local level. My research adds to the current body of literature confirming that school
demographics and characteristics impact students’ high school experience, however,
smaller schools, cultural responsive teaching and pro-social discipline only highlight the
complexities of this topic. This study only looked at four variables that are associated
with out-of-school suspension and graduation rates but there are many other variables-

TEACHER PERCEPTIONS
53
which I acknowledge, is the limitation of this broad study. The recommendations from
this research are couched for state-level results, but the embedded recommendation is to
follow-up with local inquiries at the school level.

TEACHER PERCEPTIONS
54
REFERENCES
Achilles, G. M., Mclauglin, M. J., & Cronniger, R. G. (2007). Sociocultural correlates
of disciplinary exclusion among students with emotional, behavioral, and
learning disabilities in SEELS National Dataset. Journal of Emotional and
Behavioral Disorders , 15 (1), 33-35.
Allman, K., & Slate, J. (2013). Disciplinary consequences assigned to students with
emotional disorder, learning disability, or other helath impairment: Effects on
their academic achievement. Journal of Education Research , 7 (1).
Alspaugh, J. W. (1998). The relationship of school-to-school transitions and school size
to high school dropout rates. High School Journal , 20-25.
Atkins, M., McKay, M. M., Frazier, S. L., Jakobsons, L. J., Arvantis, P., Cunningham,
T., et al. (2002). Suspensions and detentions in an urban, low-income school:
Punishment or reward. Journal of Abnormal Child Psychology , 30 (4), 361-
372.
Balfanz, R., & Legters, N. (2004). Locating the Dropout Crisis: Which High Schools
Produce the Nation's Dropouts? Where are they located? Who Attends them? In
G. O. (Ed.), Dropouts in America: Confronting the Graduation Rate Crisis (pp.
57-84). Cambridge: Havard Education Press.
Battin-Pearson, S., Newcomb, M. D., Abbott, R. D., Hill, K. G., Catalano, R. F., &
Hawkins, J. D. (2000). Predictors of early high school dropout: A test of five
theories. Journal of Educational Psychology , 92 (3), 568-582.
Borger, J. B., Lo, C., Oh, S., & Walberg, H. J. (1985). Effective schools: A quantitative
synthesis of constructs. Journal of Classroom Interaction , 20 (2), 12-17.
TEACHER PERCEPTIONS
55
Bowditch, C. (1993). Getting rid of troublemakers: High school disciplinary procedures
and the production of droputs. Social Problems , 40, 493-509.
Bridgeland, J. M., DiIulio, J. J., & Morison, K. B. (2006). The Silent Epidemic:
Perspectives of High School Dropouts. Washington, D.C.: Civic Enterprises,
LLC.
Brooks, K., Schiraldi, V., & Ziedenberg, J. (1999). School house hype: Two years later.
San Francisco, CA. Retrieved from www.cjcj.org.
Brown, D. L., & Swanson, L. E. (2003). Challenges for Rural America in the Twenty-
First Century. University Park, Pennsylvania: Penn State Press.
Bryk, A. S., & Driscoll, M. E. (1988). The school as community: Theoretical
foundation, contextual infuences, and consequences for students and teachers.
National Center for Effective Secondary Schools .
Burke, R., Greenglass, E. R., & Schwarzer, R. (1996). Predicting teacher burnout over
time: Effects of work stress, social support, and self-doubt on burnout and its
consequences. Anxiety, Stress, and Coping , 9, 261-175.
Butts, M. J., & Cruzeiro, P. A. (2005). Student perceptions of Facotrs leading to an
effective transition from eighth to ninth grade. Amercian Secondary Education ,
70-80.
Caprara, G., Barbaranelli, C., Steca, P., & Malone, P. (2006). Teachers' self-efficacy
beliefs as determinants of job satisfaction and students' academic achievement:
A study at the school level. Journal of School Psychology , 44, 473-490.

TEACHER PERCEPTIONS
56
Carpenter, D. M., & Ramirez, , A. (2007). More than one gap: Dropout rate gaps
betwen and among Black, Hispanic, and White Students. Journal of Advanced
Academics , 19, 32-64.
Center for Disease Control and Prevention. (2012, November). Center for Disease and
Prevention. Retrieved January 21, 2014, from About Teen Pregnancy:
www.cdc.gov/teenpregnancy/aboutteenpreg.htm.
Chapman, C., Laird, J., Ifill, N., & KewalRamani, A. (2011 йил October). Trends in
High School Dropout and Completion Rates in the United States: 1972–2009
(NCES 2012-006). Retrieved 2012 йил September from National Center for
Education Statistics: http://nces.ed.gov/pubsearch.
Child Trends Data Bank. (2013, September). High School Droput Rates: Indicators on
chldren and youth. Retrieved December 20, 2013, from
www.childtrendsdatabank.org: www.childtrends.org/wp-
content/uploads/2012/10/01_Dropout_Rates.pdf
Christle, C., Jolivett, K., & Nelson, M. (2004). School characteristics related to the use
of suspension. Education & Treatment of Children , 14 (4), 509-526.
Christle, C., Jolivette, K., & Nelson, M. (2007). School characteristics related to high
school dropout rates. Remedial and Special Education , 28 (6), 325-339.
Clunies-Ross, P., Little, E., & Kienhuis, M. (2008). Self-reported and actual use of
proactive and reactive classroom management strategies and heir realtinship
with teacher stress and student behavior. Educational Psychology. , 28, 693-
710.
TEACHER PERCEPTIONS
57
Constenbader, V., & Markson, S. (1994). School suspension: A study with secondary
school students. Journal of School Psychology , 36, 59-82.
Costendbader, V., & Markson, S. (1998). School supension: A study with secondary
school students. Journal of School Pyschology , 36, 59-82.
Cotton, K. (1996). School size, school climate, and student performance. School
Improvement Research Series . Portland, OR: Northwest Regional Educational
Laboraory.
Darling-Hammond, L., Peter, R., & Milliken, M. (2006). High school size,
organization, and content: What matters for student success. Brooking Papers
on Education Policy , 9, pp. 163-203.
Day, J. C., & Ndwburger, E. C. (2002). The big payoff: Educational attainment and
synthetic estimates of work-life earnings. U.S. Census Bureau, Current
Population Reports. Washington, D.C.: U.S. Government Printing Office.
DeWit, D. J., Karioja, K., Rye, B. J., & Shain, M. (2011). Perceptions of declining
classmate and teacher support following the transition to high school: Potential
correlates of increaseing student metnal health difficulties. Psychology in the
Schools. , 556-572.
Donovan, M. S., & Cross, C. T. (Eds.). (2002). Minority students in special and gifted
education. Washington, D.C.: National Academics.
Dupper, D., & Bosch, L. A. (1996). Reasons for school suspensions. Journal for a Just
and Caring Education , 2, 140-150.
Engec, N. (2006). Relationship between mobility and student performance and
behavior. The Journal of Educational Research , 99 (3), 167-178.

TEACHER PERCEPTIONS
58
Felter, M. (1989). School dropout rates, academic performance, size and reform.
Educational Evaluation and Policy Analysis , 11 (2), pp. 109-116.
Fenning, P., & Rose, J. (2007). Overrepresentation of African American students in
exclusionary discipline:The role of school policy. Urban Educaiton , 42 (6),
536-559.
Gardner, P., Ritblatt, S. N., & Beatty, J. R. (2000). Academic achievement and parental
school involvement as a function of high school size. High School Journal , 83,
21-27.
Gleason, P., & Dynarski, M. (2002). Do we know whom to serve? Issues in using risk
factors to identify droputs. Journal of Education for Students Placed at Risk , 7,
25-41.
Gonzalez, J., & Szecsy, E. M. (2004). The condition of minority access and
paticipation in Arizona: 2004. Retrieved October 13, 2013, from Academia.edu.
Gonzalez, P. (2006). Facts from NLTS2: School behavior and disciplinary experiences
of youth with disabilties. U.S. Department of Education, National center for
Special Education Rsearch. Washington, D.C.: Institute of Education Sciences.
Green, J., & Winters, M. (2006). The effects of residential school choice on public high
school graduation rates. Peabody Journal of Education , 81 (1), 203-216.
Greeney, B., & Slate, J. R. (2012). School climate and high school size: A mutli-year
analysis of Hispanic students. The ACEF Journal , 2 (2), 27-45.
Gregg, J. (1995). Discipline, control, and school mathematics tradition. Teaching and
Teacher Education. , 11, 579-593.

TEACHER PERCEPTIONS
59
Gregory, A., & Ripski, M. B. (2008). adolescent Trust in Teachers: implications for
Behavior in the High School Classroom. School Psychology Review , 37 (3),
337-353.
Heaviside, S., Rowand, C., Williams, C., Farris, E., & Westat, I. (1996-97). Violence &
discipline problems in U.S. public schools. Department of Education.
Washington, D.C.: National Center for Education Statistics.
Hess, R. S. (2000). Dropping out among Mexican American youth: Reviewing the local
literature through an ecological perspective. Journal of Education for Students
Placed at Risk , 5 (3), 267-290.
Howley, C., & Howley, A. A. (2004, 9 24). School size and the influence of
socioeconomic status on student achievement: Confronting the threat of size
bias in national data sets. Education Policy Analysis Archives , 12 (52).
Hoyle, J. R., & Collier, V. (2006). Urban CEA superintendents alternative strategies in
reducin school dropouts. Education and Urban Soceity , 39 (1), 69-90.
Jordan, W., McPartland, J. M., & Lara, J. (1999). Rethinking the causes of high school
dropout. The Prevention Reseracher , 6 (3), 1-4.
Kentucky Department of Education. (2013, June 24). Kentucky Department of
Educaiton. Retrieved July 15, 2013, from Kentucky Department of Education:
School Report Card: http://education.ky.gov/AA/Reports/Pages/SRC.aspx
Kentucky Department of Education. (2013, July 1). Kentucky Department of
Education: Unbridled Learning. Retrieved July 15, 2013, from Kentucky
Department of Education: http://education.ky.gov/comm/UL/Pages/default.aspx

TEACHER PERCEPTIONS
60
King, S. (1993). The limited presence of African-American teachers. Review of
Educational Research , 64 (2), 115-149.
Kremien, M. P., Leone, P. E., & Achilles, G. M. (2006). Supension, race, and
disability: Analysis of statewide practices and reporting. Journal of Emotional
and Behavioral Disorders. , 14 (4), 217-226.
Krezmien, M. L., Leone, P. E., & Achilles, G. M. (2006). Suspension, race and
disability: Analysis of statewide practices and reporting. Journal of Emotional
and Behavioral Disorders , 14 (4), 217-216.
Lee, T., Cornell, D., Gregory, A., & Fan, X. (2011). High Suspension Schools and
Dropouts Rates for Black and White Students. Education and Treatment of
Children , 34 (2), 167-192.
Lehr, C. A., Johnson, D. R., Bremer, C. D., Cosio, A., & Thompson, M. (2004).
Increasing rates of school completion: moving from policy and research to
pratice. (U. o. Mnneapolis, Ed.) Retrieved December 20, 2013, from
www.ncset.org: www.ncset.org/publications/essentialtools/droput.pdf
Litt, M. D., & Turk, D. C. (1985). Sources of stress and dissatisfaction in experienced
high school teachers. Journal of Educational Research , 78, 178-185.
Losen, D. (2011). Discipline Policies, Successful Schools, and Racial Justice. National
Education Policy Center. Boulder: K-12 Integration and Diversity, The Civil
Rights Project/ Proyecto Derechos Civiles, UCLA.
Losen, D., & Martinez, T. E. (2013). Out of school and off track: The overuse of
suspensions in American middle and high schools. The Center for Civil Rights
Remedies. Los Angelos: The Civil Rights Project, UCLA.

TEACHER PERCEPTIONS
61
Maag, J. W. (2002). Rewarded by punishment: Reflections on the disuse of positive
reinforcement in schools. Exceptional Children. , 67, 173-186.
McCallumore, K. M., & Sparapani, E. F. (2010). The imprtance of teh ninth grade on
high school graduation rates and student success in high school. Education ,
447-456.
McFadden, A., Marsh, G. E., Price, B. J., & Hwang, Y. (1992). A study of race and
gender bias in the punishment of school children. Education and Treatment of
Children , 15, 140-146.
Mellard, D., & Seybert, L. (1996). Voices about school supsension, expulsion, and
safety. Center for Research on Learning . Lawrence, KW.
Mendez, L. M., & Knoff, H. M. (2003). Who gets suspended from school and why: A
demographic analysis of schools and disciplinary infractions in a large school
district. Education and Treatment of Children , 26 (1), 30-51.
Mendez, L., Knoff, H. M., & Ferron, J. M. (2002). School demographic variables and
out-of-school supsension rates: A quantitative an qualitative analysis of a large,
ethnically diverse school district. Psychology in the Schools. , 39, 259-277.
Morrison, G., & D'Incau, B. (1997). The web of zero tolerance: Charateristics of
students who are recommended for expulsion from school. Education and
Treatment of Children , 20, 316-335.
Murray, C., & Naranjo, J. (2008). Poor, black learning disabled, and graduating: An
investigation of factors and processes associated with school completion among
high-risk urban youth. Remedial and Special Education , 29 (3), 145-160.

TEACHER PERCEPTIONS
62
National Teacher Center. (2013). Kentucky Reports. (N. T. Center, Producer) Retrieved
July 15, 2013, from TELL Kentucky: Teaching, Empowering, Leading and
Learning: www.tellkentucky.org/results
Natriello, G., McDill, E. L., & Pallas, A. M. (1990). Schooling disadvantage children:
Racing against catastrophe. New York: Teachers College Press.
Neild, R. C., Stoner-eby, S., & Furstenberg, F. (2008). Connecting Engtrance and
Departure: The Transition to Ninth Grade and High School Dropout. Education
and Urban Society , 543-569.
Newman, B. M., Newman, P. R., Myers, M. C., Smith, V. L., & Lohman, B. J. (2000).
Experiences of Urban Youth Navigatin the Transition to Ninth Grade. Youth
and Sociiety , 387-416.
Newmann, F. M., & Wehlage, G. G. (1989). Organizational facors that affect school
sense of efficacy, community, and expectations. Sociology of Education , 62,
221-238.
Nicholas, J., Ludwin, W. G., & Iadicola, P. (1999). A darker shade of gray: A year-end
analysis of discipline and suspension data. Equity and Excellence in Education ,
32, 43-55.
Norguera, P. (2001). Racial politics and the elusive quest for excellence in and equity in
education. Education and Urban Society , 34 (1), 112.
Office of Juvenile Justice and Delinquency Prevention. Juvenile offenders and victims:
A national report. Pittsburgh: National Center for Juvenile Justice.
Ohlson, M. (2009). Examining Instructional Leadership: A Study of School Culture and
Teacher Quality Characteristics Influencing Student Outcomes. 2 (2), 102-113.

TEACHER PERCEPTIONS
63
Petras, H., Masyn, K.E., Buckley, J.A., Ialongo, N.S., & Kellam, S. (2011). Who is
most at risk for school removal? A multilevel discrete-time survival analysis of
individual- and context-level influences. Journal of Educational Psychology,
103(1), 223-237.
Pittman, R., & Haughwout, P. (1987). Influence of high school size on dropout rate.
Educational Evaluation and Policy Analysis , 9, 337-343.
Raffaele Mendez, L. M., & Knoff, H. M. (2003). Who gets suspended from school and
why: A demographic analysis of schools and disciplinary infractions in a large
school district. Education and Treatment of Children , 26 (1), 30-51.
Ream, R., & Rumberger, R. (2008). Student Engagement, Peer Social Capital, and
School Dropout among Mexican Amrican and Non-Latino White Students.
Sociology of Education , 81 (2), 109-139.
Riehl, C., & Sipple, J. W. (1996). Making the most of time and talent: Secondary
school organizational climates, teaching task environment, and teacher
commitment. American Educational Research Journal , 33, 873-901.
Royal, M., & Rossi, R. J. (1999). Predictors of within-school differences in teachers'
sense of community. Journal of Educational Research , 92, 259-266.
Rumberger, R. (1987). High school dropouts: A review of issues and evidence. .
Review of Educational Resaerch , 57, 101-112.
Rumberger, R., & Thomas, S. L. (2000). The distribution of dropout and turnover rates
among urban and suburban high schools. Sociology of Education , 73 (1), 39-67.

TEACHER PERCEPTIONS
64
Rumerger, R., & Palardy, G. J. (2005). Test scores, dropout rates, and transfer rates as
alternative indicators of high school performance. American Educational
Journal Research , 42, 3-42.
Schonfeld, I. S. (2001). Stress in first year women teachers: The context of social
support and coping. Genetic, Social and General Psychology Monographs. ,
127, 133-169.
Skiba, R. (2000). An analysis of school disciplinary practice. Policy Research Rep.
Bloomington: Indiana Education Policy Center.
Skiba, R. J., & Peterson, R. (1999). The dark side of zero tolerance: Can punishment
lead to safe schools? Phi Delta Kappa , 80, 372-376,381-382.
Skiba, R. J., Peterson, R. L., & Williams, T. (1997). Office referrals and suspension:
Disciplinary intervention in middle schools. Education and Treatment of
Children , 20, 295-315.
Skiba, R., Michael, R. S., Nardo, A. C., & Peterson, R. (2000, June). The color of
discipline: Sources of racial and gender disproportionality in school
punishment. Retrieved from www.indianan.edu/~safeschl/cod.pdf/minor/html.
Skiba, R., Michael, R. S., Nardo, A. C., & Peterson, R. (2002). The color of discipline:
Sources of racial and gender disproportionality in school punishment. The
Urban Review , 34 (4), 317-342.
Slate, J., & Jones, C. H. (2006). Secondary school size and Hispanic student
performance in Texas. Essays in Education .
Stillwell, R., & Sable, J. (2013, January). Public School Graduates and Dropouts from
the Common Core of Data: School Year 2009-2010: First Look (Provisional
TEACHER PERCEPTIONS
65
Data). Retrieved December 19, 2013, from The National Center for Education
Statistics: http://nces.ed.gov/pubsearch
Suh, S., & Suy, J. (2011). Changing Pattern and Process of High School Dropouts.
Educational Research Study , 3-13.
Suh, S., Suh, J., & Houston, I. (2007). Predictors of categorical at-risk high school
dropouts. Journal of Counseling and Development , 85 (2), 196-203.
Sullivan, A. L., Klingbeil, D. A., & Van Norman, E. R. (2013). Beyond behavior:
Multilevel anaysis of hte influence of sociodemographics and school
charasteristics on students risk of suspension. School Psychology Review , 42
(1), 99-114.
Suma, A., Khatiwada, I., McLaughlin, J., & Palma, S. (2009). The Consequences of
Dropping Out of High School. Northeastern University, Center for Labor
Market Studies, Boston.
Swanson, S. B. (2008, April). Cities in crisis: A specail analytic report on high school
graduation. Editorial Projects in Education Research Center.
The National Campaign to Prevent Teen Pregnancy. (2010, March). Why it Matters.
Retrieved January 21, 2014, from The National Campaign:
www.thenationalcampaign.org/why-it-matters/pdf/education.pdf
Tillery, A., Varjas, K., & Collins, A. S. (2010). General education teachers' perceptions
of behavior management and intervention strategies. Journal of Positive
Behaivor Interventions , 12, 86-102.

TEACHER PERCEPTIONS
66
Townsend, B. (2000). Disproportionate discipline of African-American children and
youth: Culturally responsive strategies for reducing school suspensions and
expulsions. Exceptional Children , 66, 381-391.
Turk, D. C., Meeks, S., & Turk, L. M. (1982). Factors contributing to teacher stress.
Implications for research, prevention, and remediation. Behavioral Counseling
Quarterlly. , 2, 1-26.
U.S. Census Bureau. (n.d.). Current Poplualtion Survey. Retrieved from U.S. Census
Bureau: http://www.census.gov/population/www/socdemo/educ-attn.html
U.S. Department of Education. (2008, December 22). Elementary & Secondary Policy
Guidance. Retrieved October 10, 2013, from U.S. Department of Education:
ww2.ed.gov/policy/elsec/guid/hsgrguidance.pdf
U.S. Department of Education. (2003). OCCR Elementary and Secondary Survey:
2000. Retrieved from http://www.nces.gov
U.S. Department of Education. (2013, Feburary 13). Office of Elementary and
Secondary Education. Retrieved July 15, 2013, from Legislation, Regulation
and Guidance: www.ed.gov/esea
Veenman, S. (1984). Perceived Problems of Beginning Teachers. Review of
Educational Research , 54 (2), 143-178.
Velez, W. (1989). High school attrition among Hispanic and non-Hispanic white
youths. Sociology of Education , 62, 119-133.
Wagner, M. (1995). Outcomes for youths with serious emotional disturbances in
secondary and early adulthood. Crtical Issues for Childrent and Youth , 5 (2),
90-112.

TEACHER PERCEPTIONS
67
Wagner, M., Newman, L., D'Amico, R., Jay, E. D., Butler-Nalin, P., Marder, C., et al.
(1991). Youth with disabilities: How are they doing? The first comprehensive
report from the national longitudianl transition study of special education
students. U.S. Department of Education, Office of Special Education Programs.
Washington, D.C.: SRI International Contract 300-87-0054.
Werblow, J., & Duesbery, L. (2009). The impact of high school size on math
achievement and dropout rate. The High School Journal , 92 (3), 14-23.
Wu, S., Pink, W., Crain, R. L., & Moles, O. (1982). Student suspension: A critical
reappraisal. Urban Review , 14, 245-303.

TEACHER PERCEPTIONS
68
Caryn L. Huber
339 Memory Lane, Lexington, KY 40502
Phone (859) 420-6785; e-mail: [email protected]
Education:
Bachelor’s of Arts-University of Kentucky; 1995.
K-12 Learning and Behavior Disability (LBD) Certificate- University of Kentucky;
1998.
Master’s of Arts-College of Notre Dame; 2005.
Doctorate of Education - Eastern Kentucky University; 2014.
Certifications:
Provisional Certificate For Teachers Of Exceptional Children--Learning And Behavior
Disorders, Grades K-12, Rank 1
Professional Certificate For Instructional Leadership Supervisor of Instruction, Level 2
Administration Experience:
Fayette County Public Schools-Lexington, KY
Dean of Students (8/13 to Present)
Lead the school disciplinary committee (Positive Based Intervention Supports).
Lead the school behavioral Multi-tiered Support System (MTSS).
Resolve discipline problems; confer with parents, teachers, counselors, support
service personnel, and students on matters of discipline and welfare.
Analyze behavioral data; present findings and trends to staff.
Provide program supervision to the school’s Special Education Department.
Provide program supervision and development support to the school’s continuum
of environmental behavior supports (SAFE, ISS, SAP and OSS).
Create and present Professional Development modules to staff.
Youth in Transition-Baltimore, MD
Director of Education (7/07 to 7/10)
Provided administrative leadership to staff as well as day to day program
management; Supervision of certified and classified staff
Conducted in-service to train staff on best practices, behavior management
Liaison between Maryland State Department of Education; District of Columbia
Public Schools; MD Department of Juvenile Services; District of Columbia Office

TEACHER PERCEPTIONS
69
of the State Superintendent of Education, Division of Special Education;
Maryland Association of Nonpublic Special Education Facilities and 18 Maryland
Local Education Agencies
Wrote and submitted grants for Title money; Community Outreach and
Partnership; Vocational program development; School enrollment and outreach
Good Shepherd Center-Baltimore, MD;
Assistant Principal-Special Education, (9/03 to 7/07)
Interpreted and maintained up-to-date knowledge of IDEA and COMAR
regulations
Communicated with 18 Maryland Local Education Agencies handling high
profile meetings, resolving complaints, and ensuring services are provided
Site Assessment Coordinator
Supervised vocational and classified staff ; Represented the Director of Education
in his duties in his absence
Teaching Experience:
Paul Laurence Dunbar High School; Lexington, KY
Special Education Teacher (LBD) (8/10- 6/13)
Taught Learning Strategies resource courses and credit recovery
Taught collaborative courses in English
Implemented a piloted program “Move” which focused on transitioning students
with mild services needs (executive functioning needs) out of special education
Extra-curricular: Certified Evaluation Appeals Panel, SBDM, Coordinator of the
Leestown Mentorship Program, School Wellness Committee Co-chair, LEAD
Conference Liaison, Mentor Teacher
Youth in Transition- Baltimore, MD;
Special Education Teacher/IEP Facilitator (7/02 to 9/03)
Facilitated IEP meetings with the students from the District of Columbia
Assisted administrators by assuming leadership role in variety of employer-
sponsored extracurricular activities
Paul Laurence Dunbar High School; Lexington, KY;
Special Education Teacher (5/98- 6/02)
Taught both resources courses in Algebra and Arts and Humanities

TEACHER PERCEPTIONS
70
Taught collaborative courses in Algebra, Arts and Humanities, English, Social
Studies and Health
Extra-curricular activities: Senior class sponsor, SBDM Council, United Way
Representative, CHAMPS trainer
Professional Development Activities:
Explosive/Noncompliant (CPS) (2001) Brain-Based Learning (2009)
Safe Crisis Management Trainer (2013) PBIS Coaching (2013-2014)
FCPS Aspiring Leaders I (2013-2014) Equity Conference (2013)