Embed Size (px)
Citation preview
THE RELATIONSHIP BETWEEN TEST SCORES ON MULTIPLE CHOICE
HIGH-STAKES TESTS AND HIGH-STAKES TESTS THAT
INCLUDE CONSTRUCTED RESPONSES
by
Natalie April Hise
Liberty University
A Dissertation Presented in Partial Fulfillment
Of the Requirements for the Degree
Doctor of Education
Liberty University
September, 2016
2
The Relationship Between Test Scores on Multiple Choice High-Stakes Tests and High-Stakes
Tests that Include Constructed Responses
by Natalie April Hise
A Dissertation Presented in Partial Fulfillment
Of the Requirements for the Degree
Doctor of Education
Liberty University, Lynchburg, VA
September, 2016
APPROVED BY:
Michelle J. Barthlow, Ed.D., Committee Chair
Jamie Philipp, Ed.D., Committee Member
Steven McDonald, Ed.D., Committee Member
Scott Watson, PhD., Associate Dean, Advanced Programs
3
ABSTRACT
This study examines the relationship between the test scores of Georgia high school students on
the multiple choice End-of-Course Test (EOCT) and the Georgia Milestones End of Course
(GAMEOC) test, which include constructed response. The study is a non-experimental
correlational study that uses ex post facto data. Scores were examined from an urban high school
in Georgia, using the Coordinate Algebra and Analytic Geometry scores from the 2013-14
EOCT tests and 2014-15 GAMEOC tests. Scores were collected from the district office of the
sample school with a sample size of 2702 test scores and then analyzed using a point biserial test
to test for a relationship between test scores. The results of the statistical tests showed that
students perform better on the multiple choice EOCT test than on the GAMEOC test that
includes constructed responses. Special education students performed better on the multiple
choice test at a higher level than general education students.
Keywords: constructed response, high school, high-stakes testing, multiple choice

4
Dedication
This work is dedicated to my maternal grandmother, Evabelle Irwin. Throughout her life,
my Nannie exemplified perseverance, hard work, and unwavering faith in God. Without this
example, I would not be where I am today. I am forever grateful for the role Evabelle played in
my life and in the life of my family and for her unfailing love.
5
Acknowledgements
In completing this work, I owe a debt of gratitude to the following people:
To my husband, Allan Hise: Thank you for your support during these years and the many
extra tasks you have performed so that I can complete my degree. Most of all thank you for
loving me and our family selflessly.
To my parents, step-parents, and sister: Thank you for always believing that I can
succeed and encouraging me to take on whatever mountain is in front of me. Who I am is shaped
in so many ways by all of you.
To my children, Makenzie, Landon, and Savannah: Thank you for cheering me on and
making me laugh! I hope that I have been able to set an example of perseverance for you.
To Dr. Michelle Barthlow: Thank you for your excitement and encouragement about my
work as well as your continued expertise and leadership. I’m so glad we met.
To Dr. Jamie Philipp: Thank you for setting an example and blazing the path with your
dissertation as well as your encouragement along the way. Your friendship is priceless and I
appreciate daily that you are my “Willis”.
To my Lord and Savior: Thank you for blessing me with such amazing people and
showing me the way while giving me strength and courage to persevere.

6
Table of Contents
ABSTRACT…………………………………………………………………………………….....3
Dedication ................................................................................................................................... 4
Acknowledgements ..................................................................................................................... 5
List of Tables ............................................................................................................................... 9
List of Figures ........................................................................................................................... 10
List of Abbreviations ................................................................................................................. 11
CHAPTER ONE: INTRODUCTION .......................................................................................... 12
Introduction ............................................................................................................................... 12
Background ............................................................................................................................... 13
Problem Statement .................................................................................................................... 15
Purpose Statement ..................................................................................................................... 15
Significance of the Study .......................................................................................................... 16
Research Questions ................................................................................................................... 16
Hypotheses ................................................................................................................................ 16
Identification of Variables ......................................................................................................... 17
Definitions ................................................................................................................................. 17
Summary ................................................................................................................................... 18
CHAPTER TWO: REVIEW OF THE LITERATURE ............................................................... 19
Historical Summary ................................................................................................................... 21
High-Stakes Testing in the Present Culture of Education ......................................................... 25
The Future of High-Stakes Testing ........................................................................................... 38
High-Stakes Testing in Georgia ................................................................................................ 39

7
Test Item Types ......................................................................................................................... 43
Christian Worldview ................................................................................................................. 45
Summary ................................................................................................................................... 46
CHAPTER THREE: METHODOLOGY ..................................................................................... 49
Introduction ............................................................................................................................... 49
Design ........................................................................................................................................ 49
Assumptions and Limitations .................................................................................................... 49
Research Questions ................................................................................................................... 50
Null Hypotheses ........................................................................................................................ 50
Participants ................................................................................................................................ 51
Setting ........................................................................................................................................ 52
Instrumentation .......................................................................................................................... 52
Procedures ................................................................................................................................. 55
Data Analysis ............................................................................................................................ 55
CHAPTER FOUR: FINDINGS .................................................................................................... 57
Research Questions ................................................................................................................... 57
Null Hypotheses ........................................................................................................................ 57
Descriptive Statistics ................................................................................................................. 59
Results ....................................................................................................................................... 60
CHAPTER FIVE: DISCUSSION, CONCLUSIONS, AND RECOMMENDATIONS .............. 76
Discussion ................................................................................................................................. 76
Conclusions ............................................................................................................................... 80
Implications ............................................................................................................................... 81

8
Limitations ................................................................................................................................ 82
Recommendations for Future Research .................................................................................... 83
REFERENCES ............................................................................................................................. 84
APPENDIX ................................................................................................................................... 92
Appendix A: IRB Approval ...................................................................................................... 92
9
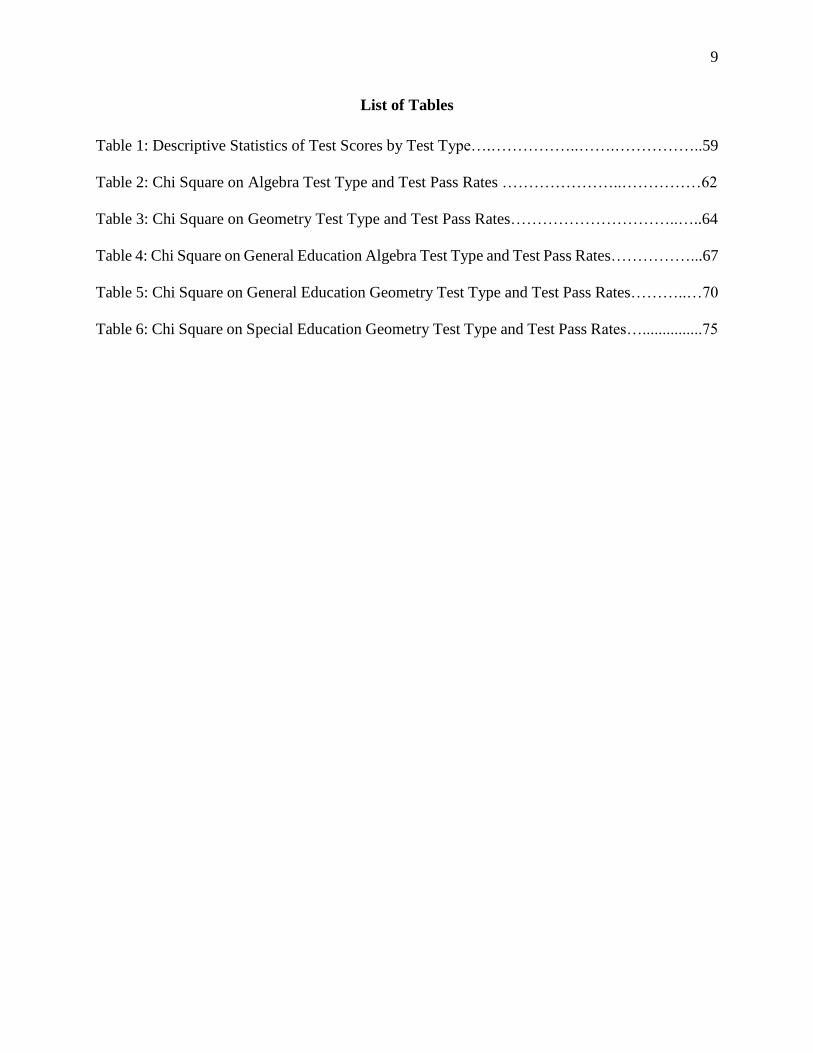
List of Tables
Table 1: Descriptive Statistics of Test Scores by Test Type….……………..…….……………..59
Table 2: Chi Square on Algebra Test Type and Test Pass Rates …………………..……………62
Table 3: Chi Square on Geometry Test Type and Test Pass Rates…………………………..…..64
Table 4: Chi Square on General Education Algebra Test Type and Test Pass Rates……………...67
Table 5: Chi Square on General Education Geometry Test Type and Test Pass Rates………..…70
Table 6: Chi Square on Special Education Geometry Test Type and Test Pass Rates…...............75
10
List of Figures
Figure 1…....……………………………………………………………………………………. 61
Figure 2…………………………………………………………………………………………. 62
Figure 3 …...……………………………………………………………………………………. 63
Figure 4 …...……………………………………………………………………………………. 65
Figure 5 ...………………………………………………………………………………………. 66
Figure 6 ……...…………………………………………………………………………………. 68
Figure 7 ……...…………………………………………………………………………………. 69
Figure 8 ……...…………………………………………………………………………………. 71
Figure 9 ……...…………………………………………………………………………………. 72
Figure 10 …...………………………………………………………………………………..…. 74
Figure 11 …...………………………………………………………………………………..…. 75
11
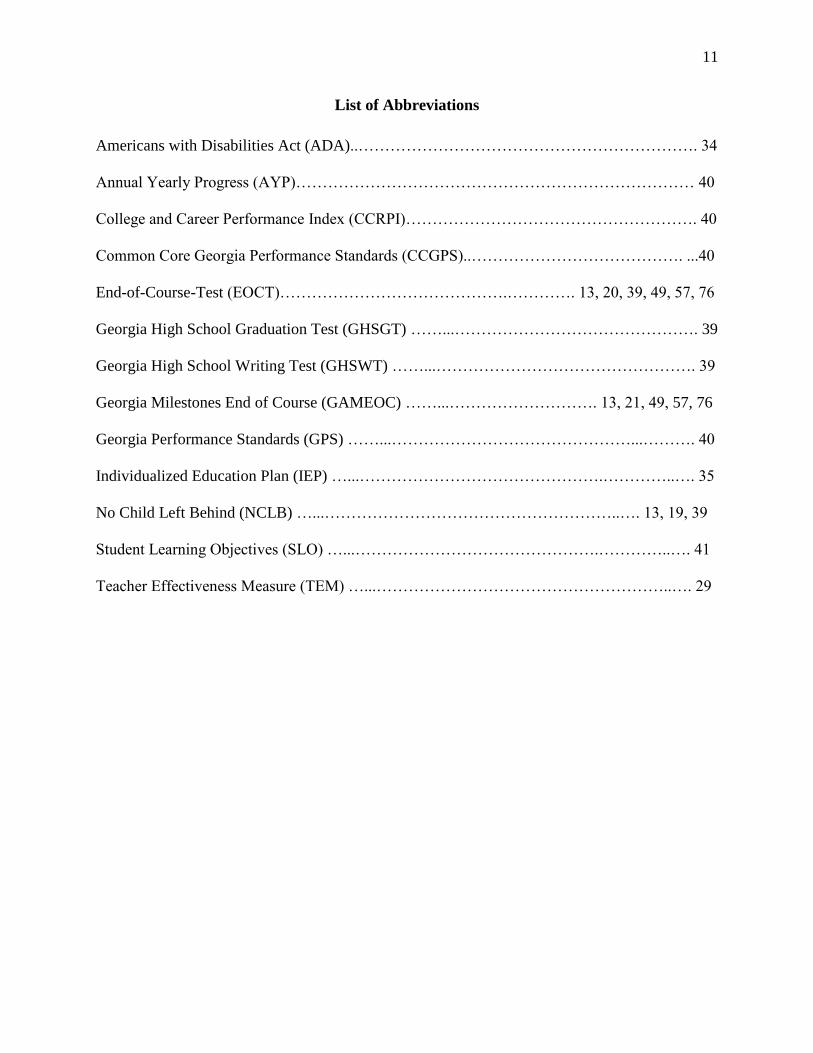
List of Abbreviations
Americans with Disabilities Act (ADA)..………………………………………………………. 34
Annual Yearly Progress (AYP)………………………………………………………………… 40
College and Career Performance Index (CCRPI)………………………………………………. 40
Common Core Georgia Performance Standards (CCGPS)..…………………………………. ...40
End-of-Course-Test (EOCT)…………………………………….…………. 13, 20, 39, 49, 57, 76
Georgia High School Graduation Test (GHSGT) ……...………………………………………. 39
Georgia High School Writing Test (GHSWT) ……...…………………………………………. 39
Georgia Milestones End of Course (GAMEOC) ……...………………………. 13, 21, 49, 57, 76
Georgia Performance Standards (GPS) ……...………………………………………...………. 40
Individualized Education Plan (IEP) …...……………………………………….…………..…. 35
No Child Left Behind (NCLB) …...………………………………………………..…. 13, 19, 39
Student Learning Objectives (SLO) …...……………………………………….…………..…. 41
Teacher Effectiveness Measure (TEM) …...………………………………………………..…. 29
12
CHAPTER ONE: INTRODUCTION
Introduction
High-stakes testing has become an integral part of education in the United States over the
past several decades. Required testing has allowed educators and curriculum planners to identify
gaps in curriculum and in achievement among student groups. However, high-stakes testing has
resulted in some unintended consequences for both teachers and students. These consequences
include narrowed curriculum, teacher-centered pedagogy, decreased motivation among students,
and an increase in the achievement gap between poor and rich students (Au, 2011; Berliner,
2011; Goldwyn, 2012; Misco, 2010).
As education continues to evolve, many states have adopted some version of the
Common Core State Standards. Specifically, the state of Georgia adopted and implemented the
Common Core Georgia Performance Standards beginning for the 2012-13 school year. The
adoption of performance standards has resulted in a shift in testing from multiple choice tests to
tests that include constructed response items (Maxcy, 2011). Georgia has followed this trend as
they have abandoned the previous End of Course Tests (EOCTs) that were multiple choice for
new tests that include constructed response items, the Georgia Milestones End of Course
(GAMEOC) tests (Georgia Department of Education, 2015). The creation of these new tests
resulted in a significant financial cost to the state and an increase in the yearly budget to maintain
the administration and scoring of these new assessments (Georgia Office of Planning and
Budget, 2015). This chapter gives a brief overview of the history and current context of high-
stakes testing as well as the research questions and hypothesis addressed in this study.

13
Background
Historical Context
In 1983, the Nation at Risk report called for educational reform. This reform began to
encourage the use of testing to drive education. Later, in 2002, No Child Left Behind (NCLB)
required testing in the areas of Mathematics and Reading in the United States. In addition,
students with disabilities were required to participate in state testing to the fullest extent possible
(Brinckerhoff & Banerjee, 2007; Byrnes, 2009). As a result of the growth of high-stakes testing,
these tests became a driving force in educational reform in public schools in the United States,
affecting teaching style, content offered, and classroom organization (Au, 2011; Heilig, Cole, &
Aguilar, 2010). Later, Race to the Top (Civic Impulse, 2016) of the Obama administration
reauthorized NCLB and the later adoption of the Common Core State Standards continued to
encourage the use of testing as an accountability measure. However, the change in standards
began to drive a change in high-stakes testing to include open response items (Maxcy, 2011).
In Georgia, testing of high school students has included multiple choice EOCT in eight
subjects, which are required to count 20% of the final course average in the course. These tests
previously covered the Georgia Performance Standards (GPS) and then the literature and math
tests were edited to cover the Common Core Georgia Performance Standards (CCGPS). For the
2014-15 school year, the tests again covered the CCGPS but were revised to include constructed
response items (Georgia Department of Education, 2015). The cost of creating these tests was
budgeted to be $10 million with an additional yearly $1 million to administer and score the tests
(Georgia Office of Planning and Budget, 2015). These new tests are now the GAMEOC tests.
14
Social Context
The emphasis on high-stakes testing has created a curriculum that is narrow in scope.
More time is spent on math and reading than on subjects that are not part of required testing
(Berliner, 2011; Heilig et al., 2010). This shift in focus is a result of the effort to raise test scores
in the required areas of reading and math. In particular, students from low-income families are
spending more time in tested subjects and test preparation classes than their peers. This increase
in class time spent on testing for poor students has created a wider educational gap as other
students are exposed to more and varied curriculum (Berliner, 2011).
High-stakes testing also affects students and teachers in other, unintended ways. As a
result of testing requirements and the use of tests in teacher accountability systems, teachers are
standardizing curriculum, using commercially created materials, and moving toward teacher-
centered pedagogy (Au, 2011; Goldwyn, 2012; Misco, 2010). For students, learning for high-
stakes tests is becoming more disjointed and rote, which results in boredom and lack of
motivation (Berliner, 2011; Mora, 2011).
Theoretical Context
In addition to providing data, high-stakes tests are intended to motivate teachers and
students (Slavin, 1997). The motivation of tests, specifically high-stakes tests, is rooted in
behaviorism (Supovitz, 2009). However, with the adoption of the Common Core State Standards,
curriculum is moving more towards constructivism. In constructivism, students are required to
defend their positions as they analyze and then construct solutions (Sutinen, 2008). The emphasis
is on the process of solution rather than simply the product (Yilmaz, 2008). As a result in this
shift in education, testing instruments are also moving toward using constructed responses to
measure the process of problem solving (Maxcy, 2011).
15
Problem Statement
The state of Georgia has required EOCT testing in eight high-school subjects: Coordinate
Algebra, Analytic Geometry, Physical Science, Biology, US History, Economics, Ninth Grade
Literature, and American Literature. With the recent adoption of Common Core standards, these
tests have been re-written and then the Ninth Grade Literature, American Literature, Coordinate
Algebra, and Analytic Geometry tests were expanded to include constructed response items.
Lissitz and Hou (2012) found that content area may matter in multiple choice versus constructed
response testing. Specifically, the authors found that multiple choice and constructed response
seem to be equivalent measures in algebra and biology, but not in other subjects. In addition, the
authors suggest further research to test generalization to other large-scale assessments. In
contrast, Powell (2012) found that students with disabilities have an advantage in multiple choice
formats on mathematics tests and suggest further research on effects of test response options on
math tests. Therefore, the problem is that the influence of response type on high-stakes tests
scores in various high school subjects is unknown.
Purpose Statement
The purpose of this correlational posttest only two-group study is to examine the
relationship, if any, between the scores of high school students on multiple choice high-stakes
tests and tests that include constructed response items at the sample high school in an urban area
of Georgia. The sample is a convenience, non-random sample. The independent variable is the
type of test administered, EOCT or GAMEOC in math. The dependent variable is the score of
high school students on the high-stakes tests.
16
Significance of the Study
Previous studies have compared multiple choice tests to constructed response tests.
Powell (2012) found that students with disabilities may be better assessed using multiple choice
format tests. DeMars (2000) found that higher stakes on tests have a larger impact on constructed
response test scores than multiple choice test scores. Lissitz and Hou (2012) found that some
contents may be equally assessed by multiple choice tests or constructed response tests, but not
other content areas. This study will add to the understanding of test scores on constructed
response versus multiple choice high-stakes tests for high school students in two different
content areas: Coordinate Algebra, and Analytic Geometry.
Research Questions
The research questions for this study are:
RQ1: What is the relationship between Georgia students’ End-of-Course Test scores and
Georgia students’ Georgia Milestones End-of-Course scores in math?
RQ2: What is the relationship between Georgia general education students’ End-of-
Course Test scores and Georgia general education students’ Georgia Milestones End-of-Course
scores in math?
RQ3: What is the relationship between Georgia special education students’ End-of-
Course Test scores and Georgia special education students’ Georgia Milestones End-of-Course
scores in math?
Hypotheses
The following are the null hypotheses:
Ho1: There is no relationship between Georgia students’ End-of-Course Test scores and
Georgia students’ Georgia Milestones End-of-Course scores in Coordinate Algebra.

17
Ho2: There is no relationship between Georgia students’ End-of-Course Test scores and
Georgia students’ Georgia Milestones End-of-Course scores in Analytic Geometry.
Ho3: There is no relationship between Georgia general education students’ End-of-
Course Test scores and Georgia general education students’ Georgia Milestones End-of-Course
scores in Coordinate Algebra.
Ho4: There is no relationship between Georgia general education students’ End-of-
Course Test scores and Georgia general education students’ Georgia Milestones End-of-Course
scores in Analytic Geometry.
Ho5: There is no relationship between Georgia special education students’ End-of-Course
Test scores and Georgia special education students’ Georgia Milestones End-of-Course scores in
Coordinate Algebra.
Ho6: There is no relationship between Georgia special education students’ End-of-Course
Test scores and Georgia special education students’ Georgia Milestones End-of-Course scores in
Analytic Geometry.
Identification of Variables
The type of test will be the independent variable in this study. The test types studied will
be the EOCT multiple choice tests and the GAMEOC tests, which include constructed response
items. The dependent variable is the test scores of high school students on these tests.
Definitions
1. End of Course Tests (EOCT): Through the 2013-14 school year, Georgia required
high school students enrolled in Coordinate Algebra, Analytic Geometry, Physical
Science, Biology, Ninth Grade Literature, American Literature, US History, and
Economics to complete a state-developed final exam. This exam is required to count
18
20% of the final course average in the class and consists of multiple choice questions
(Georgia Department of Education, 2006).
2. Georgia Milestones End of Course (GAMEOC) Tests: Beginning in the 2014-15
school year, Georgia began administering end of course assessments that included
constructed response items in all high school courses that previously required EOCT
tests. These tests are also required to count 20% of the final course average in the
class. However, the scores for the first year of test administration are not required to
count in the course average due to the time needed to score these new tests (Georgia
Department of Education, 2015).
Summary
As a result of NCLB (2002) and Race to the Top (Civic Impulse, 2016), high-stakes
testing has become an integral part of the educational system in the United States. Such testing is
intended to form a basis for accountability for students, teachers, and schools and to illuminate
gaps in education. However, the required testing in math and reading has led to an increase in
educational gaps among student groups as some groups are spending much more time on test
preparation than other groups. In addition, students are being exposed to less curriculum as more
and more time is spent on reading and math content areas and test preparation.
The recent adoption of Common Core State Standards among many states is leading
states to revise their high-stakes tests to include constructed response items. These revisions are
costly and time consuming. In light of these changes, this correlational study aims to examine the
relationship, if any, between test scores on the multiple choice EOCT tests and the GAMEOC
tests that include constructed response in math.
19
CHAPTER TWO: REVIEW OF THE LITERATURE
Since the 1980s, the use of high-stakes testing has grown considerably in the United
States as well as in other countries around the world. This growth was first fueled by the release
of the 1983 Nation at Risk report which detailed the need for widespread reform in American
education, including increased time spent at school and increased teacher salaries. Later, the No
Child Left Behind Act (NCLB) of 2002 further increased the use of high-stakes testing as it
required regular testing in the subjects of math and reading. These data from this testing was then
intended to drive reform and hold schools accountable as all students were expected to achieve
on grade-level results by 2014. In addition, schools were held accountable for the achievement of
all student subgroups, including students with disabilities. As the use of high-stakes testing has
grown, it has continued to be driven by the need for school reform as the scores are used to hold
both teachers and schools accountable for consistent teaching and learning at all school levels
and in all subgroups.
In requiring high-stakes testing, NCLB has resulted in some unintended changes in
education that affect curriculum, teachers, and students. The required tests in reading and math
have resulted in additional time spent in those subjects for students as well as a focus on
developing curriculum in these areas while other subject areas receive less attention. In addition,
using test scores as accountability measures for teachers and schools leads the classroom in a
direction that is more teacher-centered as teachers attempt to prepare students to score well on
the required high-stakes tests (Misco, 2010). Unfortunately, using test scores as accountability
measures has also resulted in unethical and dishonest practices by schools and teachers (Au,
2009).
20
While NCLB and high-stakes test scores have caused increased participation for special
education students in both testing and curriculum, these tests have also negatively impacted the
experience of students in the classroom. Students are increasingly required to participate in test
preparation classes and lessons, test-taking skills instruction, and more teacher-driven instruction
(Berliner, 2009; Misco, 2010; Mora, 2011). The widespread use of high-stakes tests continues to
result in teaching content for the individual tests, rather than teaching a curriculum that is
connected across subjects. In addition, students have become bored with this test-driven
curriculum, especially those students who have less access to varied curriculum as they are
targeted for placement in tested subjects and test preparation classes (Berliner, 2011).
At first, the use of high-stakes testing drove education in a direction that included
multiple choice tests, disjointed knowledge, and teacher-centered pedagogy (Au, 2011; Berliner,
2011; Misco, 2010). More recently, many states have adopted the Common Core State standards,
or similar sets of standards. These standards include process standards and are geared toward
critical thinking over cognitive skill (Georgia Department of Education, 2015). The new
standards are aimed at moving teaching and learning toward a more student-centered experience,
including more projects and group work. As these new standards have been more and more
widely implemented, it has become necessary to revisit high-stakes tests in order to align the
tests with the standards as well as the intent of the standards (Maxcy, 2011). As a result, many
states are now administering high-stakes tests that include constructed response test items as a
means of allowing students to demonstrate critical thinking and application or process skills.
In Georgia, students began taking a high school exit exam in 1995 which covered all core
subjects and writing (Georgia Department of Education, 2006). After NCLB, Georgia
implemented multiple choice End of Course Tests (EOCT) in eight high school core subjects
21
(Georgia Department of Education, 2014). After the Common Core standards were adopted in
Georgia, the EOCT tests were then re-written and the literature and mathematics tests began to
include constructed response items, these are the Georgia Milestones End of Course (GAMEOC)
tests. There is some debate about whether a multiple choice or constructed response test is better
for high-stakes testing administration. Multiple choice tests are more reliable measures and are
easy to write and score while constructed response tests are very costly to score. Constructed
response tests also have some variability in grading as scoring often relies on the interpretation
of a rubric. However, constructed response items are thought to allow for students to demonstrate
understanding and application rather than skill. As a result, the purpose of this study is to review
the relationship between the scores of students on multiple choice tests and constructed response
tests.
Historical Summary
The Rise of High-Stakes Testing
Nation at Risk. The move toward using high-stakes testing as an accountability measure
first began with the Nation at Risk report of 1983. This report was the result of an investigation
into education in the United States that was conducted by a committee which formed under the
leadership of Terrel Bell, the U.S. Secretary of Education under President Ronald Regan. The
committee conducted observations and surveys at all levels of education and determined that the
public education system in the United States was performing at a level that was far from par. The
committee then published their report of the need for reform in public education, which has been
seen as “a pre-cursor for modern day federal involvement in the American education system”
(Good, 2010, p. 380) and began the movement toward using high-stakes testing as an
accountability measure.
22
No Child Left Behind. After 1983, high-stakes testing continuously increased in public
education in the United States. The use of high-stakes testing was to form a consistent
accountability measure for teachers and schools and to pinpoint areas and student groups where
reform was most needed (Berliner, 2011). While the use of high-stakes testing grew throughout
the 1980s and 1990s, it was the NCLB Act of 2002 that first required the implementation of
high-stakes testing in certain subjects in all states and districts (Au, 2011). These new nationwide
testing requirements have resulted in high-stakes testing being the driving force in educational
change in the United States (Au 2011; Heilig et al., 2010).
NCLB and the required testing introduced data driven instruction into American
education in a new way. This data became a tool for driving school improvement and studying
achievement differences among student groups, which have shown a narrowing trend over recent
years (“Examining High-Stakes Testing”, 2014). The NCLB required testing has also resulted in
a larger number of special education students participating in the general curriculum as they are
also required to be included in the math and reading high-stakes tests (Brinckerhoff & Banerjee,
2007; Byrnes, 2009). This increase in special education students participating is also a result of
the NCLB requirement that all students, regardless of their demographic group, must be on
grade-level by 2014 in order to receive Title I funds (Martin, 2012).
In contrast, NCLB has also had some negative, unintended results in the classroom. The
testing requirements of NCLB have lessened the focus on teacher pedagogy and have pushed the
teaching of disjointed content knowledge as teachers gear instruction toward the required high-
stakes tests (Olivant, 2015). Despite the intention of testing to shrink the achievement gap among
student groups, some studies show that achievement gaps have not been eliminated.
Minarechova (2012) found that two-thirds of poor students did not succeed on Georgia’s math,
23
English, and reading tests but that all wealthy students found success. In addition, student
achievement seems to have an inverse relationship with high-stakes testing as achievement has
been found to decrease in nations with testing such as the United States, but has increased in
countries without high-stakes testing accountability systems (Berliner, 2011).
Race to the Top. The Race to the Top program, put in place by President Obama, served
to continue to require high-stakes testing as it reauthorized the testing requirements put in place
by NCLB. The goal of the Race to the Top program was to raise the performance of the lower
performing schools in the nation and encouraged schools to take part in the program through
monetary rewards to schools who met the specified guidelines (Civic Impulse, 2016). In
addition, the Race to the Top program has driven many states to adopt the Common Core
standards in addition to implementing high-stakes accountability programs for students and
teachers, even using tests as a means for determining merit pay and evaluation scores for
teachers (Maxcy, 2011).
Accountability Systems and Reform
High-stakes testing first took the stage in American education in the 1980s, but formed an
accountability system with the requirements put in place by NCLB. For the first time, parents
were able to compare the test data of their child to children across the district, state, and country
(“Examining High-Stakes Testing”, 2014). High-stakes tests also serve as extrinsic motivators
for both teachers and students, bringing motivational theory into the forefront of school culture
(Supovitz, 2009). In many cases, the distribution of money among schools is linked to
performance on high-stakes tests, among other factors, as is teacher evaluation and pay. In
addition, high-stakes test scores often result in students being retained, remediated in excess, or
even suspended from school (Minarechova, 2012).

24
Accountability that is centered in high-stakes testing is part of a behaviorist view of
teaching and learning. This view holds that the natural consequences, both good and bad, of
high-stakes testing will serve to motivate both teachers and students to perform well. As a result,
the connecting of pay and evaluation to testing will motivate teachers to teach all students at a
higher level while test scores and grades will motivate students to learn the material that is
presented in the classroom. However, the current trend in education, driven by the adoption of
the Common Core standards, is towards a more constructivist view of learning where students
work collaboratively to apply learning rather than using lecture and drill. However, the tests of
the past few decades “represented an outdated behaviorist view of learning, rather than more
contemporary constructivist and socio-cognitive perspectives” (Supovitz, 2009, p. 216).
High-stakes Tests and Data
As high-stakes tests allowed parents to have new insight into the achievement levels of
their children, these tests allow allowed for educators to make decisions regarding curriculum
and classroom pedagogy and differentiation (Bambrick-Santoyo, 2010). The data from high-
stakes tests, when used effectively, can show achievement differences among student groups
within a school as well as allow teachers to identify the specific content where their students
need additional instruction. On a national level, high-stakes tests have been used to create a more
uniform curriculum across the nation as well as standardize the expectations of teachers across
districts and states as pedagogy trends toward a more uniform style (Au, 2011; Supovitz, 2009).
In contrast, high-stakes testing does not often supply useful classroom-level data as the data is
often supplied after students have moved on to another classroom or is not truly comparable to
the previous testing data of students (Supovitz, 2009).
25
High-Stakes Testing in the Present Culture of Education
Curriculum Narrowing
NCLB and its testing requirements were designed to reform education in the United
States by increasing achievement and identifying and narrowing achievement gaps among
student groups as well as holding both schools and teachers accountable for teaching and
learning. However, the widespread use of high-stakes testing has resulted in other unintended
negative results. One of the unintended results of high-stakes testing is the narrowing of
curriculum within schools and classrooms (Berliner, 2011). Most states, Georgia included, have
been testing reading, math, science, and social studies for several decades. In contrast, NCLB
requires testing in only reading and math, and does not require science or social studies testing.
These testing requirements and the accountability measures connected to testing by NCLB have
caused schools to focus more on the subjects that are tested than on subjects that are not required
to be tested. As a direct result of the testing requirements of NCLB, classroom teachers have
changed their pedagogy and classroom curriculum to align with the tested curriculum and test-
taking skills as they shape their classroom curriculum to the norms of the tests (Au, 2011).
High-stakes testing requirements have caused a narrowing of curriculum within the
classroom as well as in the subjects offered for students in schools. For many students, their
choices in subjects have been limited to tested subjects or test preparation courses. One Texas
survey showed that only 15% of teachers believe that high-stakes testing has not decreased the
offerings among non-tested subjects (Heilig et al., 2010). In addition, poor and minority students
are often required to take more math and reading courses or test preparation courses in these
areas as part of an effort to raise their test scores (Berliner, 2011). One 2006 study found that
97% of high-poverty school districts had curriculum policies that restrict the offerings for their
26
students (Berliner, 2009). The math and reading testing requirements of NCLB have resulted in a
decrease in electives offerings in higher grades, while recess and physical education have
decreased in elementary schools. Au (2011) found that 71% of districts in the United States have
cut some portion of non-tested subjects from the curriculum offerings in order to focus on
reading and math. In an earlier study, Au (2009) found that social studies has been targeted for
decrease in instructional time in 33% of districts across the nation. According to Heilig et al.
(2010), the non-tested subject that has been most affected by high-stakes testing requirements is
art, which has decreased in instructional time by 16%.
Curriculum narrowing in the form of fewer courses available to students is also seen as
some students are required to take remedial or test-preparation courses in the areas of reading
and math, giving them fewer opportunities to participate in other non-tested courses. This
practice is called double-blocking and changed the ability for students to participate in electives
such as music and art. In Texas, many middle school bands have found themselves unable to
participate in traditional statewide competitions as a result of the sheer number of students who
could no longer participate in music classes due to the requirement that they take test
remediation courses instead of electives (Heilig et al., 2010).
Curriculum narrowing began as an attempt by educators to raise reading and math high-
stakes test scores by any means possible, but has resulted in the disappearance of courses and
curriculum. In addition to changing the overall content offerings, high-stakes testing has changed
the curriculum offered within the classroom and the pedagogy with which curriculum is
presented. High-stakes testing requirements and the accountability connected to test scores drives
teachers to teach only the topics required for the test, which results in students learning in a
disconnected fashion and promotes the memorization of tested knowledge rather than critical
27
thinking and problem solving (Au, 2011). Changing the focus of curriculum and double-blocking
of students in tested subjects is intended to raise achievement and close the achievement gap,
however this has instead created a new type of gap where wealthy students have access to more
varied course offerings and poor students are limited to tested subjects and test preparation
classes (Heilig et al., 2010). The practice of curriculum narrowing began as an attempt to raise
test scores on tested subjects, however, some research shows that this may raise scores only
temporarily, while later scores in reading and math suffer as a direct result of narrowed
curriculum (Berliner, 2011). Ultimately, curriculum that may not be tested has been eliminated
from the classroom and course offerings for students are limited based on the need for more time
spent in tested subjects and in test preparation courses.
Teachers, Curriculum, and Pedagogy
NCLB and its high-stakes testing requirements have pressured teachers to change the
curriculum presented within their classrooms. In addition, schools and districts have been
pressured to standardize curriculum and teaching across classrooms and have often turned
toward test specific curriculum from commercial curriculum writers. As a result, high-stakes
testing requirements and commercial curriculum drive the classroom decisions of teachers and
classroom level curriculum now more than ever before (Au, 2011). This shift in curriculum has
left teachers less involved in decisions about their classrooms and requires that they leave
decisions regarding their students to those who create high-stakes tests, commercial curriculum,
and policy makers. As districts and states continue to seek to standardize both curriculum and
pedagogy, teachers are decreasingly able to change the curriculum in the classroom to meet the
needs of their students (Goldwyn, 2012). This standardization has created positive reform for
28
many underperforming schools and districts, but has left teachers unable to make classroom level
curriculum decisions that meet the individual needs of the student in their classrooms.
In addition to changing the curriculum within the classroom, high-stakes testing has
changed the pedagogy of the teacher within the classroom. Teachers are focused on presenting
the required and tested curriculum and standards and are less likely to be creative in classroom
pedagogy (Olivant, 2015). In addition, the structure of teaching and learning in the classroom is
often dictated to teachers, which results in teacher-centered teaching practices (Misco, 2010).
However, rather than allowing teachers freedom in the classroom, pedagogy continues to become
more focused on tested content and skills as teachers and schools are required to face
consequences of poor high-stakes test scores (Au, 2009). Rather than allowing creativity in the
classroom, teachers are pushed to focus on tested standards and content and are lead to have
students learn tested content in a similar format to the high-stakes tests, which often results in the
exclusion of project-centered learning or the use of current issues in the classroom (Journell,
2010). One study of teachers in Tennessee and Mississippi found that over 90% of teachers felt
that their instructional practices were influenced by the need to help their students score higher
on high-stakes tests (Vogler & Burton, 2010). Olivant (2015) found that teachers in schools with
a higher population of poor or minority students feel more pressured by the requirements of
high-stakes testing and often seek out employment in schools that allow for more pedagogical
creativity in the classroom.
More recently, teachers are being further pressured by high-stakes tests as there is
movement to use these scores in teacher evaluation methods as well as in determining teacher
pay. According to Martin (2012), the Federal Government has encouraged the use of test scores
in teacher evaluation, which implies that these scores are a direct result of the teachers’
29
instruction and methods. However, while teacher quality has some effect on test scores, these
scores are not necessarily a direct reflection on the instruction of an individual teacher.
Washington, D.C. continues to debate how much the salaries and retention of teachers and
administrators should be determined by the test scores of their students. In August, 2015,
teachers in the Atlanta Public School system who had a Teacher Effectiveness Measure (TEM)
score in the top 10% of the district received a $2,500 one-time bonus (Atlanta Public Schools,
2015). The TEM score of these teachers is weighted as 50% observation and 50% student growth
as measured by high-stakes tests. This bonus comes even after a widely publicized scandal in
Atlanta Public Schools concerning educators changing the answers of students on high-stakes
tests in order to reflect positively on the district (Ellis & Lopez, 2015).
Currently, in Georgia, there is a proposal to institute a state-wide merit pay scale for
teachers. In light of this proposal, Edenfield (2014) conducted survey research regarding teacher
perceptions of merit pay. The survey results showed that 81% of Georgia teachers surveyed were
in favor of raising statewide base teacher pay instead of instituting a merit pay system. This
preference for teachers is based upon their perception of factors which influence students that are
beyond the control of the teacher, such as home environment, socioeconomic status, and home
language. Martin (2012) stated, “Ninety percent of variation in scores is attributable to factors
specific to the student and unrelated to the teacher” (p. 4). Martin proceeds to say that using test
scores for teacher and school accountability purposes is the equivalent of holding teachers
accountable for the income, home language, and disabilities of their students.
Professionalism and Ethics
Minarechova (2012) found that 67% of teachers feel that high-stakes testing requirements
push them to teach only the tested content and to have students who score at an acceptable level

30
on the high-stakes tests. This pressure created by the accountability of high-stakes tests
sometimes pushes teachers to engage in unethical or dishonest teaching and testing practices.
One study showed that only 24% of teachers believe that high-stakes testing did not result in
questionable or unsound classroom practices (Au, 2009). The pressure created by the
accountability connected to high-stakes tests results in the focus on tested subjects and test
preparation, questionable testing procedures, manipulation of students groups, and blatant
cheating by teachers and administrators on high-stakes tests (Berliner, 2011; Minarechova,
2012). Some unethical practices by educators are as simple as being overly focused on tested
content while other practices include changing test answers or even supplying students covertly
with correct answers to high-stakes tests. In 2015, educators in the Atlanta Public School system
of Georgia were given jail sentences in response to convictions of cheating by means of
changing student answers on state high-stakes tests in order to reflect upon the district more
favorably (Ellis & Lopez, 2015). The high-stakes test scores in question were connected to
teacher and school evaluation scores as well as pay incentives for various educators in the
district. The cheating in the Atlanta Public School district has led many districts across Georgia
to change standardize testing procedures, but will likely not prevent all educators from
participating in all unethical teaching and testing practices as the accountability of high-stakes
testing has not changed within the state.
Online Learning
Alongside the growth of high-stakes testing, the nation has seen an explosion in virtual
learning programs. Once frowned upon, virtual learning programs have become accepted at all
levels of education. Among these virtual schools, many are private and do not necessarily have
to participate in all high-stakes tests. However, there are a growing number of public virtual
31
schools which are required to participate in high-stakes testing just as any other public school. In
comparison to traditional schools, online schools face a higher lack of motivation among
students as well as more teacher-centered instruction. Artino (2008) suggests that virtual teachers
tailor content toward the academic goals of students and relevance to their lives in order to
increase engagement in curriculum and, in turn, student achievement. In addition, teachers are
encouraged to focus on methods to boost interactivity in virtual courses as interactivity is directly
related to motivation and achievement among online students (Mahle, 2011). In order to boost
interactivity among virtual students, their teachers are encouraged to implement immediate and
constructive feedback as well as more student-centered activities that required interactivity, such
as discussion board assignments. Among virtual schools, the challenges posed by the
accountability of high-stake testing are much the same as the challenges felt in traditional
schools, but being removed from their virtual students means that virtual teachers struggle more
with motivating and engaging their online students.
Students and High-Stakes Testing
Motivation. The changes in curriculum and pedagogy driven by high-stakes testing have
also impacted the motivation of students in the classroom as they view teaching toward the tests
to be both irrelevant and disjointed. Student motivation and relevancy of content have been
found to be positively related (Crumpton & Gregory, 2011) and teachers are urged to focus on
making lessons immediately relevant to students that are also engaging. This type of relevancy,
along with integration across curriculum, has been found to increase student achievement,
particularly among students considered at-risk (MacMath, Roberts, Wallace, & Xiaohong, 2010).
The findings of these studies that encourage relevancy, integration, and more student-centered
learning are in contrast to the changes in curriculum and pedagogy that has resulted from the

32
accountability measures of high-stakes tests that have negatively impacted student motivation
and engagement. Rather than focusing on engaging students, educators are focusing on raising
high-stakes tests scores as they narrow curriculum and use teacher-centered pedagogy,
particularly with student groups who are the most at-risk.
Student groups. Despite having negative results, high-stakes testing has successfully
identified existing achievement gaps as well as struggling students (“Examining High-Stakes
Testing”, 2014). For example, one study by Capraro, Capraro, Yetkiner, Rangel-Chavez, and
Lewis (2010) identified a gap between White and Hispanic students on mathematics high-stakes
tests in that the White students scored significantly higher than their Hispanic peers. As a result
of studies such as this one identifying a gap between student groups, testing focused remediation
and test taking instruction has been geared toward more poor and minority students. In addition,
it has been found that efforts to address these identified gaps have resulted in lower scoring
student groups participating in more test preparation instruction and memorization than their
higher scoring peers, who participate in a more integrated curriculum (Berliner, 2011).
In addition to focusing on poor and minority student groups, there is also a focus on
students who may pass high-stakes tests with just a little remediation or intervention. These
students are often called “bubble students” and are sometimes targeted for test remediation and
preparation more than those who are far from passing in an effort to raise passing rates within a
school or district quickly (Minarechova, 2012). In addition, these “bubble students” are often
enrolled in multiple core and test remediation courses and unable to participate in elective or
non-tested subjects at the same level as their peers (Au, 2009).
Classroom experience and grading. The influence of high-stakes testing has greatly
affected the classroom culture and experience of students. The accountability that teachers face
33
in the world of high-stakes tests has led to the use of fewer integrated or project activities in the
classroom (Berliner, 2011). This decrease in project-based activities has occurred even at a time
when businesses are increasing the use of project-based tasks (Minarechova, 2012). Berliner
(2011) found that high-stakes testing has resulted in 42% of classroom time being centered on
whole-class teaching rather than other, more student-centered activities. Project-based activities
are prioritized behind test preparation and remediation and are used more often in schools that
have higher achievement scores on high-stakes tests. The changing focus of classroom time to
include more teacher-centered activity and less project-based activity has made learning a more
rote process and has increased both student reports of boredom as well as teacher reports of poor
student behavior in the classroom. Even further, Mora (2011) found that student boredom in the
classroom can result in both skipping class and higher rates of intention to drop out of school all
together.
Before the growth of high-stakes testing, classroom grades were assigned based on
teacher-created tests, projects, homework, and classwork. However, the introduction of high-
stakes testing requirements have resulted in these tests counting a large portion of the classroom
grade. For example, the EOCT or GAMEOC test score in each of the eight tested subjects is
required to count 20% of the student’s final grade in the class. Including high-stakes test scores
in the classroom grade of the student increases the motivation factor of the test for students and
makes classroom grades less teacher-driven. Including these scores also makes student grades
across various classrooms and schools more consistent as the high-stakes EOCT scores in
Georgia were found to have a significant relationship with course averages (Philipp, 2014).
However, students from states with high-stakes exit exams were found to perform lower on the
34
SAT test than students in states without an exit exam, presumably because of the narrowing
effect caused by the high-stakes tests (Berliner, 2009).
Students with disabilities. Part of the requirements of NCLB include that special
education students are required to participate in all high-stakes tests, as much as is possible for
the student, with applicable accommodations. The population of special education students in the
United States has grown from 10% to 14% since 1980 (National Center for Education Statistics,
2012). Including provisions for special education students in NCLB, along with the Americans
with Disabilities Act (ADA) of 1990, has helped to allow all students equal access to curriculum
and testing, while minimizing discrimination in education towards those students who are
considered special education.
These provisions for students include special education testing accommodations designed
to “lessen the impact of disabilities so that more accurate test score information can be obtained”
(Lai & Berkeley, 2012, p. 158). Among the most often used testing accommodations are
extended time, calculator use, use of large print tests, having the test read aloud, and having a
certified teacher serve as a scribe for a student. These accommodations fall into the common
categories of presentation accommodations, response format accommodations, timing
accommodations, scheduling accommodations, and setting accommodations (Salend, 2008). The
accommodations used should parallel the accommodations used by the student in the classroom
and cannot be allowed to change the nature of the test itself.
The use of these accommodations seems to have grown as high-stakes testing has grown,
but it is the extended time accommodation that is the most requested and most often used
accommodation, despite research that brings into question both the benefit and validity of the
extended time accommodation (Fuchs, Fuchs, & Capizzi, 2005; Lee, Osborne, & Carpenter,
35
2010). The extended time accommodation is thought to allow students time to complete a test so
that other weaknesses do not interfere in testing the intended skills as well as lessen the stress of
the high-stakes testing environment. However, Elliot and Marquart (2004) and Salend (2008)
found that special education students might benefit more from a combination of test
accommodations rather than just the use of extended time. Their results also indicate that all
populations of students would likely benefit from the extended time testing accommodation as
this accommodation results in lowered test anxiety among all students. However, as special
education students are continued to be required to participate in high-stakes testing, it is
important for educators to find the most effective accommodations for each student so that they
may participate in both testing and the curriculum at the same level as their peers.
In some states, students with more significant cognitive disabilities who are unable to
achieve at the expected grade level are now able to participate in alternate assessments to the
high-stakes tests completed by their grade-level peers (Salend, 2008). According to Fielding
(2004), allowing schools to have students who take these alternate assessments has resulted in
not all students being included in high-stakes testing, which may raise the school’s test score
averages. As a result, there is pressure from both teachers and administrators to recommend
students for special education services. In addition, school administrators said that high-stakes
testing has resulted in an increased number of students being identified as students with
disabilities. In total, 82% of students identified as students with disabilities have testing
accommodations as part of the Individualized Education Plan (IEP) (Fielding, 2004). However,
accommodation decisions should be based on the individual needs of the student rather than
simply the presence of a disability (Salend, 2008) and educators must be appropriately trained to
36
administer high-stakes tests with these accommodations so that they do not inadvertently give
information and clues to students while giving the examination to students with disabilities.
In addition, students with disabilities often have other difficulties, such as reading
deficits, which can affect performance on high-stakes tests such as mathematics tests (Steele,
2010). Students who are behind grade level in reading often misunderstand what is being asked
in on-level mathematics questions and thus struggle to show their math ability on the test.
Students with disabilities feel increased pressure from high-stakes tests as a result of their
disabilities and the amount of material a student who is behind grade-level must learn in order to
become on-grade level for successful test completion. In order to be labeled as having a
disability, students typically must be two years or more below grade level and so must make
more significant progress to achieve grade level designation than their peers (Martin, 2012). This
pressure created by high-stakes tests places students with disabilities and minority or
socioeconomically disadvantaged students at greater risk of not completing high school
(Johnson, Thurlow, Stout, & Movis, 2007).
Test Preparation
Along with the increased use of high-stakes accountability systems, both test remediation
and test preparation have become a more prominent part of classroom instruction. This testing-
focused instruction is sometimes offered within the core curriculum and at other times offered in
separate testing-focused courses. In addition, many schools have purchased online test
preparation resources such as Study Island® and USA Testprep, Inc. and students use these both
in the classroom and at home, often for credit as part of their classroom grade. Mora (2011)
found that test preparation and testing comprises over 100 hours of classroom time in certain
schools. Eunsook, Sas, and Sas (2006) stated, “Teaching test-taking skills is an appropriate
37
instruction for test preparation” (p. 154). However, teaching to the test is seen as unethical and
Georgia teachers are encouraged to teach the skills listed in the standards of the tested subjects
and are discouraged from focusing on a particular problem or fact that might be on the state
high-stakes test (Georgia Department of Education, 2014). One study found that 80% of teachers
in North Carolina commit teaching time to test preparation and practice and, of these, the time
spent on test preparation amounts to more than 20% of teaching time (Berliner, 2009). Vogler
and Burton (2010) found that 70% of Tennessee teachers spent class time on test preparation, as
did 88% of Mississippi teachers. In addition, 57% of Tennessee teachers who spent classroom
time on test preparation said they spent more than two months of teaching time on test
preparation and practice. In Mississippi, the 68% of teachers who included test preparation said
they spent more than two months on test preparation and practice. These two months likely
represent time reviewing skills believed to be on the high-stakes tests as well as practice
answering multiple-choice test items, rather than learning new knowledge or applying
knowledge collaboratively.
According to Turner (2009), the use of test preparation is a positive tool in the classroom
and should include motivating students as well as teaching students various test strategies and
familiarizing them with various assessment types. Teachers are encouraged to teach test taking
strategies within the content of the curriculum, however the low achieving students are less
likely to practice these strategies than their peers, requiring more classroom guidance and
practice time. The need for lower achieving students to spend more in-class time practicing for
high-stakes tests serves to widen the gap between student subgroups even more.
In addition, Eunsook et al. (2006) found that high-stakes test scores may be increased by
the inclusion of testing strategy instruction in the classroom as well as the inclusion of
38
instruction on anxiety coping methods. Teaching students to face high-stakes test with less
anxiety will result in higher test scores and must be taught within the classroom curriculum so
that content instruction is not lost within testing instruction. Unfortunately, test preparation
instruction often focuses on rote memorization techniques and the use of commercial test
preparation materials and has not been shown to be effective (Misco, 2010). As a result, it seems
that integrating test taking strategies instruction and other test preparation into classroom content
curriculum would be most effective in boosting high-stakes test scores, but educators need to be
wary of the amount of time spent practicing for high-stakes tests and how the inclusion of this
preparation affects the curriculum and pedagogy of the classroom.
The Future of High-Stakes Testing
The high-stakes testing requirements of NCLB have succeeded in identifying struggling
students and achievement gaps among students, but have also resulted in narrowing of
curriculum offerings and classroom content as well as decreased motivation among students
(Berliner, 2011; Heilig et al., 2010). In more recent years, many states have adopted the
Common Core Standards or other similar more standardized guidelines for curriculum planners.
These new common standards include a focus on critical thinking and process skills, which have
led to some testing formats including more open-ended questions rather than consisting
completely of multiple choice item types.
The new focus of curriculum standards to include reasoning and process standards has
caused the high-stakes tests written and designed as part of NCLB to become outdated. The new
standards are causing a shift in classroom pedagogy toward more student-centered activity which
is not reflected in the high-stakes tests of NCLB that are still used in some states (“Examining
High-Stakes Testing”, 2014). This shift in pedagogy has prompted educational leaders to re-align

39
high-stakes tests with the new standards and to include constructed response item types on the
tests (Maxcy, 2011). However, the writing, administration, and grading of these tests that include
constructed response items has proven to be a labor rich and costly challenge. In Georgia, the
cost of creating the Georgia Milestones tests, which include constructed response items was $10
million (Georgia Office of Planning and Budget, 2014). In addition, the state then budgeted an
additional $1 million to administer and grade the new tests (Georgia Office of Planning and
Budget, 2015). These funds are in addition to the previously established testing budget.
High-Stakes Testing in Georgia
In high schools in Georgia, high-stakes testing has taken several different forms over the
past few decades. From the early 1980s through the early 1990s, high school students were
required to pass a basic skills test in order to graduate (Georgia Department of Education, 2006).
With the class of 1995, Georgia high school students were required to take a newly designed test,
the Georgia High School Graduation Test (GHSGT) which consisted of tests in all core subjects
as well as in writing. Students first took this test as eleventh graders and could re-take the tests
several times if needed in order to graduate. Students in Georgia were required to pass all subject
areas of the GHSGT in order to graduate through the 2013-14 school year, at which time the
subject area tests were discontinued (Georgia Department of Education, 2014). At this time,
students must only pass the Georgia High School Writing Test (GHSWT) in order to graduate,
but must also complete eight subject area tests which are administered as final exams in various
content areas, however a passing score on these tests is not required.
In response to the requirements of NCLB (2002), Georgia developed the EOCTs in
algebra, geometry, physical science, biology, ninth grade literature, American literature, U.S.
history, and economics (Georgia Department of Education, 2006). All students enrolled in each
40
of the respective courses were required to complete the EOCT for their subject at the completion
of the course. These tests were originally required to count 15% of the course grade but were
then changed to 20% of the course grade after the 2010-11 school year (Georgia Department of
Education, 2014). While passing the test is not a requirement, completion of each of these tests is
a requirement for graduation, regardless of score. However, during the years of 2001-2009,
students in Georgia were required to complete the EOCT test in the eight tested subjects as well
as pass the subject area tests of the GHSGT in order to graduate from high school. The score on
the EOCT test is figured as 20% of the course grade while the classroom average comprises 80%
of the course grade. In order to have a passing grade, the combined classroom and EOCT score
must equal a 70% or higher. These scores were a portion of a school’s Annual Yearly Progress
(AYP) status, now the College and Career Ready Performance Index (CCRPI) score and are used
to detect academic progress and to inform teacher-effectiveness measures.
These EOCT tests have been revised several times in recent years as Georgia moved
from the Georgia Performance Standards (GPS) to the Common Core Georgia Performance
Standards (CCGPS). With the adoption of the CCGPS standards, Georgia then began revising
the tests in literature and math to include constructed response items as well as a writing
component within the English assessments (Georgia Department of Education, 2015). These new
tests were called the Milestones tests, or Georgia Milestones End of Course (GAMEOC) tests
and were first implemented in the 2014-15 school year. As with the previous tests, they are
required to count 20% of the course grade in each course and must be completed in order to
graduate from high school. In addition, the GAMEOC tests are to be given primarily online, with
a transition over time to a complete online administration of all testing (Georgia Department of
Education, 2014a).
41
Both the earlier EOCT tests and the current GAMEOC tests are criterion-referenced tests,
designed to give feedback on a student’s mastery of the standards within a course (Georgia
Department of Education, 2014a). Data is also reported at the domain level so that teachers may
determine strengths and weaknesses of students. This data is intended to be formative and to
drive instruction, however, the score reports are generated and reported after the student has
moved on to the next course in the sequence. On both the EOCT and GAMEOC tests students
receive both a raw score and a scaled score, as well as a proficiency level designation. The raw
score is based on the number correct on the multiple-choice EOCT. On the GAMEOC that
includes constructed response items, the raw score is based on a number of points awarded, with
multiple choice items counting 1 point, constructed response counting 2 points, and extended
constructed response items counting 4 points. Both tests are then also given a scaled score, a
score that is comparable across all test forms and years for the same GAMEOC test, and is
reported on a scale of 0-100 to be used as the grade of the final exam. Both the EOCT and
GAMEOC tests allow for accommodations for students with disabilities that include setting,
scheduling, presentation, and response-type accommodations. All certified high-school educators
in Georgia are required to participate yearly in training regarding proctoring these tests,
including administering the tests to students with disabilities who require accommodations.
Of all the high school core courses offered to students in Georgia, only eight require the
GAMEOC: algebra, geometry, physical science, biology, ninth grade literature, American
literature, U.S. history, and economics. However, student growth and student growth measures
are currently a part of the evaluation of teachers in Georgia. In order to measure growth in
courses that do not require GAMEOC final exam, a Student Learning Objectives (SLO) test is
given in all other high school subjects, core or elective (Georgia Department of Education,
42
2014b). These tests are developed or selected at the district level across the state and are
approved by the Georgia Department of Education. The SLO test in each subject is designed to
be aligned with the standards and learning objectives in each course and according to a table of
specifications provided by the state. These tests are generally all multiple choice and are
administered as a pre-test/post-test in order to show student growth. The score on each SLO test
is required to count as a final exam in the course, usually 10%. Teachers then receive a rating
based on the percent growth of their students on the SLO test and this rating is weighted as half
of the Teacher Effectiveness Measure (TEM) score in the teacher’s evaluation. The development,
administration, and use of the SLO tests has been in process over the past three years, and is still
in flux as many districts, including Cobb County School District (a large suburban district in
northwest Georgia), decided that the SLO scores for the 2015-16 school year would only be
counted as a final exam for students if the score helped the student (Cobb County School
District, 2015). If the SLO score lowered the class average when counted as a final exam, the
score was dropped. However, the SLO scores are still meant to count as a part of the teachers’
TEM score even though the score does not count for most students.
In considering the GHSGT, EOCT, GAMEOC, and SLO tests in Georgia, high school
students have been required to complete and sometimes pass high-stakes tests in all core subject
areas since 1995. For a period of time, students were required to complete the GHSGT core
subject area tests and then the EOCT test in the eight tested core subjects as well. Currently,
Georgia high school students are required to complete a high-stakes test in every course, elective
or core, in the form of a GAMEOC test or an SLO test. The GAMEOC tests are required for
graduation and count 20% of the final course average per the state (Georgia Department of
Education, 2014). However, SLO test is not required for graduation.

43
Test Item Types
The adoption of the Common Core State Standards and other similar standards is driving
a change in testing to include open and constructed response items (Maxcy, 2011). Georgia has
adopted tests that include constructed response items in Coordinate Algebra, Analytic Geometry,
Ninth Grade Literature, and American Literature beginning with the 2014-15 school year
(Georgia Department of Education, 2015). These new tests are rooted in constructivism as there
is an emphasis on the process rather than the product and students must construct a solution
rather than select the correct answer from a supplied list (Sutinen, 2008; Yilmaz, 2008).
As tests begin to include constructed response items, it is important to know the
difference between multiple choice high-stakes tests and constructed response high-stakes tests.
DeMars (2000) found that higher stakes on tests have a larger impact on constructed response
scores than on multiple choice tests scores. Lissitz and Hou (2012) compared multiple choice
tests to constructed response tests and found that the two types of tests seem to be equivalent
measures in Algebra and Biology, but not necessarily in other subjects. In addition, they
suggested further research to test generalization of their results to other large-scale assessments
in various content areas. In another study, Powell (2012) found that students with disabilities
have an advantage in multiple choice formats in math. Powell states that this is in contrast to
earlier studies showing that format does not influence performance and suggests further research
on the effects of test response options on math tests.
According to Martinez (1999), when high-stakes tests guide teaching, the inadequacies of
the tests are felt far beyond the test itself as the tests also distort teaching and learning in the
classroom. As a result, it is important to consider the type of test, test item types, and content
measured before instituting a practice of testing students. Unfortunately, most high-stakes tests
44
measure only cognitive outcomes which serves to limit the scope of teaching and learning to this
type of material (Martinez, 1999). In general, multiple-choice tests measure only
decontextualized pieces of knowledge and serve to reward the knowledge that is learned through
test preparation and drill (Berliner, 2009). In addition, the multiple-choice test format makes it
more difficult to measure deeper and more complex understanding of material, such as
application and critical reasoning, which can be measured by constructed response measures.
However, multiple choice tests generally have near-perfect scoring reliability while extended-
response items are by far the most expensive to score and report (Martinez, 1999).
As the adoption of new standards leads states like Georgia to change high-stakes tests to
include constructed response items, it is possible that teaching and learning may be affected in
such a way as to allow more room for application and critical reasoning. Wendt and Kenny
(2009) found that stakeholders felt that alternate test item types were more challenging and
realistic as they allowed students to demonstrate their knowledge. In addition, they felt that tests
with more than one response type encouraged more than recall and promoted application of
learned material. As a result, Martinez (1999) encourages the use of assessments with a
combination of response formats so that the tests can capitalize on the strengths of each type of
response item type.
As high-stakes testing continues to evolve to meet the demands of the current standards
and expectations in education, it seems that including constructed response items will allow
teachers to focus less on drill and test preparation and more on application of knowledge.
However, test writers must be careful to write various test item types to measure the desired type
of knowledge as all types of test item types can be written so as to measure only cognitive skill
(Martinez, 1999). In addition, test writers must be careful that students are being measured on the

45
content intended without being inadvertently tested on other areas. For instance, Lamb (2010)
found that students in Texas performed lower on math questions that were written with a reading
grade level that was above the students’ current grade level. When writing test items, test authors
must consider if secondary factors such as reading ability will affect the tests ability to measure
the mathematics ability of the student. This is especially true for constructed response
mathematics test items that tend to include situational problems and require explanation as part
of the response.
Christian Worldview
The current culture of high-stakes testing in education which includes prescribed and
commercially created curriculum is reflective of a process-mastery curriculum orientation. This
orientation is described by Van Brummelen (2002) to be one that includes a focus on objective
knowledge as well as a predetermined curriculum. The use of high-stakes tests allows educators
to gain data on student learning and achievement and to adjust curriculum to meet their needs,
however these tests also result in narrowing curriculum and limiting creativity and experiences
of students in the classroom. According to Van Brummelen (2002), focusing on skills may
“inhibit other abilities or applications such as creative problem solving” (p. 30). In our current
educational culture, skill is being taught thoroughly and often effectively while critical thinking
and process skills are often neglected.
Romans 1:20 says, “For since the creation of the world God’s invisible qualities – his
eternal power and divine nature – have been clearly seen, being understood from what has been
made” (NIV). In order to educate the whole individual, education must include both objective
knowledge as well as a growing knowledge of God. In standardizing education through the use
of high-stakes testing, students are not able to express their creativity or to utilize their unique
46
talents in the classroom. Students need to be able to think critically regarding the world around
them and to become autodidactic learners in order to continue to develop a knowledge of God.
As a means of encouraging a more complete knowledge a core curriculum should include
“values, dispositions, and commitments in harmony with biblical norms and values such as love,
responsibility, peace, justice, righteousness, and truth” (Van Brummelen, 2002, p. 87).
Summary
NCLB and the required high-stakes testing has succeeded in holding schools accountable
for teaching and learning as well as identifying achievement gaps and student needs. However,
the widespread use of high-stakes testing has also resulted in other unintended consequences for
schools, teachers, and students. Both classroom curriculum and course offerings have been
narrowed as more time is spent focused on the tested subjects, especially for students in poor and
minority groups. Students in these groups are often required to spend more time in courses
focused on tested subjects and test preparation. In some districts, course offerings are limited
according to high-stakes test results, affecting music and art programs as well as access to other
elective courses. As a result, a new educational gap has been created by the use of high-stakes
testing as various student groups are allowed different access to elective and other non-tested
subjects.
Beyond the narrowing of curriculum, NCLB and high-stakes testing has resulted in more
teacher-centered instruction as well as the use of a more standardized, sometimes commercially
created, curriculum. In addition, teachers are spending a significant amount of teaching time on
test preparation and test taking skills in order to raise the high-stakes test scores of their students.
Often, group collaboration and application projects are left out of the classroom curriculum in
order to make time for more test preparation and practice. These changes in curriculum and
47
pedagogy have caused students to become increasingly bored in the classroom. In addition, there
has been an increase in students who are identified as students with disabilities as teachers and
administrators feel pushed to allow testing accommodations and alternate testing options for
these students in order to raise test scores.
Teachers feel pressured by the culture of high-stakes testing as they shape the curriculum
and teacher-centered pedagogy of the classroom. Using test scores to hold teachers accountable,
and even to determine their rate of pay, has caused teachers to change curriculum and pedagogy
and even to change schools or leave the profession altogether. In addition, the pressure created
by the accountability of high-stakes tests has cause some educators to participate in cheating or
other unethical practices, as was the case in the Atlanta Public School System.
In Georgia, high-stakes tests have been a large part of public education since the
introduction of the GHSGT in the mid-90s. Since then, with the introduction of NCLB,
Georgia’s required high-stakes tests at the high school level changed to be standardized state-
wide final exams in eight of the core subjects. These tests were considered EOCTs and were all
multiple choice tests. More recently, these tests have been revised to become the GAMEOC in
the same eight core subject areas. However, the tests in literature and mathematics now include
constructed response test items.
In addition to identifying achievement gaps and need of students, the use of high-stakes
testing has created a system where data is used to drive instruction. The adoption of the Common
Core Standards and inclusion of critical thinking and constructed response items on high-stakes
tests are an important addition to this data driven culture. These changes refocus public
education on process and application skills rather than cognitive skill and allow for more teacher
and student creativity, including a need for project learning. However, given the burden of

48
creating tests with constructed response items to accompany these new standards, along with the
increased cost of scoring these items, it is important to determine if there is any relationship in
test scores between the previous multiple choice tests and the newer tests that include
constructed response items.
49
CHAPTER THREE: METHODOLOGY
Introduction
As changes in the standards in education lead states to redesign high-stakes tests to
include constructed response items, it is pertinent to ask if the scores on the new tests are related
to the scores on previous multiple choice tests. This study aimed to determine if there was a
relationship between the test scores of Georgia’s high school students on the multiple choice End
of Course Test (EOCT)and the Georgia Milestones End of Course (GAMEOC) tests which
include constructed response items. This chapter details the design and research method of the
study as well as setting, participants, instrumentation, and statistical analysis methods.
Design
In order to measure the relationship between EOCT and GAMEOC scores, a posttest only
two-group correlational design is most appropriate. The type of test administered (EOCT or
GAMEOC) represents the dichotomous independent variable and the test scores represent the
dependent variable. “Correlational research refers to studies in which the purpose is to discover
relationships between variables through the use of correlational statistics” (Gall, Gall, & Borg,
2007, p. 332). As a result, such a design was be used to assess the relationship between the test
scores of students’ on tests that do or do not included constructed response items. This allows
discussion regarding student scores and test type.
Assumptions and Limitations
Assumptions
The EOCT and GAMEOC test scores for each of the four subjects were tested for
normality using Kolmogorov-Smirnov’s test and for equal variances using Levene’s test. The
results of these assumption tests will determine if a point biserial test is appropriate or if a non-
50
parametric test such as the chi-squared test is needed.
Limitations
Limitations for this study included the use of non-random convenience sampling in
choosing the participants for the study. While the demographics of the sample school are similar
to many across the state of Georgia, care should be taken when applying the results of this study
to other settings and high-stakes tests.
Research Questions
The research questions for this study are:
RQ1: What is the relationship between Georgia students’ End-of-Course Test scores and
Georgia students’ Georgia Milestones End-of-Course scores in math?
RQ2: What is the relationship between Georgia general education students’ End-of-
Course Test scores and Georgia general education students’ Georgia Milestones End-of-Course
scores in math?
RQ3: What is the relationship between Georgia special education students’ End-of-
Course Test scores and Georgia special education students’ Georgia Milestones End-of-Course
scores in math?
Null Hypotheses
The following are the null hypotheses:
Ho1: There is no relationship between Georgia students’ End-of-Course Test scores and
Georgia students’ Georgia Milestones End-of-Course scores in Coordinate Algebra.
Ho2: There is no relationship between Georgia students’ End-of-Course Test scores and
Georgia students’ Georgia Milestones End-of-Course scores in Analytic Geometry.

51
Ho3: There is no relationship between Georgia general education students’ End-of-
Course Test scores and Georgia general education students’ Georgia Milestones End-of-Course
scores in Coordinate Algebra.
Ho4: There is no relationship between Georgia general education students’ End-of-
Course Test scores and Georgia general education students’ Georgia Milestones End-of-Course
scores in Analytic Geometry.
Ho5: There is no relationship between Georgia special education students’ End-of-Course
Test scores and Georgia special education students’ Georgia Milestones End-of-Course scores in
Coordinate Algebra.
Ho6: There is no relationship between Georgia special education students’ End-of-Course
Test scores and Georgia special education students’ Georgia Milestones End-of-Course scores in
Analytic Geometry.
Participants
The participants in this study consisted of a non-random sample of high school students
from the sample school who have taken a total of 1,234 math EOCT tests and a total of 1,468
GAMEOC tests. The scores of all students enrolled in the school’s Coordinate Algebra and
Analytic Geometry courses were tested, resulting in a convenience sample. The number of
EOCT tests taken by the participants in each content area were: 665 Coordinate Algebra and 569
Analytic Geometry. The number of GAMEOC tests taken by the participants in each content
area were: 659 Coordinate Algebra and 809 Analytic Geometry.
The demographics of the sample school were as follows: 50% are male and 50% are
female. The ethnicity of the participants includes 43% Caucasian, 35% African American, 15%
52
Hispanic, and 4% Asian. In addition, 41% of the students at the sample school were enrolled in
the free or reduced lunch program.
Setting
This study took place in a large public high school in a suburban area of Georgia. The
courses studied include only those high school level courses that include required state tests and
where the test had been changed from multiple choice to both multiple choice and constructed
response, without an essay section. These courses were: Coordinate Algebra and Analytic
Geometry. This study compared the scores on the 2013-2014 all multiple choice EOCT tests to
the 2014-2015 GAMEOC tests which included constructed response items.
Instrumentation
The two tests used in this study include the EOCT and the GAMEOC tests. These tests
were developed in conjunction with the state board of education by a nationally recognized
contracted test developer to measure the standards for each content area. The EOCT tests were
required to count 20% of a student’s final course grade and were made up of two sections of
multiple choice questions per tests, totaling 50-80 questions. These tests have been used in
Georgia for approximately 15 years and are continuously reviewed and revised to ensure quality
measurement of the standards, now including Common Core standards. The questions range in
difficulty, which is also carefully reviewed by the development team. The Georgia board of
education has previously reported a reliability coefficient for EOCT tests between 0.84 and 0.96
(Georgia Department of Education, 2006). The GAMEOC tests were first administered in the
2014-2015 school year in Georgia. These tests cover the same standards as the most recent
EOCT tests but include the addition of constructed and extended response items. The GAMEOC

53
tests are also developed by the state with a contracted developer and count 20% of the final
course grade.
The mathematics EOCT tests are given in two 60 minute sections, with a total of 62
multiple choice test items (Georgia Department of Education, 2014a). The Coordinate Algebra
EOCT includes questions in the domains of Algebra and Functions, Connections to Geometry,
and Connections to Statistics and Probability. The Analytic Geometry EOCT includes questions
in the domains of Geometry, Expressions, Equations, and Functions, Number and Quantity, and
Statistics and Probability. Of the test items, 8 are field test items and do not count toward the test
score. Students are given a raw score based on the number correct, with each correct answer
counting 1 point. This raw score is then converted to a scaled score. The scaled score is normed
in such a way as to adjust for differences in difficulty, making it so that various forms of the
same subject tests have the same reporting scale. The scaled score is then converted into a Grade
Conversion score in order to be reported and averaged into the classroom grade and students are
assigned a proficiency level. For both Coordinate Algebra and Analytic Geometry, a scaled score
of 200-399 results in a grade conversion of 0 to 69 and a designation of Does Not Meet
Expectations. A scaled score of 400-449 results in a grade conversion of 70-89 and a designation
of Meets Expectations. Lastly, a scaled score of 450-600 results in a grade conversion of 90-100
and a designation of Exceeds Expectations. For example, a student may answer 38 out of the 54
graded items on the Coordinate Algebra EOCT correctly and earned a scaled score of 425, grade
conversion of 80, and designation of Meets Expectations.
In contrast, the mathematics GAMEOC tests are given in two 85 minute sections with a
total of 73 test items (Georgia Department of Education, 2015a; Georgia Department of
Education, 2015b). Of these items, 10 are considered field test items and 10 are used for
54
percentile rank purposes. Only 53 of the items are used to form the criterion referenced score.
Each multiple choice item counts as one point, each constructed response item counts 2 points,
and each extended constructed response item counts 4 points. The Coordinate Algebra
GAMEOC includes items in the domains of Algebra and Functions, Connections to Geometry,
and Connections to Statistics and Probability. The Analytic Geometry GAMEOC includes items
in the domains of Geometry, Expressions, Equations, and Functions, Number and Quantity, and
Statistics and Probability. As with the EOCT, GAMEOC scores are first calculated as raw scores
then converted to normed scaled scores and grade conversion scores. For the Coordinate Algebra
GAMEOC, a scaled score of 215-474 results in a grade conversion of 0-67 and a designation of
Beginning Learner; a scaled score of 475-524 results in a grade conversion of 68-79 and a
designation of Developing Learner; a scaled score of 525-593 results in a grade conversion of
80-91 and a designation of Proficient Learner; and a scaled score of 594-790 results in a grade
conversion of 92-100 and a designation of Distinguished Learner (Georgia Department of
Education, 2014b). For the Analytic Geometry GAMEOC, a scaled score of 185-474 results in a
grade conversion of 0-67 and a designation of Beginning Learner; a scaled score of 475-524
results in a grade conversion of 68-79 and a designation of Developing Learner; a scaled score of
525-595 results in a grade conversion of 80-91 and a designation of Proficient Learner; and a
scaled score of 596-810 results in a grade conversion of 92-100 and a designation of
Distinguished Learner (Georgia Department of Education, 2014c). For all tests, a grade
conversion of 0 is given to the lowest scaled score, 68 is given to the scaled cut for Developing
Learner, or 475. A grade conversion of 80 is given to the scaled score cut of Proficient Learner,
or 525. A grade conversion of 92 is given to the scaled score cut for Distinguished Learner and
55
100 is given to the highest scaled score. A linear transformation is then applied to all scaled
scores between any to cut scores to assign grade conversion scores to all scaled scores.
Testing accommodations are allowed for students with disabilities or English learners
(Georgia Department of Education, 2014c). The accommodations allowed fall into the categories
of presentation, response, setting, and scheduling such as extended time, small group, read aloud,
scribe, large print, and more. In addition, there are standard accommodations which allow a
student access to the test without altering what is being measured; and conditional
accommodations will allow students who may not otherwise be able to take the test to
participate. In order to have conditional accommodations, a student must meet specific criteria
and the resulting test score must be interpreted in light of the conditional test administration.
Procedures
In order to carry out this study, IRB approval was first necessary from the Liberty
University Institutional Review board. In addition, permission was sought from the sample
school’s district IRB office to anonymously use the EOCT and GAMEOC scores of students.
After this approval was received, 2013-14 EOCT and 2014-15 GAMEOC scores were be
obtained for all students enrolled in the sample school’s Coordinate Algebra and Analytic
Geometry courses. These scores were provided to the district by the Georgia Department of
Education Testing Division. Finally, data analysis was completed on the EOCT and GAMEOC
scores for each of the two subjects.
Data Analysis
A point biserial correlational test with significance level set to p < .05 is most appropriate
when examining the relationship between two variables where one variable is continuous and
one is a dichotomy (Gall et al., 2007). In order to study the relationship between test scores and

56
the degree of the relationship, either a point biserial or a chi-squared test was calculated,
depending on the assumption testing of the data. The data met the assumptions that one variable
is continuous and one is dichotomous as the test scores are continuous measures and the two
types of tests, EOCT and GAMEOC, form a dichotomous variable. To analyze the data, raw
score data was first converted to a percent of total possible points and screened for outliers using
a box and whisker plot for each set of test scores. Data was then tested for normality using the
Kolmogorov-Smirnov test and for equal variances using Levene’s test for each category of data,
EOCT and GAMEOC. If the data satisfies the assumption tests, a point biserial correlation was
used. Otherwise, a chi-squared test was used to test the relationship. The reported test values
include the degrees of freedom, correlation coefficient, and significance level, allowing for
analysis of the relationship between EOCT and GAMEOC scores as well as the degree of this
relationship.

57
CHAPTER FOUR: FINDINGS
Research Questions
The research questions for this study are:
RQ1: What is the relationship between Georgia students’ End-of-Course Test (EOCT)
scores and Georgia students’ Georgia Milestones End-of-Course (GAMEOC) scores in math?
RQ2: What is the relationship between Georgia general education students’ End-of-
Course Test scores and Georgia general education students’ Georgia Milestones End-of-Course
scores in math?
RQ3: What is the relationship between Georgia special education students’ End-of-
Course Test scores and Georgia special education students’ Georgia Milestones End-of-Course
scores in math?
Null Hypotheses
The following are the null hypotheses:
Ho1: There is no relationship between Georgia students’ End-of-Course Test scores and
Georgia students’ Georgia Milestones End-of-Course scores in Coordinate Algebra.
Ho2: There is no relationship between Georgia students’ End-of-Course Test scores and
Georgia students’ Georgia Milestones End-of-Course scores in Analytic Geometry.
Ho3: There is no relationship between Georgia general education students’ End-of-
Course Test scores and Georgia general education students’ Georgia Milestones End-of-Course
scores in Coordinate Algebra.
58
Ho4: There is no relationship between Georgia general education students’ End-of-
Course Test scores and Georgia general education students’ Georgia Milestones End-of-Course
scores in Analytic Geometry.
Ho5: There is no relationship between Georgia special education students’ End-of-Course
Test scores and Georgia special education students’ Georgia Milestones End-of-Course scores in
Coordinate Algebra.
Ho6: There is no relationship between Georgia special education students’ End-of-Course
Test scores and Georgia special education students’ Georgia Milestones End-of-Course scores in
Analytic Geometry.
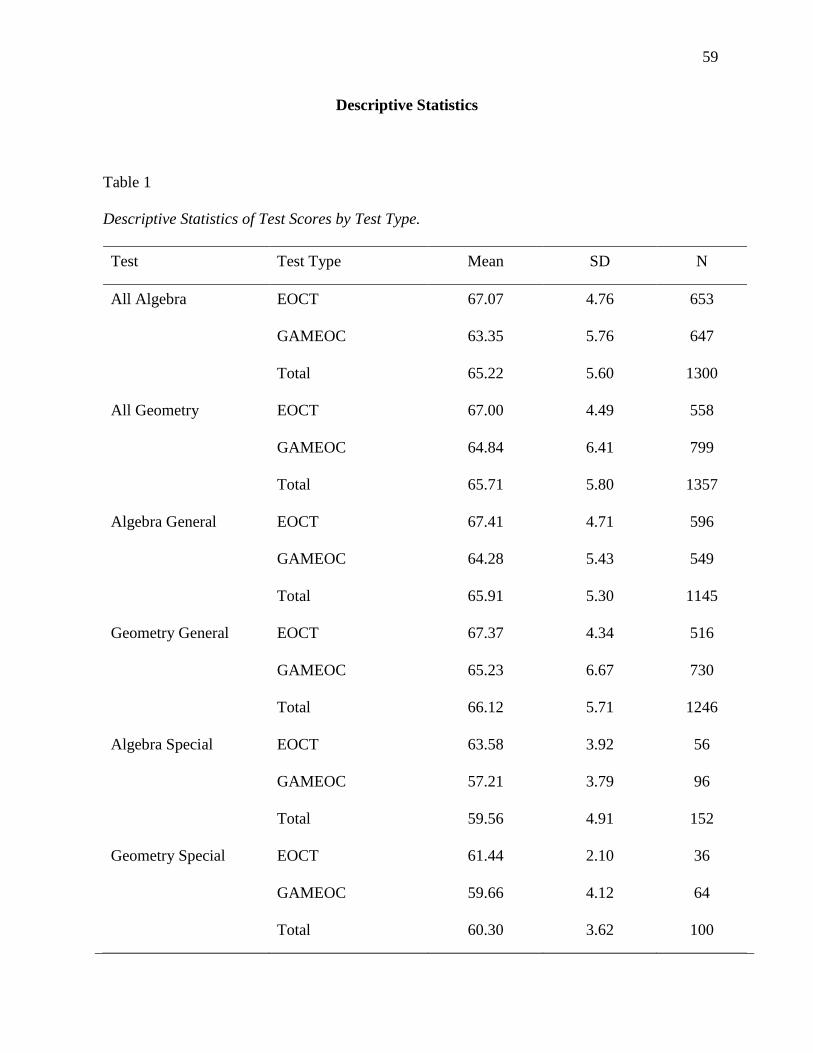
59
Descriptive Statistics
Table 1
Descriptive Statistics of Test Scores by Test Type.
Test Test Type Mean SD N
All Algebra EOCT 67.07 4.76 653
GAMEOC 63.35 5.76 647
Total 65.22 5.60 1300
All Geometry EOCT 67.00 4.49 558
GAMEOC 64.84 6.41 799
Total 65.71 5.80 1357
Algebra General EOCT 67.41 4.71 596
GAMEOC 64.28 5.43 549
Total 65.91 5.30 1145
Geometry General EOCT 67.37 4.34 516
GAMEOC 65.23 6.67 730
Total 66.12 5.71 1246
Algebra Special EOCT 63.58 3.92 56
GAMEOC 57.21 3.79 96
Total 59.56 4.91 152
Geometry Special EOCT 61.44 2.10 36
GAMEOC 59.66 4.12 64
Total 60.30 3.62 100
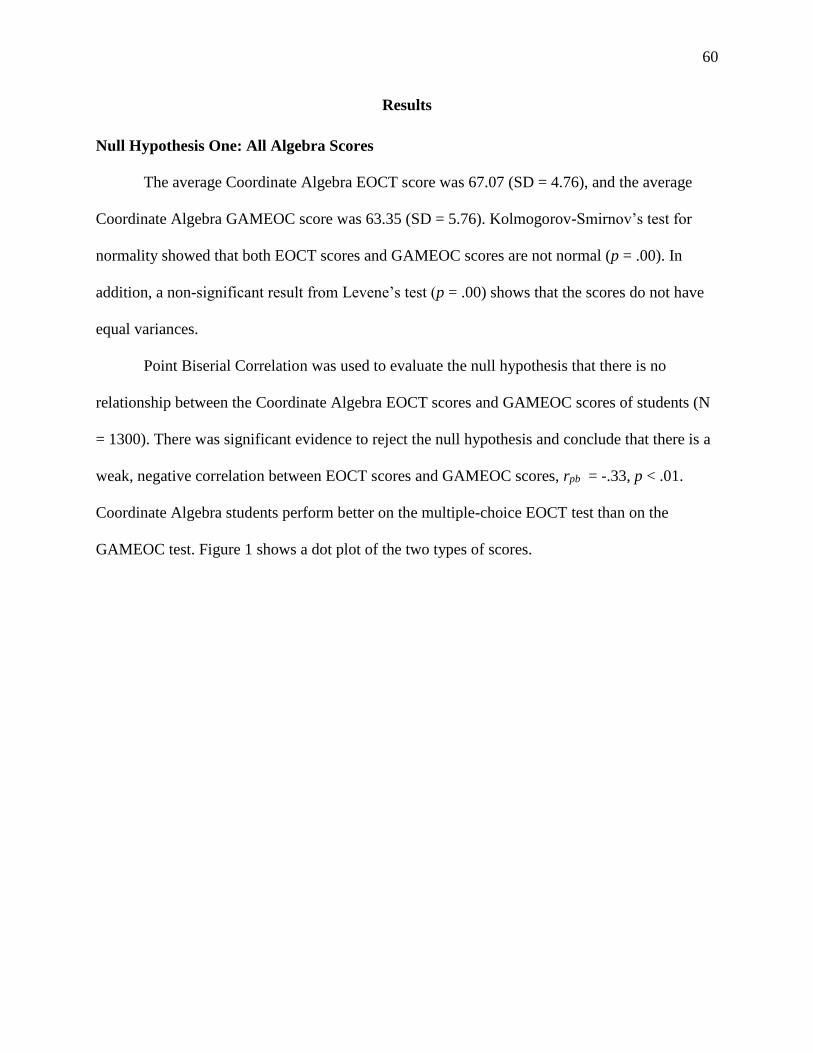
60
Results
Null Hypothesis One: All Algebra Scores
The average Coordinate Algebra EOCT score was 67.07 (SD = 4.76), and the average
Coordinate Algebra GAMEOC score was 63.35 (SD = 5.76). Kolmogorov-Smirnov’s test for
normality showed that both EOCT scores and GAMEOC scores are not normal (p = .00). In
addition, a non-significant result from Levene’s test (p = .00) shows that the scores do not have
equal variances.
Point Biserial Correlation was used to evaluate the null hypothesis that there is no
relationship between the Coordinate Algebra EOCT scores and GAMEOC scores of students (N
= 1300). There was significant evidence to reject the null hypothesis and conclude that there is a
weak, negative correlation between EOCT scores and GAMEOC scores, rpb = -.33, p < .01.
Coordinate Algebra students perform better on the multiple-choice EOCT test than on the
GAMEOC test. Figure 1 shows a dot plot of the two types of scores.
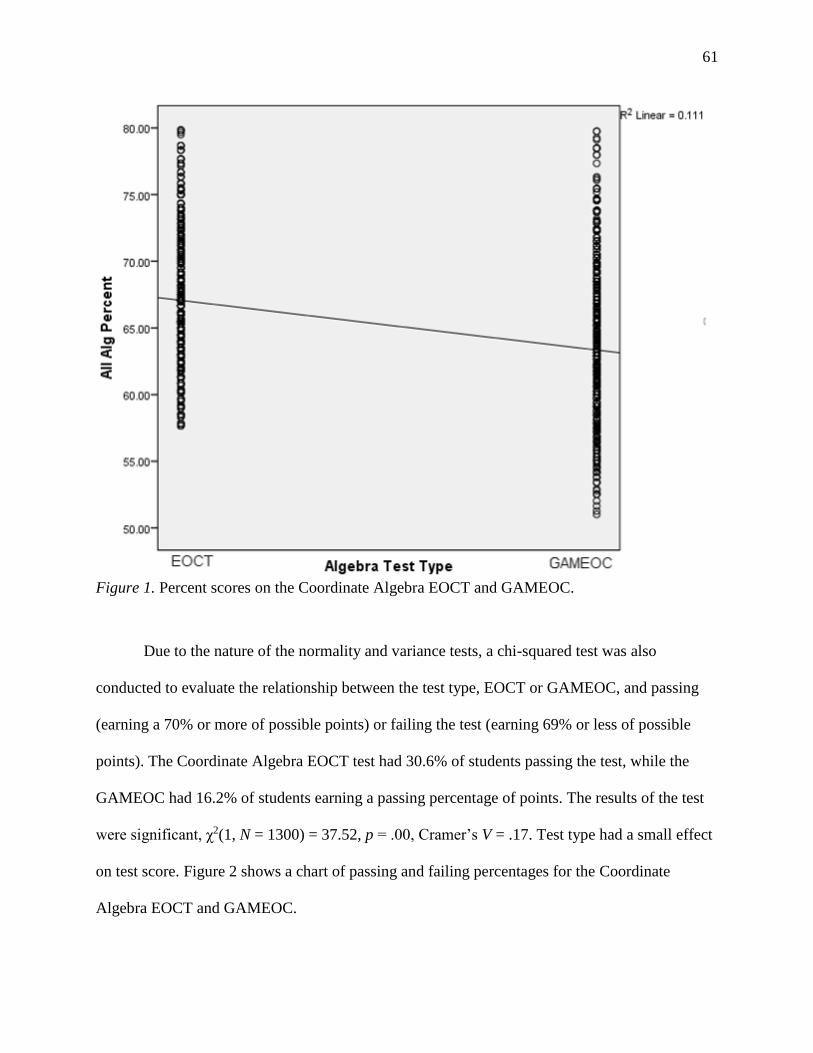
61
Figure 1. Percent scores on the Coordinate Algebra EOCT and GAMEOC.
Due to the nature of the normality and variance tests, a chi-squared test was also
conducted to evaluate the relationship between the test type, EOCT or GAMEOC, and passing
(earning a 70% or more of possible points) or failing the test (earning 69% or less of possible
points). The Coordinate Algebra EOCT test had 30.6% of students passing the test, while the
GAMEOC had 16.2% of students earning a passing percentage of points. The results of the test
were significant, χ2(1, N = 1300) = 37.52, p = .00, Cramer’s V = .17. Test type had a small effect
on test score. Figure 2 shows a chart of passing and failing percentages for the Coordinate
Algebra EOCT and GAMEOC.

62
Table 2
Chi Square on Algebra Test Type and Test Pass Rates
Test Test Type Fail Pass
Algebra EOCT 453 200
GAMEOC 542 105
Algebra2=37.52, df=1, p=.00 N = 1300
Figure 2. Number of passing and failing scores on the Coordinate Algebra EOCT and
GAMEOC.
Null Hypothesis Two: All Geometry Scores
The average Analytic Geometry EOCT score was 67.00 (SD = 4.49), and the average
Analytic Geometry GAMEOC score was 64.84 (SD = 6.41). Kolmogorov-Smirnov’s test for
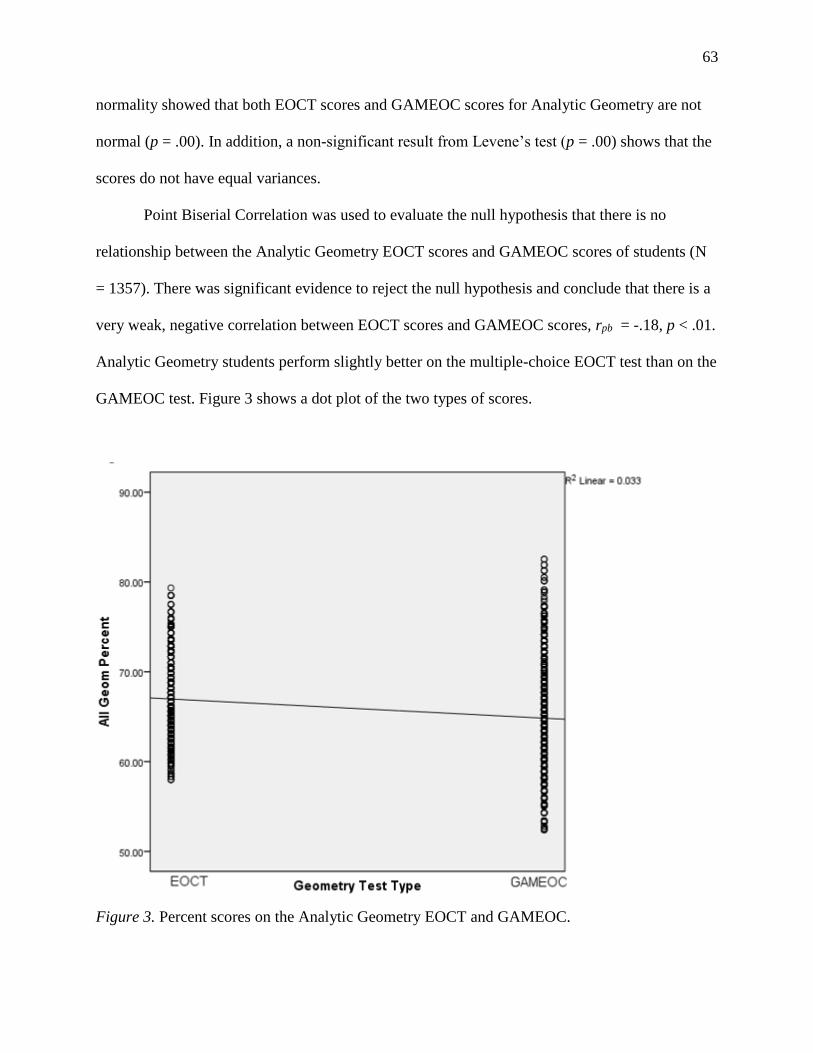
63
normality showed that both EOCT scores and GAMEOC scores for Analytic Geometry are not
normal (p = .00). In addition, a non-significant result from Levene’s test (p = .00) shows that the
scores do not have equal variances.
Point Biserial Correlation was used to evaluate the null hypothesis that there is no
relationship between the Analytic Geometry EOCT scores and GAMEOC scores of students (N
= 1357). There was significant evidence to reject the null hypothesis and conclude that there is a
very weak, negative correlation between EOCT scores and GAMEOC scores, rpb = -.18, p < .01.
Analytic Geometry students perform slightly better on the multiple-choice EOCT test than on the
GAMEOC test. Figure 3 shows a dot plot of the two types of scores.
Figure 3. Percent scores on the Analytic Geometry EOCT and GAMEOC.
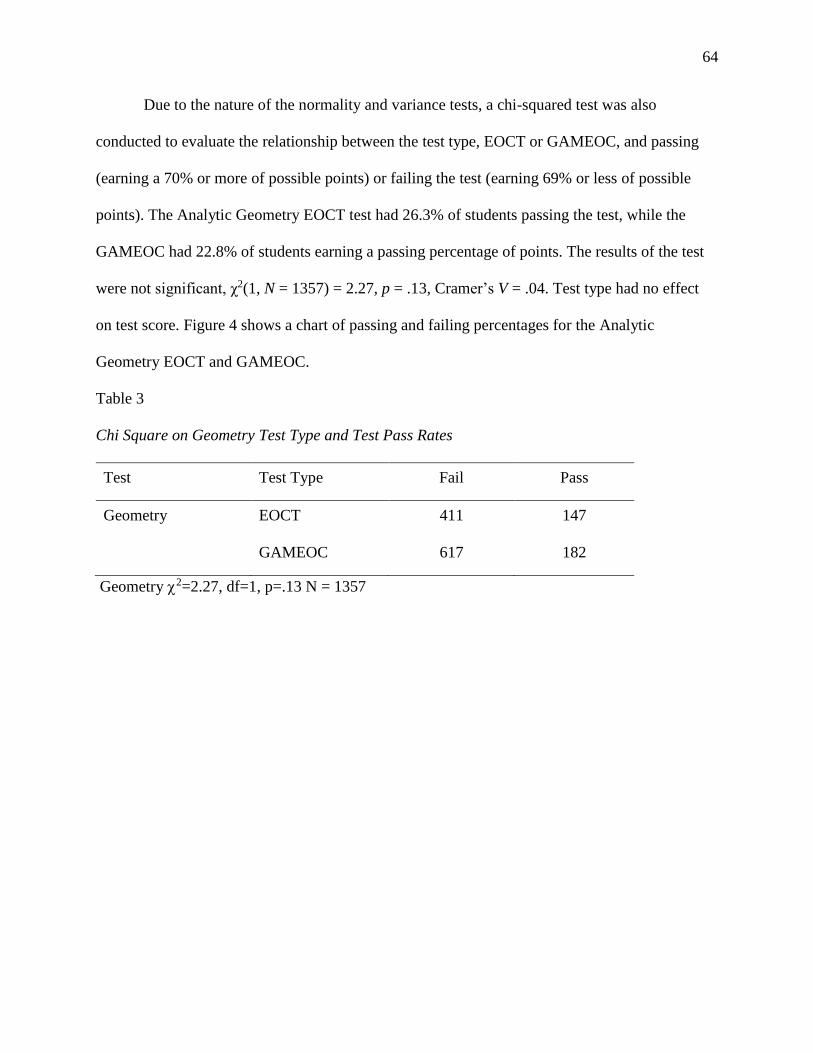
64
Due to the nature of the normality and variance tests, a chi-squared test was also
conducted to evaluate the relationship between the test type, EOCT or GAMEOC, and passing
(earning a 70% or more of possible points) or failing the test (earning 69% or less of possible
points). The Analytic Geometry EOCT test had 26.3% of students passing the test, while the
GAMEOC had 22.8% of students earning a passing percentage of points. The results of the test
were not significant, χ2(1, N = 1357) = 2.27, p = .13, Cramer’s V = .04. Test type had no effect
on test score. Figure 4 shows a chart of passing and failing percentages for the Analytic
Geometry EOCT and GAMEOC.
Table 3
Chi Square on Geometry Test Type and Test Pass Rates
Test Test Type Fail Pass
Geometry EOCT 411 147
GAMEOC 617 182
Geometry2=2.27, df=1, p=.13 N = 1357
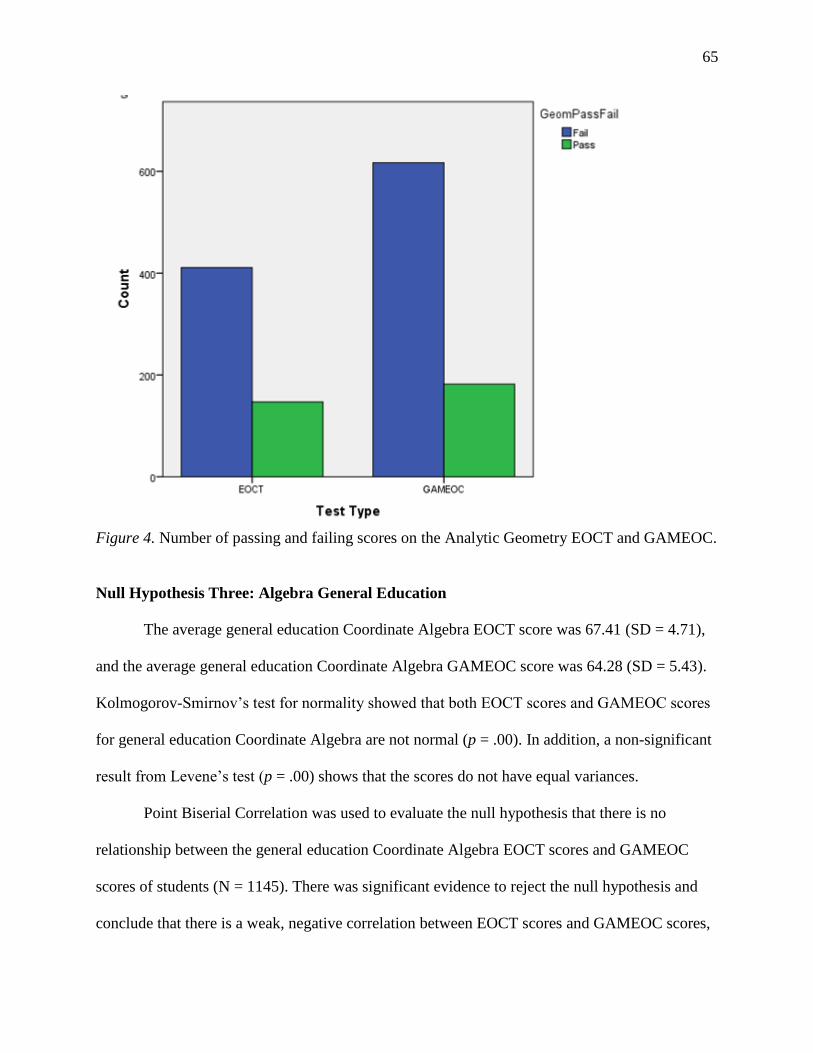
65
Figure 4. Number of passing and failing scores on the Analytic Geometry EOCT and GAMEOC.
Null Hypothesis Three: Algebra General Education
The average general education Coordinate Algebra EOCT score was 67.41 (SD = 4.71),
and the average general education Coordinate Algebra GAMEOC score was 64.28 (SD = 5.43).
Kolmogorov-Smirnov’s test for normality showed that both EOCT scores and GAMEOC scores
for general education Coordinate Algebra are not normal (p = .00). In addition, a non-significant
result from Levene’s test (p = .00) shows that the scores do not have equal variances.
Point Biserial Correlation was used to evaluate the null hypothesis that there is no
relationship between the general education Coordinate Algebra EOCT scores and GAMEOC
scores of students (N = 1145). There was significant evidence to reject the null hypothesis and
conclude that there is a weak, negative correlation between EOCT scores and GAMEOC scores,
66
rpb = -.30, p < .01. General education Coordinate Algebra students perform slightly better on the
multiple-choice EOCT test than on the GAMEOC test. Figure 5 shows a dot plot of the two types
of scores.
Figure 5. Percent scores on the Coordinate Algebra EOCT and GAMEOC for general education
students.
Due to the nature of the normality and variance tests, a chi-squared test was also
conducted to evaluate the relationship between the test type, EOCT or GAMEOC, and passing
(earning a 70% or more of possible points) or failing the test (earning 69% or less of possible
points) for general education Coordinate Algebra scores. The EOCT test had 32.9% of students
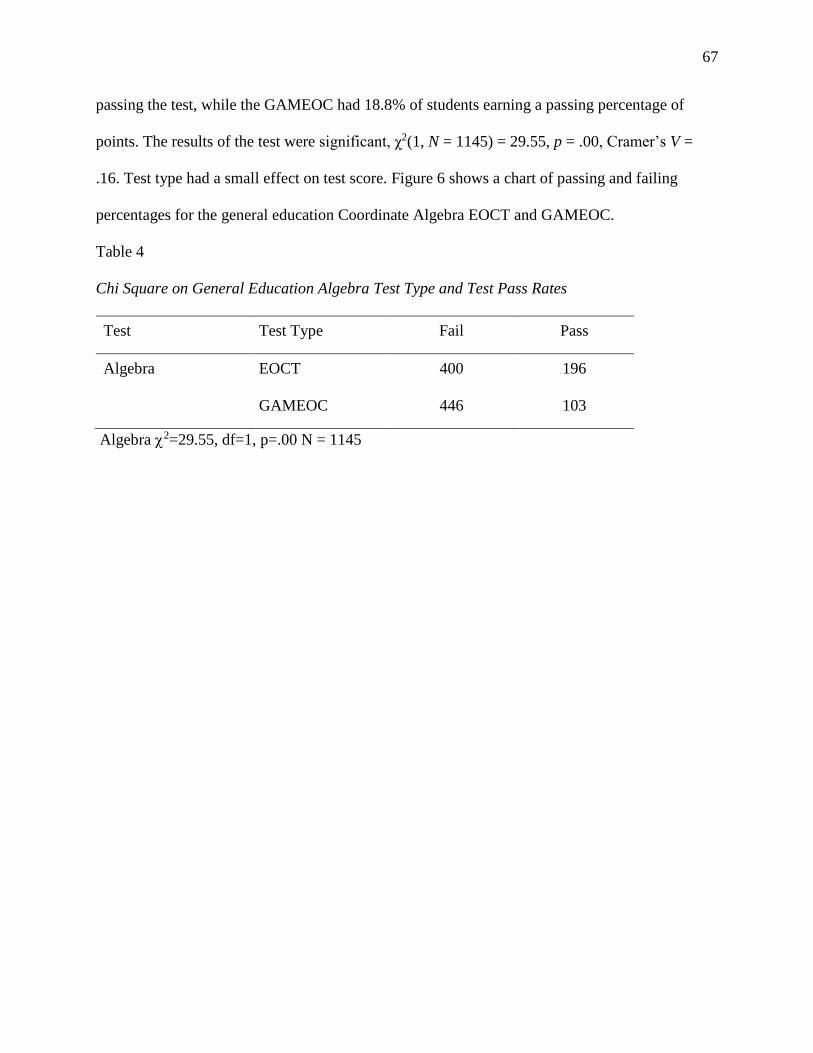
67
passing the test, while the GAMEOC had 18.8% of students earning a passing percentage of
points. The results of the test were significant, χ2(1, N = 1145) = 29.55, p = .00, Cramer’s V =
.16. Test type had a small effect on test score. Figure 6 shows a chart of passing and failing
percentages for the general education Coordinate Algebra EOCT and GAMEOC.
Table 4
Chi Square on General Education Algebra Test Type and Test Pass Rates
Test Test Type Fail Pass
Algebra EOCT 400 196
GAMEOC 446 103
Algebra2=29.55, df=1, p=.00 N = 1145
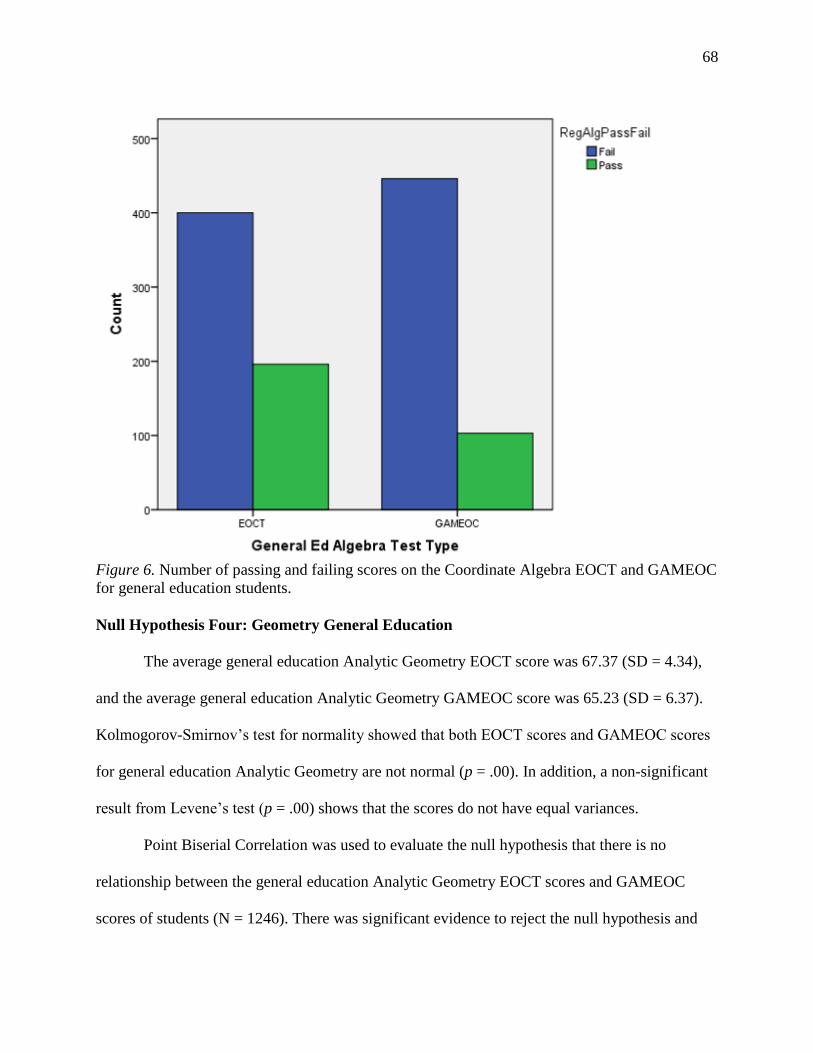
68
Figure 6. Number of passing and failing scores on the Coordinate Algebra EOCT and GAMEOC
for general education students.
Null Hypothesis Four: Geometry General Education
The average general education Analytic Geometry EOCT score was 67.37 (SD = 4.34),
and the average general education Analytic Geometry GAMEOC score was 65.23 (SD = 6.37).
Kolmogorov-Smirnov’s test for normality showed that both EOCT scores and GAMEOC scores
for general education Analytic Geometry are not normal (p = .00). In addition, a non-significant
result from Levene’s test (p = .00) shows that the scores do not have equal variances.
Point Biserial Correlation was used to evaluate the null hypothesis that there is no
relationship between the general education Analytic Geometry EOCT scores and GAMEOC
scores of students (N = 1246). There was significant evidence to reject the null hypothesis and
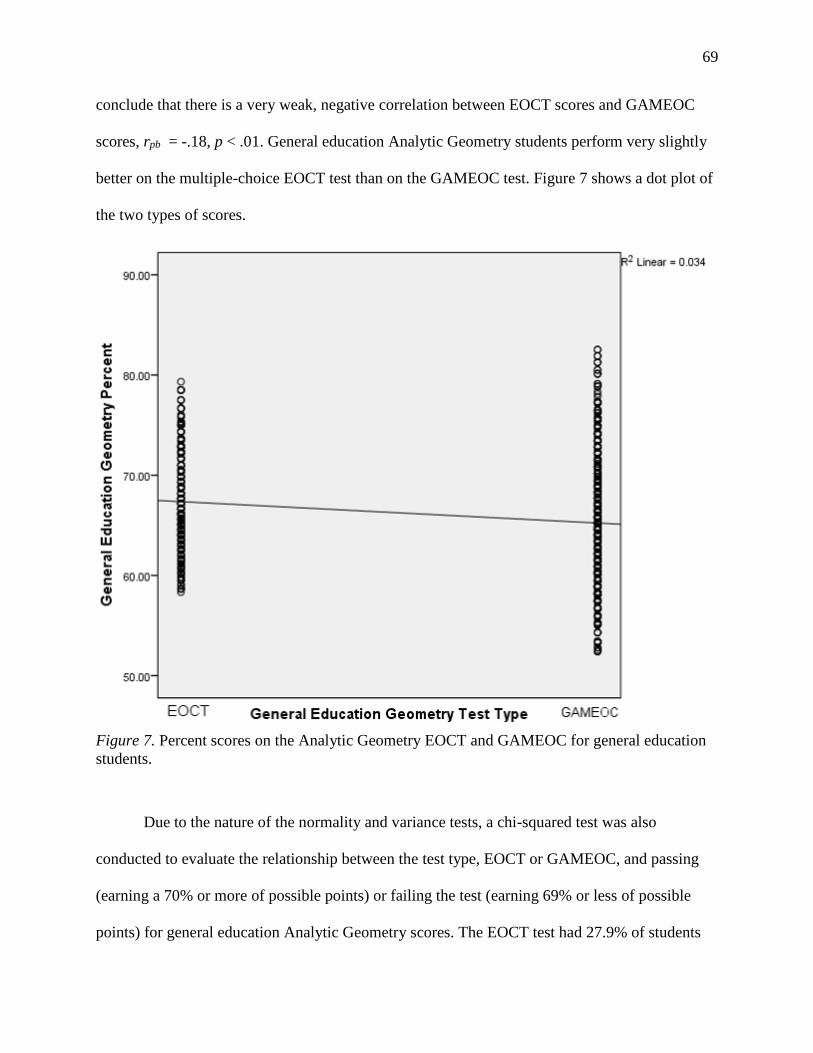
69
conclude that there is a very weak, negative correlation between EOCT scores and GAMEOC
scores, rpb = -.18, p < .01. General education Analytic Geometry students perform very slightly
better on the multiple-choice EOCT test than on the GAMEOC test. Figure 7 shows a dot plot of
the two types of scores.
Figure 7. Percent scores on the Analytic Geometry EOCT and GAMEOC for general education
students.
Due to the nature of the normality and variance tests, a chi-squared test was also
conducted to evaluate the relationship between the test type, EOCT or GAMEOC, and passing
(earning a 70% or more of possible points) or failing the test (earning 69% or less of possible
points) for general education Analytic Geometry scores. The EOCT test had 27.9% of students

70
passing the test, while the GAMEOC had 24.1% of students earning a passing percentage of
points. The results of the test were not significant, χ2(1, N = 1243) = 2.33, p = .13, Cramer’s V =
.04. Test type had no effect on test score. Figure 8 shows a chart of passing and failing
percentages for the general education Analytic Geometry EOCT and GAMEOC.
Table 5
Chi Square on General Education Geometry Test Type and Test Pass Rates
Test Test Type Fail Pass
Geometry EOCT 372 144
GAMEOC 552 175
Geometry2=2.33, df=1, p=.13 N = 1243
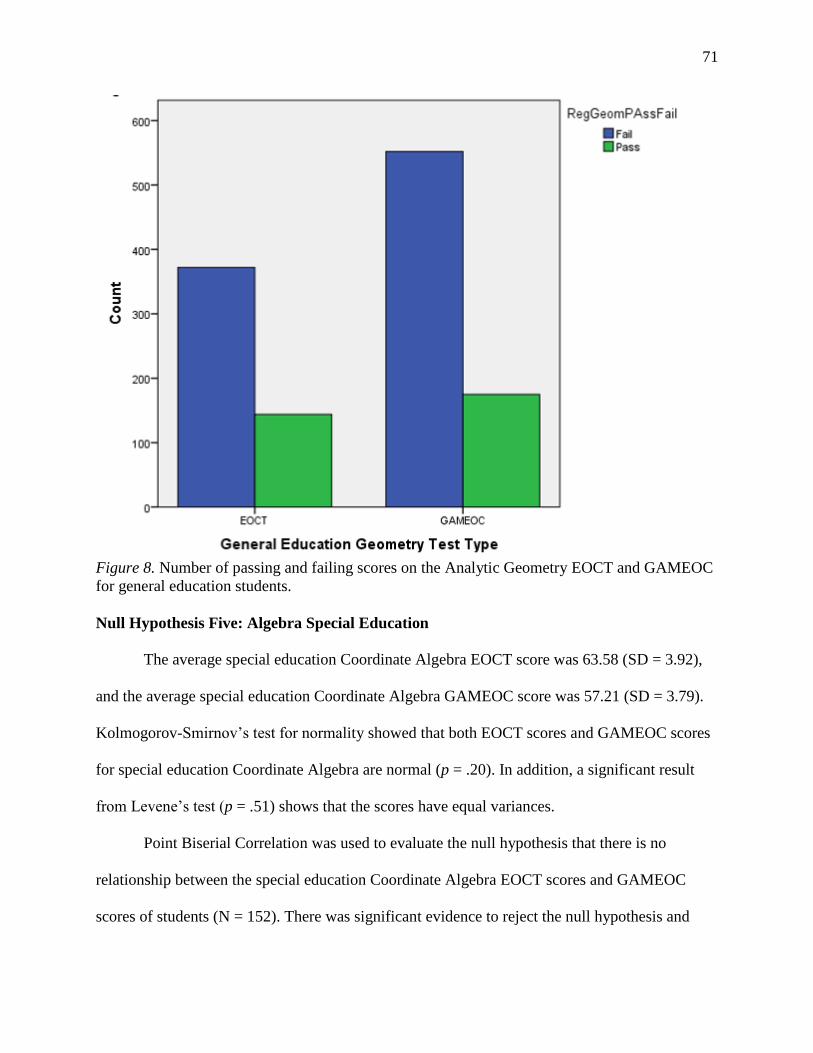
71
Figure 8. Number of passing and failing scores on the Analytic Geometry EOCT and GAMEOC
for general education students.
Null Hypothesis Five: Algebra Special Education
The average special education Coordinate Algebra EOCT score was 63.58 (SD = 3.92),
and the average special education Coordinate Algebra GAMEOC score was 57.21 (SD = 3.79).
Kolmogorov-Smirnov’s test for normality showed that both EOCT scores and GAMEOC scores
for special education Coordinate Algebra are normal (p = .20). In addition, a significant result
from Levene’s test (p = .51) shows that the scores have equal variances.
Point Biserial Correlation was used to evaluate the null hypothesis that there is no
relationship between the special education Coordinate Algebra EOCT scores and GAMEOC
scores of students (N = 152). There was significant evidence to reject the null hypothesis and

72
conclude that there is a moderate, negative correlation between EOCT scores and GAMEOC
scores, rpb = -.63, p < .01. Special education Coordinate Algebra students perform moderately
better on the multiple-choice EOCT test than on the GAMEOC test. Figure 9 shows a dot plot of
the two types of scores.
Figure 9. Percent scores on the Coordinate Algebra EOCT and GAMEOC for special education
students.
Null Hypothesis Six: Geometry Special Education
The average special education Analytic Geometry EOCT score was 61.44 (SD = 2.10),
and the average special education Analytic Geometry GAMEOC score was 59.66 (SD = 4.12).
Shapiro-Wilk’s test for normality showed that EOCT scores for special education Analytic
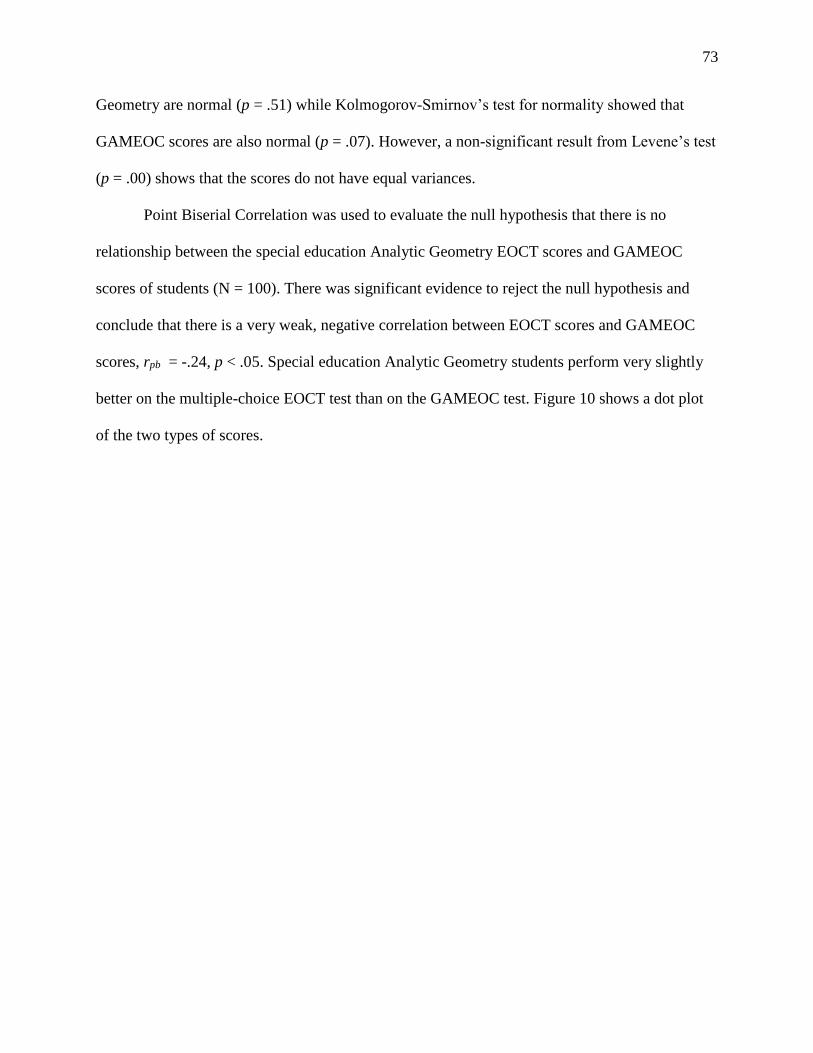
73
Geometry are normal (p = .51) while Kolmogorov-Smirnov’s test for normality showed that
GAMEOC scores are also normal (p = .07). However, a non-significant result from Levene’s test
(p = .00) shows that the scores do not have equal variances.
Point Biserial Correlation was used to evaluate the null hypothesis that there is no
relationship between the special education Analytic Geometry EOCT scores and GAMEOC
scores of students (N = 100). There was significant evidence to reject the null hypothesis and
conclude that there is a very weak, negative correlation between EOCT scores and GAMEOC
scores, rpb = -.24, p < .05. Special education Analytic Geometry students perform very slightly
better on the multiple-choice EOCT test than on the GAMEOC test. Figure 10 shows a dot plot
of the two types of scores.
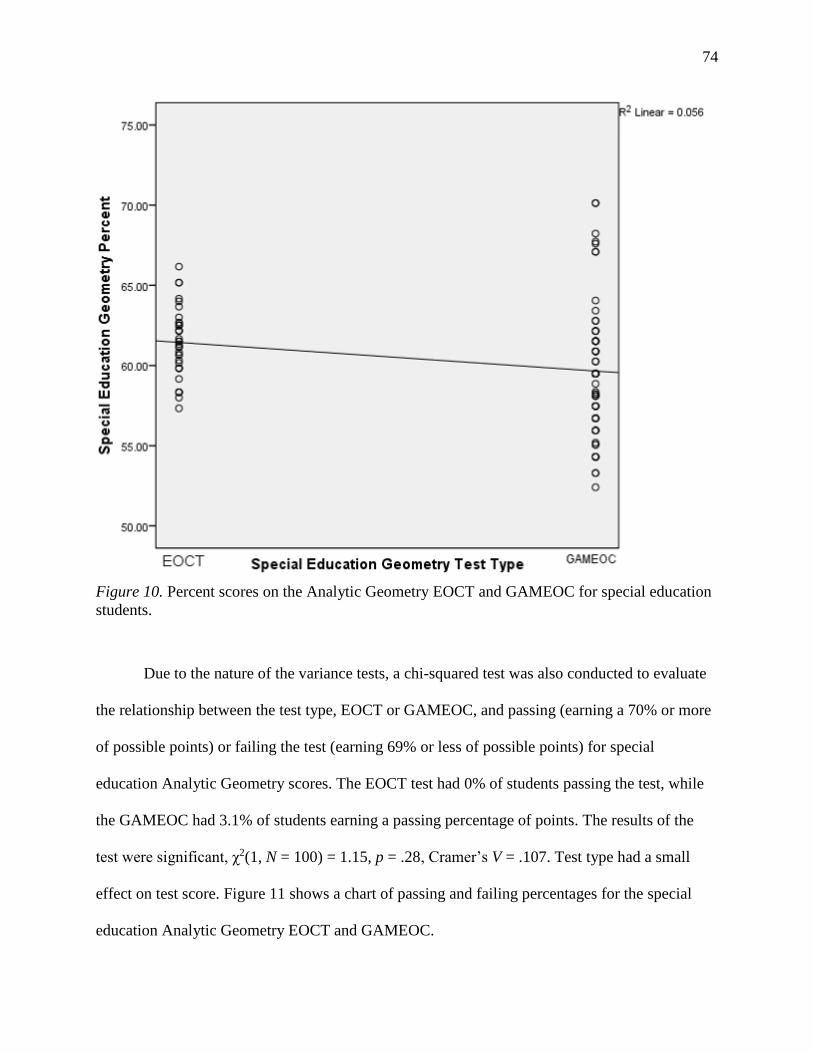
74
Figure 10. Percent scores on the Analytic Geometry EOCT and GAMEOC for special education
students.
Due to the nature of the variance tests, a chi-squared test was also conducted to evaluate
the relationship between the test type, EOCT or GAMEOC, and passing (earning a 70% or more
of possible points) or failing the test (earning 69% or less of possible points) for special
education Analytic Geometry scores. The EOCT test had 0% of students passing the test, while
the GAMEOC had 3.1% of students earning a passing percentage of points. The results of the
test were significant, χ2(1, N = 100) = 1.15, p = .28, Cramer’s V = .107. Test type had a small
effect on test score. Figure 11 shows a chart of passing and failing percentages for the special
education Analytic Geometry EOCT and GAMEOC.

75
Table 6
Chi Square on Special Education Geometry Test Type and Test Pass Rates
Test Test Type Fail Pass
Geometry EOCT 36 0
GAMEOC 62 2
Geometry2=1.15, df=1, p=.28 N = 100
Figure 11. Number of passing and failing scores on the Analytic Geometry EOCT and
GAMEOC for special education students.

76
CHAPTER FIVE: DISCUSSION, CONCLUSIONS, AND RECOMMENDATIONS
Discussion
The purpose of this study was to examine the relationship, if any, between the scores of
students on the Coordinate Algebra and Analytic Geometry multiple choice End of Course
(EOCT) test and the scores on the Georgia Milestones End of Course (GAMEOC) test, which
includes constructed response items. The GAMEOC test was first administered in the 2014-15
school year in Georgia as a result of the use of Common Core standards and process standards
within the school curriculum and is the first set of high-stakes tests that include open-ended
constructed response items (Georgia Department of Education, 2015). Examining and
understanding a possible relationship between math EOCT and GAMEOC scores will allow
educators to make decisions regarding curriculum in the classroom and to understand the
performance of students on the different types of tests.
Point biserial correlation was conducted to examine the relationship between EOCT and
GAMEOC scores in Coordinate Algebra and Analytic Geometry for all scores, general education
scores, and special education scores. When data did not pass the assumption testing of normality
and equal variances, a chi squared test was also used to examine the relationship between the
EOCT and GAMEOC test types and earning a passing or failing percentage of points. The results
of these tests showed that there was a very weak, weak, or moderate negative relationship
between EOCT and GAMEOC scores. The relationship was strongest among the Coordinate
Algebra tests, specifically the special education Coordinate Algebra tests, and was weakest
among the Analytic Geometry scores for all students and general education students.
The first research question for this study was:

77
RQ1: What is the relationship between Georgia students’ End-of-Course Test scores and
Georgia students’ Georgia Milestones End-of-Course scores in math?
The corresponding null hypotheses are:
Ho1: There is no relationship between Georgia students’ End-of-Course Test scores and
Georgia students’ Georgia Milestones End-of-Course scores in Coordinate Algebra.
Ho2: There is no relationship between Georgia students’ End-of-Course Test scores and
Georgia students’ Georgia Milestones End-of-Course scores in Analytic Geometry.
When examining the test scores of all students in both Coordinate Algebra and Analytic
Geometry, point biserial correlation showed that there was a weak, negative relationship between
EOCT scores and GAMEOC scores in Coordinate Algebra and a very weak, negative
relationship between EOCT scores and GAMEOC scores in Analytic Geometry. The chi squared
tests supported the results of the correlation in that test type was found to have a small effect on
test score for Coordinate Algebra but no effect on test score for Analytic Geometry.
The negative relationship between EOCT and GAMEOC scores could be explained by
the inclusion of constructed response items on the GAMEOC tests. Higher stakes on tests have
been found to have a larger impact on constructed response test scores than on multiple choice
scores (DeMars, 2000). However, the negative relationship between the scores may also have
been impacted by the fact that the administration of the constructed response GAMEOC included
in this study was the first time students at the sample school had participated in high-stakes
testing that included constructed responses (Georgia Department of Education, 2015). In
addition, the difference in results between the Coordinate Algebra and Analytic Geometry tests
may be explained by the age of the students. Those completing the Coordinate Algebra test are
78
generally ninth graders who are completing their first set of end of course high-stakes tests while
those taking the Analytic Geometry test are generally tenth graders.
The second research question for this study was:
RQ2: What is the relationship between Georgia general education students’ End-of-
Course Test scores and Georgia general education students’ Georgia Milestones End-of-Course
scores in math?
The corresponding hypotheses are:
Ho3: There is no relationship between Georgia general education students’ End-of-
Course Test scores and Georgia general education students’ Georgia Milestones End-of-Course
scores in Coordinate Algebra.
Ho4: There is no relationship between Georgia general education students’ End-of-
Course Test scores and Georgia general education students’ Georgia Milestones End-of-Course
scores in Analytic Geometry.
When scores were limited to just those of general education students, point biserial
correlation showed that there was a weak, negative correlation between Coordinate Algebra
EOCT scores and GAMEOC scores. This relationship was very similar to that of all algebra
scores. The Analytic Geometry correlation for general education students was also similar to that
of all scores and showed a very weak, negative correlation between Analytic Geometry EOCT
and GAMEOC scores. In addition, the chi squared tests supported the point biserial correlation,
showing that test type had a small effect on passing or failing the Coordinate Algebra tests but
had no effect on passing or failing the Analytic Geometry tests.
The similarity between the results for all test scores and general education test scores may
be explained by the fact that most of the scores included in the testing of all scores are from

79
general educations students. The population of special education students is relatively small. In
addition, previous research has found that multiple choice and constructed response tests seem to
be equivalent measure in algebra and biology (Lissitz & Hou, 2012). The results of the testing on
general education scores would seem to support this earlier research as the weak, negative
correlation may be explained by this first administration of the constructed response test types in
Georgia and the grade level of the students.
The third research question for this study was:
RQ3: What is the relationship between Georgia special education students’ End-of-
Course Test scores and Georgia special education students’ Georgia Milestones End-of-Course
scores in Math?
The corresponding hypotheses are:
Ho5: There is no relationship between Georgia special education students’ End-of-
Course Test scores and Georgia special education students’ Georgia Milestones End-of-Course
scores in Algebra.
Ho6: There is no relationship between Georgia special education students’ End-of-Course
Test scores and Georgia special education students’ Georgia Milestones End-of-Course scores in
Analytic Geometry.
When examining only special education scores, point biserial correlation showed that
there is a moderate, negative correlation between the Coordinate Algebra EOCT and GAMEOC
scores and a weak, negative correlation between the Analytic Geometry EOCT and GAMEOC
scores. These negative correlations were stronger for the special education scores than for those
of general education scores or all scores.

80
The stronger relationship between test scores for special education students supports the
earlier study of Powell (2012) which found that students with disabilities have an advantage in
multiple choice formats in math. It would seem logical that including constructed response items
on high-stakes tests for special education students would increase the chance that disability may
influence test score as students are required to perform more reading and writing within the math
test in order to complete constructed response items. Steele (2010) found that students with
disabilities often have other difficulties, such as reading deficits, which can affect performance
on high-stakes math tests. In addition, special education students have greater risk of being
behind grade level in reading, which can affect their ability to read and respond to constructed
response items.
Conclusions
In light of the results of the statistical testing on the relationship between the multiple
choice EOCT test and the GAMEOC test which includes constructed response items, it seems
that students perform better, even if sometimes only slightly better, on the multiple choice EOCT
test than on the GAMEOC test in Coordinate Algebra and Analytic Geometry. However, special
education test scores show a stronger negative relationship. Special education students seem to
perform better on the multiple choice test versus the tests which include constructed responses at
a higher level than general education students. Adding constructed responses to the end of course
high-stakes tests in math in Georgia resulted in students earning a smaller percentage of the
points possible on both the Coordinate Algebra and Analytic Geometry tests. The inclusion of
constructed response items on the GAMEOC tests impacted special education students’ scores
more than general education students, especially on the Coordinate Algebra test.
81
These results imply that the two types of tests do not similarly asses the mathematical
knowledge of all students. While all students earned a smaller percentage of possible points on
the GAMEOC which includes constructed responses, special education students’ scores were
much lower on the constructed response tests. While this is true of both Coordinate Algebra and
Analytic Geometry, the Coordinate Algebra test for special education students was impacted
most significantly by the constructed response items. Given that the test scores are required to
count 20% of a student’s overall course average, it is logical to say that the constructed response
GAMEOC test negatively affects the course averages of all students more than the multiple
choice EOCT test. In addition, the negative affect of the test score on the course average is likely
to be more often felt by special education students as the statistical test results show that special
education students were more negatively impacted by the use of constructed response items than
their general education peers.
Implications
This study adds to the understanding of multiple-choice versus constructed response
high-stakes test as this research supports previous research in several ways. In general, the results
showed that students in Coordinate Algebra and Analytic Geometry perform slightly to
moderately better on the all multiple choice test than on the test which included constructed
responses. These results are in line with those of DeMars (2000) and show that constructed
response items affect test scores negatively. In addition, the results for special education students
showed that these students perform significantly lower on the test that includes constructed
responses than their general education peers. These results also support those of Powell (2012)
which show that special education students have an advantage on multiple choice tests in
mathematics.
82
As states such as Georgia continue to use Common Core standards and process standards,
it seems that constructed response items may become more and more widely used on high-stakes
tests (Maxcy, 2011). In order for these tests to assess students in a similar manner to the previous
multiple choice high-stakes tests, educators will need to strategically move away from the
current teacher-centered trend which results in disjointed and rote knowledge (Au, 2011;
Berliner, 2011; Mora, 2011). Curriculum geared toward constructed responses will need to be
more rooted in constructivism (Sutinen, 2008), allowing students to learn not just mathematical
processes but also how to show those processes as they justify their logic both mathematically
and verbally. These skills will require pedagogy that shows students how to communicate
mathematical logic and includes strategies for teaching special education students how to read
and answer constructed response items. Rather than having students spend as much time on test
preparation as has become the norm, students will need to spend more time connecting reading,
writing, and mathematics as they learn to connect concepts to form a logical argument to support
their mathematical thinking.
Limitations
In order to appropriately apply the findings of this study, it is important to understand the
following limitations:
The first limitation identified in this study was the setting. The sample school was
situated in a middle-class suburban area of Georgia and has an enrollment of approximately
2,800 students. While the sample school follows the curriculum standards as prescribed by the
state of Georgia, the school was not necessarily representative of all schools in Georgia.
83
The second limitation identified in this study was the large sample size for the tests on all
scores and on general education scores, which included over 1000 scores. Having such a large
sample size increases the likelihood of being able to reject the null hypothesis (Gall et al., 2007).
The third limitation identified in this study was the inclusion of data from multiple levels
of student. The data examined includes data from students who were below grade-level in
mathematics, on-level, and considered accelerated. These various levels make the data non-
homogeneous and may affect the applicability of the results to different groups of students.
The fourth limitation identified in this study was the fact that all but one of the data sets
did not follow the assumptions tests of normality and equal variances. As a result, the chi
squared test was also conducted for five of the data sets and the strengths of the point biserial
correlations should be interpreted with caution (Gall et al., 2007).
Recommendations for Future Research
Additional research should be conducted to deepen the understanding of the relationship
between multiple choice high-stakes test scores and high-stakes test scores that include
constructed responses. Suggestions for future research include the following:
1. Separating the data for the different levels of student – support, on-level, honors, and
accelerated – to study the relationship between test scores for each level of student.
2. Expanding the study to include more high schools in Georgia.
3. Expanding the study to include other subject areas.
4. Replicating the study on future administrations of the GAMEOC tests.
5. Replicating the study on other types of tests which include constructed responses and
on those that include a larger number of constructed responses than the GAMEOC tests.
84
REFERENCES
Americans With Disabilities Act of 1990, Pub. L. No. 101-336, §2, 104 Stat. 328 (1991).
Atlanta Public Schools. (2015). RT3 merit pay for teachers and school administrators. Retrieved
from http://nctq.org/docs/Atlanta_Merit_Pay_2014-15.pdf
Artino Jr., A. R. (2008). Promoting academic motivation and self-regulation: Practical guidelines
for online instructors. TechTrends: Linking Research & Practice to Improve Learning,
52(3), 37-45.
Au, W. (2009). Social studies, social justice: W(h)ither the social studies in high-stakes testing?.
Teacher Education Quarterly, 36(1), 43-58.
Au, W. (2011). Teaching under the new Taylorism: High-stakes testing and the standardization
of the 21st century curriculum. Journal of Curriculum Studies, 43(1), 25-45.
Bambrick-Santoyo, P. (2010). Driven by data: A practical guide to improve instruction. San
Fransisco, CA: Jossey-Bass.
Berliner, D. (2009). MCLB (Much Curriculum Left Behind): A U.S. calamity in the
making. Educational Forum, 73(4), 284-296.
Berliner, D. (2011). Rational responses to high stakes testing: The case of curriculum narrowing
and the harm that follows. Cambridge Journal of Education, 41(3), 287-302.
Brinckerhoff, L. C., & Banerjee, M. (2007). Misconceptions regarding accommodations on high-
stakes tests: Recommendations for preparing disability documentation for test takers with
Learning Disabilities. Learning Disabilities Research & Practice (Wiley-Blackwell),
22(4), 246-255.
Byrnes, M. (2009). Taking sides: Clashing views in special education (4th ed.). New York, NY:
85
McGraw-Hill.
Capraro, M., Capraro, R., Yetkiner, Z., Rangel-Chavez, A., & Lewis, C. (2010). Examining
Hispanic student mathematics performance on high-stakes tests: An examination of one
urban school district in Colorado. Urban Review, 42(3), 193-209.
Civic Impulse. (2016). H.R. 6244 — 111th Congress: Race to the Top Act of 2010. Retrieved
from https://www.govtrack.us/congress/bills/111/hr6244
Cobb County School District (2015). Student learning objectives. Retrieved from
http://www.cobbk12.org/campbellhs/2015_2016/2016SLOFAQ.pdf
Crumpton, H. E., & Gregory, A. (2011). 'I'm not learning': The role of academic relevancy for
low-achieving students. Journal of Educational Research, 104(1), 42-53.
DeMars, C. E. (2000). Test stakes and item format interactions. Applied Measurement in
Education, 13(1), 55-77.
Edenfield, J. (2014). Teachers' Perceptions of Merit Pay in Georgia (Unpublished dissertation).
Georgia Southern University, Statesboro, GA.
Elliott, S. N., & Marquart, A. M. (2004). Extended time as a testing accommodation: Its effects
and perceived consequences. Exceptional Children, 70(3), 349-367.
Ellis, R. & Lopez, E. (2015). Judge reduces sentences for 3 educators in Atlanta cheating
scandal. Retrieved from www.cnn.com/2015/04/03/us/atlanta-schools-cheating-scandal/
Eunsook, H., Sas, M., & Sas, J. C. (2006). Test-taking strategies of high and low mathematics
achievers. Journal of Educational Research, 99(3), 144-155.
Examining High-Stakes Testing. (2014). Education Next, 14(1), 70-77.
Fielding, C. (2004). Low performance on high-stakes test drives special education referrals: A
Texas survey. Educational Forum,68(2), 126-132.
86
Fuchs, L. S., Fuchs, D., & Capizzi, A. M. (2005). Identifying appropriate test accommodations
for students with learning disabilities. Focus on Exceptional Children, 37(6), 1-8.
Gall, M. D., Gall, J. P., & Borg, W. R. (2007). Educational research: An introduction (8th ed.).
New York, NY: Allyn & Bacon.
Georgia Department of Education. (2006). What Georgia educators need to know about
Georgia’s testing program. Retrieved from http://dlgmaint.galib.uga.edu/cgi-
bin/govdimag.cgi?user=public&page=1&path=2006/ga/e300_pt45/m1/2006/t4/folio.con
&return=http%3A%2F%2Fdlgmaint.galib.uga.edu%2Fcgi-
bin%2Fgovdimag.cgi%3Fpage%3D6%26path%3D2006%2Fga%2Fe300_pt45%2Fm1%
2F2006%2Ft4%2Ffolio.con
Georgia Department of Education (2014). Student assessment handbook. Retrieved from
http://www.gadoe.org/Curriculum-Instruction-and-
assessment/Assessment/Documents/Student%20Assessment%20Handbook%202014-
2015%20FINAL%2092214.pdf
Georgia Department of Education. (2014a). Georgia EOCT interpretive guide for score reports.
Retrieved from http://www.gadoe.org/Curriculum-Instruction-and-
Assessment/Assessment/Pages/EOCT-Resources.aspx
Georgia Department of Education. (2014b). Student learning objectives. Retrieved from
https://www.gadoe.org/School-Improvement/Teacher-and-Leader-
Effectiveness/Documents/2015-2016%20SLOs%20A%20Guide%20for%20Teachers.pdf
Georgia Department of Education. (2014c). End of course (EOC) interpretive guide for score
reports. Retrieved from http://www.gadoe.org/Curriculum-Instruction-and-
87
Assessment/Assessment/Pages/Georgia-Milestones-End-of-Course-Assessment-
Guides.aspx
Georgia Department of Education. (2015). Georgia milestones assessment system. Retrieved
from http://www.gadoe.org/Curriculum-Instruction-and-
Assessment/Assessment/Pages/Georgia-Milestones-Assessment-System.aspx
Georgia Department of Education. (2015a). Assessment guide: Algebra 1. Retrieved from
http://www.gadoe.org/Curriculum-Instruction-and-
Assessment/Assessment/Pages/Georgia-Milestones-End-of-Course-Assessment-
Guides.aspx
Georgia Department of Education. (2015b). Assessment guide: Analytic Geometry. Retrieved
from http://www.gadoe.org/Curriculum-Instruction-and-
Assessment/Assessment/Pages/Georgia-Milestones-End-of-Course-Assessment-
Guides.aspx
Georgia Office of Planning and Budget. (2014). The governor’s budget report: Fiscal year 2015.
Retrieved from
https://opb.georgia.gov/sites/opb.georgia.gov/files/related_files/document/FY2015Gover
norsReport.pdf
Georgia Office of Planning and Budget. (2015). The governor’s budget report: Fiscal year 2016.
Retrieved from
https://opb.georgia.gov/sites/opb.georgia.gov/files/related_files/site_page/FY_2016_Gov
ernorsBudgetReport.pdf
Goldwyn, A. (2012). One size fits all: The increasing standardisation of English teachers' work
in England. English Teaching: Practice & Critique, 11(4), 36-53.
88
Good, C. J. (2010). A nation at risk: Committee members speak their mind. American
educational History Journal, 37(2), 367-386.
Heilig, J. V., Cole, H., & Aguilar, A. (2010). From Dewey to No Child Left Behind: The
evolution and devolution of public arts education. Arts Education Policy Review, 111(4),
136-145.
Johnson, D. R., Thurlow, M. L., Stout, K. E., & Mavis, A. (2007). Cross-state study of high-
stakes testing practices and diploma options. Journal Of Special Education
Leadership, 20(2), 53-65.
Journell, W. (2010). The influence of high-stakes testing on high school teachers' willingness to
incorporate current political events into the curriculum. High School Journal, 93(3), 111-
125.
Lai, S. A., & Berkeley, S. (2012). High-stakes test accommodations: Research and practice.
Learning Disability Quarterly, 35(3), 158-169.
Lamb, J. H. (2010). An analysis of Texas mathematics assessment items and their reading
difficulty. Mathematics Educator, 20(1), 22-34.
Lee, K. S., Osborne, R. E., & Carpenter, D. N. (2010). Testing accommodations for university
students with AD/HD: Computerized vs. paper-pencil/regular vs. extended time. Journal
of Educational Computing Research, 42(4), 443-458.
Lissitz, R. W. & Hou, X. (2012). The contribution of construted response items to large scale
assessment: Measuring nd understanding their impact. Journal of Applied Testing
Technology, 13(3).
89
MacMath, S., Roberts, J., Wallace, J., & Xiaohong, C. (2010). Curriculum integration and at-risk
students: A Canadian case study examining student learning and motivation. British
Journal of Special Education, 37(2), 87-94.
Mahle, M. (2011). Effects of interactivity on student achievement and motivation in distance
education. Quarterly Review of Distance Education, 12(3), 207-215.
Martin, P. C. (2012). Misuse of high-stakes test scores for evaluative purposes: Neglecting the
reality of schools and students. Current Issues in Education, 15(3), 1-10.
Martinez, M. E. (1999). Cognition and the question of test item format. Educational
Psychologist, 34(4), 207.
Maxcy, B. D. (2011). The politics of priorities in turbulent times: Policy logics, faces of
power, and reform possibilities. Peabody Journal of Education 86(3), 252-271.
Minarechová, M. (2012). Negative impacts of high-stakes testing. Journal of Pedagogy /
Pedagogický Casopis, 3(1), 82-100.
Misco, T. (2010). Remediation for another high-stakes test. Kappa Delta Pi Record, 46(3), 121-
126.
Mora, R. (2011). "School is so boring": High-stakes testing and boredom at an urban middle
school. Penn GSE Perspectives On Urban Education, 9(1), 1-9.
National Center for Education Statistics (2012). Fast facts. Retrieved from
http://nces.ed.gov/fastfacts/display.asp?id=64.
No Child Left Behind Act of 2001, Pub. L. No. 107-110, § 115, Stat. 1425 (2002).
Olivant, K. F. (2015). “I am not a format”: Teachers’ experiences with fostering creativity in the
era of accountability. Journal of Research in Childhood Education, 29(1), 115-129.
90
Philipp, J. (2014). End of course grades and end of course tests in the birtual environment: A
study of correlation (Unpublished dissertation). Liberty University, Lynchburg, VA.
Powell, S. R. (2012). High-stakes testing for students with mathematics difficulty: Response
format effects in mathematics problem solving. Learing Disability Quarterly, 35(1), 3-9.
Salend, S. J. (2008). Determining appropriate testing accommodations. Teaching Exceptional
Children, 40(4), 14-22.
Slavin, R. (1997). Education Psychology: Theory and Practice. Allyn and Bacon: Boston,
612.
Steele, M. M. (2010). High school students with learning disabilities: Mathematics instruction,
study skills, and high stakes tests. American Secondary Education, 38(3), 21-27.
Supovitz, J. (2009). Can high stakes testing leverage educational improvement? Prospects from
the last decade of testing and accountability reform. Journal of Educational Change,
10(2/3), 211-227.
Sutinen, A. (2008). Constructivism and education: Education as an interpretative
transformational process. Studies in Philosophy and Education, 27(1), 1-14.
Turner, S. L. (2009). Ethical and appropriate high-stakes test preparation in middle school: Five
methods that matter. Middle School Journal, 41(1), 36-45.
United States. (1983). A nation at risk: The imperative for educational reform.
Van Brummelen, H. (2002). Steppingstones to curriculum. Colorado Springs: Purposeful
Design Publications.
Vogler, K. E., & Burton, M. (2010). Mathematics teachers' instructional practices in an era of
high-stakes testing. School Science & Mathematics, 110(5), 247-261.

91
Wendt, A., & Kenny, L. E. (2009). Alternate item types: Continuing the quest for authentic
testing. Journal of Nursing Education,48(3), 150-156.
Yilmaz, K. (2008). Constructivism: Its theoretical underpinnings, variations, and implications for
classroom instruction. Educational Horizons, 86(3), 161-172.
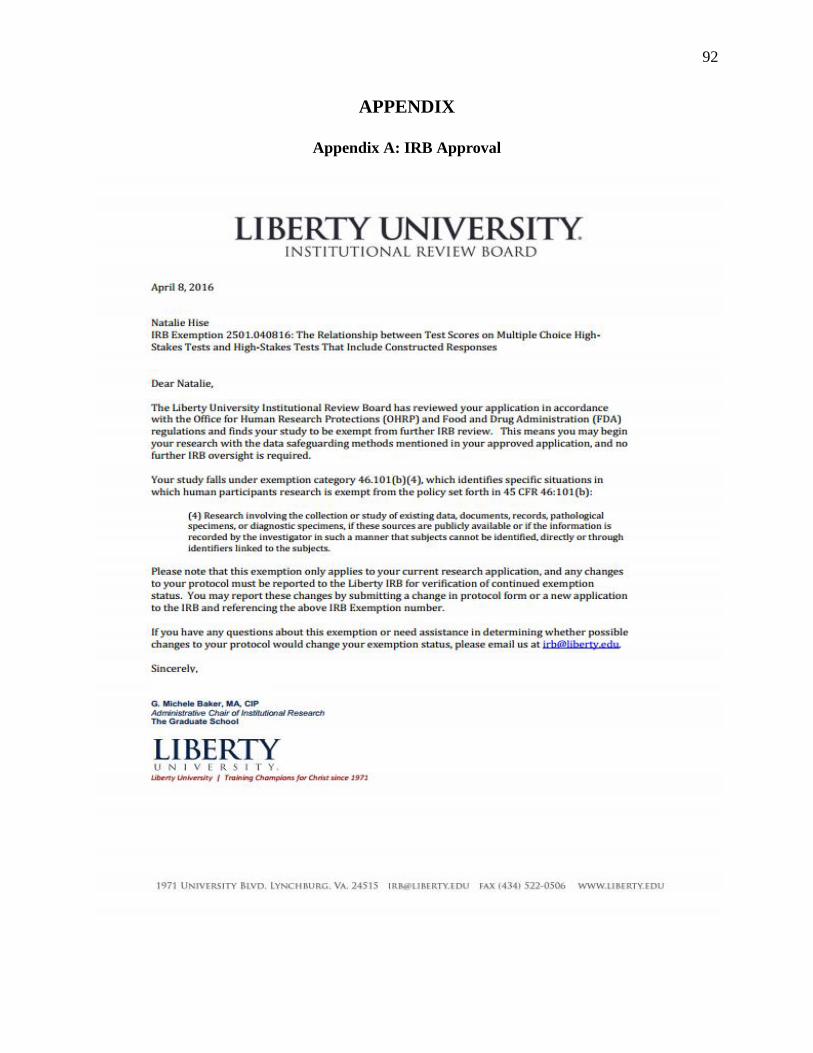
92
APPENDIX
Appendix A: IRB Approval