Embed Size (px)
Citation preview
University of Central Florida University of Central Florida
STARS STARS
Electronic Theses and Dissertations, 2004-2019
2008
The Relationships Between Leader Behavior, Follower Motivation, The Relationships Between Leader Behavior, Follower Motivation,
And Performance And Performance
Melissa Harrell University of Central Florida
Part of the Psychology Commons
Find similar works at: https://stars.library.ucf.edu/etd
University of Central Florida Libraries http://library.ucf.edu
This Doctoral Dissertation (Open Access) is brought to you for free and open access by STARS. It has been accepted
for inclusion in Electronic Theses and Dissertations, 2004-2019 by an authorized administrator of STARS. For more
information, please contact [email protected].
STARS Citation STARS Citation Harrell, Melissa, "The Relationships Between Leader Behavior, Follower Motivation, And Performance" (2008). Electronic Theses and Dissertations, 2004-2019. 3765. https://stars.library.ucf.edu/etd/3765
THE RELATIONSHIPS BETWEEN LEADER BEHAVIOR,
FOLLOWER MOTIVATION, AND PERFORMANCE
by
MELISSA M. HARRELL
B.S. University of Florida, 2001
M.S. University of Central Florida, 2006
A dissertation submitted in partial fulfillment of the requirements
for the degree of Doctor of Philosophy
in the Department of Psychology
in the College of Sciences
at the University of Central Florida
Orlando, Florida
Fall Term 2008
Major Professor: Robert D. Pritchard

ii
©2008 Melissa Harrell
iii
ABSTRACT
The primary goal of this study was to examine ways in which leaders can influence
followers’ motivation. Motivation is a key construct in industrial and organizational psychology
due to its impact on employee performance. Modern motivation theories adapt a more
sophisticated view of motivation in terms of definition, relationships, and operationalization. In
particular, one new theory of motivation is the Pritchard and Ashwood Theory (2008). This
theory proposes that motivation is comprised of four perceived relationships that, in
combination, reflect the extent to which employees believe that their actions on the job will lead
to need satisfaction. These four relationships are called connections.
The relationship between two leadership behaviors, initiating structure and consideration,
and the Pritchard and Ashwood motivational connections was examined. It was hypothesized
that the two leader behaviors would have differential relationships with the four motivational
connections. These differential relationships should facilitate targeted behavioral feedback to
leaders to improve each of the motivational connections. Additionally, motivation was
hypothesized to mediate the relationship between the leader behaviors and employee outcomes.
The Pritchard and Ashwood Theory is operationalized by the Motivation Assessment
Questionnaire (MAQ) (Pritchard, 2006a). A secondary goal of this study was to contribute to the
validity evidence of the MAQ. This recently developed questionnaire has shown good
psychometric properties and initial validity evidence has demonstrated moderate relationships
between the MAQ and job performance. However, this is the first study of the relationship
between the MAQ and employee outcomes with a large sample of full-time working adults.
Further, this study expanded potential MAQ outcomes beyond employee performance to include
organizational citizenship behaviors and turnover intentions.
iv
A sample of 208 employees was recruited from two central Florida companies. These
employees responded to the MAQ and other study measures via a secure, online survey.
Participating employees provided contact information for their supervisors who were then
invited to participate in the study by providing criteria ratings. A large number of the invited
supervisors participated (n = 195).
Results indicated robust support for one of the leadership behaviors: consideration.
Consideration was related to performance and this relationship was partially mediated by
motivation. On the other hand, initiating structure was not related to employee performance.
Consideration and initiating structure were not differentially related as hypothesized to the four
motivational connections. This was due in part to the strong correlation between the two
leadership behaviors (r = .73).
Results provided additional validation evidence for the MAQ. The overall effort scale
was not related to performance as it had been in the two previous studies that used a student
sample. However, the average of the motivation connections predicted performance.
Additionally, the MAQ predicted both organizational citizenship behaviors and turnover
intentions.
As mentioned previously, the sample was drawn from two central Florida companies.
Although many of the study hypotheses were supported for the overall sample, the observed
relationships were very different for the two subsamples. Similarly, findings in this study differ
from previous studies using the MAQ with working students. Potential reasons for these
differences are discussed.

v
ACKNOWLEDGMENTS
I am thankful to each of my committee members for their work on this project. Drs.
Kimberly Smith-Jentch, Ronald Piccolo, and Leslie DeChurch each provided a unique
prospective and contribution. Their efforts resulted in considerable improvements to this
dissertation. I would also like to thank my advisor and chair of my dissertation committee, Dr.
Robert Pritchard for his invaluable input. In addition to his guidance on this dissertation, I am
very appreciative to him for his support and advice throughout the doctoral program.
On a personal note, I would like to thank my family for cheering me on throughout this
process. In particular, I would like to thank my sister, Brenda, for always understanding and
helping me to see the bigger picture. I cannot possibly imagine how I would have gotten through
graduate school without my husband, Alex. His belief, encouragement, and support were
unwavering and because of him these past few years have been a lot of fun!
Last but not least, I am grateful to and in awe of the newest member of my family, my
daughter Madeline Annabelle Harrell. Her nonnegotiable timeline kept me focused and ever
motivated towards my goal! Every day she amazes me.
vi
TABLE OF CONTENTS
LIST OF FIGURES ..................................................................................................................... ix
LIST OF TABLES ........................................................................................................................ x
LIST OF ACRONYMS ............................................................................................................... xi
CHAPTER 1: INTRODUCTION ................................................................................................ 1
The Pritchard-Ashwood Theory of Motivation ........................................................................................................ 3 Overview of the P-A Theory ..................................................................................................................................... 3 Relationship between the P-A Theory and Other Theories of Motivation ................................................................ 5 Relationship between Motivation and Performance ................................................................................................. 9 Relationship between Motivation and Other Outcomes ......................................................................................... 14
Initiating Structure and Consideration ................................................................................................................... 15 History and Definition of Initiating Structure and Consideration ........................................................................... 16 Relationship between IS&C and Other Theories, Styles, and Behaviors of Leadership ......................................... 18 Relationship between IS&C and Performance ........................................................................................................ 20 Shape and moderators of the relationship between IS&C and Performance ........................................................... 21 Relationship between IS&C and Organizational Citizenship Behaviors ................................................................ 24
IS&C and the P-A Theory of Motivation ................................................................................................................ 26 Path-Goal Theory of Leader Effectiveness ............................................................................................................. 26 Relationship between IS&C and Motivation .......................................................................................................... 28
Summary of Introduction ......................................................................................................................................... 35
CHAPTER 2: METHOD ........................................................................................................... 37
Participants ................................................................................................................................................................ 37
Procedure ................................................................................................................................................................... 38
Measures ..................................................................................................................................................................... 38 Motivation ............................................................................................................................................................... 38 Performance ............................................................................................................................................................ 39 Organizational Citizenship Behavior ...................................................................................................................... 40 Leadership ............................................................................................................................................................... 40 Task ambiguity ....................................................................................................................................................... 41
CHAPTER 3: RESULTS ........................................................................................................... 43
Overall ........................................................................................................................................................................ 43 Relationship between Motivation and Performance ............................................................................................... 47 Relationship between Motivation and Other Outcomes ......................................................................................... 49 Examination of the Unique Variance of the Motivational Connections ................................................................. 50
vii
Relationship between IS&C and Performance ........................................................................................................ 51 Shape and Moderators of the relationship between IS&C and Performance .......................................................... 51 Relationship between IS&C and Organizational Citizenship Behaviors ................................................................ 54 Relationship between IS&C and Motivation .......................................................................................................... 55 Mediation Model..................................................................................................................................................... 59
CHAPTER 4: DISCUSSION ..................................................................................................... 60
Differential Relationships between Organization ................................................................................................... 60 Statistical Explanations ........................................................................................................................................... 60 Substantive Differences between the Organizations ............................................................................................... 63
Strong Correlation between IS&C ........................................................................................................................... 67
Summary of Findings and Contributions ................................................................................................................ 70 Relationship between Motivation and Performance ............................................................................................... 70 Relationship between Motivation and Other Outcomes ......................................................................................... 72 Examination of the Uniqueness of the Motivational Connections .......................................................................... 72 Relationship between IS&C and Employee Outcomes ........................................................................................... 73 Relationship between IS&C and Motivation .......................................................................................................... 74 Mediation Model..................................................................................................................................................... 75 Practical Implications ............................................................................................................................................. 75
Limitations ................................................................................................................................................................. 76
Future Directions ....................................................................................................................................................... 77
APPENDIX A: MOTIVATION AND IS&C ............................................................................ 79
APPENDIX B: HYPOTHESES AND FINDINGS................................................................... 83
APPENDIX C: MOTIVATION ASSESSMENT QUESTIONNAIRE .................................. 86
A-R Connection.......................................................................................................................................................... 87
R-E Connection .......................................................................................................................................................... 87
E-O Connection.......................................................................................................................................................... 88
O-NS Connection ....................................................................................................................................................... 88
Overall Motivation .................................................................................................................................................... 89
APPENDIX D: PERFORMANCE ............................................................................................ 90
APPENDIX E: ORGANIZATIONAL CITIZENSHIP BEHAVIORS .................................. 92
APPENDIX F: TURNOVER INTENTIONS ........................................................................... 94
viii
APPENDIX G: LEADER BEHAVIOR DESCRIPTION QUESTIONNAIRE FORM XII 96
APPENDIX H: TASK AMBIGUITY........................................................................................ 98
APPENDIX I: INSTITUTIONAL REVIEW BOARD APPROVAL LETTER ................. 101
REFERENCES .......................................................................................................................... 103
ix
LIST OF FIGURES
Figure 1. Theoretical Model ......................................................................................................... 35 Figure 2: Initiating Structure and Performance ............................................................................ 52
Figure 3: Initiating Structure and Performance Residuals ............................................................ 53 Figure 4: Consideration and Performance .................................................................................... 53 Figure 5: Consideration and Performance Residuals .................................................................... 54 Figure 6: Distribution of IS&C Difference Scores ....................................................................... 68
x
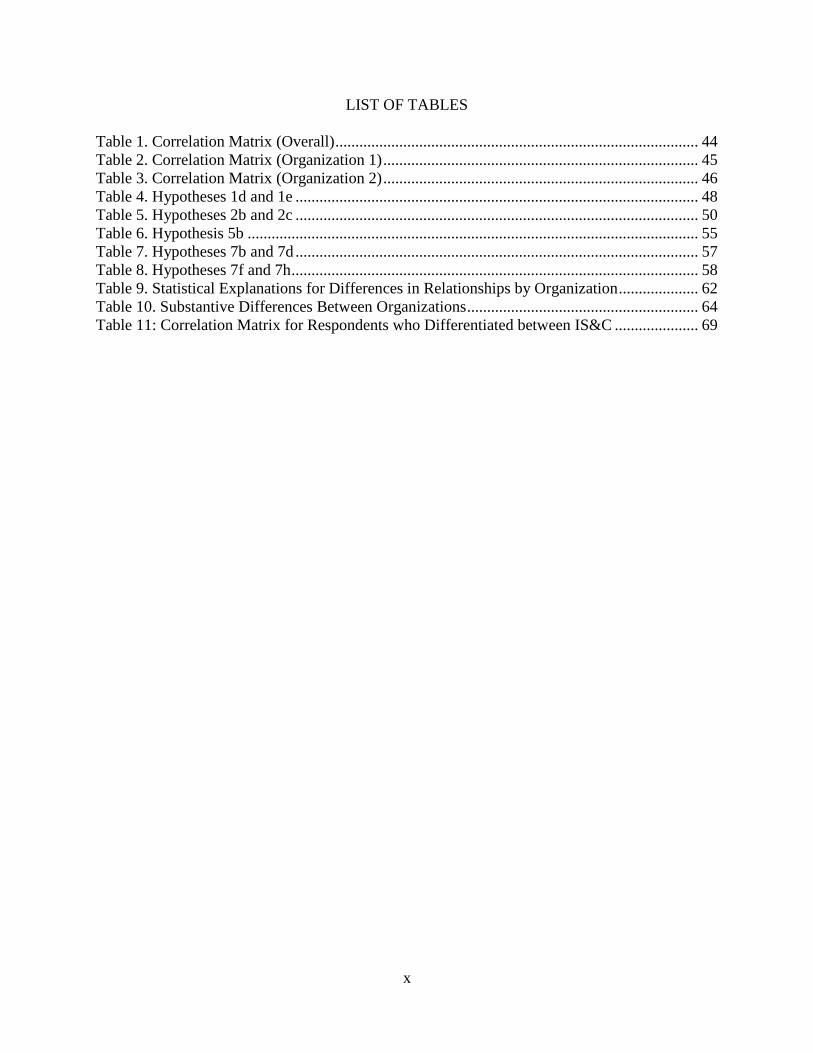
LIST OF TABLES
Table 1. Correlation Matrix (Overall) ........................................................................................... 44 Table 2. Correlation Matrix (Organization 1) ............................................................................... 45
Table 3. Correlation Matrix (Organization 2) ............................................................................... 46 Table 4. Hypotheses 1d and 1e ..................................................................................................... 48 Table 5. Hypotheses 2b and 2c ..................................................................................................... 50 Table 6. Hypothesis 5b ................................................................................................................. 55 Table 7. Hypotheses 7b and 7d ..................................................................................................... 57
Table 8. Hypotheses 7f and 7h ...................................................................................................... 58 Table 9. Statistical Explanations for Differences in Relationships by Organization .................... 62 Table 10. Substantive Differences Between Organizations .......................................................... 64 Table 11: Correlation Matrix for Respondents who Differentiated between IS&C ..................... 69
xi
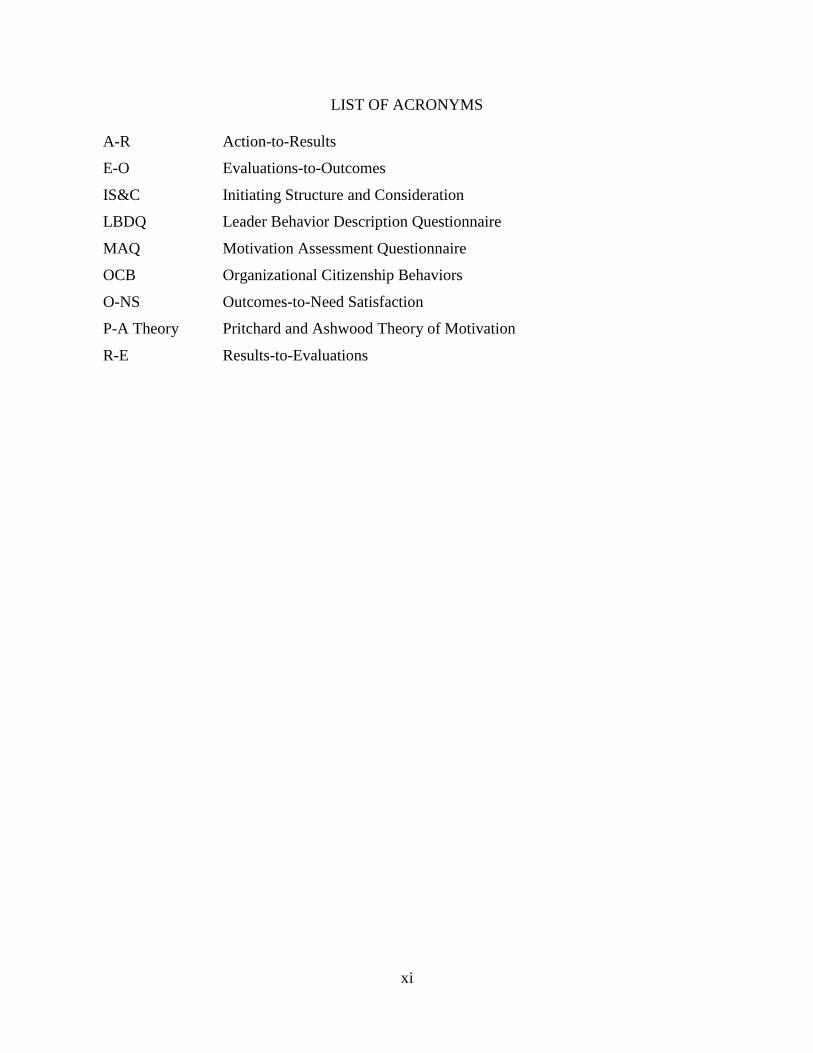
LIST OF ACRONYMS
A-R Action-to-Results
E-O Evaluations-to-Outcomes
IS&C Initiating Structure and Consideration
LBDQ Leader Behavior Description Questionnaire
MAQ Motivation Assessment Questionnaire
OCB Organizational Citizenship Behaviors
O-NS Outcomes-to-Need Satisfaction
P-A Theory Pritchard and Ashwood Theory of Motivation
R-E Results-to-Evaluations
1
CHAPTER 1: INTRODUCTION
At the most basic level, leadership theories propose that leaders can have a powerful
impact on individual, group, and organizational outcomes. Further, follower motivation is
thought to be a primary mechanism through which leaders exert their influence. Thus it follows
that if leaders wish to improve outcomes, they should enhance the motivation of their followers.
The purpose of this study is to more fully integrate leadership and motivation domains by
considering the relationship between two leadership behaviors (i.e. initiating structure and
consideration) and motivational facets as outlined by the Pritchard-Ashwood Theory of
Motivation (Pritchard & Ashwood, 2008). Additionally, this study contributes to the validity
evidence of the Motivation Assessment Questionnaire, a questionnaire designed to operationalize
the Pritchard-Ashwood Theory.
This research will add to both the motivation and the leadership literatures. Motivation is
typically believed to be influenced by a combination of individual and contextual factors.
Leadership can be a powerful contextual factor. However, it is often not explicitly included in
motivation theories (Zaccaro, Hildebrand, & Nelson, 2008) . For example, in the motivation
theories described in the following section, only Path-Goal Theory focuses on leadership as a
primary contributor to follower motivation.
Leadership theories, on the other hand, often include the concept on motivation; however,
leadership research tends to operationalize motivation rather simplistically as an overall measure,
rather than considering the components of motivation (Zaccaro et al., 2008) If individuals can
achieve a high level of motivation through multiple ways, overall measures of motivation make
it difficult to advise leaders and organizations how to improve their motivational climates. For
instance, meta-analytic evidence suggests that transformational leadership and contingent reward
2
leadership have similar effects on followers’ overall levels of motivation (Judge & Piccolo,
2004). While the overall effect of those two leadership styles on motivation is not significantly
different, it is not clear which components of motivation either of the styles affects. Thus, which
style should practitioners recommend to a leader who has diagnosed a specific motivational
deficiency in one of his/her followers? This dilemma is not unique to the transformational
leadership literature; viewing motivation globally rather than as a complex, multi-faceted
construct is common throughout the leadership literature (Zaccaro et al., 2008). Therefore, a
practical goal of this study is to assist practitioners in suggesting more targeted solutions to
leaders whose followers have low motivational levels.
One exception to the lack of integration between leadership and motivation theories is the
Path-Goal Theory of Leadership (House, 1971). This theory drew heavily on expectancy theories
and suggested that leader behaviors affect the followers’ motivational constructs of expectancy,
instrumentality, and perceived valence. Additionally, this theory suggested a number of
moderators of the leader behavior – follower motivation relationship. Despite the strong
theoretical framework of Path-Goal Theory, results of primary empirical studies and a meta-
analysis have demonstrated mixed support (Wofford & Liska, 1993). However, in a
reformulation of the theory, House offered several plausible reasons for the lack of consistent
support and provided encouragement that the effort to integrate the leadership and motivation
research, while difficult, is a worthwhile undertaking (House, 1996); this is discussed in more
detail in a later section. Thus, it seems there are fertile grounds for continued research in this
direction.
In an attempt to integrate the motivation and leadership literatures, this paper will focus
primarily on the Pritchard-Ashwood Theory of Motivation (Pritchard & Ashwood, 2008) and
3
leadership behaviors (i.e. Initiating Structure and Consideration). I will propose that leaders’
behaviors influence followers’ performance in part through followers’ motivation. In the
following sections, these constructs will be defined, the literatures will be reviewed, and
predictions will be made concerning the relationships between motivation and performance and
leadership and performance. Then, literature specifically linking leadership to motivation will be
reviewed and hypotheses regarding the proposed relationships will be proposed.
The Pritchard-Ashwood Theory of Motivation
The Pritchard and Ashwood Theory of Motivation (P-A Theory) is a refinement and
addition to the motivation concepts originally laid out in the Naylor, Pritchard, and Ilgen theory
(1980). While P-A Theory is an expectancy theory, it incorporates many of the constructs and
relationships described in other motivation domains. Thus, it provides a holistic theory of
motivation around which to base this work. In this section, I will provide an overview of P-A
Theory, link the theory to other motivation literatures, review evidence regarding the relationship
between the P-A Theory and performance, and discuss the question of how the components in P-
A Theory can best be combined to represent the overall construct of motivation.
Overview of the P-A Theory
In this paper, motivation is defined as the process one uses to allocate his or her energy
across tasks in an effort to meet needs (Pritchard & Ashwood, 2008). As stated above, P-A
Theory is an expectancy theory of motivation and as such, at the most basic level, states that
individuals are motivated towards actions based on their perceived relationship between their
effort devoted to that action and the receipt of outcomes that will satisfy their needs. P-A Theory
splits this overall expectation into a chain of four connections which must be strong in order for
4
an individual to be motivated: Action-to-Results Connections, Results-to-Evaluations
Connections, Evaluations-to Outcomes Connections, and Outcomes-to-Need Satisfaction
Connections. Each of these connections is described below.
The Action-to-Results Connections (A-R Connections) represent the degree to which
individuals feel that effort on their part will lead to a result, or output, of some kind. For instance,
the task of cleaning a room may have a strong A-R Connection. The more effort one puts in, the
cleaner the room becomes. However, for other tasks, such as composing a musical script, the
connection may be weaker. This is because more effort does not necessarily lead to a more
finished script.
The Results-to-Evaluation Connections (R-E Connections) refer to the expected
relationship between the level of results produced by individuals and the favorableness of the
evaluation of those results. The evaluation could be formal or informal and could be from anyone
(e.g. peers, supervisors, self, family members, etc.). From a work perspective, this connection
reflects the fact that some behaviors, and the results that follow, are more valuable to the
organization than others. For instance, the job of a professor may include research, teaching, and
service. At a research university, the results of one’s research will be more strongly tied to
evaluations than the results of one’s service; thus, the R-E Connection for research is stronger
than that for service.
The third link is the Evaluation-to-Outcome Connections (E-O Connections). These
connections refer to the extent to which organizational outcomes are tied to the evaluations one
receives. Pay is one particularly tangible example of an outcome; however, other less obvious
outcomes are important as well, such as office space, recognition, and promotions. For example,
5
jobs which provide salary increases based on one’s performance have a stronger E-O Connection
for salary than jobs in which everyone receives the same yearly cost-of-living salary increase.
Outcome-to-Need Satisfaction Connections (O-NS Connections) are the final connections
specified by the theory. The O-NS Connections are expectations regarding the degree to which
receiving the outcomes offered by the organization would satisfy one’s needs. For instance, a
$500 bonus may be quite satisfying to an entry-level employee. However, this same bonus may
do little to satisfy the needs of a successful, high-salaried employee. The extent to which
outcomes are satisfying depends partially on the strength of the needs at the time.
The P-A Theory suggests that all individuals have needs and a finite source of energy
available to meet their various needs. As such, individuals allocate their resources in such a way
that anticipated need satisfaction is optimized. Thus the strength of the connections described
above predicts how one will choose to allocate the finite energy resources.
Relationship between the P-A Theory and Other Theories of Motivation
There is an enormous literature on work motivation. This section compares P-A Theory
to some other theories of motivation to demonstrate the comprehensive nature of P-A theory.
There are excellent, comprehensive recent reviews of the work-motivation literature available for
the interested reader (Kanfer, 1992; Kanfer, Chen, & Pritchard, 2008, in press; Latham, 2007;
Latham & Pinder, 2005; Mitchell & Daniels, 2003). The remainder of this section will discuss
how P-A Theory includes key features of other theories of motivation. To do this, I will use the
broad motivational categories identified by Mitchell and Daniels as the organizing framework:
expectancy theory, self-efficacy, goal-setting, need theories, reinforcement, and justice. This
section is not intended to suggest that P-A Theory is superior to other theories of motivation or
6
that other theories are unnecessary; it is simply intended to describe the comprehensive nature of
the P-A Theory.
Expectancy theory. As noted previously, P-A Theory is an expectancy theory. As such, it
shares much in common with other expectancy theories. Perhaps the most well-known
expectancy theory is the VIE Theory developed by Vroom (1964). The three main constructs of
the theory are expectancy, instrumentality, and valence. Expectancy is one’s belief that his/her
effort will result in performance; this relationship is reflected in the A-R and R-E Connections of
P-A Theory. Instrumentality is the belief that performance will lead to an outcome: the E-O
Connections in the language of P-A Theory. Valence is the subjective value of the outcomes
available; stated differently, it is the degree to which one anticipates outcomes will satisfy his or
her needs (i.e. the O-NS Connections).
Clearly there is considerable overlap between P-A Theory and other expectancy theories,
which is expected given the developmental roots of P-A Theory. However, there are some areas
in which P-A Theory differs from other expectancy theories. For instance, P-A Theory focuses
on resource allocation rather than overall effort, it explicitly states that the connections are
relationships and are often non-linear, and the theory identifies determinants of each connection
(Pritchard & Ashwood, 2008; Pritchard, Harrell, DiazGranados, & Guzman, 2008).
Self-efficacy. Self-efficacy is one of the most popular constructs in psychology and has
been linked to a variety of positive outcomes (Judge, Jackson, Shaw, Scott, & Rich, 2007).
According to Baron, Byrne, and Branscombe (2006, p. 181), self-efficacy is “the belief that one
can achieve a goal as a result of one’s own actions.” Bandura defined self-efficacy as being
primarily situation or task specific; however, he also acknowledged that past successful
experiences contributed to a generalized feeling of self-efficacy (Downey & McMurtrey, 2007).
7
The construct of task specific self-efficacy is quite similar to the A-R Connections. Both task
specific self-efficacy and the A-R Connection refer to the degree to which an individual
anticipates that effort on his/her part will lead to a result.
Goal setting. Goal setting is another popular and well researched area within motivation.
Research consistently shows that difficult, specific, and achievable goals result in higher levels
of performance than “do your best” goals (Locke & Latham, 2002). Setting specific goals can be
thought of as clarifying the R-E Connections, in that specific goals inform employees how
varying levels of results will be evaluated. Levels of output/results at or above the level of the
goal will be evaluated positively; levels below the goal will be evaluated more negatively.
Achievable goals strengthen the A-R Connection by making it clear to employees that their
actions can bring about results. Locke and Latham point out an apparent contradiction between
goal setting theory and expectancy theories: Difficult goals lead to better performance despite the
fact that difficult goals should result in lower expectancy. However, as they point out, when one
considers a goal at a given level of difficulty (i.e. with-in goal vs. between goal conditions),
expectancy does predict higher performance. Furthermore, the P-A theory makes it explicit that
expectancy should be considered a relationship, not the probability of reaching a given level of
output. When expectancy is seen as a relationship, both goal setting and P-A Theory predict
higher performance when expectancies, as conceptualized as A-R connections, are high.
Need theories. Need theories are another category of motivation theory that has received
considerable attention. Although Maslow’s Need Hierarchy is often misunderstood and the
validity of the theory has been questioned, the theory is one of the most enduring in psychology
(Koltko-Rivera, 2006). Mitchell and Daniels (2003) described McClelland’s need theory as
another popular needs based approach to motivation. This theory proposed that people were
8
motivated by three primary needs: need for achievement, need for power, and need for
affiliation. This theory has been used to help explain why some people are drawn towards
careers in leadership (Stewart & Roth, 2007).
At the most general level, need theories state that needs influence motivation, need
strength varies across people, the strength of needs changes over time, and it is the need strength
at a given time that influences motivation. Needs are also incorporated in P-A Theory. P-A
Theory recognizes that needs are important to motivation, need strength varies across people and
across time, and it is the need strength at the time that influences motivation. P-A theory goes
beyond this by positing that needs are only motivating to the extent that variations in the amount
of outcomes lead to variations in the amount of need satisfaction, i.e. O-NS Connections.
Further P-A Theory states that the relationship is non-linear in that varying levels of the outcome
do not result in uniform increases in anticipated need satisfaction.
Reinforcement. Reinforcement theory is closely related to modern motivation theories
(Mitchell & Daniels, 2003). Research has shown repeatedly that people are more likely to repeat
behaviors that are reinforced (Stajkovic & Luthans, 1997). P-A Theory recognizes this finding in
the E-O and O-NS Connections by suggesting that in order for work outcomes to be motivating,
they should be tied to the evaluations of one’s results and lead to need satisfaction.
Justice. The final category of motivational theories discussed by Mitchell and Daniels
(2003) is Organizational Justice. Distributive justice is concerned with rules regarding the
distribution of outcomes (Colquitt, Conlon, Wesson, Porter, & Ng, 2001). The P-A Theory
incorporates ideas of distributive justice. Tying outcomes to evaluations (high E-O Connections)
and evaluations to results (high R-E Connections) is a distribution rule which should result in
increased perceptions of distributive fairness. Additionally, the theory acknowledges that
9
outcomes will be more satisfying when they are perceived as fair. For this reason, justice
perceptions are included as determinants of the O-NS Connections. The concept of procedural
justice suggests that individuals may perceive a situation as fair if they have control or input in
the process, regardless of the outcome (Colquitt et al., 2001). The A-R, R-E, and E-O
Connections are related to procedural justice in that if these connections are strong, employees
will have considerable control over the process.
As has been noted in the preceding paragraphs, P-A Theory incorporates many of the
important constructs found in other motivation theories. Because a goal of this paper is to better
understand how leaders influence follower’s performance, it was important to base my
hypotheses around a motivational theory that met two criteria. The theory must be robust enough
to explain many views of motivation, and motivation, as defined in the theory, must be related to
performance. Now that I have explained how the P-A Theory is related to other motivation
theories, I will turn my attention to the second criteria, the relationship between P-A Theory and
performance.
Relationship between Motivation and Performance
The primary reason that researchers and practitioners are interested in motivation is
because of the relationship between motivation and performance. Thus, useful motivation
theories should explain variance in the performance of workers. Empirical tests of relationships
between P-A Theory and performance are limited. This is in part due to the fact that until
recently there were no measures operationalizing the theory. However, Pritchard and his
colleagues have recently developed the Motivation Assessment Questionnaire (MAQ) that is
designed to assess P-A Theory (Pritchard, 2006b). This study will contribute to the ongoing
validation evidence of the theory and the questionnaire.
10
The MAQ includes five primary sections: a subscale for each of the four P-A Theory
connections and an overall motivation scale. This newly developed questionnaire has shown
good psychometric properties. More information about the questionnaire instrument, its
development, and its psychometric properties is provided in the Method section. The current
section reviews the literature surrounding empirical tests of the relationship between the P-A
theory and performance.
Direct supporting evidence using the MAQ is available in the form of the two
unpublished manuscripts: a thesis and a dissertation. Both of these projects examined the
relationship between the MAQ and supervisor rated performance. The first paper examined the
overall motivation scale of the MAQ (Botero, 2007) in a sample of police officers. Botero found
the correlation between motivation and supervisor rated performance was .36. This correlation
was marginally significant (p = .08). However, the number of participants was quite small (Ns
ranged from 24 to 28 respondents). As expected, when supervisors rated both motivation and job
performance the correlation was considerably stronger, r = .81, p < .05; this effect is likely due to
both a genuine relationship between motivation and job performance as well as rater biases (e.g.
halo error and performance cue bias).
A dissertation study using the MAQ found results of a similar magnitude (Cornejo,
2007). This study found that the MAQ measure of overall motivation was related to supervisor
ratings of performance, r = .33, p < .05. Again, when supervisors rated both motivation and job
performance, the correlation was considerably stronger, r = .85, p < .01. The author of the study
questioned whether the magnitude of the correlations would generalize to other samples
(Cornejo, 2007, p. 83). This study used undergraduate students who were working at least 10
11
hours a week. It is possible that the relationship between their motivation and performance is
smaller than would typically be found among adults working full time.
The previous study hypothesized, but failed to support, significant relationships between
P-A Theory connections and supervisor rated performance (Cornejo, 2007). The correlations
between the motivation connections and supervisor rated performance were as follows: A-R
Connection, r = .16; R-E Connection, r = .21; E-O Connection, r = .29; and O-NS Connection, r
= .07. One reason that the hypotheses were not supported is due to lack of statistical power (n =
37). However, another reason for the lack of support for these hypotheses can be found in P-A
Theory. The theory does not predict each connection should be related to performance. In fact, it
predicts that level of motivation will be determined by the lowest connection, not by each
connection separately (Pritchard & Ashwood, 2008).
The first hypothesis concerns the relationship between overall motivation and
performance. The theoretical scaffolding for this hypothesis is strong and was explained in the
previous section that linked the P-A Theory to a wide variety of motivational theories. Further,
the preliminary empirical evidence that is available suggests that there is a moderate relationship
between overall motivation and supervisor rated performance. The current study seeks to
replicate that finding while improving on previous limitations (i.e. sample size and participant
characteristics). Overall motivation will be indexed in three ways for the purpose of this study:
mean score on the overall motivation scale, the average of the P-A connections, and the weakest
of the P-A connections.
Hypothesis 1a: Motivation as measured by the Overall Motivation scale will be positively
related to supervisor rated performance.
12
Hypothesis 1b: Motivation as measured by the average of the P-A connections will be
positively related to supervisor rated performance.
Hypothesis 1c: Motivation as measured by the weakest of the P-A connections will be
positively related to supervisor rated performance.
As stated previously, the P-A theory proposes that the weakest connection will be a better
predictor of performance than the other connections (Pritchard & Ashwood, 2008). Stated
differently, the theory posits that the connections are non-compensatory: Strength in some
connections will not make up for weaknesses in others. As an example, imagine a case where the
O-NS link is very high; for instance $1,000,000 reward offered to a struggling single parent.
Further imagine the task is to climb Mt. Everest this weekend and the individual has no previous
climbing experience and does not believe she is capable of the task (i.e. low A-R connection).
Despite the strong incentive of the reward, the weak A-R connection would prevent her from
attempting the task. This is also in line with the learned helplessness literature that suggests that
when organisms learn that outcomes are beyond their control, they are no longer motivated
towards action, even when the outcome is extreme (e.g. dogs being exposed to electrical shock)
(Maier & Seligman, 1976).
The dissertation study described previously examined the difference between indexing
motivation as the overall scale, the average of the connections, or the minimum connection
(Cornejo, 2007). However, results did not support the weakest link hypothesis. The weakest
connection was not a significantly better predictor of performance (r = .27) than was the score on
the overall motivation scale (r = .33) or the average of the connections (r = .22). However, as
stated previously this study used a small sample of college students who worked only part-time.
It seems feasible that in this sample the relationship between the overall motivation scale (which
13
is a measure of effort) and performance would be stronger than in other samples because the
work being done may have been simpler. However, unlike in part-time, presumably simple jobs,
in more complex jobs, the weakest connection may be a stronger predictor of performance than
the overall motivation scale (i.e. effort). For instance suppose two individuals in a complex job
have very different A-R Connection scores but both put in the same amount of effort at their jobs
overall. The one with the higher A-R Connection will likely perform better because he will direct
his effort in more effective ways.
Another reason that the previous study may have failed to find an effect is because the
relationship between the weakest connection and performance and the average connection and
performance were contrasted. However, the weakest connection was included in the average of
the connections; this resulted in a high correlation between the weakest connection and the
average connection (r = .92); with a correlation so strong, it is not surprising that a differential
relationship was not found. Thus I retested this relationship in a different sample and I calculated
the average connection excluding the weakest connection. I hypothesized that consistent with the
P-A model, the weakest connection will be a stronger predictor of performance than the Overall
Motivation scale or the average of the other three connections.
Hypothesis 1d: The relationship between the weakest connection and performance will
be stronger than the relationship between the overall motivation scale and performance.
Hypothesis 1e: The relationship between the weakest connection and performance will be
stronger than the relationship between the average of the other three connections and
performance.
14
Relationship between Motivation and Other Outcomes
A moderate relationship between motivation as measured by the MAQ and performance
has been observed; however, it is unclear how the MAQ relates to other important employee
outcomes. There has been a recent call in literature to expand the criterion domain to consider
outcomes other than task performance (Borman & Motowidlo, 1993; Campbell, 1990). One
outcome that has received a lot of empirical attention recently is organizational citizenship
behaviors (OCB).
OCB is positive employee behavior that is above and beyond that which is required by
the formal role (C. A. Smith, Organ, & Near, 1983). OCB was originally defined as having two
dimensions: altruism and generalized compliance (C. A. Smith et al.). However, more recent
models have included additional or different factors (Organ, 1988; Williams & Anderson, 1991).
For the purposes of this paper OCB will be treated as one factor consistent with the
recommendations of a recent meta-analysis on the factoral structure of OCB (Hoffman, Blair,
Meriac, & Woehr, 2007).
I propose that those who have a high overall level of motivation are more likely to engage
in OCB. The MAQ is not limited to motivation of tasks specifically included in one’s formal
role; rather it asks about one’s motivational connections for the job in general. Further, although
OCB and task performance are distinct, they are also very highly correlated (Hoffman et al.,
2007). Thus, motivation as measured by the MAQ should predict OCB as well as task
performance.
In regards to the specific motivational connections, a differential relationship for the A-R
and O-NS motivational connections is expected. This is because factors dealing with ability tend
to be more strongly related to task performance; meanwhile, attitudes are more strongly related
15
to OCB (Organ & Ryan, 1995). The A-R connection describes the perceived ability for actions to
lead to work results; thus it should predict performance more strongly than it predicts OCB. On
the other hand, the O-NS connection describes the extent to which employees believe they will
be satisfied if they receive the outcomes offered by the job. Therefore, I expect that O-NS
connection will be more strongly related to OCBs than performance.
Hypothesis 2a: Motivation will be positively related to OCB.
Hypothesis 2b: The A-R connection will be a better predictor of performance than of
OCB.
Hypothesis 2c: The O-NS connection will be a better predictor of OCB than performance.
Another important job outcome is turnover intentions. Turnover costs American industry
approximately $11 Billion per year (Abbasi & Hollman, 2000). Hulin (1991) described the
Progression-of-Withdrawal Model which suggests that individuals withdrawal from work in
steps. Before leaving their jobs, employees first withdraw by doing less at work (e.g.
daydreaming, taking breaks). Thus a decline in motivation may precede intentions to turn over.
Meta-analytic results support this model (Griffeth, Hom, & Gaertner, 2000). Although this
meta-analysis did not examine motivation, they did find that performance, promptness, and
attendance were negatively correlated with turnover; thus suggesting that those who are more
motivated are less likely to turnover.
Hypothesis 2d: Motivation will be negatively related to turnover intentions.
Initiating Structure and Consideration
Although there is an abundance of leadership behaviors, styles, and theories available in
the literature, Initiating Structure and Consideration (IS&C) are the focus of the current paper.
There are several reasons why I chose to focus on IS&C. First, IS&C are foundational constructs
16
in many modern theories of leadership (Fleishman, 1998). Secondly, focusing on behaviors
rather than styles or traits allows one to be more prescriptive in recommendations to practitioners
which, as stated previously, is an applied goal for this paper. Third, Path-Goal Theory is an
example of an attempt to integrate the leadership and motivation literatures. Though this study
does not attempt to test Path-Goal Theory, the theory provides a theoretical and empirical
background. Finally, a recent meta-analysis found sizable correlations between IS&C and
important organizational outcomes; the authors suggested that these behaviors had been
forgotten too soon and recommended renewed research in this area (Judge, Piccolo, & Ilies,
2004).
There are five primary goals for this section. First I will provide a historical overview of
the development of IS&C and define the constructs. Next, I will relate IS&C to other leadership
theories, styles, and behaviors. Then, I will review the literature regarding the effectiveness of
IS&C in improving performance of subordinates. Next, I will discuss the potential non-linearities
and a moderator of the relationship between IS&C and performance. Finally, I will move beyond
task performance and discuss OCB as a possible outcome of IS&C.
History and Definition of Initiating Structure and Consideration
Prior to the 1950s, leadership research focused primarily on the traits of leaders. The idea
at the time was that leaders were born, not made, and thus the emphasis was on identifying the
traits necessary for effective leadership so that good leaders could be selected (Bass, 1990;
House & Podsakoff, 1994). This provides a historical context for the original IS&C research
conducted in the early 1950s. At the time of development, IS&C represented a considerable shift
in thinking.
17
In a historical account, Fleishman (1973) discussed the development of IS&C behaviors
through the Ohio State studies. In an effort to refocus leadership research towards what leaders
do rather than who leaders are, approximately 1800 leader behavior statements were written.
Duplicates and overlapping items were deleted and an eventual list of 150 items was retained and
became the original leader behavior questionnaire, a precursor to commonly used behavioral
scales such as the Leader Behavior Description Questionnaire (LBDQ), Supervisor Behavior
Description Questionnaire (SBDQ), and the revised Leader Behavior Description Questionnaire
(LBDQ-Form XII); these scales are discussed in more detail in the Method Section. The
orthogonal factors of IS&C were derived from a series of factor analyses of the questionnaire
that each resulted in two factors that were named initiating structure and consideration. This
developmental history is important because it underscores one of the common criticisms of
research on IS&C: It tends to be atheoretical. In fact, that is one potential cause Fleishman cited
of the mixed empirical findings concerning the antecedents and consequences of the behaviors.
Bass (1990, p. 512) provided a commonly cited definition for initiating structure: “such
leadership behavior as insisting on maintaining standards and meeting deadlines and deciding in
detail what will be done and how it should be done.” He went on to state that leaders high in
initiating structure establish clear communications and patterns of work and are oriented towards
the task at hand; this type of leader is directive. Similarly, House and Podsakoff (1994, p. 50)
described leaders high in initiating structure as “those who structured the work for their
subordinates, and provided clear messages regarding the roles they expected their subordinates to
perform.” House (1971) pointed out that those high in initiating structure are similar to portrayals
of leaders in classical management theories; they plan, organize, direct, and control.
18
Alternatively, consideration is “the extent to which a leader exhibits concern for the
welfare of the other members of the group” (Bass, 1990, p. 511). In particular, Bass noted that
considerate leaders are appreciative of good work, focus on job satisfaction of subordinates, treat
others as equals, put subordinates at ease, take suggestions, and consult with subordinates on
important decisions. House and Podsakoff (1994, p. 50) described leaders high in consideration
as “those who demonstrated friendliness and a concern for the well-being of their subordinates.
Thus, while initiating structure focuses on organizing tasks, consideration is more people-
oriented.
Relationship between IS&C and Other Theories, Styles, and Behaviors of Leadership
As mentioned previously, IS&C emerged in several of the Ohio State factor analysis
studies of leader behavior conducted in the 1950s. However, given that it has been half a century
since those studies were conducted, it is fair to question the extent to which those two behaviors
can currently account for a good deal of variability in leaders’ behaviors. In fact, one of the
reasons that I choose to use the constructs of IS&C is because they are comprehensive and still
relevant as is explained in the following paragraphs.
Bass provided a review of the theoretical and empirical literature linking IS&C to other
leadership styles (1990). For instance, democratic and autocratic styles of leadership reflect the
degree to which leaders retain power versus distribute power among their subordinates. Bass
noted that the democratic style is conceptually similar to consideration, and the autocratic style is
similar to initiating structure (p. 416). In reviewing the empirical findings linking the constructs,
Bass reported moderate to high correlations between both IS&C and the two styles (p. 524).
Similarly, task and relation orientations are also in-line conceptually with IS&C. However, Bass
reported mixed empirical findings regarding their relationships. Given the high degree of
19
correlation between both IS&C with a variety of leadership styles, Bass noted that a strong
general factor of leadership exists.
Dimensions of transformational and transactional leadership also share meaning with
IS&C. Transformational leadership includes intellectual stimulation (e.g. encouraging divergent
thinking, taking risks) and individualized consideration (e.g. attending to individuals’ growth and
development) (Bono & Anderson, 2005). These two dimensions, intellectual stimulation and
individualized consideration, are conceptually similar to the definition provided earlier of
consideration. Alternatively, transactional leadership includes contingent reward, which is
support and resources in exchange for subordinates’ efforts and performance (Bono & Judge,
2004). This type of leadership is task related and is conceptually similar to initiating structure.
However, Bass (1990) reported that both IS&C correlate moderately to strong with all three
dimensions (intellectual stimulation, individualized consideration, and contingent reward). The
lack of differentiation between the relationships of transformational and contingent reward
leadership with other leadership types and behaviors, including IS&C, is not particularly
surprising given the meta-analytic correlation estimate of .80 between transformational
leadership and contingent reward (Judge & Piccolo, 2004).
Nowhere is the foundational nature of IS&C more apparent than in a comprehensive
review of leadership typologies conducted by Fleishman and his colleagues (Fleishman et al.,
1991). These authors reviewed the literature from 1940-1986 and identified 65 different
leadership classification systems. They concluded that “in nearly every classification system,
dimensions are proposed focusing on (a) the facilitation of group social interaction, and (b)
objective task accomplishment” (p. 253) which, as they pointed out is similar to the constructs of
IS&C. More recently, this sentiment was echoed “after all the conceptualizations, factor
20
analyses, and theorizing are done, some form of Consideration and Structure generally emerge
among the overarching constructs or as a significant part of the mix” (Fleishman, 1998, pp. 831-
832).
Relationship between IS&C and Performance
Prior to a recent meta-analysis, IS&C were widely recognized as important theoretical
building blocks in the leadership literature, but no longer applicable for continued research
(Judge et al., 2004). However, this meta-analysis found relationships between IS&C and a
variety of outcomes including follower satisfaction, motivation, leader effectiveness, leader job
performance, and group/organization performance, thereby suggesting that these behaviors
deserve continued attention. Particularly relevant to this section are the estimated relationships
between group/organization performance and initiating structure (p = .30) and consideration (p =
.28) (Judge et al., 2004).
Since the 2004 meta-analysis, Keller (2006) found that initiating structure positively
predicted team performance, particularly in certain types of projects (i.e. development projects
that were more incremental and required more communication and less creativity than research
projects). This finding is significant on its own. However, it is particularly encouraging for the
field because Judge and his colleagues (2004) were unable to find any empirical studies of IS&C
between the years of 1987 and 2004. Additionally, a search in the PsycINFO database returns
three dissertations from 2007 dealing with IS&C. Perhaps IS&C are receiving more research
attention following the 2004 meta-analysis.
Thus, based on the accumulated empirical evidence of 130 studies included in the recent
meta-analysis (Judge et al., 2004), as well as the emerging literature, I hypothesize that IS&C
will be related to performance. The theoretical explanation for this hypothesis is that IS&C
21
increase performance by increasing follower motivation. This theoretical proposal is fully
explained in the later section: IS&C and the P-A Theory of Motivation.
Hypothesis 3a: Leader’s initiating structure will be positively related to the subordinate’s
performance.
Hypothesis 3b: Leader’s consideration will be positively related to the subordinate’s
performance.
Shape and moderators of the relationship between IS&C and Performance
While the main, linear relationships between IS&C and performance are interesting, they
are well-established in the literature and thus do not add considerably and are a minor focus of
this project. In my opinion, what is more interesting is examining the shape of the relationship
between IS&C and performance. For instance, is there a point of diminishing returns beyond
which additional IS&C is unnecessary? Or is more always better? In addition to the issue of
linearity, this section will examine a potential moderator of the relationship between initiating
structure and performance: task ambiguity.
Linearity. Only one previous study has examined the issue of linearity in the effects of
IS&C (Fleishman, 1998; Judge et al., 2004). In 1962, Fleishman and Harris published a study
that became the most popularly cited article in Personnel Psychology in the 1960’s (Fleishman,
1998). When asked to write some post hoc reflections, Fleishman noted that one of the most
interesting findings in his study has received the least amount of attention: IS&C had a
curvilinear relationship with both employee grievances and turnover. Although initiating
structure tends to be positively related to performance, this study found negative relationships
with grievances and turnover. Specifically, turnover and grievances increased most sharply at
low levels of consideration and high levels of initiating structure. Fleishman pointed out that the
22
curvilinear relationships between IS&C and criteria may be one reason for inconsistent findings
in the literature and highlighted the importance of range restriction.
Yukl (1981) also commented on the lack of replication of the nonlinearity finding.
Additionally, he noted concern about the generalizability of the finding. In particular he was
concerned about the sample being foremen and questioned whether other professions would
show similar shapes. Additionally, he noted that the criteria in the study were grievances and
turnover; he suggested that the shape may be different for different outcomes. Given that I have
hypothesized positive relationships between IS&C and performance and the 1962 study found
negative relationships between initiating structure and grievances and turnover, the findings of
the 1962 may not generalize in terms of direction of effect. However, it seems reasonable that the
nonlinear finding may generalize.
At the extreme, high levels of initiating structure and low levels of consideration
resemble destructive leader behaviors. In a recent effort to create a taxonomy of ineffective
leader behaviors, Rasch, Shen, Davies, and Bono (2008) identified nine categories of destructive
behaviors. They found that these nine categories of behavior had an undesired effect on a myriad
of employee outcomes: turnover intentions, self-reported job performance, motivation,
satisfaction, and mood. Several of these ineffective leadership behavior categories are
conceptually similar to extreme levels of IS&C.
An excessively high level of initiating structure (e.g. providing too much detail of what
things should be done and how, insisting too strongly on standards and deadlines) resembles the
behavior (Rasch et al., 2008) labeled “Over-Controlling”. Unlike initiating structure, over-
controlling has a negative effect on employee outcomes (Rasch et al., 2008). Therefore, although
23
I am predicting that initiating structure will have a positive effect on performance, the
relationship should become negative at a high enough level.
Extremely low levels of consideration are similar to the constructs that Rash et al. (2008)
call “Failure to Consider Human Needs” and “Poor Emotional Control.” In the same study, the
authors found that failing to consider human needs had a particularly strong effect on employee
outcomes as compared to the other ineffective behaviors. Therefore, while I am predicting a
positive relationship between consideration and performance, I predict that the relationship will
be steepest at low levels of consideration.
Hypothesis 4a: The relationship between initiating structure and performance will be a
nonlinear, quadratic, one such that it is positive for low and moderate levels of initiating
structure but not for extremely high levels.
Hypothesis 4b: The relationship between consideration and performance will be a
nonlinear, quadratic, one such that it is consistently positive but the slope is steepest for low
levels of consideration.
Task Ambiguity as a Moderator. One of the things that authors often note when they
review the literature on IS&C is that there are mixed results regarding their correlations with
criteria. This is also reflected in the significant Q Statistics in the recent IS&C meta-analysis
(Judge et al., 2004); this suggests that moderators are likely present. The lack of consistent
findings is particularly true for initiating structure as opposed to consideration (Bass, 1990;
House & Podsakoff, 1994; Yukl, 1981). Situational approaches to leadership suggest that the
extent to which a leader’s behaviors are effective is contingent on variables in the situation
(Yukl, 1981).
24
One situational approach to leadership is the Path-Goal Theory (House, 1971). This
theory is discussed in detail in the following section. Although not the primary purpose of the
current study, I will explore propositions one and three of House’s revised theory (House, 1996).
Specifically, House proposed that initiating structure will be effective when task demands are
ambiguous and satisfying (Proposition 1), but that behavior will not be effective for
unambiguous, dissatisfying tasks (Proposition 3) (p. 336). The logic is if the task is clear and
straight-forward without the leader’s influence, then additional effort on the leader’s behalf to
provide psychological structure is neither needed nor desired. This is also in line with the
substitutes for leadership model which suggests that environmental characteristic can diminish
the necessity and effectiveness of a leader’s behavior (Kerr & Jermier, 1978).
Kahn and his colleagues defined task ambiguity as a type of role ambiguity in which
individuals do not have the task related information to carry out their roles (Eys & Carron, 2001).
One of the functions of a leader high in initiating structure is to clarify information about the task
(House, 1996). However, for this hypothesis, I am interested in task ambiguity beyond the effects
of the leader. Stated differently, I will consider task ambiguity as the extent to which a task
would be unclear without the input of the leader.
Hypothesis 4c: The relationship between initiating structure and performance will be
moderated by task ambiguity such that the relationship will be most positive when the task is
ambiguous.
Relationship between IS&C and Organizational Citizenship Behaviors
I have already discussed the relationship between IS&C and task performance. However,
it is also important to consider whether those leader behaviors are related to other types of
25
performance such as OCB. In particular, a relationship between consideration and OCB seems
likely.
In their seminal work, Smith and colleagues (1983) proposed that consideration and
leader supportiveness may be related to citizenship behaviors because considerate leaders
demonstrate OCB and thus their followers may repeat OCB based on the leader’s example. They
also suggested that followers may engage in more OCB with a considerate leader out of a sense
of reciprocity. A moderate relationship between OCB and consideration was confirmed in a
meta-analysis (Organ & Ryan, 1995).
In addition to replicating this finding, I also propose that consideration will have a
stronger relationship with OCB than initiating structure will. While both IS&C were
hypothesized to positively affect performance, there is no reason to believe that initiating
structure will be positively related to OCB. In fact, research indicates that when decisions are
made hierarchically, as is the case with leaders high in initiating structure, employees may be
less likely to engage in OCB. Another reason that consideration, as opposed to initiating
structure, may have a stronger relationship with OCB is because consideration is more strongly
related to satisfaction (Judge et al., 2004). In turn satisfaction is more strongly related to OCB
than to task performance (Organ & Ryan, 1995). In other words, followers of considerate
leaders are happier and happier people are more likely to engage in OCBs.
Hypothesis 5a: Consideration will be positively related to OCB.
Hypothesis 5b: The relationship between consideration and OCB will be stronger than the
relationship between initiating structure and OCB.
26
IS&C and the P-A Theory of Motivation
A primary goal of this paper is to integrate P-A Theory with the behaviors of IS&C. In
particular, I propose that IS&C affects performance (see Hypotheses 2a-b) and that this effect is
mediated by motivation as defined by P-A Theory. Now that P-A Theory and IS&C have been
explained and linked to performance, this section focuses on the relationship between IS&C and
motivation. First, I will review Path-Goal Theory because it is particularly relevant to this
integration. Next, I will review previous findings linking IS&C to motivation. Then, I will
develop specific hypotheses relating IS&C to the motivational connections of the P-A Theory.
Path-Goal Theory of Leader Effectiveness
As mentioned in the opening section, Path-Goal Theory is an example of the integration
of the motivation and leadership literatures. Although this dissertation is not a direct test of the
Path-Goal theory, the theory is discussed because of its theoretical relevance. Path-Goal Theory
is based heavily on expectancy theory and IS&C (House, 1971). Relevant to this section, Path-
Goal Theory proposes that leaders have their effects on distal outcomes such as performance and
satisfaction through motivation. In his original theory, House made four propositions. The first
was that leaders motivate employees by increasing the outcomes available from work goal-
attainment and making the path to these outcomes easier. The second was that by clarifying the
path-goal relationship, leader behavior will have a positive effect on motivation by reducing role
ambiguity and allowing for external controls. The third was that these behaviors will be more
appropriate in some cases than others. Specifically, if the path-goal relationship is already clear,
then addition of controls will lead to decreased satisfaction. The final proposition was that leader
behavior aimed at satisfying needs of subordinates would increase performance if need
satisfaction was linked to goal-directed effort.
27
Unfortunately, tests of the theory yielded inconsistent results and ultimately, a meta-
analysis failed to support many of the hypotheses (Wofford & Liska, 1993). The authors
however noted a significant limitation is the failure to include motivational variables in the study
of the Path-Goal Theory: “Although path instrumentalities are the dependent variables of the
basic propositions of the original path-goal theory, most of the research on the theory has used
measures of satisfactions, performance, role clarity, and organizational commitment as
surrogates. Because many other variables may affect these surrogate measures, tests of the
theories are weakened by their use” (p. 872). House (1996, p. 331) expressed a similar frustration
in his reformulation of the theory: “To my knowledge there have been no tests of the effects of
leader behaviors on follower valences. Further, the only test of the effects of leader behaviors on
follower expectancies is that of House and Dessler (1974) which yielded rather strong support
for the theory based on two independent samples.”
In addition to the measurement of motivational constructs, House (1996) proposed two
other guidelines for future research that will be used in the current paper. The first is that
researchers avoid using measures that contaminate the initiating structure construct by including
punitive behaviors. In the past, the Supervisor Behavior Description Question (SBDQ) was used
often and this measure includes items that are inconsistent with the construct of initiating
structure. In fact, 19% of the studies in the IS&C meta-analysis measured initiating structure
with the SBDQ (Judge et al., 2004). These studies had significantly, meaningfully smaller
validities for initiating structure than studies using other measures (average r = .05 versus .29,
.27, .27, and .29). The second guideline concerns the test of moderators hypothesized by the
theory. Rather than measuring constructs such as task ambiguity, researchers have often relied on
surface surrogates such as job title. The current paper will attempt to overcome these previous
28
limitations. Despite the promising guidelines for future research, to date I am only aware of one
study that tested the propositions in this reformulated theory, and it did not involve motivation
(Schriesheim, Castro, Zhou, & DeChurch, 2006).
Thus the current study provides a retest of two of the original Path-Goal hypotheses
(House, 1971) using the best practices for future research recommended by House (1996) and
Wofford and Liska (1993). Because the Path-Goal Theory uses different terminology than P-A
Theory, P-A Theory connections are listed in parentheses following similar or related constructs.
First, House hypothesized that initiating structure would decrease role ambiguity (A-R and R-E
Connections) for non-routine tasks. Secondly, he hypothesized that consideration could result in
an increase in positive valences or a decrease in negative valences (O-NS Connections). These
two hypotheses are retested in Hypothesis 7a, 7c, and 7g.
Relationship between IS&C and Motivation
The meta-analysis conducted by Judge and his colleagues (Judge et al., 2004) was
discussed in the section on IS&C and performance. In addition to performance, these authors
considered other criteria including follower motivation. They found overall estimated meta-
analytic correlations of .50 and .40 with consideration and initiating structure, respectively.
Thus, it appears that there is a strong relationship with these leadership behaviors and follower
motivation.
The findings of the Judge et al. (2004) meta-analysis support the general proposition of
this paper that IS&C is related to motivation and to performance; however, they did not test a
mediation model. Further, this meta-analysis does not clarify to which motivational components
IS&C are related. Because the meta-analysis is a summary of the relationship, it is not clear from
the meta-analysis which measures of follower motivation were used or which motivational
29
constructs those measures tapped. Therefore, in the following paragraphs, I review the primary
studies included in the estimation of these effect sizes to get more information about the
motivational constructs represented.
I obtained a list of the ten studies included in the estimation of the 21 IS&C – follower
motivation effect sizes from the second author, Ronald Piccolo. I reviewed each of the primary
studies to see how motivation was operationalized. One of the things that was interesting was
that not only were different measures used by different authors, but in many cases the measures
were of different constructs. In order to simplify presentation and discussion, I translated the
motivational constructs in the primary studies into P-A Theory terminology; while there were not
exact matches of the constructs, I placed the constructs in the primary studies with the
connection from P-A Theory that most closely matched the definition. Appendix A presents a
summary of the motivation constructs from these primary studies. Readers may notice that the
literature reviewed in the section is somewhat dated. However, as a reminder, there have been
limited empirical studies done on the IS&C behaviors since 1987.
One of the things that I noted from this review is that researchers tended to look at
motivation overall; five of the ten studies included an overall measure as the primary dependent
variable(s). In some cases, the overall measures were based on extra effort (Ehrlich, Meindl, &
Viellieu, 1990) or job related daily motivation (Schriesheim, 1979). Additionally, there were
three studies that conceptualized motivation in accordance with expectancy theory, but computed
overall motivation by combining expectancy, instrumentality, and valence mathematically using
a variety of formulas (Evans, 1974; Matsui, Osawa, & Terai, 1975; Miles & Petty, 1977). This
accurately reflects the thinking at the time of overall motivation as mathematical combination of
its subcomponents. Unfortunately, results for relationships between the individual motivational
30
components and IS&C were not reported in these cases which makes it hard to generalize the
findings from these studies to the current set of hypotheses.
This mathematical combination is particularly troubling because although the basic
concepts of expectancy, instrumentality, and valence have been supported, the mathematical
combination of the constructs to arrive at an individual’s overall motivation has typically not
been supported (Muchinsky, 2006). Another issue is in the way that many studies using these
expectancy theory variables have operationalized the components. They did not actually ask
about the relationship, they asked about specific points in the relationship. For example, asking
what the likelihood is for high performance if effort is high is a common way of measuring
expectancy. However, this does not get at the relationship; on an easy task, performance can be
high with low or high effort.
I anticipate that in the present study IS&C will be related to overall motivation. IS&C
were developed to represent leader behaviors that are effective and can lead to increased
motivation and subsequent performance of subordinates. Theoretical rationale for how and why
overall motivation is affected is presented in the next section. Empircal results of prior research
largely confirm the relationship between IS&C and motivation as well. For instance, a study by
Ehrlich and colleagues (1990) demonstrated that extra effort was correlated with initiating
structure, r = .43, and with consideration, r = .40. Schriesheim (1979) found that typical daily
motivation was related to consideration, r = .20, but not to initiating structure, r = .01. Evans
(1974) examined the relationship between the product of expectancies and instrumentalities with
consideration for a variety of specific behaviors; he found correlations ranging from .49 to .54.
Miles and Petty (1977) calculated overall motivation from the expectancy components using two
31
different formulas. They found that the correlations with initiating structure were .05 or .23 and
with consideration were .30 and .27 depending on how motivation was calculated.
Hypothesis 6a: Leader’s initiating structure will be positively related to the subordinate’s
overall motivation.
Hypothesis 6b: Leader’s consideration will be positively related to the subordinate’s
overall motivation.
In addition to the overall measures of motivation, there was one study that conceptualized
motivation as persuasiveness (Stogdill, Goode, & Day, 1963), that was not relevant to the current
study. The other studies, however, provided background for the next set of hypotheses, the
relationships between IS&C and the motivation connections of P-A Theory. In the following
paragraphs, rationale is explained for the hypotheses, the related empirical results are discussed,
and hypotheses are presented.
A-R and R-E Connections. As a reminder, the A-R Connections refer to the perceived
relationship between level of effort applied to actions and level of results/output obtained; the R-
E Connections is the perceived relationship between level of results and the level of the
evaluation one receives. Note that the actions, results, and evaluations components of the P-A
Theory are very much task/performance oriented. On the other hand, the E-O and O-NS links
deal with the outcomes received as a result of one’s performance and how much those outcomes
satisfy needs. I point this out because previous studies have demonstrated that initiating structure
tends to be more strongly correlated with performance-based outcomes and consideration more
strongly correlated with affective outcomes such as satisfaction (Bass, 1990; Judge et al., 2004;
Yukl, 1981).
32
Recall from a previous section that leaders are classified as high in initiating structure
when they decide what should be done and how, set performance standards, and communicate
this information with their subordinates (Bass, 1990; House & Podsakoff, 1994). Thus, one of
the roles of a leader high in initiating structure is to implement appropriate work strategies. Work
strategies are an important component of motivation and are directly related to the A-R
Connections. When good work strategies are known and used, employees should feel as though
their actions will lead to work results. P-A Theory supports this proposition; one of the stated
determinants of the A-R Connections is work strategies (Pritchard & Ashwood, 2008). Oldham
(1976) examined the relationship between placing personnel and initiating structure. Placing
personnel involves making sure that people are in positions were they are able to use their skills
effectively to produce work results; thus this construct is related to the A-R Connections. The
correlation between this construct and initiating structure was .43; the relationship with
consideration was smaller, r = -.09.
Another key characteristic of leaders high in initiating structure is setting and
communicating performance standards. Performance standards make it clear to employees what
level of work result is acceptable and what is unacceptable. When this information is
communicated to employees and work of a given quality/quantity is consistently evaluated in the
same way, employees’ R-E Connections should become quite clear. Two studies have compared
initiating structure and expectancy (Miles & Petty, 1977; Szilagyi & Keller, 1976). Recall from a
previous section that expectancy is similar to the combination of the A-R and R-E connections.
The Miles and Petty study demonstrated support for the proposition that initiating structure is a
more powerful behavior for strengthening the A-R and R-E connections than is consideration; r
= .26 versus .18; results of the Szilagyi and Keller study revealed small effect sizes for each of
33
the behaviors (r = .07 and .10). Similarly, the Oldham study (1976) found that setting goals, a
behavior that is closely in-line with the R-E Connection, was more positively related to initiating
structure than to consideration (r = .44 and -.18).
Hypothesis 7a: Leader’s initiating structure will be positively related to the A-R
Connection.
Hypothesis 7b: Leader’s initiating structure will have a stronger effect on the A-R
Connection than will consideration.
Hypothesis 7c: Leader’s initiating structure will be positively related to the R-E
Connection.
Hypothesis 7d: Leader’s initiating structure will have a stronger effect on the R-E
Connection than will consideration.
E-O and O-NS Connections. The E-O and O-NS Connections involve an individual’s
anticipation of what will happen after the work results have been produced and evaluated.
Specifically, they refer to whether the evaluation will lead to an outcome and whether that
outcome will satisfy need(s). Thus rather than focusing on the actual work performance, these
connections focus on the eventual anticipated satisfaction that will be received. Therefore, they
should be related to consideration more strongly than they are related to initiating structure
(Judge et al., 2004).
Considerate leaders show appreciation for good work. Recall from a previous section that
work outcomes include not only the tangible (money, office space, etc.) but also the intangible.
Thus appreciation can be thought of as an additional outcome, and when leaders express the
appreciation based on good work (an evaluation), this will strengthen the E-O link. The E-O link
is similar to the concept that has previously been related to IS&C, Expectancy II. Expectancy II
34
is the perceived link between performance and personal reward (Szilagyi & Keller, 1976). One
study found that Expectancy II was related to initiating structure, r = .28 or .21 depending on the
sample, but did not consider the relationship with consideration (Dessler & Valenzi, 1977).
Another study found that Expectancy II was more strongly related to consideration than initiating
structure; the difference was substantial depending on the measures used, r = .40 versus .35 or r
= .46 versus .07 (Szilagyi & Keller, 1976).
Considerate leaders consult with subordinates to seek input before making decisions
(House & Podsakoff, 1994). This is known as “voice” in the justice literature and has been
shown to increase satisfaction with outcomes (Colquitt et al., 2001). Considerate leaders also
demonstrate concern about the welfare and satisfaction of their subordinates (Bass, 1990). This
also has a counter part in the justice literature, interpersonal justice. Interpersonal justice is
related to perceptions of fairness overall and satisfaction with the outcomes (Colquitt et al.,
2001). In P-A theory, the fairness of the outcome distribution process is a determinant of the
strength of the O-NS connections. Thus, considerate leaders should increase the O-NS
Connections of their subordinates. O-NS Connections are similar to the construct of valence in
traditional expectancy theories. House (1996) reported that there were no studies examining the
relationship between IS&C and valence. I was only able to find one study that measured valence;
however, results were not reported for valence alone, but rather valence was combined with
expectancy theory components to form overall motivation (Matsui et al., 1975).
Hypothesis 7e: Leader’s consideration will be positively related to the E-O Connection.
Hypothesis 7f: Leader’s consideration will have a stronger effect on the E-O Connection
than will initiating structure.
Hypothesis 7g: Leader’s consideration will be positively related to the O-NS Connection.
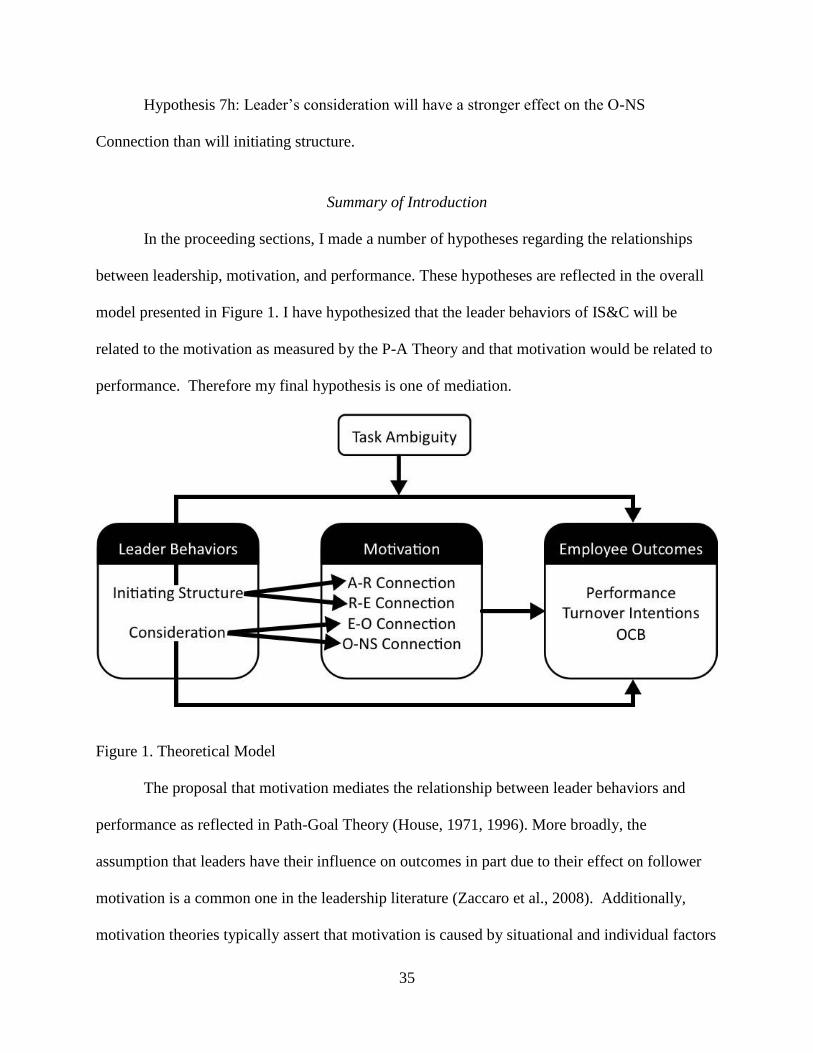
35
Hypothesis 7h: Leader’s consideration will have a stronger effect on the O-NS
Connection than will initiating structure.
Summary of Introduction
In the proceeding sections, I made a number of hypotheses regarding the relationships
between leadership, motivation, and performance. These hypotheses are reflected in the overall
model presented in Figure 1. I have hypothesized that the leader behaviors of IS&C will be
related to the motivation as measured by the P-A Theory and that motivation would be related to
performance. Therefore my final hypothesis is one of mediation.
Figure 1. Theoretical Model
The proposal that motivation mediates the relationship between leader behaviors and
performance as reflected in Path-Goal Theory (House, 1971, 1996). More broadly, the
assumption that leaders have their influence on outcomes in part due to their effect on follower
motivation is a common one in the leadership literature (Zaccaro et al., 2008). Additionally,
motivation theories typically assert that motivation is caused by situational and individual factors
36
and that motivation in turn leads to performance (Kanfer, 1992). Leader behavior is one potential
important situational factor (Zaccaro et al., 2008).
Despite the theoretical rationale that motivation mediates the relationship between leader
behavior and performance, I am not hypothesizing full mediation. This decision was based
primarily on the results of simulation studies demonstrating the power issues associated with
typical tests for mediation. In particular larger sample sizes simultaneously make it easier to
show that the independent variable and dependent variable are related, but harder to show that
that relationship is no longer significant once the mediator is introduced; this makes complete
mediation difficult to demonstrate (Stone-Romero & Rosopa, 2004). From a theoretical
standpoint, it is also plausible that leaders’ behaviors may influence performance, particularly as
rated by the leader, through other variables in addition to motivation.
Hypothesis 8a: Motivation will partially mediate the relationship between initiating
structure and performance.
Hypothesis 8b: Motivation will partially mediate the relationship between consideration
and performance.
37
CHAPTER 2: METHOD
Participants
Participants were recruited from two central Florida companies. Organization 1 is a
branch office of a telecommunications company. This company is preparing to introduce new
products to the market including high speed internet access and high definition television. The
employees at this branch office are preparing for this product expansion by updating databases
with information about customer’s telecommunication infrastructure. When updates to the
infrastructure are needed, employees at this branch office read and interpret work orders and
update this information in customer databases. Organization 2 is a sales and marketing
organization. They promote the Central Florida area as a tourist and convention destination.
Employees at this Organization hold a wide range of positions from sales and marketing to
human resources to accounting.
A priori power analysis suggested that a total of 191 participants were needed for the
study. Study invitations were sent to 287 employees; 215 responded (74.91% response rate).
Supervisors of the 215 respondents were invited to complete the supervisor portion of the study;
195 supervisor surveys were completed resulting in a supervisor response rate of 90.70%. A
total of seven incomplete responses were excluded from the analyses, providing a total of 208
responses maintained in the study.
Of the 208 respondents that were included in the study, 40 were male, 133 were female,
and 35 did not indicate their gender. Age was reported by 164 of the respondents; of those
respondents, the average age was 37.99 years old (SD = 11.16). One hundred and seventy
respondents indicated their race: 98 were Caucasian (57.65%), 29 were African-American
(17.06%), 31 were Hispanic/Latino (18.24%), 7 were Asian &4.12%), and 5 selected the “other”
38
category (2.94%). Tenure with the company was obtained for 163 respondents; of these, the
average tenure with the company was 4.71 years (SD = 6.31). Respondents had been in the
workforce an average of 19.05 years (SD = 11.56).
As noted before, the supervisors of the survey respondents were also invited to participate
in the study by providing performance ratings. Each survey respondent provided the contact
information for the supervisor to which he/she typically reports; thus these dyads represent intact
working relationships. On average, the supervisors in the study provided ratings for 6
subordinates (SD = 6.32). However, that varied widely from as few as one to as many as twenty-
six. Supervisors were from a variety of levels of the organizations from front-line leaders to vice
presidents.
Procedure
All surveys were administered via a secure, online survey software: Survey Monkey with
128 bit SSL encryption. Survey links were e-mailed directly to the respondents from the
researcher’s e-mail address. After completing the survey, respondents were asked to provide
their supervisor’s e-mail address. At that time, the supervisor portion of the survey was
automatically sent to the supervisor. All responses were saved to a secure online database.
Measures
Motivation
Motivation was measured using the MAQ. The development and validation evidence of
the MAQ is outlined in an unpublished document (Pritchard, 2006a) and the developmental
history is summarized in the recent dissertation that used the MAQ (Cornejo, 2007). The
measure was developed to operationalize P-A Theory and as such has five primary scales: A-R,
39
R-E, E-O, O-NS, and Overall Motivation. Each scale is averaged to arrive at a score. Internal
consistency reliability estimates of the scales range from .76 to .89. Two week test-retest
reliability estimates range from .55 to .89.
One change was made to the instrument from the way it is typically administered. This
was done to reduce the length of the scale to maximize response rate. As discussed previously,
under the concept of “evaluations,” P-A Theory includes all types of evaluations (i.e. formal,
informal, and self). Thus, in the survey, the connections dealing with evaluations, the R-E and E-
O Connections, each include three subparts: formal, informal, and self. This results in six scales
for these connections rather than two. Due to survey length constraints, the three types of
evaluations were collapsed to form two scales: one each for the R-E and E-O Connections. As
such, the instructions for these scales were changed to indicate that respondents should consider
all types of evaluations (formal, informal, and self) when making ratings on the R-E and E-O
Connections. Additionally, slight wording changes were made to reflect the changes in
instructions. For instance, rather than asking “If the quantity and quality of my work went up a
lot, my formal evaluations would:” I will ask “If the quantity and quality of my work went up a
lot, the evaluations of my work would:” The MAQ with this change is presented in Appendix C.
Reliability estimates remained sufficiently high in this administration (A-R: α = .78, R-E: α =
.83, E-O: α = .77, ONS: α = .71, and Overall motivation scale, α = .85).
Performance
Performance was assessed using the five item scale previously developed for use with the
MAQ validation. Prior researchers have found this scale to have moderate to high internal
consistency reliability, α = .88 (Cornejo, 2007) and .62 (Botero, 2007). An example item is
“How often does this person perform his/her job effectively?” with response options ranging
40
from “never” to “always.” One of the items in the scale was excluded from the composite in
order to maximize internal consistency. The item was “In how many areas does this person's
performance need to improve?” After the item was reverse-coded, the internal consistency of the
scale was .52 with this item and .90 without it. The complete scale is presented in Appendix D.
Turnover
Turnover was measured as the average of three items developed for research with the
MAQ. These three items create an internally consistent scale (α = .84). An example item is “I
have started to look around for another job.” The complete scale is presented in Appendix F.
Organizational Citizenship Behavior
OCB was measured as the average of five items from one of the most commonly used
OCB scales (Podsakoff, MacKenzie, Moorman, & Fetter, 1990). One item was used from each
of the five dimensions on which the scale was built; items were selected to maximize domain
coverage by selecting items with high factor loadings while also considering conceptual overlap
to the domain. This abbreviated scale demonstrated sufficient internal consistency reliability (α =
.75). The scale is presented in Appendix E.
Leadership
Several measures have been developed to operationalize the constructs of IS&C: The
Leader Behavior Description Questionnaire (LBDQ), Leader Behavior Description
Questionnaire Form XII (LBDQ XII), Leader Opinion Questionnaire (LOQ), and the Supervisor
Behavior Description Questionnaire (SBDQ) (Bass, 1990). This study used the IS&C scales of
the Leader Behavior Description Questionnaire Form XII (Stogdill, 1962). Theoretical
considerations reveal several benefits to this scale as opposed to others. As mentioned
41
previously, one common criticism of the SBDQ is the inclusion of punitive items in the initiating
structure scale; one such example is that the supervisor “needles subordinates for greater effort”
(Bass, 1990, p. 513). House argued that the SBDQ and the LBDQ were not valid instruments to
test Path-Goal Theory and instead preferred the LBDQ XII (House, 1996) because the earlier
scales were inconsistent with the constructs. The LOQ is not appropriate for the current study
because it is not a measure of subordinates’ perceptions of leaders’ behaviors, but is rather
designed to measure leader attitudes towards the behaviors of IS&C (Fleishman, 1973).
In addition to the theoretical considerations, empirical results also support the use of the
LBDQ XII. Bass reported that the internal consistency estimates for the scales were in the .80 to
.90 range. Additionally, meta-analytic results (Judge et al., 2004) indicated that LBDQ Form XII
consideration scale had a large effect size when predicting criteria (p = .54; for the other scales, p
= .51, .34, and .54). The effect size for the initiating structure scale was moderate (p = .32; for
the other scales, p = .37, .40, and .07). The LBDQ Form XII is presented in Appendix G. In this
study, internal consistency was high for both scales (α = .90 for both).
Task ambiguity
Task ambiguity was measured using five items derived from the Rizzo, House, and
Lirtzman (1970) role ambiguity scale, a commonly used measure. Reliability estimates of .78 to
.81 were found in the original validation studies of the scale (Rizzo et al., 1970). Smith, Tisak,
and Schmieder (1993) reviewed the literature surrounding the psychometric properties of the
scale and extended the research using confirmatory factor analysis. They determined that the
scale was psychometrically sound and recommended its continued use. Specifically, they found
that the ambiguity scale was distinct from the role conflict scale, a proposition that had been
questioned in previous literature. Additionally, they found that the scale and item statistics of the
42
measure were acceptable. One conceptual limitation that they noted about the role ambiguity
scale is that it only operationalizes task ambiguity, not socioemotional ambiguity, the other type
of role ambiguity discussed by Kahn and his colleagues. However, given that this study is
interested in task ambiguity that is actually an advantage.
The original scale by Rizzo and colleagues (1970) was altered in two ways. The original
scale was six items. However, I dropped one of the items as recommended in the literature
because of its low factor loading and item reliability (C. S. Smith et al., 1993). The second
change was made in order to reflect the conceptual definition of task ambiguity used in the
current study. Recall from above that I am interested in task ambiguity as the extent to which a
task would be unclear without the input of the leader. For this reason, the following stem was
added to each question: “Without any input or advice from my supervisor…” Additional,
wording of the items were changed slightly to follow the new question stem. For example, an
original item read “I know what my responsibilities are” but the revised item will read “Without
any input or advice from my supervisor I would know what my responsibilities are.” Both the
original and altered wordings are presented in Appendix H. For this sample, internal consistency
was high (α = .94).

43
CHAPTER 3: RESULTS
Overall
Means, standard deviations, reliability estimates, and correlations of study variables are
presented in Table 1. For consistency, all significance values are based on two-tailed tests
unless otherwise noted. As mentioned in the methods section, participants were drawn from two
companies. The number of respondents for the two organizations was very close: n = 101 for
organization 1 and n = 107 for organization 2. Preliminary analyses revealed some important
demographic differences in the two samples. Particularly, respondents from organization 2 were
older (t (162) = -2.56, p = .011), had a higher level of education (t (173) = -4.82, p = .00), and
worked more hours per week (t (173) = -3.88, p = .00) than those at organization 1. Due to
possible differences in the relationship between the study variables for the two samples, each
analysis was conducted three times: once for the full sample, once for organization 1, and once
for organization 2. The means, standard deviations, reliability estimates, and correlations of
study variables are broken down by organization in Tables 2 and 3. A summary of study
hypotheses and findings is presented in Appendix B.
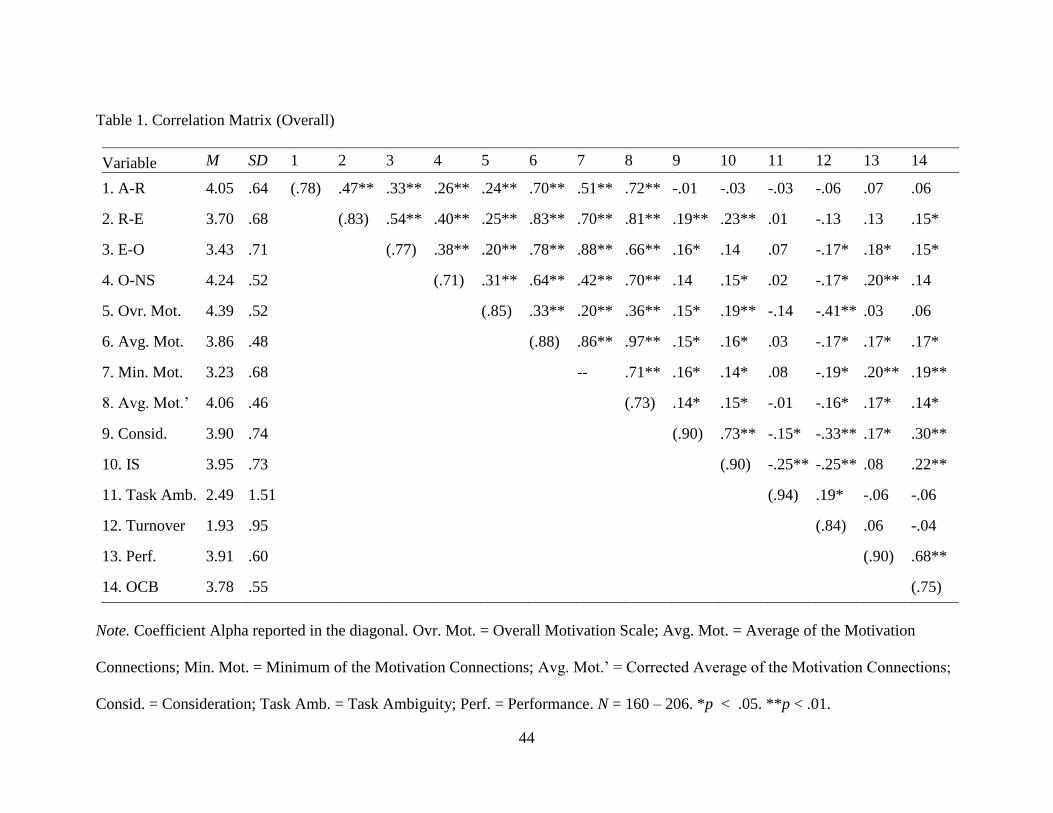
44
Table 1. Correlation Matrix (Overall)
Variable M SD 1 2 3 4 5 6 7 8 9 10 11 12 13 14
1. A-R 4.05 .64 (.78) .47** .33** .26** .24** .70** .51** .72** -.01 -.03 -.03 -.06 .07 .06
2. R-E 3.70 .68 (.83) .54** .40** .25** .83** .70** .81** .19** .23** .01 -.13 .13 .15*
3. E-O 3.43 .71 (.77) .38** .20** .78** .88** .66** .16* .14 .07 -.17* .18* .15*
4. O-NS 4.24 .52 (.71) .31** .64** .42** .70** .14 .15* .02 -.17* .20** .14
5. Ovr. Mot. 4.39 .52 (.85) .33** .20** .36** .15* .19** -.14 -.41** .03 .06
6. Avg. Mot. 3.86 .48 (.88) .86** .97** .15* .16* .03 -.17* .17* .17*
7. Min. Mot. 3.23 .68 -- .71** .16* .14* .08 -.19* .20** .19**
8. Avg. Mot.’ 4.06 .46 (.73) .14* .15* -.01 -.16* .17* .14*
9. Consid. 3.90 .74 (.90) .73** -.15* -.33** .17* .30**
10. IS 3.95 .73 (.90) -.25** -.25** .08 .22**
11. Task Amb. 2.49 1.51 (.94) .19* -.06 -.06
12. Turnover 1.93 .95 (.84) .06 -.04
13. Perf. 3.91 .60 (.90) .68**
14. OCB 3.78 .55 (.75)
Note. Coefficient Alpha reported in the diagonal. Ovr. Mot. = Overall Motivation Scale; Avg. Mot. = Average of the Motivation
Connections; Min. Mot. = Minimum of the Motivation Connections; Avg. Mot.’ = Corrected Average of the Motivation Connections;
Consid. = Consideration; Task Amb. = Task Ambiguity; Perf. = Performance. N = 160 – 206. *p < .05. **p < .01.
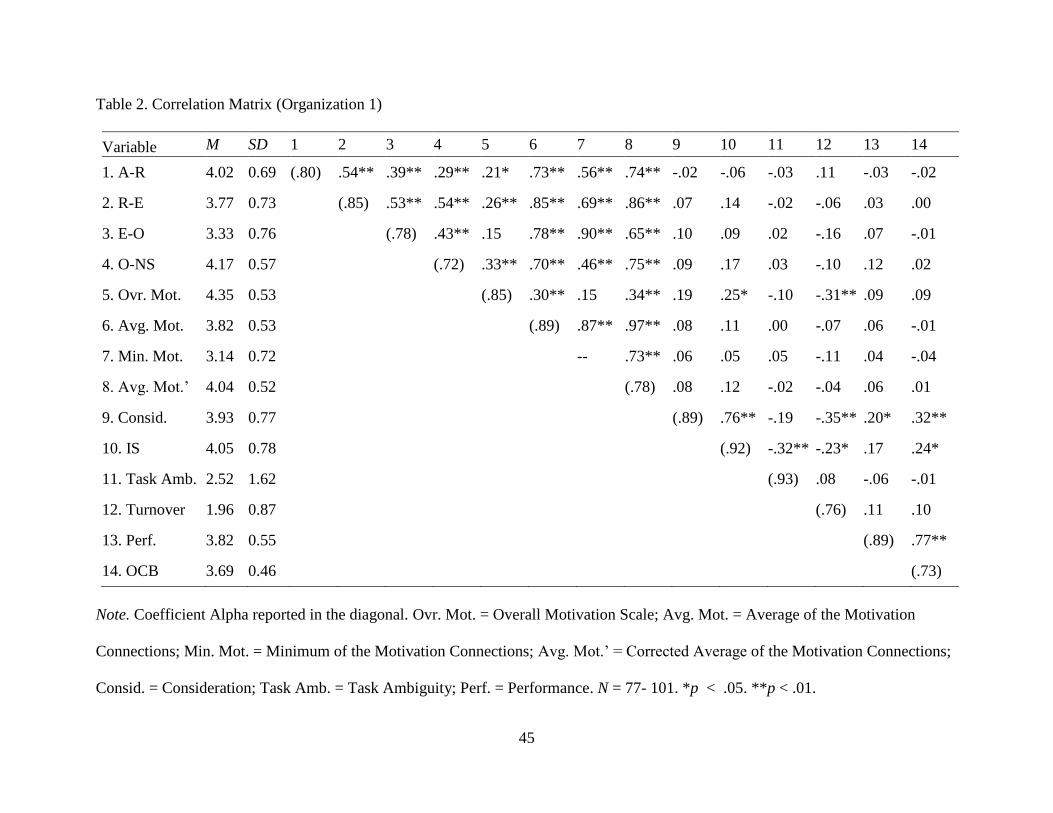
45
Table 2. Correlation Matrix (Organization 1)
Variable M SD 1 2 3 4 5 6 7 8 9 10 11 12 13 14
1. A-R 4.02 0.69 (.80) .54** .39** .29** .21* .73** .56** .74** -.02 -.06 -.03 .11 -.03 -.02
2. R-E 3.77 0.73 (.85) .53** .54** .26** .85** .69** .86** .07 .14 -.02 -.06 .03 .00
3. E-O 3.33 0.76 (.78) .43** .15 .78** .90** .65** .10 .09 .02 -.16 .07 -.01
4. O-NS 4.17 0.57 (.72) .33** .70** .46** .75** .09 .17 .03 -.10 .12 .02
5. Ovr. Mot. 4.35 0.53 (.85) .30** .15 .34** .19 .25* -.10 -.31** .09 .09
6. Avg. Mot. 3.82 0.53 (.89) .87** .97** .08 .11 .00 -.07 .06 -.01
7. Min. Mot. 3.14 0.72 -- .73** .06 .05 .05 -.11 .04 -.04
8. Avg. Mot.’ 4.04 0.52 (.78) .08 .12 -.02 -.04 .06 .01
9. Consid. 3.93 0.77 (.89) .76** -.19 -.35** .20* .32**
10. IS 4.05 0.78 (.92) -.32** -.23* .17 .24*
11. Task Amb. 2.52 1.62 (.93) .08 -.06 -.01
12. Turnover 1.96 0.87 (.76) .11 .10
13. Perf. 3.82 0.55 (.89) .77**
14. OCB 3.69 0.46 (.73)
Note. Coefficient Alpha reported in the diagonal. Ovr. Mot. = Overall Motivation Scale; Avg. Mot. = Average of the Motivation
Connections; Min. Mot. = Minimum of the Motivation Connections; Avg. Mot.’ = Corrected Average of the Motivation Connections;
Consid. = Consideration; Task Amb. = Task Ambiguity; Perf. = Performance. N = 77- 101. *p < .05. **p < .01.
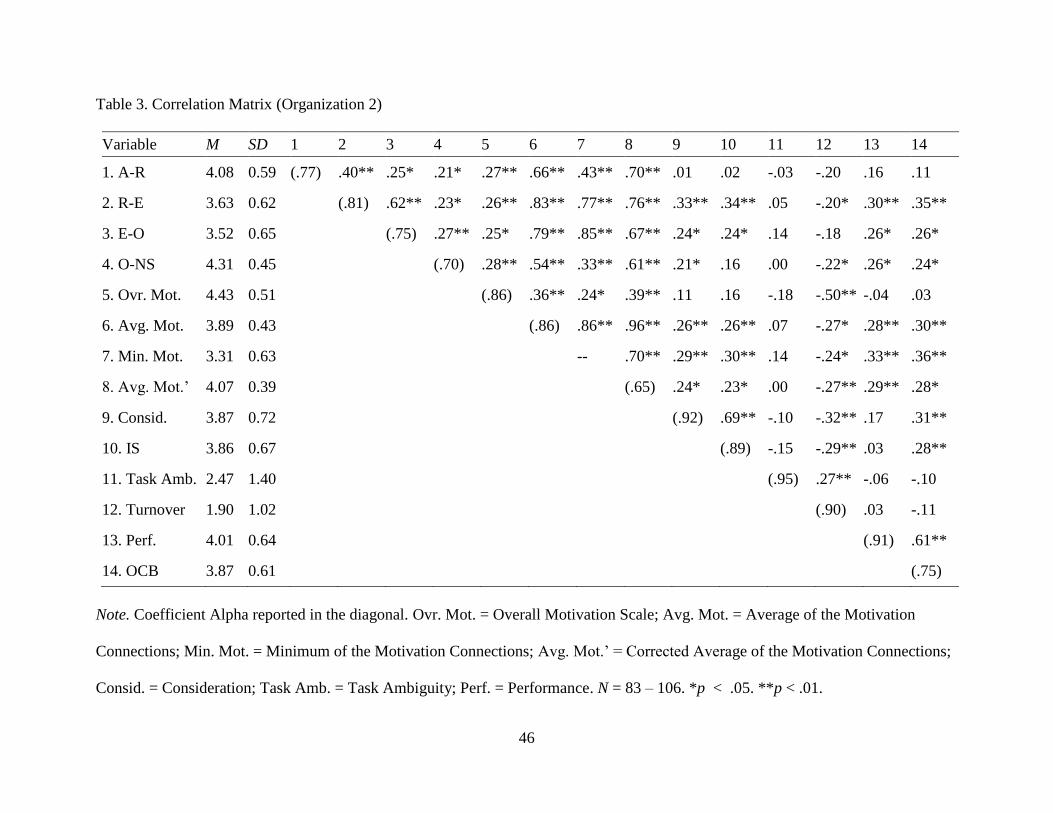
46
Table 3. Correlation Matrix (Organization 2)
Variable M SD 1 2 3 4 5 6 7 8 9 10 11 12 13 14
1. A-R 4.08 0.59 (.77) .40** .25* .21* .27** .66** .43** .70** .01 .02 -.03 -.20 .16 .11
2. R-E 3.63 0.62 (.81) .62** .23* .26** .83** .77** .76** .33** .34** .05 -.20* .30** .35**
3. E-O 3.52 0.65 (.75) .27** .25* .79** .85** .67** .24* .24* .14 -.18 .26* .26*
4. O-NS 4.31 0.45 (.70) .28** .54** .33** .61** .21* .16 .00 -.22* .26* .24*
5. Ovr. Mot. 4.43 0.51 (.86) .36** .24* .39** .11 .16 -.18 -.50** -.04 .03
6. Avg. Mot. 3.89 0.43 (.86) .86** .96** .26** .26** .07 -.27* .28** .30**
7. Min. Mot. 3.31 0.63 -- .70** .29** .30** .14 -.24* .33** .36**
8. Avg. Mot.’ 4.07 0.39 (.65) .24* .23* .00 -.27** .29** .28*
9. Consid. 3.87 0.72 (.92) .69** -.10 -.32** .17 .31**
10. IS 3.86 0.67 (.89) -.15 -.29** .03 .28**
11. Task Amb. 2.47 1.40 (.95) .27** -.06 -.10
12. Turnover 1.90 1.02 (.90) .03 -.11
13. Perf. 4.01 0.64 (.91) .61**
14. OCB 3.87 0.61 (.75)
Note. Coefficient Alpha reported in the diagonal. Ovr. Mot. = Overall Motivation Scale; Avg. Mot. = Average of the Motivation
Connections; Min. Mot. = Minimum of the Motivation Connections; Avg. Mot.’ = Corrected Average of the Motivation Connections;
Consid. = Consideration; Task Amb. = Task Ambiguity; Perf. = Performance. N = 83 – 106. *p < .05. **p < .01.
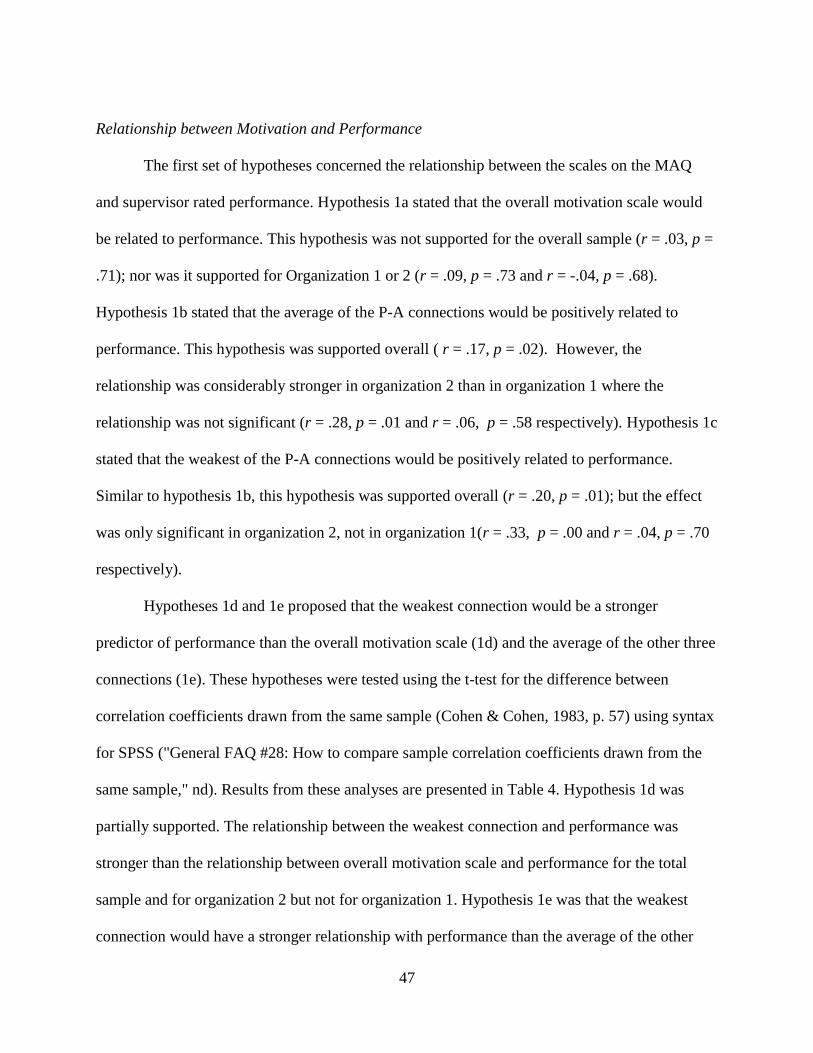
47
Relationship between Motivation and Performance
The first set of hypotheses concerned the relationship between the scales on the MAQ
and supervisor rated performance. Hypothesis 1a stated that the overall motivation scale would
be related to performance. This hypothesis was not supported for the overall sample (r = .03, p =
.71); nor was it supported for Organization 1 or 2 (r = .09, p = .73 and r = -.04, p = .68).
Hypothesis 1b stated that the average of the P-A connections would be positively related to
performance. This hypothesis was supported overall ( r = .17, p = .02). However, the
relationship was considerably stronger in organization 2 than in organization 1 where the
relationship was not significant (r = .28, p = .01 and r = .06, p = .58 respectively). Hypothesis 1c
stated that the weakest of the P-A connections would be positively related to performance.
Similar to hypothesis 1b, this hypothesis was supported overall (r = .20, p = .01); but the effect
was only significant in organization 2, not in organization 1(r = .33, p = .00 and r = .04, p = .70
respectively).
Hypotheses 1d and 1e proposed that the weakest connection would be a stronger
predictor of performance than the overall motivation scale (1d) and the average of the other three
connections (1e). These hypotheses were tested using the t-test for the difference between
correlation coefficients drawn from the same sample (Cohen & Cohen, 1983, p. 57) using syntax
for SPSS ("General FAQ #28: How to compare sample correlation coefficients drawn from the
same sample," nd). Results from these analyses are presented in Table 4. Hypothesis 1d was
partially supported. The relationship between the weakest connection and performance was
stronger than the relationship between overall motivation scale and performance for the total
sample and for organization 2 but not for organization 1. Hypothesis 1e was that the weakest
connection would have a stronger relationship with performance than the average of the other
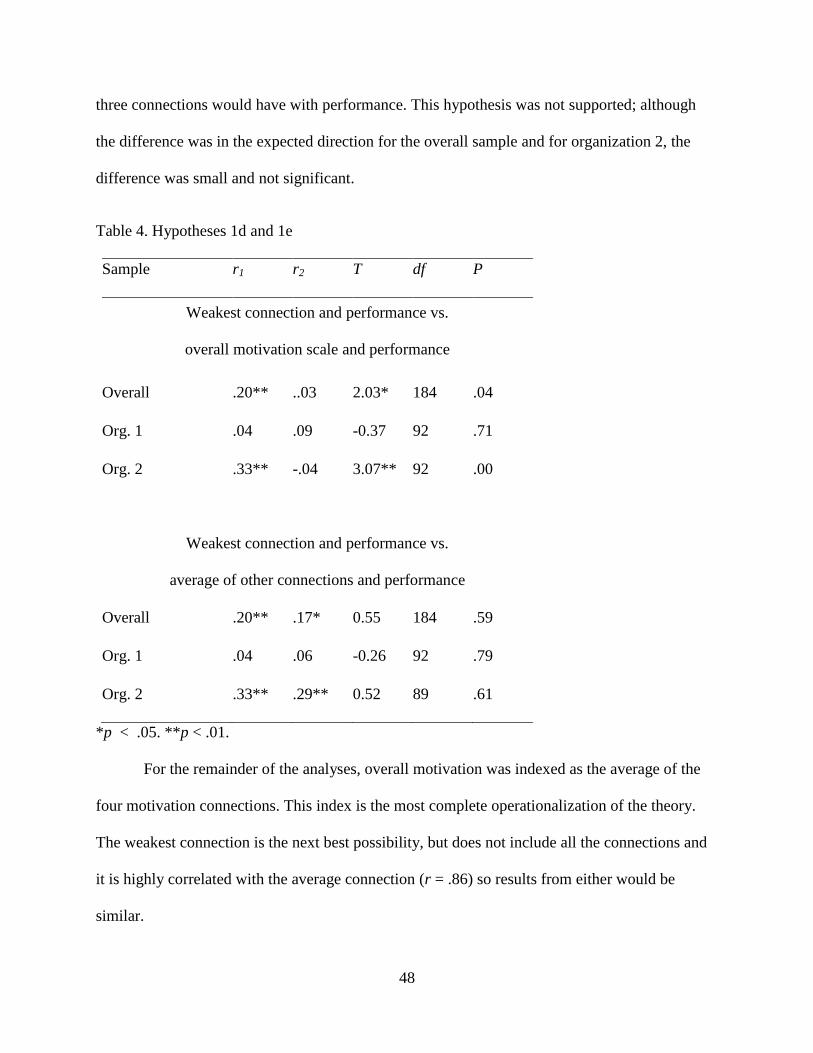
48
three connections would have with performance. This hypothesis was not supported; although
the difference was in the expected direction for the overall sample and for organization 2, the
difference was small and not significant.
Table 4. Hypotheses 1d and 1e
Sample r1 r2 T df P
Weakest connection and performance vs.
overall motivation scale and performance
Overall .20** ..03 2.03* 184 .04
Org. 1 .04 .09 -0.37 92 .71
Org. 2 .33** -.04 3.07** 92 .00
Weakest connection and performance vs.
average of other connections and performance
Overall .20** .17* 0.55 184 .59
Org. 1 .04 .06 -0.26 92 .79
Org. 2 .33** .29** 0.52 89 .61
*p < .05. **p < .01.
For the remainder of the analyses, overall motivation was indexed as the average of the
four motivation connections. This index is the most complete operationalization of the theory.
The weakest connection is the next best possibility, but does not include all the connections and
it is highly correlated with the average connection (r = .86) so results from either would be
similar.
49
Relationship between Motivation and Other Outcomes
The second set of hypotheses dealt with the relationship between motivation and other
employee outcomes: OCB and turnover intentions. Hypotheses 2a and 2d predicted that
motivation would be positively related to OCB and negatively related to turnover intentions
respectively. Both hypotheses were supported in the overall sample (r = .17, p = .02 and r = -.17,
p = .02 respectively). As with the relationships with performance, the relationships between
motivation with OCB and turnover intentions were stronger and significant in organization 2 (r =
.30, p = .00 and r = -27, p = .00 for OCB and turnover intentions respectively) but weaker and
insignificant in organization 1 (r = -.01, p = .95 and r = -.07, p = .53 for OCB and turnover
intentions respectively).
Hypothesis 2b proposed that the A-R connection would be related to performance
stronger than it was related to OCB. This hypothesis was not tested or supported because the A-
R connection was not significantly related to performance or OCB for the total sample or either
of the two subsamples. Hypothesis 2c was that the O-NS connection would be a better predictor
of OCB than performance. This hypothesis was not supported for the overall sample or for
organization 1 or organization 2 separately (see Table 5).
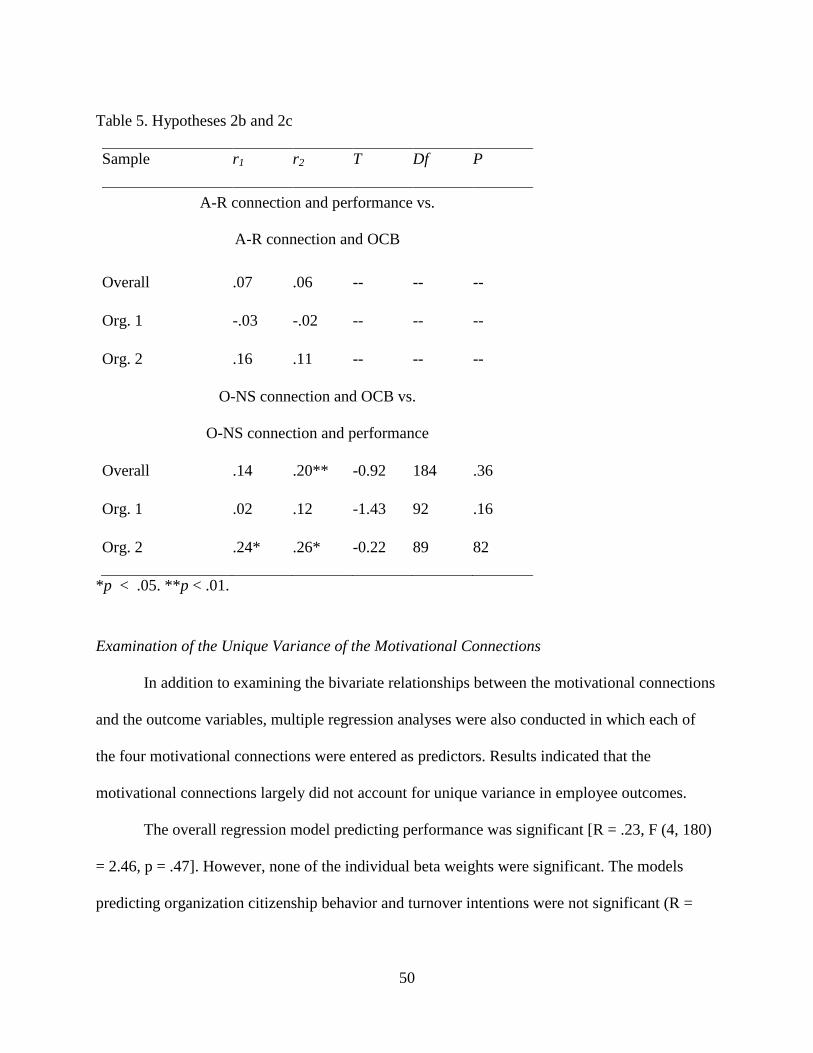
50
Table 5. Hypotheses 2b and 2c
Sample r1 r2 T Df P
A-R connection and performance vs.
A-R connection and OCB
Overall .07 .06 -- -- --
Org. 1 -.03 -.02 -- -- --
Org. 2 .16 .11 -- -- --
O-NS connection and OCB vs.
O-NS connection and performance
Overall .14 .20** -0.92 184 .36
Org. 1 .02 .12 -1.43 92 .16
Org. 2 .24* .26* -0.22 89 82
*p < .05. **p < .01.
Examination of the Unique Variance of the Motivational Connections
In addition to examining the bivariate relationships between the motivational connections
and the outcome variables, multiple regression analyses were also conducted in which each of
the four motivational connections were entered as predictors. Results indicated that the
motivational connections largely did not account for unique variance in employee outcomes.
The overall regression model predicting performance was significant [R = .23, F (4, 180)
= 2.46, p = .47]. However, none of the individual beta weights were significant. The models
predicting organization citizenship behavior and turnover intentions were not significant (R =
51
.18, F (4, 180) = 1.50, p = .21 and R = .20, F (4, 168) = 1.83 p = .13). The pattern of results was
similar for the two companies.
Relationship between IS&C and Performance
Hypotheses 3a and 3b proposed that initiating structure and consideration (respectively)
would be positively related to performance. Hypothesis 3a was not supported for the full sample
(r = .08, p = .28); the relationships were the same for organizations 1 and 2 (r = .17, p = .10 and r
= .03, p = .28 respectively). Hypothesis 3b was supported for the overall sample and organization
1 (r = .17, p = .02 and r = .20, p = .77) but was not supported for organization 2 (r = .17, p =
.11).
Shape and Moderators of the relationship between IS&C and Performance
Hypotheses 4a and 4b concerned the shape of the relationships between IS&C and
performance. Hypothesis 4a was that initiating structure would be positively related to
performance at low and moderate levels of initiating structure, but not at high levels of initiating
structure. To test hypothesis 4a, first a bivariate scatterplot of the relationship between initiating
structure and performance was examined (see Figure 2). Although no curvilinear relationship
was apparent, I next examined the scatterplot of the residual values of performance after the
linear trend in initiating structure was accounted for (see Figure 3) as recommend (Cohen,
Cohen, West, & Aiken, 2003). The shape of the scatterplots is almost identical because the linear
relationship between initiating structure and performance was very small (r = .08). The residual
scatterplot also produced no apparent curvilinear relationship. Thus the hypothesis was not
supported. The finding was confirmed with curve estimation using the regression equation of Y
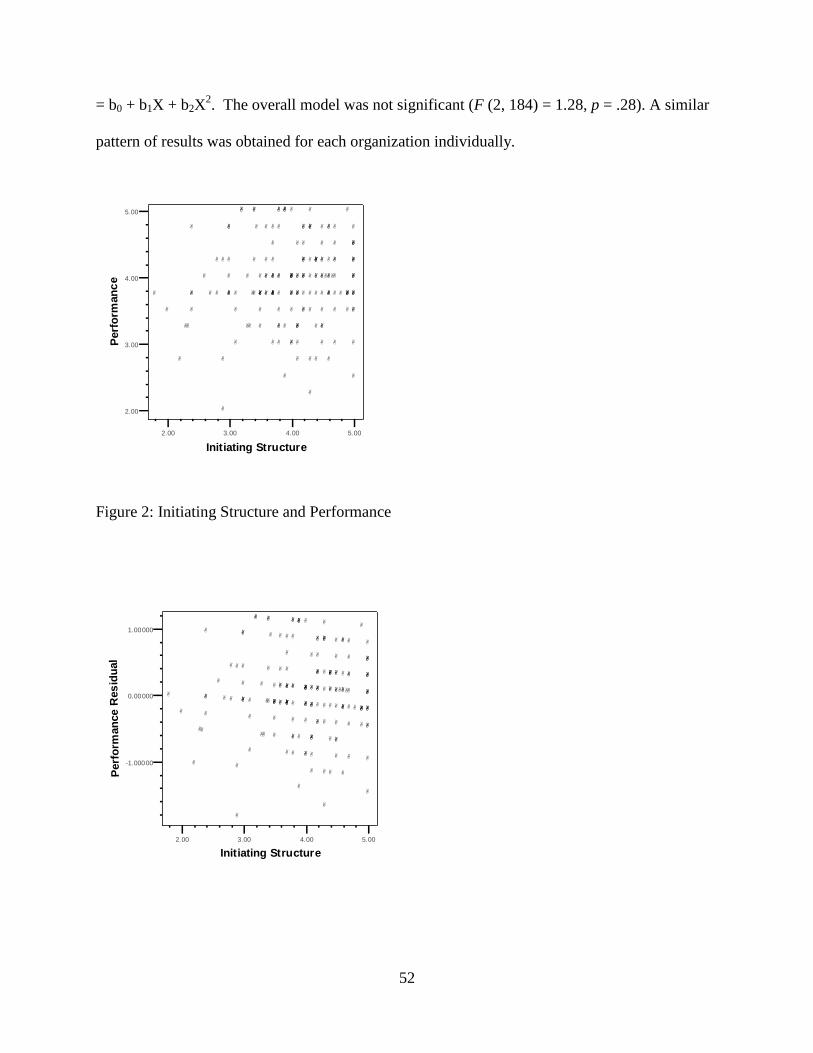
52
= b0 + b1X + b2X2. The overall model was not significant (F (2, 184) = 1.28, p = .28). A similar
pattern of results was obtained for each organization individually.
2.00 3.00 4.00 5.00
Initiating Structure
2.00
3.00
4.00
5.00
Perf
orm
an
ce
Figure 2: Initiating Structure and Performance
2.00 3.00 4.00 5.00
Initiating Structure
-1.00000
0.00000
1.00000
Perf
orm
an
ce
Res
idu
al
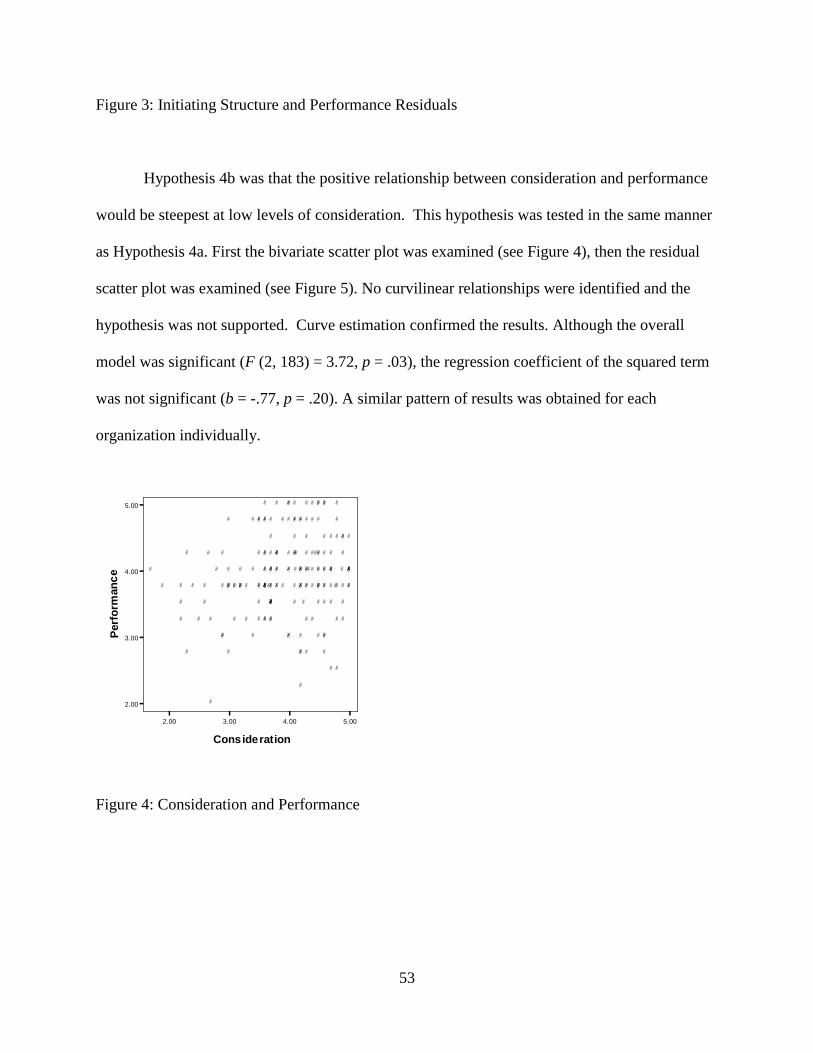
53
Figure 3: Initiating Structure and Performance Residuals
Hypothesis 4b was that the positive relationship between consideration and performance
would be steepest at low levels of consideration. This hypothesis was tested in the same manner
as Hypothesis 4a. First the bivariate scatter plot was examined (see Figure 4), then the residual
scatter plot was examined (see Figure 5). No curvilinear relationships were identified and the
hypothesis was not supported. Curve estimation confirmed the results. Although the overall
model was significant (F (2, 183) = 3.72, p = .03), the regression coefficient of the squared term
was not significant (b = -.77, p = .20). A similar pattern of results was obtained for each
organization individually.
2.00 3.00 4.00 5.00
Consideration
2.00
3.00
4.00
5.00
Perf
orm
an
ce
Figure 4: Consideration and Performance
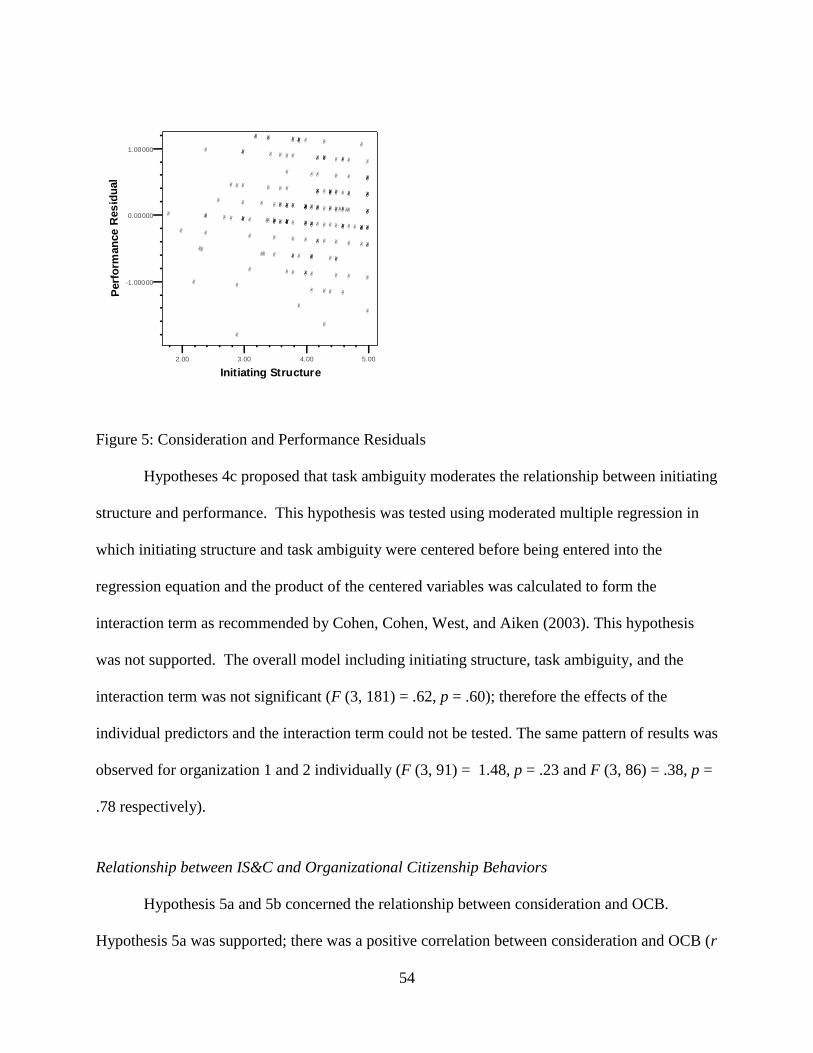
54
2.00 3.00 4.00 5.00
Initiating Structure
-1.00000
0.00000
1.00000
Perf
orm
an
ce
Res
idu
al
Figure 5: Consideration and Performance Residuals
Hypotheses 4c proposed that task ambiguity moderates the relationship between initiating
structure and performance. This hypothesis was tested using moderated multiple regression in
which initiating structure and task ambiguity were centered before being entered into the
regression equation and the product of the centered variables was calculated to form the
interaction term as recommended by Cohen, Cohen, West, and Aiken (2003). This hypothesis
was not supported. The overall model including initiating structure, task ambiguity, and the
interaction term was not significant (F (3, 181) = .62, p = .60); therefore the effects of the
individual predictors and the interaction term could not be tested. The same pattern of results was
observed for organization 1 and 2 individually (F (3, 91) = 1.48, p = .23 and F (3, 86) = .38, p =
.78 respectively).
Relationship between IS&C and Organizational Citizenship Behaviors
Hypothesis 5a and 5b concerned the relationship between consideration and OCB.
Hypothesis 5a was supported; there was a positive correlation between consideration and OCB (r
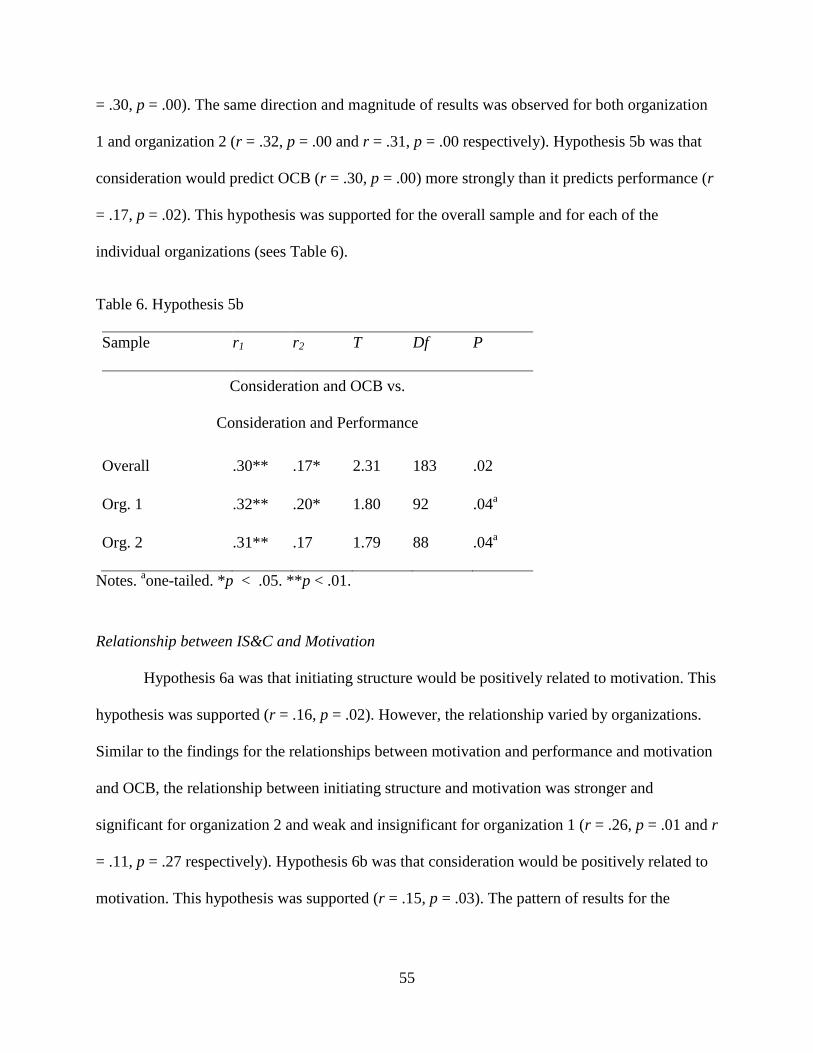
55
= .30, p = .00). The same direction and magnitude of results was observed for both organization
1 and organization 2 (r = .32, p = .00 and r = .31, p = .00 respectively). Hypothesis 5b was that
consideration would predict OCB (r = .30, p = .00) more strongly than it predicts performance (r
= .17, p = .02). This hypothesis was supported for the overall sample and for each of the
individual organizations (sees Table 6).
Table 6. Hypothesis 5b
Sample r1 r2 T Df P
Consideration and OCB vs.
Consideration and Performance
Overall .30** .17* 2.31 183 .02
Org. 1 .32** .20* 1.80 92 .04a
Org. 2 .31** .17 1.79 88 .04a
Notes. aone-tailed. *p < .05. **p < .01.
Relationship between IS&C and Motivation
Hypothesis 6a was that initiating structure would be positively related to motivation. This
hypothesis was supported (r = .16, p = .02). However, the relationship varied by organizations.
Similar to the findings for the relationships between motivation and performance and motivation
and OCB, the relationship between initiating structure and motivation was stronger and
significant for organization 2 and weak and insignificant for organization 1 (r = .26, p = .01 and r
= .11, p = .27 respectively). Hypothesis 6b was that consideration would be positively related to
motivation. This hypothesis was supported (r = .15, p = .03). The pattern of results for the
56
organizations individually again showed a stronger relationship for organization 2 and a weak,
insignificant relationship for organization 1 (r = .26, p = .01 and r = .08, p = .40 respectively).
Hypotheses 7a-d concerned the relationships between initiating structure and the P-A
Connections. These findings are summarized in Table 7. Hypothesis 7a was not supported. The
relationship between initiating structure and the A-R connection was not significant (r = -.03, p =
.69); the same result was found for both of the organizations (r = -.06, p = .57 and r = .02, p =
.83). Hypothesis 7b was that the correlation between the A-R connection and initiating structure
would be stronger than the correlation between the A-R connection and consideration. Because
the A-R connection was not significantly related to either initiating structure or consideration,
this hypothesis could not be tested.
Hypothesis 7c was that initiating structure would be positively related to the R-E
Connection. This hypothesis was supported; the correlation between initiating structure and the
R-E Connection was significant (r = .23, p = .00). Consistent with other results, this relationship
was found only in organization 2 (r = .34, p = .00) but not in organization 1 (r = .14, p = .17).
Hypothesis 7d was that initiating structure would have a stronger effect on the R-E Connection
than would consideration. Although the difference in correlation coefficients was in the expected
direction, this hypothesis was not significant because the difference was not significant; the same
pattern of results was observed for each organization (see Table 7)
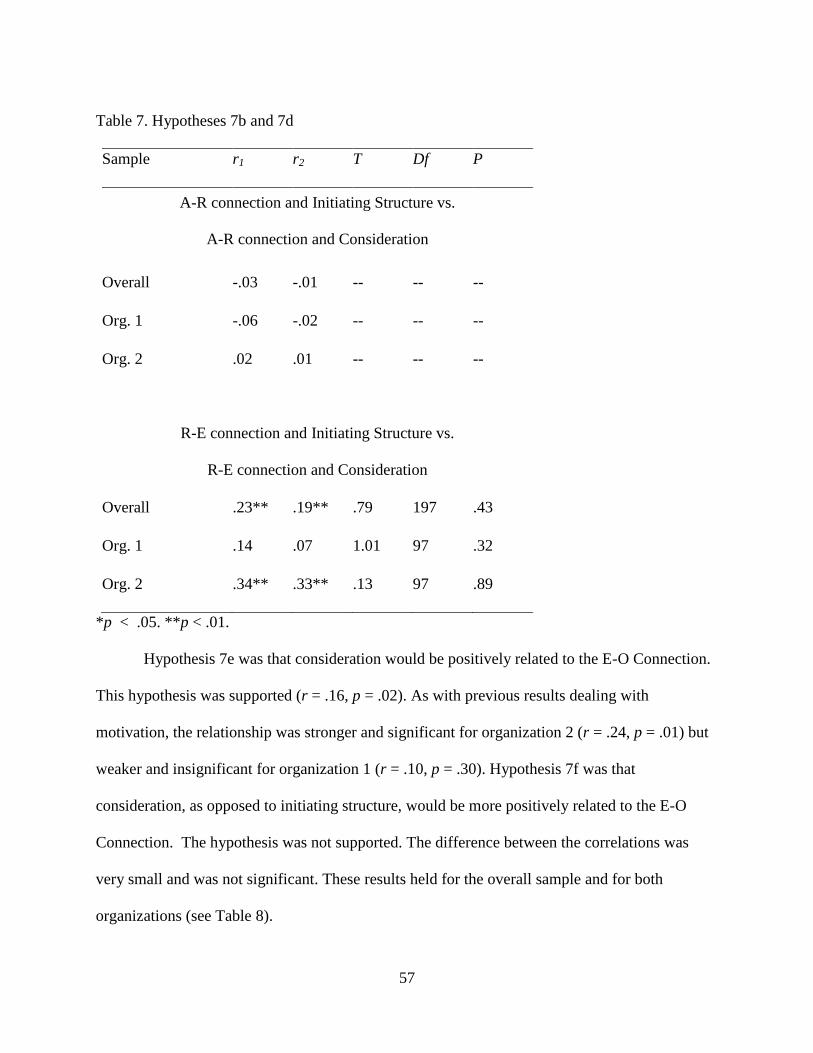
57
Table 7. Hypotheses 7b and 7d
Sample r1 r2 T Df P
A-R connection and Initiating Structure vs.
A-R connection and Consideration
Overall -.03 -.01 -- -- --
Org. 1 -.06 -.02 -- -- --
Org. 2 .02 .01 -- -- --
R-E connection and Initiating Structure vs.
R-E connection and Consideration
Overall .23** .19** .79 197 .43
Org. 1 .14 .07 1.01 97 .32
Org. 2 .34** .33** .13 97 .89
*p < .05. **p < .01.
Hypothesis 7e was that consideration would be positively related to the E-O Connection.
This hypothesis was supported (r = .16, p = .02). As with previous results dealing with
motivation, the relationship was stronger and significant for organization 2 (r = .24, p = .01) but
weaker and insignificant for organization 1 (r = .10, p = .30). Hypothesis 7f was that
consideration, as opposed to initiating structure, would be more positively related to the E-O
Connection. The hypothesis was not supported. The difference between the correlations was
very small and was not significant. These results held for the overall sample and for both
organizations (see Table 8).
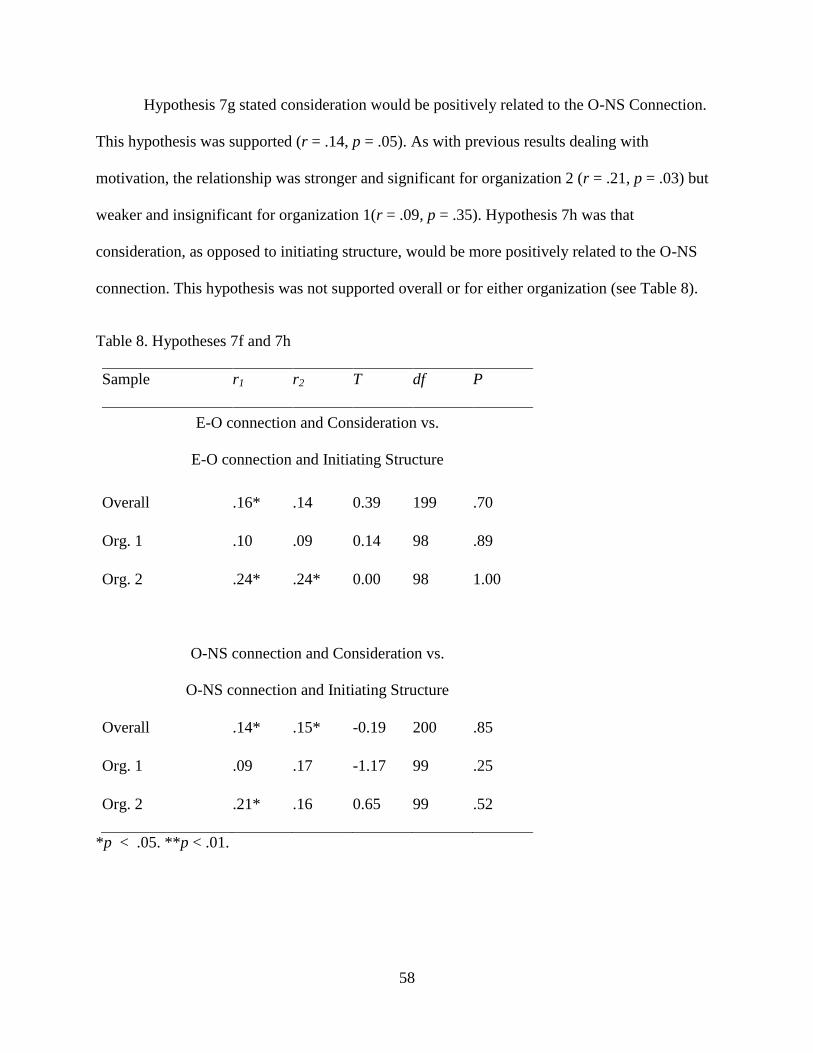
58
Hypothesis 7g stated consideration would be positively related to the O-NS Connection.
This hypothesis was supported (r = .14, p = .05). As with previous results dealing with
motivation, the relationship was stronger and significant for organization 2 (r = .21, p = .03) but
weaker and insignificant for organization 1(r = .09, p = .35). Hypothesis 7h was that
consideration, as opposed to initiating structure, would be more positively related to the O-NS
connection. This hypothesis was not supported overall or for either organization (see Table 8).
Table 8. Hypotheses 7f and 7h
Sample r1 r2 T df P
E-O connection and Consideration vs.
E-O connection and Initiating Structure
Overall .16* .14 0.39 199 .70
Org. 1 .10 .09 0.14 98 .89
Org. 2 .24* .24* 0.00 98 1.00
O-NS connection and Consideration vs.
O-NS connection and Initiating Structure
Overall .14* .15* -0.19 200 .85
Org. 1 .09 .17 -1.17 99 .25
Org. 2 .21* .16 0.65 99 .52
*p < .05. **p < .01.
59
Mediation Model
Hypotheses 8a and 8b proposed that motivation mediated the relationship between
initiating structure and performance and consideration and performance respectively. These
hypotheses were tested using the Baron and Kenny method of mediation analysis (1986). This
method states that in order to demonstrate mediation you have to fulfill three requirements: The
independent variable (initiating structure or consideration) must be related to the mediator
(motivation) (Condition 1). The independent variable (initiating structure or consideration) must
be related to the dependent variable (performance) (Condition 2). When the independent variable
(initiating structure or consideration) and the mediator (motivation) are both entered, the effect of
the independent variable on the dependent variable must be smaller than in the previous step
(Condition 3). Based on this approach, hypothesis 8a could not be tested because condition two
of the Baron and Kenny method was not met: as discussed in Hypothesis 3a initiating structure
was not related to performance.
Hypothesis 8b was that motivation would partially mediate the relationship between
consideration and performance. This hypothesis was supported. Consideration was related to
motivation (Condition 1; F (1, 202) = 4.97, p = .02). Consideration was related to performance
(Condition 2; F (1, 184) = 5.78, p = .02). And when consideration and motivation were entered
simultaneously, the effect of consideration on performance (β = .15) was smaller than when
consideration alone predicted performance (β = .18) (Condition 3). Because the effect of
consideration remained significant in the final regression equation (β = .15, t = 1.99, p = .048),
motivation partially mediated the relationship between consideration and performance.
60
CHAPTER 4: DISCUSSION
Before getting to the substantive findings for the hypotheses, it is important to deal with
the issue of different findings in the two organizations.
Differential Relationships between Organization
One of the more intriguing findings in this study was the unexpected differential
relationships between the study variables in organization 1 versus organization 2. In almost every
case, hypothesized relationships were stronger in organization 2 than they were in organization
1. Several possible explanations for this finding were explored and presented. The first set of
explanations deals with statistical artifacts of the data: reliability, variance, and range restriction.
The second set of explanations discusses mean differences between the organizations in terms of
study variables and demographics.
Statistical Explanations
Given the nearly uniform lower correlations in hypothesized relationships for
organization 1, I first examined statistical artifacts that could be attenuating true relationships.
Reliability is one such factor; thus internal consistency reliability estimates were calculated for
each sample separately for all major study variables. However, as can be seen in Table 9, the
estimates for organization 1 and organization 2 are largely similar and are sufficiently high for
all variables in both organizations. Another possible factor that can obscure relationships is
limited variability in the predictor or the criterion. Therefore, the standard deviation of each
study variable was computed for both samples. As can be seen in Table 9, the standard
deviations for the variables are similar across organizations, and in cases where there is a
difference, organization 1 tends to have a larger standard deviation. The exception to that
61
observation is the criteria variables; this issue will be discussed in the next section. A third
possible statistical factor that could reduce correlations is range restriction. However, as can be
seen in Table 9, the minimums and maximums for each variable are similar across both
organizations. Again, an exception to this is with the criteria variables which are discussed in the
next section.
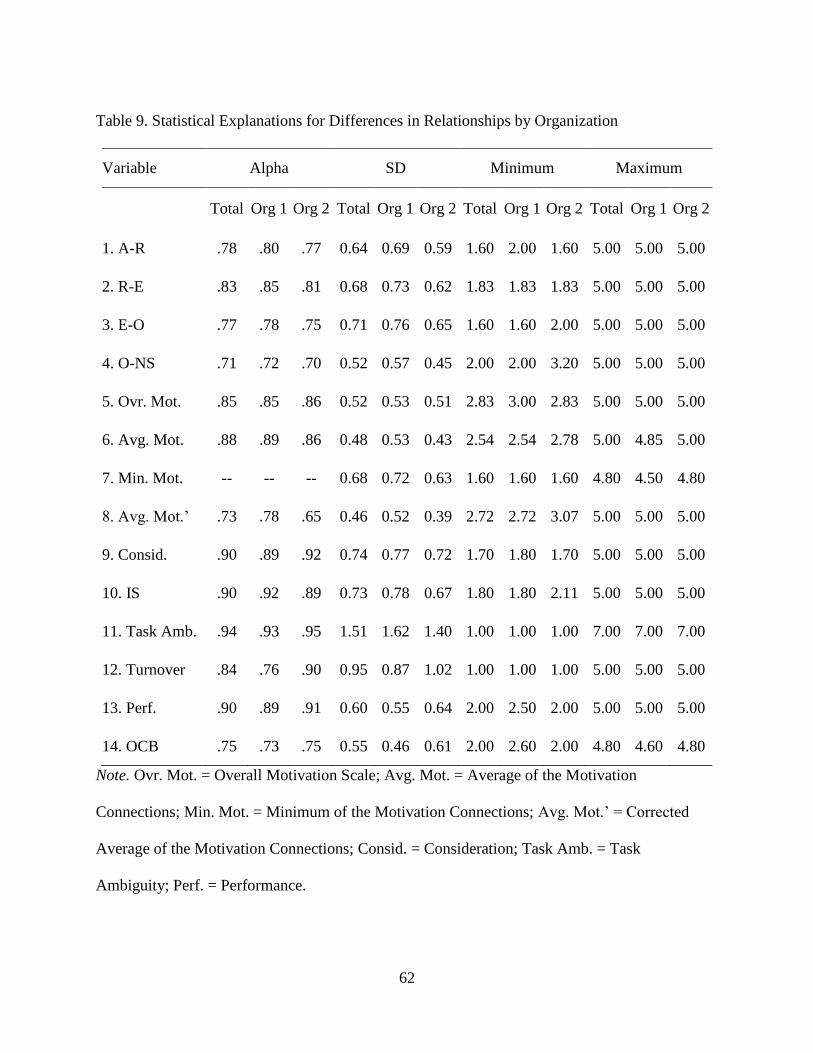
62
Table 9. Statistical Explanations for Differences in Relationships by Organization
Variable Alpha SD Minimum Maximum
Total Org 1 Org 2 Total Org 1 Org 2 Total Org 1 Org 2 Total Org 1 Org 2
1. A-R .78 .80 .77 0.64 0.69 0.59 1.60 2.00 1.60 5.00 5.00 5.00
2. R-E .83 .85 .81 0.68 0.73 0.62 1.83 1.83 1.83 5.00 5.00 5.00
3. E-O .77 .78 .75 0.71 0.76 0.65 1.60 1.60 2.00 5.00 5.00 5.00
4. O-NS .71 .72 .70 0.52 0.57 0.45 2.00 2.00 3.20 5.00 5.00 5.00
5. Ovr. Mot. .85 .85 .86 0.52 0.53 0.51 2.83 3.00 2.83 5.00 5.00 5.00
6. Avg. Mot. .88 .89 .86 0.48 0.53 0.43 2.54 2.54 2.78 5.00 4.85 5.00
7. Min. Mot. -- -- -- 0.68 0.72 0.63 1.60 1.60 1.60 4.80 4.50 4.80
8. Avg. Mot.’ .73 .78 .65 0.46 0.52 0.39 2.72 2.72 3.07 5.00 5.00 5.00
9. Consid. .90 .89 .92 0.74 0.77 0.72 1.70 1.80 1.70 5.00 5.00 5.00
10. IS .90 .92 .89 0.73 0.78 0.67 1.80 1.80 2.11 5.00 5.00 5.00
11. Task Amb. .94 .93 .95 1.51 1.62 1.40 1.00 1.00 1.00 7.00 7.00 7.00
12. Turnover .84 .76 .90 0.95 0.87 1.02 1.00 1.00 1.00 5.00 5.00 5.00
13. Perf. .90 .89 .91 0.60 0.55 0.64 2.00 2.50 2.00 5.00 5.00 5.00
14. OCB .75 .73 .75 0.55 0.46 0.61 2.00 2.60 2.00 4.80 4.60 4.80
Note. Ovr. Mot. = Overall Motivation Scale; Avg. Mot. = Average of the Motivation
Connections; Min. Mot. = Minimum of the Motivation Connections; Avg. Mot.’ = Corrected
Average of the Motivation Connections; Consid. = Consideration; Task Amb. = Task
Ambiguity; Perf. = Performance.
63
Substantive Differences between the Organizations
Given the similarity of the statistics presented for each organization in Table 9, it seems
unlikely that statistical artifacts alone are causing the differential observed relationships. Thus I
examined possible differences between the two organizations that could be creating these
differential relationships. These relationships are shown in Table 10. As can be seen, several of
the relationships are significant. Organization 2 reported higher E-R and O-NS Connections. The
supervisors at Organization 2 were rated lower in initiating structure. Employees at Organization
2 were older, had more education, and worked more hours per week than those at Organization
1; they were also rated higher on performance on OCB than employees at Organization 1.
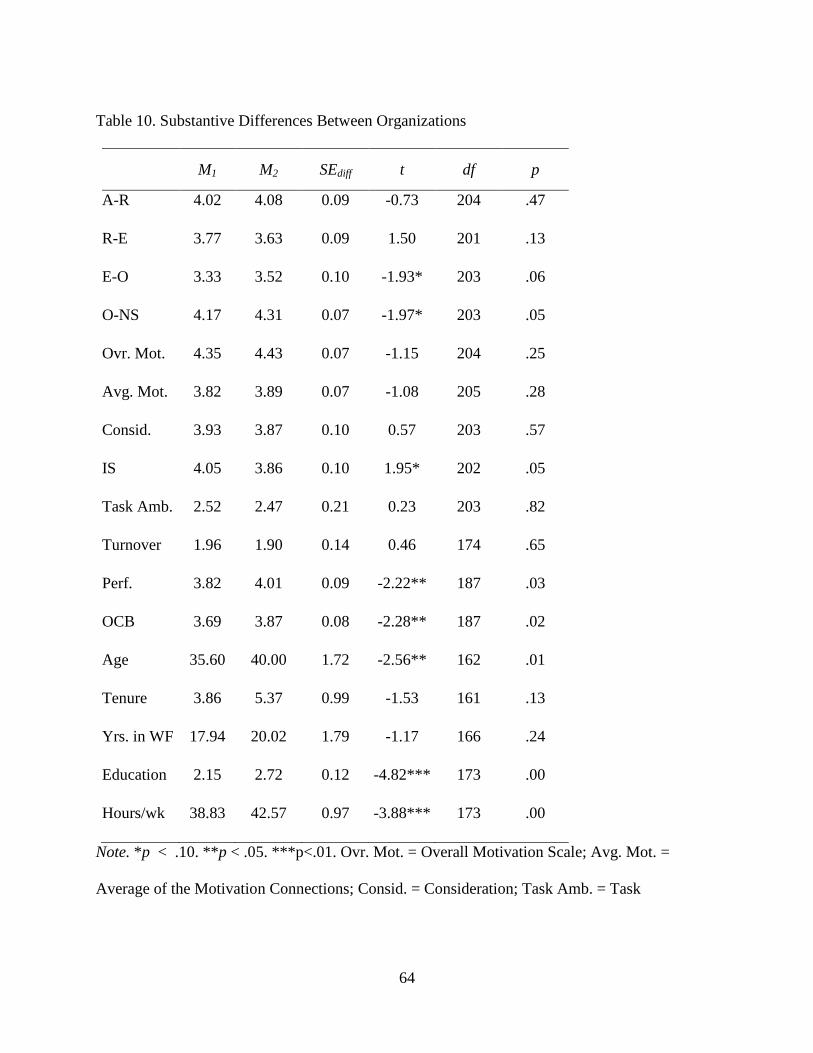
64
Table 10. Substantive Differences Between Organizations
M1 M2 SEdiff t df p
A-R 4.02 4.08 0.09 -0.73 204 .47
R-E 3.77 3.63 0.09 1.50 201 .13
E-O 3.33 3.52 0.10 -1.93* 203 .06
O-NS 4.17 4.31 0.07 -1.97* 203 .05
Ovr. Mot. 4.35 4.43 0.07 -1.15 204 .25
Avg. Mot. 3.82 3.89 0.07 -1.08 205 .28
Consid. 3.93 3.87 0.10 0.57 203 .57
IS 4.05 3.86 0.10 1.95* 202 .05
Task Amb. 2.52 2.47 0.21 0.23 203 .82
Turnover 1.96 1.90 0.14 0.46 174 .65
Perf. 3.82 4.01 0.09 -2.22** 187 .03
OCB 3.69 3.87 0.08 -2.28** 187 .02
Age 35.60 40.00 1.72 -2.56** 162 .01
Tenure 3.86 5.37 0.99 -1.53 161 .13
Yrs. in WF 17.94 20.02 1.79 -1.17 166 .24
Education 2.15 2.72 0.12 -4.82*** 173 .00
Hours/wk 38.83 42.57 0.97 -3.88*** 173 .00
Note. *p < .10. **p < .05. ***p<.01. Ovr. Mot. = Overall Motivation Scale; Avg. Mot. =
Average of the Motivation Connections; Consid. = Consideration; Task Amb. = Task
65
Ambiguity; Perf. = Performance; Yrs. in WF = Number of Years in the Workforce; Hours/wk. =
Number of Hours Worked Per Week.
In addition to the relationships observed in the data, I obtained qualitative information
from the leaders of the organizations about an additional difference between the companies that
could affect the outcomes. Employees at Organization 1 are in term limited positions. They were
hired to work at a temporary site that will likely close in two years. Thus on average those
employees have not been with the company as long as employees in Organization 2. This should
be reflected in the correlation between organization and tenure but it is not due to a shortcoming
in the research design. Responses to the item “how many years have you worked for the
organization” could only be entered in whole numbers. This was problematic for those who had
been at the company for less than a year as evidenced by the fact that 29 individuals at
Organization 1 skipped that item as compared to the 16 who skipped the item at Organization 2.
Further, several employees at Organization 1 had previously worked for the organization in a
different capacity before accepting this temporary position. These two factors prevent the
difference in tenure from being reflected in the data. In actuality, of the employees at
Organization 1 to whom the survey was sent, the average tenure in their current capacity was six
months (M = 185 days). All employees that were invited to participate in the study had been with
the company for at least one and a half months.
To put all of the information together, the workforce at Organization 1 has lower E-O and
O-NS Connections, is younger and less educated, work in temporary positions, have more
oversight in terms of initiating structure, work less per week, have been in their roles for a
shorter period of time, do not have long term commitment to/from the organization, and have
lower levels of performance and OCB.
66
Lower performance and OCB of temporary staff has been observed in literature
(Moorman & Harland, 2002). Further, it is not surprising from a psychological contract
perspective (Rousseau, 1995). However, the reason for the lack of relationship between
motivation and supervisor’s initiating structure and performance is not as clear. One possible
reason is that temporary workers may require a different type of leadership than traditional
workers. For example, Liu, Lepak, Takeuchi, and Sims (2003) proposed that a directive
leadership style is more appropriate for contract workers because the performance requirements
tend to be well specified and contract workers are less involved in the organization. This idea is
reflected in the current data. The relationship between initiating structure and performance was
stronger in the organization comprised of temporary workers (r = .17 versus .03). Another
possible reason for this is that at Organization 1 many of the job outcomes that people are
motivated towards (e.g. promotions, raises, and bonuses) are not applicable and thus retaining
one’s position is the primary external motivator. That combined with the possibility that the
work is less demanding (as evidenced by less educated workforce and fewer hours worked per
week) may produce a situation in which motivation would not be related to performance because
everyone who is retained with the organization is doing sufficiently well regardless of their level
on the motivation connections. If this were the case, one would expect to see a lower overall
level of performance, limited variability in the performance criteria, and a higher level of
minimum performance. In fact, Organization 1 does have a lower mean level of performance
(3.82 versus 4.01), lower standard deviation for performance (.55 versus .64) and a higher level
of minimum performance (2.50 compared to 2.00).
Similarly, this would explain the smaller relationships between leader behavior and the
average motivation connections. If the process is straightforward and well established, leaders
67
are limited in the outcomes they can offer employees, and many of the outcomes typically valued
by employees are not available, then there may be less a leader can do to influence the P-A
connections.
Strong Correlation between IS&C
The correlation between IS&C was much stronger than expected. The recent IS&C meta-
analysis found IS&C to be correlated at r = .14; the correlation using the LBDQ XII measure as
was used in this study was higher (r = .46) (Judge et al., 2004). However, both estimates are
considerably lower than the observed correlation in the current study (r = .73). The questions
about supervisor behavior were near the end of the survey; perhaps respondent fatigue
contributed to rating error. Hypotheses 7b, 7d, 7f, and 7h proposed differential relationships
between IS&C and the motivational connections. It is possible that these hypotheses could have
been supported if respondents had differentiated more between IS&C.
To explore this possibility, I conducted a post hoc analysis in which I reexamined the
pattern of correlations for only those individuals who differentiated between IS&C. First, for
each respondent I calculated difference scores as the absolute value of initiating structure minus
consideration. The mean difference between IS&C was .43 (SD = .33) on a five point scale. The
histogram in Figure 6 presents the distribution of difference scores. The difference scores were
not correlated with any of the demographic variables measured in the study nor did the two
organizations differ by difference score.
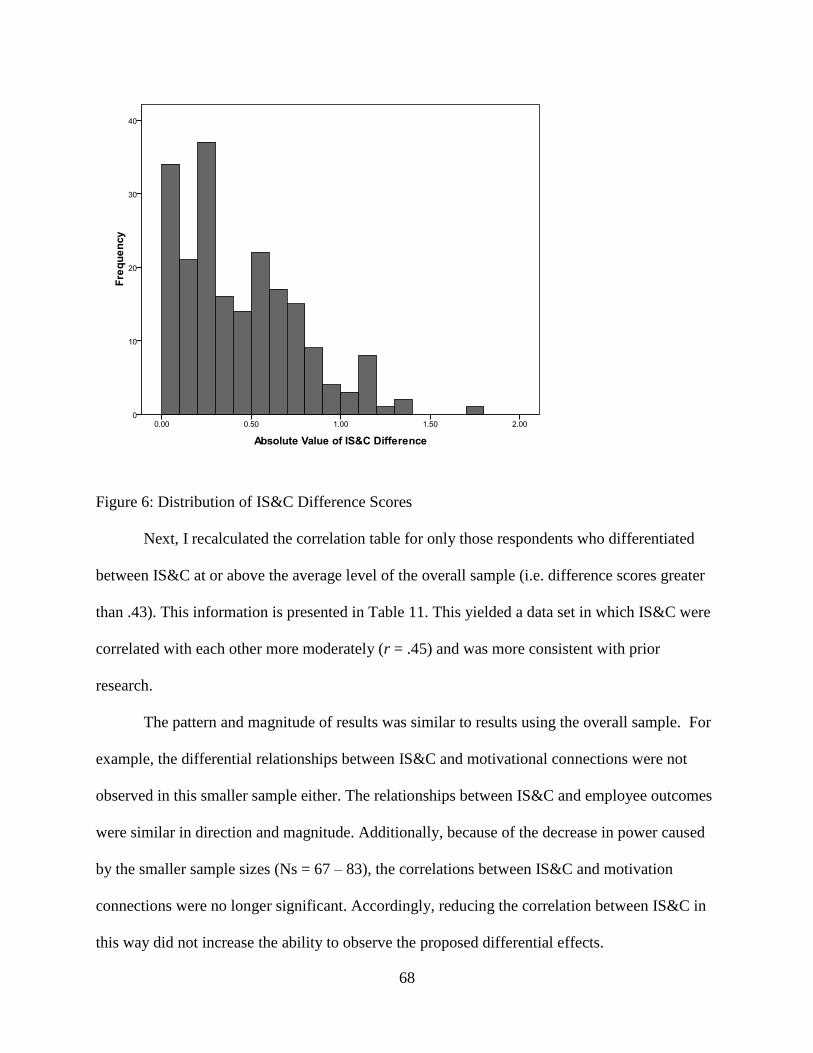
68
Figure 6: Distribution of IS&C Difference Scores
Next, I recalculated the correlation table for only those respondents who differentiated
between IS&C at or above the average level of the overall sample (i.e. difference scores greater
than .43). This information is presented in Table 11. This yielded a data set in which IS&C were
correlated with each other more moderately (r = .45) and was more consistent with prior
research.
The pattern and magnitude of results was similar to results using the overall sample. For
example, the differential relationships between IS&C and motivational connections were not
observed in this smaller sample either. The relationships between IS&C and employee outcomes
were similar in direction and magnitude. Additionally, because of the decrease in power caused
by the smaller sample sizes (Ns = 67 – 83), the correlations between IS&C and motivation
connections were no longer significant. Accordingly, reducing the correlation between IS&C in
this way did not increase the ability to observe the proposed differential effects.
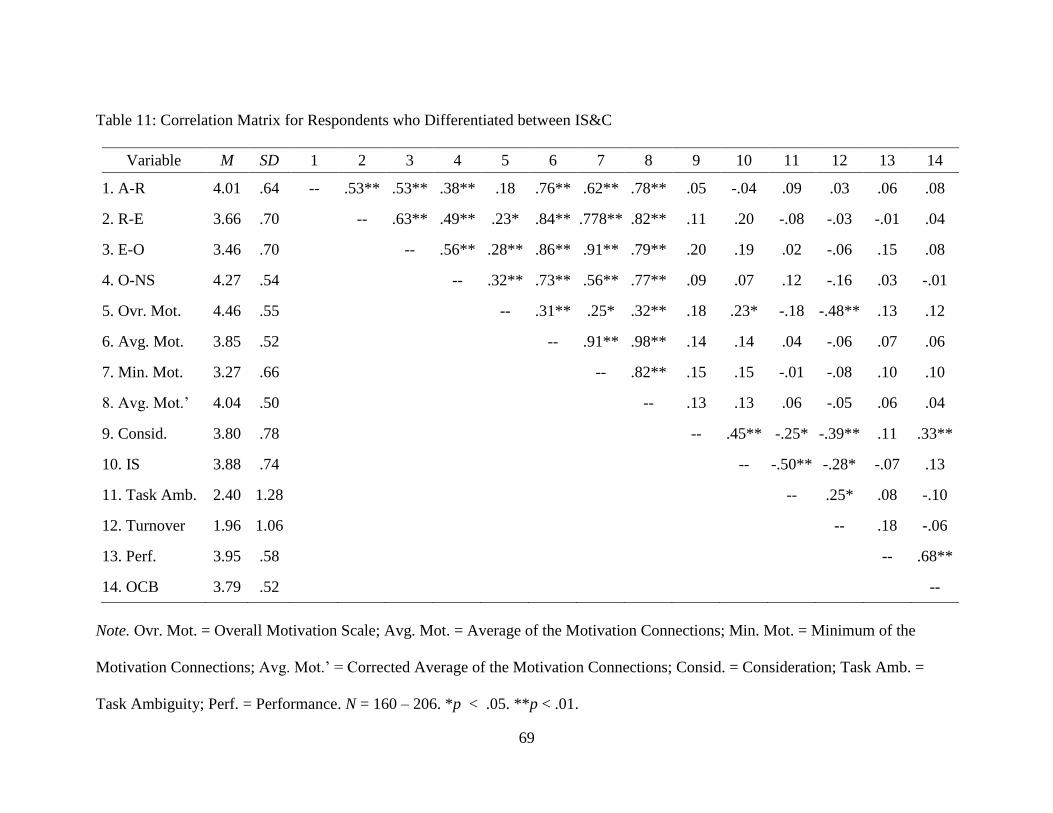
69
Table 11: Correlation Matrix for Respondents who Differentiated between IS&C
Variable M SD 1 2 3 4 5 6 7 8 9 10 11 12 13 14
1. A-R 4.01 .64 -- .53** .53** .38** .18 .76** .62** .78** .05 -.04 .09 .03 .06 .08
2. R-E 3.66 .70 -- .63** .49** .23* .84** .778** .82** .11 .20 -.08 -.03 -.01 .04
3. E-O 3.46 .70 -- .56** .28** .86** .91** .79** .20 .19 .02 -.06 .15 .08
4. O-NS 4.27 .54 -- .32** .73** .56** .77** .09 .07 .12 -.16 .03 -.01
5. Ovr. Mot. 4.46 .55 -- .31** .25* .32** .18 .23* -.18 -.48** .13 .12
6. Avg. Mot. 3.85 .52 -- .91** .98** .14 .14 .04 -.06 .07 .06
7. Min. Mot. 3.27 .66 -- .82** .15 .15 -.01 -.08 .10 .10
8. Avg. Mot.’ 4.04 .50 -- .13 .13 .06 -.05 .06 .04
9. Consid. 3.80 .78 -- .45** -.25* -.39** .11 .33**
10. IS 3.88 .74 -- -.50** -.28* -.07 .13
11. Task Amb. 2.40 1.28 -- .25* .08 -.10
12. Turnover 1.96 1.06 -- .18 -.06
13. Perf. 3.95 .58 -- .68**
14. OCB 3.79 .52 --
Note. Ovr. Mot. = Overall Motivation Scale; Avg. Mot. = Average of the Motivation Connections; Min. Mot. = Minimum of the
Motivation Connections; Avg. Mot.’ = Corrected Average of the Motivation Connections; Consid. = Consideration; Task Amb. =
Task Ambiguity; Perf. = Performance. N = 160 – 206. *p < .05. **p < .01.
70
Summary of Findings and Contributions
In all cases except one, the results were the same in the Overall Sample and in
Organization 2 in terms of significance; they varied only in magnitude of result. In this section, I
will discuss the findings in the Overall Sample and in Organization 2. Discussion of findings for
Organization 1 is excluded given the differences between the organizations described above and
the general lack of findings for Organization 1.
Relationship between Motivation and Performance
In general, motivation predicted performance as expected by the motivation literature
(Kanfer, 1992; Kanfer et al., 2008; Latham & Pinder, 2005; Mitchell & Daniels, 2003; Pritchard
& Ashwood, 2008). The relationship between motivation and performance was observed when
motivation was indexed as an average of the Pritchard-Ashwood Connections and the weakest of
the Connections. While not hypothesized, with the exception of the A-R Connection, the
individual connections were also related to performance. Surprisingly, the overall motivation
scale was not related to performance. In hindsight, this may be because the overall motivation
scale is primarily an index of effort or intensity. Overall motivation consists of intensity,
direction, and persistence (Kanfer et al., 2008). Previous studies found a significant, moderate
relationship between the overall motivation (intensity) and performance (Botero, 2007; Cornejo,
2007). One of the purposes of the study was to attempt to replicate that finding with a non-
student, full time employee sample. Perhaps students are employed on average in more menial,
simple positions in which working harder (intensity) is a better predictor of performance.
Perhaps for the positions under study, it is not intensity that affects performance but rather
direction or persistence.
71
In terms of how to index overall motivation so as to best predict performance, the overall
scale, the weakest connection, and the average connection were tested. As stated in the previous
paragraph, the overall scale did not predict performance. Thus the weakest connection and the
average connection were clearly superior for this purpose. The weakest connection predicted
performance better than the average connection, though not significantly. Even when the average
was corrected by removing the weakest connection and averaging the other three, the difference
between the corrected average and weakest connection remained insignificant.
One reason that the weakest connection was not a better predictor of performance was
that it was comprised of fewer items than the average of all of the items and therefore one would
expect a lower reliability. Indeed, that was the case with this data; coefficient alpha was .88 for a
scale of all of the items while the average coefficient alpha for any of the subscales was .77. It is
also possible that the weakest link was not the best predictor for theoretical reasons. An
alternative theoretical proposition would be that proximal motivational constructs would show a
stronger effect than more distal ones. For example, the A-R connection is more within the
control of the individual than are any of the other connections. However, the data do not support
this alternative explanation; in fact of the connections, the A-R connection is the only one that
does not significantly predict employee outcomes.
The question of how to combine motivational components to arrive at an overall measure
of motivation is not a new one for Expectancy Theories of Motivation. Vroom originally
suggested that the motivational components (i.e. expectancy, instrumentality, and valance)
combined mathematically to produce force. However, a meta-analysis of Expectancy Theory
found that the motivational components themselves, rather than mathematically derived models,
have higher effect sizes (Van Eerde & Thierry, 1996). Thus for the remaining hypotheses, the
72
individual connections are used for connection-level hypotheses. Overall motivation was indexed
as the average of the four connections.
Relationship between Motivation and Other Outcomes
To extend the validity evidence of the MAQ, motivation was compared to two additional
outcomes: OCB and turnover intentions. The average of the motivation connections was related
to both. Interestingly, although the overall motivation scale was not related to performance or
OCBs, there was a strong relationship between the overall scale and turnover intentions (r = -.41,
p = .00). This is in-line with the Progression-of-Withdrawal Model, in that it appears that
individuals put forth less effort on the job concurrent with thinking about leaving the
organization (Hulin, 1991).
Support was not found for the hypotheses that proposed differential relationships between
the P-A Connections and OCB versus performance. The A-R Connection was not more strongly
related to performance than to OCB because it was not significantly related to either. The O-NS
Connection was not more strongly related to OCB than to performance; in fact the opposite was
true though the difference was not significant.
Examination of the Uniqueness of the Motivational Connections
The P-A Theory proposes that the four connections are unique, yet correlated, constructs.
The pattern of correlation coefficients among the motivational connections suggests that this is
true. The average correlation among the connections was .40, which is a sizable relationship, but
not so large as to suggest that the connections are redundant. However, the connections did not
account for unique variance in employee outcomes. This suggests that although the connections
are unique conceptually, their effects are not distinct.
73
However, it is important to note that the outcomes examined in the current study were
very broad. Thus one reason that the individual connections do not predict unique variance in
performance is because of the mismatch in the level of generality between the connections and
the outcomes. For instance, the performance items asked the supervisor to rate the employees’
performance overall. Thus, perhaps the connections do not explain unique variance in overall
performance, but would explain unique variance if performance were measured at the
competency level, consistent with the Great Eight competency framework (Bartram, 2005).
Relationship between IS&C and Employee Outcomes
Initiating structure was not related to performance. This was surprising given the
culmination of previous studies regarding initiating structure and performance (Judge et al.,
2004). However, it is well established in research that there are moderators to this relationship
(Bass, 1990; House & Podsakoff, 1994; Yukl, 1981); thus, it is possible that is the reason the
effect was obscured. Unfortunately, the moderator included in the study, task ambiguity, failed to
moderate the relationship between initiating structure and performance. One possible reason for
this is insufficient statistical power. Although an a priori power analysis dictated my sample
size, given the fact that there were differential relationships between the two organizations, effect
sizes were attenuated in the overall sample. The sample size was halved in the Organization 2
sample; in both cases, the result is a reduction in power from what was anticipated.
Another reason that task ambiguity may have failed to moderate the relationship between
initiating structure and performance is the way it was operationalized. Recall that the task
ambiguity items asked the extent to which the task would be ambiguous “without any input or
advice from my supervisor.” The correlation between task ambiguity and initiating structure was
-.25. If the task ambiguity items were interpreted as intended, this finding would indicate that
74
supervisors provided more initiating structure for tasks that were naturally less ambiguous. The
more likely explanation is that respondents did not rate the items from a “without any input or
advice from my supervisor” perspective, but rather just rated overall task ambiguity including
supervisor input.
More support was found for the hypotheses regarding consideration. Consideration
predicted performance and OCB better than initiating structure did. It is also interesting to note
that of the three findings that were significant in Organization 1, they all dealt with the
consideration variable. Consistent with the IS&C meta-analysis (Judge et al., 2004),
consideration was the more robust predictor.
Relationship between IS&C and Motivation
As expected, both IS&C predicted motivation overall. One of the more interesting aspects
of this project was to examine the relationships between IS&C and the individual motivation
connections. Unfortunately, the hypothesized differential relationships between IS&C and the
motivation connections were not observed. This is in part due to the strong correlation between
IS&C (r = .68); this lack of discriminant validity between the two predictors made it difficult to
find differential relationships. The problem was further compounded by the fact that the P-A
Connections share an average correlation of .40. However, most of the hypotheses regarding the
relationships between IS&C and the Connections were supported. Initiating structure was not
related to the A-R Connection; however, it was related to the R-E Connection. While not
hypothesized, it was also related to the E-O and O-NS Connections. Consideration was related to
the E-O and O-NS Connections as hypothesized. While not hypothesized, it was also related to
the R-E Connections.
75
The differential effects for the leadership – motivation relationships indicate that there are
organizational level moderators that affect this relationship. It is impossible to tell which
variables are driving this difference as data were only collected in two organizations. The use of
a temporary workforce is one, particularly salient, variable that may be causing this difference,
However, the companies also differed in other ways that were discussed in a previous section.
This illustrates the importance of considering organizational differences in leadership research as
well as in organizational research more generally: individual level findings from one
organization may not generalize to others. Additionally this supports the foundational claim of
contingency theories of leadership that the most appropriate leadership style or behavior depends
on the situation (Yukl, 1981). That said, consideration was a more robust predictor than initiating
structure across outcomes and organization.
Mediation Model
Motivation was expected to mediate the relationships between IS&C and performance.
Because of lack of relationship between initiating structure and performance, that hypothesis
could not be tested. However, support was found for the consideration mediation model: Results
support the hypothesis that subordinates of considerate leaders perform better in part because
their motivational connections are stronger.
Practical Implications
The primary contribution of this study was to further integrate the leadership and
motivation literatures. Examining the connections between IS&C and the motivational
connections worked toward the applied goal: to be able to make clear recommendations
regarding which behaviors supervisors should adopt to improve a diagnosed deficiency in one of
76
the motivation connections. However, rather than supporting targeted suggestions depending on
the motivation connection that is low, results suggest that overall consideration behaviors have
the stronger effect on performance and an equal, if not stronger, effect on all of the P-A
motivation connections. Thus if there is room for improvement on consideration behaviors,
leaders wishing to improve followers motivation and subsequent performance should first focus
on displaying more consideration.
Additionally, the results provide guidance to leaders wishing to influence follower
motivation. Data suggest that the R-E connection has the strongest relationship with the two
leader behaviors. Thus leaders wishing to influence the other connections will have to be more
strategic in those efforts and perhaps use skills and behaviors above and beyond those that typify
a leader strong in IS&C.
Limitations
One limitation of this study is the use of non-experimental survey data. Many of the
relationships discussed are assumed to be causal. Of course causality cannot be assessed with the
research method employed. On the positive side, however, the research design enabled me to
collect data from working adults in their natural setting so may be more generalizable.
This study limited the measure of leadership to only IS&C. Other leadership constructs
may show differential relationships with the motivation connections as expected. One of the
reasons that IS&C were used is because they are robust constructs that overlap with many
leadership styles, behaviors, and profiles. However, this presents a limitation: Perhaps these
behaviors are too broad to relate with criteria in a targeted, differential way.
Criteria ratings of performance and OCB were collected from supervisors and predictor
ratings of IS&C were collected from incumbents. OCB and performance (r = .68) and IS&C (r =
77
.73) were highly correlated making it difficult to observe differential relationships. One possible
reason for this is that the raters did not receive any rater training. Additionally, supervisors may
not be the optimal source from which to collect OCB ratings; they may not have ample
opportunity to observe OCBs. For this reason as well as psychometric reasons, Allen, Barnard,
Rush, and Russell (2000)suggested that OCB ratings be taken from multiple individuals with
different perspectives.
The two data irregularities already discussed (i.e. different findings between the two
organizations and abnormally strong correlation between IS&C) present an additional limitation
of the study. Both of these abnormalities decreased my ability to test the hypotheses in the study
and limit the ability to draw conclusions from the results. However, it should be noted that even
though the correlation between IS&C was abnormally high, the pattern of relationships with
consideration being a more robust predictor of outcomes is consistent with the leadership
literature.
Future Directions
The P-A theory states that the four connections are distinct, related constructs. However,
in this study the individual connections failed to explain unique variance in the outcome
variables. Additionally, the P-A theory states that the weakest connection should be the best
predictor of performance and that was also not supported. One can question the extent to which
this study should serve as a test of these hypotheses given the limitations with the data described
previously. Future research should reexamine these questions. One suggestion is to examine
performance on a more granular level as discussed above.
One contribution of this study was to further expand the validation efforts of the new
MAQ. As expected, the MAQ shows a positive relationship with OCB and a negative
78
relationship with turnover intentions. Additionally, this study suggests some future directions for
further research with the MAQ. Because the overall motivation scale is a measure of intensity,
the motivational constructs of direction and persistence should also be considered in order to
fully cover the construct; indeed, work in this area is underway by Pritchard and his colleagues.
The drastically different effect sizes of the overall scale in predicting performance as
compared to the previous two studies (Botero, 2007; Cornejo, 2007)(r = .03 versus .36 and .33)
suggests that there may be moderators to the extent that effort (i.e. intensity) predicts
performance. Further, the differential relationships between motivation connections and
performance for the two organizations suggest that there may be moderators for those
relationships as well. Some potential reasons for these differences were discussed in the previous
section. Future research should assess the extent to which the relationships generalize across jobs
and organizations or are moderated by other variables.

79
APPENDIX A: MOTIVATION AND IS&C
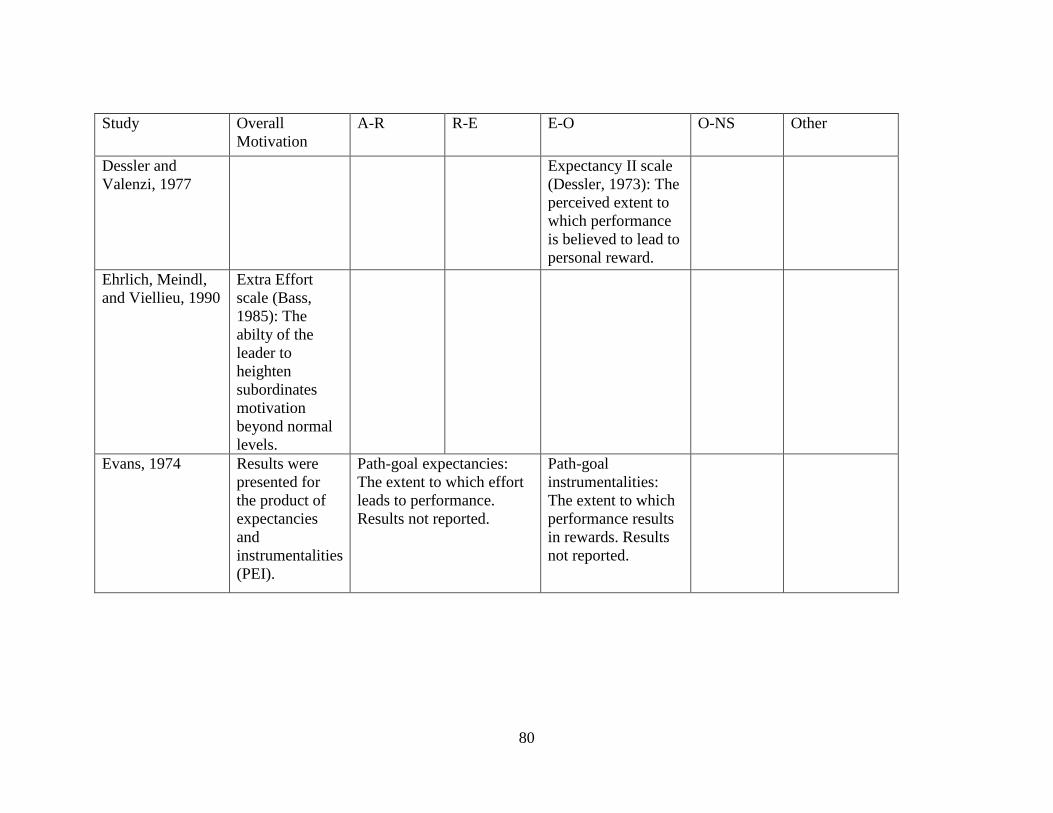
80
Study
Overall
Motivation
A-R R-E E-O O-NS Other
Dessler and
Valenzi, 1977
Expectancy II scale
(Dessler, 1973): The
perceived extent to
which performance
is believed to lead to
personal reward.
Ehrlich, Meindl,
and Viellieu, 1990
Extra Effort
scale (Bass,
1985): The
abilty of the
leader to
heighten
subordinates
motivation
beyond normal
levels.
Evans, 1974 Results were
presented for
the product of
expectancies
and
instrumentalities
(PEI).
Path-goal expectancies:
The extent to which effort
leads to performance.
Results not reported.
Path-goal
instrumentalities:
The extent to which
performance results
in rewards. Results
not reported.
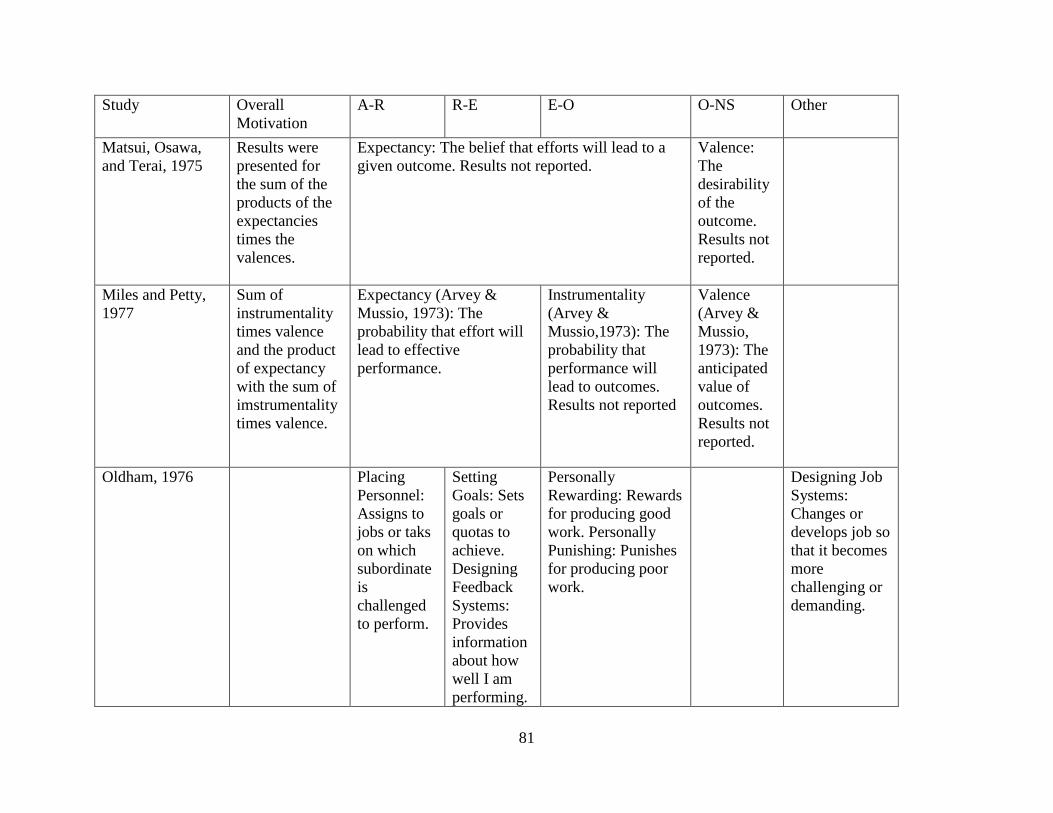
81
Study
Overall
Motivation
A-R R-E E-O O-NS Other
Matsui, Osawa,
and Terai, 1975
Results were
presented for
the sum of the
products of the
expectancies
times the
valences.
Expectancy: The belief that efforts will lead to a
given outcome. Results not reported.
Valence:
The
desirability
of the
outcome.
Results not
reported.
Miles and Petty,
1977
Sum of
instrumentality
times valence
and the product
of expectancy
with the sum of
imstrumentality
times valence.
Expectancy (Arvey &
Mussio, 1973): The
probability that effort will
lead to effective
performance.
Instrumentality
(Arvey &
Mussio,1973): The
probability that
performance will
lead to outcomes.
Results not reported
Valence
(Arvey &
Mussio,
1973): The
anticipated
value of
outcomes.
Results not
reported.
Oldham, 1976 Placing
Personnel:
Assigns to
jobs or taks
on which
subordinate
is
challenged
to perform.
Setting
Goals: Sets
goals or
quotas to
achieve.
Designing
Feedback
Systems:
Provides
information
about how
well I am
performing.
Personally
Rewarding: Rewards
for producing good
work. Personally
Punishing: Punishes
for producing poor
work.
Designing Job
Systems:
Changes or
develops job so
that it becomes
more
challenging or
demanding.
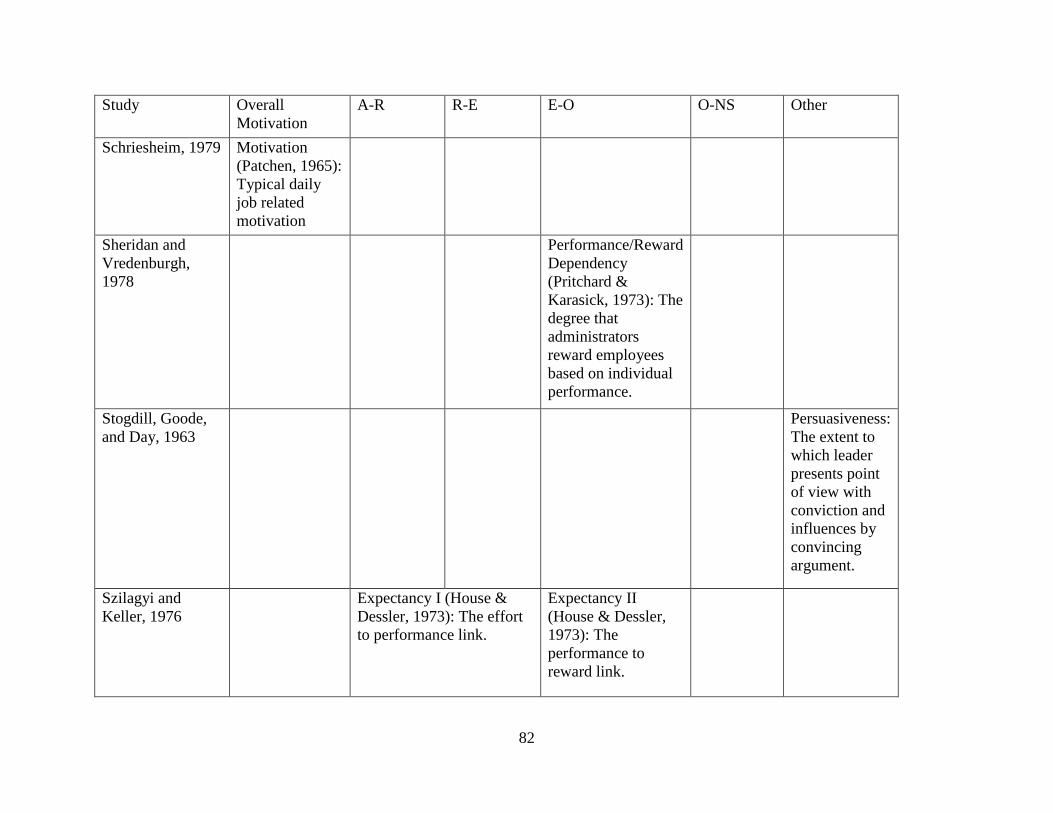
82
Study
Overall
Motivation
A-R R-E E-O O-NS Other
Schriesheim, 1979 Motivation
(Patchen, 1965):
Typical daily
job related
motivation
Sheridan and
Vredenburgh,
1978
Performance/Reward
Dependency
(Pritchard &
Karasick, 1973): The
degree that
administrators
reward employees
based on individual
performance.
Stogdill, Goode,
and Day, 1963
Persuasiveness:
The extent to
which leader
presents point
of view with
conviction and
influences by
convincing
argument.
Szilagyi and
Keller, 1976
Expectancy I (House &
Dessler, 1973): The effort
to performance link.
Expectancy II
(House & Dessler,
1973): The
performance to
reward link.

83
APPENDIX B: HYPOTHESES AND FINDINGS
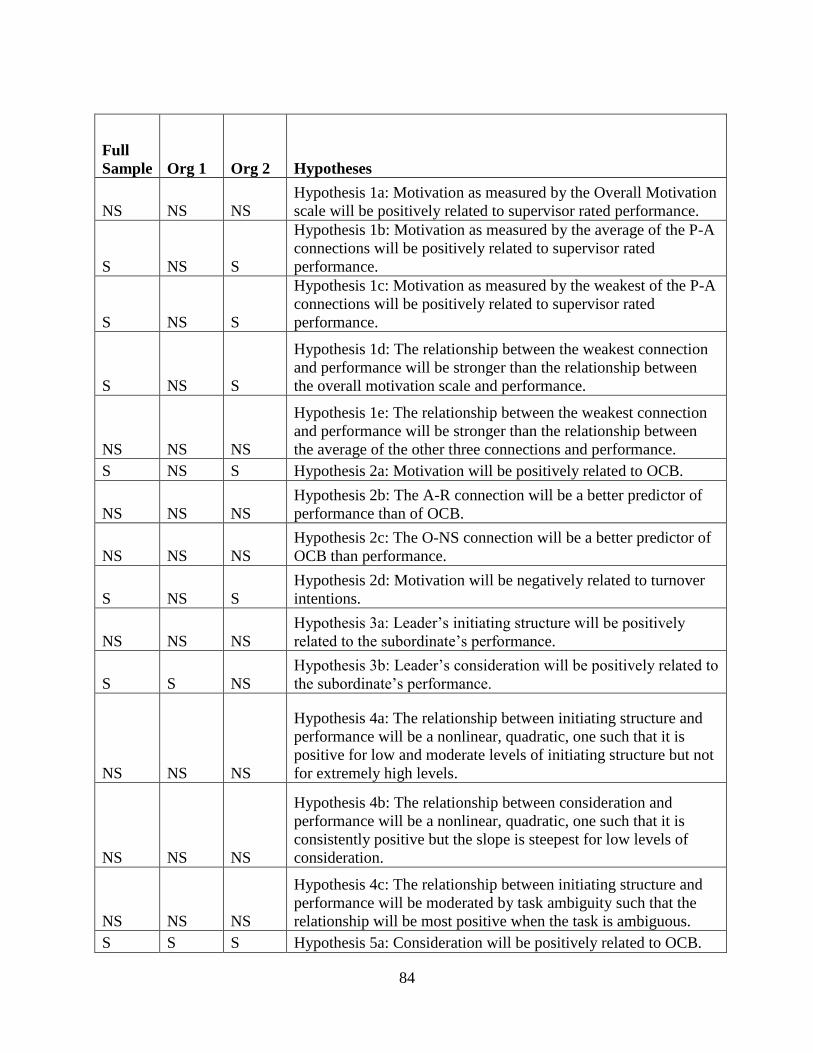
84
Full
Sample Org 1 Org 2 Hypotheses
NS NS NS
Hypothesis 1a: Motivation as measured by the Overall Motivation
scale will be positively related to supervisor rated performance.
S NS S
Hypothesis 1b: Motivation as measured by the average of the P-A
connections will be positively related to supervisor rated
performance.
S NS S
Hypothesis 1c: Motivation as measured by the weakest of the P-A
connections will be positively related to supervisor rated
performance.
S NS S
Hypothesis 1d: The relationship between the weakest connection
and performance will be stronger than the relationship between
the overall motivation scale and performance.
NS NS NS
Hypothesis 1e: The relationship between the weakest connection
and performance will be stronger than the relationship between
the average of the other three connections and performance.
S NS S Hypothesis 2a: Motivation will be positively related to OCB.
NS NS NS
Hypothesis 2b: The A-R connection will be a better predictor of
performance than of OCB.
NS NS NS
Hypothesis 2c: The O-NS connection will be a better predictor of
OCB than performance.
S NS S
Hypothesis 2d: Motivation will be negatively related to turnover
intentions.
NS NS NS
Hypothesis 3a: Leader’s initiating structure will be positively
related to the subordinate’s performance.
S S NS
Hypothesis 3b: Leader’s consideration will be positively related to
the subordinate’s performance.
NS NS NS
Hypothesis 4a: The relationship between initiating structure and
performance will be a nonlinear, quadratic, one such that it is
positive for low and moderate levels of initiating structure but not
for extremely high levels.
NS NS NS
Hypothesis 4b: The relationship between consideration and
performance will be a nonlinear, quadratic, one such that it is
consistently positive but the slope is steepest for low levels of
consideration.
NS NS NS
Hypothesis 4c: The relationship between initiating structure and
performance will be moderated by task ambiguity such that the
relationship will be most positive when the task is ambiguous.
S S S Hypothesis 5a: Consideration will be positively related to OCB.
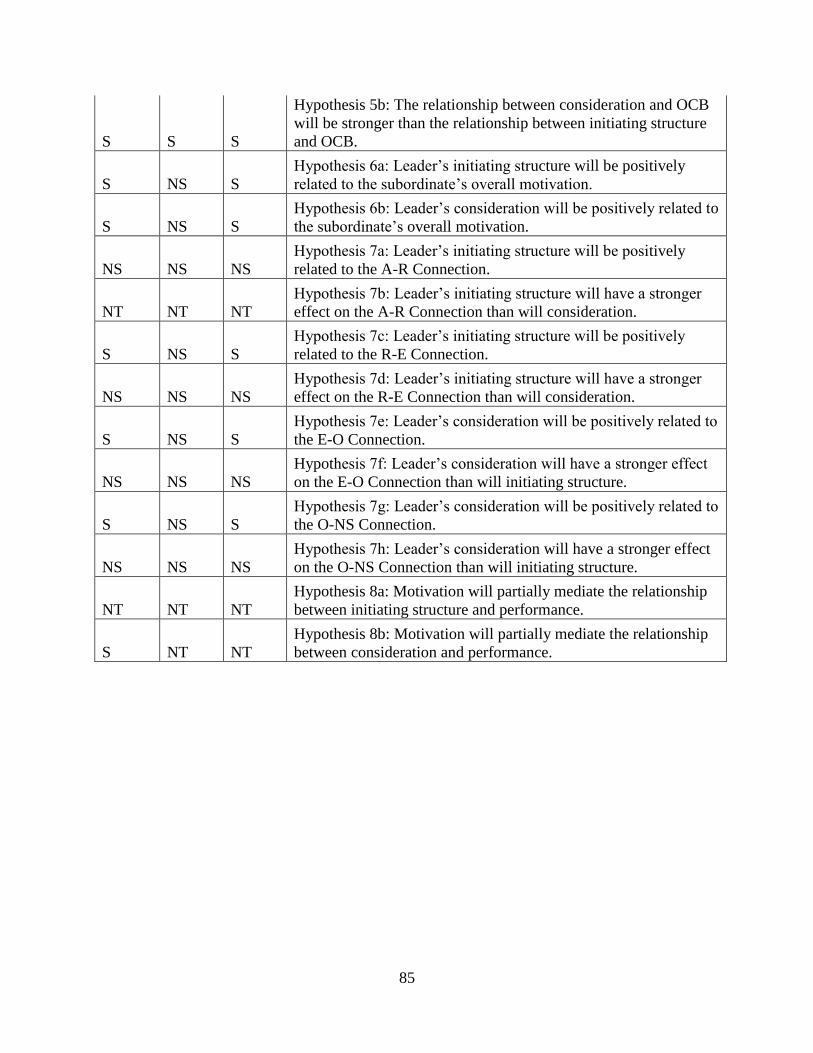
85
S S S
Hypothesis 5b: The relationship between consideration and OCB
will be stronger than the relationship between initiating structure
and OCB.
S NS S
Hypothesis 6a: Leader’s initiating structure will be positively
related to the subordinate’s overall motivation.
S NS S
Hypothesis 6b: Leader’s consideration will be positively related to
the subordinate’s overall motivation.
NS NS NS
Hypothesis 7a: Leader’s initiating structure will be positively
related to the A-R Connection.
NT NT NT
Hypothesis 7b: Leader’s initiating structure will have a stronger
effect on the A-R Connection than will consideration.
S NS S
Hypothesis 7c: Leader’s initiating structure will be positively
related to the R-E Connection.
NS NS NS
Hypothesis 7d: Leader’s initiating structure will have a stronger
effect on the R-E Connection than will consideration.
S NS S
Hypothesis 7e: Leader’s consideration will be positively related to
the E-O Connection.
NS NS NS
Hypothesis 7f: Leader’s consideration will have a stronger effect
on the E-O Connection than will initiating structure.
S NS S
Hypothesis 7g: Leader’s consideration will be positively related to
the O-NS Connection.
NS NS NS
Hypothesis 7h: Leader’s consideration will have a stronger effect
on the O-NS Connection than will initiating structure.
NT NT NT
Hypothesis 8a: Motivation will partially mediate the relationship
between initiating structure and performance.
S NT NT
Hypothesis 8b: Motivation will partially mediate the relationship
between consideration and performance.

86
APPENDIX C: MOTIVATION ASSESSMENT QUESTIONNAIRE
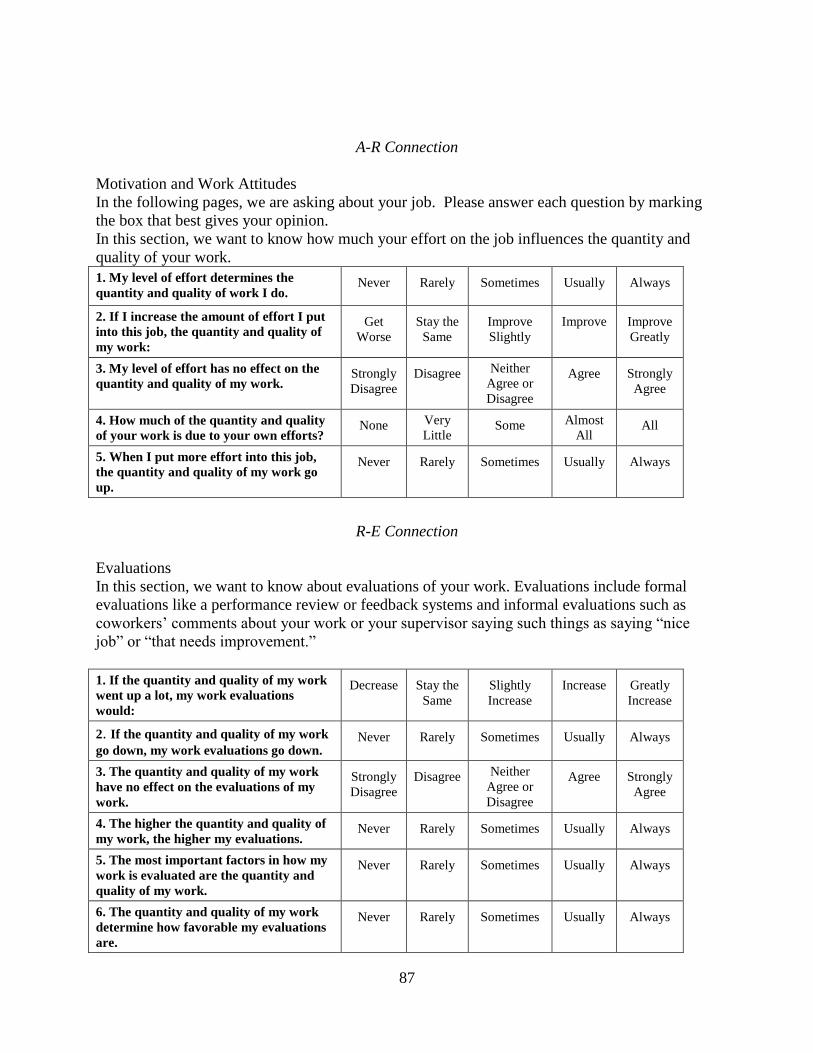
87
A-R Connection
Motivation and Work Attitudes
In the following pages, we are asking about your job. Please answer each question by marking
the box that best gives your opinion.
In this section, we want to know how much your effort on the job influences the quantity and
quality of your work.
1. My level of effort determines the
quantity and quality of work I do. Never Rarely Sometimes Usually Always
2. If I increase the amount of effort I put
into this job, the quantity and quality of
my work:
Get
Worse
Stay the
Same
Improve
Slightly
Improve Improve
Greatly
3. My level of effort has no effect on the
quantity and quality of my work. Strongly
Disagree
Disagree Neither
Agree or
Disagree
Agree Strongly
Agree
4. How much of the quantity and quality
of your work is due to your own efforts? None Very
Little Some Almost
All All
5. When I put more effort into this job,
the quantity and quality of my work go
up.
Never Rarely Sometimes Usually Always
R-E Connection
Evaluations
In this section, we want to know about evaluations of your work. Evaluations include formal
evaluations like a performance review or feedback systems and informal evaluations such as
coworkers’ comments about your work or your supervisor saying such things as saying “nice
job” or “that needs improvement.”
1. If the quantity and quality of my work
went up a lot, my work evaluations
would:
Decrease Stay the
Same
Slightly
Increase
Increase Greatly
Increase
2. If the quantity and quality of my work
go down, my work evaluations go down. Never Rarely Sometimes Usually Always
3. The quantity and quality of my work
have no effect on the evaluations of my
work.
Strongly
Disagree
Disagree Neither
Agree or
Disagree
Agree Strongly
Agree
4. The higher the quantity and quality of
my work, the higher my evaluations. Never Rarely Sometimes Usually Always
5. The most important factors in how my
work is evaluated are the quantity and
quality of my work.
Never Rarely Sometimes Usually Always
6. The quantity and quality of my work
determine how favorable my evaluations
are.
Never Rarely Sometimes Usually Always
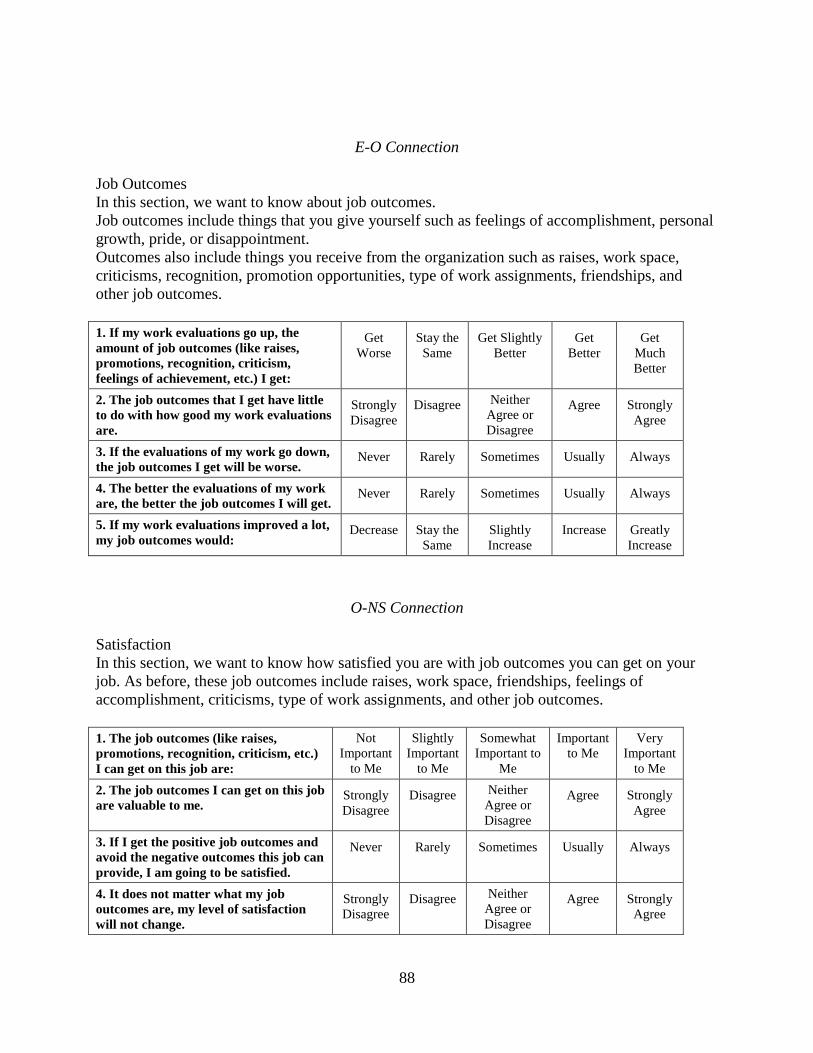
88
E-O Connection
Job Outcomes
In this section, we want to know about job outcomes.
Job outcomes include things that you give yourself such as feelings of accomplishment, personal
growth, pride, or disappointment.
Outcomes also include things you receive from the organization such as raises, work space,
criticisms, recognition, promotion opportunities, type of work assignments, friendships, and
other job outcomes.
1. If my work evaluations go up, the
amount of job outcomes (like raises,
promotions, recognition, criticism,
feelings of achievement, etc.) I get:
Get
Worse
Stay the
Same
Get Slightly
Better
Get
Better
Get
Much
Better
2. The job outcomes that I get have little
to do with how good my work evaluations
are.
Strongly
Disagree
Disagree Neither
Agree or
Disagree
Agree Strongly
Agree
3. If the evaluations of my work go down,
the job outcomes I get will be worse. Never Rarely Sometimes Usually Always
4. The better the evaluations of my work
are, the better the job outcomes I will get. Never Rarely Sometimes Usually Always
5. If my work evaluations improved a lot,
my job outcomes would: Decrease Stay the
Same
Slightly
Increase
Increase Greatly
Increase
O-NS Connection
Satisfaction
In this section, we want to know how satisfied you are with job outcomes you can get on your
job. As before, these job outcomes include raises, work space, friendships, feelings of
accomplishment, criticisms, type of work assignments, and other job outcomes.
1. The job outcomes (like raises,
promotions, recognition, criticism, etc.)
I can get on this job are:
Not
Important
to Me
Slightly
Important
to Me
Somewhat
Important to
Me
Important
to Me
Very
Important
to Me
2. The job outcomes I can get on this job
are valuable to me. Strongly
Disagree
Disagree Neither
Agree or
Disagree
Agree Strongly
Agree
3. If I get the positive job outcomes and
avoid the negative outcomes this job can
provide, I am going to be satisfied.
Never Rarely Sometimes Usually Always
4. It does not matter what my job
outcomes are, my level of satisfaction
will not change.
Strongly
Disagree
Disagree Neither
Agree or
Disagree
Agree Strongly
Agree
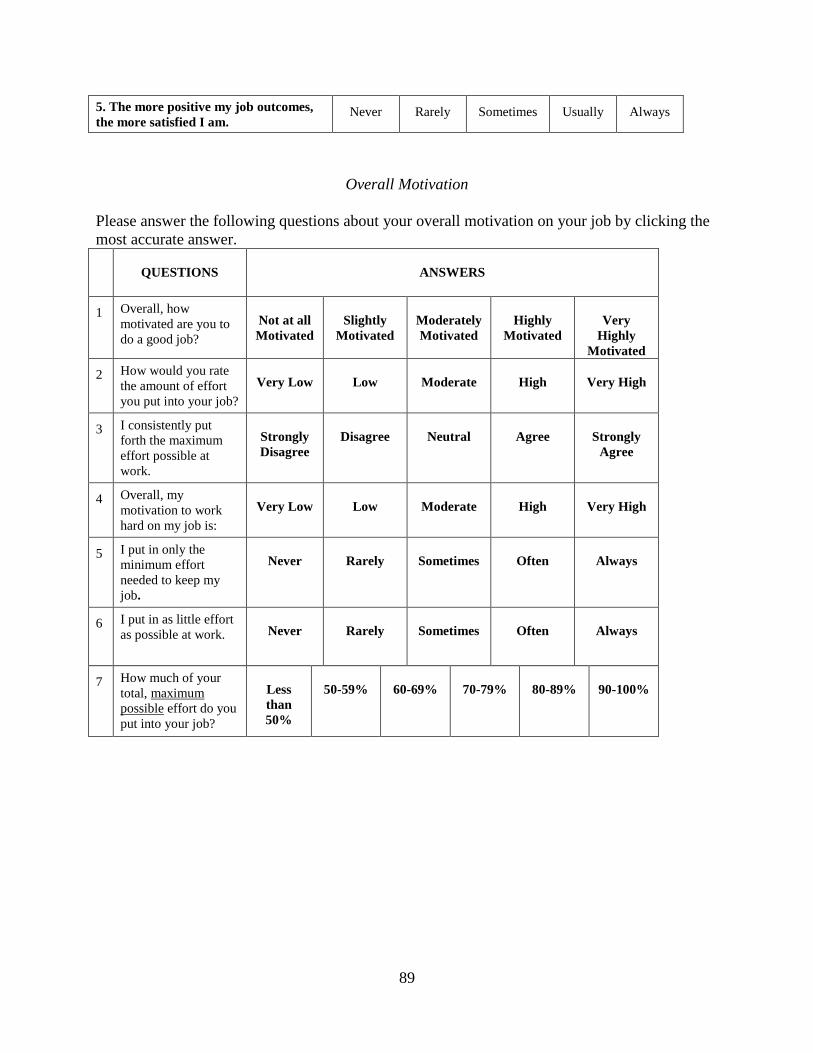
89
5. The more positive my job outcomes,
the more satisfied I am. Never Rarely Sometimes Usually Always
Overall Motivation
Please answer the following questions about your overall motivation on your job by clicking the
most accurate answer.
QUESTIONS
ANSWERS
1
Overall, how
motivated are you to
do a good job?
Not at all
Motivated
Slightly
Motivated
Moderately
Motivated
Highly
Motivated
Very
Highly
Motivated
2 How would you rate
the amount of effort
you put into your job?
Very Low
Low
Moderate
High
Very High
3 I consistently put
forth the maximum
effort possible at
work.
Strongly
Disagree
Disagree
Neutral
Agree
Strongly
Agree
4 Overall, my
motivation to work
hard on my job is:
Very Low
Low
Moderate
High
Very High
5 I put in only the
minimum effort
needed to keep my
job.
Never
Rarely
Sometimes
Often
Always
6 I put in as little effort
as possible at work.
Never
Rarely
Sometimes
Often
Always
7 How much of your
total, maximum
possible effort do you
put into your job?
Less
than
50%
50-59%
60-69%
70-79%
80-89%
90-100%

90
APPENDIX D: PERFORMANCE
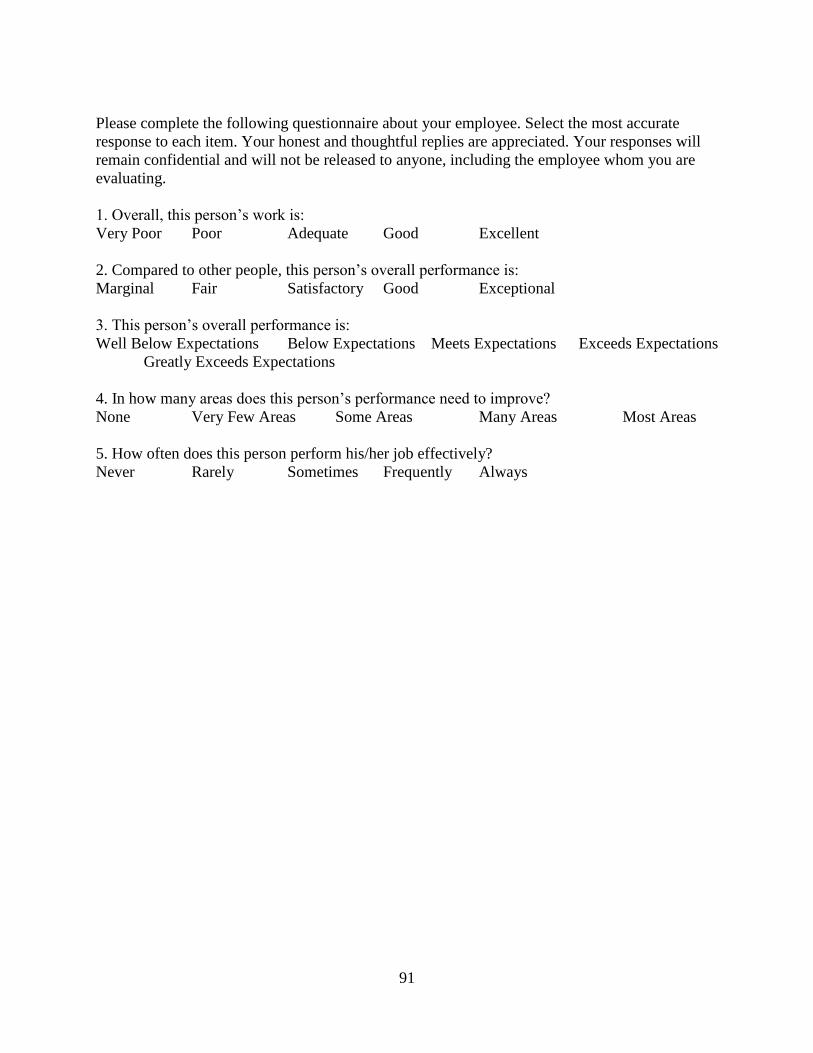
91
Please complete the following questionnaire about your employee. Select the most accurate
response to each item. Your honest and thoughtful replies are appreciated. Your responses will
remain confidential and will not be released to anyone, including the employee whom you are
evaluating.
1. Overall, this person’s work is:
Very Poor Poor Adequate Good Excellent
2. Compared to other people, this person’s overall performance is:
Marginal Fair Satisfactory Good Exceptional
3. This person’s overall performance is:
Well Below Expectations Below Expectations Meets Expectations Exceeds Expectations
Greatly Exceeds Expectations
4. In how many areas does this person’s performance need to improve?
None Very Few Areas Some Areas Many Areas Most Areas
5. How often does this person perform his/her job effectively?
Never Rarely Sometimes Frequently Always

92
APPENDIX E: ORGANIZATIONAL CITIZENSHIP BEHAVIORS
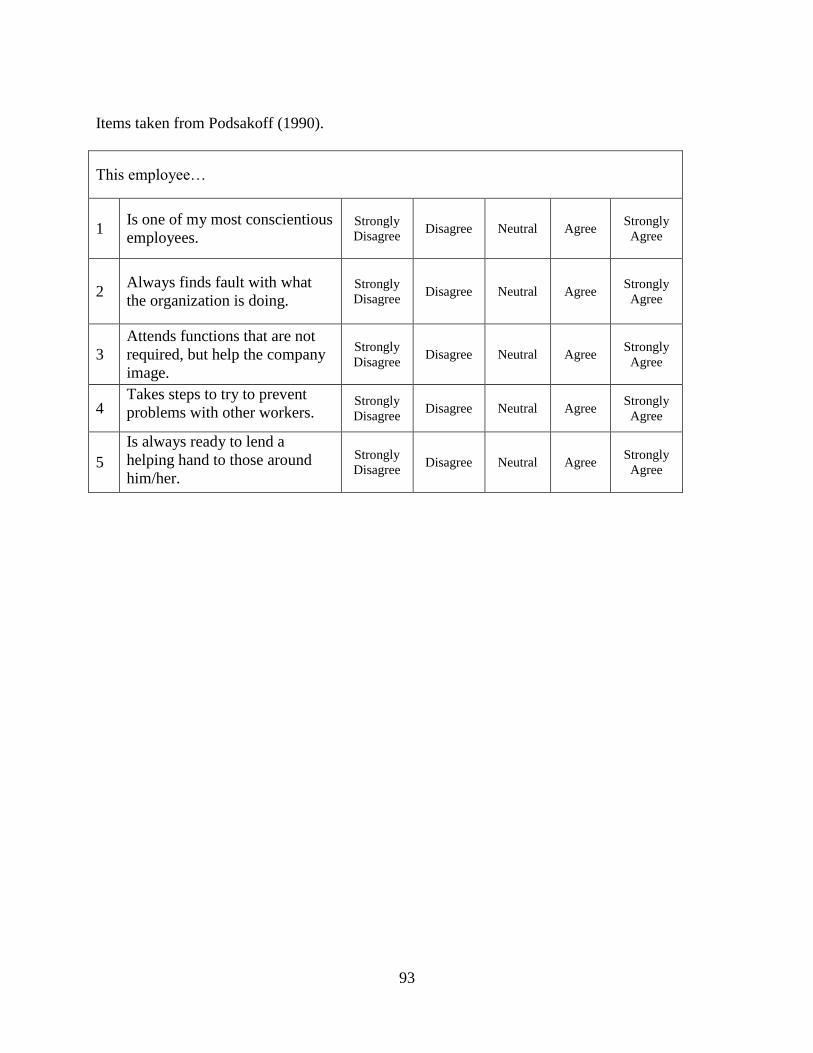
93
Items taken from Podsakoff (1990).
This employee…
1 Is one of my most conscientious
employees. Strongly
Disagree Disagree Neutral Agree
Strongly
Agree
2 Always finds fault with what
the organization is doing. Strongly
Disagree Disagree Neutral Agree
Strongly
Agree
3
Attends functions that are not
required, but help the company
image.
Strongly
Disagree Disagree Neutral Agree
Strongly
Agree
4 Takes steps to try to prevent
problems with other workers.
Strongly
Disagree Disagree Neutral Agree
Strongly
Agree
5
Is always ready to lend a
helping hand to those around
him/her.
Strongly
Disagree Disagree Neutral Agree
Strongly
Agree

94
APPENDIX F: TURNOVER INTENTIONS
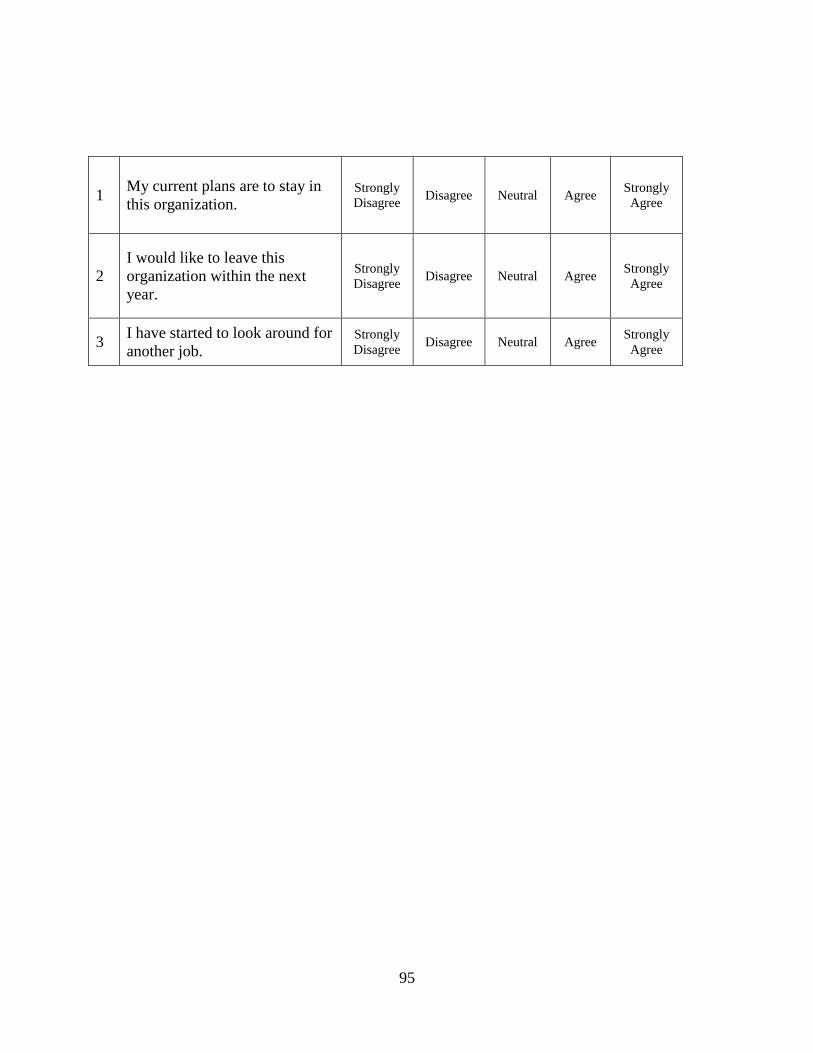
95
1 My current plans are to stay in
this organization. Strongly
Disagree Disagree Neutral Agree
Strongly
Agree
2
I would like to leave this
organization within the next
year.
Strongly
Disagree Disagree Neutral Agree
Strongly
Agree
3 I have started to look around for
another job. Strongly
Disagree Disagree Neutral Agree
Strongly
Agree

96
APPENDIX G: LEADER BEHAVIOR DESCRIPTION QUESTIONNAIRE FORM XII
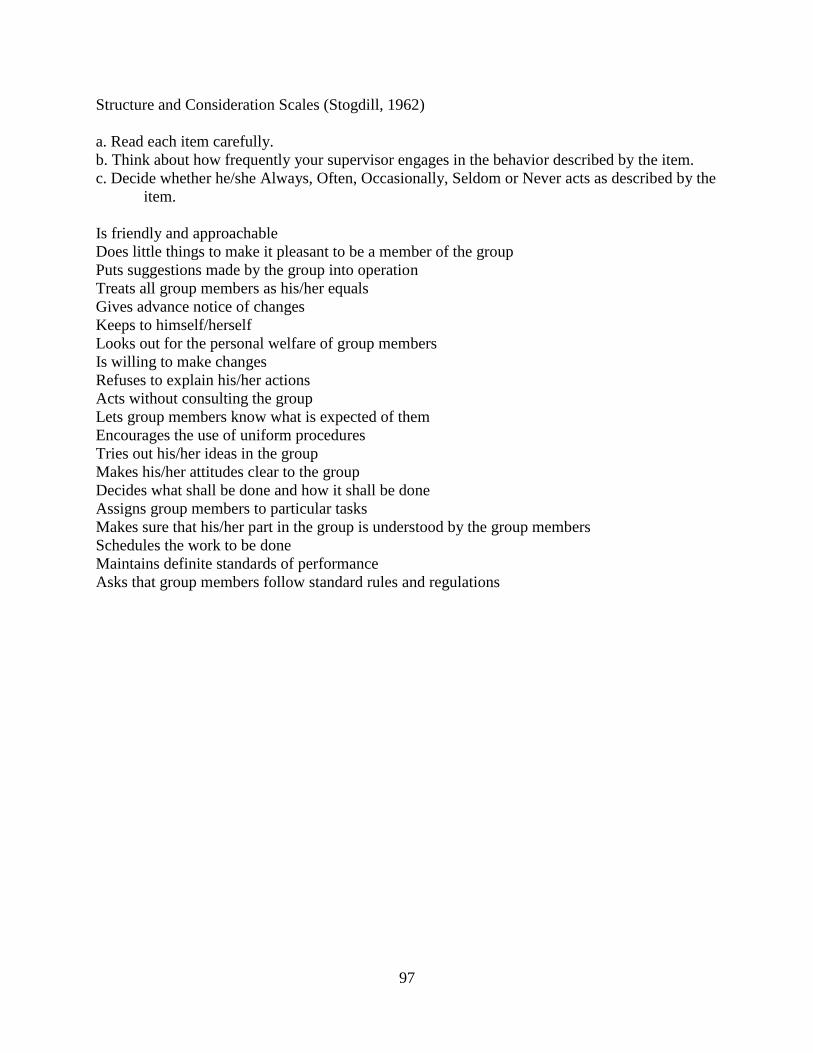
97
Structure and Consideration Scales (Stogdill, 1962)
a. Read each item carefully.
b. Think about how frequently your supervisor engages in the behavior described by the item.
c. Decide whether he/she Always, Often, Occasionally, Seldom or Never acts as described by the
item.
Is friendly and approachable
Does little things to make it pleasant to be a member of the group
Puts suggestions made by the group into operation
Treats all group members as his/her equals
Gives advance notice of changes
Keeps to himself/herself
Looks out for the personal welfare of group members
Is willing to make changes
Refuses to explain his/her actions
Acts without consulting the group
Lets group members know what is expected of them
Encourages the use of uniform procedures
Tries out his/her ideas in the group
Makes his/her attitudes clear to the group
Decides what shall be done and how it shall be done
Assigns group members to particular tasks
Makes sure that his/her part in the group is understood by the group members
Schedules the work to be done
Maintains definite standards of performance
Asks that group members follow standard rules and regulations

98
APPENDIX H: TASK AMBIGUITY
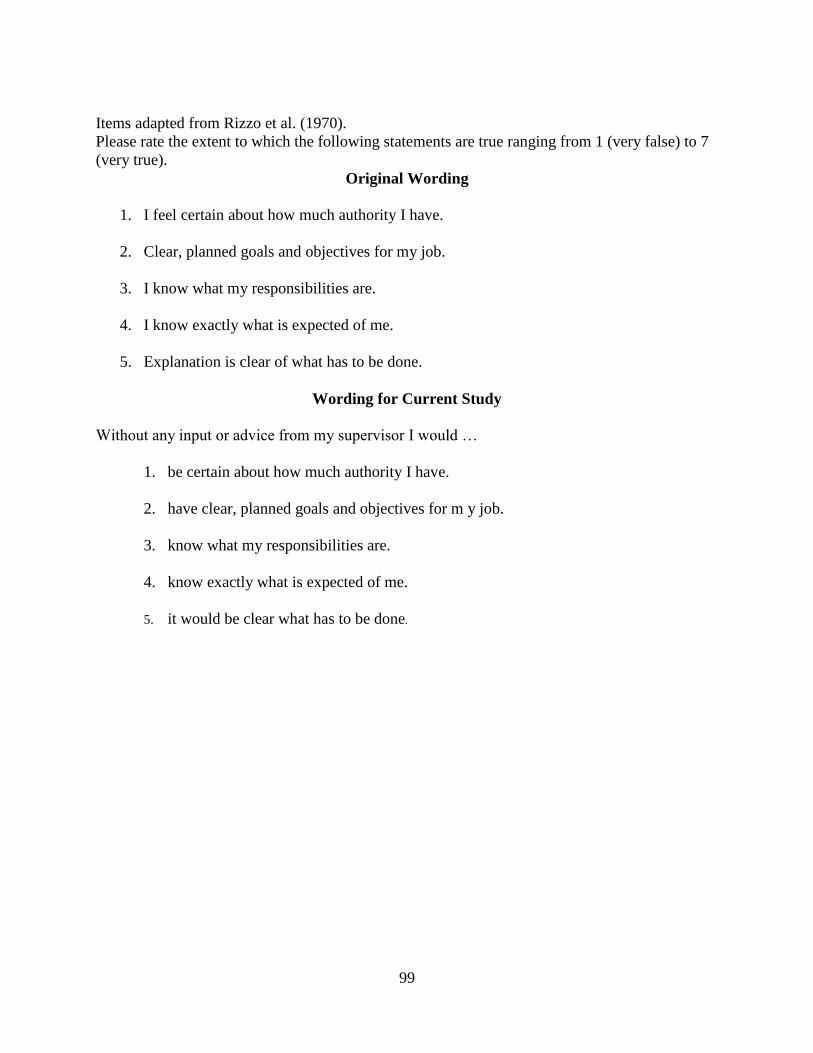
99
Items adapted from Rizzo et al. (1970).
Please rate the extent to which the following statements are true ranging from 1 (very false) to 7
(very true).
Original Wording
1. I feel certain about how much authority I have.
2. Clear, planned goals and objectives for my job.
3. I know what my responsibilities are.
4. I know exactly what is expected of me.
5. Explanation is clear of what has to be done.
Wording for Current Study
Without any input or advice from my supervisor I would …
1. be certain about how much authority I have.
2. have clear, planned goals and objectives for m y job.
3. know what my responsibilities are.
4. know exactly what is expected of me.
5. it would be clear what has to be done.

100

101
APPENDIX I: INSTITUTIONAL REVIEW BOARD APPROVAL LETTER
102
103
REFERENCES
Abbasi, D. S., & Hollman, D. K. (2000). Turnover: The real bottom line. Public Personnel
Management, 29, 333-342.
Allen, T. D., Barnard, S., Rush, M. C., & Russell, J. E. A. (2000). Ratings of Organizational
Citizenship Behavior: Does the Source Make a Difference? Human Resource
Management Review, 10, 97-114.
Baron, R. A., Byrne, D., & Branscome, N. R. (2006). Social psychology (11 ed.). Boston: Allyn
& Bacon.
Baron, R. M., & Kenny, D. A. (1986). The moderator-mediator variable distinction in social
psychological research: Conceptual, strategic and statistical considerations. Journal of
Personality and Social Psychology, 51, 1173-1182.
Bartram, D. (2005). The Great Eight Competencies: A Criterion-Centric Approach to Validation.
Journal of Applied Psychology, 90, 1185.
Bass, B. M. (1990). Bass & Stogdill's handbook of leadership: theory, research, and managerial
applications. New York: The Free Press.
Bono, J. E., & Anderson, M. H. (2005). The advice and influence networks of transformational
leaders. Journal of Applied Psychology, 90, 1306-1314.
Bono, J. E., & Judge, T. A. (2004). Personality and transformational and transactional
leadership: A meta-analysis. Journal of Applied Psychology, 89, 901-910.
Borman, W. C., & Motowidlo, S. J. (1993). Expanding the criterion domain to include elements
of contextual performance. In N. Schmitt & W. C. Borman (Eds.), Personnel selection in
organizations. San Francisco: Jossey-Bass.
Botero, E. (2007). The relationship between motivation and stress in police officers. Unpublished
master's thesis, University of Central Florida, Orlando.
Campbell, J. P. (1990). An overview of the Army Selection and Classification Project (Project
A). Personnel Psychology, 43, 231-239.
Cohen, J., & Cohen, P. (1983). Applied Multiple Regression/Correlation Analysis for the
Behavioral Sciences. (2nd ed.). Hillsdale, NJ: Lawrence Erlbaum Associates.
Cohen, J., Cohen, P., West, S. G., & Aiken, L. S. (2003). Applied Multiple
Regression/Correlation Analysis for the Behavioral Sciences. (3rd ed.). Mahwah, NJ:
Lawrence Erlbaum Associates.
Colquitt, J. A., Conlon, D. E., Wesson, M. J., Porter, C. O. L. H., & Ng, K. Y. (2001). Justice at
the millenium: A meta-analytic review of 25 years of organizational justice research.
Journal of Applied Psychology, 86, 425-445.
Cornejo, J. M. (2007). An examination of the relationship among perceived gender
discrimination, work motivation, and performance. Unpublished doctoral dissertation,
University of Central Florida Orlando.
Dessler, G., & Valenzi, E. R. (1977). Initiation of structure and subordinate satisfaction: A path
analysis test of Path-Goal Theory. The Academy of Management Journal, 20, 251-259.
Downey, J. P., & McMurtrey, M. (2007). Introducing task-based general computer self-efficacy:
An empirical comparison of three general self-efficacy instruments. Interacting with
Computers, 19, 382-396.
Ehrlich, S. B., Meindl, J. R., & Viellieu, B. (1990). The charismatic appeal of a transformational
leader: An empirical case study of a small, high technology contractor. Leadership
Quarterly, 1, 229-248.
104
Evans, M. G. (1974). Extensions of a path-goal theory of motivation. Journal of Applied
Psychology, 59, 172-178.
Eys, M. A., & Carron, A. V. (2001). Role ambiguity, task cohension, and task self-efficacy.
Small group research 32, 356-373.
Fleishman, E. A. (1973). Twenty years of consideration and structure. In E. A. Fleishman & J. G.
Hunt (Eds.), Current developments in the study of leadership (pp. 1-40). Carbondale, IL:
Southern Illionois University Press.
Fleishman, E. A. (1998). Patterns of leadership behavior related to employee grievances and
turnover: Some post hoc reflections. Personnel Psychology, 51, 825-834.
Fleishman, E. A., Mumford, M. D., Zaccaro, S. J., Levin, K. Y., Korokin, A. L., & Hein, M.
(1991). Taxonomic effects in the description of leadership behavior: A synthesis and
cognitive interpretation. Leadership Quarterly, 2, 245-287.
General FAQ #28: How to compare sample correlation coefficients drawn from the same sample.
(nd). Retrieved September 2, 2008 from
http://ssc.utexas.edu/consulting/answers/general/gen28.html
Griffeth, R. W., Hom, P. W., & Gaertner, S. (2000). A meta-analysis of antecedents and
correlates of employee turnover: Update, moderator tests, and research implications for
the next millennium, Journal of Management (Vol. 26, pp. 463).
Hoffman, B. J., Blair, C. A., Meriac, J. P., & Woehr, D. J. (2007). Expanding the criterion
domain? A quantitative review of the OCB literature. Journal of Applied Psychology,
92(2), 555-566.
House, R. J. (1971). A path goal theory of leader effectiveness. Administrative Science
Quarterly, 16, 321-339.
House, R. J. (1996). Path-goal theory of leadership: Lessons, legacy and a reformulated theory.
Leadership Quarterly, 7, 323-352.
House, R. J., & Podsakoff, P. M. (1994). Leadership effectiveness: Past perspectives and future
directions for research. In J. Greenberg (Ed.), Organizational behavior: The state of the
science (pp. 45-82). Hillsdale, NJ: Lawrence Erlbaum Associates.
Hulin, C. L. (1991). Adaptation, persistence, and commitment in organizations. In M. D.
Dunnette & L. M. Hough (Eds.), Handbook of industrial and organizational psychology
(2 ed.). Palo Alto, CA: Consulting Psychologists Press.
Judge, T. A., Jackson, C. L., Shaw, J. C., Scott, B. A., & Rich, B. L. (2007). Self-efficacy and
work-related performance: The integral role of individual differences. Journal of Applied
Psychology, 92, 107-127.
Judge, T. A., & Piccolo, R. F. (2004). Transformational and transactional leadership: A meta-
analytic test of their relative validity. Journal of Applied Psychology, 89, 755-768.
Judge, T. A., Piccolo, R. F., & Ilies, R. (2004). The forgotten ones? The validity of consideration
and initiating structure in leadership research. Journal of Applied Psychology, 89, 36-51.
Kanfer, R. (1992). Work motivation: New directions in theory and research. International
Review of Industrial and Organizational Psychology, 7, 1–53.
Kanfer, R., Chen, G., & Pritchard, R. D. (Eds.). (2008). Work Motivation: Past, present and
future. Philadelphia, PA: Lawrence Erlbaum Associates / Psyhology Press.
Kanfer, R., Chen, G., & Pritchard, R. D. (Eds.). (in press). Work Motivation: Past, present and
future. Philadelphia, PA: Lawrence Erlbaum Associates
105
Keller, R. T. (2006). Transformational leadership, initiating structure, and substitutes for
leadership: a longitudinal study of research and development project team performance.
Journal of Applied Psychology, 91, 202-210.
Kerr, S., & Jermier, J. M. (1978). Substitutes for leadership: Their meaning and measurement.
Organizational Behavior & Human Performance, 22, 375-403.
Koltko-Rivera, M. E. (2006). Rediscovering the later version of Maslow's hierarchy of needs:
Self-transcendence and opportunities for theory, research, and unification. Review of
General Psychology, 10(4), 302-317.
Latham, G. P. (2007). Work motivation: History, theory, research, and practice. Thousand Oaks,
CA: Sage Publications.
Latham, G. P., & Pinder, C. C. (2005). Work motivation theory and research at the the dawn of
the twenty-first century Annual Review of Psychology, 56, 485-516.
Liu, W., Lepak, D. P., Takeuchi, R., & Sims, H. P. (2003). Matching leadership styles with
employment modes: strategic human resource management perspective. Human Resource
Management Review, 13, 127-152.
Locke, E. A., & Latham, G. P. (2002). Building a practically useful theory of goal setting and
task motivation. A 35-year odyssey. American Psychologist, 57, 705-717.
Maier, S. F., & Seligman, M. E. P. (1976). Learned helplessness: Theory and evidence. Journal
of Experimental Psychology:General, 105(1), 3-46.
Matsui, T., Osawa, T., & Terai, T. (1975). Relations between supervisory motivation and the
consideration and structure aspects of supervisory behavior. Journal of Applied
Psychology, 60, 451-454.
Miles, R. H., & Petty, M. M. (1977). Leader effectiveness in small bureaucracies. The Academy
of Management Journal, 20(2), 238-250.
Mitchell, T. R., & Daniels, D. (2003). Motivation. In W. C. Borman & D. R. Ilgen (Eds.),
Handbook of psychology, Industrial and organizational psychology (Vol. 12, pp. 225-
254).
Moorman, R. H., & Harland, L. K. (2002). Temporary employees as good citizens: Factors
influencing their OCB performance. Journal of Business and Psychology, 17, 171-187.
Muchinsky, P. M. (2006). Psychology applied to work (8th ed.). Belmont, CA: Thomson
Wadsworth.
Naylor, J. C., Pritchard, R. D., & Ilgen, D. R. (1980). A theory of behavior in organizations. New
York: Academic Press.
Oldham, G. R. (1976). The motivational strategies used by supervisors: Relationships to
effectiveness indicators. Organizational Behavior & Human Performance, 15(1), 66-86.
Organ, D. W. (1988). Organizational citizenship behavior: The good soldier syndrome.
Lexington, MA: Lexington Books.
Organ, D. W., & Ryan, K. (1995). A meta-analytic review of attitudinal and dispositional
predictors of organizational citizenship behavior. Personnel Psychology, 48, 775-802.
Podsakoff, P. M., MacKenzie, S. B., Moorman, R. H., & Fetter, R. (1990). Transformational
leader behaviors and their effects on followers’ trust in leader, satisfaction, and
organizational citizenship behaviors. Leadership Quarterly, 1(2), 107-142.
Pritchard, R. D. (2006a). Development of the Motivation Assessment Questionnaire April 24,
2006. University of Central Florida
Pritchard, R. D. (2006b). Motivation Assessment Questionnaire Version 06 10 27. University of
Central Florida
106
Pritchard, R. D., & Ashwood, E. (2008). A manager's guide to diagnosing and improving
motivation. New York: Routledge, Taylor & Francis Group.
Pritchard, R. D., Harrell, M. M., DiazGranados, D., & Guzman, M. J. (2008). The Productivity
Measurement and Enhancement System: A meta-analysis. Journal of Applied
Psychology, 93, 540-567.
Rasch, R., Shen, W., Davies, S. E., & Bono, J. (2008). Destructive outcomes of ineffective leader
behavior. In R. F. Piccolo, D. DiazGranados & M. M. Harrell (Eds.), 23rd Annual
Conference of the Society for Industrial and Organizational Psychology. San Francisco.
Rizzo, J. R., House, R. J., & Lirtzman, S. I. (1970). Role conflict and ambiguity in complex
organizations. Administrative Science Quarterly, 15, 150-163.
Rousseau, D. M. (1995). Psychological contracts in organizations: Understanding written and
unwritten agreements. Newbury Park, CA: Sage.
Schriesheim, C. A. (1979). The similarity of individual directed and group directed leader
behavior descriptions. The Academy of Management Journal, 22, 345-355.
Schriesheim, C. A., Castro, S. L., Zhou, X. T., & DeChurch, L. A. (2006). An investigation of
path-goal and transformational leadership theory predictions at the individual level of
analysis. The Leadership Quarterly, 17, 21-38.
Smith, C. A., Organ, D. W., & Near, J. P. (1983). Organizational citizenship behavior: Its nature
and antecedents. Journal of Applied Psychology, 68, 653-663.
Smith, C. S., Tisak, J., & Schmieder, R. A. (1993). The measurement properties of the role
conflict and role ambiguity scales: A review and extension of the empirical research.
Journal of Organizational Behavior, 14(1), 37-48.
Stajkovic, A. D., & Luthans, F. (1997). A meta-analysis of the effects of organizational behavior
modification on task performance, 1975-95. Academy of Management Journal, 40, 1122-
1149.
Stewart, W. H., Jr., & Roth, P. L. (2007). A meta-analysis of achievement motivation differences
between entrepreneurs and managers. Journal of Small Business Management, 45, 401-
421.
Stogdill, R. M. (1962). Manual for the Leader Behavior Description Questionnaire - Form XII
Fisher College of Business, The Ohio State University, Columbus, OH.
Stogdill, R. M., Goode, O. S., & Day, D. R. (1963). The leader behavior of United States
Senators. Journal of Psychology: Interdisciplinary and Applied, 56(1), 3-8.
Stone-Romero, E. F., & Rosopa, P. J. (2004). Inference problems with hierarchical multiple
regression-based tests of mediating effects. . Research in Personnel and Human
Resources Management, 23, 249-290.
Szilagyi, A. D., & Keller, R. T. (1976). A comparative investigation of the Supervisory Behavior
Description Questionnaire (SBDQ) and the Revised Leader Behavior Description
Questionnaire (LBDQ-Form XII). The Academy of Management Journal, 19, 642-649.
Van Eerde, W., & Thierry, H. (1996). Vroom's expectancy models and work-related criteria: A
meta-analysis. Journal of Applied Psychology, 81(5), 575-586.
Vroom, V. H. (1964). Work and motivation. New York: Wiley
Williams, L. J., & Anderson, S. E. (1991). Job satisfaction and organizational commitment as
predictors of organizational citizenship and in-role behaviors. Journal of Management,
17, 601-617.
Wofford, J. C., & Liska, L. Z. (1993). Path-goal theories of leadership: A meta-analysis. Journal
of Management, 19, 857-876.

107
Yukl, G. A. (1981). Leadership in organizations. Englewood Cliffs, NJ: Prentice Hall
Zaccaro, S. J., Hildebrand, K., & Nelson, J. (2008). Leadership processes and work motivation.
In R. Kanfer, G. Chen & R. D. Pritchard (Eds.), Work motivation: Past, present and
future. Philadelphia, PA: Lawrence Erlbaum Associates


![Solving Multi-Leader-Follower Gamestmunson/papers/epec.pdf · modeled as a Stackelberg (single-leader-follower) game [31, 20], in which the dominant firm, the leader, maximizes its](https://img.pdfslide.net/doc/110x75/5f1f9974fa328e4a717d9aac/solving-multi-leader-follower-games-tmunsonpapersepecpdf-modeled-as-a-stackelberg.jpg)


![[inria-00326740, v1] Map-based Active Leader-Follower](https://img.pdfslide.net/doc/110x75/61585de50c409c7917352e76/inria-00326740-v1-map-based-active-leader-follower-.jpg)

