Embed Size (px)
Citation preview
This article was downloaded by: [The University of Manchester Library]On: 10 October 2014, At: 06:46Publisher: RoutledgeInforma Ltd Registered in England and Wales Registered Number: 1072954 Registered office: Mortimer House,37-41 Mortimer Street, London W1T 3JH, UK
Journal of Relationship MarketingPublication details, including instructions for authors and subscription information:http://www.tandfonline.com/loi/wjrm20
The Relationships of Customer-Perceived Value,Satisfaction, Loyalty and Behavioral IntentionsSpiros P. Gounaris PhD a , Nektarios A. Tzempelikos a & Kalliopi Chatzipanagiotou PhD ba Department of Marketing and Communication , Athens University of Economics andBusiness , Athens, Greeceb Athens University of Economics and Business , Athens, GreecePublished online: 30 Sep 2009.
To cite this article: Spiros P. Gounaris PhD , Nektarios A. Tzempelikos & Kalliopi Chatzipanagiotou PhD (2007) TheRelationships of Customer-Perceived Value, Satisfaction, Loyalty and Behavioral Intentions, Journal of Relationship Marketing,6:1, 63-87
To link to this article: http://dx.doi.org/10.1300/J366v06n01_05
PLEASE SCROLL DOWN FOR ARTICLE
Taylor & Francis makes every effort to ensure the accuracy of all the information (the “Content”) containedin the publications on our platform. However, Taylor & Francis, our agents, and our licensors make norepresentations or warranties whatsoever as to the accuracy, completeness, or suitability for any purpose of theContent. Any opinions and views expressed in this publication are the opinions and views of the authors, andare not the views of or endorsed by Taylor & Francis. The accuracy of the Content should not be relied upon andshould be independently verified with primary sources of information. Taylor and Francis shall not be liable forany losses, actions, claims, proceedings, demands, costs, expenses, damages, and other liabilities whatsoeveror howsoever caused arising directly or indirectly in connection with, in relation to or arising out of the use ofthe Content.
This article may be used for research, teaching, and private study purposes. Any substantial or systematicreproduction, redistribution, reselling, loan, sub-licensing, systematic supply, or distribution in anyform to anyone is expressly forbidden. Terms & Conditions of access and use can be found at http://www.tandfonline.com/page/terms-and-conditions
The Relationships of Customer-PerceivedValue, Satisfaction, Loyaltyand Behavioral Intentions
Spiros P. Gounaris
Athens University of Economics and Business
Nektarios A. Tzempelikos
Athens University of Economics and Business
Kalliopi Chatzipanagiotou
Athens University of Economics and Business
ABSTRACT. The concept of Customer-Perceived Value (CPV) hasbecome a matter of increasing concern in marketing literature. However,there are few empirical studies that attempt to examine the notion ofit. Filling this gap, this study provides a conceptual as well as empiricalinvestigation of CPV as a formative construct and also offers an insightregarding the role of CPV in influencing, through satisfaction and loy-alty, the behavioral intentions of word of mouth, repurchase intentionand cross-buying. Furthermore, the potential moderating role of socialpressure in the relationship between satisfaction and loyalty is also
Spiros P. Gounaris, PhD, is Assistant Professor of Marketing and Nektarios A.Tzempelikos is a PhD student, both at the Department of Marketing and Communica-tion; and Kalliopi Chatzipanagiotou, PhD, is Research Assistant, all at the Athens Uni-versity of Economics and Business, Athens, Greece.
Address correspondence to: Spiros P. Gounaris, Athens University of Economicsand Business, Marketing and Communication, 76 Patission Street, Athens 10434,Greece (E-mail: [email protected]).
Journal of Relationship Marketing, Vol. 6(1) 2007Available online at http://jrm.haworthpress.com
© 2007 by The Haworth Press, Inc. All rights reserved.doi:10.1300/J366v06n01_05 63
Dow
nloa
ded
by [
The
Uni
vers
ity o
f M
anch
este
r L
ibra
ry]
at 0
6:46
10
Oct
ober
201
4
examined. The results suggest that delivering superior customer valueenables a firm to achieve favorably behavioral intentions. Implications forpractice, study limitations and future research are discussed. doi:10.1300/J366v06n01_05 [Article copies available for a fee from The Haworth Docu-ment Delivery Service: 1-800-HAWORTH. E-mail address: <[email protected]> Website: <http://www.HaworthPress.com> © 2007 by TheHaworth Press, Inc. All rights reserved.]
KEYWORDS. Customer-perceived value, satisfaction, loyalty, word ofmouth, repurchase intention, cross-buying, social pressure
INTRODUCTION
During the last decade, the interest of both marketing practitionersand scholars alike regarding the notion of “customer value” has in-creased (Gale, 1994). Although delivering superior customer value is animportant factor for company’s success (e.g., Bolton and Drew, 1991;Grönroos, 1994, 1997; Zeithaml et al., 1996; Parasuraman, 1997), andresearchers acknowledge the importance of customer value for improv-ing the performance of the firm’s Customer Relationship Management(CRM) program (Day, 1994; Slater, 1997; Wang et al., 2004), related em-pirical research has been slim. As a result, the conceptualization of thenotion of Perceived Customer Value remains largely unclear and quitedivergent.
This lack of empirical investigation impedes the comprehension ofthe relationship between the value the company offers to its customersand the relational outcomes, in terms of customer satisfaction and brandloyalty, as well as customers’ subsequent behavior intentions.
Thus, the purpose of this study is to build and empirically test an inte-grated framework regarding the dimensions of the value customers re-ceive from the company while investigating the impact of customer’sperceived value on their satisfaction and loyalty, two key dimensions ofrelationship quality (Crosby et al., 1990; Dorsch et al., 1998; Robertset al., 2003; Wong and Sohal, 2002), as well as upon their behavioralintentions, regarding repurchase intention, cross-buying and word-of-mouth (wom) communicating.
The next section of the paper is organized as follows. First we presentthe conceptual framework underpinning our study. Then we developresearch hypotheses based on the reviewed literature. Next, we presentthe methodology of research we conducted to test the hypothesis. Wethen proceed with the data analysis and the testing of the hypotheses,
64 JOURNAL OF RELATIONSHIP MARKETING
Dow
nloa
ded
by [
The
Uni
vers
ity o
f M
anch
este
r L
ibra
ry]
at 0
6:46
10
Oct
ober
201
4
and finally the results, the limitations of the study as well as suggestionsfor future research are discussed.
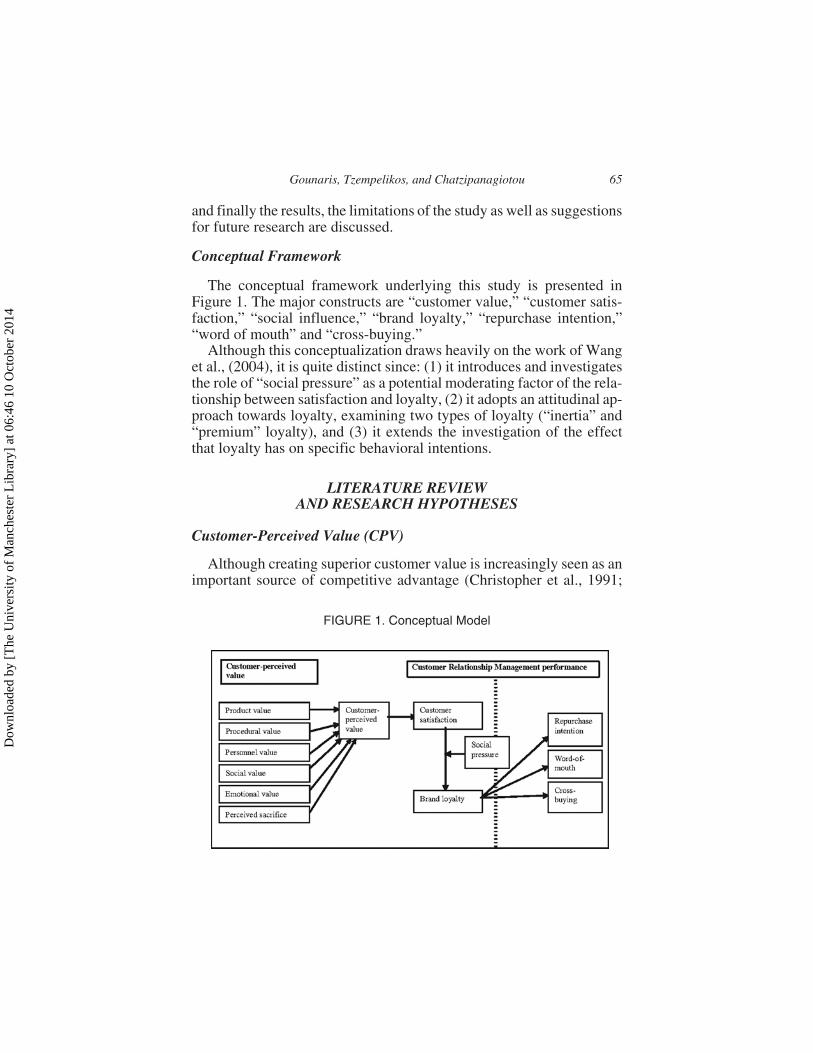
Conceptual Framework
The conceptual framework underlying this study is presented inFigure 1. The major constructs are “customer value,” “customer satis-faction,” “social influence,” “brand loyalty,” “repurchase intention,”“word of mouth” and “cross-buying.”
Although this conceptualization draws heavily on the work of Wanget al., (2004), it is quite distinct since: (1) it introduces and investigatesthe role of “social pressure” as a potential moderating factor of the rela-tionship between satisfaction and loyalty, (2) it adopts an attitudinal ap-proach towards loyalty, examining two types of loyalty (“inertia” and“premium” loyalty), and (3) it extends the investigation of the effectthat loyalty has on specific behavioral intentions.
LITERATURE REVIEWAND RESEARCH HYPOTHESES
Customer-Perceived Value (CPV)
Although creating superior customer value is increasingly seen as animportant source of competitive advantage (Christopher et al., 1991;
Gounaris, Tzempelikos, and Chatzipanagiotou 65
FIGURE 1. Conceptual Model
Dow
nloa
ded
by [
The
Uni
vers
ity o
f M
anch
este
r L
ibra
ry]
at 0
6:46
10
Oct
ober
201
4
Ravald and Grönroos, 1996; Woodruff, 1997), its nature remains un-clear (Wang et al., 2004), probably because it is quite subjective anddynamic (Khalifa, 2004).
Various authors have attempted to define CPV. For instance, Day(1990) proposes that CPV represents the difference between “customer’sperceived benefits” and “customer’s perceived costs.” Zeithaml (1988)suggests that CPV represents the “consumer’s overall assessment of theutility of a product1 based on perceptions of what is received and what isgiven,” a definition that introduces the subjective nature of CPV. Differ-ences on personal values, needs and preferences as well as in terms offinancial ability (Ravald and Grönroos, 1996) lead different individualsto hold different perceptions of what a product offers (means-end theory),as Gutman (1982, 1991), Peter and Olson (1987), and Huber et al. (2001)describe in detail. In fact, following the means-end paradigm, Woodruff(1997) defines customer value as the customer’s preference for thoseproduct attributes, performances and consequences that satisfy his/herown goals and purposes.
However, despite the differences in conceiving customer value, thereis some common ground. For instance, “value” is always conceived as asubjective notion (Doyle, 1989). Also, there is consensus regarding theexistence of a trade-off between what customers receive and what theysacrifice. The latter explains why, traditionally, customer value is seenas a function of quality and price. Nevertheless, since the 1990s variousauthors suggest alternative, more integrated, ways for conceiving “cus-tomer value.”
An early attempt to derive a classification of these product attributesthat are important for the consumer resulted in a five-element scheme:functional value, social value, emotional value, epistemic value (refer-ring to the surprise or novelty element of a product) and conditionalvalue (capturing the effects of a specific situation when value is per-ceived) (Sheth et al., 1991). More recently, Sweeney and Soutar (2001)introduced a modified model (“PERVAL”), in which they suggestedthe decomposition of the functional dimension of value to “quality” and“price” value and advised the elimination of the epistemic and condi-tional elements of CPV.
However, when considering the notion of CPV it is important to takeinto account the fact that for many products consumers derive morevalue from the product’s intangible (service) aspect. This is the case, forinstance, with motor vehicles, personal computers and so on (Berry,1980; Cronin et al., 1997). According to Lovelock (2001), the utility thatconsumers derive from the intangible part of the product they purchase
66 JOURNAL OF RELATIONSHIP MARKETING
Dow
nloa
ded
by [
The
Uni
vers
ity o
f M
anch
este
r L
ibra
ry]
at 0
6:46
10
Oct
ober
201
4
is a function of the company’s employees and the company’s servicedelivery procedures and operations.
Thus, in conceptualizing the notion of CPV the present study as-cribes to its multidimensional and subjective nature, as described byvarious authors (e.g., Wang et al., 2004; Sweeney and Soutar, 2001;Sheth et al., 1991), but at the same time, we suggest the need for broad-ening the scope of CPV to incorporate “personnel value” (i.e., the utilityconsumers derive from service personnel skills and capabilities) and“procedural value” (referring to the utility customers receive throughthe company’s service delivery procedures and operations). To this end,in this study we conceive CPV as a function of six elements, namelyProduct value (+), Procedural value (+), Personnel value (+), Emotionalvalue (+), Social value (+) and Perceived sacrifice (–).
CPV and Customer Satisfaction
The importance of customer satisfaction in achieving business goalsand its impact on business performance has been widely acknowledged(e.g., Anderson et al., 1994; Bolton, 1998). In conceptualizing custom-ers’ degree of satisfaction, two research streams have emerged: the“transaction-specific” satisfaction and the “overall” or cumulative satisfac-tion (Bolton and Drew, 1991; Boulding et al., 1993). From the transaction-specific perspective, customer satisfaction is viewed as a post-choiceevaluation of a specific purchase occasion (Oliver, 1980, 1981). In con-trast, the cumulative perspective suggests that satisfaction accumulatesacross a series of experiences with the product which result to an overallevaluation over time (Anderson et al., 1994; Fornell, 1992). Becausecumulative satisfaction is a fundamental indicator of the firm’s past,current, and future performance (Lam et al., 2004), in this study the focusis on the cumulative perspective of satisfaction.
According to the disconfirmation paradigm (Parasuraman et al.,1988), the consumer’s degree of overall satisfaction is a function ofthe value the customer expects in relation to the value actually received.Although the disconfirmation paradigm has been heavily criticized, par-ticularly when it comes to methodology and measurement issues (e.g.,Teas, 1993; Cronin and Taylor, 1994), its theoretical value and contri-bution in conceiving the impact of value upon customer satisfactionremains unquestioned.
Consumers become satisfied when receiving “adequate doses” ofvalue from the products they buy, within a broader expectancy-disconfirmation framework (Oliver, 1981). The consumer first forms
Gounaris, Tzempelikos, and Chatzipanagiotou 67
Dow
nloa
ded
by [
The
Uni
vers
ity o
f M
anch
este
r L
ibra
ry]
at 0
6:46
10
Oct
ober
201
4
(based on personal needs, values, experiences as well as on extrinsiccues) specific expectations regarding the value she/he wishes and antic-ipates to receive from the product. Post purchase experiences reveal thelevel of value each individual accumulates from the choice she/he made(CPV). When CPV exceeds the individual’s expectancy, the consumeris satisfied (Anderson et al., 1994), and thus, satisfaction becomes afunction of CPV (Ravald and Grönroos, 1996; Fornell et al., 1996) be-cause expectations serve merely as the basis for comparison purposesand do not influence satisfaction (e.g., Churchill and Suprenant, 1982;Oliver and DeSarbo, 1988).
Recently (Wang et al., 2004) used the scale for assessing CPV devel-oped by Sweeney and Soutar (2001) to explain customer satisfactionand loyalty. Their findings show that satisfactions as well as loyaltyare related to CPV. However, since CPV comprises elements that carrypositive and negative utility for the consumer, it follows that the former(positive utility elements) will serve as satisfaction drivers, while thelatter (negative utility element) will reduce the overall level of con-sumer’s satisfaction with a product. On these grounds, we suggest thefollowing hypotheses:
H1a.Perceived sacrifice will relate negatively with customer satis-faction.
H1b.The remaining five dimensions of perceived value will relatepositively with customer satisfaction.
Customer Satisfaction and Brand Loyalty
With regard to brand loyalty, two major alternative approaches, thebehavioral and the attitudinal have emerged. The former conceivesloyalty in terms of repeated purchases of the same brand over time (e.g.,Cunningham, 1956; Kuehn, 1962). This approach, though widely used,is insufficient to explain the forming mechanisms that explain the patternof repeated purchases (Dick and Basu, 1994; Knox and Walker, 2001).On the contrary, the attitudinal perspective in conceiving loyalty offersan interesting insight towards this direction by going beyond repetitivepurchase (Jacoby and Kyner, 1973) implying a favorable attitude and acommitment towards a specific brand as antecedents of a repeatedlypurchasing behavior (Wong and Sohal, 2003; Quester and Lim, 2003).
Recently, a third perspective in conceptualizing brand loyalty hasalso emerged (Ha, 1998). Based on the reasoned action theory, this thirdperspective suggests that pressures and influences from the social en-
68 JOURNAL OF RELATIONSHIP MARKETING
Dow
nloa
ded
by [
The
Uni
vers
ity o
f M
anch
este
r L
ibra
ry]
at 0
6:46
10
Oct
ober
201
4
vironment explain the consumer’s pattern of repeated purchases of aspecific brand. In fact, the social influences can be so coercive that al-though the consumer may have an unfavorable attitude towards a brand,she/he decides to buy it to avoid for instance, the criticism from itssocial environment.
Gounaris and Stathakopoulos (2004) attempted to combine the threeprevailing approaches. Their study reveals four specific types of loy-alty, namely Premium Loyalty, Covetous Loyalty, Inertia Loyalty andNo Loyalty. More specifically, premium loyalty represents the highestlevel of loyalty since premium loyal consumers have a favorable attitudetowards the brand, they repeatedly purchase it and, also, they have the ap-proval of their social environment for doing so. Inertia loyalty on theother hand is much weaker. Although it encompasses a pattern ofrepeated purchases, it lacks both affectional and social reinforcement.Habitual or convenience-seeking behavior can explain the pattern ofrepeated purchases. Covetous loyalty is quite different from both pre-mium and inertia loyalty in the sense that it does not involve purchasingof the brand. However, covetous loyal consumers have grown positivefeelings and affection for the brand. The social environment reinforcesthis attitude. Such consumers are important for the company because ofthe income they indirectly generate through influencing the choicesof peers, relatives, and friends and so on.
The importance of customer satisfaction and loyalty is that they helpcompanies to achieve market and financial objectives (e.g., Oliver et al.,1997; Fornell, 1992; Hesket et al., 1997). Companies deliver satisfac-tion in anticipation of gaining their customer’s loyalty (Oliver, 1999).Satisfied customers develop (what McDougall and Levesque, 2000,p. 295, call) “loyalty intentions,” that is, willingness to repurchase abrand, which is the prime concern of the company. However, covet-ous loyalty does not encompass a purchasing behavior (Gounaris andStathakopoulos, 2004), and thus the focus of this study is on premiumand inertia loyalty, the two types of loyalty that directly influence thecompany’s market and financial performance.
According to Oliver (1999), the relationship between satisfaction andloyalty is not straight-forward. For instance, social forces help to achievethe “transformation” of satisfaction to loyalty. Given the conceptualdifference between “premium” and “inertia” loyalty discussed earlier,satisfaction would relate with the development of the former because pre-mium loyalty develops as a result of both satisfactory experiences thathelp develop a positive attitude towards the brand and social embracementof the consumer’s choice. On the other hand, repeated purchases due to,
Gounaris, Tzempelikos, and Chatzipanagiotou 69
Dow
nloa
ded
by [
The
Uni
vers
ity o
f M
anch
este
r L
ibra
ry]
at 0
6:46
10
Oct
ober
201
4
say, reasons of convenience or habit (inertia loyalty) will be unrelatedwith satisfaction. On these grounds, the following hypotheses are inves-tigated:
H2a.Customer satisfaction has a positive relation with PremiumLoyalty.
H2b.Customer satisfaction is unrelated with Inertia Loyalty.
However, following the reasoned action paradigm, the consumers’patterns of purchases are susceptible to influences from their social en-vironment (Ha, 1998; Oliver, 1999). Even in the cases where the con-sumer has not developed a strong allegiance with the brand, socialsupport of his/her choice can lead him/her to “village envelopment”(Oliver, 1999), that is, repeated purchases that the social environmentespouses, which eventually leads to conditioned affective commit-ment to the brand. In other word, the individual could learn to like thebrand. The opposite could also stand: strong negative social pressuremay deter a consumer from buying a brand although he/she initiallyheld a positive attitude. On these grounds the following hypothesis isinvestigated:
H3. Pressures from the social environment moderate the relation-ship between customer satisfaction and premium brand loyalty.
Behavioral Intentions
Customer’s behavior intentions are indicators of their willingness tokeep a sustainable relationship with the company or not to do so (Zeithamlet al., 1996). This is important because, particularly in mature markets,retaining existing customers appears to be financially sounder thanattracting new customers from competition (e.g., Rust et al., 2000;Christopher et al., 1991; Reichheld and Sasser, 1990).
Apart from some noticeable recent exceptions (Wang et al., 2004;Gounaris and Stathakopoulos, 2004), the relationship between con-sumer’s behavioral intentions and brand loyalty has received little em-pirical investigation. Apparently, this lack of empirical research stemsfrom the fact that researchers tend to consider loyalty as a behavior ofrepeated purchases and not as an attitude (e.g., Boulding et al., 1993;
70 JOURNAL OF RELATIONSHIP MARKETING
Dow
nloa
ded
by [
The
Uni
vers
ity o
f M
anch
este
r L
ibra
ry]
at 0
6:46
10
Oct
ober
201
4
Olsen, 2002). However, according to the attitudinal approach towardsloyalty, this is not necessarily the case.
One of the most expected behavioral outcomes of loyalty is brand ad-vocating. Consumers become loyal as a result of the satisfaction theyexperience (Ajzen and Fishbein, 1980) and satisfied consumers are, admit-tedly, the best advocators of any company and its products (Greenleafand Lehmann, 1993). In fact, as Oliver (1999) suggests, it is the sharingof the experience regarding the brand that, in certain cases, provides thesatisfaction and not the brand itself. However, implied in this relationbetween word-of-mouth and loyalty is that the consumer has developeda positive attitude towards the brand as a result of the value she/hereceived (Gounaris and Stathakopoulos, 2004). In other words, a stateof “premium loyalty” is required before the consumer can really be abrand advocator. The same appears to be true when it comes to repeatpurchase and cross-buying intentions too, as literature suggests (e.g.,Bolton et al., 2004; Szmigin and Bourne, 1998).
With regard to “inertia loyalty,” consumers repeatedly purchase butthey do so out of habit or convenience, not with any emotional commit-ment towards the brand. This implies that the relationship between iner-tia loyalty and repurchase intention is weak (Dick and Basu, 1994): ifany of the circumstances (e.g., convenience) that drive consumers’ be-havior change, the consumer will not hesitate to switch brand. This isin line with the argument that past behavior is not necessarily the bestpredictor for customers’ behavioral intentions (Bagozzi and Warshaw,1990). Therefore, inertia loyal consumers do not have repeat purchaseintentions neither they have the intention to purchase additional prod-ucts from the same company or become advocators of the company’sproducts. On these grounds, the next few hypotheses are investigated:
H4a.The development of premium loyalty relates to repurchaseintention, positive word-of-mouth communication and cross-purchases from the same company.
H4b.Repurchase intention, positive word-of-mouth communicationand cross-buying are unrelated with inertia loyalty.
RESEARCH METHODOLOGY
The data presented in this manuscript derives from a study focusingon the automobile sector in Greece. The decision to focus on this sector
Gounaris, Tzempelikos, and Chatzipanagiotou 71
Dow
nloa
ded
by [
The
Uni
vers
ity o
f M
anch
este
r L
ibra
ry]
at 0
6:46
10
Oct
ober
201
4
was taken because of the remarkable variety of alternative producersand brands, as well as the considerable width and depth of each carmanufacturer’s product-line. Therefore, customers have many options,a fact that eliminates the probability that the lack of an attractive offer-ing guides the final choice of the consumer.
The telephone directory served as sample frame to produce a ran-domized sample. More specific, one sample unit was selected every500 registered telephone users. If the respondent did not own a car, thenext telephone user was picked. This process resulted in a sample com-prising 1,050 car owners. In total, 170 completed questionnaires wereproduced through telephone computer-assisted interviewing (CATI),giving a response rate of 16%.
With regard to variables measurement, Product Value (� = 0.85) wasmeasured using the 5-item scale developed by Dodds et al. (1991). So-cial Value (� = 0.95), Perceived Sacrifice (� = 0.80) and EmotionalValue (� = 0.92) measures relied on the work of Wang et al. (2004) andSweeney and Soutar (2001). With regard to Personnel Value (� = 0.88)and Procedural Value (� = 0.81), new measures were developed sincethe review of existing literature did not reveal any relevant instrument.In doing so, the procedure suggested by Churchill (1979) was followed.Customer Satisfaction (� = 0.91) was based on a scale adapted fromOliver and Swan (1989) and Westbrook and Oliver (1981). The work ofGounaris and Stathakopoulos (2004) served as the basis to measurePremium and Inertia Loyalty (� = 0.78 and � = 0.66, respectively)as well as Social Pressure (� = 0.78). In order to assess Word of mouth(� = 0.87), the measure of Zeithaml et al. (1996) was employed. Finally,Cross-buying (� = 0.78) and Repurchase Intention were assessed witha 3-item scale and a single-item measure, respectively.
Prior to its implementation, the final research instrument was pre-tested with a subsample of 20 respondents, a procedure that allowedrectifying wording issues as well as the respondent’s ability to com-prehend what each question attempted to assess.
DATA ANALYSIS
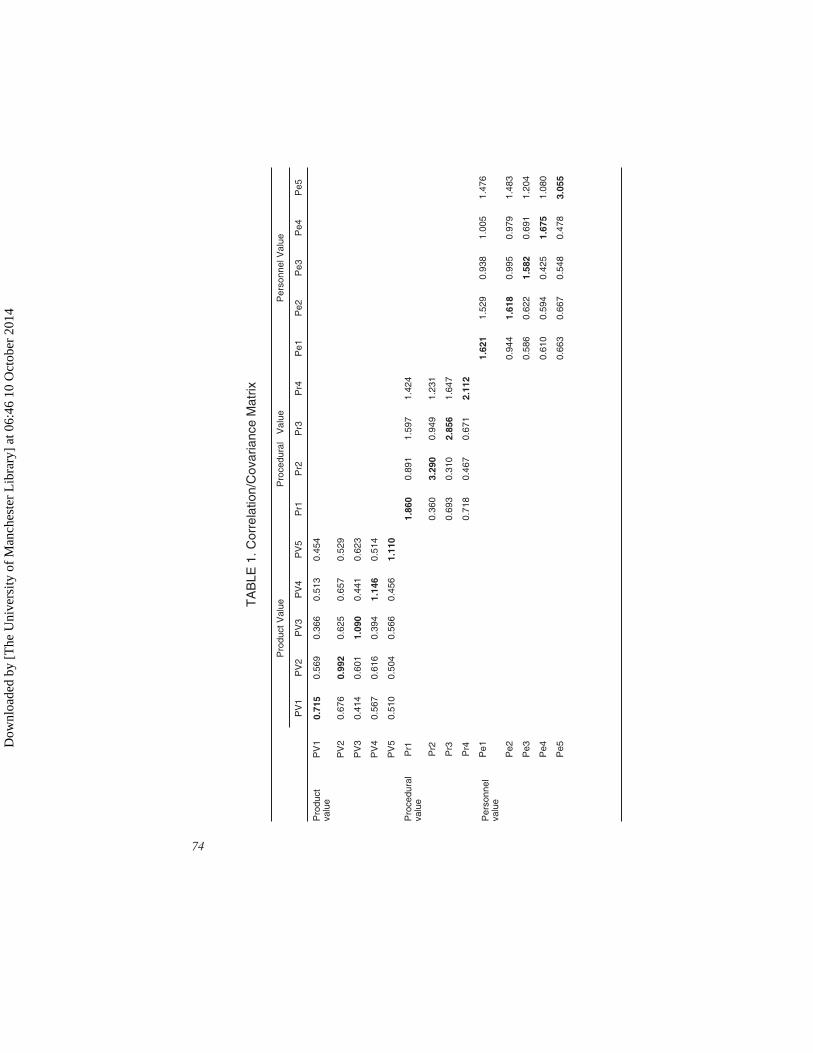
Because this study adopts a conception of CPV that no previousresearch has employed, the first phase of the data analysis seeks toexamine the validity of our conception, while the next phase involvesthe testing of the hypotheses put forward in this manuscript. In the fol-
72 JOURNAL OF RELATIONSHIP MARKETING
Dow
nloa
ded
by [
The
Uni
vers
ity o
f M
anch
este
r L
ibra
ry]
at 0
6:46
10
Oct
ober
201
4
Dow
nloa
ded
by [
The
Uni
vers
ity o
f M
anch
este
r L
ibra
ry]
at 0
6:46
10
Oct
ober
201
4
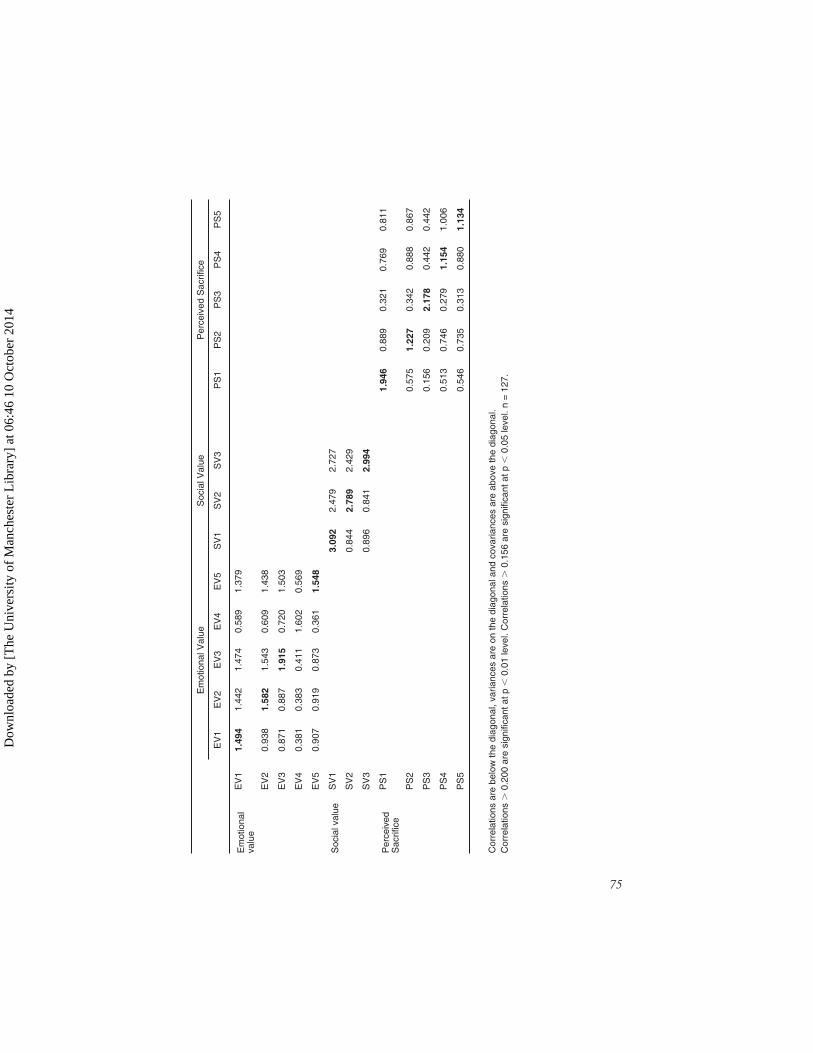
TA
BLE
1.C
orre
latio
n/C
ovar
ianc
eM
atrix
Pro
duct
Val
ueP
roce
dura
lV
alue
Per
sonn
elV
alue
PV
1P
V2
PV
3P
V4
PV
5P
r1P
r2P
r3P
r4P
e1P
e2P
e3P
e4P
e5
Pro
duct
valu
eP
V1
0.71
50.
569
0.36
60.
513
0.45
4
PV
20.
676
0.99
20.
625
0.65
70.
529
PV
30.
414
0.60
11.
090
0.44
10.
623
PV
40.
567
0.61
60.
394
1.14
60.
514
PV
50.
510
0.50
40.
566
0.45
61.
110
Pro
cedu
ral
valu
eP
r11.
860
0.89
11.
597
1.42
4
Pr2
0.36
03.
290
0.94
91.
231
Pr3
0.69
30.
310
2.85
61.
647
Pr4
0.71
80.
467
0.67
12.
112
Per
sonn
elva
lue
Pe1
1.62
11.
529
0.93
81.
005
1.47
6
Pe2
0.94
41.
618
0.99
50.
979
1.48
3
Pe3
0.58
60.
622
1.58
20.
691
1.20
4
Pe4
0.61
00.
594
0.42
51.
675
1.08
0
Pe5
0.66
30.
667
0.54
80.
478
3.05
5
74
Dow
nloa
ded
by [
The
Uni
vers
ity o
f M
anch
este
r L
ibra
ry]
at 0
6:46
10
Oct
ober
201
4
Em
otio
nalV
alue
Soc
ialV
alue
Per
ceiv
edS
acrif
ice
EV
1E
V2
EV
3E
V4
EV
5S
V1
SV
2S
V3
PS
1P
S2
PS
3P
S4
PS
5
Em
otio
nal
valu
eE
V1
1.49
41.
442
1.47
40.
589
1.37
9
EV
20.
938
1.58
21.
543
0.60
91.
438
EV
30.
871
0.88
71.
915
0.72
01.
503
EV
40.
381
0.38
30.
411
1.60
20.
569
EV
50.
907
0.91
90.
873
0.36
11.
548
Soc
ialv
alue
SV
13.
092
2.47
92.
727
SV
20.
844
2.78
92.
429
SV
30.
896
0.84
12.
994
Per
ceiv
edS
acrif
ice
PS
11.
946
0.88
90.
321
0.76
90.
811
PS
20.
575
1.22
70.
342
0.88
80.
867
PS
30.
156
0.20
92.
178
0.44
20.
442
PS
40.
513
0.74
60.
279
1.15
41.
006
PS
50.
546
0.73
50.
313
0.88
01.
134
Cor
rela
tions
are
belo
wth
edi
agon
al,v
aria
nces
are
onth
edi
agon
alan
dco
varia
nces
are
abov
eth
edi
agon
al.
Cor
rela
tions
�0.
200
are
sign
ifica
ntat
p�
0.01
leve
l.C
orre
latio
ns�
0.15
6ar
esi
gnifi
cant
atp
�0.
05le
vel.
n=
127.
75
Dow
nloa
ded
by [
The
Uni
vers
ity o
f M
anch
este
r L
ibra
ry]
at 0
6:46
10
Oct
ober
201
4
76 JOURNAL OF RELATIONSHIP MARKETING
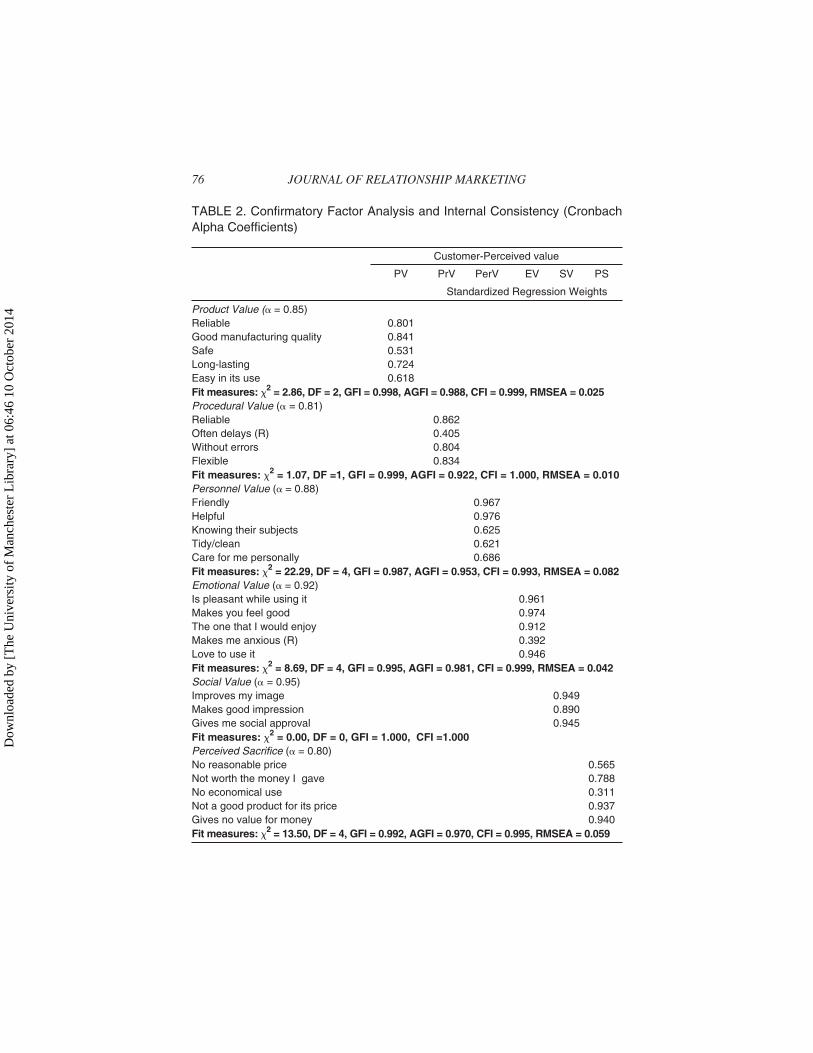
TABLE 2. Confirmatory Factor Analysis and Internal Consistency (CronbachAlpha Coefficients)
Customer-Perceived value
PV PrV PerV EV SV PS
Standardized Regression Weights
Product Value (� = 0.85)Reliable 0.801Good manufacturing quality 0.841Safe 0.531Long-lasting 0.724Easy in its use 0.618Fit measures: 2 = 2.86, DF = 2, GFI = 0.998, AGFI = 0.988, CFI = 0.999, RMSEA = 0.025Procedural Value (� = 0.81)Reliable 0.862Often delays (R) 0.405Without errors 0.804Flexible 0.834Fit measures: 2 = 1.07, DF =1, GFI = 0.999, AGFI = 0.922, CFI = 1.000, RMSEA = 0.010Personnel Value (� = 0.88)Friendly 0.967Helpful 0.976Knowing their subjects 0.625Tidy/clean 0.621Care for me personally 0.686Fit measures: 2 = 22.29, DF = 4, GFI = 0.987, AGFI = 0.953, CFI = 0.993, RMSEA = 0.082Emotional Value (� = 0.92)Is pleasant while using it 0.961Makes you feel good 0.974The one that I would enjoy 0.912Makes me anxious (R) 0.392Love to use it 0.946Fit measures: 2 = 8.69, DF = 4, GFI = 0.995, AGFI = 0.981, CFI = 0.999, RMSEA = 0.042Social Value (� = 0.95)Improves my image 0.949Makes good impression 0.890Gives me social approval 0.945Fit measures: 2 = 0.00, DF = 0, GFI = 1.000, CFI =1.000Perceived Sacrifice (� = 0.80)No reasonable price 0.565Not worth the money I gave 0.788No economical use 0.311Not a good product for its price 0.937Gives no value for money 0.940Fit measures: 2 = 13.50, DF = 4, GFI = 0.992, AGFI = 0.970, CFI = 0.995, RMSEA = 0.059
Dow
nloa
ded
by [
The
Uni
vers
ity o
f M
anch
este
r L
ibra
ry]
at 0
6:46
10
Oct
ober
201
4
The results regarding the test of H2 are presented in Table 5. Therelationship between satisfaction and premium loyalty (H2a) is quitestrong (� = 0.25) and statistically significant, while inertia loyalty is notsignificantly related with satisfaction (H2b). Hence, H2 is accepted.
H3 suggests that social pressure moderates the influence of satisfac-tion on premium loyalty. Testing H3 requires moderated regression anal-ysis. Arnold (1982) offers a detailed description of this type of regression
Gounaris, Tzempelikos, and Chatzipanagiotou 77
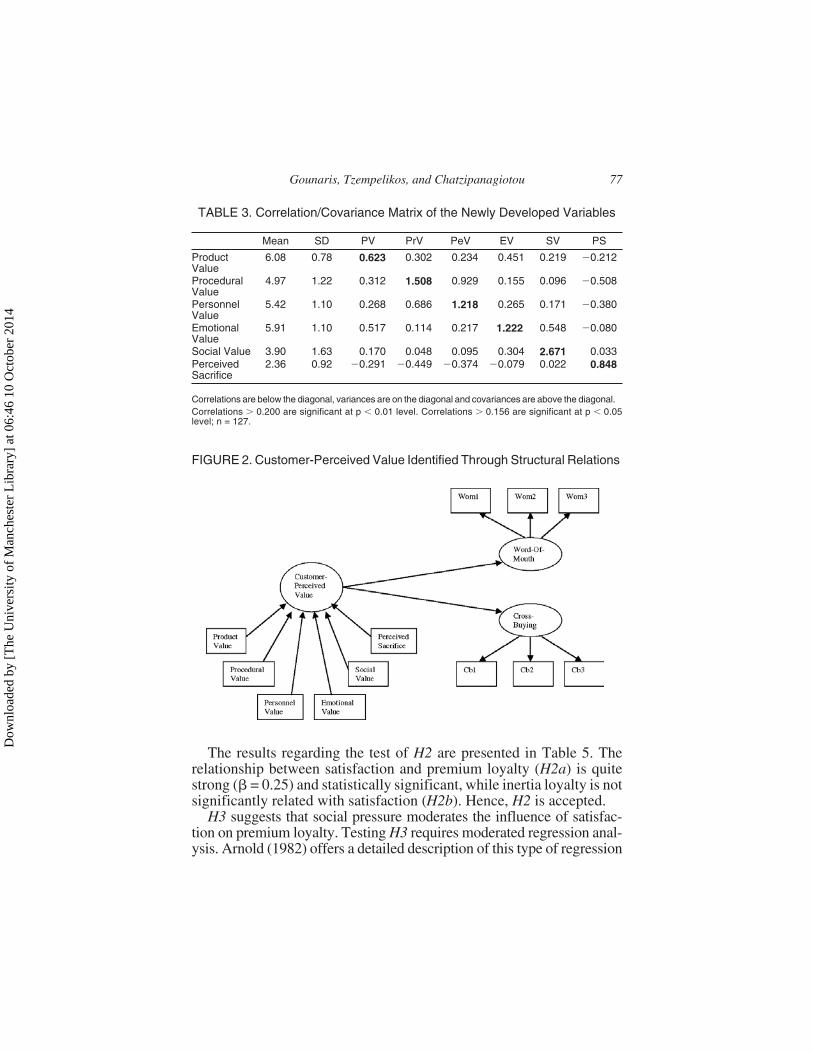
TABLE 3. Correlation/Covariance Matrix of the Newly Developed Variables
Mean SD PV PrV PeV EV SV PS
ProductValue
6.08 0.78 0.623 0.302 0.234 0.451 0.219 �0.212
ProceduralValue
4.97 1.22 0.312 1.508 0.929 0.155 0.096 �0.508
PersonnelValue
5.42 1.10 0.268 0.686 1.218 0.265 0.171 �0.380
EmotionalValue
5.91 1.10 0.517 0.114 0.217 1.222 0.548 �0.080
Social Value 3.90 1.63 0.170 0.048 0.095 0.304 2.671 0.033PerceivedSacrifice
2.36 0.92 �0.291 �0.449 �0.374 �0.079 0.022 0.848
Correlations are below the diagonal, variances are on the diagonal and covariances are above the diagonal.Correlations � 0.200 are significant at p � 0.01 level. Correlations � 0.156 are significant at p � 0.05level; n = 127.
FIGURE 2. Customer-Perceived Value Identified Through Structural Relations
Dow
nloa
ded
by [
The
Uni
vers
ity o
f M
anch
este
r L
ibra
ry]
at 0
6:46
10
Oct
ober
201
4
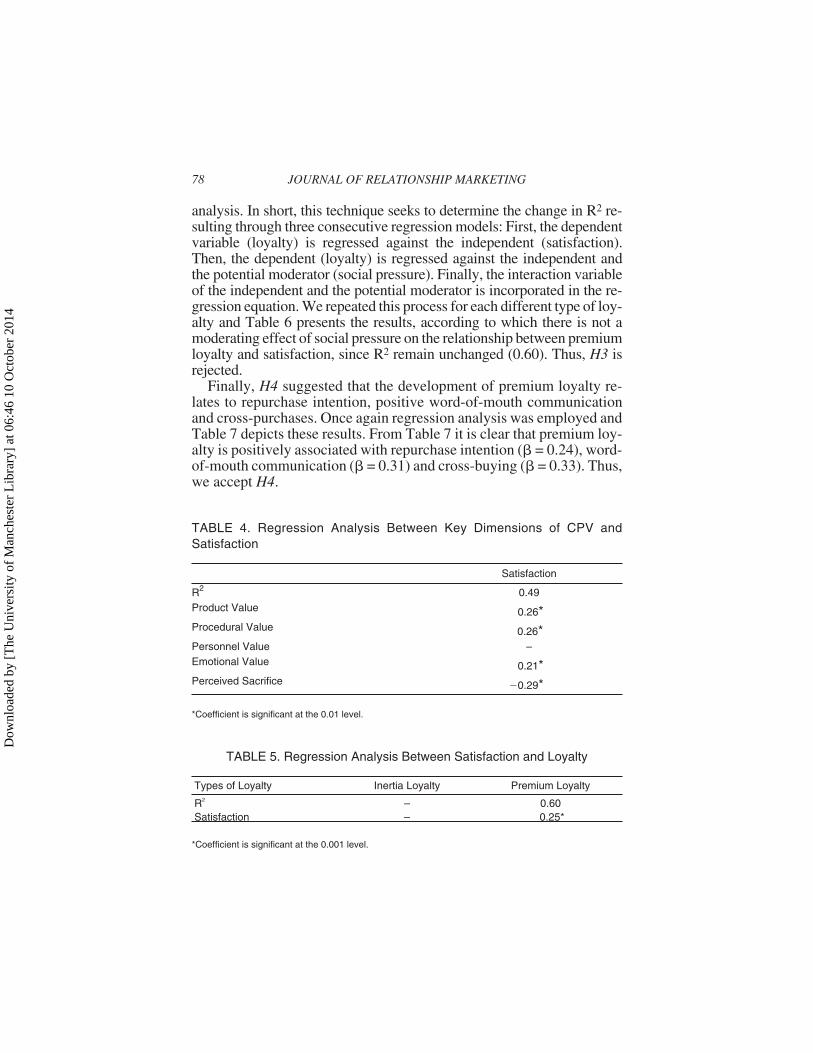
analysis. In short, this technique seeks to determine the change in R2 re-sulting through three consecutive regression models: First, the dependentvariable (loyalty) is regressed against the independent (satisfaction).Then, the dependent (loyalty) is regressed against the independent andthe potential moderator (social pressure). Finally, the interaction variableof the independent and the potential moderator is incorporated in the re-gression equation. We repeated this process for each different type of loy-alty and Table 6 presents the results, according to which there is not amoderating effect of social pressure on the relationship between premiumloyalty and satisfaction, since R2 remain unchanged (0.60). Thus, H3 isrejected.
Finally, H4 suggested that the development of premium loyalty re-lates to repurchase intention, positive word-of-mouth communicationand cross-purchases. Once again regression analysis was employed andTable 7 depicts these results. From Table 7 it is clear that premium loy-alty is positively associated with repurchase intention (� = 0.24), word-of-mouth communication (� = 0.31) and cross-buying (� = 0.33). Thus,we accept H4.
78 JOURNAL OF RELATIONSHIP MARKETING
TABLE 4. Regression Analysis Between Key Dimensions of CPV andSatisfaction
Satisfaction
R2 0.49Product Value 0.26*Procedural Value 0.26*Personnel Value –Emotional Value 0.21*Perceived Sacrifice �0.29*
*Coefficient is significant at the 0.01 level.
TABLE 5. Regression Analysis Between Satisfaction and Loyalty
Types of Loyalty Inertia Loyalty Premium Loyalty
R2 – 0.60Satisfaction – 0.25*
*Coefficient is significant at the 0.001 level.
Dow
nloa
ded
by [
The
Uni
vers
ity o
f M
anch
este
r L
ibra
ry]
at 0
6:46
10
Oct
ober
201
4
DISCUSSION AND IMPLICATIONS
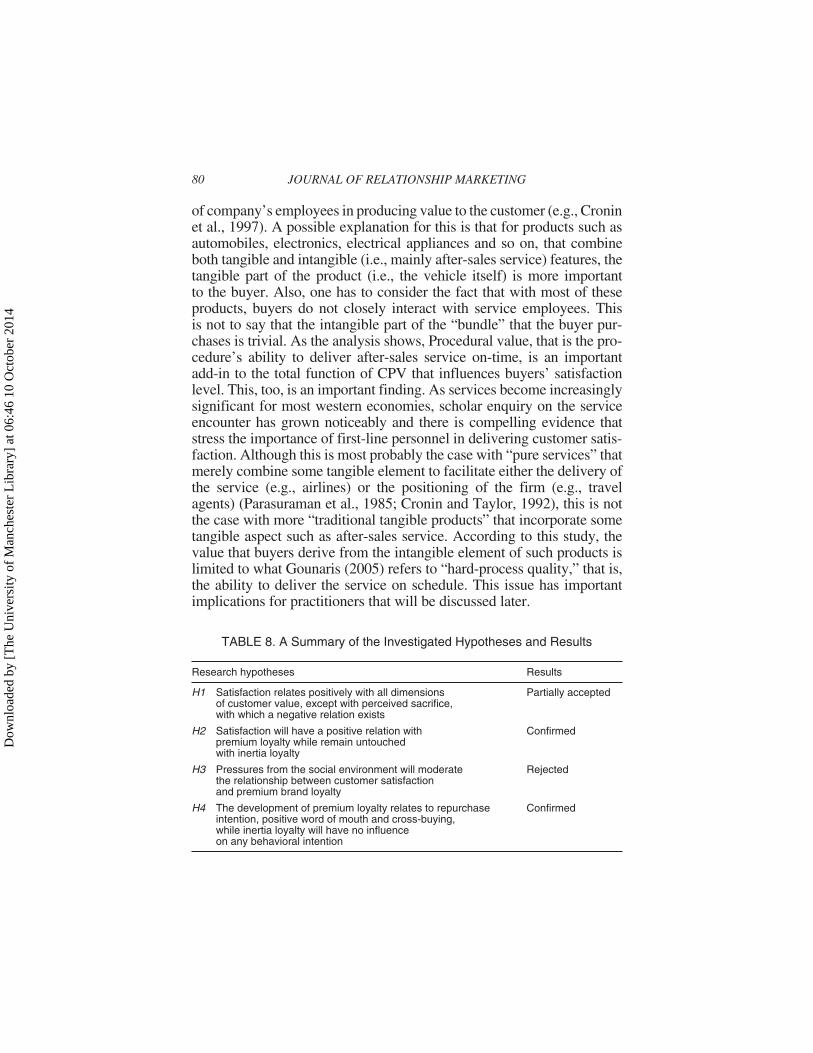
This study has significant implications for both scholars and practi-tioners. A first implication for academics is the formative conceptual-ization of CPV. Without resolving the issue, the findings from thisstudy appear to suggest that it represents a formative second-order con-struct. As this study suggests, five value dimensions form the notion ofCPV, namely product value, procedural value, personnel value, emo-tional value and perceived sacrifice. Although studying CPV in detailand validating an instrument to measure it is clearly beyond the scope ofthis study, this is an important finding because it provides scholars witha fresh insight regarding a very important notion for marketing scienceand practice for which, so far, its conceptualization and assessmentremain obscured (e.g., Day, 1990; Ravald and Grönroos, 1996; Huberet al., 2001). The issue is further raised in the “Limitations and FutureResearch” section of the manuscript.
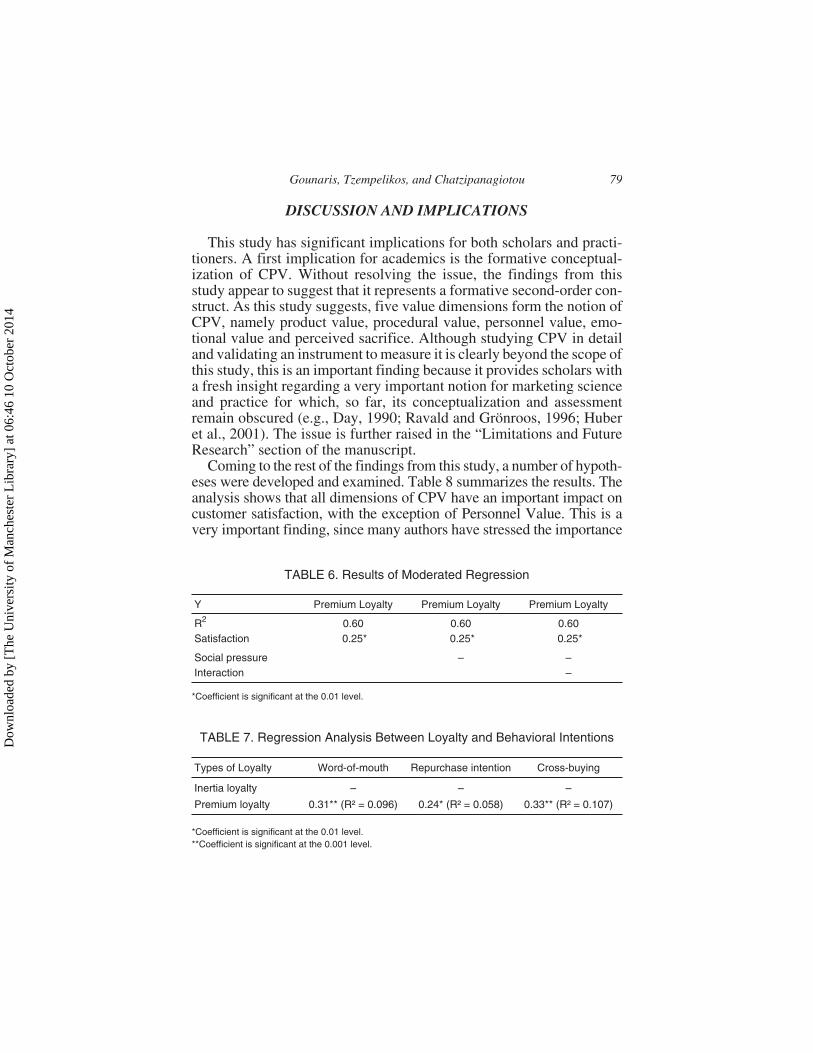
Coming to the rest of the findings from this study, a number of hypoth-eses were developed and examined. Table 8 summarizes the results. Theanalysis shows that all dimensions of CPV have an important impact oncustomer satisfaction, with the exception of Personnel Value. This is avery important finding, since many authors have stressed the importance
Gounaris, Tzempelikos, and Chatzipanagiotou 79
TABLE 6. Results of Moderated Regression
Y Premium Loyalty Premium Loyalty Premium Loyalty
R2 0.60 0.60 0.60Satisfaction 0.25* 0.25* 0.25*
Social pressure – –Interaction –
*Coefficient is significant at the 0.01 level.
TABLE 7. Regression Analysis Between Loyalty and Behavioral Intentions
Types of Loyalty Word-of-mouth Repurchase intention Cross-buying
Inertia loyalty – – –
Premium loyalty 0.31** (R² = 0.096) 0.24* (R² = 0.058) 0.33** (R² = 0.107)
*Coefficient is significant at the 0.01 level.**Coefficient is significant at the 0.001 level.
Dow
nloa
ded
by [
The
Uni
vers
ity o
f M
anch
este
r L
ibra
ry]
at 0
6:46
10
Oct
ober
201
4
of company’s employees in producing value to the customer (e.g., Croninet al., 1997). A possible explanation for this is that for products such asautomobiles, electronics, electrical appliances and so on, that combineboth tangible and intangible (i.e., mainly after-sales service) features, thetangible part of the product (i.e., the vehicle itself) is more importantto the buyer. Also, one has to consider the fact that with most of theseproducts, buyers do not closely interact with service employees. Thisis not to say that the intangible part of the “bundle” that the buyer pur-chases is trivial. As the analysis shows, Procedural value, that is the pro-cedure’s ability to deliver after-sales service on-time, is an importantadd-in to the total function of CPV that influences buyers’ satisfactionlevel. This, too, is an important finding. As services become increasinglysignificant for most western economies, scholar enquiry on the serviceencounter has grown noticeably and there is compelling evidence thatstress the importance of first-line personnel in delivering customer satis-faction. Although this is most probably the case with “pure services” thatmerely combine some tangible element to facilitate either the delivery ofthe service (e.g., airlines) or the positioning of the firm (e.g., travelagents) (Parasuraman et al., 1985; Cronin and Taylor, 1992), this is notthe case with more “traditional tangible products” that incorporate sometangible aspect such as after-sales service. According to this study, thevalue that buyers derive from the intangible element of such products islimited to what Gounaris (2005) refers to “hard-process quality,” that is,the ability to deliver the service on schedule. This issue has importantimplications for practitioners that will be discussed later.
80 JOURNAL OF RELATIONSHIP MARKETING
TABLE 8. A Summary of the Investigated Hypotheses and Results
Research hypotheses Results
H1 Satisfaction relates positively with all dimensionsof customer value, except with perceived sacrifice,with which a negative relation exists
Partially accepted
H2 Satisfaction will have a positive relation withpremium loyalty while remain untouchedwith inertia loyalty
Confirmed
H3 Pressures from the social environment will moderatethe relationship between customer satisfactionand premium brand loyalty
Rejected
H4 The development of premium loyalty relates to repurchaseintention, positive word of mouth and cross-buying,while inertia loyalty will have no influenceon any behavioral intention
Confirmed
Dow
nloa
ded
by [
The
Uni
vers
ity o
f M
anch
este
r L
ibra
ry]
at 0
6:46
10
Oct
ober
201
4
Another important finding is that social pressure does not appear tomoderate the relationship between satisfaction and Premium loyalty.Previous researchers have acknowledged the role of social influence onforming consumer’s attitudes and behaviors (e.g., Bearden et al., 1989).According to these findings, consumers tend to conform to the expecta-tions of their peers, frequently making choices other than the ones theywould have done in the first place.
However, in certain cases, the influence of social pressure on con-sumer’s behavior can be rather weak, particularly when the productcategory represents a necessity (Bearden and Etzel, 1982). In suchcases, the consumer’s attitude towards the brand and his/her subsequentbehavior is more a function of personal experience and satisfaction thansocial pressure (Mourali et al., 2005). Our study adds to these findingsby demonstrating that some principles apply also for high-involvementproduct categories, such as automobiles.
The study has also several implications for practitioners. To startwith, firms should not focus exclusively on the building and deliveringfunctional utility to the customers, since other dimensions, such as emo-tional value, are equally important in terms of Perceived value.
Managers should also be very cautious when it comes to services thataccompany high-involvement products. While Procedural value ap-pears to be a satisfaction driver, the satisfaction of the buyers of suchproducts is unrelated to the value they perceive they derive from thecompany’s first-line personnel. Hence, companies competing in suchindustries would be better-off to focus on hard-process quality, designeffective and efficient service provision blueprints and ensure that theymeet both their customers’ expectations as well as their own promises.Emphasis on managing the customer’s encounter with their service per-sonnel may consummate significant effort and resources, but will mostprobably not impact the level of customer satisfaction.
Finally, another important implication pertains to the lack of a mod-erating effect from social pressure to the relationship between Premiumloyalty and Satisfaction. Consistently with relationship marketing the-ory, managers producing high-involvement products need to work onbuilding customer satisfaction to deliver premium loyal customers. Forsuch companies their bonding strategy should focus on developingproduct, emotional and procedural value rather than spending resourceson customers networking (Gounaris, 2005). For instance, in the auto-mobile industry, organizing social clubs of car owners, team activitiesand so on, although they may help develop a social network among theircustomers, eventually has no impact on the degree of their loyalty.
Gounaris, Tzempelikos, and Chatzipanagiotou 81
Dow
nloa
ded
by [
The
Uni
vers
ity o
f M
anch
este
r L
ibra
ry]
at 0
6:46
10
Oct
ober
201
4
LIMITATIONS AND FUTURE RESEARCH
This study is not free from limitations, which, nonetheless, futureresearch can tackle. A first limitation is the industry-specific sample(car industry) which may pose constraints on our ability to general-ize our findings. More products combining different proportions of tan-gible and intangible cues should be examined before the relationshipbetween customer value and satisfaction is clarified.
A second limitation concerns to the static nature of the study. Therelative importance of each dimension of customer value might changeover time since customers’ needs change continuously. Thus, a longitu-dinal study to explore the dynamics of customer value would be useful.
A third limitation pertains to the absence of intrinsic variables in theconceptual framework. Future research is not only welcomed towardsthis direction but also highly recommended, particularly in the light ofthe findings from this study regarding the lack of moderation from so-cial pressure on the relation between satisfaction and brand loyalty.
Furthermore, the dimensions of behavior intentions that were even-tually included in this study are not exhaustive. Future research mightenlarge the research agenda by incorporating additional behavior inten-tions such as intention to buy alternative brand or customers’ toleranceof price changes before they decide to change their regular brand.
Finally, the national context of the study (Greece) is also a concernsince it puts constraints on the generalizability of the results to other cul-tural contexts. Cultural factors influence consumer’s behavior and theformation of the consumer’s attitude (Hofstede, 2001). Hence, futureresearch which would replicate the study in different cultural contexts isnecessary before we can generalize the findings from this study.
NOTE
1. In this manuscript, the term “product” is defined as a synthesis of tangible goodsand intangible services a company offers to meet specific customer’s needs. In anygiven product, the proportion of the tangible and the intangible part varies accordingto the benefit the customer seeks from the purchase. For instance, when purchasing aPC a consumer mainly seeks benefits primarily from the hardware (tangible part of theproduct) and secondary from the service (intangible part of the product) the companyoffers. In other words, a “product” represents a specific bundle of benefits developedto meet a specific need of the consumer.
82 JOURNAL OF RELATIONSHIP MARKETING
Dow
nloa
ded
by [
The
Uni
vers
ity o
f M
anch
este
r L
ibra
ry]
at 0
6:46
10
Oct
ober
201
4
REFERENCES
Ajzen, I. and Fishbein, M. (1980), Understanding Attitudes and Predicting Social Be-havior, Prentice Hall, Englewood Cliffs, NJ.
Anderson, E.W., Fornell, C., and Lehmann, R.R. (1994), “Customer satisfaction, marketshare, and profitability: Findings from Sweden,” Journal of Marketing, Vol. 58,January, 53-66.
Arnold, H.J. (1982), “Moderator variables: A clarification of conceptual, analytic andpsychometric issues,” Organizational Behavior and Human Performance, No. 29,April, 253-268.
Bagozzi, R.P. and Warshaw, P.R. (1990), “Trying to consume,” Journal of ConsumerResearch, Vol. 17, 127-140.
Bagozzi, R.P. and Yi, Y. (1988), “On the evaluation of structural equation models,”Journal of the Academy of Marketing Science, Vol. 16, Winter, 74-94.
Bearden, W.O. and Etzel, M.J. (1982), “Reference group influence on product andbrand purchase decisions,” Journal of Consumer Research, Vol. 9, September,183-194.
Bearden, W.O., Netemeyer, R., and Teel, J.E. (1989), “Measurement of consumer sus-ceptibility to interpersonal influence,” Journal of Consumer Research, Vol. 15,March, 473-481.
Berry, L.L. (1980), “Services marketing is different,” Business Magazine, May-June,24-29.
Bolton, R.N. (1998), “A dynamic model of the duration of the customer’s relationshipwith a continuous service provider: The role of satisfaction,” Marketing Science,Vol. 17, No. 1, 45-65.
Bolton, R.N. and Drew, J.H. (1991), “A multistage model of customer’s assessments ofservice quality and value,” Journal of Consumer Research, Vol. 17, No. 4, 375-384.
Bolton, R.N., Lemon, K.N., and Verhoef, P.C. (2004), “The theoretical underpinningsof customer asset management: A framework and propositions for future research,”Journal of the Academy of Marketing Science, Vol. 32, No. 3, 271-292.
Boulding, W., Kalra, A., Staelin, R., and Zeithaml, V.A. (1993), “A dynamic processmodel of service quality: From expectations to behavioral intentions,” Journal ofMarketing Research, Vol. 30, February, 7-27.
Christopher, M., Payne, A., and Ballantyne, D. (1991), Relationship Marketing: Bring-ing Quality, Customer Service and Marketing Together, Butterworth-Heinmann,Oxford.
Churchill, G.A. Jr. (1979), “A paradigm for developing better measures of marketingconstructs,” Journal of Marketing Research, Vol. 16, No. 1, 64-73.
Churchill, G.A. Jr. and Suprenant, C. (1982), “An investigation into determinants ofcustomer satisfaction,” Journal of Marketing Research, Vol. 19, No. 4, November,460-469.
Cronin, J.J. and Taylor, S.A. (1992), “Measuring service quality: A re-examination andextension,” Journal of Marketing, Vol. 56, July, 55-68.
Cronin, J.J. and Taylor, S.A. (1994), “SERVPERF versus SERVQUAL: Reconcilingperformance-based and perceptions-minus-expectations measurement of servicequality,” Journal of Marketing, Vol. 58, No. 1, 125-131.
Gounaris, Tzempelikos, and Chatzipanagiotou 83
Dow
nloa
ded
by [
The
Uni
vers
ity o
f M
anch
este
r L
ibra
ry]
at 0
6:46
10
Oct
ober
201
4
Cronin, J.J., Brady, M.K., Brand, R.R., Hightower, R., and Shemwell, D.J. (1997), “Across-sectional test of the effect and conceptualization of service value,” The Journalof Services Marketing, Vol. 11, No. 6, 375-391.
Crosby, L.A., Evans, K.R., and Cowles, D. (1990), “Relationship quality in serviceselling: An interpersonal influence perspective,” Journal of Marketing, Vol. 54,68-81.
Cunningham, R.M. (1956), “Brand loyalty: What, where, how much?,” HarvardBusiness Review, Vol. 34, 116-128.
Day, G. (1990), Market-Driven Strategy: Processes for Creating Value, The Free Press,New York, NY.
Day, G. (1994), “The capabilities of market-driven organizations,” Journal of Marketing,Vol. 58, No. 4, 37-52.
Diamantopoulos, A. and Winklhofer, H.M. (2001), “Index construction with formativeindicators: An alternative to scale development,” Journal of Marketing Research,Vol. 38, May, 269-277.
Dick, A.S. and Basu, K. (1994), “Customer loyalty: Towards an integrated concep-tual framework,” Journal of the Academy of Marketing Science, Vol. 22, No. 2,99-113.
Dodds, W., Monroe, K.B., and Grewal, D. (1991), “Effects of price, brand and store in-formation on buyers’ product evaluation,” Journal of Marketing Research, Vol. 28,307-319.
Dorsch, M.J., Swanson, S.R., and Kelley, S.W. (1998), “The role of relationship qual-ity in the stratification of vendors as perceived by customers,” Journal of the Acad-emy of Marketing Science, Vol. 26, No. 2, 128-142.
Doyle, P. (1989), “Building successful brands: The strategic objectives,” Journalof Marketing Management, Vol. 5, No. 1, 77-95.
Fornell, C. (1992), “A national customer satisfaction barometer: The Swedish experi-ence,” Journal of Marketing, Vol. 55, January, 1-21.
Fornell, C., Johnson, M.D., Anderson, E.W., Cha, J., and Bryant, B.E. (1996), “TheAmerican customer satisfaction index: Nature, purpose, and findings,” Journalof Marketing, Vol. 60, October, 7-18.
Gale, B.T. (1994), Managing Customer Value, Free Press, New York, NY.Gounaris, S. (2005), “Measuring service quality in b2b services: An evaluation of the
SERVQUAL scale vis-à-vis the INDERV scale,” Journal of Services Marketing,Vol. 19, No. 6, 421-435.
Gounaris, S. and Stathakopoulos, V. (2004), “Antecedents and consequences of brandloyalty: An empirical study,” Brand Management, Vol. 11, No. 4, 283-306.
Greenleaf, E.A. and Lehmann, D.R. (1993), “Reasons for substantial delay in con-sumer decision making,” Journal of Consumer Research, Vol. 22, September,No. 2, 186-199.
Grönroos, C. (1994), “From marketing mix to relationship marketing. Towards a par-adigm shift in marketing,” Management Decision, Vol. 32, No. 2, 4-32.
Grönroos, C. (1997), “Value-driven relational marketing: From products to resourcesand competencies,” Journal of Marketing Management, Vol. 13, No. 5, 407-419.
Gutman, J. (1982), “A means-end chain model based on consumer categorisation pro-cesses,” Journal of Marketing, Vol. 46, 60-72.
84 JOURNAL OF RELATIONSHIP MARKETING
Dow
nloa
ded
by [
The
Uni
vers
ity o
f M
anch
este
r L
ibra
ry]
at 0
6:46
10
Oct
ober
201
4
Gutman, J. (1991), “Exploring the nature of linkages between consequences andvalues,” Journal of Business Research, Vol. 22, 143-148.
Ha, C. (1998), “The theory of reasoned action applied to customer loyalty,” Journalof Product and Brand Management, Vol. 7, No. 1, 51-61.
Heskett, J.L., Sasser, E.W., and Schlesinger, L.A. (1997), The Service Profit Chain,The Free Press, New York, NY.
Hofstede, G. (2001), Culture’s Consequences: Comparing Values, Behaviors, Insti-tutions, and Organizations, Sage Publications, Thousand Oaks, CA.
Huber, F., Herrmann, A., and Morgan, R.E. (2001), “Gaining competitive advantagethrough customer value oriented management,” Journal of Consumer Marketing,Vol. 18, No. 1, 41-53.
Jacoby, J. and Kyner, D.B. (1973), “Brand loyalty vs. repeat purchasing behavior,”Journal of Marketing Research, Vol. 10, February, 1-9.
Jarvis, C.B., Mackenzie, S.B., and Podsakoff, P.M. (2003), “A critical review of con-struct indicators and measurement model misspecification in marketing and con-sumer research,” Journal of Consumer Research, Vol. 30, September, 199-218.
Khalifa, A.S. (2004), “Customer value: A review of recent literature and an integrativeconfiguration,” Management Decision, Vol. 42, No. 5, 645-666.
Knox, S. and Walker, D. (2001), “Measuring and managing brand loyalty,” Journal ofStrategic Marketing, Vol. 9, 111-128.
Kuehn, A. (1962), “Consumer brand choice as a learning process,” Journal of Advertis-ing Research, Vol. 2, March/April, 10-17.
Lam, S.Y., Shakar, V., and Murthy, M.K.E.B. (2004), “Customer value, satisfac-tion, loyalty and switching costs: An illustration from a business-to-businessservice context,” Journal of the Academy of Marketing Science, Vol. 32, No. 3,293-311.
Lovelock, C. (2001), Services Marketing. People, Technology, Strategy, 4th ed.,Prentice Hall, Upper Saddle River, NJ.
Mourali, M., Laroche, M., and Pons, F. (2005), “Individualistic orientation and con-sumer susceptibility to interpersonal influence,” Journal of Services Marketing,Vol. 19, No. 3, 164-173.
Nunnally, J.C. (1978), Psychometric Theory, 2nd ed., McGraw-Hill, New York, NY.Oliver, R.L. (1980), “A cognitive model of the antecedents and consequences of satis-
faction decisions,” Journal of Marketing Research, Vol. 17, November, 460-469.Oliver, R.L. (1981), “Measurement and evaluation of satisfaction processes in retail
settings,” Journal of Retailing, Vol. 57, Fall, 25-48.Oliver, R.L. (1999), “Whence consumer loyalty?,” Journal of Marketing, Vol. 63,
(special issue), 33-44.Oliver, R.L. and DeSarbo, W.S. (1988), “Response determinants in satisfaction judg-
ments,” Journal of Consumer Research, Vol. 14, No. 4, 495-507.Oliver, R.L., Rust, R., and Varki, S. (1997), “Customer delight: Foundations, findings
and managerial insight,” Journal of Retailing, Vol. 73, No. 3, 311-336.Oliver, R.L. and Swan, J. (1989), “Equity and disconfirmation perceptions as influ-
ences on merchant and product satisfaction,” Journal of Consumer Research,Vol. 16, No. 3, 372-384.
Gounaris, Tzempelikos, and Chatzipanagiotou 85
Dow
nloa
ded
by [
The
Uni
vers
ity o
f M
anch
este
r L
ibra
ry]
at 0
6:46
10
Oct
ober
201
4
Olsen, S.O. (2002), “Comparative evaluation and the relationship between quality, sat-isfaction, and repurchase loyalty,” Journal of the Academy of Marketing Science,Vol. 30, No. 3, 240-249.
Parasuraman, A. (1997), “Reflections on gaining competitive advantage through cus-tomer value,” Journal of the Academy of Marketing Science, Vol. 25, No. 2, 154-161.
Parasuraman, A., Zeithaml, V.A., and Berry, L.L. (1985), “A conceptual model of ser-vice quality and its implications for future research,” Journal of Marketing, Vol. 49,Fall, 41-50.
Parasuraman, A., Zeithaml, V.A., and Berry, L.L. (1988), “SERVQUAL: A multiple-item scale for measuring consumer perceptions of service,” Journal of Retailing,Vol. 64, Spring, 12-40.
Peter, J.P. and Olson, J.C. (1987), Consumer Behavior Marketing Strategy Perspec-tives, Irwin, Homewood, IL.
Quester, P. and Lim, A.L. (2003), “Product involvement/brand loyalty: Is there alink?,” Journal of Product and Brand Management, Vol. 12, No. 1, 22-38.
Ravald, A. and Gronroos, C. (1996), “The value concept and relationship marketing,”European Journal of Marketing, Vol. 30, No. 2, 19-30.
Reichheld, F.F. and Sasser, W.E. (1990), “Zero defections: Quality comes to services,”Harvard Business Review, Vol. 68, No. 5, 105-111.
Roberts, K., Varki, S., and Brodie, R. (2003), “Measuring the quality of relationships inconsumer services: An empirical study,” European Journal of Marketing, Vol. 37,No. 1/2, 169-196.
Rust, R.T., Zeithaml, V.A., and Lemon, K.A. (2000), Driving Customer Equity, TheFree Press, New York, NY.
Sheth, J.N., Newman, B., and Gross, B.L. (1991), “Why we buy what we buy: A theoryof consumption values,” Journal of Business Research, Vol. 22, 159-170.
Slater, S.F. (1997), “Developing a customer value-based theory of the firm,” Journalof the Academy of Marketing Science, Vol. 25, No. 2, 162-167.
Sweeney, J.C. and Soutar, G.N. (2001), “Consumer-perceived value: The developmentof a multiple-item scale,” Journal of Retailing, Vol. 77, No. 2, 203-220.
Szmigin, I. and Bourne, H. (1998), “Consumer equity in relationship marketing,”Journal of Consumer Marketing, Vol. 15, No. 6, 544-557.
Teas, R.K. (1993), “Expectations, performance evaluation and consumers’ perceptionof quality,” Journal of Marketing, Vol. 57, No. 4, 18-34.
Wang, Y., Lo, H.P., Chi, R., and Yang, Y. (2004), “An integrated framework forcustomer value and customer-relationship-management performance: A customer-based perspective from China,” Managing Service Quality, Vol. 14, No. 2/3, 169-182.
Westbrook, R. and Oliver, R. (1981), “Developing better measures of consumer satis-faction: Some preliminary results,” Advances in Consumer Research, Vol. 8, No. 1,94-100.
Wong, A. and Sohal, A. (2002), “Customers’ perspectives on service quality and relation-ship quality in retail encounters,” Managing Service Quality, Vol. 12, No. 6, 424-434.
Wong, A. and Sohal, A. (2003), “Service quality and customer loyalty perspectives ontwo levels of retail relationships,” Journal of Services Marketing, Vol. 17, No. 5,495-513.
86 JOURNAL OF RELATIONSHIP MARKETING
Dow
nloa
ded
by [
The
Uni
vers
ity o
f M
anch
este
r L
ibra
ry]
at 0
6:46
10
Oct
ober
201
4
Woodruff, R.B. (1997), “Customer value: The next source for competitive advantage,”Journal of the Academy of Marketing Science, Vol. 25, No. 2, 139-153.
Zeithaml, V.A. (1988), “Consumer perceptions of price, quality and value: A means-end model and synthesis of evidence,” Journal of Marketing, Vol. 52, 2-22.
Zeithaml, V.A., Berry, L., and Parasuraman, A. (1996), “The behavioral consequencesof service quality,” Journal of Marketing, Vol. 60, No. 2, 31-46.
doi:10.1300/J366v06n01_05
Gounaris, Tzempelikos, and Chatzipanagiotou 87
APPENDIX
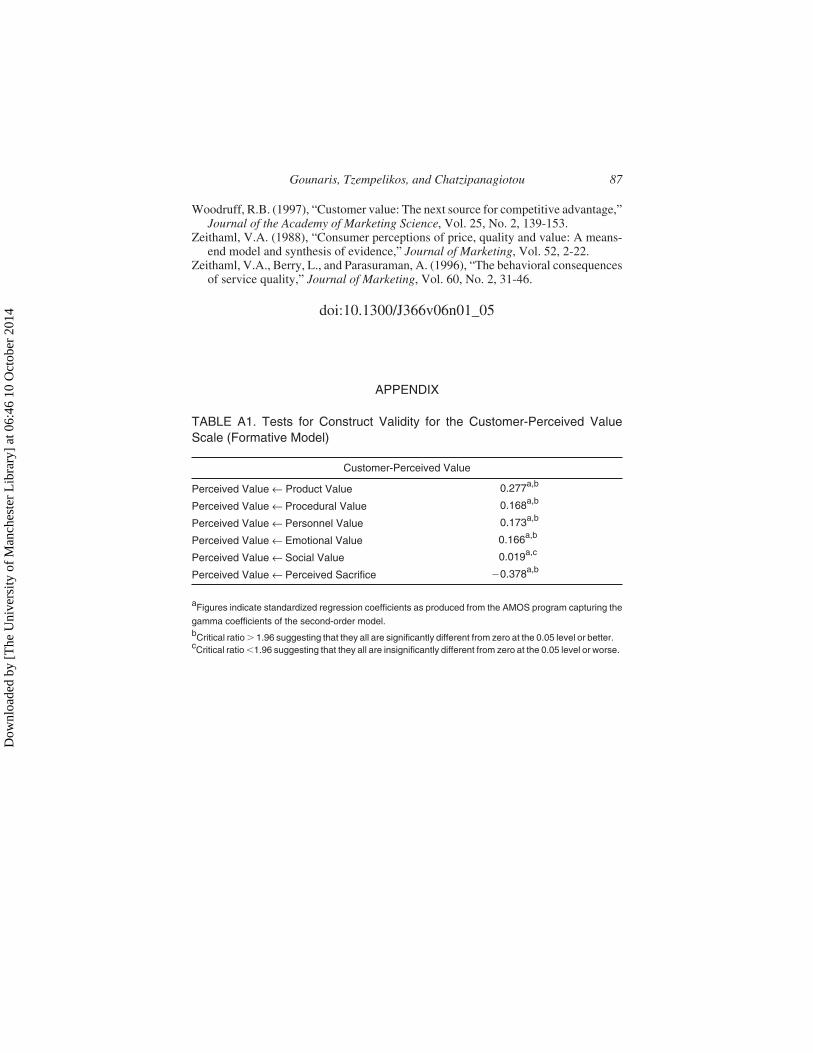
TABLE A1. Tests for Construct Validity for the Customer-Perceived ValueScale (Formative Model)
Customer-Perceived Value
Perceived Value ← Product Value 0.277a,b
Perceived Value ← Procedural Value 0.168a,b
Perceived Value ← Personnel Value 0.173a,b
Perceived Value ← Emotional Value 0.166a,b
Perceived Value ← Social Value 0.019a,c
Perceived Value ← Perceived Sacrifice 0.378a,b
aFigures indicate standardized regression coefficients as produced from the AMOS program capturing the
gamma coefficients of the second-order model.bCritical ratio � 1.96 suggesting that they all are significantly different from zero at the 0.05 level or better.cCritical ratio �1.96 suggesting that they all are insignificantly different from zero at the 0.05 level or worse.
Dow
nloa
ded
by [
The
Uni
vers
ity o
f M
anch
este
r L
ibra
ry]
at 0
6:46
10
Oct
ober
201
4