Embed Size (px)
Citation preview
IOSR Journal of Environmental Science, Toxicology and Food Technology (IOSR-JESTFT)
e-ISSN: 2319-2402,p- ISSN: 2319-2399.Volume 10, Issue 4 Ver. I (Apr. 2016), PP 01-10
www.iosrjournals.org
DOI: 10.9790/2402-1004010110 www.iosrjournals.org 1 | Page
The Relevance of Geospatial Techniques in the Assessment of
Forest Fragmentation of Anjaneri Hill, Nasik District,
Maharashtra, India.
Ravindra G. Jaybhaye,1 Poorva K. Kale,
2 Pradumnya Joshi
3
1Professor at Department of Geography, S. P. Pune University, Pune, Maharashtra, India
2Research fellow at Department of Geography, S. P. Pune University, Pune, Maharashtra, India
3Research assistance at Department of Geography, S. P. Pune University, Pune, Maharashtra, India
Abstract: The Western Ghats is one of the prominent regions in the world known for the variety of flora and
fauna species. Though it is declared as a biological hotspot, the human interference is causing negative impact
on the biodiversity. Consequently, the species are getting rapidly diminished and extinct. The land use and land
cover maps for the study area were derived from the satellite imageries for the year 1989, 2006 and 2015. The
land use and land cover analysis reveals that there was reduction in natural vegetation cover from 1989 to
2015. The fragmentation analysis for the study area was based on the parameters of class area, percentage of
land, number of patches, patch density, total edge length, edge density, and largest patch index. The results
obtained from the study revealed an increase in the fragmentation and significant degradation of forests. The
evaluation of degraded and fragmented conditions of forests provides a significant platform for the ultimate
research on its impacts on the different component of biodiversity. It will also aid in understanding the spatial
configuration pattern of the forest fragments and examine the transition in this pattern over time and space at
landscape level.
Keywords: Biological hotspot, Fragstats, Fragmentation, Largest Patch Index (LPI), Anjaneri.
I. Introduction
Landscape can be defined as a heterogeneous land area composed of cluster of interacting ecosystem
that is repeated in similar from throughout (Forman and Godron, 1986). Landscape ecology is largely founded
on the notion that environmental pattern strongly influence ecological processes (Turner and Ruscher, 1988). In
a landscape, the identification of individual patches and their boundaries is an important step in characterizing
its structure (Jose, 2012). For the study of a landscape, the patch analysis is one of the important parameter, as it
analyzes the role played by a patch in the spatial distribution of species and the genesis of structure in the
ecosystem. This analysis also aids in the conservation of the habitat. The fragmentation of habitat is detrimental
to many species and may contribute substantially to the loss of regional and global biodiversity (Harris, 1984).
One of the main purposes of ecological studies is to orient the land use planning by providing signs to optimal
ecosystem pattern for supporting nature conservation. Growing concern about biodiversity has encouraged the
planners to think about landscape while planning at different spatial and temporal scale (Jose, 2012). Landscape
ecology considers the vegetation as a mosaic of patches. For the assessment of vegetative landscape, the three
significant properties which assist in analyzing the status are structure, function and change. These properties
can be explained in terms of fragmentation, patch index, patchiness, interspersion, juxtaposition, etc.
Fragmentation can be explained as the number of patches of forest and non-forest type per unit area. It
refers to the transformation of the landscape, often driven by disturbances, from a uniform to a more
heterogeneous and patchy situation (Kshirsagar, 2004). Habitat fragmentation and forest loss have been
recognized as a major threat to ecosystems worldwide (Armenteras et al., 2003; Dale and Pearson, 1997; Iida
and Nakashizuka, 1995; Noss, 2001). These two processes may have negative effects on biodiversity, by
increasing separation of habitats. Fragmentation may adversely affect the richness of species by reducing the
probability of successful dispersal and establishment (Gigord et al., 1999) as well as by reducing the capacity of
a patch of habitat to sustain a resident population (Iida and Nakashizuka, 1995). The temporal evaluation of
forest change based on satellite imagery linked to fragmentation analysis is becoming a valuable set of
techniques for assessing the degree of threat to ecosystems (Armenteras et al., 2003; Franklin et al., 2001;
Imbernon and Branthomme, 2001; Luque, 2000; Sader et al., 2001). The aim of this study is to assess the
patterns of fragmentation in the forest. To achieve this aim, we have examined the patterns of change in land use
and land cover during the time period of sixteen years.
The Relevance Of Geospatial Techniques In The Assessment Of Forest Fragmentation Of Anjaneri
DOI: 10.9790/2402-1004010110 www.iosrjournals.org 2 | Page
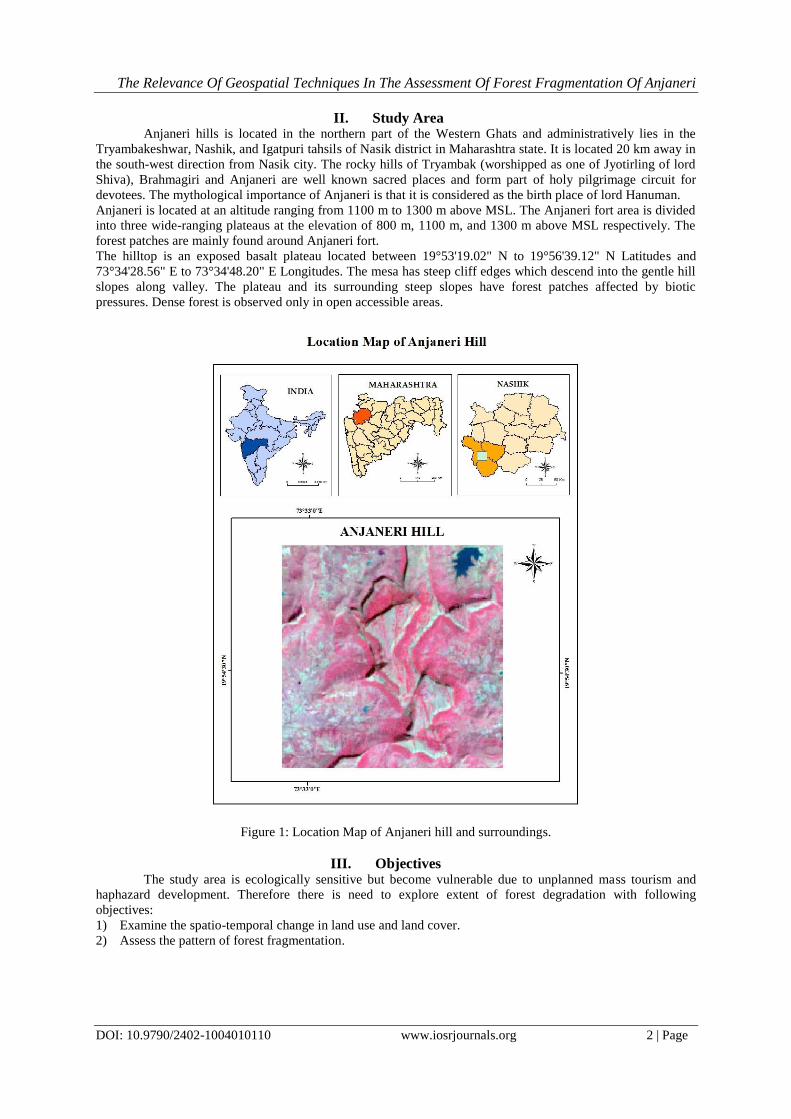
II. Study Area Anjaneri hills is located in the northern part of the Western Ghats and administratively lies in the
Tryambakeshwar, Nashik, and Igatpuri tahsils of Nasik district in Maharashtra state. It is located 20 km away in
the south-west direction from Nasik city. The rocky hills of Tryambak (worshipped as one of Jyotirling of lord
Shiva), Brahmagiri and Anjaneri are well known sacred places and form part of holy pilgrimage circuit for
devotees. The mythological importance of Anjaneri is that it is considered as the birth place of lord Hanuman.
Anjaneri is located at an altitude ranging from 1100 m to 1300 m above MSL. The Anjaneri fort area is divided
into three wide-ranging plateaus at the elevation of 800 m, 1100 m, and 1300 m above MSL respectively. The
forest patches are mainly found around Anjaneri fort.
The hilltop is an exposed basalt plateau located between 19°53'19.02" N to 19°56'39.12" N Latitudes and
73°34'28.56" E to 73°34'48.20" E Longitudes. The mesa has steep cliff edges which descend into the gentle hill
slopes along valley. The plateau and its surrounding steep slopes have forest patches affected by biotic
pressures. Dense forest is observed only in open accessible areas.
Figure 1: Location Map of Anjaneri hill and surroundings.
III. Objectives The study area is ecologically sensitive but become vulnerable due to unplanned mass tourism and
haphazard development. Therefore there is need to explore extent of forest degradation with following
objectives:
1) Examine the spatio-temporal change in land use and land cover.
2) Assess the pattern of forest fragmentation.
The Relevance Of Geospatial Techniques In The Assessment Of Forest Fragmentation Of Anjaneri
DOI: 10.9790/2402-1004010110 www.iosrjournals.org 3 | Page
IV. Methodology The study is mainly based on the image processing techniques which involve two stages. First stage is
concerned with the preparation of base map in the form of land use and land cover map. In the second stage, the
fragmentation pattern in the study area was analyzed using Fragstats.
4.1 Remote sensing Data
The satellite images of the study area for the year 1989 and 2006 with a spatial resolution of 30 m were
obtained from Landsat TM and Landsat ETM+ respectively. These satellite images were used for the
preparation of land use and land cover maps. The maps prepared from the satellite images were useful for the
identification of the forest and non-forest patches. Patches are an important spatial attribute that aids in
determining the areas affected by fragmentation. It was necessary to correct the images geometrically,
atmospherically and topographically before they could be used to assess changes in forest cover and
fragmentation (Chuvieco, 1996). Road network and other base layers were digitized with the help of Survey of
India topographical maps 47E/9 with a scale of 1:50000.
4.2 Image Classification
Catastro is a GIS-based data set of thematic maps derived from aerial photographs and satellite imagery
between 1994 and 1997 (Conaf et.al. 1999a) Owing to the availability of these ground-based data sets,
supervised classification was performed on the procured satellite images. To obtain better results for the study
area, Maximum Likelihood Classifier was used in the supervised classification. The selection of training sites
was by considering the representation of all digital categories of radiance according to spectral signature
(Chuvieco, 1996). Some of these training areas were consistently delineated in each scene in order to minimize
classification errors when performing change detection (Luque, 2000). Accuracy assessment of land use and
land cover classified images was carried out using the set of 100 points.
4.3 Land use and land cover categories
The categories of land use and land cover for the study area are as follows: (1) agriculture, (2) barren
land, (3) fallow land, (4) open vegetation, (5) dense vegetation, (6) settlement, (7) wetland, (8) water bodies.
The classes were based on the NRSC land use and land cover classification scheme and were finalized with the
aid of hybrid classification. Considering the density of trees, the forests were classified into “open vegetation”
and “dense vegetation” for the analysis.
4.4 Fragmentation
For the present study, the transition of different patches throughout the time was determined from the
class metrics. FRAGSTATS software was used to quantify the fragmentation in the forest as it provided detailed
statistical information on various landscape levels. One of the significant features of FRAGSTATS software is
that it can provide metrics at the individual patch level. Area, perimeter, and radius of gyration can be computed
for each area of homogeneous habitat (McGarigal et al., 2002). Using ArcGIS (Version 9.3) software, the grid
covers were configured for the application of landscape spatial indices. These indices or spatial metrics were
computed using statistical software- FRAGSTATS 4.2. The advantage of using FRAGSTATS software helps in
comparing the spatial pattern of forest cover for each time interval of study region. Consequently, similar
statistics was computed for each class of habitat (i.e. the compilation of all of the patches for each habitat), with
many added metrics such as percentage of landscape or total edge within that class.
Quantification and comparison of the spatial configuration of native forest fragments was based on the
following set of key landscape metrics selected after reviewing recent forest fragmentation studies (Armenteras
et al., 2003; Imbernon and Branthomme, 2001;) : (a) Class Area (CA), (b) Percentage of Land (PLAND), (c)
Number of Patches (NP), (d) Patch Density (PD), (e) Total edge length (TE), (f) Edge Density (ED), and (g)
Largest patch index (% landscape comprised by the largest patch). These seven indices were computed on the
class metrics derived from land use and land cover classified images using Fragstats software. (McGarigal, K.
2002).
1.4.1 Class area (CA) is a measure of landscape composition which helps in determining the area covered by
a particular patch type in the landscape. In addition to its direct interpretive value, class area is used in the
computations for many of the class and landscape metrics. It is an important parameter because it defines the
extent of the landscape.
1.4.2 Percentage of Land (PLAND) equals to the sum of the areas (sq. m.) for all patches of the
corresponding patch type, divided by total landscape area (sq. m.), multiplied by 100 (to convert to a
The Relevance Of Geospatial Techniques In The Assessment Of Forest Fragmentation Of Anjaneri
DOI: 10.9790/2402-1004010110 www.iosrjournals.org 4 | Page
percentage). In other words, PLAND equals to the percentage of landscape comprised of the corresponding
patch type. If the PLAND approaches 0 then the corresponding patch type (class) becomes rare in the landscape.
While the value of 100 suggests the entire landscape consists of a single patch type; this also means that the
entire image is comprised of a single patch land area. In many ecological applications, PLAND is like total class
area, which is a measure of the landscape composition.
1.4.3 Number of patches (NP) is a simple measure for the extent of fragmentation of the particular patch
type. If total landscape area and class area are held constant, then number of patches conveys the same
information as patch density and may be a useful index to interpret. The significant increase in the number of
patches suggests that the fragmentation is occurring.
1.4.4 Patch density (PD) is a limited, but fundamental aspect of landscape pattern. Patch density has the same
basic utility as number of patches as an index, except that it expresses number of patches on a per unit area basis
that facilitates comparisons among landscapes of varying size. If total landscape area is held constant, then patch
density and number of patches convey the same information. Like number of patches, patch density often has
limited interpretive value by itself because it conveys no information about the sizes and spatial distribution of
patches.
1.4.5 Total Edge Length (TE) equals the sum of the length (m) of all edge segments involving the
corresponding patch type. Total edge at the class level is an absolute measure of total edge length of a particular
patch type.
1.4.6 Edge Density (ED) equals the sum of the lengths (m) of all edge segments involving the corresponding
patch type, divided by the total landscape area (sq. m.), multiplied by 10,000 (to convert to hectares). Edge
Density at the class level has the same utility and limitations as Total Edge; except that edge density reports
edge length on a per unit area basis that facilitates comparison among landscapes of varying size.
1.4.7 Largest Patch Index (LPI) helps one understand about the fragmentation in an area. Largest patch index
shows the class wise large patch area. LPI approaches 0, when the largest of corresponding patch type is absent.
When the LPI approaches 100, then the entire landscape consists of a single patch. Largest patch index at the
class level quantifies the percentage of total landscape area comprised by the largest patch.
V. Results And Discussion 5.1 Major changes in land use and land cover
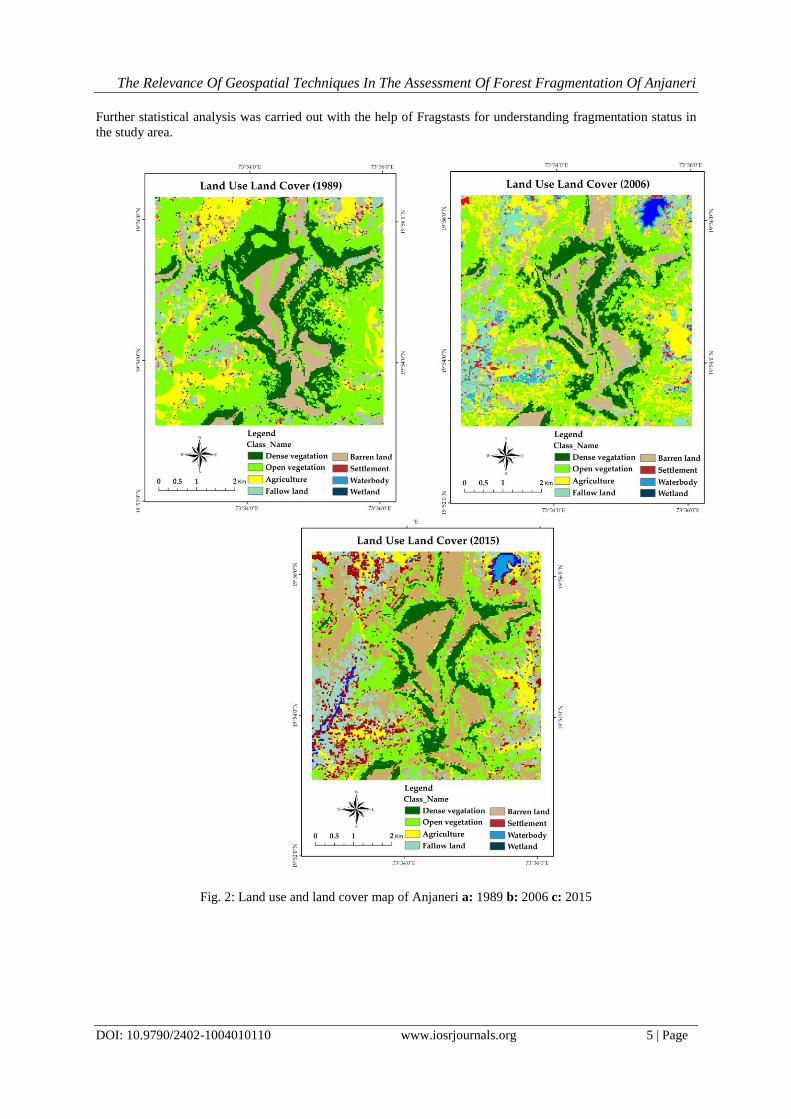
For the study area, eight categories were identified and interpreted according to the characteristics they
exhibited. There was a significant temporal change observed in the categories of open and dense vegetation. As
per the land use and land cover analysis from the satellite imagery of the year 1989, 45% area was covered by
the open vegetation and 19% by dense vegetation. It was followed by barren land (15%) and agriculture (14%).
A small area is occupied by settlement (1%) and water body (0.003%).
In 2006, open vegetation class covered 34% and dense vegetation about 13% of the total geographical
area. The agriculture covers an area of 22% followed by the fallow land (9%) and settlement (2%). As small
reservoir has been built after 1989, water body covers the 0.79%. Agriculture is 22%, fallow land is 9% and
settlement is 2%. In 2015 30% area remains under the category of open vegetation and 7% area is under dense
vegetation. Barren land is increase up to 28%. Agriculture is 9% and fallow land is increase up to 14%.
The Relevance Of Geospatial Techniques In The Assessment Of Forest Fragmentation Of Anjaneri
DOI: 10.9790/2402-1004010110 www.iosrjournals.org 5 | Page
Further statistical analysis was carried out with the help of Fragstasts for understanding fragmentation status in
the study area.
Fig. 2: Land use and land cover map of Anjaneri a: 1989 b: 2006 c: 2015
The Relevance Of Geospatial Techniques In The Assessment Of Forest Fragmentation Of Anjaneri
DOI: 10.9790/2402-1004010110 www.iosrjournals.org 6 | Page
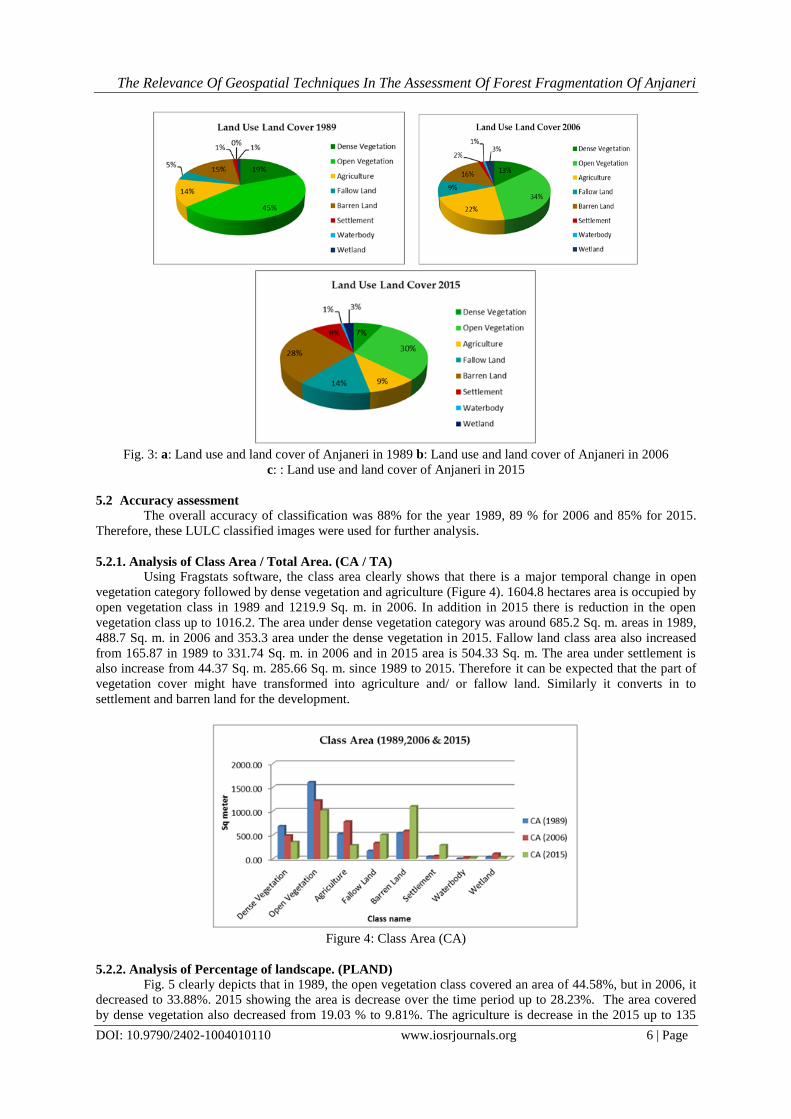
Fig. 3: a: Land use and land cover of Anjaneri in 1989 b: Land use and land cover of Anjaneri in 2006
c: : Land use and land cover of Anjaneri in 2015
5.2 Accuracy assessment
The overall accuracy of classification was 88% for the year 1989, 89 % for 2006 and 85% for 2015.
Therefore, these LULC classified images were used for further analysis.
5.2.1. Analysis of Class Area / Total Area. (CA / TA)
Using Fragstats software, the class area clearly shows that there is a major temporal change in open
vegetation category followed by dense vegetation and agriculture (Figure 4). 1604.8 hectares area is occupied by
open vegetation class in 1989 and 1219.9 Sq. m. in 2006. In addition in 2015 there is reduction in the open
vegetation class up to 1016.2. The area under dense vegetation category was around 685.2 Sq. m. areas in 1989,
488.7 Sq. m. in 2006 and 353.3 area under the dense vegetation in 2015. Fallow land class area also increased
from 165.87 in 1989 to 331.74 Sq. m. in 2006 and in 2015 area is 504.33 Sq. m. The area under settlement is
also increase from 44.37 Sq. m. 285.66 Sq. m. since 1989 to 2015. Therefore it can be expected that the part of
vegetation cover might have transformed into agriculture and/ or fallow land. Similarly it converts in to
settlement and barren land for the development.
Figure 4: Class Area (CA)
5.2.2. Analysis of Percentage of landscape. (PLAND) Fig. 5 clearly depicts that in 1989, the open vegetation class covered an area of 44.58%, but in 2006, it
decreased to 33.88%. 2015 showing the area is decrease over the time period up to 28.23%. The area covered
by dense vegetation also decreased from 19.03 % to 9.81%. The agriculture is decrease in the 2015 up to 135
The Relevance Of Geospatial Techniques In The Assessment Of Forest Fragmentation Of Anjaneri
DOI: 10.9790/2402-1004010110 www.iosrjournals.org 7 | Page
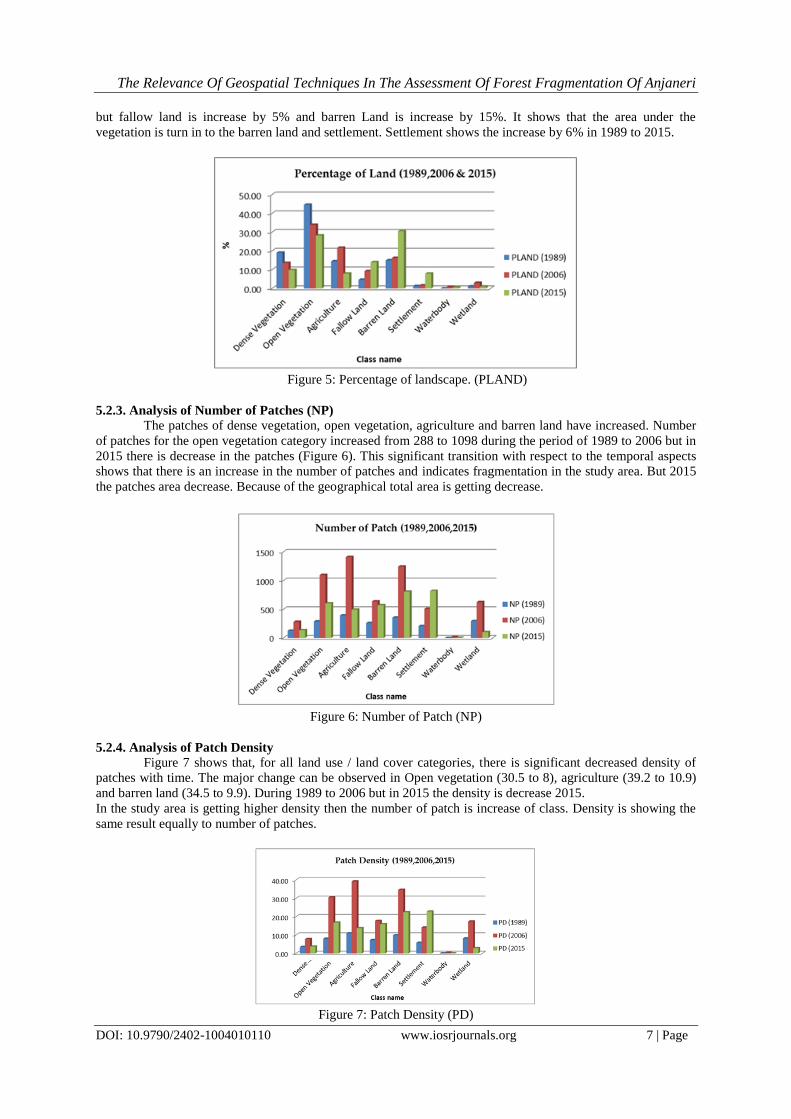
but fallow land is increase by 5% and barren Land is increase by 15%. It shows that the area under the
vegetation is turn in to the barren land and settlement. Settlement shows the increase by 6% in 1989 to 2015.
Figure 5: Percentage of landscape. (PLAND)
5.2.3. Analysis of Number of Patches (NP)
The patches of dense vegetation, open vegetation, agriculture and barren land have increased. Number
of patches for the open vegetation category increased from 288 to 1098 during the period of 1989 to 2006 but in
2015 there is decrease in the patches (Figure 6). This significant transition with respect to the temporal aspects
shows that there is an increase in the number of patches and indicates fragmentation in the study area. But 2015
the patches area decrease. Because of the geographical total area is getting decrease.
Figure 6: Number of Patch (NP)
5.2.4. Analysis of Patch Density Figure 7 shows that, for all land use / land cover categories, there is significant decreased density of
patches with time. The major change can be observed in Open vegetation (30.5 to 8), agriculture (39.2 to 10.9)
and barren land (34.5 to 9.9). During 1989 to 2006 but in 2015 the density is decrease 2015.
In the study area is getting higher density then the number of patch is increase of class. Density is showing the
same result equally to number of patches.
Figure 7: Patch Density (PD)
The Relevance Of Geospatial Techniques In The Assessment Of Forest Fragmentation Of Anjaneri
DOI: 10.9790/2402-1004010110 www.iosrjournals.org 8 | Page
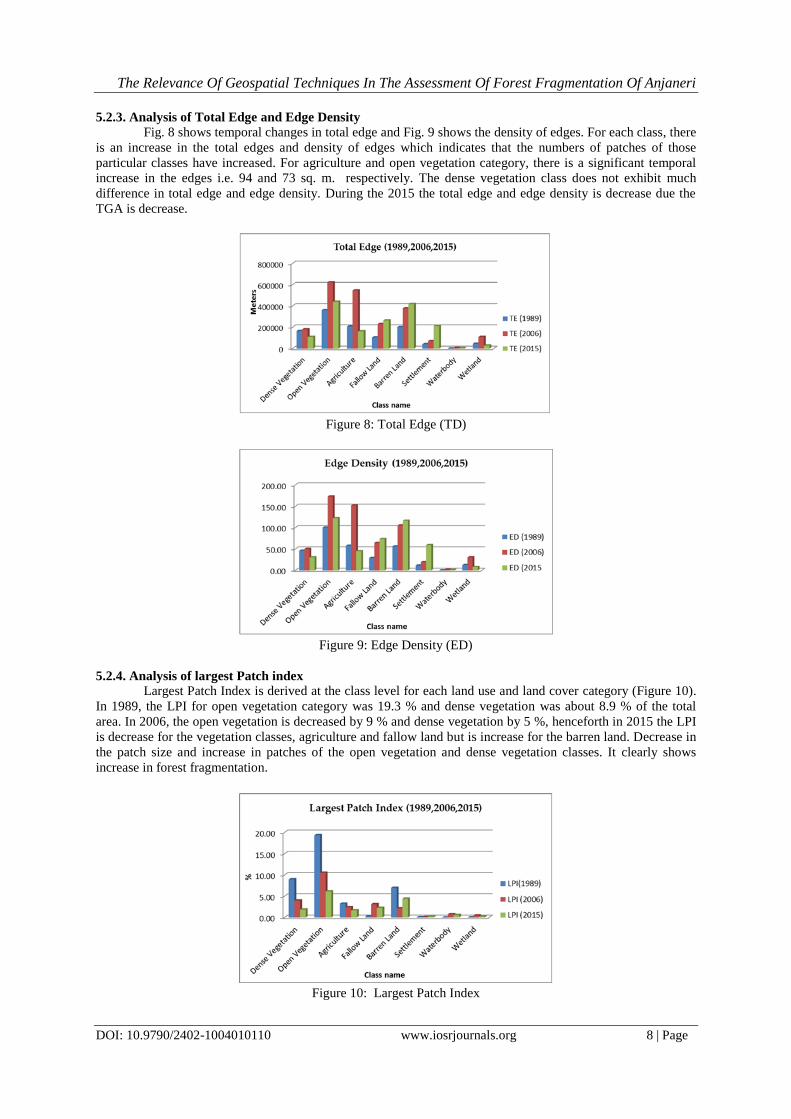
5.2.3. Analysis of Total Edge and Edge Density
Fig. 8 shows temporal changes in total edge and Fig. 9 shows the density of edges. For each class, there
is an increase in the total edges and density of edges which indicates that the numbers of patches of those
particular classes have increased. For agriculture and open vegetation category, there is a significant temporal
increase in the edges i.e. 94 and 73 sq. m. respectively. The dense vegetation class does not exhibit much
difference in total edge and edge density. During the 2015 the total edge and edge density is decrease due the
TGA is decrease.
Figure 8: Total Edge (TD)
Figure 9: Edge Density (ED)
5.2.4. Analysis of largest Patch index
Largest Patch Index is derived at the class level for each land use and land cover category (Figure 10).
In 1989, the LPI for open vegetation category was 19.3 % and dense vegetation was about 8.9 % of the total
area. In 2006, the open vegetation is decreased by 9 % and dense vegetation by 5 %, henceforth in 2015 the LPI
is decrease for the vegetation classes, agriculture and fallow land but is increase for the barren land. Decrease in
the patch size and increase in patches of the open vegetation and dense vegetation classes. It clearly shows
increase in forest fragmentation.
Figure 10: Largest Patch Index
The Relevance Of Geospatial Techniques In The Assessment Of Forest Fragmentation Of Anjaneri
DOI: 10.9790/2402-1004010110 www.iosrjournals.org 9 | Page
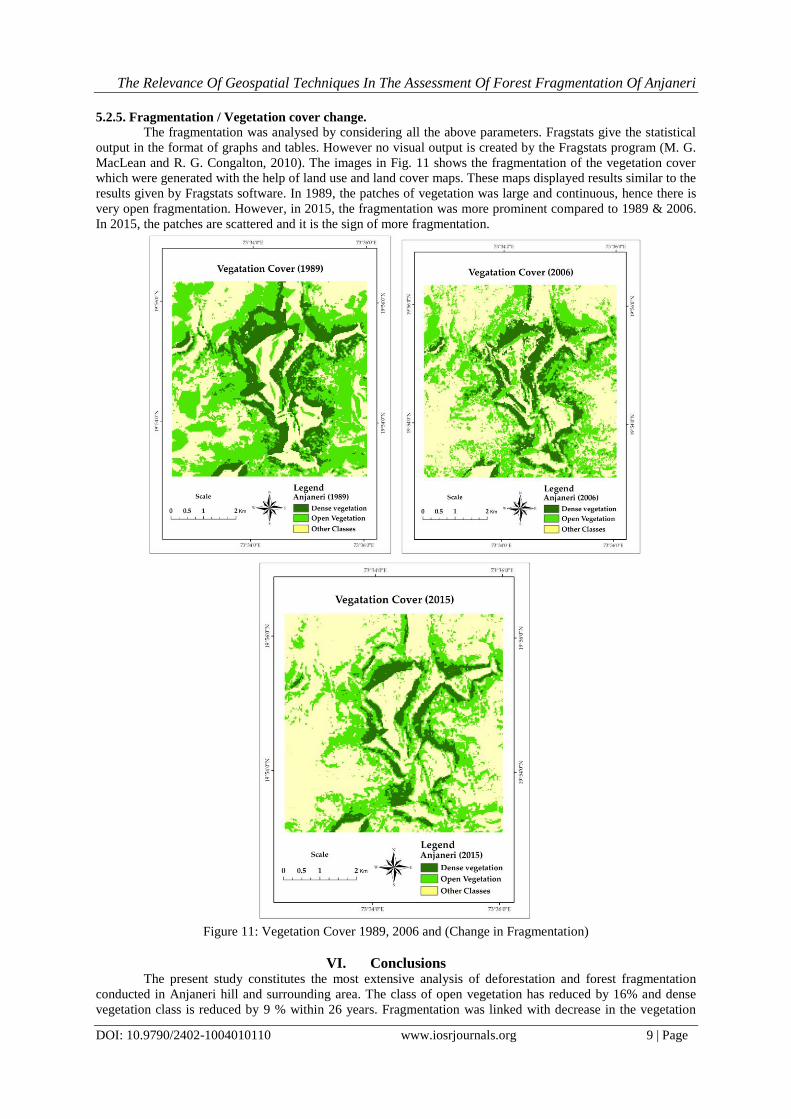
5.2.5. Fragmentation / Vegetation cover change.
The fragmentation was analysed by considering all the above parameters. Fragstats give the statistical
output in the format of graphs and tables. However no visual output is created by the Fragstats program (M. G.
MacLean and R. G. Congalton, 2010). The images in Fig. 11 shows the fragmentation of the vegetation cover
which were generated with the help of land use and land cover maps. These maps displayed results similar to the
results given by Fragstats software. In 1989, the patches of vegetation was large and continuous, hence there is
very open fragmentation. However, in 2015, the fragmentation was more prominent compared to 1989 & 2006.
In 2015, the patches are scattered and it is the sign of more fragmentation.
Figure 11: Vegetation Cover 1989, 2006 and (Change in Fragmentation)
VI. Conclusions The present study constitutes the most extensive analysis of deforestation and forest fragmentation
conducted in Anjaneri hill and surrounding area. The class of open vegetation has reduced by 16% and dense
vegetation class is reduced by 9 % within 26 years. Fragmentation was linked with decrease in the vegetation
The Relevance Of Geospatial Techniques In The Assessment Of Forest Fragmentation Of Anjaneri
DOI: 10.9790/2402-1004010110 www.iosrjournals.org 10 | Page
patch size, which is associated with rapid increase in the density of small patches, and a decrease in the
connectivity of the patches. The loss of vegetation cover may be due to the development of settlement, road
network and tourist places in the study area.
Class Area, PLAND shows that there is significant decrease in open and dense vegetation classes and
increase in agriculture, fallow land and barren land classes. Patch Density for all the classes has reduced with
time. Other important parameters include the number of patches, total edge length and edge density show
significant temporal increase of patchiness in open vegetation, agriculture and barren land classes.
Largest Patch Index (LPI) shows the changes in fragmentation i.e. decrease in largest patch size and increase in
the edge density. Largest patch for the dense vegetation class during the year 1989 was 8.9% and it reduced to
3.9% in 2006 and it reduce more in 2015 i.e. 1.8%. For the open vegetation class, the patch size decreased by
9% that is from 19.4 % in 1989 to 10.49% in 2006. But overall decrease by 13% till the 2015 that is up to 6.16%
Change in vegetation cover with time in the study area shows that there is decrease in forest cover as well as the
forest patches are more dispersed which is harmful for biodiversity.
The assessment of forest loss and fragmentation provides a basis for future research on the impacts of
forest fragmentation on the different component of biodiversity. Conservation strategies and land use planning
of the study area should consider the spatial configuration pattern of forest fragments and also check this pattern
change over time and space at landscape level.The research on biodiversity is mainly carried out at a macro
scale but the essence lies in investigating the problem at micro level scale. The latter approach will consequently
lead in determining the transition in terms of fragmentation at micro level region.
References [1]. Forman, T.T.R. and Godron, M., 1986. Landscape Ecology. Wiley and Sons. New York.
[2]. Turner, M. G., & Ruscher, C. L., Changes in landscape patterns in Georgia, USA. Landscape Ecology, 1988, 1,241-251. [3]. Jose K Subin Landscape Ecological Assessment And Forest Disturbance Analysis, 2012, Chapter 15
[4]. Harris, L.D. The fragmented forest: island biogeographic theory and the preservation of biotic diversity. Chicago: University of
Chicago Press. 1984. 211 p. [5]. Kshirsagar, M.. Landscape characterisation of Jhabua and Ratlam District (Madhya Pradesh) using satellite remote sensing data and
geographic information system.University of pune. Forestry & Ecology division.Indian Institute of Remote Sensing (NRSA). 2004
[6]. Armenteras, D., Gast, F., Villareal, H Andean forest fragmentation and the representativeness of protected natural areas in the eastern Andes, Colombia. Biological Conservation 113, 2003, 245–256.
[7]. Dale, V.H., Pearson, S.M., Quantifying habitat fragmentation due to land use change in Amazonia. In: Laurance, W., Bierregaard,
R. (Eds.), Tropical Forest Remnants. The University of Chicago Press, Chicago, USA, 1997 pp. 400–414. [8]. Iida, S., Nakashizuka, T.,.Forest fragmentation and its effect on species diversity in sub-urban coppice forests in Japan. Forest
Ecology & Management 73, 1995, 197–210.
[9]. Noss, R.F., Forest fragmentation in the southern rocky mountains. Landscape Ecology 16, 2001, 371–372. [10]. Gigord, L., Picot, F. & Shyko¡, J. A. E¡ects of habitat fragmentation on Dombeya acutangula (Sterculiaceae), a native tree on La
Re¨union (Indian Ocean). Biol. Conserv. 88, 1999
[11]. Franklin, J., D. Simons, D, Beardsley, H. Gordon and J. M. Rogan, , Evaluating errors in a digital vegetation map with forest inventory data and accuracy assessment using fuzzy sets, Transactions in GIS vol. 5, no. 4 2001, pp. 285-304.
[12]. Imbernon, J., Branthomme, A., Characterization of landscape patterns of deforestation in tropical rain forests. International Journal
of Remote Sensing 22, 2001, 1753–1765. [13]. Luque, S., Evaluating temporal changes using Multi-spectral Scanner and Thematic Mapper data on the landscape of a natural
reserve: the New Jersey Pine Barrens, a case study. International Journal of Remote Sensing 21, 2000, .2589–2611.
[14]. Sader, S.A., Hepinstall, D.J.H., Coan, M., Soza, C., 2001.Forest change monitoring of a remote biosphere reserve. International Journal of Remote Sensing 22, 1937–1950.
[15]. Chuvieco E. Sales, FJ Mapping the spatial distribution of forest fire danger using GIS, International Journal of Geographical information system. 10 1996. pp 333-355.
[16]. Conaf, Conama, Ibrd, University Of Southern Chile, Catholic University Of Chile Et Al. Cadastre and evaluation of native
vegetation resources in chile. National report environmental variables. Santiago, Chile. 1999a, 88 pp. [17]. McGarigal, K.. Landscape pattern metrics. In: El-Shaarawi AH and Piegorsch WW. (ed.) Landscape pattern metrics. John Wiley &
Sons, Sussex, England, 2002. p. 1135-1142.
[18]. McGarigal, K., S.A. Cushman, M.C. Neel, and E. Ene.. FRAGSTATS: Spatial Pattern Analysis Program for Categorical Maps. Computer software program produced by the authors at the University of Massachusetts, Amherst. Available at the following web
site: http://www.umass.edu/landeco/research/fragstats/fragstats.html, 2002
[19]. M. G. MacLean and R. G. Congalton, Mapping and analysis of fragmentation in Southeastern new Hampshire. A special joint symposium of ISPRS Technical Commission IV & AutoCarto in conjunction with ASPRS/CaGIS 2010 Fall Specialty Conference
November 15-19, 2010 Orlando, Florida