Embed Size (px)
Citation preview
MET project
The Reliability of Classroom Observations by School Personnel
Andrew D. HoThomas J. Kane
Harvard Graduate School of Education
REsEARcH PAPER
1 The lead authors and their affiliations are Andrew D. Ho., Assistant Professor at the Harvard Graduate School of Education, and Thomas J. Kane, Professor of Education and Economics at the Harvard Graduate School of Education and principal investigator of the MET project.
ABOUT THis repOrT: This report presents an in-depth discussion of the technical methods, results, and implications of the MET project’s study of video-based classroom observations by school personnel.1 A non-technical summary of the analysis is in the policy and practitioner brief, Ensuring Fair and Reliable Measures of Effective Teaching. All MET project papers and briefs are available at www.metproject.org.
ABOUT THe meT prOjecT: The MET project is a research partnership of academics, teachers, and education organizations committed to investigating better ways to identify and develop effective teaching. Funding is provided by the Bill & Melinda Gates Foundation.
The approximately 3,000 MET project teachers who volunteered to open up their classrooms for this work are from the following districts: The Charlotte-Mecklenburg Schools, the Dallas Independent Schools, the Denver Public Schools, the Hillsborough County Public Schools, the Memphis Public Schools, the New York City Schools, and the Pittsburgh Public Schools.
Partners include representatives of the following institutions and organizations: American Institutes for Research, Cambridge Education, University of Chicago, The Danielson Group, Dartmouth University, Educational Testing Service, Empirical Education, Harvard University, National Board for Professional Teaching Standards, National Math and Science Initiative, New Teacher Center, University of Michigan, RAND, Rutgers University, University of Southern California, Stanford University, Teachscape, University of Texas, University of Virginia, University of Washington, and Westat.
AcKNOWLeDGemeNTs: The Bill & Melinda Gates Foundation supported this research. Alejandro Ganimian at Harvard University provided research assistance on this project. David Steele and Danni Greenberg Resnick in Hillsborough County (Fla.) Public Schools were extremely thorough and helpful in recruiting teachers and principals in Hillsborough to participate. Steven Holtzman at Educational Testing Service managed the video scoring process and delivered clean data in record time.
ON THe cOver: A MET project teacher records herself engaged in instruction using digital video cameras (at right of photo).
January 2013
The Reliability of classroom Observations | 1
Table of contents
InTRODucTIOn AnD ExEcuTIvE suMMARy 3
sTuDy DEsIgn 5
DIsTRIbuTIOn Of ObsERvED scOREs 9
cOMPOnEnTs Of vARIAncE AnD RElIAbIlITy 13
cOMPARIng ADMInIsTRATORs AnD PEERs 15
THE cOnsEquEncEs Of TEAcHER DIscRETIOn In cHOOsIng lEssOns 23
fIfTEEn MInuTE vERsus full lEssOns 25
fIRsT IMPREssIOns lIngER 27
AlTERnATIvE WAys TO AcHIEvE RElIAbIlITy 29
cOnclusIOn 30
REfEREncEs 32

2 | The Reliability of classroom Observations
The Reliability of classroom Observations | 3
Introduction and Executive summaryFor many teachers, the classroom observation has been the only opportunity to receive direct feedback from another school professional. As such, it is an indispensable part of every teacher evaluation system. Yet it also requires a major time commitment from teachers, principals, and peer observers. To justify the investment of time and resources, a classroom observation should be both accurate (that is, it should reflect the standards that have been adopted) and reliable (that is, it should not be unduly driven by the idiosyncrasies of a particu-lar rater or particular lesson).
In an earlier report from the Measures of Effective Teaching (MET) project (Gathering Feedback for Teaching), Kane and Staiger (2012) compared five different instruments for scoring classroom instruction, using observ-ers trained by the Educational Testing Service (ETS) and the National Math and Science Initiative (NMSI). The report found that the scores on each of the five instruments were highly correlated with one another. Moreover, all five were positively associated with a teacher’s student achievement gains in math or English language arts (ELA). However, achieving high levels of reliability was a challenge. For a given teacher, scores varied considerably from lesson to lesson, and for any given lesson, scores varied from observer to observer.
In this paper, we evaluate the accuracy and reliability of school personnel in performing classroom observa-tions. We also examine different combinations of observers and lessons observed that produce reliability of .65 or above when using school personnel. We asked principals and peers in Hillsborough County, Fla., to watch and score videos of classroom teaching for 67 teacher-volunteers using videos of lessons captured during the 2011–12 school year. Each of 129 observers provided 24 scores on lessons we provided to them, yielding more than 3,000 video scores for this analysis. Each teacher’s instruction was scored an average of 46 times, by dif-ferent types of observers: administrators from a teacher’s own school, administrators from other schools, and peers (including those with and without certification in the teacher’s grade range). In addition, we varied the length of observations, asking raters to provide two sets of scores for some videos (pausing to score after the first 15 minutes and then scoring again at the end of the full lesson). For other lessons, we asked them to pro-vide scores only once at the end of the full lesson. We also gave teachers the option to choose the videos that school administrators would see. For comparison, peers could see any of a teacher’s lesson videos, including the chosen lessons and the lessons that were explicitly not chosen by teachers. Finally, we tested the impact of prior exposure to a teacher on a rater’s scores, by randomly varying the order in which observers saw two different pairs of videos from the same teacher.
4 | The Reliability of classroom Observations
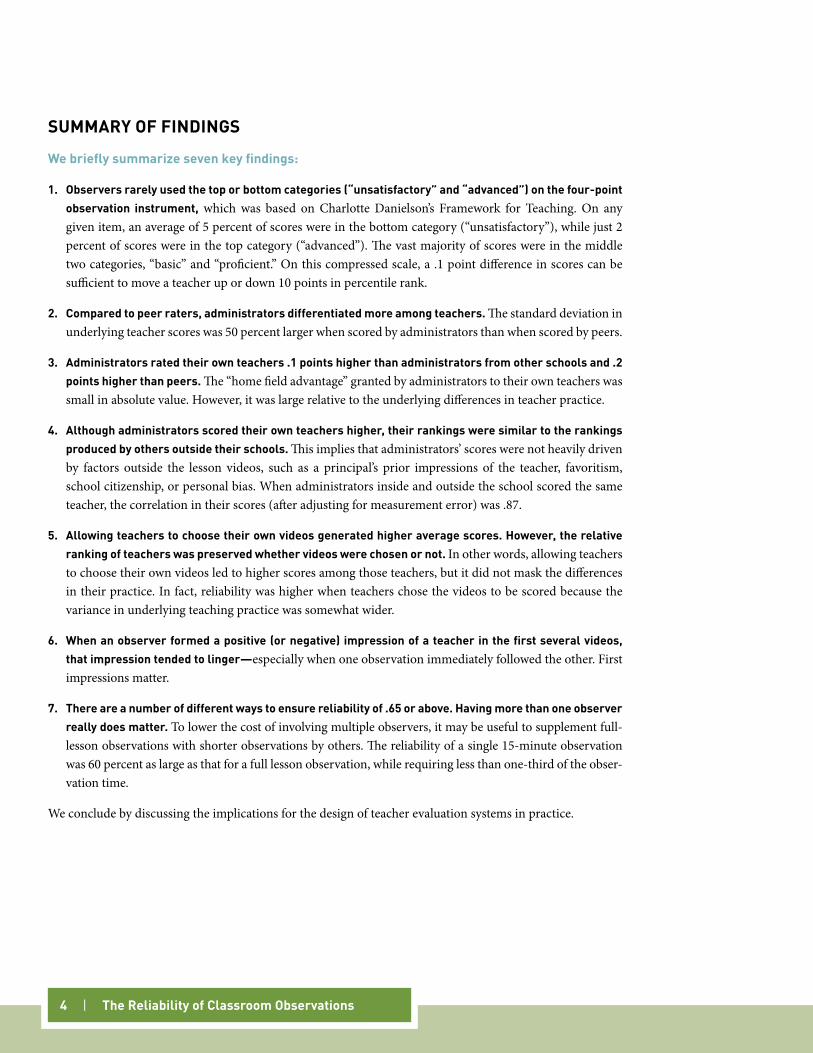
suMMARy Of fInDIngs
We briefly summarize seven key findings:
1. Observers rarely used the top or bottom categories (“unsatisfactory” and “advanced”) on the four-point observation instrument, which was based on Charlotte Danielson’s Framework for Teaching. On any given item, an average of 5 percent of scores were in the bottom category (“unsatisfactory”), while just 2 percent of scores were in the top category (“advanced”). The vast majority of scores were in the middle two categories, “basic” and “proficient.” On this compressed scale, a .1 point difference in scores can be sufficient to move a teacher up or down 10 points in percentile rank.
2. compared to peer raters, administrators differentiated more among teachers. The standard deviation in underlying teacher scores was 50 percent larger when scored by administrators than when scored by peers.
3. Administrators rated their own teachers .1 points higher than administrators from other schools and .2 points higher than peers. The “home field advantage” granted by administrators to their own teachers was small in absolute value. However, it was large relative to the underlying differences in teacher practice.
4. Although administrators scored their own teachers higher, their rankings were similar to the rankings produced by others outside their schools. This implies that administrators’ scores were not heavily driven by factors outside the lesson videos, such as a principal’s prior impressions of the teacher, favoritism, school citizenship, or personal bias. When administrators inside and outside the school scored the same teacher, the correlation in their scores (after adjusting for measurement error) was .87.
5. Allowing teachers to choose their own videos generated higher average scores. However, the relative ranking of teachers was preserved whether videos were chosen or not. In other words, allowing teachers to choose their own videos led to higher scores among those teachers, but it did not mask the differences in their practice. In fact, reliability was higher when teachers chose the videos to be scored because the variance in underlying teaching practice was somewhat wider.
6. When an observer formed a positive (or negative) impression of a teacher in the first several videos, that impression tended to linger—especially when one observation immediately followed the other. First impressions matter.
7. There are a number of different ways to ensure reliability of .65 or above. Having more than one observer really does matter. To lower the cost of involving multiple observers, it may be useful to supplement full-lesson observations with shorter observations by others. The reliability of a single 15-minute observation was 60 percent as large as that for a full lesson observation, while requiring less than one-third of the obser-vation time.
We conclude by discussing the implications for the design of teacher evaluation systems in practice.
The Reliability of classroom Observations | 5
study DesignBeginning in 2011–12, the Bill & Melinda Gates Foundation supported a group of 337 teachers to build a video library of teaching practice.2 The teachers were given digital video cameras and microphones to capture their practice 25 times during the 2011–12 school year (and are doing so again in 2012–13). There are 106 such teachers in Hillsborough County, Fla.
In May 2012, 67 of these Hillsborough teachers consented to having their lessons scored by administrators and peers following the district’s observation protocol. With the help of district staff, we recruited administra-tors from their schools and peer observers to participate in the study. In the end, 53 school administrators (principals and assistant principals) and 76 peer raters agreed to score videos, for a total of 129 raters.
“same-school” versus “other school” administrators: The 67 participating teachers were drawn from 32 schools with a mix of grade levels (14 elementary schools, 13 middle schools, and 5 high schools). In 22 schools, a pair of administrators (the principal and an assistant principal) stepped forward to participate in the scoring. Another nine schools contributed one administrator for scoring. Only one school had no partici-pating administrators. In our analysis, we compare the scores provided by a teacher’s own administrator with the scores given by other administrators and peer observers from outside the school.
self-selected lessons: Teachers were allowed to choose the four lessons that administrators saw. Of the 67 teachers, 44 took this option. In contrast, peers could watch any video chosen at random from a teacher. In this paper, we compare the peer ratings for videos that were chosen to those that were not chosen.
Some school districts require that teachers be notified prior to a classroom observation. Advocates of prior notification argue that it is important to give teachers the chance to prepare, in case observers arrive on a day when a teacher had planned a quiz or some other atypical content. Opponents argue that prior notification can lead to a false impression of a teacher’s typical practice, since teachers would prepare more thoroughly on days they are to be observed.3 Even though the analogy is not perfect, the opportunity to compare the scores given by peer raters for chosen and non-chosen videos allows us to gain some insight into the consequences of prior notification.4
Peer certification: In Hillsborough, peer raters are certified to do observations in specific grade levels (early childhood; PK to grade 3; elementary grades; K–6; and middle/high school grades, 6–12).5 We allocated teacher videos to peers with the same grade range certification (either elementary or middle school/high school) as the teacher as well as to others with different grade range certifications.
2 The project is an extension of the Measures of Effective Teaching (MET) project and the teachers who participated in the original MET project data collection.
3 Prior notification can also complicate the logistical challenge of scheduling the requisite observations. This can be particularly onerous when external observers are tasked with observing more than one teacher in each of many schools.
4 Because teachers were allowed to watch the lessons and choose which videos to submit after comparing all vid-eos, they could be even more selective than they might be with prior notification alone. Arguably, we are studying an extreme version of the prior notification policy.
5 Some peers are certified to observe in more than one grade range.
6 | The Reliability of classroom Observations
15-minute ratings: During the school day, a principal’s time is a scarce resource. Given the number of obser-vations they are being asked to do, a mix of long and short observations could help lighten the time burden. But shorter observations could also reduce accuracy and reliability. To gain insight into the benefits of longer versus shorter observations, we asked observers to pause and provide scores after the first 15 minutes of a video and then to record their scores again at the end of the lesson. A randomly chosen half of their observa-tions were performed this way; for the other half, they provided scores only at the end of the lesson.
We deliberately chose a 15-minute interval because it is on the low-end of what teachers would consider reasonable. However, by using such a short period, and comparing the reliability of very short observations to full-lesson observations, we gain insight into the full range of possible observation lengths. Observations with durations between 15 minutes and a full lesson are likely to have reliability between these two extremes.
Rating load: Each rater scored four lessons from each of six different teachers, for a total of 24 lessons. Attrition was minimal and consisted of a single peer rater dropping out before completing all 24 scores.6
Assigning videos to observers: With a total of 67 teachers (with four lessons each) and an expectation that each rater would score only 24 videos, we could not use an exhaustive or “fully crossed” design. Doing so would have required asking each rater to watch more than 10 times as many videos—4 * 67 = 268. As a result, we designed an assignment scheme that allows us to disentangle the relevant sources of measurement error while limiting the number of lessons scored per observer to 24.
First, we identified eight videos for each teacher—the four videos they chose to show to administrators (the “chosen” videos) and four more videos picked at random from the remaining videos they had collected during the spring semester of the 2011–12 school year (their “not chosen” videos).7
Second, we assigned each teacher’s four chosen videos (or, if they elected not to choose, four randomly cho-sen videos) to the administrators from their school. If there were two administrators from their school, we assigned all four chosen videos to each of them.
Third, we randomly created administrator teams of three to four administrators each (always including administrators from more than one school) and peer teams of three to six peer raters each. We randomly assigned a block of three to five additional teachers from outside the school to each administrator team. (For example, if an administrator had three teachers from his or her school participating, he or she could score three additional teachers; if the administrator had one teacher from his or her school, he or she could score five more.) The peer rater teams were assigned blocks of six teachers.
Fourth, to ensure that the scores for the videos were not confounded by the order in which they were observed or by differences in observers’ level of attentiveness or fatigue at the beginning or end of their scoring assign-ments, we randomly divided the four lessons from a teacher assigned to a rater block into two pairs. We randomly assigned the order of the pairs of videos to the individual observers to each of the observers in the block. Moreover, within each pair of videos for a teacher, we randomized the order when the first and second were viewed.
6 Another observer stepped in to complete those scores.7 Teachers understood that if they did not exercise their right to choose, we would identify lessons at random to assign
to administrators.
The Reliability of classroom Observations | 7
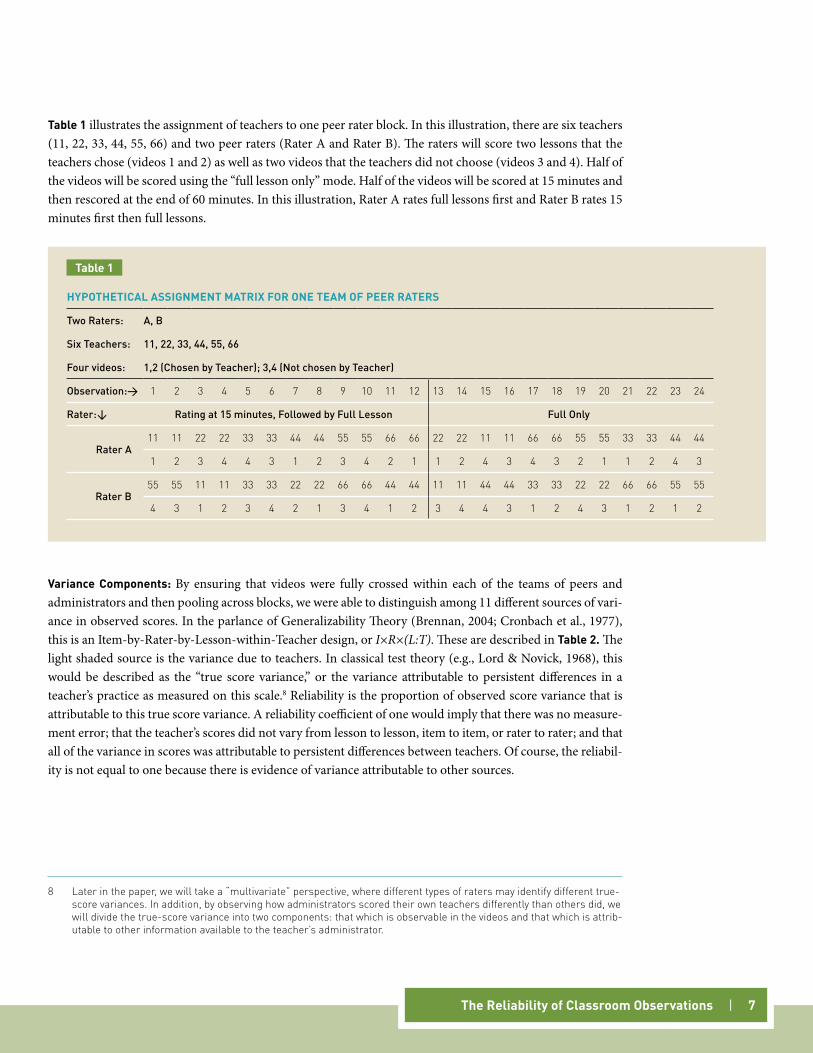
Table 1 illustrates the assignment of teachers to one peer rater block. In this illustration, there are six teachers (11, 22, 33, 44, 55, 66) and two peer raters (Rater A and Rater B). The raters will score two lessons that the teachers chose (videos 1 and 2) as well as two videos that the teachers did not choose (videos 3 and 4). Half of the videos will be scored using the “full lesson only” mode. Half of the videos will be scored at 15 minutes and then rescored at the end of 60 minutes. In this illustration, Rater A rates full lessons first and Rater B rates 15 minutes first then full lessons.
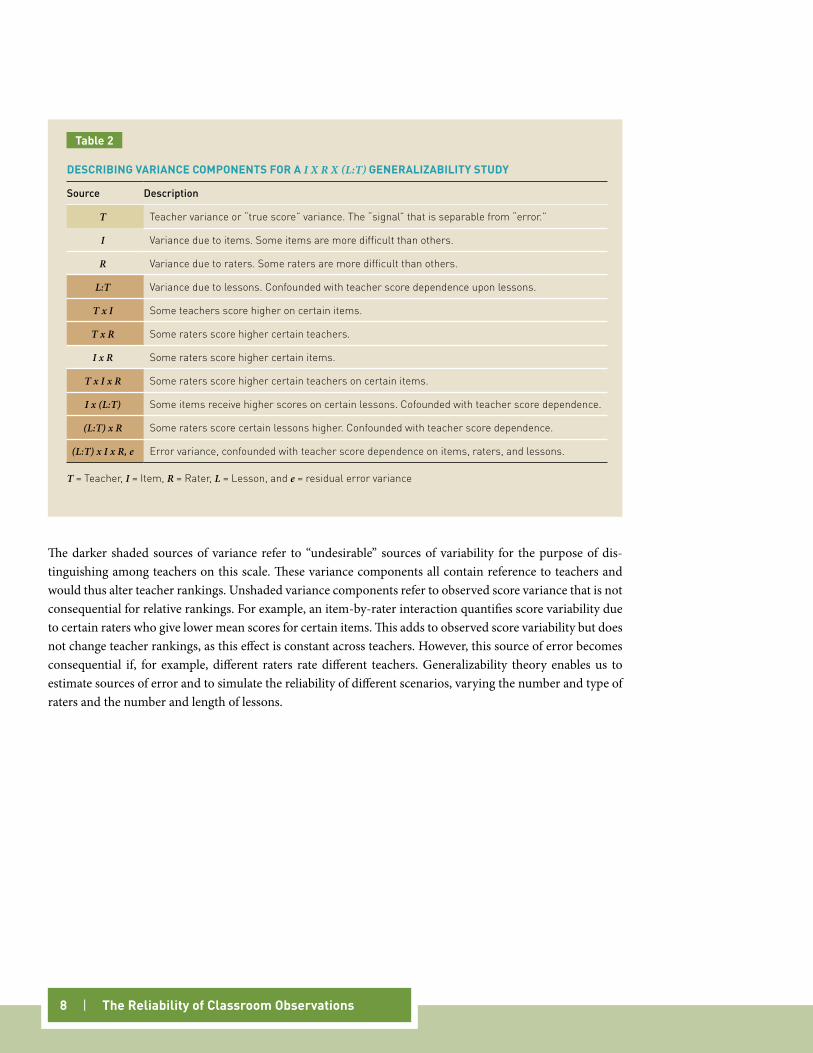
variance components: By ensuring that videos were fully crossed within each of the teams of peers and administrators and then pooling across blocks, we were able to distinguish among 11 different sources of vari-ance in observed scores. In the parlance of Generalizability Theory (Brennan, 2004; Cronbach et al., 1977), this is an Item-by-Rater-by-Lesson-within-Teacher design, or I×R×(L:T). These are described in Table 2. The light shaded source is the variance due to teachers. In classical test theory (e.g., Lord & Novick, 1968), this would be described as the “true score variance,” or the variance attributable to persistent differences in a teacher’s practice as measured on this scale.8 Reliability is the proportion of observed score variance that is attributable to this true score variance. A reliability coefficient of one would imply that there was no measure-ment error; that the teacher’s scores did not vary from lesson to lesson, item to item, or rater to rater; and that all of the variance in scores was attributable to persistent differences between teachers. Of course, the reliabil-ity is not equal to one because there is evidence of variance attributable to other sources.
8 Later in the paper, we will take a “multivariate” perspective, where different types of raters may identify different true-score variances. In addition, by observing how administrators scored their own teachers differently than others did, we will divide the true-score variance into two components: that which is observable in the videos and that which is attrib-utable to other information available to the teacher’s administrator.
HyPOTHETIcAl AssIgnMEnT MATRIx fOR OnE TEAM Of PEER RATERs
Two Raters: A, B
Six Teachers: 11, 22, 33, 44, 55, 66
Four videos: 1,2 (Chosen by Teacher); 3,4 (Not chosen by Teacher)
Observation:→ 1 2 3 4 5 6 7 8 9 10 11 12 13 14 15 16 17 18 19 20 21 22 23 24
Rater:↓ Rating at 15 minutes, Followed by Full Lesson Full Only
Rater A11 11 22 22 33 33 44 44 55 55 66 66 22 22 11 11 66 66 55 55 33 33 44 44
1 2 3 4 4 3 1 2 3 4 2 1 1 2 4 3 4 3 2 1 1 2 4 3
Rater B55 55 11 11 33 33 22 22 66 66 44 44 11 11 44 44 33 33 22 22 66 66 55 55
4 3 1 2 3 4 2 1 3 4 1 2 3 4 4 3 1 2 4 3 1 2 1 2
Table 1
8 | The Reliability of classroom Observations
The darker shaded sources of variance refer to “undesirable” sources of variability for the purpose of dis-tinguishing among teachers on this scale. These variance components all contain reference to teachers and would thus alter teacher rankings. Unshaded variance components refer to observed score variance that is not consequential for relative rankings. For example, an item-by-rater interaction quantifies score variability due to certain raters who give lower mean scores for certain items. This adds to observed score variability but does not change teacher rankings, as this effect is constant across teachers. However, this source of error becomes consequential if, for example, different raters rate different teachers. Generalizability theory enables us to estimate sources of error and to simulate the reliability of different scenarios, varying the number and type of raters and the number and length of lessons.
DEscRIbIng vARIAncE cOMPOnEnTs fOR A I x r x (L:T) gEnERAlIzAbIlITy sTuDy
Source Description
T Teacher variance or “true score” variance. The “signal” that is separable from “error.”
I Variance due to items. Some items are more difficult than others.
R Variance due to raters. Some raters are more difficult than others.
L:T Variance due to lessons. Confounded with teacher score dependence upon lessons.
T x I Some teachers score higher on certain items.
T x R Some raters score higher certain teachers.
I x R Some raters score higher certain items.
T x I x R Some raters score higher certain teachers on certain items.
I x (L:T) Some items receive higher scores on certain lessons. Cofounded with teacher score dependence.
(L:T) x R Some raters score certain lessons higher. Confounded with teacher score dependence.
(L:T) x I x R, e Error variance, confounded with teacher score dependence on items, raters, and lessons.
T = Teacher, I = Item, R = Rater, L = Lesson, and e = residual error variance
Table 2
The Reliability of classroom Observations | 9
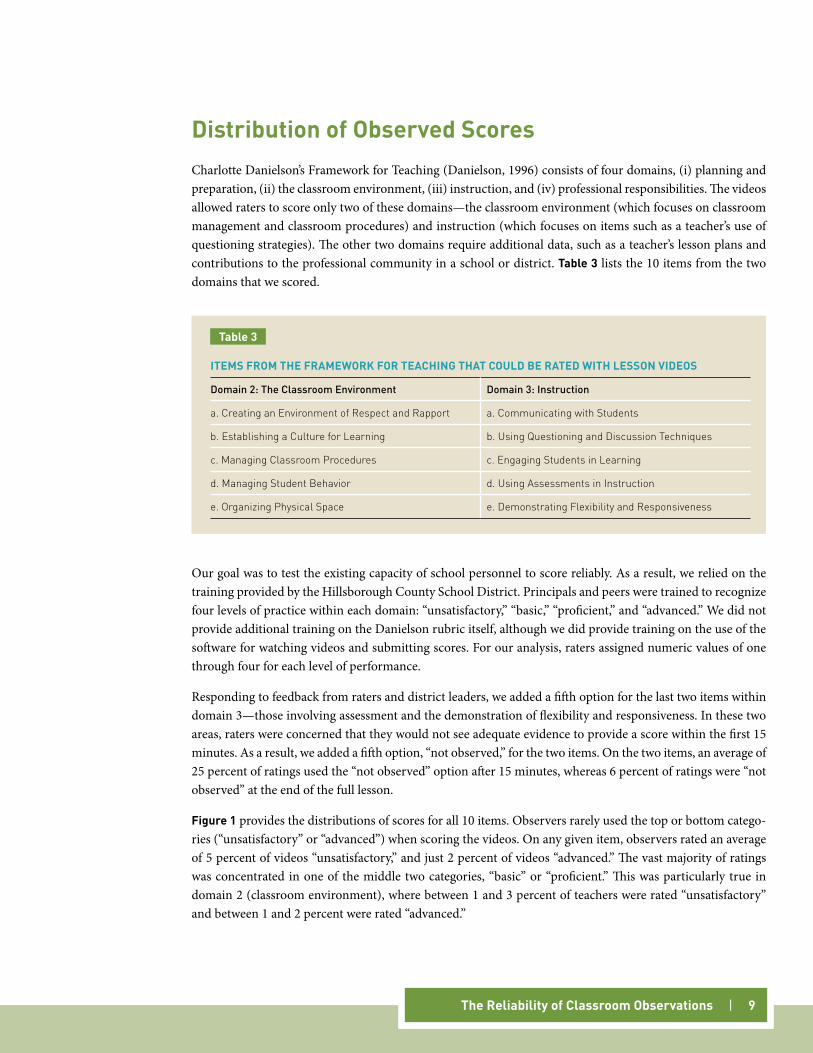
Distribution of Observed scoresCharlotte Danielson’s Framework for Teaching (Danielson, 1996) consists of four domains, (i) planning and preparation, (ii) the classroom environment, (iii) instruction, and (iv) professional responsibilities. The videos allowed raters to score only two of these domains—the classroom environment (which focuses on classroom management and classroom procedures) and instruction (which focuses on items such as a teacher’s use of questioning strategies). The other two domains require additional data, such as a teacher’s lesson plans and contributions to the professional community in a school or district. Table 3 lists the 10 items from the two domains that we scored.
Our goal was to test the existing capacity of school personnel to score reliably. As a result, we relied on the training provided by the Hillsborough County School District. Principals and peers were trained to recognize four levels of practice within each domain: “unsatisfactory,” “basic,” “proficient,” and “advanced.” We did not provide additional training on the Danielson rubric itself, although we did provide training on the use of the software for watching videos and submitting scores. For our analysis, raters assigned numeric values of one through four for each level of performance.
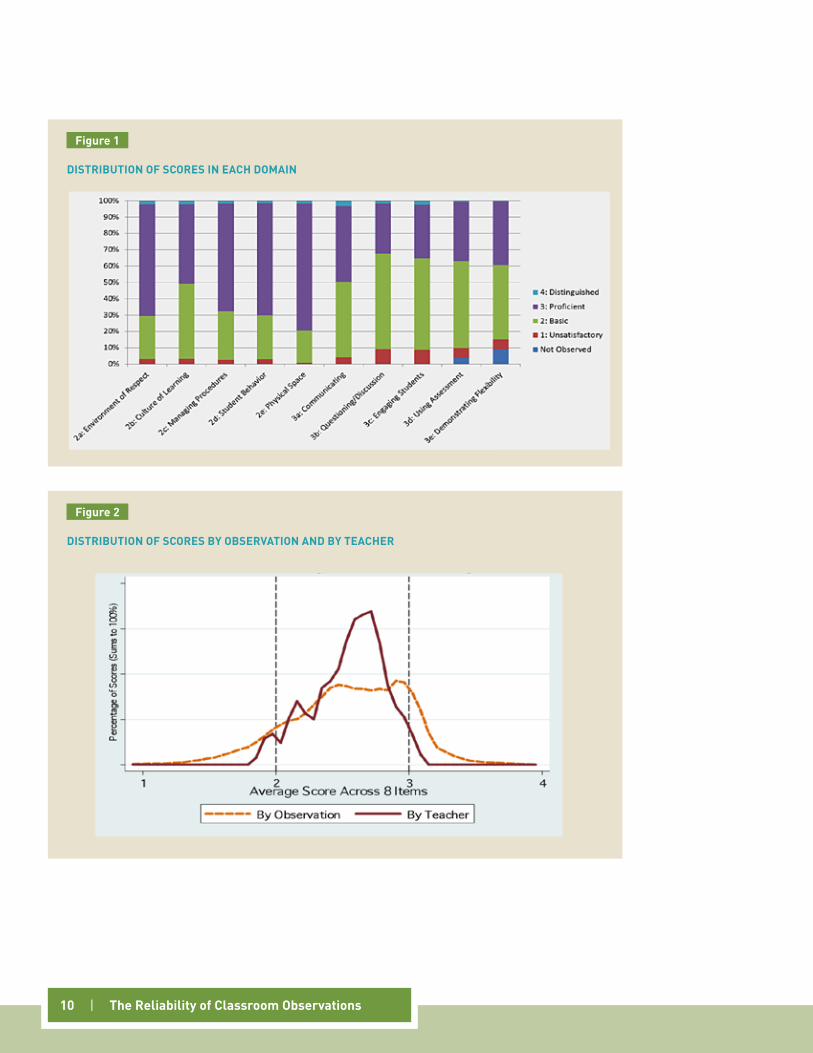
Responding to feedback from raters and district leaders, we added a fifth option for the last two items within domain 3—those involving assessment and the demonstration of flexibility and responsiveness. In these two areas, raters were concerned that they would not see adequate evidence to provide a score within the first 15 minutes. As a result, we added a fifth option, “not observed,” for the two items. On the two items, an average of 25 percent of ratings used the “not observed” option after 15 minutes, whereas 6 percent of ratings were “not observed” at the end of the full lesson.
figure 1 provides the distributions of scores for all 10 items. Observers rarely used the top or bottom catego-ries (“unsatisfactory” or “advanced”) when scoring the videos. On any given item, observers rated an average of 5 percent of videos “unsatisfactory,” and just 2 percent of videos “advanced.” The vast majority of ratings was concentrated in one of the middle two categories, “basic” or “proficient.” This was particularly true in domain 2 (classroom environment), where between 1 and 3 percent of teachers were rated “unsatisfactory” and between 1 and 2 percent were rated “advanced.”
ITEMs fROM THE fRAMEWORK fOR TEAcHIng THAT cOulD bE RATED WITH lEssOn vIDEOs
Domain 2: The Classroom Environment Domain 3: Instruction
a. Creating an Environment of Respect and Rapport a. Communicating with Students
b. Establishing a Culture for Learning b. Using Questioning and Discussion Techniques
c. Managing Classroom Procedures c. Engaging Students in Learning
d. Managing Student Behavior d. Using Assessments in Instruction
e. Organizing Physical Space e. Demonstrating Flexibility and Responsiveness
Table 3
10 | The Reliability of classroom Observations
DIsTRIbuTIOn Of scOREs In EAcH DOMAIn
figure 1
DIsTRIbuTIOn Of scOREs by ObsERvATIOn AnD by TEAcHER
figure 2
The Reliability of classroom Observations | 11
figure 2 shows two different distributions: the dashed orange line is the distribution of scores by individual classroom observation (the distribution has a mean of 2.58 and a standard deviation of .43); the solid red line is the distribution of scores by teacher, averaging across all available observations for each teacher (with a mean of 2.58 and a standard deviation of 0.27).9 There are 3,120 individual observations portrayed by the orange line. The same 3,120 observations are averaged by teacher to produce 67 average scores for the red line.
The distribution of scores by single observations is fairly symmetric except for a small jump at exactly 3. However, it is also compact. Only 17 percent of individual observations had an overall score outside the inter-val 2 to 3 (inclusive). In the central portion of the distribution of individual observations, a difference of 0.1 point corresponds to 10 percentile points.
The average teacher received more than 46 scores from 11 different observers. Averaging the scores over les-sons and observers allows for a clearer picture of the differences in underlying teacher practice. This distribu-tion is even more compact: 93 percent of all teachers had average scores in the 2 to 3 interval. In the central portion of the distribution of teacher average scores over many observations, a difference of 0.1 point cor-responds to 15 percentile points.
cOMPARIng THE vIDEO sAMPlE TO OTHER HIllsbOROugH TEAcHERs
In Table 4, we summarize the differences between the 67 teachers who consented to participate in this study and all teachers in Hillsborough County working in 4th through 8th grade math and English classrooms. The top panel reports the mean and standard deviation of scores by peer and administrator evaluators during the 2011–12 school year on domains 2 and 3 of the Danielson instrument (the two domains we are using for this study). The next panel reports scores for informal observations by administrators and peer evaluators. The third panel reports the value-added scores used by the district in its evaluation system. The bottom panel reports the total evaluation score for the teachers on the district’s evaluation system in 2010–11, which com-bines value-added and administrator and peer ratings. For each of the measures, two patterns are evident: the mean score for the video-sample teachers was between .24 and .45 standard deviations higher than the district overall, and the variance in scores was smaller (57 percent to 89 percent of the districtwide variance). In other words, the video-sample teachers were a higher-performing and less variable group than Hillsborough teach-ers overall. In general, samples with restricted ranges understate the reliability of their populations, assuming other conditions of measurement remain the same (Haertel, 2006). This implies that if the conditions of this study were applied to the full population, the reliability coefficients reported through this paper would be conservative.
The top two panels of Table 4 imply two other findings: First, for both groups of teachers, the mean scores given by peers were considerably lower than the scores granted by administrators to their own teachers. The differences are large, .2 to .3 points, which translates into two-thirds to three-quarters of a standard deviation. Second, the variation in scores given by peers was also somewhat smaller than that given by administrators. As reported in the next section, we observed similar patterns of differences in scores when peers and admin-istrators scored the videos for this study.
9 Both of these have been limited to items 2a through 3c, given the number of observers who reported being unable to score items 3d and 3e. For the observations where an observer recorded two scores (at 15 minutes and at the end of the lesson), we used only the end-of-lesson scores.
12 | The Reliability of classroom Observations
cOMPARIng THE vIDEO-sAMPlE TEAcHERs TO HIllsbOROugH TEAcHERs
MET Project Video Study All Teachers
Difference in S.D. Units
Ratio of Variances
Formal Observations in 2011–12*
ADMInISTRATORS
Mean 2.96 2.87 0.24
S.D. 0.28 0.37 0.57
n 66 12,808
PEER EVALUATORS
Mean 2.78 2.68 0.28
S.D. 0.34 0.36 0.89
n 66 12,610
Informal Observations in 2011–12*
ADMInISTRATORS
Mean 3.16 2.97 0.45
S.D. 0.37 0.42 0.78
n 66 11,554
PEER EVALUATORS
Mean 2.84 2.75 0.24
S.D. 0.32 0.38 0.71
n 67 10,986
Value-Added (2010–11 District Calculated)
Mean 25.15 24.29 0.26
S.D. 2.6 3.33 0.61
n 65 11,709
Total Evaluation Score (Value-Added & Admin + Peer Rating 2010–11)
Mean 64.56 60.9 0.40
S.D. 7.36 9.11 0.65
n 65 11,709
notes: The data on evaluation metrics for all teachers in Hillsborough were provided by the school district. Formal and informal scores use the weights developed by the district and incorporate all available observations. Total evaluation score is a sum of value-added (40 points), administrator ratings (30 points), and peer ratings (30 points).
Table 4
The Reliability of classroom Observations | 13
components of variance and ReliabilityTable 5 presents our estimates of the sources of variance in teacher scores using school-based observers in Hillsborough County, and it compares them to analogous estimates in Kane and Staiger (2012).10 For com-parability across analyses, we have pooled the results across items 2a through 3c, and we report the variance components of the unweighted mean in overall FFT scores. We emphasize five findings from Table 5.
First, our estimate of the standard deviation in underlying teacher performance is similar to that estimated in the earlier study. While that study found a standard deviation of .29 points on a four-point scale, our results suggest a .27 point standard deviation.
Note that .27 corresponds to the distribution in average scores by teacher (the red line) in Figure 2. This is not a coincidence. Averaging across 46 or more observations per teacher by different observers and different lessons reduces the variance due to differences in scores across raters and lessons, producing something much closer to the true variance in underlying practice by teachers.
Second, the reliability from a single observation in Hillsborough is comparable to that which we obtained in our earlier study using raters trained by ETS. The reliability of a single observation is simply the proportion of variance that is attributable to persistent differences in teacher practice. A single observation by a single observer is a fairly unreliable estimate of a teacher’s practice, with reliability between .27 and .45.11
10 In Kane and Staiger (2012), clusters of raters were assigned to rate the videos for the teachers in a given school, grade, and subject. If a teacher taught more than one section of students, the two videos were drawn from each of two course sections. However, a given rater typically saw only one video for a given teacher, limiting our ability to identify a rater-by-teacher variance component.
11 In the present study, we have videos from each teacher from a single course section. As a result, when we refer to the “teacher component” in this paper, we are actually referring to the “teacher + section component.” In the earlier report, we could separately identify the effect of section. note that the section component was small in the earlier study.
cOMPARIng THE sOuRcEs Of vARIAncE In HIllsbOROugH TO PREvIOus MET PROJEcT REPORTs
FROM G-STUDy PERCENT OF VARIANCE
S.D. of Teacher Effect (4 point scale)
SEM of a Single
Observation Teacher SectionLesson | Teacher Rater
Rater X Teacher
Rater X Lesson | Teacher, Residual
Kane and Staiger (2012) 0.293 0.380 37 4 10 6 43
Hillsborough 0.274 0.342 39 7 13 17 23
Administrators only 0.333 0.369 45 5 10 15 24
Peers only 0.197 0.313 27 11 17 21 22
notes: Kane and Staiger estimates are based on scoring by ETS-trained raters watching the first 30 minutes of the MET project videos. Hillsborough estimates include all videos scored by each type of rater. The peer raters, then, will include both teacher chosen and non-chosen videos.
Table 5
14 | The Reliability of classroom Observations
Third, the variation from lesson to lesson for a given teacher (the lesson-within-teacher component) was lower than the earlier study for administrators (5 percent versus 10 percent) but very comparable for peer observers (11 percent versus 10 percent). This may reflect the fact that familiar administrators enter an obser-vation with a clearer perception of a teacher and a better understanding of the context. For both those reasons, they may have less variation in scores from lesson to lesson. Because they have had little or no prior exposure to a teacher, the peers are more comparable to the raters in the earlier study.
Fourth, the rater effect (that attributable to some raters being consistently high and others being consistently low) was larger in Hillsborough than in the earlier study (10 to 17 percent versus 6 percent). While the rater effects in Hillsborough are still modest, the larger magnitude may have been due to the daily calibration exercises that ETS required of its raters, which were not required in Hillsborough. (Before each session, ETS raters had to score a set of videos and produce a limited number of discrepancies before being allowed to score that day.)
Fifth, while the remaining sources of variance were comparable in Hillsborough and the earlier study (rep-resenting 39 percent to 43 percent of the variance in scores), the research design in Hillsborough allows us to decompose that further. For instance, we are able to identify the importance of “rater-by-teacher” effects—differences in rater perceptions of a given teacher’s practice. The rater-by-teacher component rep-resents 15 percent to 20 percent of the variance in scores. In other words, it accounts for about half of the residual we saw in the earlier study. This is substantively important because increasing the number of les-sons per observer does not shrink this portion of the residual. The only way to reduce the error and mis-judgments due to rater-by-teacher error is to increase the number of raters per teacher, not just the number of lessons observed. (This implies that adding raters improves reliability more than adding observations by the same rater, a point we discuss further on.)
The Reliability of classroom Observations | 15
comparing Administrators and PeersA subset of the teacher lessons were observed by four types of observers:12 (i) administrators from the teacher’s own schools, (ii) administrators from other schools, (iii) peer observers who were certified in a teacher’s grade range, and (iv) peer observers from other grade ranges. In Table 6, we report the mean scores, sources of vari-ance, and reliability for all four categories of observers.
We highlight five findings: First, administrators scored their own teachers higher—about .10 points higher on average than administrators from other schools and .20 points higher than peers. Although these differences may seem small in absolute terms, this “home field advantage” is large in relative terms. Given the compressed distribution of teacher scores, the difference is between one-third and two-thirds of the underlying standard deviation in scores between teachers. As noted above, a .10 point advantage would move a teacher by approxi-mately 10 percentile points in the distribution of observation scores.13
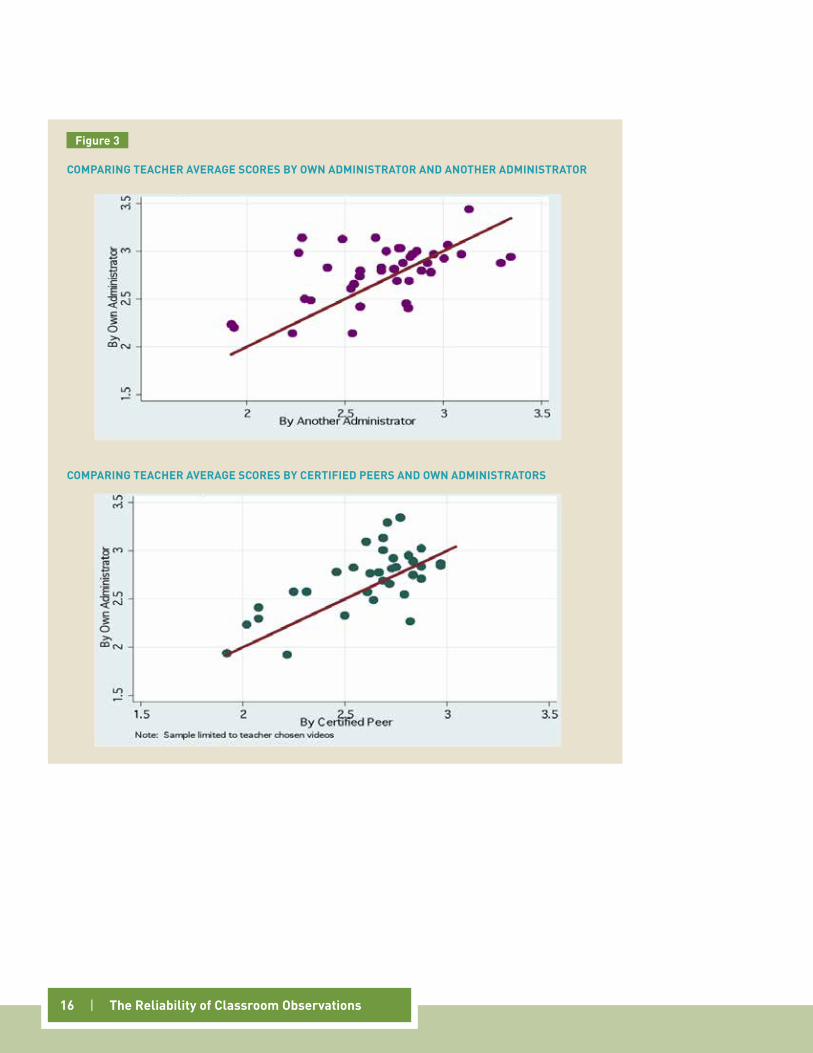
The top panel of figure 3 portrays the mean score by a teacher’s own administrator against the mean score given to the same teacher by an administrator from another school.14 The red line is the 45 degree line, where the two scores would be equivalent. The average score from a teacher’s own administrator(s) is on the vertical axis and the average score from other administrators is on the horizontal axis. Note that many of the points lie above the 45 degree line, meaning that own administrators are providing higher scores for teachers than other administrators. The bottom panel of Figure 3 compares the mean scores from a teacher’s own administrators
12 This represents the four chosen videos for the 44 teachers who exercised their right to choose. For the 23 teachers who did not elect to choose, we chose four videos at random and showed them to all four types of raters.
13 This is equivalent to approximately 15 percentile points in the distribution of underlying teacher scores.14 All of these scores in Figure 3 are for teacher-chosen videos.
MEAn scOREs, sOuRcEs Of vARIAncE, AnD RElIAbIlITy by TyPE Of ObsERvER
By TyPE OF RATERMean Score
# of Ratings
FROM G-STUDy
Reliability of 1 Rating by 1
Observer
PERCENT IMPROVEMENT IN RELIABILITy
S.D. of Teacher
Effect
SEM of a Single
Observation1 12 Lessons
(1 rater)1 12 Raters
(1 lesson)1 12 Raters (2 lessons)
Administrator from same school 2.6658 428 0.326 0.320 0.510 14.22% 22.72% 31.56%
Difference relative to own administrator:
Administrator from another school -0.10 844 0.332 0.380 0.433 17.45% 35.73% 39.13%
Peers from same grade range -0.20 684 0.195 0.308 0.287 19.36% 42.15% 54.59%
Peers from different grade range -0.25 606 0.190 0.338 0.240 21.96% 47.22% 60.65%
notes: Sample was limited to chosen lessons, along with a set of four lessons from the teachers who were indifferent to lesson selection. Based on average scores for items 2a through 3e of the Framework for Teaching.
Table 6
16 | The Reliability of classroom Observations
cOMPARIng TEAcHER AvERAgE scOREs by OWn ADMInIsTRATOR AnD AnOTHER ADMInIsTRATOR
cOMPARIng TEAcHER AvERAgE scOREs by cERTIfIED PEERs AnD OWn ADMInIsTRATORs
figure 3
The Reliability of classroom Observations | 17
against the scores given by similarly certified peers. Again, most of the points are above the 45 degree line. Moreover, following Table 6, the advantage given by own administrators is larger relative to peers than relative to other administrators.
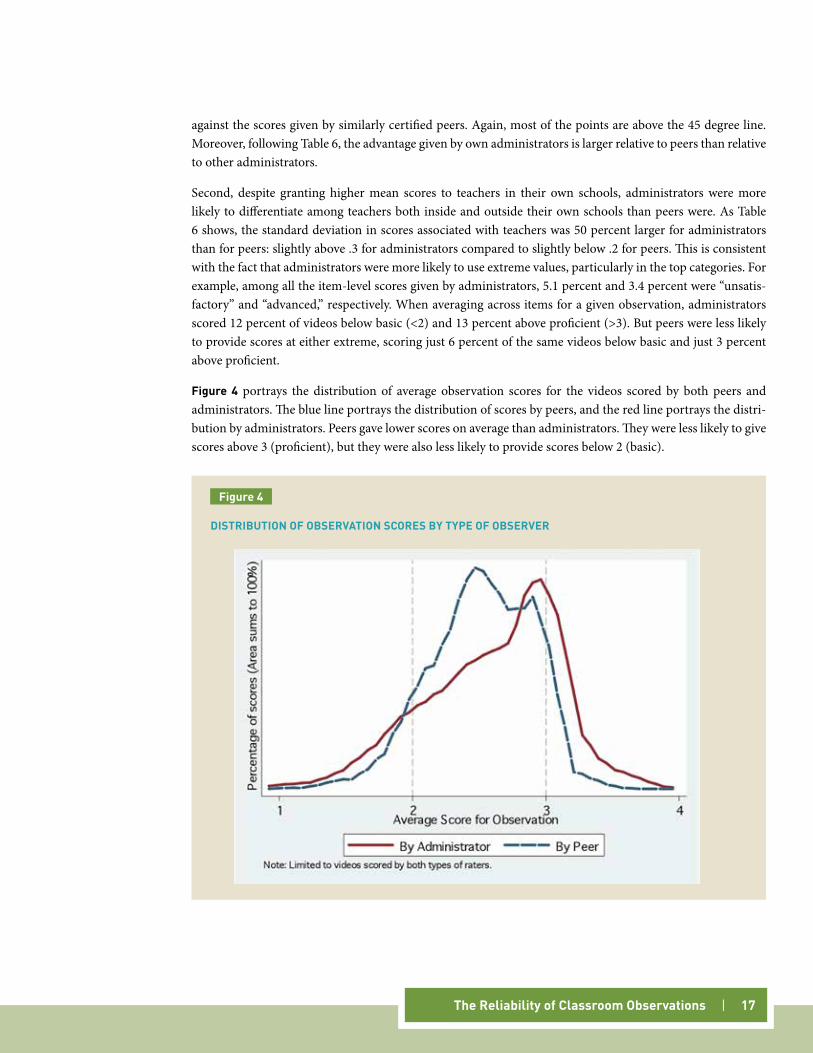
Second, despite granting higher mean scores to teachers in their own schools, administrators were more likely to differentiate among teachers both inside and outside their own schools than peers were. As Table 6 shows, the standard deviation in scores associated with teachers was 50 percent larger for administrators than for peers: slightly above .3 for administrators compared to slightly below .2 for peers. This is consistent with the fact that administrators were more likely to use extreme values, particularly in the top categories. For example, among all the item-level scores given by administrators, 5.1 percent and 3.4 percent were “unsatis-factory” and “advanced,” respectively. When averaging across items for a given observation, administrators scored 12 percent of videos below basic (<2) and 13 percent above proficient (>3). But peers were less likely to provide scores at either extreme, scoring just 6 percent of the same videos below basic and just 3 percent above proficient.
figure 4 portrays the distribution of average observation scores for the videos scored by both peers and administrators. The blue line portrays the distribution of scores by peers, and the red line portrays the distri-bution by administrators. Peers gave lower scores on average than administrators. They were less likely to give scores above 3 (proficient), but they were also less likely to provide scores below 2 (basic).
DIsTRIbuTIOn Of ObsERvATIOn scOREs by TyPE Of ObsERvER
figure 4
18 | The Reliability of classroom Observations
Third, the standard error of measurement was similar for all four types of observers. It was only slightly higher for administrators from other schools than for the administrators from the same schools (.38 versus .32) and for peers from different grade ranges than for peers in the same grade range as the teacher being observed (.34 versus .31).
Fourth, despite having similar standard errors of measurement, the reliability of administrator scores was higher for administrators than for peers. Reliability is the proportion of variance in observed scores that reflects persistent differences between teachers. Even though the error variance was similar, administrators discerned larger underlying differences between teachers, producing a higher implied reliability.
Fifth, the percentage gain in reliability from having an observer watch one more lesson from a teacher is about half as large as the gain from having a second observer watch the original lesson. In other words, having one video watched by two different observers produces more reliable scores than having one observer watch two videos from the same teacher. (This is due to the fact that the lesson-to-lesson variance, and its interactions with other sources of error, is less than the corresponding variance for raters.)
The gain is even larger when the second observer watches a different lesson from the first observer. With two raters each scoring a single lesson, reliability improves in two ways—by dividing both the lesson-to-lesson variance and the rater-by-teacher error variance in half. When having the same rater score two lessons from a teacher, only the lesson-to-lesson variance is reduced. As a result, if a school district is going to pay the cost to observe two lessons for each teacher (both financially and in terms of school professionals’ time), it gets bigger improvements in reliability by having each lesson observed by a different observer.
The Reliability of classroom Observations | 19
ARE DIffEREnT TyPEs Of RATERs sEEIng TEAcHERs sIMIlARly?
Higher reliability simply means that administrators were more consistent. But consistency does not necessar-ily imply accuracy. For example, if a principal and an assistant principal shared the same bias against a teacher from their school—either positive or negative—and allowed those biases to drive the scores they provided, then we would conclude that these administrators were quite “reliable.” The reliability statistic cannot distin-guish between consistent bias and consistent accuracy.
However, because each teacher was observed by different types of observers—administrators from their own school as well as peers and administrators elsewhere—we can study the degree to which the different observ-ers were interpreting the video evidence similarly. Specifically, we can calculate the correlation in the teacher effects across different types of observers and correct for reliability.15 To the extent that different types of observers were looking for different behaviors, were using different standards, or were influenced by informa-tion outside the video record, then the correlation in their teacher effects will be less than one.
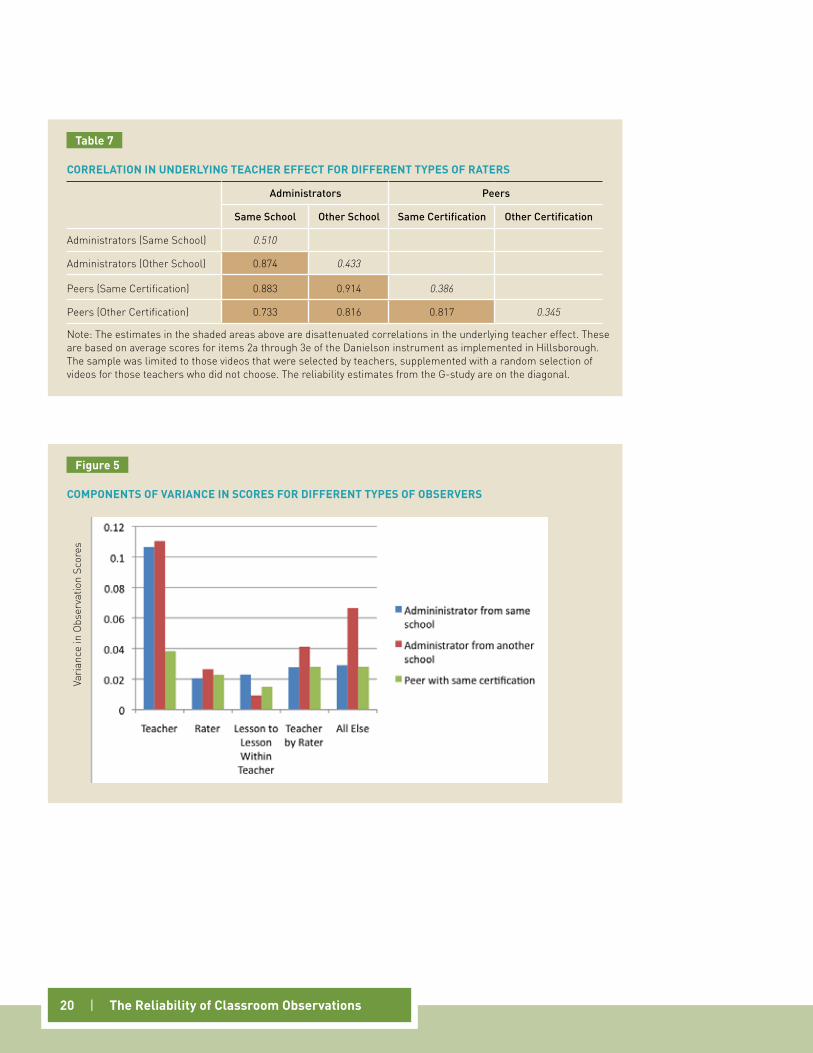
The correlations are reported in Table 7, along with the estimated reliabilities for each of the four types of rat-ers (which are reported along the diagonal). As reported in the first column of Table 7, the estimated correla-tion in teacher effects between administrators from the teacher’s own school and administrators from another school was high, .87. Moreover, the correlation between a teacher’s own administrators’ scores and those of peer observers from the same grade range was also high, .88. The correlation with peer observers’ ratings from a different certification area was not as high, .73—implying that the peer observers from other grade ranges interpreted the videos differently from administrators and peers from the same grade level.
The second column reports the correlations for administrators outside a teacher’s school. The correlation between unfamiliar administrators and peers from the same grade range was slightly higher than the .87 correlation between administrators, at .91. In other words, administrators who do not know a given teacher and peer observers from the teacher’s grade range were most likely to concur in their assessments of a given teacher’s practice. The group of observers that was least aligned with the other three types of observers were the peer observers from other grade levels.
15 To calculate the correlation in the underlying teacher effects being measured by different types of raters, we use the following calculation. Suppose each teacher (designated by the subscript i) is observed by an observer of type j, during a lesson k, by a specific rater r. Then the disattenuated correlation in observation scores by observers of type 1 and 2 would be as follows:
(1) ( ( , , , ), ( , , , ))
r rCorr Score i k r Score i not k not r1 2
12
1 2
t =
where the numerator is the correlation in scores whenever two different lessons from a given teacher were scored by raters of different types. In the denominator, r1 and r2 represent the estimated reliabilities of scores for rater types 1 and 2, respectively. In other words, we first calculate the observed correlation in scores whenever a different lesson for a given teacher was scored by a different type of observer. We then correct that correlation to account for the known tendency of low reliability to diminish observed correlations. The result is the estimated correlation in underlying teacher effect as observed by raters of any two types, 1 and 2.
20 | The Reliability of classroom Observations
cORRElATIOn In unDERlyIng TEAcHER EffEcT fOR DIffEREnT TyPEs Of RATERs
Administrators Peers
Same School Other School Same Certification Other Certification
Administrators (Same School) 0.510
Administrators (Other School) 0.874 0.433
Peers (Same Certification) 0.883 0.914 0.386
Peers (Other Certification) 0.733 0.816 0.817 0.345
note: The estimates in the shaded areas above are disattenuated correlations in the underlying teacher effect. These are based on average scores for items 2a through 3e of the Danielson instrument as implemented in Hillsborough. The sample was limited to those videos that were selected by teachers, supplemented with a random selection of videos for those teachers who did not choose. The reliability estimates from the G-study are on the diagonal.
Table 7
cOMPOnEnTs Of vARIAncE In scOREs fOR DIffEREnT TyPEs Of ObsERvERs
figure 5
Vari
ance
in O
bser
vatio
n Sc
ores
The Reliability of classroom Observations | 21
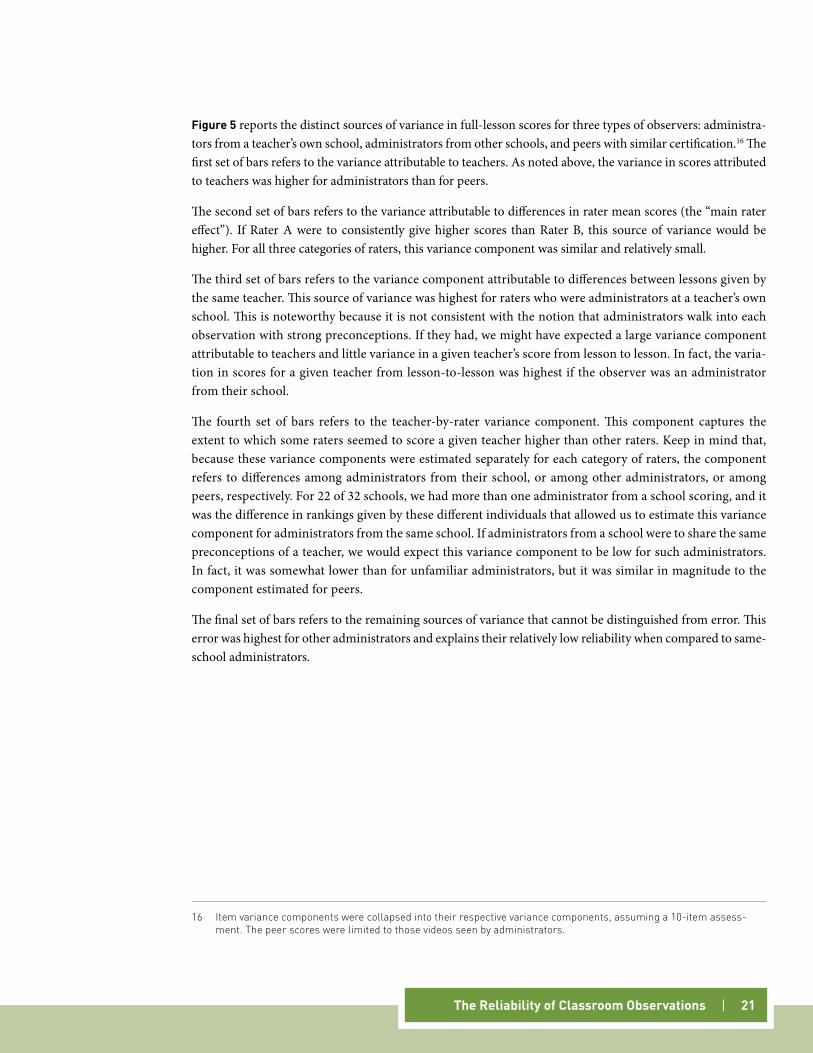
figure 5 reports the distinct sources of variance in full-lesson scores for three types of observers: administra-tors from a teacher’s own school, administrators from other schools, and peers with similar certification.16 The first set of bars refers to the variance attributable to teachers. As noted above, the variance in scores attributed to teachers was higher for administrators than for peers.
The second set of bars refers to the variance attributable to differences in rater mean scores (the “main rater effect”). If Rater A were to consistently give higher scores than Rater B, this source of variance would be higher. For all three categories of raters, this variance component was similar and relatively small.
The third set of bars refers to the variance component attributable to differences between lessons given by the same teacher. This source of variance was highest for raters who were administrators at a teacher’s own school. This is noteworthy because it is not consistent with the notion that administrators walk into each observation with strong preconceptions. If they had, we might have expected a large variance component attributable to teachers and little variance in a given teacher’s score from lesson to lesson. In fact, the varia-tion in scores for a given teacher from lesson-to-lesson was highest if the observer was an administrator from their school.
The fourth set of bars refers to the teacher-by-rater variance component. This component captures the extent to which some raters seemed to score a given teacher higher than other raters. Keep in mind that, because these variance components were estimated separately for each category of raters, the component refers to differences among administrators from their school, or among other administrators, or among peers, respectively. For 22 of 32 schools, we had more than one administrator from a school scoring, and it was the difference in rankings given by these different individuals that allowed us to estimate this variance component for administrators from the same school. If administrators from a school were to share the same preconceptions of a teacher, we would expect this variance component to be low for such administrators. In fact, it was somewhat lower than for unfamiliar administrators, but it was similar in magnitude to the component estimated for peers.
The final set of bars refers to the remaining sources of variance that cannot be distinguished from error. This error was highest for other administrators and explains their relatively low reliability when compared to same-school administrators.
16 Item variance components were collapsed into their respective variance components, assuming a 10-item assess-ment. The peer scores were limited to those videos seen by administrators.
22 | The Reliability of classroom Observations
InTERnAl OR ExTERnAl ObsERvERs?
Some school districts have chosen to take on the additional expense of involving external observers—from outside a teacher’s school—in classroom observations. Our results are unambiguous in suggesting the impor-tance of having more than one observer. The gain in reliability from adding another set of eyeballs is more than twice as large as that of adding another observation from the same observer.
But do those eyeballs have to belong to an observer from outside the school? Our results are unclear on that score. Those who advocate for external review often point to the possibility of bias in a school setting, fearing that a principal’s or other administrator’s scores would be driven by preconceptions for or against a teacher. While administrators gave their teachers higher mean scores, we saw little evidence that such preconceptions were a major influence on the relative ranking of video scores: (1) the underlying scores given by administra-tors from a teacher’s school were highly correlated with the scores given by other administrators and peers who only saw the teacher on video; (2) rather than being fixed, administrators’ scores seemed to vary from lesson to lesson for a given teacher just as much as when other observers were scoring; and (3) different administrators in a school had a similar degree of disagreement in their assessment of individual teachers as peers (although somewhat less than administrators from other schools did).
Nevertheless, having at least a subset of teachers observed by external observers provides assurance that the system itself remains fair and reliable by safeguarding against any biases internal to a school. This could be done by having a random sample of teachers observed by external observers (as we suggested in Gathering Feedback for Teaching, 2012).
The Reliability of classroom Observations | 23
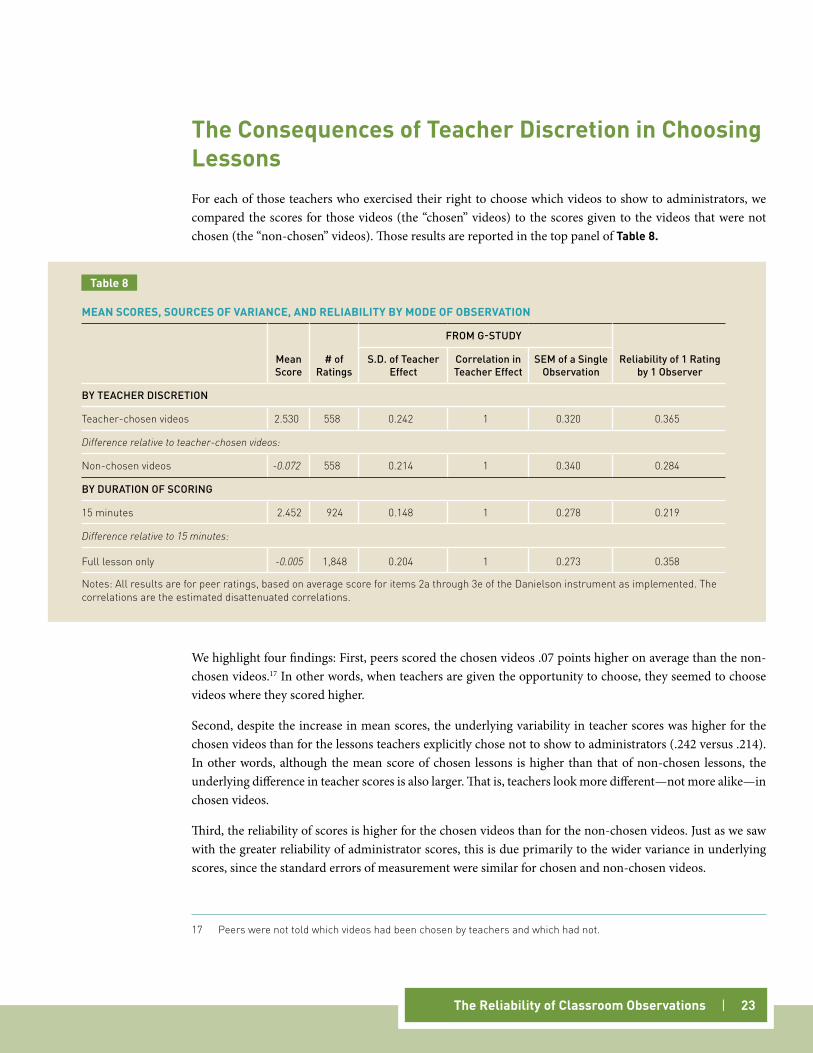
The consequences of Teacher Discretion in choosing lessonsFor each of those teachers who exercised their right to choose which videos to show to administrators, we compared the scores for those videos (the “chosen” videos) to the scores given to the videos that were not chosen (the “non-chosen” videos). Those results are reported in the top panel of Table 8.
We highlight four findings: First, peers scored the chosen videos .07 points higher on average than the non-chosen videos.17 In other words, when teachers are given the opportunity to choose, they seemed to choose videos where they scored higher.
Second, despite the increase in mean scores, the underlying variability in teacher scores was higher for the chosen videos than for the lessons teachers explicitly chose not to show to administrators (.242 versus .214). In other words, although the mean score of chosen lessons is higher than that of non-chosen lessons, the underlying difference in teacher scores is also larger. That is, teachers look more different—not more alike—in chosen videos.
Third, the reliability of scores is higher for the chosen videos than for the non-chosen videos. Just as we saw with the greater reliability of administrator scores, this is due primarily to the wider variance in underlying scores, since the standard errors of measurement were similar for chosen and non-chosen videos.
17 Peers were not told which videos had been chosen by teachers and which had not.
MEAn scOREs, sOuRcEs Of vARIAncE, AnD RElIAbIlITy by MODE Of ObsERvATIOn
Mean Score
# of Ratings
FROM G-STUDy
Reliability of 1 Rating by 1 Observer
S.D. of Teacher Effect
Correlation in Teacher Effect
SEM of a Single Observation
By TEAChER DISCRETION
Teacher-chosen videos 2.530 558 0.242 1 0.320 0.365
Difference relative to teacher-chosen videos:
non-chosen videos -0.072 558 0.214 1 0.340 0.284
By DURATION OF SCORING
15 minutes 2.452 924 0.148 1 0.278 0.219
Difference relative to 15 minutes:
Full lesson only -0.005 1,848 0.204 1 0.273 0.358
notes: All results are for peer ratings, based on average score for items 2a through 3e of the Danielson instrument as implemented. The correlations are the estimated disattenuated correlations.
Table 8
24 | The Reliability of classroom Observations
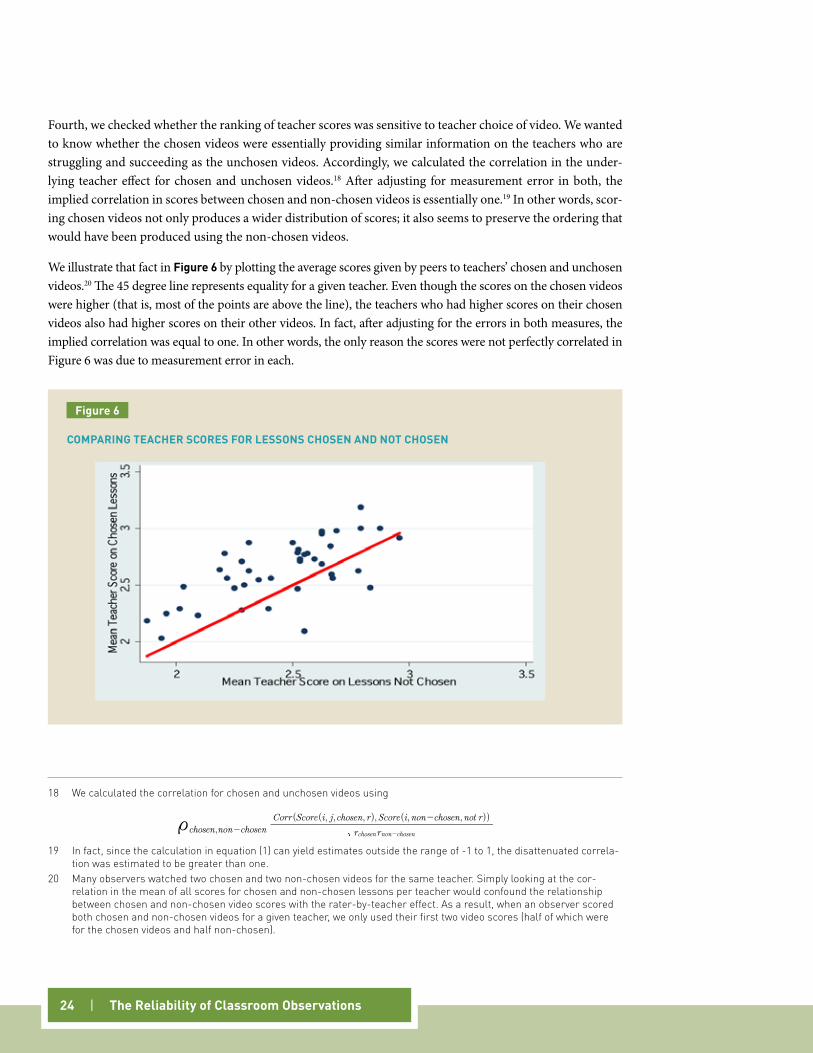
Fourth, we checked whether the ranking of teacher scores was sensitive to teacher choice of video. We wanted to know whether the chosen videos were essentially providing similar information on the teachers who are struggling and succeeding as the unchosen videos. Accordingly, we calculated the correlation in the under-lying teacher effect for chosen and unchosen videos.18 After adjusting for measurement error in both, the implied correlation in scores between chosen and non-chosen videos is essentially one.19 In other words, scor-ing chosen videos not only produces a wider distribution of scores; it also seems to preserve the ordering that would have been produced using the non-chosen videos.
We illustrate that fact in figure 6 by plotting the average scores given by peers to teachers’ chosen and unchosen videos.20 The 45 degree line represents equality for a given teacher. Even though the scores on the chosen videos were higher (that is, most of the points are above the line), the teachers who had higher scores on their chosen videos also had higher scores on their other videos. In fact, after adjusting for the errors in both measures, the implied correlation was equal to one. In other words, the only reason the scores were not perfectly correlated in Figure 6 was due to measurement error in each.
18 We calculated the correlation for chosen and unchosen videos using
,( ( , , , ), ( , , ))
chosen non chosen r r
Corr Score i j chosen r Score i non chosen not r
chosen non chosent -
-
-
19 In fact, since the calculation in equation (1) can yield estimates outside the range of -1 to 1, the disattenuated correla-tion was estimated to be greater than one.
20 Many observers watched two chosen and two non-chosen videos for the same teacher. Simply looking at the cor-relation in the mean of all scores for chosen and non-chosen lessons per teacher would confound the relationship between chosen and non-chosen video scores with the rater-by-teacher effect. As a result, when an observer scored both chosen and non-chosen videos for a given teacher, we only used their first two video scores (half of which were for the chosen videos and half non-chosen).
cOMPARIng TEAcHER scOREs fOR lEssOns cHOsEn AnD nOT cHOsEn
figure 6
The Reliability of classroom Observations | 25
fifteen Minutes versus full lessonsThe bottom panel of Table 8 on page 23 compares the mean and variance of scores when observers scored a lesson after only 15 minutes and when they scored it only at the end of the full lesson. The mean score was similar with short and long observations. The standard error of measurement was similar. The disattenuated correlation in scores (adjusted for measurement error) was equal to one. However, underlying differences in teacher performance after 15 minutes were smaller than after observers scored the full lesson. The standard deviation in the underlying teacher effect was .15 points after 15 minutes and .20 points after the full lesson (usually 50 minutes to an hour). As a result, the reliability for each short observation was less than the reli-ability of the longer observations.
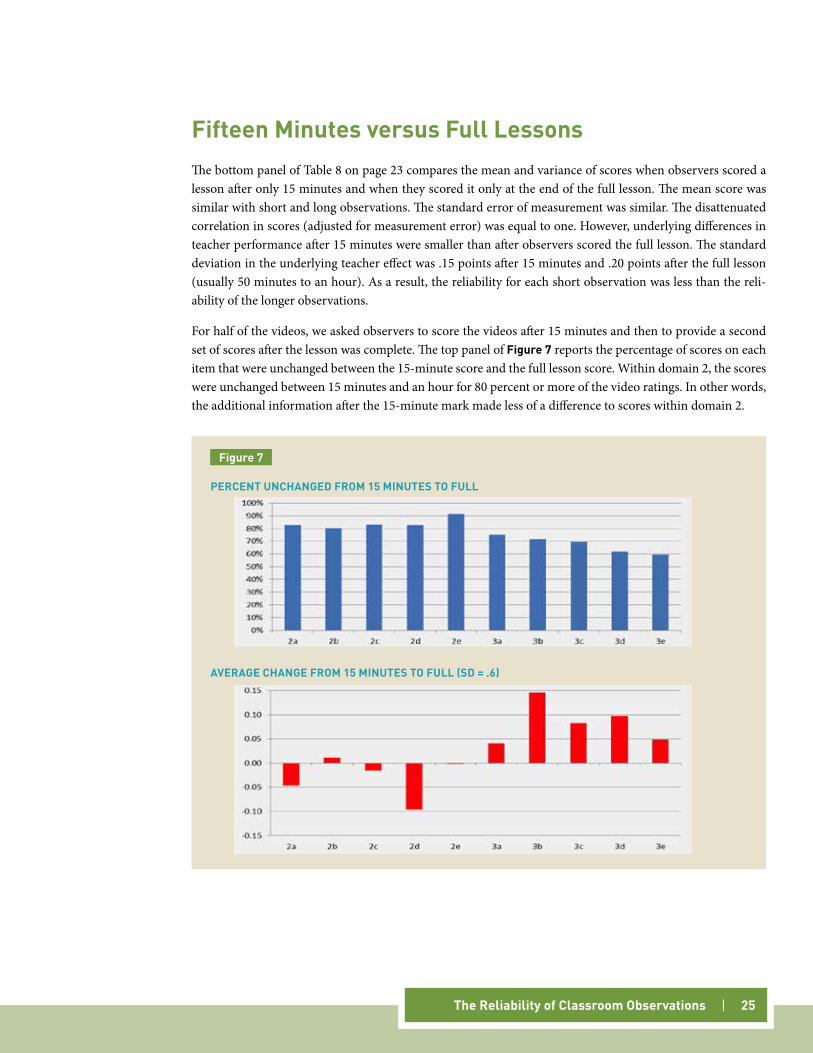
For half of the videos, we asked observers to score the videos after 15 minutes and then to provide a second set of scores after the lesson was complete. The top panel of figure 7 reports the percentage of scores on each item that were unchanged between the 15-minute score and the full lesson score. Within domain 2, the scores were unchanged between 15 minutes and an hour for 80 percent or more of the video ratings. In other words, the additional information after the 15-minute mark made less of a difference to scores within domain 2.
PERcEnT uncHAngED fROM 15 MInuTEs TO full
figure 7
AvERAgE cHAngE fROM 15 MInuTEs TO full (sD = .6)
26 | The Reliability of classroom Observations
However, within domain 3, being able to see the remainder of the lesson had a larger impact on the likelihood of changing scores. Rather than 80+ percent being unchanged, 60 percent to 75 percent were unchanged. Moreover, as reported in the bottom panel of Figure 7, observers were more likely than not to raise scores in domain 3 when they were able to watch a complete lesson.21
21 We tested the reliability of scoring when observers watched the first 15 minutes of a class, not a random 15-minute segment. Therefore, we are conflating the effects of short observations and watching the initial moments of a class. It may be that the types of instruction required for domain 3 are more likely to show up during a latter portion of a class. We do not have the data to test that hypothesis.
The Reliability of classroom Observations | 27
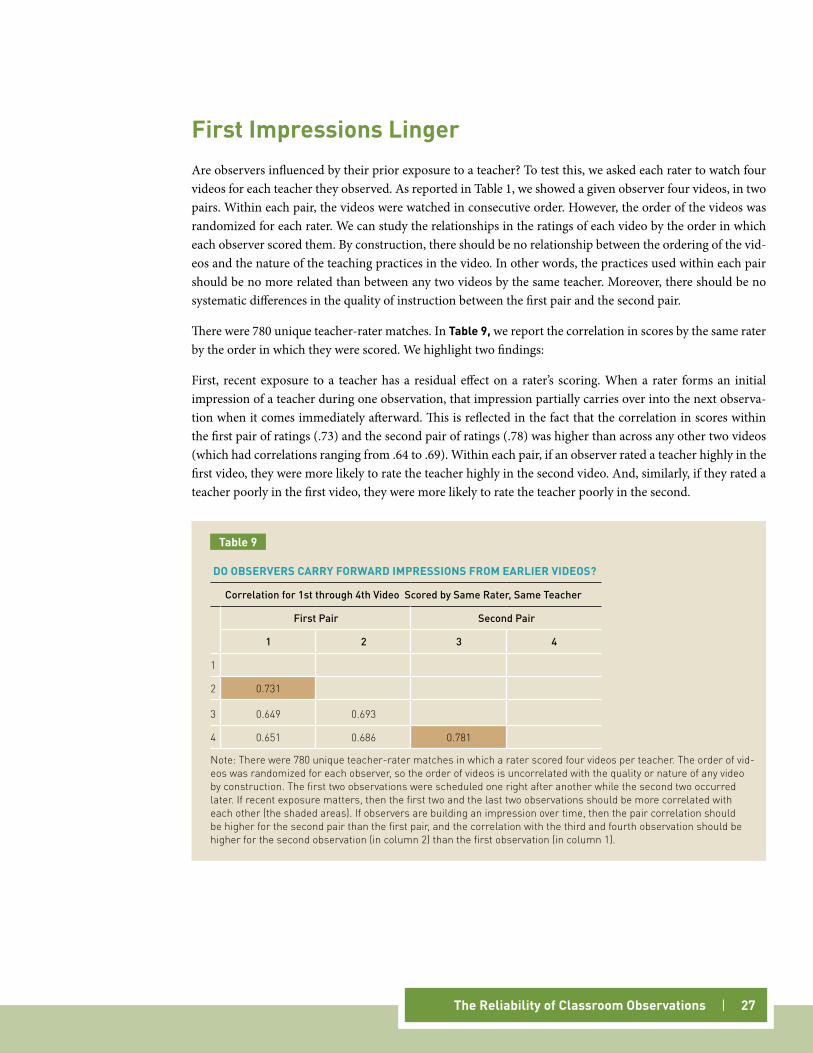
first Impressions lingerAre observers influenced by their prior exposure to a teacher? To test this, we asked each rater to watch four videos for each teacher they observed. As reported in Table 1, we showed a given observer four videos, in two pairs. Within each pair, the videos were watched in consecutive order. However, the order of the videos was randomized for each rater. We can study the relationships in the ratings of each video by the order in which each observer scored them. By construction, there should be no relationship between the ordering of the vid-eos and the nature of the teaching practices in the video. In other words, the practices used within each pair should be no more related than between any two videos by the same teacher. Moreover, there should be no systematic differences in the quality of instruction between the first pair and the second pair.
There were 780 unique teacher-rater matches. In Table 9, we report the correlation in scores by the same rater by the order in which they were scored. We highlight two findings:
First, recent exposure to a teacher has a residual effect on a rater’s scoring. When a rater forms an initial impression of a teacher during one observation, that impression partially carries over into the next observa-tion when it comes immediately afterward. This is reflected in the fact that the correlation in scores within the first pair of ratings (.73) and the second pair of ratings (.78) was higher than across any other two videos (which had correlations ranging from .64 to .69). Within each pair, if an observer rated a teacher highly in the first video, they were more likely to rate the teacher highly in the second video. And, similarly, if they rated a teacher poorly in the first video, they were more likely to rate the teacher poorly in the second.
DO ObsERvERs cARRy fORWARD IMPREssIOns fROM EARlIER vIDEOs?
Correlation for 1st through 4th Video Scored by Same Rater, Same Teacher
First Pair Second Pair
1 2 3 4
1
2 0.731
3 0.649 0.693
4 0.651 0.686 0.781
note: There were 780 unique teacher-rater matches in which a rater scored four videos per teacher. The order of vid-eos was randomized for each observer, so the order of videos is uncorrelated with the quality or nature of any video by construction. The first two observations were scheduled one right after another while the second two occurred later. If recent exposure matters, then the first two and the last two observations should be more correlated with each other (the shaded areas). If observers are building an impression over time, then the pair correlation should be higher for the second pair than the first pair, and the correlation with the third and fourth observation should be higher for the second observation (in column 2) than the first observation (in column 1).
Table 9
28 | The Reliability of classroom Observations
Second, a rater’s impressions of a teacher accumulate over time. Early impressions linger, even if recent expo-sure matters more. This is evident in the fact that the third and fourth observation scores are both more highly correlated with the second observation than the first observation (.69 versus .65). Moreover, the second pair of ratings was more highly correlated with each other than the first pair of ratings (.78 versus .73).
How do we know that these findings are driven by recent exposure and not the fact that a rater may simply “like a teacher’s style”? If the correlation were driven solely by a rater-by-teacher effect—that is, if a rater sim-ply reacts positively to a given teacher’s personality or social background or teaching style independent of the content of the particular video being watched—then the correlations would be the same between the first and the second, the second and the third, the third and the fourth, etc. That is not the pattern in Table 8.
The Reliability of classroom Observations | 29
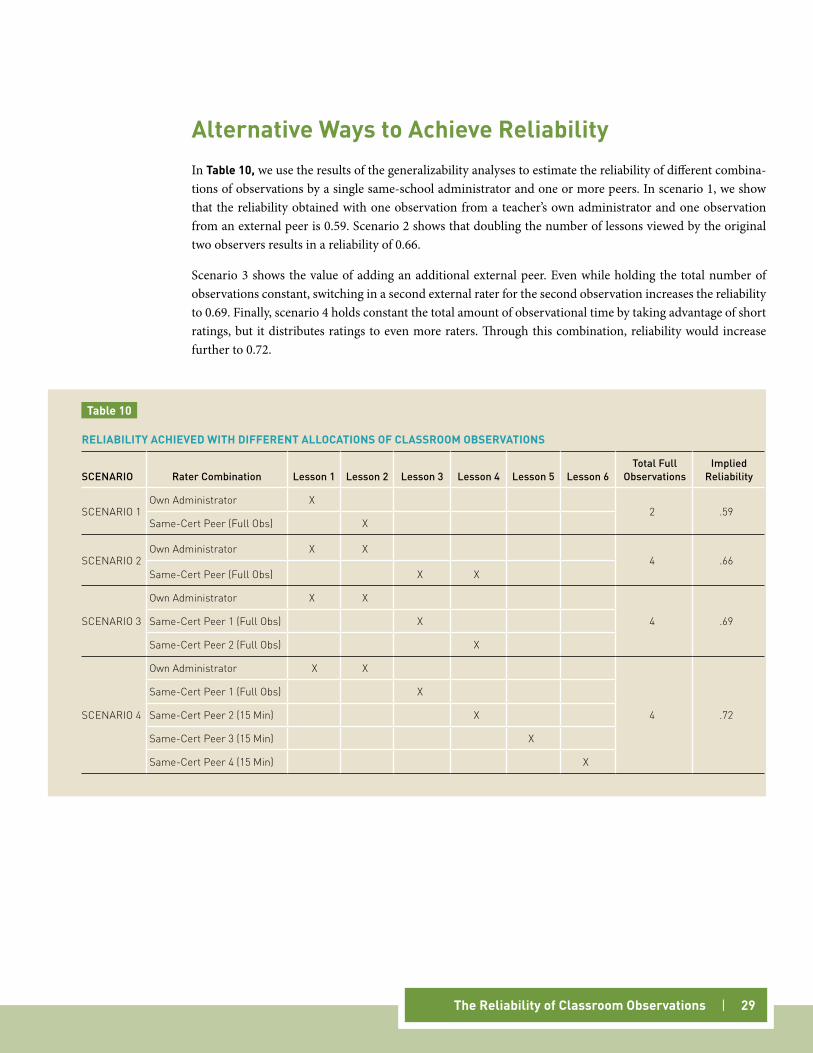
Alternative Ways to Achieve ReliabilityIn Table 10, we use the results of the generalizability analyses to estimate the reliability of different combina-tions of observations by a single same-school administrator and one or more peers. In scenario 1, we show that the reliability obtained with one observation from a teacher’s own administrator and one observation from an external peer is 0.59. Scenario 2 shows that doubling the number of lessons viewed by the original two observers results in a reliability of 0.66.
Scenario 3 shows the value of adding an additional external peer. Even while holding the total number of observations constant, switching in a second external rater for the second observation increases the reliability to 0.69. Finally, scenario 4 holds constant the total amount of observational time by taking advantage of short ratings, but it distributes ratings to even more raters. Through this combination, reliability would increase further to 0.72.
RElIAbIlITy AcHIEvED WITH DIffEREnT AllOcATIOns Of clAssROOM ObsERvATIOns
SCENARIO Rater Combination Lesson 1 Lesson 2 Lesson 3 Lesson 4 Lesson 5 Lesson 6Total Full
ObservationsImplied
Reliability
SCEnARIO 1Own Administrator X
2 .59Same-Cert Peer (Full Obs) X
SCEnARIO 2Own Administrator X X
4 .66Same-Cert Peer (Full Obs) X X
SCEnARIO 3
Own Administrator X X
4 .69Same-Cert Peer 1 (Full Obs) X
Same-Cert Peer 2 (Full Obs) X
SCEnARIO 4
Own Administrator X X
4 .72
Same-Cert Peer 1 (Full Obs) X
Same-Cert Peer 2 (15 Min) X
Same-Cert Peer 3 (15 Min) X
Same-Cert Peer 4 (15 Min) X
Table 10
30 | The Reliability of classroom Observations
conclusionSchool systems have an obligation to ensure that classroom observations provide accurate and reliable feed-back to teachers. In this paper, our goal has been to expose the measurement properties of classroom observa-tions, so that we can point to specific ways in which they can be improved.
Several findings highlight the importance of involving multiple observers. Many of the errors in teacher evalu-ations result from the divergent perceptions between raters. It is not simply that some raters consistently rate teachers too high or too low. A particular Rater A may score one teacher higher than Rater B; but Rater B scores the next teacher higher than Rater A. Increasing the number of observations per observer does not reduce this source of error. It would be helpful to provide better training and certification tests for prospec-tive raters, followed by regular efforts to ensure that observers remain calibrated to the standards. However, the best way to reduce this type of error is to ensure that multiple observers are involved in each teacher’s evaluation. In Table 10 we showed that one could increase reliability without increasing the number of total observations, simply by doing the same number of observations per teacher but doing them with more than one observer. For any given number of ratings, more raters per teacher yields higher reliability.
In addition, the only way a district can monitor the reliability of classroom observations and ensure a fair and reliable system for teachers would be to use multiple observers and set up a system to check and compare the feedback given to teachers by different observers. Moreover, to quantify the “home field advantage” given by administrators and peers inside their own schools, one must be able to compare results for observers inside and outside the school, at least for a sample of teachers.
Our findings also have implications for prior notification of teachers before each evaluation. Many school systems have preserved the “element of surprise” to ensure that observers are seeing representative examples of a teacher’s practice. But such policies heighten anxiety and reinforce the impression that teacher evaluation is primarily about teacher accountability and not the twin goal of improvement. The element of surprise may not be necessary. Aside from the shift in mean scores, the scores following prior notification seem to preserve the differences in practice that one would see without notification. In fact, our results suggest that those dif-ferences become easier to see.
Finally, it is clear from these findings and the MET project’s earlier study of classroom observation instru-ments that classroom observations are not discerning large absolute differences in practice. The vast majority of teachers are in the middle of the scale, with small differences in scores producing large changes in percen-tile rankings. We cannot say definitively why this is true. It could be that observers are simply uncomfortable making absolute distinctions between teachers. (We saw evidence that administrators were more willing to differentiate than peers.) It could be that the performance level standards need to make finer distinctions. Or it could simply be that underlying practice on the existing scales does not vary that much.
The Reliability of classroom Observations | 31
But given the evidence of large differences in student achievement gains by teacher (Kane and Staiger, 2012), the field needs scales that allow for clearer distinctions. One approach might be to develop better subject-based or content-based instruments—rather than general pedagogical instruments. As described in the last MET project report, Gathering Feedback for Teaching, Heather Hill of Harvard University and Pamela Grossman of Stanford University have been developing instruments for assessing math instruction and ELA, respectively. Moving beyond subject-specific instruments to identifying best practices for teaching particular topics, we hope there will soon be instruments for assessing instruction on specific standards in the Common Core State Standards. Researchers and school districts should continue to refine their observational instru-ments to provide even richer, more discerning feedback to teachers. With improved instruments, we hope to increase our ability to understand the differences in practice that are driving the large differences in student achievement gains we see.
32 | The Reliability of classroom Observations
ReferencesBrennan, R.L. (2001). Generalizability Theory. New York: Springer-Verlag.
Cronbach, L.J., Gleser, G.C., Nanda, H., & Rajaratnam, N. (1972). The Dependability of Behavioral Measurements: Theory of Generalizability for Scores and Profiles. New York: Wiley.
Danielson, C. (1996). Enhancing Professional Practice: A Framework for Teaching. Alexandria, VA: Association for Supervision and Curriculum Development.
Haertel, E.H. (2006). “Reliability.” In R. L. Brennan (Ed.), Educational Measurement (4th ed., pp. 65–110). Westport, CT: American Council on Education / Praeger Publishers.
Kane, T.J., & Staiger, D.O. (2012). Gathering Feedback for Teaching: Combining High-Quality Observations with Student Surveys and Achievement Gains. Bill & Melinda Gates Foundation.
Lord, F.M., & Novick, M.R. (1968). Statistical Theories of Mental Test Scores. Reading, MA: Addison-Wesley.
©2013 Bill & Melinda Gates Foundation. All Rights Reserved.
Bill & Melinda Gates Foundation is a registered trademark in
the United States and other countries.
Bill & melinda Gates Foundation
Guided by the belief that every life has equal
value, the Bill & Melinda Gates Foundation works
to help all people lead healthy, productive lives.
In developing countries, it focuses on improving
people’s health and giving them the chance
to lift themselves out of hunger and extreme
poverty. In the United States, it seeks to ensure
that all people—especially those with the fewest
resources—have access to the opportunities
they need to succeed in school and life. Based in
Seattle, Washington, the foundation is led by CEO
Jeff Raikes and Co-chair William H. Gates Sr.,
under the direction of Bill and Melinda Gates and
Warren Buffett.
For more information on the U.S. Program,
which works primarily to improve high school
and postsecondary education, please visit www.
gatesfoundation.org.
www.gatesfoundation.org