Embed Size (px)
Citation preview
Pursuant to Department Order No. DO2005-02-001 of the Department of Energydated 28 February 2005
The Report of theIndependent Committee Reviewing the Downstream Oil IndustryDeregulation Act of 1998
CONTENTS Chapter I Preamble 1 Introduction and Purpose 1 Composition of the IRC 2 Perspective of the IRC 2 Chapter II The Oil Industry 3 Oil Industry Background
Information Gathered on the Philippine Oil Industry 3 Downstream Industry Knowledge 4
Technical Background 5 Philippine Oil Demand 6 Philippine Crude Oil Supply – Practically Zero 7 Developments Leading to the Deregulation Law (RA No. 8479) 8 Rationale for the Oil Price Stabilization Fund 9 Transition to Full Deregulation 11 Features of the New Deregulation Law (RA No. 8479) 11 Policy of the State 11 Competition 12 Pricing 15 Other Matters 29 Chapter III Results of the Consultations 35 Oil Companies 35 Liquid Fuels Sector (Gasoline Station Business) 37 Liquefied Petroleum Gas (LPG) Sector 38 Transport Groups – Land Transport Sector 40 Transport Groups – Shipping Sector 41 Consumers/Consumer Groups 41 Government Agencies 43
Chapter IV Analysis and Conclusions 45 Analysis on Prices 45 Analysis on Competition 50 Analysis on Enforcement 50 Chapter V Recommendations 55
On Pricing 55 On Price Movements 56 On Subsidy 57 Competition 57 Enforcement 57
Tables 1.1 Crude Oil Production of the Philippines and Some ASEAN Countries 3 1.2 RP Production/Refinery Capacity Utilization vs. Demand (in MBCD) 8 1.3 2004 Total Assets, Total Equity, and Net Sales
of Petron and Shell 12 1.4 Historical Market Share of the Industry 13 1.5 Average Annual Forex, 1996-2005 21 1.6 Rise in Imported Cost of Selected Imported Oil Products, Average 1998 – Average Jan-May 2005 22 1.7 Comparative Price Increases , March 1998 and April 2005 23 1.8 Taxes in the Philippines and Other Asian Countries, in % or Local
Currency per Liter 26 1.9 Taxes in the Philippines and Other Asian Countries, in % or
Philippine Peso per Liter 27 1.10 91-Day T-Bill Rates 27 1.11 Current Specifications in the Region 32 Figures 1 Downstream Oil Sector 4 2 Energy Mix and Power Mix 6 3 Cut of the Barrel FY 2004 Demand Mix 7 4 New Players’ Gasoline Stations 14 5 LPG Market Share – Full Year 2004 14 6 What Do We Pay for in a Liter of Gasoline? 16 7 What Do We Pay for in a Liter of Diesel? 16 8 What Do We Pay for in a Liter of Kerosene? 16 9 What Do We Pay for in a Liter of LPG? 16 10 Dubai Yields vs. Philippine Oil Demand 18 11 Dubai Crude Prices/Forex, March 1984 – May 2005 22 12 Dubai vs. Local Prices, Jan. 1998 - Feb. 2005 23 13 Comparative Prices of Unleaded Gasoline and Diesel,
May 27, 2005 26 14 Rate of Return of Pilipinas Shell 28 15 Return on Equity – Net of Exports of Petron 28 16 Return on Equity of Petron 29 17 Fuel Quality and Standards, CAA Requirements – Fuel Specs 31
1
CHAPTER I PREAMBLE
INTRODUCTION AND PURPOSE (1) The series of oil price hikes has led to public clamor for the review of the Oil Deregulation Law. Upon the directive of President Gloria Macapagal Arroyo, the Department of Energy created an Independent Review Committee (IRC) consisting of professionals from the private sector who are respected in their fields, to review and assess whether the Oil Deregulation Law has been effective and whether it has attained its goals under the prevailing economic circumstances and conditions in the country. (2) There is no question that oil prices have increased rapidly. Gasoline and diesel are now priced in the neighborhood of P29.13/liter and P26.02/liter while they were P11.76/liter and P8.25/liter when the deregulation law went into effect. (3) The purpose of this study is to determine if the main cause of these major price increases was the deregulation of the downstream oil industry; if there are measures or alternatives available to bring about lower prices; and, if it would be better for the country to revert to regulation. This study would like to answer the following specific perceptions and questions:
1. What is the main cause of the present high level cost of gasoline and other oil products? Is it the Oil Deregulation Law?
2. Would the prices be any cheaper if we were under a regulated regime? 3. Did the Oil Deregulation Law actually encourage competition? Did
competition bring about lower prices? 4. Could prices be reduced by asking companies to reduce their profits? Or by
providing subsidy or a program like the Oil Price Stabilization Fund (OPSF)? 5. Why were increases in oil prices very frequent? Why didn’t prices decrease
right away when there was a decrease in international crude prices? 6. Are there disorders in the deregulated regime that need to be addressed? 7. Why do oil companies seem to raise prices at the same time? Do cartels
exist?
(4) Before conclusions and recommendations can be properly made, the IRC needs to:
1. Learn about the oil industry by gathering data about the downstream oil industry from various sources (Chapter II).
2. Listen to what oil industry players and consumers have to say through consultations and interviews (Chapter III).
3. Present the IRC’s analysis and conclusions based on the two previous chapters (Chapter IV).
4. On the basis of their analysis, prepare their recommendations (Chapter V).
2
COMPOSITION OF THE IRC (5) The Committee is composed of six members.
• Mr. Carlos R. Alindada, a retired Chairman of SGV & Co. and a retired Commissioner of the Energy Regulatory Commission. He served as chair of the committee.
• Mr. Cedric R. Bagtas, Deputy-General Secretary of the Trade Union Congress of the Philippines (TUCP) and former head of the Research Center of TUCP;
• Ms. Merceditas A. Garcia, President of the Federation of Petroleum Dealers of the Philippines;
• Mr. Jose P. Leviste, Jr., Chairman of the Philippine Business Leaders Forum, Inc. (An associate of Corporate Network, a service of Economist Intelligence Unit) and the original Executive Director of the Petroleum Board;
• Mr. Alberto H. Suansing, Secretary General of the Confederation of Land Transport Organizations of the Philippines and who is undertaking several advisory functions for the Secretary of the Department of Transportation and Communications; and,
• Dr. Peter Lee U, Dean of the School of Economics of the University of Asia and the Pacific and who has prepared several papers and studies on Oil Deregulation.
PERSPECTIVE OF THE IRC (6) Although the members of the Committee come from different backgrounds, they are of one mind in seeking solutions that will be good for the Philippines and Filipinos, regardless of whether the resulting recommendations are entirely consistent with the interests of the sector they represent.
3
CHAPTER II THE OIL INDUSTRY
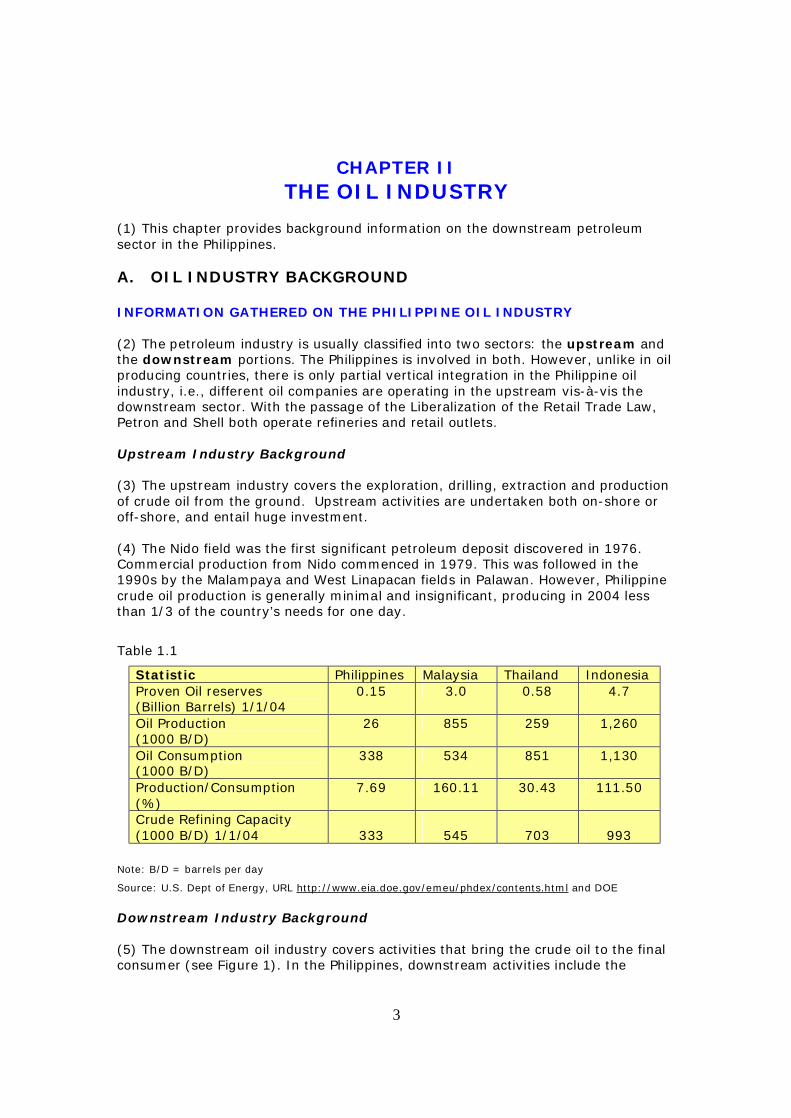
(1) This chapter provides background information on the downstream petroleum sector in the Philippines. A. OIL INDUSTRY BACKGROUND INFORMATION GATHERED ON THE PHILIPPINE OIL INDUSTRY (2) The petroleum industry is usually classified into two sectors: the upstream and the downstream portions. The Philippines is involved in both. However, unlike in oil producing countries, there is only partial vertical integration in the Philippine oil industry, i.e., different oil companies are operating in the upstream vis-à-vis the downstream sector. With the passage of the Liberalization of the Retail Trade Law, Petron and Shell both operate refineries and retail outlets. Upstream Industry Background (3) The upstream industry covers the exploration, drilling, extraction and production of crude oil from the ground. Upstream activities are undertaken both on-shore or off-shore, and entail huge investment. (4) The Nido field was the first significant petroleum deposit discovered in 1976. Commercial production from Nido commenced in 1979. This was followed in the 1990s by the Malampaya and West Linapacan fields in Palawan. However, Philippine crude oil production is generally minimal and insignificant, producing in 2004 less than 1/3 of the country’s needs for one day.
Table 1.1
Statistic Philippines Malaysia Thailand Indonesia Proven Oil reserves (Billion Barrels) 1/1/04
0.15 3.0 0.58 4.7
Oil Production (1000 B/D)
26 855 259 1,260
Oil Consumption (1000 B/D)
338 534 851 1,130
Production/Consumption (%)
7.69 160.11 30.43 111.50
Crude Refining Capacity (1000 B/D) 1/1/04
333
545
703
993
Note: B/D = barrels per day
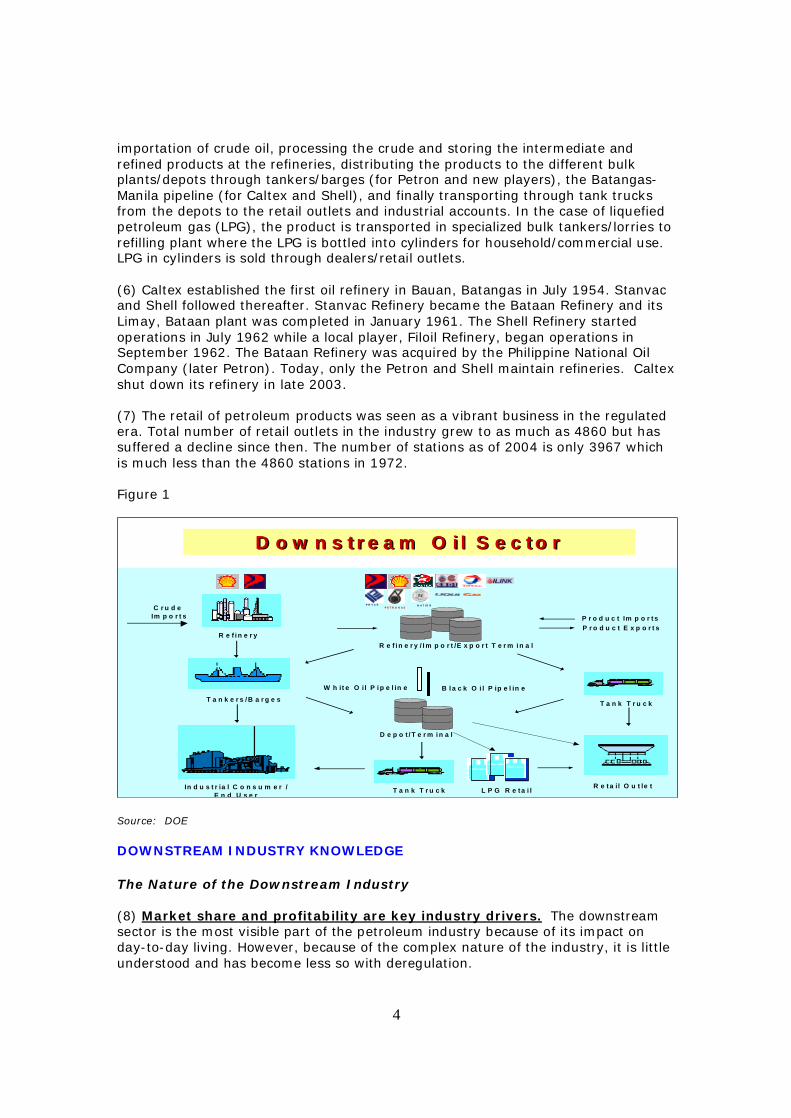
Source: U.S. Dept of Energy, URL http://www.eia.doe.gov/emeu/phdex/contents.html and DOE Downstream Industry Background (5) The downstream oil industry covers activities that bring the crude oil to the final consumer (see Figure 1). In the Philippines, downstream activities include the
4
importation of crude oil, processing the crude and storing the intermediate and refined products at the refineries, distributing the products to the different bulk plants/depots through tankers/barges (for Petron and new players), the Batangas-Manila pipeline (for Caltex and Shell), and finally transporting through tank trucks from the depots to the retail outlets and industrial accounts. In the case of liquefied petroleum gas (LPG), the product is transported in specialized bulk tankers/lorries to refilling plant where the LPG is bottled into cylinders for household/commercial use. LPG in cylinders is sold through dealers/retail outlets. (6) Caltex established the first oil refinery in Bauan, Batangas in July 1954. Stanvac and Shell followed thereafter. Stanvac Refinery became the Bataan Refinery and its Limay, Bataan plant was completed in January 1961. The Shell Refinery started operations in July 1962 while a local player, Filoil Refinery, began operations in September 1962. The Bataan Refinery was acquired by the Philippine National Oil Company (later Petron). Today, only the Petron and Shell maintain refineries. Caltex shut down its refinery in late 2003. (7) The retail of petroleum products was seen as a vibrant business in the regulated era. Total number of retail outlets in the industry grew to as much as 4860 but has suffered a decline since then. The number of stations as of 2004 is only 3967 which is much less than the 4860 stations in 1972.
Figure 1
In d u s t r ia l C o n s u m e r /E n d U s e r
T a n k T r u c k
T a n k T r u c kT a n k e r s / B a r g e s
R e t a i l O u t le t
R e f i n e r y
D e p o t / T e r m i n a l
W h it e O il P i p e l in e B l a c k O i l P ip e l in e
P r o d u c t Im p o r t sP r o d u c t E x p o r t s
R e f i n e r y / I m p o r t /E x p o r t T e r m i n a l
C r u d eIm p o r t s
P R Y C EP R Y C E N A T IO NN A T IO NP E T R O N A SP E T R O N A S
L P G R e t a i l
D o w n s t r e a m O i l S e c t o rD o w n s t r e a m O i l S e c t o r
Source: DOE DOWNSTREAM INDUSTRY KNOWLEDGE The Nature of the Downstream Industry (8) Market share and profitability are key industry drivers. The downstream sector is the most visible part of the petroleum industry because of its impact on day-to-day living. However, because of the complex nature of the industry, it is little understood and has become less so with deregulation.
5
(9) Industry players are driven by both market share and profitability. Large oil players are known to gear operations and pricing in a manner that would allow them to increase market share. Other players give premium to operating only in markets that would give them reasonable returns. (10) Oil players use various schemes to capture market share: competitive pricing sometimes forgoing profits; investments in strategically located retail stations, brand equity, facilities and services such as convenience stores and quick-service restaurants, product quality, and in customer-loyalty programs like company fleet cards and company credit cards. (11) Interchangeability of products. Given minimum quality and performance standards, a product such as gasoline from one oil company can be used in combination or alternately with that from another oil company without any expected adverse effects on the same engine. Any product differentiations by the oil companies can be seen in other performance-adding properties that are added to the minimum specification. For example, some gasoline brands have 97RON rating or two octane numbers higher than the minimum of 95RON as prescribed in the Philippine National Standards (PNS). Others have additional cleaning properties intended to improve combustion resulting in cleaner emissions. Such value-adding properties establish product differentiation among oil companies as well as price differentiation within the same fuel grade. (12) Tendency to have uniform prices. It should be noted that the oil companies engage in diverse activities, i.e., from refining (for Petron and Shell), storage to marketing to distribution. Accordingly, by the very nature of their operations, they may not necessarily have similar cost conditions and structures. The DOE’s observations on price behavior in the market show that the companies simply match the prices of the price leader, since differences in prices, small as they may be, can have significant impact on their sales volume and market share. If a competitor reduces prices the other oil companies consider following suit to maintain share of the market. This competitive pressure compels them to match the price of their competitor, thereby resulting in a uniform price. However, this apparent uniformity in prices is not evident in the entire national market, but only in specific geographical pockets. Moreover, price levels are lowest in areas where there are more players. TECHNICAL BACKGROUND
The nature of oil products – Meet national standards and usually interchangeable (13) Petroleum products have standard specifications. Most countries have national standards that generally follow international standards. Product specifications cover chemical and physical properties that affect fuel performance in the engine, handling characteristics, or the level of emission expected. There is a global thrust towards harmonizing product quality to reduce cost of production and storage, as well as allow the use of better and efficient technologies leading to cleaner air. (14) PNS ensures that each product type aligns with international standards. The PNS for gasoline and diesel, for example, now conforms to the fuel that meets the Euro 2 standards for emissions. Thus, if a product meets the product
6
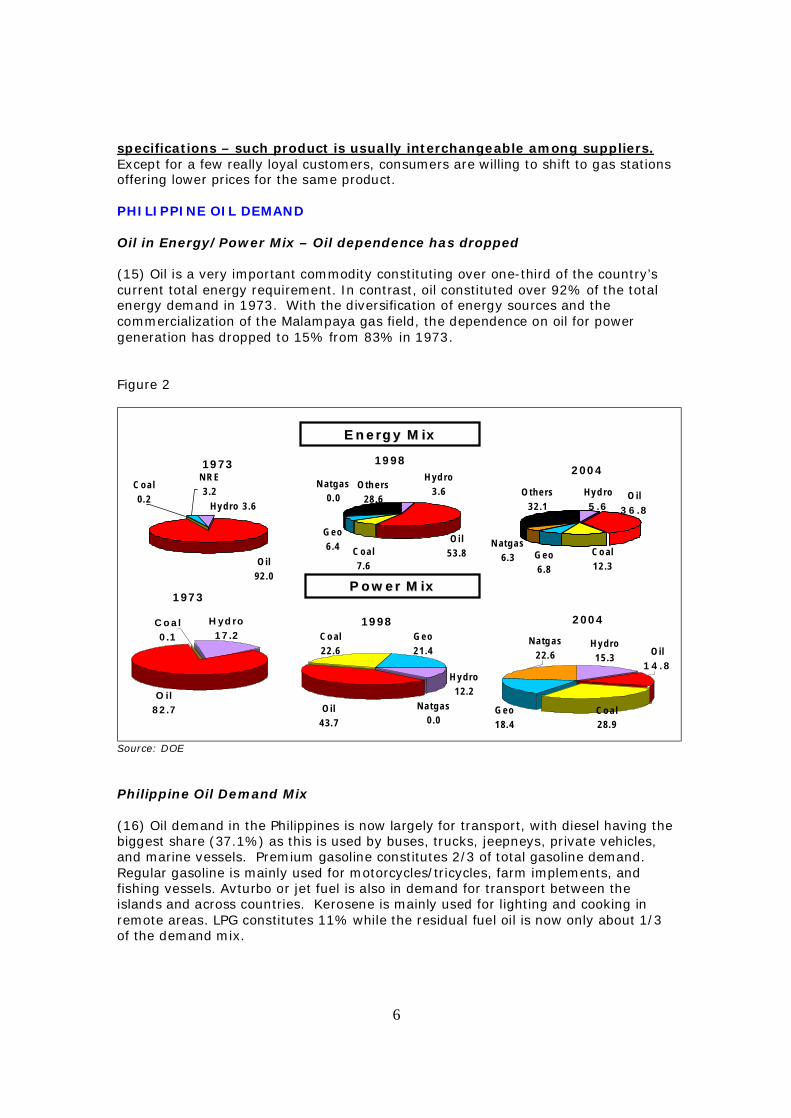
specifications – such product is usually interchangeable among suppliers. Except for a few really loyal customers, consumers are willing to shift to gas stations offering lower prices for the same product. PHILIPPINE OIL DEMAND Oil in Energy/Power Mix – Oil dependence has dropped (15) Oil is a very important commodity constituting over one-third of the country’s current total energy requirement. In contrast, oil constituted over 92% of the total energy demand in 1973. With the diversification of energy sources and the commercialization of the Malampaya gas field, the dependence on oil for power generation has dropped to 15% from 83% in 1973. Figure 2
E n e rg y M ixE n e rg y M ix
O the rs3 2 .1
O il3 6 .8
C o al1 2 .3
N atga s6.3 G e o
6 .8
H y d ro5 .6
2 00 4O th e rs
28 .6
O i l5 3 .8C oa l
7.6
N atga s0.0
G e o6 .4
H yd ro3 .6
19 9819 73
H y dro 3 .6
N R E3 .2C oa l
0.2
O il 92 .0
P o w e r M ixP o w e r M ix
O il1 4 .8
C o a l2 8.9
N a tg a s2 2.6
G e o1 8.4
H y dro1 5 .3
2 00 4H yd ro1 7 .2
C o a l0 .1
O il8 2 .7
1 97 3
O il4 3.7
C o al2 2 .6
N a tga s0 .0
G e o2 1 .4
H y dro1 2.2
19 98
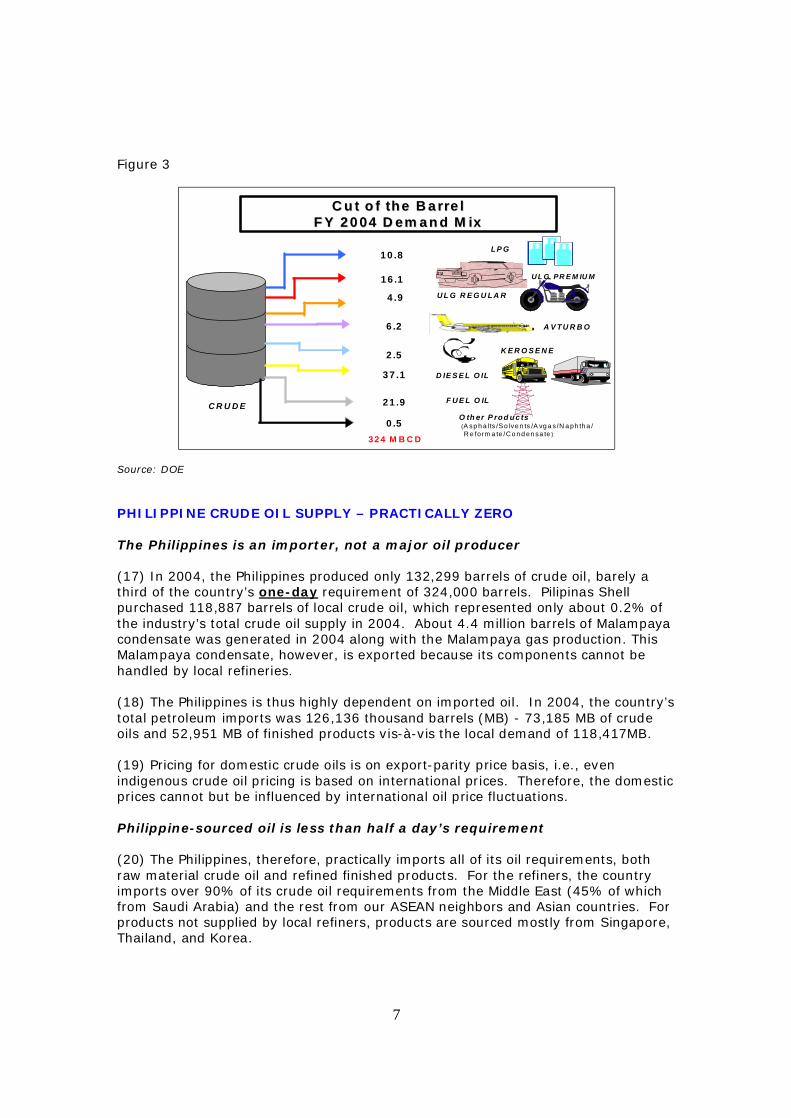
Source: DOE Philippine Oil Demand Mix (16) Oil demand in the Philippines is now largely for transport, with diesel having the biggest share (37.1%) as this is used by buses, trucks, jeepneys, private vehicles, and marine vessels. Premium gasoline constitutes 2/3 of total gasoline demand. Regular gasoline is mainly used for motorcycles/tricycles, farm implements, and fishing vessels. Avturbo or jet fuel is also in demand for transport between the islands and across countries. Kerosene is mainly used for lighting and cooking in remote areas. LPG constitutes 11% while the residual fuel oil is now only about 1/3 of the demand mix.
7
Figure 3
C R U D E
A V T U R B O6 .2
U L G PR E M IU M1 6 .1
K E R O S E N E 2 .5
D IE S E L O IL3 7 .1
F U E L O IL2 1 .9
U L G R E G U L A R4 .9
O th er P ro d u c ts(A sp h a lts /S o lve n ts /A vg a s/N a ph th a /R e form a te /Co n d en sa te )
0 .5
L P G1 0 .8
3 2 4 M B C D
C ut o f the B a rre l C u t o f the B a rre l F Y 20 04 D em a nd M ixF Y 2 0 04 D em a n d M ix
Source: DOE PHILIPPINE CRUDE OIL SUPPLY – PRACTICALLY ZERO The Philippines is an importer, not a major oil producer (17) In 2004, the Philippines produced only 132,299 barrels of crude oil, barely a third of the country’s one-day requirement of 324,000 barrels. Pilipinas Shell purchased 118,887 barrels of local crude oil, which represented only about 0.2% of the industry’s total crude oil supply in 2004. About 4.4 million barrels of Malampaya condensate was generated in 2004 along with the Malampaya gas production. This Malampaya condensate, however, is exported because its components cannot be handled by local refineries. (18) The Philippines is thus highly dependent on imported oil. In 2004, the country’s total petroleum imports was 126,136 thousand barrels (MB) - 73,185 MB of crude oils and 52,951 MB of finished products vis-à-vis the local demand of 118,417MB. (19) Pricing for domestic crude oils is on export-parity price basis, i.e., even indigenous crude oil pricing is based on international prices. Therefore, the domestic prices cannot but be influenced by international oil price fluctuations. Philippine-sourced oil is less than half a day’s requirement (20) The Philippines, therefore, practically imports all of its oil requirements, both raw material crude oil and refined finished products. For the refiners, the country imports over 90% of its crude oil requirements from the Middle East (45% of which from Saudi Arabia) and the rest from our ASEAN neighbors and Asian countries. For products not supplied by local refiners, products are sourced mostly from Singapore, Thailand, and Korea.
8
(21) When refined, crude oil produces different products, the ratio of which depends on the type of crude and refinery facilities. The refiners therefore have to determine which crude oil to import depending on their product demand mix, the quality of the crude vis-à-vis the configuration of their refineries and price. (22) Over the years, the Philippines’ demand for petroleum products has been mainly sourced from the local refineries of Petron in Bataan, and Caltex and Shell in Batangas. On the other hand, the country has been a net importer of LPG, bunker fuel, and diesel. (23) However, the country’s dependence on direct imports of refined products has been increasing as fuel quality specifications became more stringent and with the conversion of the Caltex refinery to a storage facility in late 2003.
A single company cannot serve the entire Philippine market
(24) Each of the two companies with refineries holds about a third of the market share. These local refineries have a combined capability to produce only about half of the countries’ requirement. As such, even the refiners have to directly import finished products. Moreover, the refiners do not have sufficient facilities for storage and distribution of these products beyond their existing market share.
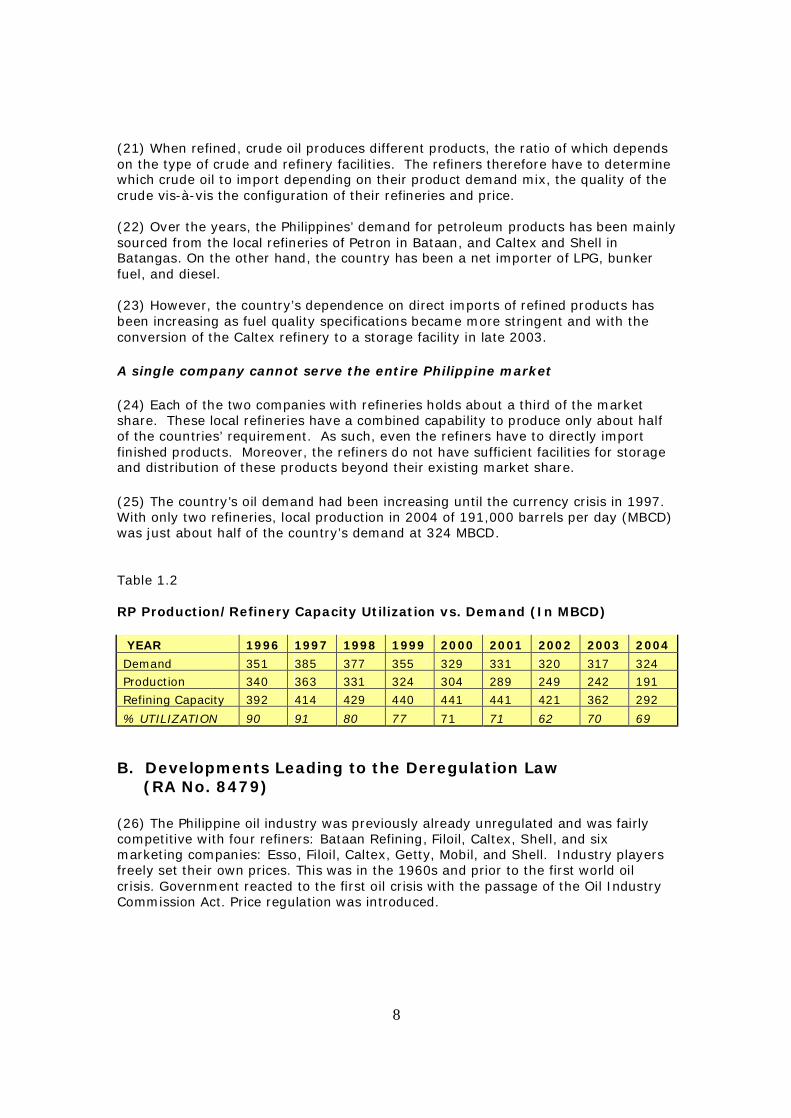
(25) The country’s oil demand had been increasing until the currency crisis in 1997. With only two refineries, local production in 2004 of 191,000 barrels per day (MBCD) was just about half of the country’s demand at 324 MBCD. Table 1.2 RP Production/Refinery Capacity Utilization vs. Demand (In MBCD) YEAR 1996 1997 1998 1999 2000 2001 2002 2003 2004
Demand 351 385 377 355 329 331 320 317 324
Production 340 363 331 324 304 289 249 242 191
Refining Capacity 392 414 429 440 441 441 421 362 292
% UTILIZATION 90 91 80 77 71 71 62 70 69 B. Developments Leading to the Deregulation Law (RA No. 8479) (26) The Philippine oil industry was previously already unregulated and was fairly competitive with four refiners: Bataan Refining, Filoil, Caltex, Shell, and six marketing companies: Esso, Filoil, Caltex, Getty, Mobil, and Shell. Industry players freely set their own prices. This was in the 1960s and prior to the first world oil crisis. Government reacted to the first oil crisis with the passage of the Oil Industry Commission Act. Price regulation was introduced.
9
(27) In 1984, the Oil Price Stabilization Fund (OPSF) was created as a buffer fund to stabilize the price of oil. When world oil prices were lower than the corresponding fixed pump prices, the oil companies contributed to the fund. In the opposite event, the firms drew from the fund. (28) Later, the Energy Regulatory Board (ERB) was formed and was tasked with setting prices of petroleum products. Characteristics of a Regulated Industry (29) Under regulation, prices were fixed by the state and players were assured of full recovery of cost plus an acceptable rate of return. (30) Prices were set at a uniform rate for the same area. Overpricing and under pricing were not allowed. Any adjustment in the wholesale and retail prices of petroleum products were made only after due notice (published) and hearings. (31) Domestic price adjustments thus occurred only occasionally (once or twice a year) with OPSF absorbing world oil price and peso fluctuations. There were few players who stayed in the business even at times when they have to contribute to the fund in order to protect their investments.
How Domestic Oil Prices Were Set (32) The ERB was created as the governing body empowered to regulate prices pursuant to existing laws. (33) The oil companies were required to submit under oath information used by the ERB to set prices. These included actual crude oil importations/costs and sales on a monthly basis. (34) Every two months, the ERB calculated the adjustment in the prices of petroleum products based on the actual cost of crude purchases of the oil companies for the preceding two months. The average adjustment due to crude cost was translated into adjustments per product type by aligning with the Singapore import parity of each product type. However, with the OPSF in place, any increase in price was charged to (withdrawn from) the fund while any decrease was credited to (contributed to) the OPSF. The OPSF was also used to cross-subsidize between and among products – gasoline and jet fuel were made to subsidize diesel, kerosene, bunker fuel and LPG. Thus, the details of increases or decreases resulting from the bimonthly reviews were generally not known to the consumers. RATIONALE FOR THE OIL PRICE STABILIZATION FUND (OPSF) (35) Volatile world crude prices and foreign exchange fluctuations motivated the government to establish a buffer fund that would absorb cost increases on oil imports to minimize frequent changes in the domestic petroleum products’ prices. This fund otherwise known as the OPSF was created by virtue of Presidential Decree No. 1956 dated October 1984, as amended.
10
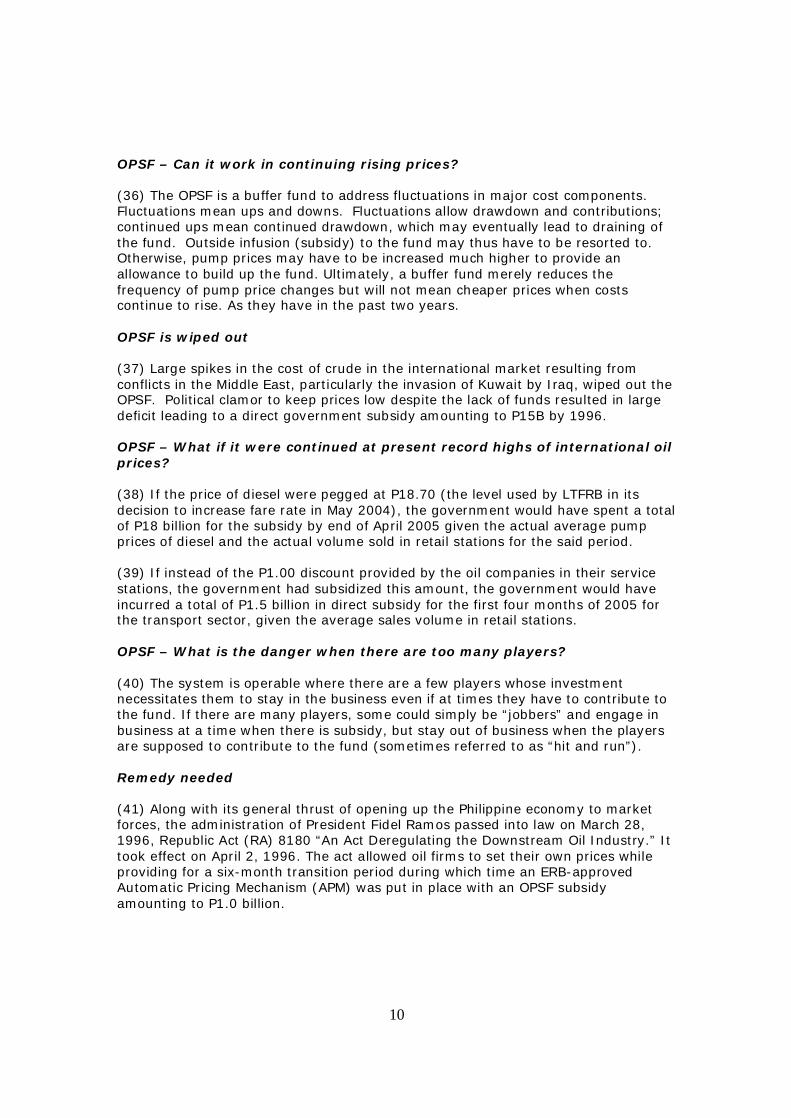
OPSF – Can it work in continuing rising prices?
(36) The OPSF is a buffer fund to address fluctuations in major cost components. Fluctuations mean ups and downs. Fluctuations allow drawdown and contributions; continued ups mean continued drawdown, which may eventually lead to draining of the fund. Outside infusion (subsidy) to the fund may thus have to be resorted to. Otherwise, pump prices may have to be increased much higher to provide an allowance to build up the fund. Ultimately, a buffer fund merely reduces the frequency of pump price changes but will not mean cheaper prices when costs continue to rise. As they have in the past two years. OPSF is wiped out (37) Large spikes in the cost of crude in the international market resulting from conflicts in the Middle East, particularly the invasion of Kuwait by Iraq, wiped out the OPSF. Political clamor to keep prices low despite the lack of funds resulted in large deficit leading to a direct government subsidy amounting to P15B by 1996. OPSF – What if it were continued at present record highs of international oil prices? (38) If the price of diesel were pegged at P18.70 (the level used by LTFRB in its decision to increase fare rate in May 2004), the government would have spent a total of P18 billion for the subsidy by end of April 2005 given the actual average pump prices of diesel and the actual volume sold in retail stations for the said period. (39) If instead of the P1.00 discount provided by the oil companies in their service stations, the government had subsidized this amount, the government would have incurred a total of P1.5 billion in direct subsidy for the first four months of 2005 for the transport sector, given the average sales volume in retail stations. OPSF – What is the danger when there are too many players? (40) The system is operable where there are a few players whose investment necessitates them to stay in the business even if at times they have to contribute to the fund. If there are many players, some could simply be “jobbers” and engage in business at a time when there is subsidy, but stay out of business when the players are supposed to contribute to the fund (sometimes referred to as “hit and run”). Remedy needed (41) Along with its general thrust of opening up the Philippine economy to market forces, the administration of President Fidel Ramos passed into law on March 28, 1996, Republic Act (RA) 8180 “An Act Deregulating the Downstream Oil Industry.” It took effect on April 2, 1996. The act allowed oil firms to set their own prices while providing for a six-month transition period during which time an ERB-approved Automatic Pricing Mechanism (APM) was put in place with an OPSF subsidy amounting to P1.0 billion.
11
(42) By 1997, the Asian crisis swept the region by surprise causing the peso to depreciate from P28/$1 to P40/$1. The oil companies naturally increased pump prices since the Philippines imports practically all its crude oil requirements. (43) However, as the peso depreciated and oil companies adjusted prices, the public reacted strongly to the situation. This attracted the attention of a few lawmakers who proceeded to file a suit with the Supreme Court. Subsequently the Supreme Court decided in favor of the petitioners and it nullified RA No. 8180 on November 5, 1997, due to three provisions deemed barriers to entry and therefore unconstitutional, namely: tariff differential between the raw material crude oil and the refined finished products, minimum inventory requirement, and predatory pricing definition. (44) Congress sought quickly to “repair” RA No. 8180 with a substitute law enacted in 1998. The result was RA No. 8479, otherwise known as the Downstream Oil Industry Deregulation Act of 1998. TRANSITION TO FULL DEREGULATION RA No. 8180 (45) During the transition phase of RA No. 8180 from August 1996 to January 1997, the ERB implemented an Automatic Pricing Mechanism (APM) which adjusted the wholesale posted prices of petroleum products monthly using Singapore Posted Prices (SPP) as price basis. RA No. 8479 (46) However, for the transition price of RA No. 8479, the ERB-approved APM used as reference Dubai crude oil, which is the crude oil benchmark in Asia and the nearest type of crude which yields similar percentage of products compared to our local demand. C. Features of the New Deregulation Law (RA No. 8479) (47) RA No. 8479 deregulating the downstream industry was signed into law on February 10, 1998 and its implementing rules and regulations on March 14, 1998. Transition pricing was still set, but only for the three most socially sensitive products – LPG, kerosene, regular gasoline – until July 13, 1998 when full deregulation of all products took effect. 1. POLICY OF THE STATE (48) Section 2 of the Law declared the policy of the State “to liberalize and deregulate the downstream oil industry in order to ensure a truly competitive market under a regime of fair prices, adequate and continuous supply of environmentally clean and high-quality petroleum products. To this end, the State shall promote and encourage the entry of new participants in the downstream oil industry, and introduce adequate measures to ensure the attainment of these goals.”
12
KEY FEATURES OF RA 8479 (49) Deregulating the downstream oil industry essentially meant:
1. Removing barriers to entry to encourage more investors to enter the industry. With deregulation, the country should expect greater competition as industry players will no longer be confined to Petron, Shell, and Caltex. To stress this, a uniform duty of 3% for crude and finished products was provided.
2. Removing government’s control over the pricing of fuel and instead allowing
market forces to dictate prices. This removes costly government subsidies and was meant to free oil pricing from political pressures.
3. No longer issuing a cost plus formula as basis for pricing, as practiced during
the regulated era and which assured players of margins, but instead making competition the basis for price setting.
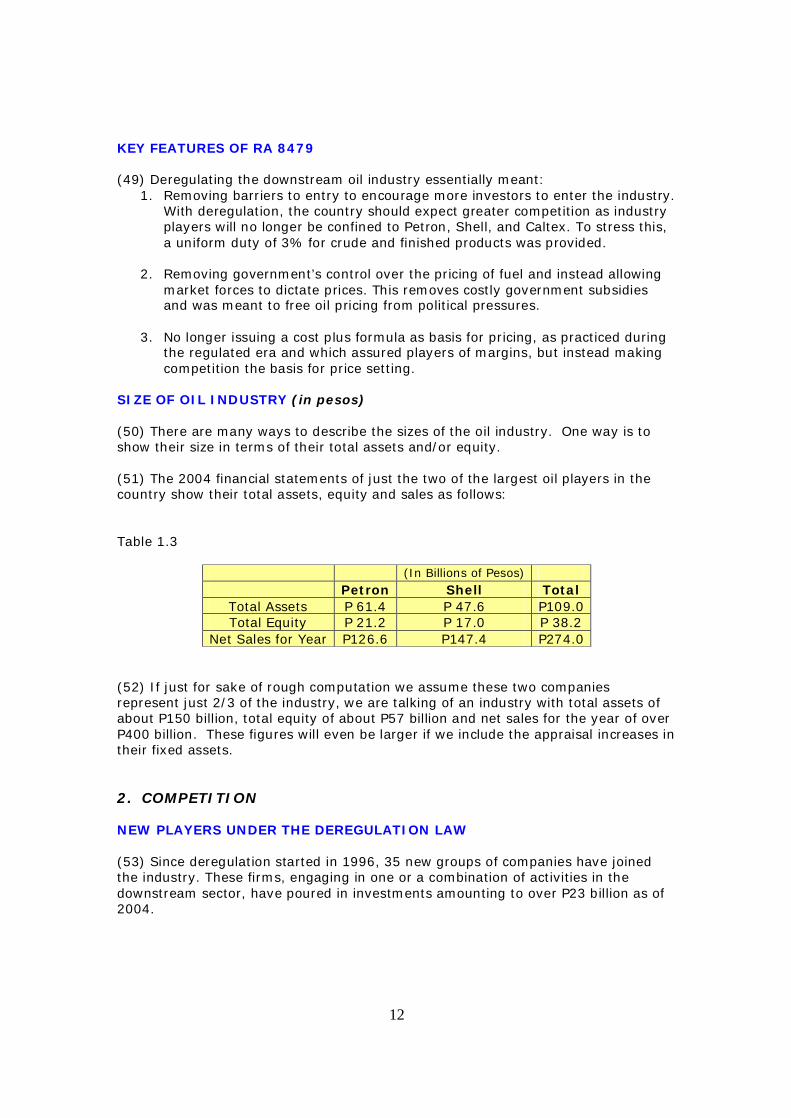
SIZE OF OIL INDUSTRY (in pesos) (50) There are many ways to describe the sizes of the oil industry. One way is to show their size in terms of their total assets and/or equity. (51) The 2004 financial statements of just the two of the largest oil players in the country show their total assets, equity and sales as follows: Table 1.3
(In Billions of Pesos) Petron Shell Total
Total Assets P 61.4 P 47.6 P109.0 Total Equity P 21.2 P 17.0 P 38.2
Net Sales for Year P126.6 P147.4 P274.0 (52) If just for sake of rough computation we assume these two companies represent just 2/3 of the industry, we are talking of an industry with total assets of about P150 billion, total equity of about P57 billion and net sales for the year of over P400 billion. These figures will even be larger if we include the appraisal increases in their fixed assets. 2. COMPETITION NEW PLAYERS UNDER THE DEREGULATION LAW (53) Since deregulation started in 1996, 35 new groups of companies have joined the industry. These firms, engaging in one or a combination of activities in the downstream sector, have poured in investments amounting to over P23 billion as of 2004.
13
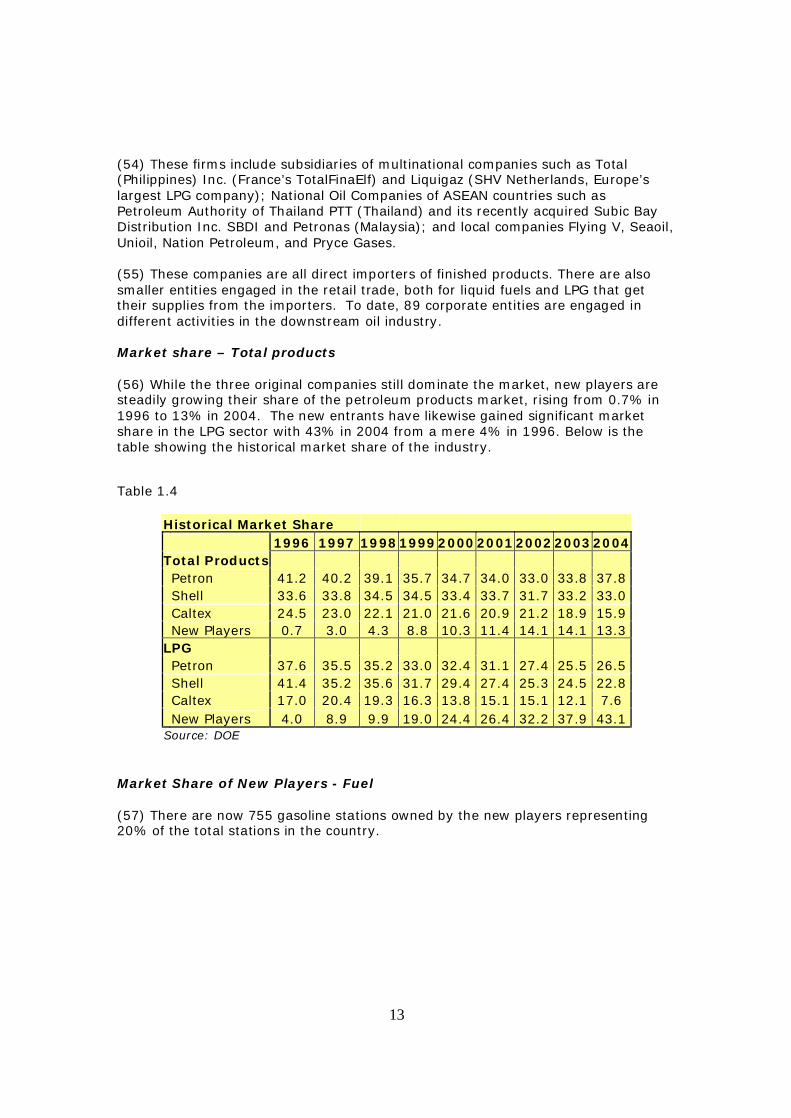
(54) These firms include subsidiaries of multinational companies such as Total (Philippines) Inc. (France’s TotalFinaElf) and Liquigaz (SHV Netherlands, Europe’s largest LPG company); National Oil Companies of ASEAN countries such as Petroleum Authority of Thailand PTT (Thailand) and its recently acquired Subic Bay Distribution Inc. SBDI and Petronas (Malaysia); and local companies Flying V, Seaoil, Unioil, Nation Petroleum, and Pryce Gases. (55) These companies are all direct importers of finished products. There are also smaller entities engaged in the retail trade, both for liquid fuels and LPG that get their supplies from the importers. To date, 89 corporate entities are engaged in different activities in the downstream oil industry. Market share – Total products (56) While the three original companies still dominate the market, new players are steadily growing their share of the petroleum products market, rising from 0.7% in 1996 to 13% in 2004. The new entrants have likewise gained significant market share in the LPG sector with 43% in 2004 from a mere 4% in 1996. Below is the table showing the historical market share of the industry.
Table 1.4
Historical Market Share 1996 1997 1998 1999 2000 2001 2002 2003 2004 Total Products Petron 41.2 40.2 39.1 35.7 34.7 34.0 33.0 33.8 37.8 Shell 33.6 33.8 34.5 34.5 33.4 33.7 31.7 33.2 33.0 Caltex 24.5 23.0 22.1 21.0 21.6 20.9 21.2 18.9 15.9 New Players 0.7 3.0 4.3 8.8 10.3 11.4 14.1 14.1 13.3 LPG Petron 37.6 35.5 35.2 33.0 32.4 31.1 27.4 25.5 26.5 Shell 41.4 35.2 35.6 31.7 29.4 27.4 25.3 24.5 22.8 Caltex 17.0 20.4 19.3 16.3 13.8 15.1 15.1 12.1 7.6 New Players 4.0 8.9 9.9 19.0 24.4 26.4 32.2 37.9 43.1 Source: DOE
Market Share of New Players - Fuel (57) There are now 755 gasoline stations owned by the new players representing 20% of the total stations in the country.
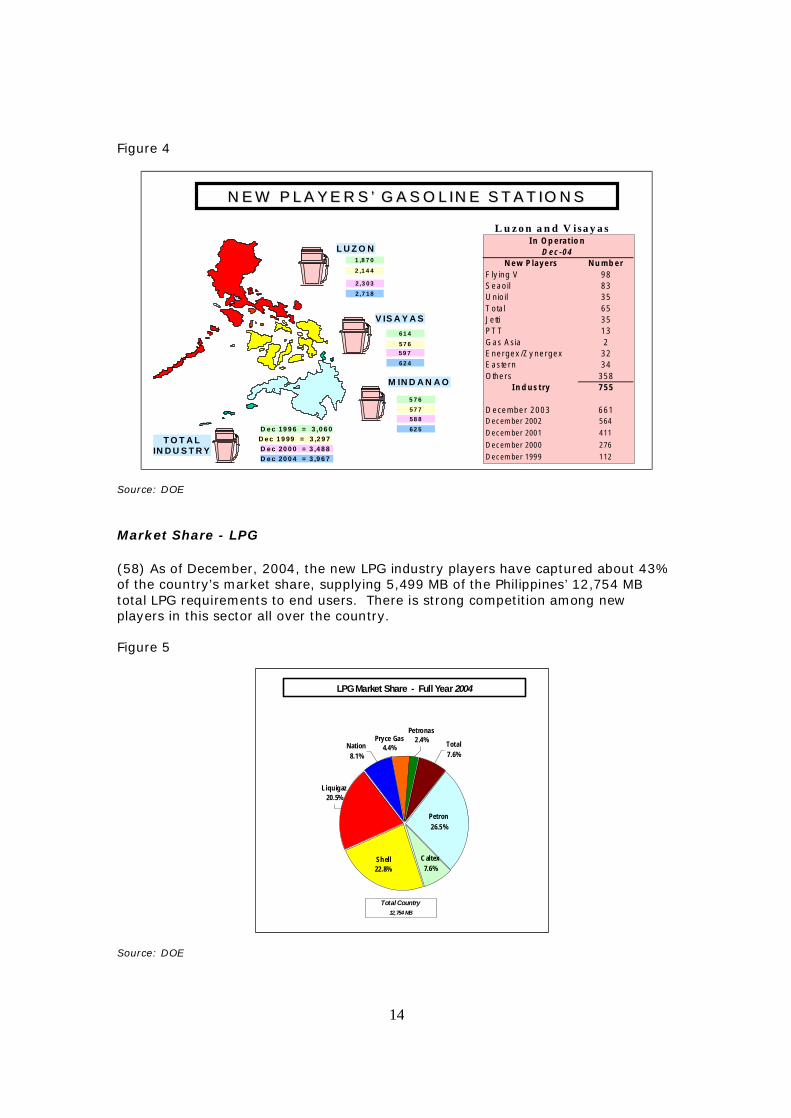
14
Figure 4
V IS A Y A S
M IN D A N A O
L U Z O N1 ,8 7 0
V IS A Y A S
M IN D A N A O
D e c 19 9 6 = 3 ,0 6 0
D e c 20 0 0 = 3 ,4 8 8
L u z o n a n d V isa y a s
N e w P la y e rs N u m b e rF ly in g V 9 8S e a o il 8 3U n io il 3 5T o ta l 6 5Je tti 3 5P T T 1 3G a s A sia 2E n e r g e x /Z y n e r g e x 3 2E a s te r n 3 4O th e r s 3 5 8
I n d u s t ry 7 5 5
D e ce m b e r 2 0 0 3 6 6 1D ecem ber 2002 564D ecem ber 2001 411D ecem ber 2000 276D ecem ber 1999 112
I n O p e ra t io n D e c -0 4
61 4
5 7 6
2 ,3 03
59 7
58 8
D e c 20 0 4 = 3 ,9 6 7
2 ,7 18
62 4
62 5
L U Z O N
T O T A LIN D U S T R Y
N E W P L A Y E R S ’ G A S O L IN E S T A T IO N SN E W P L A Y E R S ’ G A S O L IN E S T A T IO N S
D e c 1 9 99 = 3 ,2 9 7
2 ,1 4 4
57 6
57 7
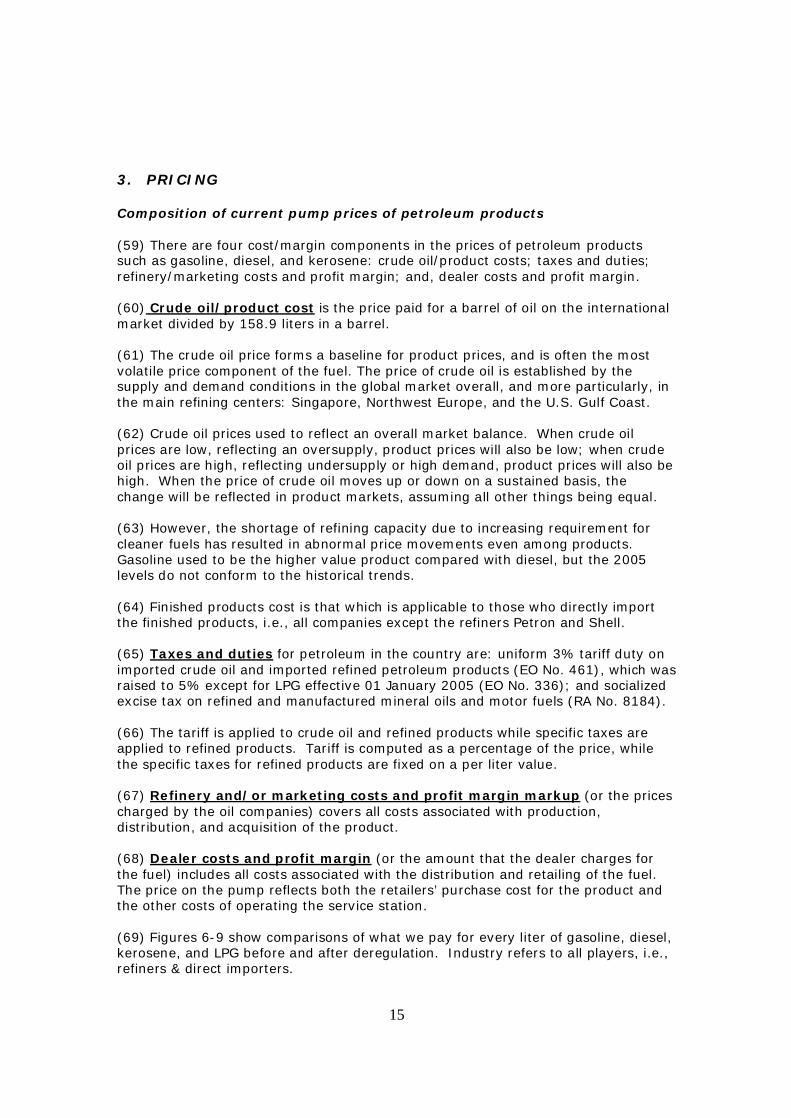
Source: DOE Market Share - LPG (58) As of December, 2004, the new LPG industry players have captured about 43% of the country’s market share, supplying 5,499 MB of the Philippines’ 12,754 MB total LPG requirements to end users. There is strong competition among new players in this sector all over the country. Figure 5
Source: DOE
LPG Market Share - Full Year 2004
Total Country12,754 MB
Petronas2.4%Pryce Gas
4.4%Nation8.1%
Liquigaz20.5%
Total7.6%
Shell22.8%
Caltex7.6%
Petron26.5%
15
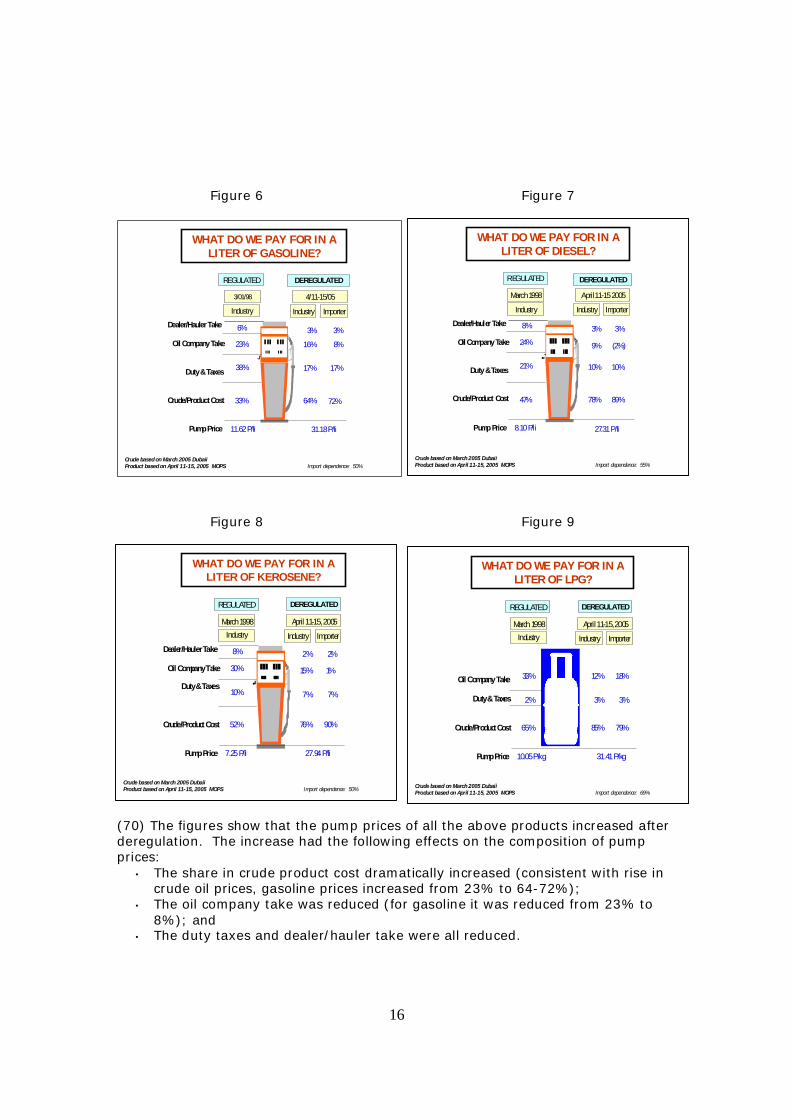
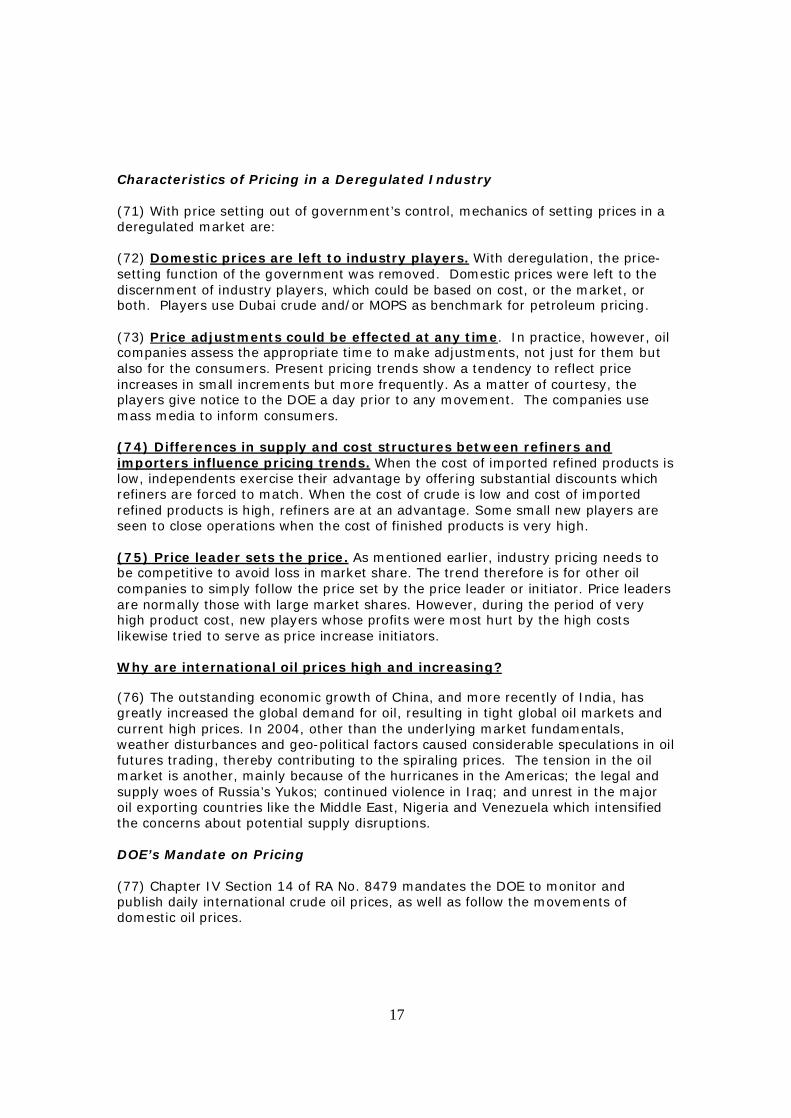
3. PRICING Composition of current pump prices of petroleum products (59) There are four cost/margin components in the prices of petroleum products such as gasoline, diesel, and kerosene: crude oil/product costs; taxes and duties; refinery/marketing costs and profit margin; and, dealer costs and profit margin.
(60) Crude oil/product cost is the price paid for a barrel of oil on the international market divided by 158.9 liters in a barrel. (61) The crude oil price forms a baseline for product prices, and is often the most volatile price component of the fuel. The price of crude oil is established by the supply and demand conditions in the global market overall, and more particularly, in the main refining centers: Singapore, Northwest Europe, and the U.S. Gulf Coast. (62) Crude oil prices used to reflect an overall market balance. When crude oil prices are low, reflecting an oversupply, product prices will also be low; when crude oil prices are high, reflecting undersupply or high demand, product prices will also be high. When the price of crude oil moves up or down on a sustained basis, the change will be reflected in product markets, assuming all other things being equal. (63) However, the shortage of refining capacity due to increasing requirement for cleaner fuels has resulted in abnormal price movements even among products. Gasoline used to be the higher value product compared with diesel, but the 2005 levels do not conform to the historical trends. (64) Finished products cost is that which is applicable to those who directly import the finished products, i.e., all companies except the refiners Petron and Shell. (65) Taxes and duties for petroleum in the country are: uniform 3% tariff duty on imported crude oil and imported refined petroleum products (EO No. 461), which was raised to 5% except for LPG effective 01 January 2005 (EO No. 336); and socialized excise tax on refined and manufactured mineral oils and motor fuels (RA No. 8184). (66) The tariff is applied to crude oil and refined products while specific taxes are applied to refined products. Tariff is computed as a percentage of the price, while the specific taxes for refined products are fixed on a per liter value. (67) Refinery and/or marketing costs and profit margin markup (or the prices charged by the oil companies) covers all costs associated with production, distribution, and acquisition of the product. (68) Dealer costs and profit margin (or the amount that the dealer charges for the fuel) includes all costs associated with the distribution and retailing of the fuel. The price on the pump reflects both the retailers’ purchase cost for the product and the other costs of operating the service station. (69) Figures 6-9 show comparisons of what we pay for every liter of gasoline, diesel, kerosene, and LPG before and after deregulation. Industry refers to all players, i.e., refiners & direct importers.
16
Figure 6 Figure 7
4/11-15/05
33%
38%
23%
6%
64%
17%
16%
3%
11.62 P/li 31.18 P/li
Dealer/Hauler Take
Oil Company Take
Duty & Taxes
Crude/Product Cost
Pump Price
Industry Importer
3%
8%
17%
72%
Industry
3/01/98
REGULATED
WHAT DO WE PAY FOR IN A LITER OF GASOLINE?
Crude based on March 2005 DubaiiProduct based on April 11-15, 2005 MOPS
DEREGULATED
Import dependence: 50%
Figure 8 Figure 9
(70) The figures show that the pump prices of all the above products increased after deregulation. The increase had the following effects on the composition of pump prices:
• The share in crude product cost dramatically increased (consistent with rise in crude oil prices, gasoline prices increased from 23% to 64-72%);
• The oil company take was reduced (for gasoline it was reduced from 23% to 8%); and
• The duty taxes and dealer/hauler take were all reduced.
47%
21%
24%
8%
78%
10%
9%
3%
8.10 P/li 27.31 P/li
Dealer/Hauler Take
Oil Company Take
Duty & Taxes
Crude/Product Cost
Pump Price
Industry Importer
3%
(2%)
10%
89%
Industry
March 1998
REGULATED
April 11-15 2005
WHAT DO WE PAY FOR IN A LITER OF DIESEL?
DEREGULATED
Import dependence: 55%Crude based on March 2005 DubaiiProduct based on April 11-15, 2005 MOPS
Industry
52%
10%
30%
8%
76%
7%
15%
2%
7.25 P/li 27.94 P/li
Dealer/Hauler Take
Oil Company Take
Duty & Taxes
Crude/Product Cost
Pump Price
Industry Importer
2%
1%
7%
90%
March 1998
REGULATED
April 11-15, 2005
WHAT DO WE PAY FOR IN A LITER OF KEROSENE?
DEREGULATED
Import dependence: 50%Crude based on March 2005 DubaiiProduct based on April 11-15, 2005 MOPS
Industry
65%
2%
33%
85%
3%
12%
10.05 P/kg 31.41 P/kg
Oil Company Take
Duty & Taxes
Crude/Product Cost
Pump Price
Industry Importer
3%
79%
March 1998
REGULATED
18%
April 11-15, 2005
WHAT DO WE PAY FOR IN A LITER OF LPG?
DEREGULATED
Import dependence: 69%Crude based on March 2005 DubaiiProduct based on April 11-15, 2005 MOPS
17
Characteristics of Pricing in a Deregulated Industry (71) With price setting out of government’s control, mechanics of setting prices in a deregulated market are: (72) Domestic prices are left to industry players. With deregulation, the price-setting function of the government was removed. Domestic prices were left to the discernment of industry players, which could be based on cost, or the market, or both. Players use Dubai crude and/or MOPS as benchmark for petroleum pricing. (73) Price adjustments could be effected at any time. In practice, however, oil companies assess the appropriate time to make adjustments, not just for them but also for the consumers. Present pricing trends show a tendency to reflect price increases in small increments but more frequently. As a matter of courtesy, the players give notice to the DOE a day prior to any movement. The companies use mass media to inform consumers. (74) Differences in supply and cost structures between refiners and importers influence pricing trends. When the cost of imported refined products is low, independents exercise their advantage by offering substantial discounts which refiners are forced to match. When the cost of crude is low and cost of imported refined products is high, refiners are at an advantage. Some small new players are seen to close operations when the cost of finished products is very high.
(75) Price leader sets the price. As mentioned earlier, industry pricing needs to be competitive to avoid loss in market share. The trend therefore is for other oil companies to simply follow the price set by the price leader or initiator. Price leaders are normally those with large market shares. However, during the period of very high product cost, new players whose profits were most hurt by the high costs likewise tried to serve as price increase initiators. Why are international oil prices high and increasing?
(76) The outstanding economic growth of China, and more recently of India, has greatly increased the global demand for oil, resulting in tight global oil markets and current high prices. In 2004, other than the underlying market fundamentals, weather disturbances and geo-political factors caused considerable speculations in oil futures trading, thereby contributing to the spiraling prices. The tension in the oil market is another, mainly because of the hurricanes in the Americas; the legal and supply woes of Russia’s Yukos; continued violence in Iraq; and unrest in the major oil exporting countries like the Middle East, Nigeria and Venezuela which intensified the concerns about potential supply disruptions. DOE’s Mandate on Pricing (77) Chapter IV Section 14 of RA No. 8479 mandates the DOE to monitor and publish daily international crude oil prices, as well as follow the movements of domestic oil prices.
18
DOE’s Monitoring Function (78) Benchmarking was employed to monitor prices. The DOE subscribes to the Platts International Marketwire Service for $60,000/yr (P3.4M/yr). The subscription agreement allows the DOE to publish the Dubai assessments for it to comply with its mandate. (79) The DOE has an internal daily international petroleum price monitor report which includes the spot prices of Dubai, Brent and WTI Cushing and the peso-dollar exchange rate as of the day the data were accessed, month-to-date and past-month averages, as well as the difference of said averages. This is distributed to the following:
• DOE Secretary, Undersecretaries • DOE Cebu and Davao Field Office Directors • Office of the Executive Secretary, Malacañang • National Security Council – Monitoring Center and Policy and Strategies
Office • Other Government Offices: NEDA, DTI, BSP, NSO, NWPC • Consumer Oil Price Watch • Petroleum Institute of the Phils. • Press: DZRH, Philstar Daily, Inc., Today • Office of Sen. Manuel A. Roxas III
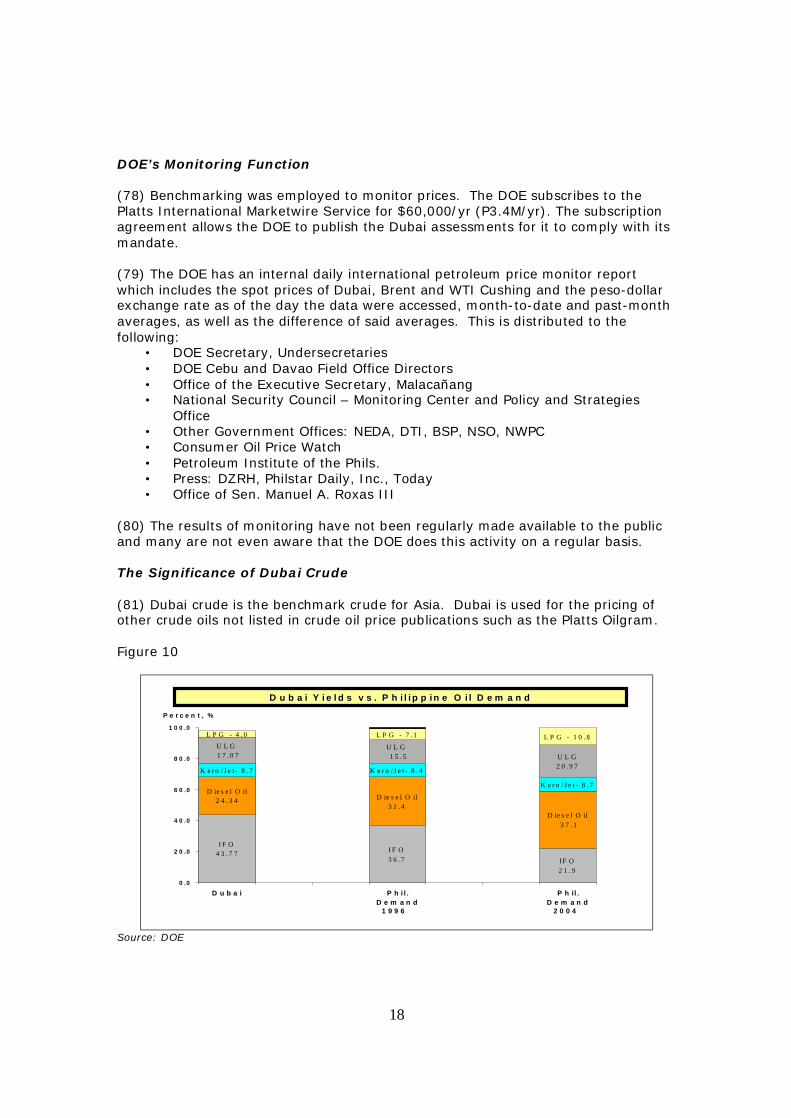
(80) The results of monitoring have not been regularly made available to the public and many are not even aware that the DOE does this activity on a regular basis. The Significance of Dubai Crude (81) Dubai crude is the benchmark crude for Asia. Dubai is used for the pricing of other crude oils not listed in crude oil price publications such as the Platts Oilgram. Figure 10
I F O4 3 . 7 7 I F O
3 6 .7 IF O2 1 . 9
D ie s e l O il2 4 . 3 4 D ie s e l O il
3 1 .4D ie s e l O il
3 7 . 1
K e r o / J e t - 8 . 7
K e r o /J e t - 8 . 4K e ro / J e t- 8 . 7
U L G2 0 .9 7
U L G 1 5 . 5
U L G 1 7 .0 7
L P G - 1 0 . 8L P G - 7 . 1L P G - 4 . 0
0 .0
2 0 .0
4 0 .0
6 0 .0
8 0 .0
1 0 0 .0
D u b a i P h i l .D e m a n d
P h il .D e m a n d
2 0 0 41 9 9 6
P e r c e n t , %
D u b a i Y i e ld s v s . P h i l i p p in e O i l D e m a n dD u b a i Y i e l d s v s . P h i l ip p in e O i l D e m a n d
Source: DOE
19
(82) Although the local refiners consider their actual import cost (crude and products) for their local price setting, the fluctuation in Dubai crude prices generally serves as indication of the movement of prices of finished products both in the international and the domestic markets. However, refiners may not necessarily buy crude at Dubai prices. The significance of MOPS (83) Mean of Platts Singapore (MOPS) is the basis for petroleum product pricing used by oil traders for product imports/exports in the Asian region. Direct product importers' costs of imports are practically MOPS-based. Typical examples of pricing formula based on MOPS are the following:
Cost at loadport = Full month average of MOPS quotations for the product during Bill of Lading (B/L) month plus a premium
Cost at loadport = Five-day average around Bill of Lading (B/L) of MOPS
quotations for the product plus a premium (84) The DOE subscribes to MOPS so that it can monitor prices of imported products. Why is MOPS not published for the public? (85) The information could not be made public owing to the subscription contract with the Service Provider Platts which will adversely affect Platts' subscription business with their current subscribers worldwide. An exorbitant redistribution fee will be charged for publishing a chart of the daily prices that does not even allow the reading of the actual points/prices. The Philippines’ oil demand is minimal and cannot influence international oil prices
(86) The Philippines’ oil demand of 0.32 million barrels is only 0.4% of the world oil demand of 82.5 million barrels. It has no influence in this respect.
(87) In contrast, the U.S. DOE’s Energy Information Agency projects worldwide oil demand growth averaging 2.5 million barrels per day for 2005 and 2006. The top oil consuming countries are the following:
1. United States with 20.4 million bbl/d of oil during the first 10 months of 2004, up from 20.0 million bbl/d in 2003;
2. China (surpassing Japan for the first time) with total demand of 5.56 million bbl/d, (which is projected by EIA to reach 12.8 million bbl/d by 2025);
3. Japan (with almost no oil reserves of its own - 59 million barrels of proven oil reserves) with an estimated 5.57 million bbl/d in 2003, up from 5.30 million bbl/d in 2002.
4. India, another fast growing oil consumer, with actual consumption of 2.2 million bbl/d in 2003, and projected consumption of 2.8 million bbl/d by 2010.
20
SUBSIDY (88) Subsidy is a system whereby someone other than the direct user pays a portion of the cost. It could either be the government or some other segment of society other than the user. (89) Subsidy results any time the government interferes with market prices, usually providing for lower than market prices. (90) A subsidy was initially regarded as payment or a tax concession from the government, but later extended to include policies that create transfers through the market mechanism. Some would also argue that the non-internalization of external costs should be regarded a social subsidy. (91) In a broader concept, subsidies are defined as comprising all measures that keep prices for consumers below market level or keep prices for producers above market level or that reduce costs for consumers and producers by giving direct or indirect support. This concept emphasizes that subsidies are much broader than cash money being transferred from the government to subsidy recipients. It is estimated to include the economic costs of forgone alternative opportunities and represent the amount of resources that is shifted from one group to another. Subsidy situation in the Philippines today (92) The Downstream Oil Industry Deregulation Act of 1998 liberalized the industry and ceased government control in oil pricing, and has abolished the OPSF, which was used to absorb world price fluctuations.
(93) It may be noted that lately, the international price of diesel has been more expensive compared to gasoline. Since diesel is mostly used by the public transport sector, which is generally patronized by low-income earners, the oil companies implemented lower increases for diesel than gasoline in support of the marginalized sector. In this situation, diesel price is partly subsidized by individual car owners using gasoline. (94) Diesel discounts given to public transport. Given the world’s volatile oil prices and the peso fluctuation, the government has been exerting effort to mitigate its impact on consumers. The DOE initiated a support mechanism for the public transport sector. A “jeepney lane,” also serving buses, has been designated by participating oil companies in 348 selected stations nationwide. They give discounts on diesel up to P1.00/liter which amount to P14 million per month; if annualized, it would reach about P170 million. Subsidy situation in other countries (95) The oil-producing countries in ASEAN generally subsidize their local pump prices. Indonesia, a member of the Organization of Petroleum Exporting Countries (OPEC), incurred US$7B last year for subsidies. Malaysia, subsidized diesel by US$1.5B. Thailand placed a cap on the price of gasoline and diesel last year; but even after lifting the subsidy on gasoline this year US$1.4B was incurred. Thailand has just announced cancellation of its oil subsidy which has cost its government an estimated US$2 billion (or over P100 billion).
21
Can the country initiate a subsidy program? (96) Considering the large expenses required to support a subsidy program, it is highly unlikely that the country, with its present huge financial deficit, can afford to do so. Subsidy is not viewed as sound fiscal measure
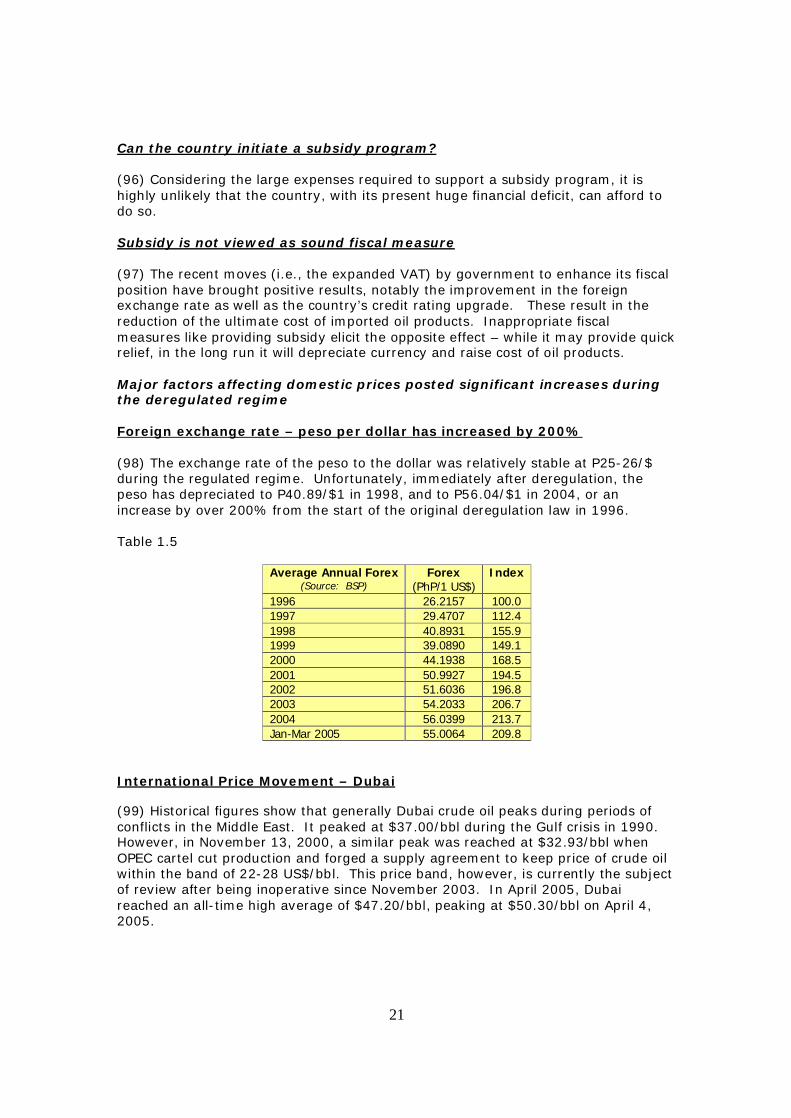
(97) The recent moves (i.e., the expanded VAT) by government to enhance its fiscal position have brought positive results, notably the improvement in the foreign exchange rate as well as the country’s credit rating upgrade. These result in the reduction of the ultimate cost of imported oil products. Inappropriate fiscal measures like providing subsidy elicit the opposite effect – while it may provide quick relief, in the long run it will depreciate currency and raise cost of oil products. Major factors affecting domestic prices posted significant increases during the deregulated regime Foreign exchange rate – peso per dollar has increased by 200% (98) The exchange rate of the peso to the dollar was relatively stable at P25-26/$ during the regulated regime. Unfortunately, immediately after deregulation, the peso has depreciated to P40.89/$1 in 1998, and to P56.04/$1 in 2004, or an increase by over 200% from the start of the original deregulation law in 1996. Table 1.5
Average Annual Forex (Source: BSP)
Forex (PhP/1 US$)
Index
1996 26.2157 100.0 1997 29.4707 112.4 1998 40.8931 155.9 1999 39.0890 149.1 2000 44.1938 168.5 2001 50.9927 194.5 2002 51.6036 196.8 2003 54.2033 206.7 2004 56.0399 213.7 Jan-Mar 2005 55.0064 209.8
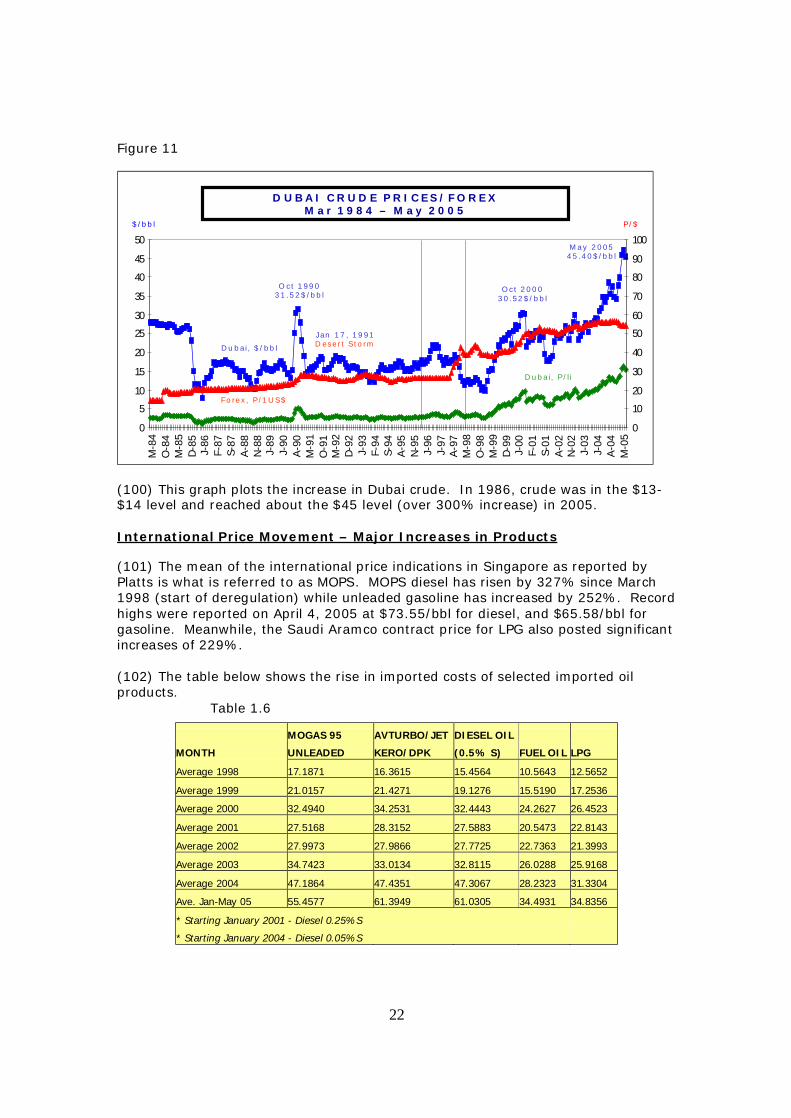
International Price Movement – Dubai (99) Historical figures show that generally Dubai crude oil peaks during periods of conflicts in the Middle East. It peaked at $37.00/bbl during the Gulf crisis in 1990. However, in November 13, 2000, a similar peak was reached at $32.93/bbl when OPEC cartel cut production and forged a supply agreement to keep price of crude oil within the band of 22-28 US$/bbl. This price band, however, is currently the subject of review after being inoperative since November 2003. In April 2005, Dubai reached an all-time high average of $47.20/bbl, peaking at $50.30/bbl on April 4, 2005.
22
Figure 11
0
5
10
15
20
25
30
35
40
45
50
M-8
4O
-84
M-8
5D
-85
J-86
F-87
S-87
A-8
8N
-88
J-89
J-90
A-9
0M
-91
O-9
1M
-92
D-9
2J-
93F-
94S-
94A
-95
N-9
5J-
96J-
97A
-97
M-9
8O
-98
M-9
9D
-99
J-00
F-01
S-01
A-0
2N
-02
J-03
J-04
A-0
4M
-05
0
10
20
30
40
50
60
70
80
90
100
O c t 1 9 9 03 1 .5 2 $ /b b l
O c t 2 0 0 03 0 .5 2 $ / b b l
D u b a i , $ / b b l
D u b a i, P / l i
F o re x , P /1 U S $
M a y 2 0 0 54 5 .4 0 $ /b b l
J an 1 7 , 1 9 9 1D es e r t S to rm
$ /b b l P /$
D U B A I C R U D E P R I C E S / F O R E XM a r 1 9 8 4 – M a y 2 0 0 5
(100) This graph plots the increase in Dubai crude. In 1986, crude was in the $13-$14 level and reached about the $45 level (over 300% increase) in 2005. International Price Movement – Major Increases in Products
(101) The mean of the international price indications in Singapore as reported by Platts is what is referred to as MOPS. MOPS diesel has risen by 327% since March 1998 (start of deregulation) while unleaded gasoline has increased by 252%. Record highs were reported on April 4, 2005 at $73.55/bbl for diesel, and $65.58/bbl for gasoline. Meanwhile, the Saudi Aramco contract price for LPG also posted significant increases of 229%. (102) The table below shows the rise in imported costs of selected imported oil products.
Table 1.6
MOGAS 95 AVTURBO/JET DIESEL OIL
MONTH UNLEADED KERO/DPK (0.5% S) FUEL OIL LPG
Average 1998 17.1871 16.3615 15.4564 10.5643 12.5652
Average 1999 21.0157 21.4271 19.1276 15.5190 17.2536
Average 2000 32.4940 34.2531 32.4443 24.2627 26.4523
Average 2001 27.5168 28.3152 27.5883 20.5473 22.8143
Average 2002 27.9973 27.9866 27.7725 22.7363 21.3993
Average 2003 34.7423 33.0134 32.8115 26.0288 25.9168
Average 2004 47.1864 47.4351 47.3067 28.2323 31.3304
Ave. Jan-May 05 55.4577 61.3949 61.0305 34.4931 34.8356
* Starting January 2001 - Diesel 0.25%S
* Starting January 2004 - Diesel 0.05%S
23
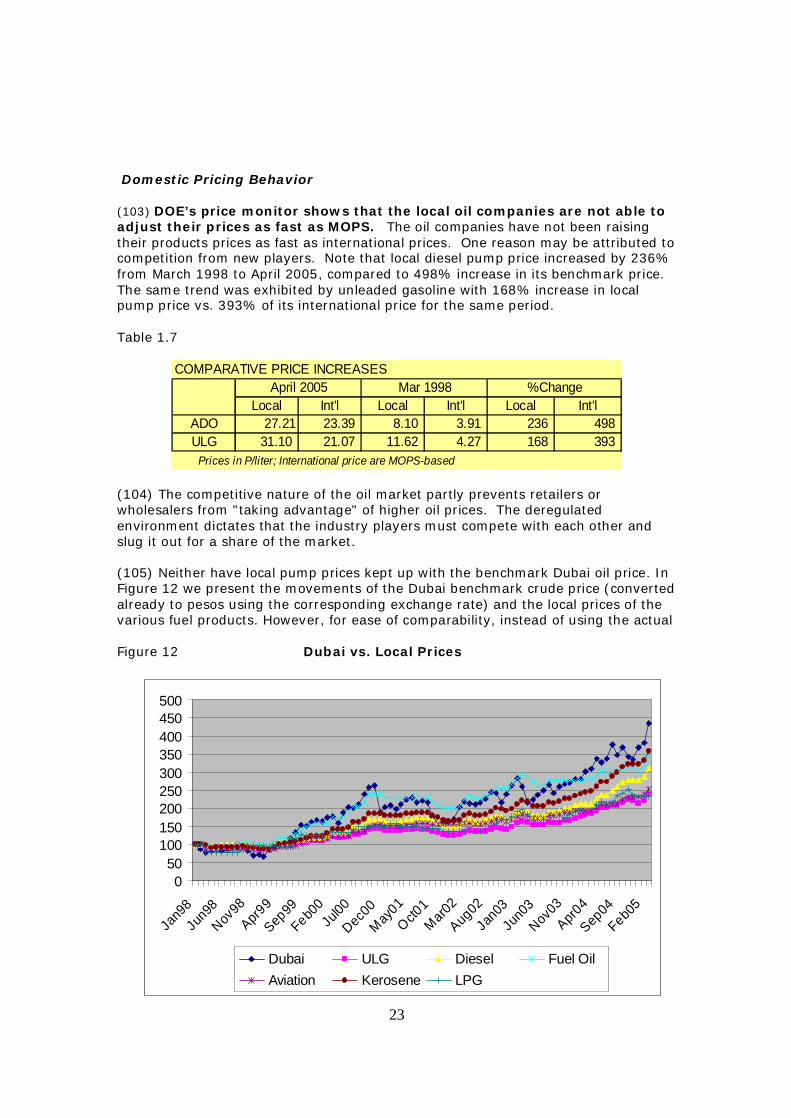
Domestic Pricing Behavior (103) DOE’s price monitor shows that the local oil companies are not able to adjust their prices as fast as MOPS. The oil companies have not been raising their products prices as fast as international prices. One reason may be attributed to competition from new players. Note that local diesel pump price increased by 236% from March 1998 to April 2005, compared to 498% increase in its benchmark price. The same trend was exhibited by unleaded gasoline with 168% increase in local pump price vs. 393% of its international price for the same period. Table 1.7
COMPARATIVE PRICE INCREASES
Local Int'l Local Int'l Local Int'lADO 27.21 23.39 8.10 3.91 236 498 ULG 31.10 21.07 11.62 4.27 168 393
Prices in P/liter; International price are MOPS-based
April 2005 Mar 1998 %Change
(104) The competitive nature of the oil market partly prevents retailers or wholesalers from "taking advantage" of higher oil prices. The deregulated environment dictates that the industry players must compete with each other and slug it out for a share of the market. (105) Neither have local pump prices kept up with the benchmark Dubai oil price. In Figure 12 we present the movements of the Dubai benchmark crude price (converted already to pesos using the corresponding exchange rate) and the local prices of the various fuel products. However, for ease of comparability, instead of using the actual Figure 12 Dubai vs. Local Prices
050
100150200250300350400450500
Jan9
8Jun
98Nov
98Apr9
9
Sep99Feb0
0Jul0
0
Dec00May
01Oct0
1Mar02
Aug02Jan
03Ju
n03Nov0
3Apr0
4
Sep04Feb05
Dubai ULG Diesel Fuel OilAviation Kerosene LPG
24
price levels, the raw data are indexed relative to January 1998 (=100), the year of the industry’s re-deregulation. Figure 12 shows that by March 2005, the indexed Dubai benchmark had reached 435 or was 4.35 times its January 1998 level. In contrast, unleaded gasoline and diesel were at about 237 (or 2.37 the January 1998 level) and 313 (3.13 times the Jan 1998 level) respectively in March 2005. Thus, insofar as the refiners are concerned, their raw material cost (as approximated by the Dubai benchmark) went up faster than did their selling price. The only exception may have been fuel oil prices, which had gone up higher relative to Jan 1998 levels than Dubai in some periods in the past. However, even fuel oil prices have lagged behind Dubai starting 2004. Price Catching-Up - Small but frequent adjustments
(106) The market works in various ways, and price catching up scenario is often practiced. When world oil prices hit all-time highs and consequently impact on local oil prices, then DOE Secretary Vicente Perez implored the cooperation of the local oil firms to increase prices on a staggered basis rather than carry out a one-shot increase. There had been suggestions that smaller but more frequent price adjustments may be more preferable than infrequent but hefty price adjustments. This was exhibited in the P0.50 weekly price movements in March 7, 15, 19, 27, and April 4, 2005. (107) Moreover, industry experts believe it would be difficult for consumers to accept a one-shot increase in oil prices considering the probabilities of high oil prices; hence adjustments are made in smaller increments. Price Matching
(108) In the Philippines, it is typical for service stations to closely watch each other’s price, especially of competitors in their trading area, such that prices in the same area tend to be the same. The decision to increase or decrease the price to match competition is undertaken to increase sales or simply to maintain market share. (109) The gasoline and diesel sold by the various companies are fairly homogenous products; i.e., they are easily substitutable for each other. Consumers can easily switch from one brand to another in fueling up their vehicles. Thus, pump prices are very similar across companies. In general, the big three and Total usually set higher prices while the other independents generally keep their prices a little below the majors. (110) This similar pricing is usually cited as “proof” of collusion and proof that the oil companies are acting as a cartel. While a cartel may agree to set a common or similar price, the latter is not a sufficient proof of collusion. Similar prices may also arise because of competition. Because of the high substitutability between brands, no one firm can set a price that is significantly different from the others. If one firm tried to set or maintain a price markedly higher than the other companies’, it would see its sales dwindle immediately as its clients switch to the competition. Gasoline station operators, especially those with competing stations nearby, can testify to this. (111) On the other hand, a station with significantly lower prices would take away sales from its competitors. The latter will of course not take this sitting down and will most likely match the lower prices. This would leave both players with the same
25
market share as before but at lower prices. Both sellers are now obviously worse off than if they had not attempted to undercut prices to begin with. (112) This situation is aggravated (for the sellers) if there had been several rounds of price cutting and retaliation; i.e., a price war. The Parachute Phenomenon
(113) It has always been questioned why the pump price does not decrease when the benchmark price starts to decrease. This is a typical phenomenon in a supply and demand economy like the oil industry. Domestic prices are perceived to go up very quickly when there are shortages, but tend to take a long time to come down when there are adequate supplies of a product. Due to intense competition, the oil companies sometimes sell their products at a loss. In other words, they lose money on some shipments of the fuel, and they usually make up for those losses by reducing prices more slowly. Overall, however, increases in local prices are still way below the increases in international prices as previously described. (114) The “Parachute Phenomenon” may also arise naturally due to strategic pricing. When costs increase, some firm or firms will deplete their older cheaper inventory first and must resort to higher cost stocks. From their perspective, if they don’t raise their prices they would lose money. If they raise their prices, they might lose some volume but would at least maintain a positive margin. Thus it would be better for these firms to raise prices immediately. (115) On the part of the firms which still have the older cheaper inventory, if they don’t follow the price increase and keep their old (and cheaper) prices, they might temporarily gain market share as buyers switch to them. But this will cause them to run out of the older inventory sooner and then must restock at the current higher cost anyway. On the other hand, if they immediately follow the price increase, they could enjoy temporarily higher margins until their old inventory runs out. Thus, these competitors will tend to follow immediately a price increase. (116) The story is reversed when costs are going down. The first firm to replenish with cheaper inventory has little incentive to immediately lower prices and pass on the savings. If it kept its higher old prices it could enjoy higher margins. Eventually, the other firms will also start selling from cheaper inventory and prices will be competed down. But at least the firm would have enjoyed higher margins in the meantime. Thus, when costs are falling, firms may have a tendency to wait for the last player to deplete its older more expensive stock before the industry starts cutting prices. PRICING SITUATION Gross Margins of the Players are lower now than when regulated (117) During the regulated regime, margins by the oil companies, and by dealers/haulers comprised 23% and 6% for gasoline; 24% and 8% for diesel; and 33% for LPG. If these were maintained, prices as of end April should have been P35.60/l for gasoline (versus P29.43/l), P35.53/l for diesel (versus P27.56/l), and P454.01/11-kg cylinders for LPG (versus P342.79/11-kg cylinders).
26
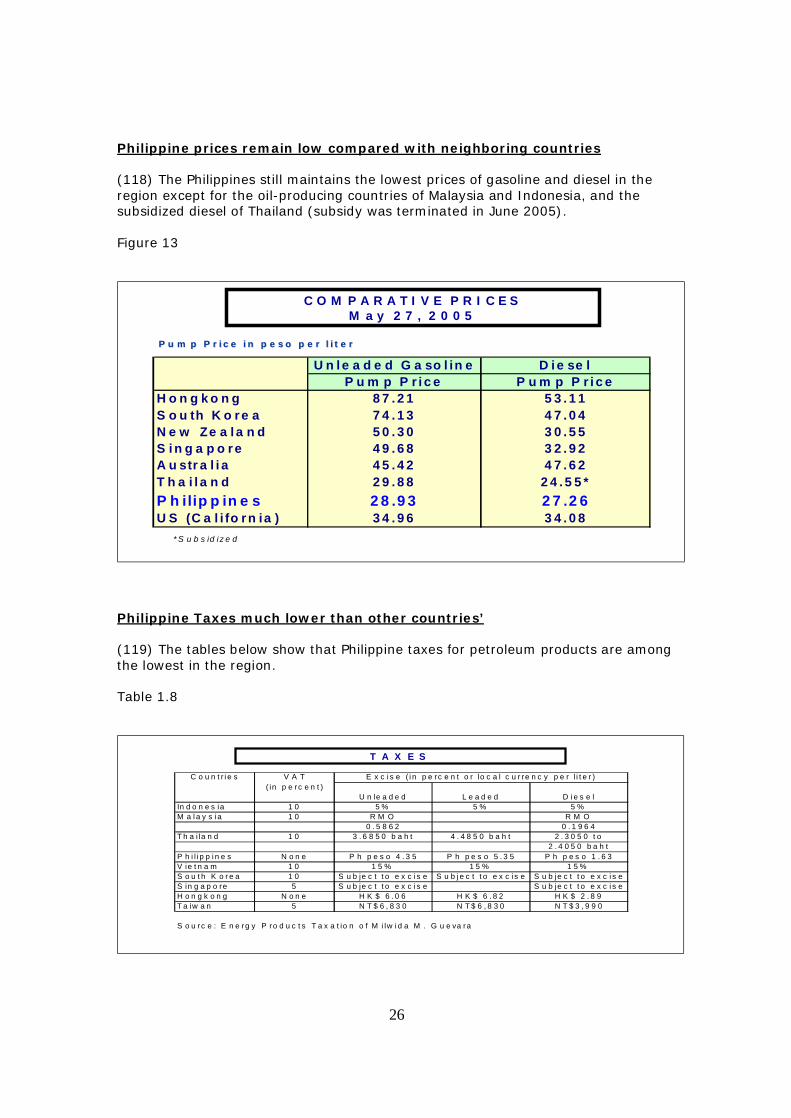
Philippine prices remain low compared with neighboring countries (118) The Philippines still maintains the lowest prices of gasoline and diesel in the region except for the oil-producing countries of Malaysia and Indonesia, and the subsidized diesel of Thailand (subsidy was terminated in June 2005). Figure 13
C O M P A R A T I V E P R I C E SM a y 2 7 , 2 0 0 5
P u m p P r i c e i n p e s o p e r l i t e rP u m p P r i c e i n p e s o p e r l i t e r
* S u b s id iz e d
U n l e a d e d G a so l in e D i e se lP u m p P r i c e P u m p P r i c e
H o n g k o n g 8 7 . 2 1 5 3 . 1 1S o u th K o re a 7 4 . 1 3 4 7 . 0 4N e w Ze a l a n d 5 0 . 3 0 3 0 . 5 5S i n g a p o re 4 9 . 6 8 3 2 . 9 2A u str a l i a 4 5 . 4 2 4 7 . 6 2T h a i l a n d 2 9 . 8 8 2 4 . 5 5 *P h ilip p in e s 2 8 .9 3 2 7 .2 6U S (C a l i fo rn ia ) 3 4 . 9 6 3 4 . 0 8
Philippine Taxes much lower than other countries’ (119) The tables below show that Philippine taxes for petroleum products are among the lowest in the region. Table 1.8
T A X E S
C o u n t r i e s V A T( in p e rc e n t )
U n le a d e d L e a d e d D i e s e lIn d o n e s ia 1 0 5 % 5 % 5 %M a l a y s ia 1 0 R M O R M O
0 . 5 8 6 2 0 . 1 9 6 4T h a i la n d 1 0 3 . 6 8 5 0 b a h t 4 . 4 8 5 0 b a h t 2 . 3 0 5 0 t o
2 . 4 0 5 0 b a h tP h i l i p p i n e s N o n e P h p e s o 4 . 3 5 P h p e s o 5 . 3 5 P h p e s o 1 . 6 3V ie t n a m 1 0 1 5 % 1 5 % 1 5 %S o u t h K o r e a 1 0 S u b je c t t o e x c i s e S u b j e c t t o e x c is e S u b je c t t o e x c i s eS in g a p o re 5 S u b je c t t o e x c i s e S u b je c t t o e x c i s eH o n g k o n g N o n e H K $ 6 . 0 6 H K $ 6 . 8 2 H K $ 2 . 8 9T a iw a n 5 N T $ 6 , 8 3 0 N T $ 6 , 8 3 0 N T $ 3 , 9 9 0
S o u rc e : E n e rg y P ro d u c t s T a x a t io n o f M i lw i d a M . G u e va ra
E x c i s e ( i n p e rc e n t o r lo c a l c u r re n c y p e r l i t e r )
27
Table 1.9
T A X E S
C o u n t rie s V A T(in p e rc e n t )
U n le a d e d L e a d e d D ie s e lIn d o n e s ia 1 0 5 % 5 % 5 %M a la y s ia 1 0 8 . 5 4 2 . 8 6Th a ila n d 1 0 4 . 9 8 6 . 0 7 3 .1 2 t o 3 .2 5P h ilip p in e s N o n e 4 . 3 5 5 . 3 5 1 . 6 3V ie tn a m 1 0 1 5 % 1 5 % 1 5 %S o u th K o re a 1 0 S u b je c t t o e x c is e S u b je c t t o e x c is e S u b je c t t o e x c is eS in g a p o re 5 S u b je c t t o e x c is e S u b je c t t o e x c is eH o n g k o n g N o n e 4 3 .1 4 4 8 .5 5 2 0 .5 7Ta iw a n 5 N T$ 6 ,8 3 0 N T$ 6 ,8 3 0 N T$ 3 ,9 9 0
S o u rc e : D O E , t ra n s la te d fro m E n e rg y P ro d u c ts Ta x a t io n o f M i lw id a M . G u e va ra
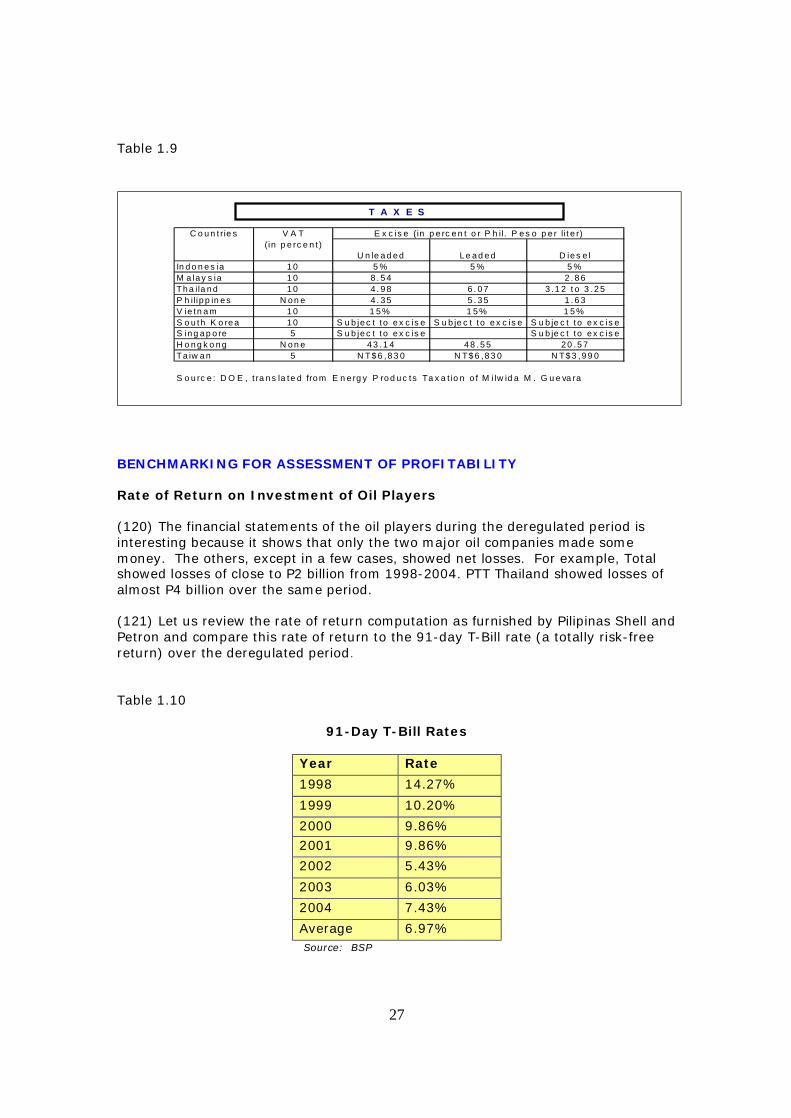
E x c is e (in p e rc e n t o r P h il. P e s o p e r lit e r)
BENCHMARKING FOR ASSESSMENT OF PROFITABILITY Rate of Return on Investment of Oil Players (120) The financial statements of the oil players during the deregulated period is interesting because it shows that only the two major oil companies made some money. The others, except in a few cases, showed net losses. For example, Total showed losses of close to P2 billion from 1998-2004. PTT Thailand showed losses of almost P4 billion over the same period. (121) Let us review the rate of return computation as furnished by Pilipinas Shell and Petron and compare this rate of return to the 91-day T-Bill rate (a totally risk-free return) over the deregulated period. Table 1.10
91-Day T-Bill Rates
Year Rate
1998 14.27%
1999 10.20%
2000 9.86% 2001 9.86%
2002 5.43%
2003 6.03%
2004 7.43%
Average 6.97% Source: BSP
28
Figure 14 (click here to enlarge table)
Source: Pilipinas Shell
Figure 15
Source: Petron
29
Figure 16 (click here to enlarge table)
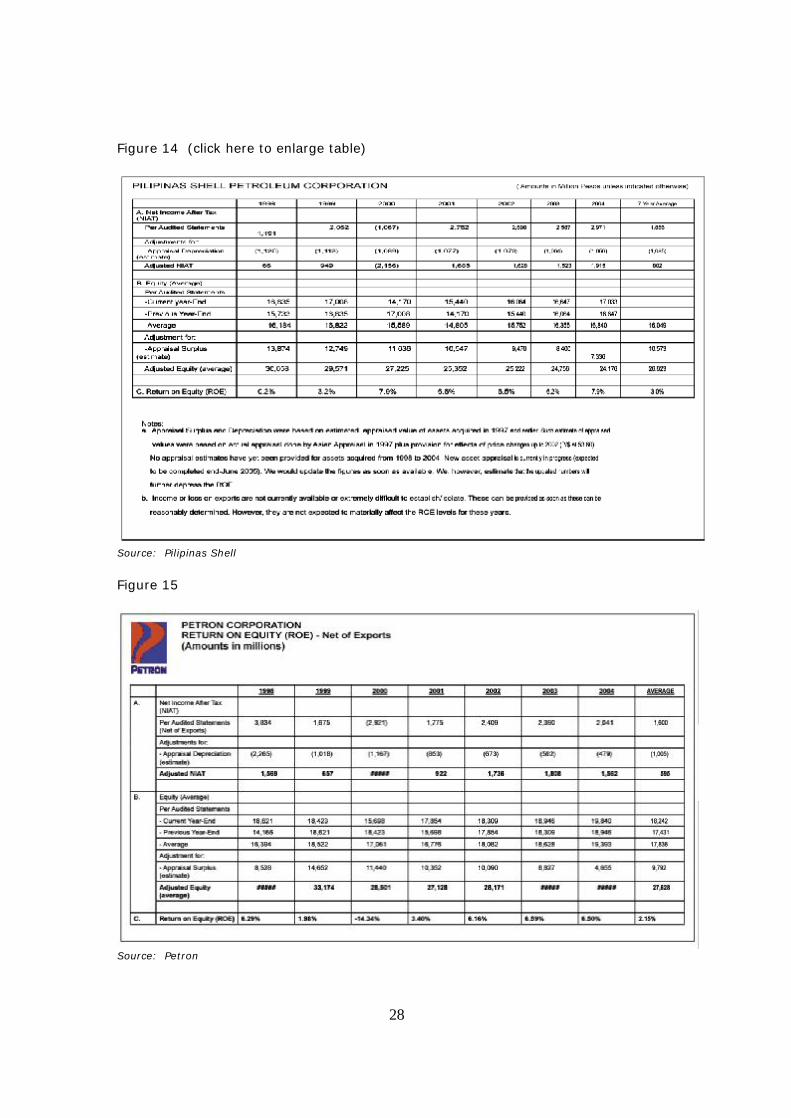
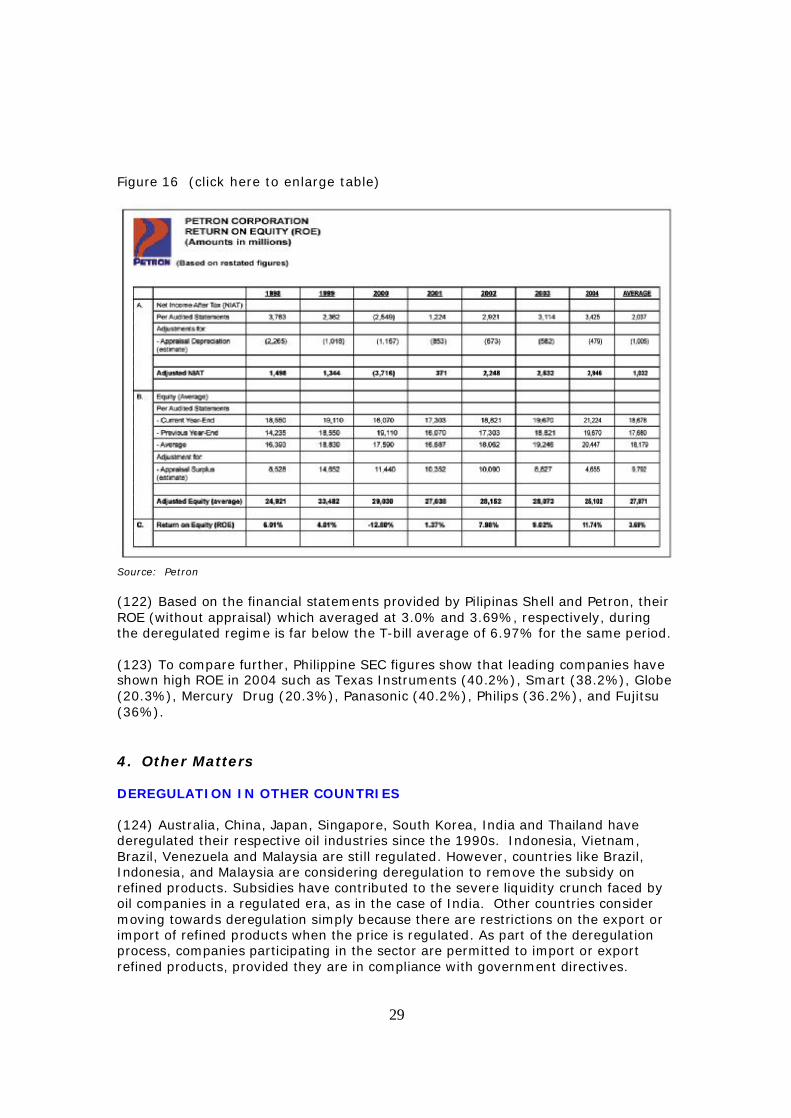
Source: Petron (122) Based on the financial statements provided by Pilipinas Shell and Petron, their ROE (without appraisal) which averaged at 3.0% and 3.69%, respectively, during the deregulated regime is far below the T-bill average of 6.97% for the same period. (123) To compare further, Philippine SEC figures show that leading companies have shown high ROE in 2004 such as Texas Instruments (40.2%), Smart (38.2%), Globe (20.3%), Mercury Drug (20.3%), Panasonic (40.2%), Philips (36.2%), and Fujitsu (36%). 4. Other Matters DEREGULATION IN OTHER COUNTRIES (124) Australia, China, Japan, Singapore, South Korea, India and Thailand have deregulated their respective oil industries since the 1990s. Indonesia, Vietnam, Brazil, Venezuela and Malaysia are still regulated. However, countries like Brazil, Indonesia, and Malaysia are considering deregulation to remove the subsidy on refined products. Subsidies have contributed to the severe liquidity crunch faced by oil companies in a regulated era, as in the case of India. Other countries consider moving towards deregulation simply because there are restrictions on the export or import of refined products when the price is regulated. As part of the deregulation process, companies participating in the sector are permitted to import or export refined products, provided they are in compliance with government directives.
30
(125) Incentives are being offered to attract foreign investors. Most investments attract tax holidays of five years like in China and the Philippines. In China, the tax rate is further reduced by 50% and duty exemptions on material imports for refineries have been removed. In the Philippines the tax on oil has been restructured as discussed previously. (126) Should the Philippines opt to return to regulation, it would send the wrong signals and may drive away foreign investors. Industry players and investors believe that it is crucial for the country to maintain its deregulation policy in order to uphold its credibility, stability, and political will. IMPORT TARIFF (127) In January 2005, the import tariff was increased to 5% from 3% as an interim measure. (128) The new players are clamoring to revert the import tariff on imported petroleum products from 5% to 3% to help ease the impact of increased prices on consumers. (Manila Bulletin/March 19, 2005) (129) New players are against the 5% tariff on petroleum products because it does not level the playing field and favors only the refiners. (130) The tariff differential between the raw materials (crude oil) and finished products may encourage continued operation of the existing refinery and increase refining capabilities to produce products meeting our own standards, thereby decreasing importations of finished products which could lower the landed cost of oil products. OIL SMUGGLING (131) Oil smuggling can be viewed as avoidance of payment of duties and taxes or nonpayment of correct duties and taxes through erroneous product or value declaration. The Bureau of Customs (BOC) is the agency tasked to collect these import duties as well as specific taxes for imported petroleum products. The DOE, with its available information on oil imports, coordinates with the BOC and even the Anti-Smuggling Task Force created by the Office of the President. (132) The BOC has previously considered creating an oil import monitoring group in its agency as well as improving the monitoring systems of both the BOC and the DOE. The DOE and BOC have thus been working towards the harmonization of data for better coordination and cooperation in the fight against smuggling. SHORTAGE OF OIL REFINING CAPACITY AROUND THE WORLD – Opportunity for Profit OPEC Fulfilling Its Commitment But Refining And Shipping Bottlenecks Keep Oil Prices on Boil (Excerpt from the article of Ali al-Yabhouni published in the February/March ADNOC News and republished with permission. He is the Head of the Marketing Research
31
and Analysis Department in ADNOC’s Marketing & Refining Directorate, and is the UAE National Representative for OPEC.) (133) “While global oil demand has increased by more than 4.5mn b/d since 2002, the world’s refining capacity has increased by only 1.3mn b/d. With refining runs already at around 95%, there is no scope for further improvement in refinery utilization. It means that the world consumption will outpace refining capacity substantially, particularly in the fourth quarter this year, when a demand of around 86mn b/d must be met with a capacity of about 83mn b/d. Certainly, the oil industry can stockpile product stocks in the second and third quarters, when oil demand is relatively weak. However, storage capacity is limited in developing countries. Similarly any planned or unplanned outage at a major refinery often results in huge fluctuation. Moreover, refineries must undergo maintenance after every five years on average.” (134) With tight refining capacity, refiners are earning a lot of money. On 31 March, a typical cracking refinery in the US was earning around US$9/B while coking margins were much higher. In Asia, jet/kero crack was reported at almost US$22/B at the end of March, a value which is unusual for this time of the year. Similarly gas oil margins were allegedly at about US$17/B. Due to higher demand for middle distillates, Asian cracking units were making about US$7.50/B in profit while the simplest refiners earned about US$2/B. In Europe, diesel cracks surged to US$163/ton while jet margin was at US$195/ton. As a result, a typical Brent cracking refiner was earning more than US$8/B on 31 March. In the Mediterranean, where refiners normally used Russian grade Urals, refining profits were at around US$9/B.
THE CLEAN AIR ACT
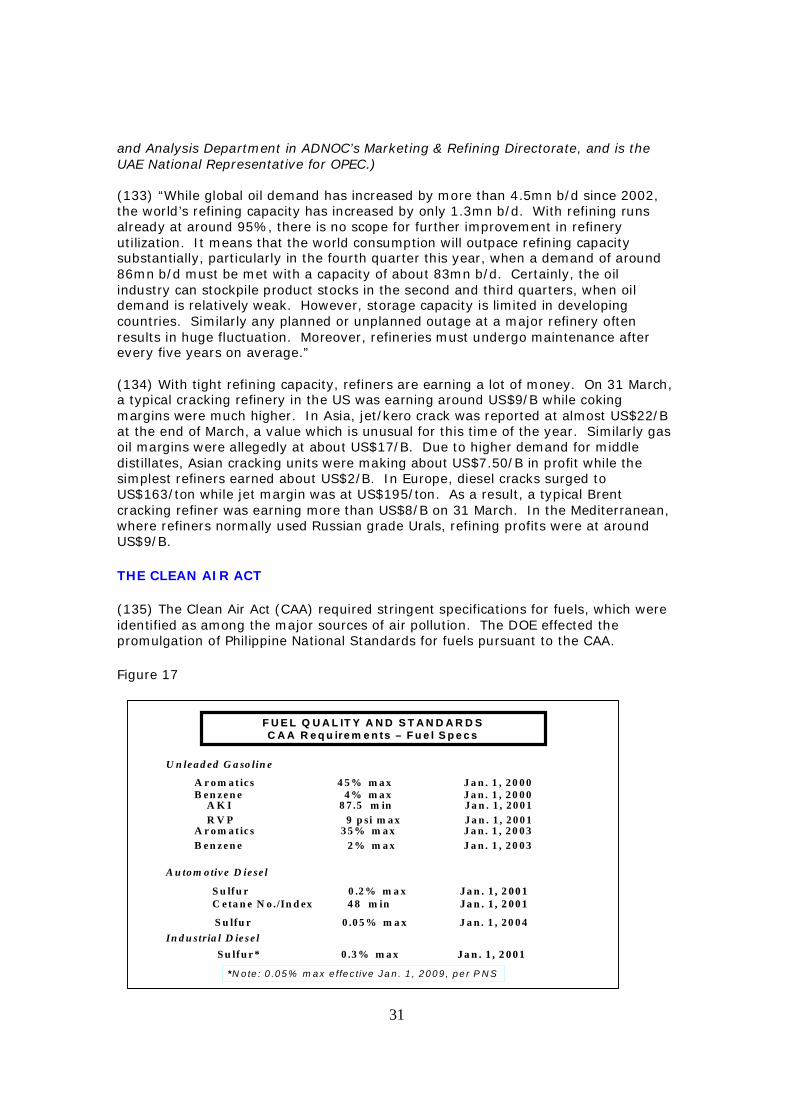
(135) The Clean Air Act (CAA) required stringent specifications for fuels, which were identified as among the major sources of air pollution. The DOE effected the promulgation of Philippine National Standards for fuels pursuant to the CAA.
Figure 17
A r o m a t ic s 4 5 % m a x J a n . 1 , 2 0 0 0 B e n z e n e 4 % m a x J a n . 1 , 2 0 0 0
U n le a d ed G a so lin e
A r o m a t ic s 3 5 % m a x J a n . 1 , 2 0 0 3B e n z e n e 2 % m a x J a n . 1 , 2 0 0 3
A K I 8 7 .5 m in J a n . 1 , 2 0 0 1R V P 9 p si m a x J a n . 1 , 2 0 0 1
A u to m o tiv e D ie se l
S u lfu r 0 .2 % m a x J a n . 1 , 2 0 0 1J a n . 1 , 2 0 0 1C e ta n e N o ./In d ex 4 8 m in J a n . 1 , 2 0 0 1J a n . 1 , 2 0 0 1
S u lfu r 0 .0 5 % m a x J a n . 1 , 2 0 0 4In d u stria l D ie s e l
S u lfu r * 0 .3 % m a x J a n . 1 , 2 0 0 1J a n . 1 , 2 0 0 1
F U E L Q U A L IT Y A N D S T A N D A R D SF U E L Q U A L IT Y A N D S T A N D A R D SC A A R e q u ire m e n ts C A A R e q u ire m e n ts –– F u e l S p e c sF u e l S p e c s
*N o te : 0 .0 5 % m a x e ffe c tive Ja n . 1 , 2 0 0 9 , p e r P N S
32
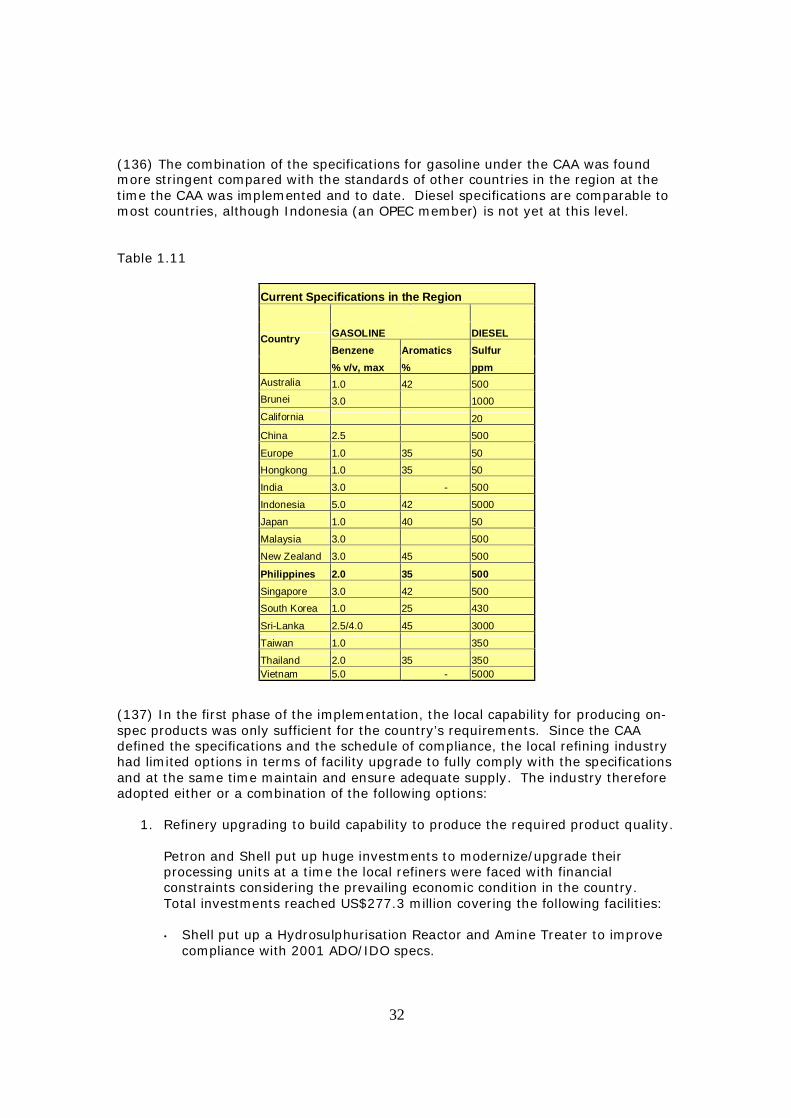
(136) The combination of the specifications for gasoline under the CAA was found more stringent compared with the standards of other countries in the region at the time the CAA was implemented and to date. Diesel specifications are comparable to most countries, although Indonesia (an OPEC member) is not yet at this level. Table 1.11 (137) In the first phase of the implementation, the local capability for producing on-spec products was only sufficient for the country’s requirements. Since the CAA defined the specifications and the schedule of compliance, the local refining industry had limited options in terms of facility upgrade to fully comply with the specifications and at the same time maintain and ensure adequate supply. The industry therefore adopted either or a combination of the following options:
1. Refinery upgrading to build capability to produce the required product quality.
Petron and Shell put up huge investments to modernize/upgrade their processing units at a time the local refiners were faced with financial constraints considering the prevailing economic condition in the country. Total investments reached US$277.3 million covering the following facilities:
• Shell put up a Hydrosulphurisation Reactor and Amine Treater to improve
compliance with 2001 ADO/IDO specs.
Current Specifications in the Region GASOLINE DIESEL Benzene Aromatics Sulfur
Country
% v/v, max % ppm Australia 1.0 42 500 Brunei 3.0 1000 California 20 China 2.5 500
Europe 1.0 35 50 Hongkong 1.0 35 50
India 3.0 - 500
Indonesia 5.0 42 5000
Japan 1.0 40 50
Malaysia 3.0 500
New Zealand 3.0 45 500
Philippines 2.0 35 500 Singapore 3.0 42 500 South Korea 1.0 25 430
Sri-Lanka 2.5/4.0 45 3000
Taiwan 1.0 350
Thailand 2.0 35 350 Vietnam 5.0 - 5000
33
• Petron, meanwhile, invested in a Naphtha Isomerization Unit to meet 2003 gasoline specs, and on a Gas Oil Treater for compliance with 2004 ADO spec.
1.1 Use of imported blending components or additives.
Blending components for gasoline such as alkylates are special products of low aromatics and high octane used by the refiners to adjust the quality of their produced gasoline for compliance with CAA specifications. Blending is expensive and components are difficult to source in regional market due to limited supply.
Effects of the CAA Implementation – Refining capacity has diminished (138) The DOE implemented the fuel quality specifications of the CAA fully and on time. Although implementation of the CAA may have been successful, it was a contributing factor in the closure of one of the major refineries in the country. Hence, due to the implementation of the CAA, the total refinery capacity went down to 292.5 MBSD in 2005 from 441.0 MBSD in 2000. Further, the country’s dependence on imported fuels increased, running counter to DOE’s long-term energy program of improving and ultimately achieving energy self-sufficiency. Importation volume of 25,980 MB in 2000 more than doubled to 52,951 MB by 2004 to meet our increasing demand for fuels that will help keep the air clean.

34
35
CHAPTER III RESULTS OF CONSULTATIONS
(1) One of the activities undertaken by the IRC was to consult the different sectors affected by the Oil Deregulation Law. Following is a summary of the results of the consultation with industry players, particularly, the oil companies and LPG players, as well as the issues raised by the public transport sector, consumers, consumer groups and others. OIL COMPANIES 1. Policy of the State under RA No. 8479
(2) The policy of the state is to liberalize and deregulate the downstream oil industry in order to ensure a truly competitive market under a regime of fair prices, and an adequate and continuous supply of high-quality petroleum products. (3) The oil companies invited to the consultations are unanimous in saying that they are in favor of the state policy on deregulation. However, the oil refiners and the importers had several other comments – which differed, as to be expected – since their interests differ in many aspects. (4) The oil refiners have pointed out that the country has not attracted new refiners and, in fact, one refiner has ceased operations. This has serious implications on the sufficiency of the country’s oil refining capacity. (5) They support the state policy of the law but note that implementation has been much lacking, particularly the:
• Poor enforcement of industry standards on facilities and product quality; • Weakened regulatory authority of the DOE; and, • Need for more incentives for refiners for them to invest in the needed
additional capacity. (6) Some new players – all importers – think the market is not truly an even playing field because the refiners have an advantage with regard to pricing because they can allocate margins from one product to support the retail prices of other products. Some importers, who owe their existence in the country to deregulation, favor some sort of regulation if it could assure them of positive margins.
2. Pricing/Subsidy
(7) Industry players disclose that increases in prices of petroleum products are mainly due to the increase in international price of crude and finished products and the devaluation of the peso against the dollar. To be able to maintain their market share, they are forced to follow the adjustment of the market leader even if the adjustment does not reflect the true cost of acquiring the petroleum products. Since adjustments are dictated by market forces, there is no truth to
36
the accusation that price fixing and/or cartelization exists in the downstream oil industry. (8) In fact, most, if not all, industry players claim that they are not getting a reasonable rate of return on their investments. Computation of the rate of return differs per oil company. The oil refiners use rate of return base (RORB) while the direct importers use the rate of capital employed (ROCE). (9) Communicating fair price to the public is a difficult task because this is relative and dependent on one’s perspective. To the oil company, fair price means fair returns on investments. To the consumer, it means low prices. (10) On the issue of subsidy, importers believe taxpayers’ money should not be used to subsidize the oil business. On price intervention, importers believe this will only result in market distortions. The market cannot be forced to work against the natural forces of the market. (11) Among the solutions cited:
a. Encourage development of renewable energy through legislation b. Improve government communication to the public. For example,
government should confirm if price increases are reasonable or unreasonable.
c. Encourage the public to practice energy conservation. For example, the government should stop colorum buses from plying the streets, noting the poor passenger load of many buses. Also, encourage lifestyle shifts as a response to the very high prices of fuel.
3. Enforcement
(12) Effective enforcement of the law is the key issue. The reported malpractices and illegal activities of marginal groups demoralize legitimate investors. Examples of malpractices are substandard service stations. Example of an illegal activity is smuggling products.
(13) Most of the players favor reinstatement and even strengthening of the DOE’s authority to issue licenses so that the DOE can effectively monitor compliance with rules and regulations on product quality, facility standards, and safety.
4. Clean Air Act (CAA)
(14) The product specifications under the CAA are good for the conservation and protection of the environment. However, the specifications were introduced prematurely before the refining tools to produce these products were in place. As a result, this became a major factor for one company deciding to forgo additional investments and to close down its refinery.
(15) The CAA requirement on fuel standards should be balanced with affordability, engine capability, and supply security.
37
5. Oil Security
(16) Most of the players are not keen on stockpiling as a means to soften the impact of the volatility of prices. Further, with the current prices of crude and finished petroleum products, stockpiling is not prudent. If prices drop, the company that maintained the stockpile would suffer a loss. Stockpiling of finished products is not advisable because the products deteriorate when stored for a long period of time.
(17) There is also the question of who would bear the economic cost of stockpiling and managing the stockpile.
(18) Other players suggest that the government prioritize the development of renewable energy and alternative fuels to have energy security and promote energy conservation as a national policy rather than just a program.
LIQUID FUELS SECTOR (GASOLINE STATION BUSINESS) 1. Policy of the State under RA No. 8479
(19) One of the key features of the deregulation law is to encourage the entry of new players in the downstream oil industry to give consumers more choices, competitive prices, and improved services and facilities, among others. Increase in market players is an indication of success, but not to the extent of bringing about cutthroat competition. (20) Members of the Federation of Petroleum Dealers (FPD) are unhappy about deregulation because of the over-competition it has spawned that resulted in substantial loss in volumes for some dealers, resulting in loss of business viability. The lack of zoning regulations combined with deregulation has resulted in an oversupply of stations in certain trading areas. In addition, because of the absence of standards when Deregulation was implemented and the difficulty in getting these enforced (upon promulgation of the Retail Rules in 2004), the industry has attracted the wrong investors – illegal fuel retailers like “bote-bote,” mobile tankers, overhead tanks used for retailing – that result in an uneven playing field for legitimate retailers. Proof of their poor profitability is the wave of retailers’ resignations that have hit the oil companies since the industry was deregulated. (21) Another feature of the deregulated market cited by the FPD is the emergence of company-owned, company-operated retail outlets (COCOs). While attributing the presence of COCOs to the Liberalization of the Retail Trade Law, the FPD however took note of the long-term impact of such outlets to competition and pricing that may deserve Government’s attention. Pricing (22) The FPD raised the lack of safeguards under the law to protect retailers from activities of the oil companies that shrink retailers’ margins. FDP asks that retail pricing be free from company intervention and that the practice of margin sharing not be allowed.
38
(23) To improve poor margins, FPD proposed converting margins now in absolute amounts to a percentage of the Suggested Retail Price. With volumes on the decline, retailers can only depend on improving margins to survive.
2. Enforcement and Other Matters
(24) The FPD suggests the following: • Restoring the DOE’s authority to issue permits to new entrants to minimize
illegal traders and mosquito retailers which have substandard facilities and inferior products. Giving the DOE authority to prohibit illegal retailing activities such as the “bote-bote” method, and use of aboveground tanks and mobile tankers which are all unsafe and hazardous to the environment.
• Removing the licensing function from the local government units (LGUs), a practice which has created chaos in the sector.
• Restoring the distance requirement between gasoline stations especially now that most trading areas are highly saturated.
• Shortening of the operating hours of gasoline stations to minimize operating expenses
• Lifting of requirement for dealers to pay company-sponsored sales promos
unless the promos are localized LIQUEFIED PETROLEUM GAS (LPG) SECTOR 1. Policy of the State Under RA No. 8479
(25) The passage of RA No. 8479 has opened up the market for the entry of new industry participants in the LPG sector. There are now eight bulk suppliers and 177 refilling plants all over the country. DOE data show that as of December 2004, the new players in the LPG sector have captured about 43% of the country’s market share or have supplied 5,499 MB of the Philippines’ 12,754 MB total LPG requirements.
(26) The LPG sector believes that deregulation has been successful in attracting new players into the LPG industry but has failed to provide a fair and competitive market with a level playing field.
(27) The LPG sector is not against the entry of new players, but believes that regulations should be in place to ensure that safety standards are complied with. (28) There seems to be a clear difference of opinion between large industry players and the smaller players covering such matters as pricing, ownership of cylinders and enforcement of industry standards.
39
2. Pricing
(29) The following are the issues on pricing:
• Due to the lack of a level playing field, legitimate players are not getting reasonable rates of return.
• Liberalization of the oil industry has given large players the ability to act as
price leaders since the smaller players cannot compete with them, but will just have to play with the music.
• The big players do not announce price increases at the proper time. World
market price for the current month must be published in local newspapers.
• Government procedures and regulations should be harmonized to remove unnecessary costs which add to the price of the products. The cost of the product becomes higher because of city ordinance fees disguised as road users’ tax, different time slots for truck ban implemented by the LGUs resulting in additional overtime pay, and loss of products due to pilferage.
3. Enforcement
(30) The industry now is marred by unsafe and unfair practices such as:
• Tampering of cylinders • Unauthorized refilling of LPG cylinders • Underfilling • Maintenance of illegal retail outlets • Tampering and conversion of cylinders • Illegal repainting of cylinders • Fake cylinder and seals • Proliferation of unbranded/substandard cylinders, and • Pilferage or “Paihi”
(31) About 3 million LPG cylinders circulating in the market are considered potential time bombs, because they are hazardous to the lives and properties of consumers. (32) Cylinder ownership is one of the critical issues of the LPG industry. The large players claim that they own the LPG cylinders which are only “on deposit” to users. Small LPG players say the LPG cylinders are already “sold” to the users. Once the issue of ownership is resolved, the LPG players should be made accountable for maintaining their LPG cylinders and avoiding unauthorized refilling.
(33) The LPG industry recognizes the importance of standards for the business. LPG refillers must comply with minimum safety standards. Likewise, only quality cylinders must circulate in the market. The large players claim that they regularly maintain their cylinders. Other LPG players propose the creation of a “bayanihan fund” for the maintenance of LPG cylinders.
40
(34) Other players request DOE to compel the recognition of LPG cylinder exchange and swapping as an industry practice.
(35) A new player in the LPG business comments that its decision to expand its operation would depend on the passage of House Bill No. 2422 or the LPG Bill which proposes one lead agency for the LPG industry. Aside from a single body to monitor the industry, the LPG players appeal for more transparent rules which are beneficial to all – government, businessmen, and consumers. These will include the revival of DOE’s licensing/permitting functions to ensure safety standards but it should not be contrary to the spirit of deregulation and should have no suspicion of corruption.
4. Clean Air Act (CAA)
(36) The CAA is a very good program of the government but it should be implemented properly.
5. Oil Security
(37) Independent LPG players say there is no problem getting supply of LPG. TRANSPORT GROUPS – LAND TRANSPORT SECTOR 1. Pricing/Subsidy
(38) The land transport sector calls for transparency in the pricing of petroleum products by the oil companies.
(39) During this period of continuously rising prices of petroleum products, the transparency they require is not for government to be more active in explaining the reason for prices of petroleum products, but rather to verify and check whether the oil companies are “fair” in translating rising international crude and petroleum products to pump prices.
(40) To cushion the impact of high petroleum prices, they are similarly asking government to extend direct subsidy to the public transport sector, either by extending the current discount lanes for public transport to all retail outlets (gasoline stations) or some form of price ceiling for diesel.
(41) The transport sector requests fuel cost subsidy because transport fares remain regulated. With fuel costs accounting for a significant part in their cost of operations, the lag between the increase in oil prices and approval of fare increase means diminishing (lost) revenues for the ordinary driver and operator. They cast an envious eye on the oil companies who are able to automatically translate any increase in international prices to their pump prices.
41
TRANSPORT GROUPS – SHIPPING SECTOR 1. Pricing
(42) In a deregulated regime, the passenger and commercial cargo water transport sectors are provided with a mechanism to automatically pass on rising fuel costs to users. Although adjustment in fares has led to decreased traffic volume, their bottom line has not been affected.
(43) However, they still request “stability” in the pricing of fuel so that they can prepare their business plans. By stability, they mean an estimated price band for oil prices, or the maximum price within a given period.
(44) They are unable to benefit from competition of potential fuel suppliers because they lack bulk storage facilities.
CONSUMERS/CONSUMER GROUPS 1. Policy of the State under RA No. 8479
(45) The views expressed by this group were quite polarized and far reaching because some suggestions would require the government to consider broad state policies. (46) One commented that the Oil Deregulation law is unconstitutional and therefore should be scrapped. Another mentioned that this law should be allowed to continue because going back to a regulated regime would send wrong signals to existing or potential investors. (47) Several groups have voiced even more drastic actions such as buying back Petron 100% and even nationalizing the entire oil industry. In this way government would be able to bundle all the oil requirements for the country and bid out as one. Further, this would allow government direct control in product pricings and the institution of subsidies. This group did not specify where the funds would come from to undertake such massive endeavors.
2. Pricing/Subsidy (48) Most consumers express the thought that they do not have adequate information on the reasons for increases in prices of oil products and other price developments. This lack of information is the reason why people think there is a cartel, overpricing, and price fixing among oil companies. What they seek is that government provide basic information to the public and to explain how price increases are arrived at and for the oil companies to be transparent in their pricing of petroleum products.
42
3. View of One Major Business Group (A Chamber of Commerce)
(49) Previously, a president of this chamber publicly expressed the views that government should reimpose a system such as the OPSF. In a press release on May 30, 2005, this president reversed his position on the OPSF. He mentioned these major points:
• Since the Philippines is basically dependent on the importation of oil and oil products, no amount of control on pricing can be effectively achieved by legislation or dictation, especially during a period of constant price movements originating outside the country like today without temporarily, if not permanently, hurting in the long run both government and private enterprise initiatives.
• The Oil Deregulation law is not the cause of price increases. Because many new players were enticed to join the industry here, repealing the law would place under question the Philippine government’s credibility, stability, and sense of political will.
4. Enforcement
(50) Some consumers think that the power of the DOE to issue licenses/permits to those who would like to engage in downstream oil industry activities should not only be revived but also be made a yearly requirement. Further, they suggest that the DOE consider deputizing the Philippine National Police or military and safety inspectors to go after violators of standards such as substandard stations. A few believe, however, that this would only add more problems and open a new alley for corruption.
5. Clean Air Act (CAA) (51) With the stringent provisions of the CAA on fuel standards, some consumers suggest a moratorium (maybe deferral by two years) if only to give some kind of a “breathing spell” to consumers and also buy some time for the oil prices to go down to previous levels. On the other hand, other consumers recommend a study on the benefits of using such fuel vis-à-vis corresponding improvement in the air quality. If there is no projected dramatic air quality improvement, then the pollution problem could be caused by other factors, and a moratorium in the CAA fuel standards implementation should be adopted and the useless fuel quality standards eventually scrapped.
6. Oil Security (52) There is a suggestion for the government to accelerate the development of indigenous energy resources because these are essential for the near-, medium- and long-term socio-economic welfare of the country.
43
GOVERNMENT AGENCIES
(53) The Committee also invited government agencies involved in the implementation of RA No. 8479. (54) Executive Order (EO) No. 377 was intended as a unifying mandate (institutional framework) for key government agencies to ensure a smooth transition from a regulated to a deregulated regime, as well as to develop and provide the necessary safety nets, as appropriate, and overall, to ensure the success of the downstream oil industry deregulation both for the individual investor and for consumers/public.
(55) The individual agencies concerned acted within their individual mandates and authority including those unique to the downstream oil industry, but they were unable to act collectively and in a holistic manner. This may be the reason for some of the shortcomings attributed to the implementation of the downstream oil industry. (56) The DOE was also invited to give its views on the implementation of the law. Secretary Raphael Lotilla and Undersecretary Peter Abaya represented the DOE. Secretary Lotilla advocates the devolution of the powers of the DOE to the LGUs. However, he also mentioned that the LGUs should first acquire the necessary skills. Because of budgetary constraints, the DOE is unable to expand its powers.

44
45
CHAPTER IV ANALYSIS AND CONCLUSIONS (1) Generally, proper analysis and valid conclusions can only be reached after seeking relevant data on which to base such analysis and conclusions. (2) The Independent Review Committee (IRC) has painstakingly taken time to learn the nature and peculiarities of the oil industry. The IRC spent many hours interviewing industry players, consumers, consumer groups and other concerned individuals. The IRC sought their views on the Oil Deregulation Law. (3) The results of industry knowledge and the interviews are discussed thoroughly in the two previous chapters. These data play an important part in our analysis. (4) As a procedure, this chapter does not intend to duplicate the same information contained in Chapters II and III. When specific topics or paragraphs are relevant in this analysis portion, the subject will be discussed briefly and specific references will be made to both the chapter and numbered paragraphs where more detailed discussion on the material can be found. ANALYSIS ON PRICES (5) The most important issue on the cost of oil products is how it affects the pocketbooks of the citizenry. There has been much noise that the price of oil products is too high and that this can be blamed on the Oil Deregulation Law. In light of information on the industry which had been gathered and presented, let us see how this plays out. What is the main cause of the present high level cost of gasoline and other oil products? Is it the Deregulation Law? (6) We need to make reference to information of currency depreciation since 1996 (Chapter II, Paragraph 98), the increase in crude prices since 1996 (Chapter II, Paragraph 100), and the percentage composition of price of crude and net margin in oil (Chapter II, Paragraph 59) to analyze this matter. (7) We have seen that the peso rate to the dollar depreciated by about 200% while the dollar cost of crude rose by at least 300%. These two factors alone, which we know are beyond the control of any oil player, will increase the peso cost of crude content in the product by at least six times that in 1996 (200% x 300% = 6 times). Importers of refined or finished products are of course affected similarly. (8) Furthermore, practically all our oil product requirements are imported because we hardly produce any oil domestically (Chapter II, Paragraph 18). Therefore, any changes in international oil market prices have a direct and immediate effect on the peso pump price.
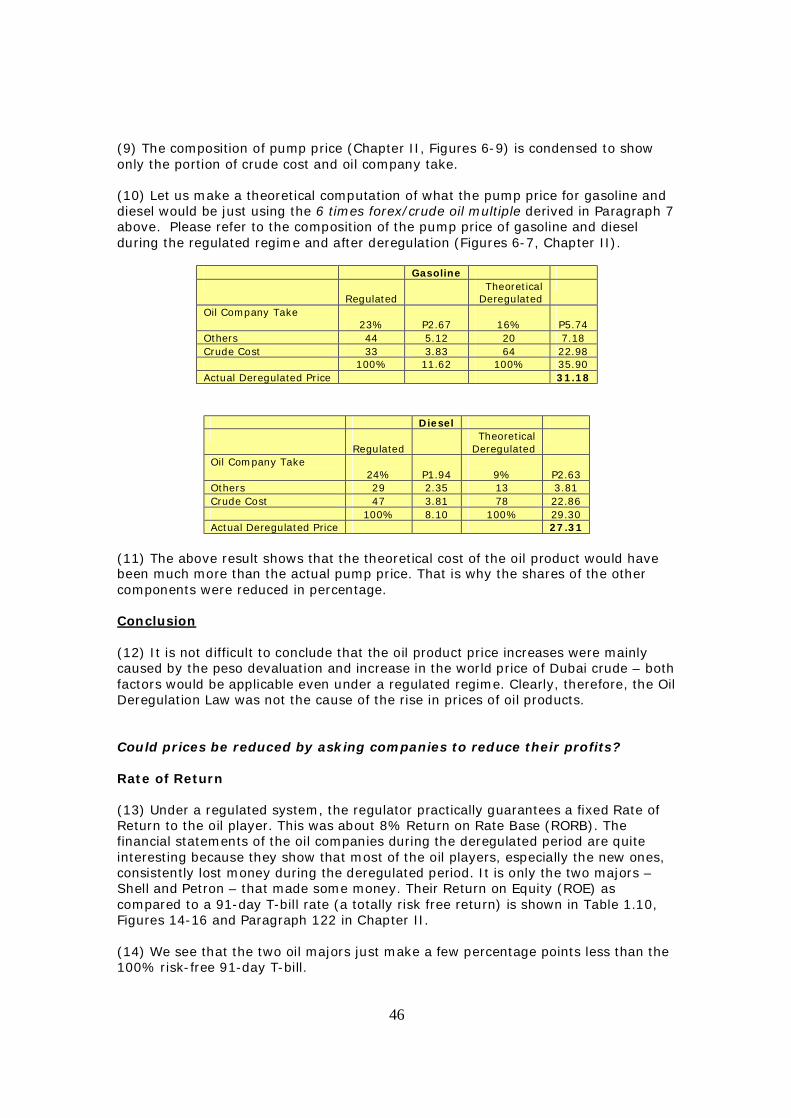
46
(9) The composition of pump price (Chapter II, Figures 6-9) is condensed to show only the portion of crude cost and oil company take. (10) Let us make a theoretical computation of what the pump price for gasoline and diesel would be just using the 6 times forex/crude oil multiple derived in Paragraph 7 above. Please refer to the composition of the pump price of gasoline and diesel during the regulated regime and after deregulation (Figures 6-7, Chapter II).
Gasoline
Regulated Theoretical
Deregulated
Oil Company Take 23%
P2.67
16%
P5.74
Others 44 5.12 20 7.18 Crude Cost 33 3.83 64 22.98 100% 11.62 100% 35.90 Actual Deregulated Price 31.18
Diesel
Regulated Theoretical
Deregulated
Oil Company Take 24%
P1.94
9%
P2.63
Others 29 2.35 13 3.81 Crude Cost 47 3.81 78 22.86 100% 8.10 100% 29.30 Actual Deregulated Price 27.31
(11) The above result shows that the theoretical cost of the oil product would have been much more than the actual pump price. That is why the shares of the other components were reduced in percentage. Conclusion (12) It is not difficult to conclude that the oil product price increases were mainly caused by the peso devaluation and increase in the world price of Dubai crude – both factors would be applicable even under a regulated regime. Clearly, therefore, the Oil Deregulation Law was not the cause of the rise in prices of oil products. Could prices be reduced by asking companies to reduce their profits? Rate of Return (13) Under a regulated system, the regulator practically guarantees a fixed Rate of Return to the oil player. This was about 8% Return on Rate Base (RORB). The financial statements of the oil companies during the deregulated period are quite interesting because they show that most of the oil players, especially the new ones, consistently lost money during the deregulated period. It is only the two majors – Shell and Petron – that made some money. Their Return on Equity (ROE) as compared to a 91-day T-bill rate (a totally risk free return) is shown in Table 1.10, Figures 14-16 and Paragraph 122 in Chapter II. (14) We see that the two oil majors just make a few percentage points less than the 100% risk-free 91-day T-bill.
47
Conclusion (15) If the two oil players were making excess profits, which the above analysis shows they are not, only then could government use suasion in convincing the oil companies to reduce their prices. But the ill effects of this move would be:
• To further increase the losses of the other oil industry players (i.e., the importers); and,
• To make the Philippines unattractive as a location for new investments into the industry.
What about subsidizing oil prices and instituting something similar to the OPSF? (16) Paragraphs 35-37 in Chapter II describe briefly what the OPSF was, why it is not applicable to the Philippines, and why it was abandoned. (17) Because of the size of the industry, any government subsidy would also be unaffordable. If we were to assume a simple subsidy of P1.00/liter of diesel, our computations show that this would cost the government at least P1.5 billion in just the first four months of the year. (18) In actual terms, Thailand gave a subsidy for a period of one year and four months and wound up in the hole to the tune of US$2 billion. Thailand could not afford continuing this, and announced in early June 2005 that it was stopping the subsidy. Could the Philippines afford US$2 billion for oil subsidy alone? (19) Providing government subsidy will effectively displace national funds for other equally important projects such as infrastructure, education, and others. The Asian Development Bank (ADB) is of the opinion that providing oil subsidies is not the solution to higher oil prices, noting that much-needed government resources may end up going to sectors that have the capacity to absorb the higher cost of petroleum products while basic services suffer. (Asia Pulse, April 20, 2005) (20) The April 20, 2005 issue of Asia Pulse reported that Senator Mar Roxas estimated that reviving the OPSF to support the Philippine domestic oil market would mean an additional P100 billion, or about US$1.83 billion, in national budget deficit, thereby upsetting the government’s fiscal consolidation program. Note that the said program seeks to gradually reduce the funding gap every year for the next five years and balance the budget by 2010. (Asia Pulse, April 20, 2005) (21) Overall, the ADB argues that allowing market forces to set domestic pump prices encourages efficient use of oil, impels productivity improvements, and increases competitiveness. It is worth noting that the multilateral banks have proposed the lifting of subsidies in Malaysia, Indonesia, Thailand, and India as they pose fiscal liabilities. Instead, these countries were advised to adopt measures to encourage the efficient use of oil and discourage wasteful consumption, and provide tax incentives for the development and use of alternative renewable energy sources.
48
(22) The United Nations Economic and Social Commission for Asia and the Pacific (UNESCAP) also warned ESCAP member-countries, including the Philippines, that government subsidy on high oil prices is likely to worsen fiscal conditions.
“While the logic of subsidized oil product prices is understandable, such a policy approach is almost certainly not viable over the medium term given its fiscal and opportunity costs.”
(23) The UN body added that subsidies invariably distort relative prices, discourage conservation and fuel efficiency in transport, and encourage overuse of the subsidized items. Further, government subsidy on high oil prices would need clear fiscal costs that will have to be made up through taxes elsewhere or through higher borrowing.
(24) The government would also need to find the resources to compensate the oil companies, whether State or private, that have not been able to pass on the full cost of the crude oil to the consumers. (Manila Times, December 20, 2004) Conclusion (25) Subsidizing oil prices (something like OPSF) does not work in an era of rising crude prices (what is happening now) because it would entail government resources that it cannot afford, and could be used for better purposes. Furthermore, international bodies like the ADB and UNESCAP are firmly against such practices because these distort relative prices, discourage conservation and fuel efficiency, and encourage overuse of subsidized items. If we accept for argument’s sake that the oil players were not overcharging, why were increases in oil prices very frequent? Why didn’t they reduce prices right away when there was a decrease in international crude prices? (26) The oil players are not able to increase their prices as fast as the price of international crude rises (Chapter II, Paragraph 103). The “parachute phenomena” is explained in Paragraph 114 where we see that there also is a time lag in reducing prices so that there is time to recapture past losses. (27) Paragraph 106 in Chapter II also tells us that the government has used suasion, requesting price leaders to spread required oil price increases in smaller increments but over a longer period. (28) Because of the parachute effect and because oil players have agreed to spread increases over a longer period, we cannot make meaningful judgments on any single act of increase or decrease. Oil players have to be judged over a longer period like over a whole year – whether their actions result in low, average, or high net income for the year.
49
Conclusion (29) Frequent price increases resulted because of positive government suasion in spreading major price increases over a longer period rather than in one big jump. It is an industry practice that there is a lag before oil companies can increase their prices to catch up with international prices and vice versa for lower prices. Perception of Cartels Why do oil companies seem to raise prices at the same time? Do cartels exist? (30) The oil players seem to be raising prices all at the same time which gives the appearance that price cartels exist in the industry (31) To address this perception, there is a need to know the nature of oil products, competition involved, and the philosophy that oil players are guided by. (32) Paragraph 11 in Chapter II will explain that oil products, when they meet specifications, are practically interchangeable. Further, Paragraphs 8-10 tell us that oil players consider market share nearly the “name of the game.” Our own experience tells us that there seems to be a proliferation of service stations especially in Metro Manila. It is not surprising to see two or three gasoline stations bunched up in one busy intersection. (33) When the above forces exist, basic college economics will tell you that prices’ going up and down at about the same time is what one should expect to happen. The fact that it does happen is an indication that market forces are working – not necessarily that cartels exist. (34) Notwithstanding what is to be expected, there are specific cases described in Paragraph 117 where oil industry players have not acted uniformly — where one has raised prices while the other reduced prices. Conclusion (35) When products are interchangeable, when market share is the “name of the game,” and competition is in full swing, we should not be surprised, but rather expect that oil companies’ prices will seem to rise and fall at the same time. Major Conclusions on Prices (36) From the above analyses we conclude that:
• The main cause of oil price increases was the effect of major peso devaluations and increases in the international price of oil especially since we import practically all our oil product requirements.
• Subsidy is not a viable solution because it will cost government excessive amounts of money.
• There is no evidence of price cartels.
50
ANALYSIS ON COMPETITION Did the Oil Deregulation Law actually encourage competition? Did competition bring about lower prices? (37) Deregulation has allowed more industry players to operate in the Philippines. From just three major players in the regulated regime, now there are 35 players with the new ones mainly importers of oil products. The total number of service stations is now over 4,000 from about 3,000 in 1996. There is also a proliferation of LPG players. (38) There have been good effects where there is evidence that the actual market price (pump price) was less than the price the player would have liked to charge. This is evidenced by the fact that practically none of the new players (which are all importers) is making any profit. (39) There are bad effects such as gasoline retail outlets complaining that competition is causing them not to make sufficient margins; that bad practices like below standard retail outlets exist and smuggled products compete in the market. (40) Intense competition in the LPG industry has polarized the large players against the smaller independents because of issues of cylinder ownership, under-filling, compliance with safety standards, and others. Conclusions on Competition (41) From the above analyses, we can conclude that:
• Deregulation has increased competition in the industry; and, • There are both positive and negative effects on competition. The effect on
lowering prices outweighs other effects. ANALYSIS ON ENFORCEMENT Are there disorders in the regulation regime that need to be addressed? Why can’t DOE seem to fix identified problems in the industry such as substandard service stations and other problems identified in the LPG industry? (42) It is in this area where it is believed most of the problems arise. Deregulation of the oil industry does not mean nonregulation of the industry by the government. It is consistent with the government continuing to monitor, supervise, and regulate those aspects of the oil industry where market forces may not operate satisfactorily and thus more active intervention may be justified to ensure a truly competitive market, under a regime of fair prices, and adequate and continuous supply of environmentally clean and high-quality petroleum products.
51
(43) The jurisdiction over the oil industry is spread out to many government agencies under EO No. 377 (Providing the Institutional Framework for the Administration of the Deregulated Downstream Oil Industry) which makes coordination and enforcement very difficult because of so many government agencies involved, each with tendency of trying to protect one’s turf. (44) Thus, enforcement of laws, rules and regulations is one of the critical issues in monitoring the downstream sector particularly in the retailing of LPG and Liquid Fuels. The LPG Industry Problems (45) Under the regulated regime, the LPG industry was dominated by only four major players. Entry to the LPG business was more stringent because of the licensing requirement of the then Ministry of Energy (now DOE). The DOE had the authority to issue licenses to operate and to confiscate LPG cylinders with violations. Abuses and unfair industry practices could be addressed because the DOE had the authority to suspend operations or revoke licenses of violators. (46) Under the deregulated regime, RA No. 8479 opened up the market to new LPG players. There are now eight bulk suppliers and 186 refilling plants all over the country. They have captured about 43% of the country’s market share. (47) The problems of the LPG industry are more fully discussed in Chapter III, Paragraphs 25-35. Some of the unsafe and unfair practices described therein include the following:
• Tampering of cylinders • Unauthorized refilling of LPG cylinders • Underfilling • Maintenance of illegal retail outlets • Tampering and conversion of cylinders • Illegal repainting of cylinders • Fake cylinder and seals • Proliferation of unbranded/substandard cylinders, and • Pilferage or “Paihi”
(48) As mentioned previously, EO No. 377 watered down the authority of the DOE to just monitoring, without authority to suspend or revoke licenses of industry violators. Even the “Revised Schedule of Penalties in the LPG Industry” issued by the DOE is being challenged by the LPG Refillers’ Association (LPGRA) as unconstitutional and confiscatory. (49) Some of the futile effects of monitoring without proper authority of the DOE are described below:
• The monitoring activities of the DOE during the period August 2000 to March 2005 showed that 45% of the 5,285 LPG establishments inspected were violating LPG rules and regulations. The most common violations were underfilling, illegal refilling, and unbranded cylinders. Unfortunately, since the Revised Schedule of Penalties mentioned above is under protest, erring LPG
52
establishments continue to ignore the sanctions and do not pay the corresponding fines.
• LPG establishments found violating LPG rules and regulations for three consecutive times are recommended for closure to the concerned LGUs. However, implementing the recommendation depends on the political will of the concerned LGUs.
(50) Because of its limited powers, the DOE has tried to encourage self-policing among the members of the industry. Through an industry Memorandum of Agreement, an LPG Task Force was created to assist the DOE in enforcing the LPG regulations. Also, the DOE helped craft and is advocating the passage of House Bill No. 2422 or the LPG Bill which would establish the monitoring and supervisory framework for the LPG industry, provide additional powers to the DOE, define and penalize certain prohibited acts. Conclusion (51) It is quite evident that emasculating the powers and authority of the DOE over the LPG industry has encouraged unfair and unsafe practices in the industry. There is a need to bolster DOE’s authority and police power to correct erring players in the industry. The Liquid Fuels Sector (Gasoline Station Business)
(52) Under the regulated regime, this sector had stricter requirements. Entities or persons who would like to engage in the gasoline station business had to apply for a Certificate to Operate from the DOE. The DOE was the final approving authority and it also had the authority to revoke licenses or erring industry violators. (53) Under the deregulated regime, the number of service stations increased from 2.793 in 1997 to 3,967 today or about a 42% increase. (54) The problems of the liquid fuels sector are more fully described in Chapter III, paragraphs 19-23. Some of the bad practices described therein includes the:
• Presence of illegal traders and “mosquito” retailers who usually have substandard facilities and inferior products;
• Lack of enforcement of the “Retail Rules” promulgated in 2004. These rules govern the operation of a gasoline station business.
• Emergence of the “bote-bote” method of retailing and gasoline stations with unauthorized aboveground tanks.
(55) Obviously, the illegal and substandard operators compete unfairly with the legitimate players who are at a disadvantage. (56) As mentioned earlier, EO No. 377 effectively watered down the authority of the DOE and spread their functions (when the industry was regulated) to different entities of the government.
53
(57) The proliferation of illegal and unfair practices and their continuance can be traced to the inability of the DOE to exercise police powers or suspending or revoking their licenses and leaves this to the political will of the respective LGUs. Conclusion (58) The emasculation of the powers of the DOE contributes to the inability to eradicate illegal and unfair practices in the liquid fuel sector of the oil industry.

54
55
CHAPTER V RECOMMENDATIONS
Recommendations in this chapter have been made based on the analyses and conclusions in Chapter IV that were drawn from the information on the industry (Chapter II) and data gathered from the consultations (Chapter III). The recommendations must be understood in this context. As such, the Independent Review Committee makes the following recommendations to the Department of Energy (DOE) based on the foregoing conclusions which are restated below. ON PRICING Conclusions 1. The main causes of oil product price increases have been the devaluation of the
peso and the increase in the world price of Dubai Crude, not the Oil Deregulation Law or lack of political will by the government as various sectors claim. (Chapter IV, Paragraph 12)
2. Both Petron and Pilipinas Shell show that they are not making excess profits
while other oil companies mostly show losses. This makes it difficult for government to use suasion in convincing oil companies to reduce their prices. (Chapter IV, Paragraph 15)
Recommendations 1. The DOE should not support or initiate any change in the Policy of the State in
the Downstream Oil Industry Deregulation Act of 1998 (RA No. 8479). This policy states: It shall be the policy of the State to liberalize and deregulate the downstream oil industry in order to ensure a truly competitive market under a regime of fair prices, adequate and continuous supply of environmentally-clean and high-quality petroleum products. To this end, the State shall promote and encourage the entry of new participants in the downstream oil industry, and introduce adequate measures to ensure the attainment of these goals.
2. The DOE should continue to monitor oil prices regularly. It should also inform the
public on a regular basis the results of its monitoring, specifically:
a. DOE must let the public know what it is monitoring and how it is being done;
b. DOE must earn the trust of the public and dispel the impression that it may be acting as spokesperson for the oil companies;
c. If DOE does not have the needed credibility at present, it should enlist the assistance or cooperation of entities or persons who have credibility and in whom the public can trust for whatever information the DOE wishes to release on its monitoring efforts. For example, the DOE may work with academic experts who understand the industry and have conducted studies on oil deregulation or an independent multisectoral price watch group with the participation of consumers; and,
56
d. That DOE be able to persuade oil companies to spread oil increases into smaller price hikes over an extended period and inform the public so that the public understands the reason behind frequent oil price increases.
3. The DOE, working though the government’s representatives in the Petron Board,
should continue to urge the Company to act as “price moderator.” In a deregulated market, price is often set by the low cost producer. Petron, being a refiner and a market leader, suits the role. The action of price moderator should not be done just during price rollbacks but also during price increases.
4. Since the country is practically 100% dependent on imported oil for its
requirements, the DOE should accustom the public that we are now in a regime of high prices as OPEC has increased the price band from US$25 to over US$50. Because of this, the DOE should continue its efforts to:
a. Encourage exploration and development of indigenous energy
resources including oil and gas; b. Encourage the use of alternative energy sources; and, c. Promote programs for the conservation of energy and avoidance of
wastages in the use of oil products (e.g., stricter enforcement of laws governing colorum vehicles).
5. The DOE should spend some time to educate the media about the basics of the
oil industry to provide reporters with a better perspective of the issues for news reporting and analysis. Media’s influence in shaping collective judgments cannot be denied and towards this, helping them acquire the proper fundamentals would be very helpful.
6. It is interesting to note that the land transport group and the sea transport group
have different views on oil deregulation. Land public transport is currently disadvantaged because while their fares are regulated, the cost of their key input, namely fuel, is deregulated. Since there is a time lag before fares are adjusted, public transport’s margins suffer in the interim when oil prices increase. We recommend the adoption of an automatic fare setting mechanism or formula that can adjust fares quickly in response to increases or decreases in fuel prices. This implies of course, that such an automatic fare setting mechanism can also result in lower fares when fuel prices are rolled back.
ON PRICE MOVEMENTS Conclusions 1. Frequent price increases resulted because of escalating world prices and positive
government suasion for oil companies to spread major price increases over a longer period rather than in one big jump. (Chapter IV, Paragraph 29)
2. When products are interchangeable, when market share is the “name of the
game,” and competition is in full swing, we should expect that oil companies’ prices will seem to rise and fall at the same time. This, on its own, does not mean there is a cartel in operation. (Chapter IV, Paragraph 35)
57
Recommendation While the uniform movement of prices, due to the nature of the industry, is not necessarily an indication of cartelization, the DOE should be alert in monitoring the behaviour of oil companies and should be prepared to prosecute erring companies. ON SUBSIDY Conclusion Subsidizing oil prices (something like OPSF) does not work in an era of rising crude prices (what is happening now) because it would entail government resources that it cannot afford, and could be used for better purposes. Furthermore, international bodies like the ADB and UNESCAP are firmly against such practices because they distort relative prices, discourage conservation and fuel efficiency, and encourage overuse of subsidized items. (Chapter IV, Paragraph 25) Recommendation The DOE should not propose or support any program that leads to any subsidy. On the other hand, the committee recognizes the need to alleviate the plight of the poorest sectors of society and some social action needs to be made. For example, government can address the impact of increases in oil prices on agriculture rather than providing subsidized prices of oil products used by farmers for production. However, this is a function of another branch of government and not the DOE’s. COMPETITION Conclusions 1. Deregulation has increased competition in the industry; and, 2. There are both positive and negative effects on competition. The effect on
lowering prices, against what prices would have been if the country were still in a regulated regime, outweighs other effects. (Chapter IV, Paragraph 41)
Recommendation We have seen the benefits of competition and their effect on the pump prices of oil products. DOE should continue to foster safe and fair competition in the oil industry so that market forces can work for the benefit of the consumers by monitoring price increases. ENFORCEMENT Conclusion Removing certain powers from the DOE has contributed to the inability to eradicate illegal, unsafe, and unfair practices in the LPG and liquid fuel (service stations) sectors of the oil industry. (Chapter IV, Paragraphs 51 and 58)
58
The DOE powers referred to was its authority to issue licenses or permits to participants in the industry which was considered in compliance with international industry practices on quality, health, safety and environmental protection – aspects which government cannot afford not to intervene. Recommendations There are many ills in the LPG and liquid fuel sectors that the DOE is unable to correct.
1. There should be an issuance to provide a clearer mandate for the DOE as the lead agency on oil and energy matters and all agencies that have to be involved in the implementation of the law.
2. The DOE should work to increase its police powers and to restore its authority
to issue clearances on compliance with standards on quality, health, safety, and environmental protection to participants in the industry before business permits can be granted by the LGUs concerned.
3. The LGU should be mandated by law to require a valid DOE clearance for the
issuance or renewal of business permits and to effect suspension of business permits it the DOE suspends clearance.
4. The DOE should enhance monitoring and enforcement by:
a. Forging or strengthening its partnership or promote solidarity with other government and private agencies; and,
b. Detailing, instead of deputizing, police under its direct supervision. Specific actions by the DOE could include the following for both sectors:
1. To work for stronger interagency cooperation against illegal activities in the sectors;
2. To be more vigilant and organized in the strict, equitable and effective enforcement of regulations; and,
3. To ensure the personal safety of all inspectors especially in cases where syndicates and persons with strong political/police connections are involved in product pilferage and other illegal operations.
For the LPG sector:
4. To formulate, unify, and update industry standards on quality, integrity and safety of LPG products, facilities, handling and marketing practices; and,
5. To mount a strong lobby for the immediate passage of an LPG Bill that addresses the needs of the sector.
For the liquid fuels sector:
6. To effectively work to curtail smuggling, to close down illegal and substandard gasoline stations, and to work more closely with the relevant LGUs concerned;
7. To ensure that effective competition exists in the service station business by discussing with the oil companies:
59
a. The existence of ruinous competition such as when there are too many service stations located within the same trading area; and,
b. Providing adequate or fair returns to dealers to enable them to survive; non-survival means closure of business and therefore, decrease in competition.
SUMMARY The DOE should continue to support a deregulated regime in the downstream oil industry. It should not support programs for subsidies. It must actively inform the public of the positive gains under deregulation and ensure public awareness of its vigilant monitoring activities towards attaining fair prices. It should promote fair competition and should work towards correcting identified ills in the industry.


![[Type text] Safeguarding, Quality and Review Independent ... · Safeguarding, Quality and Review Independent Reviewing Officers Annual Report 2013 - 2014 . 2 Safeguarding Quality](https://img.pdfslide.net/doc/110x75/5ec5b2ef74b3aa2b4907d771/type-text-safeguarding-quality-and-review-independent-safeguarding-quality.jpg)


![[A] Reviewing the PAST](https://img.pdfslide.net/doc/110x75/56816618550346895dd96a1f/a-reviewing-the-past.jpg)