Embed Size (px)
Citation preview

Report No. 28812 The Republic of Kenya Country Assistance Evaluation May 21, 2004 Operations Evaluation Department
Document of the World Bank

Abbreviations and Acronyms
AG Attorney General CAN Country Assistance Note CAS Country Assistance Strategy CBK Central Bank of Kenya GDP Gross Domestic Product EGG Economic and Governance Group EPSRC Economic and Public Sector Reform Credit ESW Economic and Sector Work GOK Government of Kenya I-PRSP Interim Poverty Reduction Strategy Paper KACA Kenya Anti Corruption Authority KPTC Kenya Posts and Telecommunication Company KRA Kenya Revenue Authority M&E Monitoring and Evaluation MTEF Medium-Term-Expenditure-Framework NGO Non-governmental Organization OED Operations Evaluation Department PER Public Expenditure Review PRSP Poverty Reduction Strategy Paper SAC Structural Adjustment Credit
Director-General, Operations Evaluation : Mr. Gregory K. Ingram Director, Operations Evaluation Department : Mr. Ajay Chhibber Senior Manager, OEDCR : Mr. R. Kyle Peters Task Manager : Ms. Poonam Gupta

Contents
Preface ............................................................................................................................... i
Summary ......................................................................................................................... iii
1. Background ................................................................................................................. 1 May 1998 Country Assistance Note ................................................................. 1 Recent Economic and Social Developments .................................................... 2
2. World Bank Group Products and Services: 1998-2000 .......................................... 3 Strategy ............................................................................................................. 3 Participatory Processes and Donor Coordination ............................................. 4 Strategy Implementation: Economic and Sector Work and Policy Dialogue... 5 Strategy Implementation: IDA Lending ........................................................... 6 Overall Assessment......................................................................................... 11
3. The Development Impact of IDA Assistance.......................................................... 13
4. Conclusions and Recommendations for a Future Bank Strategy .........................15
Text Tables Table 1: Strategy Triggers and Actions .......................................................................... 8
Annex Tables
Annex Table 1: Kenya at a glance ................................................................................. 17 Annex Table 2: Key Economic and Social Indicators, 1991–1999 ............................... 19 Annex Table 3: External Assistance to Kenya .............................................................. 20 Annex Table 4: Selected ESW and CAS List for Kenya, 1980–2000........................... 21 Annex Table 5: OED Ratings for Kenya and Comparator Countries............................ 22 Annex Table 6: Costs of Bank Programs for Kenya and Comparator Countries, FY91–99 ............................................................................. 23 Annex Table 7: Bank's Senior Management, CY91–00 ................................................ 24
Attachments
Attachment A: Government’s Comments on the Draft Kenya CAE Update ............... 25 Attachment B: Summary of Comments Received from the Government and OED’s Response .................................................................................. 31 Attachment C: Kenya: A Note on Recent Developments ........................................... 33 Attachment D: Updated Annex Tables......................................................................... 37 Attachment E: Government’s Comments on A Note on Recent Developments.......... 45 Attachment F: Guide to OED’s Country Evaluation Rating Methodology ................ 49 Attachment G: Chairperson’s Summary ...................................................................... 53


i
Preface
Kenya’s economy is the largest in East Africa with a GDP of about $10.6 billion in 1999. Its GNP per capita is higher than that of its two neighbors, Tanzania and Uganda. But while Uganda’s growth has been impressive in recent years, and Tanzania has adopted structural reforms, Kenya’s performance has lagged. This is despite, political stability, an absence of internal and external conflicts, high domestic revenue collections, substantial donor assistance, and a relatively well-educated labor force.
The World Bank has supported Kenya since FY60. Total Bank commitments between FY60 and FY79 have been about $1 billion and between FY80 and FY00 another $3 billion of which $1.2 billion has been adjustment support.
This Country Assistance Evaluation (CAE) provides OED’s assessment of the developments in Kenya since the last Country Assistance Note (CAN) of May 1998. It focuses on the period, 1998-2000. The first section summarizes the CAN findings and the recent economic and social developments in Kenya. The second section assesses the Bank’s strategy; its relevance and implementation experience (strategy, participatory processes, aid coordination, economic and sector work, policy dialogue, and lending). The third section evaluates the Bank’s development impact on governance. The last section presents the conclusions and the recommendations for a future Bank strategy.
An OED mission visited Kenya between October 3 and 12, 2000. The mission overlapped with the regional mission to Kenya comprising of the Poverty Reduction Strategy Paper (PRSP) team leader (also the country program coordinator), the CAS team leader, and other members. This allowed Operations Evaluation Department (OED) to apprise the country team of the emerging findings in the field, as well as to better appreciate the challenges they were facing in Kenya, from the Government, donors, other stakeholders, and from within the Bank. The country team members were cooperative, open to suggestions, and willing to actively debate sensitive issues.
This Kenya CAE Update was distributed to the Committee on Development Effectiveness (CODE) on March 14, 2001 in anticipation of a planned Country Assistance Strategy (CAS). Subsequently, the CAS was postponed indefinitely and no CODE discussion was held. About a year later, the draft CAE was sent to the Government by the Country Director in early 2002. On June 6, 2002, OED received Government comments on the CAE Update (see attachment A). OED prepared a response and is attached as attachment B.
A new CAS is now in preparation and, because the CAE Update was circulated
some time ago, OED has also prepared a short note on recent developments (attachment C). A revised set of annex tables to update the annex tables in the 2001 CAE Update was also prepared and is attached as attachment D. The Government’s comments on the note on recent developments is attached as attachment E.

ii
This Country Assistance Evaluation was prepared by Ms. Poonam Gupta (Task Manager). This evaluation also benefited from comments of Mr. René Vandendries (Peer Reviewer). Anar Omarova provided research assistance. Betty Casely-Hayford and Agnes Santos provided administrative support.

iii
Summary
The May 1998 OED Country Assistance Note (CAN) concluded that Bank assistance to Kenya had not been effective in promoting reforms. The economic, social, and governance conditions were poorer in the 1990s than they were in the 1970s. The Government of Kenya complied weakly with Bank conditionality under the nine adjustment loans ($1.2 billion) approved during fiscal years 1980-96. According to OED audits of adjustment loans, overestimation by the Bank of what the Government was willing to do was a major issue; the Bank’s conditions for tranche release were also faulted for being over ambitious, and vague. Given weak compliance with Bank conditionality, and the poor governance situation, the note recommended limiting lending to small poverty targeted interventions and shifting focus towards non-lending activities. It concluded that such a strategy should not be undermined by internal pressures to lend.
The Bank’s strategy in 1998 mirrored the recommendations in the CAN. The strategy envisaged Kenya to be in a Low Case lending for the three years FY99-01 with a total lending volume of $150 million. Base Case lending in the $300–$500 million range for the three-year period (including the provision of budget support) would be closely linked to economic governance reform. If the Base Case were triggered, the volume of lending in the first year would be around $100 million, but strong progress in implementation would justify increasing annual lending towards the higher end of the range. The Bank would invest in non-lending services.
According to stakeholders, the Bank’s stance of limiting lending to Kenya (coordinated with other donors) led the Government to appoint the Change Team in July 1999 and to initiate economic governance and policy reforms. These events were viewed by the Bank as a potentially unique opportunity to support the reform minded elements in the Government. In August 2000, the Bank provided a $150 million budget assistance loan (the EPSRC). OED’s assessment is that the conditions for such support, as specified in the 1998 country strategy, were not fully met. Following the EPSRC, the Bank approved three more operations. Total Bank commitments between FY99 and December 2000 have been $362 million of which $322 million were approved in the last six months of 2000. More projects are in the pipeline. Although some progress has been made in the design of economic governance reforms, but not much in terms of effective implementation. Risks to the sustainability of the reform process are high.
The Bank’s portfolio in Kenya has continued to perform poorly. Since October 1997, OED has rated 14 projects, and of these only one was rated as having a satisfactory outcome with likely sustainability and substantial institutional development impact. This represented a satisfactory outcome of 4 percent of evaluated commitments compared to 71 percent in the Africa region in the same period. An internal review of the Kenya portfolio conducted in mid-1999 has led to proactive management of the portfolio. Two projects which had repeatedly been extended despite unsatisfactory performance were closed in the end of FY00. But systemic problems related to overall public expenditure management and to the timely flow of funds to projects in execution still remain. These problems are likely to be magnified in fast-track/emergency projects because of attempts to design quickly. The Bank faces considerable risks in Kenya and at the present juncture

iv
it is difficult to envision how the Bank’s assistance will evolve over a three-year period. Some critical reforms have been reversed and some others remain stalled. To mitigate the risks, three recommendations are offered in this country evaluation.
(1) Timing and Scope of the CAS: Develop a one-year CAS or alternatively submit to the Board a multi-year CAS with the understanding that a yearly progress report or update will be submitted in conjunction with any new lending. Fast-track/Emergency lending should be taken into account when determining the size and modalities of the lending program under both the low and base case scenarios.
(2) Choice of Instruments: (a) Once agreement is reached with the Government on governance reforms, sequence annual single-tranche adjustment credits submitted after implementation of a few clearly defined conditions. These conditions should be widely disseminated as transparency is an important guard against reversibility. (b) Non-lending support should play a larger role in strengthening the sustainability of the budding reforms. For example, by dedicating Bank resources to intensive country dialogue, effective portfolio management, long-term capacity building for public sector reform, and to fostering greater transparency and accountability rather than to continue to develop a lending pipeline.
(3) Monitoring and evaluation: Strengthening the monitoring and evaluation (M&E) framework is particularly important in preparing the CAS for poor performers. In order to improve the M&E in the upcoming CAS, the region should consider proposing a few monitoring indicators linked to intended outputs/outcomes and some additional ones directly tracking Bank inputs. At least one indicator should reflect beneficiary satisfaction with the Bank program and should involve a wide range of stakeholders. Gregory K. Ingram Director-General Operations Evaluation

1
1. Background
May 1998 Country Assistance Note 1.1 In May 1998, OED prepared an evaluation of the World Bank’s strategy in Kenya. The report was discussed by the Board’s Committee on Development Effectiveness in June 1998. The evaluation found that economic, social and governance conditions were poorer in the 1990s than they were in the 1970s, despite Bank commitments in Kenya of nearly designed to provide financing for exporters defrauded the Treasury of some $400 million $3 billion between FY1980-97. The CAN noted that the pre-shipment loan scheme in 1992 (6.5 percent of GDP). The system failed to ensure accountability for this fraud. Corruption in energy sector projects, and financial irregularities identified in reports of the Parliamentary Public Accounts Committee remained unaddressed.
1.2 The Government of Kenya (GOK) complied weakly with Bank conditionality under the nine adjustment loans ($1.2 billion), between FY80-96, frequently backtracking on reforms. For instance, initial progress under Structural Adjustment Credits (SAC I and II) approved in FY80 and FY83 was substantially reversed by 1984-85. The FY86-92 period during which six sectoral adjustment operations were approved was one of stop and go reforms, with reversals and an increasingly unstable macro performance. The FY96 SAC failed to achieve its objectives and the second tranche was cancelled in mid-1998. For over two decades and over nine adjustment operations, disappointing progress was recorded in important reform areas: public expenditure management, reform of parastatals, the financial sector, and the rationalization of public investments.
1.3 Inadequate GOK ownership and overestimation by the Bank of what GOK was willing to do were the major considerations. In this regard, the Bank’s conditions for tranche release were faulted for being over ambitious and vague. Conditions in adjustment operations were too wide ranging straining the capacity of GOK to carry them out. The Bank underestimated the time required to carry out difficult reforms, and placed too great a reliance on a small number of important individuals in the Government. The loose definition of conditions created problems when staff who designed them were replaced by other staff who had to interpret them. During discussions of tranche release, the Bank was perceived to be moving the goal posts.
1.4 Completed OED audits, reviews of implementation completion reports, and OED studies suggested that the factors adversely affecting outcomes had changed little over time. Apart from the factors listed in para 1.3 above, which translated into barely acceptable quality of some major projects, other factors impeding successful outcomes included: (a) deficient Bank supervision and monitoring and evaluation systems preventing mid-stream corrections; (b) inadequate ministerial financial systems contributing to delays in processing of payment authorizations to suppliers, preparation of project and institutional accounts, and in submission of audits; (c) reluctance on the part of GOK and the Bank to consult widely with potential beneficiaries leading to inadequate understanding of beneficiary situations; (d) poor design of the Technical Assistance
2
Component; (e) difficulties in observing IDA guidelines on procurement; (f) weak donor coordination leading to fragmentation of assistance and finally high managerial turnover.1
1.5 By October 1997, 90 loans/credits and $2.4 billion in commitments had been rated by OED. The overall satisfactory outcome ratio of 59 percent for Kenya was lower than for the Africa region and Bankwide. Sustainability was likely in only 20 percent of commitments and only 5 percent of commitments were considered as having substantial institutional development impact.
1.6 The evaluation note concluded that Kenya had a history of weak compliance with Bank conditionality. Even after two decades of Bank assistance, only a few individuals were perceived to support the reform process, whereas elsewhere there was strong opposition; a finding that dated from OED audits of nearly a decade ago. It recommended that until decisive action was taken to improve economic governance, a very limited lending strategy (limited to small poverty targeted interventions to reduce poverty) would be justified. It asked that this strategy not be undermined by internal Bank pressures to lend.
Recent Economic and Social Developments 1.7 In the 1990s the real GDP growth rate has averaged 2.0 percent, below the population growth of 2.7 percent. In fiscal year 1997/98 GDP growth was 2.3 percent; it fell to 1.8 percent in 1998/99 and to 1.4 percent in 1999/2000. In 1997, 52 percent of Kenyans were living in poverty; with declining per capita incomes the percent of poor living in poverty in 1999/2000 has probably increased. Important social indicators have deteriorated. The gross primary and secondary enrollment ratios in 1998 were lower than in 1989. The prevalence of malnutrition has increased, and life expectancy has declined from 57 years in 1991 to 51 years in 1998, largely due to the AIDS epidemic.
1.8 The economic decline and the plight of the poor has been aggravated by severe adverse shocks. Kenya was hit by a drought in late 1997, the El Niño floods in early 1998 and another drought in 2000.
1.9 The availability of a fairly large volume of financial resources has failed to stem the long-term social and economic decline. Government revenue collections averaged 25 percent of the GDP in Kenya in the 1990s, substantially higher than in Uganda (8-9 percent) and in Tanzania (12 percent). Net receipts of official development assistance (ODA) to Kenya from all donors averaged more than $600 million a year in 1991-98. Large commercial debt service payments have contributed to large outflows from Kenya but aggregate estimates show positive net resource flows. Yet, per capita growth has declined in Kenya while Uganda’s has been impressive and Tanzania’s is picking up.
1 The quality assurance group has rated six projects for quality of supervision of which three were rated satisfactory. Of the two projects rated for quality at entry in Kenya, one was rated satisfactory.

3
2. World Bank Group Products and Services: 1998-2000
Strategy
2.1 The 1998 country strategy acknowledged the poor track record of performance and identified weak economic governance as the central challenge facing Kenya. The strategy to improve governance consisted of public sector restructuring, public expenditure management reform, and strengthening of accountability mechanisms. This strategy had been echoed in past Public Expenditure Reviews, the 1996 country strategy and the FY96 SAC. But this was the first time in Kenya when the Bank downplayed lending and emphasized knowledge (analytical and advisory services) support to improve economic governance.
2.2 The shift away from lending in the 1998 strategy was particularly relevant because past Bank strategy pushed lending despite poor portfolio results and underfunded analytical and advisory services. According to OED’s CAN, the undisbursed balance on the IDA portfolio increased from $449 million in FY96 to $640 million in FY98. Resources for Economic and Sector Work (ESW) continued to decline and in FY96 and FY97, only 8 percent and 9 percent of resources, respectively, were allocated for this purpose.
2.3 The strategy’s non-lending program consisted of support for public sector reform, external communication and capacity building, and economic and sector work. Specific areas of assistance included: service delivery surveys in key sectors, which together with Public Expenditure Reviews (PERs), would be repeated annually; conducting an institutional assessment to diagnose weaknesses in the public sector; facilitating the development of a Medium-Term-Expenditure-Framework (MTEF); assisting the GOK in formulating a new Policy Framework Paper; increasing efforts at disclosure and partnerships; and participatory ESW to support sectoral reforms (for example in the water sector, financial sector).
2.4 In lending, the strategy envisaged Kenya to be in the Low Case for FY99-01 in the absence of substantial progress in the reform program. Over the three years the Bank would lend a total of $150 million; a third of the $564 million lent in FY96-98. The $150 million would support poverty targeted projects in partnership with non-governmental organizations (NGOs). No adjustment lending would be provided in the Low Case.
2.5 Base Case lending levels including budget support were directly linked to improvements in economic governance. It would be triggered after evidence of satisfactory macroeconomic management, fulfillment of minimum requirements for economic governance reforms, and improvements in IDA portfolio performance. The focus on economic governance to trigger the Base Case was a first in Bank history but the relevance of the economic governance triggers would have been greater if some of them had focused on actions rather than action plans (table 1). For instance, the strategy asked for a redefinition of the core functions of the Government and not its implementation, improved public expenditure management through MTEF and not the outcomes that these expenditures were expected to achieve.

4
2.6 The trigger for strengthening accountability institutions was not well articulated in the strategy. The minimum requirement in this trigger was the adoption of a comprehensive anti-corruption strategy (including coordination of various efforts by Kenya Anti Corruption Authority (KACA), the Central Bank (CBK) and Kenya Revenue Authority (KRA), and the development of a prevention-focused strategy). It was unclear what “adoption” meant, and what “coordination” efforts were being sought. Strengthening KACA was a strategy that was geared more towards the detection (downstream) rather than prevention (upstream) of corrupt activities. The accountability institutions that can prevent fraud, waste, and abuse of public resources were not mentioned in the strategy for example, the public rights to information, participation of civil society in monitoring and evaluating government performance, and the capacity and effectiveness of the Parliament in demanding accountability for performance from the executive arm of the government. However, the environment at that time was not conducive to a dialogue with the Government on these issues.
2.7 The lending program in the Base Case was expected to be $300-$500 million for the three–year period, FY99-01. If the Base Case were triggered, the volume of assistance in the first year would be around $100 million, but strong progress in implementation would justify increasing annual lending towards the higher end of the range. Key indicators of strong performance would include: timely implementation of the second phase of the Civil Service Reform Program, including ministerial rationalization according to redefined government functions; budget surpluses and elimination of pending bills. The strategy sought to build incentive for sustained effort as progress in the past had been marred with wavering commitment and policy reversals and therefore was highly relevant. The Executive Directors supported this strategy but made it clear that they were looking for actions rather than promises of actions.
2.8 The bulk of lending support in the Base Case would be adjustment lending in support of major public sector reforms. This would be complemented by technical assistance for institutional reforms to improve accountability and financial management across government. Investment lending would be small and primarily poverty focused.
Participatory Processes and Donor Coordination
2.9 The Bank consulted frequently and transparently with stakeholders during strategy preparation but it focused almost exclusively on the non-governmental stakeholders: NGOs, the private sector, labor unions, academicians and donors. The Bank’s primary partners among stakeholders—the Government and Parliamentarians—were largely absent. The Government refused to make the strategy public. Thus, the participants in strategy discussions never received the final official strategy document although draft of an earlier version was made available to them. In hindsight, greater effort should have been made by the Bank to dialogue with the Government. Initially, the Minister of Finance did endorse the Bank’s plans for participation in strategy discussions. However, when the Bank staff’s position shifted from economic governance being one of the issues to the major issue, Government participation, not large to begin with, declined quickly.

5
2.10 Donor consensus that poor economic governance was the most important obstacle to Kenya’s development was facilitated by the Economic Governance Group (EGG) formed by major donors in October 1997 in Kenya. As Chair of the EGG, the Bank led the discussions and coordinated donor thinking on economic governance. The consensus that economic governance was the central strategic issue for the strategy eventually helped to persuade Bank management and the Bank Board about the merits of a Low Case lending strategy. It is unclear if the strategy and the Bank’s stance significantly influenced assistance levels of major bilateral donors. In interviews some donors attributed a decline in their support not to the Bank or to poor economic governance but to budgetary problems at home. Others contended that due to governance concerns their assistance levels had been declining even before the Bank’s Low Case. One major donor maintained its assistance levels to those in previous years and increased it in 2000 in parallel with the Bank.
Strategy Implementation: Economic and Sector Work and Policy Dialogue
2.11 The implementation of non-lending activities foreseen in the strategy was mixed. Service delivery surveys were carried out but their quality has been somewhat questionable because of a lack of involvement of the Central Bureau of statistics and other agencies/ministries, for example, the Ministry of Health and the MTEF Secretariat. The surveys have not been successful in providing insights into how education and health programs are delivered, and into patterns of bribery. An Institutional Development Fund (IDF) Grant supported procurement reform but institutional assessments that could have provided insights into strengthening of the Parliamentary Oversight Committees were not undertaken. A series of Bank sponsored workshops and informal ESW between September and November 1999 on the MTEF helped the Government start the process of MTEF preparation. Ministerial PERs were also done but the quality varied and even in those cases where the quality was good they did not feed into budget preparation as had been expected because of a lack of engagement from the Government. Participatory ESW foreseen in the 1998 strategy in the water sector and in the financial sector was not undertaken.
2.12 Central to the Bank’s non-lending efforts was disclosure and partnerships. A close working relationship with the GOK failed to materialize. This had much to do with a shift towards non-lending but the strategy was seen as assigning all the blame to the Government when the Bank had been a partner in Kenya’s development efforts for more than three decades. In hindsight, the strategy should have transparently assessed the Bank’s own role in Kenya by drawing more liberally on OED’s work and should have included a survey of stakeholder satisfaction with the Bank’s program. The Bank should have involved stakeholders in periodic annual reviews of progress. This would have increased Bank’s credibility in Kenya and may have led to more Government ownership of the strategy.
2.13 After the 1998 strategy, the Government moved forward with reforms. Besides the announcement of the Change Initiative in July 1999, steps taken between October 1998 and August 2000, included the development of a strategic plan for public sector reform, suspension of the sale and transfer of public land, dismissal of several senior

6
public officials for corruption, the appointment of competent and reputable private sector people to an Oversight Board to manage Nairobi City Council, appointment of a new management team in the Kenya Ports Authority, appointment of new Kenya coffee Board members, and financial officers who would be accountable to the treasury.
2.14 The Government formulated the Interim Poverty Reduction Strategy Paper (I-PRSP) and an interim PRSP was published and considered by the boards of the Bank and the IMF in August 2000. The I-PRSP rightly focuses on facilitating sustained economic growth, improving governance and security, increasing the ability of the poor to raise their incomes, and promoting equity and participation. Unlike most other I-PRSPs it provides a detailed description of the poverty profile, and specific indicators to monitor progress towards fulfilling International Development goals. While the I-PRSP lays a sound basis for the development of a full PRSP, there remains a large unfinished agenda. Programs have to be prioritized and costed, and expenditures have to be rationalized to release resources for poverty reduction. Irrespective of consultations and what it may mean for the final PRSP, the integration of the national plan for eradicating poverty into the PRSP, identification of poverty targeted interventions, regional issues, decentralization, and land reform will have to be addressed. A realistic timetable of participation, consultation, and assimilation inside the Government (central and line ministries) and outside (with beneficiaries, donors, NGOs, the private sector) remains to be established. Finally, an important challenge will be for donor interventions, including the Bank’s to fit into the PRSP, and not the other way around.
Strategy Implementation: IDA Lending
2.15 New Lending FY99-01: Between FY99 and December 30, 2000, the Bank committed $362 million. In FY99-00 the Bank continued with its low lending strategy and only $40 million in commitments were approved (El Niño Emergency Project). In FY01, the Bank moved to the Base Case with the Economic and Public Sector Reform Credit, EPSRC ($150 million). HIV/AIDS ($50 million), an Emergency Energy Credit ($72 million), and Decentralized Reproductive Health and HIV/AIDs ($50 million) were also approved.
2.16 Assistance envisaged in the strategy for rural and social sectors in partnership with NGOs and pilots to support financial accountability was not undertaken although it is doubtful if it would have had the desired impact. The Bank’s Arid Lands project (FY96) was prepared with community participation and Early Childhood Development (FY97) involved NGO participation and both have disbursed slowly. Technical assistance for parastatal reform and for institutional development failed to achieve their objectives and eventually closed in June 2000. In hindsight, the strategy could have benefited from an articulation of the appropriate lending instruments to support governance reforms but even two years later this remains a question.
2.17 The El Niño project was identified by the strategy as a Low Case project (to be financed out of the $150 million) because it had already been approved when the strategy was under preparation. At the time of project approval, discussions within the country team revolved around the ineffectiveness of past projects and the lending program to be

7
supported by the $150 million had not yet been defined. The project was perceived by donors and other stakeholders to be hurriedly prepared, with consultations limited to a few GOK officials and selected Bank sector staff.2 They viewed the project as yet another example of non-transparency in the Bank.
2.18 A Change Team was instituted in July 1999 to start addressing long-standing issues. The Bank’s management along with some donors viewed these and other developments (2.13-2.14) as a turning point in GOK commitment to implement structural reforms, reorganize dysfunctional institutions, and make changes in public policy. The Bank felt that this could potentially be a unique opportunity to support reform-minded elements in the GOK. The first tranche ($50 million) of the $150 million EPSRC was released in August 2000 on effectiveness. The approval of this operation signaled that the Bank’s program was in the Base Case.
2.19 This evaluation finds that progress was made in governance reforms after July 1999 and stakeholders generally support the resumption of aid but the economic governance triggers for the Base Case as specified in the strategy were not fully met in August 2000 when the EPSRC was approved (table 1). The number of ministries decreased from 27 to 15 but the number of ministers were not reduced creating confusion in defining the core functions of the Government. Concrete steps had been taken to bring the telecommunications company to the point of bid but privatization has been postponed to early 2001.3 The MTEF was prepared but there was little evidence of improved public expenditure management. Cabinet approval of service for the staff of KACA, the adoption by the cabinet of a bill to strengthen KACA and to make it autonomous of the Attorney General (AG) were interpreted as strengthening of accountability institutions. These were important actions on the part of GOK but strengthening an anti-corruption authority is not synonymous with strengthening of accountability institutions. The latter requires strengthening links in the accountability chain between the legislature and the government, the external auditor, the media, and the civil society. If these links are weak, the anti-corruption authorities/agencies can be susceptible to capture by vested interests.4
2.20 GOK undertook an array of reforms, and prepared the I-PRSP but the CAS benchmarks for strong progress (para 2.7) that would trigger assistance levels above $100 million were not fully met. Retrenchments were supposed to start on July 1, 2000 but the exercise did not get underway until September 2000. The focus has been more on
2 If in the past the GOK had enforced appropriate road maintenance policies, some of the damage to the roads from El Niño which the project was attempting to mitigate could have been avoided or reduced. The Urban Transport Project (FY96) was 95 percent undisbursed in September 1998 in part because it highlighted road maintenance standards for which commitment in the GOK was weak. The region is of the view that no road system in sub-saharan Africa could have withstood the catastrophic rains and that the system in Kenya held up much better than the road systems in Tanzania or Uganda. 3 The region is of the view that developments in the international telecom market affected adversely the bidding process. 4 Access to timely and comprehensible information by citizens, legislators, and an independent media, can create demand for transparency and accountability from the government for its decisions and performance. The region has undertaken an assessment of Kenya’s institutions for financial accountability in October 2000.

8
Table 1: Strategy Triggers and Actions Key areas Strategy Trigger Action OED Assessment
Macro Satisfactory macromanagement.
The IMF staff completed negotiations for a Poverty Reduction Growth Facility (PRGF) arrangement which was approved in July 2000.
Eco.gov
Progress on public sector restructuring; minimum requirements: (i) redefinition of the core functions of government. (ii) Privatization of KPTC Improved public expenditure management through MTEF; minimum requirement: (i) Balanced budget (for central Government) starting in 1998/99 (ii) Non-recurrence of unbudgeted expenditures (as noted in the 1997 PER) Strengthening accountability institutions; minimum requirement is adoption of a comprehensive anti-corruption strategy (including coordination of various efforts by KACA, CBK, and KRA and development of a prevention-focused strategy)
Paper defining core functions of Government issued. Number of ministries and permanent secretaries reduced from 27 to 15. A review process to restructure the ministries has been completed. Government approved retrenchment and civil service reform program. Bill to split KPTC into regulatory agency and two separate entities (Telecom Kenya Ltd-TKL and POSTA) signed into law in November, 1998. Separation was effected in July 1999. Cabinet made decision to sell 49 percent of telecom company to strategic investor. Privatization launched on April 11, 2000, transaction expected to be completed in 3rd quarter of 2000. A review of expenditure of core ministries was undertaken. GOK held a workshop in October 1999 to introduce senior Government officials to principles and objectives of MTEF. The 2000–01 budget is being prepared using MTEF principles. GOK is preparing the MTEF for the period 2000–01 to 2002–03. Fiscal balance excluding grants 0.7 percent of GDP and 0.0 including grants in 1998–99. In 1999–00, 0.9 percent of GDP excluding grants. A circular has been issued to combat potential abuses, and financial control officers appointed by the Treasury to oversee expenditures in each Ministry. Director and Assistant Directors of KACA appointed between April and October 1999. Cabinet approved conditions of service for KACA staff, (90 cases under investigation, 11 in court). A bill to strengthen KACA and make it autonomous of the AG is to be adopted by cabinet in June 2000 and presented to Parliament by October, 2000. KACA has prepared a comprehensive anti-corruption strategy for implementation. The autonomy of the KRA strengthened; KRA Act amended to reduce ex-officio members of the Board from 5 to 2 and to ensure that Board members could be removed only for good reasons; staff members involved in corruption were removed. The Banking Act amended to reduce insider lending and to give CBK power to supervise banking institutions.
The number of ministries were reduced but not the number of ministers creating confusion in defining the core functions of the Government. Privatization of the telecommunications company was postponed to early 2001. The MTEF is a step in the right direction but reallocation of expenditures toward priority areas had not occurred in 2000–01. According to GOK most resources are being used to pay wages and service domestic debt. The authorities need to enforce the rules and regulations, and impose penalties when these are breached. The accountant-general should attest that unbudgeted expenditures have not occurred. IMF and the World Bank have been monitoring unbudgeted expenditures closely since 1997 and their assessment is that they have not occurred. See text. The focus has been on processes. Need to implement an anti-corruption strategy.

9
Table 1 (cont’d.) Key areas Strategy Trigger Action Evaluation of Actions IDA portfolio perfor-mance
Improved disbursement ratios of at least 20 percent per year for investment projects. Reduction in problem projects (no more than 30 percent in 1998–99 and 20 percent in 1999–00 and 2000–01)
Disbursement ratio at end-June 2000 was 21 percent. Government issued a circular to improve flow of funds to projects. Circular to facilitate flow of funds from Special Accounts made operational. As of June 30, 2000 the problem projects were 30 percent.
Disbursement ratio improved and number of problem projects were reduced.
retrenchment per se and less on rationalization based on core functions of the Government. Pending bills or arrears had not been eliminated at the time of EPSRC approval although they were targeted for elimination by December 2000 and a strategy would be developed to prevent their further accumulation.5
2.21 The EPSRC could run into the same problems as those encountered by the Bank’s lending program in the past. These include election risk, over-estimation of Government ownership, releasing tranches on the basis of action plans rather than actions. A recurring theme in interviews in Kenya was that the Bank has not been realistic about timetables for achievement of conditions and has not assessed their social costs. Retrenchment and privatization, two areas addressed in EPSRC came up in several discussions.
2.22 Following the EPSRC, two AIDS projects and an Emergency Energy Project were approved. Neither of the three projects was in the lending program of the 1998 strategy but the region viewed these projects as high priority given the rising toll of the AIDS epidemic and the effects of the drought on energy supplies. Fast-track, emergency, projects raise the issue of the role of the Bank in a crisis in a country with a poor governance environment. There are good reasons to engage in crisis situations but fast-track, emergency lending does not fit well with institutional development. Services to the poor—dependent on an effective participatory monitoring system—risk being compromised by the attempts to design quickly.
2.23 The AIDS project of September 2000 was not viewed favorably by several of those that were interviewed. It was seen as having been prepared without extensive internal Bank consultations, and without consultations with and buy-in from the donors and civil society. A Bank Committee reviewed the September 12, 2000 AIDS project in early June 2000. Appraisal and negotiations were completed by end-July 2000.6
2.24 The effects of the drought on energy would not have been so severe as to require an Emergency Energy Credit (approved in October 2000) if the GOK had followed through with the development objectives supported by the Bank’s previous energy
5 The fiscal program for 2000–01 envisaged an overall deficit on a commitment basis before grants of 1.5 percent of GDP (including grants a small surplus of 0.2 percent of GDP) but the budget that was submitted to the Parliament on June 15, 2000 showed an overall deficit of 2.7 percent of GDP. 6 The project’s quality at entry has not yet been assessed by the Bank’s quality assurance group.

10
project.7 At the end of June 2000, the Energy Sector Investment project of FY97 was 93 percent undisbursed. In FY00 only $1.6 million was disbursed under that project against an estimate of $11 million 11 months ago. The slow rate of disbursements was attributable in part to the lumpiness of two large civil works contracts which had been delayed because of nonfulfillment of policy and institutional reforms sought under the credit. The region expects this credit to be disbursed now that the undisbursed amount has almost been fully committed.
2.25 The Bank has developed a pipeline of projects. If these are approved, the Bank will be at the higher end of the Base Case ($500 million) which should be triggered by reforms even deeper than those identified in the triggers. These projects could potentially weaken commitment to reform within the GOK, and divert attention away from needed portfolio improvements.
2.26 Portfolio Performance: Since October 1997, OED has evaluated 14 additional projects. Only one of the 14 was rated as having satisfactory outcomes with likely sustainability and substantial institutional development impact. The satisfactory rating on this project can be attributed to the reform efforts resulting from the PER and the strategy debates which began in 1997 and continued into 1998.
2.27 Even when project performance has been unsatisfactory, projects have continued to be extended repeatedly. Three unsatisfactory projects that closed in FY99 and FY00 had been extended by 26, 28, and 36 months. In the last three years only one credit, the FY96 SAC was canceled. The Bank has undertaken four consecutive Bank-wide reviews of portfolio performance in the last four years. Concern with Kenya’s poor portfolio performance appropriately led to Kenya being chosen as a priority portfolio improvement program (PIP) country in all four years (FY97, FY98, FY99 and FY00) but the portfolio continued to perform poorly. The 1998 strategy highlighted the fact that the poor portfolio performance was due to continuing governance related issues. An internal review in mid-1999 identified the systemic portfolio performance problem and listed specific actions for some of the more problematic projects. This was followed by a meeting in August 1999 with GOK officials and regular review meetings by the country team in November 1999; January, April, and September 2000 to monitor the needed actions and to identify bottlenecks.
2.28 Portfolio performance ratings have improved. In December 1999, 13 projects were ongoing and of these six were problem projects. Two of the six were closed in June 2000. Another two are no longer on the problem list. As of November 30, 2000, in the 14 projects that are ongoing, the achievement of development objectives and/or implementation progress was rated unsatisfactory in project supervision reports in two projects.
7 The Bank has been asking for energy sector reforms since the 1980s. Conditions in past Bank programs have asked for action plans, completion of studies but they have not led to a restructuring of the utility. An action plan to restructure Kenya Power and Lighting Corporation was agreed as a condition for Board presentation of the Energy Reform Credit of October 2000.

11
2.29 It is unclear whether the improved performance primarily reflects expectations or there is a demonstrated improvement in performance.8 The Government issued a circular in March 2000 to address the timely flow of funds to the project level and the EPSRC includes conditions related to portfolio improvements. Effective implementation of the circular and EPSRC conditions will be important for sustaining improved portfolio results but the Bank on its part will have to pay greater attention to design issues in its projects. In all the 14 OED evaluations since October 1997, design issues were flagged as the most serious problem, including in the evaluation of the Emergency Drought Recovery loan of FY93. Fast-track emergency projects that the Bank has been approving could be particularly susceptible to poor design. Inadequate supervision and reluctance to cancel projects despite evident implementation problems tied for second place in the list of problems flagged by OED.
2.30 The Bank and the GOK would also benefit from stakeholders views on why the Bank’s projects have not led to results. Besides poor project supervision, they cite excessive focus on Nairobi, a lack of provision of information to the communities on the amount of funds that are released for specific projects, and a lack of community involvement in project evaluations even though they are the ultimate beneficiaries and are responsible for repayments of loans to the Bank. A frequently echoed comment was that it does not help to consult if the Bank does not provide information. Communities and NGOs seek partnership from design to implementation stage in Bank projects and transparency in the conditions for Bank support.
Overall Assessment
2.31 The country team’s efforts to develop the institution’s role in Kenya as a Knowledge Bank were hampered. This is because within the Bank the strategy was not in alignment with the Bank’s incentive structure which remains geared towards lending. Thus, the 1998 strategy was relevant but its efficacy has been mixed.
2.32 Within the GOK a shift by the Bank away from lending was interpreted as disengagement. Bank financial support should not have been a major issue in a country which collects almost $3 billion annually in revenues. There were several reasons behind GOK perceptions of Bank disengagement and these reasons hold important lessons for future Bank strategy and dialogue. First, the Bank was primarily viewed by the GOK as a financial institution capable of giving large loans on concessional terms. Second, poverty targeted projects were not well articulated in the CAS. The GOK viewed poverty targeted projects as transferring funds directly to NGOs for which the Government would be held liable. Finally, at the time of second tranche cancellation of the FY96 SAC in mid-1998, the GOK was given the impression that a new budget support credit would be prepared to replace the SAC. The GOK realized in October 1998 that the Bank’s strategy
8 In the current portfolio, one project (age 6.5 years) was 74 percent undisbursed, another project (age 3.3 years) was 92 percent undisbursed, a third project (age 3.4 years) was 72.5 percent undisbursed, and a fourth one (age 4.8 years) was 53.6 percent undisbursed as of October 30, 2000. All were rated satisfactory in supervision reports. Realism in project supervision ratings is particularly important for Kenya because the average net disconnect in the five years, FY95-99, has been 25 percent compared to 11 percent Bankwide and 15 percent for Sub-Saharan Africa.

12
had moved away from lending towards non-lending activities implying that a new credit would not be prepared. They viewed this as a shifting of goal posts.

13
3. The Development Impact of IDA Assistance
3.1 The Government did not own the 1998 strategy but the participatory process sent a powerful signal. It demonstrated the extent of support for economic governance issues, and presented to the Government the combined challenge from the Bank, other donors and the civil society. The stakeholders credit the Bank’s strategy and high level dialogue in early 2000 for the Government of Kenya’s Change Initiative.9 The quality of dialogue between the Bank and the Government has now improved markedly. Currently the Bank staff is able to draw the attention of the Government to a number of pending issues. Government ownership of reforms is perceived to be much greater than in 1998 when the strategy was under preparation. Lack of ownership and poor dialogue are now viewed to be less important in moving forward the reform agenda than lack of resources (both human and financial).
3.2 The GOK undertook reforms for improving economic governance. The Government agreed to submit annually to the Parliament the Government’s governance agenda. Expenditure management and control is being improved. An MTEF has been prepared. The GOK agreed to provide adequate budgetary support to the Controller and Auditor-General, the KACA, Kenya Revenue Authority (KRA), the office of the Attorney General and the Judiciary. Directors and assistant directors of KACA were appointed, the Cabinet approved conditions of service for KACA staff and prepared a comprehensive anti-corruption strategy. The autonomy of KRA was strengthened through legislation. Amendments of the Anti-Corruption Act have been incorporated in the draft Anti-Corruption and Economic Crimes Bill. A bill for the Code of Conduct for all holders of public office was published in the official gazette. The civil society is more active and organized, the Parliament is playing an increasingly active role and on a bipartisan basis lobbies more effectively the Executive for reforms. Corruption scandals get wide coverage in the print media, names are explicitly mentioned and people appear to be wary of being involved in corrupt schemes. The private sector sees improvements in the climate for private investment.
3.3 However, improvements in governance were not sufficient to merit a change in Bank strategy.10 This was because of several factors. (1) The continuing risk of policy reversals as in the past. This risk has now materialized with halting of the sale of Kenya Telecom (a central trigger for Bank assistance in the 1998 strategy), the declaration of KACA as unconstitutional, stripping it of powers to investigate or enforce corruption, and the passage of a bill in the Parliament to cap commercial bank interest rates undoing, liberalization in the financial sector. (2) The impact of the reforms at the central level has not yet been felt at the level of communities. (3) Important laws, bills and circulars
9 The diversity of background of Bank team members was a major factor in conceptualizing the strategy and in using participation as a tool to effect development impact. The full core strategy team consisted of the Country Program Coordinator, a senior resident economist, a Social Development Specialist, a Kenyan economist, a political scientist, a participation specialist and a number of members with extensive knowledge of Kenya. 10 Stakeholders agreed that governance must remain the central focus of the Bank’s strategy in Kenya.

14
expected to be passed have been rejected by the Parliament.11 Stakeholders emphasize not passage (which has not occurred) but transparent implementation of an anti-corruption strategy, of the Code of Conduct, and of an effective Economic Crimes Bill. (4) Expenditure management and control practices have not yet shown significant improvements. (5) Beneficiaries are not yet participating in monitoring and evaluating results which feeds back into Government performance.
3.4 Stakeholders want accountability from the Bank and the GOK for results. Therefore, the Bank should focus not only on the MTEF and public sector restructuring but also on what these tools are supposed to achieve, improved public sector performance in general and service delivery in particular.12
3.5 Many economic governance problems are endemic and cannot be solved in the short-term. Their longer-term success depends on many variables. First, stakeholders unanimously agreed that without political reforms, not much further progress is likely in economic governance. Second, the contracts of Change Team members, the main architects of the Change Initiative were due to expire in June 2001 and the reform-mentality had not spread beyond the six people in the Change Team. In fact since the members are paid higher salaries it has become like a Project Implementation Unit for the Government leading to jealousies in the rest of the civil service, and a deliberate attempt to sabotage its agenda of reform. Third, as in the past, elections in 2002 could slow progress in reforms. Fourth, the effectiveness of KACA could be impeded by endemic corruption in the judiciary and political interference. Fifth, there was a perception among some important members of the civil society that as formal institutions are maturing, informal institutions defined by patronage are not changing and may have in fact become more powerful. Finally, sustainability depends on the extent to which Kenyan citizens see tangible results, improvements in service delivery and prosecutions for corruption. Social tensions are currently high in Kenya.
11 In December 2000, the Code of Conduct bill was rejected, as were the amendments to the economic crimes bill. 12 Heads of important private sector companies feel that their quality of life has deteriorated in terms of communication, roads, availability of water and above all personal security. The communities do not see the results of the Bank’s governance interventions.

15
4. Conclusions and Recommendations for a Future Bank Strategy
4.1 The following conclusions can be drawn. First, the focus on governance in the 1998 strategy was appropriate. Second, some progress was made in economic governance reforms but effective implementation did not occur. Critical reforms have been reversed and others put on hold. Third, systemic problems related to overall public expenditure management and to the timely flow of funds to projects in execution are likely to be magnified in fast-track/emergency projects because of attempts to design quickly. The Bank faces considerable risks in Kenya and at the present juncture it is difficult to envision how the Bank’s assistance will evolve over a three-year period. To mitigate the risks, three recommendations are offered in this country evaluation.
(1) Timing and Scope of the CAS: Develop a one-year CAS or alternatively submit to the Board a multi-year CAS with the understanding that a yearly progress report or update will be submitted in conjunction with any new lending. Fast-track/Emergency lending should be taken into account when determining the size and modalities of the lending program under both the low and base case scenarios.
(2) Choice of Instruments: (a) Once agreement is reached with the Government on governance reforms, sequence annual single-tranche adjustment credits submitted after implementation of a few clearly defined conditions. These conditions should be widely disseminated as transparency is an important guard against reversibility. (b) Non-lending support should play a larger role in strengthening the sustainability of the budding reforms. For example, by dedicating Bank resources to intensive country dialogue, effective portfolio management, long-term capacity building for public sector reform, and to fostering greater transparency and accountability rather than to continue to develop a lending pipeline.
(3) Monitoring and evaluation: Strengthening the monitoring and evaluation (M&E) framework is particularly important in preparing the CAS for poor performers. In order to improve the M&E in the upcoming CAS, the region should consider proposing a few monitoring indicators linked to intended outputs/outcomes and some additional ones directly tracking Bank inputs. Data on these indicators should be available in real time with errors in measurement smaller than the changes expected. At least one indicator should reflect beneficiary satisfaction with the Bank program and should involve a wide range of stakeholders. A first step towards the latter would be involving stakeholders in periodic (annual evaluation group) reviews of progress.


17
Annex Table 1: Kenya at a glance
POVERTY and SOCIAL Kenya
Sub-Saharan
Africa Low-income1998Population, mid-year (millions) 29.3 2,372 627GNP per capita (Atlas method, US$) 350.0 410 510GNP (Atlas method, US$ billions) 10.2 984 322
Average annual growth, 1992-98
Population (%) 2.6 1.9 2.6Labor force (%) 3.3 2.6 2.3
Most recent estimate (latest year available, 1992-98)
Poverty (% of population below national poverty line) 42 .. ..Urban population (% of total population) 31 31 33Life expectancy at birth (years) 51 60 50Infant mortality (per 1,000 live births) 76 77 92Child malnutrition (% of children under 5) 23 .. ..Access to safe water (% of population) 53 .. ..Illiteracy (% of population age 15+) 20 39 41Gross primary enrollment (% of school-age population) 85 97 78 Male 85 103 85 Female 85 86 71
KEY ECONOMIC RATIOS and LONG-TERM TRENDS
1978 1988 1997 1998GDP (US$ billions) 5.3 8.5 10.6 11.6Gross domestic investment/GDP 29.8 20.2 15.4 14.4Exports of goods and services/GDP 28.9 21.9 28.2 24.6Gross domestic savings/GDP 20.0 14.9 8.1 6.7Gross national savings/GDP 17.3 14.6 11.9 10.8
Current account balance/GDP -12.4 -5.5 -3.6 -3.1Interest payments/GDP 1.5 2.8 1.8 1.1Total debt/GDP 41.0 68.2 62.5 60.5Total debt service/exports 14.0 39.0 22.3 18.8Present value of debt/GDP .. .. .. 44.7Present value of debt/exports .. .. .. ..
1978-88 1988-98 1997 1998GDP 3.9 2.3 2.1 1.8GNP per capita 26.9 -.4 7.5 27.5Exports of goods and services 2.0 3.5 -13.5 -5.8
STRUCTURE of the ECONOMY1978 1988 1997 1998
Agriculture 32.1 27.0 23.6 22.5Industry 17.4 16.4 12.9 14.0Manufacturing 10.7 10.0 8.3 9.3Services 37.3 42.3 49.4 49.7
Private consumption 60.5 67.1 75.7 77.2General government consumption 19.5 18.1 16.2 16.1Imports of goods and services 38.7 27.2 35.5 32.3
1978-88 1988-98 1997 1998Agriculture 3.1 1.2 1.2 1.6Industry 3.4 2.3 2.0 1.3Manufacturing 4.6 2.9 1.9 1.3Services 5.1 3.7 3.1 2.1
Private consumption 3.1 2.1 28.1 -4.5General government consumption 2.0 10.8 22.8 11.0Gross domestic investment -2.0 2.5 6.4 5.8Imports of goods and services -3.3 8.6 2.5 -4.2Gross national product 3.9 2.5 2.6 2.7
Development Economics SIMA system, On-the-fly Tables: AAG(Database: GDF & WDI central)Note: This table has not been cleared for offical use.* The diamonds show four key indicators in the country (in bold) compared with its income-group average. If data are missing, the diamond will be incomplete. .
D e ve lo p m e nt D ia m o nd *
Life expectancy
Gro ss P rimaryEnrollm ent
A cc ess to safewater
GNP per capita
Kenya Sub-Saharan A fric a
E co n o m ic ra t io s*
T rade
Inv es tm ent
Indebtedness
Do mest icsav ings
Kenya Sub-Saharan A fric a
G ro wth o f In v e st m e nt a n d G D P ( %)
-20
-10
0
10
20
93 94 95 96 97 98
GDI GDP
G ro wth o f expo rt s a nd im p o rt s ( %)
-20
0
20
40
93 94 95 96 97 98
Expo rts Impo rts

18
Annex Table 1 (continued)
PRICES and GOVERNMENT FINANCE
Domestic prices 1978 1988 1997 1998(% change)Consumer prices 16.9 11.2 12.0 5.8Implicit GDP deflator 3.1 8.5 15.5 10.6
Government finance(% of GDP)Current revenue 22.4 21.1 .. ..Current budget balance 1.22E-05 1.59E-05 5.80E-06 1.43E-07Overall surplus/deficit -4.0 -4.1 .. ..
TRADE 1978 1988 1997 1998(US$ millions)Total exports (fob) .. .. .. .. Food Agricultural raw materials Fuels Ores and metals ManufacturesTotal imports (cif) .. .. .. .. Food Agricultural raw materials Fuels Ores and metals Manufactures
BALANCE of PAYMENTS 1978 1988 1997 1998(US$ millions)Exports of goods and services 1,496 1,872 2,977 2,851Imports of goods and services 2,060 2,332 3,772 3,695Resource balance -564 -461 -795 -844
Net income -188 -345 -232 -173Net current transfers 180 209 483 519Current account balance -659 -471 -377 -363
Financing items (net) 441 429 479 412Changes in net reserves 218 43 -101 -49
Memo:Reserves including gold (US$ millions) 369 297 811 783Conversion rate (DEC, local/US$) 7.7 17.7 58.7 60.4
EXTERNAL DEBT and RESOURCE FLOWS 1978 1988 1997 1998(US$ millions)Total debt outstanding and disbursed 2,174 5,810 6,603 7,010 IBRD 240 973 213 154 IDA 128 673 2,032 2,210
Total debt service 216 738 669 545 IBRD 160 77 74 66 IDA 17 138 95 138
Composition of net resource flows Official grants 93 389 202 197 Official creditors 152 239 -58 9 Private creditors 16,824 66,140 .. .. Foreign direct investment 34 0 20 11 Portfolio equity 0 0 12 4
World Bank program Commitments 172 136 84 123 Disbursements 59 161 84 123 Principal repayments 123 123 123 123 Net flows -64 38 -40 0 Interest payments 0 0 0 0 Net transfers -64 38 -40 0
Development Economics SIMA system, On-the-fly Tables: AAG (Database:GDF & WDI central) 10/23/00
Note: This table has not been cleared for offical use.
Inflation ( %)
01020304050
93 94 95 96 97 98
GDP deflator CPI
Export and import levels (US$ mill.)
0
0.2
0.4
0.6
0.8
1
92 93 94 95 96 97 98
Exports Imports
Current account balance to GDP (%)
-5
-4
-3
-2
-1
0
1
2
92 93 94 95 96 97 98
Composition of 1998 debt (US$ mill.)154
197
6352,076
879
859
IBRD IDAIMF Other multilateralBilateral PrivateShort-term

Ann
ex T
able
2:
Key
Eco
nom
ic a
nd S
ocia
l Ind
icat
ors,
1991
–199
9
19
Indi
cato
r 19
9119
9219
9319
9419
9519
9619
9719
9819
99
Ken
ya
Ave
rage
19
91-1
999
Gha
na
Ave
rage
19
91-1
999
Mad
a gas
car
Ave
rage
19
91-1
999
Tanz
ania
A
vera
ge
1991
-199
9
Uga
nda
Ave
rage
19
91-1
999
GD
P gr
owth
(ann
ual %
) 1.
4-0
.80.
42.
64.
44.
12.
11.
81.
62.
04.
41.
43.
16.
9G
NP
per c
apita
gro
wth
(ann
ual %
) -2
.0-3
.0-6
.02.
03.
03.
00.
00.
00.
0-0
.31.
6-1
.10.
84.
0G
NP
per c
apita
, Atla
s met
hod
(cur
rent
US$
)*
340.
033
0.0
250.
024
0.0
260.
032
0.0
340.
035
0.0
360.
036
0.0
390.
025
0.0
240.
032
0.0
GN
P pe
r cap
ita, P
PP (c
urre
nt in
tern
atio
nal $
)*
885.
689
9.5
868.
990
0.6
957.
399
2.8
982.
696
1.7
975.
097
5.0
1,79
3.3
766.
047
7.9
1,13
6.3
Agr
icul
ture
, val
ue a
dded
(% o
f GD
P)
27.0
26.6
31.5
33.3
31.1
29.6
27.5
26.1
27.0
28.9
38.9
32.9
47.4
47.9
Man
ufac
turin
g, v
alue
add
ed (%
of G
DP)
12
.211
.110
.010
.79.
910
.29.
710
.811
.210
.69.
111
.57.
77.
3Se
rvic
es,
valu
e ad
ded
(% o
f GD
P)
53.0
54.5
51.6
49.4
52.8
54.3
57.5
57.7
56.2
54.1
37.9
53.4
37.4
37.0
Expo
rts o
f goo
ds a
nd se
rvic
es (%
of G
DP)
27
.426
.946
.737
.032
.832
.728
.224
.624
.731
.225
.920
.517
.510
.1Im
ports
of g
oods
and
serv
ices
(% o
f GD
P)
28.6
27.4
41.2
33.9
38.7
37.1
35.5
32.3
32.8
34.2
38.6
28.1
35.2
21.6
Res
ourc
e ba
lanc
e (%
of G
DP)
-1
.3-0
.55.
53.
1-5
.9-4
.3-7
.4-7
.7-8
.1-2
.9-1
2.7
-7.6
-17.
7-1
1.6
Cur
rent
acc
ount
bal
ance
(% o
f GD
P)
-2.7
-2.3
1.4
1.4
-4.4
-0.8
-3.6
-3.1
-5.0
-2.1
-5.4
-7.3
-12.
9-1
0.1
Tota
l deb
t ser
vice
(% o
f exp
orts
of g
oods
and
serv
ices
) 32
.631
.127
.132
.930
.327
.822
.318
.8..
27.9
27.5
16.7
24.7
40.1
Gro
ss in
tern
atio
nal r
eser
ves i
n m
onth
s of i
mpo
rts
0.6
0.4
2.1
2.5
1.2
2.5
2.4
2.4
2.5
1.8
3.2
1.7
2.2
3.4
Gro
ss d
omes
tic in
vest
men
t (%
of G
DP)
17
.913
.717
.716
.417
.516
.815
.414
.415
.316
.120
.711
.222
.015
.7G
ross
dom
estic
savi
ngs (
% o
f GD
P)
16.6
13.2
23.2
19.6
11.6
12.5
8.1
6.7
7.1
13.2
8.0
3.6
4.3
4.2
Infla
tion,
con
sum
er p
rices
(ann
ual %
) 19
.829
.545
.829
.00.
88.
812
.05.
82.
617
.128
.317
.921
.713
.9C
urre
nt re
venu
e, e
xclu
ding
gra
nts (
% o
f GD
P)
24.7
21.6
23.3
25.1
26.0
27.2
....
..24
.614
.58.
9..
..Ex
pend
iture
, tot
al (%
of G
DP)
28
.924
.829
.932
.428
.529
.0..
....
28.9
17.6
17.9
....
Ove
rall
budg
et d
efic
it, in
clud
ing
gran
ts (%
of G
DP)
-2
.6-0
.4-5
.2-6
.0-1
.3-0
.9..
....
-2.7
-2.0
-3.8
....
Popu
latio
n, to
tal (
m)
24.3
025
.05
25.7
826
.51
27.2
227
.92
28.6
129
.29
29.4
127
.12
17.1
013
.37
29.6
219
.18
Popu
latio
n gr
owth
(ann
ual %
) 3.
13.
02.
92.
82.
62.
52.
52.
42.
32.
72.
72.
92.
93.
0U
rban
pop
ulat
ion
(% o
f tot
al)
25.0
25.9
26.8
27.7
28.6
29.5
30.4
31.3
32.2
28.6
36.0
26.5
26.9
12.6
Illite
racy
rate
, adu
lt to
tal (
% o
f peo
ple
15+)
27
.826
.425
.224
.022
.921
.720
.619
.518
.523
.034
.937
.729
.938
.3Sc
hool
enr
ollm
ent,
prim
ary
(% g
ross
) 93
.091
.790
.586
.984
.9..
....
..89
.478
.592
.167
.874
.1Im
mun
izat
ion,
DPT
(% o
f chi
ldre
n un
der 1
2 m
onth
s)
41.0
40.0
42.0
50.0
84.0
77.0
36.0
....
52.9
48.3
65.5
78.4
73.7
Sani
tatio
n (%
of p
opul
atio
n w
ith a
cces
s)
....
77.0
....
....
....
77.0
42.0
15.0
86.2
57.0
Life
exp
ecta
ncy
at b
irth,
tota
l (ye
ars)
..
56.8
....
....
52.0
51.0
..53
.359
.356
.948
.243
.3M
orta
lity
rate
, inf
ant (
per 1
,000
live
birt
hs)
..61
.0..
..74
.0..
74.0
76.2
..71
.368
.295
.087
.698
.9So
urce
: W
orld
Ban
k da
taba
se a
s of O
ctob
er 2
5, 2
000.
*D
ata
for c
ompa
rison
am
ong
coun
tries
refe
r to
1999
.

20
Annex Table 3: External Assistance to Kenya
I. Average Net Receipts from all donors for CY 1980-1998, (US$ million)
Donors 80-90 91-98 1996 1997 1998 Bilateral 567.18 403.59 24.48 288.02 393.59 Multilateral 199.83 201.93 159.27 81.93 127.70 o/w IBRD 18.62 -91.02 -88.50 -73.81 -65.87 o/w IDA 81.88 130.72 145.50 72.29 108.40 o/w ADB 8.02 -0.81 -1.57 -6.45 -16.91 Other 7.33 -1.74 -2.65 -1.29 -2.20 Total 774.34 603.78 181.10 368.66 519.09 Memo item: GDP at market prices (current US$ million) 9,220 10,572 11,579 Source: International Development Statistics CD ROM, 2000 Edition, OECD World Bank database as of October 25,
2000. *Net receipts include net official and net private flows to a recipient country.
II. World Bank Commitments by Sectors for FY 1980-1999, (US$ million)
Sectors 80-90 91-99 1997 1998 1999 Agriculture/Environment 311.7 294.2 52.5 .. .. Education/HNP 147.7 348.1 27.8 .. .. Finance/Industry* 359.7 67.3 .. .. .. Infrastructure** 471.5 290.0 125.0 .. .. Public Sector Management*** 11.0 21.8 .. .. .. Multisector**** 190.4 368.8 26.6 17.5 .. Urban Development/Water Supply & Sanitation 99.8 83.2 .. .. 40.0
Total 1,591.8 1,473.4 231.9 17.5 40.0 Source: World Bank database as of October 25, 2000. * Finance, Industry sectors ** Electric Power, Oil and Gas, Telecommunications, Transportation sectors *** Public Sector Management, Social Protection sector **** Multisector, Private Sector Development, Economic Policy

21
Annex Table 4: Selected ESW and CAS List for Kenya, 1980–2000
Report Title Date Report No.
Economic Reports
Population and Development in Kenya 10 Mar 1980 2775 Kenya – Country Economic Memorandum and Annex on Agricultural
Issues 12 Jun 1981 3456
Growth and Structural Change in Kenya: A Basic Economic Report 31 Aug 1982 3350 Growth and Structural Change in Kenya: A Basic Economic Report,
Annex I: Poverty and Growth in Kenya 31 Aug 1982 3350
Growth and Structural Change in Kenya: A Basic Economic Report, Annex II: Issues in Kenyan Agricultural Development
31 Aug 1982 3350
Growth and Structural Change in Kenya: A Basic Economic Report, Annex III: The Industrialization Process: Growth and Structural Adjustment
31 Aug 1982 3350
Kenya – Country Economic Memorandum 08 Oct 1983 4689 Sector Reports
Kenya: Issues and Options in the Energy Sector May 1982 3800 Kenya: Poverty Assessment 15 Mar 1995 13152
Country Assistance Strategy Documents
Kenya: Country Assistance Strategy 02 Jan 1996 15254 Kenya: Country Assistance Strategy 02 Sept 1998 18391
Note: Excluded from this list are 7 economic reports and 19 sector reports which have not been disclosed at the present time.

22
Annex Table 5: OED Ratings for Kenya and Comparator Countries
Outcome Inst. Devel. Impact Sustainability
Country Total
Evaluated $m o/w
Adjustment $m % Satisf.% Satisf.
Adj. % Substan.% Substan.
Adj. % Likely % Likely
Adj. Evaluated before 10/97 Bank wide 197,357 48,824 73 74 35 41 56 59 Africa 30,032 10,286 60 57 21 21 28 31 Kenya 2,465 1,054 59 66 5 0 20 12 Tanzania 1,860 840 56 69 23 30 37 51 Ghana 1,711 983 78 79 64 71 75 81 Uganda 947 444 29 0 11 0 36 29 Madagascar 800 281 60 70 39 0 40 40 Evaluated after 10/97 Bank wide 81,134 28,028 80 91 45 52 63 74 Africa 10,956 4,223 71 86 29 31 39 51 Kenya 525 105 4 0 4 0 4 0 Tanzania 383 0 61 ... 40 ... 37 ... Ghana 932 181 71 28 42 0 35 28 Uganda 680 405 83 100 34 55 29 49 Madagascar 388 71 73 100 13 0 25 0 All projects evaluated Bank wide 278,491 76,852 75 80 39 46 59 66 Africa 40,988 14,509 63 65 24 24 32 38 Kenya 2,990 1,159 50 61 5 0 16 11 Tanzania 2,243 840 57 69 27 31 37 51 Ghana 2,643 1,164 76 71 55 59 59 73 Uganda 1,627 849 52 48 21 26 33 39 Madagascar 1,188 352 64 76 28 0 34 32 Source: OED database as of 03/31/2000 and World Bank database as of 11/2000.

23
Annex Table 6: Costs of Bank Programs for Kenya and Comparator Countries, FY91–99
Regions/Countries Total costs, $m* Lending completion
costs, $m** Supervision costs,
$m ESW completion
costs, $m*** Costs Bank wide 2,292 979 898 415 Africa 656 254 281 122 Kenya 30 12 15 4 Tanzania 32 11 16 5 Ghana 38 14 18 6 Uganda 31 11 15 5 Madagascar 29 13 13 4
Percentages Bank wide 100% 43% 39% 18% Africa 100% 39% 42% 19% Kenya 100% 39% 49% 12% Tanzania 100% 35% 50% 15% Ghana 100% 38% 47% 15% Uganda 100% 36% 49% 15% Madagascar 100% 43% 43% 14%
Source: World Bank database as of July 6, 2000. * The amount of total costs includes lending completion costs, supervision, scheduled and unscheduled ESW, and dropped project costs. ** The amount of lending completion costs includes lending completion costs and dropped project costs. *** The amount of ESW preparation costs includes unscheduled and scheduled ESW preparation costs. Efficiency Table
Regions/ Countries
Total costs, $m
Number of
projects
Net commitment,
$m
Net commitment for satif. & nonrisky
projects, $m
Average costs per project, $1000
Average costs $ per
$1000 of net commitment
Average costs $ per $1000 of net commitment for
satisfy. & nonrisky projects
Memo Average
project size, $m
Bank wide 2,292 2,229 197,103 144,120 1,028 11.6 16.0 88 Africa 656 564 25,157 16,920 1,164 26.1 38.8 45 Kenya 30 24 1,643 723 1,267 18.5 42.0 68 Tanzania 32 22 1,338 1,050 1,455 23.9 30.5 61 Ghana 38 43 2,073 1,417 881 18.3 26.7 48 Uganda 31 33 1,613 1,479 948 19.4 21.2 49 Madagascar 29 25 731 563 1,176 40.2 52.2 29

24
Annex Table 7: Kenya: Bank’s Senior Management, CY1991–2000
Year Vice President Country Director Chief/Resident Representative 1991 Edward V. K. Jaycox Callisto E. Madavo Peter Eigen 1992 Edward V. K. Jaycox Francis X. Colaco F. Stephen O' Brien 1993 Edward V. K. Jaycox Francis X. Colaco F. Stephen O' Brien 1994 Edward V. K. Jaycox Francis X. Colaco F. Stephen O' Brien 1995 Edward V. K. Jaycox Francis X. Colaco F. Stephen O' Brien
Callisto E. Madavo James W. Adams F. Stephen O' Brien 1996 Callisto E. Madavo Harold E. Wackman Harold E. Wackman
1997 Callisto E. Madavo Harold E. Wackman Harold E. Wackman 1998 Callisto E. Madavo Harold E. Wackman Harold E. Wackman 1999 Callisto E. Madavo Harold E. Wackman Harold E. Wackman 2000 Callisto E. Madavo Harold E. Wackman Harold E. Wackman
Source: World Bank Group Directory 1991–2000.

Attachment A 25


27 Attachment A (continued)

Attachment A (continued) 28

29 Attachment A (continued)

Attachment A (continued) 30

Attachment B 31
Summary of Comments Received from the Government and OED’s Response
Government’s Comments OED’s Response The Government has made positive strides in realizing the reform initiatives contained in the 1998 strategy (e.g., full implementation of the MTEF and public sector reforms, strengthening of oversight institutions, taking measures to privatize key parastatals and tackling the issue of pending bills).
The evaluation acknowledges the steps taken between October 1998 and August 2000 (see paras 2.11 and 2.13). It argues that the economic governance triggers for the Base Case specified in the 1998 strategy were not fully met when the Economic and Public Sector Reform Credit was approved. The MTEF was prepared but was not implemented. The number of ministries was reduced but not the number of ministers. While the anti-corruption authority was strengthened, there was little evidence of implementation of an anti-corruption strategy and in late 2000, the Constitutional Court ruled that the anti-corruption authority was unconstitutional. The new Government is now seeking to make provision for the establishment of an anti-corruption agency in the new constitution that is under consideration. Concrete steps had been taken to privatize the telecommunications company but privatization had been postponed and, as of October 2002, it had still not been privatized. Privatization has now been postponed to 2005/06. The issue of pending bills remained in 2000 and escalated in 2001; the new Government has once again confirmed their intentions to resolve this problem.
The state of affairs in Kenya should be viewed from a broader perspective, i.e., the macroeconomic factors other than restricting the whole phenomenon to governance issues. What is required is an assessment of the overall impact of Bank assistance.
Even viewed from a broad perspective (i.e., macroeconomic), the state of affairs in Kenya has not improved. OED’s 1998 Country Assistance Note (CAN) found that in the first half of the 1990s, average growth had been lower than in the 1970s, the budget deficit averaged 5.4 percent of GDP and reductions in the deficit in the mid-1990s were due to ad hoc measures. The Government’s fiscal program went off-track over the course of 2000/01. Poor expenditure management (a reflection of the overall governance environment in the country), has been a key factor behind Kenya’s unstable macroeconomic performance and the overall unsatisfactory outcome of Bank assistance.
Limiting lending to small poverty targeted interventions is a contradiction of the overall objective of poverty reduction. The failure to develop a lending pipeline, limiting lending and focusing on non-lending activities will compromise the Bank’s objective of poverty reduction and sustained growth and GOK’s intention to reduce poverty through implementing the PRSP.
While Government revenue collections averaged almost 25 percent of GDP per year or almost US$3 billion, average net flows from IDA to GOK were only US$145 million in 1996, US$72 million in 1997, and US$108 million in 1998. Thus, Bank lending by itself is likely to have a limited impact on the overall objective of poverty reduction. The overriding need is for improved public expenditure management. The Bank’s corporate strategy is emphasizing lending and non-lending activities as furthering the objective of poverty reduction in all client countries.
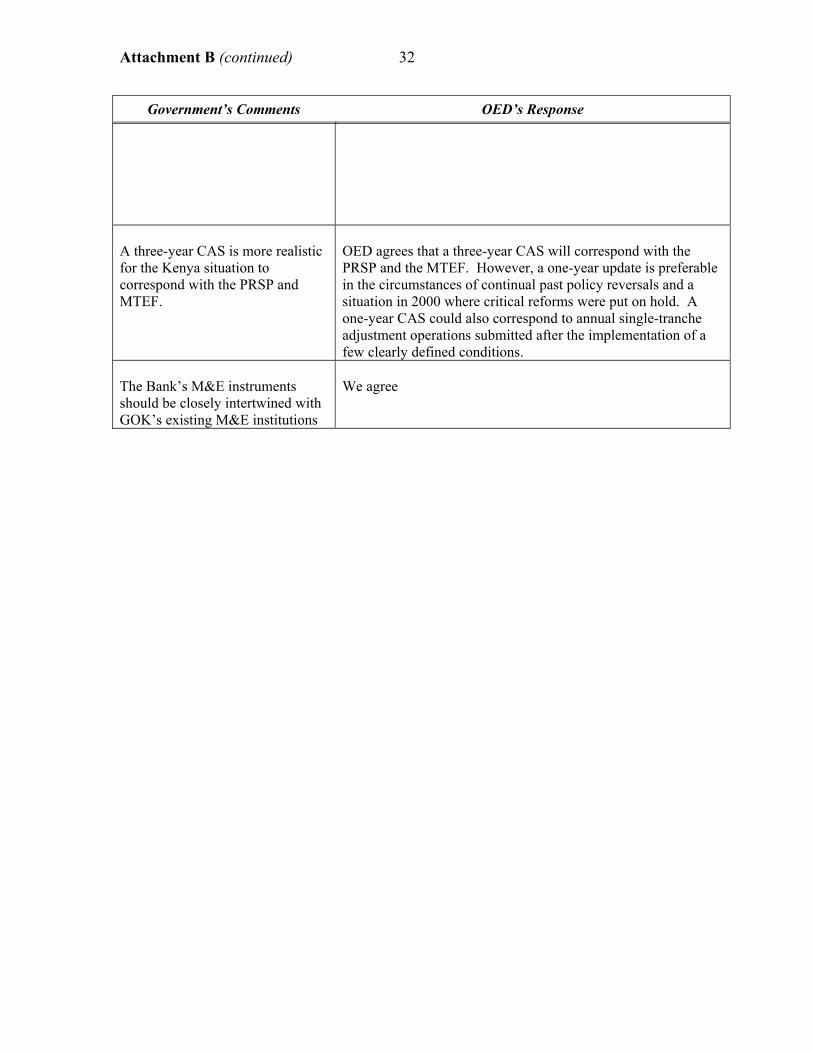
Attachment B (continued) 32
Government’s Comments OED’s Response
A three-year CAS is more realistic for the Kenya situation to correspond with the PRSP and MTEF.
OED agrees that a three-year CAS will correspond with the PRSP and the MTEF. However, a one-year update is preferable in the circumstances of continual past policy reversals and a situation in 2000 where critical reforms were put on hold. A one-year CAS could also correspond to annual single-tranche adjustment operations submitted after the implementation of a few clearly defined conditions.
The Bank’s M&E instruments should be closely intertwined with GOK’s existing M&E institutions
We agree

Attachment C 33
OPERATIONS EVALUATION DEPARTMENT KENYA: A NOTE ON RECENT DEVELOPMENTS
Background 1. OED’s May 1998 Country Assistance Evaluation (CAE) of the World Bank’s strategy in Kenya noted that Kenya had a two-decade history of poor governance and of complying weakly with Bank conditionality in adjustment loans. The Government tended to undertake reforms to obtain quick disbursing assistance from the Bank, only to reverse the reforms or implement them partially. This experience was played out over nine adjustment loans (US$1.2 billion) approved during fiscal years 1980–96. Given Kenya’s past record of backtracking, the 1998 CAE recommended a minimal lending strategy and warned that substantial commitments prior to the finalization of the next CAS (September 1998) could undermine the credibility of the Bank.
2. The 1998 strategy mirrored the recommendations in the CAE. It envisaged Kenya to be in the low case lending scenario for FY99–01 with lending of only US$150 million. Triggers for base case lending (including budget support) were to be closely linked to economic governance reforms. The Executive Directors supported this strategy and made it clear that they were looking for actions rather than promises of actions in the strategy’s triggers.
3. A CAE Update in 2001 assessed the Bank’s implementation of the 1998 strategy and found that while only one project was approved in FY98–00, substantial lending of US$350 million was approved in FY01. Bank perceptions of a unique window of opportunity provided by the appointment of a Change Team in July 1999 led to a budget support operation, the Economic and Public Sector Reform Credit (EPSRC), for US$150 million in August 2000. However, the CAE Update also found that the pre-conditions for the EPSRC specified in the 1998 strategy, were not fully met (e.g., there was a reduction in the number of ministries but not in the number of ministers, privatization of Kenya Telecom was postponed). Projects for AIDS, regional trade facilitation, and the energy sector, which were not in the strategy, were also approved. The Update was critical of these emergency/fast-track projects given Kenya’s governance situation and failure to meet the strategy-triggers for higher lending levels.
4. The Update found that although some progress was made in the design of economic governance reforms (a Medium-Term-Expenditure-Framework–MTEF–, a comprehensive anti-corruption strategy, publication of the Code of Conduct for public officials), there was little progress in implementation. OED cautioned against interpreting government commitment on the basis of action plans rather than actions and on the basis of the “reform-mindedness” of a few individuals in the Change Team.
5. As in the past, soon after the release of the first tranche of the EPSRC critical reforms were reversed (e.g., passage of a bill to cap commercial interest rates, reversing liberalization in the financial sector), and others put on hold (e.g., civil service restructuring, privatization of Kenya Telecom, and enforcement of anti-corruption activities). Two remaining tranches for a total of US$100 million were delayed. The Bank appropriately refrained from formulating a new strategy but engaged in substantial and relevant ESW (see annex table 4). For example, a country report from 2003 highlights the importance of implementation of structural reforms.

Attachment C (continued) 34
6. A new government came into power in December 2002, with a strong commitment to address governance issues and to implement policy measures to revive growth and to reduce poverty. An Anti-Corruption and Economics Bill and a revised Public Officer Ethics Act were quickly passed by Parliament. Reforms of the judiciary have been initiated. Primary education has been expanded. An Economic Recovery Strategy for Wealth and Employment Creation has been prepared. The Government has agreed to do annual public expenditure reviews (PERs). A PER was completed recently and a MTEF budget is being prepared. A consolidated action plan, combining the recommendations of the Country Financial Accountability Assessment and a Public Expenditure Management Assessment, was also completed. A welcome window of opportunity has been opened to re-engage the government in its fight against poverty.
7. World Bank commitments increased sharply in FY03 with the approval of two projects in June 2003 for US$110 million. The Bank has waived conditions on civil service reform and on funding of core poverty programs to release the second tranche of the EPSRC. Disbursement ratios have improved from 12 percent in FY98 to 24 percent in FY03. The share of problem projects decreased from 43 percent in FY98 to 21 percent in FY04, and that of projects at risk from 79 percent in FY98 to 43 percent in FY04. The upcoming strategy is expected to recommend substantial financial support beginning in FY04.
OED Assessment and Recommendations 8. The new Government faces three main challenges. The first challenge will be to sustain implementation of governance reforms which in turn will depend on the speed with which the reform-mindedness in the executive branch in the new government will overcome inertia in institutions that have been defined by patronage for over two decades. The second challenge will be to implement structural reforms in the fiscal, enterprise, and banking sectors which have materialized only slowly (attachment C, table 1). The third challenge will be to successfully complete the constitutional review process.
9. In light of the actions taken by the new Government to date, OED supports the Bank’s re-engagement in Kenya. Two of the three recommendations reached at the time of update are modified. The first recommendation on the timing and scope of the Bank’s strategy is changed to suggest that a multi-year strategy is appropriate but that a periodic review of progress in implementation is essential. The second recommendation on the choice of instruments, lending versus non lending, has also been modified. Since substantial new analytical work has already been undertaken, the part of the recommendation on non lending is considered to have been implemented. Going forward, the choice and timing of Bank lending should be geared towards building incentives for sustained reforms. This could be achieved by backloading commitments, and with triggers for higher lending levels and disbursements of adjustment loans based on actions rather than plans. That conditions should be disseminated widely remains valid as transparency is an important guard against reversibility. The third recommendation that the Bank should pay particular attention to strengthening the monitoring and evaluation framework by involving a wide range of stakeholders, and that at least one indicator should reflect beneficiary satisfaction with the Bank program, also remains valid.
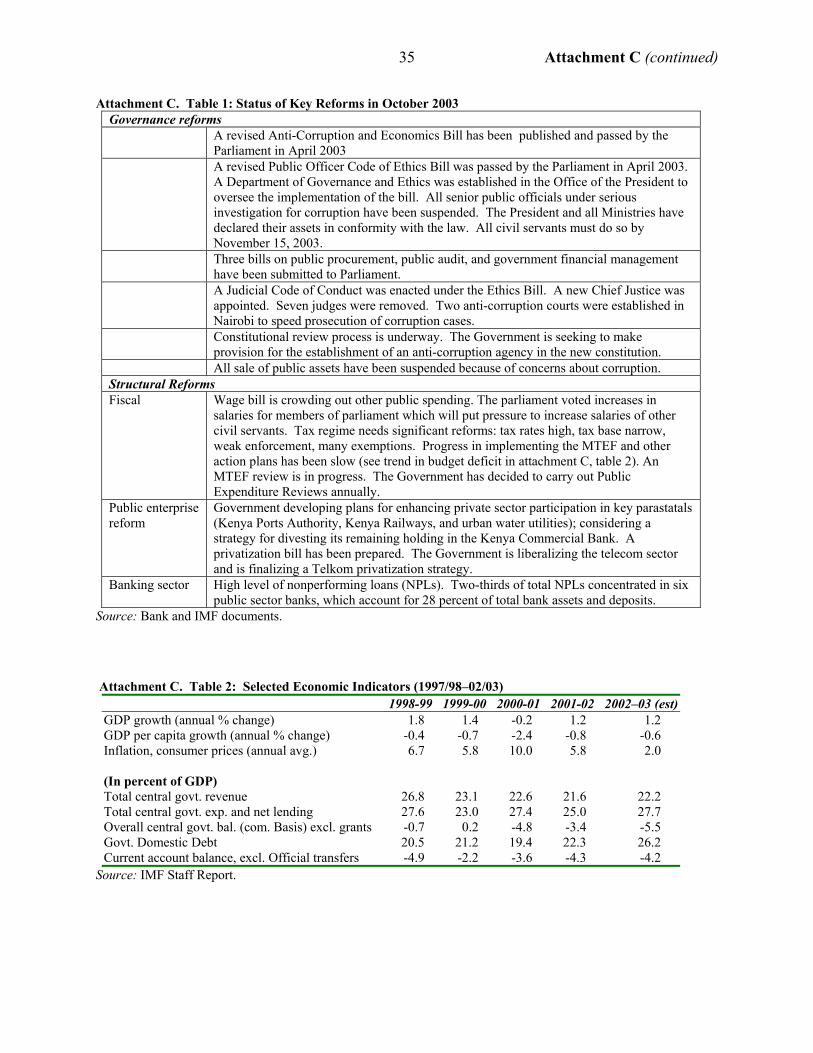
Attachment C (continued) 35
Attachment C. Table 1: Status of Key Reforms in October 2003 Governance reforms A revised Anti-Corruption and Economics Bill has been published and passed by the
Parliament in April 2003 A revised Public Officer Code of Ethics Bill was passed by the Parliament in April 2003.
A Department of Governance and Ethics was established in the Office of the President to oversee the implementation of the bill. All senior public officials under serious investigation for corruption have been suspended. The President and all Ministries have declared their assets in conformity with the law. All civil servants must do so by November 15, 2003.
Three bills on public procurement, public audit, and government financial management have been submitted to Parliament.
A Judicial Code of Conduct was enacted under the Ethics Bill. A new Chief Justice was appointed. Seven judges were removed. Two anti-corruption courts were established in Nairobi to speed prosecution of corruption cases.
Constitutional review process is underway. The Government is seeking to make provision for the establishment of an anti-corruption agency in the new constitution.
All sale of public assets have been suspended because of concerns about corruption. Structural Reforms Fiscal Wage bill is crowding out other public spending. The parliament voted increases in
salaries for members of parliament which will put pressure to increase salaries of other civil servants. Tax regime needs significant reforms: tax rates high, tax base narrow, weak enforcement, many exemptions. Progress in implementing the MTEF and other action plans has been slow (see trend in budget deficit in attachment C, table 2). An MTEF review is in progress. The Government has decided to carry out Public Expenditure Reviews annually.
Public enterprise reform
Government developing plans for enhancing private sector participation in key parastatals (Kenya Ports Authority, Kenya Railways, and urban water utilities); considering a strategy for divesting its remaining holding in the Kenya Commercial Bank. A privatization bill has been prepared. The Government is liberalizing the telecom sector and is finalizing a Telkom privatization strategy.
Banking sector High level of nonperforming loans (NPLs). Two-thirds of total NPLs concentrated in six public sector banks, which account for 28 percent of total bank assets and deposits.
Source: Bank and IMF documents. Attachment C. Table 2: Selected Economic Indicators (1997/98–02/03)
1998-99 1999-00 2000-01 2001-02 2002–03 (est)GDP growth (annual % change) 1.8 1.4 -0.2 1.2 1.2 GDP per capita growth (annual % change) -0.4 -0.7 -2.4 -0.8 -0.6 Inflation, consumer prices (annual avg.) 6.7 5.8 10.0 5.8 2.0 (In percent of GDP) Total central govt. revenue 26.8 23.1 22.6 21.6 22.2 Total central govt. exp. and net lending 27.6 23.0 27.4 25.0 27.7 Overall central govt. bal. (com. Basis) excl. grants -0.7 0.2 -4.8 -3.4 -5.5 Govt. Domestic Debt 20.5 21.2 19.4 22.3 26.2 Current account balance, excl. Official transfers -4.9 -2.2 -3.6 -4.3 -4.2
Source: IMF Staff Report.


Attachment D 37
Updated Annex Table 1: Kenya at a glance 8/20/03
Sub-POVERTY and SOCIAL Saharan Low-
Kenya Africa income2002Population, mid-year (millions) 31.3 688 2,495GNI per capita (Atlas method, US$) 360 450 430GNI (Atlas method, US$ billions) 11.3 306 1,072
Average annual growth, 1996-02
Population (%) 2.3 2.4 1.9Labor force (%) 2.9 2.5 2.3
Most recent estimate (latest year available, 1996-02)Poverty (% of population below national poverty line) .. .. ..Urban population (% of total population) 35 33 30Life expectancy at birth (years) 46 46 59Infant mortality (per 1,000 live births) 80 105 81Child malnutrition (% of children under 5) 22 .. ..Access to an improved water source (% of population) 57 58 76Illiteracy (% of population age 15+) 16 37 37Gross primary enrollment (% of school-age population) 94 86 95 Male 95 92 103 Female 93 80 87
KEY ECONOMIC RATIOS and LONG-TERM TRENDS1982 1992 2001 2002
GDP (US$ billions) 6.4 8.0 11.4 12.1Gross domestic investment/GDP 18.2 13.7 12.8 14.8Exports of goods and services/GDP 25.0 26.9 26.0 25.5Gross domestic savings/GDP 14.5 13.7 4.2 8.7Gross national savings/GDP 11.8 9.7 9.6 13.1
Current account balance/GDP -4.7 -2.3 -2.8 ..Interest payments/GDP 1.3 2.5 0.7 0.5Total debt/GDP 10.0 86.2 49.5 51.1Total debt service/exports 14.5 31.1 13.9 9.8Present value of debt/GDP .. .. 38.7 ..Present value of debt/exports .. .. 146.6 ..
1982-92 1992-02 2001 2002 2002-06(average annual growth)GDP 4.4 2.1 1.1 1.8 3.5GDP per capita 1.0 -0.4 -1.0 -0.2 1.8Exports of goods and services 5.9 1.1 6.8 1.9 6.9
STRUCTURE of the ECONOMY1982 1992 2001 2002
(% of GDP)Agriculture 33.4 26.6 19.0 19.1Industry 19.9 18.9 18.2 18.3 Manufacturing 12.2 11.1 12.5 12.7Services 46.7 54.5 62.9 62.6
Private consumption 67.1 70.2 79.0 81.1General government consumption 18.4 16.1 16.8 10.2Imports of goods and services 28.7 26.9 34.6 31.6
1982-92 1992-02 2001 2002(average annual growth)Agriculture 2.7 1.6 1.2 1.0Industry 4.3 1.6 0.7 1.4 Manufacturing 5.1 1.8 0.8 3.5Services 4.9 2.9 1.3 3.6
Private consumption 5.1 2.2 -4.4 0.0General government consumption 3.6 6.6 4.3 6.2Gross domestic investment 1.5 4.3 2.3 3.8Imports of goods and services 5.7 5.5 -1.2 2.9
Note: 2002 data are preliminary estimates.This table was produced from the Development Economics central database.* The diamonds show four key indicators in the country (in bold) compared with its income-group average. If data are missing, the diamond will be incomplete.
-10-505
1015
97 98 99 00 01 02
GDI GDP
Growth of investment and GDP (%)
Kenya Low-income group
Development diamond*
Life expectancy
Access to improved water source
GNIpercapita
Grossprimary
enrollment
-20
-10
0
10
20
97 98 99 00 01 02
Exports Imports
Growth of exports and imports (%)
Kenya Low-income group
Economic ratios*
Trade
Domesticsavings
Investment
Indebtedness

Attachment D (continued) 38
Updated Annex Table 1 (continued)
Kenya
PRICES and GOVERNMENT FINANCE1982 1992 2001 2002
Domestic prices(% change)Consumer prices .. 27.3 3.9 5.0Implicit GDP deflator 11.7 17.5 11.3 4.9
Government finance(% of GDP, includes current grants)Current revenue 25.1 27.5 22.5 22.4Current budget balance -1.5 1.3 1.5 2.4Overall surplus/deficit -10.2 -3.3 -0.9 -0.9
TRADE1982 1992 2001 2002
(US$ millions)Total exports (fob) 894 1,013 1,732 1,742 Fuel 223 69 115 101 Coffee 227 128 88 97 Manufactures 107 144 274 310Total imports (cif) 1,415 1,866 3,182 3,137 Food 83 156 290 300 Fuel and energy 523 412 810 809 Capital goods 250 411 756 803
Export price index (1995=100) 77 76 74 74Import price index (1995=100) 112 91 100 104Terms of trade (1995=100) 69 84 74 71
BALANCE of PAYMENTS1982 1992 2001 2002
(US$ millions)Exports of goods and services 1,715 2,149 2,966 3,001Imports of goods and services 2,030 2,152 3,939 3,850Resource balance -315 -3 -973 -848
Net income -254 -355 -80 -70Net current transfers 83 68 761 576
Current account balance -305 -180 -318 ..
Financing items (net) 139 255 509 ..Changes in net reserves 167 -75 -191 256
Memo:Reserves including gold (US$ millions) 248 182 1,097 1,174Conversion rate (DEC, local/US$) 10.9 32.2 78.6 78.7
EXTERNAL DEBT and RESOURCE FLOWS1982 1992 2001 2002
(US$ millions)Total debt outstanding and disbursed 641 6,898 5,644 6,207 IBRD 0 656 24 13 IDA 0 1,411 2,263 2,447
Total debt service 258 670 417 299 IBRD 1 159 26 13 IDA 0 16 51 60
Composition of net resource flows Official grants 143 378 252 .. Official creditors -15 155 62 1 Private creditors -136 20 -103 -18 Foreign direct investment 13 6 5 .. Portfolio equity 0 0 0 ..
World Bank program Commitments 0 176 93 2 Disbursements 0 92 116 66 Principal repayments 0 104 58 54 Net flows 0 -12 58 12 Interest payments 1 71 20 19 Net transfers -1 -83 39 -7
Note: This table was produced from the Development Economics central database. 8/20/03
-5
-4
-3
-2
-1
096 97 98 99 00 01 02
Current account balance to GDP (%)
0
1,000
2,000
3,000
4,000
96 97 98 99 00 01 02
Exports
Export and import levels (US$ mill.)
0
5
10
15
20
97 98 99 00 01 02
GDP deflator CPI
Inflation (%)
86313
52688
2447482
1788
Composition of 2002 debt (US$ mill.)
A - IBRDB - IDA C - IMF
D - Other multilateralE - BilateralF - PrivateG - Short-term
Imports

Upd
ated
Ann
ex T
able
2:
Ken
ya –
Eco
nom
ic a
nd S
ocia
l Ind
icat
ors,
1995
–200
2
39 Attachment D (continued)
Se
ries
Nam
e 19
9519
9619
9719
9819
9920
0020
0120
02K
enya
Gha
naTa
nzan
iaU
gand
aG
DP
grow
th (a
nnua
l %)
4.41
4.15
2.08
1.62
1.29
-0.1
61.
101.
801.
794.
274.
326.
19G
DP
per c
apita
gro
wth
(con
stan
t LC
U)
1.78
1.58
-0.4
0-0
.79
-1.0
8-2
.40
-1.0
2-0
.18
-0.5
72.
051.
732.
89G
NI p
er c
apita
, Atla
s met
hod
(cur
rent
US$
) 26
032
035
035
036
035
035
036
033
7.50
350.
0022
7.14
282.
50G
NI p
er c
apita
, PPP
(cur
rent
inte
rnat
iona
l $)
960
990
980
960
970
980
980
990
976.
251,
788.
7548
7.50
1,15
5.00
Agr
icul
ture
, val
ue a
dded
(% o
f GD
P)
31.1
329
.43
27.3
526
.45
23.4
119
.71
18.9
719
.07
24.4
436
.41
45.7
940
.26
Indu
stry
, val
ue a
dded
(% o
f GD
P)
16.0
216
.52
15.4
716
.46
17.8
818
.53
18.1
518
.32
17.1
724
.97
15.1
818
.73
Serv
ices
, etc
., va
lue
adde
d (%
of G
DP)
52
.85
54.0
657
.18
57.0
858
.71
61.7
662
.87
62.6
158
.39
38.6
339
.03
41.0
1Ex
ports
of g
oods
and
serv
ices
(% o
f GD
P)
32.5
932
.79
28.0
424
.86
25.5
126
.26
26.0
325
.52
27.7
038
.40
16.1
111
.74
Impo
rts o
f goo
ds a
nd se
rvic
es (%
of G
DP)
38
.82
36.3
635
.52
32.6
731
.24
36.0
834
.57
31.5
934
.61
53.6
427
.73
23.6
0Pr
ivat
e ca
pita
l flo
ws,
tota
l (%
of G
DP)
..
....
....
....
....
..2.
162.
11C
urre
nt a
ccou
nt b
alan
ce (%
of G
DP)
-4
.43
-0.7
9-4
.31
-4.1
5-0
.85
-1.9
5-2
.79
-4.1
0-2
.92
-6.4
5-7
.41
-6.4
4To
tal d
ebt s
ervi
ce (%
of e
xpor
ts o
f goo
ds a
nd se
rvic
es)
30.3
127
.77
22.3
023
.25
25.8
417
.05
15.3
5..
23.1
222
.92
16.2
916
.47
Gro
ss in
tern
atio
nal r
eser
ves i
n m
onth
s of i
mpo
rts
1.18
2.52
2.42
2.39
2.72
2.73
3.05
3.13
2.52
2.36
4.19
5.56
Gro
ss d
omes
tic sa
ving
s (%
of G
DP)
11
.30
13.1
97.
897.
448.
893.
854.
238.
688.
188.
314.
976.
54In
flatio
n, c
onsu
mer
pric
es (a
nnua
l %)
1.55
8.86
11.3
66.
725.
749.
985.
741.
966.
4929
.23
12.7
24.
20C
urre
nt re
venu
e, e
xclu
ding
gra
nts (
% o
f GD
P)
25.9
627
.06
23.3
525
.79
....
....
25.5
4..
..11
.15
Expe
nditu
re, t
otal
(% o
f GD
P)
28.4
528
.90
24.5
325
.99
....
....
26.9
7..
..19
.14
Ove
rall
budg
et b
alan
ce, i
nclu
ding
gra
nts (
% o
f GD
P)
-1.2
7-0
.90
-0.7
70.
56..
....
..-0
.60
....
-2.7
9U
rban
pop
ulat
ion
(% o
f tot
al)
28.4
629
.38
30.3
331
.31
32.3
233
.37
34.2
935
.25
31.8
435
.71
30.5
713
.68
Illite
racy
rate
, adu
lt to
tal (
% o
f peo
ple
ages
15
and
abov
e)
22.9
821
.90
20.8
219
.74
18.6
517
.58
16.6
615
.75
19.2
630
.39
26.8
034
.57
Scho
ol e
nrol
lmen
t, pr
imar
y (%
gro
ss)
84.9
183
.65
85.9
090
.73
89.4
594
.00
....
88.1
177
.84
64.6
011
2.01
Imm
uniz
atio
n, D
PT (%
of c
hild
ren
unde
r 12
mon
ths)
94
8779
7979
..76
..82
.33
72.6
785
56.8
3Im
prov
ed w
ater
sour
ce (%
of p
opul
atio
n w
ith a
cces
s)
....
....
..57
....
57.0
073
.00
6852
.00
Impr
oved
sani
tatio
n fa
cilit
ies (
% o
f pop
ulat
ion
with
acc
ess)
..
....
....
87..
..87
.00
72.0
090
79.0
0Li
fe e
xpec
tanc
y at
birt
h, to
tal (
year
s)
52.5
7..
49.7
4..
47.6
946
.98
46.2
645
.54
48.1
357
.41
45.4
342
.80
Mor
talit
y ra
te, i
nfan
t (pe
r 1,0
00 li
ve b
irths
) 73
..74
.60
....
7778
..75
.65
60.5
510
3.60
84.1
0Po
pula
tion,
tota
l 26
.69
27.3
628
.04
28.7
329
.42
30.0
930
.74
31.3
429
.05
18.6
832
.48
21.3
1Po
pula
tion
grow
th (a
nnua
l %)
2.50
2.45
2.41
2.37
2.27
2.12
1.96
1.81
2.37
2.17
2.53
3.21
Sour
ce: W
orld
Ban
k da
taba
se a
s of N
ovem
ber 5
, 200
3.

Attachment D (continued) 40
Updated Annex Table 3: External Assistance to Kenya I. Average Net Receipts from all donors for CY1991–2001 (US$ million) Donors 91-98 1999 2000 2001
Bilateral 404.52 344.79 668.87 389.75 Multilateral 194.17 -8.01 185.37 125.28 o/w IBRD -91.02 -58.48 -40.41 -22.46 o/w IDA 130.72 55.09 141.52 80.90 o/w ADB -0.81 -22.97 -14.78 -13.45 Other 0.85 2.74 4.58 5.16 Total 598.69 336.78 854.24 515.03 Memo item: GDP at market prices (current US$ million) 10,527 10,449 11,396 Source: International Development Statistics CD ROM, 2003 Edition, OECD. World Bank database as of
November 5, 2003. II. World Bank Commitments by Sectors for FY1992–2003 (US$ million)
Total Commitment, US$m Sectors 92-97 98-03 1998 1999 2000 2001 2002 2003Agriculture/Environment 174.4 60 60Education/Health Nutrition and Population 348.1 150 100 50Infrastructure a 290 72 72 Public Sector Governance b 21.8 170.2 153.2 16.5 0.5Private Sector Development 97.9 25 25 Economic Policy 153.4 Urban Development/ Water Supply and Sanitation 43.2 40 40 Total 1,128.8 517.2 0 40 0 350.2 16.5 110.5a Includes Energy and Mining. b Includes Social Protection. Source: World Bank database as of November 5, 2003.

Attachment D (continued) 41
Updated Annex Table 4: Selected ESW and CAS List for Kenya, 1990–2003
Report Title Date Report No. Economic Report
Kenya – A Policy Agenda to Restore Growth 18 Aug 2003 25840 Sector Reports
Kenya – Community Driven Development: Challenges and Opportunities
27 Jun 2002 24688
Kenya – Poverty Assessment 15 Mar 1995 13152 Country Assistance Strategy Documents
Kenya – Country Assistance Strategy 02 Sep 1998 18391 Kenya – Country Assistance Strategy 02 Jan 1996 15254
Note: Excluded from this list are 4 economic reports, 10 sector reports, and 9 other country-related reports which have not been disclosed at the present time.

Attachment D (continued) 42
Updated Annex Table 5: OED Ratings for Kenya and Comparator Countries
Outcome Inst. Devel. Impact Sustainability
Country Total
Evaluated $m o/w
Adjustment $m % Satisf.% Satisf.
Adj. % Substan.% Substan.
Adj. % Likely % Likely
Adj. 1991–2002 Bank wide 235,797.5 81,588.0 77.1 79.3 65.3 70.4 43.0 45.0 Africa 8,043.3 3,461.3 63.0 63.8 36.0 37.0 44.3 52.0 Kenya 1,738.3 708.1 46.4 55.1 8.0 0.0 16.2 4.9 Uganda 2,150.7 1,056.9 62.5 67.5 29.0 36.0 48.5 59.5 Tanzania 1,708.8 743.2 67.4 70.1 49.0 49.0 56.2 70.1 Ghana 2,445.5 953.1 71.9 61.1 54.0 56.0 52.3 64.7 Note: The Institutional Development Impact and Sustainability ratings have been in use only since FY89. Hence, the
data for these two ratings for the period before FY91 applies for smaller levels of total net commitment than shown in columns 2 and 3 of the table.
Source: World Bank database as of November 5, 2003.
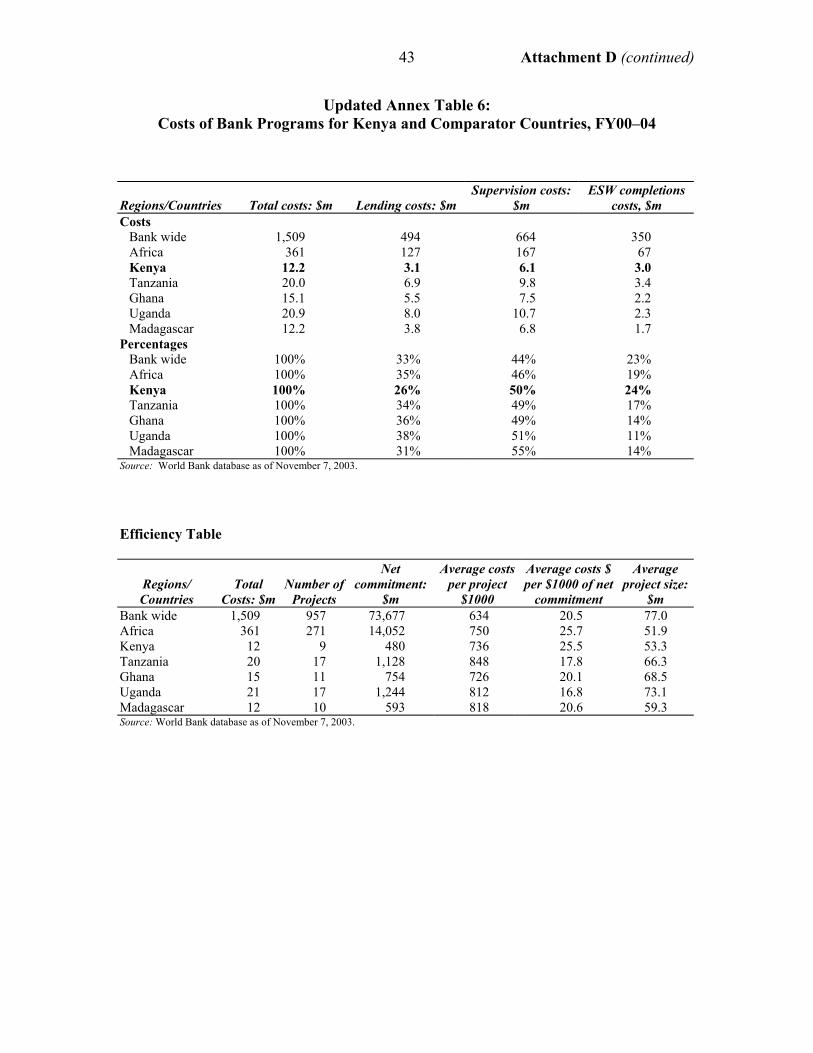
Attachment D (continued) 43
Updated Annex Table 6: Costs of Bank Programs for Kenya and Comparator Countries, FY00–04
Regions/Countries Total costs: $m Lending costs: $m Supervision costs:
$m ESW completions
costs, $m Costs
Bank wide 1,509 494 664 350 Africa 361 127 167 67 Kenya 12.2 3.1 6.1 3.0 Tanzania 20.0 6.9 9.8 3.4 Ghana 15.1 5.5 7.5 2.2 Uganda 20.9 8.0 10.7 2.3 Madagascar 12.2 3.8 6.8 1.7
Percentages Bank wide 100% 33% 44% 23% Africa 100% 35% 46% 19% Kenya 100% 26% 50% 24% Tanzania 100% 34% 49% 17% Ghana 100% 36% 49% 14% Uganda 100% 38% 51% 11% Madagascar 100% 31% 55% 14%
Source: World Bank database as of November 7, 2003.
Efficiency Table
Regions/ Countries
Total Costs: $m
Number of Projects
Net commitment:
$m
Average costs per project
$1000
Average costs $ per $1000 of net
commitment
Average project size:
$m Bank wide 1,509 957 73,677 634 20.5 77.0 Africa 361 271 14,052 750 25.7 51.9 Kenya 12 9 480 736 25.5 53.3 Tanzania 20 17 1,128 848 17.8 66.3 Ghana 15 11 754 726 20.1 68.5 Uganda 21 17 1,244 812 16.8 73.1 Madagascar 12 10 593 818 20.6 59.3 Source: World Bank database as of November 7, 2003.

Attachment D (continued) 44
Updated Annex Table 7: Kenya – Bank’s Senior Management, 1995–2003
Year Vice President Country Director Chief/Resident Representative 1995 Edward V. K. Jaycox Francis X. Colaco F. Stephen O' Brien 1996 Callisto E. Madavo James W. Adams F. Stephen O' Brien Callisto E. Madavo Harold E. Wackman Harold E. Wackman 1997 Callisto E. Madavo Harold E. Wackman Harold E. Wackman 1998 Callisto E. Madavo Harold E. Wackman Harold E. Wackman 1999 Callisto E. Madavo Harold E. Wackman Harold E. Wackman 2000 Callisto E. Madavo Harold E. Wackman Harold E. Wackman 2001 Callisto E. Madavo Harold E. Wackman Harold E. Wackman 2002 Callisto E. Madavo Makhtar Diop Makhtar Diop 2003 Callisto E. Madavo Makhtar Diop Makhtar Diop Source: The World Bank Group Directory 1995-2003.

Attachment E 45
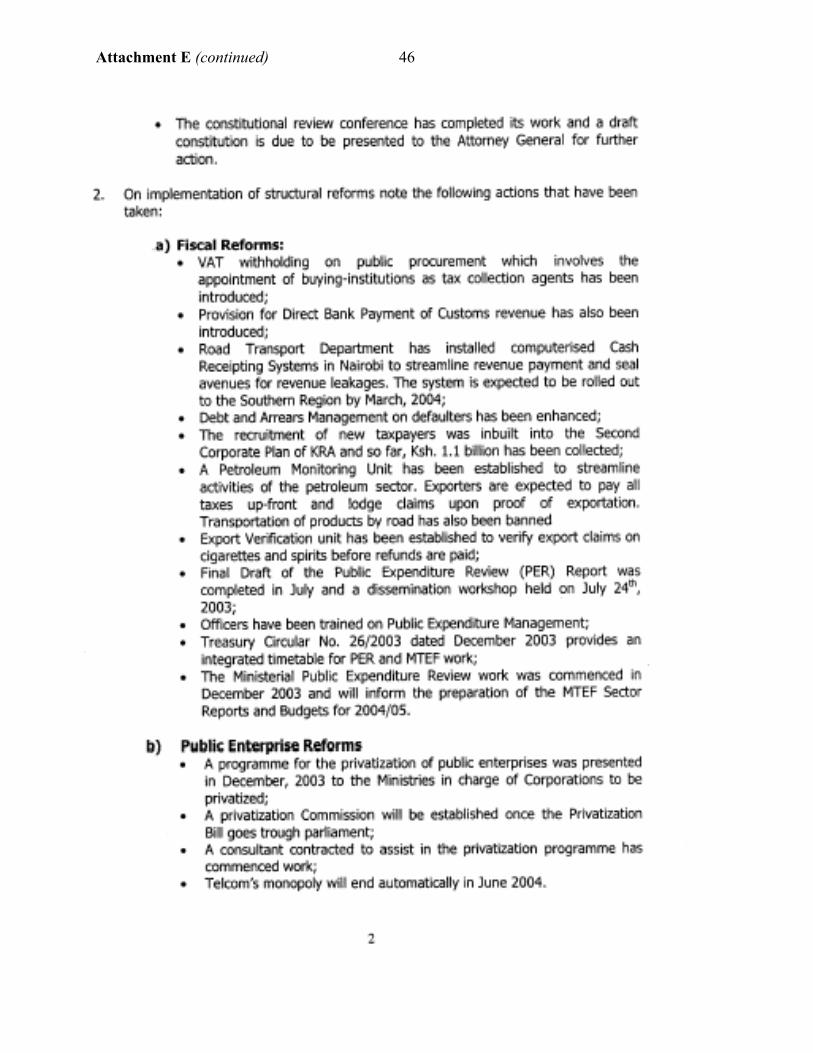
Attachment E (continued) 46

Attachment E (continued) 47


Attachment F 49
Guide to OED’s Country Evaluation Rating Methodology
1. This methodological note describes the key elements of OED’s country assistance evaluation (CAE) methodology.1 CAEs rate the outcomes of Bank assistance programs, not Clients’ overall development progress 2. An assistance program needs to be assessed on how well it met its particular objectives, which are typically a sub-set of the Client’s development objectives. If an assistance program is large in relation to the Client’s total development effort, the program outcome will be similar to the Client’s overall development progress. However, most Bank assistance programs provide only a fraction of the total resources devoted to a Client’s development by donors, stakeholders, and the government itself. In CAEs, OED rates only the outcome of the Bank’s program, not the Client’s overall development outcome, although the latter is clearly relevant for judging the program’s outcome. 3. The experience gained in CAEs confirms that program outcomes sometimes diverge significantly from the Client’s overall development progress. CAEs have identified assistance programs which had:
• satisfactory outcomes matched by good Client development; • unsatisfactory outcomes in Clients which achieved good overall development results,
notwithstanding the weak Bank program; and, • satisfactory outcomes in Clients which did not achieve satisfactory overall results during
the period of program implementation. Assessments of assistance program outcome and Bank performance are not the same 4. By the same token, an unsatisfactory assistance program outcome does not always mean that Bank performance was also unsatisfactory, and vice-versa. This becomes clearer once we consider that the Bank's contribution to the outcome of its assistance program is only part of the story. The assistance program’s outcome is determined by the joint impact of four agents: (a) the Client; (b) the Bank; (c) partners and other stakeholders; and (d) exogenous forces (e.g., events of nature, international economic shocks, etc.). Under the right circumstances, a negative contribution from any one agent might overwhelm the positive contributions from the other three, and lead to an unsatisfactory outcome. 5. OED measures Bank performance primarily on the basis of contributory actions the Bank directly controlled. Judgments regarding Bank performance typically consider the relevance and implementation of the strategy, the design and supervision of the Bank’s lending interventions, the scope, quality and follow-up of diagnostic work and other AAA, the consistency of Bank’s lending with its non-lending work and with its safeguard policies, and the Bank’s partnership activities.
1 In this note, assistance program refers to products and services generated in support of the economic development of a Client country over a specified period of time, and client refers to the country that receives the benefits of that program.
Attachment F (continued) 50
Evaluation in Three Dimensions 6. As a check upon the inherent subjectivity of ratings, OED examines a number of elements that contribute to assistance program outcomes. The consistency of ratings is further tested by examining the country assistance program across three dimensions:
(a) a Products and Services Dimension, involving a “bottom-up” analysis of major program inputs—loans, AAA, and aid coordination;
(b) a Development Impact Dimension, involving a “top-down” analysis of the principal
program objectives for relevance, efficacy, outcome, sustainability, and institutional impact; and,
(c) an Attribution Dimension, in which the evaluator assigns responsibility for the
program outcome to the four categories of actors (see paragraph 4. above). Rating Assistance Program Outcome 7. In rating the outcome (expected development impact) of an assistance program, OED gauges the extent to which major strategic objectives were relevant and achieved, without any shortcomings. Programs typically express their goals in terms of higher-order objectives, such as poverty reduction. The country assistance strategy (CAS) may also establish intermediate goals, such as improved targeting of social services or promotion of integrated rural development, and specify how they are expected to contribute toward achieving the higher-order objective. OED’s task is then to validate whether the intermediate objectives produced satisfactory net benefits, and whether the results chain specified in the CAS was valid. Where causal linkages were not fully specified in the CAS, it is the evaluator’s task to reconstruct this causal chain from the available evidence, and assess relevance, efficacy, and outcome with reference to the intermediate and higher-order objectives. 8. Evaluators also assess the degree of Client ownership of international development priorities, such as the Millennium Development Goals, and Bank corporate advocacy priorities, such as safeguards. Ideally, any differences on dealing with these issues would be identified and resolved by the CAS, enabling the evaluator to focus on whether the trade-offs adopted were appropriate. However, in other instances, the strategy may be found to have glossed over certain conflicts, or avoided addressing key Client development constraints. In either case, the consequences could include a diminution of program relevance, a loss of Client ownership, and/or unwelcome side-effects, such as safeguard violations, all of which must be taken into account in judging program outcome.

Attachment F (continued) 51
Ratings Scale 9. OED utilizes six rating categories for outcome, ranging from highly satisfactory to highly unsatisfactory: Highly Satisfactory: The assistance program achieved at least
acceptable progress toward all major relevant objectives, and had best practice development impact on one or more of them. No major shortcomings were identified.
Satisfactory: The assistance program achieved acceptable progress toward all major relevant objectives. No best practice achievements or major shortcomings were identified.
Moderately Satisfactory: The assistance program achieved acceptable progress toward most of its major relevant objectives. No major shortcomings were identified.
Moderately Unsatisfactory: The assistance program did not make acceptable progress toward most of its major relevant objectives, or made acceptable progress on all of them, but either (a) did not take into adequate account a key development constraint or (b) produced a major shortcoming, such as a safeguard violation.
Unsatisfactory: The assistance program did not make acceptable progress toward most of its major relevant objectives, and either (a) did not take into adequate account a key development constraint or (b) produced a major shortcoming, such as a safeguard violation.
Highly Unsatisfactory: The assistance program did not make acceptable progress toward any of its major relevant objectives and did not take into adequate account a key development constraint, while also producing at least one major shortcoming, such as a safeguard violation.
10. The institutional development impact (IDI) can be rated as: high, substantial, modest, or negligible. IDI measures the extent to which the program bolstered the Client’s ability to make more efficient, equitable and sustainable use of its human, financial, and natural resources. Examples of areas included in judging the institutional development impact of the program are:

Attachment F (continued) 52
• the soundness of economic management; • the structure of the public sector, and, in particular, the civil service; • the institutional soundness of the financial sector; • the soundness of legal, regulatory, and judicial systems; • the extent of monitoring and evaluation systems; • the effectiveness of aid coordination; • the degree of financial accountability; • the extent of building NGO capacity; and, • the level of social and environmental capital.
11. Sustainability can be rated as highly likely, likely, unlikely, highly unlikely, or, if available information is insufficient, non-evaluable. Sustainability measures the resilience to risk of the development benefits of the country assistance program over time, taking into account eight factors:
• technical resilience; • financial resilience (including policies on cost recovery); • economic resilience; • social support (including conditions subject to safeguard policies); • environmental resilience; • ownership by governments and other key stakeholders; • institutional support (including a supportive legal/regulatory framework, and
organizational and management effectiveness); and, • resilience to exogenous effects, such as international economic shocks or changes in
the political and security environments.

Attachment G 53
CHAIRPERSON’S SUMMARY: COMMITTEE ON DEVELOPMENT EFFECTIVENESS
Informal Subcommittee's Report on Kenya Country Assistance Evaluation Update
Meeting of December 8, 2003
1. The Informal Subcommittee (SC) of the Committee on Development Effectiveness met on December 8, 2003 to discuss Kenya: Country Assistance Evaluation (CAE) - An Update. Kenya: A Note on Recent Developments provided useful additional information for the discussion.
2. Background. OED remarked that the CAE Update had been written in 2001 as input to a country strategy that had subsequently been delayed. As a result, the "Note on Recent Developments" has been prepared to provide a current context. This note was accompanied by a response from the Government which was received by OED over a year after the CAE Update had been written. OED further noted that a new Government came to power in Kenya in 2002 which showed a strong commitment to address governance issues and implement policy measures to revive growth and reduce poverty. Thus, OED stated that a window of opportunity existed and recommended Bank re-engagement with Kenya. However, in light of past experience of partial implementation, policy reversals, and a lack of broad ownership of reforms, the Bank's strategy should strengthen incentives for sustainable reform and manage the development effectiveness risks. The Bank's assistance should be based on actions rather than plans and on implementation of reform measures. OED also stressed the importance of transparency and suggested the Bank strengthen the monitoring and evaluation framework by involving a wide range of stakeholders.
3. Management shared OED's concerns with regard to achieving results in the country and noted that the Bank's emphasis was on ownership of the reform process and continuity going forward. Management stressed that an opportunity existed with the new Government and the country strategy had been delayed in order to build ownership. They further noted that it was important for the Bank to strengthen its knowledge base and ESW was currently being carried out in a number of relevant areas that were linked to country strategy preparation. Management also emphasized that the new Government had been engaged in a broad-based consultative and consensus-building process in the country. While agreeing with OED's recommendations on actions rather than plans, Management also noted that many of the actions were complex and would take time to accomplish and the continuity of Bank support was important in this regard. Management commented that the Bank’s evolving country strategy was closely linked to the Government's own results-based economic recovery strategy and thus, had a strong emphasis on monitoring and evaluation. In light of this linkage, Management did not believe it was appropriate to restrict the Bank's lending to single tranche operations or to carry out annual country strategy reviews as suggested in the CAE Update.
4. Main Conclusions. The Subcommittee welcomed the CAE discussion and thanked both OED and Management for their participation. Members generally agreed with the findings and recommendations of the documents and agreed it was appropriate for the Bank to re-engage with Kenya. However, it was also noted that the Bank should proceed with caution given past experience with the country. Members further noted that greater discussion was needed on the positive actions taken by the new Government.
5. The Chair representing Kenya noted that the Government broadly concurred with the CAE Update's findings and conclusions. However, he noted that the CAE Update focused on the previous Government and did not adequately reflect the achievements or actions of the new Government, which took office in late 2002. The new Government had shown itself to be committed to reforms, and governance and economic recovery were central to its mandate. More emphasis on this in the "Note on Recent Developments" would have been important as a signal to the outside world. He added that donors and partners had broadly endorsed the new Government's reform program at a Consultative Group meeting in November 2003.

Attachment G (continued) 54
The main points of the Subcommittee's discussion are summarized below: 6. New Government. The Subcommittee generally agreed that the "Note on Recent Developments" did not send enough of a positive signal with regard to the reform credentials and accomplishments of the new Government. Members suggested that it was important for the Bank to be supportive as the new Government moved forward with a reform program. In general, the Subcommittee agreed with the notion of re-engagement with Kenya through a multi-year commitment and a programmatic approach, a focus on country ownership, capacity building, and results on the ground. 7. Annual Country Strategy Review. Many members questioned the annual country strategy review and suggested that a multi-year country strategy with backloading of financial support and well-defined triggers tied to the Bank's diagnostic work may be more appropriate in cases like Kenya. They stressed that reforms have political costs, and the Bank needed to show a multi-year commitment in a country undertaking such reforms. A multi-year approach focusing on results would allow the Bank to re-engage but with appropriate caution given past experience in the country. Other members commented that though the new Government showed great promise, the Bank's long history in Kenya had shown consistent reversals of reforms, and thus, the Bank needed to proceed cautiously and report back frequently. Management responded that the new country strategy framework called for a mid-term review after two years and this would be appropriate for Kenya. 8. Public Sector Reforms. The Subcommittee emphasized that the Bank should focus on a number of remaining public sector reforms, namely public financial management, public expenditure management, pro-poor spending, and capacity building in the public sector. Management agreed.
Rosemary Stevenson Chairperson CODE Subcommittee

![Republic v Edward Kirui [2010] eKLR REPUBLIC OF KENYA …kenyalaw.org/Downloads_FreeCases/75128.pdf · Republic v Edward Kirui [2010] eKLR . REPUBLIC OF KENYA . ... AT NAIROBI (NAIROBI](https://img.pdfslide.net/doc/110x75/5acfc9f67f8b9a4e7a8d1a22/republic-v-edward-kirui-2010-eklr-republic-of-kenya-v-edward-kirui-2010.jpg)