Embed Size (px)
Citation preview

The Research Journal of Social Science, Jalgaon M.S.
Volume I Issue -11 April. 20131
Volume - I April., 2013 Issue - 11
The Research Journal
Of Social Science
Jalgaon M.S.
Institute of Social Science Researchand Development, Jalgaon 425 002
(India)
www.issrdjalgaon.co.in.
ISSN 0976-061X
RNI REGN NO. MAHENG/2006/22743
International Refereed Journal

The Research Journal of Social Science, Jalgaon M.S.
Volume I Issue -11 April. 20132
Volume - I Issue - 11 April., 2013
- CONTENTS -
1.
2.
3.
4.
5.
6.
7
8
9
The statement and views expressed in the articles are as per author and do not necessarlyreflect those of editor or The Institute of social science Research and Development Jalgaon.
Printed in : 1 Apil, 2013 Printed by - Dr. Shailaja Dongar Bhangale , Institute of SocialScience Research and development Jalgaon, 63/35, Vidyut Colony, Jalgaon 425 002 (India)
1
10
15
20
38
44
53
60
67
ISSN 0976-061 X
The Research Journal of Social Science, Jalgaon M.S.RNI REGN NO. MAHENG/2006/22743
International Refereed Journal
Environmental Degradatopm & Depletion of Mangroves along theCostal Region of Glue of Kutch, Gujrat- Dr. A.A.Ansari
Educational Scenario of Maikal Plateau (MP)- Dr. B. Tembhare , Dr. Devendra K. Bisen
“The nature of circular tour of attractive places in Gadchiroli Districtof Maharashtra State”- Dr. J. V. Dadve
Growth of slums and environmental derioration in the cities of Tirupatiand Vijaywada -A Comparative study- G.Y. Sujatha , Dr. D. Chandrasekhar Reddy , Dr. N. Nagabhushanam
Population growth in Gadchiroli Districts Maharashtra- Prof. Dr. Kishor Y. Thakare
“Spatio-temporal changes in land use and cropping pattern in BramhapuriSubdivision area in chandrapur district, Maharashtra”- Dr. Rajendrakumar K. Dange
Ajanta Caves- Orchestra of Tourism-Dr. B.B. Sonule
Spatial Distribution of Arable Land In Jalgaon District: A GeographicalAnalysis- Mr. S. N. Bharambe, Dr. A. S. Bhole
“Origin and Development of Slums in Bhusawal city Maharashtra”
- Dr. A. S. Bhole

The Research Journal of Social Science, Jalgaon M.S.
Volume I Issue -11 April. 20133
ENVIRONMENTAL DEGRADATION & DEPLETION OF MANGROVES
ALONG THE COASTAL REGION OF GULF OF KUTCH, GUJARAT
- Dr. A.A.Ansari Dept. of Geography, Faculty of Science, The M. S. University of Baroda, Vadodara-390002, Gujarat
INTRODUCTION
Mangrove forests are the salinewater ecosystem of tropical and sub-tropical coastal regions. Mangroves arefound in the intertidal zone, betweenland and sea, an area consisting ofparticulate matters. The wave action andassociated littoral sediments impart aunique environment to the mangroveecosystem. The geomorphological,biological and physio-chemical featuresplay an important role in determiningthe ecological setup of the area. It wasonly in the second half of the 20th
Abstract
The coast of Gujarat accounts for about 21% of India’s coast and has certainpeculiar geophysical characteristics which are different from those found in othercoastal region in the country. Gulf of Kutch has an area of 7350 Sq. Km. Sincelast two decades, the development of various types of industries along the coastalregion such as Mundra port; Kandla and Jamnagar coastal region have poseddanger for the safety and growth of coastal biodiversity. The coastal environmenthas degraded such an extent that depleting mangrove plantation along the coastalregion has made matter worse. Mangroves are tree that help in protecting marinehabitat. Not only do they provide a natural cover against Tsunami or cyclone butalso result in better catches for the fisherman communities in the area. Mangrovesso far checked the salinity ingression in coastal villages and protected farm landfrom turning saline. In present paper, an attempt has been made to study theimpact of environmental degradation and the depletion and destruction ofmangrove plantation and also suggest some measures to control and save it.
Key Words: Coastal Environment, Degradation, Salinity, Mangroves.
century that importance of mangroveforest has been identified. Mangrovesare the integral part of the life andlivelihood of coastal population of India.According to Singh (2000), “Todaymangroves are observed in about 30countries in tropical subtropical regionscovering an area of about 99,300 Sq.Km.”. However, at present there has beenmuch reduction in the acreage becauseof the human interferences. Numerouseconomic activities has caved in this areasuch as agriculture, forestry, saltextraction, tourism, construction of
The Research Journal of Social Science, Jalgaon M.S.
Volume I Issue -11 April. 20134
infrastructure, industrialization, shrimpfarming, sand mining, cattle grazing etc.Reduction in the amount of fresh waterreceived, in the inter-tidal zone have alsodecreased because of construction ofdam and reservoir, thereby, influencingthe beach morphology, which ultimatelyaffect the mangrove richness. As per thereport of Forest Survey of India,mangrove coverage is 4481 Sq. Km.(2001). Gujarat, with 911 Sq. Km. ofmangrove forest cover is second to WestBengal having the acreage of 2081 Sq.Km.AIMS & OBJECTIVES
The study focuses on thechanging status of mangrove in the studyarea and to estimate the extent ofdepletion and degradation of mangroves.The study will also try to findout thereasons hampering the growth ofmangrove and measures needed forimproving their growth.DATABASE & METHODOLOGY
The configuration of this paperis based on the following methodolo-gical steps:• To have an insight on the current
status of mangrove.• To introduce the study area in terms
of physical and ecologicalcharacteristics.
• The study is based on field study andinvestigation of mangrove types andtheir habitats. Required datapertaining to the subject has been
collected from the secondarysources.
• To work out the root causes ofenvironmental degradation of coastalarea and mangrove depletion.
• Certain ecologically andeconomically viable methods tocheck further depletion has also beensuggested, which can help in thesmooth functioning of coastalecological setup
GEOGRAPHICAL OUTLINE OF
STUDY AREA
Kutch district stretches roughlyfrom 22Ú44' to 24Ú41' N latitude and68Ú09' to 71Ú54' E longitude. Kutchwith an area of 45652 sq.km. is thelargest district of Gujarat. It is about23.29 % of the total area of the state.The district has an extensive coast lineof 322 kms., along with the internationalboundary bordering it from the north andwest with Pakistan, on the north east byRajasthan, on the east by Banaskanthadistrict, on the south east by Rajkot, onthe south by Gulf of Kutch and on thewest by Arabian Sea. Kutch is a mosaicof landforms in a way that it has peaks,ranges, hills, plateau, alluvial plains,desert plain, grass land, saline encrustedwaste land, area with laterite soils etc.The Kutch is comprises of the two Ranns(a shallow sea in the past), Kutch plateauin the centre, coastal areas with tidalflats, covered with mangroves in thesouth and saline grassland covering the

The Research Journal of Social Science, Jalgaon M.S.
Volume I Issue -11 April. 20135
transitional zone between Rann andplateau.
PATTERN & PROCESS OF
ENVIRONMENTAL DEGRA-
DATION
Environment, as a point ofconcern, has been the recent paradigmshift in all the studies in general &geography in particular & the reason forit is the extent & pace of environmentaldegradation on the globe. Degradationat large is induced in the environmentthrough the alteration of landusepractices. Concern for the presentmetamorphosis of environment hasresulted in mayhem between man,technology, urbanization and nature ofwhich man & nature are the realsufferers. The post independenceperiod has witnessed significanceeconomic developments in Kutch. But,these developmental acts have beenrestricted to certain pockets. TheIndustrial growth in the region has beenhaphazard and neither confirms auniform growth of the region nor do iseco-friendly. Environmentaldegradation reduces both the quantity &quality of resources, and its impact overhuman being is spontaneous.
Environmentalists and conserva-tionists have declared Kutch to be oneof the most fragile ecosystems in theworld. With large tracts of dry landturning waste due to salinity ingress and
drought like conditions, Kutch is not ina position to meet the demand ofgrowing population and suddenunprecedented growth in industries.During a four day conference on “NaturalResource Conservation, Use &Sustainability in Drylands”, held inDecember 2006, Indira Hirway (Directorat Centre For Development Alternatives)said’ “Kutch is in this vicious circle ofdroughts which starts with ameteorological cause, followed byhydrological scarcity and thenagricultural drought comes, followed byecological drought. It is a high time thatthe government plans an integratedapproach for sustainable use of naturalresources in the region. The neglect hassounded the death knell for the region”.
The link between the environmentand development involves much morethan exploitation of natural resourceonly, preserving & protecting theecological equilibrium of ourenvironment is a vital component notonly of human development but, also forhuman survival. At present the coastalarea of Kutch is confronting &combating with multi dimensionalenvironmental degradation problemsuch as deforestation of mangroves, overexploitation of marine fisheries, forestdeforestation, reduction in wet land area,decrease in pastoral land & landdegradation due to mining and all theseare directly or indirectly related to

The Research Journal of Social Science, Jalgaon M.S.
Volume I Issue -11 April. 20136
growth of population along the coastalarea.
POPULATION
Human being on earth have beenexposed to dual problem, one being therapid growth of population & other isthe pace at which environment is beingdegraded. The coastal regions of Gujaratsustain over a million of populationbeing spread over 2000 coastal villages.These rapidly growing populations ladenwith sophisticated technology &industrial development has had asignificant effects on the ecology & theland use pattern of the coastal and marineenvironment, in the last decade, theaverage growth rate of population in thedistrict was 20-22% (1991). Among thetalukas, coastal Anjar taluka hasrecorded the highest growth rate of38.58 whereas Mundra taluka recordedlowest rate of 8.59. The Decadal growthrate of Lakhpat and Anjar (CoastalTaluka) and Bhuj is greater than thedistrict if taken together. Three talukasi.e., Bhuj, Anjar (Coastal), Mandvicontribute about 86 percent urbanpopulation of the district. The growingpopulations have always been deterrentto the natural resources & environment.
MANGROVES
There are numerous economicaland ecological significance of mangroveas for example; it is used as fire wood,in the form of charcoal, buildingmaterial for houses, boat, source of
fodder, vegetables, supports breeding ofwide range of fishes and other marine andinter-tidal creature, improving themarine ecosystem and biodiversity; andprovides livelihood for hundreds offishermen on the coast and above allMangroves are the natural barriersagainst cyclones, Tsunamis and Salinityingress. Mangroves are also consideredas shoreline stablizers as they stabilizesediments that have been depositedlargely by geomorphological processes.Mangroves also protect the coast fromerosion and damage. They also act asshelter bed between land and sea andprevents strong winds from damagingvegetation and property on land. Theyprevent wind bound salinity fromspreading on land thereby protectingagriculture.
Gujarat state with it longest coastline of 1650 hosts 20% of the totalmangrove forest of the nation. And, theKutch’s mangrove forest accounts for90% (706 sq.km.) of the mangrove forestin the state. The northern coast of Gulfof Kutch is characterized by tidal flatswith good coverage of mangrovesespecially all along the coast of Lakhpat,Abdasa, Mandvi, Mundra, Anjar andBhacahu talukas. As per the report offorest department there has beensubstantial increase in the mangroveforest cover fro 1991 to 1999 i.e, from239 sq. km. to 854 sq. km. However,there was a decline in the year 2001 by148 sq. km. (Table-1, 2 & 3). Marine and
The Research Journal of Social Science, Jalgaon M.S.
Volume I Issue -11 April. 20137
water resources division (2001) has alsoreported significant decline of landcover under mangroves.
There are many reasons for thedecline of mangrove forest as forexample; the forests are not under thecontrol of forest department and therefor are freely used for fodder, fire-woodand for the making of charcoal; there hasoccurred lots of morphological changesin the coastal relief reducing the naturalregeneration and land-use changes interms of increasing number of salt pansand other industries. Also, the landdevoted to pasture area has beendecreasing while the numbers oflivestock have increased 4 fold within aperiod of about 60 years. Early 1996,the grassland areas have been reducedfrom 3.3 million in 1975 to 2.9 millionhectare (1995). There have beenconsiderable changes in the BanniGrassland over the period. Earlier thesame Banni plain was known forElephant grass, which now is devoid ofsimple grasses. Because of the changein the natural ecosystem, trends inarrival of migratory birds have also beenaffected. Such trend has definitelyincreased the pressure on exhistingmangrove forest resource.
Mangroves are widely used in theform of fodder for cattle, apart from thedirect browsing by the camels;mangroves are also cut by the natives tofeed the cattle population. At large, localcommunities are responsible for
indiscriminate use of mangroveresource, partially done out of theirrequirement and secondly, are unawareof the ecological significance ofmangrove forest. Change in themorphological characteristics of coastalarea either by natural processes oranthropogenic activities have led todestruction of forest. Constructions ofreservoir and check dams have alsoaffected the growth by minimizing theamount of fresh water. Clearing ofmangroves of Gulf of Kutch fordevelopmental purpose have a severeeffect. The Bocha island area which wassupposed to be left undisturbed is alsobeing cleared by excavators andbulldozers. The growths of Industries &salt pans have made a largeencroachment on the area, which wereearlier covered by mangroves. The bundswhich, are made around the mangrovesto trap the saline water from the sea hadhas an adverse effect on mangroves andgradually the salt chokes them to death.
The projects like Sanghi andAdani have contributed to large scaledestruction of patches of mangroves andhave disturbed the only means oflivelihood of local people. Howeverthese industries may become boonprovided it adopts the sustainableapproach . In between 1975-82, the Gulfof Kutch has lost 72.5% of mangrovesarea. Mundra region has also lost its 260hectare of mangroves within a period of11 years i.e., (1988-99). Effects of

The Research Journal of Social Science, Jalgaon M.S.
Volume I Issue -11 April. 20138
destruction of Mangroves is manifoldsuch a destablishing of the coastal area,which will again have several indirecteffect on human beings, loss ofBiodiversity, deposition of sedimentson coral through back tidal impact, local
weather Phenomenon etc. Till a decadeago there were a variety of mangroveswhich attracted more than 100 speciesof fishes to the shores. But now onlythree species are found & they areAvacenia marina, Rhizophora & Ceriops.
Table -I Mangrove covers (in Sq. Km.) in Kutch
Sr.. Location Dense Mangrove Sparse Mangrove Total MangroveNo Cover1 Kori and adjoining
creek 306.2 337.1 643.32 Lakhpat taluka 2.3 2.1 4.43 Naliya/Abdasa 16.5 5.0 21.54 Mandvi 0.2 0.1 0.35 Mundra 9.5 9.6 19.16 Anjar 7.5 11.9 19.47 Bhachau 2.0 174 19.4
Total 344.2 383.2 727.4
Table-II Trend of change in Mangrove Habitats at the core area of the
Marine National Park, Gulf of Kachchh
Categories Area in Sq. Km during various years1975 1982 1985 1988 1992-93
Mud flats 7.7 125.6 163.2 81.1 79.6Mangroves 138.5 50 33.4 55.7 61.3Dense Mangroves 58.4 21.8 23.4 28.6 48.6Sparse Mangroves 80.1 28.2 10 27.1 12.7Salt Pans 8.4 13.7 17.5 18.4 25.7
Source: Bahuguna A., HH.B. Chauhan and Shailesh Nayak, 1997(In proceedings of the workshop on integrated coastal zone management, 1997)
Source: Mangroves in Gujarat (2000), GEER Foundation, Gandhinagar
RESTORATION OF MANGROVES
Looking to the economic andecological significance of mangrove,government has undertaken various
measures to restore and regenerate themangroves. Irrespective of the spatialareas of thrust, it is true that governmentinitiated mangrove plantation right from

The Research Journal of Social Science, Jalgaon M.S.
Volume I Issue -11 April. 20139
the 1960’s. up to the During Third FiveYear Plan (i.e.1966) about 13.60 Sq. Km.area was covered under mangroveplantation. Working Plan (1973 –1983)of Kachchh district has documented thisplantation on suitable sites on the muddycreeks along the sea coast (Singh 1999).
Region Year
1984-85 1985-86 1986-87 1987-88 1988-89 1989-90 1990-91 1991-92
Kachchh East 25 25 - - 150 150 50 100
KachchhWest 75 75 - 150 150 150 75 200
Region Year
1992-93 1993-94 1994-95 1995-96 1996-97 1997-98 1998-99 1999-00
Kachchh East 100 100 80 50 50 50 50 94
KachchhWest 200 250 170 150 100 100 100 100
EFFECT OF ENVIRONMENTAL
DEGRADATION & MANGROVE
DEPLETION
The coastal areas have beenexploited by the growing population interms of extraction of corals,development of ports & otherinfrastructures has exploited the coastalareas. All these have led to severesiltation on the off shore reefs, also theeffluent discharge from the industriesand the houses has increased thepressure on ecosystem. Latest availablerecord says that the coral reef area hasdecreased by 43% since 1975. Corals,most fragile ecosystem if conservedproperly can be of great utility formankind. Coral increased the shore
stability & also offers protection fromnatural disasters. Coral like paracyanthusindices has been declared endangered &many like Acropra species is probablyextinct. Coral supports the mangrovethrough providing pedestal for itsgrowth. Removal of mangrove tree along thecoast has led to the sea-ingress in theland area in the immediate vicinity. Thetrees not only prevented sea-ingress,they allowed the coastal water to remainpristine allowing unique sea life tosurvive near the shore. The marginalsites which has front with the Ranns andthe adjoining sea are very much affectedby the sea ingress. North of Lakhpat,Jakhayu Port, Navlakhi , the eastern part
it is also evident from the Table-4.Plantation started merely with an area of100 hectare in 1983-84 and continued forcouple of year and than increased to 300hectare per year from 1988-1994. During1999 it was reduced to 194 hectare, andthe total area covered was 3119 since1981.
Table-III Mangrove Plantation in Gujarat by Forest Department (in ha.)

The Research Journal of Social Science, Jalgaon M.S.
Volume I Issue -11 April. 201310
of Little Rann of Kutch and the west ofKhavda hills, all are affected by theingress of sea. Major threats to marine/ coastal habitats identified in the studyareas are:· Change of hydrology and the flow of
sediments.· Desertification & dune
encroachment along the coastalareas.
· Mangroves destruction throughextensive wood utility.
· Ecological habitat destruction due tocoastal development.
· Damage of coral reefs throughunsustainable fishing practice.
· Removal of corals for the touristtrade.
· Construction of coastal highwayright on beach & dumping of rubbles& rubbish materials seaward..
· Unplanned urban development,disposal of raw materials & untreatedIndustries waste.
Measures To Be Taken To Avoid FurtherDamages To The Environment:
· Development should be in harmonywith the environment.
· All projects must followEnvironment Impact Assessment.
· Industrial Development Corporationmust see that all company mustfollow the norms pertaining toenvironmental issues.
· Reforestation should be initiated inall those areas where mangroves havedepleted. And in future, efforts
should be made to prevent suchdegradation.
· Survey on environmental and socialimpact due to industrialization shouldbe mandatory before giving clearanceto the industries.
· Mundra mangrove reserve forest andthe Jakhau area in the Gulf of Kutchhave been identified as specificmangrove sites by the GujaratEcology Commission, and is in theprocess of restoration.
CONCLUSION:
Beyond any doubt, mangrove isan extremely valuable forest ecosystemfor its ecological functions and itseconomic uses. On the basis of variousground facts and statistics, it can besummerised that the increasingpopulation has had a tremendouspressure on the natural resources andsubsequently on the environment. Atpresent the coastal area of Gujarat isexposed to intense & sustainedenvironmental pressures from a range ofdriving forces which have beenincreasing in their intensity over manydecades. The causes and the rate &extent of change in coastal area is largelyregulated by an integrated complex ofsocio-economic & bio climateinterrelationships. The loss of mangroverepresents the most serious of landusechange and associated ecosystemdamage in the district as well as in wholestate. Its cover reduced by 72.5% in the

The Research Journal of Social Science, Jalgaon M.S.
Volume I Issue -11 April. 201311
Gulf of Kutch during 1975-1980.Mangrove areas and mudflats are lost tosalt pans and other industrial activitiesand also because of increasing salt alongthe coastal areas, seen in the form ofsalt flakes is another cause formangrove depletion. There have beensignificant decline especially in the twoindustrial zones, i.e. Kandla & Navlakhi.However, from 1991 to 2001 there hasbeen constant and substantial increasein the mangrove cover in the district thatis from 239 sq. km. to 706 sq. km. inthe respective year.REFERENCES:
Anon, (1987). Mangroves in India.Status Report. Government of India,Ministry of Environment and Forest,New Delhi.
Chavan, S.A. (1985). Status ofMangrove Ecosystem in Gulf ofKachchh. Paper no. 42, symposium:Endangered Marine Animals andmarine Parks, Marine BiologicalSociety, Cochin, India
Government of India, (1998).Mangrove Atlas of India, SAC, ISRO,Ahmedabad
Gujarat Ecology Commission &Gujarat Institute of Desert Ecology,April 2000, Ranns & Desertification(SEAP, Gujarat), Phase-I report,Bhuj, Kachchh, Gujarat, India.
Gujarat Ecology Commission, March2000, State Environmental ActionProgramme (SEAP), Coastal &
Marine Environment, Phase-I Report,Vadodara, Gujarat, India.
Kohli, Spandan, (2002). “Landuse andenvironmental change due to recentdevelopment in coastal region ofKutch district” (unpublished) Ph.D.thesis, dept. of Geography, M.S.University of Baroda.
Kothari, M.J. and Rao, K.M., (1993).Environmental Impact on Mangrovesof Gujarat, Pp. 51-57.
Kulkarni, D.H. (1957). Utilization ofMangrove Forests in Saurashtra andKachchh. Mangrove Symposium,Calcutta, pp. 30-32
Nayak, Shailesh and Bahaguna, Anjali(2001). Application of RemoteSensing Data to Monitor Mangrovesand other Coastal Vegetation of India.Indian Journal of Marine Sciences,Vol. 30 (4), Dec. Pp. 195-213.
Singh, H.S., (2000) “Mangroves inGujarat: Current status and strategyfor conservation” Gujarat EcologicalEducation and Research (GEER)Foundation, Gandhinagar.
Thivakaran, G.A. et al (2002).Vegetation Structure of KachchhMangroves, Gujarat, Northwest Coastof India. Indian Journal of MarineSciences, Vol. 32 (1), March 2003.Pp. 37
The Research Journal of Social Science, Jalgaon M.S.
Volume I Issue -11 April. 201312
EDUCATIONAL SCENARIO OF MAIKAL PLATEAU (MP)
Dr. B. Tembhare Dr. Devendra K. Bisen
Asst prof. Geography Asso. prof. GeographyR.D.Govt.P.G. College Mandla (MP) M.B.Patel College Deori Gondia (MS)
INTRODUCTION
Literacy is a considered as anindicator for development and quality oflife of a human being became he is boththe producer and consumer ofresources. Development of resources isan parameter of the measurement of thedevelopment of a country which isentirely dependent of the literacy of thepopulation. Literacy of people is a mustif the process of development is the anyregion/country has to be at per globally.In other words Literacy and educationattainment are powerful indications ofsocial and economic development of theany region As per the census 2011,percentage of illiterate population inIndia. MP and study region are 33.66,36.00 and 40.39 percent respectively.while the female illiteracy is verypathetic in the respective areas.
STUDY AREA
The Maikal Plateau region,presently a tribal area of MadhyaPradesh, is situated in the south’s eastpart of Madhya Pradesh. The region liesalmost entirely in the catchment of theriver Narmada and its tributariesgeographically the study region extendsbetween 22Ú12', to 23Ú12' North
latitudes & 80Ú18' to 81Ú51' eastlongitudes. According to the cencus thestudy region accommodates 887 871persons out of which 440341 are maleand 447530 are female of the totalpopulation 89.72 percent its totalpopulation is the rural one. while 57.20%of the total population is tribal one.Where literacy ratio for the male andfemale is 74.38 and 45.30 percentrespectively. Even today after 63 yearsof Independence Day of the country40.20 percent of the total population and54.61 percent the female population isstill cursed with illiteracy
OBJECTIVES OF THE STUDY
The main objectives of this workare study the literacy level in the studyregion. A part from this the workhighlights the scenario of the level ofliteracy schooling among the childrenand attempts to improve the level ofliteracy rate qualitatively.
RESEARCH METHOLODY AND
SOURCES OF DATA
To accomplish the purposecensus reports of 1991 and 2011 havebeen obtained from the NIC while Noof students studying class wise has beenobtained from the DSO Mandla General

The Research Journal of Social Science, Jalgaon M.S.
Volume I Issue -11 April. 201313
Statistical methods have been used foranalysis of objectives of study topresent transparency
STATUS OF LITERACY TRENDS IN
MAIKAL PLETEAU
Literacy is an important indicatorof development among the any region.Despite being made serious andenormous attempts by the governmentand NGO’s for the last 63 years in thestudy region the literacy in thebeginning of the study period was 22.20percent only which more to 59.61percent by an increase of 62.96 percenttill the end of the study period. Theanalysis of the above facts reveals that77.80 percent that is less than three forthof the population was illiterate in thebeginning of the study period. While40.39 percent population still remainsilliterate by the end of the study perioddespite putting in several attempts. Theterrible truth of above facts has beenpresented in table No .1
EDUCATIONAL STATUS OF MALE
POPULATION
Evaluation of the educationalstatus of any region or country can bemore realistic if it is based on the no ofstudent completing their middle,secondary or higher studies amongst theregistered students at the primary level,in place of the literacy ratio. Adoptingthis realistic consideration it has beenfound that only 44.36, 18.02, and 4.12
percent students and higher levels at themiddle secondary and higher levelrespectively Analysis of the above factsdepicts that 55.64, 81.98, and 95.88percent student amongst the registeredat the primary level leave their studiesat the middle secondary and higher levelsof their education respectively It meansevery half of the students leave theirstudies at the very next level Minuteanalysis of the above facts has beenpresented in table no 2
EDUCATIONAL STATUS OF
FEMALE POPULATION
Women / girls are the uniquecreation of creator under whom thefamily/ society flourishes. theirimportance has been manifested well byNepolean the great “Give me an able
Mother, I will give you an able
nation” As per the studies of the womenand child development development ,Govt of India only 06 girls out of 10 girlsadmitted in class Ist standard reach classVth standard. That is 40% girls dropoutat the primary level itself. Analysis ofthe corresponding girls/ womenseducation in the study area shows thatonly 37.32 11.0 and 3.25 percent girls’students study at the middle secondaryand higher levels respectively. Thesefacts reveal that 62.88, 59.0 and 96.75percent of girls registered at the primarylevel leave their studies at middlesecondary and higher levels respectively.The minute observation of the above

The Research Journal of Social Science, Jalgaon M.S.
Volume I Issue -11 April. 201314
facts shows that 62.68, 26.22 and 7.87percent girls dropout when they go tomiddle level from the primary levelsecondary level from the middle leveland higher level the secondary levelrespectively. The figures Block-wisehave been given in the Table No 3
PROBLEMS
Analysis made so far presents avery terrible and pathetic picture of theeducational scenario of the study area.The society or region whole 82.0percent of population is deprived ofeven secondary education what to sayabout their higher education It cannot beexpected to be a co player in thedevelopment of the nation. Followingare the causes for the educationbackwardness of the study area.
1. Low income group/poverty
2. educational backwardness of theguardians
3. Indifference and negative attitudetowards woman/girls education andfeeling of insecurity Traditionally,the Hindu society has society hasdemonstrated a preference for sons& has treated boys & girls differentlybased on social & cultural normsParents often allocate their scarceresourced towards the schooling oftheir son’s . For the particularsections of the population, It isworthwhile to investing in the son’seducation as that would generate
income for the family & their future.Daughters are expected to get marriedearly, and parents have to save moneyfor dowry payment. Further, parentsdo not want to invest in their daughterschooling because the latter havelimited labour market opportunitiesand earning potential. This perceptionis partly Justified in light of the poorlabour market prospects for thewomen in many development blocksin the study region
4. Hindrance towards regular studiesdue to the agricultural back ground.
5. lack of contemporary courses ofstudies
Solution
Education is very important forgiving momentum to development of anyregion/or country and to maintain socialharmony It most only impartsmomentum to the process ofdevelopment but also strengthen stable/continuous/total development of theregion or country Adopting followingsuggestions, apart from thegovernmental attempts educationalscenario can be imported qualitatively.
1. Opening educational institutes inevery village/township/city is neitherpossible nor practical. Popularizingdistant mode (open school/college)of learning education scenario can beimproved. People who are drop outdue to employment or other family

The Research Journal of Social Science, Jalgaon M.S.
Volume I Issue -11 April. 201315
reasons can be re admitted in theeducational institutes and thus theywill be brought to the mainstream ofdevelopmental process
2. Developing courses suited to thelocal environment and needs andpopularizing it. not only theeducation’s scenario will change, butalso in difference towards educationwill end owing to the creation ofopportunities for employment
REFFERENCES
Agrawal, U.C. (2004) - SavtantraBharat Mai Shaikhnic Vikas ke prayasEk AVlokan, Ed Satya narayan,Pratiyogita kiran , Kiran prakashanPatna, Vol -10 Page 20-24
Gandhi Jagdish (2006)- Ajj ki shikhaki chunootiyan Evm Uddeshyapurnashikha ka sawaroop,Ed Jain mahendra,Pratiyogita Darpan, Upkar prakashanAgra vol 12 page 2192-2193
Kachhi NK (2007) Mahilaon ka vikasPrati Bodhtaye Ed Jain mahendraPratiyogita Darpan Upkar prakashanAgra vol 3 page 486-487
Ojha S and singh J (2008) Bharat 2008,Prakashan Vibhag Soochna evmPrasaran Mantralaya, Bhatrat Sarkarpage -253-297
Sarsawat,R(2008) Bhartiya Nari EdMishra,AKChankya Satya NiketanPrakashan New delhi Vol12 page 66-68
Table No 1
LITERATE AND ILLITERATE POPULATION IN MAIKAL PLATEAU
(PERCENT)
S.no Development literate illiterate Growth of
Block population population literate
population
1991 2001 1991 2001
1 Nainpur 25.82 65.62 74.18 34.58 60.652 Mandla 29.96 71.27 70.04 28.73 57.963 Mohgaon 14.59 53.66 85.41 46.34 72.814 Ghughari 09.69 43.54 90.31 56.46 71.745 Bichhiya 19.90 60.68 80.10 39.32 67.206 Mavai 11.31 47.33 88.69 52.67 76.107 Niwas 16.29 58.64 83.71 41.36 72.228 Bijadandi 15.56 59.11 84.44 40.89 73.689 Narayanganj 18.56 52.21 81.34 47.39 64.26
Maikal plateau 22.20 59.61 77.80 40.39 62.76
Source : DISTRICT INFORMATION CENTRE (NIC) MANDLA

The Research Journal of Social Science, Jalgaon M.S.
Volume I Issue -11 April. 201316
Table no 2
EDUCATIONAL STATUS OF MALE POPULATION IN MAIKAL PLATEAU(PERCENT)
S. Development No of going male population Dropout male population
No. Block next level to enrolled in enrolled population
in primary level
Middle higher higher Middle highers highersecondary education econdary education
1 Nainpur 45.06 15.94 4.89 54.94 29.07 11.10
2 Mandla 44.28 19.65 12.25 55.72 24.63 7.40
3 Mohgaon 53.09 25.26 46.91 27.83
4 Ghughari 33.43 15.90 66.57 17.53 5.19
5 Bichhiya 41.75 10.36 58.27 31.39
6 Mavai 46.22 22.38 3.21 53.78 23.84 19.17
7 Niwas 44.61 23.02 55.39 21.59
8 Bijadandi 53.77 13.58 46.23 40.19
9 Narayanganj 57.41 27.19 42.59 30.22
Maikal plateau 44.36 18.02 4.12 55.64 26.34 13.90Source : Based on District Statistical pustika 2009 page No 51-52
Table No 3-EDUCATIONAL STATUS OF FEMALE POPULATION IN MAIKAL PLATEAU PERCENT)
S. Development No of going female Dropout female population
No. Block population next level to in enrolled population
enrolled in primary level
Middle higher higher Middle highers highersecondary education econdary education
1 Nainpur 45.06 15.94 4.89 54.94 29.07 11.10
2 Mandla 44.28 19.65 12.25 55.72 24.63 7.40
3 Mohgaon 53.09 25.26 46.91 27.83
4 Ghughari 33.43 15.90 66.57 17.53 5.19
5 Bichhiya 41.75 10.36 58.27 31.39
6 Mavai 46.22 22.38 3.21 53.78 23.84 19.17
7 Niwas 44.61 23.02 55.39 21.59
8 Bijadandi 53.77 13.58 46.23 40.19
9 Narayanganj 57.41 27.19 42.59 30.22
Maikal plateau 44.36 18.02 4.12 55.64 26.34 13.90Source : Based on District Stastitical pustica 2009 page No 51-52

The Research Journal of Social Science, Jalgaon M.S.
Volume I Issue -11 April. 201317
“THE NATURE OF CIRCULAR TOUR OF ATTRACTIVE
PLACES IN GADCHIROLI DISTRICT OF MAHARASHTRA
STATE”
Dr. J. V. Dadve
Principal Y. C. College LakhandurDistrict – Bhandara (M.S.)Introduction :-
Resources are generallyclassified in Two Major Types, Natural& Hunan or cultural. Gadchiroli Districtof Maharashtra state is endowed withnatural Resource. Apart from it’seconomy value. These Resources canbe utilized to attract the Tourist and thusin Gadchiroli District of Maharashtrastate. Can we achieve progress ofGadchiroli District successful bydeveloping Tourism Industries?
Apart from the natural spot thetourists can enjoy the cultural activitiesand programs of the tribal’s in theregions. Thus with proper and persistentplanning. The resources of the Districtcan be developed with will be certainlybeneficial to the Gadchiroli District ®ion.Study Region :-
Gadchiroli District lies alongeastern border of Maharashtra State. Onthe 26 th August 1982, the oldChandrapur district was divided and anew district of Gadchiroli was formed.According to population this is thesmallest district in the Maharashtra stateand has been recognized a tribal district.
The district lies between 180 41’North to 200 50’ North latitudes and790 46’ East to 800 55’ East longitudes
According to 2001 census thepopulation of the district is 9,69,960 outof which 93.6% is a rural population.After recent revision the district hasbeen divided into 12 tahsils.
The geopraphical area of thedistrict is 14915 km2. There is largetopographical diversity in the district.The Southern and Eastern part is hilly andcovered with thick forest which is theabode of many tribes. Part of the hillyareas are more than 300 mt above sealevel. While the west of the region liesbelow 300 mt. from the mean sea level.Gadalgatta is the highest point 967 mtrabove mean sea level. It is in Etapallitahsil, in east central part of the district.
There are five major rivers andthe basin of the Wainganga river is mostextensive and covers 40.19% of the areaof the district. The other river basinswhich are important the Godavari, Iravati,Pranhita and Seonath rivers.The districtexperiences tropical mansoon climate.The mean minimum temperature atSironcha Tahsil is 22.10 C and the meanmaximum temperature is 340 C. Theaverage annual rainfall at Chamorshi inthe Western part of the district is 1200m.m. while at Yetapalli in the East it is1558 m.m. It means the rainfall

The Research Journal of Social Science, Jalgaon M.S.
Volume I Issue -11 April. 201318
increases from west to east. Thevariability of rainfall ranges from22.94% at Dhanora in the east to29.97% at Chamorshi, in the west.
Compared to the Eastern section,the Western part of the district is totallydifferent is a completely dominated bythe rivers, Wainganga and it’s tributaries.The southern part is a combination ofboth, there are isolated hills with valleyaround them. These physiographicdifferences have created differentnatural spot of attraction. Because ofthis topographic nature of district theinfrastructure development is very poor.For example the whole district theLength of the tar (pakka rd.) road is only457.98 km. and is only 13.60% of thetotal road . It shows clearly the poordevelopment approach, which in a primerequirement for Tourism development.Hypothesis :-
In spite of the several places oftourist attraction. Tourism has notdeveloped as an industries in the district.Infrastructure difficulty as well as socialfactor is responsible for this lowdevelopment of tourism in the district.Objective :
The main objective of thisresearch paper is to point out the spotsof Tourist’s attraction. Anotherobjective is to explain the way in whichthe tour can be arranged in the districtso that all major spots are covered. Thethird objective is to analysis the factorsthe which are responsible for Lowdevelopment of tourism Industry.
Spot of the attraction in the district:-
There are various types of placesin the district which are worth visiting.They can be divided in to two types 1)Physical. 2) Social & Cultural.
1. physical tourist center :-
On the Western side of the districtas mentioned earlier, river Waingangadominates the natural Landscape andmost of the centers of attraction on areassociated with this district.
Starting form Gadchiroli andtraelling towards South, the first placeis “Markhanda” at this point the riverhas sundenly tarned it’s course and hasturned towards North. Such turning hasreligious impoirtance and old Sivatempalwas built at this place. Similarly thereare some caves of archeologicalimportance. This place is known as“Khajurao” of Vidharbha. At South, ofMarkhanda about 60 km. away there is aplace called “Chaparala”. There is anconfluence of Wardha river withWainganga river. The place issurrounded by deep forest with somechandan trees.
Further at South about 136km. awaythere is another place of riverconfluence is is ‘Nagram’ where riverPranhita (originally Wainganga). Meetsthe major river of Maharashtra State thatis Godavari. Nagram is situated on theWestern bank of the river apposite to itand on the side of river there is anothercenter “Kaleshwar”.
We have to cross the river by boat togo to which Kaleshwar, this small

The Research Journal of Social Science, Jalgaon M.S.
Volume I Issue -11 April. 201319
Journey through the river is pleasuresome and worth visiting Kaleswar.
At East of Nagram of about 35 km.away. There is another place “Somnur”
where river Indravati joins riverGodavari. Somnur is located just at thebend formed by the rivers.
To visit the nest interesting placelocated at the East on has to go toAllapalli from Somnur then travallingEast one each to “Bhamragarh”. It isa hilly place surrounded by three rivers.There is a temple on the hill from whereone can enjoy a beautiful view of thescenery around. One can enjoy thebeautiful confluence of three riversfrom the top of the hill.
From Bhamragarh we can go toTippagarh via Chatgoan on the Easternborder there is a Hill Fort which wasbuilt by Raja Purmshaw in 10th centuary.The wall of the fort is about 10 km. inLength & there is a big Lake in side thiswall. At the West of Tippagarh there is aFort at Wairagarh it is also a hill fort.Then from this place one can easilyreach to Gadchiroli the starting point.2. Cultural Center :-
There are two important places whichare Nationally and Internationallyfamous places. They have becamefamous because of the exceptionalwork to great personalities Dr.Prakash Amate & Dr. Abhaya Bang.
Dr. Prakash Amate is doing a greatservice to tribal’s under the project“Lokbiradari” located at Hemalkasa,
which is at a distance of few km. fromBhamragarh.
Another places which one can visitwhile returning back to Gadchiroli isChatgoan. There is a research centerat this place Dr. Mr. Abhaya & Mrs.Rani Bang provide the noble serviceto the tribal’s and the people.
Nature of the Tour :-
The circular tour of natural andcultural places described above appearsto be simple. But the distance betweensome places are longer and the roadscondition is bad and narrow. The distanceand time required to cover them has beennoted in the Table No. 1 similarly thetime required to see this places and someother point also have been noted in thesame table.
It require nearly sixty Hours tocomplete this tour. It needs a time spanof three days and two nights. If it istedious one an cut the period tour andmake it short. Thus circular tour can becut into Two parts Northern part to andSouthern part to.
There is another difficulty andthat is of night stay. This facility isavailable only at few places. There isanother difficulty and that is of directroad connection. There are no motorable road which can connect the Touristplaces, we desire to cover in circularTour. One has to go to Allapalli which ison the North East side of Somnur andthen go to Bhamragarh. It is a long routeconsuming more time.

The Research Journal of Social Science, Jalgaon M.S.
Volume I Issue -11 April. 201320
Time–Requirement to visit major tourist centers in Gadchiroli Dist.
From To Dis tance Time Time needed Time for(in km.) Required by to see the Lunch/ dinner
car (in Hrs.) spot (in hrs.) & Rest.Time Purpose
Gadchiroli – Markhanda 45 1 1.30 - -(starting Point)Markhanda - Chaprala 60 1.30 2.00 1.30 LunchChaprala – Allapali & Aheri 40 1.00 1.00 0.30 TeaAllapalli - Sironcha 96 2.00 - - Night haltSironcha - Nagram 10 0.15 0.30 - -Nagram – Kaleshwara 5 1.00 by 1.30 1.00 Break fastMandir Boat & walkingKalashwar – Siro35ncha. 15 1.30 by Boat & - 1.30 Lunch
walking & carSironcha - somnur 35 1.00 Hrs. 1.00 Hrs. 0.30 Tea.Somnur - Allapalli 131 3.00 - - Night halt.Allapalli - Bhamragarh 64 1.30 1.30 Hr. - -Bhamragarh - Hemalkasa 07 0.10 1.30 Hr. 0.30 Breake fastHemalkasa – Allapalli 57 1.15 - 1.00 LunchAllapalli – Chatgoan 90 2.00 2.00 0.30 Tea(via Kasansur)Chatgoan - Dhanora 17 0.20 - - Night haltDhanora - Tippagarh 60 3.00 3.00 1 LunchTippagarh - Gadchiroli 94 3.30 - 0.30 Tea
Note :-
1. Total Duration of tour – FormGadchiroli to Gadchiroli – 60 Hrs.
2. Frequency of State Transport busesis very low. Therefore it is advisableto hire a Taxi or use your ownvehicle.
3. It is advisable to start your tour fromGadchiroli early in the morning
Some suggestions to the Tourism
development :-
The first thing that is essential andimportant is to think of existing roadsand head of constructing new good roads.Secondly, considering the various tourprograms administration. First providefacilities of Stay and Food at certainplaces. Thirdly adequate arrangement ofguides should be made for theconvenience of the tourists shorlaly,Government must assure the touristssafety. Fifthly, the administration that

The Research Journal of Social Science, Jalgaon M.S.
Volume I Issue -11 April. 201321
is tourism department should preparedte tour program of various duration. Forthis tour they must make thearrangement of travel, stay, fook &Guidance and other facilities. They canarrange the cultural programs of tribalfor the recreation of the tourist. Andlastly it is very necessary to advertisethis tour arranged by the tourismdevelopment.References :-
1. Chandrapur District Gazetteer1973
2. Censes book Gadchiroli District1991.
3. Topo Sheets : No. 65, No. 56N, No.56 M/13, No. 56 M/14, No. 64 D/4,No. 65 A/11.
4. Singh Tej Vir : Tourism & Recreation The New frontier of Geography in
Mondal R.B. & Singha V.N.P (Ed.Recent trends & concept inGeography Vol. II Concept. Pub. NewDelhi)
5.Social & Economics ReviewGadchiroli District. 2001.

The Research Journal of Social Science, Jalgaon M.S.
Volume I Issue -11 April. 201322
GROWTH OF SLUMS AND ENVIRONMENTAL
DETERIORATION IN THE CITIES OF TIRUPATI AND
VIJAYAWADA – A COMPARATIVE STUDY
G.Y. Sujatha Dr. D. Chandrasekhar Reddy Dr. N. Nagabhushanam
Professor,Dept. of Geography,S.V. University, Tirupati
Project Fellow,Dept. of Geography,S.V. University, Tirupati.
Research Scholar,Dept of Geography,S.V. University, Tirupati.
Abstract
Slum is the product of modern industrial civilization. The sporadic growthof slums is one of the distressing manifestations of urbanization. It is a socialevil, which grows along with urbanization. Poverty and deficit of housing inrapidly growing cities are the main reasons for the emergence of slums. Selectedbig cities of the old world developing countries like India have experienced analarming concentration of population and even over urbanization. Overurbanization means excess of population in relation to the available resourcesand level of economic development which is detrimental for future prosperityof that particular urban unit. (Dharam Singh, 2011).
The paper is an effort to study firstly the growth of urban population intwo class – I towns/cities namely Tirupati and Vijayawada, both being the pilgrimcities receiving enormous floating population . Secondly, these cities have largesize of natural growth and eventually the cities with their sectoral functionsattracting rural to urban migration. These cities are not provided with basicamenities for the increasing population. Therefore, slums are originated andgrowing decade by decade degrading the quality of urban life. Thus the two pilgrimcorporate cities are considered to make a comparative study of the deteriorationof environment due to spurting of slums.Keywords: Over Urbanization, Detrimental, Deterioration
IntroductionExponential form of urban
growth gained momentum in postglobalized era and has caused havoc forthe geo-environment in the urban areaitself as well as in surrounding rurallandscape. Excessive population
concentration, heavy and unplannedurbanization of a few large cities, havecaused heavy burden on the limitedresource base, available land, urbanamenities, infrastructure and have alsoaggravated the pollution problems anddeteriorated the urban environmental

The Research Journal of Social Science, Jalgaon M.S.
Volume I Issue -11 April. 201323
quality (11 thAsian UrbanizationConference, 2011 Osmania University,Hyderabad, Abstract by DasguptaJayaratil and Sivaramakrishnan).
The sprouting of slums occursexclusively of excessive urban growthand due to many other factors, such asshortage of developed land for housingand the high prices of land which isbeyond the reach of the urban poor. Thisis addition to a large influx of ruralmigrants to the cities in search of jobs.Growth of slums has been rapid, puttingtremendous pressure on the existingurban basic services and infrastructure.The percentage of slum population asagainst the total population of the Stateis 6.80. The average literacy rate in theslum areas of the State is 70.70%whereas it is 61.11% for the State as awhole. The literacy rate figures give anindication of the rural literacy migrationto the urban areas in search ofemployment. With these factors theslums in the Class – I and major citiesare mushrooming in number,deteriorating the normal living of thepeople by disturbing the ecology andenvironment of the cities. (ThawareKailas, 2011).Methodology
The study is established mainlybased on primary data as well assecondary data where ever necessary.Utilising the scientifically well preparedquestionnaire to interview the slumdwellers in each locality and data hasbeen compiled according to the plan ofthe study. Out of 42 slums in Tirupati
and 109 slums in Vijayawada, 5developed∗ and 5 under-developed∗∗
slums and 100 respondents from themin each city are interviewed on the basisof multi stage random samplingtechnique. The findings and suggestionspertaining to the growth of spatial anddemography of slums of the cities arediscussed.STUDY AREA
Tirupati and Vijayawada is theimportant pilgrimage sites in the Hinduworld, attracting floating population forholy visits and also for business andcommercial purposes from all over Indiamore so from the Southern states. Fourimportant factors have helped Tirupatiand Vijayawada grow to its present sizeand magnitude. They are (i) the religiousattractions, (ii) the establishment ofseveral higher educational institutionsof different specialities, (iii) thedevelopment of industrial andcommercial activities and (iv) thedevelopment of transport andcommunication services. Revolvingaround these four very importantaspects, the cities are developed intoreligious-academic-commercial centresand transport hubs within a span of twoor three decades.
TIRUPATI (In RayalaseemaRegion of Andhra Pradesh), thefoothill city of Tirumala the abode ofLord Venkateswara, the pilgrim placesare visited by over 180 lakh (2001)devotees annually. It is situated on thelatitude of 13°40’N and longitude of79°27’E and at a height of 500 feet above

The Research Journal of Social Science, Jalgaon M.S.
Volume I Issue -11 April. 201324
the mean sea level, bounded by Tirumalahills on the north, Chandragiri village onthe west, Avilala and Tiruchanoorrevenue villages on the south andAkkarampalle village on the east to oldRenigunta road (Fig.2).∗ Developed slums– 50% of development is seen regardingthe infrastructure development, socialservices, capacity building and linkageof infrastructure where priority is givento supply of drinking water, sanitation,construction of drains, roads,underground drainage, street lightning,garbage disposal.∗∗Under-developed slums- the overallcondition of the slum is poor withrespect to housing, water supply, roads,drainage, poor health services, lowincome, poor education, lack of awareness about their rights, governmentwelfare schemes, land tenure andsecurity, etc., Akkarampalle village onthe east to old Renigunta road .
VIJAYAWADA (In CoastalAndhra), is situated at the foot of a lowrange hills of the northern bank of theriver Krishna with its cardinal points as16°31’N latitude and 80°37’E longitude,around 70 km away from the coast. Thecity is surrounded by the Krishna riveron the east and west, the Budameru riveron the north (Fig.3).Climatic conditions of Tirupati andVijayawada- The climate of the Tirupatiis hot and semi-arid. The averageMinimum and Maximum temperaturesare 12.48°C and 44.18°C respectively.Highest temperature in the summermonths (May) is recorded as 46.20°C.The humidity ranges from 21% to 90%with a mean of 60%. The predominantwind direction is due East during SouthWest Monsoon and West directionduring North East Monsoon. The windvelocity ranges from 5.14 km/hr to18.15 km/hr with a mean of 9.72 km/hr.The Sunshine hours ranges from 3.77 to10.71 with an average of 7.60 (Fig.1).
22.2
9
25.1
2
28.0
3
31.1
32.2
9
31.1
9
29.7
3
28.7
7
28.2
5
26.6
5
24.2
22.3
163
58
53 54
53 54
59
59 6
2
70 71
70
7.7
7.3
7.25
7.25
11.2
9
15.8
12.9
213
.29
9.41
6.88
8.05
9.748
.99 9.6
6
9.9
4
9.7
6
8.3
1
7.3
1
5.0
9 6.1
5
6.3
6.0
1
6.3
2 7.3
2
0
10
20
30
40
50
60
70
80
Jan Feb Mar Apr May Jun Jul Aug Sep Oct Nov Dec
Months
0C
& %
0
2
4
6
8
10
12
14
16
18km
/hTemperature
Humidity
Wind
Sunshine
(Fig.1 Tirupati Climate) Source: Comprehensive Report of Climate, Tirupati Municipal Corporation

The Research Journal of Social Science, Jalgaon M.S.
Volume I Issue -11 April. 201325
The climate of Vijayawada is tropical innature with hot summers and moderatewinters. The climate is hot and drythroughout the year. Vijayawada islocated on the line which separates thedelta irrigated lands and, the dry uplands
of the district. The climate cycle canthus be divided into four seasons asCool months (January and February),Hot months (March to May), South-West Monsoons (June to September)and North-East Monsoons (October toDecember).
Vijayawada and thesurrounding areas experience hightemperature. The mean daily maximumtemperature is 47°C, while minimum is27.7°C in this region. The rainfall in theregion generally decreases from east towest. This region receives maximumrainfall both by southwest and retreatingmonsoons. Two thirds of the annualrainfall is recorded during southwestmonsoon. During February to June, therelative humidity in the afternoonsranges from 68-80%DEMOGRAPHIC AND SPATIAL-
GROWTH OF TIRUPATI AND
VIJAYAWADA CITIES
24.00 25.35
30.60
36.05 37.35
32.05 32.6030.00 29.40 28.05
26.0023.75
50.0
0
53.5
0
66.5
0
63
.50
66.0
0
65.0
0
54.0
0
56
.00
55
.00
50.0
0
44
.50
45
.00
10.10
36.00
10.60
40.10
85.10
42.70
25.30
82.5085.40
92.50
81.70
53.50
6.60 7.90 6.009.30 9.90
13.20 12.30
6.00 5.60 4.50 5.50 5.90
0.00
20.00
40.00
60.00
80.00
100.00
Jan Feb Mar Apr May Jun Jul Aug Sep Oct Nov Dec
Months
0C
& %
0.00
20.00
40.00
60.00
80.00
100.00
km
/h
Temperature HumidityRainfall Widn speed
(Fig.2 Vijayawada Climate) Source: Vijayawada Municipal Corporation, 2001.
Tirupati is a Vibrant Pilgrimcity located in Chittoor District ofAndhra Pradesh, dramatically sited atthe foot of bluff red sand stone thatmarks the Tirumala Hills. It has closelinks with two metros i.e., Chennai andBangalore at a distance of 150 kms and258 kms respectively.DEMOGRAPHY
In Tirupati city there are threejurisdictions viz., Tirupati Municipality(TM), Tirupati Urban AgglomerationArea (TUAA) and Tirupati UrbanDevelopment Authority (TUDA),controlling 1000 km² area having 182villages and one city and three towns.

The Research Journal of Social Science, Jalgaon M.S.
Volume I Issue -11 April. 201326
Tirupati has a unique distinction of beingdeclared a town in the very census ofIndia in 1871, when it recorded apopulation of 10,423. In 1931, thenumber of Municipal wards increasedfrom 6 to 14. In 1965, the municipalitywas upgraded to the status of a grade IMunicipality and in 1970 made a specialgrade Municipality. In the same year,Tirupati was brought under the categoryof standard urban area and it consistedof the urban components of 19 revenuewards and 16 rural blocks. The municipalarea in 1971 was 9.01 Km². By 1981,another ward (20) was added and thearea increased to 16.21 Km²and in 1991the area and the number of wardsremained the same. The TirupatiMunicipality has a population of 2,28,202 as per 2001 census, spread overan area of 24 sq.km with 20 revenuewards and 42 slums. The Tirupati UrbanAgglomeration area comprises ofTirupati town and surrounding peri urbanareas viz., Tiruchanoor (census town),Settipalle, Timminaidupalle, Avilala(Three outgrowths), Muthyala Reddypalle, Rajiv Nagar, Sai Nagar,Padmavathipuram, Vedanthapuram,Mallamgunta, Ramanujapalli,Thummalagunta and Chiguruwada (ninevillages) with a population of 97,000contributing to a total population of3,25,202.
Bulk of growth in the last decadehas been towards south of the railwayline. While the ongoing development of
the new State Highway in the southalmost the entire belt between theexisting National Highway and the newState Highway is witnessing newresidential developments. Thecomparative growth of municipal areahas been slowing over the decades butTirupati Non Municipal Area has beengrowing at an extremely rapid pace. Thepopulation noticed decreasing in therevenue wards of the old (core) townnumbering 3,8,9,11,12,14,15,16 and 17over three decades. But Ward Nos. 19and 20 have grown extremely highduring the three decades from 1981-2011. Decrease of population in therevenue wards of the old town are dueto increase of commercial activities,conversion of residential areas intocommercial area, increase of houserents, increase of site cost, increase oftransport activities for loading andunloading and increase of commutersto work in these areas. On the otherhand, the reasons for increase ofpopulation in the 19th and 20th wards arebecause of their location in the new andplanned infrastructural developmentalareas of the city, land cost iscomparatively cheaper and spacious andthere are many posh colonies in thewards, where the rich migrants comingfrom other areas are likely toconcentrate in these areas (Table.1 &Fig.3).

The Research Journal of Social Science, Jalgaon M.S.
Volume I Issue -11 April. 201327
Table 1: Growth of Population, Rank and Extent of Tirupati City (1901-2001)
Year of Total Decadal Growth Class Percentage Male Female Extent
census population Growth rate increase in Km²
1901 15485 - - IV - 7541 7944 3.001911 16701 1216 0.79 IV 7.85 8239 8462 3.001921 17434 733 0.44 IV 4.39 8631 8803 3.001931 19138 1704 0.98 IV 9.77 9493 9645 3.001941 20143 1005 0.53 III 5.25 9981 10162 3.001951 25207 5064 2.51 III 25.14 12793 12414 4.601961 35845 10638 4.22 III 42.20 19230 16615 6.801971 65843 29998 8.36 II 83.69 34841 31002 9.001981 115292 49449 7.51 I 75.10 60360 54884 16.211991 174393 59101 5.10 I 51.26 90741 83652 16.592001 228202 53809 3.09 I 30.85 117640 110562 24.00
Vijayawada Municipality wasset up in the year 1888 with an area of30 sq km. The Municipality wasupgraded to a selection grade in 1960sand further to a Corporation status in theyear 1981, adding another 29.4 km²areatotalling to 59.4 km². Later,Bhavanipuram, Patamata, Payakapuram,Gunadala and Kundavari Kandrika areadded to it and now as per the revenuerecords; the extent of the municipalcorporation area is 61.88 sq km.DEMOGRAPHY
The population of Vijayawada city is 8,45,217 as per 2001census. Thepopulation density increased from 9544/km² in 1961 to 13659/km² in 2001. Theentire city is divided into 26 revenue
Source: Tirupati Municipal Corporation.
wards having 109 slums. This historicaltown has originated on the northern bankof the river Krishna and, by 1855 AD thetown was in the form of small settlementon the eastern side of the Indrakiladrihills around the temple of LordMalleswara. The growth of the townpicked up momentum after theconstruction of a barrage and threeirrigation canals namely Eluru, Ryvesand Bandar canals in 1855 and, the railbridge over the river Krishna in 1892.The city experienced a modest growthin the pre-independence era; however,after independence the construction ofroad bridge over the river Krishna,establishment of South-Central Railwayterminal, setting up of divisional

The Research Journal of Social Science, Jalgaon M.S.
Volume I Issue -11 April. 201328
headquarters, major government officesincluding district court, majorinstitutions for higher education, majorcommercial and distributive tradingactivities, wholesale establishments,agricultural marketing centre andJawahar auto nagar industrial estate havebrought a tremendous effect on thecity’s growth. During 1905 AD, thegrowth started along the canals and areasabutting Indrakiladri and Gandhi hills.The city grew further along the threecanals with more growth along theBandar road. The population growth rateremained almost at around 40% during1961-1981, which increased to 52%during 1981-91, but declined to 20%during 1991-2001. The decrease in the
growth rate during 1991-2001 is partlydue to a bigger base built by 1991(7 lakh)compared to 1981 (4.6 lakh) owingmainly to addition of new areas into thecity during 1981-1991. It is estimatedthat around a lakh population of 2001census would have moved out from thecity over time for better livingenvironment. Majority of the slums arelocated in these regions because of thewater source and non-availability of land.As the city grew further along the Elururoad towards Gunadala hills, because ofbetter infrastructure and transportationfacilities, it added many of thesurrounding villages and the area ofjurisdiction of the municipality hasincreased (Table.2 &Fig.3).
Table 2: Growth of Population, Rank and Extent of Vijayawada city (1901-2001)
Year of Population Decadal Percentage Class Growth Male Female Extent
census growth increase rate in Km²
rate %
1901 24224 - - III - 14151 10073 30.001911 32867 8643 35.68 III 3.57 20925 11942 30.001921 44159 11292 34.36 III 3.43 24314 19845 30.001931 60427 16268 36.84 II 3.68 33540 26887 30.001941 86184 25757 42.62 II 4.26 46300 39884 30.001951 161198 75014 87.04 I 8.70 89048 72150 30.001961 230397 69199 42.93 I 4.29 128003 102394 45.121971 317258 86861 37.70 I 3.77 162855 154403 45.121981 461772 144514 45.55 I 4.55 235126 226646 59.401991 701827 240055 51.99 I 5.19 356153 345674 59.402001 845217 143390 20.43 I 2.04 430110 415117 61.88
Source: Vijayawada Municipal Corporation.

The Research Journal of Social Science, Jalgaon M.S.
Volume I Issue -11 April. 201329
Thus the high growth of arealextent and high growth of urbanizationare the two basic causes responsible forchanging urban land use pattern of thestudy region.Migration in Tirupati and
Vijayawada In Tirupati, the decadalgrowth of the population from 1991-2001 is too varying because of the rapidinsurgence of rural population. Thegrowth of population of any town is atwin process of (i) natural growth dueto birth- death ratio and (ii) in-migration. Added to it is the floatingpilgrim population of 60,000 persons/day on an average. The city has witnesseda substantial increase in urbanpopulation which is partially naturalgrowth but heavily with the increase ofslums and slum dwellers. At Presentthere are 42 slums within the municipal
0
10
20
30
40
50
60
70
80
90
100
1901 1911 1921 1931 1941 1951 1961 1971 1981 1991 2001
YEARS
Pe
rcen
tag
e (
%)
TIRUPATI
VIJAYAWADA
Fig.6: Decadal Growth and its Percentage increase in Tirupati City and
Vijayawada City
limits of the city. Out of 42 slumsidentified, 22 slums are located in theold town and 20 slums in the new town(Table 3 & Fig.4). Migration ofpopulation in the Tirupati city seems tobe much guided by the followingfactors:• Establishment of Tirumala TirupatiDevasthanam Trust.• Being mainly a religious centre.• In view of heavy influx of pilgrimsthroughout the year, has become a bigcommercial and tourist centre.• Conversion of town into Municipalityand Municipal Corporation extending itsboundaries includes population andslums of those areas.• Establishment of several highereducational institutions of differentspecialities.
The Research Journal of Social Science, Jalgaon M.S.
Volume I Issue -11 April. 201330
• Establishment of Tirupati UrbanDevelopment Authority.• Establishment of large industrialunits like Railway Coach Factory,Amararaja Batteries, Agro-basedindustries, Ceramics, etc.,• Availability of corporate educational
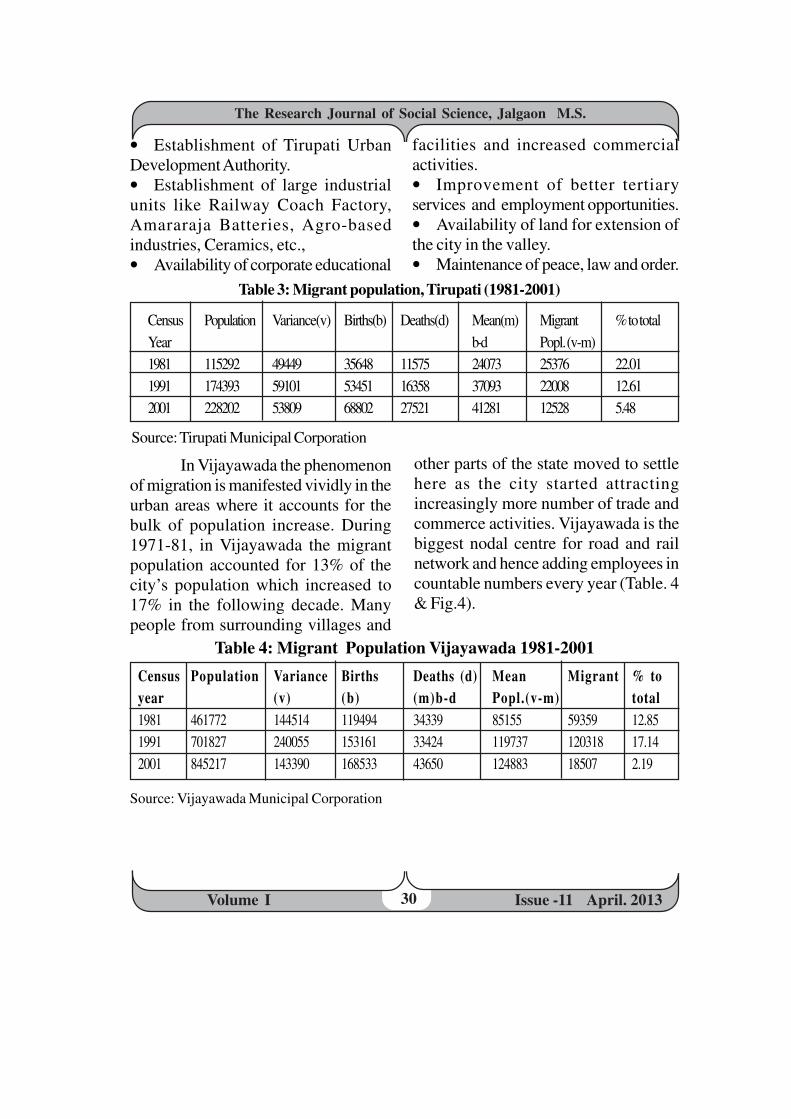
Table 3: Migrant population, Tirupati (1981-2001)
facilities and increased commercialactivities.• Improvement of better tertiaryservices and employment opportunities.• Availability of land for extension ofthe city in the valley.• Maintenance of peace, law and order.
Census Population Variance(v) Births(b) Deaths(d) Mean(m) Migrant % to totalYear b-d Popl. (v-m)1981 115292 49449 35648 11575 24073 25376 22.011991 174393 59101 53451 16358 37093 22008 12.612001 228202 53809 68802 27521 41281 12528 5.48
Source: Tirupati Municipal Corporation
In Vijayawada the phenomenonof migration is manifested vividly in theurban areas where it accounts for thebulk of population increase. During1971-81, in Vijayawada the migrantpopulation accounted for 13% of thecity’s population which increased to17% in the following decade. Manypeople from surrounding villages and
other parts of the state moved to settlehere as the city started attractingincreasingly more number of trade andcommerce activities. Vijayawada is thebiggest nodal centre for road and railnetwork and hence adding employees incountable numbers every year (Table. 4& Fig.4).
Table 4: Migrant Population Vijayawada 1981-2001
Census Population Variance Births Deaths (d) Mean Migrant % to
year (v) (b) (m)b-d Popl.(v-m) total
1981 461772 144514 119494 34339 85155 59359 12.851991 701827 240055 153161 33424 119737 120318 17.142001 845217 143390 168533 43650 124883 18507 2.19
Source: Vijayawada Municipal Corporation

The Research Journal of Social Science, Jalgaon M.S.
Volume I Issue -11 April. 201331
The in-migration to the city hassuddenly declined to 2% of the city’spopulation during 1991-2001, as thecity’s carrying capacity was under stressdue to existence of hill areas and thepopulation base in the preceding censusyear was high. Addition of new areas tothe Municipal Corporation (about 26.39sq.km) to the existing 30 Sq.km of theMunicipal Corporation is also one ofthe reasons. Thus the natural growth,migration and floating populationshowed a lot of impact on the spatialextent of Vijayawada MunicipalCorporation resulting into formation ofslums.Pilgrim growth trends in Tirupati
and Vijayawada
In Tirupati the pilgrim numbers hasbeen constantly increasing from 1961
22.01
12.61
5.48
12.85
17.14
2.19
0
5
10
15
20
25
1981 1991 2001
Years
% M
igra
tio
nTirupati
Vijayawada
Fig. 7 Population migration in Tirupati City and Vijayawada City
to 1993. The growth of pilgrims wasphenomenal in the years 1994, 1995 and1996 and started declining from 1997onwards. The daily visitation of pilgrimsin 1994-1996 was around 68,000pilgrims/day while the number ofpilgrim visitation has come down to60,000 by the year 2000. In Vijayawadaon an average 7,000 to 10,000 pilgrims(floating population) visit everyday. Thenumber increases to over a lakh duringfestival days and weekends. It is alsoobserved that the number of pilgrimsvisiting reaches the peak during themonths of September-October, a timewhen the nine days of Navarathri iscelebrated (Fig.5).

The Research Journal of Social Science, Jalgaon M.S.
Volume I Issue -11 April. 201332
Growth of slums and their
Demographic profile of Tirupati and
Vijayawada
Tirupati city is one of the fastgrowing cities in India during the lastfour decades. There are 42 slums inTirupati with a population of 76,905 in15,173 households with an averagehousehold size of 5.10. The largest slumin terms of population is Maruthi Nagarwith 9064 persons and the smallest isPachigunta with 285 persons as per2001 census. The analysis of thelocation of slums in Tirupati clearlyshows that the Transport andcommunication system have played amajor role for the origin andestablishment of slums. About onefourth of the slums such as HaridwarColony, Pachigunta, Marri ChennaReddy Colony, Singalagunta, AmbedkarColony, Sanheevaiah Nagar, SanjeevaiahColony, Yasoda Nagar, Sapthagiri Nagar,
0
10000
20000
30000
40000
50000
60000
70000
80000
1960 1965 1970 1975 1980 1985 1990 1995 2000
YEARS
NO
. O
F P
ILG
RIM
S
TIRUAPTI
VIJAYAWADA
Fig. 5 Daily growth of Pilgrims in Tirupati and VijayawadaSource: Tirupati –Tirumala Devasthanam and Sri Durga Malleswara Swamy Varla
Devasthanam
Ambedkar Society Colony, SurayyaKatta, Sivajyothi Nagar, Yerramitta, andChinnagunta are located in the northernside of Tirupati. When the process ofurbanization started and betteremployment opportunities wereprovided in non-agricultural sector in thetowns and the frequent occurrence ofdroughts in the district, the agriculturallabourers started moving into variousplaces and thus passing the way formushroom growth of slums in the lasttwo to three decades.The data on age of slums shows that theyvary between 8 and 50 years.Mallaiahgunta slum in ward 3 is 50 yearsold while Sivajyothi Nagar slum in ward20 is the recent one, 8 years old. Three(3) slums namely Tataiahgunta,Chintalachenu and Maruthi Nagar aremore than 40 years old. About 50% ofthe slums are found to be between 30 to40 years old. The slums in the old town

The Research Journal of Social Science, Jalgaon M.S.
Volume I Issue -11 April. 201333
are more in number than in the new townand have come up adjacent to the marketand business areas taking advantage ofthe government and municipal landsavailable for encroachment. Most of theslum in Tirupati city has cropped up ongovernment and municipal landsespecially on road margins, andgovernment porambokes. Bulk of thedwellers belong to the poorer sectionsof the society and uneducated. It maybe explained from the table that 18.75%of the town dwellings and 18.3% of thetotal population of the town are locatedin the slums. Although the slums are
scattered all over the city, there is adistinct concentration in the sociallybackward areas which are associatedeither with the industrial areas(Renigunta) or historic core of the city.The common features that are observedin the slums of Tirupati city are landinsecurity, poor living conditions,unemployment and also acceleratedpopulation growth is observed in theslums where regulation of family sizethrough family welfare programme isnot so popular. Population ballooningtakes place far beyond the capacity ofthe environment to support it adequately(Fig.6).
There are 109 slums inVijayawada; about 26% of the totalpopulation reside in slums, squattersand other poor settlements in smallgroups on the hillocks, river beds, in thecity and in Mangalagiri municipality andsurrounding villages deprived of basic
Fig.6 Tirupati slum location Fig. 7 Vijayawada slum location
services. In the VMC they are mostlyconcentrated on the south-eastern partof the city. They are predominantlyspread along the banks of river Krishnaand many canals that flow through thecity. Their contribution to city’seconomy has been growing over

The Research Journal of Social Science, Jalgaon M.S.
Volume I Issue -11 April. 201334
decades. With soaring land prices andabsence of clear policy framework toaddress their problems, the poor sufferwithout access to basic services likehousing, livelihoods, education andhealth services, etc. The slum people aregenerally engaged in tertiary sectoractivities. The Vijayawada UrbanAgglomeration consists of out growthswhich are presently not part of thecorporation area but inextricably linkedwith the city both spatially andeconomically. In all these areas the poorpopulation is very high and all theseareas are considered to be slums withoutbasic infrastructure – physical andsocial .
The total slum population of thecity is around 2 lakh of which maleconstitutes 51% and female 49%. Of thetotal population around 64,000 are fromBackward Classes and 36,000 from SCcategory. Of the total slum dwellers44% are below the Poverty Line. Theslum population is living in 48,280households with an average householdsize of 3.86 against Tirupati being 5.10.This is very strange as generally, theeconomically weaker section family’srecord much higher family sizecompared to other income groups.Literacy rate is also good with 63% ofwhich male literacy rate is 67% andfemale literacy rate is 60%. Among thechildren in the slum localities, 43% goto private schools and the rest togovernment schools.
Environment improvementscheme is being taken up by theMunicipal Corporations of Tirupati andVijayawada with the sponsorship oftechnology and funding by Indo-GermanCo-operation (GTZ1 ASEM2 CPCB3) forthe development of slums. Under thisscheme the roads were formed, drainsand other amenities are also beingprovided as per the layout approved bythe Director of Town Planning butimplementation find lapses.
The secondary data analysedabove revealed the spatio-temporal-economic and social causes offormation and growth of slums in the twocities. But to work out with thequalitative analysis of slums the primarydata shall supplement the wholescenario of the slums. The qualitativeanalysis of the slums in two cities isbased on the empirical data collected assaid in the methodology. By selecting25 parameters such as number of houses,drinking water, toilet facilities, drainage,cleaning of drainage, quantity of wastegenerated in the slum, air and noisepollution, etc., the study was conducted.Of these only 10 important parameterswere considered for the analysis of theresearch paper. The Chi-squarestatistical technique is adopted for those10 variables (as mentioned in the tables5, 6, 7, 8 and 9) to evaluate the qualityof life of slum dwellers. With the helpof qualitative analysis of the data, levelsof quality of life are ascertained. The
The Research Journal of Social Science, Jalgaon M.S.
Volume I Issue -11 April. 201335
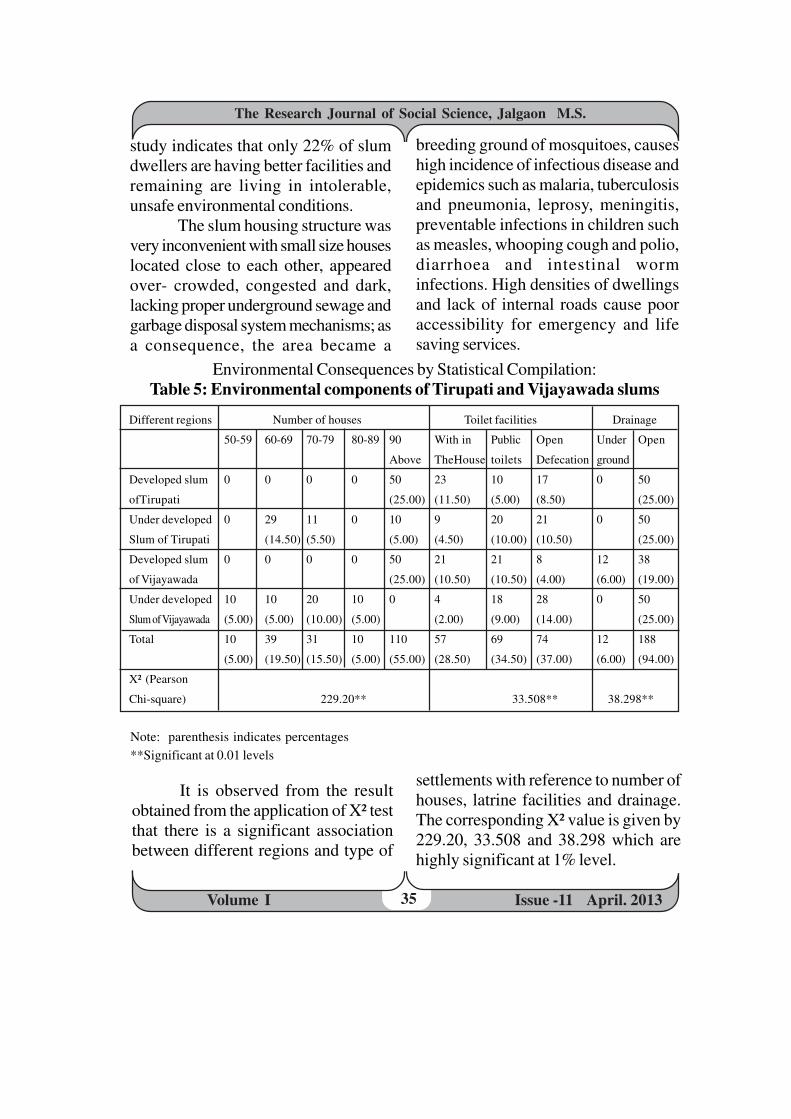
study indicates that only 22% of slumdwellers are having better facilities andremaining are living in intolerable,unsafe environmental conditions.
The slum housing structure wasvery inconvenient with small size houseslocated close to each other, appearedover- crowded, congested and dark,lacking proper underground sewage andgarbage disposal system mechanisms; asa consequence, the area became a
breeding ground of mosquitoes, causeshigh incidence of infectious disease andepidemics such as malaria, tuberculosisand pneumonia, leprosy, meningitis,preventable infections in children suchas measles, whooping cough and polio,diarrhoea and intestinal worminfections. High densities of dwellingsand lack of internal roads cause pooraccessibility for emergency and lifesaving services.
Environmental Consequences by Statistical Compilation:Table 5: Environmental components of Tirupati and Vijayawada slums
Note: parenthesis indicates percentages**Significant at 0.01 levels
It is observed from the resultobtained from the application of X² testthat there is a significant associationbetween different regions and type of
settlements with reference to number ofhouses, latrine facilities and drainage.The corresponding X² value is given by229.20, 33.508 and 38.298 which arehighly significant at 1% level.
Different regions Number of houses Toilet facilities Drainage
50-59 60-69 70-79 80-89 90 With in Public Open Under Open
Above TheHouse toilets Defecation ground
Developed slum 0 0 0 0 50 23 10 17 0 50
ofTirupati (25.00) (11.50) (5.00) (8.50) (25.00)
Under developed 0 29 11 0 10 9 20 21 0 50
Slum of Tirupati (14.50) (5.50) (5.00) (4.50) (10.00) (10.50) (25.00)
Developed slum 0 0 0 0 50 21 21 8 12 38
of Vijayawada (25.00) (10.50) (10.50) (4.00) (6.00) (19.00)
Under developed 10 10 20 10 0 4 18 28 0 50
Slum of Vijayawada (5.00) (5.00) (10.00) (5.00) (2.00) (9.00) (14.00) (25.00)
Total 10 39 31 10 110 57 69 74 12 188
(5.00) (19.50) (15.50) (5.00) (55.00) (28.50) (34.50) (37.00) (6.00) (94.00)
X² (Pearson
Chi-square) 229.20** 33.508** 38.298**
The Research Journal of Social Science, Jalgaon M.S.
Volume I Issue -11 April. 201336
Table 6: Environmental Components of Tirupati and Vijayawada Slums
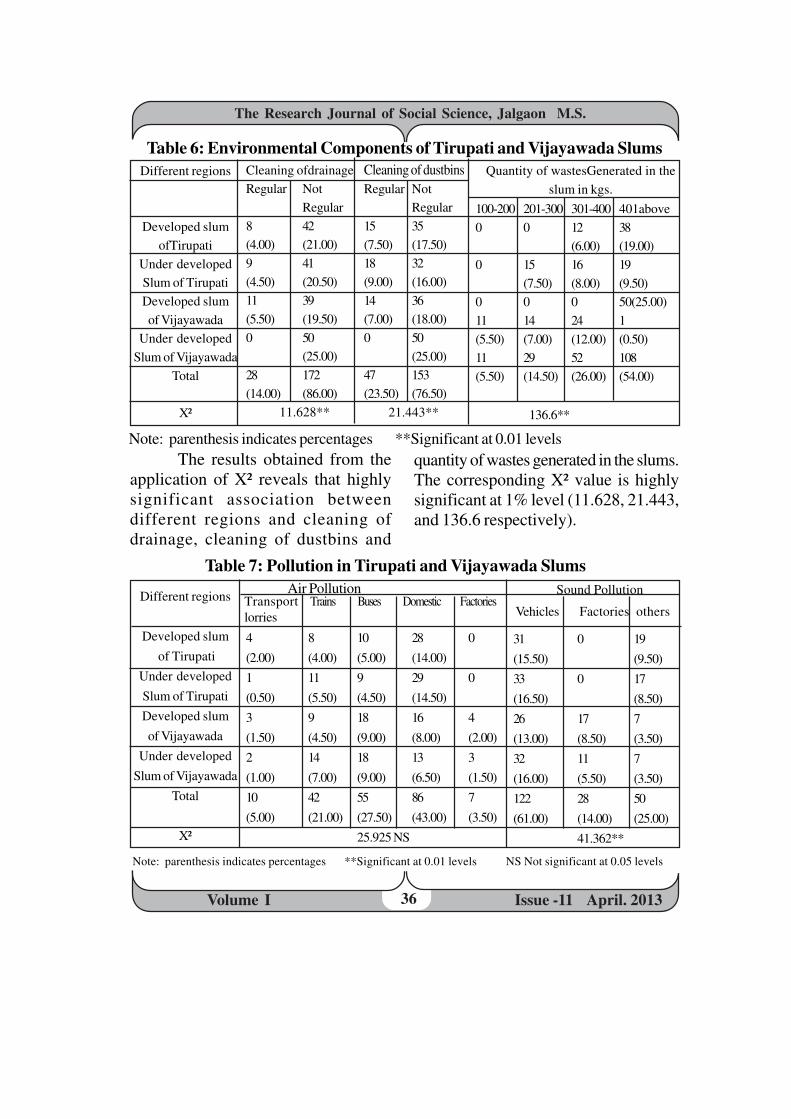
Note: parenthesis indicates percentages **Significant at 0.01 levelsThe results obtained from the
application of X² reveals that highlysignificant association betweendifferent regions and cleaning ofdrainage, cleaning of dustbins and
quantity of wastes generated in the slums.The corresponding X² value is highlysignificant at 1% level (11.628, 21.443,and 136.6 respectively).
Table 7: Pollution in Tirupati and Vijayawada Slums
Note: parenthesis indicates percentages **Significant at 0.01 levels NS Not significant at 0.05 levels
Different regions
Developed slum
ofTirupati
Under developed
Slum of Tirupati
Developed slum
of Vijayawada
Under developed
Slum of Vijayawada
Total
X²
Cleaning ofdrainage
Regular Not
Regular
8 42
(4.00) (21.00)
9 41
(4.50) (20.50)
11 39
(5.50) (19.50)
0 50
(25.00)
28 172
(14.00) (86.00)
11.628**
100-200 201-300 301-400 401above
0 0 12 38
(6.00) (19.00)
0 15 16 19
(7.50) (8.00) (9.50)
0 0 0 50(25.00)
11 14 24 1
(5.50) (7.00) (12.00) (0.50)
11 29 52 108
(5.50) (14.50) (26.00) (54.00)
Cleaning of dustbinsRegular Not
Regular
15 35
(7.50) (17.50)
18 32
(9.00) (16.00)
14 36
(7.00) (18.00)
0 50
(25.00)
47 153
(23.50) (76.50)
21.443**
Quantity of wastesGenerated in the
slum in kgs.
136.6**
Air PollutionDifferent regions
Developed slum
of Tirupati
Under developed
Slum of Tirupati
Developed slum
of Vijayawada
Under developed
Slum of Vijayawada
Total
X²
31 0 19
(15.50) (9.50)
33 0 17
(16.50) (8.50)
26 17 7
(13.00) (8.50) (3.50)
32 11 7
(16.00) (5.50) (3.50)
122 28 50
(61.00) (14.00) (25.00)
41.362**
4 8 10 28 0
(2.00) (4.00) (5.00) (14.00)
1 11 9 29 0
(0.50) (5.50) (4.50) (14.50)
3 9 18 16 4
(1.50) (4.50) (9.00) (8.00) (2.00)
2 14 18 13 3
(1.00) (7.00) (9.00) (6.50) (1.50)
10 42 55 86 7
(5.00) (21.00) (27.50) (43.00) (3.50)
25.925 NS
Transport Trains Buses Domestic Factorieslorries
Sound Pollution
Vehicles Factories others

The Research Journal of Social Science, Jalgaon M.S.
Volume I Issue -11 April. 201337
The results obtained from theapplication of X² reveals that there is nosignificant association betweendifferent regions and air pollution. The
corresponding X² value is not significantat 5% level. The sound pollutioncorresponding X² value is 41.362 whichare highly significant.
Table 8: Season-wise Health Hazards in Tirupati and Vijayawada Slums
Note: parenthesis indicates percentages **Significant at 0.01 levels
From the results obtained fromthe application of X² test, that there issignificant association betweendifferent regions and diseases with
reference to season-wise commondiseases. The corresponding X² value is26.907 which are highly significant at1% level.
Table 9: Social Components of Tirupati and Vijayawada Slums
Note: parenthesis indicates percentages **Significant at 0.01 levels
Different regions Season-wise common diseasesSummer Winter Rainy Spring
Developed slum of Tirupati 28(14.00) 0 22(11.00) 0Under developedSlum of Tirupati 12(6.00) 12(6.00) 26(13.00) 0Developed slum of Vijayawada 19(9.50) 8(4.00) 22(11.00) 1(0.50)Under developedSlum of Vijayawada 13(6.50) 5(2.50) 32(16.00) 0Total 72(36.00) 25(12.50) 102(51.00) 1(0.50)X² 26.907**
Rural Land- Economic Irregular Unemploy Displace
poverty lessness problem Work -ment ment
5(2.50) 17(8.50) 12(6.00) 6(3.00) 9(4.50) 1(0.50)
1(0.50) 2(1.00) 14(7.00) 20(10.00) 12(6.00) 1(0.50)
1(0.50) 12(6.00) 22(11.00) 3(1.50) 11(5.50) 1(0.50)
0 5(2.50) 14(7.00) 12(6.00) 19(9.50) 0
7(3.50) 36(18.00) 62(31.00) 41(20.50) 51(25.50) 3(1.50)
49.483**
Reasons for entering the slumDifferent regions
Developed slum of Tirupati
Under developed Slum of
Tirupati
Developed slum of Vijayawada
Under developed Slum of
Vijayawada
Total
X²

The Research Journal of Social Science, Jalgaon M.S.
Volume I Issue -11 April. 201338
It is observed from the resultsthat there is a significant associationbetween different regions and type ofsettlements with reference to reasonsfor entering the slums. The X² value isgiven by 49.483 which are highlysignificant at 1% level.
The study denotes that the slumsof Tirupati and Vijayawada have varyingnature of morphological anddemographic characteristicsinfluencing on the socio-economicconditions of slum dwellers and varyfrom one category to another dependingupon the functional and ecologicalsystem of the localities. The datacompiled reveals that the environmentalproblems are prevailing commonly bothin the developed and under-developedslums. These problems between twoareas are not significant at 0.05 levelsexperiencing, inadequate wateravailability both in quality and quantity,depletion of ground water table, lackof sanitation or toilet facility,indiscriminate disposal of waste water,erratic electricity supply, unplannedgrowth of residential areas,deteriorating urban air quality,inadequate solid waste disposal andmanagement, etc.,
The comparative study ofTirupati, called as “the city of Vatican”and Vijayawada, “the city on fast track”,shows that they are highly significant at0.01 levels, where majority of theparameters taken for the study are atdifferent levels. Tirupati slums arehaving better amenities compared toVijayawada, which was recorded low
quality in most of the parameters.Though Vijayawada is a contemporarymetropolitan city today butenvironmentally, socially and economi-cally unsustainable with the problems ofinfrastructure. The analysis shows thatthe peripheral growth plays a significantrole in the growth of city through urbansprawl, the haphazard and arbitrarydevelopment of these fringe areasdevastates rural areas in many ways, andthus environmental problems areerupted. Tirupati is having lesspopulation compared to Vijayawada andbecause of its special functions it wasmade as corporation. Added advantage isthat Tirupati Tirumala Devasthanam isworking together in sharing, caring andshaping the sustainable city andimproving the quality of life of peopleliving and working there which is anotherlapse to Vijayawada. The analysisprovides an overview of the populationcharacteristics and slum problems andis expected to serve as a bench mark forpragmatic and realistic town planningwhile dealing with the issues of slumsand slum dwellers.To overcome the challenges andconsequences the followingsuggestions are made:• A planned city should be strengthenedin all the scientific sectors to provideaccommodation for incomingpopulation to avoid formation of slumsand develop the already formed slums.• To attain pollution free, congenial,serene atmosphere with optimumvegetation and rendering responsible,accountable, incorruptible administra-

The Research Journal of Social Science, Jalgaon M.S.
Volume I Issue -11 April. 201339
tion with strategic reforms, to study andprovide better amenities to the poorestcoming from the backward ruralbackground.• The infrastructural developmentalworks such as new roads, to reduce thetraffic problems, increasing watersupply, improvement in the sanitation,drainage system and treatment plants,developing a clean and green zones,establishment of training and marketingcentres for industrial, cottage andhandicrafts oriented products, improvedcommunication, strengthening theprivatization of solid waste managementare required to be developed in the slumsof two pilgrim cities.• The paramount concern is povertyreduction through mutually cooperativeand coordinated efforts of electedrepresentatives, public servants,residents and other higher officials toachieve slum free-city. It can besucceeded by implementing JNNURM(Jawaharlal Nehru National UrbanRenewal Mission) and Rajiv Awas Yojana(RAY) projects very effectively to solvethe basic problems of slums in the cities.• The perspective plan, as an elaboratedversion of a typical city development,will provide much needed impetus toaccomplish the vision for the futuredevelopment of slums.References1. Census of India (1991 and 2001):Civic and Other Amenities in theNotified Slums of Class I and II Towns(Delhi: Controller of Publications)
2. Bhan Gautam, (2009). This is No
Longer the City I Once Knew;Evictions, the Urban Poor and the Rightto the City in Millennial Delhi. Envir-onment and Urbanization, 127-142.
3. Devanand, K.S. (1993): “Cityformation and the role of institution-A case study of Tirupati Town, Urbanand Regional Planning, Tirupati”
4. Kondapalli Ranga Rao, M.S.A. Rao.(1984). Cities and Slums: “A study ofa squatters’ settlement in the city ofVijayawada” Concept PublishingCompany
5. Sudha Kaladate. (1999). “Slums andHousing Problems”, Print WellPublishers, Jaipur
6. Abstract of 11th Asian UrbanizationConference, 2011 Department ofGeography, Osmania University,Hyderabad, India.
7. Akshayakumar Ramanlal Desai, S.Devadaspillai, “A Profile of an IndianSlum” University of Bombay, 1972.
8. Global research.org, India’s UrbanSlums : “Rising social inequalities,mass poverty and homelessness byArunShrivastava, Global Research, May08, 2012.
9. Izeogu, C.V. (1989): “UrbanDevelopment and the Environment inPort Hardcourt, Environment andUrbanization, Vol.1., No.1, pp.59-68.
10. City Development Plan, VGTM,Urban Development Authority.
11.City Sanitation Plan, TirupatiMunicipal Corporation, Tirupati.
12.www.tirupatimunicipalcorporation.org13.www.vgtmuda.gov.in14.www.ourvmc.org

The Research Journal of Social Science, Jalgaon M.S.
Volume I Issue -11 April. 201340
POPULATION GROWTH IN GADCHIROLI DISTRICTS
MAHARASHTRA- Prof. Dr. Kishor Y. Thakare
Y.C.College, Lakhandur
Abstract:
Natural increase in population depends upon two factors i.e. increase ordecrease in the Birth rate or death rate and migration of the population from oneplace to another can either decrease or increase population. This is the twomain factors responsible for the increase in the population of Gadchiroli district.Birth rate and death rate of this district is low as compared to the other district.Apart from that due to migration of large number of Bengali people from otherdistrict and get settled. After year 1982 Gadchiroli district has been formed asa independent district and Gadchiroli was the main city of the district. Due tothis there is increase in rate of employment opportunities in this district due tothis large number of people are arriving in the district for working purpose. Thepopulation of Gadchiroli has been increasing fastly but in eastern part of thedistrict the population growth was slightly more. In this district tribal communitypeople’s population is more and seems to be stable in this area. The increase inrate of population in western part of the district is medium level. From the totalpopulation 1/3rd population is localized in this area.Key Word: Population growth, Environment, Socio-economic factors.
INTRODUCTIONThe population of any state does
not remain stable everytime it keeps onchanging. Population growth rateincreases or decreases it depends uponthe two main factors i.e. Birth rate anddeath rate that keeps on increasingnaturally. The second reason is themigration of people from one area tothe another area. Population growth getincreased is the main reason for thesetwo factors.
The population of any statedepends upon many factors. It dependson the mineral resources,environmental
impact, financial point of view and thesurvival of the population due to increasein population of this area ovestions getarised about the socio-economiccondition of this district. Due to lack ofproper nutrition in diet the chances ofmalnutrition has been increased, lowliving status, environmental change,unemployment are the main problemshas been get developed. In Gadchirolidistrict if we see how population growthget increased from the decade 1901-2001 in this 100 years the population ofthe district has been increased upto 5.50while the percentage of this population

The Research Journal of Social Science, Jalgaon M.S.
Volume I Issue -11 April. 201341
was 446.04%. In 1901 the populationof the district was 77,244 but in 2001 itget increase 9,70,294. In 1901 thepopulation growth was 23 peoplepersquare kilometer while in 2001 it isabout 63 person sq/km. It shows that inthese 10 years population growth rateincreases in decent amount.OBJECTIVE :-
The present paper has attemptedto assess the decadal variation ofpopulation growth in Gadchiroli districtof Maharashtra.HYPOTHESIS :-
Gadchiroli district is known asthe tribal district. Most of the part ofthe district is surrounded by forestandmountain ranges it shows differencesinland cover. In all part of the districtdevelopment has been not taken placeor seen due to this some areas of thedistrict show more population and someareas shows low population.STUDY AREA :-
Gadchiroli district is situated inborder of eastern part of theMaharashtra. District 80% of the partis surrounded by forest and mountainranges. In this region tribal communitypopulation is more so this district isknown as tribal district. District islocated at 180.89’-20050’ northernlatitude and 71046’-80055’ easternlongitude. Total Geographical Area ofGadchirolidistrict is 15433.10 sq/km.out of that 4.69% of the area ofMaharashtra state is occupied byGadchiroli district. According to 2001
census Report the population of thedistrict was 9,70,294. Desaiganj andGadchiroli are the main place in thisDistrict. The population of this area is7.44% of the urban population while inMaharashtra the dois growth rate is upto 40% more most of the area of thedistrict is surrounded by village. Inesteem side of the district thetopography of area is undulating. Averageheight of this area is 550-600m. Totalmountain ranges in this area aresurrounded by forest cover. Which isalso seen in other region of this district.In this Area population of tribalcommunity is more. Due to presence offorest waver there is huge Amount ofmineral resources Available there itshows economical background of thisdistrict. while natural and socialquestions are also has been get arised.The climate of this district is of moderatetype. Summer are very hot and wintersare cold. The temperature goes up to47.30c in the Month of May while inwinter month of December or January itgoes below up to 80c Annual averagerainfall is upto 1585.83 mm.DATABASE AND METHODOLOGY:- Form the data Available on populationcensus book the appropriate populationof this district has been noted in digitspation temporal analysis of this districthas been done clearly. In this study from1901-2001 decade.i.e. 100 yearsduration spationtamporal analysis ofpopulation has been done.

The Research Journal of Social Science, Jalgaon M.S.
Volume I Issue -11 April. 201342
Years Total Population Decadal Variations (Percent)Gadchiroli District India
1901 177244 - -1911 225086 +26.99 +5.751921 220771 -1.92 -0.311931 254088 +15.09 +11.001941 290730 +14.42 +14.221951 324962 +11.77 +13.311961 386392 +18.90 +21.311971 522229 +35.16 +24.801981 637342 +22.04 +24.751991 787010 +23.48 +23.502001 970294 +23.28 +21.34
Source :-1) Census of Gadchiroli (1991) SeriesI, Part II-A General Population2) Census of Gadchiroli District(2001) Series – I, Part II-A, GeneralPopulationPOPULATION GROWTH DURING1901- 2001
In 1901-2001 decade i.e. in 100years period the population growth ofthis district was around 9.50 while thepercentage of this population was447.05%. In year 1901 the populationof the district was 1,77,244 while in2001 it was about 9,70,294. It meansthat in the period of 100 years thepopulation growth increases upto7,93050. In 100 years decade i.e. from1921 the growth rate of population wasvery low upto 1.92% while in year 1971the growth rate was slightly more i.e.35.16%. In the decade 1901-1961 thepopulation growth rate was very low or
steady while in 1961-2001 seconddecade population growth has beenincreased exponentially. In this decadethe population growth was 6 lakh morefrom the normal population. Populationgrowth history has been divided in tothree parts:-i) The period 1901-1921 whenintermittent rise and fall in the growthrate was registered.ii) The period 1921-1961 when thegrowth-rate was sluggish.iii) The period 1961-2001 whenaccelerating growth rate was witnessed.POPULATION GROWTH DURING1901-1921 :-
In first twenty years populationgrowth increase or decrease rate hasbeen seen it means in this decadepopulation growth rate increased hasbeen seen. During 1911 period thepopulation growth increase upto 26.99%while in next period only -1.62% of the

The Research Journal of Social Science, Jalgaon M.S.
Volume I Issue -11 April. 201343
population growth has been recordedwhich was very low. Population growthhas been get decreased due to diseaseconditions prevailing there and illnessinpeople’s disease for the decrease inpopulation growth. In year 1918 plagueis the most common disease for thedeath of people’s so decrease inpopulation has been seen.POPULATION GROWTH DURING1921-1961 :-
After 1921 development hasbeen taken place and medicine andmedical facilities has been done due tothis death rate has been get decreased-
In this forty years period i.e.from 1921-31 the population growthrate was only 15.09% while next periodi.e. from 1931-41 it get decreased up to14.42%. In 1941-51 period it getdecreased upto 11.77% In this perioddue to diseases like malaria, cholera anddrought conditions decrease inpopulation has been seen.POPULATION GROWTH DURING1961-2001 :-
In next forty years i.e. from1961-2001 population growth wasincreased very fastly. In this decade thepopulation get increased upto 6 lakhform the normal population In 1961-1971 period increase in populationgrowth was 30.10%. This populationincrease was more in 100 year while innext period i.e. from 1971-1981 hasbeen done population get decrease upto22.04%. In 1981-1991 period
population growth inerease slightly andgoes upto 23.48%. In this periodmedical facilities slightly and goes upto23.48%. In this period medical facilitieshas been done due to this death rate hasbeen get decreased. After 1961population growth get increased itdepends up on many factors.i) High birth rate and relatively lowdeath rateii) Increase in agriculturalproduction through expansion ofcultivated land both horizontally andvertically.iii) Development of quick means oftransport facilities so that food supplymay be made readily accessible to areasliable to familiar conditions.iv) Browingwncern andresponsibility of government in evolvinga rational system of distribution of foodand in takingAnticipatory measures to tight famines.Due to the improvement in the socio-economic londitions in the postindependence period the trend shows arapid growth of population furthermore,industrialization are also responsible forthe conditions of an upward trend.
SPATIAL PATTERN OFPOPULATIONGROWTH DURING1991-2001 :-
In 1991-2001 period if we thinkit was that in etapalli andBhamaragarhtaluka population get
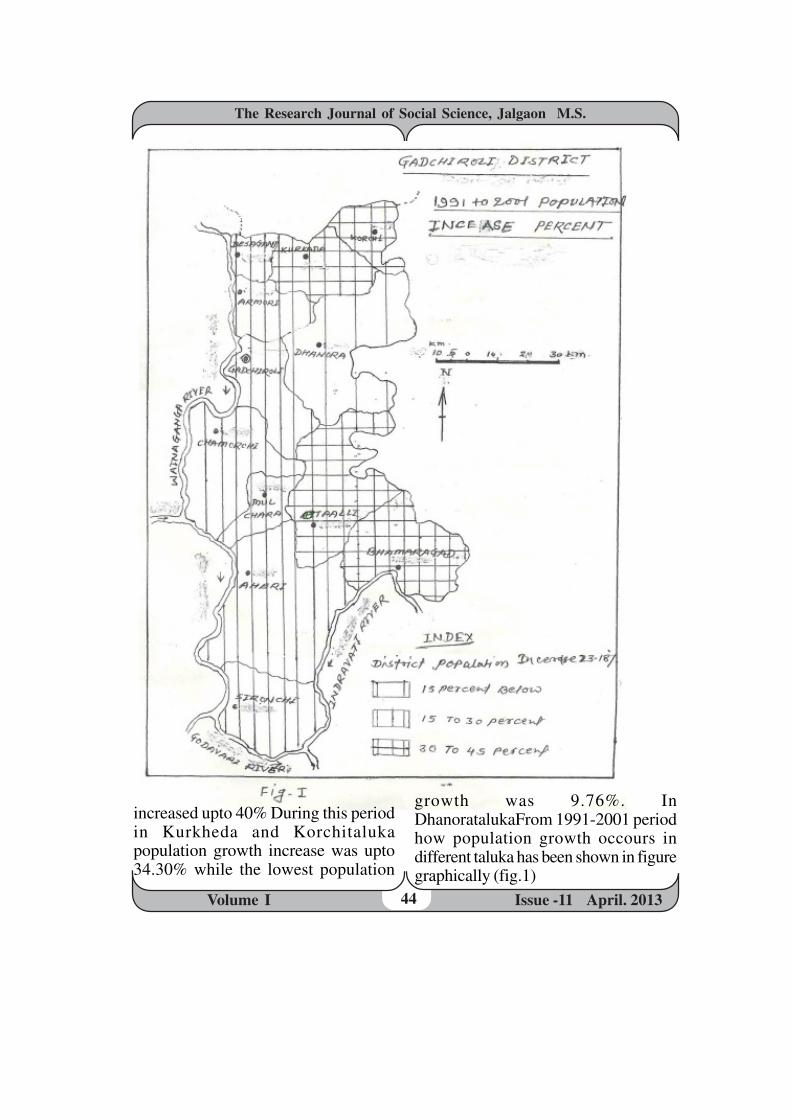
The Research Journal of Social Science, Jalgaon M.S.
Volume I Issue -11 April. 201344
growth was 9.76%. InDhanoratalukaFrom 1991-2001 periodhow population growth occours indifferent taluka has been shown in figuregraphically (fig.1)
increased upto 40% During this periodin Kurkheda and Korchitalukapopulation growth increase was upto34.30% while the lowest population

The Research Journal of Social Science, Jalgaon M.S.
Volume I Issue -11 April. 201345
get increae in moderate level. In easternside mountain ranges Tribal regionshows increase in population growthwhile in western side scheduled regionshows less population growth. In thisdistrict 1/3rd of the area is of villagetype. In this region the populationgrowth rate was low while undevelopedforest region shows increase inpopulation growth. This clearly showsthat there are the region in this district.On eastern side undeveloped region ispresent while in westernside showsmedium level of population growth.This shows that district has been dividedin two parts.RESULT AND CONCLUSION :-
From the present research paperdone it shows that the population growthin Gadchiroli district has been getincreased population get spreaded dueto impact of landscape faming industrialworks, economical and social issues hasbeen included. Population growth showsvariation in natural as well as migrationof people from one place to another inyear 1901 the population of the districtwas 1,77,244 and after 100 years i.e. in2001 it gets increased upto 9,70,294.It means that area which has beenincluded in district shown populationgrowth rate of 446.05% while the
population growth was low in the years1901-1961. After that population getstarted to increase exponentially. Ineasternside of district population growthwas more but it shows stable population.
In easternside of the district thepopulation growth has been increasing.In this area tribal community populationis more and the literacy rate was alsolow The development of this district isvery low they still belive that thechildren’s are the gift given to them bygod so in this district improvementshould have to be taken place to improvethe conditions prevailing there. In thisarea vehicle availability medicalfacilitiesavailabilities should beimproved. People should be teached toget awareness about the growing ofpopulation to control the growthrate ofpopulation. To decrease populationgrowth birthrate should be decreased.Apart from that migrationof Bengalipeople’s from other district shoould bebanned to decrease the populationgrowth.ReferencevBarclay, G.W. (1959); “Techniques of
population Analysis”, New York, JohnWiley, Pp. 28-29 and 206-208
vSharma, S. K. (2006); “Curvingpopulation Growth in India-Annals ofthe national Association ofGeographers, India,” New Delhi,Vol.26, No.2, Pp.45-55.
vCensus of Gadchiroli District (1991)Part-III, A.
vCensus of Gadchiroli District (2001)General Population Tables.
In northern Eastern side ofdistrict in Dhanoratauka growth rate wasvery low while in northern side likeKurkheda and Korchi and eastern sidelike Bhamaragarh and Ettapallitalukagrowth rate was 30.40% waingangaRiver is lying in western side of thetaluka and covers upto 15-30% it means

The Research Journal of Social Science, Jalgaon M.S.
Volume I Issue -11 April. 201346
“SPATIO-TEMPORAL CHANGES IN LAND USE AND
CROPPING PATTERN IN BRAMHAPURI SUBDIVISION AREA
IN CHANDRAPUR DISTRICT, MAHARASHTRA”
Dr. Rajendrakumar K. Dange
Abstract- Since independence, India witnessed considerable change in land use andcropping pattern. The intensive growth of population pressure and attendantdemand of land to accommodate various activities are the prime drivers of change.The growth of population leads to spatio-temporal change in land use pattern. Inthis paper an attempt to analysis the spatio-temporal changes in the land use andcropping pattern in response to population growth during last two decades ( 1990-91 and 2010-11) in the Bramhapuri subdivision area. In the last two decades the scenario of the land use pattern and the croppingpattern in the subdivision area were change. In 1990-91 out of the totalagricultural area 96.1 percent of agricultural land under food crops; but in 2010-11 the food crops cultivated area increase to 97.9percent.The cropping patternof the subdivision has changed towards commercialization due to increased inthe irrigation potentiality, transport, communication, market facilities etc. Thecultivation of commercial crops has impact on socio-economic developmentof famers compared to food crops growing famers. The diversified nature ofland use pattern and cropping pattern of the subdivision has increased productioncapacity and cropping intensity of the land. In the present scenario need to strength on the irrigation facilities, soil andmoisture conservation, adaption of biotechnology, a forestation changing in thecropping pattern, agronomic practices, livestock development, ruralcommunications, development of small, medium and marginal farmers,agricultural labours and setting up agro-based industries.Key words: Agriculture, Land use, Cropping pattern, Spatio-temporal changes,Irrigated area, Crop intensity, Population growth.
Introduction: The land is considered as animportant resource. So an assessmentand improvement of the use of land areessential to any significant increase infood supply especially in developing
countries of the world. In most of thedeveloping countries there is an urgentneed to extent and improve theexploitation of land resource to achievethe maximum out put of crops ; livestockas well as to ensure the productive

The Research Journal of Social Science, Jalgaon M.S.
Volume I Issue -11 April. 201347
capacity of the land. Since independenceIndia witnessed considerable change inland use and cropping pattern. Theintensive growth of population pressureand attendant demand of land toaccommodate various activities are theprime drivers of change. The growth ofpopulation leads to slatio-temporalchange in the land use pattern. In thispaper an attempt is made to analyses thespatio-temporal changes in the land useand cropping pattern in response topopulation growth during last twodecades(1990-91 to 2010-11) in thesubdivision area.Objectives: This paper aims to evaluatechanging land use, agriculture land useand cropping pattern, crop intensity andto examine the population growth andland use change in Bramhapurisubdivision area.Database and Methodology: Thesecondary data have been collected fromvarious published reports of subdivisionarea for 1990-91 and 2010-11 toanalyses the land use and croppingpattern. Simple statistical techniques(percentage and average) are used toanalyze the changing trend in croppingpattern and crop intensity
Crop intensity = × 100Gross cropped areaNet sown area
Study area: Bramhapuri subdivision areais situated north-east past ofMaharashtra state lie between 20o 0’
to20o 40’ N latitudes and 79o 20’ to 80o
0’E longitude. This area belongs to themonsoon climatic region. Thesubdivision is consisting three revenuetalukas namely Bramhapuri, Nagbhid andsindewahi. The subdivision haspopulation 3, 84,186 (2001 census) andit has 2219 square kilometer ofGeographical area. Out of the totalgeographical area of the subdivision39.90 percent of area is used foragriculture in 1990-91 but it decreaseto 36.58 percent in 2010-11. In the lasttwo decades the scenario of land usepattern and cropping pattern in thesubdivision were change drastically.Land utilization pattern: The largest portion of thenatural resource of the study areaconsists of land and by far the largerproportion of inhabitants is engaged inthe exploitation of land. In many schemeof land use planning in the subdivisiontherefore agriculture organization andreform hold a position of basicimportance. Recently an account of thegrowth need for food and raw materialshave been brought home to all sectionof the community. In this sense theimportance of agriculture is both basicand vital. According to 1990-91 census data89.79 percent of the working populationof subdivision was directly engaged ascultivators and agriculture labours. Thesubdivision as a whole had 39.90percent of its area under cultivation. But

The Research Journal of Social Science, Jalgaon M.S.
Volume I Issue -11 April. 201348
this scenario was changed in 2010-11,in the study area about 83.54 percent ofworking population engaged ascultivators and agriculture labours and37.04 percent of the area undercultivation. In these decades theagriculture area was decreased to 2.94percent, because of the current fallowland from 0.7 percent to 4.5 percent. Thehigh percentage of current fallow landwas reported in Sindewahi (10.5percent), Nagbhid (5,8percent) andBramhapuri (2.6 percent) talukas. In thesome areas particularly marginal landswith poor quality soil are periodicallyleft as fallow to regain soil fertility.Besides certain land remain either dueto idleness or poverty of the individualcultivator. The total area under forest in the studyarea is 51.30 percent i.e.123100hectares. Out of this Bramhapuri talukahas highest forest area i.e.51018 hectares(54.1 percent) and lowest is reportedNagbhir taluka i.e.33429 hectares (46.1percent). Accurate statistics regardingthe area under forest are not available,because whatever the figures available inthe district forest department is includesa considerable area of un wooded wasteland ,but no account is taken of tree landsand there are gaps in coverage in respectof different talukas. The permanent pasture andgrazing land occupying only about 2.4percent (5822 hectare) of the total areain the subdivision .The highest permanent
pasture and grazing land is in Nagbhid(3.8 percent) and lowest is inBramhapuri taluka (2.1 percent ) . Thewestern part of the subdivision areacharacterized by hilly, rugged terrain andforest under this category. Thesepasture lands are capable of sustainingof livestock population. The irrigatedarea has increase 15.27 percent in 1990-91 to 17.75 percent in 2010-11 mainlythrough the extension of Ghodazari andAsolamendha cannels. It has beennoticed that the increased in theirrigation area but not to increase thearea sown more than once.Changing of Land use pattern: In order to study the changes inland use pattern in subdivision comparedto land use data of 1990-91 and 2010-11 (Table no.1).Area under currentfallow land, barren and uncultivable land,cultivable waste land, gross irrigatedarea all these showed increasing trend.Some categories showed decreasingtrend in area under non-agriculture use,permanent pasture and grazing lands.Netsown area and grass cropped areas aredecreased 1.47 percent and 2.94 percentrespectively. This trend is expected asthere is growing demand for land to theneed of increasing population. The totalnet sown area has slightly decreased to1.47 percent. In the study region currentfallow land, barren and un-cultivablelands are increased by the creating newsettlements, lay-out and roads etc. Insubdivision area the forest covered areais unchanged over decade.
The Research Journal of Social Science, Jalgaon M.S.
Volume I Issue -11 April. 201349
Growth of population and
availability of land: The subdivision has occupied 23.73percent area out of the total geographicalarea in the chandrapur district. Thepopulation density is also low i.e.173person per square kilometer area againstthe 182 persons in chandrapur and 314persons in Maharashtra state. The rate ofpopulation growth in the subdivision hasalways remained considerably lower (+11.62 percent) than the district (+17.26percent) and the Maharashtra average(+22.60 percent).With in subdivision,during 1990-91 to 2010-11 periodNagbhir is the most densely populatedarea having 189 person per squarekilometer and sindewahi taluka issparsely populated track with 170 personper square kilometer. In the subdivision area, percapita availability of cultivated land hasdeclined as consequences of increase inpopulation. So also the per capita grosscropped area, which declined from 0.28hectare in 1991 to 0.23 hectare in 2011during this period population ofsubdivision increased by 11.62 percent. The net sown area decreased by 1.47percent and grass cropped areadecreased by 2.94 percent in this periodfrom 1991 to 2011.The topographiccondition and scope of agriculturalexpansion are the important factors incontrolling per capita availability of landin all talukas.
Cropping pattern: The study region principal crops aregrowing in kharif season because theregion receives most of its rainfallduring this time. Agriculture economyof this subdivision is based on the singlerain-fed kharif crop. Out of the totalagricultural area of the subdivision,about 95.42 percent of agricultural areais devoted to food crops and remaining4.58 percent of land is under non-foodcrops. Cereals crop like rice (74.32percent) cover most of the area underfood crops. Wheat (4.5percent) andtotal pulses (15.3 percent) are most ofthe important crops in the subdivision,its occupied 2nd and 3rd rank among theindividual crops. The area under the rice is very highthroughout the subdivision, its occupied74.32 percent area among the individualcrops. Fruits and vegetable growing areaare occupied only for 1425 hectares instudy region; out of this highest area isrecorded in Bramhapuri taluka. All thesecrops required assured water supply andproper irrigation facilities, absence ofwhich is the major impediment to extendtheir area.Change in cropping pattern: Over a decade, marginaldecrease in net sown area was affectedon changing cropping pattern insubdivision area. The ratio of food cropand non-food crops to grass croppedarea is very one sided. The proportionof area under food crops (95.42 %) and

The Research Journal of Social Science, Jalgaon M.S.
Volume I Issue -11 April. 201350
non-food crops (4.58 %) remain slightlychange. Because the subdivision area hasno industrial development therefore theburden of growing population the foodcrop area marginally increase. (+1.42%) In order to the changes incropping pattern in Bramhapurisubdivision compared the agriculturalland use pattern data of 1990-91 and2010-11. (Table no. 2) Area under Rice,fruits and vegetable showed increasingtrend; but wheat, Jawar, total pulses, totaloilseeds cropped area shows decreasing.The total area under pulses decreasedmarginally (-3.3 percent) from 1990-91to 2010-11; but area under jawardecreased drastically to -7.4 percent.The area under Rice highly increased to+12.81 percent. Though this comparison isbetween to particular time period, yearsselected is fairly normal and averageyearly fluctuation in terms of area underdifferent crops in this 20 years of period.A tendency to bring more and more areaunder food crops can notice. Farmers are undergoing attitudinalchange, however they point out that lackof extension education efforts tosupply inputs to pursue modern scientificagriculture. The changes in tauka levelscan be attributed to farmer’s responseto climate and other environmentalconditions by virtue of their fieldexperience. When we seen in the lightof population growth, is remarkable
change that in spite of the increasingpressure population, the cultivators havenot devoted additional land to growexcept food crops Growth of foodcrops does not commensurate to thegrowth of population and there was nosubstantial change in productivity also.Intensity of cropping and Irrigation
pattern: In this paper hypothesized that thepositive relationship betweenagriculture intensity and populationdensity. In this section our enquiry is toexamine weather the pressure ofpopulation has created condition forintensification in cropping pattern, sothat the enhanced form production cantake care of the increasing humanpopulation. Where the scope ofhorizontal expansion of cultivated landis limited intense cape with growingpopulation. Table no. 3 reveals that theintensity of cropping has marginallydecrease in the year 1990-91 to 2010-11. Intensity cropping depends uponwater supply, climate and soil, immunityfrom floods water logging and improvedforming practices. In spite of good soil,favorable climate, growing populationand lack of irrigation facilities thathinder the cropping intensity, but wherethe irrigation facilities are less and thecropping intensity are also less.Therefore the area sown more than oncehas decreased form 18000 hectare(18.86 percent) to 13566 hectare.(15.01 percent)
The Research Journal of Social Science, Jalgaon M.S.
Volume I Issue -11 April. 201351
Table no.3 show that the croppingintensity is high in Nagbhid taluka,medium intensity was found inSindewahi 1991 but it change in 2011andlow intensity category in Brahmapuritaluka. At present out of the grassirrigated area 17.75 percent. The grassirrigated area receives water from canals14.71 percent, from open wells 12.50percent, Bore wells 7.40 percent andremaining 44.06 percent receives waterfrom tanks. The irrigation potential ofthe area is limited, as the flow of Riversand level of water tanks depend onmonsoon rainfall. According to thedepartment of ministry of irrigationMaharashtra more than 50 percent ofagriculture area can be brought undercanal irrigation through the GosikhurdDam project. But the project work hasnot completed last 20 years. Theirrigation potential of the district can beenhanced by constructing more tanks andwells.Concluding remarks: The study has brought out thatcropping pattern of the subdivision hasnot change significantly in spite ofpopulation growth. In this context thehypothesis is positive correlationbetween population growth and change
in cropping pattern .The directrelationship as observed in irrigatedarea, where population pressure is thedriving force in determining cropintensity. The diversified nature of land usepattern and cropping of the subdivisionhas increased the production capacityand cropping intensity of the land .In thepresent scenario needs to strengthen theirrigation facilities ,soil and moistureconservation, adaption of bio-technology, afforestation, changing inthe cropping pattern, agronomicpractices, livestock development ,ruralcommunication, development ofmedium, small and marginal farmers ,agricultural laboures and setting upagro-based industries. The dry landdevelopment program, sustenance ofanimal husbandry, fisheries,horticultural, sericulture and small scaleindustries at village level should be setup through the various programmes. Themain objective of these programmes ofagricultural development in thesubdivision area is rotating around thedrought situation. Therefore, plans onpermanent basis to promote agriculturedevelopment and restore the ecologicalbalance in the region.

The Research Journal of Social Science, Jalgaon M.S.
Volume I Issue -11 April. 201352
Table-1: Land Utilization Pattern in Bramhapuri Subdivision
S. Land Utilization pattern 1990-91 2010-11 PercentageNo. Area Percentage Area Percentage1. Total geographical area 239096 100.00 239096 100.00 -2. Total reported area for the 239096 100.00 239096 100.00 - Land utilization3. Forest 123100 51.48 122252 51.13 -0.274. Not available for cultivation (i) area put for non-agricultural use 21800 9.1 5466 2.2 -6.9 (ii) barren and un-cultivable land. 4000 1.6 13921 5.8 + 4.25.Other un-cultivated area excluding Fallow land. (i)permanent pasture and grazing land. 12300 5.1 5822 2.4 -2.7 (ii)land under miscellaneous tree crops And groves. 500 0.2 28 - -

The Research Journal of Social Science, Jalgaon M.S.
Volume I Issue -11 April. 201353
Table-2: Changing Pattern in agriculture land use
S. No. Cropping pattern 1990-91 20010-11 Change Area Percentage Area Percentage 1. Rice 58521 61.51 64911 74.32 +12.81 2. Wheat 4965 05.2 3957 4.5 -0.7 3. Jawar 8227 8.7 1142 1.3 -7.4 4. Total cereals 71713 74.41 70010 80.06 +5.65 5. Total pulses 17697 18.6 13432 15.3 -3.3 6. Total oilseeds 3650 3.8 1674 1.9 -1.9 7. Total cash crops 2017 2.1 2217 2.5 +0.4 8. Total food crops 89491 94.00 83450 95.42 +1.42 9. Non-food crops 5636 6.0 3883 4.58 -1.42. Total crops area 95127 100.0 87333 100.0 -Source: District land use Report, Chandrapur Note: Area is in hectares.
Source: District land use Report, Chandrapur Note: Area is in hectares.
(iii) cultivable waste 2200 0.9 3135 1.3 -0.406. Fallow land (i) current fallow 1900 0.7 10968 4.5 +3.6 (ii)other fallow 3100 1.3 3595 1.5 +0.27. Grass cropped area 95400 39.90 87455 37.04 -2.94 (i) Net sown area 77400 32.37 73889 30.90 -1.47 (ii)Area sown more than ones 18000 18.86 13566 15.51 -3.368 Grass irrigated area 36510 15.27 42447 15.75 +2.48
Table-3: Cropping Intensity Index
S Name of Taluka 1990-91 Cropping 2010-11 Intensity No. GCA NSA Intensity GCA NSA Index1. Nagbhid 30898 26351 117.25 27146 24282 111.792. Bramhapuri 38021 31632 120.19 37511 31238 120.083. Sindewahi 21644 18427 117.45 22014 18369 119.84
Subdivision 90563 76400 118.53 86671 73889 117.29Source: Computed by Authors Note: Area is in hectares.

The Research Journal of Social Science, Jalgaon M.S.
Volume I Issue -11 April. 201354
References
Boserup E (1965): “The conditions ofagricultural progress”, London, Allen anUnwin.Census Report (1990 and 2001):Government of IndiaDatye V. S.Jayamala& Gaikawad G.
D. (1983): “Process of landfragmentation and consolidation oncropping and productivity,”A case studyof village Nirgudi,Pune District; Annalsof the National association of IndiaVol.III, No.I p-12Dange R. K. ( 2011): “The presentagricultural condition in Bramhapurisubdivision area and its future” ,Unpublished Ph. D. thesis, RTMUniversity, Nagpur.Das K. N.(1973): “Population pressureand intensity of cropping in Kosi area,Bihar,”Geographical Review ofIndia,Vol.35 pp.384-396.Govt. of Maharashtra state
(1991&2011): Report on the survey ofcultivable waste land in Chandrapurdistrict.Kostrowicki. J (1974): The typologyof world agriculture principle; methods,model types, Warzawa(Memeographed) p.20Shafi M (1984): Agriculturalproductivity and Regional imbalance: Astudy of Uttar Pradesh, conceptpublishing company, New Delhe,p.53.
Sinde S. D.& More K(1979): CoastralMaharashtra , A study of in Ranking landand cropping pattern , NationalGeographer Vol.8 pp.37-47.Vaidya B. C. (2004): “Changes in landuse in cropping pattern in Cotton Beltof Vidarbha, A casestudy,”Annals,Vol.24,No.2,pp.65-73.
The Research Journal of Social Science, Jalgaon M.S.
Volume I Issue -11 April. 201355
AJANTA CAVES- ORCHESTRA OF TOURISM
Dr. B.B. Sonule
Associate ProfessorDept. of Geography, University of Mumbai
Abstract:
The caves of Ajanta have earned a worldwide fame. Some of themasterpieces of Indian arts are in the Ajanta caves. The subjects of the famouswall paintings are based on episodes related to Buddha and Bodhisattvas. Thewall painting reflects the life and culture of the people in that period. Man’sinteractions with nature give birth to his culture which is a sort of imaging throughwhich he learns to progress. In Ajanta caves all the manifestations of culture areexpressed in splendid combinations of art, skill, tools, colors and moreover itgives insight to the technique, stage of progress, life styles and dexterity andqualities of community. The present paper attempts to explore the various facetsof art, history, culture, religion, architecture and archaeological bearings whichpromote tourism in Ajanta cave sites. It also tries to discover the potentials oftourism development in the study area.Key Words: Ajanta caves, Bodhisattvas, culture, manifestations, community.
Introduction:India has about 30 rock-
cut Buddhist cave monuments datingfrom 2nd century BCE to about 480 or650 CE. The caves include paintings andsculptures described by the government Archaeological Survey of India as “thefinest surviving examples of Indian art,particularly paintings”which aremasterpieces of Buddhist religious art,with figures of the Buddha anddepictions of the Jataka tales. The siteis a protected monument in the care ofthe Archaeological Survey of India, andsince 1983, the Ajanta Caves have beena UNESCO World Heritage Site. Thefirst Satavahana period caves lacked
figurative sculpture, emphasizing thestupa instead, and in the caves of thesecond period the overwhelmingmajority of images represent the Buddhaalone, or narrative scenes of his lives.Some 20 cave temples of second phasewere simultaneously created, for themost part viharas with a sanctuary atthe back. The most elaborate caves wereproduced in this period, which includedsome “modernization” of earlier caves.The caves form the largest corpus ofearly Indian wall-painting; indeed othersurvivals from the area of modern Indiaare very few indeed, though they arerelated to 5th-century paintingsat Sigiriya in Sri Lanka. The area was

The Research Journal of Social Science, Jalgaon M.S.
Volume I Issue -11 April. 201356
previously heavily forested, and afterthe site ceased to be used the caves werecovered by jungle until accidentallyrediscovered in 1819 by a Britishofficer John Smith, of the 28th Cavalry,on a hunting party. They are Buddhistbuildings which represented a numberof distinct “monasteries” or colleges.The elaborate architectural carving inmany caves is also very rare, and thestyle of the many figure sculptures is ahighly local one, found only at a coupleof nearby contemporary sites, althoughthe Ajanta tradition can be related tothe later Hindu Ellora Caves and othersites. The caves are numbered 1 to 28according to their place along the path,beginning at the entrance. Several areunfinished and some barely begun andothers are small shrines, included in thetraditional numbering as e.g. “9A”;“Cave 15A” was still hidden underrubble when the numbering wasdone. Further round the gorge are anumber of waterfalls, which when theriver is high are audible from outsidethe caves.Objective:The main objectives of this researchpaper are:1. To study the factors promotingcultural, historical, archaeological,architectural, and religious tourism inthe study area.2. To identify the potentials fordeveloping tourism at the site of AjantaCaves.Data Source and Methodology:Various data sources have been used for
the study including primary andsecondary sources. Survey of IndiaToposheet No 46 P and The ImperialGazetteer of India Volume no. XVI.Cartographic techniques relevant for thestudy were applied for preparation ofmaps. Field visit was made to obtainrelated information and photographs.STUDY AREA:
The caves are located in the Indianstate of Maharashtra, near Jalgaon andjust outside the village of Ajanta 20°312563 N 75°442 443 E (Fig.no.1) about59 kilometers (36 miles) from Jalgaonrailway station on the Delhi – Mumbailine and Howrah-Nagpur-Mumbailine of the Central Railway zone, and104 kilometers (64 miles) from the cityof Aurangabad. They are 100 kilometers(62 miles) from the Ellora Caves, whichcontain Hindu and Jain temples as wellas Buddhist caves, the last dating from aperiod similar to Ajanta. The Ajantacaves are cut into the side of a cliff thatis on the south side of a U-shaped gorgeon the small river Waghora (or Wagura),and although they are now along andabove a modern pathway running acrossthe cliff they were originally reached byindividual stairs or ladders from the sideof the river 35 to 110 feet below.ANALYSIS AND INTERPRETATION:Following important observa- tionsreflect the potentials for developingtourism at the Ajanta cave site.THE ARCHAEOLOGICAL ANDARCHITECTURAL ASPECTS: The monasteries mostly consistof vihara halls for prayer and living,

The Research Journal of Social Science, Jalgaon M.S.
Volume I Issue -11 April. 201357
which are typically rectangular withsmall square dormitory cells cut intothe walls, and by the second period ashrine or sanctuary at the rear centredon a large statue of the Buddha, alsocarved from the living rock.
This change reflects the
movement from Hinayana to
Mahâyâna Buddhism. The other
type of main hall is the
narrower and higher chaitya hallwith a stupa as the focus at the far end,and a narrow aisle around the walls,behind a range of pillars placed closetogether. Other plainer rooms were forsleeping and other activities. Some ofthe caves have elaborate carvedentrances, some with large windowsover the door to admit light. There isoften a colonnaded porch or verandah,with another space inside the doorsrunning the width of the cave. Thecentral square space of the interior ofthe viharas is defined by squarecolumns forming a more or less squareopen area. Outside this are longrectangular aisles on each side, forminga kind of cloister. Along the side and rearwalls are a number of small cells enteredby a narrow doorway; these are roughlysquare, and have small niches on theirback walls. Originally they had woodendoors. The centre of the rear wall has alarger shrine-room behind, containing alarge Buddha statue. The viharas of theearlier period are much simpler, and lackshrines. Spink in fact places the changeto a design with a shrine to the middleof the second period, with many caves
being adapted to add a shrine in mid-excavation, or after the original phase.The caves at Ajanta are excavated in thesemicircular steep massive rock about76 m high. There is a narrow sinuousgorge through which Waghur Riverflows. It descends at the head of theravine beyond cave no. 28 with a cascadeor rapids known as “Satkund”. This canbe watched from cave no. 16. Ajanta viewpoint is located at a distance of 90 kmsfrom Aurangabad on the way to the caves,one get a fine panoramic view of all 30caves. The caves extend to 550 metersin a horse shoe form. The floor levelsof all caves are on unequal heights. Caveno 8 is on the lower level and cave no.29 occupy higher level. A terracedpavement connects all the caves.
Due to difficulty of access, theAjanta caves were but little visited until1843. Mr. Fergusson’s paper on rock-cut temples of India created a generalinterest in this remarkable work of art.Twenty- four monasteries’ (Vihars) andfive temples (Chaityas) have been hewnout of solid rock, many of themsupported by lofty pillars, richlyornamented with sculpture and coveredwith highly finished paintings. Thefollowing brief description iscondensed chiefly from notes by Dr.Burgess (1908). The five Chaityas orcave temples for public worship, areusually about twice as long as they arewide, the largest being 94.5 feet by 41.5feet. The back or inner end of theChaityas is almost circular; the roofs arelofty and vaulted. Some ribbed with

The Research Journal of Social Science, Jalgaon M.S.
Volume I Issue -11 April. 201358
wood, others with stone cut inimitations of wooden ribs. A colonnadehewn out of the solid rock runs roundeach, dividing the nave from the aisles.The columns in the most ancient cavesare plain octagonal pillars without basesor capitals with richly ornamentedshufts. Within the circular end of thecaves stands the daghoba (relic-holder),a solid mass of rock, either plain orrichly sculptured, consisting ofcylindrical base supporting a cupola(garbha), which in turn surmounted by asquare capital or “tee” (toran). Thetwenty four viharas, or Buddhistmonasteries’ containing cells, areusually square in form, supported byrows of pillars, either running roundthem and separating the great central hallfrom the aisles, or disposed in fourequidistant lines. (Fig-2)
In the larger caves a veranda cutout of the rock, with cells at either end,shades the entrance, the great halloccupies the middle space, with a smallchamber behind and a shrine containinga figure of Buddha enthroned. The wallson all the three sides are excavated in tocells, the dwelling places (grihas) of theBuddhist monks. The simplest form ofthe vihara or monastery is a varanda hewnout of the face of the precipice, withcells opening from the back in to therock. Very few of the caves seem to havebeen completely finished, but nearly allof them appear to have been painted onthe walls, ceilings, and pillars, inside andout. Even the sculptures have all beenrichly coloured. Twenty five
inscriptions, seventeen painted ones inthe interior, eight rocks inscriptionsengraved outside- commemorate thenames of pious founders in Sanskrit andPakrit. One monastery has its wholefaçade richly carved, but as a rule, suchornamentation is confined in themonasteries (viharas) to the doorwaysand windows. More lavish decorationwas bestowed upon the temples(chaityas) the most ancient havesculptured facades, while in the moremodern ones the walls, columns,entablatures and daghoba are coveredwith carving. The sculptures showknowledge of arts and consist chiefly ofBuddhas, or Buddhist teachers, in everyvariety of posture, instructing theirdisciples. A grand gateway to the site, atthe apex of the gorge’s horsehoebetween caves 15 and 16, wasapproached from the river, and isdecorated with elephants on either sideand a nâga, or protective snake deity.HISTORICAL AND RELIGIOUSDYNAMISM:
There are in all 30 caves. Themaking of and adoring these caves issupposed to be continued for 100 yearsfrom second century B.C. to the eighthcentury A.D. Historically the cavesform two groups. The oldest caves areVIII, IX, X, XII and XIII excavated andadorned under the reigns ofAndhrabhitya and Satukarni kings. Othercaves are excavated later on. Majorityof the caves are complete with wallpaintings while few of them areincomplete. The painting and sculpture

The Research Journal of Social Science, Jalgaon M.S.
Volume I Issue -11 April. 201359
are of Buddhist origin. They depict thelife of Buddha and social life in thatperiod. This gives ample proof of theadvancement in painting, making ofdifferent shades of paints and tools by200 years ago. The 7th-centurytravelling scholar Xuanzang informs usthat Dinnaga, the celebrated Buddhistphilosopher and controversialist, authorof well-known books on logic, livedthere in the 5th century. In its prime thesettlement must have accommodatedseveral hundred teachers and pupils.Many monks who had finished theirfirst training may have used Ajanta as abase to return to duringthe monsoon season from an itinerantlifestyle.ART WORKS:
The paintings, writes Dr.Burgess, (1908) have much higherpretensions, and have been consideredsuperior to the style of Europe in theage when they were probably executed.Mural paintings survive from both theearlier and later groups of caves.Several fragments of murals preservedfrom the earlier caves (Caves 9 and 11)are effectively unique survivals ofcourt-led painting in India from thisperiod, and “show that by Sâtavâhanatimes. Four of the later caves have largeand relatively well-preserved muralpaintings which “have come torepresent Indian mural painting to thenon-specialist”,[33] and fall into twostylistic groups, with the most famousin Caves 16 and 17, and apparently laterpaintings in Caves 1 and 2. All the
paintings appear to be the work ofpainters at least as used to decoratingpalaces as temples, and show afamiliarity with and interest in detailsof the life of a wealthy court. The humanfigure is represented in every possiblevariety of position, displaying someslight knowledge of anatomy, andattempts at foreshortening have beenmade with surprising success. The handsare generally well and gracefully drawn,and rude efforts at perspective are to bemet with. Besides paintings of Buddhaand his disciples and devotees, there arerepresentations of streets, processions,battles, interiors of houses with theinmates pursuing their dailyoccupations, domestic scenes of loveand marriage and death, groups ofwomen performing religious austerities,there are hunts men, on horsebackspearing the wild buffalo, animals, fromthe huge elephant to the diminutive quail;exhibitions of cobras, ships, fish etc.CULTURAL ASPECTS:
The common earthen water potand lota, a drinking cup and one or twoother dishes, a tray, an elegantly shapedsort of jug having an oval body and longthin neck with lip and handle, togetherwith a stone and roller for grindercondiments, being all that areobservable. The same lack of weaponsof war, either offensive or defensive, isalso to be noticed. Swords, straight andcrooked, long and short, spears ofvarious kinds, clubs, bows and arrows, aweapon resembling a bayonet reversed,a missile like a quoit with cross bars in

The Research Journal of Social Science, Jalgaon M.S.
Volume I Issue -11 April. 201360
the center, and shields of different form,exhaust the list. There is also a thingwhich bears a strong resemblance to aGreek helmet, and three horses are tobe seen yoked abreast, but where theywere originally attached to a war-chariot cannot be determined. Thepaintings have been in the most brilliantcolors- the light and shade are verygood, they must have been executedupon a thick layer of stucco. In manyplaces, the color has penetrated to aconsiderable depth. Of the date of thesepaintings it is not difficult to form avery definite estimate, nor are they allof the same age. The scenes representedare generally from the legendary historyof Buddha and the Jatakas, the visit ofAsita to the infant Buddha, thetemptation of Buddha by mara and hisforces, Buddhist miracles, the Jatakasof king Sibi, legends of the Nagas,hunting scenes, battle-pieces, thecarrying off the relics in Sri Lanka.
The cave-temples andmonasteries of Ajanta furnish acontinuous narrative of Buddhist artduring 800 years, from shortly after thereign of Asoka to shortly before theexpulsion of the faith from India. Theoldest of them are assigned to about 200B.C. the most modern cannot be placedbefore the year A.D. 600. For manycenturies they enable us to study theprogress of Buddhist art, and ofBuddhist conceptions, uninfluenced byHinduism. The chief interest of thelatest Chaitya, about A.D. 600, is toshow how nearly Buddhism had
approximated to Brahmanism, beforethe convulsions amid which itdisappeared. The liberality of the Indiangovernment had enabled Major Gill totake up his residence in Ajanta, and toprepare a magnificent series offacsimiles from the frescoes. Theseunfortunately perished in the fire at thecrystal palace in 1860, but reductionsof two of the more important of them,and of eight detached fragments, exist(Mrs. Spiers life in Ancient India).Recently the matchless art series ofAjanta has been made available to theWestern world by Griffiths.CONCLUSIONS AND SUGGES-TIONS:
Until the Nizam of Hyderabad built the modern path between thecaves, among other efforts to make thesite easy to visit, a trip to Ajanta was aconsiderable adventure, andcontemporary accounts dwell withrelish on the dangers from falls offnarrow ledges, animals and the Bhilpeople, who were armed with bows andarrows and had a fearsome reputation.Today, fairly easily combined withEllora in a single trip, the caves are themost popular tourist destination inMaharashtra, and are often crowded atholiday times, increasing the threat tothe caves, especially the paintings.Damage to cave walls is pertinent. Thusthough, tourism today is an importantsector of the world economy; withoutdoubt it is less damaging to theenvironment than the other industry, forinstance, yet it still presents a number

The Research Journal of Social Science, Jalgaon M.S.
Volume I Issue -11 April. 201361
of problems. Sustainable tourism maycontribute to the resolution of theseproblems to some extent. In the studyarea tourism is perceived as animportant means of regionaldevelopment. The problems related toenvironmental, social and economicimpact could be ameliorated andavoided through planning. This requiresa diversity of development of efficienttransportation, accommodation, foodservices for the promotion ofsustainable tourism in the area.References:1) Burgess, James and Fergusson.(
2005) Cave Temples ofIndia. (London: W.H. Allen & Co.,1880.
2)Burgess, James.(1964) BuddhistCave Temples and TheirInscriptions, Archaeological Surveyof Western India,
3) Behl, Benoy K, (1998) The AjantaCaves (London: Thames & Hudson,1998. New York: Harry N. Abrams
4) Cohen, Richard S. ,( 2006),“Ajanta’s Inscriptions.”In Walter M.Spink, Ajanta:History AndDevelopment, volume 2
5)Cohen, Richard S.(1998):Nâga,Yaksinî,Buddha: Local Deities
and Local Buddhism at
Ajanta, History of Religions6)Cohen, Richard S. (1997)”Problems
in the Writing of Ajanta’s History:The Epigraphic Evidence,” Indo-Iranian Journal
7)Griffiths, J. (1897) Paintings in theBuddhist Cave Temples of Ajanta, 2vols.London.
8) Parimoo, Ratan; et al.(1991) The Artof Ajanta: New Perspectives, 2 volsNew Delhi,
9) Schlingloff, Dieter.(1987) Studiesin the Ajanta Paintings:Identifications and Interpreta-tions New Delhi
10) Shastri, Ajay Mitra, ed.(1992) TheAge of the Vakatakas New Delhi:Harman,
11) Singh, Rajesh Kumar.(2012) ‘TheEarly Development of the Cave 26-Complex at Ajanta,’ South AsianStudies London: , vol. 28, No. 1,
12) Singh, Rajesh K.(2012) AnIntroduction to the AjantaCaves Baroda: Hari Sena Press,
13) Singh, Rajesh Kumar.(2008) “SomeProblems in Fixing the Date of AjantaCaves,” Kala, the Journal of IndianArt History Congress 17,
14) Spink, Walter M.(1981) “Ajanta’sChronology: Cave 1’sPatronage,” Chhavi 2, ed. Krishna,Anand Benares: Bharat Kala Bhawan,.
15) Spink, Walter M.(1968) “Ajanta’sChronology: The Problem of Cave11,” Ars Orientalis, 7
16) Spink, Walter M. (1987)”Ajanta’sPaintings: A Checklist for theirDating,” Dimensions of Indian Art,Pupul Jayakar Felicitation Volume,ed. Chandra, Lokesh; and Jain,Jyotindra (Delhi: Agam KalaPrakashan

The Research Journal of Social Science, Jalgaon M.S.
Volume I Issue -11 April. 201362
SPATIAL DISTRIBUTION OF ARABLE LAND IN JALGAON
DISTRICT: A GEOGRAPHICAL ANALYSIS
- Mr. S. N. Bharambe
(Associate Professor)- Dr. A. S. Bhole (Research Guide),Dept. of Geography, M.J.College, Jalgaon ( M.S. )
INTRODUCTION :
The population continues togrow rapidly in the developingcountries and great pressure is beingplaced on arable land, water, energy andbiological resources to provide anadequate supply of food and energyrequirements. Even if these resourcesare never exhausted, on per capita basisthey will decline significantly becausethey must be divided among morepeople. Land is one such naturalresources of nation on which the entiresuperstructure is created. Thus, land useis a synthesis of physical, chemical andbiological system and processes on theone hand human/social processes andbehavior on the other hand, land isimportant not only for producing foodstaffs, cereals, fruits and vegetables forconsumption but also for generatingsurpluses to meet the increasingdemand created by rising population anddeveloping industrial sector for layingdown the transport network,communication lines, for theconstructions of dwellings publicinstitution etc. Due to unprecedentedpopulation growth; man has made usesand misuses of land resources causing
environmental degradation (Ms. SoumyaMahanty) . Agricultural land use and population,its management and relationship is basicproblem of modern developing ward.Land may be regarded as a basic resourcewithin and upon which human activitiesare carried out indisputably leading to alltypes of productions. In agriculturalperspective world’s cultivated land arelimited while population is growingrapidly and consequently, with passageof time each one of us will get less food,fiber, fuel and fodder. In order to meetthis challenge a rational and efficient useof agricultural land need to be given toppriority in its developmental strategy andplanning .From the global scenario, theagricultural circumstances on the Indianscene are not much different. In contrastto galloping population, its growinggreed and need in terms of both qualityas well as quantity, the per capitaagricultural land is gradually andperceptibly limited and less available. Innear feature, it is bound to be futurereduced. Thus ,what is happening atglobal national and regional levels is verywell reflected in the studies carried outat the sub-regional and local level.

The Research Journal of Social Science, Jalgaon M.S.
Volume I Issue -11 April. 201363
The present study analyses thespatial characteristics of per capita landavailable and factors influencingvariations in land-man ratio and studiesthe intensity of population pressureparticularly suited to diversified terrainwhere maximum proportion of dailycaloric intake per person is obtainedfrom food grain. AIMS AND OBJECTIVES :
The main objectives of the proposedresearch work is 1)To analyse arable land resources 2)To analyse spatial characteristics oftahsils having varying quality of percapita of arable landTHE STUDY AREA
Jalgaon district lies in theNorthern most part of state ofMaharashtra covering about 11765 sqkm. area. The district lies between 200and 210 North latitude and 74055’ and76028’East longitude. Towards North,the district is surrounded by Sapuraranges, a mountain tract of 40 to 60 kmwide and bordered by state of MadhyaPradesh. A major part North westernboundry is marked by tributary Anerwhich separates district of Jalgaonfrom the district of dhule till itsjunction with Tapi To the south, theAjanta, Satmala and Chandor rangesmay roughly be said to mark territory.On the west, Jalgaon shares itsboundary with Nasik district over astretch about 40km and then with Dhuledistrict for about 80km,The Panjharariver being the only natural feature
demarcating it over a major srtetch inthe East and south east without anymarked natural boundary seperatesJalgaon from the Buldhana of Vidarbha. Land resource of Jalgaon district hasbeen largely agriculture dominatedfollowing more or less a subsistenceeconomy. On the other hand, the districtexperienced a rapped increase in thistotal population during the last fewdecades and exerting heavy pressure onits agriculture land utilization. Its land-man ratio is changing and deteriorating.It is therefore essential to understand themagnitude of problem arisen by highpopulation growth in the region in viewof this, Jalgaon district has been selectedto study the spatial distribution of arableland over time and space.DATA SOURCE :
The present study is based onboth primary and secondary data source.Information has been called fromvarious sources and they includepublished and unpublished maps,literature, census data, unpublishedpublished data from official sources andpersonal field investigation.Thesecondary data covers all publishedmaterials and unpublished records whichwere preserved in the department of landrevenue. The tahsil office was the primesource for area under various cropsduring different period. Besides this, thepublished records like Socio-economicabstract of Jalgaon district, DistrictCensus Hand book, District statisticalreport of Jalgaon district, Season andCrop report, Jalgaon district Gazetteer,.
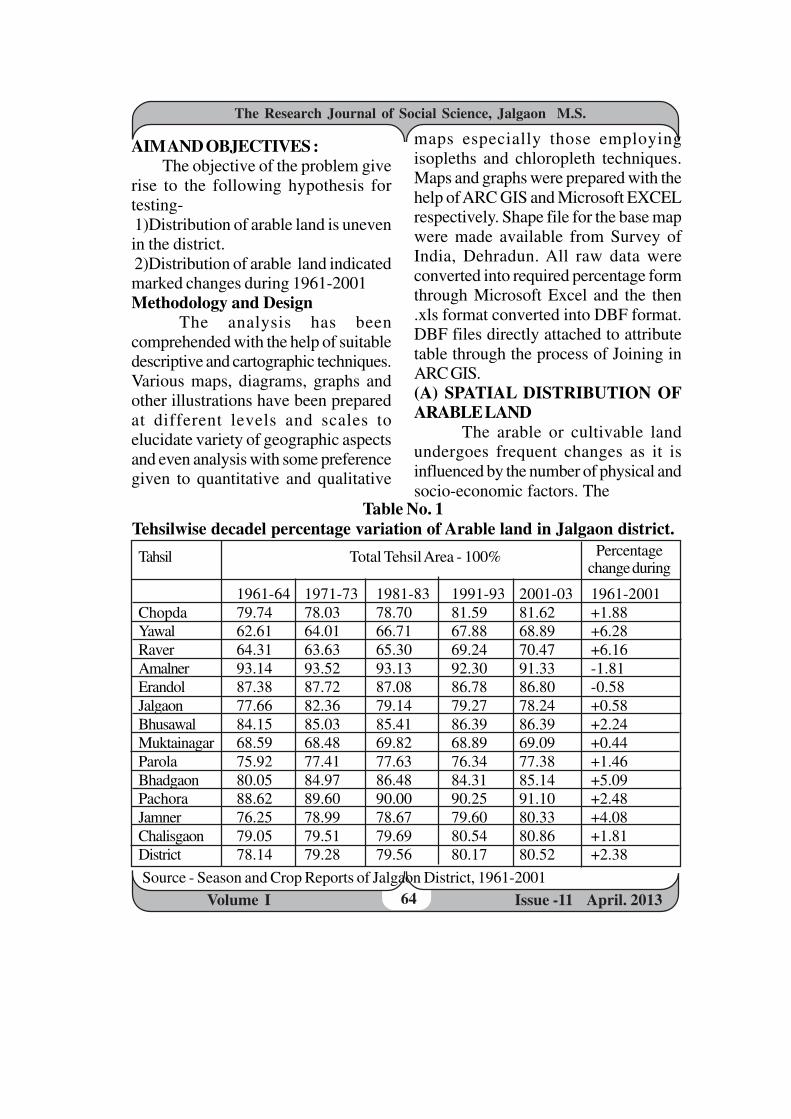
The Research Journal of Social Science, Jalgaon M.S.
Volume I Issue -11 April. 201364
AIM AND OBJECTIVES :
The objective of the problem giverise to the following hypothesis fortesting- 1)Distribution of arable land is unevenin the district. 2)Distribution of arable land indicatedmarked changes during 1961-2001Methodology and Design
The analysis has beencomprehended with the help of suitabledescriptive and cartographic techniques.Various maps, diagrams, graphs andother illustrations have been preparedat different levels and scales toelucidate variety of geographic aspectsand even analysis with some preferencegiven to quantitative and qualitative
maps especially those employingisopleths and chloropleth techniques.Maps and graphs were prepared with thehelp of ARC GIS and Microsoft EXCELrespectively. Shape file for the base mapwere made available from Survey ofIndia, Dehradun. All raw data wereconverted into required percentage formthrough Microsoft Excel and the then.xls format converted into DBF format.DBF files directly attached to attributetable through the process of Joining inARC GIS.(A) SPATIAL DISTRIBUTION OF
ARABLE LAND
The arable or cultivable landundergoes frequent changes as it isinfluenced by the number of physical andsocio-economic factors. The
Tahsil Total Tehsil Area - 100%
1961-64 1971-73 1981-83 1991-93 2001-03 1961-2001Chopda 79.74 78.03 78.70 81.59 81.62 +1.88Yawal 62.61 64.01 66.71 67.88 68.89 +6.28Raver 64.31 63.63 65.30 69.24 70.47 +6.16Amalner 93.14 93.52 93.13 92.30 91.33 -1.81Erandol 87.38 87.72 87.08 86.78 86.80 -0.58Jalgaon 77.66 82.36 79.14 79.27 78.24 +0.58Bhusawal 84.15 85.03 85.41 86.39 86.39 +2.24Muktainagar 68.59 68.48 69.82 68.89 69.09 +0.44Parola 75.92 77.41 77.63 76.34 77.38 +1.46Bhadgaon 80.05 84.97 86.48 84.31 85.14 +5.09Pachora 88.62 89.60 90.00 90.25 91.10 +2.48Jamner 76.25 78.99 78.67 79.60 80.33 +4.08Chalisgaon 79.05 79.51 79.69 80.54 80.86 +1.81District 78.14 79.28 79.56 80.17 80.52 +2.38
Percentagechange during
Table No. 1
Tehsilwise decadel percentage variation of Arable land in Jalgaon district.
Source - Season and Crop Reports of Jalgaon District, 1961-2001

The Research Journal of Social Science, Jalgaon M.S.
Volume I Issue -11 April. 201365
percentage of the arable land to the totalgeographical area averages 78.80. Thetable no. 2.2 gives the decadelpercentage changes of the arable landin the district which was only 0.79percentage.
The rate of development wasvery slow as compared with other partof the state, especially in the Westernpart of Maharashtra. Not only that two
tehsils of the district had shown anegative variation. Even the positivevariation is less than 7 percent in mostof the tehsils. Yawal and Raver were thetehsils were arable land had increasedsignificantly followed by Bhadgaon(5.09) and Jamner (4.08). Table no. 2.3shows a balance sheet of the increase /decrease in arable land and the names ofdonors / receivers from non-arable land.
Table No. 2
The increase/ decrease in arable land over 40 years (1961-2001)
Tehsil
Forest Barren land
Chopda 2.08 -4.34 2.24 0.02Yawal 6.28 -8.87 2.07 0.52Raver 6.16 -7.75 0.12 1.45Amalner -1.81 -0.48 1.04 1.26Erandol -0.58 -2.33 -1.50 4.40Jalgaon 0.58 -5.29 0.31 4.42Bhusawal 2.24 -3.43 -3.50 4.69Muktainagar 0.44 -3.60 -0.32 3.48Parola 1.48 -3.68 0.92 1.28Bhadgaon 5.09 -6.91 -0.06 1.88Pachora 2.48 -3.71 -0.35 1.58Jamner 4.12 -5.52 1.19 0.21Chalisgaon 1.81 -3.34 -0.37 1.70District 2.38 -4.52 0.09 2.05
Donors /
Receivers from
Non-arable
% increase /
decrease of
arable land
(1961-2001)Land not
available for
agriculture
It is encouraging that the landunder forest had decreased throughoutthe district while land put to nonagriculture had increased throughout the
(Source - Computed by Author) district. The decreased in area underforests had contributed to the beads ofarable land in the district. On the basisof average figures in the table 3, thethirteen tehsils are classified into fourintensity groups.
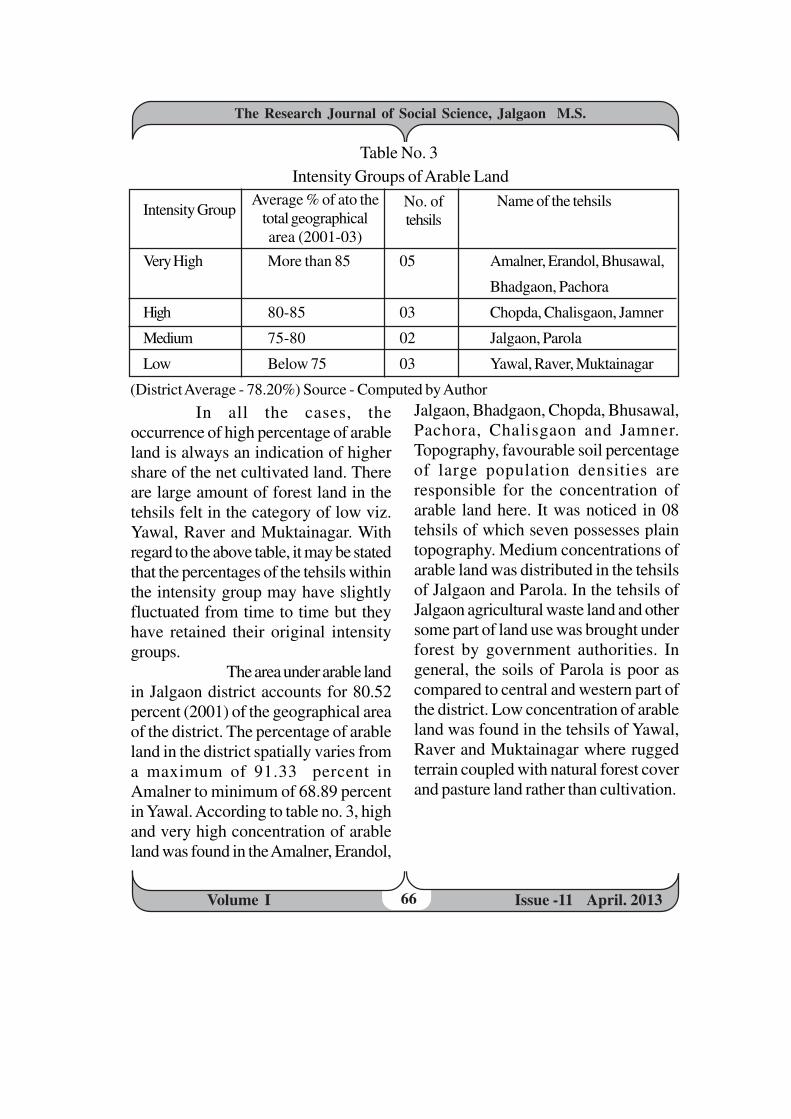
The Research Journal of Social Science, Jalgaon M.S.
Volume I Issue -11 April. 201366
Table No. 3 Intensity Groups of Arable Land
Intensity Group
Very High More than 85 05 Amalner, Erandol, Bhusawal,
Bhadgaon, Pachora
High 80-85 03 Chopda, Chalisgaon, Jamner
Medium 75-80 02 Jalgaon, Parola
Low Below 75 03 Yawal, Raver, Muktainagar
Name of the tehsilsNo. oftehsils
Average % of ato thetotal geographicalarea (2001-03)
(District Average - 78.20%) Source - Computed by Author
In all the cases, theoccurrence of high percentage of arableland is always an indication of highershare of the net cultivated land. Thereare large amount of forest land in thetehsils felt in the category of low viz.Yawal, Raver and Muktainagar. Withregard to the above table, it may be statedthat the percentages of the tehsils withinthe intensity group may have slightlyfluctuated from time to time but theyhave retained their original intensitygroups.
The area under arable landin Jalgaon district accounts for 80.52percent (2001) of the geographical areaof the district. The percentage of arableland in the district spatially varies froma maximum of 91.33 percent inAmalner to minimum of 68.89 percentin Yawal. According to table no. 3, highand very high concentration of arableland was found in the Amalner, Erandol,
Jalgaon, Bhadgaon, Chopda, Bhusawal,Pachora, Chalisgaon and Jamner.Topography, favourable soil percentageof large population densities areresponsible for the concentration ofarable land here. It was noticed in 08tehsils of which seven possesses plaintopography. Medium concentrations ofarable land was distributed in the tehsilsof Jalgaon and Parola. In the tehsils ofJalgaon agricultural waste land and othersome part of land use was brought underforest by government authorities. Ingeneral, the soils of Parola is poor ascompared to central and western part ofthe district. Low concentration of arableland was found in the tehsils of Yawal,Raver and Muktainagar where ruggedterrain coupled with natural forest coverand pasture land rather than cultivation.

The Research Journal of Social Science, Jalgaon M.S.
Volume I Issue -11 April. 201367
Sr. Component Element 1961 1971 1981 1991 2001
No.
1. Net sown area 66.67 68.57 70.36 71.73 72.84 90.46 6.172. Current fallow 3.53 3.06 2.54 2.34 3.06 2.56 -1.463. Old fallow 1.86 1.54 1.25 1.11 0.93 1.16 -0.934. Misc. Trees and Groves 0.22 0.26 0.30 0.38 0.36 0.47 0.145. Cultivable waste land 0.61 0.53 0.50 0.42 0.41 0.51 -0.206. Pastures and grazing 5.25 5.31 4.61 4.19 3.92 4.87 -1.33
grounds
Table No. 4
Decadal differentials of components of Arable land
Changeduring theyear 1961-
2001
Average %to arableland 2001
For a comprehensive appraisalof arable land. It is important to discussin detail its component part individually.The intensity groups of this componentelements are shown in table no. 3Thedecadal differentials of the componentelements of the arable land in thedistrict is represented in table no. 4. Itreveals an encouraging picture of thecultivable land for a poor ruraleconomy. For any agrariandevelopment, the net cultivatedarea should increase. All thesecharacteri -stics were observedhere. To maintain the fertility andproductivity of soil, land keptfallow for one year or more wasa regular practice of the district.The miscellaneous trees andgroves which should have alsoincreased a little also rightlymarked in the table no. 4.
Source - Computed by author ABSOLUTE VOLUME OF CHANGE
IN ARABLE LAND (1961-2001):
The variation in the concentration ofarable land in the district reveals amarginal increase of 2.38 percent duringthe period from 1961 to 2001. In termsof hectarage, the area under arable landhad increased from 891063 hectares in1961 to 921880 hectares in 2001showing a net increase of 30817hectares during 40 years.

The Research Journal of Social Science, Jalgaon M.S.
Volume I Issue -11 April. 201368
A spatial analysis of arable land duringthe period had shown an increase ineleven tehsils of the district, out ofwhich high increase of above 5 percentwas recorded only in Yawal (6.28%) andRaver (6.16%) followed by Bhadgaon(5.09%) and Jamner (4.08%). Adecrease in the percentage of arable landwas also recorded in two tehsils of thedistrict viz Amalner (-1.81%) andErandol (-0.58%).CONCLUSION :The following results have beenobtained from the foregoing analysis;1. The spatial distribution of arable
land in Jalgaon district is uneven .2. The area under arable land in Jalgaon
district accounts for 80.52 percent(2001) of the geographical area ofthe district. The percentage of arableland in the district spatially variesfrom a maximum of 91.33 percentin Amalner to minimum of 68.89percent in Yawal.
3. Low concentration of arable landwas found in the tehsils of Yawal,Raver and Muktainagar where ruggedterrain coupled with natural forestcover and pasture land rather thancultivation.
4.Spatial analysis of arable land duringthe period had shown an increase ineleven tehsils of the district, out ofwhich high increase of above 5percent was recorded only in Yawal(6.28%)
REFERENCES :1. Agrawal, A.N. (1980): Indian
Agricultural” Vikas Publishing
House Pvt Ltd, New Delhi PP 3-572. Ali Mohamad (1978): Studies in
Agricultural Geography” RajeshPublication, New Delhi PP 15-45
3.Chouhan T.S. (1987):” AgriculturalGeography- A case study of RajastanState” Academic Publisher, Jaipur PP237-253.
4.Dube R.S.(1987): “ AgriculturalGeography- Issues andApplications”Gian Publishing HouseNew Delhi PP 71-78
5.Har Prasad(1992):“ ResearchMethods and techniques inGeography”, Rawat Publications,Jaipur, PP 142-166.
6.Kaur Dhian (1991): “ ChangingPatterns of Agricultural Land Use”Rawat Publications, Jaipur,PP 65-118
7.Mamoria C.D. and TripathiB.B.(1953): “ Agricultural Problemsof India”, Kitab Mahal Publications,Allahabad PP 228-248
8.Pal B.N. (1961): “Economic Surveyof Agriculture” Kitab Mahal, (W.D.)Private Ltd, Allahabad, PP 102-107.
9.Sharma B.L.(1991): “AppliedAgricultural Geography” RawatPublications, Jaipur,, PP 4-28.
10.Singh Jasbir and Dhillon S.S.(1984): “Agricultural Geography”Tata Mc Graw Hill Publishing Co Ltd,PP 71-76,110-120.
11.S.N.Bharambe,c.d.Mahajan (2012):“ Change detection of land use andland cover of Yawal, raver, Bhusawaland Muktainagar tahsils using remotesensing ans GIs techniques”, Journalof Chemo and Biosphere, Issue-3,Vol-2, Aug-2012
The Research Journal of Social Science, Jalgaon M.S.
Volume I Issue -11 April. 201369
India is one of the developingcountries in the world. Higher industrialdevelopment urbanization naturalcalamities changes in natural andcultural environment influence thelocation and development of slums inour Indian cities. In this research paperinvestigator has done intensive surveywith the help of questionnaire. In thisstudy the role of geographical aspect onspatial and temporal development ofslums in the Bhusawal city. Bhusawalcity is one of the cosmopolitan city actsas transport, trading, industrial andeducational centre in the region. Theidentical location of the city, changingenvironmental condition mark as typicalslum problems in this city. To study therelationship with environment slumsand their character, this study has beenundertaken by the investigator.Introduction :
Bhusawal city is located on 75degree 46 minutes E longitude and 21degree 20 minutes’ North latitudes workas tahsil head quarter and transportcentre in the Maharashtra State. Taptiriver bank and the national highwaylocation and commercial educationalindustrial administrative culturalfunction has make Bhusawal as
“ORIGIN AND DEVELOPMENT OF SLUMS IN BHUSAWAL
CITY MAHARASHTRA”
- Dr. A. S. Bhole, Head, Post–Graduate and Research Dept of Geography M. J. College, Jalgaon – 425002 India
important city in Jalgaon District. Largeconcentration of population due tomultifunctional city some part ofBhusawal city having British culture dueto railway junction. Easy transportationindustrial development, educationalfunction, trading centre, easy jobopportunity, high wage rate droughtcondition in surrounding region, animportant factors responsible for thelarge concentration of population fromlast two decades. The total populationof Bhusawal city is about 2 lakh 20,000people and out of this 16,405population is living in 10 main slums inthis city.Location of slums:
In this study investigator hasdone intensive survey about thelocational pattern of slums in Bhusawalcity. Special and temporal changes in thelocation of slums are to be analyzed intIus study. Vaitagwadi, Bhoi Nagar,Agakhan wadi, Harijan’ Vasti, Quazi Plot,Khadka road, Chimta mala, Heti Boudhe,Dindayal Nagar, Koli Inam are tile largeslum in the Bhusawal city. In this cityinvestigator has done study related withlocation of slums in Bhusawal cityavailability of easy accommodation,nearness to work place, availability of

The Research Journal of Social Science, Jalgaon M.S.
Volume I Issue -11 April. 201370
basic need in nearby area, easy jobopportunity, high wedge rate,accessibility are the significant factorsresponsible for the location of slumsin Bhusawal city. The Natural andcultural environmental factors are
changing through time and space inBhusawal city play an significant role onlocation of slums in this city. Thefollowing chart shows the locationalpattern of slums in Bhusawal city.
Sr. Name of Location Area Population No.ofNo. the ‘slum inHect. Houses1 Vaitagwadi Road 0.80 1022 2072 Bhoi Nagar Road 2.20 1380 2713 Aghakhan wadi Railway 1.20 1304 2144 Harijan Vasti Market 4.80 2256 3755 Quazi Plot Railway 1.60 1593 2786 KhadaRoad MillC 2.50 1916 3107 Chinch Moholla Market 2.40 3241 5578 Heti Boudhi Road 0.60 1062 1199 Dindayal Nagar Road 2.40 2210 43410 Koil Inam Road 0.49 421 65
Total 114.59 16405 2907
Source: Bhusawal City town planning and field survey
Bhusawal City slums at a glance :
1) Road site Slums: In Bhusawal citywe can observe ten identified slumslocated in various part of the city. In tlustable we can note that about 50 % slumsare located along the National Highwayor District Road. Vaitagwadi, Bhoinagar,hati Baudhi, Dindayal Nagar, Koli Inamare the important slums inhabited nearthe road accessibility. During the fieldwork it has been mark that easyaccessibility, transportation facilities,job opportunity, public land, lowerground water level are the factorsresponsible for the origin anddevelopment of slums in Bhusawal city.
The area of the slums located near theroad site is smaller in size.2) Railway site slums: Bhusawal cityis well known for its railwaytransportation centre. In Bhusawal citythe town planning and survey workspecified two slums i.e. Agakhan wadiand Quazi plot. Both these slumslocated near the railway. These are theMuslim slums. Easy availability ofcheap accommodation nearness to workplace, accessibility, and availability ofvarious amenities are the elementsinfluence location and development ofrailway site slums in the city. Both

The Research Journal of Social Science, Jalgaon M.S.
Volume I Issue -11 April. 201371
slums located near by really are smallerin area but medium in population. Mostof the slums dwellers are the porters,laboures, plastic bag and wastage papercollection persons.3) Market site slums:
Bhusawal city is also work as theimportant marketing centre in J algaonDistrict in Maharashtra. Agriculturalmarketing centre, wholesale, retailmarketing are main function of this city.Bhusawal city has developed largemarket yard and commercial area. Easyavailability of human porter age in themarket high wedge rate, nearness towork of place, availability of variousamenities for human life, easy shelterare the remarkable factors influence ondevelopment of slums near the marketof area Marimata temple and Saraffaarea, Weekly market, Daily market areaare the commercial zone influence todevelop Harijan Vasti and ChinchMoholla slwns in Bhusawal city. Theslums dwellers are busy in market asporter and worker.4) M.LD.C. Area Slums: Theindustrial function is also performed byBhusawal city. Along the NationalHighway No. 6. Maharashtra IndustrialDevelopment Corporation hasdeveloped MIDC area for thedevelopment of various types ofindustries. In this area numbers of agro-based industries, chemical industries,fertilizer industries, engineeringindustries has developed. In this area wecan observed easy job opportunity innearby industrial area, nearness to jobplace, cheap accommodations,
availability of amenities, easyaccessibility factors are mark during thesurvey which influence origin anddevelopment of slums in the city.Khadka road slum area developed dueto nearness to MIDC. This is a slumlocated in the vicinity of MIDC area with1914 population.Development slums before 1961:
In this period Bhusawal city workas small town work as a tehsilheadquarter. In the period population ofBhusawal city was small with marketingrailway as the main functions limitedjob opportunities in the city influencelimited development of slums in thecity. Agakhan wada, Quazi plot, Harijanwasti are the slums developed in tinsperiod. All these slums are located nearthe railway station and market area. Allthe slum dwellers from tIns slum are theunskilled labour in railway and market.In that period development of shuns dueto easy job in the city highland cost, highwage rate, attraction of urbanenvironment. In that period Muslimsimmigrates has settled in Agakhan wadiand Quazi plot. Harijan inmigrats hassettled in Harijan vasti shun.Development of slums during 1961to 1991:
During this period Bhusawal cityhad developed various functions.Railway function, market area,commercial function, educationalfunctions, administrative functions,industrial function, medical centre hasinfluence speedy urban growth. Largedevelopment of various functionsinfluence large demand for skilled and

The Research Journal of Social Science, Jalgaon M.S.
Volume I Issue -11 April. 201372
unskilled labour. To pulfill the labourdemand large unskilled labour hasimmigrated in Bhusawal city. Exparitionof central and western railway junction,wholesale market, retail market, MillCarea create large job opportunity and sorural peoples from Maharathwada andkhandesh region in migrated. Large scaleindustrialization and limited accommo-dation facilities badly influence originof slums. Heti Boundi Nagar, ClinethMohalla. Dindayal Nagar, ChinduMohalla, are the large size slumdevelopment during this period. Highland value, limited accommodation, easycheap dwelling, nearness to work placeare the important towards responsibleto develop these slums in Bhusawal city.Development of slums in Moderntime: Development of new MIDC area,large market yard, extension of railwayproject, increase in multifunctionalactivities of the city, famine conditionin surrounding rural area, high wedgerate, lllgh land cost, influence speedydevelopment of Bhusawal city. Large jobopportunities, high wedge rate attract therural in-migrants in this city. In themodern time large flow of unskilledlabour as worker in factory, railway,market. Limited accommodationfacilities influence large developmentof slums in Bhusawal city. The cheapaccommodation, nearness to work place,easy accessibility, influence to developslums. Vaitagwadi, Koli InaIn and Bhoinagar are the slums recently developedin Bhusawal city. In the field work it hasbeen observed that in all these shIms inmigrants from the Marathwada region.
Drought condition in Marathwada,influence to out migration to ruralpopulation from Marathwada to Bhusawalcity. All the slums from Bhusawal cityfacing from problem like a water supply,medical facility, electricity supply, toiletblock, rashaning shop, pollutionproblem, education problems.Conclusions:·1)Old slums are located at theconvergence of roads and railway.2)All the old slums are near the place ofwork.3)Old slums are inhabited by local ruralin-migrants and new slums are inhabitedby long distance (Marathwada) in-migrants.4)Growth of slums due to large scale inmigration.5)Locational pattern of slums arechanging in this city. Road and railwayside slums are not growing but themarket, MIDC side slums are growingfastly.6)Town planning development ofMunicipality are planning to rehabilitateall the slums from the city.References:1) Culling Worth J. D. “Housing need andPlanning Policy” London, 19642)Goshal Guruduo Singh. “RecentPopulation growth in India” PopulationGeography Vol. 4, June. 1992.3) Negi P.S. “Trends of out migration inTabari Gudhwal”, Geographical Reviewof India, Calcutta, Vol. 65, March 83.4) Mehta S. and “Special Pattern ofpopulation changes Singh S.M. III BistDuab (pub) The Deccan GeographerHyderabad, June, 80.

The Research Journal of Social Science, Jalgaon M.S.
Volume I Issue -11 April. 201373
I Dr. Shailaja Dongar Bhangale , here declare that the particulars given above aretrue to the best of my knowledge and belief.
Date : 1 April., 2013 Sd/Dr. Shailaja Dongar BhangaleSignature of Publisher
Form IV
1. Place of Publication - Institute of Social Sciences Research andDevelopment Jalgaon 425 002 India.
2. Periodicity of Publication - Six Monthly
3. Printers Name - Dr. Shailaja Dongar BhangaleNationality - IndianAddress - 63/35, Vidyut Colony, NH6 Jalgaon 425 002 (India)
4. Publishers Name - Dr. Shailaja Dongar BhangaleNationality - IndianAddress - 63/35, Vidyut Colony, NH6 Jalgaon 425 002 (India)
5. Editors Name - Dr. A. S. BholeNationality - IndianAddress - Prof. A.S. Bhole
NH6 , 63/35, Vidyut Colony, Jalgaon 425 002 IndiaTel (0257) 2281628
6. Name and Address - Micro processof printing press 35, Shrikrishna Colony, Jalgaon- 425001
7. Name and Address of - Institute of Social Science Research andindividuals who own the Development , Jalgaon 425 002 Indianewspaper Journal and partnersof share holders holding morethan one percent of the total capital
Whether citizen of India - Yes
ISSN 0976-061 X
The Research Journal of Social Science, Jalgaon M.S.
RNI REGN NO.MAHENG/2006/22743
International Refereed Journal

The Research Journal of Social Science, Jalgaon M.S.
Volume I Issue -11 April. 201374
INSTRUCTION TO AUTHORS
The Research Journal of Social Science, Jalgaon (M.S.) is published twicein year. The editor invite articles that will contribute to advances in the field ofsocial sciences. All manuscripts of papers, short articles, book reviews and newsintended for publication in the journal should be send to the Editor, The ResearchJournal of Social Science, Jalgaon, M.S., Institute of Social Science Researchand Development, Jalgaon, 63/35, Vidyut Colony, Jalgaon – 425002, India.Authors are requested to submit manuscripts by email to
[email protected][email protected]
In addition, the authors should send by post two hard copies of manuscriptswith a set of original maps/illustration and soft copy on CD with MS-Word file.We send each manuscript to at least two peer reviewers. Mailing cost beenprohibitive so articles will not be return to authors. The reviewer’s decisionwill be final.Manuscripts should not exceed eight printed pages. They should be typed doublespaced on A4 size paper with wide margin. The manuscripts should contain atitle, name & address of author, an abstract, and the list of references cited,tables, list of figures and their captions. Authors should send each figureseparately on CD .The letter accompanying the manuscripts should contain astatement of confirming that neither the whole article nor any portion of it ispublished elsewhere.The authors are charged a publication fee Rs. 1000/- byDD to Editor or deposit cash on Bank of Baroda, Jalgaon A/c No.19580100002090. Scan copy of deposit will be send along with hard copy. Onecopy of the journal will be send to the contributor, no reprints will be sent toauthor. Authors are responsible for the views expressed in their article and forobtaining permission for copy right material. All the legal undertaking relatedto research journal and subject at Jalgaon jurisdiction only.
Thoughts language vision and examples is published research paper areentirely of author of research paper. It is not necessary that editor or editorialboard are satisfied by research paper . The responsibility of the matter ofresearch paper is entirely of author.

The Research Journal of Social Science, Jalgaon M.S.
Volume I Issue -11 April. 201375
President
Dr. R.B. Singh.
Dr. Sudesh NangiaDr. P. C. PandeyDr. M.B. ChauhanDr. Ehsan Golmer
Vice President
Dr. K. BhaskarProf. N.R. KaswanDr. S.R. Chaudhari
Dr. NagbhushanamDr. D.G. BholeDr. R. K. Rai
Honorary Secretary
Dr. Shailaja BhangaleHonorary Treasurer
Prof. Sahas Narkhede
Members
Dr. Pravin SaptarshiDr. Jitkumar GuptaDr. K.B. KankureDr. B.C. JatDr. B.R. SinhaDr. R.D. SinghDr. Deepak WankhedeDr. M.A. Zambare
Dr. A.S. JadhavDr. B.C. VaidyaDr. J.A. SheikhDr. Kamala PrasadDr. ChaturwediDr. Yusuf KhanDr. Devendra BisenDr. Virendra Nagrale
Dr. N.C. JanaDr. K.DasDr. C.S. TiwariDr. BandopadhyayDr. J.C. KuniyalProf. D.A. ParadhiDr. Rajani DeshmukhDr. Kaveri Dabholkar
Chief Editor
Dr. A.S. Bhole
ISSN 0976-061 X
The Research Journal of Social Science, Jalgaon M.S.
RNI REGN NO.MAHENG/2006/22743
Editorial Advisory Board
And
Review Committee
International Refereed Journal