Embed Size (px)
Citation preview
The Research Summary of Research Relevant to
Multidisciplinary Climate Change Education
Climate Change Research: An Overview
Over the past 1 million years, the earth has gone through several cycles of
warming and cooling, with ice ages alternating with warmer periods. Each
of these cycles has lasted about 100,000 years.
By comparison, the earth’s climate has remained relatively stable over the
past 10,000 years. There is an important exception, though. Since the
beginning of the Industrial Revolution in Europe in about 1750, climate
scientists have measured a relatively rapid increase in global temperatures
of approximately 1.3°F (0.7°C).
Evidence of Climate Change
The Intergovernmental Panel on Climate Change (IPCC) is an agency
formed in 1988 by the World Meteorological Organization and the United
Nations Environment Program to study the extent of climate change and its
effects. In August 2013, the IPCC prepared to issue its fifth assessment of
the risks of climate change. According to the IPCC, there is at least a 95
percent certainty that humans have caused warmer temperatures through
their activities.
The draft summary stated, “It is extremely likely that human influence on
climate caused more than half of the observed increase in global average
surface temperature from 1951 to 2010. There is high confidence that this
has warmed the ocean, melted snow and ice, raised global mean sea levels,
and changed some climate extremes in the second half of the twentieth
century.” In its previous assessment, issued in 2007, the IPCC had
predicted that global temperatures will rise between 2°F and 11.5°F by
2100.
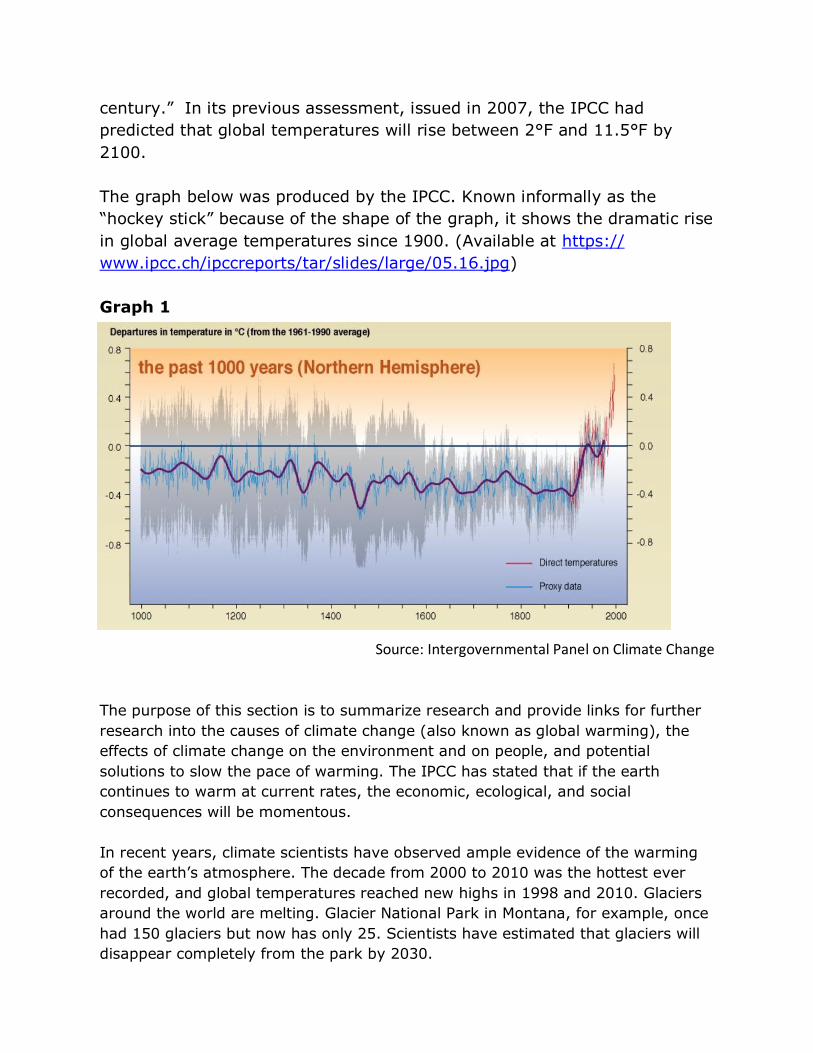
The graph below was produced by the IPCC. Known informally as the
“hockey stick” because of the shape of the graph, it shows the dramatic rise
in global average temperatures since 1900. (Available at https://
www.ipcc.ch/ipccreports/tar/slides/large/05.16.jpg)
Graph 1
Source: Intergovernmental Panel on Climate Change
The purpose of this section is to summarize research and provide links for further
research into the causes of climate change (also known as global warming), the
effects of climate change on the environment and on people, and potential
solutions to slow the pace of warming. The IPCC has stated that if the earth
continues to warm at current rates, the economic, ecological, and social
consequences will be momentous.
In recent years, climate scientists have observed ample evidence of the warming
of the earth’s atmosphere. The decade from 2000 to 2010 was the hottest ever
recorded, and global temperatures reached new highs in 1998 and 2010. Glaciers
around the world are melting. Glacier National Park in Montana, for example, once
had 150 glaciers but now has only 25. Scientists have estimated that glaciers will
disappear completely from the park by 2030.
Similarly, ice is melting in the Arctic Circle, with widespread consequences for
wildlife such as polar bears, which depend on ice to migrate and hunt for food.
Scientists have observed that birds and other wildlife are migrating to higher
latitudes in the northern and southern hemispheres to stay within their
accustomed temperature ranges.
Greenhouse Effect Simulator-University of Colorado Boulder
http://phet.colorado.edu/en/simulation/greenhouse
Global carbon dioxide levels near worrisome milestone-nature.com
http://www.nature.com/news/global-carbon-dioxide-levels-near-worrisome-
milestone-1.12900
Global land temperatures have increased by 1.5 degrees C over the past
250 years-BerkeleyEarth.org
http://berkeleyearth.org/summary-of-findings
Causes of Climate Change
Scientists have linked the rise in global temperatures to the increase in certain
gases in the atmosphere since the beginning of the Industrial Revolution around
1750. These gases result from the burning of fossil fuels, particularly coal, oil, and
natural gas. The fossil-fuel emissions cause gases to enter the atmosphere, where
they trap radiation from the sun and prevent some of that radiation from being
reflected back into space. The trapped radiation increases temperatures on the
surface of the earth. These gases are called greenhouse gases (GHG) because they
function somewhat like greenhouses.
The three most common GHG are carbon dioxide, methane, and nitrous oxide.
Carbon dioxide (CO2) is the gas that all vegetation on Earth absorbs in the
photosynthesis process. The amount of CO2, emitted from smokestacks and other
exhausts has increased from 280 parts per million (ppm) in 1750 to nearly 400
ppm in 2013. (A part per million is a measure of the amount of a contaminate in
the atmosphere or in a body of water.) A molecule of CO2 stays in the atmosphere
between 100 years and 500 years.
The second most common GHG is methane (CH4), which is the main component of
natural gas. Methane lasts in the atmosphere only for about 12 years, but it is 20
times more potent than CO2 as a GHG. It leaks into the atmosphere primarily
during the process of producing natural gas. Livestock also emit methane as part
of the animals’ natural digestive process. Methane has increased from 715 parts
per billion (ppb) in 1750 to 1774 ppb in 2005.
The third most common GHG is nitrous oxide (N2O), which results from various
industrial processes such as the burning of fossil fuels, agriculture, and the
management of wastewater. This gas lasts in the atmosphere for about 120 years
and is about 300 times as potent a GHG as CO2. Nitrous oxide has increased from
270 ppb in 1750 to 319 ppb in 2005.
A fourth GHG is sulfur hexafluoride (SF6), which is a human-made gas that is used
primarily by the electric power industry.
Another major cause of climate change has been changes in land use. In the past
250 years, the human population has grown from 800 million to 7 billion. To
accommodate this population expansion, people have cut down forests to harvest
timber and cleared land for farms, cities, and suburbs. Trees absorb CO2 as part of
the photosynthesis process. However, because of deforestation, the earth has far
fewer trees to absorb CO2, leaving more of the gas in the atmosphere. Logging of
rain forests, such as the vast rain forest of Brazil, has been a major contributor to
deforestation and to climate change.
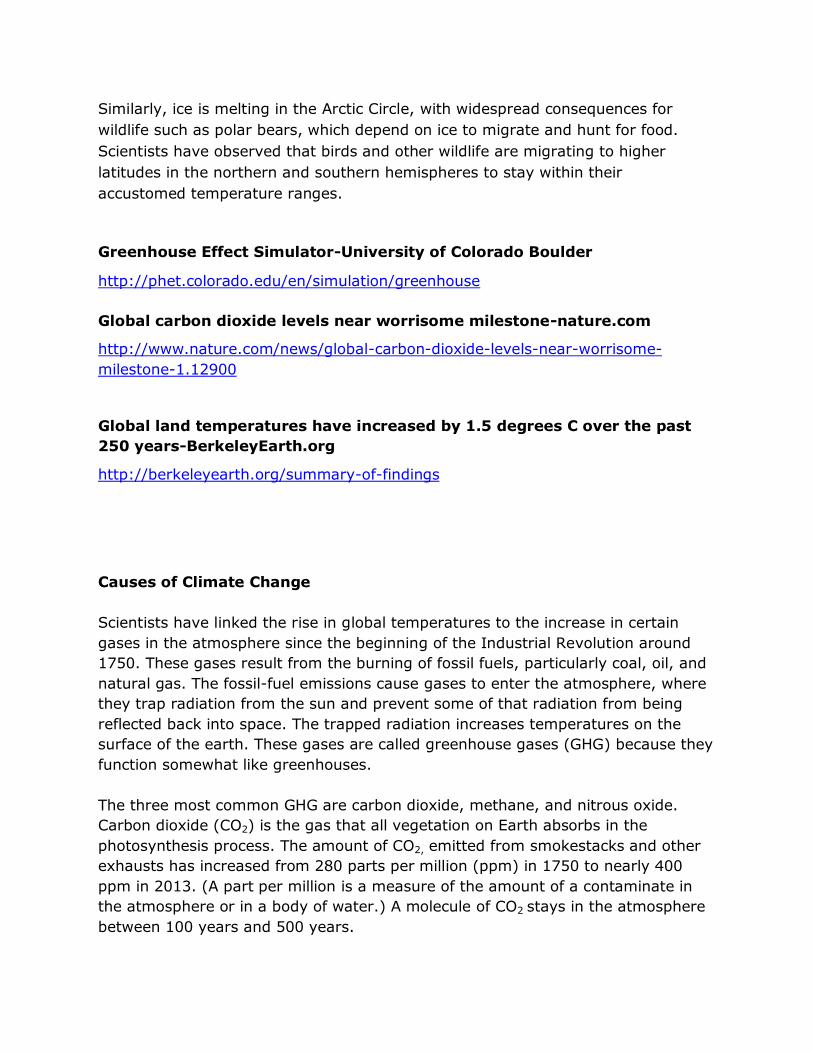
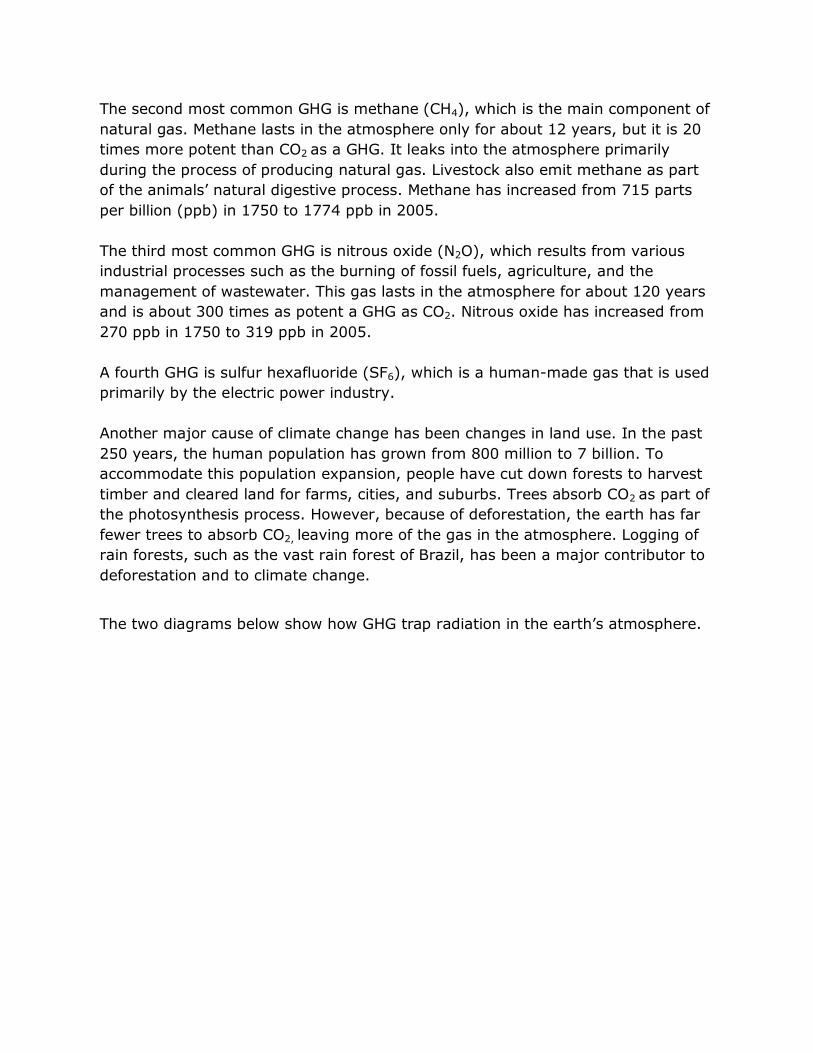
The two diagrams below show how GHG trap radiation in the earth’s atmosphere.
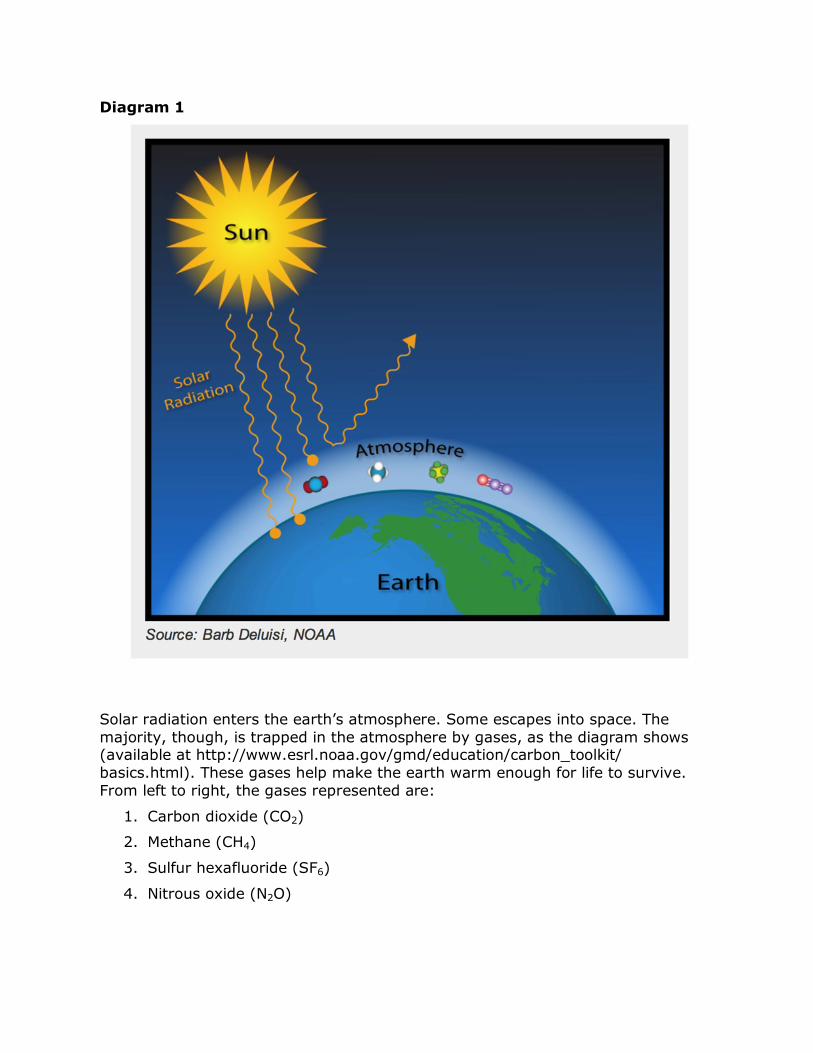
Diagram 1
Solar radiation enters the earth’s atmosphere. Some escapes into space. The
majority, though, is trapped in the atmosphere by gases, as the diagram shows (available at http://www.esrl.noaa.gov/gmd/education/carbon_toolkit/
basics.html). These gases help make the earth warm enough for life to survive.
From left to right, the gases represented are:
1. Carbon dioxide (CO2)
2. Methane (CH4)
3. Sulfur hexafluoride (SF6)
4. Nitrous oxide (N2O)
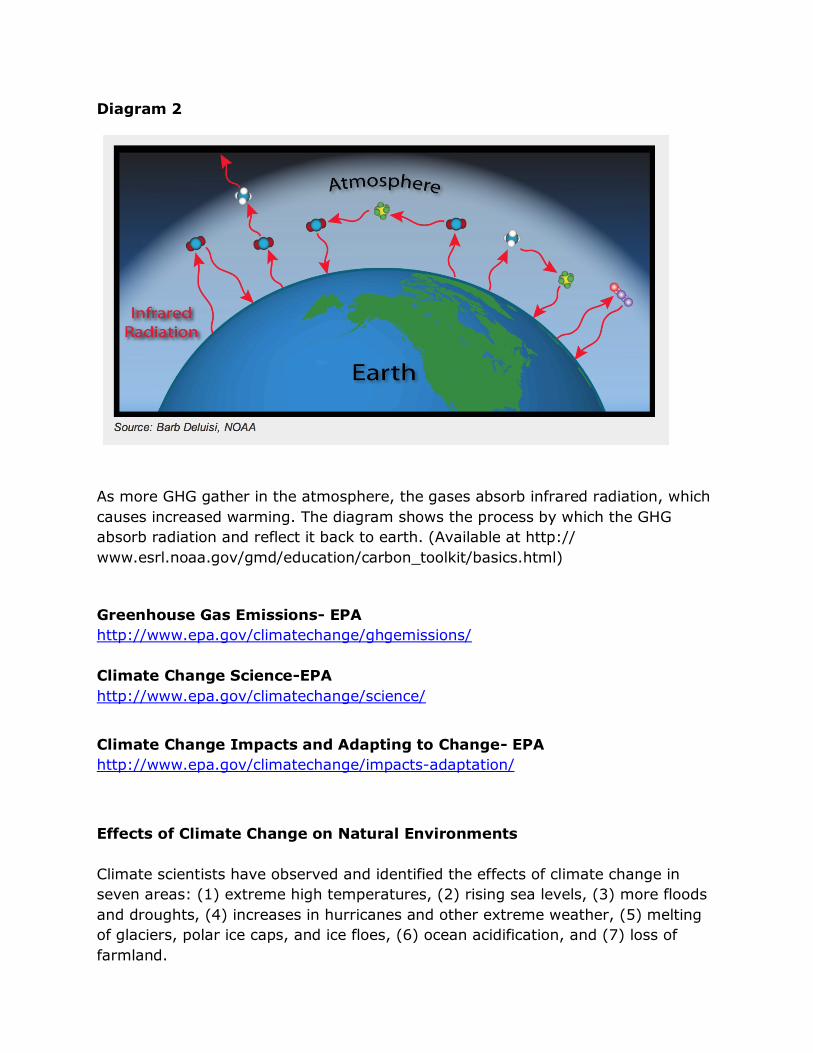
Diagram 2
As more GHG gather in the atmosphere, the gases absorb infrared radiation, which
causes increased warming. The diagram shows the process by which the GHG
absorb radiation and reflect it back to earth. (Available at http://
www.esrl.noaa.gov/gmd/education/carbon_toolkit/basics.html)
Greenhouse Gas Emissions- EPA
http://www.epa.gov/climatechange/ghgemissions/
Climate Change Science-EPA
http://www.epa.gov/climatechange/science/
Climate Change Impacts and Adapting to Change- EPA
http://www.epa.gov/climatechange/impacts-adaptation/
Effects of Climate Change on Natural Environments
Climate scientists have observed and identified the effects of climate change in
seven areas: (1) extreme high temperatures, (2) rising sea levels, (3) more floods
and droughts, (4) increases in hurricanes and other extreme weather, (5) melting
of glaciers, polar ice caps, and ice floes, (6) ocean acidification, and (7) loss of
farmland.
As already noted, the decade from 2000 to 2010 was the warmest on record. In
2010, 19 countries experienced the hottest temperatures ever recorded, including
Finland at 99°F, Niger at 119°F, and Saudi Arabia at 125°F. The scorching
temperatures caused misery in cities such as Moscow, where few people had air
conditioning and residents feared going outside because of the heavy smog.
As average temperatures have risen, the world’s oceans have absorbed 80 percent
of the atmospheric warming. As the water has warmed, it has expanded, raising
ocean levels. In the draft summary of its fifth assessment, the IPCC predicted that
if carbon emissions continue at current rates, ocean levels could rise by 21 inches
to 3 feet by 2100, threatening coastal cities like New York and London.
The world has also experienced more severe floods and droughts, which most
likely have resulted from changing weather patterns. In 2005, for example, more
than 3 feet of rain fell on Mumbai, India, in 24 hours. Across the northern United
States, the amount of precipitation has increased between 5 and 20 percent in
recent years because rising temperatures have increased evaporation of water into
the earth’s atmosphere.
Yet other parts of the world have experienced greater drought as warmer
temperatures take moisture out of the atmosphere. Several parts of the world,
including the Sahel, the Mediterranean region, southern Africa, southern Asia, and
the southwestern United States have suffered through extended droughts.
Climate scientists expect an increase in the severity of tropical storms, such as
hurricanes, because rising temperatures will contribute to the build-up of energy
unleashed by storms.
Warmer temperatures are causing glaciers, polar ice caps, and ice floes to shrink
and even disappear. Arctic ice has shrunk by 2.7 percent per decade since 1978.
Mountain glaciers and snow cover have been shrinking, contributing to the rise in
ocean levels because of the runoff of water.
The large amount of CO2 that the oceans are absorbing from the atmosphere is
causing the ocean water to become more acidic. The increased acidity has a
negative impact on shelled species, such as shellfish and corals, by impeding the
process of building shells using calcium carbonate found in sea water.
Finally, rising ocean levels threaten farmland in coastal areas, where land in low-
lying countries like Bangladesh will be lost for agriculture. For example, rising sea
levels have already had negative effects on the growing of rice in the Mekong
Delta in Southeast Asia and the growing of crops in several countries in coastal
Africa.
All these changes will have a major impact on the species of life on the earth.
Scientists estimate the potential extinction of between 20 percent and 30 percent
of all species because of disappearing habitats. Global warming will have a
negative effect on ocean ecosystems, including coral reefs.
New USDA plant zones clearly show climate change- Washington Post
http://www.washingtonpost.com/blogs/capital-weather-gang/post/new-usda-plant
-zones-clearly-show-climate-change/2012/01/27/gIQA7Vz2VQ_blog.html
NOAA’s Tides and Currents: Sea Level Trends Map
http://tidesandcurrents.noaa.gov/sltrends/sltrends.html
What is Ocean Acidification?-NOAA
http://www.pmel.noaa.gov/co2/story/What+is+Ocean+Acidification%3F
The Antarctic's Ice Paradox-PBS.org
http://www.pbs.org/newshour/rundown/2013/05/why-climate-change-means-
more----and-less----ice-for-the-antarctic.html
Effects of Climate Change on Humans
The effects of climate change will have major and perhaps catastrophic effects on
humans, causing greater poverty, hunger and malnutrition, disease, injury, and
death.
One of the major effects will be on food supply. In tropical regions, where much of
the world’s food is grown, crop yields will almost certainly decline because of
increased drought. Malnutrition will increase as agricultural lands are lost to rising
ocean levels and flooding. In addition, higher temperatures and dry conditions will
bring more wildfires, which threaten the forests and croplands on which many
people depend for their livelihoods. Today, 840 million people in the world are
malnourished. With climate change, the IPCC estimates that the number of
undernourished people will probably increase by 100 million to 240 million.
Climate change will probably worsen poverty in the world. Scientists predict that
rising temperatures will lower the global gross domestic product by 20 percent
during the 21st century, partly by eliminating agricultural lands that are now
productive. The effects will be particularly serious in developing countries, causing
mass migration from agricultural regions to cities and putting intense pressure on
urban services ranging from education to medical care.
Scientists also predict that climate change will lead to higher occurrences of
certain diseases. According to the World Health Organization, climate change
caused more than 150,000 deaths in the year 2000. For example, malaria will
probably increase because disease-carrying mosquitoes thrive in warm, moist
weather conditions. Heat waves are major threats to people’s health. In July 1995,
750 people in Chicago died as the result of record-breaking heat and humidity that
plagued the city. Heart and lung diseases may also increase because of rising
temperatures, ozone levels, and other forms of pollution.
Finally, climate change could well result in increased war and conflict. In its 2007
report, the IPCC pointed out that conflicts over fresh water, arable land, and food
have played significant roles in wars in Malawi, Mozambique, Somalia, Ethiopia,
Sudan, and other countries in Africa.
Climate Change Impacts and Adapting to Change
http://www.epa.gov/climatechange/impacts-adaptation/
Climate may crank storms into overdrive- Futurity.com
http://www.futurity.org/earth-environment/climate-may-crank-storms-into-
overdrive/
Latest Forecast Shows the U.S. Drought Moving West-PBS.org
http://www.pbs.org/newshour/rundown/2013/05/latest-forecast-shows-the-us-
drought-moving-west.html
Local Impacts
The global impact of climate change is very real, but students may ask, “How is
climate change going to affect me and the area in which I live?” In fact, climate
scientists have examined the likely impact of climate change on each of the major
regions of the United States.
In the Northeast, the average temperature has risen by 2°F since 1970, and
scientists expect temperatures to rise between 2.5°F and 4°F in the next century.
Because of the region’s long coastline, it will face potentially catastrophic floods,
storm surges, property damage, and loss of wetlands. The region’s large cities,
such as New York and Philadelphia, could suffer through more than 30 days each
year with temperatures over 100°F, with an accompanying increase in ozone and
other forms of pollution. Such heat waves have the potential to cause hundreds, if
not thousands, of fatalities.
The warm and humid region of the Southeast has experienced an average increase
in temperature of 2°F since 1970. Average temperatures over the next several
decades could rise between 4.5°F and 9°F. This region is particularly vulnerable to
hurricanes, which scientists expect to increase in intensity as warmer ocean water
feeds the energy that builds up in these storms. At the same time, scientists
expect more prolonged droughts because of higher temperatures. Since the mid-
1970s, the area of the Southeast suffering through long droughts has increased by
26 percent. Droughts could have widespread economic consequences for the
agriculture in this region.
The Midwest has also experienced rising average temperatures. Throughout the
region, the last frosts in spring now come a week earlier than they used to, and
heavy thunderstorms are twice as frequent as they were 100 years ago. Flooding
has also become more frequent, as evidenced by record-setting floods in the
Mississippi River Valley in 1993 and 2013. As previously mentioned, Chicago
experienced an unprecedented heat wave in 1997 that cost the lives of more than
700 people. Scientists expect this trend to continue, as the region may experience
severe heat waves as often as every other year. Meanwhile, water levels in the
Great Lakes have been falling because of increase evaporation, with economic
consequences for shipping, tourism, and water quality.
In the Great Plains, average temperatures have risen by 1.5°F since the 1970s,
and temperatures over the next century could rise between 2.5°F and 13°F. This
region is semi-arid, and rising temperatures will cause heat waves, drought, and
increasingly heavy thunderstorms, with serious impacts on agriculture, ranching,
health. One of the greatest threats is from declining water tables in aquifers. For
example, the Ogallala aquifer, which stretches from Texas to South Dakota and is
critical to irrigation in the region, has declined by 9 percent since 1950. Scientists
expect water tables to continue dropping, with major impacts on irrigation and
agriculture.
In the Southwest, average temperatures have increased by 1.5°F since 1960, and
they are expected to increase by another 4 to 10 degrees over the next several
decades. This already-arid region has already suffered from water shortages
because of drought and reduced snowpack in the Rocky Mountains. As a result,
agriculture and ranching in the region have suffered. Another serious threat is that
of forest fires. Long periods of drought have created conditions for runaway fires.
Also contributing to the fire threat has been insects like the pine park beetle,
which are now able to survive through winters because of somewhat higher
average temperatures. The beetles have killed millions of trees, turning them into
tinder for forest fires.
In the Northwest, temperatures have risen by an average of 1.5°F over the past
several decades. Scientists estimate that the average temperatures will increase
by 3 to 10 degrees by 2100. Higher temperatures have already reduced snowpack
in the Cascades and other mountain ranges, reducing the water that runs off into
rivers and streams. As a result, there has been a reduction in hydropower, which
generates about 70 percent of the region’s electricity. Rising temperatures will also
have a major impact on the region’s forests, which are central to the economy.
Drier conditions are making forest fires worse, as are insects like the pine bark
beetle. In British Columbia in Canada, beetles have destroyed 33 million acres of
trees.
Perhaps no region of the United States has undergone as much impact from
climate change as Alaska. Over the past several decades, summer temperatures
have risen by 3.4°F, while winter temperatures have soared by 6.3°F. These
higher temperatures have caused shrinking glaciers and melting sea ice, and
thawing permafrost. Temperatures in Alaska could rise anywhere between 3.5°F
and 13°F over the next several decades. As in the Northwest, higher temperatures
will lead to drought and insect infestation, worsening forest fires and threatening
an important part of Alaska’s economy. Warming ocean temperatures will also
affect fish populations, negatively affecting another important part of the state’s
economy.
Global Climate Change Impacts in the United States
http://nca2009.globalchange.gov
Union of Concerned Scientists, Global Warming Solutions: Prepare for
Impacts
http://www.ucsusa/org/global_warming/solutions/prepare-for-impacts
Possible Global Solutions
According to the IPCC’s 2007 report, “The ultimate objective of the United Nations
Framework Convention on Climate Change (UNFCCC) is to achieve the stabilization
of (GHG) concentrations in the atmosphere at a level that would prevent
dangerous anthropogenic [human-caused] interference with the climate system.”
It is essential, climate scientists say, that countries limit the amount of carbon
emissions into the atmosphere. The most important international effort to date has
been the Kyoto Protocol to the UN Framework Convention on Climate Change,
which was developed in 1997. It established binding goals for reducing emissions
of GHG. Most industrialized countries have ratified the Kyoto treaty, but the United
States has not.
Countries signing the Kyoto Protocol agreed that by 2012, they would reduce GHG
by an average of 5.2 percent below 1990 levels. The European Union met these
goals, but emissions by the United States and China exceeded the reductions in
Europe. In fact, global emissions increased by almost 40 percent from 1990 to
2009. If policies are not changed, fossil fuels will, by 2030, continue to supply 80
percent of energy needs, and GHG emissions will be 40 to 110 percent higher than
they were in 2000.
The IPCC’s 2007 report emphasized the need for countries to improve energy
efficiency and shift to renewable sources of energy, including solar energy, wind
turbines, geothermal energy, hydroelectric power, biomass, and nuclear fusion and
fission. In addition, scientists are experimenting with methods of capturing and
storing carbon below ground to prevent it from entering the atmosphere.
The IPCC cited six areas of the global economy in which countries must use far
greater proportions of renewable energy: (1) transportation; (2) residential and
commercial buildings; (3) industry; (4) agriculture; (5) forestry; and (6) waste
management, recycling, and reuse.
Since the Kyoto climate change conference and the 2007 IPCC report, scientists
and conservationists around the globe have grown increasingly alarmed that
countries are not making enough progress in reducing GHG emissions. In 2009,
world leaders gathered in Copenhagen, Denmark, to try to create a path toward
greater progress. Progress at the conference was slow, but it did issue a clear
goal: to hold future global temperature increases to 3.4°F (2°C). One hundred
sixty-seven countries agreed to this goal, although it was nonbinding. Scientists
maintain that the atmosphere already has enough carbon to increase temperatures
by 3.4°F (.8°C). Consequently, the earth is already well on its way toward the 3.4°
F mark.
According to the draft summary of the IPCC’s 2013 report, computer models show
that humans can emit 565 more gigatons of CO2 into the atmosphere over the
next 5 decades to hold global temperature increases to 3.4°F. However, according
to the Carbon Tracker Initiative, a nonprofit organization in Britain, energy
companies worldwide hold some 2,795 gigatons of fossil-fuel reserves. If such
huge amounts of carbon were to enter the atmosphere, the earth would heat up by
much more than 3.4°.
Scientists are continually adding to the store of knowledge about climate change
and its impact on the earth, humans, and other forms of life. An excellent source
to find updated information is on the Web site of Global Systems Science, created
by the University of California’s Lawrence Hall of Science and available at http://
www.globalsystemsscience.org/home. The GSS Web site includes updates from
the IPCC, the UN, and the U.S. government. It also provides lesson plans for
teaching about climate change.
What is EPA Doing About Climate Change?
http://www.epa.gov/climatechange/EPAactivities.html
Obama Moves to Limit Greenhouse Gases Emissions Through Executive
Order- PBS.org
http://www.pbs.org/newshour/bb/science/jan-june13/climate1_06-25.html
UN Framework Convention on Climate Change, Report of the Conference
of the Parties on its fifteenth session, held in Copenhagen from 7 to 19
December 2009.
http://unfccc.int/resource/docs/2009/cop15/eng/11a01.pdf
Carbon Tracker Initiative, “Unburnable Carbon—Are the World’s Financial
Marketing Carrying a Carbon Bubble?”)
http://www.carbontracker.org/carbonbubble
Global System Science, Lawrence Hall of Science, University of California,
Berkeley
http://www.globalsystemsscience.org/home
Strategies for Students
The remainder of this e-workbook will suggest essential questions, activities, and
projects to involve your students in slowing the pace of climate change and
achieving sustainability through improved energy efficiency and use of renewable
energy. The traditional touchstone has been the 3 R’s: reduce, recycle, and reuse.
In these projects and activities, you will find individual and collective actions that
are essential and achievable. Individual actions are those taken by an individual
alone, such as voting, reducing resource use, managing habitat on one's own
property, and taking action to encourage legislation (e.g., writing letters). For
example, a student acting alone can ride a bicycle rather than rely on parents to
drive him or her everywhere.
Students can also have an impact on their schools and households. They can
measure their schools’ and families’ carbon footprints--the total of GHG that a
person is responsible for emitting into the atmosphere. They can encourage their
families to use LED light bulbs, use public transportation, and buy in-season,
locally produced fruits and vegetables because less fuel is used in transporting
these foods to market.
Collective actions are almost anything that can be done with more than one
person. For example, students can work together on campaigns to legislate the
use of renewable energies, organize outings to plant trees, and write to elected
representatives to encourage the construction of wind turbines. The important
thing is for such collective action to stem from students’ questions about and
desires to address a local situation. Their investigation of options for addressing
the situation that are feasible from societal, legal, economic, and scientific
perspectives, followed by their assessment of the initiative’s success is important.
Campaigns lacking such context and rigor may have a low or no likelihood of
leading to improvements and may, in fact, lead to backlash.
Recent years have seen the emergence of important initiatives designed to
increase sustainability and build community. These initiatives offer opportunities
for students to do research and become involved.
One initiative is smart growth—the planning and creation of communities that are
more energy-efficient and that use resources more wisely than do communities
today. To reduce commuting time, for example, smart-growth communities include
offices and industries so that people can live near where they work, reducing drive
times. Smart-growth communities also include plans for public transportation.
Zero waste refers to efforts by industries, communities, and municipalities to
reduce the amount of waste they generate by recycling, reclaiming used
resources, and eliminating emissions. The ultimate goal is to eliminate waste
completely, substantially reducing the amount of GHG released into the
atmosphere.
A third initiative is biomimicry—the effort to imitate strategies and patterns found
in nature. By emulating plants and animals, engineers can design products that
use and recycle energy more efficiently. One Web site on biomimicry cited, for
example, a solar panel that emulates a leaf in its design.
The projects and activities that follow draw on a variety of sustainability initiatives.
There should be emphasis on engaging students in the designing of activities and
scaffolding of them so that students will experience success. In the activities, the
students will develop the higher-level skills of analysis, synthesis, decision-
making, communication, and self-assessment.
LED Light bulb prices are falling and so will household power consumption
- Cleveland Plain Dealer
http://www.cleveland.com/business/index.ssf/2012/01/
led_lightbulb_prices_are_falli.html - comments
What You Can Do- EPA
http://www.cleveland.com/business/index.ssf/2012/01/
led_lightbulb_prices_are_falli.html
http://www.epa.gov/climatechange/wycd/
Collective Actions
Biomimicry 3.3
http://biomimicry.net/about/mimicry
Climate Smart Communities: Local Action to Combat Climate Change- New
York State Department of Environmental Conservation
http://www.dec.ny.gov/energy/50845.html
Preparing for Climate Change- CityofBoston.gov
http://www.cityofboston.gov/climate/adaptation/
State and Local Climate and Energy Program-EPA
http://www.epa.gov/statelocalclimate/
Welcome to the Zero Waste Alliance
http://www.zerowaste.org/
Why Smart Growth?
http://www.smartgrowth.org/why.php
Resources to back up entire document:
Massachusetts Climate Change Adaptation Report
http://www.mass.gov/eea/air-water-climate-change/climate-change/climate-
change-adaptation-report.html
Special Report on Managing the Risks of Extreme Events and Disasters to
Advance Climate Change Adaptation (SREX)-IPCC
http://ipcc-wg2.gov/SREX/report/
Summary
http://ipcc-wg2.gov/SREX/images/uploads/SREX-SPMbrochure_FINAL.pdf
U.S. 2013 National Climate Assessment: Key Findings-Scott Doney
(WHOI)
U.S. Global Change Research Program
http://www.whoi.edu/fileserver.do?id=149804&pt=10&p=91553
Global Warming & Climate Change Article Archive- New York Times
http://topics.nytimes.com/top/news/science/topics/globalwarming/index.html?
inline=nyt-classifier
Sources
Cleannet.org. Climate Literacy: The Essential Principles of Climate Sciences: A
Guide for Individuals and Communities. March 2009. www.climatescience.gov.
(accessed 6/1/13).
Gillis, Justin. “Climate Panel Cites Near Certainty on Warming.” The New York
Times, August 20, 2013.
Henson, Robert. The Rough Guide to Climate Change: The Symptoms, The
Science, The Solutions. London: Rough Guides Ltd., 2011.
Intergovernmental Panel on Climate Change. Climate Change 2007: Working
Group 1: The Physical Science Basis. Cambridge, England: Cambridge University
Press, 2007. http://www.ipcc.ch/publications_and_data/ar4/wg1/en/contents.html
(accessed 8/156/13).
Intergovernmental Panel on Climate Change. Climate Change 2007: Working
Group II: Impacts, Adaptation, and Vulnerability. Cambridge, England: Cambridge
University Press, 2007.

Intergovernmental Panel on Climate Change. Climate Change 2007: Working
Group III: Mitigation of Climate Change.
Karl, Thomas R., Jerry M. Melillo, and Thomas C. Peterson, editors. Global Climate
Change Impacts in the United States. New York: Cambridge University Press,
2009.
Union of Concerned Scientists. Global Warming Solutions: Prepare for
Impacts.http://www.ucsusa.org/global_warming/solutions/prepare-for-impacts.
(accessed 10/4/2013).
UN Framework Convention on Climate Change, Report of the Conference of the
Parties on its fifteenth session, held in Copenhagen from 7 to 19 December 2009
http://unfccc.int/resource/docs/2009/cop15/eng/11a01.pdf
U.S. Environmental Protection Agency. “Climate Change: Overview of Greenhouse
Gases: Methane Emissions.” http://epa.gov/climatechange/ghgemissions/bases/
ch4.html (accessed 8/15/13).
U.S. Environmental Protection Agency. “Climate Change: Overview of Greenhouse
Gases: Nitrous Oxide Emissions.” http://epa.gov/climatechange/ghgemissions/
bases/n2o.html (accessed 8/15/13).