Embed Size (px)
Citation preview
Proceedings World Geothermal Congress 2015
Melbourne, Australia, April 19-25, 2015
1
The Resistivity Structure of Aluvial in Geothermal Prospect Using Time Domain
Electromagnetic Methode (TDEM) Survey
Taruna Fadillah, Budi Sulistijo, Sudarto Notosiswoyo, Ary Kristanto, and Anna Yushantarti
Bandung Institute of Technology, Jln Ganesha 10, Bandung, West Java, 40132, Indonesia
Keywords: Geothermal, Resistivity, Time Domain Electromagnetic Method, Aluvial
ABSTRACT
Time-domain electromagnetic (TDEM) surveys were carried out around alluvial region, Sulili district, Pinrang regency, South
Sulawesi province, Indonesia in 2013. The purpose of the study is to determine areas of low resistivity geophysical data using Time
Domain Electromagnetic Method. The surveys were a completion of the previously interpreted geological data collected from
geological surveys in 2012. Interpretation of the recorded transient magnetic fields resulted in a general feature of the resistivity
structure which was composed of three main layers: a low resistive layer (below 2 Ωm), a medium resistive layer (around 2-100
Ωm) and a high resistive layer (above 100 Ωm). Depending on geological formation, the high resistive layer was interpreted as
andecite intrution, medium resistive layer was interpreted as aluvial, Tml, Tmpv or all of them, and the low resistive layer was
considered to be a complex of altered geological formation. The cross section of conductance distribution showed a region near the
intrusion and hot water springs that had low resistivity characteristics. This evidence indicated that it was the cap rock of the
reservoir near of the geothermal manifestation.
1. INTRODUCTION
Geothermal exploration consists of several methods, which are geology, geochemistry and geophysics. In exploration, those
methods are complementary and give a complete and detailed exploration result. This study used the Time Domain Electromagnetic
Method (TDEM) because this method identifies rock resistivity. The study was conducted in the Center for Geology Resource
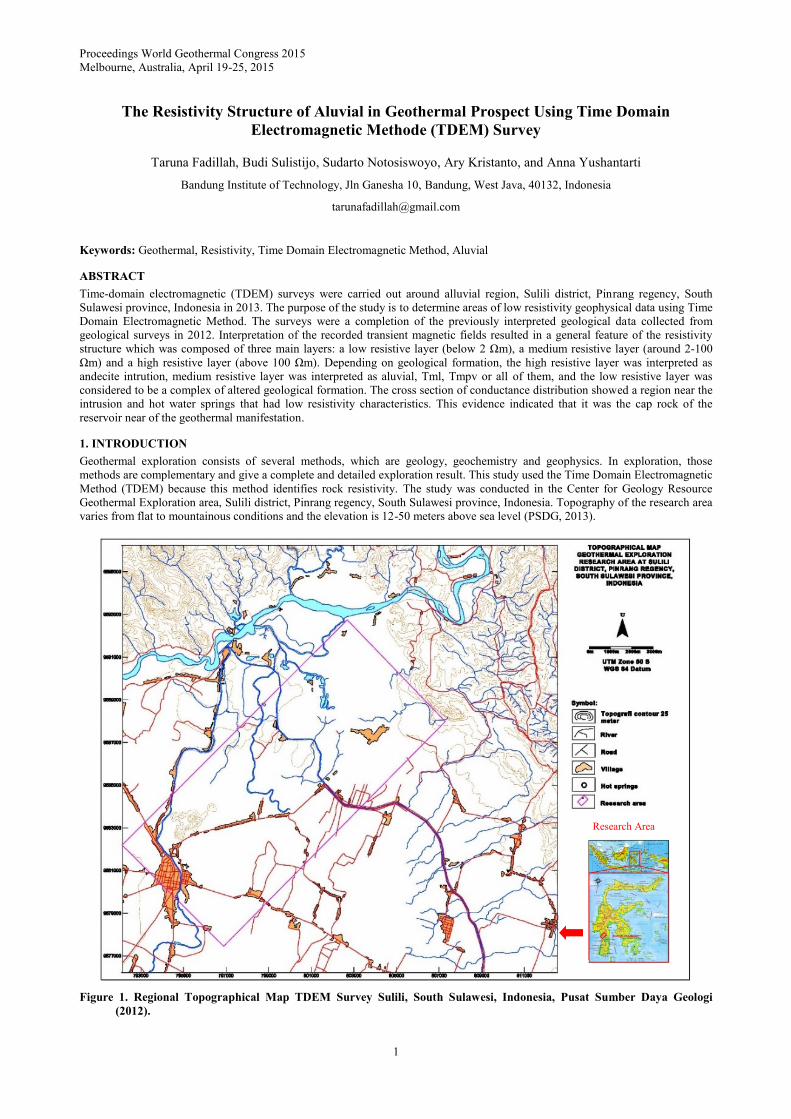
Geothermal Exploration area, Sulili district, Pinrang regency, South Sulawesi province, Indonesia. Topography of the research area
varies from flat to mountainous conditions and the elevation is 12-50 meters above sea level (PSDG, 2013).
Figure 1. Regional Topographical Map TDEM Survey Sulili, South Sulawesi, Indonesia, Pusat Sumber Daya Geologi
(2012).
Research Area
Fadillah et al.
2
This geological formation was formed by faults in the northern and eastern part of this research area. There are major fault
structures in the north and a large fracture in the northeast. Graben structures which existed in the area were caused by two
structures on the northern and northeastearn. Based on the stratigraphy of the formation, the youngest rock was alluvium, while the
oldest was Latimojong formation.
2. TIME DOMAIN ELECTROMAGNETIC METHOD
Time Domain Electromagnetic Method (TDEM) is a geophysical method that uses electrical current injection from the transmitter
to the cable which will form a magnetic field (Telford, 1990). In this research, Time Domain Electromagnetic Method (TDEM)
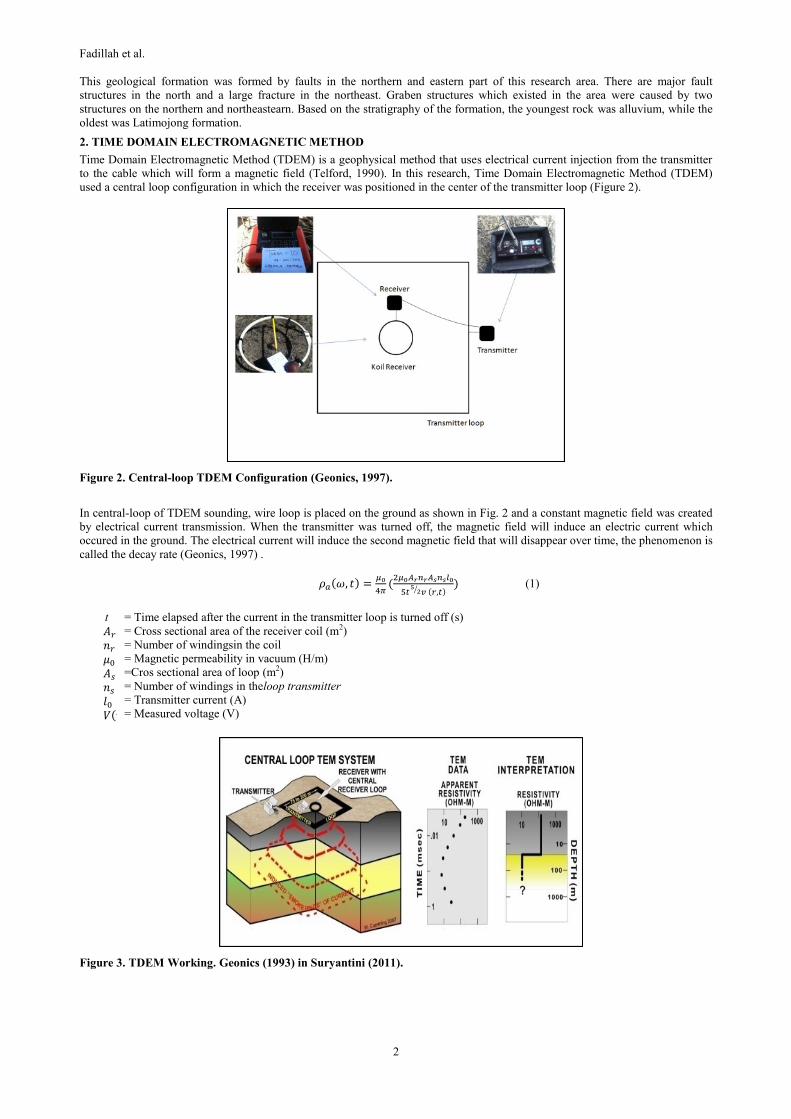
used a central loop configuration in which the receiver was positioned in the center of the transmitter loop (Figure 2).
Figure 2. Central-loop TDEM Configuration (Geonics, 1997).
In central-loop of TDEM sounding, wire loop is placed on the ground as shown in Fig. 2 and a constant magnetic field was created
by electrical current transmission. When the transmitter was turned off, the magnetic field will induce an electric current which
occured in the ground. The electrical current will induce the second magnetic field that will disappear over time, the phenomenon is
called the decay rate (Geonics, 1997) .
𝜌𝑎(𝜔, 𝑡) =𝜇0
4𝜋(
2𝜇0𝐴𝑟𝑛𝑟𝐴𝑠𝑛𝑠𝑙0
5𝑡5
2⁄ 𝑣 (𝑟,𝑡)) (1)
t
𝐴𝑟
𝑛𝑟
𝜇0
𝐴𝑠
𝑛𝑠
𝑙0
𝑉(𝑟, 𝑡)
= Time elapsed after the current in the transmitter loop is turned off (s)
= Cross sectional area of the receiver coil (m2)
= Number of windingsin the coil
= Magnetic permeability in vacuum (H/m)
=Cros sectional area of loop (m2)
= Number of windings in theloop transmitter
= Transmitter current (A)
= Measured voltage (V)
Figure 3. TDEM Working. Geonics (1993) in Suryantini (2011).
Fadillah et al.
3
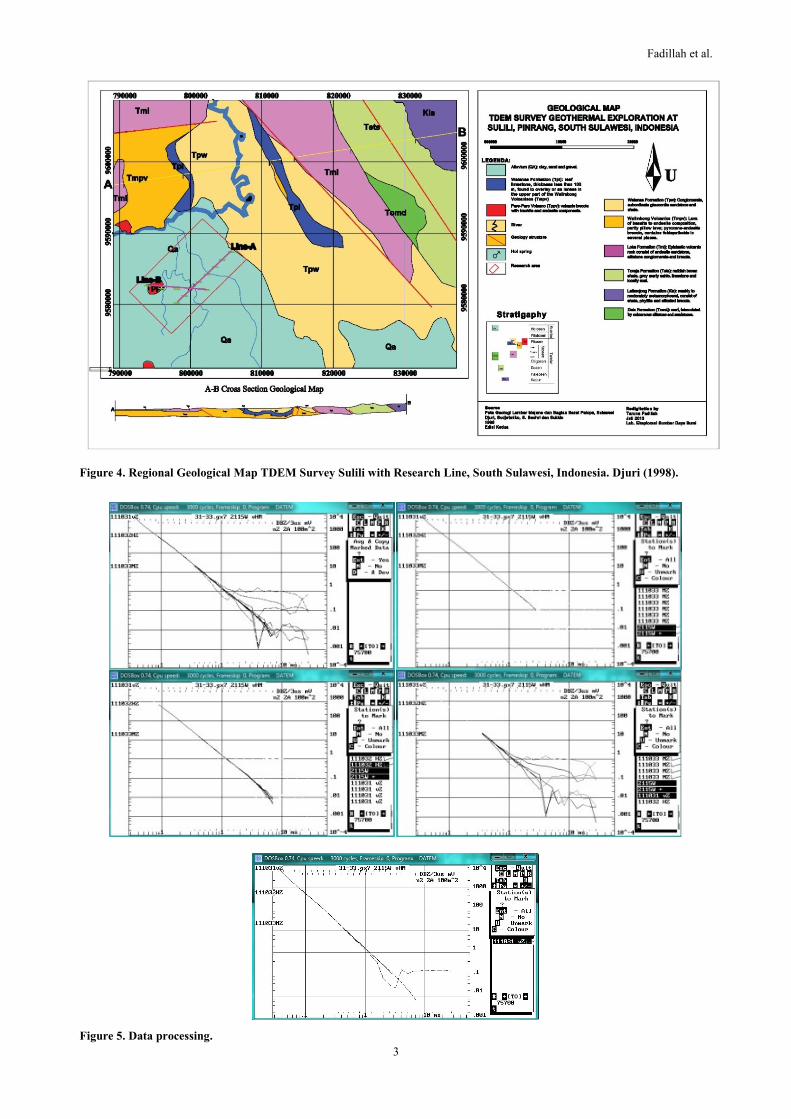
Figure 4. Regional Geological Map TDEM Survey Sulili with Research Line, South Sulawesi, Indonesia. Djuri (1998).
Figure 5. Data processing.
Fadillah et al.
4
3. ANALYSIS OF TDEM SOUNDING
Based on initial data and interpretation, it could be gained the interpretation and analysis of cross-sectional models of each line
interpolation. This interpretation will be analyzed with the data from the geological map. Resistivity will be grouped into low,
medium, and high for rock interpretation. Low is ranged from one to two ohm.m, while 100 ohm.m or higher is high and medium is
in the range of 2-100 ohm.m.
The distribution of TDEM stations is shown in Figure 4. There are eight station from north to south and six stations from west to
east. The current injection is arount 2-4 A and the diameter of the loop transmitter is about 50 meter each point. In each station, we
use three frequency: 62.5, 25 and 6.25 Hz. The data processing combined three graphics of all frequencies to become one graphic.
Graphics can be well interpreted if they have small noise. After that, the graphics can be interpreted as resistivity value, which gives
information about the geological layer.
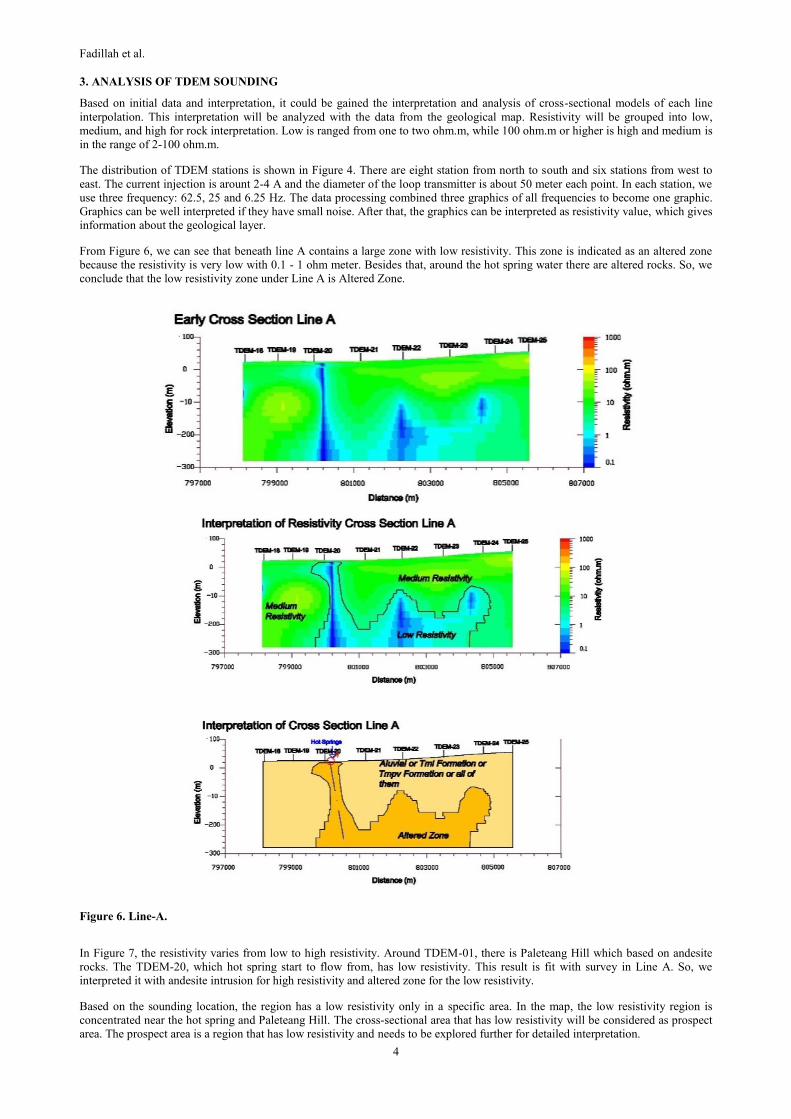
From Figure 6, we can see that beneath line A contains a large zone with low resistivity. This zone is indicated as an altered zone
because the resistivity is very low with 0.1 - 1 ohm meter. Besides that, around the hot spring water there are altered rocks. So, we
conclude that the low resistivity zone under Line A is Altered Zone.
Figure 6. Line-A.
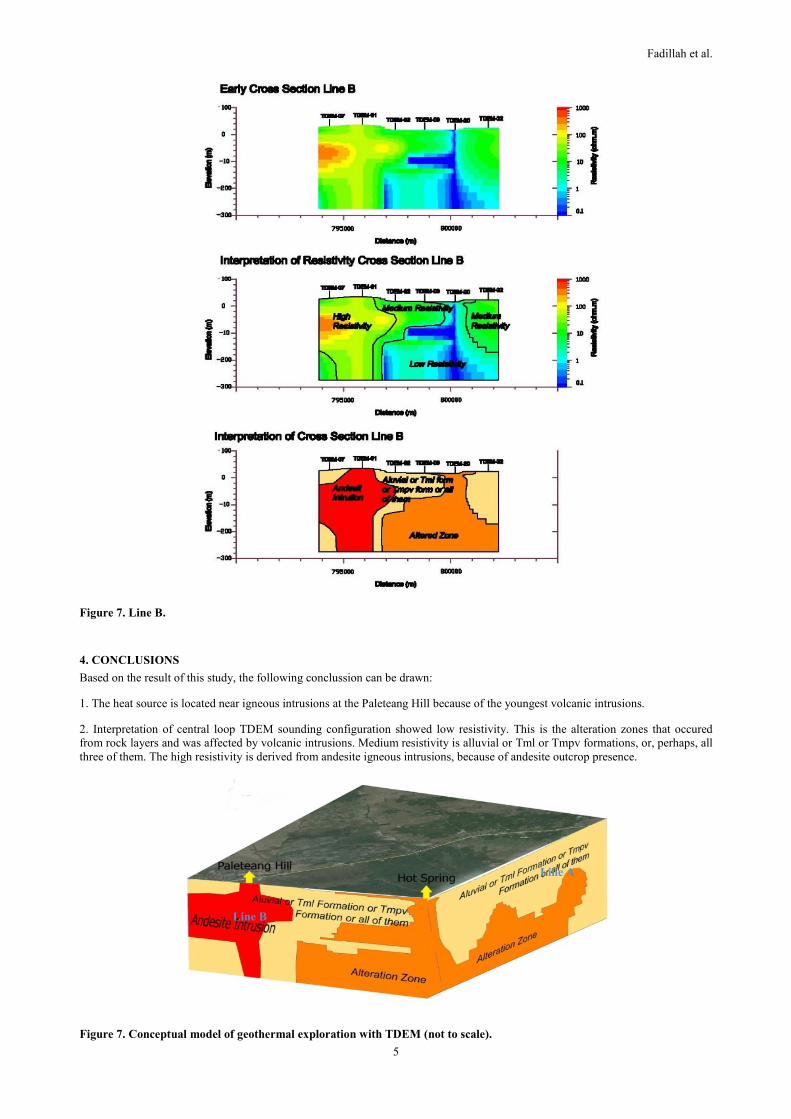
In Figure 7, the resistivity varies from low to high resistivity. Around TDEM-01, there is Paleteang Hill which based on andesite
rocks. The TDEM-20, which hot spring start to flow from, has low resistivity. This result is fit with survey in Line A. So, we
interpreted it with andesite intrusion for high resistivity and altered zone for the low resistivity.
Based on the sounding location, the region has a low resistivity only in a specific area. In the map, the low resistivity region is
concentrated near the hot spring and Paleteang Hill. The cross-sectional area that has low resistivity will be considered as prospect
area. The prospect area is a region that has low resistivity and needs to be explored further for detailed interpretation.
Fadillah et al.
5
Figure 7. Line B.
4. CONCLUSIONS
Based on the result of this study, the following conclussion can be drawn:
1. The heat source is located near igneous intrusions at the Paleteang Hill because of the youngest volcanic intrusions.
2. Interpretation of central loop TDEM sounding configuration showed low resistivity. This is the alteration zones that occured
from rock layers and was affected by volcanic intrusions. Medium resistivity is alluvial or Tml or Tmpv formations, or, perhaps, all
three of them. The high resistivity is derived from andesite igneous intrusions, because of andesite outcrop presence.
Figure 7. Conceptual model of geothermal exploration with TDEM (not to scale).
Line A
Line B
Fadillah et al.
6
REFERENCES
Djuri, Sudjatmiko, dkk: Peta Geologi Lembar Majene dan Bagian Barat Lembar Palopo, Sulawesi, skala 1:250.000. Pusat
Penelitian dan Pengembangan Geologi, Bandung, (1998).
Geonics Limited: GSPx7, Protem & EM37 Transient EM Software for PC/MS-DOS Compatibles. Canada, (1993).
Geonics Protem-47D: operating manual 3.0, (1997)
Pusat Sumber Daya Geologi: Peta Topografi Survei TDEM daerah Panasbumi Sulili, Pinrang, Sulawesi Selatan. PSDG, Bandung,
(2012).
Pusat Sumber Daya Geologi (PSDG): Laporan Survei Terpadu Geologi dan Geokimia daerah Panasbumi, Sulili, Pinrang, Sulawesi
Selatan. PSDG, Bandung, (2013).
Suryantini: Metode Geofisika untuk Eksplorasi Panasbumi. In-House Training Unima-Magister Geothermal ITB. ITB, Bandung,
(2011).
Telford, W. M. ,Geldart, L. P. ,Sheriff, R. E: Applied Geophysics, Second Edition. Cambridge University Press, Cambridge, (1990).


![RESISTIVITY [ ]](https://img.pdfslide.net/doc/110x75/6249524a7a9f6a12787a8128/resistivity-.jpg)