Embed Size (px)
Citation preview
1
The retirement effects of old-age pension and early retirement schemes in OECD countries
Romain Duval1
Department of Economics, OECD
Abstract
This paper examines the impact of old-age pension systems and other social transfer programmes on the retirement decision of older males in OECD countries. For each of the 55-59, 60-64 and 65+ age groups, a new panel dataset (22 OECD countries over 1969-1999 or shorter periods in some cases) of retirement incentives embedded in those schemes is constructed for an illustrative worker. The main focus is on the implicit tax rate on working for five more years, which sums up various dimensions of retirement incentives such as the pension accrual rate but also, to a lesser extent, the availability and generosity of benefits. There is currently wide dispersion across OECD countries in implicit tax rates on continued work embedded in old-age pension and early retirement schemes: they are high in most Continental European Countries, compared with Japan, Korea, English-speaking and Nordic countries. Simple cross-country correlations and panel data econometric estimates both show that implicit taxes on continued work have sizeable effects on the departure of older male workers from the labour force. For the 55-59 age group, there is clear evidence that these effects result from a number of social transfer programmes, which have been used de facto as early retirement schemes, rather than from old-age pension systems themselves. For the 60-64 and 65+ age groups, eligibility ages also appear to have a specific impact on the retirement decision, probably reflecting liquidity and/or customary effects. On the basis of estimated coefficients, past changes in implicit tax rates and standard retirement ages are found to explain about a third (31%) of the trend decline in older males’ labour force participation in OECD countries over the last three decades. Though this is more than in previous comparable studies, it remains plausible that other determinants, such as preferences for leisure or “demand-side” factors, may have also played a role in driving down participation rates.
JEL Classification: H55, J14, J21, J26
Key words: Social Security, public pensions, economics of the elderly, labor force and employment, retirement policies
1 . E-mail address: [email protected]. The views expressed in this paper are those of the author and
should not be construed as those of the OECD. I would like to thank Jean-Marc Burniaux, Florence Jaumotte, Willi Leibfritz, Svenbjörn Blöndal, Jorgen Elmeskov, Mike Feiner and other colleagues in the OECD Economics Department for their valuable comments. Invaluable statistical assistance was provided by Catherine Chapuis-Grabiner.
2
1. Introduction
Over the future decades, population ageing will induce a substantial “greying” of the working-age population in OECD countries. Given their currently low labour market attachment compared with prime-age workers, aggregate participation and employment rates would decline and old-age dependency ratios would rise. These evolutions, combined with the growth slowdown associated with lower growth rates of the working-age population, would put increasing pressure on living standards and the fiscal sustainability of social expenditures. Increasing the labour force and employment of older workers, not least by raising effective retirement ages,2 could help alleviate the burden of ageing populations by increasing output and curbing the projected increases in spending on old-age pensions, while at the same time generating higher tax revenues to finance them. More broadly, as this paper will make clear, there is evidence that higher labour force participation of older workers would be welfare-enhancing in many countries.
Despite the potential gains associated with later retirement, the steep decline in the effective retirement age that has prevailed since the first oil shock has been at best reversed slightly in few OECD countries during the 1990s, and has simply come to a halt in most others. As a result, effective retirement ages remain significantly lower than in the early 1970s. However, there is considerable variation across countries in terms of both current levels of participation rates of older workers and the magnitude of their past declines. In 2001, the participation rates of males aged 55-64 ranged from under 40% in Belgium, Hungary and Luxembourg to over 80% in Iceland, Japan, Mexico and Switzerland, and the cross-country dispersion was even larger for females. Starting from comparable levels in the late 1960s, the participation rates of older males remained broadly stable in Japan until the mid-1990s while they declined by almost 40 percentage points in Finland and the Netherlands.
A broad range of factors identified in the literature may account for the trend decline and the cross-country variation in effective retirement ages. Some of these primarily affect labour supply, such as wealth effects associated with rising living standards, increased demand for leisure, and policies that distort retirement incentives, including through the design of welfare systems. Other factors affect supply indirectly via labour demand, such as: i) declining relative productivity and wages of low-skilled older workers in times of rapid technological change (Perrachi and Welch, 1994; Lee, 2003); ii) insufficient training; iii) rigid age-earnings profiles -
2 . In principle, there is no straightforward relationship between the effective retirement age and the
labour force participation of older workers. For instance, even if participation is higher in a country than another, the effective retirement age may still be lower if labour market participants withdraw earlier. However, there is actually a very strong cross-country relationship between both variables: countries with lower participation rates of older workers tend to have lower effective retirement ages. Therefore, increasing the effective retirement age and raising the labour force participation of older workers appear to go hand in hand in practice.
3
supported by specific institutional arrangements of which some reflect policies (high minimum wage, stringent employment protection legislation) - reducing the employment opportunities of the older unemployed, thereby discouraging them to remain in the job market; and, iiii) temporary negative demand shocks leading to irreversible labour force withdrawal. Some of these demand-side influences tend to reinforce each other. For instance, rigid age-earnings profiles can provide insufficient incentives to engage in training, thereby magnifying the decline in productivity of older workers. At the same time, they can hinder the wage response to this productivity decline. As a result, demand for older workers declines and unemployment increases, thereby encouraging older workers to leave the labour market.
The focus of this paper is mainly on early retirement incentives embedded in pension systems and a number of social transfer programmes used de facto as early retirement schemes. This relatively narrow focus on social protection systems is adopted for various reasons. First, in reasonably well-functioning labour and product markets, supply-side factors should be the major long-run determinants of labour force participation, even though in practice market imperfections may also assign an influential role to demand-side factors. In this paper, demand-side policies, such as tax wedges, minimum wages, employment protection legislation or active labour market policies, are indirectly taken into account -- to the extent that they affect labour force participation indirectly via their impact on unemployment (“discouraged worker” effect) - but not explicitly explored. Second, reducing early retirement incentives may to a certain extent contribute to easing labour demand constraints, for example by lengthening the pay-back period for investment in training. They may also reduce the risk that temporary negative demand shocks induce some older workers to withdraw irreversibly from the labour market, thereby leading to permanent labour supply effects. Third, other supply-side factors, such as living standards and/or demand for leisure, cannot account a priori for the large differences in effective retirement ages observed in the OECD area, and even less so for the fact that these differences have widened over time.3 This hints at a significant impact of retirement incentives embedded in social systems. Finally, adjusting these systems to better cope with ageing populations is a main policy target in OECD countries and is the
3 . For instance, despite being ranked among the highest OECD countries in terms of GDP per capita,
Japan and the United States have significantly above-average participation rates for older workers. Similarly, demand for leisure is unlikely to differ drastically across OECD countries given their economic and socio-cultural integration. However, these factors may have contributed to a common trend decline in participation rates of older workers within OECD countries over the past decades, at least to the extent that they have dominated the opposite effects of higher life expectancy and improved health status. For instance, Johnson (2000) provides evidence of negative participation effects of rising living standards for a panel of developed countries, while Costa (1997) suggests similar effects from rising demand for leisure - associated with declining relative prices and improving quality of leisure goods. Nevertheless, these explanations for declining effective retirement ages in the OECD area are not fully convincing. Indeed, they would imply a concomitant trend increase in leisure time during working life. Yet, over the last three decades declines in working time have been modest compared with those in effective retirement ages.
4
main instrument available for policymakers to raise labour force participation of older workers.
The remainder of this paper is organised as follows. Section 2 presents descriptive results regarding early retirement incentives embedded in pension schemes and other welfare systems - such as unemployment, disability or special early retirement benefits that have been used as pathways into early retirement -, both across countries and over time. Section 3 presents preliminary cross-country econometric evidence about the overall impact of these schemes on labour force participation of older males. Section 4 provides more in-depth econometric analysis, based on panel data estimates. Section 5 sums up the main findings and concludes.
2. Assessing early retirement incentives embedded in old-age pension systems and their evolution over time
Three main characteristics of old-age pension systems, presented each in turn below, can affect the retirement decision of older male workers: i) standard and early ages of entitlement to pension benefits, when associated with liquidity constraints and/or “customary” effects; ii) the generosity of pension benefits; and, iii) the implicit marginal tax attached to them.
2.1. Standard and early ages of entitlement to old-age pension benefits
In theory, retirement eligibility does not per se induce effective retirement. Under a certain set of assumptions, standard and early ages of entitlement to benefits would even have no direct effect on the retirement decision of older workers, over and above their indirect impact via pension wealth levels and implicit taxes on continued work (see below). When trading off between consumption and leisure/retirement over their life cycle, forward-looking individuals could always set their retirement age at the optimal level chosen to maximise their welfare by borrowing or lending in capital markets. Since there is a priori no reason for the optimal retirement age to be equal to the standard age, the latter should not per se affect the retirement decision.
However, there is ample evidence that actual retirement decisions do not conform to standard life-cycle models on this specific point. Indeed, a common feature of empirical studies of the retirement decision is that even fairly detailed microeconomic models cannot explain the large jumps in retirement rates occurring at early and standard retirement ages (Gruber and Wise, 2002). At least four factors may account for this specific impact of standard and early entitlement ages on the effective retirement age: i) some individuals are “liquidity constrained”, which makes them unable to borrow in order to retire before pension benefits
5
are available; ii) custom or accepted practice induce people to retire at “customary” ages (Lumsdaine et al., 1996); iii) workers are myopic or information constrained, i.e. they do not assess accurately actuarial incentives/disincentives to continued work embedded in pension systems and thus tend to retire at the earliest age at which benefits become available; and, in some cases, iv) individuals may not be allowed to continue working after the standard retirement age.
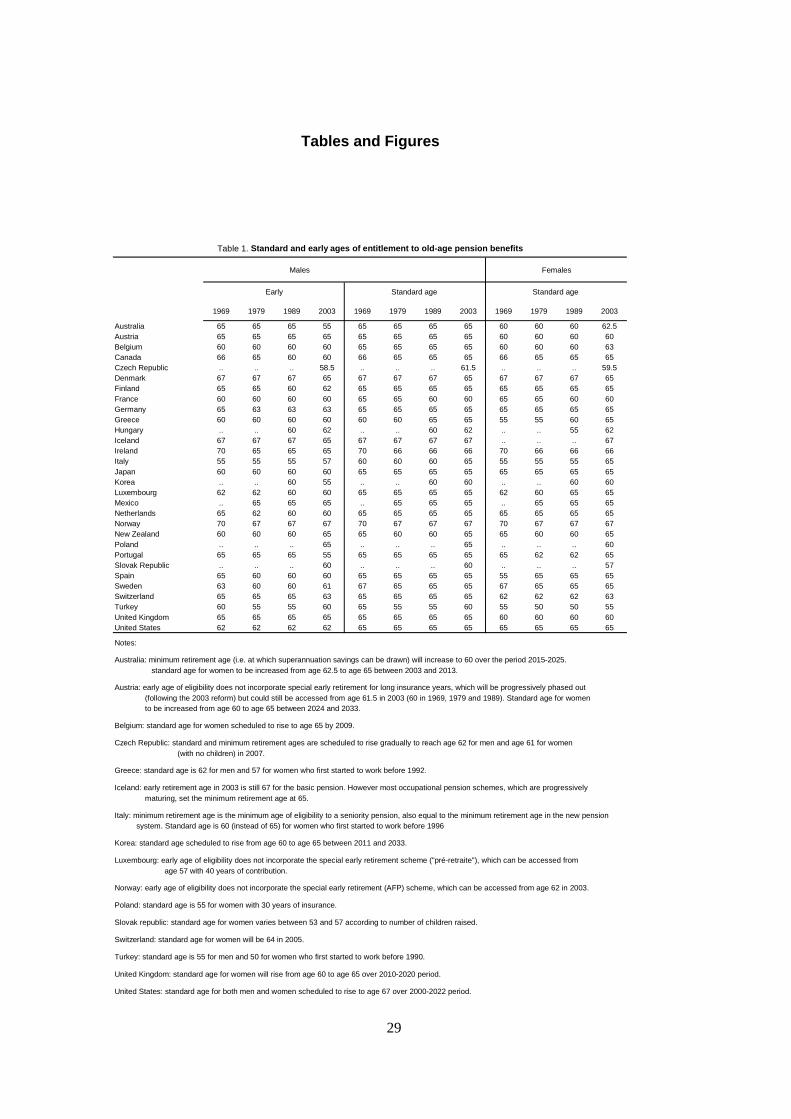
The standard age of eligibility to pension benefits differs substantially across OECD countries (Table 1). It is currently set at 65 years in two-thirds of them, but ranges from a low of 60 in a few countries (France, Korea, Slovak Republic and Turkey) to a high of 67 in some Nordic countries (Denmark, Iceland and Norway). There is somewhat wider cross-country variance in standard ages for females because several countries still keep it lower than for males (Austria, Belgium, Czech Republic, Poland, Slovak Republic, Switzerland, Turkey, United Kingdom). However, in most of these countries gradual convergence towards male levels has already started, or is scheduled in the future (Table 1). There are even greater cross-country differences in early eligibility ages than in standard ages, but interpreting their impact on retirement incentives is not straightforward because pension penalties for early withdrawal also differ considerably.
In the majority of OECD countries, standard and -to a lesser extent- early ages have remained constant since the late 1960s. In those countries where changes have occurred, a general pattern emerges of cuts in the 1970s-1980s (Canada, Finland, Germany, Ireland, Netherlands, Norway, Spain, Sweden), followed by few increases (Finland, Italy, New Zealand, Sweden) since the beginning of the 1990s. In New Zealand, the rapid transition from 60 to 65 in the standard retirement age during the 1990s was accompanied by a pick-up in the labour force participation of the 55-64 age group –by over 15 percentage points – a larger rise than in any other OECD country over the past three decades.
[Table 1. Standard and early ages of entitlement to old-age pension benefits]
2.2. Replacement rates and pension wealth levels
Under a certain set of conditions, labour force participation should be independent from replacement rate levels. According to standard life-cycle theory, a Pay-As-You-Go (PAYGO) scheme that pays an amount of pension benefits equal to the amount of contributions (or other taxes in flat-rate pension systems) paid (in present value terms) should have no effect on consumption or labour supply, as long as the taxes imposed are no greater than the amount that the person would have saved voluntarily and the real interest rate equals the rate of
6
growth of total real wages (Aaron, 1982, Chapter 2; Disney, 1996, Chapter 7).4 Indeed, such quasi or fully-funded scheme would simply reduce personal saving during working life by the amount of contributions paid, i.e. the savings rate would be low if contributions and replacement rates were high, and vice versa.5
In practice, however, redistributive elements in schemes, changes in scheme provisions, as well as demographic changes, lack of information and short time horizons, imply that public pension systems affect the distribution of income and wealth both across and within generations, thereby creating “wealth effects” on the retirement decision (Disney, 1996). Indeed, the future stream of benefits to which older workers are entitled can be regarded as their old-age pension wealth, which is a share of their total wealth. Hence, an unexpected6 increase in the level of pension benefits of older workers not exactly offset by an increase in their tax payroll creates windfall gains in the value of their retirement and total assets. The resulting increase in their demand for both consumption goods and leisure pushes them to retire earlier than expected, insofar as retirement is a form of leisure concentrated at the end of the working life.7 Assuming no further institutional or demographic shocks, these participation effects then fade over time as new cohorts, unaffected by redistribution between past generations, replace older ones.8
The most straightforward indicator of the generosity of pension benefits is the replacement rate, which corresponds to the ratio of annual benefits to earnings just prior to retirement.9 4 . Lifetime retirement models also rely on the assumption that individuals have a long planning horizon
in making their labour supply decisions and fully recognise the value of accumulating entitlements to future benefits associated with contributions paid.
5 . Even if the amount of contributions is so high that it exceeds desired saving, such PAYGO scheme would still not affect labour supply behaviour so long as individuals can borrow at the same rate used to compute pension benefits.
6 . Expected increases in the generosity of pension benefits yield smaller labour supply effects than unexpected ones. The farther in advance changes in scheme provisions are announced, the more workers increase their consumption and reduce their savings in anticipation of future pension wealth gains (Feldstein, 1974), the smaller the increase in their total wealth and the corresponding impact on their retirement decision.
7 . The more workers care about the welfare of their descendants and realise that the cost of higher benefits will have to be borne by them, the more changes in the generosity of benefits are offset by changes in bequests, and the smaller the “wealth effect” on labour supply.
8 . Anderson et al. (1997) suggest that the large unanticipated increase in the level of social benefits that took place in the United States during the 1970s created windfall gains in the value of retirement assets of those nearing retirement, thus inducing some of them to anticipate their retirement decision. Unlike older workers, younger cohorts were less affected because they had time to adjust their savings patterns to reflect these windfalls.
9 . Earnings just prior to retirement are assumed to be a reasonable proxy for expected earnings from work, which in theory should be used in the calculation.
7
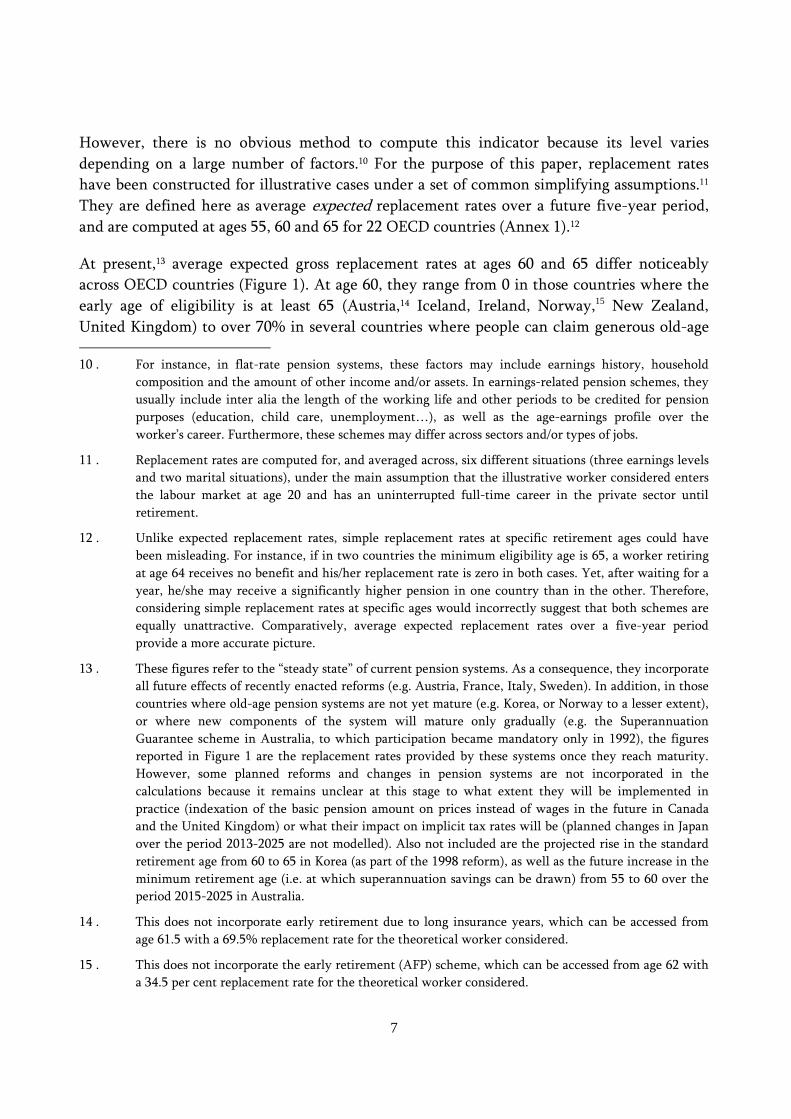
However, there is no obvious method to compute this indicator because its level varies depending on a large number of factors.10 For the purpose of this paper, replacement rates have been constructed for illustrative cases under a set of common simplifying assumptions.11 They are defined here as average expected replacement rates over a future five-year period, and are computed at ages 55, 60 and 65 for 22 OECD countries (Annex 1).12
At present,13 average expected gross replacement rates at ages 60 and 65 differ noticeably across OECD countries (Figure 1). At age 60, they range from 0 in those countries where the early age of eligibility is at least 65 (Austria,14 Iceland, Ireland, Norway,15 New Zealand, United Kingdom) to over 70% in several countries where people can claim generous old-age 10 . For instance, in flat-rate pension systems, these factors may include earnings history, household
composition and the amount of other income and/or assets. In earnings-related pension schemes, they usually include inter alia the length of the working life and other periods to be credited for pension purposes (education, child care, unemployment…), as well as the age-earnings profile over the worker’s career. Furthermore, these schemes may differ across sectors and/or types of jobs.
11 . Replacement rates are computed for, and averaged across, six different situations (three earnings levels and two marital situations), under the main assumption that the illustrative worker considered enters the labour market at age 20 and has an uninterrupted full-time career in the private sector until retirement.
12 . Unlike expected replacement rates, simple replacement rates at specific retirement ages could have been misleading. For instance, if in two countries the minimum eligibility age is 65, a worker retiring at age 64 receives no benefit and his/her replacement rate is zero in both cases. Yet, after waiting for a year, he/she may receive a significantly higher pension in one country than in the other. Therefore, considering simple replacement rates at specific ages would incorrectly suggest that both schemes are equally unattractive. Comparatively, average expected replacement rates over a five-year period provide a more accurate picture.
13 . These figures refer to the “steady state” of current pension systems. As a consequence, they incorporate all future effects of recently enacted reforms (e.g. Austria, France, Italy, Sweden). In addition, in those countries where old-age pension systems are not yet mature (e.g. Korea, or Norway to a lesser extent), or where new components of the system will mature only gradually (e.g. the Superannuation Guarantee scheme in Australia, to which participation became mandatory only in 1992), the figures reported in Figure 1 are the replacement rates provided by these systems once they reach maturity. However, some planned reforms and changes in pension systems are not incorporated in the calculations because it remains unclear at this stage to what extent they will be implemented in practice (indexation of the basic pension amount on prices instead of wages in the future in Canada and the United Kingdom) or what their impact on implicit tax rates will be (planned changes in Japan over the period 2013-2025 are not modelled). Also not included are the projected rise in the standard retirement age from 60 to 65 in Korea (as part of the 1998 reform), as well as the future increase in the minimum retirement age (i.e. at which superannuation savings can be drawn) from 55 to 60 over the period 2015-2025 in Australia.
14 . This does not incorporate early retirement due to long insurance years, which can be accessed from age 61.5 with a 69.5% replacement rate for the theoretical worker considered.
15 . This does not incorporate the early retirement (AFP) scheme, which can be accessed from age 62 with a 34.5 per cent replacement rate for the theoretical worker considered.
8
pension benefits in their early sixties (Korea, Luxembourg, Netherlands,16 Portugal, Spain). At age 65, they range from less than 40% in Ireland and Norway to as high as 100% in Hungary and Luxembourg.
[Figure 1. Average expected replacement rates over next 5 years in current old-age pension systems]
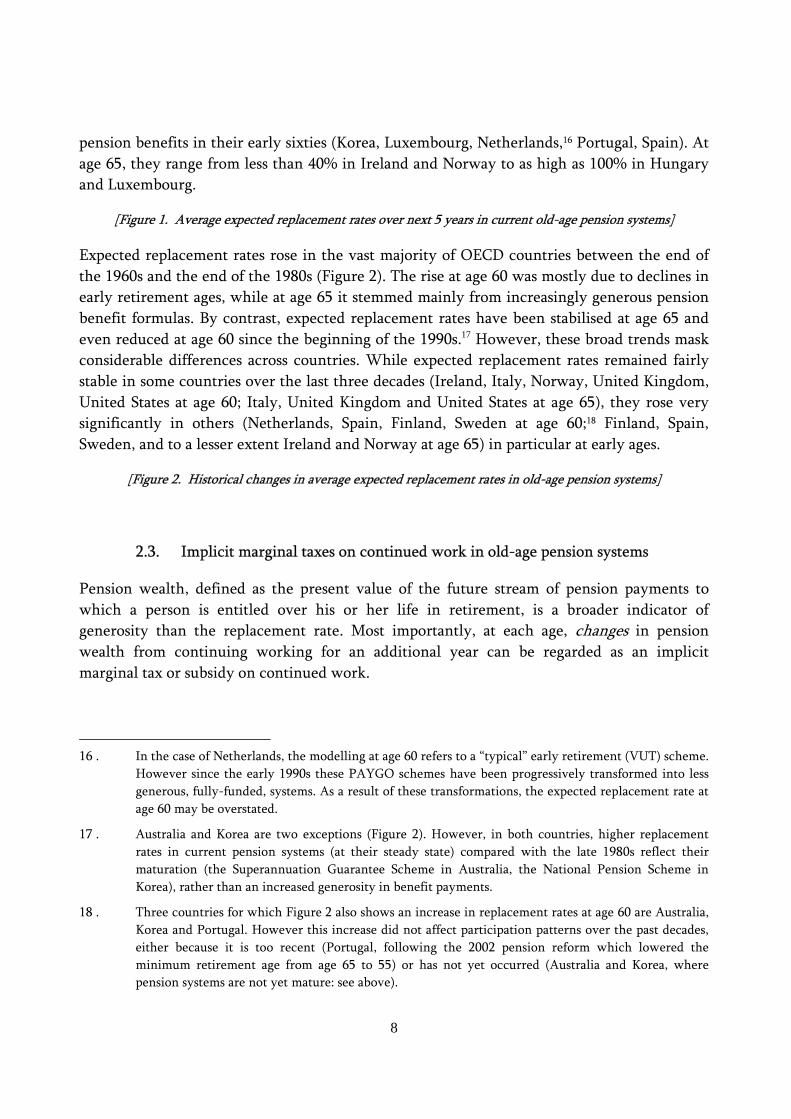
Expected replacement rates rose in the vast majority of OECD countries between the end of the 1960s and the end of the 1980s (Figure 2). The rise at age 60 was mostly due to declines in early retirement ages, while at age 65 it stemmed mainly from increasingly generous pension benefit formulas. By contrast, expected replacement rates have been stabilised at age 65 and even reduced at age 60 since the beginning of the 1990s.17 However, these broad trends mask considerable differences across countries. While expected replacement rates remained fairly stable in some countries over the last three decades (Ireland, Italy, Norway, United Kingdom, United States at age 60; Italy, United Kingdom and United States at age 65), they rose very significantly in others (Netherlands, Spain, Finland, Sweden at age 60;18 Finland, Spain, Sweden, and to a lesser extent Ireland and Norway at age 65) in particular at early ages.
[Figure 2. Historical changes in average expected replacement rates in old-age pension systems]
2.3. Implicit marginal taxes on continued work in old-age pension systems
Pension wealth, defined as the present value of the future stream of pension payments to which a person is entitled over his or her life in retirement, is a broader indicator of generosity than the replacement rate. Most importantly, at each age, changes in pension wealth from continuing working for an additional year can be regarded as an implicit marginal tax or subsidy on continued work.
16 . In the case of Netherlands, the modelling at age 60 refers to a “typical” early retirement (VUT) scheme.
However since the early 1990s these PAYGO schemes have been progressively transformed into less generous, fully-funded, systems. As a result of these transformations, the expected replacement rate at age 60 may be overstated.
17 . Australia and Korea are two exceptions (Figure 2). However, in both countries, higher replacement rates in current pension systems (at their steady state) compared with the late 1980s reflect their maturation (the Superannuation Guarantee Scheme in Australia, the National Pension Scheme in Korea), rather than an increased generosity in benefit payments.
18 . Three countries for which Figure 2 also shows an increase in replacement rates at age 60 are Australia, Korea and Portugal. However this increase did not affect participation patterns over the past decades, either because it is too recent (Portugal, following the 2002 pension reform which lowered the minimum retirement age from age 65 to 55) or has not yet occurred (Australia and Korea, where pension systems are not yet mature: see above).
9
More precisely, working for an extra year implies paying contributions to the system. Provided that the individual is already eligible for a pension, and that the receipt of a pension cannot be combined with earnings from work, remaining in the labour market also implies foregoing one year of benefits. If the cost in terms of foregone pensions and contributions paid is not exactly offset by an increase in future pension benefits, the pension system is said to be “actuarially non-neutral” and carries an implicit tax on continued work. Formulating this definition in terms of pension wealth, actuarial non-neutrality arises when the change in pension wealth from working for an additional year is less than the value of contributions paid.
In theory, labour supply effects of implicit taxes on continued work created by pension schemes are ambiguous (Mitchell and Fields, 1984). As suggested by Lazear (1986), over and above the usual wage rate, the implicit tax/subsidy on continued work can be regarded as an additional component of the “true wage”. From this perspective, a rise in the implicit tax on continued work - due for instance to a cut in the pension accrual rate - is equivalent to a fall in the wage rate, producing opposite substitution and income effects: the lower financial gain from postponing retirement reduces the opportunity cost of retiring earlier (negative substitution effect) but, at the same time, provides lower income for each future year of work, thereby inducing later retirement (positive income effect). In practice, however, there is overwhelming empirical evidence that the substitution effect dominates (Lazear, 1986; Lumsdaine and Mitchell, 1999). Therefore high implicit taxes on continued work tend to bias the retirement decision towards early labour market withdrawal.
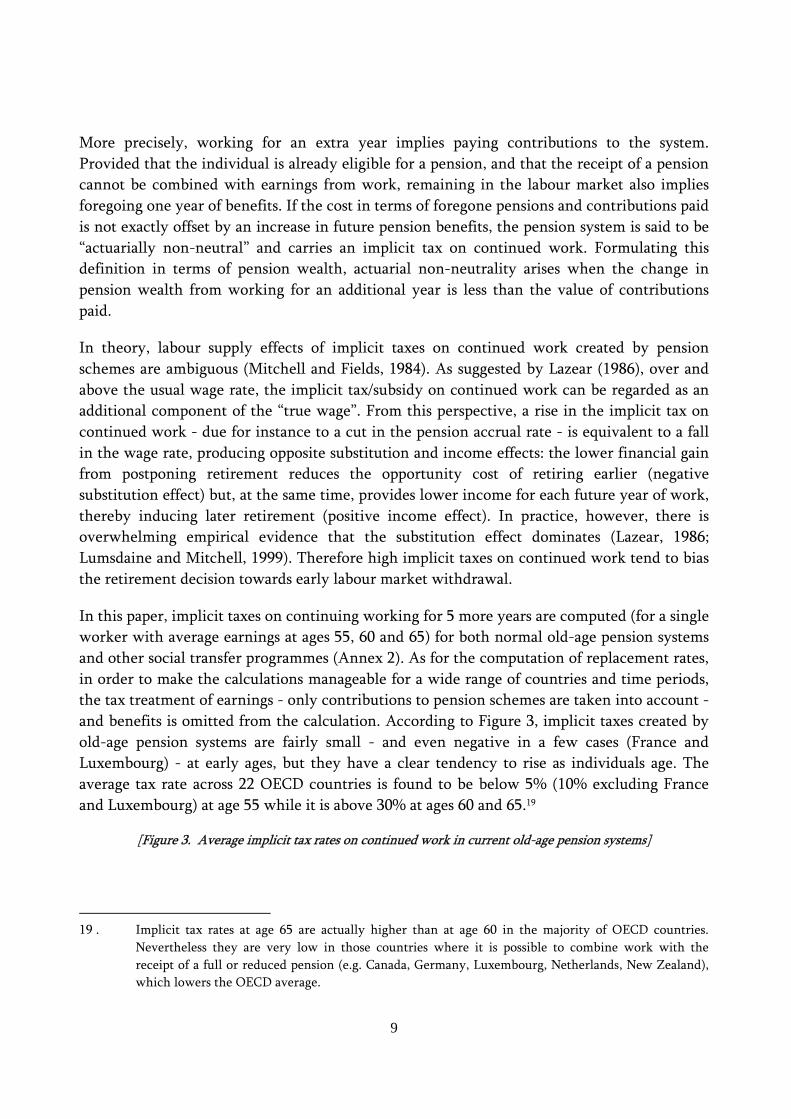
In this paper, implicit taxes on continuing working for 5 more years are computed (for a single worker with average earnings at ages 55, 60 and 65) for both normal old-age pension systems and other social transfer programmes (Annex 2). As for the computation of replacement rates, in order to make the calculations manageable for a wide range of countries and time periods, the tax treatment of earnings - only contributions to pension schemes are taken into account - and benefits is omitted from the calculation. According to Figure 3, implicit taxes created by old-age pension systems are fairly small - and even negative in a few cases (France and Luxembourg) - at early ages, but they have a clear tendency to rise as individuals age. The average tax rate across 22 OECD countries is found to be below 5% (10% excluding France and Luxembourg) at age 55 while it is above 30% at ages 60 and 65.19
[Figure 3. Average implicit tax rates on continued work in current old-age pension systems]
19 . Implicit tax rates at age 65 are actually higher than at age 60 in the majority of OECD countries.
Nevertheless they are very low in those countries where it is possible to combine work with the receipt of a full or reduced pension (e.g. Canada, Germany, Luxembourg, Netherlands, New Zealand), which lowers the OECD average.

10
The dispersion of implicit taxes on continued work across OECD countries is very large, especially at high ages.20 In addition, these differences usually match fairly well -though not perfectly- those in expected replacement rates (Figure 4 and Annex 3):21 countries with generous old-age pension systems often have also large implicit taxes on continued work (e.g. France, Luxembourg and the Netherlands at age 60, Austria, Italy and Spain at age 65), and vice versa (Iceland, Ireland, New Zealand, United Kingdom). Broadly speaking, implicit taxes are high in Continental European countries compared with Nordic and English-speaking ones.
[Figure 4. Average expected replacement rates and implicit tax rates on continued work]
Like expected replacement rates, although less pronounced, implicit taxes on continued work rose through the 1970s and the 1980s, but have started to stabilise -and even decline in some cases- since the early 1990s (Figure 5). Increases were large in some Continental European countries (France before the 2003 reform, Netherlands) compared with English-speaking and Nordic countries, primarily for people in their early 60s. Both of these observations are consistent with historical labour force participation patterns, i.e. with trend declines in participation being stronger in Continental European countries and having flattened out since the early 1990s.
[Figure 5. Historical changes in average implicit tax rates on continued work in old-age pension systems]
2.4. Implicit marginal taxes on continued work in other social transfer programmes
In a number of OECD countries, relatively easy access to various social transfer programmes has often enabled certain categories of older workers to withdraw from the labour market before the early age of entitlement to old-age pension benefits. Such schemes, which include special early retirement provisions as well as unemployment-related and disability benefits (Blöndal and Scarpetta, 1998; Casey et al., 2003), often entail high implicit taxes on continued work, for two main reasons: replacement rates are usually high, and pension rights continue to accrue, even if, in some cases, at a reduced rate.
No attempt is made here at being comprehensive in the coverage of these programmes. Rather, in order to provide a rough assessment of early retirement incentives arising from them, a “typical early retirement route” is modelled along the following lines:
20 . Excluding France and Luxembourg -where high implicit subsidies on continued work tend to inflate
variance across countries at age 55-, the cross-country dispersion of implicit tax rates is almost 4 times as high at age 60 as at age 55, and is about 50% higher at age 65 than at age 60.
21 . The correlation coefficient between average expected replacement rates and implicit taxes on continued work is about -0.8 at age 60 and -0.5 at age 65.
11
- In those countries where unemployment-related benefits can be used de facto22 to bridge the time until people are entitled to an old-age pension,23 implicit taxes on continued work are computed for the same illustrative cases as for old-age pension schemes.
- Where unemployment-related schemes cannot be used effectively as an early retirement device but other schemes are available,24 the latter are considered.
- Where no social transfer programme can be used to withdraw from the labour market before the minimum pensionable age,25 the “early retirement route” is simply the old-age pension pathway into retirement.
It should be stressed that, for at least two reasons, the implicit tax on continued work obtained using the above methodology provides only a rough estimate of the magnitude of retirement incentives embedded in early retirement schemes. First, the focus on a single “early retirement route” leaves aside the participation effects of a number of other social transfer programmes that may actually be used as early retirement devices. Second, the actual strictness of eligibility criteria for these programmes is imperfectly reflected in the calculations. For instance, even in those countries for which it has been assumed that retirement on account of disability is not - or no longer, as in Sweden - an available option due to the official strictness of eligibility criteria, the share of disability benefit status in non employment actually grew significantly during the second half of the 1990s (e.g. Australia, Sweden, United States: see OECD, 2003).
Keeping these caveats in mind, the results are broadly in line with those obtained for old-age pension schemes. First, the dispersion of implicit tax rates in the “early retirement route” is very large across OECD countries (Figures 6 and 7, Panels B). Second, implicit tax rates rose throughout most of the 1970s and the 1980s, especially at age 55, as early retirement schemes were created and/or were becoming more generous. However, this expansion has come to a halt since the early 1990s, and has even been reversed in some countries (e.g., Sweden, or Finland more recently).
22 The identification of social transfer programme that can be used de facto as early retirement devices is
based on Blöndal and Scarpetta (1998). Basically, unemployment benefit schemes fall into this category when they include special dispositions for older workers, such as no obligation to search for a job. Similarly, disability schemes are classified as early retirement schemes when disability pensions can be granted not only on the basis of health but labour market criteria.
23 Belgium, Finland, France, Germany, Netherlands, Portugal, Spain, United Kingdom.
24 Austria and Luxembourg (where disability benefits were considered given their widespread incidence among pensioners), as well as Ireland and Norway (where the modelling refers to the pre-retirement allowance and the special early retirement programme, respectively).
25 Australia, Canada, Iceland, Italy, Japan, Korea, New Zealand, Switzerland, United States.
12
3. Effects of implicit tax rates on labour market participation of older men: preliminary cross-country evidence
The implicit tax on continued work is the key summary indicator of early retirement incentives embedded in pension schemes because it also captures some of the effects of both eligibility ages and the generosity of benefits. The higher the replacement rate, the higher is the “opportunity cost” of and the implicit tax on continued work, ceteris paribus (Annex 3). Similarly, the higher the minimum pensionable age, the lower is the implicit tax on continued work before this age, ceteris paribus.26 Thus there is a rationale for focusing primarily on implicit taxes on continued work when assessing participation effects of retirement incentives embedded in pension schemes. In any event, the strong correlation between the replacement rate and the implicit tax on continued work raises a multicollinearity issue, thereby excluding the possibility to include both variables in cross-country and/or panel data regressions using macroeconomic data.27
As an illustration of potential participation effects of retirement incentives embedded in “regular” pension schemes, Panels A in Figures 6 and 7 plot, for two age spans (55-59 and 60-64), the fall in male labour force participation - an implicit measure of labour market withdrawal - against the corresponding implicit tax on continuing working for five more years.28 The fall in labour force participation over the age span 55-59 appears to be unrelated to the implicit tax on continued work between ages 55 and 60 (Figure 7, Panel A). This finding should come as no surprise, insofar as implicit taxes in regular pension schemes are usually low and fairly similar across countries at age 55, while differences in participation rates are large. A slightly positive - but insignificant - relationship even emerges, due to the position of France and Luxembourg where participation rates are low despite large implicit subsidies on continued work embedded in “regular” old-age pension schemes between ages 55 26 . To see this, one can consider a purely illustrative country in which the pensionable age would be 100.
Whatever the generosity of future benefits and the pension accrual rate between 60 and 65, pension wealth would be very low at both ages because pension flows to be received far into the future would be heavily discounted. Therefore, the change in pension wealth from continuing working between 60 and 65 would also be very small.
27 . For instance, the cross-country correlation coefficient between both variables in 1999 is about 0.8 for the 60-64 age group.
28 . Strictly speaking, people in the 50-54 and 55-59 age groups in 1999 belong to different birth cohorts. As a consequence, as computed in Figure 6, the difference in participation between these two age groups reflects not only a participation effect but also a cohort effect. However, in practice, the latter is very small compared with the former. Therefore, using the difference in participation within a given cohort (i.e. the participation rate of the 55-59 age group in 1999 less the participation rate of the 50-54 age group in 1994) would leave Figure 6 unaffected. The same applies to Figure 7 (55-59 and 60-64 age groups).
13
and 60. By contrast, there is a significant bivariate correlation between the fall in male labour force participation over the age span 60-64 and the implicit tax on continued work between 60 and 65 (Figure 7, Panel A). Both labour market withdrawal and implicit taxes are generally higher in Continental European countries than in Japan, Korea, English-speaking and Nordic countries.
While no clear link emerges between the fall in male labour force participation over the age span 55-59 and the implicit tax in “regular” pension systems (Figure 7, Panel A), a robust relationship emerges when the early retirement route is considered (Figure 7, Panel B). For the 60-64 age group, taking into account early retirement schemes brings a more limited improvement to the cross-country relationship between labour force participation and implicit tax rates (Figure 8, Panel B). These results hint at larger participation effects of early retirement programmes on workers in the 55-59 age group than on those in the 60-64 age group, whose retirement decision seems to be comparatively more influenced by regular pension schemes. This finding refines those of previous studies which had already pointed to comparable cross-country correlations for broader age groups (55-64 age group in Blöndal and Scarpetta, 1998; 55-69 age group in Gruber and Wise, 1999a)
[Figure 6. Fall in male labour force participation between 50-54 and 55-59 and implicit tax rates on continued work]
[Figure 7. Fall in male labour force participation between 55-59 and 60-64 and implicit tax rates on continued work]
4. Panel data econometric analysis of the labour force participation of older male workers
4.1. Previous studies
A broad range of microeconometric studies of the retirement decision have been conducted over the past decade for a number of OECD countries (for a summary of individual country results, see for instance, Blöndal and Scarpetta, 1998; Gruber and Wise, 1999b, 2002). They confirm that among a variety of factors -such as individual and household characteristics, economic variables such as wage earnings, retirement incentives embedded in old-age pension and early retirement schemes affect the labour supply of older workers. This result is also supported at the macroeconomic level by a variety of country case studies (see for instance the country-specific papers in Gruber and Wise, 1999b). The latter are based on the idea that historical changes in old-age pension benefits rules offer “natural experiments” to study the participation effects of early retirement incentives. For instance, when early and standard retirement ages are lowered and/or when early retirement benefits are allowed or extended, the wealth of older workers and the implicit tax on continued work tend to rise. Therefore,
14
historical experiences showing the effective age of retirement plummeting following benefit extensions (such as Germany and France respectively in the aftermath of the 1972 and 1981 reforms) or, conversely, soaring following benefit restrictions (New Zealand during the 1990s), can be interpreted as evidence of a powerful effect of retirement incentives on the labour supply of older workers.
Comparatively, panel data macroeconometric evidence remains fairly limited. Blöndal and Scarpetta (1998) find effects of old-age pension and early retirement schemes on the labour force participation of older men aged 55-64 in a panel of 15 countries from 1971 to 1995. Johnson (2000) investigates old-age pension systems only and reaches similar conclusions for males in the 60-64 and 65+ age groups in a panel containing data for 13 countries at approximately ten-year intervals from 1880 to 1990. However, in both studies the magnitude of the participation effects of early retirement incentives is relatively moderate: for instance, for the 60-64 age group, Johnson estimates that only around 11% of the decline in average participation rates from 1920 to 1990 can be explained by old-age pension variables.
The econometric analysis presented below combines the respective strengths of both studies, and as a result should a priori improve the estimates and allow richer analysis of the participation effects of retirement schemes. As in Johnson (2000, op.cit.), the calculation of implicit tax rates takes proper account of the possibilities to combine work with the receipt of a reduced or full pension. For instance, when benefits are not income-tested and no contributions to the pension system have to be paid, the implicit tax is simply zero because the stream of future payments is the same whether individuals keep working or not (Annex 2). For instance, less strict income testing has been traditionally at the root of low implicit taxes on continued work in the Swedish and Japanese pension systems, two countries with significantly above-average participation rates of older workers. Also as in Johnson (2000, op.cit.), separate analysis is undertaken for the 55-59, 60-64 and 65+ age groups, while only the aggregate 55-64 age group was studied in Blöndal and Scarpetta (1998, op.cit.). There are several advantages associated with breaking up older males into three different age groups: i) the narrower the age band considered, the smaller the “demographic bias” involved in older males’ participation trends;29 ii) isolating the 55-59 age group allows more precise analysis of the participation effects of early retirement schemes, because the latter affect a priori to a lesser extent the 60-64 age group; and, iii) the implicit horizon for the retirement decision is shorter and, thus, probably more realistic in practice (individuals are implicitly assumed to
29. To see how considering large age-bands tends to bias the analysis of participation trends, one can
consider a hypothetical country where (different) participation rates of both the 55-59 and 60-64 age groups would have remained constant over past decades. A priori, one would expect the participation rate of the aggregate 55-64 age group to have also been stable. Yet it would actually show a decline, because population ageing increases the weight of older age groups with lower participation rates. In this hypothetical example, considering the 55-59 and 60-64 age groups separately would remove this demographic bias.
15
decide whether they retire immediately or remain in the labour market for five additional years, rather than ten in Blöndal and Scarpetta (1998, op.cit.)). Finally, as in Blöndal and Scarpetta (1998, op.cit.), early retirement schemes are covered, which should significantly improve the analysis of the labour force participation of the 55-59 and - to a lesser extent - 60-64 age groups compared with Johnson (2000, op.cit.).
4.2. The estimated equation
The equation adopted, which is estimated separately for each of the 55-59, 60-64 and 65+ age groups, can be expressed as follows:
ittiititititit aPRMPRM εγβββ UR AGE) (STANDARD TAX100/)( 321* +++×+×+×=∆
where i and t are country and time suffices, 100/)( *itit PRMPRM∆ is the difference in male labour force participation rates between two consecutive age groups (in per cent), TAX is the implicit tax on continued work, STANDARD AGE is the standard retirement age and UR is the unemployment rate of prime-age workers.
In each of the three equations, the dependent variable is the same as in Figures 6 and 7, i.e. the difference in labour force participation rates of older men between two consecutive age groups. Therefore these equations implicitly model withdrawal from the labour market and thus the retirement decision rather than the level of participation per se, which may be influenced by a number of other factors including irreversible withdrawal from the labour market at earlier ages.30
The main explanatory variable characterising early retirement incentives is the implicit tax on continued work in the “early retirement route” defined above. As mentioned in Section 3, focusing on this variable is justified on two grounds. First, it sums up various dimensions of retirement incentives, such as the availability and generosity of benefits or the pension accrual rate. Second, in any event, the strong correlation between the replacement rate and the implicit tax rate raises a multicollinearity issue, thereby excluding the possibility to identify separately the participation effects of both variables within the same regression.
Even though the labour force participation equation estimated in this paper is not directly derived from an option value model a la Stock and Wise (1990), it is implicitly consistent with such an approach. Indeed, in practice, most of the cross-country and time-series variance of the option value of postponing retirement actually comes from corresponding variance in
30. For instance, despite no implicit tax on continued work beyond age 65, the participation rate of the 65-
69 age group in Luxembourg ranks among the lowest in the OECD area, partially because high implicit taxes at earlier ages induce massive retirement before age 65.
16
implicit taxes on continued work, to the extent that changes in wage rates and preferences are likely to be comparatively smaller and less frequent. However, no attempt is made below at estimating a full option value model, mainly because of data limitations, particularly in a cross-country dimension.31
In order to test for the existence of “customary” and/or “liquidity” effects, the standard retirement age is introduced as a separate explanatory variable in the regressions for the 60-64 and 65+ age groups.32 Other potential influences on the retirement decision are controlled for in two ways. First, potential discouragement effects among older workers associated with low employment opportunities are captured by the unemployment rate. Since the latter is jointly determined with participation, a potential endogeneity issue arises which is addressed by using the unemployment rate of prime-age workers instead of the old age unemployment rate. Insofar as the unemployment rate is counter-cyclical, this variable also captures business cycle effects, in addition to discouragement effects. Second, as in Johnson (2000), secular retirement trends, such as increasing demand for leisure over time and/or wealth effects stemming from rising living standards, are captured by time dummies.33 These time fixed effects may also absorb all shocks common to all countries, such as irreversible withdrawal from the labour market by laid-off workers in the aftermath of the two oil shocks of the 1970s.
All other determinants of older males' labour supply which may vary across countries are not explicitly covered by the analysis. These factors, such as insufficient training or rigid age-earnings profiles, affect the retirement decision indirectly by pressuring older workers' wages and/or by reducing their employment opportunities. To a limited extent, part of their influence may be captured indirectly by other variables in the regressions. For instance, the rigidity of age-earnings profiles is supported by specific institutional arrangements (high minimum wage, stringent employment protection legislation…) that may also affect the unemployment rate of prime-age workers, a variable included in the regressions. Similarly, the low incidence of training for older workers may partially result from the fact that high implicit taxes lower the expected retirement age. In any event, some omitted variable bias cannot be completely ruled out of the regressions below.34 In addition, implicit taxes are
31. Earnings over the past and potential future years of work, as well as the marginal utility of leisure,
would be required to estimate the full model.
32. Unsurprisingly, the standard -as well as the early- retirement age proved to be insignificant for the 55-59 age group.
33. To a certain extent, such shocks reflect business cycles and are therefore already captured by the unemployment rate. However, time fixed effects were found to be significantly different from zero at the 5% level in all regressions below.
34. For instance, no account is made for the fact that retiring often results from a joint decision made in a household context (see for instance Coile, 2003). Another omitted variable affecting the retirement decision is the presence of voluntary private pension schemes, especially in those countries where such plans are prominent, e.g. Australia, Canada or the United States. There is indeed ample empirical
17
measured with error, not least because of the number of simplifying assumptions underlying the calculations (Annex 2), and also because the illustrative worker considered in the modelling may not be representative of the typical worker.35, 36
4.3. Econometric results
For each of the 55-59, 60-64 and 65+ age groups, Table 2 presents three alternative regressions. All are estimated on an unbalanced panel dataset of 22 OECD countries over the period 1967-1999.37 Model A incorporates country-specific time trends rather than common time fixed effects in order to better capture country-specific retirement trends.38 As expected, implicit taxes on continued work, and the unemployment rate of prime-age males are negatively signed and statistically significant. The standard retirement age appears to affect positively the labour force participation of workers aged 65 and over, but it is not significant for the 60-64 age group. However, there is evidence that despite their statistical significance, country-specific time trends unduly capture part of the participation effects of implicit taxes on continued work. Indeed, a simple regression of the estimated coefficients of country-specific time trends on a variable39 representative of the magnitude of implicit taxes yields
evidence that large disincentives to work are embedded in some of these schemes (Kotlikoff and Wise, 1987; Stock and Wise, 1990). However, they may affect more the age of departure from a particular firm than labour force withdrawal per se, especially when prior knowledge of their characteristics enables workers to smooth consumption and labour supply over the life cycle.
35. For instance, theoretical replacement rates computed for Spain are significantly higher than actual average replacement rates. One reason for this gap is the assumption of an uninterrupted career used in the modelling, which does not hold in practice in Spain due to persistently high unemployment until very recently.. In addition, the calculation of implicit tax rates implicitly assumes that all workers are covered by the old-age pension system. As a result, it does not capture the trend increase in pension coverage experienced in a number of OECD countries over the past three decades.
36. There could also be a problem of reverse causality on two grounds: i) (older) voters with a strong preference for retirement may push towards lower eligibility ages and higher implicit tax rates; ii) the deterioration of employment opportunities of older workers may force them out of the labour market, thereby inducing governments to improve the generosity of pension systems and other social transfer programmes. However, Johnson (2000) suggests that the latter bias may be small in practice. Looking at major past changes in scheme provisions in a number of OECD countries, he finds that they have preceded, not followed, declines in older males’ participation.
37. In 8 out of these 22 countries, time series for participation rates and explanatory variables are significantly shorter.
38. In order to obtain meaningful coefficients for country-specific time trends, Model A is estimated on a balanced (14 countries over the period 1967-1999) rather than an unbalanced panel dataset.
39. This variable takes the values 0, 1 and 2 for those countries where retirement incentives embedded in old-age pension and early retirement schemes are classified respectively as low (Australia, Canada,
18
significant results at the 5% level for each of the three age groups: the larger the incentive to retire early in a country, the larger the estimated coefficient of its (negative) specific time trend. This finding can be imputed to the fact that changes in participation rates induced by abrupt changes in implicit taxes are usually gradual, and may thus be better captured by simple time trends. Since Model A probably understates the coefficients of implicit taxes on continued work, in Model B country-specific time trends are replaced by common time fixed effects. All variables remain correctly signed and significant (including the standard retirement age for the 60-64 age group), but the coefficients of implicit taxes are larger, and do not differ across age groups at the 5% level. The latter finding comes as no surprise, given the difficulty to capture the complex influence of early retirement schemes on the retirement decision through a single quantitative variable Finally, Model C is the same as Model B, except that it corrects for country-wise heteroskedasticity (using Feasible Generalised Least Squares) rather than for individual heteroskedasticity (using the Huber/White/Sandwich estimator of variance as in Model B). The econometric results remain broadly unchanged, except that the coefficients on implicit taxes are somewhat smaller.40
[Table 2. Old-age male participation equations]
The magnitude of estimated participation effects of implicit taxes on continued work is consistent with existing panel data estimates at the macroeconomic level. In particular, they are fairly similar to those estimated for the 60-64 age group in Johnson (2000) and are somewhat larger than in Blöndal and Scarpetta (1998). Basic specifications (Model B above) suggest that, on average, a 10 percentage points decline in the implicit tax rate reduces the fall in participation rates between two consecutive (5-year) age groups of older men by about 1.5 percentage points. However, these participation elasticities with respect to implicit tax rates are almost three times lower than those found in the simple cross-country regressions
Ireland, Norway, Sweden, United States), moderate (Germany, Portugal, Spain, United Kingdom) and large (Finland, France, Italy, Netherlands) on the basis of their implicit tax rates.
40. In order to assess the potential impact of demographic trends on the labour force attachment of older men, specifications including the share of prime-age workers (aged 25-54) in total working-age population (aged 15-64) as an explanatory variable were also estimated. A priori, usual cohort-crowding effects would suggest a positive effect: the larger the number of prime-age workers compared to older ones, the higher the relative wage rate of the latter and the higher their labour force participation rate -to the extent that the substitution effect dominates the income effect-. However, this demographic variable had a significantly negative effect for both the 55-59 and 60-64 age groups. The rationale behind this result remains unclear. One possibility is that the increase in the share of prime-age, better educated workers which occurred throughout the 1970s and the 1980s deteriorated the employment opportunities of less educated older workers. In any event, the coefficients of all other variables (implicit taxes, the standard retirement age and the unemployment rate) were insensitive to the introduction of this demographic variable.
19
presented above41 (Figures 6 and 7, Panels B) or in the microeconomic literature. For instance, in Gruber and Wise (2002), simulations using option value models estimated on separate microeconomic panel datasets for France, Belgium and the Netherlands suggest that a three-year delay in eligibility ages to old-age and early retirement schemes would raise the labour force participation of the 55-64 age group by about 20 points in each of these countries. The low elasticities typically found in panel data estimates using macroeconomic data may result from the difficulty to disentangle short and long-run effects and/or from the fact that historical changes in implicit tax rates - on which panel data (within) estimates are based - are measured with more error than current implicit tax rates levels. Therefore, it cannot be ruled out, as suggested by Johnson (2000), that simple cross-country regressions actually better capture the long-run participation elasticities of implicit tax rates.
On the basis of the coefficients estimated in Model B, past changes in implicit tax rates and standard retirement ages are found to explain only a third (31%) of the trend decline in older males’ labour force participation in OECD countries over the last three decades.42 This contribution reaches 40% when the whole model (including the effect of rising unemployment rates in a number of continental European countries) is considered. Though this is more than in Blöndal and Scarpetta (1998) or Johnson (2000, op.cit.), it remains clear that other determinants, such as preferences for leisure or “demand-side” determinants, may have also played a major role in driving down participation rates.
5. Summary and conclusions
The analysis presented in this paper has shown that there is currently wide dispersion across OECD countries in implicit tax rates on continued work embedded in old-age pension systems and other social transfer programmes: they are high in most Continental European Countries, compared with Japan, Korea, English-speaking and Nordic countries. Simple cross-country correlations suggest that such taxes induce older male workers to anticipate their retirement decision. This finding is confirmed by panel data econometric estimates, for each of the 55-59, 60-64 and 65+ age groups. For the 55-59 age group, there is clear evidence that these effects result from a number of social transfer programmes, which have been used de facto as early retirement schemes, rather than from old-age pension systems themselves. For the 60-64 and 65+ age groups, eligibility ages also appear to have a specific impact on the retirement decision, probably reflecting liquidity and/or customary effects.
41. At first glance, the latter should be inflated by an omitted variable bias, but this intuition does not
appear to be confirmed by the data. In particular, the unemployment rate variable is barely significant at the 5% level and does not reduce the implicit tax rate coefficient in a cross-country regression.
42. This figure is a simple arithmetic average of contributions found for the 14 OECD countries (using the coefficients in Model B) for which lengthy time series of participation rates are available.
20
Given the magnitude of retirement incentives still embedded in a number of old-age pension schemes and other social transfer programmes, the potential impact of policy reforms on labour force participation appears to be fairly large.43 However, as in previous studies, the estimated participation effects of implicit tax rates are significantly lower than those found in microeconometric analyses of the retirement decision. In addition, past changes in implicit tax rates and standard retirement ages are found to explain only a third of the trend decline in older males’ labour force participation in OECD countries over the last three decades. This suggests that even though retirement incentives embedded in old-age pension and other retirement schemes have a major impact on the retirement decision, future research should pay greater attention to other influences, such as preferences for leisure or “demand-side” factors.
43. For quantitative policy simulations (based on the econometric estimates presented in section 4), see
Burniaux et al. (2003).
21
Bibliography
AARON H. (1982), “Economic Effects of Social Security”, Studies of Government Finance, The Brookings Institution, Washington D.C.
ANDERSON P., A. GUSTMAN and T. STEINMEIER (1997), “Trends in Male Labor Force Participation and Retirement: Some Evidence on the Role of Pensions and Social Security in the 1970's and 1980's”, NBER Working Paper No. 6208, October.
BLANCHET D., C. BROUSSE and M. OKBA (1996), “Retraite, pré-retraite, neutralité actuarielle et couverture du risque de chômage en fin de carrière”, Economie et Statistique No. 291-292, 1/2.
BLÖNDAL S. and S. SCARPETTA (1998), “The Retirement Decision in OECD Countries”, OECD Economics Department Working Papers, No. 98.
BURNIAUX J-M., R. DUVAL and F. JAUMOTTE (2003), “Coping with Ageing: a Dynamic Approach to Quantify the Impact of Alternative Policy Options on Future Labour Supply”, OECD Economics Department Working Papers, forthcoming.
CASEY B., W. LEIBFRITZ, H. OXLEY, E. WHITEHOUSE, P. ANTOLIN and R. DUVAL (2003), “Policies for an Ageing Society: Recent Measures and Areas for Further Reform”, OECD Economics Department Working Papers, No. 369.
COILE C. (2003), “Retirement Incentives and Couples’ Retirement Decisions”, NBER Working Paper No. 9496, February.
COSTA D. (1997), “Less of a Luxury: The Rise of Recreation Since 1888”, NBER Working Paper No. 6054, June.
DISNEY R. (1996), Can We Afford to Grow Older: A Perspective on the Economics of Aging, Cambridge, Massachussets, MIT Press.
FELDSTEIN M. (1974), “Social Security, Induced Retirement and Aggregate Capital Accumulation”, Journal of Political Economy 82, No. 5.
GINN J. and S. ARBER (1998), “How Does Part-Time work Lead to Low Pension Income?”, in O’REILLEY J. and C. FAGAN (eds), Part-Time Prospects: An International Comparison of Part-Time Work in Europe, North America and the Pacific Rim, Routledge, London.
GRUBER D. and D. WISE (2002), “Social Security Programs and Retirement Around the World: Micro Estimation”, NBER Working Paper No. 9407, December.
22
GRUBER D. and D. WISE (1999a), “Social Security Programs and Retirement Around the World: Introduction and Summary”, in GRUBER D. and D. WISE (eds), Social Security Programs and retirement Around the World, University of Chicago Press, Chicago.
GRUBER D. and D. WISE (1999b), Social Security Programs and retirement Around the World, University of Chicago Press, Chicago.
HOLZMANN R., L. MacKELLAR and M. RUTKOWSKI (2003), “Accelerating the European Pension Reform Agenda: Need, Progress, and Conceptual Underpinnings”, in HOLZMANN R., M. ORENSTEIN and M. RUTKOWSKI (eds), Pension Reform in Europe: Process and Progress, The World Bank, Washington D.C.
JOHNSON R. (2000), “The Effect of Old-Age Insurance on Male Retirement: Evidence from Historical Cross-Country Data”, Federal Reserve Bank of Kansas City Working Paper, No. 00-09, December.
KOTLIKOFF L. and D. WISE (1987), “The Incentive effects of Private Pension Plans”, in BODIE Z., D. SHOVEN and D. WISE (eds), Issues in Pension economics, University of Chicago Press, Chicago.
LAZEAR E. (1986), “Retirement from the Labor Force”, in ASHENFELTER O. and R. LAYARD (eds), Handbook of Labor Economics, Vol. 1, North Holland, Amsterdam.
LEE C. (2003), “Labor Market Status of Older Males in The United States, 1880-1940”, NBER Working Paper No. 9550, March.
LUMSDAINE R. and O. MITCHELL (1999), “New Developments in the Economic Analysis of Retirement”, in ASHENFELTER O. and D. CARD (eds), Handbook of Labor Economics, Vol. 3, North Holland, Amsterdam.
LUMSDAINE R., J. STOCK and D. WISE (1996), “Why are Retirement Rates so High at Age 65?”, in WISE D., Advances in the Economics of Aging, The University of Chicago Press, Chicago.
MITCHELL O. and G. FIELDS (1984), “The Economics of Retirement Behaviour”, Journal of Labour Economics, Vol. 2, No. 1.
OECD (2003), “Transforming Disability into Ability: Policies to Promote Work and Income Security for Disabled People”, Paris.
OECD (2002), “Increasing Employment: the Role of Later Retirement”, Chapter V, OECD Economic Outlook, No. 72, December, Paris.

23
STOCK J. and D. WISE (1990), “Pensions, the Option Value of Work, and Retirement”, Econometrica, 58, No. 5.
24
Annex 1: Methodology and assumptions underlying the computation of replacement rates
The replacement rate is classically defined as:
YPR RR /=
where RR is the replacement rate at age R, PR is the pension level if retiring at age R and Y is the earnings level just before retirement.
For all possible retirement ages between 55 and 70, theoretical replacement rates in both “regular” and early retirement schemes are computed for 3 earnings levels (60%, 100% and 140% of average production workers’ (APW) earnings) and two household compositions (single worker and married couple with dependent spouse of same age). Thus, these calculations enable computation of average replacement rates across six different situations. In addition to replacement rates at retirement age R, average replacement rates between ages R and R+4 are also constructed.
In order to make these calculations manageable for a wide range of countries and time periods, the following assumptions are made:
- The worker is assumed to enter the labour market at age 20 and work full-time in the private sector without interruption until retirement.
- The age-earnings profile over the working life is assumed to be flat, i.e. earnings are assumed to grow in line with countrywide average earnings. Under this assumption, lifetime earnings at the age of retirement are simply equal to 60%, 100% or 140% of APW earnings, depending upon the earnings level considered. A key implication is that changes in the earnings base used in the pension benefit formula are, in general, not reflected in the calculations reported in this paper.
- The reported replacement rates only cover public schemes and mandatory or quasi-mandatory (as in Finland, the Netherlands,44 Sweden, Switzerland or the United Kingdom) private occupational schemes. Occupational schemes offered by employers on a voluntary basis (as in Canada, Germany, Japan or the United States) are not covered.
- The tax treatment of earnings and pension benefits is omitted. The concept of gross earnings considered in the calculations excludes employers’ but includes employees’ contributions to social security. Insofar as most OECD countries tend to apply a favourable tax treatment of
44. As mentioned in the main text, in the case of Netherlands, a “typical” early retirement (VUT) scheme
is considered between ages 60 and 65. However, since the early 1990s these PAYGO schemes have been progressively transformed into funded systems. Because of these transformations the modelling adopted here is less relevant now than it was in the 1970s and 1980s.
25
pension benefits compared to gross wage earnings, gross replacement rates reported in this paper are generally lower than net replacement rates.
The main source for past and present pension rules is Social Security Programs Throughout the World, published every two years by the U.S. Department of Health and Human Services. In the case of European member countries, the modelling also relies heavily on MISSOC (Social Protection in the Member States of the European Union), published by the Commission of the European Communities. Supplementary information is obtained from national sources and contacts, and in some cases from background material collected in Blöndal and Scarpetta (1998).
Annex 2: Methodology and assumptions underlying the computation of pension, social wealth and implicit taxes on continued work
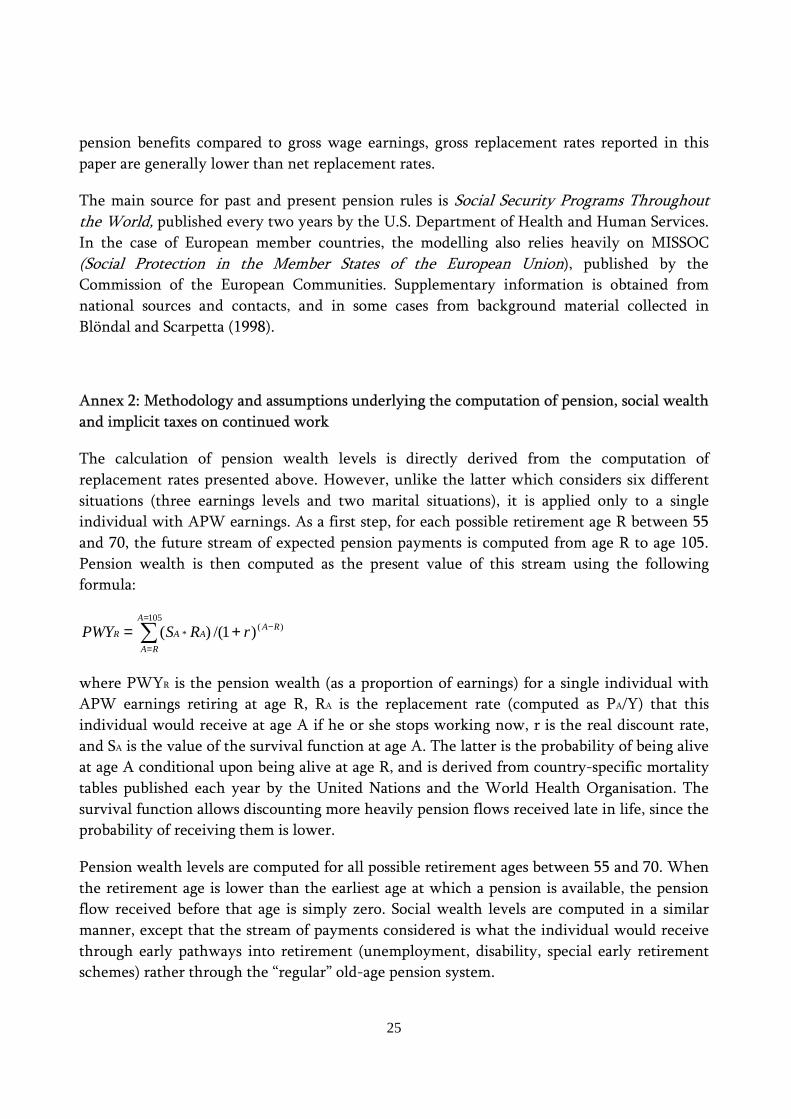
The calculation of pension wealth levels is directly derived from the computation of replacement rates presented above. However, unlike the latter which considers six different situations (three earnings levels and two marital situations), it is applied only to a single individual with APW earnings. As a first step, for each possible retirement age R between 55 and 70, the future stream of expected pension payments is computed from age R to age 105. Pension wealth is then computed as the present value of this stream using the following formula:
)(105
* )1/()( RAA
RA
AAR rRSPWY −=
=
+= ∑
where PWYR is the pension wealth (as a proportion of earnings) for a single individual with APW earnings retiring at age R, RA is the replacement rate (computed as PA/Y) that this individual would receive at age A if he or she stops working now, r is the real discount rate, and SA is the value of the survival function at age A. The latter is the probability of being alive at age A conditional upon being alive at age R, and is derived from country-specific mortality tables published each year by the United Nations and the World Health Organisation. The survival function allows discounting more heavily pension flows received late in life, since the probability of receiving them is lower.
Pension wealth levels are computed for all possible retirement ages between 55 and 70. When the retirement age is lower than the earliest age at which a pension is available, the pension flow received before that age is simply zero. Social wealth levels are computed in a similar manner, except that the stream of payments considered is what the individual would receive through early pathways into retirement (unemployment, disability, special early retirement schemes) rather through the “regular” old-age pension system.
26
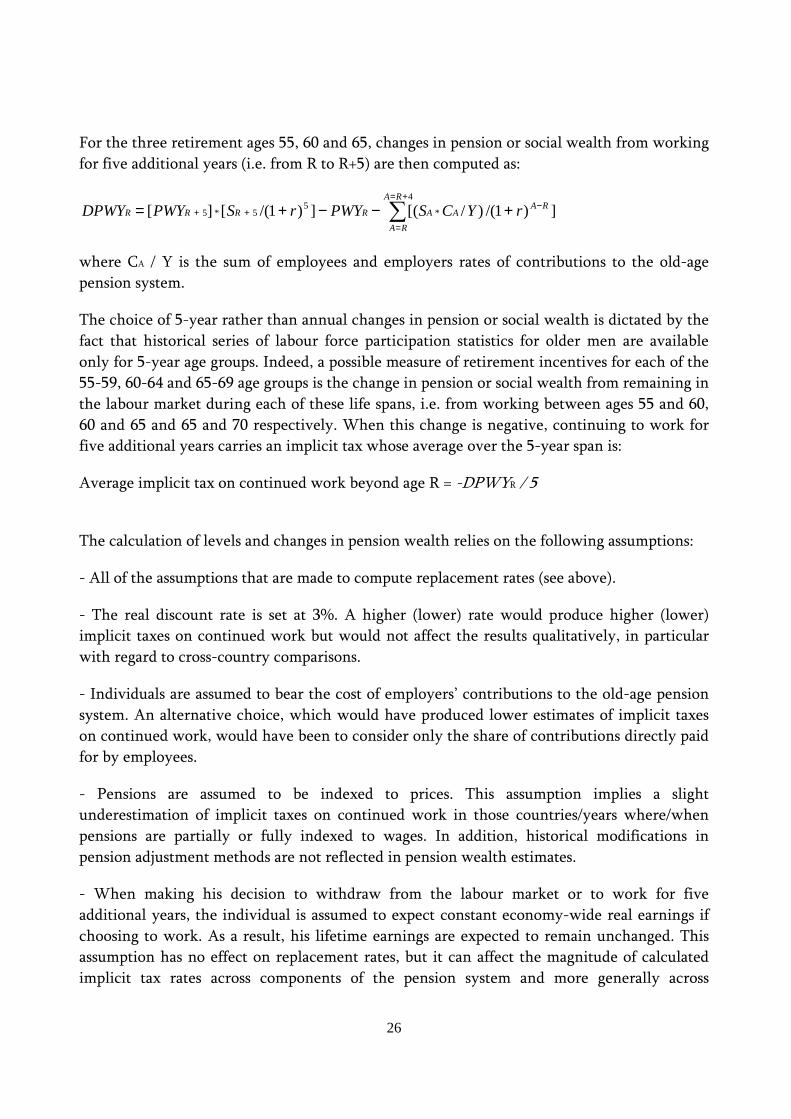
For the three retirement ages 55, 60 and 65, changes in pension or social wealth from working for five additional years (i.e. from R to R+5) are then computed as:
])1/()/[(])1/([][4
*5
5*5RA
RA
RA
AARRRR rYCSPWYrSPWYDPWY −+=
=
++ +−−+= ∑
where CA / Y is the sum of employees and employers rates of contributions to the old-age pension system.
The choice of 5-year rather than annual changes in pension or social wealth is dictated by the fact that historical series of labour force participation statistics for older men are available only for 5-year age groups. Indeed, a possible measure of retirement incentives for each of the 55-59, 60-64 and 65-69 age groups is the change in pension or social wealth from remaining in the labour market during each of these life spans, i.e. from working between ages 55 and 60, 60 and 65 and 65 and 70 respectively. When this change is negative, continuing to work for five additional years carries an implicit tax whose average over the 5-year span is:
Average implicit tax on continued work beyond age R = -DPWYR / 5
The calculation of levels and changes in pension wealth relies on the following assumptions:
- All of the assumptions that are made to compute replacement rates (see above).
- The real discount rate is set at 3%. A higher (lower) rate would produce higher (lower) implicit taxes on continued work but would not affect the results qualitatively, in particular with regard to cross-country comparisons.
- Individuals are assumed to bear the cost of employers’ contributions to the old-age pension system. An alternative choice, which would have produced lower estimates of implicit taxes on continued work, would have been to consider only the share of contributions directly paid for by employees.
- Pensions are assumed to be indexed to prices. This assumption implies a slight underestimation of implicit taxes on continued work in those countries/years where/when pensions are partially or fully indexed to wages. In addition, historical modifications in pension adjustment methods are not reflected in pension wealth estimates.
- When making his decision to withdraw from the labour market or to work for five additional years, the individual is assumed to expect constant economy-wide real earnings if choosing to work. As a result, his lifetime earnings are expected to remain unchanged. This assumption has no effect on replacement rates, but it can affect the magnitude of calculated implicit tax rates across components of the pension system and more generally across
27
countries. While there is no impact in flat-rate schemes, implicit tax rates can be over-estimated in earnings-related schemes, all the more so as the reference period for earnings used in the benefit formula is long (e.g. in the “new” pension system in Italy). This is because the calculations do not incorporate at the margin the automatic revaluation of past earnings in line with economy-wide earnings -- as is the rule in most OECD countries --, i.e. the potential revaluation of past earnings that could take place as a result of the increase in economy-wide earnings during the additional year of work.
- Strictly speaking, the above formula for changes in pension wealth applies only when full-time work cannot be combined with the receipt of any full or reduced pension. Even though this assumption holds for a worker with APW earnings in most countries and at most ages, this is not always true. For instance work can be combined with the receipt of a reduced old-age pension in Japan (subject to an income test) between ages 60 and 64, or with the receipt of a full pension in New Zealand. In such instances, the computation of the change in pension wealth from working for five additional years incorporates the stream of pension payments that the individual would receive over this 5-year period (i.e. PWYR+5 incorporates not only the stream of pension payments received from age R+5 but also those received between ages R and R+4). As a result, changes in pension wealth are more positive (or less negative) and implicit taxes on continued work are lower than in the case of a strict income test. In the extreme case where the receipt of a pension is not income-tested and no contributions to the old-age pension system have to be paid (e.g. in New Zealand from age 65), the implicit tax on continued work is simply zero because the stream of pension payments remains unchanged whether the individual keeps working or not (see for instance Johnson, 2000).
Annex 3: Theoretical relationship between replacement rates and implicit taxes on continued work
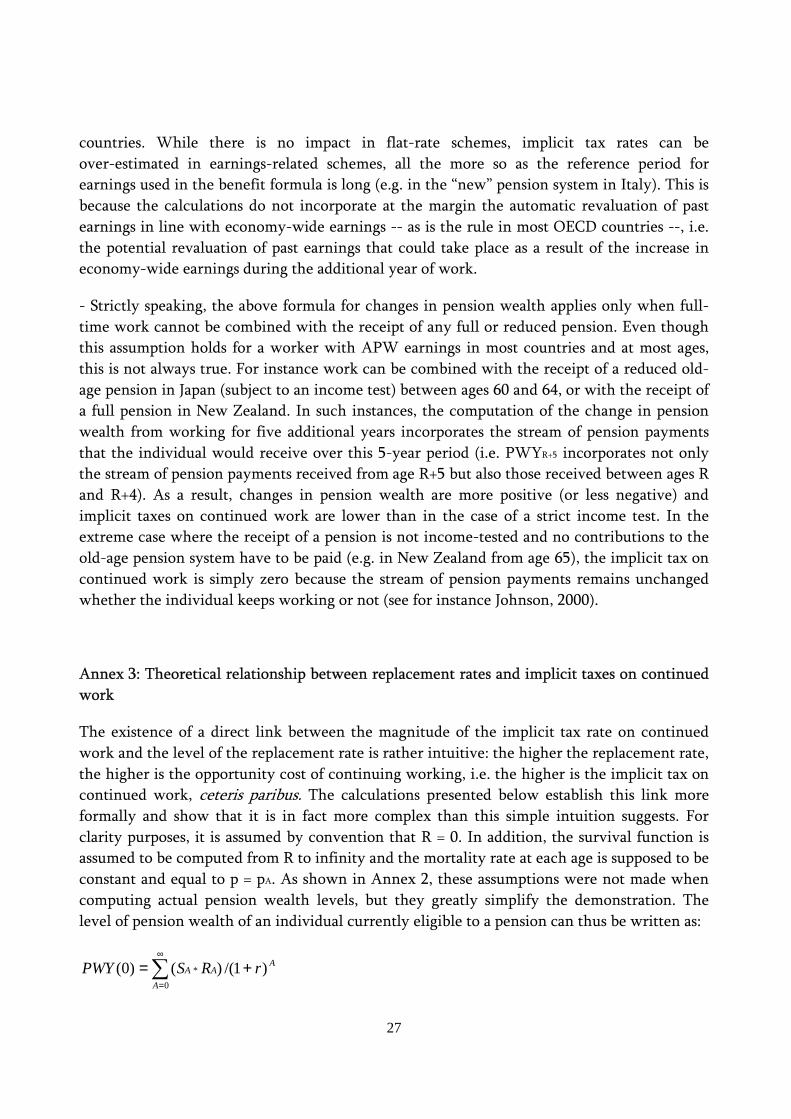
The existence of a direct link between the magnitude of the implicit tax rate on continued work and the level of the replacement rate is rather intuitive: the higher the replacement rate, the higher is the opportunity cost of continuing working, i.e. the higher is the implicit tax on continued work, ceteris paribus. The calculations presented below establish this link more formally and show that it is in fact more complex than this simple intuition suggests. For clarity purposes, it is assumed by convention that R = 0. In addition, the survival function is assumed to be computed from R to infinity and the mortality rate at each age is supposed to be constant and equal to p = pA. As shown in Annex 2, these assumptions were not made when computing actual pension wealth levels, but they greatly simplify the demonstration. The level of pension wealth of an individual currently eligible to a pension can thus be written as:
A
A
AA rRSPWY )1/()()0(0
* +=∑∞
=
28
where RA is the replacement rate and SA is the value of the survival function at age A.
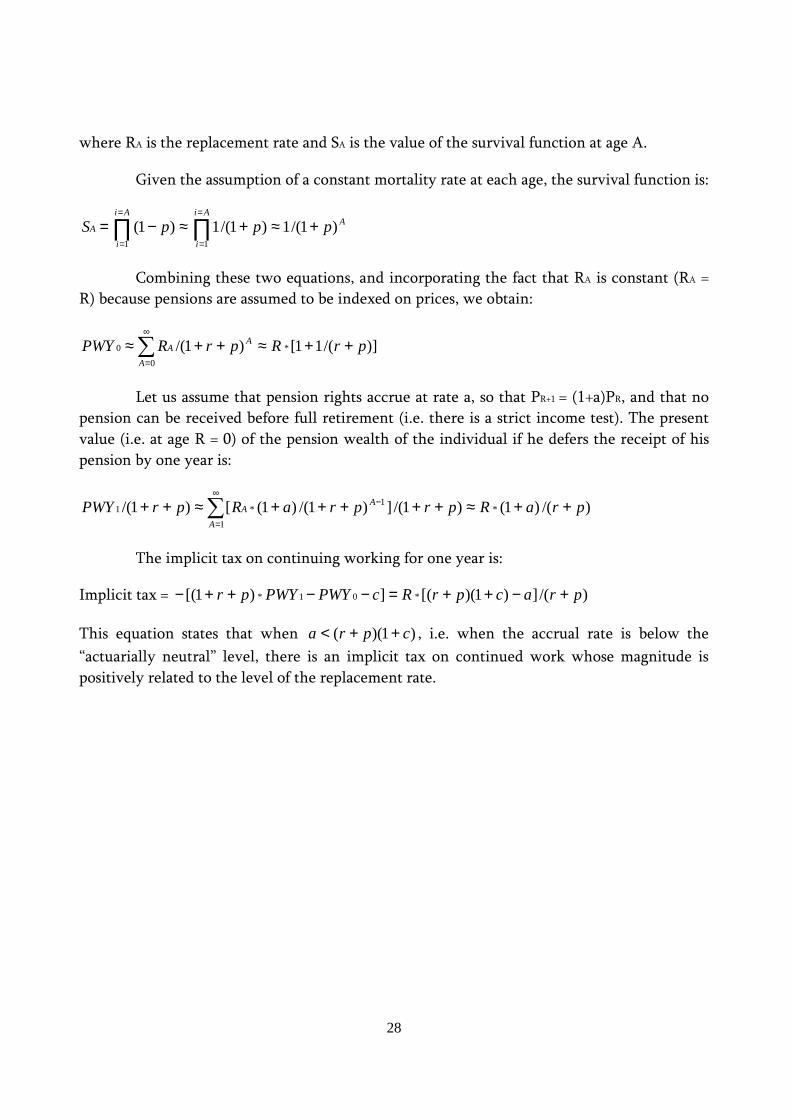
Given the assumption of a constant mortality rate at each age, the survival function is:
AAi
i
Ai
i
A pppS )1/(1)1/(1)1(11
+≈+≈−= ∏∏=
=
=
=
Combining these two equations, and incorporating the fact that RA is constant (RA = R) because pensions are assumed to be indexed on prices, we obtain:
)]/(11[)1/( *
0
0 prRprRPWY A
A
A ++≈++≈∑∞
=
Let us assume that pension rights accrue at rate a, so that PR+1 = (1+a)PR, and that no pension can be received before full retirement (i.e. there is a strict income test). The present value (i.e. at age R = 0) of the pension wealth of the individual if he defers the receipt of his pension by one year is:
)/()1()1/(])1/()1([)1/( *1
*
1
1 praRprpraRprPWY A
A
A ++≈+++++≈++ −∞
=∑
The implicit tax on continuing working for one year is:
Implicit tax = )/(])1)([(])1[( *01* pracprRcPWYPWYpr +−++=−−++−
This equation states that when )1)(( cpra ++< , i.e. when the accrual rate is below the “actuarially neutral” level, there is an implicit tax on continued work whose magnitude is positively related to the level of the replacement rate.
29
Tables and Figures
Table 1. Standard and early ages of entitlement to old-age pension benefits
Males Females
Early Standard age Standard age
1969 1979 1989 2003 1969 1979 1989 2003 1969 1979 1989 2003
Australia 65 65 65 55 65 65 65 65 60 60 60 62.5Austria 65 65 65 65 65 65 65 65 60 60 60 60Belgium 60 60 60 60 65 65 65 65 60 60 60 63Canada 66 65 60 60 66 65 65 65 66 65 65 65Czech Republic .. .. .. 58.5 .. .. .. 61.5 .. .. .. 59.5Denmark 67 67 67 65 67 67 67 65 67 67 67 65Finland 65 65 60 62 65 65 65 65 65 65 65 65France 60 60 60 60 65 65 60 60 65 65 60 60Germany 65 63 63 63 65 65 65 65 65 65 65 65Greece 60 60 60 60 60 60 65 65 55 55 60 65Hungary .. .. 60 62 .. .. 60 62 .. .. 55 62Iceland 67 67 67 65 67 67 67 67 .. .. .. 67Ireland 70 65 65 65 70 66 66 66 70 66 66 66Italy 55 55 55 57 60 60 60 65 55 55 55 65Japan 60 60 60 60 65 65 65 65 65 65 65 65Korea .. .. 60 55 .. .. 60 60 .. .. 60 60Luxembourg 62 62 60 60 65 65 65 65 62 60 65 65Mexico .. 65 65 65 .. 65 65 65 .. 65 65 65Netherlands 65 62 60 60 65 65 65 65 65 65 65 65Norway 70 67 67 67 70 67 67 67 70 67 67 67New Zealand 60 60 60 65 65 60 60 65 65 60 60 65Poland .. .. .. 65 .. .. .. 65 .. .. .. 60Portugal 65 65 65 55 65 65 65 65 65 62 62 65Slovak Republic .. .. .. 60 .. .. .. 60 .. .. .. 57Spain 65 60 60 60 65 65 65 65 55 65 65 65Sweden 63 60 60 61 67 65 65 65 67 65 65 65Switzerland 65 65 65 63 65 65 65 65 62 62 62 63Turkey 60 55 55 60 65 55 55 60 55 50 50 55United Kingdom 65 65 65 65 65 65 65 65 60 60 60 60United States 62 62 62 62 65 65 65 65 65 65 65 65
Notes:
Australia: minimum retirement age (i.e. at which superannuation savings can be drawn) will increase to 60 over the period 2015-2025. standard age for women to be increased from age 62.5 to age 65 between 2003 and 2013.
Austria: early age of eligibility does not incorporate special early retirement for long insurance years, which will be progressively phased out (following the 2003 reform) but could still be accessed from age 61.5 in 2003 (60 in 1969, 1979 and 1989). Standard age for women to be increased from age 60 to age 65 between 2024 and 2033.
Belgium: standard age for women scheduled to rise to age 65 by 2009.
Czech Republic: standard and minimum retirement ages are scheduled to rise gradually to reach age 62 for men and age 61 for women (with no children) in 2007.
Greece: standard age is 62 for men and 57 for women who first started to work before 1992.
Iceland: early retirement age in 2003 is still 67 for the basic pension. However most occupational pension schemes, which are progressively maturing, set the minimum retirement age at 65.
Italy: minimum retirement age is the minimum age of eligibility to a seniority pension, also equal to the minimum retirement age in the new pension system. Standard age is 60 (instead of 65) for women who first started to work before 1996
Korea: standard age scheduled to rise from age 60 to age 65 between 2011 and 2033.
Luxembourg: early age of eligibility does not incorporate the special early retirement scheme ("pré-retraite"), which can be accessed from age 57 with 40 years of contribution.
Norway: early age of eligibility does not incorporate the special early retirement (AFP) scheme, which can be accessed from age 62 in 2003.
Poland: standard age is 55 for women with 30 years of insurance.
Slovak republic: standard age for women varies between 53 and 57 according to number of children raised.
Switzerland: standard age for women will be 64 in 2005.
Turkey: standard age is 55 for men and 50 for women who first started to work before 1990.
United Kingdom: standard age for women will rise from age 60 to age 65 over 2010-2020 period.
United States: standard age for both men and women scheduled to rise to age 67 over 2000-2022 period.
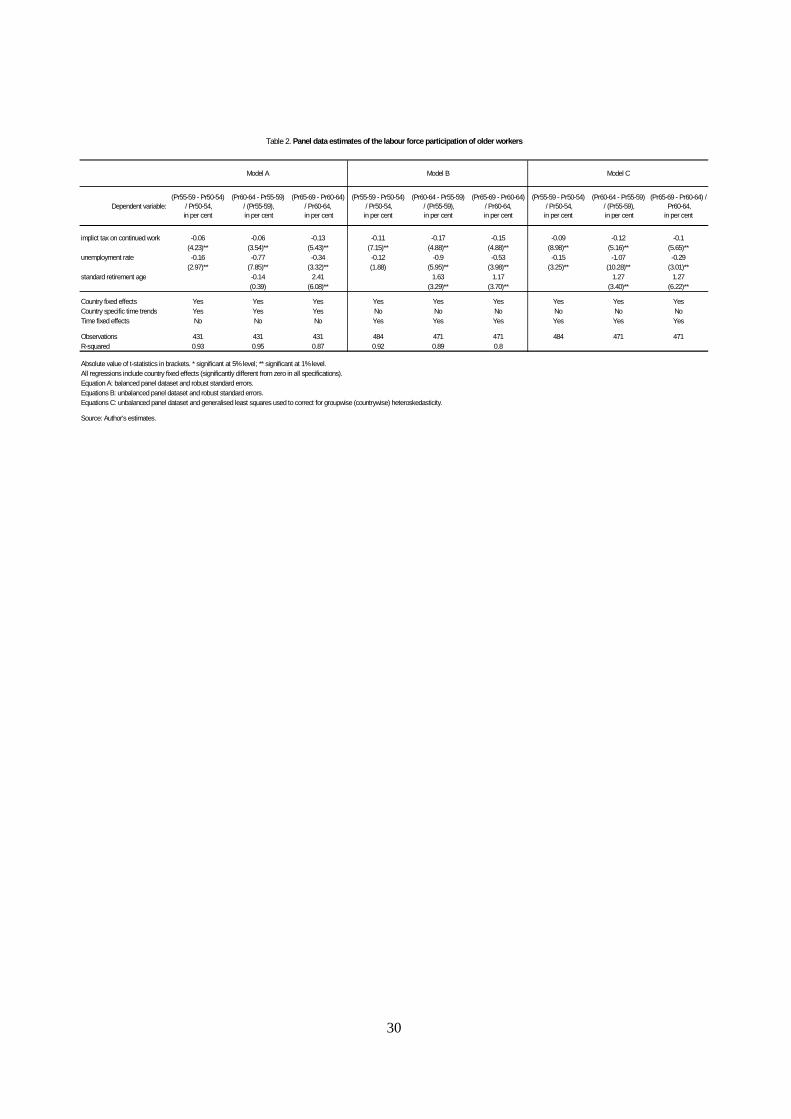
30
Table 2. Panel data estimates of the labour force participation of older workers
Model A Model B Model C
Dependent variable:(Pr55-59 - Pr50-54)
/ Pr50-54, in per cent
(Pr60-64 - Pr55-59) / (Pr55-59), in per cent
(Pr65-69 - Pr60-64) / Pr60-64, in per cent
(Pr55-59 - Pr50-54) / Pr50-54, in per cent
(Pr60-64 - Pr55-59) / (Pr55-59), in per cent
(Pr65-69 - Pr60-64) / Pr60-64, in per cent
(Pr55-59 - Pr50-54) / Pr50-54, in per cent
(Pr60-64 - Pr55-59) / (Pr55-59), in per cent
(Pr65-69 - Pr60-64) / Pr60-64, in per cent
implict tax on continued work -0.06 -0.06 -0.13 -0.11 -0.17 -0.15 -0.09 -0.12 -0.1(4.23)** (3.54)** (5.43)** (7.15)** (4.88)** (4.88)** (8.98)** (5.16)** (5.65)**
unemployment rate -0.16 -0.77 -0.34 -0.12 -0.9 -0.53 -0.15 -1.07 -0.29(2.97)** (7.85)** (3.32)** (1.88) (5.95)** (3.98)** (3.25)** (10.28)** (3.01)**
standard retirement age -0.14 2.41 1.63 1.17 1.27 1.27(0.39) (6.08)** (3.29)** (3.70)** (3.40)** (6.22)**
Country fixed effects Yes Yes Yes Yes Yes Yes Yes Yes YesCountry specific time trends Yes Yes Yes No No No No No NoTime fixed effects No No No Yes Yes Yes Yes Yes Yes
Observations 431 431 431 484 471 471 484 471 471R-squared 0.93 0.95 0.87 0.92 0.89 0.8
Absolute value of t-statistics in brackets. * significant at 5% level; ** significant at 1% level.All regressions include country fixed effects (significantly different from zero in all specifications).Equation A: balanced panel dataset and robust standard errors. Equations B: unbalanced panel dataset and robust standard errors.Equations C: unbalanced panel dataset and generalised least squares used to correct for groupwise (countrywise) heteroskedasticity.
Source: Author's estimates.
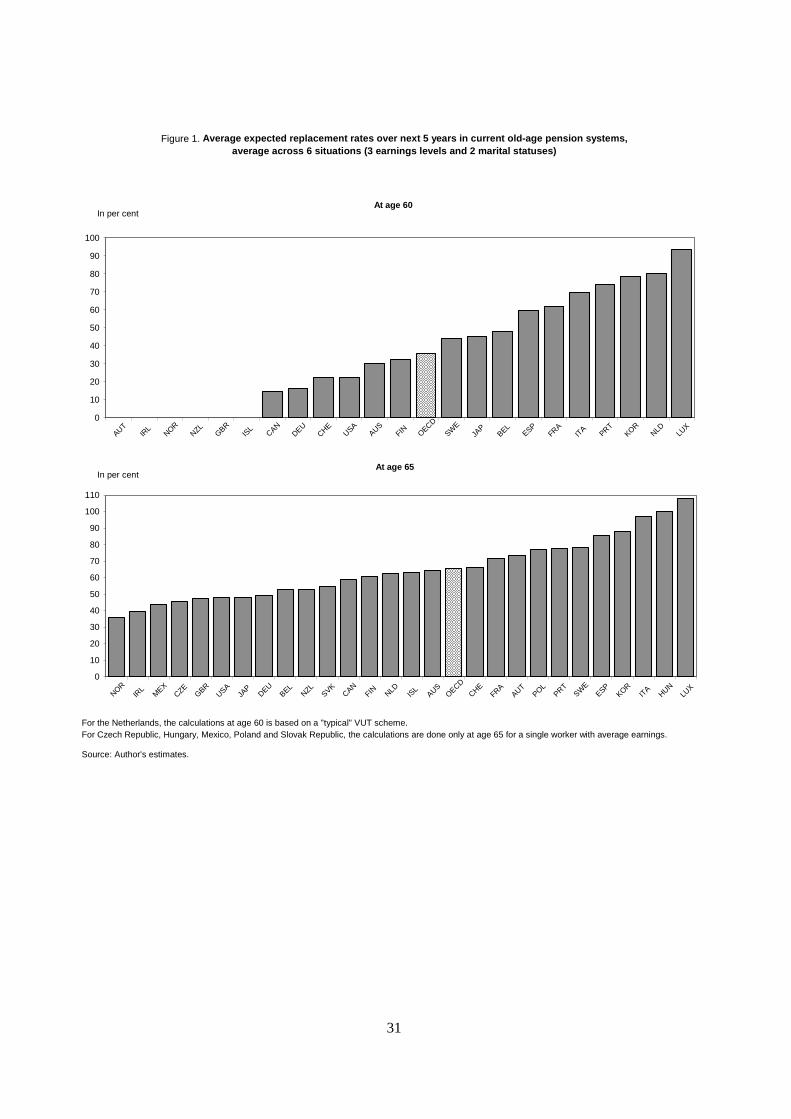
31
Figure 1. Average expected replacement rates over next 5 years in current old-age pension systems,average across 6 situations (3 earnings levels and 2 marital statuses)
For the Netherlands, the calculations at age 60 is based on a "typical" VUT scheme.For Czech Republic, Hungary, Mexico, Poland and Slovak Republic, the calculations are done only at age 65 for a single worker with average earnings.
Source: Author's estimates.
At age 60
LUX
NLDKOR
PRTIT
AFRA
ESPBEL
JAP
SWE
OECD
FINAUSUSA
CHEDEU
CANIS
LGBR
NZLNOR
IRL
AUT0
10
20
30
40
50
60
70
80
90
100
In per cent
At age 65
LUX
HUNIT
AKOR
ESPSW
EPRT
POLAUT
FRACHE
OECD
AUSIS
LNLDFINCAN
SVKNZL
BELDEU
JAP
USAGBR
CZEMEX
IRL
NOR0
10
20
30
40
50
60
70
80
90
100
110
In per cent
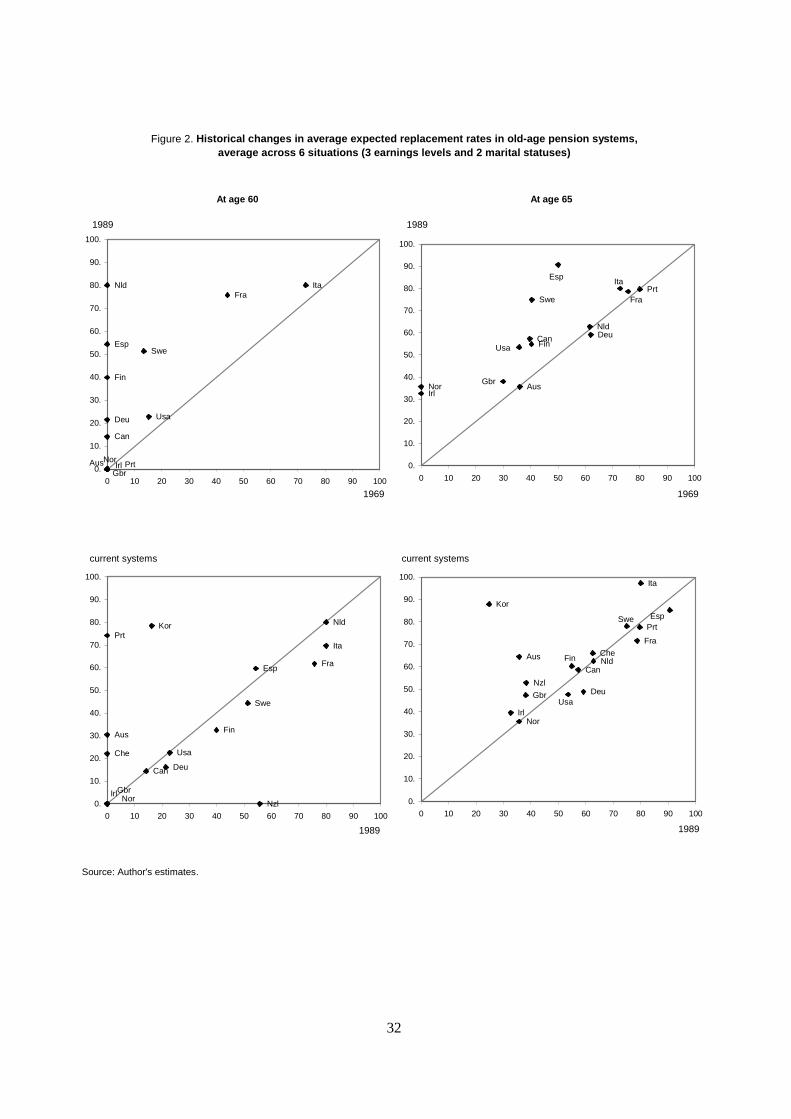
32
Figure 2. Historical changes in average expected replacement rates in old-age pension systems, average across 6 situations (3 earnings levels and 2 marital statuses)
At age 60 At age 65
Source: Author's estimates.
Usa
Gbr
SweEsp
PrtNor
Nld Ita
Irl
Deu
Fra
Fin
Can
Aus0.
10.
20.
30.
40.
50.
60.
70.
80.
90.
100.
0 10 20 30 40 50 60 70 80 90 100
1969
1989
Usa
Gbr
Che
Swe
Esp
Prt
NzlNor
NldKor
Ita
Irl
Deu
Fra
Fin
Can
Aus
0.
10.
20.
30.
40.
50.
60.
70.
80.
90.
100.
0 10 20 30 40 50 60 70 80 90 100
1989
current systems
Aus
CanFin
Fra
Deu
Irl
Ita
Nld
Nor
Prt
Esp
Swe
Gbr
Usa
0.
10.
20.
30.
40.
50.
60.
70.
80.
90.
100.
0 10 20 30 40 50 60 70 80 90 100
1969
1989
UsaGbr
Che
Swe EspPrt
Nzl
Nor
Nld
Kor
Ita
Irl
Deu
Fra
FinCan
Aus
0.
10.
20.
30.
40.
50.
60.
70.
80.
90.
100.
0 10 20 30 40 50 60 70 80 90 100
1989
current systems
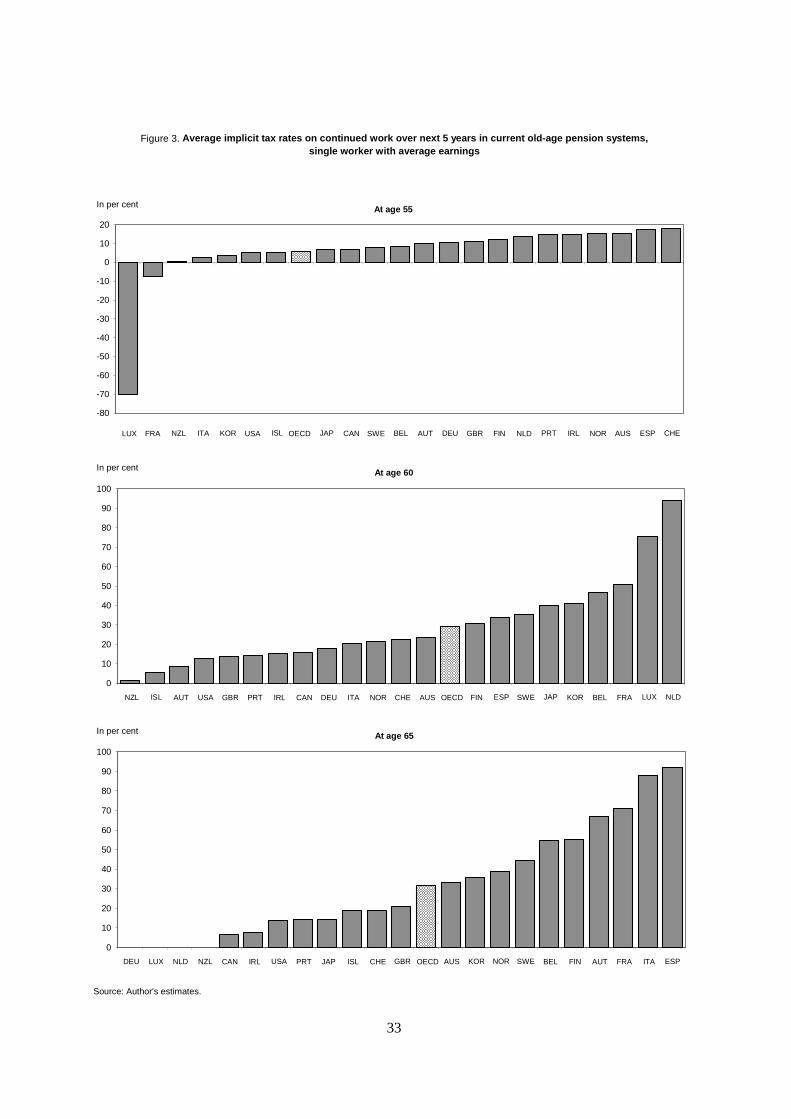
33
Figure 3. Average implicit tax rates on continued work over next 5 years in current old-age pension systems, single worker with average earnings
Source: Author's estimates.
At age 55
CHEESPAUSNORIRLPRTNLDFINGBRDEUAUTBELSWECANJAPOECDISLUSAKORITANZLFRALUX
-80
-70
-60
-50
-40
-30
-20
-10
0
10
20
In per cent
At age 60
NLDLUXFRABELKORJAPSWEESPFINOECDAUSCHENORITADEUCANIRLPRTGBRUSAAUTISLNZL
0
10
20
30
40
50
60
70
80
90
100
In per cent
At age 65
ESPITAFRAAUTFINBELSWENORKORAUSOECDGBRCHEISLJAPPRTUSAIRLCANNZLNLDLUXDEU
0
10
20
30
40
50
60
70
80
90
100
In per cent
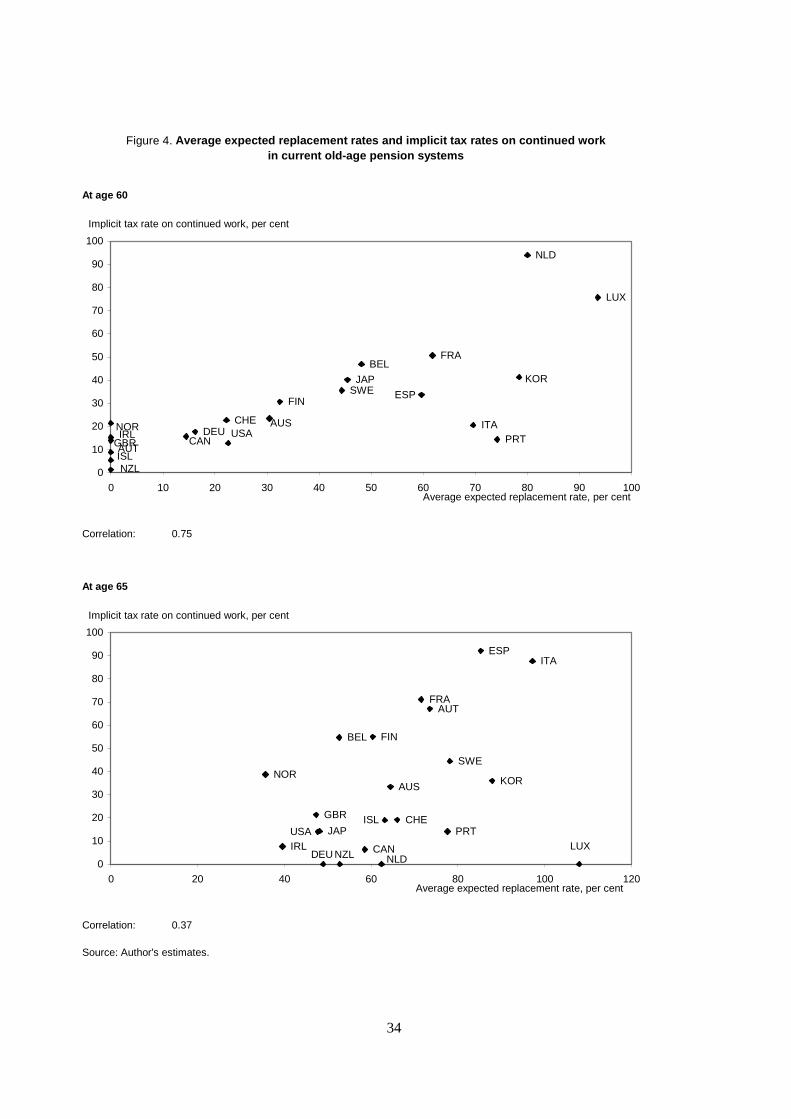
34
Figure 4. Average expected replacement rates and implicit tax rates on continued workin current old-age pension systems
At age 60
Correlation: 0.75
At age 65
Correlation: 0.37
Source: Author's estimates.
AUTUSA
GBR
CHE
SWE ESP
PRT
NZL
NOR
NLD
LUX
KORJAP
ITAIRL
ISL
DEU
FRA
FIN
CAN
BEL
AUS
0
10
20
30
40
50
60
70
80
90
100
0 10 20 30 40 50 60 70 80 90 100Average expected replacement rate, per cent
Implicit tax rate on continued work, per cent
AUT
USA
GBR CHE
SWE
ESP
PRT
NZL
NOR
NLDLUX
KOR
JAP
ITA
IRL
ISL
DEU
FRA
FIN
CAN
BEL
AUS
0
10
20
30
40
50
60
70
80
90
100
0 20 40 60 80 100 120Average expected replacement rate, per cent
Implicit tax rate on continued work, per cent
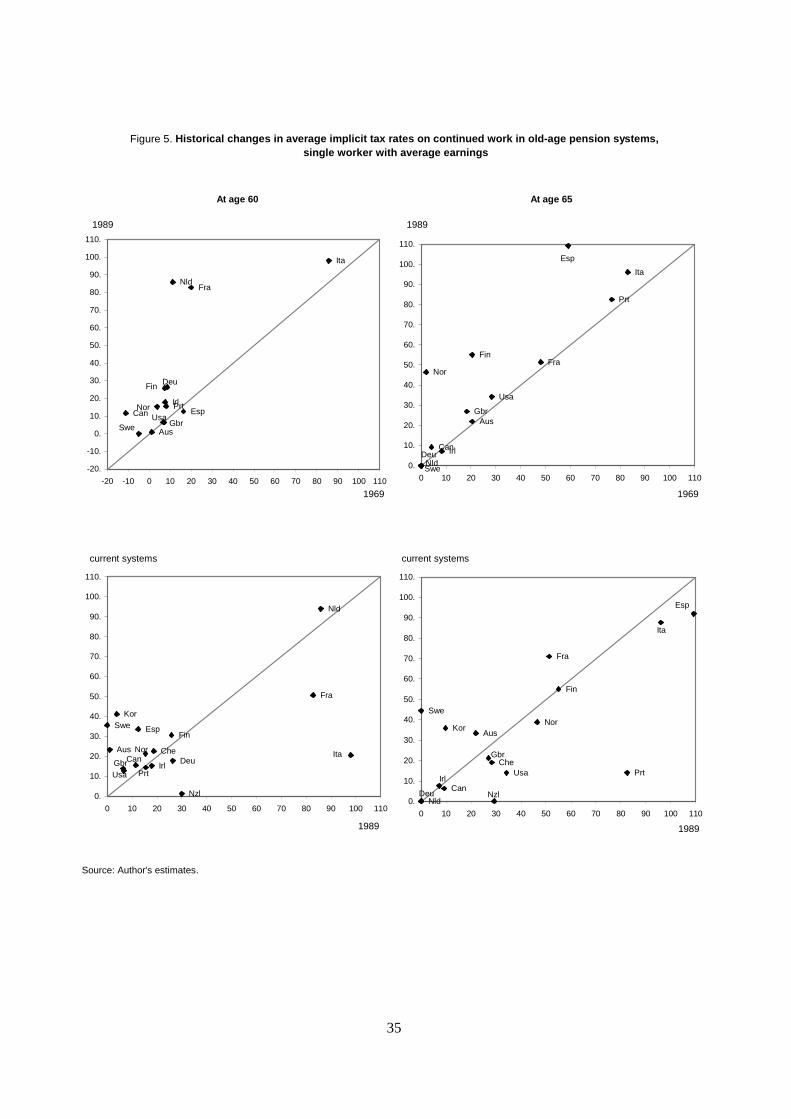
35
Figure 5. Historical changes in average implicit tax rates on continued work in old-age pension systems, single worker with average earnings
At age 60 At age 65
Source: Author's estimates.
UsaGbrSwe
EspPrtNor
Nld
Ita
Irl
Deu
Fra
Fin
Can
Aus
-20.
-10.
0.
10.
20.
30.
40.
50.
60.
70.
80.
90.
100.
110.
-20 -10 0 10 20 30 40 50 60 70 80 90 100 110
1969
1989
UsaGbr
Che
Swe Esp
Prt
Nzl
Nor
Nld
Kor
ItaIrl
Deu
Fra
Fin
CanAus
0.
10.
20.
30.
40.
50.
60.
70.
80.
90.
100.
110.
0 10 20 30 40 50 60 70 80 90 100 110
1989
current systems
Usa
Gbr
Swe
Esp
Prt
Nor
Nld
Ita
IrlDeu
FraFin
Can
Aus
0.
10.
20.
30.
40.
50.
60.
70.
80.
90.
100.
110.
0 10 20 30 40 50 60 70 80 90 100 110
1969
1989
Usa
GbrChe
Swe
Esp
Prt
Nzl
Nor
Nld
Kor
Ita
Irl
Deu
Fra
Fin
Can
Aus
0.
10.
20.
30.
40.
50.
60.
70.
80.
90.
100.
110.
0 10 20 30 40 50 60 70 80 90 100 110
1989
current systems
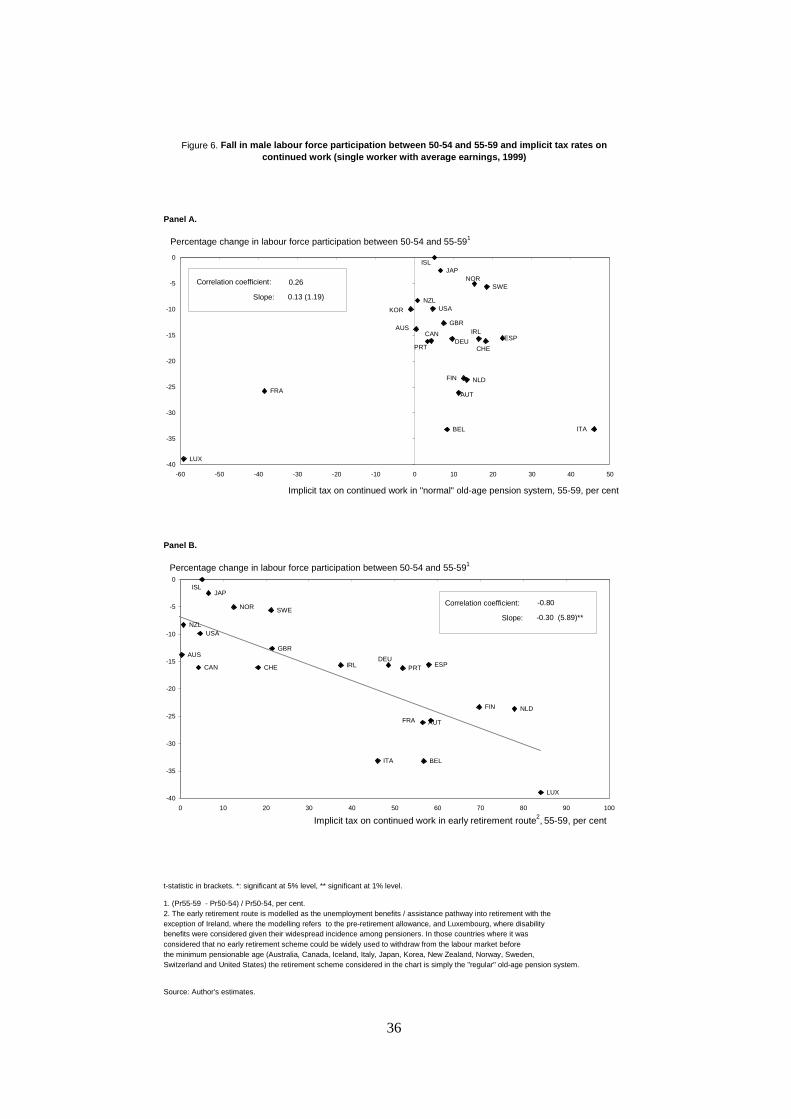
36
Figure 6. Fall in male labour force participation between 50-54 and 55-59 and implicit tax rates on continued work (single worker with average earnings, 1999)
Panel A.
Panel B.
t-statistic in brackets. *: significant at 5% level, ** significant at 1% level.
1. (Pr55-59 - Pr50-54) / Pr50-54, per cent.2. The early retirement route is modelled as the unemployment benefits / assistance pathway into retirement with theexception of Ireland, where the modelling refers to the pre-retirement allowance, and Luxembourg, where disability benefits were considered given their widespread incidence among pensioners. In those countries where it was considered that no early retirement scheme could be widely used to withdraw from the labour market before the minimum pensionable age (Australia, Canada, Iceland, Italy, Japan, Korea, New Zealand, Norway, Sweden, Switzerland and United States) the retirement scheme considered in the chart is simply the "regular" old-age pension system.
Source: Author's estimates.
AUT
USA
GBR
CHE
SWE
ESPPRT
NZL
NOR
NLD
LUX
KOR
JAP
ITA
IRL
ISL
DEU
FRA
FIN
CAN
BEL
AUS
-40
-35
-30
-25
-20
-15
-10
-5
0
-60 -50 -40 -30 -20 -10 0 10 20 30 40 50
Implicit tax on continued work in "normal" old-age pension system, 55-59, per cent
Percentage change in labour force participation between 50-54 and 55-591
Correlation coefficient: 0.26
0.13 (1.19)Slope:
AUT
AUS
BEL
CAN
FIN
FRA
DEU
ISL
IRL
ITA
JAP
LUX
NLD
NOR
NZL
PRT ESP
SWE
CHE
GBR
USA
-40
-35
-30
-25
-20
-15
-10
-5
0
0 10 20 30 40 50 60 70 80 90 100
Percentage change in labour force participation between 50-54 and 55-591
Correlation coefficient: -0.80
-0.30 (5.89)**Slope:
Implicit tax on continued work in early retirement route2, 55-59, per cent
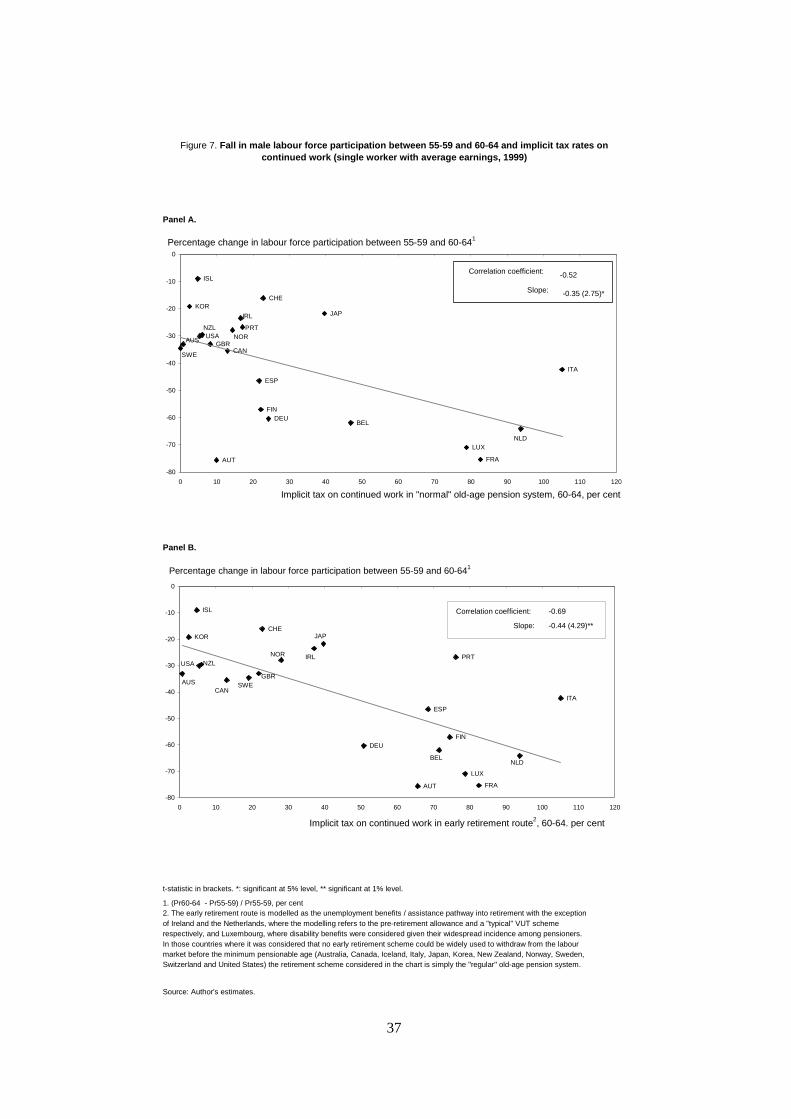
37
Figure 7. Fall in male labour force participation between 55-59 and 60-64 and implicit tax rates on continued work (single worker with average earnings, 1999)
Panel A.
Panel B.
t-statistic in brackets. *: significant at 5% level, ** significant at 1% level.
1. (Pr60-64 - Pr55-59) / Pr55-59, per cent2. The early retirement route is modelled as the unemployment benefits / assistance pathway into retirement with the exceptionof Ireland and the Netherlands, where the modelling refers to the pre-retirement allowance and a "typical" VUT schemerespectively, and Luxembourg, where disability benefits were considered given their widespread incidence among pensioners. In those countries where it was considered that no early retirement scheme could be widely used to withdraw from the labourmarket before the minimum pensionable age (Australia, Canada, Iceland, Italy, Japan, Korea, New Zealand, Norway, Sweden, Switzerland and United States) the retirement scheme considered in the chart is simply the "regular" old-age pension system.
Source: Author's estimates.
USAGBR
CHE
SWE
ESP
PRTNZLNOR
NLDLUX
KORJAP
ITA
IRL
ISL
DEU
FRA
FIN
CAN
BEL
AUS
AUT
-80
-70
-60
-50
-40
-30
-20
-10
0
0 10 20 30 40 50 60 70 80 90 100 110 120
Implicit tax on continued work in "normal" old-age pension system, 60-64, per cent
Percentage change in labour force participation between 55-59 and 60-641
-0.35 (2.75)*
-0.52Correlation coefficient:
Slope:
USA
GBR
CHE
SWE
ESP
PRTNZL
NOR
NLD
LUX
KOR JAP
ITA
IRL
ISL
DEU
FRA
FIN
CAN
BEL
AUS
AUT
-80
-70
-60
-50
-40
-30
-20
-10
0
0 10 20 30 40 50 60 70 80 90 100 110 120
Percentage change in labour force participation between 55-59 and 60-641
Correlation coefficient: -0.69
-0.44 (4.29)**Slope:
Implicit tax on continued work in early retirement route2, 60-64. per cent