Embed Size (px)
Citation preview

Innovation and the performance of New Zealand firms Staff Working Paper 2017/2
November 2017
Authors: Simon Wakeman and Paul Conway

ii Innovation and the performance of New Zealand firms
New Zealand Productivity Commission Staff Working Paper 2017/2: Innovation and the performance of New Zealand firms
Date: November 2017
Authors: Simon Wakeman and Paul Conway
JEL classification: O30, O31
ISBN: 978-0-478-44040-9
Acknowledgements: We would like to thank Bronwyn Hall, Adam Jaffe, Geoff Lewis, Lisa Meehan,
Patrick Nolan, Grant Scobie, Beth Webster, Guangyu Zheng, and participants at a Motu seminar for
comments on earlier versions of this work; members of the Microdata Access Team at Statistics New
Zealand for support in using the Longitudinal Business Database (LBD); Richard Fabling and Dave Mare
for sharing their firm-level estimates of productivity and for their efforts to improve the usefulness of the
information in the LBD for researchers (together with Lynda Sanderson). We retain responsibility for any
errors.
Disclaimer: The opinions, findings, recommendations and conclusions expressed in this paper are
those of the author, not Statistics New Zealand or the New Zealand Productivity Commission.
The results in this paper have been created for research purposes from the Integrated Data
Infrastructure (IDI) managed by Statistics New Zealand and are not official statistics. Access to the
anonymised data used in this study was provided by Statistics New Zealand in accordance with security
and confidentiality provisions of the Statistics Act 1975. Only people authorised by the Statistics Act
1975 are allowed to see data about a particular person, household, business or organisation and the
results in this paper have been confidentialised to protect these groups from identification. Careful
consideration has been given to the privacy, security and confidentiality issues associated with using
administrative and survey data in the IDI. Further detail can be found in the privacy impact assessment
for the IDI available from www.stats.govt.nz.
The results are based in part on tax data supplied by Inland Revenue to Statistics New Zealand under
the Tax Administration Act 1994. This tax data must be used only for statistical purposes, and no
individual information may be published or disclosed in any other form, or provided to Inland Revenue
for administrative or regulatory purposes. Any person who has had access to the unit-record data has
certified that they have been shown, have read, and have understood section 81 of the Tax
Administration Act 1994, which relates to secrecy. Statistics NZ confidentiality protocols were applied to
the data sourced from the Ministry of Business, Innovation and Employment. Any discussion of data
limitations or weaknesses is in the context of using the IDI for statistical purposes, and is not related to
the data's ability to support these government agencies' core operational requirements.
Information on the Productivity Commission can be found on www.productivity.govt.nz or by contacting
+64 4 903 5150.

Staff Working Paper 2017/1 iii
Abstract
This paper examines the relationship between innovation and the performance of New Zealand firms. It
draws on information in Statistics New Zealand’s Longitudinal Business Database, particularly responses
to questions from the Business Operations Survey on R&D and innovative activity, and measures of
employment, output, and firm productivity based on data collected from various sources. It applies a
differences-in-differences approach to isolate the impact of innovation from other drivers of firm
performance. Results show that on average across all firms included in the study over the sample
period of 2000 to 2012, innovating firms grew at a faster rate relative to firms that did not innovate but
did not experience improved productivity outcomes. However, digging into the relationship between
innovation and firm performance across various types of firms reveals that firms in the manufacturing
sector improved their productivity performance as a result of innovation. Firms that were younger or
had access to larger markets also tended to experience higher productivity growth following product
and organisational innovation. The relationship between innovation and firm productivity also varied
across time, with innovating firms more likely lift their productivity from 2009 (compared to the pre-GFC
period). Results suggest that the returns to innovation in New Zealand may be lower than for
comparable countries, but methodological differences mean it is not possible to be conclusive.
iv Innovation and the performance New Zealand firms
Contents
Abstract ................................................................................................................................... iii
1 Introduction .................................................................................................................... 5
2 Related literature ............................................................................................................ 6 2.1 New Zealand’s low BERD ..................................................................................................... 6 2.2 Measuring returns to innovation/R&D ................................................................................. 6
3 Empirical analysis ............................................................................................................ 7 3.1 Data sources & variable construction .................................................................................. 7 3.2 Descriptive statistics ............................................................................................................. 9 3.3 Empirical method................................................................................................................ 13
4 Estimation results ......................................................................................................... 14 4.1 Baseline results ................................................................................................................... 14 4.2 Weighting by firm size ........................................................................................................ 15 4.3 Innovation and firm survival ............................................................................................... 17 4.4 The impact of innovation across different firm types ....................................................... 18 4.5 The impact of innovation across time ............................................................................... 23 4.6 Robustness checks .............................................................................................................. 24
5 Conclusion .................................................................................................................... 25
References ............................................................................................................................. 27
Tables
Table 3.1 Number of observations .................................................................................................... 9 Table 3.2 Means of key variables by sample .................................................................................. 10 Table 3.3 Share of product development expenditure by sector/industry & type ...................... 11 Table 3.4 Firms engaged in R&D activity vs innovation activity .................................................... 11
Figures
Figure 3.1 Relative size and productivity for innovating vs. non-innovating firms by innovation type ................................................................................................................................... 12
Figure 3.2 Proportion of firms engaged in innovation by MFP decile in year 0 ............................ 13 Figure 4.1 Change in firm performance by R&D activity ................................................................. 15 Figure 4.2 Change in firm performance by innovation activity ....................................................... 15 Figure 4.3 Change in multi-factor productivity by type of innovation............................................ 15 Figure 4.4 Change in output by R&D activity (weighted by firm size) ............................................ 16 Figure 4.5 Change in output by innovation activity (weighted by firm size) .................................. 17 Figure 4.6 Change in multi-factor productivity by type of innovation (weighted by size) ............ 17 Figure 4.7 Relative probability of survival by innovation type ........................................................ 18 Figure 4.8 Relative change in MFP over 3 years, by firm age ......................................................... 19 Figure 4.9 Relative change in MFP over 3 years, by firm size ......................................................... 19 Figure 4.10 Relative change in MFP over 3 years, by sector ............................................................. 20 Figure 4.11 Relative change in MFP over 3 years, by whether engaged in R&D ............................. 20 Figure 4.12 Relative change in MFP over 3 years by source of information/ideas .......................... 21 Figure 4.13 Relative change in MFP over 3 years by international connection ............................... 22 Figure 4.14 Relative change in MFP over 3 years by quartile of MFP .............................................. 22 Figure 4.15 Change in MFP by type of innovation across time ........................................................ 23 Figure 4.16 Change in MFP by degree of product novelty across time........................................... 23

Staff Working Paper 2017/2 5
1 Introduction
International comparisons show that GDP per capita in New Zealand lags behind the OECD average by
around 15 percent and that New Zealand’s productivity performance over the past 40 years has been
disappointing (Conway, 2016). de Serres, Yashiro, and Boulhol (2014) have argued that low investment
in knowledge based capital may explain as much as 40% of this gap, pointing specifically to the
relatively low rate of business expenditure on research and development by New Zealand firms. The
implication is that lifting investment in knowledge-based capital and having more New Zealand firms
more engaged in innovative activity would help New Zealand reduce this substantial productivity gap.
One potential explanation for low investment in innovation by New Zealand firms is that they earn less
from innovating than firms in other countries. Innovation is a costly exercise, requiring the firm to spend
money on R&D, retraining employees, and promoting new products to customers. It exposes a
business to the risk of failure; new products may not catch on or process changes could disrupt systems
that were working efficiently, and even where the innovation is a success rivals may copy it and capture
a large share of the returns. Hence if the expected returns are not there, firms are unlikely make the
investment.
There are reasons to believe that New Zealand firms may not benefit as much from innovation as firms
in other countries. For example, New Zealand’s small domestic markets mean there are fewer
customers over which innovators can earn a premium on new products or save costs by using more
efficient processes. But reaching larger, foreign markets can be difficult from New Zealand. Even
though the costs of moving most products have come down considerably (e.g., moving software is
essentially free), very few products sell themselves, and selling any product – especially a new one –
requires effort dedicated to marketing and sales. From New Zealand, that means either spending a lot
of time on a plane or managing marketing and sales teams working in different cultures and time zones
– or both. Moreover, new products frequently go through several versions before they reach their full
potential, and perfecting the specifications requires close integration between the original developers,
customer-facing marketing and sales personnel, and executive management. This is also more difficult
and more costly to manage at a distance.
This paper uses information from Statistics New Zealand’s Longitudinal Business Database (LBD) to
measure the relationship between innovation and firm performance. The biennial Innovation module of
the Business Operations Survey (BOS) provides information for a sample of around 6000 firms each year
on whether they engaged in product, process, organisational, or marketing innovation. Within the LBD,
Statistics New Zealand also compiles financial data from various sources, including tax records filed
with the Inland Revenue Department and the Annual Enterprise Survey, which provides the basis for
measuring the productivity and performance of New Zealand firms.
This information makes it possible to compare innovators against non-innovators across a range of
performance measures – growth in employment, output, and firm productivity, and the probability of
survival – and thereby build evidence on the relationship between innovative activity and the
performance of New Zealand firms. The approach does not, however, account for the factors that lead
firms to innovate, or other unobserved factors that might explain why firms both engage in innovation
and their level of performance. Hence, it is not possible to provide an estimate for the effect of
innovation on firm performance – that is, to say “if firms engage in innovation, their performance will
increase by X”.
The next section summarises literature that (1) attempts to explain New Zealand’s relatively low BERD
and (2) estimate the returns to innovation in other countries. Section 3 describes the empirical method
and data used in this paper while Section 4 outlines the results and highlights some limitations of the
analysis. Section 5 concludes.

6 Innovation and the performance New Zealand firms
2 Related literature
2.1 New Zealand’s low BERD
A number of prior papers have tried to explain the relatively low BERD of New Zealand firms. One
stream of research has attempted to determine whether within-industry or cross-industry differences
provide a stronger explanation. Mazoyer (1999) benchmarked New Zealand’s BERD against ten other
OECD countries using information on the manufacturing sector from the OECD’s STAN database. She
concluded that differences in R&D intensity within industries provide a more important explanation for
New Zealand’s low BERD than differences in industry structure.
Di Maio and Blakeley (2004) updated this analysis, and included data on primary and services sectors.
Similar to Mazoyer (1999), they found that New Zealand’s relatively low BERD can be attributed to a
combination of both lower R&D intensity than the average within industries and a less R&D-intensive
industry structure. They noted that more than half the difference in R&D intensity within the existing
structure is driven by the electrical equipment (including radio, TV, and communication) and the wood,
paper and printing industries; the only industry in which New Zealand is more intensive than the OECD
average is the (relatively non-intensive) financial information, computer and related activities. They also
noted that New Zealand is relatively unusual in that less than 40% of total R&D is funded by the
business sector, while the OECD average is close to 70%.
Crawford, Fabling, Grimes, and Bonner (2007) used a cross-country dataset to examine the factors that
are correlated with BERD at a national level. They regressed both national R&D expenditure and
patenting levels for New Zealand and a set of other comparable countries on a number of country-level
characteristics, including market size, firm size, distance from major economic centres, and industry
structure. They found that New Zealand’s relatively low level of R&D was consistent with being distant
from major markets, having a large agricultural base, and small average firm size.
However, none of these papers provide any evidence on whether the reason that New Zealand firms
spend relatively little on R&D is because the returns to innovation for New Zealand firms are relatively
low. By measuring the difference in returns associated with innovation, this paper seeks provide
evidence that may help identify a deeper, more fundamental explanation for New Zealand’s relatively
low BERD.
2.2 Measuring returns to innovation/R&D
There is a large international literature that measures the relationship between R&D and firm
performance (see Hall, Mairesse, & Mohnen, 2009, for a summary). Due to variety in methods and
contexts, it is not possible to put an overall figure on the returns to R&D. Nevertheless, in general this
literature finds that the private returns to R&D are strongly positive and higher than for investment in
physical capital. It also finds that the social returns may be even higher, but they are variable and often
imprecisely measured.
A more recent stream of literature incorporates innovation as an intermediate output from R&D, and
thereby provides evidence on the relationship between innovation and measures of firm performance
such as productivity. This literature uses both patents and survey-based measures of innovation,
including binary indicators of whether a firm introduced a product and/or process new to the firm, and
the share of total sales from new products.
Much of this literature uses the recursive three-equation model developed by Crepon, Duguet, &
Mairesse (1998), known as the “CDM approach” (see Hall, 2011, for a review). The equations in this
model describe (1) the decision to invest in R&D; (2) the knowledge “production” function that
translates R&D and other investments into innovation; and (3) the firm production function that
combines innovation/knowledge with labour, capital, and other inputs to generate economic output.
The purpose of instrumenting for innovation in equation (2) is to address both measurement error and

Staff Working Paper 2017/2 7
the endogeneity of innovation in equation (3). In addition, including equations (1) and (2) explicitly
models the selection of firms that engage in R&D and/or innovation.
Hall (2011) found that the results from estimations of the impact of innovation on productivity are
reasonably consistent across countries and time periods, whether or not the studies follow the CDM
approach. In a review of a range of studies across multiple countries (mainly in Western Europe) and
various time periods, she found that the elasticity of the level of multi-factor productivity (MFP) with
respect to the share of innovative sales lies between 0.09 and 0.13 – that is, a 10 percentage points
increase in the share of sales from new products leads to an increase in productivity of around 1%. She
found a much wider dispersion in analyses using binary indicators of product and/or process
innovation, but for the manufacturing sector in Western Europe the elasticity of MFP with respect to
product innovation is typically around 0.05 to 0.10. In studies that use MFP growth instead of the level
of MFP, the measure of output find an elasticity with respect to sales from new products was 0.04 to
0.08 and with respect to the binary indicator was 0.02.
A recent study on Australian SMEs by Palangkaraya, Spurling, and Webster (2015), which does not use
the CDM approach, found that firms which introduce goods/services new to the firm (i.e., engage in
product innovation) on average have MFP growth over the subsequent 1-4 years around 6.5 percentage
points higher than firms that did not do so. However, they found no relationship between any of the
other types of innovation and MFP growth.
This paper seeks to provide corresponding evidence for New Zealand, focusing in particular on the
relationship between MFP growth and indicators of innovation. Instead of following the CDM
approach, it uses a differences-in-differences approach similar to Palangkaraya et al.(2015).
3 Empirical analysis
3.1 Data sources & variable construction
The data used in this analysis is drawn from the Longitudinal Business Database (LBD) compiled by
Statistics New Zealand as part of the Integrated Data Infrastructure (IDI). The LBD combines financial
data for New Zealand firms collected by Statistics New Zealand through the Annual Enterprise Survey
(AES) and by the Inland Revenue Department (IRD) on the IR10 form. It also includes self-reported
measures of R&D expenditure and innovation (e.g., introducing new goods and services) collected by
Statistics New Zealand in the Business Operations Survey (BOS), and data on patent & trademark
applications filed with the Intellectual Property Office of New Zealand.
MFP is measured using the approach described in Fabling and Maré (2015). Firm-level productivity is
estimated using a trans-log production function with gross output as the dependent variable, firm-level
measures of employment (L), capital stock (K), materials (M) as inputs and firm fixed effects. However, in
contrast to Fabling and Maré, the regression specification does not include year dummies. This allows
the mean of MFP to vary across the 12-year period of the dataset – 2000-2012 – making it possible to
compare MFP levels across time and to measure changes over time.
Formally the production function specification is:

8 Innovation and the performance New Zealand firms
for each industry
where , { , , }
is firm 's gross output in year t
is firm 's level of employment in year t
is firm 's capital sto
r r sit j r it rs it it i
r
i
r s r
t
Lit
Kit
ln GO ln X ln X ln X j J
r s L K M
GO i
X i
X i
ck in year t
is intermediate inputs firm uses in year t
is a fixed effect for firm
is the set of industries
Mit
i
X i
i
J
MFP for each firm i in year t is calculated as the residual from this estimation:
ln(
where is multi-factor productivity o
)
f firm in year
r r sit it r it rs it it
r
it
r s r
MFP ln GO ln X ln X ln X
MFP i t
Because MFP is derived as the residual from the production function, measurement error in any of the
inputs (i.e., labour, capital, intermediate goods) will mean that MFP is also measured with error (i.e.,
t tMFP MFP ). As result, the true correlation between innovation and MFP growth may be
overwhelmed by measurement error, especially when MFP growth is measured over short time periods.
To mitigate this concern, the analyses that follow use a two-year moving average of MFP:
1
2t t
t
MFP MFPMFP
This smoothes out short-run variation in MFP that may be caused by measurement error in any
particular year.
In addition to MFP, the paper also uses labour productivity – measured by dividing the firm’s value added (GO – M) by its level of employment – as an alternative productivity measure:
iit
i
iGOP
ML
L
As well as the two productivity measures, the paper also assesses the impact of innovation on the levels
and growth rates of employment (L) and value added (VA).
Innovation is measured using a range of indicators:
1. an indicator of whether the firm was engaged in R&D activity in a given (financial) year (from
BOS Module A);
2. an indicator of whether the firm was engaged in innovative activity of any type in a given year
(from BOS Module A);
3. indicators of whether the firm engaged in specific types of innovation (introduced goods &
services, operational processes, organisational processes, and marketing methods) in the last 2
financial years (from BOS Module B);
4. for goods & services specifically, a categorical variable that captures whether in the last 2
financial years the firm introduced products that are new to the world, new to New Zealand,
new only to the firm (from BOS Module B);
5. the firm’s R&D expenditure (from BOS Module A) as a proportion of total expenditure in the
last financial year (from AES/IR10);
6. the firm’s expenditure on various types of product development (from BOS Module B) as a
proportion of total expenditure in the last financial year (from AES/IR10); and

Staff Working Paper 2017/2 9
7. the share of the firm’s sales that come from goods & services new to the firm in the last financial
year (from BOS Module B);
These various measures of innovation and the relationship between them are described in detail in
Wakeman and Le (2015).
As well as the various measures of productivity and innovation, industry dummies at the 3-digit level of
the NZ Standard Industry Output categories are included to capture the firm’s primary industry.
Information on employment and firm age from the core LBD is used to construct sets of employment
and age categories. Data reflecting the firm’s primary location (from the plant in which the highest
share of the firm’s employees is located) and level of international connection are also constructed and
included in the regression.
3.2 Descriptive statistics
Table 3.1 shows the number of observations in the full BOS sample by year alongside the number of observations for which estimates of the level of MFP and changes in MFP are available over different time horizons. It shows that in any given year, MFP estimates are available for around 60% of firms in the BOS sample. However, data on MFP growth is available across fewer firms. For example, data on the 3-year changes in MFP is available for only about 40% of firms and only for firms that responded to BOS in 2009 or earlier.1
Adjusting the BOS sample weights to account for the missing productivity estimates results in a sample that is more or less the same size as the weighted BOS sample (Table 3.2). Nevertheless, there is still attrition of around 40% of firms in calculating the 3-year changes in MFP growth.
Table 3.1 Number of observations
Panel A: Unweighted Year All firms in
BOS sample Firms in BOS
with MFP data Firms in BOS with data on n-year change in MFP
1 2 3 4
2005 7,134 4,410 3,921 3,570 3,390 3,231
2006 5,886 3,630 3,123 2,961 2,820 2,673
2007 6,450 3,939 3,468 3,276 3,060 2,856
2008 6,180 3,933 3,477 3,264 3,012 2,835
2009 6,234 4,113 3,603 3,333 3,135 0
2010 6,027 3,876 3,354 3,162 0 0
2011 5,979 3,741 3,261 0 0 0
2012 5,430 3,384 0 0 0 0
Panel B: Weighted Year All firms in
BOS sample Firms in BOS
with MFP data Firms in BOS with data on n-year change in MFP
1 2 3 4
2005 32,472 31,989 23,922 20,586 19,158 18,192
2006 32,772 32,157 24,744 21,081 19,278 18,642
2007 32,298 31,794 23,361 20,373 18,441 16,794
2008 33,729 33,270 25,524 21,702 19,665 18,342
2009 34,008 33,507 24,672 21,225 19,617 0
2010 33,066 32,580 25,221 21,588 0 0
2011 33,111 32,547 24,528 0 0 0
2012 33,603 32,985 0 0 0 0
Notes: This table shows the number of firms in the full BOS sample in each year against the number of firms with MFP estimates and with estimates of the n-year change in MFP. Observation counts rounded to base 3. The counts in Panel A are unweighted. The counts in Panel B are weighted by the BOS sampling weights and (in all but the first column) adjusted for missing productivity estimates.
1 This is either because firms exit from the sample or because of they do not report data in every year

10 Innovation and the performance New Zealand firms
Table 3.2 shows the means of the variables used in the analysis across three samples: (1) all firms in the BOS sample; (2) the subset of firms with productivity data; and (3) the subset of firms with the data necessary to calculate the 3-year change in productivity. The asterisks in columns (2) & (3) indicate that the subsample mean is significantly different from the BOS sample mean. It shows that in general the means of the subsample of firms with MFP estimates are statistically different to the means of the full sample, although the magnitude of the differences is typically very small. In particular, the firms with MFP estimates are slightly less likely to be engaged in innovation, but no more likely to be engaged in R&D. However, the percentage of total expenditure spent on various types of product development expenditure differs greatly across firms in the two samples.
Table 3.2 Means of key variables by sample
(1) (2) (3)
All firms in BOS sample
Firms in BOS with estimate of MFP
Firms in BOS with estimate of 3-year
change in MFP
Measures of firm production
Multi-factor productivity - 0.1433 0.1561
Labour productivity ($000) - 83.74 83.82
Value-added output ($000) - 3,418.93 4,146.21
Employment (FTE employees) - 31.16 36.39
Measures of innovation output
Any innovation new to the firm 38.3% 37.4%*** 37.4%***
Share of sales from new good/service 2.79% 2.61%** 2.49%***
Product innovation
new to the world 2.7% 2.7% 2.7%
new to New Zealand 3.8% 4.0%*** 4.0%***
new to the firm 13.2% 12.9%** 12.9%**
Process innovation 17.3% 17.3% 17.3%
Organisational innovation 22.7% 22.1%*** 22.1%***
Marketing innovation 22.1% 21.6%*** 21.6%***
Measures of intermediate outputs
Filed patent application in year 0.12% 0.14%* 0.14%*
Made trademark registration in year 2.06% 2.21%*** 2.21%***
# patent applications filed 0.0020 0.0025 0.0038
# trademarks registered 0.0920 0.1146 0.1347
Measures of innovation inputs
R&D activity 7.36% 7.33% 7.33%
R&D expenditure ($000, from annual BOS Module A) 22.78 27.54 29.74
R&D expenditure ($000, from biennial BOS Module B) 26.22 31.19 39.78
Design expenditure ($000) 8.24 7.46 9.97
Marketing expenditure ($000) 19.24 22.89 38.05
Other product development expenditure ($000) 12.29 12.73 13.00
Total product development expenditure ($000) 65.71 73.98 100.32
Firm characteristics
Age (years) 21.30 22.13*** 22.53***
Exporter 15.8% 17.1%*** 17.1%***
Foreign owned 7.0% 6.9%* 6.9%*
Has investment overseas 3.3% 3.2%** 3.2%**
International connection
NZ-owned domestic 79.1% 78.1%*** 78.1%
foreign-owned domestic 3.7% 3.5%*** 3.5%***
international 17.3% 18.4%*** 18.4%***
Notes: This table shows means of the key variables used in the analysis for: (1) all firms in BOS from 2005-2012; (2) firms in (1) with estimates of MFP; and (3) all firms in (1) with estimates of 3-year change in MFP. Means of the binary variables have been generated using sum and counts rounded to base 3. Means generated by weighting observations by revised BOS sampling weights (column 1), adjusted for missing productivity estimates (columns 2 & 3). t-statistic calculated using standard error of unweighted mean. Asterisks indicate sample mean (in columns 2 or 3) is different from population mean (in column 1): *** p<0.01, ** p<0.05, * p<0.1.
R&D expenditure can be a poor proxy for innovation (see Box 1). As a consequence, the results that
follow focus on indicators of whether a firm introduced a product, process, organisational, or marketing
innovation (new to the firm). Nevertheless, for comparison, the paper also shows the results derived
using the indicator of whether a firm was engaged in R&D activity in a given year.
Staff Working Paper 2017/2 11
2 “Other Services” includes Transport and Storage (I), Communication Services (J), Finance and Insurance (K), Government Administration and Defence (M),
Education (N), Health and Community Services (O), Cultural and Recreational Services (P), and Personal and Other Services (Q).
Box 1 R&D versus innovation
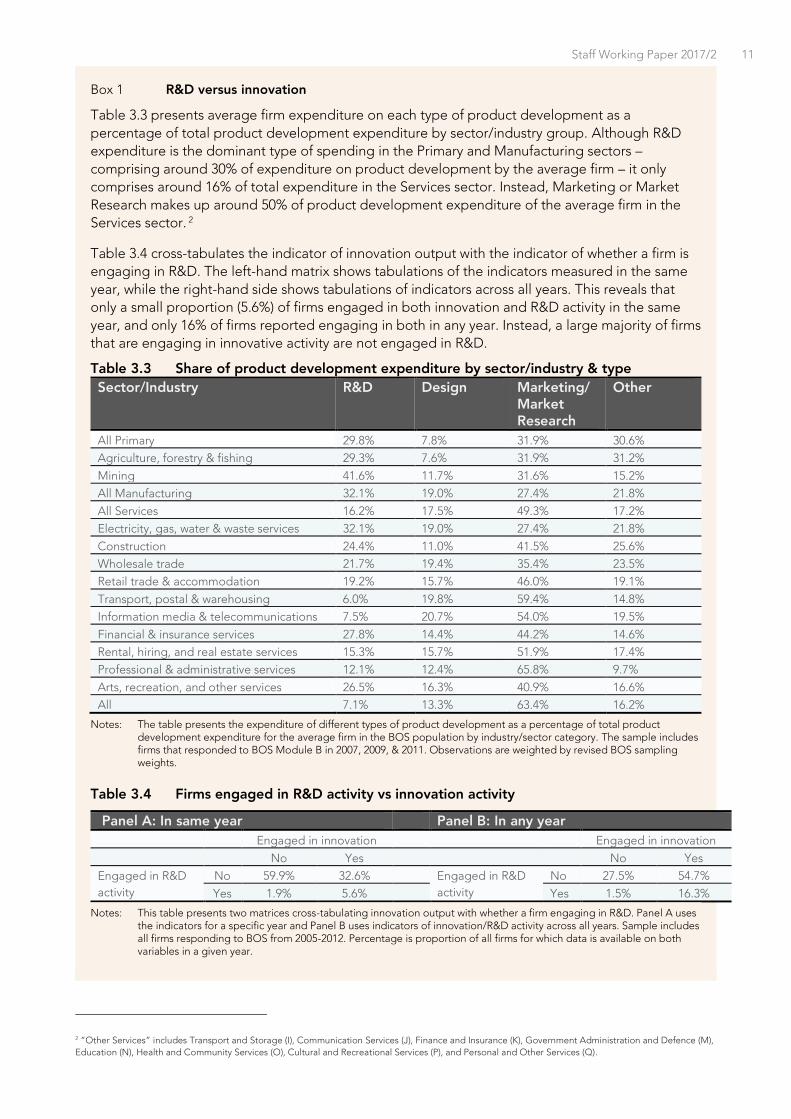
Table 3.3 presents average firm expenditure on each type of product development as a
percentage of total product development expenditure by sector/industry group. Although R&D
expenditure is the dominant type of spending in the Primary and Manufacturing sectors –
comprising around 30% of expenditure on product development by the average firm – it only
comprises around 16% of total expenditure in the Services sector. Instead, Marketing or Market
Research makes up around 50% of product development expenditure of the average firm in the
Services sector. 2
Table 3.4 cross-tabulates the indicator of innovation output with the indicator of whether a firm is
engaging in R&D. The left-hand matrix shows tabulations of the indicators measured in the same
year, while the right-hand side shows tabulations of indicators across all years. This reveals that
only a small proportion (5.6%) of firms engaged in both innovation and R&D activity in the same
year, and only 16% of firms reported engaging in both in any year. Instead, a large majority of firms
that are engaging in innovative activity are not engaged in R&D.
Table 3.3 Share of product development expenditure by sector/industry & type
Sector/Industry R&D Design Marketing/ Market Research
Other
All Primary 29.8% 7.8% 31.9% 30.6%
Agriculture, forestry & fishing 29.3% 7.6% 31.9% 31.2%
Mining 41.6% 11.7% 31.6% 15.2%
All Manufacturing 32.1% 19.0% 27.4% 21.8%
All Services 16.2% 17.5% 49.3% 17.2%
Electricity, gas, water & waste services 32.1% 19.0% 27.4% 21.8%
Construction 24.4% 11.0% 41.5% 25.6%
Wholesale trade 21.7% 19.4% 35.4% 23.5%
Retail trade & accommodation 19.2% 15.7% 46.0% 19.1%
Transport, postal & warehousing 6.0% 19.8% 59.4% 14.8%
Information media & telecommunications 7.5% 20.7% 54.0% 19.5%
Financial & insurance services 27.8% 14.4% 44.2% 14.6%
Rental, hiring, and real estate services 15.3% 15.7% 51.9% 17.4%
Professional & administrative services 12.1% 12.4% 65.8% 9.7%
Arts, recreation, and other services 26.5% 16.3% 40.9% 16.6%
All 7.1% 13.3% 63.4% 16.2%
Notes: The table presents the expenditure of different types of product development as a percentage of total product development expenditure for the average firm in the BOS population by industry/sector category. The sample includes firms that responded to BOS Module B in 2007, 2009, & 2011. Observations are weighted by revised BOS sampling weights.
Table 3.4 Firms engaged in R&D activity vs innovation activity
Panel A: In same year Panel B: In any year
Engaged in innovation Engaged in innovation
No Yes No Yes
Engaged in R&D
activity
No 59.9% 32.6% Engaged in R&D
activity
No 27.5% 54.7%
Yes 1.9% 5.6% Yes 1.5% 16.3%
Notes: This table presents two matrices cross-tabulating innovation output with whether a firm engaging in R&D. Panel A uses the indicators for a specific year and Panel B uses indicators of innovation/R&D activity across all years. Sample includes all firms responding to BOS from 2005-2012. Percentage is proportion of all firms for which data is available on both variables in a given year.
12 Innovation and the performance New Zealand firms
Most of the results in this paper are derived using binary indicators of innovation new to the firm.
Arguably, the indicators of whether a firm introduced a product new to New Zealand or new to the
world would better capture cutting-edge innovation. Meanwhile, many researchers prefer to use the
share of sales coming from new products (as opposed to the binary indicators) because it is not
confounded by firm size.3 Accordingly, the paper also shows results derived using the degree of
product novelty and the share of sales.
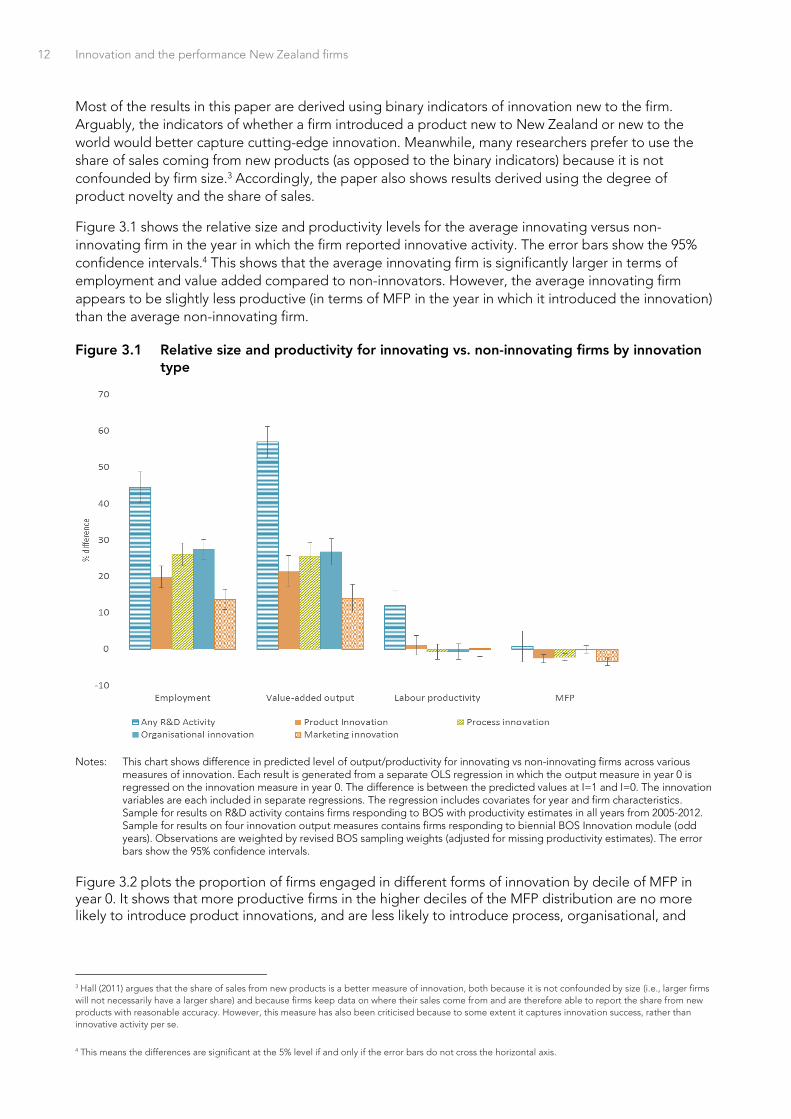
Figure 3.1 shows the relative size and productivity levels for the average innovating versus non-
innovating firm in the year in which the firm reported innovative activity. The error bars show the 95%
confidence intervals.4 This shows that the average innovating firm is significantly larger in terms of
employment and value added compared to non-innovators. However, the average innovating firm
appears to be slightly less productive (in terms of MFP in the year in which it introduced the innovation)
than the average non-innovating firm.
Figure 3.1 Relative size and productivity for innovating vs. non-innovating firms by innovation type
Notes: This chart shows difference in predicted level of output/productivity for innovating vs non-innovating firms across various measures of innovation. Each result is generated from a separate OLS regression in which the output measure in year 0 is regressed on the innovation measure in year 0. The difference is between the predicted values at I=1 and I=0. The innovation variables are each included in separate regressions. The regression includes covariates for year and firm characteristics. Sample for results on R&D activity contains firms responding to BOS with productivity estimates in all years from 2005-2012. Sample for results on four innovation output measures contains firms responding to biennial BOS Innovation module (odd years). Observations are weighted by revised BOS sampling weights (adjusted for missing productivity estimates). The error bars show the 95% confidence intervals.
Figure 3.2 plots the proportion of firms engaged in different forms of innovation by decile of MFP in year 0. It shows that more productive firms in the higher deciles of the MFP distribution are no more likely to introduce product innovations, and are less likely to introduce process, organisational, and
3 Hall (2011) argues that the share of sales from new products is a better measure of innovation, both because it is not confounded by size (i.e., larger firms
will not necessarily have a larger share) and because firms keep data on where their sales come from and are therefore able to report the share from new
products with reasonable accuracy. However, this measure has also been criticised because to some extent it captures innovation success, rather than
innovative activity per se.
4 This means the differences are significant at the 5% level if and only if the error bars do not cross the horizontal axis.

Staff Working Paper 2017/2 13
marketing innovations than firms in the lower deciles. That is, the most productive firms are least likely to undertake these types of innovation.
Although these results do not say anything about the impact of innovation on productivity, they highlight that the BOS measures of innovation, particularly those that capture innovation new to the firm, are more likely to describe efforts by firms to adopt technology and catch-up than attempts to push out the technological frontier. This is important to keep in mind when interpreting the results that follow.
Figure 3.2 Proportion of firms engaged in innovation by MFP decile in year 0
Notes: These charts show the predicted probabilities of introducing innovation in a given year by decile of MFP in the same year across various innovation types, where 1 is the lowest decile (i.e., the least productive firms) and 10 is the highest. The results on each chart are generated from a single OLS regression in which the indicator of innovation in year 0 is regressed on a set of dummies for the decile of MFP level in year 0 (without controls). Sample contains firms responding to biennial BOS Innovation module (B) with productivity estimates in the same year. Observations are weighted by revised BOS sampling weights (adjusted for missing productivity estimates). The error bars show the 95% confidence intervals.
3.3 Empirical method
The objective of this paper is to understand the relationship between innovation and the performance
of New Zealand firms. Because it is not possible to observe how an innovating firm would have
performed if it had not innovated, the performance of a set of non-innovating firms is used to
approximate the counterfactual. However, underlying differences between innovating and non-
innovating firms are likely to drive both the decision to innovate and firm performance (i.e., innovation
is endogenous). Therefore it is not possible to interpret a correlation between innovation and
performance differences across innovating and non-innovating firms as a measure of the impact of
innovation on firm performance.
As discussed in section 2.2, most of the prior literature deals with this endogeneity issue by
instrumenting for innovation in the 3-stage CDM model. The longitudinal nature of the LBD makes it
possible in this paper to instead use a differences-in-differences approach. This approach controls for
fixed firm characteristics.
In addition, the regression specification includes a range of variables that capture differences in firm
characteristics and in the environment in which it operates. In particular, it includes the year in which the
innovation occurred, the firm’s industry, year-industry effects, and firm characteristics such as age, size,
the extent of international connectivity, and the firm’s primary location.
Specifically, the following model of firm performance is estimated:
0 0 0ln – ln
iin I i X iY Y I X t
where Yit is a measure of firm i’s performance in year t; Iit is a vector of indicators of various types of
innovation for firm i in year t; and Xit is a vector of firm i’s characteristics in year t. Taken together, this

14 Innovation and the performance New Zealand firms
controls for a range of factors that may influence both whether a firm innovates and its performance,
and hence provides more confidence that the observed result reflects the impact of innovation on
performance.
The sample includes all firms in the BOS sample with productivity estimates in a given year. To ensure
this sample is representative of the BOS population, the observations are weighted by the BOS
sampling weights (adjusted to ensure that the sample of firms with productivity data is representative of
the BOS population). Applying these weights in the regression means the results from the regression
reflect the relative growth levels for the average firm in the BOS population (i.e., with each firm
weighted equally).
To examine how the relationship between innovation and productivity growth varies across different
types of firms, the various innovation measures are interacted with a vector of firm characteristics and
included in the regression. More specifically, the results are derived by estimating the following
equation:
0 0 0 0 0ln( – ln( ) ) iin I i X i IX i iY Y I X I X t
The predicted values of the dependent variable are then calculated and compared under alternative
scenarios (i.e., with and without innovation) given specific firm characteristics.
4 Estimation results
4.1 Baseline results
Figure 4.1 shows the average changes in firm performance – employment, value-added, labour
productivity, and MFP – over time across R&D active vs non-active firms (the green and blue lines
respectively). The orange bars show the differences in performance between R&D active and inactive
firms with error bars reflecting the 95% confidence interval around the differences in means.
The results show that on average firms that engaged in R&D activity had faster growth in employment
and output in the following years, but experienced similar productivity growth (whether measured in
terms of labour productivity or MFP) relative to firms that did not engage in R&D. Firms with higher
levels of R&D intensity have higher rates of growth in employment, output and MFP, but the differences
are not statistically significant. Interestingly, the charts indicate that both employment and output are
declining over time on average across firms in the BOS with population with productivity data. This
decline is not present when the firms are weighted by firm size (see below), suggesting that it is driven
by the large share of smaller firms in the sample, which generally grew more slowly than larger firms
during this time period.
Figure 4.2 shows the relative growth and productivity results based on whether a firm engaged in any
type of innovative activity or not. The broad pattern is similar to those for R&D activity except the
magnitude of the differences across the two groups of firms is larger and more clearly significant. Firms
that engaged in innovative activity clearly grow faster (by around 3-4 percentage points in the first two
years) than non-innovating firms, but do not experience any significant differences in productivity
growth.
Figure 4.3 breaks out the changes in MFP across innovating and non-innovating firms for the four different types of innovation – product, process, organisational, and marketing. These results do not reveal any specific type of innovation that is associated with significant increase (or decrease) in productivity for the average firm. The results do show that product and organisational innovation are associated with very little difference in MFP performance, whereas process and marketing innovation generate a productivity gap of around 1.5 percentage points after 3 years. However, it is not statistically significant.

Staff Working Paper 2017/2 15
Figure 4.1 Change in firm performance by R&D activity
Employment Value add Labour productivity MFP
Notes: These charts show predicted changes in various measures of firm performance for R&D active vs R&D inactive firms. Performance differences across these two groups of firms are also plotted. Results are generated from separate OLS regressions of the change in performance from year 0 to year n on the measure of R&D activity in year 0. Sample contains firms responding to BOS in all years from 2005-2011, with productivity estimates from 2005-2012. Observations are weighted by revised BOS sampling weights (adjusted for missing productivity estimates). Other details same as for Figure 3.1.
Figure 4.2 Change in firm performance by innovation activity
Employment Value add Labour productivity MFP
Notes: These charts show the change in various performance measures for firms engaging in any form of innovation activity vs non-innovating firms. Other details same as for Figure 4.1.
Figure 4.3 Change in multi-factor productivity by type of innovation
Product innovation Process innovation Organisational innovation Marketing innovation
Notes: These charts show the change in multi-factor productivity across the four types of innovation new to the firm – product, process, organisational, and marketing. Sample contains firms with productivity estimates responding to BOS Innovation module in odd years from 2005-2011. Other details same as for Figure 4.1.
4.2 Weighting by firm size
The results presented above reflect the performance differences of the average firm depending on
whether it engaged in R&D activity or innovation, with firms weighted equally regardless of their size. However, to get a better estimate of the relationship between innovation and productivity in the

16 Innovation and the performance New Zealand firms
economy as a whole, Figures 3.6 and 3.7 show results derived by weighting each observation by the
predicted level of a firm’s output in year 0.5
In contrast to the unweighted results, both the (weighted) set of firms engaged in R&D activity and the
set of firms engaged in innovative activity grew in terms of both employment and output, while non-
innovating firms declined in size. Meanwhile, there is an obvious decline in MFP for both sets of firms.
R&D active firms have significantly higher employment growth than non-active firms, as do firms with
higher R&D intensity. Firms engaged in innovative activity have higher growth in both employment and
output growth, but lower growth in MFP.
To dig deeper into this result, Figure 4.6 shows the change in MFP for the four types of innovation –
product, process, organisational, and marketing. In general the charts show the same downward trend
in MFP among both innovating and non-innovating firms.6 However, they show that firms that engaged
in some types of innovation perform better than firms that did not engage in that type of innovation,
while in other cases they perform worse. In particular, firms that engaged in marketing innovation
experienced higher relative MFP growth in the first year following the innovation activity. Meanwhile
firms that engaged in product innovation experienced a relative decline in MFP, although the
difference is not statistically significant.
Figure 4.4 Change in output by R&D activity (weighted by firm size)
Employment Value add Labour productivity MFP
Notes: These charts show the change in various performance measures for firms that report engaging in R&D activity vs non-innovating firms (in Panel A) and the elasticity with respect to the share of total expenditure spent on R&D (in Panel B). Observations are weighted by revised BOS sampling weights (adjusted for missing productivity estimates) multiplied by predicted gross output. Other details are the same as for Figure 4.1.
5 To be more precise, the weighted results correspond to the relationship between innovation and firm performance for the set of firms in the BOS
population, which includes all firms with 6 or more employees more that have been operating for at least a year. The predicted levels of output calculated
from the productivity function estimation are used rather than the actual level of output to remove the level of MFP.
6 The samples used to generate the charts in Figure 4.4 and Figure 4.6 are different. The charts in Figure 4.4 are based on the responses to the BOS in all
years from 2005-2012, while the charts in Figure 4.6 are based on response to the BOS Innovation Module (B) in odd years from 2005-2011.

Staff Working Paper 2017/2 17
Figure 4.5 Change in output by innovation activity (weighted by firm size)
Employment Value add Labour productivity MFP
Notes: These charts show the change in various output measures for firms reporting engaging in any innovation activity vs non-innovating firms. Observations are weighted by revised BOS sampling weights (adjusted for missing productivity estimates) multiplied by predicted gross output. Other details same as for Figure 4.2.
Figure 4.6 Change in multi-factor productivity by type of innovation (weighted by size)
Product innovation
Process innovation
Organisational innovation
Marketing innovation
Notes: These charts show the change in MFP across the four types of innovation new to the firm – product, process, organisational, and marketing. Sample contains firms with productivity estimates responding to BOS Innovation module in odd years from 2005-2011. Other details same as for Figure 4.4.
4.3 Innovation and firm survival
Innovation is a risky activity that is likely to increase the volatility in firm outcomes. For example, this is
reflected is in higher variance around firm performance measures – the standard errors on the
performance measures reported above are almost always higher across innovating firms compared with
non-innovating firms.7 At the extreme, firms pursuing unsuccessful innovation strategies may exit the
market.
From an economy-wide perspective, higher rates of exit among innovating firms would not necessarily
be a bad outcome. If selection mechanisms are working well, the resources of failing firms will be
reallocated to more successful firms. Nevertheless, from the perspective of the individual firms,
increasing the chances of survival is likely to be one of the objectives of engaging in innovation.
Figure 4.7 shows the relative probability of survival for innovating and non-innovating firms in the years
following the various types of innovation. The results show that innovating firms have higher survival
probabilities in all cases. However, this difference in the probability of survival is only statistically
significant in the case of marketing innovation.
7 These results are available on request.

18 Innovation and the performance New Zealand firms
Figure 4.7 Relative probability of survival by innovation type
Product innovation Process innovation Organisational innovation Marketing innovation
4.4 The impact of innovation across different firm types
The results that follow show how the relationship between innovation and productivity growth varies
across different types of firms. Because the results from the prior analysis show the clearest difference
between innovating and non-innovating firms over the three years following the innovation, the results
shown focus specifically on the relative change over a 3-year time period.
Figure 4.8 to Figure 4.13 present the relative changes in MFP for each innovation measure by each
category of firm characteristic. Taken together, the results reveal that some specific types of firms
experience significantly higher MFP growth following innovation relative to non-innovating firms.
However, they also point to several cases where some types of innovating firms actually exhibit lower
MFP growth relative to similar non-innovating firms.
Figure 4.8 shows that innovating firms in the younger age group, and particularly firms that are between
5-10 years old, exhibit higher MFP growth following R&D activity and most types of innovation
compared to non-innovators. The biggest productivity dividends accrue to firms that introduce a
product innovation new to the world, which increase their productivity by 22 percent over the first three
years, which is 20 percentage points more than firms that do not. This group of firms – start-ups that
introduce truly novel products – are a special case, and the results cannot readily be generalised to
other start-ups. Nevertheless, they represent the frontier that some will aspire to.
Figure 4.9 shows that (after controlling for firm age) small-to-medium enterprises (SMEs) – particularly those with 20-50 employees – that introduce a product or process innovation experience lower MFP
growth than firms that make no change. The returns to larger firms appear to have more variance.
However prior research indicates that a much higher proportion of the larger firms are likely to be
engaged in innovation (Wakeman & Le, 2015), so engaging in innovation is less likely to be a
distinguishing feature of the firm.
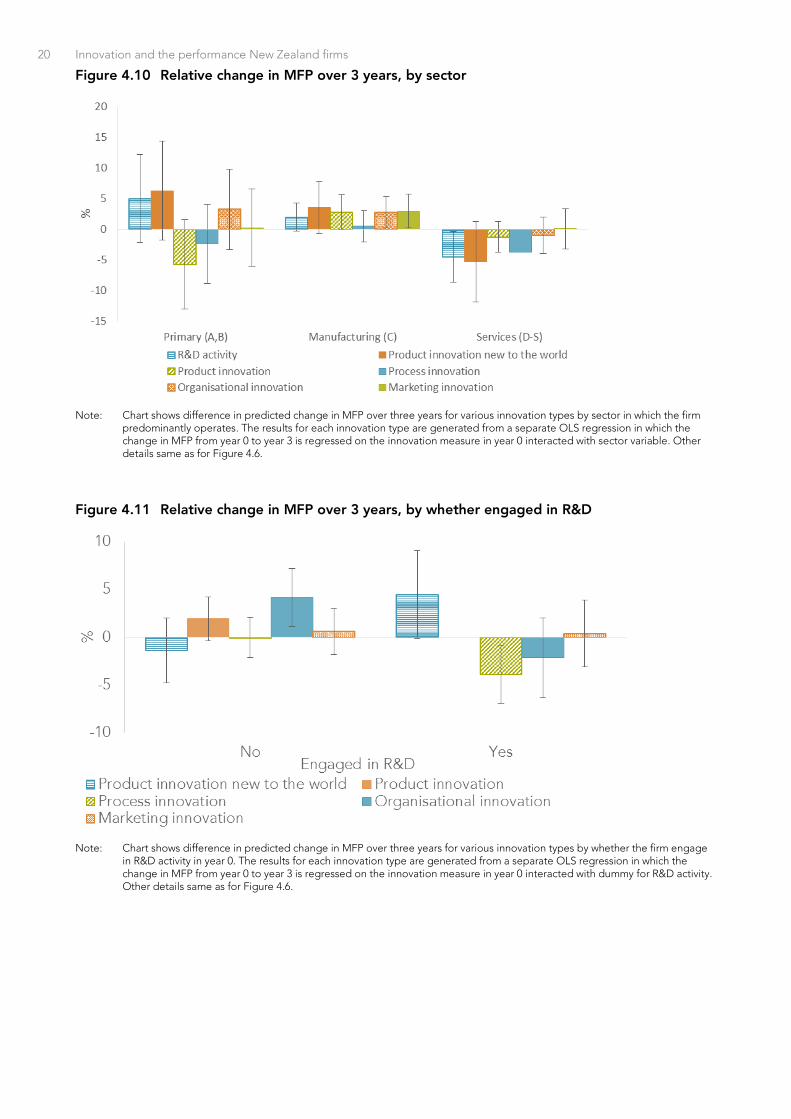
Figure 4.10 shows that firms in the manufacturing sector on average experienced positive and
significant returns to product, organisational, and marketing innovation, but in the other sectors the
change in MFP associated with innovation is either insignificant or negative (e.g., to R&D activity in the
Services sector). Looking at the specific industries within the sectors (in results not reported here) does
not reveal much additional insight. In almost all cases the relationship between innovation and MFP
growth in specific industries is insignificant, the exceptions being Information Media &
Telecommunications, where process innovation is associated with negative productivity growth, and
Rental, Hiring, and Real Estate Services, in which organisational innovators have positive productivity
growth and marketing innovators have negative growth.
Figure 4.11 shows that R&D-active firms perform much better when they introduce a product innovation
new to the world, but no better following the other types of innovation. Meanwhile firms not engaged
in R&D do better following organisational innovation, but no better after any of the others.

Staff Working Paper 2017/2 19
Looking more broadly at where the innovating firm gets its ideas from, Figure 4.12 shows that product
innovators do better if the source of their ideas are professional advisors, books, industry/employer
organisations, and universities; organisational innovators do better if they get their ideas from
professional advisors and other businesses; and marketing innovators do better if they get their ideas
from conferences.
Figure 4.8 Relative change in MFP over 3 years, by firm age
Note: Chart shows difference in predicted change in MFP over three years for innovating vs non-innovating firms by category of firm age. The coloured bars represent different innovation types. The results for each innovation type are generated from a separate OLS regression in which the change in MFP from year 0 to year 3 is regressed on the innovation measure in year 0 interacted with firm age. Other details same as for Figure 4.6.
Figure 4.9 Relative change in MFP over 3 years, by firm size
Note: Chart shows difference in predicted change in MFP over three years for various innovation types by employment size. The results for each innovation type are generated from a separate OLS regression in which the change in MFP from year 0 to year 3 is regressed on the innovation measure in year 0 interacted with employment size. Other details same as for Figure 4.6.
20 Innovation and the performance New Zealand firms
Figure 4.10 Relative change in MFP over 3 years, by sector
Note: Chart shows difference in predicted change in MFP over three years for various innovation types by sector in which the firm
predominantly operates. The results for each innovation type are generated from a separate OLS regression in which the change in MFP from year 0 to year 3 is regressed on the innovation measure in year 0 interacted with sector variable. Other details same as for Figure 4.6.
Figure 4.11 Relative change in MFP over 3 years, by whether engaged in R&D
Note: Chart shows difference in predicted change in MFP over three years for various innovation types by whether the firm engage in R&D activity in year 0. The results for each innovation type are generated from a separate OLS regression in which the change in MFP from year 0 to year 3 is regressed on the innovation measure in year 0 interacted with dummy for R&D activity. Other details same as for Figure 4.6.

Staff Working Paper 2017/2 21
Figure 4.12 Relative change in MFP over 3 years by source of information/ideas
Note: The charts shows difference in predicted change in MFP over three years by source of ideas across four main innovation types. The results for each innovation type are generated from a separate OLS regression in which the change in MFP from year 0 to year 3 is regressed on the innovation measure in year 0 interacted with a set of dummies for whether obtained ideas for particular source. Other details same as for Figure 4.6.

22 Innovation and the performance New Zealand firms
To understand how international connections influence the relationship between innovation and
productivity, firms are grouped into three types: New Zealand-owned domestically focused firms (i.e.,
those that are not exporting and do not have any investments overseas), foreign-owned domestically
focused firms (i.e., as before but owned by a foreign company), and internationally focused firms (i.e,
exporting and/or with overseas investments, whether New Zealand or foreign-owned). Figure 4.13
shows that internationally focused firms that are innovating typically have higher productivity growth
than those that are not. Meanwhile, New Zealand-owned firms that are domestically focused and
innovating tend to have weaker productivity growth. This is consistent with the idea expressed in
Conway (2016) that small market size may limit the returns to innovation.
According to the results presented in Figure 4.14, the relative change in MFP associated with
innovation is greatest among the most productive firms, with R&D activity and product innovation both
associated with significantly higher growth rates. By contrast, among the least productive firms the
relative returns of innovating firms are generally negative, with firms doing R&D activity and
organisational innovation experiencing relative declines in MFP of 8 and 11 percentage points
(respectively) over three years. This is interesting, particularly given the finding (depicted in Figure 3.1
above) that the least productive firms are more likely to engage in innovation in the first place.
Nevertheless, the variance in returns associated with innovation among these firms (as represented by
the error bars) is also the largest. Hence it appears that at least for some of the firms in the lowest
quartile, innovation may enable them to catch up.
Figure 4.13 Relative change in MFP over 3 years by international connection
Note: Chart shows difference in predicted change in MFP over three years for various innovation types by the firm’s extent of
international connection. The results for each innovation type are generated from a separate OLS regression in which the change in MFP from year 0 to year 3 is regressed on the innovation measure in year 0 interacted with the international connectivity variable. Other details same as for Figure 4.6.
Figure 4.14 Relative change in MFP over 3 years by quartile of MFP
Note: Chart shows difference in predicted change in MFP over three years for various innovation types by quartile of the firm’s MFP in year 0. The results for each innovation type are generated from a separate OLS regression in which the change in MFP from year 0 to year 3 is regressed on the innovation measure in year 0 interacted with MFP quartile. Other details same as for Figure 4.6.

Staff Working Paper 2017/2 23
4.5 The impact of innovation across time
The results presented above are based on the change in MFP averaged from 2005-2012. However, it is
plausible that the relationship between innovation and productivity may have changed over time, given
that the Global Financial Crisis occurred part way through the sample period. To investigate, Figure
4.15 shows the change in MFP in innovating and non-innovating firms by year for each of the four types
of innovation.8 For product innovation, Figure 4.16 shows the change in MFP by year and the degree of
product novelty (i.e., new to the world, new to New Zealand, new to the firm, and not new).
Figure 4.15 Change in MFP by type of innovation across time
Product innovation Process innovation
Organisational innovation Marketing innovation
Notes: The figure shows the one- and two-year change in MFP for firms that engaged in innovation (green line) and firms that did not (blue line). They are overlaid on the one-year change in MFP by year for all firms together (dotted black line). Other details are the same as for Figure 3.16.
Figure 4.16 Change in MFP by degree of product novelty across time
Notes: The figure shows the one- and two-year change in MFP for firms that introduced innovation new to the world (green line), new to New Zealand (orange line), new to the firm (blue line) and firms that did not (dashed grey line). They are overlaid on the one-year change in MFP by year for all firms together (dotted black line). Other details same as for Figure 3.1.
8 As the productivity data is only available until 2012 at the time of writing, the charts only display changes for the 1 year following innovation in 2011
respectively. This also highlights that the results shown in the previous graphs are based on an unbalanced panel, and the results for 2- to 4-year changes
are skewed towards the outcomes from earlier years.
`
5
0
-5
-10
%
2005 2006 2007 2008 2009 2010 2011 2012 year
`
5
0
-5
-10
%
2005 2006 2007 2008 2009 2010 2011 2012 year
5
0
-5
-10
%
2005 2006 2007 2008 2009 2010 2011 2012 year
5
0
-5
-10
%
2005 2006 2007 2008 2009 2010 2011 2012 year
all Innovative firms Non-innovative firms
5
0
-5
-10
%
2005 2006 2007 2008 2009 2010 2011 2012
10
all new to world new only to NZ new only to firm not new

24 Innovation and the performance New Zealand firms
The results reveal a changing relationship between innovation and firm productivity over time. Firms
that engaged in product, process, and organisational innovation in the two years prior to both 2005 and
2007 generally had weaker MFP growth than non-innovating firms over the subsequent two years.
Similarly, firms that introduced products “new to the world” over these years had lower productivity
growth compared to other firms. In contrast, firms engaged in these types of innovation in the two
years prior to 2009 and 2011 experienced comparatively good productivity growth over the following
two years.
On the basis of the current study, it is not possible to disentangle the deeper reasons for these changes
in the relationship between innovation and firm productivity over time. It may be, for example, that
firms innovate for different reasons at different points in the economic cycle. During contractions, firms
at greater risk of going out of business may innovate as a defensive strategy against falling revenues in
a shrinking market. On the other hand, firms wishing to expand and extract greater value from its base
of productive resources may be more likely to innovate during expansions.
Nevertheless, this change in the relationship between innovation and firm productivity provides a
potential explanation the lack of a clear aggregate relationship between innovation and productivity.
That is, the analysis includes a broad range of firms operating under different market conditions and
with different reasons for innovating. Pooling results across different types of firms may be one
explanation why the aggregate results reported above on the impact of innovation on productivity are
not clearer.
4.6 Robustness checks
4.6.1 Innovation in intervening years
The results presented above show the relationship between innovating in year 0 and firm performance over the following n years. The regression specification includes covariates for firm characteristics in
year 0 that may affect either the underlying level or changes in performance for innovating vs non-
innovating firms. The difference-in-differences methodology also implicitly controls for unobserved
factors that may affect output levels across firms. However, one important factor omitted is whether the
firm innovates in the intervening years (i.e., after the innovation but before the MFP is ultimately
measured).
As a robustness check, the analysis was rerun with an additional set of covariates for innovation in the
intervening years. As only a fraction of firms were surveyed in more than one year, including these
covariates significantly reduces the size of the sample.9 It may also potentially introduce some bias in
the estimation if there is a correlation between innovation and/or output and the likelihood the firm is
included in the survey in multiple years. Nevertheless, including these controls does not materially
affect the findings described above, indicating that whether the firm innovated in the intervening years
does not appear to be a significant factor.
4.6.2 Multiple types of innovation
To avoid the problem of correlated measurement error, all the results outlined above were generated
using a separate regression for each innovation measure. Hall (2011) argued that if different innovation
measures all suffer from measurement error, and the measurement error is correlated across those
different measures, then including them all in the same regression is likely to result in the coefficients
on the more accurate measures being biased upwards and the coefficients on the less accurate
measures being biased downwards. However, if the various innovation measures themselves are
correlated, the measure of innovation included in the regression may be picking up the effect of the
omitted measures. Another downside is that it prevents studying the interaction between the variables.
9 This reduces the sample size by between 25% and 50% over years 2 to 6.

Staff Working Paper 2017/2 25
For robustness, the analysis was rerun with the indicators for the four different types of innovation in the
same regression. In general the results on individual measures are slightly weaker, and the standard
errors are slightly larger, but qualitatively the results were very similar. The one exception is with
process innovation, where including indicators for the other types of innovation makes the negative
correlation with MFP larger and more significant.
5 Conclusion
Overall, the results outlined above show that innovating firms grew (in terms of size) at a faster rate over
the sample period than firms which do not innovate, but did not improve their productivity
performance relative to non-innovators. The average output growth of innovating firms in the first year
was almost 5 percentage points faster than for non-innovating firms across all types of innovation, rising
to 8.5 percentage points higher after 3 years. This finding of higher output growth holds true for all
types of innovation, but is especially clear for firms that engaged in product and process innovation.
The growth-rate differential is smaller when firms are weighted by size in the regression but there is still
a significant overall growth differential of around 3.5 percentage points in the first year and 5
percentage points after two years for innovating firms. Meanwhile, the aggregate results show no
difference in the MFP growth of the average innovating and non-innovation firm.
The results based on firm characteristics show that younger firms - specifically those in the 5-10 year
age group - that engaged in product, process, or marketing innovation had significantly higher
productivity than similarly aged firms that did not innovate. However, after controlling for age, smaller
firms (i.e., those with 20-50 employees) did worse following product and process innovation. Hence,
although innovation appears to be worthwhile for start-up firms, it does not appear to be so for other
small-to-medium enterprises. This may be one factor that explains the preponderance of small, old
firms in New Zealand that survive but do not grow (Criscuolo, Gal, & Menon, 2014).
The results show that innovation is correlated with MFP growth for firms in the manufacturing sector,
but less so in other sectors of the economy. This may reflect more robust data across manufacturing
firms and/or signal that further work is necessary to understand the impact of innovation on firms in the
services sector.
Meanwhile, the sources of information and ideas underlying innovation appear to be related to the
success of innovating firms. Firms that are engaged in R&D, or who obtain their ideas from the
traditional sources of technological knowledge such as universities, show higher returns following
product innovation, while firms that obtain ideas from other businesses are more likely to show higher
returns after organisational innovation. This highlights the importance of the ecosystem surrounding
the firm for capturing value from an innovation.
Firms with connections to international markets, either via foreign ownership or by exporting or owning
an overseas company themselves, experience higher returns from product and organisational
innovation. Counterintuitively, these international connections matter more when the firm introduces
product innovation new to the firm than new to the world. Hence the firms may be using their
international connections to obtain better information and guidance on how to exploit their innovation.
In interpreting the results it is important to keep in mind the limitations of the method and the analysis.
The method does not account for external factors that both make a firm more likely to engage in
innovation and are associated with higher productivity growth. For instance, the GFC caused the
market for many firms to shrink. In many cases this lowered their productivity, and may also have caused
the firm to innovate. However, without incorporating external factors such as this into the model, it is
not possible to say whether it was the changes in the external environment or the decision to innovate
that led to a decrease in the firm’s productivity.
Similarly, the results on the firm characteristics suggest that innovation generates greater benefits for
some types of firms than for others. However, these firm characteristics are often the result of firm
choices that may themselves be driven by anticipated returns to innovation. For instance, the decision

26 Innovation and the performance New Zealand firms
to obtain ideas from the business environment may be driven by higher expected returns from
engaging in organisational innovation. This means we cannot necessarily conclude that having these
characteristics (e.g., having greater international connections) causes a firm to obtain higher returns
from innovation.
This analysis examines how innovation is related to changes in output and productivity, but does not
look at how it affects profitability, which is presumably the more relevant driver for firms.10 The impact
of productivity on profitability is likely to depend on the extent of competition in the market for a firm’s
product – more intense competition is likely to see the gains from productivity improvements
competed away into lower prices and higher quality for consumers. Hence even if we observe that
higher productivity growth associated with innovation (and assume that translates into higher
revenues), it may not necessarily result in higher profitability for innovating firms.
The paper also does not say anything directly about the overall returns to innovation to the economy or
to society as a whole (i.e., the social returns to innovation). In most cases, knowledge generated
through innovation is likely to spill over to other firms, which are able to copy the innovation directly or
replicate its benefits through other changes. The result of this imitation will be lower prices and/or
higher availability that benefits consumers. However, the results in this paper only measure the private
returns associated with innovation and not the social returns.
The primary objective of this project was to understand whether low investment in BERD might be
explained by relatively low returns to innovation. As reported in section 2.2 above, Hall (2011) found
that MFP growth for product innovators is around 2 percentage points higher in a range of studies from
Western Europe. Meanwhile, Palangkaraya et al. (2015) found a 6.5 percentage-point differential in the
returns to product innovation for Australian SMEs. As these international studies do not usually weight
by firm size, the results from Figure 4.2 of the paper are the most comparable. These results show no
statistically significant difference in MFP growth between product innovators and non-innovators
among New Zealand firms. This would appear to suggest that the returns to (product) innovation for
New Zealand firms are relatively low, and so provide a potential explanation for why New Zealand firms
invest relatively little in R&D. Nevertheless, as the results are not generated using the same approach
(i.e., the CDM approach), it is not possible to be conclusive.
10 Most of the literature implicitly assumes that increases in productivity will translate into higher profits. However, this depends on the extent to which
higher productivity allows the firm to lower costs or to produce a better product for which it can charge higher prices. Moreover, whether higher
productivity caused by innovation translates into higher profits depends on the costs imposed on the firm from engaging in innovation. Innovation is costly,
in terms of both the direct outlays necessary to develop new products or processes and the risks it poses to the firm’s business model. The productivity
measure accounts for the costs of inputs (including labour, capital, and raw materials) in the year in which the innovation is reported, but does not capture
innovation-related spending in years prior to introducing the innovation (e.g., R&D) or other innovation-related spending (e.g., market development) in the
years between when the initial innovation was introduced and when the outcome is measured.

Staff Working Paper 2017/2 27
References
Conway, P. (2016). Achieving New Zealand's productivity potential. New Zealand Productivity Commission Research Paper series, 2016/1. Wellington.
Conway, P., & Zheng, G. (2014, 05/06/2014). Trade over distance for New Zealand firms: measurement and implications. Staff working paper, (WP 2014/5).
Crawford, R., Fabling, R., Grimes, A., & Bonner, N. (2007). National R&D and patenting: is New Zealand an outlier? New Zealand Economic Papers, 41(1), 69-90.
Crepon, B., Duguet, E., & Mairesse, J. (1998). Research, Innovation And Productivity: An Econometric Analysis At The Firm Level. Economics of Innovation and New Technology, 7(2), 115-158. doi: 10.1080/10438599800000031
Criscuolo, C., Gal, P. N., & Menon, C. (2014). The Dynamics of Employment Growth: New Evidence from 18 Countries. OECD Science, Technology and Industry Policy Papers, (14). OECD Publishing.
de Serres, A., Yashiro, N., & Boulhol, H. (2014). An International Perspective on the New Zealand Productivity Paradox. Paper presented at the New Zealand Productivity Commission Working Paper, Wellington, New Zealand.
Di Maio, M., & Blakeley, N. (2004). Business Research and Development and Industry Structure. New Zealand Treasury.
Fabling, R., & Maré, D. C. (2015, Sep). Production function estimation using New Zealand’s Longitudinal Business Database. Motu Economic and Public Policy Research Working Papers, (15-15). Motu Economic and Public Policy Research.
Hall, B. H. (2011). Innovation and productivity. Nordic Economic Policy Review, 167.
Hall, B. H., Mairesse, J., & Mohnen, P. (2009). Measuring the Returns to R&D: National Bureau of Economic Research.
Jaffe, A., & Le, T. (2015). The impact of R&D subsidy on on innovation: a study of New Zealand firms. Motu Working Papers, (WP 15-08).
Lipsey, R. G., & Carlaw, K. I. (2004). Total factor productivity and the measurement of technological change. Canadian Journal of Economics, 37(4), 1118-1150. doi: 10.1111/j.0008-4085.2004.00263.x
Mairesse, J., Mohnen, P., & Kremp, E. (2005). The Importance of R&D and Innovation for Productivity: A Reexamination in Light of the French Innovation Survey. Annales d'Économie et de Statistique(79/80), 487-527. doi: 10.2307/20777586
Mazoyer, P. (1999). Analysis of R&D structure and intensities. Research Paper. Wellington.
Palangkaraya, A., Spurling, T., & Webster, E. (2015). Does innovation make (SME) firms more productive? Swinburne University of Technology.
Wakeman, S., & Le, T. (2015, June 2015). Measuring the innovative activity of New Zealand firms. New Zealand Productivity Commission Working Paper.