Embed Size (px)
Citation preview

THE RIGHT SIZE: THE HORMONAL AND TRANSCRIPTIONAL REGULATION OF GROWTH IN DROSOPHILA MELANOGASTER
By
Rewatee Hemant Gokhale
A DISSERTATION
Submitted to Michigan State University
in partial fulfillment of the requirements for the degree of
Biochemistry and Molecular Biology - Doctor of Philosophy
2017
ABSTRACT
THE RIGHT SIZE: THE HORMONAL AND TRANSCRIPTIONAL REGULATION OF GROWTH IN DROSOPHILA MELANOGASTER
By
Rewatee Hemant Gokhale
Regulation of final organ size is a complex developmental process involving the
integration of systemic, organ-specific and environmentally regulated processes. Together these
processes enable co-ordination of organ growth with body growth and the achievement of correct
organ size. Dysregulation in these processes causes over- or under growth of organs resulting in
compromised organ function. Understanding the mechanisms contributing to regulation of organ
size is therefore key to understanding organ function.
My research has focused on understanding two distinct aspects of developmental growth
control. Firstly, what role does systemic hormonal signaling play in regulating final organ size?
Second, what is the role of transcriptional regulation of the Insulin Receptor (InR) gene in
regulating final organ size? I have addressed these questions through a variety of genetic and
biochemical tools in the model system of the common fruit fly Drosophila melanogaster.
In order to understand the role of hormonal signaling, I used the model of the wing
imaginal disc to show that growth retardation in one part of the imaginal disc results in
coordinated reduction in growth rate in the unperturbed part. Further, I show that this is mediated
through systemic signaling by the insect hormone 20-hydroxyecdysone. Lastly, I demonstrate
that systemic ecdysone signaling interacts with organ-autonomous insulin signaling to mediate
growth coordination across the imaginal disc.
To understand the role of transcriptional regulation of InR, I generated transgenic flies
with increased dosage of InR. Using this transgenic fly line, I identified the minimal cis-

regulatory region of InR and the effects of increased dosage of InR on aspects of fly physiology.
I further show that the InR cis-regulatory region consists of multiple enhancers, which are
capable of driving tissue-specific reporter gene expression. Lastly, I outline a strategy to test the
role of modified transcriptional feedback to InR by the transcription factor dFoxo.
Together, my results would be of broad interest to developmental biologists and
contribute to our understanding of the mechanisms organ and body size regulation.

Copyright By
REWATEE HEMANT GOKHALE 2017

v
This thesis is dedicated to
My parents, Hemant Moreshwar Gokhale and Sarita Hemant Gokhale
My brother, Nachiket Hemant Gokhale, Without whose support and encouragement I would never have begun,
And
My husband, Jayesh Hariprasad Kakade,
Without whom I would never have finished.

vi
ACKNOWLEDGEMENTS
This dissertation would not have been possible without the support of both of my fantastic
mentors: Dr. Alexander Shingleton and Dr. David Arnosti. Each of them is uniquely brilliant in
their own way, and from observing both of them I have learned how to think scientifically,
approach a problem, and design appropriate experiments to test hypotheses. I would also like to
add that through many, many conversations with them, I have learned to look at any problem in
biology from opposite ends of the spectrum—from the molecular aspect to whole organismal
level. Needless to say, without their constant support (and needling!), this thesis would not have
been complete.
I would also like to acknowledge the members of my thesis committee: Dr. Lee Kroos,
Dr. Christina Chan, Dr. Kyle Miller and Dr. Jeff Mackeigan for their valuable input throughout
my PhD. Many thanks to the former members of the Shingleton lab here at MSU for providing
an excellent environment for the first half of my PhD, as well as the current and former members
of the Arnosti lab for many interesting conversations over the years. In particular, I would like to
thank my partners-in-crime Yiliang Wei and Anne Sonnenschein—all three of us joined the
Arnosti lab at the same time and it was very helpful having someone else in the same boat as me
throughout this time.
I was fortunate to be surrounded by some wonderful friends here at MSU, many of
whom were in the middle of finishing their graduate school degrees as well. Shared
conversations over coffee, long rants about failed experiments over a drink and shared
celebrations of Indian festivals together provided the much needed social fuel to finish this
thesis. I am glad to say that that the friendships formed here would last me lifelong.

vii
I would also like to take this opportunity to thank my extended family here in the US:
Dr. Mrunalini Dhamdhere and Dr. Jaydeep Kulkarni, and Dr. Ramesh and Seema Bhave for
being a home away from home. Lastly, none of this would have been complete without the
support of my amazing family—my husband Jayesh, who more often than not was my punching
bag at the end of a long day, my parents for their unflinching love and support, my brother for
many pearls of wisdom gained during his own doctoral studies, and my in-laws for their love and
blessings. I will always be grateful to them.

viii
TABLE OF CONTENTS
LIST OF TABLES x LIST OF FIGURES xi KEY TO ABBREVIATIONS xiii CHAPTER I: INTRODUCTION 1
Introduction 2 Signaling Pathways that Control Size 3
Insulin/IGF1-Signaling 3 Ras/Raf/MAPK-Signaling 6 TOR-Signaling 7 Hippo-Signaling 8 JNK-Signaling 9 Signaling pathways that control patterning 10
Aspects of Size Control 10 Growth Rate 11 Growth Duration 14 Target Size 18 Negative Growth 25 Systemic Growth Coordination 27
Natural variation in body size 31 Nutrition 32 Temperature 33 Oxygen 34
Summary 36 REFERENCES 38
CHAPTER II: INTRA-ORGAN GROWTH COORDINATION IN DROSOPHILA IS MEDIATED BY SYSTEMIC ECDYSONE SIGNALING 58
Abstract 59 Introduction 60 Materials and Methods 63
Drosophila stocks 63 Generation of mitotic clones 63 Measurement of wing imaginal disc growth in growth-perturbed larvae 64 20E treatment of larvae 64 Statistical Analysis 65
Results 65 Growth is coordinated between compartments within an organ 65 Ecdysone treatment results in a disruption of growth coordination between compartments 77 Growth coordination between compartments is disrupted by changes in EcR signaling 80 Growth coordination between compartments is disrupted by changes in Insulin-signaling 81

ix
Discussion 88 APPENDIX 95 REFERENCES 103
CHAPTER III: IN-VIVO CHARACTERIZATION OF THE INR REGULATORY LOCUS IN DROSOPHILA 108
Introduction 109 Materials and Methods 110
Fly Stocks 110 Generation of transgenic flies 111 qPCR analysis of mRNA from transgenic flies 111
Results 112 Genomic rescue construct identifies regulatory regions of InR 112 Evidence for tissue-specific enhancers of InR 112
Discussion 115 APPENDICES 123 APPENDIX I: Characterization of INR-BAC flies 124 APPENDIX II: Transgenic fly system to assess the effect of dFOXO feedback to InR 128 REFERENCES 136
CHAPTER IV: CONCLUSIONS AND FUTURE PERSPECTIVES 141
Integration of systemic and organ-autonomous mechanisms in organ size regulation 142 The role of feedback regulation in organ size regulation 149 Organ size regulation: a mammalian perspective 151 Organ size regulation: perspectives for future research 157 REFERENCES 158

x
LIST OF TABLES
Table 3-1 Expression details of reporter fragments tested in this study 118
Table 3-2 Primers and oligos used in vector construction 135

xi
LIST OF FIGURES
Figure 1-1 Size regulatory signaling pathways 4 Figure 1-2 Physiology and the control of size in Drosophila 17 Figure 1-3 Models of target size regulation in Drosophila wing imaginal discs 20 Figure 2-1. Growth is coordinated among compartments within imaginal discs. 67 Figure 2-2. Generation of mitotic clones in the anterior compartment 70 Figure 2-3. Growth is coordinated in antslow:postfast discs 72 Figure 2-4: Repeated determination of ontogenetic allometry in WT and antfast:postslow discs. 73 Figure 2-5: Imaginal disc growth is retarded in en>Rps3.RNAi larvae 75 Figure 2-6. 20E treatment disrupts growth coordination between compartments in antfast:postslow
larvae. 78 Figure 2-7. EcR knockdown in the anterior compartment disrupts growth coordination in WT larvae 82 Figure 2-8. InR expression is necessary but not sufficient to disrupt intra-organ growth coordination. 83 Figure 2-9 Compartment autonomous changes in IIS have reduced effect on final anterior:posterior ratio in antslow:postfast discs 87 Figure 2-10 Compartment autonomous modulation of Thor expression does not disrupt intra-organ growth coordination 97 Figure 2-11 Compartment autonomous modulation of dFoxo expression does not disrupt intra-organ growth coordination 101 Figure 3-1 An 80kbp cis regulatory region is sufficient to rescue InR mutants 113 Figure 3-2 Regulatory landscape of the InR locus 116 Figure 3-3 Adult and larval expression of UAS-GFP reporters 119 Figure 3-4 Phenotypic Analysis of InR-BAC transgenic flies 127

xii
Figure 3-5 Transgenic system to test the role of dFoxo feedback 131 Figure 4-1 Systemic signaling pathways regulating body and organ growth during development in Drosophila melanogaster 146

xiii
KEY TO ABBREVIATIONS
20E 20 hydroxyecdysone
cDNA complementary deoxyribonucleic acid
ci cubitus interruptus
DNA deoxyribonucleic acis
FLP flippase
FOXO Forkhead box, sub-group O
FRT flippase recongnition target
IIS Insulin/Insulin-like growth factor (IGF) Signaling
JNK c-Jun N-terminal kinase
MAPK Mitogen Activated Protein Kinase
RNA ribonucleic acid
TOR Target of Rapamycin
WT Wild Type

1
CHAPTER I: INTRODUCTION
1Part of the work described in this chapter is used in the following manuscript: Gokhale, R. H., &
Shingleton, A. W. (2015). Size control: the developmental physiology of body and organ size
regulation. Wiley Interdisciplinary Reviews: Developmental Biology, 4(4), 335-356

2
Introduction
Body size is perhaps the most fundamental of phenotypic traits. Body size impacts multiple
aspects of an animal’s biology, from its anatomy and physiology, to its behavior and ecology.
The control of body and organ size is therefore a key developmental process that ensures an
animal grows to a body size that is characteristic of its species and where the size of individual
organs matches the size of the body as a whole . Research over the last two decades has revealed
a multitude of signaling pathways, genes and hormones that regulate body and organ size in
response to environmental and developmental perturbations. Misregulation in these pathways
results in multiple pathologies, from dwarfism and gigantism, to hypo-and hyperplasia of
individual organs, to cancer. Understanding the mechanisms contributing to regulation of size is
therefore, key to understanding function.
Much of what we know about size regulation has been elucidated in non-mammalian model
organisms, in particular the fruit fly Drosophila melanogaster. These studies have revealed the
crucial role of developmental nutrition and hormone signaling in regulating organ growth.
However, we still lack a clear understanding of the organ specific mechanisms that contribute to
growth regulation in response to these systemic inputs. The goal of my thesis research is to
bridge this gap and understand these key aspects of organ-specific growth control in D.
melanogaster.
Before I describe my efforts to address these questions, I provide in the following chapter an in-
depth review of the current state of knowledge of size regulation. I first outline the signaling
pathways involved in size control and then detail how these pathways regulate five aspects of
size control (i) growth rate, (ii) growth duration, (iii) target size, (iv) apoptosis, and (v) systemic
growth coordination. Finally, I describe how these aspects relate to natural variation in body size

3
observed between and within species. I would like to point out, however, that while I discuss
each of these size control aspects individually, they do not function completely independent of
each other. For example, growth duration may be regulated in part by growth rate. Size control
therefore involves integration and crosstalk at every level of organization in a growing animal.
Moreover, while most of the research described below was conducted in D. melanogaster, size
regulatory mechanisms are highly conserved among animals, and therefore, the concepts and
mechanisms the research reveals apply broadly to animals in general, including humans. For
simplicity and where possible I use the mammalian gene nomenclature.
Signaling Pathways that Control Size
A number of signaling pathways have been shown to regulate growth rate, growth duration and
final body and organ size. Figure 1-1 illustrates the key components of these pathways and how
they are integrated, but is by no means comprehensive. These pathways have been well described
elsewhere, however, and I will point the interested reader to relevant reviews. Nevertheless, a
brief introduction of the major components of each pathway is necessary to fully understand how
they interact to control growth regulatory processes.
Insulin/IGF1-Signaling
The Insulin/Insulin-like growth factor (IGF) Signaling (IIS) pathway regulates growth in
response to insulin-like growth factors that are, in part, released in a nutrition-dependent manner
(Figure 1-1A). Insulin-like Growth Factors bind to the IGF1 receptor (IGF1R) of dividing cells,
which initiates the phosphorylation of the Insulin Receptor Substrate (IRS). IRS
phosphorylation recruits the PhosphoInositide 3-Kinase (PI3K) to the membrane and the
resulting complex phosphorylates membrane-bound PI(4,5)P2 to PI(3,4,5)P3. This then binds
Phosphoinositide-Dependent Kinase (PDK) and Akt to the membrane and leads to the

4
Figure 1-1 Size regulatory signaling pathways
(A) The insulin/IGF1-signaling (IIS) pathway. (B) The RAS/RAF/MAPK-signaling pathway.
(C) The TOR-signaling pathway. (D) The Hippo-signaling pathway. (E) The JNK-signaling
pathway. Transcribed growth factors targeted by MAPK, Hippo and JNK-signaling pathways
include secreted factors, protein synthesis and cell-cycle regulators and anti-apoptotic factors.
Note that any individual growth factor may be regulated by only one pathway. IGF1R: Insulin-
Growth Factor 1 Receptor; Pi3K: Phosphatidylinositol-4,5-bisphosphate 3-kinase; IRS: IGF1R
Substrate; PIP2/3: Phosphatidylinositol bi/triphosphate; GSK3: Glycogen Synthase Kinase 3;
FOXO1: Forkhead transcription factor 1; SHC: Src Homology 2 domain Containing protein;
Grb2: Growth factor receptor-bound protein 2; SOS: Son-Of-Sevenless; MEK:
Mitogen/Extracellular signal-regulated Kinase; MAPK: Mitogen-Activated Protein Kinase;
TSC1/2: Tuberous Sclerosis proteins 1/2; Rheb: Ras homolog enriched in brain; AMPK: 5'
Adenosine Monophosphate-activated Protein Kinase; TOR: Target of Rapamycin; mLST8:

5
mammalian Lethal with SEC13 protein 8; S6K: Ribosomal protein S6 kinase beta-1; Crb:
Crumb; Mer: Merlin; Ex: Expanded; Sav1: Salvador; Mats: Mob as tumor suppressor; Yki:
Yorkie; Sd: Scalloped; TNFR: Tumor Necrosis Factor Receptor; GPCR: G Protein-Coupled
Receptors; RTK: Receptor Tyrosine Kinase; MAPKKK: MAPK Kinase Kinase; MKK4/7: Dual
specificity Mitogen-activated protein Kinase Kinase 4/7; JIP: JNK-Interacting Protein; TF:
Transcription Factor.

6
phosphorylation of Akt 1-5.PI3K/Akt can also be activated by other receptors, including the
Fibroblast Growth Factor Receptor (FGFR), Epidermal Growth Factor Receptor (EGFR) family
receptors, and interleukin receptors 6-8. Akt is a phosphokinase and has a number of downstream
targets, FOXO1 and TSC2 being amongst the more important ones. Activated Akt is transported
to the nucleus where it phosphorylates and deactivates the forkhead transcription factor FOXO19-
11, a negative regulator of growth which targets the expression of myriad growth regulators 12.
Akt also regulates the TOR signaling pathway by phosphorylation of TSC2, thereby inactivating
the TSC1/2 complex (see below) 13-17. For a more detailed review of the IIS-pathway see 18, 19.
Ras/Raf/MAPK-Signaling
Binding of insulin-like growth factor to IGF1R also initiates the phosphorylation of a second
substrate, Shc 20, 21 (Figure 1-1B). Upon phosphorylation, Shc binds Grb2, which is complexed
with SOS. This brings SOS to the membrane, where it activates Ras through binding of GTP.
Ras activation in turn activates Raf kinase, which phosphorylates and activates MEK1/2, which
phosphorylates and activates MAPK 20, 21. Activated MAPK then either regulates targets in the
cytosol or is translocated to the nucleus where it phosphorylates a number of transcription
factors, both activating and suppressing their activity 22. A number of other receptor tyrosine
kinases can also activate Ras, including epidermal-, fibroblast-, and vascular endothelial-growth
factor receptors 23. The role of Ras/Raf/MAPK signaling on size regulation is complex and
context dependent. For example, while many of the nuclear and cytosolic targets of
Ras/Raf/MAPK are regulators of cell-cycle progression, over-expression of activated Raf
proteins can lead to such diverse responses as cell growth, cell cycle arrest or even apoptosis, as
well as the expression of autocrine and paracrine growth factors 23. This complexity is
compounded by the fact that there is considerable crosstalk between Ras/Raf/MAPK and other

7
growth regulatory pathways. For example, Ras can also activate Pi3K 24, while Akt can inhibit
the activity of Raf 23. For more details about the MAPK signaling pathway see 25.
TOR-Signaling
Like the Insulin/IGF1-signaling pathway, the TOR-signaling pathway also regulates growth with
respect to nutrition, cellular energy and oxygen (Figure 1-1C). At the centre of the pathway is the
Target of Rapamycin (TOR), so called because mutations of TOR confer resistance to the growth
inhibitory effects of rapamycin. TOR forms two complexes, TORC1 and TORC2, both of which
have kinase activity. Signaling through TORC1 is better understood than signaling through
TORC2.
TORC1 has two key targets that regulate growth: 4EBP and the p70 ribosomal protein S6 Kinase
(S6K). 4EBP suppresses growth by inhibiting eIF4E, a translational initiation factor.
Deactivation of 4EBP by TORC1 therefore promotes growth by de-repressing protein synthesis.
At the same time, TORC1 promotes translation and growth more directly by phosphorylating and
activating S6K, a regulator of ribosomal protein production. In addition to its effects on 4EBP
and S6K, TORC1 indirectly promotes the translation of additional growth regulators, including
cyclin D126, HIF-1α (see below) and c-Myc27. For more details of TORC1 signaling see 28.
TORC2 signaling is less well elucidated. The best-characterized function of TORC2 is the
phosphorylation and activation of Akt 29, 30. In contrast to TORC1, TORC2 is positively
regulated by TSC1/2 (itself negatively regulated by Akt, Figure 1-1A), which binds directly to
the TORC2 complex and is required for its activation 31. In yeast and mammals, TORC2 is
involved in actin cytoskeleton organization of the cell and so may be involved in regulating
spatial aspects of cell growth 32. For more details of TORC2 signaling see 33.

8
Hippo-Signaling
Hippo-signaling is the most recent addition to the family of signaling pathways that are involved
in size control (Figure 1-1D). At the core of the pathway is Hippo (Mst1/2 in mammals),
Salvador (Sav1 in mammals), Warts (Lats1/2 in mammals), and Mats (Mob1A/B in mammals).
When active, MST1/2 binds Sav1 and together they phosphorylate Lats1/2 and its co-factor
Mob1A/B, stimulating Lats1/2 kinase activity 34-36. Active Lats/Mob then phosphorylate the
downstream effectors YAP and TAZ – which have a single homolog Yorkie (Yki) in Drosophila
– and inhibits their activity as transcriptional coactivators 37-41. In mammals, the major binding
partners of YAP/TAZ are four TEA-domain-containing proteins (TEAD1-4), while in
Drosophila the major binding partner of Yki is Scalloped (Sd), the single homolog of TEAD1-4
42-46. Yap/Taz/TEAD1-4 (or Yki/Sd in Drosophila) promotes transcription of a number of
growth-regulating genes, including cyclin E, Myc and the microRNAi bantam in Drosophila. 47-
49. Thus Hippo-signaling regulates growth by inhibiting the activity of growth-promoting
YAP/TAZ and Yki. Consequently, loss of Mst1/2 or Hippo or over-expression of YAP or Yki in
individual organs leads to overgrowth 37, 50, 51, although this is highly tissue-specific52.
While the core of the Hippo-signaling pathway and many of the genes that it regulates have been
relatively well elucidated, its upstream regulation is less clear. What is known has been largely
elucidated in Drosophila and suggest that Hippo-signaling appears to regulate growth in
response to a variety of different cell-cell interactions53. For example, the interaction of Fat and
Dachsous at the surface of neighbouring cells appears to negatively regulate growth by activating
Warts via Dachs and the Expanded (Exp)/Merlin (Mer)/Kibra complex54-57. The transmembrane
protein Crumbs (Crb) also regulates Warts, as do a number of other membrane associated
proteins including Lethal giant large (Lgl), which organizes apical-basal cell polarity 58, and

9
Ajuba (Jub), a protein that localizes to adherens junctions upon cell-cell contact 59, 60 . For a
more details of the Hippo signaling pathway see 61.
JNK-Signaling
The JNK-signaling pathway functions mainly in response to cellular stress 62 (Figure 1-1E). The
JNK pathway is a mitogen activated protein kinase pathway (MAPK), with the c-Jun Kinase as
its terminal activator 63. The JNK pathway is conserved from flies to mammals, and is crucial in
regulating cell death, tissue regeneration, wound healing and many other morphogenetic
processes 64. In mammals, there are three JNK proteins encoded by the genes jnk1, jnk2, and
jnk362, 63. JNK signaling is perhaps the most complex MAPK signaling pathway, owing mainly
due to its number of inputs. These include, but are not limited to, Tumor Necrosis Factor-
signaling (TNF/TNFR)65, 66, Platelet Derived Growth Factor-Signaling (PDGF/PDGFR)67 and
Wnt-signaling68, 69. Signaling through the JNK pathway is initiated via small GTPases of the Rho
family (Rac, Rho, cdc42)70, 71. This leads to the phosphorylation and activation of MAPKKKs
such as MEKK1-4, Apoptosis Induced Kinases (ASKs)) and Mixed Lineage Kinases (MLKs)72,
73. These activate the MAPKKs MEK4 and MEK7, which phosphorylate and activate
JNK1/2/3(72). Activation of JNKs also depends on the scaffold proteins JIP1-374-76.
Phosphorylation of JNK1/2/3 causes their activation and translocation to the nucleus where they
phosphorylate and activate transcription factors such as c-Jun 63, 77, Fos78, and p5379, 80, among
others. An important class of proteins that are phosphorylated by JNKs are anti-apoptotic
proteins such Bcl2 73, 81 and heat shock proteins such as Hsf1 62. However, JNK also plays an
important role in regulating growth in response to stress, in particular as a result of tissue damage
and localized growth perturbation 64, as discussed below. For a more detailed review of the JNK
pathway see 72.

10
Signaling pathways that control patterning
Another group of pathways that contribute to the final size of an individual are those involved in
tissue patterning. Patterning pathways regulate overall organ shape and the number and
organization of each individual cell type within a tissue. Deregulation of these pathways result in
changes in the overall shape and patterning of organs, with corresponding changes in cell growth
and proliferation. Patterning genes relay positional information to cells in a tissue by either
forming a diffusible protein gradient (as in the case of Hh, Wnt and TGF-beta signaling in
imaginal discs in Drosophila) or via cell-cell interactions (as in the case of Notch-signaling and
Fat-Dachsous signaling). These pathways then regulate growth by interacting with canonical
growth-regulatory pathways, although the details of these interactions are poorly understood.
Nevertheless, because of their central role in development, the major components of patterning
pathways and how they function have been very well elucidated. For more details see 82-84
Aspects of Size Control
While the pathways described above all regulate cell growth and proliferation, this is not
sufficient to explain how they control size. Understanding body size regulation requires an
appreciation of the physiological and developmental context within which cells grow and
proliferate. At a very basic level body size is the product of growth rate and growth duration.
Growth rate is regulated by signaling pathways that control the rate of cell growth and
proliferation. Growth duration is regulated by systemic hormonal signals that coordinate the
cessation of growth across the whole body, as well as by organ-autonomous processes that
ensure organs stop growing when they achieve their final size. Body size is not only regulated by
positive growth, however, but also by negative growth, and there is increasing evidence that
apoptosis plays a major role in size control. Finally, all these processes must be coordinated

11
across the body to ensure that each organ achieves its correct final size by the end of
development. The remainder of this chapter will deal with each of these different aspects of size
control and how they are regulated by the pathways detailed above.
Growth Rate
Organismal growth rate is regulated by the processes that control the rate of cell growth and cell
division. Over a given time period, an increase in the rate of cell growth and division will result
in an increase in final cell size and number, leading to an increase in final body and organ size.
Nevertheless, the relationship between the rate of cell growth and division and final cell size and
number will depend on how the rates of cell growth and division are coordinated 85. Changes in
the rate of cell growth but not division will increase final cell size but not cell number. In
contrast, changes in both the rate of cell growth and cell division, in parallel, changes cell
number but not cell size. Historically, there has been a tendency to confound ‘cell growth’ with
‘cell division’. However, the processes that control cell growth and division are distinct, albeit
coupled during normal development.
Cell growth requires the accumulation of cellular mass. Apart from water, ions and small
molecules (~75% of cell mass), protein is the largest component of the cell, comprising ~18% of
total cell mass in animals 86. Cell growth is therefore intimately linked to the synthesis of
proteins, and perturbations of the mechanisms that regulate protein synthesis affect cell and
organismal growth rate. One example of this is Minute mutations in Drosophila. These mutations
were originally identified as a series of genetic factors that reduce the rate of development 87.
Further analysis indicated that they reduce cellular and organismal growth rate (and the rate of
cell division) by reducing the expression of ribosomal proteins and hence reducing the rate of
translation and protein synthesis 88. Despite their name, however, Minute mutations do not

12
typically affect final body and organ size or cell size, indicating that changes in growth at a
cellular level are not necessarily sufficient to affect final body size. This appears to be because
the duration of growth is extended to compensate for the reduction in growth rate 87.
Apart from mutations that affect the rate of translation directly, cellular growth is also affected
by factors that regulate and respond to the quantity of amino acids available for protein synthesis.
As discussed above, the central regulator of cell growth with respect to cellular amino acids is
the TOR signaling pathway, via TORC1 89-93 (Figure 1-1C). Of course, cellular growth requires
more than just amino acids and TOR signaling also responds to the level of cellular energy, via
AMPK 94, 95; and oxygen level, via AMPK and REDD (REgulated in Development and DNA
damage responses) protein 96-98; as well as systemic nutrient levels via the IIS and Akt, which
negatively regulates TSC1/2, an inhibitor of TOR 99-101 (Figure 1-1A & B). Unlike direct
perturbations of the protein synthesis machinery, changes in TOR-signaling also affect final
body and organ size 15. In the case of perturbation of S6K, these changes are through effects on
cell size: Drosophila deficient in S6K are reduced in size through a reduction in cell size rather
than cell number, while S6K-mutant mammalian cells are also reduced in size 102, 103.
IIS also regulates growth with respect to nutrition, although unlike TOR-signaling, this
regulation is hormonal, through the nutrition-dependent release of insulin-like peptides 100, 104, 105.
As mentioned above, IIS influences TOR-signaling via Akt and TSC1/2, and so the effects of IIS
on size are partially mediated by TOR-signaling. IIS additionally regulates the rate of cell
proliferation, however, and animals in which IIS is perturbed are reduced in size both through a
reduction in cell size and cell number 106. In Drosophila these effects on cell number appear to be
mediated by FOXO: up-regulating FOXO expression in specific organs reduces their size
through a reduction in cell number but not cell size, while down-regulating FOXO expression

13
has the opposite effect 9-11 . Thus it appears that, in Drosophila at least, cell size and cell number
are regulated independently, the former through TOR/S6K and the latter through insulin/FOXO.
This is unlikely to be the case. A reduction in cell number but not size requires a parallel
reduction in both the rate of cell growth and cell proliferation so both processes must be affected
by FOXO in Drosophila 85. Rather, it seems likely that signaling via S6K and FOXO have
differential effects on the relative rates of cell growth and proliferation, with corresponding
effects on final cell size and cell number 85. Interestingly, moderate reductions in insulin/IGF-
activity in Drosophila affect cell size alone, while more severe reductions also reduce cell
number 107. Thus it is possible that the rate of cell growth is more sensitive to changes in
insulin/IGF-signaling than the rate of cell proliferation, at least in Drosophila.
Cell growth and proliferation are controlled by a conserved family of kinases called cyclin
dependent kinases (CDKs) and their binding partners called cyclins. Cyclins and CDKs regulate
progression through the cell cycle by regulating the G1-S and G2-M transitions. With the lone
exception of yeast, all eukaryotes have multiple cyclins and CDKs and the activity of these
proteins ultimately regulates the rate of cell growth and division, which in turn affects tissue and
organ size. A number of cell cycle regulators have been shown to play an important role in size
control. Prominent among these are myc, cyclin D, cyclin E and Cdk1. In Drosophila, targeted
overexpression of dMyc, the homologue of the c-myc oncoprotein in mammals, has been shown
to cause organ overgrowth 108, while loss of dMyc inhibits body growth 109. Myc is a
transcription factor that promotes the expression of multiple growth regulators, and positively
regulates ribosome biogenesis and hence global protein synthesis 110 as well as global
transcription 111, 112. Myc therefore regulates multiple growth-regulatory processes (see below).
However, in the context of cell cycle progression Myc functions, in part, by inducing the

14
expression of Cyclin E, Cyclin D and Cdk4. These proteins inhibit the activity of the Drosophila
Retinoblastoma-family protein (Rbf), and thereby promote the G1-S transition 109, 113-115.
Overexpression of Cyclin D/Cdk4 promotes cellular growth in Drosophila tissues, although this
growth is context-dependent. For example in proliferating imaginal tissue, overexpression results
in hyperplasia (increase in tissue volume due to increase in cell proliferation), without any effect
on cell size; however overexpression in endoreplicating salivary glands results in hypertrophy
(increase in tissue volume due to increase in cell size) and concomitant cell enlargement 116.
Conversely, flies (and mice) lacking Cdk4, while viable, show a significant reduction in body
size 117, 118. Cyclin E, Cyclin B and Cyclin A are also negatively regulated by components of the
Hippo pathway. For instance, in Drosophila, Sav, Wts and Hpo negatively regulate Cyclin E
while Wts negatively regulates Cyclin A and cyclin B 47, 119, 120. Consequently, these cell cycle
regulators are elevated in Hippo pathway mutants, likely contributing to the massive tissue
overgrowth of these mutants 121, 122.
There are many other genes and pathways that regulate cell growth and proliferation. However,
like Minute mutations, changes in the expression and activity of these genes do not influence
final body and organ size because of compensatory mechanisms that mitigate their effects. These
compensatory mechanisms are discussed in more detail towards the end of this chapter.
Growth Duration
Changes in cellular rates of growth and proliferation while necessary to control size are not in
themselves sufficient. Ultimately, variations among individuals and species in body size are due
to changes in the size and number of cells, which is also regulated by the period of growth. It is
not a surprise perhaps that the pathways that regulate growth rate are also involved in regulating
the duration of growth. As with many aspects of size control, the regulation of growth duration is

15
best understood in Drosophila and so the emphasis here will be on what is understood in this
insect. Nevertheless, it is increasingly clear that similar mechanisms are employed in many
animals, not just Drosophila.
Drosophila is a holometabolous insect that grows through three larval instars before pupating
and metamorphosing into its final adult form. Because the hard exoskeleton of adult fruit flies
prohibits additional growth, the final size of the adult is largely (but not entirely) determined by
the size of the larva at the point at which it stops feeding and growing and begins to search for a
pupation site, called larval wandering. While larval wandering occurs at the end of the larval
period, the decision to pupate is made much earlier in development and is associated with the
attainment of a particular body size, called critical size, at the beginning of the third larval instar
123-125 (Figure 1-2). Attainment of critical size is accompanied by the initiation of a hormonal
cascade that ultimately causes the release of the steroid hormone ecdysone 126, 127 (Figure 1-2A).
Ecdysone is synthesized in a series of ever increasing pulses, with each pulse being associated
with a particular developmental transition essential to metamorphosis 126 (Figure 1-2B). For
example, there is a peak in ecdysone levels at the cessation of larval feeding and the initiation of
larval wandering, and a later larger peak that initiates pupation itself. Since larvae continue to
grow after attainment of critical size but stop growing at larval wandering, the final size of the
larvae is controlled by the critical size plus the amount of growth achieved in the period between
critical size and larval wandering, called the Terminal Growth Period (TGP)107 (Figure 1-2C).
The amount of growth during the TGP is in turn regulated by the duration of the TGP and the
rate of growth during the TGP. It is within this physiological context that the processes that
regulate growth rate at a cellular level affect final body and organ size. For example, systemic
changes in insulin/IGF-signaling do not affect critical size or (substantially) the duration of the

16
TGP but reduce growth rate during the TGP, thereby reducing final body and organ size 107. In
contrast, perturbations in ribosomal function also slow growth rate but delay the synthesis of
ecdysone, largely eliminating any effect on final body and organ size 128.
The precise mechanism by which larvae recognize they have reached their critical size is poorly
understood (although see 129), but the signaling pathways that regulate ecdysone synthesis and
respond to attainment of critical size have been well elucidated. Changes in IIS, TOR-signaling
and RAS/RAF/MAPK signaling in the prothoracic gland alone cause larvae to initiate
ecdysteroidogenesis at an inappropriate size (Figure 1-2A). For example, up-regulating
insulin/IGF- and RAS/RAF/MAPK-signaling in the prothoracic gland causes a reduction in
critical size, so that larvae metamorphose prematurely at a small size 127, 130, 131. Down regulating
these pathways in the prothoracic gland has the opposite effect 127, 130, 131. In contrast, changes in
TOR-signaling in the prothoracic gland does not appear to affect critical size itself but appear to
influence the timing of the subsequent peaks in ecdysone, altering the duration of the TGP and
hence final body and organ size 132 (although see 133). An important observation as to the
function of these pathways in controlling the cessation of growth is that their effects on critical
size and TGP are observed when the pathways are perturbed in the prothoracic gland alone. This
suggests that insulin/IGF-, TOR- and RAS/RAF/MAPK-signaling in the prothoracic gland links
ecdysone synthesis to whole-body physiology so that ecdysone is synthesized at the
developmentally-appropriate time. Each pathway appears to communicate different types of
information to the prothoracic gland 134. The insulin/IGF- and TOR-signaling pathways appear to
communicate nutritional status, delaying metamorphosis when a larva is poorly fed and
accelerating it when a larva is well fed 127, 130. This delay is mediated by the interaction of
Ultraspiracle, the binding partner of Ecdysone receptor, with FOXO, part of the IIS pathway

17
Figure 1-2 Physiology and the control of size in Drosophila
(A) The synthesis of ecdysone by the prothoracic gland is positively regulated by several
signaling pathways, including IIS pathway, the RAS/RAF/MAPK-signaling pathway (blue
arrow) and the TOR-signaling pathway (green arrow). Ecdysteroidogenesis is also negatively
regulated by dILP8, and autoregulated by ecdysone via dynamic positive and negative feedback
loops (red arrows). (B) Developmental transition are driven by peaks of ecdysone. These
transitions include larval molts, attainment of critical size, the cessation of feeding (and growth)
and pupariation. IIS and RAS/RAF/MAPK-signaling regulates the timing of the critical size
ecdysone peak, while TOR-signaling regulates the Terminal Growth Period between the critical
size peak and the ecdysone peak that stops feeding. (C) Final body size is therefore regulated by
the size of the larva at critical size plus the amount of growth achieved during the TGP.

18
(Figure 1-1A) 135. In contrast, the RAS/RAF/MAPK pathway (Figure 1-1B) is regulated by
prothoracicotropic hormone (PTTH), which is released in a series of pulses from the larval brain
and may communicate temporal information to the prothoracic gland 136, 137. Each of these
pathways appears to increase ecdysteroidogenesis to the point where ecdysone starts to regulate
its own synthesis. This autoregulation involves a series of dynamic positive and negative
feedback mechanisms that generate the steroid oscillations responsible for growth cessation and
developmental maturation 138. The critical size phenomenon therefore appears to represent the
point at which ecdysteroidogenesis switches from being regulated by insulin/IGF- and
RAS/RAF/MAPK-signaling, to being autoregulated.
Target Size
Although changes in the rate and duration of growth can lead to changes in the size of the body
as a whole and of the organs within it, there is also considerable evidence that organs ‘know’
what size they need to be and stop growing once that size is achieved. The concept of a target
organ size is supported by the observation that fetal kidneys in rats and wing imaginal discs in
Drosophila, when cultured in the bodies of their respective adult hosts, autonomously grow to
their WT size 139-141. Similarly, when part of a liver is removed in vivo, the remaining tissue re-
grows to its previous size 142. Finally, slowing cell proliferation in a single developmental
compartment in a Drosophila wing imaginal disc reduces the number of cells in the compartment
but not, surprisingly, compartment size. Rather, the cells grow larger to ensure that compartment
size is maintained 143.
The developmental mechanisms that are hypothesized to regulate target size have fallen in to two
classes: mechanisms that regulate target size by patterning genes and mechanisms that regulate
target size by physical force. As with many aspects of size control, these hypotheses have been

19
developed to address the question of size control with respect to developing Drosophila, and
specifically the wing imaginal disc.
Patterning genes include short-range graded paracrine signals, called morphogens, and the
signaling pathways that produce and respond to them 82. The two most important patterning
genes in the wing imaginal discs are the morphogens Decapentaplagic (Dpp) and Wingless (Wg).
Dpp is synthesized by cells along the anterioposterior boundary of the wing 114, 144-146 while Wg
is synthesized by cells along the dorsoventral boundary of the wing 147, 148. Both morphogens
spread laterally and generate a gradient that defines the area that will be come the wing blade.
Loss of either of these morphogens leads to a severe reduction in wing size 114, 149-153. Indeed, the
size difference between the wing and the haltere in Drosophila is due to differences in Dpp
signaling 154. The halteres are a second pair of wings that have been modified to form small club-
like appendages used as gryoscopes during flight. They are defined during development by the
expression of a Hox gene Ultrabithorax (Ubx) in the cells of the haltere imaginal disc 155, 156,
which restricts the spread of Dpp by downregulating Dpp expression and upregulating
expression of the Dpp receptor thickvein 154. The result is a reduction in the size of the Dpp
gradient, limiting its mitogenic effects and reducing the number of haltere cells to approximately
one fifth the number in the wings.
The observation that wing size is regulated by the expression and spread of morphogens has led
to the hypothesis that it is the dimensions of the morphogen gradient that defines target size 157.
The most basic model proposes that the concentration of Dpp is fixed at the anterioposterior
boundary and at the lateral edge of the disc. Consequently, as the disc grows the Dpp gradient
becomes flatter and growth stops when the Dpp gradient drops below a particular level (Figure
1-3A & A’) 157. This original model has subsequently been modified in a variety of ways to

20
Figure 1-3 Models of target size regulation in Drosophila wing imaginal discs
(A) Under the morphogen gradient model disc growth is maintained whilst a morphogen gradient
is maintained. At a cellular level, there is evidence that the Dpp gradient generates opposing
gradients of Fj and Ds. This in turn may lead to the asymmetrical activation of Fat, which frees
Dachs to inhibit Warts, de-repressing Yki and promoting cell growth and proliferation. (A’)
When the gradient becomes sufficiently flat at target size, symmetrical activation of Fat inhibits

21
Warts, allowing Warts to deactivate Yki and suppress cell growth and proliferation. (B) Under
the Shraiman model, growth in the center and the periphery of the disc is driven by the
morphogen gradient, as in (A). (B’) Growth stops when cells at the periphery of the disc grows
beyond the morphogen gradient, inhibiting their proliferation and imposing a compressive force
on the cells at the center of the disc (grey arrows), stopping their growth also. (C) Under the
Aegerter-Wilmsen model, growth in the center of the disc is driven by the morphogen gradient
while growth at the periphery is driven by the stretch imposed by cell proliferation at the center
of the disc (black arrows). (C’) Growth stops when compression at the center of the disc imposed
by the peripheral cells overcomes the growth-promoting effects of the morphogen gradient,
which in turn eliminates stretch at the periphery of the disc, stopping cell growth and
proliferation there also.

22
accommodate new evidence regarding the shape of the Dpp gradient and how it changes with
disc size 158-160. There is some evidence that cells are able to detect and show a proliferative
response to a gradient of Dpp, through Dpp generating opposing gradients of Dachsous (Ds) and
Four-jointed (Fj) expression, with Ds expressed highest at the periphery of the wing disc and Fj
expressed highest medially (Figure 1-3A & A’) 55, 161. Both Ds and Fj regulate Hippo signaling
via Fat (Ds as a ligand for Fat and Fj as a Golgi kinase that modulate Ds/Fat binding) and
juxtaposition of cells expressing different levels of either Ds or Fj induces elevated level of cell
proliferation, as measured by BrDU incorporation 55. Although binding of Ds to Fat inhibits
proliferation by activating Warts, it is thought that, if Fat is activated asymmetrically in a cell, it
leads to the asymmetric cellular localization of Dachs. This allows Dachs to locally promote the
degradation and inactivation of Warts and thereby stimulate growth 55 (Figure 1-3).
Consequently, as a disc grows and the Dpp gradient is lost, the resulting loss of asymmetry in
both Fat activation and Dachs cellular localization leads to a cessation in cell proliferation. This
is supported by the observation that uniform expression of Fj and Ds inhibit cell proliferation and
growth 55. However, additional research suggests that the juxtaposition of cells with different
Dpp-signaling levels is not necessary to drive proliferation 162 and that the asymmetrical
localization of Dachs is maintained even when Dpp-signaling is uniform 163. These observations
suggest that the Dpp and Ds/Fj gradients are generated independently but act together to generate
uniform cell proliferation across the imaginal disc 163. Nevertheless, what role both systems play
in regulating final organ size, if any, is unclear, particularly since the temporal dynamics of the
gradients have not yet been fully elucidated 160.
Models of target disc size that implicate patterning genes are based on the evidence that growth
is promoted and maintained by Dpp, Wg and Vg. These proteins form a gradient of
23
concentration across the wing disc, yet the average growth rate across the area of the wing disc is
remarkably uniform 159, 164 (although there does appear to be elevated levels of cell proliferation
at the center of very young wing discs, 165). A pair of conceptually similar models has been
proposed to reconcile this apparent paradox and also account for the termination of growth and
achievement of target size at the end of development 164, 166 (Figure 1-3B & C). Both of these
models assume that the wing imaginal disc functions essentially as a rigid solid with little to no
rearrangement of cells during development. Morphogen-promoted cell proliferation in the center
of the wing disc therefore causes cells in the center to push against surrounding cells. This results
in two different mechanical forces being set up in the organ. Firstly, a stretching force is exerted
on the surrounding peripheral cells by the proliferating central cells. Secondly, these peripheral
cells then exert a compressive force back to the cells in the center of the disc, which tends to
inhibit their proliferation. Growth at the center of the wing ceases when morphogen-promoted
growth can no longer overcome the inhibitory effect of compression by surrounding cells. These
two models differ on what causes proliferation of the peripheral cells. The Shraiman model
attributes it to the Dpp morphogen gradient experienced by the peripheral cells 166 (Figure 1-3B
& B’). The Aegerter-Wilmsen model attributes growth of these cell to stretching induced by cell
proliferation at the center of the disc 164 (Figure 1-3C & C’). Experimental validation of these
models has not been extensive, although there is growing evidence in favor of the mechanical
gradient model 167. Both models are supported by the observation that there is a non-homogenous
distribution of mechanical stress in the wing imaginal disc, with the highest compression being
present in the center of the disc 168, 169. Further, the orientation of the long axis in the peripheral
cells compared to the central cells suggests that the peripheral cells are stretched tangential to the
disc’s radial axis 165, a hypothesis confirmed by the recoil response of the peripheral cells upon

24
laser-ablation of tangential versus radial cell junctions 169. Intriguingly, cells at the periphery of
the wing imaginal disc divide parallel to the lines of stress 169, supporting the hypothesis that
stretch induces proliferation. More generally, there is considerable evidence to support a role for
mechanical forces in regulating cell proliferation both in mammalian tissues as well as
Drosophila imaginal discs 170, 171. Nevertheless, fundamental questions remain. Perhaps most
importantly, we do not know the molecular mechanism responsible for translating mechanical
signals into changes in cell proliferation. Emerging work from mammalian and other systems
seems to suggest a role for cytoskeletal proteins in transducing mechanical signaling to the cell
170. Cell adhesion molecules are also crucial in maintaining the balance of mechanical stress
between neighboring cells and the extra-cellular matrix (ECM)170. Further, there is growing
evidence for a role for the Hippo pathway effectors YAP and TAZ in transducing mechanical
signals to the cell 172-176, leading to the suggestion that YAP is a growth-regulatory sensor for
mechanical force 166.
Regardless of the mechanism used to transduce physical forces into changes in the expression of
growth control genes, it remains unclear the extent to which discs use a target size mechanism to
regulate their final size. Presumably, any organ-autonomous size-control mechanism must also
interact with the mechanisms that cause variation in final disc size, for example the IIS pathway.
Further, as discussed above, the duration of organ growth is regulated and coordinated by
circulating hormones, for example ecysteroids in Drosophila. The degree to which the cessation
of organ growth is regulated by organ-autonomous versus systemic mechanisms is unknown. It is
possible that target size represents a redundancy mechanism that prevents organ overgrowth
when systemic regulators of growth duration fail. Alternatively, attainment of target size may

25
regulate the release of and/or response to circulating hormones that control developmental
transitions and the duration of growth.
Negative Growth
So far, this chapter has focused on aspects of growth control that lead to increase in cell number
and size, that is 'positive' growth. However, an important aspect of growth control is the removal
of ostensibly superfluous tissues. This is achieved by apoptosis, in which individual cells activate
a self-destruction mechanism in response to external and internal signals. Apoptosis is a response
to activation of caspases and is characterized by a series of biochemical events that lead to
morphological changes in the cell and eventually cell death. These changes include blebbing, cell
shrinkage, nuclear fragmentation, chromatin condensation and DNA fragmentation. In contrast,
necrosis, the other form of cell death, is characterized by cell lysis and the release of cellular
contents. Apoptosis is a regulated process essential for correct development of adults from
embryos. This has been most clearly demonstrated in Drosophila where the inhibition of
apoptosis in the wing imaginal disc, through expression of the anti-apoptotic protein p35, leads
to a loss of uniform disc size 108. Further, apoptosis has been shown to be fundamental to correct
development of the nervous system in Drosophila, where at least half of the cells are eliminated
through programmed cell death during embryogenesis 177.
In Drosophila, multiple cell death pathways converge on the three proteins: reaper, grim and
head-involution-defective (hid). In the absence of these death-domain proteins, apoptosis is
virtually eliminated. Conversely, ectopic expression of any of these genes is sufficient to induce
cell death 177. Reaper, hid and grim all regulate cell death through their ability to bind to and
inhibit the action of Diap1, one of the two Inhibitor of Apoptosis Protein (IAP) in Drosophila.
IAPs in turn bind to and antagonize effector caspases, and therefore, negatively regulate
26
apoptosis. Together, the IAPs and the death domain proteins are the crucial targets by which
signaling pathways such as JNK and the Hippo pathway regulate organ size.
The antagonistic relationship between the Hippo pathway and apoptosis was revealed through
the observation that overexpression of Sav (Sav1) and Wts (Lats1/2) in Drosophila eye-antennal
imaginal discs results in an increase in cell death, and ultimately in adult eyes with an irregular
ommatidial pattern 121. Conversely, loss of function mutants of Sav (Sav1) and Wts (Lats1/2) as
well as their upstream regulator Hpo (Mst1/2) show massive tissue overgrowth 52, 121, 178-180. sav
and hpo (Mst1/2) mutant cells were shown to contain elevated Diap1 levels, thus resulting in an
inhibition of cell death 121, 180. As discussed above, Lats1/2 functions by inhibiting YAP, a
transcriptional co-activator. Logically, it could therefore be expected that YAP/Yorkie
overexpression would have the opposite effect of Sav, Wts or Hpo overexpression. This was
exactly what was found: Yorkie-overexpressing clones in wing imaginal discs shown to cause
massive overgrowth of wing imaginal discs, extending to overgrowth in the adult notum 37.
Yorkie appears to regulate organ size by regulating the transcription of multiple downstream
targets including various cell cycle progression genes and inhibitors of apoptosis. A detailed
description of all of these is beyond the scope of this review, however, the best-characterized
mechanisms by which Yki promotes growth are as follows. Firstly, Yki inhibits cell death by up-
regulating transcription of diap1 37. Secondly, Yki promotes cell proliferation by up-regulating
transcription of cycE and the microRNA bantam, the latter inhibiting the expression of hid. 47.
Lastly, Yki also upregulates the expression of the growth regulator dMyc, with loss of dMyc
preventing Yki-mediated growth 49, 181. More recent studies in Drosophila have now elucidated
another potential target of the Hippo pathway: Dronc, the Drosophila homologue of initiator

27
caspase-9. Dronc levels are elevated in hpo(Mst1/2) cells and blocking Dronc expression is
sufficient to block Hippo-induced cell death 182.
Systemic Growth Coordination
The final body or organ size achieved at the end of development depends on the four aspects that
have been previously discussed in this chapter, that is growth rate, growth duration, target size
and negative growth. This is not however the end of the story. The final size achieved by an
organ must be proportionate to final body size in order for the organ to function correctly within
its physiological context. In addition, the timing of development and maturation of the organs
needs to be coordinated with that of the body such that organs achieve developmental maturity at
the appropriate time. Consequently, there need to be systemic mechanisms that regulate and
coordinate growth and development across the body. In this section, I will discuss our emerging
understanding of how the different processes that regulate size are coordinated, both locally
within organs and globally among organs.
The best understood aspects of local growth coordination are cell competition and compensatory
cell proliferation. Compensatory cell proliferation is induced as a homeostatic mechanism in
response to the presence of dying cells within proliferating tissues. The study of compensatory
proliferation has perhaps been best studied in Drosophila, through the induction of apoptosis in
the cells of the wing imaginal discs. The presence of apoptotic cells leads to the non-autonomous
proliferation of adjacent cells caused by the JNK-dependent up-regulation of wg and dpp
expression 183-185. The result is the JNK-dependent regeneration of damaged imaginal discs 186,
187. The precise signaling mechanisms of compensatory proliferation, however, may differ based
on the specific tissue that is affected. For instance, in differentiating eye imaginal discs,
apoptotic cells induce compensatory proliferation by inducing Hedgehog signaling rather than

28
Wg/Dpp signaling 188. Further, while mitogenic signaling involving Wg and Dpp is likely one of
the key pathways involved in compensatory cell proliferation, other signals also appear to be
involved. This is because compensatory proliferation induced by gamma-irradiation still occurs
in dpp and wg-mutant wing discs 185. Recent studies have uncovered a likely candidate: the
Hippo signaling pathway. These studies establish a role for Yki in mediating compensatory cell
proliferation. On induction of apoptosis in the wing imaginal disc, Yki activity increases in the
adjacent cells stimulating a proliferative response 189, 190. This increase in Yki activity is JNK-
dependent, thus establishing a novel link between the JNK- and the Hippo signaling pathway 189.
A related phenomenon to compensatory proliferation is cell competition, which is induced when
proliferating tissue contains two differentially growing cell types. Cell competition was first
observed in Drosophila that carried Minute mutations. As discussed above Minute mutations are
dominant ribosomal protein mutations, which are homozygous lethal but when heterozygous
cause a cell-autonomous reduction in growth rate. When patches of Minute +/- cells (called
clones) are generated in an otherwise WT fly, the slow-growing cells are eliminated through
JNK-dependent apoptosis, and the resulting adult tissue is composed entire of WT cells 191, 192.
Such cell competition appears to be a mechanism to ensure that organs grow to their correct final
size despite localized cell-autonomous perturbations in proliferation. The intensity of cell
competition is likely to be further heightened by the apoptotic-induction of compensatory
proliferation in the surrounding cells, increasing the differential growth rates between fast and
slow growing cells, and further increasing the effects of cell competition 193. Since its discovery,
numerous regulators of cell competition have been discovered. The first of these was Myc,
through the observation that cell competition can be induced by differential expression of Myc in
neighboring cells, with cells expressing higher levels of Myc eliminating cells expressing lower

29
levels of Myc 108 194 Conversely, clones lacking expression of Myc are outcompeted by their wild
type counterparts when induced in the wing imaginal disc 109. Subsequently, numerous other
regulators of cell competition have been identified in Drosophila, including JAK-STAT and
Hippo-mediated cell competition 195-198. It is important to note, however, that while cell
competition has perhaps been best studied in Drosophila, there are several notable mammalian
examples. Three recent studies reveal a conserved role for c-Myc in inducing cell competition in
mouse Embryonic Stem Cells (ESCs), mouse embryonic epiblast and mouse cardiomyocytes 199-
201. All these studies demonstrate that establishment of differential c-Myc levels in a population
of cells is sufficient to induce cell competition, and the cells expressing lower levels of c-Myc
are outcompeted by those expressing higher levels (For further details see 202, 203).
While local growth coordination ensures that different parts of an organ are of the correct size
relative to one another, global or systemic growth coordination ensures that different organs are
the correct size relative to one another. This can, in principle be achieved by common exposure
of growing organs to external and internal growth-regulating factors. For example, in Drosophila
raised at higher temperatures there is a coordinated decrease in adult organ and body size 204, 205.
Similarly, systemic overexpression of an insulin-like peptide (dILP2), a secreted molecule whose
levels are correlated with nutrition, results in a coordinated increase in size of the organs and the
body 2. Not all organs, however, respond in the same way to systemic regulators of body size.
For example, in Drosophila changes in nutrition have less of an effect on the size of the genitalia
204, 206 and the CNS 207 than on other organs: Under conditions of low nutrition, when dILP levels
are low, both of these organs maintain their size even when the rest of the body shows a decrease
in size. They therefore appear to disproportionately larger in malnourished flies when compared
to well-fed individuals. This is achieved using two different mechanisms. In the case of the CNS

30
the activation of an alternative kinase, the Anaplastic Lymphoma Kinase (ALK), results in the
activation of the IIS pathway even in the absence of nutrition 207. The genital discs achieve the
same result by suppressing expression of FOXO, which in other tissues negatively regulates
growth when nutrition and insulin signaling is low, but its relative scarcity in the genitalia
ensures that genital growth is not inhibited under the same conditions 206.
Although common exposure to growth-regulating factors is sufficient to coordinate growth
among organs, such unidirectional systemic regulation is not robust to perturbations in the
growth of an individual organ. How is coordinated growth maintained when the growth of one
organ is slowed or accelerated? To achieve this organs must be able to recognize their own
growth and development and communicate this information to the rest of the body. This seems to
be the case in Drosophila. In Drosophila, perturbing the growth of individual imaginal discs in
developing larvae causes a delay in the attainment of critical size and a suppression of
ecdysteroidogenesis 125, 208, 209 (Figure 1-2A). This appears to be a mechanism to give the
damaged discs additional time to regenerate to their correct size. What is interesting, however is
that the other undamaged imaginal discs do not overgrow despite the additional developmental
time 210.This is because the undamaged discs slow their growth to match with the growth
perturbed discs 210, 211,212. How this growth coordination occurs between imaginal discs is not
entirely clear, although pieces of the puzzle are beginning to emerge.
Damaged imaginal discs have been shown to secrete an insulin-like peptide, dILP8, which
appears to regulate developmental timing by inhibiting the production of ecdysone from the
protharacic gland by upregulation of nitric oxide synthase (NOS) 213-215 (Figure 1-2A). Damaged
imaginal discs have also been shown to signal through a retinoid-dependent manner to repress
PTTH production, which also suppresses ecdysone production 209. Flies mutant for dILP8 or the

31
members of the retinoid-signaling pathway do not retard development when the growth of one
disc is retarded 209, 215. The reduced level of circulating ecdysone in larvae with damaged discs
also appears to be limiting for growth in the remaining undamaged discs. Ecdysone signaling is
known to promote growth of imaginal discs 216-218 and application of ecdysone to larvae with a
growth-perturbed disc rescues the growth rate of the other discs 210. Ecdysone signaling
therefore, seems to be one of the key mechanisms involved in growth coordination.
Natural variation in body size
Body size shows a tremendous variation both within and between species. This natural variation
can be attributed to genetic variation and environmental variation. Amongst the environmental
factors that have the most significant impact on size, nutrition, temperature and oxygen
concentration have received the most attention. Body size variation within and between species
can be explained by distinct biological phenomena. Size variation within species can be
attributed to two aspects: genetic variation between individuals and phenotypic plasticity in
response to the environment. Phenotypic plasticity refers to the ability of one genotype to
produce more than one phenotype when exposed to different environments. Thus, two different
individuals of the same species may have vastly different body sizes depending on the quality of
developmental nutrition that they were exposed to. However, in terms of size variation between
species, the predominant contributor is genetic variation resulting in genetic divergence of one
species from another. Genetic divergence refers to the process by which two or more populations
of an ancestral species accumulate independent mutations through time, often after the
populations have become reproductive isolated over time. For example, one likely mechanism to
explain size variation in two different species of Drosophila may be an accumulation of single
nucleotide polymorphisms or indels in cis-regulatory loci of a particular gene. Natural variation

32
in body size among different populations of animals can thus be explained by their underlying
genetic variation and phenotypic plasticity. In this section, I discuss briefly how natural body
size variation in response to changes in nutrition, temperature and oxygen concentration can be
explained by phenotypic plasticity and the underlying intra- and inter-species genetic variation.
Nutrition
Developmental nutrition is one of the most crucial factors in regulating growth rate and final
adult size. The relationship between nutrition and growth is rather intuitive: cellular growth takes
place through the conversion of nutrients to new tissue, and therefore, increased nutrition would
result in an increased growth rate and consequently larger body size. What is surprising,
however, is that in almost all animals, this is mediated through common nutrient-sensitive
signaling pathways: the IIS/TOR signaling pathways. The molecular mechanisms by which these
pathways regulate cellular growth and body size have already been discussed earlier in this
chapter.
Apart from the myriad molecular studies implicating the IIS pathway in body size regulation,
there is considerable evidence from population studies of naturally occurring Drosophila
populations suggesting a strong correlation between genetic variation in the IIS pathway and size
variation across latitudinal clines. For example, the chromosomal inversion In(3R)Payne which
contains, among others, genes of the IIS pathway, has been shown to be strongly associated with
body size and wing area219-222 . Similarly, the frequencies of the inversion In(2L)t containing the
IIS genes chico, Pten and Tor, decreases with increase in latitude and is associated with a low
body weight 222. Additionally, naturally segregating alleles of the InR have been associated with
body weight in Drosophila 223.

33
Apart from population-level variations in IIS being associated with body size, intra-individual
variation in IIS pathway activity among organs within an individual has been implicated in
organ-specific patterns of phenotypic plasticity. For example, in rhinoceros beetles, the male
horns are more sensitive to changes in nutrition, possibly due to higher expression of InR and
consequently are more responsive to changes in environmental perturbation224. These findings
corroborate evidence from Drosophila and the horned beetle Onthophagus nigriventris, which
suggest that male genitalia are less responsive to changes in nutrition due to low expression of
the IIS gene foxo 206, 225 thus providing further support to the role of IIS in mediating phenotypic
plasticity.
Temperature
Temperature is an important regulator of body size, particularly for ectothermic animals. In
almost all ectotherms, an increase in environmental temperature during development results in a
corresponding decrease in body size. This observation is captured in the ‘temperature-size rule’
(TSR) and is nearly universally applicable with well-documented examples from bacteria,
protozoa, plants and animals 226-229. Canonically, this has been attributed to the effect of
temperature on biochemical kinetics 230. Nevertheless, a definite mechanistic explanation of TSR
still remains elusive. There have been three main hypothesis proposed to explain the effect of
temperature on body size. The van der Have and de Jong model of TSR 231 proposes that higher
temperatures decrease developmental time much more than they increase growth rates,
ultimately resulting in adults with smaller body sizes. The von Bertalanffny/Perrin model
proposes that temperature directly regulates final body size and growth rate but not duration 232,
233. Under this hypothesis, temperature affects the rate of catabolism more than the rate of
anabolism, and the cessation of growth occurs when these rates are equal to each other. With

34
increasing temperature therefore, this balance is achieved at smaller body sizes resulting in
individuals with a smaller final body size. Lastly, several models 229, 234-236 propose that rather
than being a biophysical constraint, the TSR is an adaptive response. Metabolic rates increase
much more with temperature than diffusion rates of oxygen, and the authors suggest that this
would lead to oxygen limitation to larger individuals at higher temperatures. Consequently,
smaller body sizes at higher temperatures has been suggested to be an adaptive response by
reducing both the diffusion distance and requirement of oxygen.
Remarkably, natural populations of both endotherms and ectotherms show the same trend as
TSR. This observation called Bergman’s Rule states that populations and species found in colder
environments have a relatively larger size than those found in warmer environments. Bergman’s
rule captures to a great degree variations in body size as observed along latitudinal clines in
populations of a wide variety of animals. Yet, the proximate mechanisms that might explain both
TSR and Bergman’s rule remain poorly understood. Evidence from Drosophila suggests that the
control of the size response to changes in temperature appears to be regulated at the level of
individual of organs, with wings showing a higher degree of phenotypic plasticity than other
organs 204. Interestingly, recent research from Manduca and Drosophila suggests that there is
likely no common developmental mechanism that might explain the TSR in different animals.
For instance, in Manduca, an increase in environmental temperature decreases developmental
time much more than it increases growth rate, thus resulting in individuals with a smaller body
size 237, 238. On the other hand, in Drosophila, temperature regulates final body size primarily by
regulating critical size, TGP as well as the growth rate 205.
Oxygen
The relationship between oxygen levels and body size of animals was first proposed by the

35
discovery of giant insect fossils from the late Paleozoic era—a time in which the atmosphere was
significantly more hyperoxic than the present 239. This led to the general observation that
hyperoxic environments result in an increase in body size, while a hypoxic environments cause a
decrease in body size. Hypoxia and hyperoxia are usually defined with reference to the
environmental partial pressure (PO2) of oxygen, which is 21kPa; therefore hyperoxia refers to
conditions in which PO2 is greater than 21kPa while hypoxia refers to a decrease below 21kPa.
In Drosophila, body size decreases linearly with a decrease in PO2 from 21kPa to 7kPa, to about
60% of the body size of flies raised under normoxic conditions240. Hypoxia increases
developmental time and decreases growth rate 241, resulting in a decrease in cell size as well as
cell number in the Drosophila wing 240. However, despite this overall effect of decrease in
growth rates and body sizes by hypoxia, the effect on the tracheal system—the oxygen carrying
respiratory system in insects—is quite the reverse. Indeed, evidence from several insect species
suggests that hypoxia causes in an increase in growth of tracheoles and branching of the tracheal
system 242-245. The molecular mechanisms responsible for sensing oxygen involve the Hypoxia
Inducible Factor 1 (HIF), first isolated as a master regulator of the transcriptional response to
hypoxia 246. Subsequent work in Drosophila revealed that similar to mammals, the oxygen
sensing machinery involves HIF1, called sima in Drosophila247. Under hypoxic conditions, sima
is no longer targeted for degradation248 but instead activates gene expression in concert with its
partner protein tango. Sima accumulates in trachea under hypoxia, where it induces the
expression of the Fibroblast Growth Factor (FGF) receptor breathless249. Breathless together
with its receptor Branchless drives tracheal branching and sprouting250, 251. However in somatic
tissues apart from the tracheal system where growth is inhibited in response to hypoxia, sima
reduces cellular growth rates and cell and body size by blocking protein synthesis through the IIS

36
and TOR pathways 252, 253. Thus the cellular pathways regulating oxygen-dependent growth
appear to converge on those regulating nutrient dependent growth.
Summary
What is clear from the above review is that enormous progress has been made in understanding
the developmental genetic and physiological processes that regulate growth of bodies and the
organs within them. To a large extent, the role of individual signaling pathways in organ-
autonomous size control has been extremely well elucidated. However, how these pathways
interact with systemic factors such as hormones and nutrition to achieve correct final size is only
beginning to be elucidated.
In particular in Drosophila, two aspects of size control remain poorly understood. Firstly, how is
growth coordinated within and between organs to ensure that the size of different parts of an
organ are correct relative to one another, and that each organ is the correct size relative to the
body as a whole? Prior research in Drosophila suggests that systemic coordination of growth
across the whole individual is mediated through hormonal signaling such as ecdysone signaling.
An outstanding question that remains is how does systemic ecdysone signaling interacts with
organ-autonomous pathways to regulate final imaginal disc size. Secondly, given that changes in
expression of the IIS pathway genes alter the sensitivity of the pathway to changes in nutrition,
what are the mechanisms of transcriptional regulation for these genes? Regulation of organ size
in response to changes in nutrition must ensure that the final organ size is proportionate to the
body size while at the same time maintain functionality of the organ. In this context, what role do
subtle transcriptional changes of genes in the IIS pathway have in regulating organ size ?
My primary motivation for this thesis was to understand how size control in Drosophila is
achieved with respect to these questions. In the following chapters I describe some of my

37
findings and how these address our current gaps in understanding. In Chapter II I present and
discuss my findings pertaining to the interaction between the organ-autonomous IIS pathway and
systemic ecdysone signaling and how this is essential to regulate compartment and organ size in
Drosophila wing imaginal discs. In Chapter III I present my findings focusing on how the InR
gene in the IIS pathway is regulated transcriptionally and discuss how these preliminary findings
can be used to address the role of IIS in organ-specific nutritional phenotypic plasticity. Lastly,
in Chapter IV discuss the implications of this work and how this work can be further extended
upon by future experiments.

38
REFERENCES
.

39
REFERENCES
1. Bohni R, Riesgo-Escovar J, Oldham S, Brogiolo W, Stocker H, Andruss BF, Beckingham K, Hafen E. Autonomous control of cell and organ size by CHICO, a Drosophila homolog of vertebrate IRS1-4. Cell 1999, 97:865-875.
2. Brogiolo W, Stocker H, Ikeya T, Rintelen F, Fernandez R, Hafen E. An evolutionarily conserved function of the Drosophila insulin receptor and insulin-like peptides in growth control. Curr Biol 2001, 11:213-221.
3. Harrington LS, Findlay GM, Gray A, Tolkacheva T, Wigfield S, Rebholz H, Barnett J, Leslie NR, Cheng S, Shepherd PR. The TSC1-2 tumor suppressor controls insulin–PI3K signaling via regulation of IRS proteins. The Journal of cell biology 2004, 166:213-223.
4. Oldham S, Stocker H, Laffargue M, Wittwer F, Wymann M, Hafen E. The Drosophila insulin/IGF receptor controls growth and size by modulating PtdInsP(3) levels. Development 2002, 129:4103-4109.
5. Claeys I, Simonet G, Poels J, Van Loy T, Vercammen L, De Loof A, Vanden Broeck J. Insulin-related peptides and their conserved signal transduction pathway. Peptides 2002, 23:807-816.
6. Goetz R, Mohammadi M. Exploring mechanisms of FGF signalling through the lens of structural biology. Nat Rev Mol Cell Biol 2013, 14:166-180.
7. Humtsoe JO, Kramer RH. Differential epidermal growth factor receptor signaling regulates anchorage-independent growth by modulation of the PI3K/AKT pathway. Oncogene 2010, 29:1214-1226.
8. Ahmed NN, Grimes HL, Bellacosa A, Chan TO, Tsichlis PN. Transduction of interleukin-2 antiapoptotic and proliferative signals via Akt protein kinase. Proc Natl Acad Sci U S A 1997, 94:3627-3632.
9. Puig O, Marr MT, Ruhf ML, Tjian R. Control of cell number by Drosophila FOXO: downstream and feedback regulation of the insulin receptor pathway. Genes Dev 2003, 17:2006-2020.
10. Kramer JM, Davidge JT, Lockyer JM, Staveley BE. Expression of Drosophila FOXO regulates growth and can phenocopy starvation. BMC Dev Biol 2003, 3:5.
11. Junger MA, Rintelen F, Stocker H, Wasserman JD, Vegh M, Radimerski T, Greenberg ME, Hafen E. The Drosophila forkhead transcription factor FOXO mediates the reduction in cell number associated with reduced insulin signaling. J Biol 2003, 2:20.
12. van der Vos KE, Coffer PJ. The extending network of FOXO transcriptional target genes. Antioxid Redox Signal 2011, 14:579-592.

40
13. Jaeschke A, Hartkamp J, Saitoh M, Roworth W, Nobukuni T, Hodges A, Sampson J, Thomas G, Lamb R. Tuberous sclerosis complex tumor suppressor-mediated S6 kinase inhibition by phosphatidylinositide-3-OH kinase is mTOR independent. J Cell Biol 2002, 159:217-224.
14. Inoki K, Li Y, Zhu T, Wu J, Guan KL. TSC2 is phosphorylated and inhibited by Akt and suppresses mTOR signalling. Nat Cell Biol 2002, 4:648-657.
15. Gao X, Zhang Y, Arrazola P, Hino O, Kobayashi T, Yeung RS, Ru B, Pan D. Tsc tumour suppressor proteins antagonize amino-acid-TOR signalling. Nat Cell Biol 2002, 4:699-704.
16. Potter CJ, Huang H, Xu T. Drosophila Tsc1 functions with Tsc2 to antagonize insulin signaling in regulating cell growth, cell proliferation, and organ size. Cell 2001, 105:357-368.
17. Gao X, Pan D. TSC1 and TSC2 tumor suppressors antagonize insulin signaling in cell growth. Genes Dev 2001, 15:1383-1392.
18. Teleman AA. Molecular mechanisms of metabolic regulation by insulin in Drosophila. Biochem J 2010, 425:13-26.
19. Papatheodorou I, Petrovs R, Thornton JM. Comparison of the mammalian insulin signalling pathway to invertebrates in the context of FOXO-mediated ageing. Bioinformatics 2014.
20. Shaw RJ, Cantley LC. Ras, PI(3)K and mTOR signalling controls tumour cell growth. Nature 2006, 441:424-430.
21. Taniguchi CM, Emanuelli B, Kahn CR. Critical nodes in signalling pathways: insights into insulin action. Nat Rev Mol Cell Biol 2006, 7:85-96.
22. Pouyssegur J, Volmat V, Lenormand P. Fidelity and spatio-temporal control in MAP kinase (ERKs) signalling. Biochem Pharmacol 2002, 64:755-763.
23. McCubrey JA, Steelman LS, Chappell WH, Abrams SL, Wong EW, Chang F, Lehmann B, Terrian DM, Milella M, Tafuri A, et al. Roles of the Raf/MEK/ERK pathway in cell growth, malignant transformation and drug resistance. Biochim Biophys Acta 2007, 1773:1263-1284.
24. Perry MW, Bothma JP, Luu RD, Levine M. Precision of hunchback expression in the Drosophila embryo. Curr Biol 2012, 22:2247-2252.
25. Keshet Y, Seger R. The MAP kinase signaling cascades: a system of hundreds of components regulates a diverse array of physiological functions. Methods Mol Biol 2010, 661:3-38.

41
26. Averous J, Fonseca BD, Proud CG. Regulation of cyclin D1 expression by mTORC1 signaling requires eukaryotic initiation factor 4E-binding protein 1. Oncogene 2008, 27:1106-1113.
27. Mills JR, Hippo Y, Robert F, Chen SM, Malina A, Lin C-J, Trojahn U, Wendel H-G, Charest A, Bronson RT. mTORC1 promotes survival through translational control of Mcl-1. Proceedings of the National Academy of Sciences 2008, 105:10853-10858.
28. Ma XM, Blenis J. Molecular mechanisms of mTOR-mediated translational control. Nat Rev Mol Cell Biol 2009, 10:307-318.
29. Facchinetti V, Ouyang W, Wei H, Soto N, Lazorchak A, Gould C, Lowry C, Newton AC, Mao Y, Miao RQ, et al. The mammalian target of rapamycin complex 2 controls folding and stability of Akt and protein kinase C. EMBO J 2008, 27:1932-1943.
30. Ikenoue T, Inoki K, Yang Q, Zhou X, Guan KL. Essential function of TORC2 in PKC and Akt turn motif phosphorylation, maturation and signalling. EMBO J 2008, 27:1919-1931.
31. Huang J, Manning BD. A complex interplay between Akt, TSC2 and the two mTOR complexes. Biochem Soc Trans 2009, 37:217-222.
32. Jacinto E, Loewith R, Schmidt A, Lin S, Ruegg MA, Hall A, Hall MN. Mammalian TOR complex 2 controls the actin cytoskeleton and is rapamycin insensitive. Nat Cell Biol 2004, 6:1122-1128.
33. Laplante M, Sabatini DM. mTOR signaling in growth control and disease. Cell 2012, 149:274-293.
34. Chan EH, Nousiainen M, Chalamalasetty RB, Schafer A, Nigg EA, Sillje HH. The Ste20-like kinase Mst2 activates the human large tumor suppressor kinase Lats1. Oncogene 2005, 24:2076-2086.
35. Praskova M, Xia F, Avruch J. MOBKL1A/MOBKL1B phosphorylation by MST1 and MST2 inhibits cell proliferation. Curr Biol 2008, 18:311-321.
36. Callus BA, Verhagen AM, Vaux DL. Association of mammalian sterile twenty kinases, Mst1 and Mst2, with hSalvador via C-terminal coiled-coil domains, leads to its stabilization and phosphorylation. FEBS J 2006, 273:4264-4276.
37. Huang J, Wu S, Barrera J, Matthews K, Pan D. The Hippo signaling pathway coordinately regulates cell proliferation and apoptosis by inactivating Yorkie, the Drosophila Homolog of YAP. Cell 2005, 122:421-434.
38. Dong J, Feldmann G, Huang J, Wu S, Zhang N, Comerford SA, Gayyed MF, Anders RA, Maitra A, Pan D. Elucidation of a universal size-control mechanism in Drosophila and mammals. Cell 2007, 130:1120-1133.

42
39. Zhao B, Wei X, Li W, Udan RS, Yang Q, Kim J, Xie J, Ikenoue T, Yu J, Li L, et al. Inactivation of YAP oncoprotein by the Hippo pathway is involved in cell contact inhibition and tissue growth control. Genes Dev 2007, 21:2747-2761.
40. Oh H, Irvine KD. In vivo regulation of Yorkie phosphorylation and localization. Development 2008, 135:1081-1088.
41. Lei QY, Zhang H, Zhao B, Zha ZY, Bai F, Pei XH, Zhao S, Xiong Y, Guan KL. TAZ promotes cell proliferation and epithelial-mesenchymal transition and is inhibited by the hippo pathway. Mol Cell Biol 2008, 28:2426-2436.
42. Vassilev A, Kaneko KJ, Shu H, Zhao Y, DePamphilis ML. TEAD/TEF transcription factors utilize the activation domain of YAP65, a Src/Yes-associated protein localized in the cytoplasm. Genes Dev 2001, 15:1229-1241.
43. Goulev Y, Fauny JD, Gonzalez-Marti B, Flagiello D, Silber J, Zider A. SCALLOPED interacts with YORKIE, the nuclear effector of the hippo tumor-suppressor pathway in Drosophila. Curr Biol 2008, 18:435-441.
44. Wu S, Liu Y, Zheng Y, Dong J, Pan D. The TEAD/TEF family protein Scalloped mediates transcriptional output of the Hippo growth-regulatory pathway. Dev Cell 2008, 14:388-398.
45. Zhang L, Ren F, Zhang Q, Chen Y, Wang B, Jiang J. The TEAD/TEF family of transcription factor Scalloped mediates Hippo signaling in organ size control. Dev Cell 2008, 14:377-387.
46. Zhao B, Ye X, Yu J, Li L, Li W, Li S, Yu J, Lin JD, Wang CY, Chinnaiyan AM, et al. TEAD mediates YAP-dependent gene induction and growth control. Genes Dev 2008, 22:1962-1971.
47. Nolo R, Morrison CM, Tao C, Zhang X, Halder G. The bantam microRNA is a target of the hippo tumor-suppressor pathway. Curr Biol 2006, 16:1895-1904.
48. Thompson BJ, Cohen SM. The Hippo pathway regulates the bantam microRNA to control cell proliferation and apoptosis in Drosophila. Cell 2006, 126:767-774.
49. Neto-Silva RM, de Beco S, Johnston LA. Evidence for a growth-stabilizing regulatory feedback mechanism between Myc and Yorkie, the Drosophila homolog of Yap. Dev Cell 2010, 19:507-520.
50. Zhou D, Zhang Y, Wu H, Barry E, Yin Y, Lawrence E, Dawson D, Willis JE, Markowitz SD, Camargo FD. Mst1 and Mst2 protein kinases restrain intestinal stem cell proliferation and colonic tumorigenesis by inhibition of Yes-associated protein (Yap) overabundance. Proceedings of the National Academy of Sciences 2011, 108:E1312-E1320.

43
51. Lu L, Li Y, Kim SM, Bossuyt W, Liu P, Qiu Q, Wang Y, Halder G, Finegold MJ, Lee J-S. Hippo signaling is a potent in vivo growth and tumor suppressor pathway in the mammalian liver. Proceedings of the National Academy of Sciences 2010, 107:1437-1442.
52. Song H, Mak KK, Topol L, Yun K, Hu J, Garrett L, Chen Y, Park O, Chang J, Simpson RM. Mammalian Mst1 and Mst2 kinases play essential roles in organ size control and tumor suppression. Proceedings of the National Academy of Sciences 2010, 107:1431-1436.
53. Boggiano JC, Fehon RG. Growth control by committee: intercellular junctions, cell polarity, and the cytoskeleton regulate Hippo signaling. Dev Cell 2012, 22:695-702.
54. Willecke M, Hamaratoglu F, Sansores-Garcia L, Tao C, Halder G. Boundaries of Dachsous Cadherin activity modulate the Hippo signaling pathway to induce cell proliferation. Proceedings of the National Academy of Sciences 2008, 105:14897-14902.
55. Rogulja D, Rauskolb C, Irvine KD. Morphogen control of wing growth through the Fat signaling pathway. Dev Cell 2008, 15:309-321.
56. Cho E, Feng Y, Rauskolb C, Maitra S, Fehon R, Irvine KD. Delineation of a Fat tumor suppressor pathway. Nature genetics 2006, 38:1142-1150.
57. Feng Y, Irvine KD. Fat and expanded act in parallel to regulate growth through warts. Proceedings of the National Academy of Sciences 2007, 104:20362-20367.
58. Grzeschik NA, Parsons LM, Allott ML, Harvey KF, Richardson HE. Lgl, aPKC, and Crumbs regulate the Salvador/Warts/Hippo pathway through two distinct mechanisms. Current Biology 2010, 20:573-581.
59. Das Thakur M, Feng Y, Jagannathan R, Seppa MJ, Skeath JB, Longmore GD. Ajuba LIM proteins are negative regulators of the Hippo signaling pathway. Curr Biol 2010, 20:657-662.
60. Reddy B, Irvine KD. Regulation of Hippo signaling by EGFR-MAPK signaling through Ajuba family proteins. Developmental cell 2013, 24:459-471.
61. Yu FX, Guan KL. The Hippo pathway: regulators and regulations. Genes Dev 2013, 27:355-371.
62. Johnson GL, Nakamura K. The c-jun kinase/stress-activated pathway: regulation, function and role in human disease. Biochimica et Biophysica Acta (BBA)-Molecular Cell Research 2007, 1773:1341-1348.
63. Davis RJ. Signal transduction by the JNK group of MAP kinases. In: Inflammatory Processes:: Springer; 2000, 13-21.

44
64. Igaki T. Correcting developmental errors by apoptosis: lessons from Drosophila JNK signaling. Apoptosis 2009, 14:1021-1028.
65. Igaki T, Kanda H, Yamamoto-Goto Y, Kanuka H, Kuranaga E, Aigaki T, Miura M. Eiger, a TNF superfamily ligand that triggers the Drosophila JNK pathway. Embo Journal 2002, 21:3009-3018.
66. Lin A. Activation of the JNK signaling pathway: breaking the brake on apoptosis. Bioessays 2003, 25:17-24.
67. Ishimaru S, Ueda R, Hinohara Y, Ohtani M, Hanafusa H. PVR plays a critical role via JNK activation in thorax closure during Drosophila metamorphosis. The EMBO journal 2004, 23:3984-3994.
68. Boutros M, Paricio N, Strutt D, Mlodzik M. Dishevelled activates JNK and discriminates between JNK pathways in planar polarity and wingless signaling. Cell 1998, 94:109-118.
69. Rosso SB, Sussman D, Wynshaw-Boris A, Salinas PC. Wnt signaling through Dishevelled, Rac and JNK regulates dendritic development. Nature neuroscience 2005, 8:34-42.
70. Teramoto H, Crespo P, Coso OA, Igishi T, Xu N, Gutkind JS. The Small GTP-binding Protein Rho Activates c-Jun N-terminal Kinases/Stress-activated Protein Kinases in Human Kidney 293T Cells EVIDENCE FOR A Pak-INDEPENDENT SIGNALING PATHWAY. Journal of Biological Chemistry 1996, 271:25731-25734.
71. Minden A, Lin A, Claret F, Abo A, Karin M. Selective activation of the JNK signaling cascade and c-Jun transcriptional activity by the small GTPases Rac and Cdc42Hs. Cell 1995, 81:1147.
72. Weston CR, Davis RJ. The JNK signal transduction pathway. Current opinion in genetics & development 2002, 12:14-21.
73. Dhanasekaran DN, Reddy EP. JNK signaling in apoptosis. Oncogene 2008, 27:6245-6251.
74. Whitmarsh AJ, Kuan C-Y, Kennedy NJ, Kelkar N, Haydar TF, Mordes JP, Appel M, Rossini AA, Jones SN, Flavell RA. Requirement of the JIP1 scaffold protein for stress-induced JNK activation. Genes & development 2001, 15:2421-2432.
75. Yasuda J, Whitmarsh AJ, Cavanagh J, Sharma M, Davis RJ. The JIP group of mitogen-activated protein kinase scaffold proteins. Molecular and cellular biology 1999, 19:7245-7254.
76. Kelkar N, Gupta S, Dickens M, Davis RJ. Interaction of a mitogen-activated protein kinase signaling module with the neuronal protein JIP3. Molecular and cellular biology 2000, 20:1030-1043.

45
77. Chang L, Karin M. Mammalian MAP kinase signalling cascades. Nature 2001, 410:37-40.
78. Cavigelli M, Dolfi F, Claret F-X, Karin M. Induction of c-fos expression through JNK-mediated TCF/Elk-1 phosphorylation. The EMBO Journal 1995, 14:5957.
79. Fuchs SY, Adler V, Pincus MR, Ronai Ze. MEKK1/JNK signaling stabilizes and activates p53. Proceedings of the National Academy of Sciences 1998, 95:10541-10546.
80. Oleinik N, Krupenko N, Krupenko S. Cooperation between JNK1 and JNK2 in activation of p53 apoptotic pathway. Oncogene 2007, 26:7222-7230.
81. Yamamoto K, Ichijo H, Korsmeyer SJ. BCL-2 is phosphorylated and inactivated by an ASK1/Jun N-terminal protein kinase pathway normally activated at G2/M. Molecular and cellular biology 1999, 19:8469-8478.
82. Held LI. Imaginal discs: the genetic and cellular logic of pattern formation. Cambridge: Cambridge University Press; 2002.
83. Zhong Z, Ethen NJ, Williams BO. WNT signaling in bone development and homeostasis. Wiley Interdisciplinary Reviews: Developmental Biology 2014, 3:489-500.
84. Tickle C, Barker H. The Sonic hedgehog gradient in the developing limb. Wiley Interdiscip Rev Dev Biol 2013, 2:275-290.
85. Neufeld TP. Shrinkage control: regulation of insulin-mediated growth by FOXO transcription factors. J Biol 2003, 2:18.
86. Alberts B, Johnson A, Lewis J, Raff M, Roberts K, Walte P. The Chemical Components of a Cell. In: Molecular Biology of the Cel. 4th ed. New York: Garland Science; 2002.
87. Morata G, Ripoll P. Minutes: mutants of Drosophila autonomously affecting cell division rate. Dev Biol 1975, 42:211-221.
88. Saebøe-Larssen S, Lyamouri M, Merriam J, Oksvold MP, Lambertsson A. Ribosomal protein insufficiency and the minute syndrome in Drosophila: a dose-response relationship. Genetics 1998, 148:1215-1224.
89. Colombani J, Raisin S, Pantalacci S, Radimerski T, Montagne J, Leopold P. A nutrient sensor mechanism controls Drosophila growth. Cell 2003, 114:739-749.
90. Expression of Drosophila glass protein and evidence for negative regulation of its activity in non-neuronal cells by another DNA-binding protein.
91. Evans K, Nasim Z, Brown J, Butler H, Kauser S, Varoqui H, Erickson JD, Herbert TP, Bevington A. Acidosis-sensing glutamine pump SNAT2 determines amino acid levels and mammalian target of rapamycin signalling to protein synthesis in L6 muscle cells. J Am Soc Nephrol 2007, 18:1426-1436.

46
92. Kim E, Goraksha-Hicks P, Li L, Neufeld TP, Guan K-L. Regulation of TORC1 by Rag GTPases in nutrient response. Nature cell biology 2008, 10:935-945.
93. Demetriades C, Doumpas N, Teleman AA. Regulation of TORC1 in response to amino acid starvation via lysosomal recruitment of TSC2. Cell 2014, 156:786-799.
94. Inoki K, Zhu T, Guan K-L. TSC2 mediates cellular energy response to control cell growth and survival. Cell 2003, 115:577-590.
95. Gwinn DM, Shackelford DB, Egan DF, Mihaylova MM, Mery A, Vasquez DS, Turk BE, Shaw RJ. AMPK phosphorylation of raptor mediates a metabolic checkpoint. Mol Cell 2008, 30:214-226.
96. Liu L, Cash TP, Jones RG, Keith B, Thompson CB, Simon MC. Hypoxia-induced energy stress regulates mRNA translation and cell growth. Mol Cell 2006, 21:521-531.
97. Li Y, Wang Y, Kim E, Beemiller P, Wang C-Y, Swanson J, You M, Guan K-L. Bnip3 mediates the hypoxia-induced inhibition on mammalian target of rapamycin by interacting with Rheb. Journal of biological chemistry 2007, 282:35803-35813.
98. DeYoung MP, Horak P, Sofer A, Sgroi D, Ellisen LW. Hypoxia regulates TSC1/2–mTOR signaling and tumor suppression through REDD1-mediated 14–3–3 shuttling. Genes & development 2008, 22:239-251.
99. Vander Haar E, Lee S-i, Bandhakavi S, Griffin TJ, Kim D-H. Insulin signalling to mTOR mediated by the Akt/PKB substrate PRAS40. Nature cell biology 2007, 9:316-323.
100. Miron M, Lasko P, Sonenberg N. Signaling from Akt to FRAP/TOR targets both 4E-BP and S6K in Drosophila melanogaster. Molecular Cell Biology 2003, 23:9117-9126.
101. Menon S, Dibble CC, Talbott G, Hoxhaj G, Valvezan AJ, Takahashi H, Cantley LC, Manning BD. Spatial control of the TSC complex integrates insulin and nutrient regulation of mTORC1 at the lysosome. Cell 2014, 156:771-785.
102. Fingar DC, Salama S, Tsou C, Harlow E, Blenis J. Mammalian cell size is controlled by mTOR and its downstream targets S6K1 and 4EBP1/eIF4E. Genes Dev 2002, 16:1472-1487.
103. Montagne J. Drosophila S6 Kinase: A Regulator of Cell Size. Science 1999, 285:2126-2129.
104. Treins C, Giorgetti-Peraldi S, Murdaca J, Semenza GL, Van Obberghen E. Insulin stimulates hypoxia-inducible factor 1 through a phosphatidylinositol 3-kinase/target of rapamycin-dependent signaling pathway. J Biol Chem 2002, 277:27975-27981.
105. Neufeld TP. Body building: regulation of shape and size by PI3K/TOR signaling during development. Mech Dev 2003, 120:1283-1296.

47
106. Chen C. The Drosophila insulin receptor is required for normal growth. Endocrinology 1996, 137:846-856.
107. Shingleton AW, Das J, Vinicius L, Stern DL. The temporal requirements for insulin signaling during development in Drosophila. PLoS Biol 2005, 3:e289.
108. de la Cova C, Abril M, Bellosta P, Gallant P, Johnston LA. Drosophila myc regulates organ size by inducing cell competition. Cell 2004, 117:107-116.
109. Johnston LA, Prober DA, Edgar BA, Eisenman RN, Gallant P. Drosophila myc regulates cellular growth during development. Cell 1999, 98:779-790.
110. van Riggelen J, Yetil A, Felsher DW. MYC as a regulator of ribosome biogenesis and protein synthesis. Nat Rev Cancer 2010, 10:301-309.
111. Lin CY, Loven J, Rahl PB, Paranal RM, Burge CB, Bradner JE, Lee TI, Young RA. Transcriptional amplification in tumor cells with elevated c-Myc. Cell 2012, 151:56-67.
112. Nie ZQ, Hu GQ, Wei G, Cui KR, Yamane A, Resch W, Wang RN, Green DR, Tessarollo L, Casellas R, et al. c-Myc Is a Universal Amplifier of Expressed Genes in Lymphocytes and Embryonic Stem Cells. Cell 2012, 151:68-79.
113. Duman-Scheel M, Johnston LA, Du W. Repression of dMyc expression by Wingless promotes Rbf-induced G1 arrest in the presumptive Drosophila wing margin. Proc Natl Acad Sci U S A 2004, 101:3857-3862.
114. Prober DA, Edgar BA. Ras1 promotes cellular growth in the Drosophila wing. Cell 2000, 100:435-446.
115. Pierce SB, Yost C, Britton JS, Loo LW, Flynn EM, Edgar BA, Eisenman RN. dMyc is required for larval growth and endoreplication in Drosophila. Development 2004, 131:2317-2327.
116. Datar SA, Jacobs HW, de la Cruz AF, Lehner CF, Edgar BA. The Drosophila cyclin D-Cdk4 complex promotes cellular growth. EMBO J 2000, 19:4543-4554.
117. Meyer CA, Jacobs HW, Datar SA, Du W, Edgar BA, Lehner CF. Drosophila Cdk4 is required for normal growth and is dispensable for cell cycle progression. EMBO J 2000, 19:4533-4542.
118. Rane SG, Dubus P, Mettus RV, Galbreath EJ, Boden G, Reddy EP, Barbacid M. Loss of Cdk4 expression causes insulin-deficient diabetes and Cdk4 activation results in beta-islet cell hyperplasia. Nat Genet 1999, 22:44-52.
119. Jahanshahi M, Hsiao K, Jenny A, Pfleger CM. The Hippo Pathway Targets Rae1 to Regulate Mitosis and Organ Size and to Feed Back to Regulate Upstream Components Merlin, Hippo, and Warts. PLoS Genet 2016, 12:e1006198.

48
120. Reddy B, Irvine KD. The Fat and Warts signaling pathways: new insights into their regulation, mechanism and conservation. Development 2008, 135:2827-2838.
121. Tapon N, Harvey KF, Bell DW, Wahrer DCR, Schiripo TA, Haber DA, Hariharan IK. salvador promotes both cell cycle exit and apoptosis in Drosophila and is mutated in human cancer cell lines. Cell 2002, 110:467-478.
122. Harvey K, Pfleger C, Hariharan I. The Drosophila Mst Ortholog, hippo, Restricts Growth and Cell Proliferation and Promotes Apoptosis. Cell 2003, 114:457-467.
123. Beadle G, Tatum E, Clancy C. Food level in relation to rate of development and eye pigmentation in Drosophila melanogaster. Biological Bulletin of the Marine Biology Laboratory, Woods Hole 1938, 75:447-462.
124. Nijhout HF, Williams CM. Control of moulting and metamorphosis in the tobacco hornworm, Manduca sexta (L.): growth of the last-instar larva and the decision to pupate. J Exp Biol 1974, 61:481-491.
125. Stieper BC, Kupershtok M, Driscoll MV, Shingleton AW. Imaginal discs regulate developmental timing in Drosophila melanogaster. Dev Biol 2008, 321:18-26.
126. Warren JT, Yerushalmi Y, Shimell MJ, O'Connor MB, Restifo LL, Gilbert LI. Discrete pulses of molting hormone, 20-hydroxyecdysone, during late larval development of Drosophila melanogaster: correlations with changes in gene activity. Dev Dyn 2006, 235:315-326.
127. Mirth C, Truman JW, Riddiford LM. The role of the prothoracic gland in determining critical weight for metamorphosis in Drosophila melanogaster. Curr Biol 2005, 15:1796-1807.
128. Lin JI, Mitchell NC, Kalcina M, Tchoubrieva E, Stewart MJ, Marygold SJ, Walker CD, Thomas G, Leevers SJ, Pearson RB. Drosophila ribosomal protein mutants control tissue growth non-autonomously via effects on the prothoracic gland and ecdysone. PLoS genetics 2011, 7:e1002408.
129. Callier V, Nijhout HF. Control of body size by oxygen supply reveals size-dependent and size-independent mechanisms of molting and metamorphosis. Proc Natl Acad Sci U S A 2011, 108:14664-14669.
130. Caldwell PE, Walkiewicz M, Stern M. Ras activity in the Drosophila prothoracic gland regulates body size and developmental rate via ecdysone release. Curr Biol 2005, 15:1785-1795.
131. Rewitz KF, Yamanaka N, Gilbert LI, O'Connor MB. The insect neuropeptide PTTH activates receptor tyrosine kinase torso to initiate metamorphosis. Science 2009, 326:1403-1405.

49
132. Layalle S, Arquier N, Leopold P. The TOR pathway couples nutrition and developmental timing in Drosophila. Dev Cell 2008, 15:568-577.
133. Kemirembe K, Liebmann K, Bootes A, Smith WA, Suzuki Y. Amino acids and TOR signaling promote prothoracic gland growth and the initiation of larval molts in the tobacco hornworm Manduca sexta. PLoS One 2012, 7:e44429.
134. Mirth CK, Shingleton AW. Integrating body and organ size in Drosophila: recent advances and outstanding problems. Front Endocrinol (Lausanne) 2012, 3:49.
135. Koyama T, Rodrigues MA, Athanasiadis A, Shingleton AW, Mirth CK. Nutritional control of body size through FoxO-Ultraspiracle mediated ecdysone biosynthesis. Elife 2014, 3.
136. McBrayer Z, Ono H, Shimell M, Parvy JP, Beckstead RB, Warren JT, Thummel CS, Dauphin-Villemant C, Gilbert LI, O'Connor MB. Prothoracicotropic hormone regulates developmental timing and body size in Drosophila. Dev Cell 2007, 13:857-871.
137. Ou Q, Magico A, King-Jones K. Nuclear receptor DHR4 controls the timing of steroid hormone pulses during Drosophila development. PLoS Biol 2011, 9:e1001160.
138. Moeller ME, Danielsen ET, Herder R, O'Connor MB, Rewitz KF. Dynamic feedback circuits function as a switch for shaping a maturation-inducing steroid pulse in Drosophila. Development 2013, 140:4730-4739.
139. Silber SJ. Growth of baby kidneys transplanted into adults. Archives of Surgery 1976, 111:75-77.
140. Bryant PJ, Simpson P. Intrinsic and extrinsic control of growth in developing organs. Q Rev Biol 1984, 59:387-415.
141. Bryant PJ, Levinson P. Intrinsic growth control in the imaginal primordia of Drosophila, and the autonomous action of a lethal mutation causing overgrowth. Dev Biol 1985, 107:355-363.
142. Michalopoulos G, DeFrances M. Liver regeneration. Science 1997, 276:60-66.
143. Neufeld TP, de la Cruz AF, Johnston LA, Edgar BA. Coordination of growth and cell division in the Drosophila wing. Cell 1998, 93:1183-1193.
144. Masucci JD, Miltenberger RJ, Hoffmann FM. Pattern-specific expression of the Drosophila decapentaplegic gene in imaginal disks is regulated by 3' cis-regulatory elements. Genes Dev 1990, 4:2011-2023.
145. Blackman RK, Sanicola M, Raftery LA, Gillevet T, Gelbart WM. An extensive 3' cis-regulatory region directs the imaginal disk expression of decapentaplegic, a member of the TGF-beta family in Drosophila. Development 1991, 111:657-666.

50
146. Martín-Castellanos C, Edgar B. A characterization of the effects of Dpp signaling on cell growth and proliferation in the Drosophila wing. Development 2002, 129:1003-1013.
147. Baker NE. Transcription of the segment-polarity gene wingless in the imaginal discs of Drosophila, and the phenotype of a pupal-lethal wg mutation. Development 1988, 102:489-497.
148. Neumann CJ, Cohen SM. Distinct mitogenic and cell fate specification functions of wingless in different regions of the wing. Development 1996, 122:1781-1789.
149. Sharma RP, Chopra VL. Effect of the Wingless (wg1) mutation on wing and haltere development in Drosophila melanogaster. Dev Biol 1976, 48:461-465.
150. Morata G, Lawrence P. The development of wingless, a homeotic mutation of Drosophila. Developmental biology 1977, 56:227-240.
151. Teleman A, Cohen S. Dpp Gradient Formation in the Drosophila Wing Imaginal Disc. Cell 2000, 103:971-980.
152. Zecca M, Basler K, Struhl G. Sequential organizing activities of engrailed, hedgehog and decapentaplegic in the Drosophila wing. Development 1995, 121:2265-2278.
153. Couso JP, Bate M, Martinez-Arias A. A wingless-dependent polar coordinate system in Drosophila imaginal discs. Science 1993, 259:484-489.
154. Crickmore MA, Mann RS. Hox control of organ size by regulation of morphogen production and mobility. Science 2006, 313:63-68.
155. Lewis EB. A gene complex controlling segmentation in Drosophila. Nature 1978, 276:565-570.
156. Beachy PA, Helfand SL, Hogness DS. Segmental distribution of bithorax complex proteins during Drosophila development. Nature 1985, 313:545-551.
157. Day SJ, Lawrence PA. Measuring dimensions: the regulation of size and shape. Development 2000, 127:2977-2987.
158. Wartlick O, Mumcu P, Kicheva A, Bittig T, Seum C, Julicher F, Gonzalez-Gaitan M. Dynamics of Dpp signaling and proliferation control. Science 2011, 331:1154-1159.
159. Wartlick O, Mumcu P, Julicher F, Gonzalez-Gaitan M. Understanding morphogenetic growth control -- lessons from flies. Nat Rev Mol Cell Biol 2011, 12:594-604.
160. Restrepo S, Zartman JJ, Basler K. Coordination of patterning and growth by the morphogen DPP. Curr Biol 2014, 24:R245-255.
161. Rogulja D, Irvine KD. Regulation of cell proliferation by a morphogen gradient. Cell 2005, 123:449-461.

51
162. Schwank G, Restrepo S, Basler K. Growth regulation by Dpp: an essential role for Brinker and a non-essential role for graded signaling levels. Development 2008, 135:4003-4013.
163. Schwank G, Tauriello G, Yagi R, Kranz E, Koumoutsakos P, Basler K. Antagonistic growth regulation by Dpp and Fat drives uniform cell proliferation. Dev Cell 2011, 20:123-130.
164. Hufnagel L, Teleman AA, Rouault H, Cohen SM, Shraiman BI. On the mechanism of wing size determination in fly development. Proc Natl Acad Sci U S A 2007, 104:3835-3840.
165. Mao Y, Tournier AL, Hoppe A, Kester L, Thompson BJ, Tapon N. Differential proliferation rates generate patterns of mechanical tension that orient tissue growth. EMBO J 2013, 32:2790-2803.
166. Aegerter-Wilmsen T, Aegerter CM, Hafen E, Basler K. Model for the regulation of size in the wing imaginal disc of Drosophila. Mech Dev 2007, 124:318-326.
167. Aegerter-Wilmsen T, Heimlicher MB, Smith AC, de Reuille PB, Smith RS, Aegerter CM, Basler K. Integrating force-sensing and signaling pathways in a model for the regulation of wing imaginal disc size. Development 2012, 139:3221-3231.
168. Nienhaus U, Aegerter-Wilmsen T, Aegerter CM. Determination of mechanical stress distribution in Drosophila wing discs using photoelasticity. Mech Dev 2009, 126:942-949.
169. Legoff L, Rouault H, Lecuit T. A global pattern of mechanical stress polarizes cell divisions and cell shape in the growing Drosophila wing disc. Development 2013, 140:4051-4059.
170. Mammoto T, Ingber DE. Mechanical control of tissue and organ development. Development 2010, 137:1407-1420.
171. Schluck T, Nienhaus U, Aegerter-Wilmsen T, Aegerter CM. Mechanical control of organ size in the development of the Drosophila wing disc. PLoS One 2013, 8:e76171.
172. Halder G, Dupont S, Piccolo S. Transduction of mechanical and cytoskeletal cues by YAP and TAZ. Nat Rev Mol Cell Biol 2012, 13:591-600.
173. Dupont S, Morsut L, Aragona M, Enzo E, Giulitti S, Cordenonsi M, Zanconato F, Le Digabel J, Forcato M, Bicciato S. Role of YAP/TAZ in mechanotransduction. Nature 2011, 474:179-183.
174. Fernández BG, Gaspar P, Brás-Pereira C, Jezowska B, Rebelo SR, Janody F. Actin-Capping Protein and the Hippo pathway regulate F-actin and tissue growth in Drosophila. Development 2011, 138:2337-2346.

52
175. Sansores‐Garcia L, Bossuyt W, Wada KI, Yonemura S, Tao C, Sasaki H, Halder G. Modulating F‐actin organization induces organ growth by affecting the Hippo pathway. The EMBO journal 2011, 30:2325-2335.
176. Wada K-I, Itoga K, Okano T, Yonemura S, Sasaki H. Hippo pathway regulation by cell morphology and stress fibers. Development 2011, 138:3907-3914.
177. White K, Grether ME, Abrams JM, Young L, Farrell K, Steller H. Genetic control of programmed cell death in Drosophila. Science 1994, 264:677-683.
178. Justice RW, Zilian O, Woods DF, Noll M, Bryant PJ. The Drosophila tumor suppressor gene warts encodes a homolog of human myotonic dystrophy kinase and is required for the control of cell shape and proliferation. Genes & Development 1995, 9:534-546.
179. Xu T, Wang W, Zhang S, Stewart RA, Yu W. Identifying tumor suppressors in genetic mosaics: the Drosophila lats gene encodes a putative protein kinase. Development 1995, 121:1053-1063.
180. Jia J, Zhang W, Wang B, Trinko R, Jiang J. The Drosophila Ste20 family kinase dMST functions as a tumor suppressor by restricting cell proliferation and promoting apoptosis. Genes Dev 2003, 17:2514-2519.
181. Ziosi M, Baena-Lopez LA, Grifoni D, Froldi F, Pession A, Garoia F, Trotta V, Bellosta P, Cavicchi S, Pession A. dMyc functions downstream of Yorkie to promote the supercompetitive behavior of hippo pathway mutant cells. PLoS Genet 2010, 6:e1001140.
182. Verghese S, Bedi S, Kango-Singh M. Hippo signalling controls Dronc activity to regulate organ size in Drosophila. Cell Death Differ 2012, 19:1664-1676.
183. Ryoo HD, Gorenc T, Steller H. Apoptotic cells can induce compensatory cell proliferation through the JNK and the Wingless signaling pathways. Dev Cell 2004, 7:491-501.
184. Huh JR, Guo M, Hay BA. Compensatory proliferation induced by cell death in the Drosophila wing disc requires activity of the apical cell death caspase Dronc in a nonapoptotic role. Curr Biol 2004, 14:1262-1266.
185. Perez-Garijo A, Shlevkov E, Morata G. The role of Dpp and Wg in compensatory proliferation and in the formation of hyperplastic overgrowths caused by apoptotic cells in the Drosophila wing disc. Development 2009, 136:1169-1177.
186. Smith-Bolton RK, Worley MI, Kanda H, Hariharan IK. Regenerative growth in Drosophila imaginal discs is regulated by Wingless and Myc. Dev Cell 2009, 16:797-809.
187. Bergantinos C, Corominas M, Serras F. Cell death-induced regeneration in wing imaginal discs requires JNK signalling. Development 2010, 137:1169-1179.

53
188. Fan Y, Bergmann A. Distinct mechanisms of apoptosis-induced compensatory proliferation in proliferating and differentiating tissues in the Drosophila eye. Dev Cell 2008, 14:399-410.
189. Sun G, Irvine KD. Regulation of Hippo signaling by Jun kinase signaling during compensatory cell proliferation and regeneration, and in neoplastic tumors. Dev Biol 2011, 350:139-151.
190. Grusche FA, Degoutin JL, Richardson HE, Harvey KF. The Salvador/Warts/Hippo pathway controls regenerative tissue growth in Drosophila melanogaster. Dev Biol 2011, 350:255-266.
191. Simpson P, Morata G. Differential mitotic rates and patterns of growth in compartments in the Drosophila wing. Developmental Biology 1981, 85:299-308.
192. Moreno E, Basler K, Morata G. Cells compete for decapentaplegic survival factor to prevent apoptosis in Drosophila wing development. Nature 2002, 416:755-759.
193. Levayer R, Moreno E. Mechanisms of cell competition: themes and variations. J Cell Biol 2013, 200:689-698.
194. Moreno E, Basler K. dMyc transforms cells into super-competitors. Cell 2004, 117:117-129.
195. Tyler DM, Li W, Zhuo N, Pellock B, Baker NE. Genes affecting cell competition in Drosophila. Genetics 2007, 175:643-657.
196. Chen CL, Schroeder MC, Kango-Singh M, Tao C, Halder G. Tumor suppression by cell competition through regulation of the Hippo pathway. Proc Natl Acad Sci U S A 2012, 109:484-489.
197. Menendez J, Perez-Garijo A, Calleja M, Morata G. A tumor-suppressing mechanism in Drosophila involving cell competition and the Hippo pathway. Proc Natl Acad Sci U S A 2010, 107:14651-14656.
198. Rodrigues AB, Zoranovic T, Ayala-Camargo A, Grewal S, Reyes-Robles T, Krasny M, Wu DC, Johnston LA, Bach EA. Activated STAT regulates growth and induces competitive interactions independently of Myc, Yorkie, Wingless and ribosome biogenesis. Development 2012, 139:4051-4061.
199. Sancho M, Di-Gregorio A, George N, Pozzi S, Sanchez JM, Pernaute B, Rodriguez TA. Competitive interactions eliminate unfit embryonic stem cells at the onset of differentiation. Dev Cell 2013, 26:19-30.
200. Villa del Campo C, Claveria C, Sierra R, Torres M. Cell competition promotes phenotypically silent cardiomyocyte replacement in the mammalian heart. Cell Rep 2014, 8:1741-1751.

54
201. Claveria C, Giovinazzo G, Sierra R, Torres M. Myc-driven endogenous cell competition in the early mammalian embryo. Nature 2013, 500:39-44.
202. Amoyel M, Bach EA. Cell competition: how to eliminate your neighbours. Development 2014, 141:988-1000.
203. Hogan C, Kajita M, Lawrenson K, Fujita Y. Interactions between normal and transformed epithelial cells: Their contributions to tumourigenesis. Int J Biochem Cell Biol 2011, 43:496-503.
204. Shingleton AW, Estep CM, Driscoll MV, Dworkin I. Many ways to be small: different environmental regulators of size generate distinct scaling relationships in Drosophila melanogaster. Proc Biol Sci 2009, 276:2625-2633.
205. Ghosh SM, Testa ND, Shingleton AW. Temperature-size rule is mediated by thermal plasticity of critical size in Drosophila melanogaster. Proc Biol Sci 2013, 280:20130174.
206. Tang HY, Smith-Caldas MS, Driscoll MV, Salhadar S, Shingleton AW. FOXO regulates organ-specific phenotypic plasticity in Drosophila. PLoS Genet 2011, 7:e1002373.
207. Cheng LY, Bailey AP, Leevers SJ, Ragan TJ, Driscoll PC, Gould AP. Anaplastic lymphoma kinase spares organ growth during nutrient restriction in Drosophila. Cell 2011, 146:435-447.
208. Simpson P, Berreur P, Berreur-Bonnenfant J. The initiation of pupariation in Drosophila: dependence on growth of the imaginal discs. J Embryol Exp Morphol 1980, 57:155-165.
209. Halme A, Cheng M, Hariharan IK. Retinoids regulate a developmental checkpoint for tissue regeneration in Drosophila. Curr Biol 2010, 20:458-463.
210. Parker NF, Shingleton AW. The coordination of growth among Drosophila organs in response to localized growth-perturbation. Dev Biol 2011, 357:318-325.
211. Mesquita D, Dekanty A, Milan M. A dp53-dependent mechanism involved in coordinating tissue growth in Drosophila. PLoS Biol 2010, 8:e1000566.
212. Martin FA, Morata G. Compartments and the control of growth in the Drosophila wing imaginal disc. Development 2006, 133:4421-4426.
213. Jaszczak JS, Wolpe JB, Dao AQ, Halme A. Nitric Oxide Synthase Regulates Growth Coordination During Drosophila melanogaster Imaginal Disc Regeneration. Genetics 2015.
214. Colombani J, Andersen DS, Leopold P. Secreted Peptide Dilp8 Coordinates Drosophila Tissue Growth with Developmental Timing. Science 2012, 336:582-585.

55
215. Garelli A, Gontijo AM, Miguela V, Caparros E, Dominguez M. Imaginal discs secrete insulin-like peptide 8 to mediate plasticity of growth and maturation. Science 2012, 336:579-582.
216. Herboso L, Oliveira MM, Talamillo A, Pérez C, González M, Martín D, Sutherland JD, Shingleton AW, Mirth CK, Barrio R. Ecdysone promotes growth of imaginal discs through the regulation of Thor in D. melanogaster. Scientific reports 2015, 5.
217. Mirth CK, Truman JW, Riddiford LM. The Ecdysone receptor controls the post-critical weight switch to nutrition-independent differentiation in Drosophila wing imaginal discs. Development 2009, 136:2345-2353.
218. Delanoue R, Slaidina M, Leopold P. The steroid hormone ecdysone controls systemic growth by repressing dMyc function in Drosophila fat cells. Dev Cell 2010, 18:1012-1021.
219. Rako L, Anderson AR, Sgro CM, Stocker AJ, Hoffmann AA. The association between inversion In(3R)Payne and clinally varying traits in Drosophila melanogaster. Genetica 2006, 128:373-384.
220. Kennington WJ, Hoffmann AA, Partridge L. Mapping regions within cosmopolitan inversion In(3R)Payne associated with natural variation in body size in Drosophila melanogaster. Genetics 2007, 177:549-556.
221. Weeks AR, McKechnie SW, Hoffmann AA. Dissecting adaptive clinal variation: markers, inversions and size/stress associations in Drosophila melanogaster from a central field population. Ecology Letters 2002, 5:756-763.
222. De Jong G, Bochdanovits Z. Latitudinal clines inDrosophila melanogaster: Body size, allozyme frequencies, inversion frequencies, and the insulin-signalling pathway. Journal of genetics 2003, 82:207-223.
223. Paaby AB, Bergland AO, Behrman EL, Schmidt PS. A highly pleiotropic amino acid polymorphism in the Drosophila insulin receptor contributes to life-history adaptation. Evolution 2014, 68:3395-3409.
224. Emlen DJ, Warren IA, Johns A, Dworkin I, Lavine LC. A mechanism of extreme growth and reliable signaling in sexually selected ornaments and weapons. Science 2012, 337:860-864.
225. Snell-Rood EC, Moczek AP. Insulin Signaling as a Mechanism Underlying Developmental Plasticity: The Role of FOXO in a Nutritional Polyphenism. Plos One 2012, 7.
226. Atkinson D. Temperature and organism size: a biological law for ectotherms? Advances in ecological research 1994, 25:1-1.

56
227. Karl I, Fischer K. Why get big in the cold? Towards a solution to a life-history puzzle. Oecologia 2008, 155:215-225.
228. Kingsolver JG, Huey RB. Size, temperature, and fitness: three rules. Evolutionary Ecology Research 2008, 10:251-268.
229. Chown SL, Gaston KJ. Body size variation in insects: a macroecological perspective. Biological Reviews 2010, 85:139-169.
230. Gillooly JF, Charnov EL, West GB, Savage VM, Brown JH. Effects of size and temperature on developmental time. Nature 2002, 417:70-73.
231. Van der Have T, De Jong G. Adult size in ectotherms: temperature effects on growth and differentiation. Journal of Theoretical Biology 1996, 183:329-340.
232. von Bertalanffy L. Principles and theory of growth. Fundamental aspects of normal and malignant growth 1960, 493.
233. Perrin N. About Berrigan and Charnov's life-history puzzle. Oikos 1995:137-139.
234. Angilletta Jr MJ, Dunham AE. The temperature‐size rule in ectotherms: simple evolutionary explanations may not be general. The American Naturalist 2003, 162:332-342.
235. Angilletta MJ, Steury TD, Sears MW. Temperature, growth rate, and body size in ectotherms: fitting pieces of a life-history puzzle. Integrative and Comparative Biology 2004, 44:498-509.
236. Walters RJ, Hassall M. The Temperature‐Size Rule in Ectotherms: May a General Explanation Exist after All? The American Naturalist 2006, 167:510-523.
237. Davidowitz G, D'Amico LJ, Nijhout HF. Critical weight in the development of insect body size. Evolution & development 2003, 5:188-197.
238. Davidowitz G, Nijhout HF. The physiological basis of reaction norms: the interaction among growth rate, the duration of growth and body size. Integrative and Comparative Biology 2004, 44:443-449.
239. Dudley R. Atmospheric oxygen, giant Paleozoic insects and the evolution of aerial locomotor performance. Journal of Experimental Biology 1998, 201:1043-1050.
240. Peck LS, Maddrell SH. Limitation of size by hypoxia in the fruit fly Drosophila melanogaster. Journal of Experimental Zoology Part A: Comparative Experimental Biology 2005, 303:968-975.
241. Frazier MR, Woods HA, Harrison JF. Interactive effects of rearing temperature and oxygen on the development of Drosophila melanogaster. Physiological and Biochemical Zoology 2001, 74:641-650.
57
242. Wigglesworth V. Growth and regeneration in the tracheal system of an insect, Rhodnius prolixus (Hemiptera). Journal of Cell Science 1954, 3:115-137.
243. Locke M. The co-ordination of growth in the tracheal system of insects. Journal of Cell Science 1958, 3:373-391.
244. LOUDON C. Tracheal hypertrophy in mealworms: design and plasticity in oxygen supply systems. Journal of Experimental Biology 1989, 147:217-235.
245. Henry JR, Harrison JF. Plastic and evolved responses of larval tracheae and mass to varying atmospheric oxygen content in Drosophila melanogaster. Journal of Experimental Biology 2004, 207:3559-3567.
246. Wang GL, Jiang B-H, Rue EA, Semenza GL. Hypoxia-inducible factor 1 is a basic-helix-loop-helix-PAS heterodimer regulated by cellular O2 tension. Proceedings of the national academy of sciences 1995, 92:5510-5514.
247. Lavista-Llanos S, Centanin L, Irisarri M, Russo DM, Gleadle JM, Bocca SN, Muzzopappa M, Ratcliffe PJ, Wappner P. Control of the hypoxic response in Drosophila melanogaster by the basic helix-loop-helix PAS protein similar. Molecular and cellular biology 2002, 22:6842-6853.
248. Gorr TA, Tomita T, Wappner P, Bunn HF. Regulation of Drosophila Hypoxia-inducible Factor (HIF) Activity in SL2 Cells IDENTIFICATION OF A HYPOXIA-INDUCED VARIANT ISOFORM OF THE HIFα HOMOLOG GENE similar. Journal of Biological Chemistry 2004, 279:36048-36058.
249. Centanin L, Dekanty A, Romero N, Irisarri M, Gorr TA, Wappner P. Cell autonomy of HIF effects in Drosophila: tracheal cells sense hypoxia and induce terminal branch sprouting. Developmental cell 2008, 14:547-558.
250. Jarecki J, Johnson E, Krasnow MA. Oxygen regulation of airway branching in Drosophila is mediated by branchless FGF. Cell 1999, 99:211-220.
251. Sutherland D, Samakovlis C, Krasnow MA. branchless encodes a Drosophila FGF homolog that controls tracheal cell migration and the pattern of branching. Cell 1996, 87:1091-1101.
252. Centanin L, Ratcliffe PJ, Wappner P. Reversion of lethality and growth defects in Fatiga oxygen‐sensor mutant flies by loss of hypoxia‐inducible factor‐α/Sima. EMBO reports 2005, 6:1070-1075.
253. Reiling JH, Hafen E. The hypoxia-induced paralogs Scylla and Charybdis inhibit growth by down-regulating S6K activity upstream of TSC in Drosophila. Genes & development 2004, 18:2879-2892.

58
CHAPTER II: INTRA-ORGAN GROWTH COORDINATION IN DROSOPHILA IS
MEDIATED BY SYSTEMIC ECDYSONE SIGNALING
The work described in this chapter was published in the following manuscript: Gokhale, R. H.,
Hayashi, T., Mirque, C. D., & Shingleton, A. W. (2016). Intra-organ growth coordination in
Drosophila is mediated by systemic ecdysone signaling. Developmental Biology, 418(1), 135-
145.

59
Abstract
Regulation of final organ size is a complex developmental process that involves the integration
of systemic and organ-specific processes. Previously, we have shown that in developing
Drosophila, perturbing the growth of one imaginal disc – the parts of a holometabolous larva that
become the external adult organs – retards growth of other discs and delays development,
resulting in tight inter-organ growth coordination and the generation of a correctly proportioned
adult. Whether different parts of the same imaginal disc similarly coordinate their growth to
generate a functioning adult organ is, however, unclear. In this study, we use the wing imaginal
disc in Drosophila to study and identify mechanisms of intra-organ growth coordination. We
generate larvae in which the two compartments of the wing imaginal disc have ostensibly
different growth rates (WT or growth-perturbed). We find that there is tightly coordinated
growth between the WT and growth-perturbed compartments, where growth of the WT
compartment is retarded to match that of the growth-perturbed compartment. Crucially, this
coordination is disrupted by application of exogenous 20-hydroxyecdysone (20E), which
accelerates growth of the WT compartment. We further elucidate the role of 20E signaling in
growth coordination by showing that in WT discs, compartment-autonomous up-regulation of
20E signaling accelerates compartment growth and disrupts coordination. Interestingly, growth
acceleration through exogenous application of 20E is inhibited with suppression of the
Insulin/Insulin-like Growth Factor Signaling (IIS) pathway. This suggests that an active IIS
pathway is necessary for ecdysone to accelerate compartment growth. Collectively, our data
indicate that discs utilize systemic mechanisms, specifically ecdysone signaling, to coordinate
intra-organ growth.

60
Introduction
In multicellular organisms, organ growth is a tightly regulated developmental process, involving
coordination with growth of other organs in the body, and with overall body size, to generate a
correctly proportioned individual. Research in Drosophila over the last two decades has
elucidated the mechanistic details of a number of growth regulatory pathways that are known to
be essential for organ growth. Nevertheless, how these pathways are regulated systemically
during development to result in the generation of correctly proportioned organs and individuals
is not well understood.
The Drosophila wing imaginal disc is one of the most well studied models of organ growth and
patterning during development. Over the course of larval development, the wing imaginal disc
undergoes rapid growth, growing from ~50 cells to ~50000 cells over four days to generate the
tissue that metamorphoses into final adult wing and much of the thorax 1. Growth and patterning
in the wing disc is regulated organ autonomously by morphogens such as Dpp and Wg 2, 3 and
systemically by circulating growth factors such as insulin-like peptides 4, 5. Any growth
perturbation to the wing disc during development results in an increase in the developmental
time 6-8—presumably to allow the growth perturbed disc to grow to its correct size. This
developmental delay is mediated by the damaged wing disc suppressing the synthesis of the
molting hormone ecdysone in the prothoracic gland. Nevertheless, despite this increase in
developmental time, other undamaged imaginal discs do not overgrow but rather slow their
growth to match that of the damaged wing disc 6, 8-10 This indicates that there is some systemic
growth coordination mechanism that coordinates growth between organs.
Data from several recent studies are beginning to elucidate the mechanisms by which discs
regulate ecdysone synthesis and developmental timing. First, growth-perturbed discs secrete an

61
insulin-like peptide, dILP8 11, 12 which appears to inhibit the production of ecdysone in the
prothoracic gland by up-regulating the expression of nitric oxide synthase 10. Second, damaged
imaginal discs signal through a retinoid-dependent manner to repress prothoacicotropic hormone
(PTTH) production 8. PTTH is a positive regulator of ecdysteroidogenesis and so suppression of
PTTH synthesis also suppresses release of ecdysone. Whilst the mechanisms by which damaged
discs delay development are increasingly well understood, how damaged discs suppress growth
in undamaged discs is less clear. Intriguingly, there is increasing evidence that ecdysone is also a
positive regulator of imaginal disc growth 13. Therefore, the slow growth of undamaged imaginal
discs may well be because of low levels of circulating ecdysone. Indeed, there is strong evidence
that this is the case – in larvae with damaged discs the growth of the undamaged discs can be
rescued by feeding growth-perturbed larvae with 20 hydroxy ecdysone (20E) 9. Thus, exogenous
application of 20E disrupts inter-organ growth coordination.
Whilst we might expect systemic mechanisms to coordinate growth between organs, it is
unknown whether similar mechanisms exist to coordinate growth between different parts within
an organ. There is increasing evidence that organs have autonomous mechanisms to regulate
growth within tissues. These mechanisms appear to rely on the interaction between morphogens
and physical forces within a growing organ to control the rate and cessation of cell proliferation
and ensure uniform growth across a WT organ 14-16. However, it is unclear whether such organ-
autonomous mechanisms are sufficient to ensure uniform growth when one part of the organ is
growth perturbed.
Efforts to address the existence of intra-organ growth coordination have been made using the
developmental compartments of the wing imaginal disc. The wing imaginal disc consists of
distinct anterior (A) and posterior (P) developmental compartments, that reflect shared cell

62
lineage. The cell population in each compartment is specified early in development, and cells
within one compartment ostensibly grow relatively independently of cells in another
compartment. Martin and Morata generated wing imaginal discs in which the anterior and
posterior compartment had different rates of growth: the anterior compartment was wild type 17
and ‘fast growing’, while the posterior compartment was heterozygous for a Minute mutation and
‘slow growing’ 18. The authors found that the ‘fast growing’ anterior compartment was relatively
large early in development, but autonomously reduced its growth rate toward the end of
development such that by pupation both anterior and posterior compartments were the same size
as in mature wing imaginal discs. Based on these data, the authors proposed that individual
compartments function as independent developmental units, and that the growth and
development of one compartment is not linked to that of the other 18. On the other hand, recent
evidence suggests that perturbing the growth of the posterior compartment in the wing disc non-
autonomously reduces the growth rate of the adjacent anterior compartment 19. More recently,
autonomously increasing the growth rate of one compartment was shown to cause a
corresponding reduction in size of the adjacent compartment, a process shown to be dependent
on the proteoglycan Dally 20. These data suggest that growth rate of one compartment is, in fact,
dependent on the growth rate of its adjacent compartment. An open question, therefore, is
whether growth among the developmental compartments is indeed coordinated, and if it is, the
mechanism by which this is achieved.
Here we manipulate growth independently in different developmental compartments of the wing
imaginal disc in Drosophila, and show that there are indeed mechanisms that coordinate growth
among different parts of an organ. Surprisingly, however, this growth coordination is mediated
systemically, via ecdysone signaling: up-regulating ecdysone signaling in an individual

63
developmental compartment accelerates its growth and disrupts coordination. The ecdysone-
stimulation of growth is dependent on Insulin/Insulin-like Growth Factor Signaling (IIS),
contrary to previous findings that suggest that ecdysone suppresses growth by inhibiting IIS.
Collectively, our data support a model of growth that utilizes ecdysone and IIS to coordinate
growth both between and with organs.
Materials and Methods
Drosophila stocks
The fly stocks used in the study are as follows (full genotype and stock numbers are in
parentheses): Rps3plac92 (w1118; P{neoFRT}82B P{Ubi-GFP(S65T)nls}3R
P{A92}RpS3Plac92/TM6C, Sb1, 5627), InR.CA (y1 w1118; P{UAS-InR.del}2, 8248), InR.DN (y1
w1118; P{UAS-InR.K1409A}2, 8252), FRT 82B (w*; P{neoFRT}82B P{arm-lacZ.V}83B/TM6C,
Sb1 Tb1, 7369), EcR.RNAi (w1118; P{UAS-EcR-RNAi}104, 9327), en-RFP (w1118; P{en2.4-
GAL4}e16E, P{UAS-RFP.W}2/CyO, 30557), tub-Gal80ts (w[*]; sna[Sco]/CyO;
P{w[+mC]=tubP-GAL80[ts]}7, 7018) were obtained from the Bloomington Drosophila Stock
Center. RpS3.RNAi (w1118; P{GD4577}v37741, 37741), and its control 60000
(y,w[1118];P{attP,y[+],w[3`]}) were obtained from the Vienna Drosophila Stock Center. UAS-
FLP; mwh, jv, FRT2A/SM6a-TM6B, en-GAL4/CyO; RpS174, ubi-GFP, FRT2A were the kind gift
of Francisco Martin. ci-Gal4, UAS-FLP; was generated by Takashi Hayashi by recombination on
the X chromosome.
Generation of mitotic clones
We used the anterior imaginal disc driver cubitus interruptus (ci) or the posterior imaginal disc
driver engrailed (en) to drive the expression of a FLP recombinase in an FRT Minute

64
background. All flies were raised at low density on standard cornmeal/molasses medium, and
maintained at 25˚C unless otherwise stated.
Measurement of wing imaginal disc growth in growth-perturbed larvae
Larvae were raised on standard cornmeal/molasses medium supplemented with yeast in 60 x
15mm Petri dishes in constant light at 25°C. ci>EcR.RNAi, and corresponding control larvae
were raised at 17°C. Third instar larvae across a range of body sizes were collected on day 7
after egg lay (AEL). For the conditional knockdown using tub-Gal80ts, larvae were raised until
L1/L2 ecdysis at 17°C. Larvae were then collected in six hour cohorts and transferred to 29°C to
allow conditional expression of the RpS3.RNAi transgene and dissected at varying time points.
Wing imaginal discs were dissected in phosphate buffered saline (PBS), fixed in 4%
paraformaldehyde for 20 minutes, followed by washing with PBS containing 0.1% Triton-X-100
(PBT). Tissues were blocked in PBT containing 0.2% BSA and 2% NGS for 1h. Primary
antibody (mouse anti-En 4D9 (Hybridoma Center), 1:100) was incubated overnight at 4°C.
Secondary antibody (goat anti-mouse IgG Alexa Fluor 594 (Invitrogen), 1:1000) was incubated
for 2h at RT. Discs were mounted either in Vectashield (Vectorlabs) containing Hoechst 33258
(Sigma) (1:500) or in Vectashield containing DAPI. Discs were imaged on either a Leica
DM6000B microscope and measured using Image-Pro (Media Cybernetics) or on an Olympus
BX51 microscope and measured using ImageJ. We measured total disc area and the size of the
engrailed-stained posterior compartment. We calculated the size of the anterior compartment as
total disc size minus posterior compartment size.
20E treatment of larvae
Flies were allowed to lay for 24h on standard corn meal agar supplemented with yeast paste in
60X15mm Petri dishes and second instar larvae were collected 80h after egg deposition. Third

65
instar larvae were collected after second-to-third instar ecdysis in 4h cohorts. Either 0.75 mg of
20-hydroxyecdysone (20E) (A.G.Scientific) dissolved in 100% ethanol or an equal volume of
100% ethanol was added to 5ml of Instant Drosophila Medium (Ward's Natural Science). Larvae
were transferred to food with or without 20E 12h after ecdysis to third instar and imaginal wing
discs were dissected 24h later.
Statistical Analysis
All disc and compartment size data were log transformed prior to analysis, and the line-of-best-
fit was estimated using the major axis (MA) regression. The slope of ontogenetic allometry
between posterior and anterior compartment size was then calculated, and compared between
genotypes by the common slope test using the smatr package in R 9, 21. The common slope test
tests whether the slope of the MA regression varies among groups. The test assumes that there is
a linear relationship between covariates, that each group of observations is independently
sampled, and that the residual error is normally distributed. When conducting multiple common
slope tests involving the same control, we applied a Bonferroni correction to ostensibly
significant P-values by multiplying by the number of comparisons involving the control. We did
not apply the correction to non-significant P-values, since the correction does not render these P-
values significant. We used the ssnanova function in the gss package in R to fit a cubic spline to
non-linear growth trajectories, with a 95% confidence interval. Throughout, significance is set at
P <0.05. All data and an annotated R-script for the analyses are provided on Dryad.
Results
Growth is coordinated between compartments within an organ
To examine the coordination of growth between compartments throughout development, we
plotted the ontogenetic allometry of the anterior against the posterior developmental
66
compartment of the wing imaginal disc in Drosophila (Fig. 2-1A). The ontogenetic allometry is
the scaling relationship between the size of two morphological traits plotted through
development. When plotted on a log-log scale, the slope of the ontogenetic allometry is the ratio
of the logarithmic growth rates of the two traits 9. If compartments grew autonomously to a
target size, then slowing the growth of one compartment would change the ratio of its
logarithmic growth rate with respect to the other, and consequently, change the slope of the
ontogenetic allometry (solid line, Fig. 2-1A). On the other hand, if compartment growth were
mediated non-autonomously, then slow growth in one compartment would result in a
concomitant reduction in growth rate of the other compartment and maintain the ratio of their
logarithmic growth rates throughout development (broken line, Fig. 2-1A). Irrespective of a
change in intercept, a change in the slope of the ontogenetic allometry represents a change in the
relative logarithmic growth rate of one compartment relative to the other. We first determined
the ontogenetic allometry between compartments in ostensibly uniformly-growing wing imaginal
discs and asked whether this relationship depended on the growth rate of the disc as a whole. We
examined the relationship between the anterior and posterior compartments in WT and slow
growing heterozygous Minute larvae (M-/+). We used a previously described Minute allele,
P{A92}RpS3Plac92 , which in heterozygous flies delays development by 51h 22. In WT and (M-/+)
discs, the ontogenetic allometry is linear throughout growth of the third larval instar (Fig. 2-1B).
Further, the slope is the same in both WT and slow-growing M-/+ larvae (common slope test, P
= 0.8486) indicating that relative growth rates of the anterior and posterior compartments are
constant and independent of the growth rate of the disc as a whole (Fig. 2-1B′). Having
established that the ontogenetic allometry is the same in both fast growing and slow growing

67
Figure 2-1. Growth is coordinated among compartments within imaginal discs.
(A) The ontogenetic allometry between the anterior and posterior compartments in the third
instar wing imaginal disc in WT larvae (n = 63). Predicted ontogenetic allometries between the
anterior and posterior compartments in the third instar wing imaginal disc if compartment growth
is mediated compartment autonomously (heavy solid line) or compartment non-autonomously
(heavy broken line) (B) The ontogenetic allometry between anterior and posterior compartment
size in WT (gray circles) (n = 63) and M-/+ (open circles) (n = 50) imaginal discs are the same,

68
Figure 2-1 (cont’d)
indicating that the growth rate of the anterior relative to the posterior compartment is the same in
both fast- and slow-growing discs (common slope test, P = 0.8486) (B′). In contrast, the
ontogenetic allometry between anterior and posterior compartment size in antfast:postslow imaginal
discs (blue circles) (n = 46) is significantly different than in both WT and M-/+ discs (common
slope test, Bonferroni corrected P < 0.0074 for both), indicating that the anterior compartment
grows 8% more slowly relative to the posterior compartment when the posterior compartment is
growth perturbed (B′). All error bars are 95% confidence intervals. WT : ci-Gal4, UAS-FLP/+;
FRT82B arm-lacZ/+. M-/+: ci-Gal4, UAS-FLP; FRT82B, ubi-GFP, P{A92}RpS3Plac92 /+.
antfast:postslow: ci-Gal4, UAS-FLP; FRT82B, ubi-GFP, P{A92}RpS3Plac92 / FRT82B arm-lacZ.

69
wing discs, we generated larvae in which the anterior and posterior compartments ostensibly
have different growth rates.. This was achieved by generating larvae with the genotype ci-Gal4,
UAS-FLP; FRT82B, ubi-GFP, P{A92}RpS3Plac92 / FRT82B arm-lacZ. These larvae are
heterozygous for the Minute allele P{A92}RpS3Plac92 and are slow growing. However, in the
anterior compartment ci-GAL4 drives expression of the recombinase FLP, which induces mitotic
recombination to generate clones that are either homozygous for P{A92}RpS3Plac92 (M-/M-) or
homozygous for the WT allele (+/+). The M-/M- clones die leaving the +/+ clones to proliferate
and fill the entire compartment, evident by a loss of GFP (Fig. 2-2C). Consequently, the anterior
compartment is WT and ostensibly fast-growing relative to the posterior M-/+ compartment.
Therefore, we refer to these discs as antfast:postslow discs. It is important to note that anterior clone
generation is essentially complete by the end of the second instar (L2), and therefore, from the
beginning of the third instar (L3), the anterior compartment is almost entirely composed of +/+
cells left over after elimination of M-/M- cells. The initial cell doubling time of WT imaginal disc
cells is 5-6hrs early in L3 +/+ discs and increases to 30hrs at the end of L3, while that of M-/+
cells is ~11hrs in early L3 discs and increases to 34hrs at the end of L3 23. Thus, if compartments
do grow autonomously, the slope of the ontogenetic allometry between anterior (y-axis) and
posterior (x-axis) compartments should be significantly steeper in antfast:postslow discs,
particularly in smaller discs, when the difference in doubling time between of WT and M-/M-
cells is expected to be greatest. However, upon plotting the ontogenetic allometry of the anterior
(y-axis) and posterior (x-axis) compartment in antfast:postslow and WT larvae, we find that the
ostensibly ‘fast growing’ anterior compartment did not show an increase in growth rate (Fig. 2-
1B). Rather, the slope of the ontogenetic allometry in antfast:postslow discs
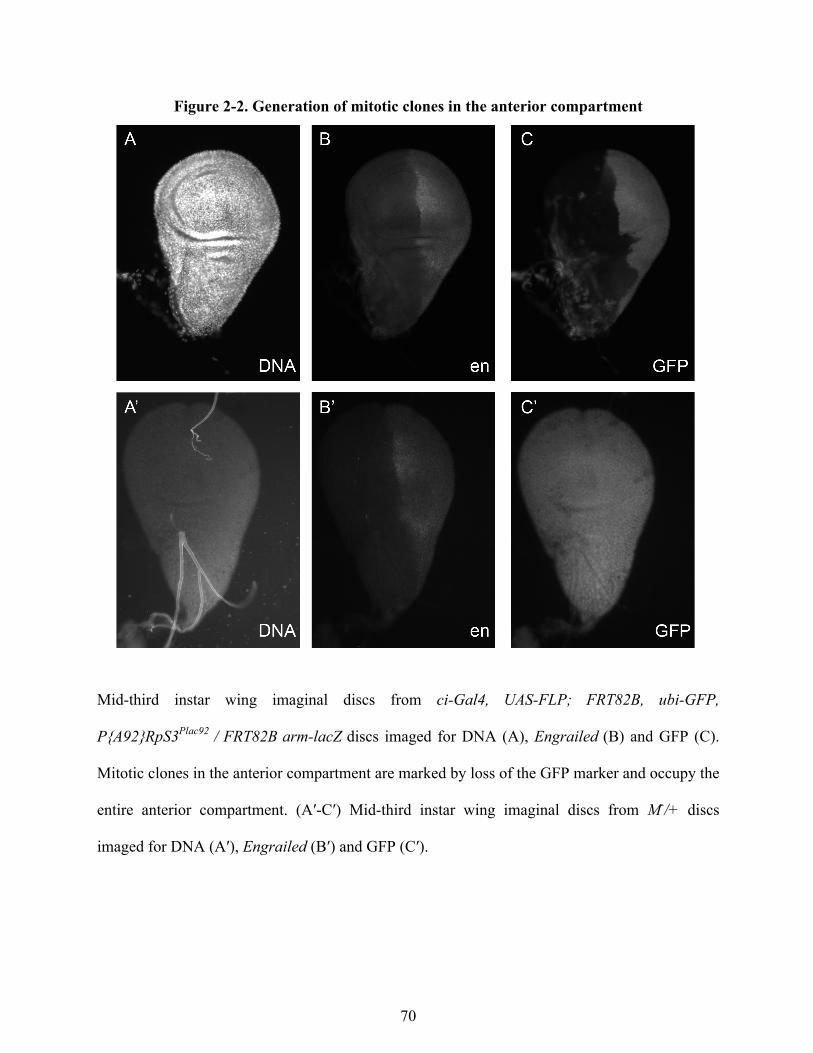
70
Figure 2-2. Generation of mitotic clones in the anterior compartment
Mid-third instar wing imaginal discs from ci-Gal4, UAS-FLP; FRT82B, ubi-GFP,
P{A92}RpS3Plac92 / FRT82B arm-lacZ discs imaged for DNA (A), Engrailed (B) and GFP (C).
Mitotic clones in the anterior compartment are marked by loss of the GFP marker and occupy the
entire anterior compartment. (A′-C′) Mid-third instar wing imaginal discs from M-/+ discs
imaged for DNA (A′), Engrailed (B′) and GFP (C′).

71
was slightly but significantly shallower than that in both WT and M-/+ control discs (common
slope test, Bonferroni corrected P < 0.0074 for both) indicating a ~8% reduction in the relative
growth rate of the anterior compartment relative to the posterior compartment in the third larval
instar (Fig. 2-1B’). This is the opposite of what is expected if the anterior compartment were
able to grow at a WT rate. It is possible that the reduced growth rate of the anterior compartment
is due to ongoing death of M-/M- cells, compensating for the increased rate of proliferation of
+/+ cells. However, this seems unlikely given that the anterior compartment is essentially
entirely composed of +/+ cells by the beginning of L3. Nevertheless, reduced growth rate of the
compartment may reflect changes in the rate of cell growth rather than cell proliferation.
We repeated the experiment using en-Gal4/UAS-FLP; RpS174, ubi-GFP, FRT2A/FRT2A larvae.
In these larvae, the posterior compartment is ostensibly fast growing, while the anterior
compartment is slow growing. We refer to these discs as antslow:postfast discs. In this case the
slope of the ontogenetic allometry of the posterior (y-axis) and anterior (x-axis) compartment is
slightly lower than in WT and M-/+ control disc (common slope test, P = 0. 0.0034), indicating
an ~11% reduction in the relative growth rate of the posterior compartment relative to the
anterior compartment (Fig. 2-3) Again this is contrary to what is expected if the posterior
compartment were able to grow at a WT rate.
To ensure that any differences in relative compartment growth rate between genotypes was not
due to experimental error, and to determine the precision of our methodology, we repeated our
experiment to determine the ontogenetic allometry of compartments in both WT and
antfast:postslow wing imaginal discs. We found that the slopes of the replicate ontogenetic
allometries differed by, on average, 0.14%, and were statistically indistinguishable (Fig. 2-4).

72
Figure 2-3. Growth is coordinated in antslow:postfast discs
(A) The ontogenetic allometry between anterior and posterior compartment size in WT (gray
circles) (n = 23), M-/+ (open circles) (n = 49) and antslow:postfast (blue circles) (n = 33) imaginal
discs are significantly different (common slope test, P = 0.0034), indicating that the anterior
compartment grows 11% more slowly relative to the posterior compartment when the latter is
ostensibly growth perturbed (B). All error bars are 95% confidence intervals. (WT: en-Gal4,
UAS-RFP/+. antslow:postpost: en-Gal4/UAS-FLP; RpS174, ubi-GFP, FRT2A/ FRT2A ri mwh, M-
/+ : CyO/UAS-FLP; RpS174, ubi-GFP, FRT2A /FRT2A ri mwh)
\

73
Figure 2-4: Repeated determination of ontogenetic allometry in WT and antfast:postslow discs.
(A) The slope of the ontogenetic allometry between anterior and posterior compartment size in
WT discs is the same when measured in two independent biological samples (n1 = 63; n2 = 42)
(common slope test, P=0.9508). (B) The slope of the ontogenetic allometry between anterior and
posterior compartment size in antfast:postslow discs is the same when measured in two independent
biological samples (n1 = 46; n2 = 44) (common slope test, P=0.9619). For both charts, data used
in Fig. 2-1 and 4 are blue, data for repeated measure are orange. Average difference in slope
between repeated measures is 0.14% of the steeper slope. (WT : ci-Gal4, UAS-FLP/+; FRT82B
arm-lacZ/+; antfast:postslow: ci-Gal4, UAS-FLP; FRT82B, ubi-GFP, P{A92}RpS3Plac92 / FRT82B
arm-lacZ.)

74
Collectively, these data indicate that, as for growth between imaginal discs 9, there are
mechanisms that prevent the overgrowth of ostensibly WT compartments in larvae that are
otherwise growth-perturbed. We refer to these mechanisms as ‘growth coordination
mechanisms’. This coupling of growth rates is observed regardless of which compartment is
growth perturbed.
Since larvae of the genotype antfast:postslow are genotypically identical to M-/+ larvae in all tissues
except the anterior compartment, it is not clear whether it is the growth-perturbed posterior
compartment that is mediating a reduction in growth rate of the anterior compartment. Therefore,
in order to identify whether growth coordination between compartments can be mediated by a
compartment-autonomous growth perturbation, we generated larvae in which one compartment
was slow-growing due to a ribosomal protein knockdown similar to our previous study 9.
Knocking down RpS3 in the anterior or posterior compartment results in larval lethality at the L1
stage. We then used a posterior compartment temperature-regulated conditional knockdown of
RpS3 starting at L1/L2 ecdysis to generate growth perturbed discs of the genotype en-Gal4,
UAS-RFP/RpS3.RNAi; tub-Gal80ts/+. In these larvae, only the posterior compartments of
imaginal discs have a growth perturbation, whereas other larval organs are un-growth perturbed.
Surprisingly, in these discs there is a severe loss of compartment identity and cells expressing
Engrailed are almost, but not completely, eliminated during L3. Nevertheless, there is a strong
reduction in growth rate of the wing disc during L3 relative to the discs of control larvae (Fig. 2-
5). Further, if one consider the discs of en-Gal4, UAS-RFP/RpS3.RNAi; tub-Gal80ts/+ larvae to
essentially comprise only the anterior compartment, they also grow slower than the anterior
compartment of WT discs (Fig. 2-5).
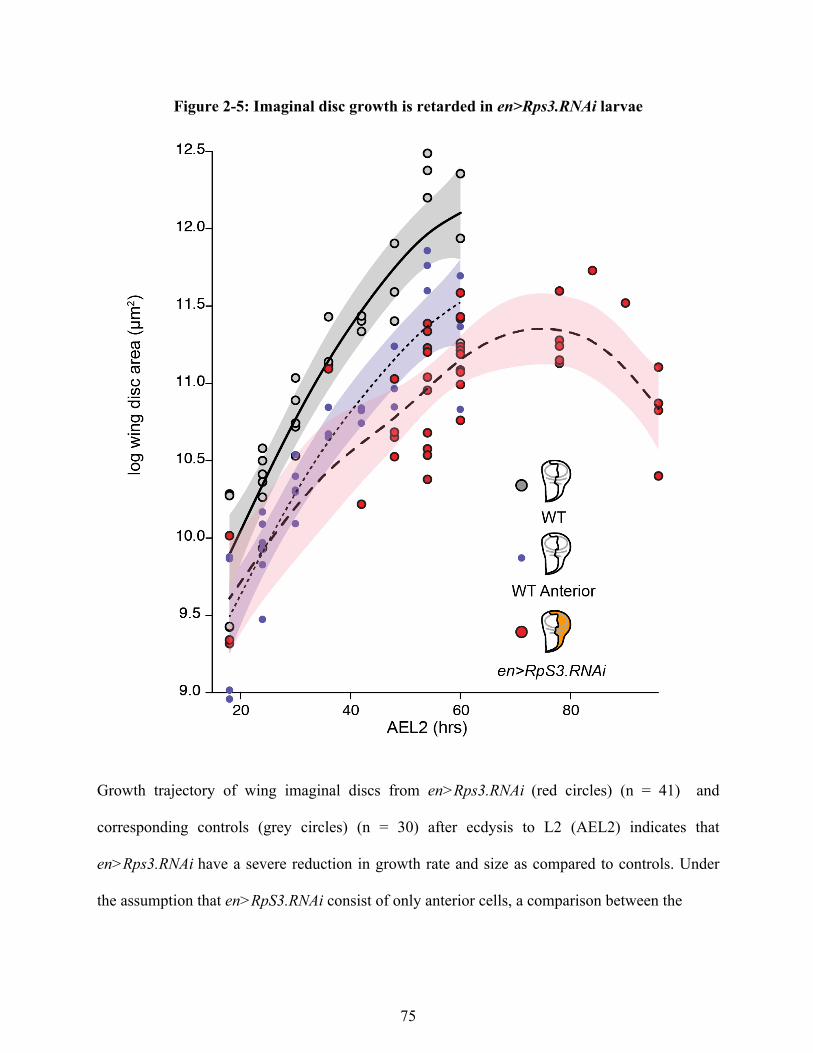
75
Figure 2-5: Imaginal disc growth is retarded in en>Rps3.RNAi larvae
Growth trajectory of wing imaginal discs from en>Rps3.RNAi (red circles) (n = 41) and
corresponding controls (grey circles) (n = 30) after ecdysis to L2 (AEL2) indicates that
en>Rps3.RNAi have a severe reduction in growth rate and size as compared to controls. Under
the assumption that en>RpS3.RNAi consist of only anterior cells, a comparison between the

76
Figure 2-5 (cont’d)
growth trajectory of the anterior compartment in WT wing imaginal discs (purple circles) (n =
30) and en>RpS3.RNAi wing imaginal discs indicates that en>RpS3.RNAi are still growth
retarded as compared to controls. Shading indicates 95% confidence intervals. (WT: en-Gal4,
UAS-RFP/60,000; tub-Gal80ts/+. en>RpS3.RNAi: en-Gal4, UAS-RFP/UAS-RpS3.RNAi; tub-
Gal80ts/+)

77
Ecdysone treatment results in a disruption of growth coordination between compartments
We have previously shown that low levels of ecdysone are necessary for inter-disc growth
coordination. In larvae with growth-perturbed wing discs and low levels of ecdysone synthesis,
feeding 20E rescues the growth rate of other non-growth perturbed imaginal discs to a near-WT
growth rate 9. We reasoned therefore, that ecdysone signaling may also be involved in mediating
coordination between compartments within discs. To test this hypothesis, we fed 20E to larvae
with antfast:postslow discs and measured the ontogenetic allometry of the anterior and posterior
compartments in the wing imaginal disc. Larvae were staged at the L2-L3 transition and
collected in 4h cohorts, and then 12h later transferred to food containing 20E or ethanol (EtOH).
Wing imaginal discs were dissected 24h after transfer to 20E or EtOH containing food, and
compartment sizes were measured as previously described. We found that, as for inter-organ
growth coordination, ecdysone is involved in mediating intra-organ growth coordination and this
can be disrupted by exogenous application of 20E. In 20E-fed larvae with antfast:postslow discs,
the slope of the ontogenetic allometry of the anterior compartment size against the posterior
compartment size is significantly higher than that of the EtOH-treated control (common slope
test, P = 0.0044) (Fig. 2-6A). As previously described, an increase in the slope of the
ontogenetic allometry indicates that the anterior compartment has a greater relative growth rate
compared to the posterior compartment. Analysis of the slopes indicates that there is a ~40%
growth acceleration in the anterior compartment relative to the posterior in 20E-fed antfast:postslow
larvae (Fig. 2-6A′). This is not because the anterior compartment is particularly responsive to
ecdysone. In M-/+ larvae, where growth of the whole disc is uniformly slowed, 20E treatment
does not significantly affect the relative growth rate of the anterior compartment against the
posterior compartment (common slope test, P = 0. 9850) (Fig. 2-6B, 2-6B′). These results

78
Figure 2-6. 20E treatment disrupts growth coordination between compartments in antfast:postslow larvae.

79
Figure 2-6 (cont’d)
(A) The ontogenetic allometry between anterior and posterior compartment size in antfast:postslow
imaginal discs from larvae fed EtOH (gray circles) (n = 24) or 20E (open circles) (n = 22) are
significantly different (common slope test, P = 0.0044), indicating that 20E application increases
the anterior compartment’s relative growth rate by 40% (A′). (B) The ontogenetic allometry
between anterior and posterior compartment size in M-/+ imaginal discs from larvae fed EtOH-
fed M-/+ (gray circles) (n = 25) or 20E (open circles) (n = 20) are the same (common slope test,
P = 0. 9850), indicating that 20E application does not affect the relative growth rate of the
compartments in wholly slow-growing wing imaginal discs (B′). All error bars are 95%
confidence intervals. antfast:postslow: ci-Gal4, UAS-FLP; FRT82B, ubi-GFP, P{A92}RpS3Plac92 /
FRT82B arm-lacZ.

80
indicate that in 20E-fed antfast:postslow discs, there is an acceleration of growth in the anterior
compartment relative to the posterior compartment, indicating a disruption of the intra-organ
growth coordination.
Growth coordination between compartments is disrupted by changes in EcR signaling
If exogenous application of 20E to antfast:postslow larvae results in acceleration in the growth rate
of the anterior compartment, then organ autonomous up-regulation of ecdysone signaling should
also alter WT inter-compartmental coordination. In order to test this, we exploited the fact that
the unliganded EcR protein in complex with Ultraspiracle (Usp) represses target genes by
binding to gene promoters 24-26. On binding of EcR to 20E, the EcR-Usp complex undergoes a
conformational change, and bound genes become transcriptionally active both through de-
repression and activation of gene expression through recruitment of additional co-factors 27, 28.
Thus, suppression of EcR expression by RNAi-knockdown eliminates repression of the EcR-Usp
complex on target genes, and, for some targets, would be equivalent to 20E-dependent increase
in gene expression. Evidence for this comes from the observation that knocking down EcR
expression in the wing disc promotes precocious expression of patterning genes such as
Senseless and Cut and differentiation genes such as Broad 29. If knocking down EcR can drive
patterning we reasoned it might also drive growth and proliferation of the wing imaginal disc.
Therefore, to test whether compartment autonomous upregulation of ecdysone signaling could
also disrupt coordination between compartments, we knocked down EcR expression in the
anterior compartment in both antfast:postslow and WT larvae. In WT discs, knocking down EcR in
the anterior compartment alters coordination between compartments and increases the growth
rate of the anterior compartment relative to the posterior compartments and increases the growth
rate of the anterior compartment relative to the posterior by ~8% (common slope test, P =

81
0.0243) (Fig. 2-7A, 2-7B). This modest acceleration in growth likely reflects the fact that
ecdysone synthesis is not retarded in WT larvae and so our manipulation only moderately
increased ecdysone signaling above endogenous levels. To test whether knockdown of EcR in
the anterior compartment had a more marked effect on growth coordination when endogenous
ecdysone levels are low we repeated the experiment in antfast:postslow discs. We failed, however,
to recover L3 larvae. Nevertheless, our data support a role for 20E in promoting growth of
imaginal discs and in growth coordination across a disc.
Growth coordination between compartments is disrupted by changes in Insulin-signaling
Collectively, our data suggest that in the context of coordinated growth within and between
imaginal discs, ecdysone functions as a growth promoter. This role for ecdysone as a growth
promoter is supported by recent findings that show that imaginal disc growth is slowed when
ecdysone synthesis is inhibited or absent, and rescued when ecdysone levels are restored 9, 10, 13.
However, this is contrary to the known role of ecdysone in suppressing the growth of larval
tissues by suppressing the IIS pathway 30-32. Together, these data suggest that ecdysone may have
different effects on different tissues. If ecdysone suppresses growth by suppressing the IIS
pathway in larval tissues, it is possible that it activates growth in imaginal discs through the same
pathway. We therefore explored whether, like ecdysone signaling, IIS/TOR signaling is
sufficient to alter coordination between developmental compartments within discs. We first up-
and down-regulated IIS in the anterior compartment of WT wing imaginal disc, by expressing a
constitutively active (InR.CA) and dominant negative (InR.DN) form of the insulin receptor,
respectively. We found that, whilst the anterior compartment was proportionally larger (InR.CA)
or smaller (InR.DN) relative to the posterior compartment than in controls, the relative growth
rate of the two compartments was unchanged in either manipulation (Fig. 2-8A, 2-8A′). Thus,

82
Figure 2-7. EcR knockdown in the anterior compartment disrupts growth coordination in WT larvae
(A) The ontogenetic allometry between anterior and posterior compartment size in WT(gray
circles) (n = 38) and ci>EcR.RNAi (blue circles) (n = 28) imaginal discs, both reared at 17˚C, are
significantly different (common slope test, P = 0.0243), indicating that partially up-regulating
ecdysone signaling by knockdown of EcR increases the relative growth rate of the anterior
compartment by 8% (B). All error bars are 95% confidence intervals. WT: ci-Gal4, UAS-FLP/+
raised at 17°C. ci>EcR.RNAi: ci-Gal4, UAS-FLP/+; UAS-EcR.RNAi/+ raised at 17°C.

83
Figure 2-8. InR expression is necessary but not sufficient to disrupt intra-organ growth coordination.
(A) The slope of the ontogenetic allometry between anterior and posterior compartment size in
WT (gray circles) (n = 63), ci-Gal4>InR.CA (pink circles) (n = 25) , and ci-Gal4>InR.DN (blue
circles) (n = 54) imaginal discs are the same (common slope test, P=0.4899), indicating that up-
or down-regulating IIS in the anterior compartment alone does not affect its growth rate relative
to the posterior compartment (A′). (B) The slope of the ontogenetic allometry between anterior
and posterior compartment size in antfast:postslow (gray circles) (n = 46), antfast, InR.CA:postslow (pink

84
Figure 2-8 (cont’d)
circles) (n = 25) and antfast, InR.DN:postslow (blue circles) (n = 37) imaginal discs are significantly
different (Common slope test, Bonferroni corrected P<0.0001), indicating that changes IIS in the
anterior compartment in antfast:postslow discs is sufficient to affect its growth rate relative to the
posterior compartment (B′).

85
Figure 2-8 (cont’d)
(C) The slope of the ontogenetic allometry between the anterior and posterior compartment in
antfast, InR.DN:postslow imaginal discs is the same in 20E-fed (blue open circles) (n = 17) and
EtOH-fed larvae (blue filled circles) (n = 17) (common slope test, P= 0.3942), indicating that
the elevated relative growth rate of the anterior compartment in response to 20E (Fig 2A) is
inhibited when IIS is suppressed in the anterior compartment (C′). The ontogenetic allometries of
antfast:postslow fed either 20E or EtOH (Fig 2A) are presented for reference. WT: ci-Gal4, UAS-
FLP/+; FRT82B arm-lacZ/+. ci>InR.DN: ci-Gal4, UAS-FLP/+; UAS-InR.K1409A 33/+.
ci>InR.CA: ci-Gal4, UAS-FLP/+; UAS-InR.del 33/+, antfast:postslow. ci-Gal4, UAS-FLP;
FRT82B, ubi-GFP, P{A92}RpS3Plac92 / FRT82B arm-lacZ (Control). antfast, InR.DN:postslow: ci-
Gal4, UAS-FLP; UAS-InR.K1409A 33/+; FRT82B, ubi-GFP, P{A92}RpS3Plac92 / FRT82B arm-
lacZ. antfast, InR.CA:postslow: ci-Gal4, UAS-FLP; UAS-InR.del 33)/+ FRT82B, ubi-GFP,
P{A92}RpS3Plac92 / FRT82B arm-lacZ. Note that the WT and antfast:postslow data are the same as
those in Fig. 2-1A, and 1B since these experiments were conducted in parallel and the data split
between Fig. 2-1 and Fig. 4.

86
upregulation or downregulation of InR in otherwise WT imaginal discs affects compartment size,
but not their relative growth rates in L3 larvae.
Counterintuitively, expression of InR.DN in the anterior compartment increases its growth rate
relative to the posterior compartment, whilst expression of InR.CA has the opposite effect (Fig.
2-8B, 2-8B′). The result is that compartment autonomous changes in insulin-signaling have less
of an effect on final anterior-to-posterior size ratio in antfast:postslow discs than in otherwise WT
discs (Fig. 2-9).
We then asked whether IIS is necessary for the ecdysone-mediated alteration of growth
coordination in antfast:postslow wing imaginal discs, by expressing a dominant negative allele of
InR (InR.DN) in the anterior compartment when larvae were fed 20E. Analysis of the
ontogenetic allometry between anterior and posterior compartment-sizes in the 20E fed larvae
reveals that the slope of this ontogenetic allometry is not significantly different than that in the
EtOH treated larvae (Fig. 2-8C, 2-8C′). Thus, the 20E treatment fails to disrupt growth
coordination in larvae with autonomous down-regulation of IIS in the anterior compartment,
supporting the hypothesis that IIS in the anterior compartment is necessary for 20E stimulated
growth.
Note that in the EtOH-treated larvae (Fig 2-8C, 2-8C′) the slope of the ontogenetic allometry is
not significantly different between antfast:postslow and antfast, InR.DN:postslow discs (common slope
test, P = 0.2632). It is possible that ethanol bypasses the effects of compartment-autonomous
down-regulation of IIS on growth coordination (Fig. 2-8B, 2-8B′). A more likely explanation,
however, is that our inability to detect a difference reflects reduced statistical power due to a
smaller sample size. This is supported by the observation that in both antfast:postslow and antfast,

87
Figure 2-9 Compartment autonomous changes in IIS have reduced effect on final anterior:posterior ratio in antslow:postfast discs
The effects of increased InR activity in the anterior compartment has significantly less effect on
final anterior:posterior ratio in antfast, InR.CA:postfast discs (log (A/P) = 0.69) than in ci>InR.CA
discs (log (A/P) = 0.8). Similarly, decreased InR activity in the anterior compartment has less
effect, albeit not significantly, on final anterior:posterior ratio in antfast, InR.DN:postfast discs (log
(A/P) = -0.23) than in ci>InR.DN discs (log (A/P) = -0.28) (n = 10-12 for each group). Columns
with different letters are significantly different (Tukey post-hoc test, P < 0.05)
88
InR.DN:postslowdiscs, relative growth rate of the anterior and posterior compartments is the same
with and without EtOH treatment (common slope test, P > 0.2307 for both)..
Discussion
Our results reveal that growth among developmental compartments in an organ is tightly
coordinated, such that even if the growth of one compartment is perturbed, both compartments
grow at more-or-less the same relative rate as observed in WT flies. This growth coordination
between compartments is disrupted by exogenously feeding 20E to growth-perturbed larvae,
resulting in an acceleration in the growth rate of the unperturbed compartment. This growth
acceleration upon feeding 20E is dependent on IIS in the unperturbed compartment. Collectively
these data support a model of imaginal disc growth regulation whereby growth perturbation in
one compartment causes a systemic reduction in circulating ecdysteroids, which results in
reduction in growth rate of the adjacent compartment.
These data are surprising in light of previous studies that suggest that imaginal discs and
individual compartments within imaginal discs can autonomously grow to their target size.
Bryant and Levinson cultured WT imaginal discs in the abdomen of adults hosts and found that
these discs grow autonomously to their normal size 34. More recently, Martin and Morata
generated ‘fast’ discs and compartments in M-/+ larvae and demonstrated that these
compartments have higher growth rates relative to the body as a whole and to adjacent
compartments 18, 23. These authors further demonstrate that the ‘fast’ compartments and discs are
developmentally advanced as compared to M-/+ controls. Collectively, these data support the
hypothesis that imaginal disc possesses an autonomous mechanism for arresting growth once
they reach a target size, and that this mechanism operates at the level of developmental
compartments. Whilst compartments may possess a target size, our data suggest that they do not

89
grow independently to this size, at least in vivo. Rather growth between developmental
compartments is coordinated even when one compartment is growth perturbed, and this growth
coordination appears to be regulated by systemic rather than disc autonomous mechanisms.
Our conclusions are supported by data from Mesquita et. al 19, who also looked at inter-
compartmental growth in the Drosophila wing imaginal disc. They observed that slowing the
growth of one compartment non-autonomously slowed the growth of the adjacent compartment.
They further demonstrate that the signal from the growth-perturbed compartment is dependent on
Drosophila p53. However, they do not elucidate what the signal is. Our results suggest that the
signal involves ecdysone. This is surprising given our current understanding of wing imaginal
disc growth. Recent models of disc growth suggest that growth of the wing imaginal disc is
driven mainly by morphogen gradients formed by the patterning genes Wg, Dpp, and Vg, which
drive cellular proliferation within the disc 14, 35-39. More recent studies further implicate disc-
autonomous mechanisms in regulating the relative size of different compartments within the
wing20. Our data show that systemic signaling, mediated by ecdysone, is also critical for
regulating growth rates among different parts of the disc.
The involvement of ecdysone in intra-organ growth coordination echoes its known role in inter-
organ growth coordination. As noted above, growth among organs is tightly coordinated when
one organ is growth perturbed—a consequence of the growth-perturbed organ suppressing
ecdysone synthesis 8, 9. Addition of ecdysone to these growth-perturbed larvae is able to rescue
the growth rate of undamaged imaginal discs. Ecydosne is however not able to rescue the growth
rate of the growth perturbed tissues 9, most likely because the inherent growth perturbation of
these tissues prevents them from responding to ecdysone. Similar to these studies on inter-organ
growth coordination, our data suggest ecdysone is able to rescue the growth rate of WT

90
compartments in M-/+ larvae, and this is mediated by compartment-autonomous ecdysone
signaling.
Whilst our data indicate that ecdysone is an important growth-coordinating signal among
developmental compartments, it is unclear precisely which tissue is influencing ecdysone
synthesis. It is possible that in larvae with antfast:postslow discs, since the whole of the rest of the
larva is Minute, the limitation on ecdysone might be an autonomous effect of the Minute
mutation on the prothoracic gland. However, our data demonstrate that knock-down of RpS3
using engrailed-GAL4, which is not expressed in the prothoracic gland, still retards disc growth.
This suggests that the growth coordination mechanism is regulated by a signal from the
compartments themselves. As discussed above, in studies where systemic growth is retarded
through localized tissue damage, including knock-down of ribosomal proteins, it is the
damaged/growth-pertrubed tissue itself that inhibits ecdysone synthesis by signaling via dILP8
10-12. Therefore, in larvae with antfast:postslow discs, ecdysteroidgenesis could be limited via a
dILP8-dependent mechanism. Which compartment is generating a putative dILP8 signal is,
however, unclear. dILP8 levels are highest at the L2-L3 transition and decline during L3, before
increasing somewhat before pupariation (Colombani et al. 2012). It is possible, therefore, that in
larvae with antfast:postslow discs, it is the immature slow-growing posterior compartment that is
secreting dILP8. Conversely, the residual generation and death of M-/- cells in the anterior
compartment through mitotic recombination early in L3 may also drive dILP8 synthesis. Further
experiments exploring the role of dILP8 in intra-organ growth coordination are clearly
necessary.
A key feature of growth coordination is that ecdysone acts as a promoter of growth for imaginal
discs. This appears contrary to previous findings that show that ecdysone inhibits larval body

91
growth by inhibiting IIS or Myc in the fat body 31, 40. However, evidence from other insect
species suggests that ecdysone can function as either a growth promoter or inhibitor, depending
on its concentration 41. Specifically, in vitro evidence from Manduca shows that low
concentrations of ecdysone can promote growth of imaginal tissues, while higher concentrations
stimulate differentiation, and stop cell proliferation 42. Further evidence from Manduca suggests
that ecdysone promotes mitosis by regulating the cell cycle, and thus acts as a mitogen43, 44.
These data echo data from Drosophila that suggests that ecdysone regulates cell cycle
progression and promotes imaginal disc growth via the ecdysone inducible gene crooked legs 44.
Collectively, it is apparent, therefore, that ecdysone is a central regulator of larval and imaginal
tissue growth, although the tissue-specific effects and molecular mechanisms involved have not
yet been completely elucidated. Research from our and other labs support the hypothesis that
imaginal discs reduce their growth rates in response to low levels of ecdysone 9, 13. At the same
time, low levels of ecdysone increase body growth rate and final adult body size 31. Together
these data suggest that ecdysone suppresses the growth of larval tissue (which comprises the
majority of the larva) but promotes growth of imaginal tissues. This hypothesis has intuitive
appeal in that a key function of ecdysone is to ‘prepare’ the larva for pupariation and
metamorphosis, a process that involves breakdown and autophagy of the larval tissues to provide
nutrients for final growth and differentiation of the imaginal discs.
Research over the past decade has elucidated mechanisms by which ecdysone functions as a
suppressor of larval growth. These studies demonstrate a role for IIS in ecdysone-mediated
suppression of larval growth. Specifically, ecdysone signaling in the fat body suppresses IIS,
which in turn inhibits systemic IIS and larval growth through repression of dILP2 release from
the brain and promotes fat body autophagy 30-32, 45, 46. How ecdysone promotes imaginal disc
92
growth is less clear, however. A recent paper by Herboso et al, indicated that ecdysone promotes
growth by suppressing Thor signaling in the imaginal discs. Discs from larvae with reduced
ecdysone synthesis have elevated levels of Thor, a repressor of growth that is a target of the IIS
pathway. The hypothesis that ecdysone regulates and coordinates growth via IIS/TOR signaling
is further supported by our observation that down-regulation of InR activity prevents the WT
compartment of antfast:postslow discs from increasing its relative growth rate in response to
ecdysone.
However, additional data suggest a more nuanced role for IIS in coordinating growth among
developmental compartments. In particular, changes in InR activity in the anterior compartment
do not affect relative compartment growth rate in larvae that are otherwise wholly WT. Rather,
changes in InR activity increase or decrease relative compartment size, presumably due to
changes in compartment growth earlier in development. This is surprising, given that mutations
of InR reduce the growth and proliferation of clones in the wing imaginal disc during L347. In
antfast:postslow discs, however, changes in InR activity does alter growth coordination during L3,
but in a counterintuitive way: reduced InR activity increases relative growth rate, whilst
increased InR activity decreases relative growth rate. This is the opposite of what we would
predict if ecdysone promotes growth by directly upregulating IIS. One interpretation of these
data is that the anterior compartments of the antfast:postslow disc adjust their relative growth rate to
rescue the final anterior:posterior size ratio, presumably using a mechanism independent of
ecdysone. Why this rescue is not evident in WT larvae is unclear, but suggest that the rescue
mechanism is able to override the ecdysone-regulated mechanism that coordinates growth rates
between compartments with different potential growth rates.

93
From our study and those of others, it seems unlikely that ecdysone promotes imaginal disc
growth only through its effects on IIS. In particular, the role of ecdysone in the regulation of
differentiation and patterning genes such as Broad, Senseless and Cut has been well elucidated 24,
29. Patterning genes are known to regulate cell proliferation 48. It is therefore possible that
ecdysone also regulates imaginal disc growth by regulating the expression of patterning genes in
the imaginal disc. One of the challenges in elucidating the role of ecdysone signaling in imaginal
disc development is that manipulating ecdysone-signaling organ-autonomously in imaginal discs
is technically difficult. We likely only subtly up-regulated ecdysone signaling by knocking down
EcR compartment-autonomously and found that this mild knockdown accelerated compartment
growth. It is seems likely that this effect is related to the degree of the knockdown, however, for
two reasons. First, complete knockdown of EcR will ultimately block ecdysone signaling, even if
it de-represses the expression of certain genes. Second, ecdysone levels can both promote and
inhibit insect growth and development depending on its level. As discussed above, moderate
level of ecdysone are sufficient to stimulate imaginal disc growth in vitro, while high levels
suppress cell proliferation 42. More precise methods of manipulating ecdysone signaling at a
cellular and tissue level are therefore needed.
In summary, our study provides evidence for an ecdysone-dependent mechanism that coordinates
growth between compartments in the wing imaginal disc of Drosophila. Our data suggest that
the control of cell proliferation across the imaginal disc is not an entirely autonomous process,
but is coordinated through humoral signaling. Our research also highlights the crosstalk between
different systemic signaling mechanisms – insulin/IGF- and ecdysone-signaling – in the
generation of correctly proportioned organs. The developmental mechanisms regulating organ
size, while best studied in Drosophila, are conserved across all animals. It is likely, therefore,

94
that the mechanisms coordinating growth between and within organs would also be conserved.
There is considerable evidence that localized growth perturbation causes systemic growth
retardation in humans. For example, children suffering from chronic inflammatory diseases such
as Crohn’s disease have systemic growth hormone insensitivity and experience severe growth
retardation as a complication of the disease 49. The utilization of systemic signaling mechanisms
to coordinate growth within and between organs may thus be a conserved mechanism across all
animals.

95
APPENDIX

96
Materials and Methods
Drosophila stocks
The fly stocks used in the study are as follows (full genotype and stock numbers are in
parentheses): Foxo21 (yw; Foxo21/TM3, Sb, Lab Stock), Foxo.RNAi (w*; UAS-Foxo.RNAi,
VDRC 30556), Thor.RNAi (w[*]; P{w[+mC]=UAS-Thor.wt}2, BDSC 9147), Thor. RNAi (y[1]
sc[*] v[1]; P{y[+t7.7] v[+t1.8]=TRiP.HMS01555}attP40, BDSC 36667)
Generation of mitotic clones and measurement of wing imaginal disc
Wing imaginal discs were dissected and measured as previously earlier in the chapter. Mitotic
clones in the anterior compartment were generated as previously described.
Results and Discussion
In order to identify the targets of EcR and/or ecdysone signaling in the imaginal disc which may
be involved in the coordinated growth of compartments, we explored the role of two effectors
downstream of the IIS/TOR pathway. As previously stated, ecdysone has been recently shown to
promote imaginal disc growth by negatively regulating the expression of Thor, a repressor of
growth that is a target of the IIS/TOR pathway. Since compartment-autonomous increases in
ecdysone signaling can break intra-organ growth coordination we reasoned that knock down of
Thor expression may do the same by accelerating the growth rate. In order to test this hypothesis,
we measured the ontogenetic allometry between compartments in larvae with an anterior
compartment knockdown of Thor. We find that there is no difference between the growth rates
between control and knockdown discs (Fig. 2-10A, A′). Simultaneously, we also tested whether
overexpression of Thor disrupted growth coordination between compartments (Fig. 2-10B, B′).
Once again we find that overexpression of Thor had no effect on the ontogenetic allometry
between compartments.

97
Figure 2-10 Compartment autonomous modulation of Thor expression does not disrupt intra-organ growth coordination

98
Figure 2-10 (cont’d)
(A) The slope of the ontogenetic allometry between anterior and posterior compartment size in
WT (gray circles) (n = 63) and ci>Thor.RNAi (blue circles) (n = 26) imaginal discs are not
significantly different (common slope test, P > 0.05) indicating that Thor knockdown in the
anterior compartment does not affect its growth rate relative to the posterior compartment (A′)
(B) The slope of the ontogenetic allometry between anterior and posterior compartment size in
WT (gray circles) (n = 63) and ci>Thor.WT (pink circles) (n = 27) imaginal discs are not
significantly different (common slope test, P > 0.05) indicating that overexpression of Thor in
the anterior compartment does not affect its growth rate relative to the posterior compartment
(B′). All error bars are 95% confidence intervals. WT: ci-Gal4, UAS-FLP/+. ci>Thor.RNAi: ci-
Gal4, UAS-FLP/+; UAS-Thor.RNAi/+. ci>Thor.WT: ci-Gal4, UAS-FLP/+; UAS-Thor.WT/+;

99
Lastly, we tried to identify whether the disruption in growth coordination between compartments
in antfast, InR.CA:postslow discs could be recapitulated by manipulating expression of dFoxo, a
downstream target of the IIS pathway. In order to test this, we generated antfast, foxo21:postslow
larvae in which the anterior compartment was dFoxo null. In these larvae, the anterior
compartment is homozygous for the dFoxo null allele foxo21 and is therefore expected to have
an increased growth rate relative to the posterior. However, on analyzing the ontogenetic
allometry between compartments in antfast, foxo21:postslow and control, we find that compartment-
autonomous manipulation of foxo does not increase the relative growth rate of the anterior
compartment (Fig. 2-11A, A′). We also assessed the effect of manipulation dFoxo expression in
WT larvae, by measuring the ontogenetic allometry in larvae with an anterior compartment
knockdown of dFoxo. In these larvae as well, dFoxo knockdown has no effect on the ontogenetic
allometry between anterior and posterior compartments as compared to WT (Fig. 2-11B, B′).
These results suggest an intriguing role for IIS in mediating intra-organ growth coordination.
While compartment autonomous modulation of dFoxo with a null allele does not disrupt
coordination between compartments, up-regulating or down-regulating IIS by modulating
activity of InR has a significant effect in perturbing intra-organ growth coordination.
Additionally, preliminary data suggests that up-regulating IIS in the anterior compartment by
dFoxo knockdown in antfast:postslow disrupts intra-organ growth coordination in a manner similar
to that in antfast, InR.CA:postslow imaginal discs (data not shown). Moreover, in larvae systemically
null for dFoxo, there is a disruption of growth coordination between imaginal discs (A.
Shingleton, personal communication); presumably due to systemic upregulation of ecdysone
signaling. Lastly, in the context of growth coordination, it appears unlikely that Thor mediates
the effects of 20E in promoting imaginal disc control, contrary to a recent study 13. Therefore,

100
ecdysone presumably promotes imaginal disc growth by acting via multiple downstream
effectors.

101
Figure 2-11 Compartment autonomous modulation of dFoxo expression does not disrupt intra-organ growth coordination

102
Figure 2-11 (cont’d)
(A) The slope of the ontogenetic allometry between anterior and posterior compartment size in in
antfast:postslow (gray circles) (n = 46) and antfast, foxo21:postslow (blue circles) (n = 20) imaginal discs
are not significantly different (common slope test, P >0.05), indicating that up-regulating IIS in
the anterior compartment with a compartment autonomous dFoxo null does not affect the relative
growth rate of the anterior compartment(A′). (B) The slope of the ontogenetic allometry between
anterior and posterior compartment size in WT (gray circles) (n = 63) and ci>Foxo.RNAi (pink
circles) (n = 38) imaginal discs are not significantly different (common slope test, P > 0.05)
indicating that Foxo knockdown in the anterior compartment does not affect its growth rate
relative to the posterior compartment (A′). All error bars are 95% confidence intervals. WT: ci-
Gal4, UAS-FLP/+. ci>Foxo.RNAi: ci-Gal4, UAS-FLP/+; UAS-Foxo.RNAi/+. antfast:postslow : ci-
Gal4, UAS-FLP; FRT82B, ubi-GFP, P{A92}RpS3Plac92 / FRT82B arm-lacZ. antfast, foxo21:postslow:
ci-Gal4, UAS-FLP; FRT82B, ubi-GFP, P{A92}RpS3Plac92 / FRT82B Foxo21

103
REFERENCES

104
REFERENCES
1. Blair SS. Compartments and appendage development in Drosophila. Bioessays 1995, 17:299-309.
2. Martin-Castellanos C, Edgar BA. A characterization of the effects of Dpp signaling on cell growth and proliferation in the Drosophila wing. Development 2002, 129:1003-1013.
3. Johnston LA, Sanders AL. Wingless promotes cell survival but constrains growth during Drosophila wing development. Nat Cell Biol 2003, 5:827-833.
4. Brogiolo W, Stocker H, Ikeya T, Rintelen F, Fernandez R, Hafen E. An evolutionarily conserved function of the Drosophila insulin receptor and insulin-like peptides in growth control. Curr Biol 2001, 11:213-221.
5. Teleman AA. Molecular mechanisms of metabolic regulation by insulin in Drosophila. Biochem J 2010, 425:13-26.
6. Stieper BC, Kupershtok M, Driscoll MV, Shingleton AW. Imaginal discs regulate developmental timing in Drosophila melanogaster. Dev Biol 2008, 321:18-26.
7. Simpson P, Berreur P, Berreur-Bonnenfant J. The initiation of pupariation in Drosophila: dependence on growth of the imaginal discs. J Embryol Exp Morphol 1980, 57:155-165.
8. Halme A, Cheng M, Hariharan IK. Retinoids regulate a developmental checkpoint for tissue regeneration in Drosophila. Curr Biol 2010, 20:458-463.
9. Parker NF, Shingleton AW. The coordination of growth among Drosophila organs in response to localized growth-perturbation. Dev Biol 2011, 357:318-325.
10. Jaszczak JS, Wolpe JB, Dao AQ, Halme A. Nitric Oxide Synthase Regulates Growth Coordination During Drosophila melanogaster Imaginal Disc Regeneration. Genetics 2015.
11. Garelli A, Gontijo AM, Miguela V, Caparros E, Dominguez M. Imaginal discs secrete insulin-like peptide 8 to mediate plasticity of growth and maturation. Science 2012, 336:579-582.
12. Colombani J, Andersen DS, Leopold P. Secreted Peptide Dilp8 Coordinates Drosophila Tissue Growth with Developmental Timing. Science 2012, 336:582-585.
13. Herboso L, Oliveira MM, Talamillo A, Perez C, Gonzalez M, Martin D, Sutherland JD, Shingleton AW, Mirth CK, Barrio R. Ecdysone promotes growth of imaginal discs through the regulation of Thor in D. melanogaster. Sci Rep 2015, 5:12383.
14. Aegerter-Wilmsen T, Aegerter CM, Hafen E, Basler K. Model for the regulation of size in the wing imaginal disc of Drosophila. Mech Dev 2007, 124:318-326.

105
15. Hufnagel L, Teleman AA, Rouault H, Cohen SM, Shraiman BI. On the mechanism of wing size determination in fly development. Proc Natl Acad Sci U S A 2007, 104:3835-3840.
16. Shraiman BI. Mechanical feedback as a possible regulator of tissue growth. Proc Natl Acad Sci U S A 2005, 102:3318-3323.
17. Facchinetti V, Ouyang W, Wei H, Soto N, Lazorchak A, Gould C, Lowry C, Newton AC, Mao Y, Miao RQ, et al. The mammalian target of rapamycin complex 2 controls folding and stability of Akt and protein kinase C. EMBO J 2008, 27:1932-1943.
18. Martin FA, Morata G. Compartments and the control of growth in the Drosophila wing imaginal disc. Development 2006, 133:4421-4426.
19. Mesquita D, Dekanty A, Milan M. A dp53-dependent mechanism involved in coordinating tissue growth in Drosophila. PLoS Biol 2010, 8:e1000566.
20. Ferreira A, Milan M. Dally Proteoglycan Mediates the Autonomous and Nonautonomous Effects on Tissue Growth Caused by Activation of the PI3K and TOR Pathways. PLoS Biol 2015, 13:e1002239.
21. Warton DI, Duursma RA, Falster DS, Taskinen S. smatr 3-an R package for estimation and inference about allometric lines. Methods in Ecology and Evolution 2012, 3:257-259.
22. Saeboe-Larssen S, Lyamouri M, Merriam J, Oksvold MP, Lambertsson A. Ribosomal protein insufficiency and the minute syndrome in Drosophila: a dose-response relationship. Genetics 1998, 148:1215-1224.
23. Martin FA, Herrera SC, Morata G. Cell competition, growth and size control in the Drosophila wing imaginal disc. Development 2009, 136:3747-3756.
24. Schubiger M, Carre C, Antoniewski C, Truman JW. Ligand-dependent de-repression via EcR/USP acts as a gate to coordinate the differentiation of sensory neurons in the Drosophila wing. Development 2005, 132:5239-5248.
25. Schubiger M, Truman JW. The RXR ortholog USP suppresses early metamorphic processes in Drosophila in the absence of ecdysteroids. Development 2000, 127:1151-1159.
26. Brown HL, Cherbas L, Cherbas P, Truman JW. Use of time-lapse imaging and dominant negative receptors to dissect the steroid receptor control of neuronal remodeling in Drosophila. Development 2006, 133:275-285.
27. Sedkov Y, Cho E, Petruk S, Cherbas L, Smith ST, Jones RS, Cherbas P, Canaani E, Jaynes JB, Mazo A. Methylation at lysine 4 of histone H3 in ecdysone-dependent development of Drosophila. Nature 2003, 426:78-83.

106
28. Bai J, Uehara Y, Montell DJ. Regulation of invasive cell behavior by taiman, a Drosophila protein related to AIB1, a steroid receptor coactivator amplified in breast cancer. Cell 2000, 103:1047-1058.
29. Mirth CK, Truman JW, Riddiford LM. The Ecdysone receptor controls the post-critical weight switch to nutrition-independent differentiation in Drosophila wing imaginal discs. Development 2009, 136:2345-2353.
30. Rusten TE, Lindmo K, Juhasz G, Sass M, Seglen PO, Brech A, Stenmark H. Programmed autophagy in the Drosophila fat body is induced by ecdysone through regulation of the PI3K pathway. Dev Cell 2004, 7:179-192.
31. Colombani J, Bianchini L, Layalle S, Pondeville E, Dauphin-Villemant C, Antoniewski C, Carre C, Noselli S, Leopold P. Antagonistic actions of ecdysone and insulins determine final size in Drosophila. Science 2005, 310:667-670.
32. Slaidina M, Delanoue R, Gronke S, Partridge L, Leopold P. A Drosophila insulin-like peptide promotes growth during nonfeeding states. Dev Cell 2009, 17:874-884.
33. Nolo R, Morrison CM, Tao C, Zhang X, Halder G. The< i> bantam</i> MicroRNA Is a Target of the Hippo Tumor-Suppressor Pathway. Current biology 2006, 16:1895-1904.
34. Bryant PJ, Levinson P. Intrinsic growth control in the imaginal primordia of Drosophila, and the autonomous action of a lethal mutation causing overgrowth. Dev Biol 1985, 107:355-363.
35. Day SJ, Lawrence PA. Measuring dimensions: the regulation of size and shape. Development 2000, 127:2977-2987.
36. Zecca M, Struhl G. Control of Drosophila wing growth by the vestigial quadrant enhancer. Development 2007, 134:3011-3020.
37. Rogulja D, Rauskolb C, Irvine KD. Morphogen control of wing growth through the Fat signaling pathway. Dev Cell 2008, 15:309-321.
38. Schwank G, Restrepo S, Basler K. Growth regulation by Dpp: an essential role for Brinker and a non-essential role for graded signaling levels. Development 2008, 135:4003-4013.
39. Zhang X, Luo D, Pflugfelder GO, Shen J. Dpp signaling inhibits proliferation in the Drosophila wing by Omb-dependent regional control of bantam. Development 2013, 140:2917-2922.
40. Delanoue R, Slaidina M, Leopold P. The steroid hormone ecdysone controls systemic growth by repressing dMyc function in Drosophila fat cells. Dev Cell 2010, 18:1012-1021.

107
41. Nijhout HF, Callier V. Developmental mechanisms of body size and wing-body scaling in insects. Annu Rev Entomol 2015, 60:141-156.
42. Champlin DT, Truman JW. Ecdysteroid control of cell proliferation during optic lobe neurogenesis in the moth Manduca sexta. Development 1998, 125:269-277.
43. Kato Y, Nair KK, Dyer KA, Riddiford LM. Changes in ploidy level of epidermal cells during last larval instar of the tobacco hornworm, Manduca sexta. Development 1987, 99:137-143.
44. Mitchell N, Cranna N, Richardson H, Quinn L. The Ecdysone-inducible zinc-finger transcription factor Crol regulates Wg transcription and cell cycle progression in Drosophila. Development 2008, 135:2707-2716.
45. Bai H, Kang P, Tatar M. Drosophila insulin-like peptide-6 (dilp6) expression from fat body extends lifespan and represses secretion of Drosophila insulin-like peptide-2 from the brain. Aging Cell 2012, 11:978-985.
46. Sato-Miyata Y, Muramatsu K, Funakoshi M, Tsuda M, Aigaki T. Overexpression of dilp2 causes nutrient-dependent semi-lethality in Drosophila. Front Physiol 2014, 5:147.
47. Tang HY, Smith-Caldas MS, Driscoll MV, Salhadar S, Shingleton AW. FOXO regulates organ-specific phenotypic plasticity in Drosophila. PLoS Genet 2011, 7:e1002373.
48. Go MJ, Eastman DS, Artavanis-Tsakonas S. Cell proliferation control by Notch signaling in Drosophila development. Development 1998, 125:2031-2040.
49. Sanderson IR. Growth problems in children with IBD. Nat Rev Gastroenterol Hepatol 2014, 11:601-610.

108
CHAPTER III: IN-VIVO CHARACTERIZATION OF THE INR REGULATORY
LOCUS IN DROSOPHILA
1Part of the work described in this chapter was published in the following manuscript: Wei, Y.,
R.H. Gokhale, A. Sonnenschein, K. Montgomery, A. Ingersoll and D.N. Arnosti (2016)
“Complex cis-regulatory landscape of the insulin receptor gene underlies the broad expression of
a central signaling regulator” Development. In press.

109
Introduction
The Insulin/Insulin Growth Factor Signaling (IIS) pathway is a conserved signaling pathway
involved in development, growth and metabolism in all metazoans. It is involved in a multitude
of functions in animal physiology--regulating animal lifespan, maintaining glucose homeostasis,
long-term memory formation, and germline proliferation to name a few. However, perhaps the
best-studied aspect of this pathway is its role in promoting nutrient-dependent growth. In D.
melanogaster, the input to this pathway is circulating insulin-like peptides (dILPs), whose levels
depend on the nutritional status of the individual1. Circulating dILPs bind to and activate the
Insulin Receptor (InR) which subsequently activates the downstream phosphorylation cascade
mediated by the kinases PI3K and Akt 2. One of the targets of Akt is the transcription factor
dFoxo. Phosphorylation of dFoxo leads to its translocation to the cytoplasm, inhibiting its
transcriptional activity 3-5. dFoxo targets the expression of a number of growth inhibitors 6-8, and
therefore, the inhibition of dFoxo under high IIS activity results in the nutrient-dependent
stimulation of growth.
In Drosophila melanogaster, loss of function mutations of InR exhibit pleiotropic recessive
phenotypes, leading to embryonic lethality9. InR expression is crucial to embryonic development
9, 10, as well as development and growth of the nervous system 9, 11. However, the most important
function of InR is in the regulation of growth by controlling cell growth and proliferation. In
D.melanogaster, InR expression regulates final body and organ size of the individual by
regulating cell number and cell size in a cell-autonomous manner 12. At the level of individual
organs, for example, upregulation of InR levels in the eye resulted in an organ autonomous
increase in size12. Individuals homozygous for hypomorphic mutations in InR have a
significantly smaller body size than wild type individuals 12. This finding echoes observations in

110
mice, in which InR and Insulin-like Growth Factor Receptor (IGFR) knockouts cause a
developmental delay and a reduction in body size13. Thus, organ-autonomous increase or
decrease in InR expression can result in an increased final body and/or organ size. However, we
still lack an understanding of the cis regulatory mechanisms contributing to InR expression in
vivo.
In order to address this outstanding question, we carried out a transgenic rescue assay to
determine the minimal regulatory sequences needed for InR expression in vivo. We further
characterized the InR cis regulatory locus by analyzing in vivo reporter gene expression and
comparing it to regulatory information gleaned from genome wide regulatory data sets in
Drosophila. We find that while individual reporter gene fragments have distinct tissue-specific
expression, there is no single characteristic set of chromatin-level properties that distinguishes
these putative enhancer fragments. Together, this study suggests a far more complex picture of
regulation than previously suggested for the InR gene regulatory locus.
Materials and Methods
Fly Stocks
The following fly strains were obtained from the Bloomington Stock Center (stock numbers in
parentheses): pBac{attp-3B}VK00001 (9722), InRGC25(9554), InRE19(9646), Putative InR
enhancers: GMR27H05-Gal4(47519), GMR28A11-Gal4(45164), GMR28D03-Gal4(47521),
GMR28E02-Gal4(49458), GMR38E09-Gal4(48080), GMR28G01-Gal4 (45547), GMR28G04-
Gal4(45548), GMR28H01-Gal4(45947), GMR29A02-Gal4(45175), GMR37B05-Gal4(47564),
UAS-GFP (1521). Each putative enhancer line was crossed to the UAS-GFP line. Larval tissues
and adult flies were imaged on an Olympus BX-41 microscope.

111
Generation of transgenic flies
BAC construct CH321-24D17 containing the entire InR locus was obtained from the BacPac
Resources Center (Oakland, CA). BACs were grown overnight for 16-20h and high copy number
was induced using Epicentre BAC autoinduction solution (Illumina). DNA was prepared using
the HiPure Midiprep kit following the manufacturer's instructions (Invitrogen). DNA was diluted
to a final concentration of ~1µg/µL and 400 embryos were injected by Rainbow Transgenics Inc
(Camarillo, CA). Landing site line VK00001, containing an attp site at location 59D3 on
chromosome 2, was used for injection and integration of the BAC.
qPCR analysis of mRNA from transgenic flies
Three-day old adult males and virgin females were collected and flash frozen at -80¹C. Total
RNA was extracted using Trizol Reagent (Invitrogen) and subjected to DNaseI treatment
(Ambion DNaseI Kit) at room temperature for 15 minutes to eliminate genomic DNA
contamination. Reverse transcription for first strand synthesis was carried out using random
primers and Multiscribe Reverse Transcriptase (ABI Biosystems). Real-time PCR was
performed using POWER SYBR Green Master Mix (ABI Biosystems) and analyzed on
Eppendorf Mastercycler Realplex. Gene expression was assayed in 3-5 biological replicates of 8-
10 flies each and normalized against expression of 28S rRNA. Primers used for assaying
expression are listed in Appendix I. Standard curves were generated using six serial dilutions of
total RNA extracted from two individuals of Samarkand WT first, second and third instar larvae,
pupae (male) and adult flies (male). Gene expression fold changes were calculated by
normalizing to WT.

112
Results
Genomic rescue construct identifies regulatory regions of InR
The Drosophila InR gene occupies a 50 kbp region on the 3R chromosome including ~ 40 kbp of
introns (Figure 3-1A). To identify the genomic region that is responsible for InR expression,
which may include sequences outside of the transcription unit, we generated an 80 kbp BAC
construct (InR-BAC) that spans the InR locus, and tested its ability to rescue the lethality of an
InR mutant. The BAC construct includes the entire InR transcription unit as well as the 3’
CG15498 gene, and portions of the 5’E2F1 and 3’ slou genes (Figure 3-1A). We crossed this
construct into a background containing the temperature-dependent conditional lethal trans-
heterozygous alleles (InRGC25/InRE19) 14. InRGC25/InRE19 flies are not viable when raised at
27 °C. The BAC was able to rescue this lethality and InR-BAC/+ ; InRGC25/InRE19 survivors
were obtained (Figure 3-1C). The presence of two copies of the BAC increases InR gene
expression in these flies about two to three fold (Figure 3-1D). The relevant cis regulatory
sequences for InR expression are thus located within this region; we therefore investigated the
short 5’ intergenic sequence and the sizeable introns of InR to uncover relevant cis regulatory
elements.
Evidence for tissue-specific enhancers of InR
The InR gene is flanked by only short intergenic regions, thus important regulatory sequences
may be located within its sizable introns, although cis regulatory elements may reside anywhere
within the 80 kbp region defined by the BAC. Data from cell-type specific enhancer analysis
using STARR-seq technology, as well as DNase hypersensitivity data and measurement of open
chromatin using FAIRE-seq support the notion that InR introns are likely to harbor relevant cis-
regulatory elements 15-19. To evaluate the regulatory potential of intronic regions in the whole fly,

113
Figure 3-1 An 80kbp cis regulatory region is sufficient to rescue InR mutants
(A) The Drosophila InR gene spans ~50 kbp and contains multiple large introns. The entire gene
along with its 5’ and 3’ regions are contained in an InR-BAC transgene (indicated by green line)
inserted into chromosome 2. (B) Crosses used for the rescue assay. Females heterozygous for
InRE19 were crossed to males heterozygous for InRGC25 and progeny were assessed at permissive
and nonpermissive temperatures. (C) InR BAC rescue experiment showing fractions of progeny

114
with and without InR transgene at permissive (18°C) and nonpermissive (27°C) temperatures.
The transheterozygous InRE19 / InRGC25 allele combination is lethal (represented here showing
second and third chromosome genotypes as InR-BAC/+; E/G, where E represents InRE19,
and G represents InRGC25 when raised at the nonpermissive temperature of 27°C. 97 Individuals
were analyzed for crosses at 27°C, and 107 individuals for crosses at 18°C. (D) Transcript levels
of InR and E2F1 measured from 3-day adult homozygous InR-BAC females and males. Both
females and males showed 2~3 fold increase in transcripts of InR and ~1.5 fold for E2F1. No
significant change was observed for kinesin (Kinesin heavy chain, also khc) as a negative control.
All transcripts were normalized to 28S transcript levels.

115
we tested ten GAL4 lines bearing genomic fragments derived from the InR gene (Figure 3-2)
(Pfeiffer et al, 2008). Previous measurements in the embryo indicated that some of these
elements drive GFP expression in dynamic and cell-type specific patterns 21-24. We found that
three of the fragments also express GFP in larvae and adults, in either ubiquitous or tissue-
specific patterns (Figure 3-2, Figure 3-3). To obtain more insight on possible cis regulatory
elements, we surveyed extant datasets for information about chromatin accessibility and ChIP-
seq information that may reveal active regulatory regions in this locus. To identify possible
correlated features, we plotted the results of genome-wide enhancer surveys (from S2 and
ovarian stem cells (OSC)), chromatin accessibility in different developmental stages and tissues
as measured by FAIRE-seq, and enhancer-associated histone modifications
H3K27Ac,H3K4Me1, and the p300 coactivator 15, 16, 18-20, 25, 26, The resultant patterns do not
provide a consistent, easily interpretable set of correlations across different developmental times.
Enhancers found using STARR-seq do point to apparently redundantly-acting enhancers in InR
introns with either shared or cell-type specific patterns (Figure 3-2) 18. These enhancers overlap
some of the fragments tested as GAL4 drivers, but there was not a complete agreement between
these different methods. The two types of assays relied on distinct basal promoters, which may
have biased detection because of enhancer-promoter specificity 27, 28.
Discussion
Our preliminary analysis of the InR cis-regulatory locus reveals a complex regulation in which
multiple enhancers control spatial and temporal expression of the gene. Together with the
detailed analysis of the transcriptional response of these enhancers to individual transcription
factors, this analysis gives us valuable insight into how to design a synthetic gene that may be
uniquely rewired to a particular transcriptional input (See Appendix II).

116
Figure 3-2 Regulatory landscape of the InR locus

117
(A) Transcriptional output of genomic fragments associated with the InR locus. Janelia GAL4
lines that contain genomic fragments in the InR locus were crossed to a UAS-GFP line. Extant
information collected from FlyLight database for embryonic and larval activity is also shown
(indicated by *). Fragments labeled in red showed GFP signal in embryos, larval, or adult flies.
Fragments labeled in blue showed limited or no expression. Representative images in larvae and
adult flies from this study are shown in Fig. 3-3. The details for each fragment are shown in Data
Table 3-1. (B) Alignment of the InR gene locus with previously identified features. STARR-seq
elements are from S2 and OSC cells 18, chromatin accessibility identified by DNase-seq in cell
lines 18, developing embryos 15-17, 20, FAIRE in different developmental stages and tissues 19, and
enhancer-associated modifications H3K27Ac, H3K4Me1 and p300 binding in different
developmental stages (modENCODE). For STARR-seq and DHS-seq, the data from two
experiments are shown, where darker areas indicate reproducible results, and lighter areas found
in only one experiment. Bar height indicates enhancer activities or reads for the peaks. Width of
STARR-seq signals set at 600 bp, the average length of the fragments 18. Chromatin accessibility
data for different developmental stages indicated at right (S developmental stage, E for hours of
embryonic development). FAIRE, H3K27Ac, H3K4Me1, and p300 data are presented as peak
intensities, with darker shades indicating higher peaks. All data scales are normalized to local
maximum. Genome version is Drosophila genome dm3/R5.

118
Table 3-1 Expression details of reporter fragments tested in this study
Janelia
fragments Coordinates Larvae (CNS)
Larvae (Imaginal
Disc) Larvae (Other) Adult
28H01 No Data No Expression No Expression No Expression No Expression 27H05 3R:21,606,484..21,609,042 No Expression Wing, Haltere No Expression Ubiquitous 28G04 3R:21,603,204..21,607,084 No Data No Data No Data No Data 28E02 3R:21,600,134..21,603,731 No Data No Data No Data No Data
37B05 3R:21,597,120..21,601,014 No Expression No Expression No Expression Abdomen, Mouth
Parts 28G01 3R:21,594,305..21,598,173 No Expression No Expression No Expression Legs 28A11 3R:21,592,500..21,595,413 No Expression No Data No Data No Data 29A02 3R:21,588,539..21,593,033 No Expression No Expression No Expression No Expression 28E09 3R:21,583,277..21,586,976 No Expression No Expression No Expression No Expression
28D03 3R:21,580,937..21,584,313 Brain (?) No Expression salivary gland, body
wall Abdomen

119
Figure 3-3 Adult and larval expression of UAS-GFP reporters
(A) GFP expression in larval leg and wing discs with Gal4 driver 27H05. (B) GFP expression in
larval eye disc with Gal4 driver 27H05. (C) Ubiquitous GFP 131 expression in adult with Gal4
driver 27H05. (D) GFP expression in adult legs with Gal4 driver 28G01. (E) Larval salivary
gland and epidermis expression with Gal4 driver 28D03 (F) Adult abdominal expression with
Gal4 driver 28D03. (G) GFP expression in adult mouthparts with Gal4 driver 37B05. (H) GFP
expression in adult mouthparts with Gal4 driver 37B05. (I) GFP expression in adult abdomen
with Gal4 driver 37B05.

120
Our rescue assay to identify the minimal regulatory region of InR identified an 80kb region that
rescues the lethality of a temperature-sensitive InR transheterozygote. The conditional lethal
transheterozygous allele combination InRGC25/InRE19 is inviable at 27¹C but is viable 18¹C.
However, even at the permissive temperature this allele combination exhibits a number of
physiological defects such as decreased cell number, increased developmental time and a smaller
body size14. Our genomic rescue with the InR-BAC allele rescued the lethality of this
transheterozygote at 27¹C, but it is not immediately clear whether this is a complete rescue to a
WT phenotype in terms of expression of the gene. We found no observable differences in body
size, wing size or developmental time between the rescue flies and the corresponding controls
when raised on regular food at 27¹C. However, we do find that when we subject these flies to a
high sugar diet, there is an appreciable difference between developmental times between the InR-
BAC rescue flies and the corresponding WT controls. These flies also exhibit a lower fecundity
as compared to controls. (See Appendix I). qPCR analysis to determine the expression of InR in
the rescue flies suggests an increase in mRNA transcripts levels almost identical to what would
be predicted by increase in gene dosage. My qPCR analysis was limited to that from adult flies,
so it is unclear whether gene expression is restored to WT levels across all tissues and
developmental contexts. However, given our preliminary physiological analysis of the InR-BAC
flies, this appears to be unlikely. The qPCR analysis also revealed that along with increased
expression InR, E2F expression is also elevated in InR-BAC flies. Therefore it is not
immediately clear whether these altered phenotypes are a result of increased InR expression or
increased E2F expression.
Our analysis of the InR regulatory locus by using Gal4 reporter analysis reveals a distinct set of
enhancers distributed across the large introns of the gene. What is most interesting is that there

121
appears to be distinct enhancer fragments driving expression in a tissue-specific manner. It is not
immediately clear whether each of these enhancers are functional in vivo and whether they drive
endogenous gene expression. Further bioinformatic analysis coupled with cell-based luciferase
reporter assays suggests a far more complex regulation than previously thought for the InR
regulatory locus. For instance, a number of enhancer fragments which showed reporter gene
expression in the Gal4 based assays showed only minimal activity in cell-based luciferase assays
(Wei et al., 2016). One way to determine which enhancers are actually employed in vivo would
be to use a CRISPR/Cas9 mediated genome engineering approach to create transgenic flies
lacking one or more of these enhancers. Alternatively, a simpler transgenic approach (similar to
the one outlined in Appendix II) can be utilized to determine the relative contribution of
individual enhancer fragments to total InR gene expression in vivo.
Research on signal transduction pathways has canonically focused more on interactions at the
protein level, with only a limited understanding of how transcriptional regulation of different
components affects signal transduction and output through the pathway. Increasingly, however, it
is becoming evident that different signal transduction pathways that had thus far been thought of
as relatively independent are interconnected via transcriptional regulatory inputs. For example,
the Cagan lab recently demonstrated that in D. melanogaster the Wnt pathway interacts with the
IIS pathway—with the Wg protein upregulating InR 29. Such regulatory mechanisms are thought
to provide a means of long-term regulation to the pathway. With the availability of genome wide
transcription factor binding data sets, we now have a wealth of information of the relative
enrichment of different transcription factors across different genes. These studies are crucial to
provide a complete picture of the transcriptional inputs that are necessary for normal in vivo
expression of any gene. However, whether transcription factor binding actually results in a

122
significant contribution to total expression, and whether this regulation is essential for a
particular developmental context is not clear from these studies. In order to address this question,
it is necessary to focus on individual transcriptional inputs to a particular gene and look at the
effect of removing or altering transcriptional regulation on gene expression and phenotype.

123
APPENDICES

124
APPENDIX I
CHARACTERIZATION OF INR-BAC FLIES

125
Methods
Measurement of developmental delay
Flies were allowed to lay for 24h on either HSD or LSD containing food vials. HSD and LSD
food was prepared based on the Bloomington semi-defined medium recipe, but contained either
342g/L or 51.3g/L of sucrose, respectively. The number of pupariating individuals was recorded
every 24 hrs.
Measurement of fecundity
InR-BAC and control flies were allowed to lay for 24 hours or 4 hrs respectively, on apple juice
agar plates supplemented with dry yeast. Embryos were then counted and transferred to vials.
Flies arising from these embryos were then counted and percent egg fertility (number of eclosed
adults/number of eggs laid*100) was calculated. Lay rate was also calculated by as the number
of eggs laid per female per hour. Data was analyzed from three independent biological replicates.
Results and Discussion
Developmental delay on HSD is partially rescued in InR-BAC flies
In order to identify whether transgenic increased dosage of InR had an altered phenotype in
terms of insulin signaling we measured the developmental delay in InR-BAC flies raised on a
High Sugar Diet (HSD) or a Low Sugar Diet (LSD) as compared to controls. Flies raised on a
high sugar diet have been previously shown to have developmental delay of ~96 hrs 30.
Consistent with these data, WT controls raised on a HSD (Fig. 3-4, dashed blue line) had a
developmental delay of ~72 hrs as compared to those raised on a LSD (Fig. 3-4, solid blue line).
Interestingly, this delay is partially rescued in InR-BAC flies, which have a developmental delay
of ~30hrs (Fig. 3-4, dashed red line). HSD has been previously demonstrated to cause a

126
reduction in expression of InR in eye-discs of larvae29. Therefore, it is likely that in InR-BAC
flies, the increased dosage of InR compensates a decrease in expression caused by the HSD and
this contributes to the partial rescue of the developmental delay. There is, however, no difference
in the developmental time in control and InR-BAC larvae raised on the LSD.
InR-BAC flies exhibit a diminished fecundity
The IIS pathway has been known to influence a number of life-history traits such as fecundity,
life span and aging. Specifically, ablation of dILP secreting cells in the brain has been show to
result in decreased female fecundity as measured by egg laying 31. In addition, the IIS/TOR
pathway is essential for the growth, proliferation and surivival of germ line as well as somatic
stem cells in the ovary 32-34. Therefore, we decided to investigate whether subtle alterations in the
transcription of InR have any effect of fecundity. Our preliminary data indicates that, increased
dosage of InR and therefore increased activity through the IIS seems to result in female flies with
lower fecundity, as evidenced by stark reductions in egg viability (Fig. 3-4B) and female egg
laying rate (Fig. 3-4C). Mutations in various IIS components as well as InR mutants have been
previously demonstrated to cause female sterility 10. Similarly, a point mutant E2F1 allele was
shown to affect female fertility with mutant mothers laying fewer eggs 35. However, increasing
expression of either gene has not been previously shown to be associated with decreased
fertility. However, overexpression of E2F1 has been shown to increase apoptosis both in vivo
and in vitro 36 and it is possible that in this case as well, increased apoptosis in the ovary or germ
line cells causes impaired egg laying and/or development.
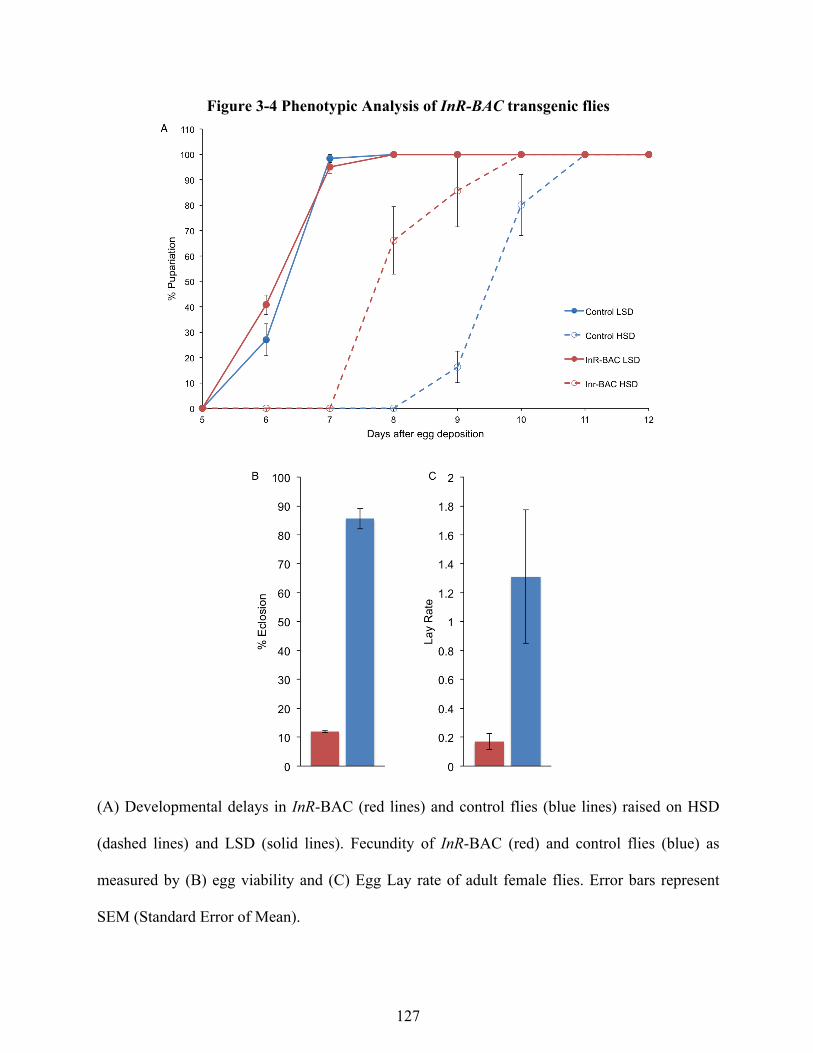
127
Figure 3-4 Phenotypic Analysis of InR-BAC transgenic flies
(A) Developmental delays in InR-BAC (red lines) and control flies (blue lines) raised on HSD
(dashed lines) and LSD (solid lines). Fecundity of InR-BAC (red) and control flies (blue) as
measured by (B) egg viability and (C) Egg Lay rate of adult female flies. Error bars represent
SEM (Standard Error of Mean).

128
APPENDIX II
TRANSGENIC FLY SYSTEM TO ASSESS THE EFFECT OF dFOXO FEEDBACK TO InR

129
Introduction
The Insulin/Insulin-like growth factor Signaling (IIS) pathway transduces environmental cues of
nutrient availability to affect intracellular cellular processes via a transmembrane receptor and a
phosphorylation cascade resulting in inhibition of the transcription factor dFoxo. Since the
primary function of a signaling pathway is to relay environmental information to the cell, in
order for it to adjust to fluctuating environments, a signaling pathway must have two essential
qualities: robustness and sensitivity. Robustness is the ability to withstand perturbations in
signaling without significantly altering the output of the pathway; sensitivity on the other hand
refers to the ability of discriminating between small changes in the input to the pathway37, 38. One
way to ensure robustness is the presence of feedback loops which are known to confer robustness
and reduce noise through the pathway38. In the IIS pathway, feedback is achieved via dFoxo,
which is a downstream target of the IIS pathway39. Under conditions of adequate nutrition, the
phosphorylation cascade results in the inactivation of dFoxo; however, under limited nutrition,
dFoxo is active and unphosphorylated and exerts feedback control on the levels of the Insulin
Receptor (InR). qPCR analysis of mRNA transcripts suggests that InR expression is upregulated
approximately 2-3 fold 39.
It has been demonstrated previously that organ-autonomously altering the levels of dFoxo in D.
melanogater alters the sensitivity of the pathway to nutrition 40. However, it is not immediately
clear whether this is due to the transcriptional feedback of dFoxo to InR. Additionally, it is not
clear whether the dFoxo feedback to InR is physiologically relevant, and if it is, how much it
contributes to total gene expression of InR. Moreover, there are no studies demonstrating a direct
effect on modified dFoxo feedback on larval development or final body and organ size in

130
D.melanogaster. In order to test this, I propose below a transgenic approach which can be
utilized to address these questions.
Transgenic system to test the role of dFoxo feedback
Vector Construction
For construction of a dFoxo inducible InR gene, 4XFRE and 8XFRE DNA fragments were
synthesized from overlapping fragments and annealed in vitro to yield two fragments of 68nts
and 126nts respectively (Fig. 3-5). The 4XFRE sequence contains four predicted Foxo4 binding
sites and had been previously demonstrated to activate transcription of a synthetic promoter in
vitro3. 0XFRE sequence was generated as a random 22nt sequence and verified to not contain
any predicted Foxo binding sites. pHonda is a phiC31 based vector containing a twist basal
promoter, and 3’ alpha tubulin UTR and has been previously demonstrated to be an effective
vector in which potential regulator sequences can be tested in 41. The 340bp spacer sequence in
pHonda1 was removed and the 4XFRE/8XFRE fragments were cloned into the AgeI and BglII
sites in the MCS of pHonda1 to generate the vector 4XFRE-pHonda1 and 8XFRE-pHonda1. The
lacZ gene in pHonda1 cloned between XhoI and KpnI was replaced with a 78nt polylinker (XhoI-
KpnI polylinker) containing unique restriction sites (AscI, AvrII, EcoRI, HindIII, PacI, StuI,
NotI) and in frame and out of frame STOP sites to generate the vectors 0XFRE/4XFRE/8XFRE-
pHonda1-polylinker. InR cDNA was obtained as the construct pMT-InR-FLAG 42 and was a kind
gift from Dr. Stephen Cohen. This construct was modified to introduce and additional FLAG
sites by Quickchange mutagenesis to generate the construct pMT-InR-2XFLAG containing a
double FLAG-tag at the C-terminus of the InR cDNA. InR cDNA was subcloned from pMT-
InR-2XFLAG into 4XFRE-pHonda1-polylinker and 8XFRE-pHonda-polylinker using the EcoRI
and NotI sites to generate the constructs 0XFRE/4XFRE/8XFRE-InR-2XFLAG-pHonda1.

131
Figure 3-5 Transgenic system to test the role of dFoxo feedback
In this transgenic system, InR cDNA (green) expression driven by a basal promoter (red) and a
DNA sequence containing either 0, 4 or 8 additional dFoxo binding sites (blue) cDNA
expression can be tracked by a 2XFLAG-Tag(yellow).
InR
promoter
OX / 4X / 8X FRE

132
Subsequently, to generate constructs containing endogenous regulatory regions responsive to
dFoxo overexpression, Fragment 2 and Fragment 4 from the reporter library of Wei et al., were
cloned upstream of InR-2X-FLAG in the vector 0X-FRE-InR-2X-FLAG-pHonda1. Additional
restriction sites were introduced in the vector by cloning a 60nt polylinker containing unique
restriction sites (AgeI, AvrII, AscI, AsiSI, FseI, EagI) in the AgeI restriction site upstream of InR.
A 30nt polylinker containing unique restriction sites (SbfI, FspI) was cloned in the AscI site
previously cloned in the XhoI-KpnI polylinker thereby destroying the AscI site. Fragment 2 and
Fragment 4 were amplified from genomic DNA by PCR and cloned into the AvrII and AscI
restriction sites to generate the constructs Fragment2-InR-2X-FLAG-pHonda1*, Fragment4-InR-
2X-FLAG-pHonda1* All constructs were validated by sequencing.
Testing constructs in S2 cells
Drosophila S2 cells and Kc cells (Kc167) and were cultured in Schneider medium (Gibco)
supplied with 10% FBS (Gibco) and penicillin-streptomycin (100 Unit/ml Penicillin, 100 ug/ml
Streptomycin, Gibco). To assess expression of InR protein driven by the metallothionine
promoter, 1000ng of pMT-InR-2XFLAG was transfected into 2 x 10^6 Drosophila S2 cells or
Kc cells in 6-well plates using Transfectene reagent (Qiagen). 24h later a final concentration of
100uM CuSO4 was added and cells were incubated at 25°C for an additional 72hrs. To assess
expression of InR protein from vectors in which InR expression is driven by FOXO sites, 1000ng
of 0X-InR-2XFLAG-pHonda1, 4XFRE-InR-2XFLAG-pHonda1, 8XFRE-InR-2XFLAG-
pHonda1, Fragment2-InR-2X-FLAG-pHonda1* or Fragment4-InR-2X-FLAG-pHonda1* were
transfected into 2 x 10^6 Drosophila S2 cells and incubated at 25°C for 72hrs. To test whether
these constructs are responsive to dFoxo overexpression, cells were also co-transfected with
250ng pAX-dFoxo-FLAG vector; 250ng pAX empty vector was used as a control. Cells were

133
harvested three days after transfection by transferring to a 1.7 ml microfuge tube, centrifugation
at 10,000 rpm in an Eppendorf centrifuge 5415C for one min at room temperature, and lysed by
freezing at -80°C for five min and thawing at 37°C for one min a total of three times, after
addition of 50 ul of lysis buffer (50mM Tris-Cl pH8.0, 150mM NaCl, 1% Triton X-100). Total
protein levels were measured by Bradford assays. 10-20ug of cell lysates were run on 4-20%
precast polyacrylamide gels (Biorad), transferred to PVDF membrane and probed with M2 anti-
Flag antibody (mouse monoclonal, 1:10,000, Sigma, F3165). Antibody incubation was
performed for overnight at 4°C for the primary antibody and one hr at room temperature for the
secondary antibody in TBST (20 mM Tris-Cl, pH 7.5, 120 mM NaCl, 0.1% Tween-20) with 5%
non-fat dry milk, washed three times, five min each, after primary and secondary antibody
incubation. Blots were developed using HRP-conjugated secondary antibodies (Pierce) and
Clarity Western ECL substrate (Biorad)
Preliminary Results
Robust expression of pMT-InR-2XFLAG was induced in S2 cells and was detected by a strong
FLAG signal in immunoblotting experiments. However, repeated experiments to detect
expression of 0XFRE-InR-2XFLAG-pHonda1, 4XFRE-InR-2XFLAG-pHonda1 and 8XFRE-
InR-2XFLAG-pHonda1 failed to detect consistent protein expression patterns with these
constructs with or without co-expression of dFoxo. Since the co-expressed dFoxo is tagged with
a FLAG-Tag, this served as a useful internal control, and I was able to detect transfected dFoxo
in every experiment. Nevertheless, out of many repeated experiments, I was able to detect
protein expression only once from 0XFRE-InR-2XFLAG-pHonda1.

134
I also tested the expression of Fragment2-InR-2X-FLAG-pHonda1* and Fragment4-InR-2X-
FLAG-pHonda1*—which contain enhancers previously shown to be activated by co-transfected
dFoxo in S2 cell based luciferase reporter assays (Wei et al., 2016) in multiple independent
experiments. However, with these constructs too, I did not detect any protein expression either
with or without dFoxo overexpression.

135
Table 3-2 Primers and oligos used in vector construction
Name SEQUENCE
0X-FRE ACCGGTCAGGATGAGGTCGCCCTAAAAGATCT
4X-FRE ACCGGTAGTTTGTTTGTCGATTAAATAAACATGTAAACACTTT
GTTTTGTTGATACAAAAAAAAGATCT
8X-FRE ACCGGTAGTTTGTTTGTCGATTAAATAAACTGTAAACACTTTG
TTTTGTTGATACAAACAAAAAGTTTGTTTGTCGATTAAATAAA
CATGTAAACACTTTGTTTTGTTGATACAAACAAAAAGATCT
XhoI-KpnI polylinker CTCGAGGGCGCGCCCCTAGGGAATTCAAGCTTTTAATTAAAG
GCCTGACGCGGCCGCGTAATAGATGAGCCCGGTACC
AscI-EcoRI polylinker CGCGTATCCTGCAGGTATGCGCATAGAATT
AgeI-polylinker ACCGGTATGCCTAGGTAGGGCGCGCCATGCGATCGCATTGGC
CGGCCTACGGCCGTTCCGGTCAGGATGAGGTCGCCCTAAAAG
ATCT
Fragment 2 FWD AATTAACCTAGGACAACAGGCAAAACCGAAGT
Fragment 2 REV AATTAAGGCGCGCCTCGCATCGCTTCTTGGAACA
Fragment 4 FWD AATTAACCTAGGTGTGTTGTTGCCTATTTTTCACTGT
Fragment 4 REV AATTAAGGCGCGCCAGGTGACAACGTGCGAGATT

136
REFERENCES

137
REFERENCES
1. Ikeya T, Galic M, Belawat P, Nairz K, Hafen E. Nutrient-dependent expression of insulin-like peptides from neuroendocrine cells in the CNS contributes to growth regulation in Drosophila. Current biology 2002, 12:1293-1300.
2. Teleman AA. Molecular mechanisms of metabolic regulation by insulin in Drosophila. Biochem J 2010, 425:13-26.
3. Puig O, Marr MT, Ruhf ML, Tjian R. Control of cell number by Drosophila FOXO: downstream and feedback regulation of the insulin receptor pathway. Genes Dev 2003, 17:2006-2020.
4. Kramer JM, Davidge JT, Lockyer JM, Staveley BE. Expression of Drosophila FOXO regulates growth and can phenocopy starvation. BMC Dev Biol 2003, 3:5.
5. Junger MA, Rintelen F, Stocker H, Wasserman JD, Vegh M, Radimerski T, Greenberg ME, Hafen E. The Drosophila forkhead transcription factor FOXO mediates the reduction in cell number associated with reduced insulin signaling. J Biol 2003, 2:20.
6. Medema RH, Kops GJ, Bos JL, Burgering BM. AFX-like Forkhead transcription factors mediate cell-cycle regulation by Ras and PKB through p27kip1. Nature 2000, 404:782-787.
7. Nakae J, Kitamura T, Kitamura Y, Biggs WH, Arden KC, Accili D. The forkhead transcription factor Foxo1 regulates adipocyte differentiation. Developmental cell 2003, 4:119-129.
8. Seoane J, Le H-V, Shen L, Anderson SA, Massagué J. Integration of Smad and forkhead pathways in the control of neuroepithelial and glioblastoma cell proliferation. Cell 2004, 117:211-223.
9. Fernandez R, Tabarini D, Azpiazu N, Frasch M, Schlessinger J. The Drosophila insulin receptor homolog: a gene essential for embryonic development encodes two receptor isoforms with different signaling potential. EMBO J 1995, 14:3373-3384.
10. Garofalo RS. Genetic analysis of insulin signaling in Drosophila. Trends Endocrinol Metab 2002, 13:156-162.
11. Song J, Wu L, Chen Z, Kohanski RA, Pick L. Axons guided by insulin receptor in Drosophila visual system. Science 2003, 300:502-505.
12. Brogiolo W, Stocker H, Ikeya T, Rintelen F, Fernandez R, Hafen E. An evolutionarily conserved function of the Drosophila insulin receptor and insulin-like peptides in growth control. Curr Biol 2001, 11:213-221.

138
13. Kitamura T, Kahn CR, Accili D. Insulin receptor knockout mice. Annual review of physiology 2003, 65:313-332.
14. Shingleton AW, Das J, Vinicius L, Stern DL. The temporal requirements for insulin signaling during development in Drosophila. PLoS Biol 2005, 3:e289.
15. Kaplan T, Li X-Y, Sabo PJ, Thomas S, Stamatoyannopoulos JA, Biggin MD, Eisen MB. Quantitative models of the mechanisms that control genome-wide patterns of transcription factor binding during early Drosophila development. PLoS Genet 2011, 7:e1001290.
16. Li X-Y, Thomas S, Sabo PJ, Eisen MB, Stamatoyannopoulos JA, Biggin MD. The role of chromatin accessibility in directing the widespread, overlapping patterns of Drosophila transcription factor binding. Genome biology 2011, 12:1.
17. Thomas S, Li X-Y, Sabo PJ, Sandstrom R, Thurman RE, Canfield TK, Giste E, Fisher W, Hammonds A, Celniker SE. Dynamic reprogramming of chromatin accessibility during Drosophila embryo development. Genome biology 2011, 12:1.
18. Arnold CD, Gerlach D, Stelzer C, Boryn LM, Rath M, Stark A. Genome-wide quantitative enhancer activity maps identified by STARR-seq. Science 2013, 339:1074-1077.
19. McKay DJ, Lieb JD. A common set of DNA regulatory elements shapes Drosophila appendages. Dev Cell 2013, 27:306-318.
20. Nègre N, Brown CD, Ma L, Bristow CA, Miller SW, Wagner U, Kheradpour P, Eaton ML, Loriaux P, Sealfon R. A cis-regulatory map of the Drosophila genome. Nature 2011, 471:527-531.
21. Jenett A, Rubin GM, Ngo T-T, Shepherd D, Murphy C, Dionne H, Pfeiffer BD, Cavallaro A, Hall D, Jeter J. A GAL4-driver line resource for Drosophila neurobiology. Cell reports 2012, 2:991-1001.
22. Jory A, Estella C, Giorgianni MW, Slattery M, Laverty TR, Rubin GM, Mann RS. A survey of 6,300 genomic fragments for cis-regulatory activity in the imaginal discs of Drosophila melanogaster. Cell Rep 2012, 2:1014-1024.
23. Manning L, Heckscher ES, Purice MD, Roberts J, Bennett AL, Kroll JR, Pollard JL, Strader ME, Lupton JR, Dyukareva AV. A resource for manipulating gene expression and analyzing cis-regulatory modules in the Drosophila CNS. Cell reports 2012, 2:1002-1013.
24. Li H-H, Kroll JR, Lennox SM, Ogundeyi O, Jeter J, Depasquale G, Truman JW. A GAL4 driver resource for developmental and behavioral studies on the larval CNS of Drosophila. Cell Reports 2014, 8:897-908.
139
25. Gohl DM, Silies MA, Gao XJ, Bhalerao S, Luongo FJ, Lin C-C, Potter CJ, Clandinin TR. A versatile in vivo system for directed dissection of gene expression patterns. Nature Methods 2011, 8:231-237.
26. Shlyueva D, Stelzer C, Gerlach D, Yáñez-Cuna JO, Rath M, Boryń ŁM, Arnold CD, Stark A. Hormone-responsive enhancer-activity maps reveal predictive motifs, indirect repression, and targeting of closed chromatin. Molecular cell 2014, 54:180-192.
27. Marinić M, Aktas T, Ruf S, Spitz F. An integrated holo-enhancer unit defines tissue and gene specificity of the Fgf8 regulatory landscape. Developmental cell 2013, 24:530-542.
28. Zabidi MA, Arnold CD, Schernhuber K, Pagani M, Rath M, Frank O, Stark A. Enhancer-core-promoter specificity separates developmental and housekeeping gene regulation. Nature 2015, 518:556-559.
29. Hirabayashi S, Baranski TJ, Cagan RL. Transformed Drosophila cells evade diet-mediated insulin resistance through wingless signaling. Cell 2013, 154:664-675.
30. Musselman LP, Fink JL, Narzinski K, Ramachandran PV, Hathiramani SS, Cagan RL, Baranski TJ. A high-sugar diet produces obesity and insulin resistance in WT Drosophila. Dis Model Mech 2011, 4:842-849.
31. Broughton SJ, Piper MD, Ikeya T, Bass TM, Jacobson J, Driege Y, Martinez P, Hafen E, Withers DJ, Leevers SJ. Longer lifespan, altered metabolism, and stress resistance in Drosophila from ablation of cells making insulin-like ligands. Proceedings of the National Academy of Sciences of the United States of America 2005, 102:3105-3110.
32. Hsu H-J, LaFever L, Drummond-Barbosa D. Diet controls normal and tumorous germline stem cells via insulin-dependent and-independent mechanisms in Drosophila. Developmental biology 2008, 313:700-712.
33. LaFever L, Drummond-Barbosa D. Direct control of germline stem cell division and cyst growth by neural insulin in Drosophila. Science 2005, 309:1071-1073.
34. Sun P, Quan Z, Zhang B, Wu T, Xi R. TSC1/2 tumour suppressor complex maintains Drosophila germline stem cells by preventing differentiation. Development 2010, 137:2461-2469.
35. Royzman I, Hayashi-Hagihara A, Dej KJ, Bosco G, Lee JY, Orr-Weaver TL. The E2F cell cycle regulator is required for Drosophila nurse cell DNA replication and apoptosis. Mechanisms of development 2002, 119:225-237.
36. Denchi EL, Helin K. E2F1 is crucial for E2F‐dependent apoptosis. EMBO reports 2005, 6:661-668.
37. Stelling J, Sauer U, Szallasi Z, Doyle FJ, Doyle J. Robustness of cellular functions. Cell 2004, 118:675-685.

140
38. Mukherji S, van Oudenaarden A. Synthetic biology: understanding biological design from synthetic circuits. Nature Reviews Genetics 2009, 10:859-871.
39. Puig O, Tjian R. Transcriptional feedback control of insulin receptor by dFOXO/FOXO1. Genes & development 2005, 19:2435-2446.
40. Tang HY, Smith-Caldas MS, Driscoll MV, Salhadar S, Shingleton AW. FOXO regulates organ-specific phenotypic plasticity in Drosophila. PLoS Genet 2011, 7:e1002373.
41. Sayal R, Ryu S-M, Arnosti DN. Optimization of reporter gene architecture for quantitative measurements of gene expression in the Drosophila embryo. Fly 2011, 5:47-52.
42. Zhang W, Thompson BJ, Hietakangas V, Cohen SM. MAPK/ERK signaling regulates insulin sensitivity to control glucose metabolism in Drosophila. PLoS Genet 2011, 7:e1002429.

141
CHAPTER IV: CONCLUSIONS AND FUTURE PERSPECTIVES

142
In my research described in the preceding chapters, I have focused on signaling mechanisms that
play essential roles in development and determining the final size of the individual. In this
chapter I will discuss my research in context of the emerging knowledge in the field, and future
experiments that may be carried out to extend this research.
Integration of systemic and organ-autonomous mechanisms in organ size regulation
In chapter 2, I described my research focusing on imaginal disc growth regulation. Each
compartment within an imaginal disc had been previously proposed to have an autonomous size
regulatory mechanism, and thus, each compartment would essentially function as independent
units. My research shows that this is not the case—the growth rate of each compartment is
tightly linked to the growth rate of other compartments within the same organ. This coordination
appears to be hormonally regulated because when one compartment is growth perturbed, the
retarded growth rate of the unperturbed compartment can be rescued by systemic signaling
mediated by the hormone 20E. My study also shows that active organ autonomous IIS pathway
is necessary to mediate growth acceleration by 20E. Collectively, my research therefore
highlights the importance of crosstalk between organ-autonomous signaling mechanisms and
systemic signaling.
There are however a number of additional questions that my research raises. First, what is the
organ-autonomous mechanism that responds to changes in systemic ecdysone signaling?
Ecdysone has been canonically thought to function by its interaction with the EcR-Usp complex,
a steroid-activated nuclear-hormone receptor 1-3. However, the specific targets that EcR-Usp
upregulates in imaginal discs are still unclear. A recent study reported a role for Thor in
ecdysone-mediated imaginal disc growth 4; however, we do not find a role for Thor in the
context of intra-organ growth coordination. This finding raises the question of what other

143
pathways and downstream effectors may be acting downstream of EcR signaling to crosstalk
with IIS and/or other signaling pathways in the imaginal disc. So far there have been only a few
systematic efforts to identify unknown targets responsive to ecdysone and/or EcR-Usp signaling
5-7. Most of these studies have been conducted by examining whole organisms in different
developmental stages, making identification of specific targets in each organ is difficult. Studies
focusing on transcriptional changes in imaginal discs in response to changes in ecdysone
signaling are therefore needed.
Second, what is the nature of the signal by which the growth perturbed compartment signals to
the rest of the body? Previous research indicated that growth perturbed imaginal discs secrete an
insulin-like peptide, dILP8, which regulates developmental timing by inhibiting ecdysone
synthesis in the prothoracic gland 8, 9. More recently, Lgr3 was identified as the receptor of
dILP8 in the prothoracic gland and the CNS 10-12. It is likely that dILP8 and its corresponding
receptor Lgr3 are also involved in intra-organ organ growth coordination. One way to test this
would be to generate antfast:postslow imaginal discs in dILP8 null larvae. If the damage signal
originates from the growth perturbed tissue, in these mutant larvae there should be no reduction
in systemic ecdysone signaling and consequently no coordination of growth between the two
compartments of the imaginal disc. However, my study does not distinguish whether the growth
perturbed or the unperturbed compartment communicates the damage signal in antfast:postslow
larvae. Therefore, to test whether the unperturbed compartment secretes the damage signal, one
can use an RNAi mediated approach to eliminate dILP8 expression from the unperturbed
compartment. If the signal originates there, one would expect a lack of coordination between
compartments. Another possibility is that dILP8 (or another unknown signal) secreted from the
growth-perturbed tissue acts directly on the unperturbed compartment and affects a reduction in

144
growth rate. However, if this were the case, it is unlikely that dILP8 would be mediating this via
Lgr3 since Lgr3 is not expressed in imaginal discs 13. Further, if direct signaling between
compartments is relevant, then the indirect effects of dILP8 on the disc mediated through the
prothoracic gland and/or CNS must be overridden by ecdysone treatment.
Lastly, the counterintuitive nature by which IIS organ-autonomously perturbs growth
coordination in growth-perturbed imaginal discs is extremely puzzling. Our study finds that
organ autonomous upregulation or down regulation of insulin signaling by manipulating
expression of InR has no effect on the ontogenetic allometry between compartments in WT
larvae. A recent study demonstrated that manipulating IIS in one compartment by upregulating
expression of Dp110, the Drosophila homolog of PI3K resulted in a skewed compartment size
ratio 14. In agreement with this, my study suggests that compartment-specific perturbation of IIS
causes an alteration in the compartment size ratio—however, the relative growth rate of each
compartment remains the same. A likely explanation of these data is that growth rates of each
compartment are maintained even if cell proliferation rates are not, through compensatory
changes in cell size.
My research is part of a growing number of papers in the field demonstrating how localized
growth perturbation or changes in the environment affect humoral signaling and how this in turn
affects body and organ size. Figure 4-1 highlights some of the most recent research
demonstrating the interconnectivity between different organs and the role of humoral signals in
maintaining body homeostasis in Drosophila. It is important to remember that while these
signaling mechanisms have been discovered in Drosophila, there are mammalian homologs for a
majority of the components involved. For example, IGF-1 regulates growth in a manner that is
similar to the action of dILPs in Drosophila. Therefore, understanding the connections between

145
these growth control pathways in flies would be of interest not just to developmental biologists,
but also to clinical research focusing on growth abnormalities such as cancer.

146
Figure 4-1 Systemic signaling pathways regulating body and organ growth during development in Drosophila melanogaster

147
Figure 4-1 (cont’d)
(A) Fat body-Brain Nutrient Sensing Pathways. Developmental nutrition regulates secretion of
Drosophila Insulin-like peptides (dILPs) from the brain, which promotes larval body growth and
ecdysone synthesis in the prothoracic gland. The larval fat body serves as a sensor for sensing
amino acids in the diet, and this is communicated to the brain which promotes releases of dILPs.
In well-fed flies, the fat body secretes a peptide called as Stunted (Sun) which activates its
receptor Methuselah (Mth) in the dILP secreting cells in the brain. Under amino acid starvation,
the TNF homolog Eiger is converted into a soluble form (green squares) and interacts with its
receptor Grindlewald (Grnd) to upregulated JNK signaling in the brain. Increased JNK signaling
inhibits dILP secretion and thereby inhibits further growth. (B) Hormone-Body Size Signaling.
The larval ring gland comprising the Prothoracic Gland (PG) and the Corpus Allatum (CA) acts
as a central coordinator of hormone secretion in response to various environmental and
physiological inputs. Circulating amino acids and brain-derived dILPs regulate Ras/Raf/MAPK
signaling and IIS/TOR in the PG which further regulates the synthesis of ecdysone. Ecdysone
secretion is also controlled by the Prothoracicotropic Hormone (PTTH) secreted from the larval
brain. PTTH also regulates secretion of Juvenile Hormone (JH) from the CA, which acts
antagonistcally to ecdysone in regulating body growth. Ecdysone secretion controls
developmental timing, promotes imaginal disc growth and inhibits larval body growth. (C)
Organ-Damage Signaling. Imaginal disc damage is signaled to the brain and PG by dILP8
interacting with its receptor Lgr3. In the PG, dILP8 signals through Lgr3 to upregulate the
expression of Nitric Oxide Synthase (NOS) which inihibits ecdysone synthesis, thereby
preventing further growth of imaginal discs. In the larval brain, dILP8 suppresses PTTH
expression thereby also preventing ecdysone secretiong by the PG. Imaginal discs also signal

148
Figure 4-1 (cont’d)
through an unknown retinoic signaling mediated pathway to suppress PTTH secretion from the
brain. This complex network showing the roles of different secreted molecules highlights inter-
organ communication during development and its involvement in the determination of final body
and organ size in response to environmental and growth perturbations.

149
The role of feedback regulation in organ size regulation
In chapter 3, I described preliminary efforts to understand the cis-regulation of InR in
Drosophila. This preliminary effort is part of a much broader goal to understand the role of
feedback regulation of InR by the transcription factor dFoxo and the physiological relevance of
this feedback loop to signal output through the pathway.
As mentioned earlier, dFoxo forms a feedback loop to InR under conditions of nutrient
deprivation, when dFoxo is active 15. Feedback regulation by dFoxo in the IIS pathway had
previously been proposed as a mechanism by which cells could be ‘primed’ to produce
additional InR and therefore detect and respond to even small changes in nutrient levels. Thus,
dFoxo was proposed to control the sensitivity of the IIS pathway15 to levels of circulating dILPs.
Research in Drosophila has validated this prediction with the demonstration that the expression
levels of dFoxo in different organs makes them more or less sensitive to changes in nutrition
thereby regulating the size of different organs in response to changes in nutrition 16. However,
the role of the feedback regulation in mediating this difference in sensitivity has not been clearly
elucidated. More importantly, whether feedback regulation has any influence on final organ size
and nutritional plasticity is not clear. An in silico model of dFoxo feedback suggests that
increasing dFoxo expression and feedback would result in an increase in the nutritional plasticity
(Y. Liang, personal communication)—though experimental validation of this prediction is still
lacking. Overall, the dFoxo feedback regulation highlights an often-ignored aspect of signaling
pathways: the contribution of transcriptional regulation to signal output through the pathway.
In this context, genome engineering approaches with CRISPR/Cas9 developed in the last few
years provides an attractive solution. Using this approach, precise genetic editing can be
achieved and the role of particular transcriptional circuit can be tested without the confounding

150
effects of non-specific protein knockdown or overexpression. If one were to apply this approach
to the dFoxo-InR feedback regulation, I would be interested in determining the effect of
increasing or eliminating feedback to InR on nutritional sensitivity of different organs. The
experimental approach would involve generation of transgenic flies in which the endogenous InR
cis-regulatory locus has been modified to include additional dFoxo binding sites (increasing
feedback) or to completely delete predicted dFoxo-regulated binding sites (decreasing feedback).
If increased feedback in the presence of high levels of dFoxo results in an increase in nutritional
plasticity, one would expect that organs with high dFoxo expression such as the wings would be
more sensitive to changes in nutrition. Consequently, a decrease in nutrition should result in
wings decreasing in size to a much greater degree than the rest of the body.
Alternatively, a simpler transgenic approach as outlined in Chapter 3, Appendix II can be used to
answer the question of how much the dFoxo feedback loop contributes to total endogenous InR
expression in vivo. In this approach, a basal promoter and a Foxo Responsive Element (FRE)
containing four or eight dFoxo binding sites drives InR cDNA expression. Transgenic flies
containing this construct can then be assayed under varying nutritional conditions to determine
the contribution of dFoxo feedback to total InR expression under starvation.
The role of transcriptional regulation on gene expression has been extensively studied in
Drosophila. However, studies so far have almost exclusively focused on patterning genes17, or
on transgenic reporter gene expression patterns18, 19. The effect of systematic and specific
rewiring of transcriptional regulation to components of signaling pathways is a poorly
understood area of research, especially in multicellular organisms. Transcriptional regulatory
networks involving metabolic pathways and cellular signaling pathways have been well studied
in yeast, and have revealed basic design principles of a gene network 20. Understanding the role

151
and effect on phenotype of perturbations of these regulatory networks in a multicellular model
organism such as Drosophila will be an exciting area for future research in the field.
Organ size regulation: a mammalian perspective
Much of the research on size control mechanisms has been conducted in the invertebrate model
system of Drosophila. However, size regulatory pathways are conserved; similar signaling
pathways regulate organ size in vertebrates and mammals. In a nutshell, the final organ size in an
adult individual is the result of growth and proliferation of cells during development.
Consequently, organ size can simplistically be considered to be a composite measure of cell size
and cell number. However, organs do not grow in isolation—they are subject to regulation by
environmental factors and physiological factors. Indeed, cells sense their surroundings and alter
their growth and proliferation in response. This is mediated by growth factors, survival factors
and mitogens that activate intracellular pathways. Along with a proliferative response,
programmed cell death pathways are also essential to control final organ size. Organ growth and
size control is therefore, a tightly regulated development process. This is perhaps the most
fundamental principle of size control—conserved from Drosophila to mammals. Organ size
control mechanisms can be broadly classified as organ-autonomous or organ non-autonomous. In
Drosophila, autonomous regulation of organ size occurs during development through
compensatory and competition-based mechanisms (See Chapter 1 for more details). A similar
mechanism of cell-competition mediated elimination of cells has recently been identified in the
early mouse embryo 21, 22. Broad parallels also exist between Drosophila and mammals for non-
organ autonomous growth control mechanisms. For example in Drosophila, systemic growth
control involves the environmentally regulated IIS/TOR pathway, ecdysone signaling and JH
signaling along with other secreted factors such as Sun and Eiger. In mammals, Growth

152
Hormone (GH) signaling, in addition to IIS/TOR signaling plays a critical role in regulating
body and organ size. In fact, in the absence of adequate GH signaling, organs fail to achieve to
achieve a normal body size 23, 24. Thus, another common feature of all animal growth seems to be
an integration of local organ growth with that of the whole organism to result in the achievement
of correct final size.
While a significant part of our understanding of size control mechanisms comes from
Drosophila, a number of vertebrate model systems have also been used to elucidate the
principles and overall generalizability of size control mechanisms. These include the amphibian
model system of the salamander, and the mammalian model systems of the chick limb, mouse
embryo and human liver. Similar to invertebrates, early transplantation studies in the large and
small salamander species Amblystoma tigranum and Amblystoma punctatum demonstrated that
organ growth is controlled by two factors: an organ-autonomous “growth potential” and a non-
organ autonomous circulating “regulator” synthesized by the animal 25. Later, the “positional
identity” model derived from chick limb development provided an insight into how these
disparate mechanisms could be integrated into one holistic model of growth control. This model
posits that growth and differentiation in the limb is critically dependent on the precise
assignment of progenitor cells in the early organ bud 26. An internal clock is thought to measure
the time that a cell spends in the “progress zone”—an instructive region that dictates the fate and
growth potential of a progenitor cell 26, 27. Systemic factors are thought to regulate the size of the
pool of progenitor cells, whereas late growth of the organ bud is thought to be largely organ-
autonomous 28. This latter aspect was demonstrated with the finding that pieces of limb bud
exchanged between embryos of different ages grow at a rate determined by the donor—
irrespective of the host 29.

153
The human liver is perhaps the most well studied model system for understanding mammalian
organ size control mechanisms. Research over many decades has elucidated a few common
principles of size control using this model system. Firstly, as described previously, final organ
size is determined by the integration of extrinsic and intrinsic cues. These include extracellular
signals such hormones, cytokines, soluble factors as well local cell-cell interactions. Secondly,
while growth regulatory pathways are common to all organs, the ability of each organ to regulate
its final size varies among different organs 30. For example, the human liver (as opposed to the
pancreas) has a higher degree of autonomy in regulating its size—it is able to sense size
deficiencies at later developmental time points and regenerate to its correct size 31. The
“positional identity” model has been suggested to explain these unique observations 32. This
model suggests that the ability of different organs to compensate or regenerate (after injury) and
achieve a correct final size may be related to the timing of the systemic regulatory inputs. If the
developing organ progenitor is exposed to regulatory inputs exclusively early in development,
growth control program may appear to be largely fixed (and organ-autonomous) with little
ability to adjust or compensate in response to later size deficiencies. Conversely, if an organ
progenitor is exposed to persistent regulatory inputs in early development or to those that can be
re-invoked later on, it may retain a greater regenerative potential and exhibit a more plastic
growth program. For example, under this paradigm, it is likely that the human liver is subject to
extensive systemic regulatory inputs signals throughout development that contribute to its greater
regenerative potential in embryonic development and later adult life. On the other hand, the
pancreas (similar to the chick limb paradigm) may receive regulatory inputs exclusively early in
development dictating the fate and limited growth potential of the organ in later life. In support
of these hypotheses, a recent study found that reducing the number of progenitor cells in the

154
early liver and pancreas had markedly different consequences 31.. The liver responded rapidly to
compensate for the reduction in the progenitor pool (consistent with its regenerative ability),
whereas the pancreas did not compensate but instead remained small throughout gestational and
adult life 31. However, we still do not clearly understand the mechanism by which the liver
senses a size deficiency, nor the mechanism by which liver cells stop proliferating after sensing
normalization of size. Moreover it is not clear why the growth program in some organs appears
fixed, but appears regulated in others and whether either of these represents a “default”
mechanism.
The molecular mechanisms by which growth control is effected in mammals shares a great
degree of overlap with Drosophila. Broadly, organ growth is regulated by soluble growth factors,
localized cell interactions and cell autonomous mechanisms. Of all the soluble growth factors,
GH/IGF-mediated growth is perhaps the most important mechanism of body size regulation in
mammals. GH functions as a mitogen in promoting growth of tissues and also acts through IGF-
1 in mediating organ growth 23. Soluble growth factors regulate both the generation as well as
proliferation of progenitor cell populations that contribute to the final organ. For example,
Fibroblast Growth Factor (FGF) secreted by the apical limb bud cells drives the early growth of
the limb bud33. An alternate mammalian mechanism by which organs may auto-regulate their
growth is by the secretion of organ-specific growth inhibitors called “chalones” 34, 35. For
example, myostatin, a member of the TGF-beta family is secreted from muscle cells and acts
systemically to inhibit further muscle growth 36, 37 More recently, a second member of the TGF-
beta family, GDF11, produced by embryonic olfactory epithelium cells was shown to act as a
chalone by inhibiting progenitor cell proliferation 38. Interestingly, however, no other chalones or
growth inhibitory molecules have been discovered so far, leaving open the question of how

155
common this mechanism may be. Lastly, environmentally modulated growth takes place through
the activation of the IIS/TOR phosphorylation cascade in both Drosophila and mammals, albeit
through the activation of different receptor molecules. In mammals, the IIS/TOR cascade is
activated by IGFR as well as several other classes of growth factor receptors including tyrosine
kinase, cytokine and TGF-beta receptors 39, whereas in Drosophila it is mediated through a
single Insulin Receptor. Localized cell interactions were first shown to be involved in
mammalian size regulation with the observation that rat embryonic liver progenitor cells grafted
into adult livers increased their number over time. This was accompanied by increased apoptosis
of recipient cells to result in no net change of the total liver mass 40. Subsequently, a c-Myc
dependent cell competition mechanism similar to that in Drosophila was identified in the mouse
embryo raising the possibility that early mammalian embryo size may, at least partly, be
regulated by cell competition. These studies demonstrate that differences in the expression of c-
Myc amongst cells in a population or tissue results in cell competition causing elimination of
cells with lower expression of Myc 21, 22, 41-43. Cell-cell contact and cell polarity also regulate the
Hippo signaling pathway, a major organ size regulatory pathway. In both Drosophila and
mammalian cells, for instance, cell-cell contact at high cell density produces a growth inhibitor
signal that is mediated through the Hippo pathway 44, 45. Similarly, the regulation of the Hippo
pathway by apical-basal polarity proteins and planar cell polarity proteins is a common feature in
both Drosophila and the mammalian system 46-51. Lastly, there is some limited evidence from the
mammalian system to suggest that cell autonomous mechanisms such as telomere shortening and
global epigenetic modifications have an impact on cell proliferation rates [Lui and Barone 2011).
However, more concrete evidence linking such genomic changes to impacts on organ size has
yet to be demonstrated.

156
Collectively, mammalian growth control mechanisms regulating organ size share a number of
similarities with those already well elucidated in Drosophila. Firstly, size regulatory pathways
are highly conserved at the molecular level, and function to regulate organ size in response to
similar inputs in both Drosophila and mammalian organs. For instance, in both invertebrate and
vertebrate systems, the IIS/TOR and Hippo pathways regulate organ growth in response to
extracellular inputs and localized cell interactions, respectively; each of these pathways consist
of a highly conserved core signaling cascade. Secondly, if one considers how these pathways are
regulated in vertebrate systems, we see that once again, there are some highly conserved features
to those in invertebrate systems. For instance, in both Drosophila and mammals, cell polarity and
cell-cell contact regulate Hippo signaling and cell competition. Lastly, despite the vast size
differences between and within species amongst vertebrates, there is little variation in the overall
pathway architecture of growth regulating pathways between vertebrates and invertebrates. Size
variation within and between species can instead be better explained for instance, by allelic
differences within species (in the case of different dog breeds) 52, or by the utilization of a variety
of physiological controls that regulate and limit organ growth differently in different species 53.
Nevertheless, despite the great progress in understanding growth control mechanisms across
different model systems, several fundamental aspects remain as yet unclear. For instance, how is
target size sensed to initiate or arrest growth of organs? How does the DNA content/ploidy of a
cell impact its size and/or growth regulation? How is autonomous growth of mammalian organs
achieved? From a more clinical perspective, how are some of these size control checkpoints
overcome and tissue growth dysregulated to result in tumorous overgrowth? Future research
directed at answering these and other open questions would likely yield insights not just into
organ function but also into the pathology of growth control diseases like cancer.

157
Organ size regulation: perspectives for future research
The research described in the previous chapters can best be appreciated if one considers organ
development from the point of view of a synthetic biologist. Both of the aspects of growth
control described in this thesis play unique roles in specific developmental and physiological
contexts, which enable the organism to adapt and effectively respond to the fluctuating
environment while still ensuring adequate functionality of the organ. A growing area of research
today is the field of regenerative medicine—which aims to improve health and disease outcomes
by repairing and regenerating cells, tissues and organs. The ultimate goal of regenerative
medicine and tissues engineers is the synthesis of a fully functional organ in the laboratory.
However, to build a functional organ, a solid understanding of the physiological processes
involved in size determination—both at the molecular level as well as the whole-organismal
level is crucial.
One of the main challenges of regenerative medicine has been poor in-vitro ability of cells to
aggregate and self-organize to form tissues mimicking the complex organization in vivo. The
primary problem is size—as the tissue grows in size, the accompanying vasculature must keep
up with it in order to sustain further growth of the tissue. Research over the last few years has
demonstrated that organ growth involves multiple different types of cells growth together in
harmony and interacting with each other through different signaling pathways to regulate the
growth of the organ. Replicating these pathways in vitro will be key to synthesizing a truly
functional organ. Future research directed at understanding the minutiae of growth control
pathways will not only give us a deeper understanding of the different molecular processes
involved in size control but also solve some of the most pressing challenges of regenerative
medicine.

158
REFERENCES

159
REFERENCES
1. Schubiger M, Carre C, Antoniewski C, Truman JW. Ligand-dependent de-repression via EcR/USP acts as a gate to coordinate the differentiation of sensory neurons in the Drosophila wing. Development 2005, 132:5239-5248.
2. Schubiger M, Truman JW. The RXR ortholog USP suppresses early metamorphic processes in Drosophila in the absence of ecdysteroids. Development 2000, 127:1151-1159.
3. Brown HL, Cherbas L, Cherbas P, Truman JW. Use of time-lapse imaging and dominant negative receptors to dissect the steroid receptor control of neuronal remodeling in Drosophila. Development 2006, 133:275-285.
4. Herboso L, Oliveira MM, Talamillo A, Perez C, Gonzalez M, Martin D, Sutherland JD, Shingleton AW, Mirth CK, Barrio R. Ecdysone promotes growth of imaginal discs through the regulation of Thor in D. melanogaster. Sci Rep 2015, 5:12383.
5. Gauhar Z, Sun LV, Hua S, Mason CE, Fuchs F, Li TR, Boutros M, White KP. Genomic mapping of binding regions for the Ecdysone receptor protein complex. Genome Res 2009, 19:1006-1013.
6. Li T-R, White KP. Tissue-Specific Gene Expression and Ecdysone-Regulated Genomic Networks in Drosophila. Developmental Cell 2003, 5:59-72.
7. Davis MB, Li T. Genomic analysis of the ecdysone steroid signal at metamorphosis onset using ecdysoneless and EcRnull Drosophila melanogaster mutants. Genes & genomics 2013, 35:21-46.
8. Garelli A, Gontijo AM, Miguela V, Caparros E, Dominguez M. Imaginal discs secrete insulin-like peptide 8 to mediate plasticity of growth and maturation. Science 2012, 336:579-582.
9. Colombani J, Andersen DS, Leopold P. Secreted Peptide Dilp8 Coordinates Drosophila Tissue Growth with Developmental Timing. Science 2012, 336:582-585.
10. Jaszczak JS, Wolpe JB, Bhandari R, Jaszczak RG, Halme A. Coordination During Drosophila melanogaster Imaginal Disc Regeneration Is Mediated by Signaling Through the Relaxin Receptor Lgr3 in the Prothoracic Gland. Genetics 2016.
11. Colombani J, Andersen DS, Boulan L, Boone E. Drosophila Lgr3 couples organ growth with maturation and ensures developmental stability. Current Biology 2015.
12. Garelli A, Heredia F, Casimiro AP, Macedo A, Nunes C, Garcez M, Dias AR, Volonte YA, Uhlmann T, Caparros E, et al. Dilp8 requires the neuronal relaxin receptor Lgr3 to couple growth to developmental timing. Nature Communications 2015, 6:8732.

160
13. Celniker SE, Dillon LA, Gerstein MB, Gunsalus KC, Henikoff S, Karpen GH, Kellis M, Lai EC, Lieb JD, MacAlpine DM. Unlocking the secrets of the genome. Nature 2009, 459:927-930.
14. Ferreira A, Milan M. Dally Proteoglycan Mediates the Autonomous and Nonautonomous Effects on Tissue Growth Caused by Activation of the PI3K and TOR Pathways. PLoS Biol 2015, 13:e1002239.
15. Puig O, Tjian R. Transcriptional feedback control of insulin receptor by dFOXO/FOXO1. Genes & development 2005, 19:2435-2446.
16. Tang HY, Smith-Caldas MS, Driscoll MV, Salhadar S, Shingleton AW. FOXO regulates organ-specific phenotypic plasticity in Drosophila. PLoS Genet 2011, 7:e1002373.
17. Perry MW, Bothma JP, Luu RD, Levine M. Precision of hunchback expression in the Drosophila embryo. Curr Biol 2012, 22:2247-2252.
18. Fakhouri WD, Ay A, Sayal R, Dresch J, Dayringer E, Arnosti DN. Deciphering a transcriptional regulatory code: modeling short-range repression in the Drosophila embryo. Mol Syst Biol 2010, 6:341.
19. Sayal R, Ryu S-M, Arnosti DN. Optimization of reporter gene architecture for quantitative measurements of gene expression in the Drosophila embryo. Fly 2011, 5:47-52.
20. Furukawa K, Hohmann S. Synthetic biology: lessons from engineering yeast MAPK signalling pathways. Molecular microbiology 2013, 88:5-19.
21. Claveria C, Giovinazzo G, Sierra R, Torres M. Myc-driven endogenous cell competition in the early mammalian embryo. Nature 2013, 500:39-44.
22. Sancho M, Di-Gregorio A, George N, Pozzi S, Sanchez JM, Pernaute B, Rodriguez TA. Competitive interactions eliminate unfit embryonic stem cells at the onset of differentiation. Dev Cell 2013, 26:19-30.
23. Lupu F, Terwilliger JD, Lee K, Segre GV, Efstratiadis A. Roles of growth hormone and insulin-like growth factor 1 in mouse postnatal growth. Developmental biology 2001, 229:141-162.
24. Brem G, Wanke R, Wolf E, Buchmüller T, Müller M, Brenig B, Hermanns W. Multiple consequences of human growth hormone expression in transgenic mice. Molecular biology & medicine 1989, 6:531-547.
25. Harrison RG. Some unexpected results of the heteroplastic transplantation of limbs. Proceedings of the National Academy of Sciences 1924, 10:69-74.
26. Summerbell D, Lewis J, Wolpert L. Positional information in chick limb morphogenesis. Nature 1973, 244:492-496.

161
27. Tabin C, Wolpert L. Rethinking the proximodistal axis of the vertebrate limb in the molecular era. Genes & development 2007, 21:1433-1442.
28. Wolpert L. Cellular basis of skeletal growth during development. British medical bulletin 1981, 37:215-219.
29. Summerbell D, Lewis J. Time, place and positional value in the chick limb-bud. Development 1975, 33:621-643.
30. Penzo-Méndez AI, Stanger BZ. Organ-size regulation in mammals. Cold Spring Harbor perspectives in biology 2015, 7:a019240.
31. Stanger BZ, Tanaka AJ, Melton DA. Organ size is limited by the number of embryonic progenitor cells in the pancreas but not the liver. Nature 2007, 445:886-891.
32. Stanger BZ. Organ size determination and the limits of regulation. Cell Cycle 2008, 7:318-324.
33. Cohn MJ, Izpisúa-Belmonte JC, Abud H, Heath JK, Tickle C. Fibroblast growth factors induce additional limb development from the flank of chick embryos. Cell 1995, 80:739-746.
34. Bullough W. Mitotic and functional homeostasis: a speculative review. Cancer Research 1965, 25:1683-1727.
35. Gamer LW, Nove J, Rosen V. Return of the chalones. Developmental cell 2003, 4:143-144.
36. McPherron AC, Lawler AM, Lee S-J. Regulation of skeletal muscle mass in mice by a new TGF-p superfamily member. 1997.
37. Schiaffino S, Dyar KA, Ciciliot S, Blaauw B, Sandri M. Mechanisms regulating skeletal muscle growth and atrophy. FEBS Journal 2013, 280:4294-4314.
38. Wu H-H, Ivkovic S, Murray RC, Jaramillo S, Lyons KM, Johnson JE, Calof AL. Autoregulation of neurogenesis by GDF11. Neuron 2003, 37:197-207.
39. Tumaneng K, Russell RC, Guan K-L. Organ size control by Hippo and TOR pathways. Current Biology 2012, 22:R368-R379.
40. Dabeva MD, Petkov PM, Sandhu J, Oren R, Laconi E, Hurston E, Shafritz DA. Proliferation and differentiation of fetal liver epithelial progenitor cells after transplantation into adult rat liver. The American journal of pathology 2000, 156:2017-2031.
41. de la Cova C, Abril M, Bellosta P, Gallant P, Johnston LA. Drosophila myc regulates organ size by inducing cell competition. Cell 2004, 117:107-116.

162
42. Moreno E, Basler K. dMyc transforms cells into super-competitors. Cell 2004, 117:117-129.
43. Neto-Silva RM, Wells BS, Johnston LA. Mechanisms of growth and homeostasis in the Drosophila wing. Annu Rev Cell Dev Biol 2009, 25:197-220.
44. Zhao B, Wei X, Li W, Udan RS, Yang Q, Kim J, Xie J, Ikenoue T, Yu J, Li L. Inactivation of YAP oncoprotein by the Hippo pathway is involved in cell contact inhibition and tissue growth control. Genes & development 2007, 21:2747-2761.
45. Ota M, Sasaki H. Mammalian Tead proteins regulate cell proliferation and contact inhibition as transcriptional mediators of Hippo signaling. Development 2008, 135:4059-4069.
46. Chen C-L, Gajewski KM, Hamaratoglu F, Bossuyt W, Sansores-Garcia L, Tao C, Halder G. The apical-basal cell polarity determinant Crumbs regulates Hippo signaling in Drosophila. Proceedings of the National Academy of Sciences 2010, 107:15810-15815.
47. Zhang N, Bai H, David KK, Dong J, Zheng Y, Cai J, Giovannini M, Liu P, Anders RA, Pan D. The Merlin/NF2 tumor suppressor functions through the YAP oncoprotein to regulate tissue homeostasis in mammals. Developmental cell 2010, 19:27-38.
48. Bennett FC, Harvey KF. Fat cadherin modulates organ size in Drosophila via the Salvador/Warts/Hippo signaling pathway. Curr Biol 2006, 16:2101-2110.
49. Willecke M, Hamaratoglu F, Kango-Singh M, Udan R, Chen C-l, Tao C, Zhang X, Halder G. The fat cadherin acts through the hippo tumor-suppressor pathway to regulate tissue size. Current Biology 2006, 16:2090-2100.
50. Azzolin L, Zanconato F, Bresolin S, Forcato M, Basso G, Bicciato S, Cordenonsi M, Piccolo S. Role of TAZ as mediator of Wnt signaling. Cell 2012, 151:1443-1456.
51. Huang W, Lv X, Liu C, Zha Z, Zhang H, Jiang Y, Xiong Y, Lei Q-Y, Guan K-L. The N-terminal phosphodegron targets TAZ/WWTR1 protein for SCFβ-TrCP-dependent degradation in response to phosphatidylinositol 3-kinase inhibition. Journal of Biological Chemistry 2012, 287:26245-26253.
52. Sutter NB, Bustamante CD, Chase K, Gray MM, Zhao K, Zhu L, Padhukasahasram B, Karlins E, Davis S, Jones PG. A single IGF1 allele is a major determinant of small size in dogs. Science 2007, 316:112-115.
53. Lui JC, Baron J. Mechanisms limiting body growth in mammals. Endocrine reviews 2011, 32:422-440.