Embed Size (px)
Citation preview
The Rise of the Equity Lending Market:Implications for Corporate Financial Policies
Murillo Campello Pedro A. C. SaffiCornell University & NBER University of Cambridge
[email protected] [email protected]
This Draft: December 8, 2015
Abstract
Ever increasing competition and search for yield have prompted institutional investors to routinely
lend their equity holdings, making them the largest suppliers of stocks used for short selling. Shorting
depresses stock prices, making it harder for firms to plan their payout policies, investments, merger
deals, and employee compensation. We exploit the framework of institutional investing to show how
shifts in the supply of lendable (shortable) stocks affect corporate policies. Firms react promptly
to increases in lendable stocks by repurchasing shares and building cash reserves. The relations we
document appear to be causal and consistent with the argument that firms shore up defenses against
shorting activity. To fund their responses, firms pay fewer dividends, issue debt, and reduce invest-
ment spending. Firm responses are more pronounced when stocks are ex-ante more liquid, relatively
overvalued, have higher pent-up shorting demand, and whose managers’ personal compensation is
more sensitive to stock prices.
Keywords: Equity lending market, cash holdings, share repurchases, short sales constraints, insti-
tutional ownership, instrumental variables.
JEL classification: G23, G32, G35.
*Murillo Campello, Johnson Graduate School of Management, Cornell University, 114 East Avenue, 381 Sage
Hall, Ithaca, NY 14853. Pedro A. C. Saffi, Judge Business School, University of Cambridge, Cambridge, UK,
CB2 1AG. We thank Zahi Ben-David, Igor Cunha, Gaurav Kankanhalli, Michael Kisser, Bart Lambrecht, Eva
Steiner, Jason Sturgess, Michael Weisbach, Pradeep Yadav, as well as seminar participants at the 2nd Ed-
inburgh Corporate Finance Conference, the 2015 LUBRAFIN meeting (Obidos), and the European Finance
Association meeting (Vienna) for their comments and suggestions. We are responsible for any remaining errors.
1 Introduction
It is based on equity prices that managers estimate their companies’ cost of capital, plan
merger deals, establish payout policies, and even design employee compensation schemes. Un-
surprisingly, managers dislike events that devalue their companies’ stock or that add volatility
to the price formation process. Indeed, the vast majority of managers say they initiate re-
purchase programs when their companies’ stock trade at depressed price levels (Brav et al.
(2008)), and evidence shows that firms buy back their shares to reduce price volatility (Hong
et al. (2008)). As shown in theoretical work, price manipulation — especially by short sellers —
can significantly distort the allocation of corporate resources (Goldstein and Guembel (2008)
and Khanna and Mathews (2012)). Managers will be concerned with the development of mar-
ket institutions and practices that facilitate stock price manipulation (Edmans et al. (2015)).
While managers cannot control stock prices, they can influence the trading of their compa-
nies’ shares. Like central bankers in currency markets, corporate managers have near-monopoly
power over the supply of (own-)company stocks going into the market: they are uniquely en-
titled to issue fresh stocks. They can also repurchase existing stocks under large company-
sponsored programs. Yet, managers’ influence over their firms’ stocks is limited. In particular,
their ability to influence float depends on the existing pool of “lendable stocks” — stocks that
are placed by company investors in the equity lending market. Interests in those stocks can
be borrowed by speculators and other traders, enabling short selling strategies.1 While the
institutional framework regulating shorting has remained stable over recent years, the sup-
ply of lendable stocks has significantly increased, together with the unprecedented growth of
institutional investing (Lewellen (2011)).
This study assesses the impact of the equity lending market on corporate financial policies,
adding insight into how evolving market institutions shape firm behavior. It does so exploiting
trends, rules, and ad hoc practices in institutional investing. Recent research establishes a
strong connection between outward shifts in the supply of lendable stocks and the relaxation
of short sales constraints (e.g., Kolasinski et al. (2013), Prado et al. (2014), and Aggarwal
et al. (2015)).2 Our analysis shows that firms respond to shifts in the supply of lendable
stocks with policies that shore up their defenses against shorting. Among other responses,
1Boehmer and Wu (2013) document that short selling now accounts for almost one quarter of all trading inthe U.S. stock market.
2Kolasinski et al. (2013), for example, show that when more shares are available to lend, speculators locatethem more easily and pay lower borrowing fees, prompting shorting activity.
1
firms promptly repurchase stocks and hoard cash following increases in the supply of lendable
stocks. In all, not only do firms act directly in reducing stock float, but also build reserves that
enable them to sustain such policy across time. The relations we report appear to be causal
and the economic magnitudes involved are significant. The various corporate policy responses
we document seem coordinated and internally consistent. As we explain in detail, the tests
we perform are informed and guided by the setting we consider, where well-identified shifts in
institutional ownership generate pronounced, discrete changes in the supply of lendable stocks.
To our knowledge, our study is the first to show the impact of the equity lending market on
corporate financial management.
We start our investigation with standard models of the determinants of corporate stock re-
purchases and cash savings (e.g., Dittmar (2000), Grullon and Michaely (2002), Almeida et al.
(2004), and Bates et al. (2009)). Performing fixed-effects (FE) estimations, we add a measure
of net lendable (shortable) stock supply to models used in prior literature. In every estimation,
we find a positive, statistically significant coefficient for the lendable supply measure. Conser-
vative estimates in this basic set of tests suggest that a one-interquartile range (IQR) increase
in a company’s supply of lendable stocks is associated with 0.14% more stock repurchases and
a 1.44% increase in cash holdings (both as a fraction of total assets) in the subsequent quar-
ter. These figures are equivalent to 23.3% and 7.1% of the sample mean repurchase and cash
holdings, respectively.
To tease out causality in the relations above, we implement test strategies that reflect the
setting in which our investigation takes place. The growth of institutional ownership and the
intensive use of trading strategies that rely on short selling have become the major drivers of
activity in equity lending. A notable phenomenon that accompanies the growth in lendable
stock supply is the surge of passive investing, attributed to the emergence of index funds and
exchange-traded funds (ETFs). These funds are concerned with a firm’s performance for as
long as it belongs to their targeted benchmark portfolio — their goal is to minimize “tracking
errors.” They trade high volumes and buy large amounts of stocks in the firms they target.
The figures involved are significant, with some 42% of all equity mutual funds in the U.S. today
being dedicated to index investing (see Cremers et al. (2015)). Critically, one key aspect of
index investing has become a concern to corporate managers. As a means to lower their in-
vestment costs and improve reported performance, index funds and ETFs customarily lend the
stocks they own to other investors; primarily to investors interested in implementing shorting
strategies (see Evans et al. (2014)). They do so indiscriminately, lending high quantities of
2
stocks at very low fees.3 The supply of lendable stocks grew over 10-fold in the last decade.4
Passive investors’ portfolio choices follow “style” and “diversification” strategies that can
be used to help identify causal effects in our tests. To wit, increases in passive ownership
lead to increases in lendable supply (inclusion restriction). Yet, these shifts are born out of
developments in the competition for funds in the index investment industry and are otherwise
independent from individual firm policies (exclusion restriction).5 These observations allow
us to propose and experiment with our first IV test strategy. We identify passive investors’
holdings in firms and use this measure of ownership as an instrument for the supply of lendable
stocks.6 In this way, we pinpoint the effects of lendable supply on firm policies that are driven
exclusively by variation in the ownership of passive institutional investors. As it turns out,
this IV test also shows that outward shifts in the supply of lendable stocks prompt corporate
managers to repurchase stocks and save cash.
The setting we explore allows us to consider additional strategies to identify the relation
between the supply of lendable stocks and corporate policies. Because the composition of
indices followed by index investors change discretely on a regular basis, one can use index
reconstitutions as surrogates for “local shifts” in the supply of lendable stocks. Specifically,
as firms are dropped and included in different indices, index funds are forced to reshuffle their
investment in stocks affected by reconstitution. As the investment portfolio of those funds
change, so does the supply of lendable stocks of the affected firms. In this setting, we focus on
the annual reconstitutions of the Russell 1000 and Russell 2000 indices, whose memberships
are composed of firms ranked according to their market capitalization. The indices are value-
weighted so that stocks at the top of the index exhibit heavy buying by index funds, whereas
stocks at the bottom receive close to none.
Transitions across the Russell 1000 and Russell 2000 indices allow for a two-sided approach
to identifying changes in the supply of lendable stocks. As firms on the margin of the capital-
ization ranking cut-off switch from the very bottom of the Russell 1000 index to the very top
of the Russell 2000 index, index investors need to buy large amounts of those firms’ stocks to
3Blocher and Whaley (2015) estimate that ETFs earn 28 basis points per year from security lending.4As of 2012, out of the $11 trillion U.S. stock market capitalization, $2.6 trillion (or 24%) were reported as
being available for lending.5Wurgler (2011) argues that index-based investing causes prices to be divorced from firms’ fundamentals,
lowering managers’ incentives to gather and act upon firm-specific fundamental information. Grossman andStiglitz (1980) provide the foundations for this argument in a general-equilibrium framework.
6We follow Bushee (1998) in identifying and classifying institutional investors into distinct style groupsbased on factor analysis. This approach has been used by, among others, Fang et al. (2014), Crane et al.(2014), Roosenboom et al. (2014), and Asker et al. (2015) to gauge the holdings of passive investors.
3
adjust their portfolios. As they do so, they make those stocks available in the equity lending
market. Analogous dynamics occur when a stock moves from the top of the Russell 2000 index
to the bottom of the Russell 1000 index. That is, this migration leads to a drop in ownership
by index investors, triggering a decline in the supply of lendable stocks. We use this process to
capture shifts in the supply of lendable stocks in our tests. These dynamics are outside of firm
managers’ control and, as we demonstrate, lead to sharp, localized shifts in the net supply of
lendable stocks.
Using the Russell indexing reconstitution process, we follow Crane et al. (2014) and Appel
et al. (2014) in designing a “local IV” test that allows us to identify the effects of changes in
the supply of lendable stocks.7 In a first-stage estimation, we recover the change in lendable
supply that is induced by membership switching across Russell indices. In the second stage,
we regress stock repurchases and cash on the component of lendable supply that is explained
by membership changes across indices. This distinct IV strategy, too, shows that increases in
the supply of lendable stocks prompt firms to repurchase stocks and build up reserves.
We extend our analysis in several ways to verify the robustness of our results and their
internal logic. We show, for example, that the estimated effect of lendable supply on stock
repurchases varies negatively with the amount of cash the firm saves. This is consistent with
the logic of a binding budget constraint that forces managers to substitute between share buy-
backs and cash hoarding in responding to surges in the supply of lendable stocks. In other
words, firms respond to a relaxation in shorting constraints by either immediately repurchas-
ing shares or by accumulating cash war chests that allow them to respond to the threat of
shorting in a time-consistent fashion. In that vein, we also show that an expansion in lendable
supply increases the probability that firms publicly announce the authorization of repurchase
programs in the following quarter. This is notable since such announcements enable firms
to signal a response to the threat of shorting, yet they do not imply that firms immediately
spend resources.8 We further examine how other corporate policies are modified in order to
fund increases in repurchases and cash. Firms pay fewer dividends, issue debt, and cut their
investment following increases in the supply of lendable stocks.
Beyond mapping out how firms optimize resources in responding to shifts in the supply of
7To help organize our overall identification strategy, we call this test the “local IV” approach, in contrastto the “global IV” approach that uses passive ownership as an instrument described previously.
8A detailed study by Simkovic (2009) reveals that, on average, only 40% of the amount authorized undera buyback program is repurchased within one quarter after the announcement. Over a full year after theannouncement, only 71% of the stocks are repurchased. The percentage of firms that fulfill their programauthorization within one year of the announcement is only 44% (see also Stephens and Weisbach (1998)).
4
lendable stocks, we exploit firm heterogeneity that helps shore up our inferences. We show, for
example, that shifts in lendable stock supply trigger stronger responses from those firms whose
stocks are more liquid and easier to trade. That is, the degree by which investors can trade
shares is rationally taken into account by managers when deciding how to respond to increases
in lendable supply. We also find that companies respond with more aggressive repurchase
policies when their stocks have higher pent-up short sales demand prior to shifts in lendable
stocks. Likewise, stock repurchases are more sensitive to changes in lendable supply for firms
whose stocks seem overvalued; that is, those that are expected to face a higher demand for
shorting following a relaxation in short sales constraints. Finally, consistent with agency con-
siderations, repurchase programs are particularly aggressive when managers’ personal wealth
(compensation) is sensitive to the market price of their companies’ stock.
The precipitous growth of the equity lending market has sparked several new research
agendas. Kolasinski et al. (2013) and Prado et al. (2014) describe relations between the sup-
ply of lendable stocks, institutional ownership, and limits to arbitrage. Massa et al. (2015)
study whether the threat of shorting (measured by lendable supply) curbs earnings manage-
ment, while Christoffersen et al. (2007) and Aggarwal et al. (2015) investigate voting behavior
around shareholder meetings using lent equity. Our paper adds to this line of research showing
how firm financial policies are shaped by the evolving nature of the equity lending market.
Research on financial management proposes several motivations for firms’ repurchase and
cash policies. Empirical work by Stephens and Weisbach (1998) and Dittmar (2000) shows
that firms repurchase shares to take advantage of undervalued equity, to change their leverage
ratios, and to prevent takeovers. Research on the drivers of corporate cash run a gamut rang-
ing from the need to minimize the impact financing constraints on investment (Almeida et al.
(2004)) to concerns about cash flow risk (Bates et al. (2009)) and product market competition
(Fresard (2010)). Notably, existing papers have not examined how share repurchase programs
and cash savings policies can be used as safeguard against shorting, nor the extent to which
firm policies jointly conform to changes in the supply of shortable stocks.
Methodologically, our study builds on recent literature looking at the impact of index in-
vesting and index reconstitution. Appel et al. (2014) use the annual reconstitution of the
Russell indices to study whether ownership by passive mutual funds affects corporate gover-
nance, while Crane et al. (2014) use the same index discontinuity to study whether ownership
by institutions affects payout. Ferreira et al. (2010) consider revisions of the MSCI World in-
dex’s country weights to estimate the intensity of cross-border activity. We follow these papers
5
in using instrumental variables to estimate the impact of index discontinuity on outcomes of
interest. None of these papers, however, looks at how firms change their policies in response
to shifts in the supply of lendable stocks.
The remainder of the paper is organized as follows. Section 2 discusses the growth of the
equity lending market. Section 3 describes the data we use. Section 4 contains the baseline,
fixed-effects regression results for the relation between corporate policies and the supply of
lendable stocks. Section 5 presents results from an instrumental variables approach that uses
passive institutional ownership as an instrument for the supply of lendable stocks. Section
6 implements an alternative instrumental estimation approach derived from rules dictating
membership in the Russell indices. Section 7 provides a number of tests designed to check the
robustness and logic of our main results. Section 8 use cross-firm heterogeneity to corroborate
and extend our findings. Section 9 concludes.
2 The Equity Lending Market
Investors wishing to short a company’s stock must borrow shares in the equity lending
market. Borrowers pay a fee and put up collateral (usually 102% of the position’s size) in ex-
change for their desired shares. The collateral is invested by the lenders, who return a certain
fraction of the proceeds (called the rebate rate) back to the borrowers. The implied loan fee
is defined as the difference between the risk-free interest rate and the rebate rate. Borrowers
in this market are mostly investors setting up short positions, such as hedge funds.9
The growth of the equity lending market has been remarkable. Massa et al. (2015) report
that the fraction of U.S. equities available for lending has increased from 0.4% in 2002 to 19.3%
in 2009. An important feature of this growth is the role institutions play in the market: they
are the largest suppliers of lendable stocks. Indeed, lending out equity holdings to secure extra
revenues has become standard in the industry. CalPERS, for example, reports having earned
$1.2 billion in revenues from security lending between 2000 and 2008; an additional 30 basis
points to the pension fund’s overall return performance (see also Blocher and Whaley (2015)).
While stock lending is widespread among institutional investors, it is more pronounced among
passive investors such as index funds and ETFs; vehicles that have become extraordinarily
popular worldwide in recent years (see Cremers et al. (2015)).
9Stocks can also be borrowed for tax-arbitrage strategies or voting in shareholder meetings (see Christoffersenet al. (2005) and Aggarwal et al. (2015)).
6
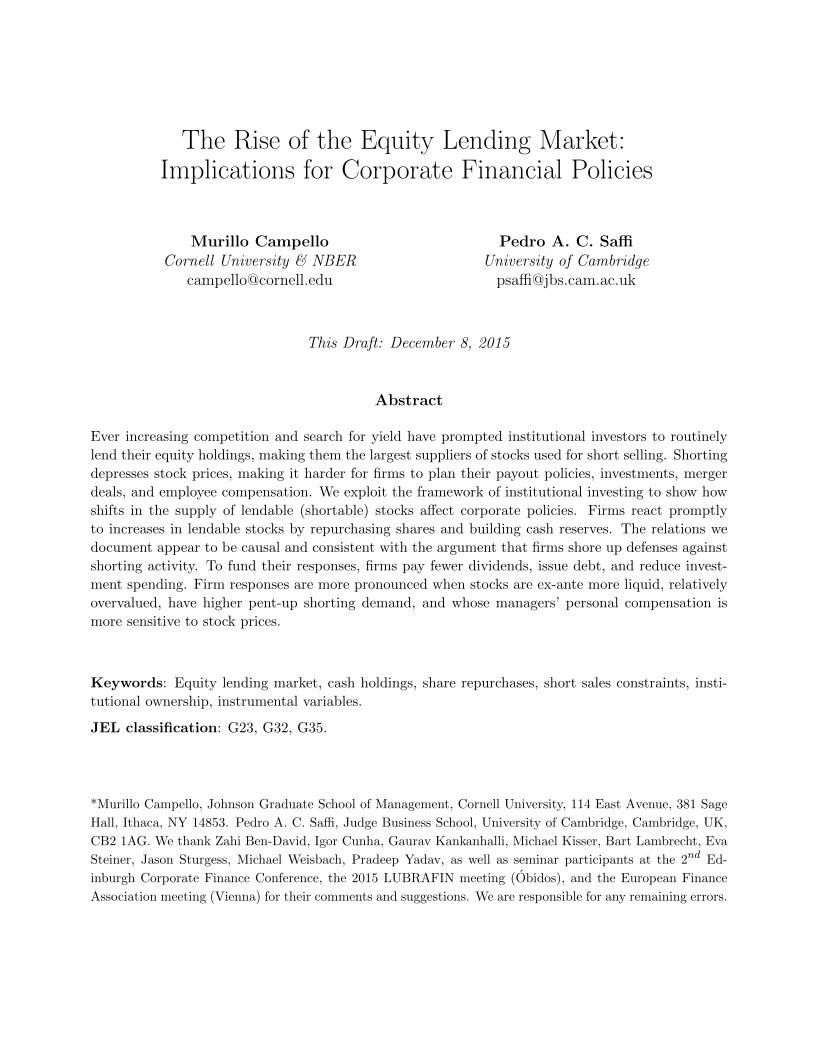
Figure 1. Equity Lending Market Dynamics over Time
12
14
16
18
20
22
24
Se
p-2
00
6
De
c-2
00
6
Ma
r-2
00
7
Ju
n-2
00
7
Se
p-2
00
7
De
c-2
00
7
Ma
r-2
00
8
Ju
n-2
00
8
Se
p-2
00
8
De
c-2
00
8
Ma
r-2
00
9
Ju
n-2
00
9
Se
p-2
00
9
De
c-2
00
9
Ma
r-2
01
0
Ju
n-2
01
0
Se
p-2
01
0
De
c-2
01
0
Mar-
2011
Ju
n-2
01
1
Se
p-2
01
1
De
c-2
01
1
Ma
r-2
01
2
Ju
n-2
01
2
Se
p-2
01
2
De
c-2
01
2
% o
f m
ark
et ca
p
Supply Shortable Supply
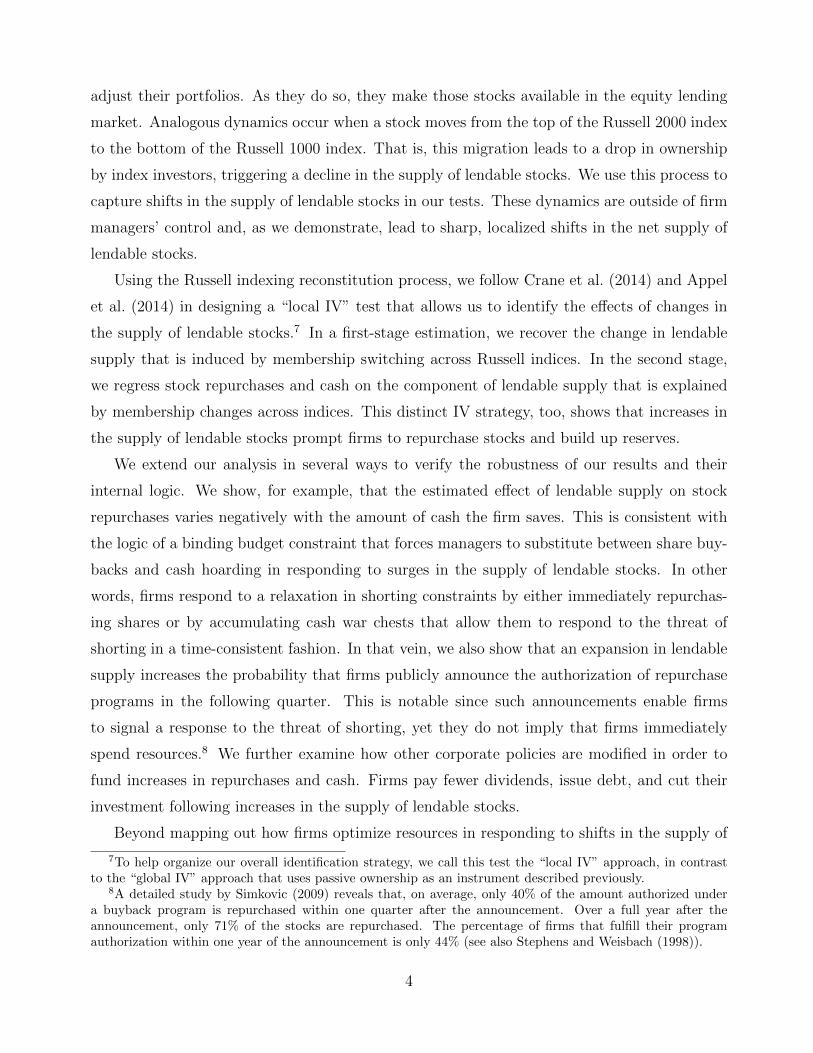
This figure shows quarterly averages of lendable supply measures of U.S. stocks. Supply is the number
of shares available to lend as a fraction of total shares outstanding. Shortable Supply is the difference
between shares available to lend and shares lent out as a fraction of total shares outstanding.
Data on the U.S. equity lending market is available from Markit for the 2006–2012 period.
The Markit database covers over 90% of that market and contains firm-level information on the
supply of lendable shares for the majority of stocks (see Saffi and Sigurdsson (2011)). Using
these data, we define Supply as the value of a firm’s lendable shares divided by its total market
capitalization. At any point in time, some of the firm’s lendable stocks are already lent out to
other borrowers (On Loan), thus unavailable for shorting.10 As such, we compute a measure
of net supply (Shortable Supply), defined as the difference between Supply and On Loan.
Figure 1 depicts the time series evolution of supply in the equity lending market. The num-
bers are based on stocks available in the Markit dataset with information on CRSP; an average
of 2,202 stocks in each quarter. The figure shows quarterly averages of the total fraction of firm
stocks put up for lending (Supply) as well as the proportion of stocks available for immediate
shorting (Shortable Supply). Supply increased from 17.8% of market capitalization in Septem-
ber 2006 to a peak of 23.5% in June 2008, right before the Lehman Brothers bankruptcy.
Growth continued over time, nonetheless, reaching 21.9% of the market capitalization at the
end of 2012, or $ 2.6 trillion. From September 2006 to September 2012, Shortable Supply grew
10On Loan is highly correlated with short interest, the fraction of shares held short and reported by Com-pustat. In our sample, the correlation between these two variables equals 0.81.
7
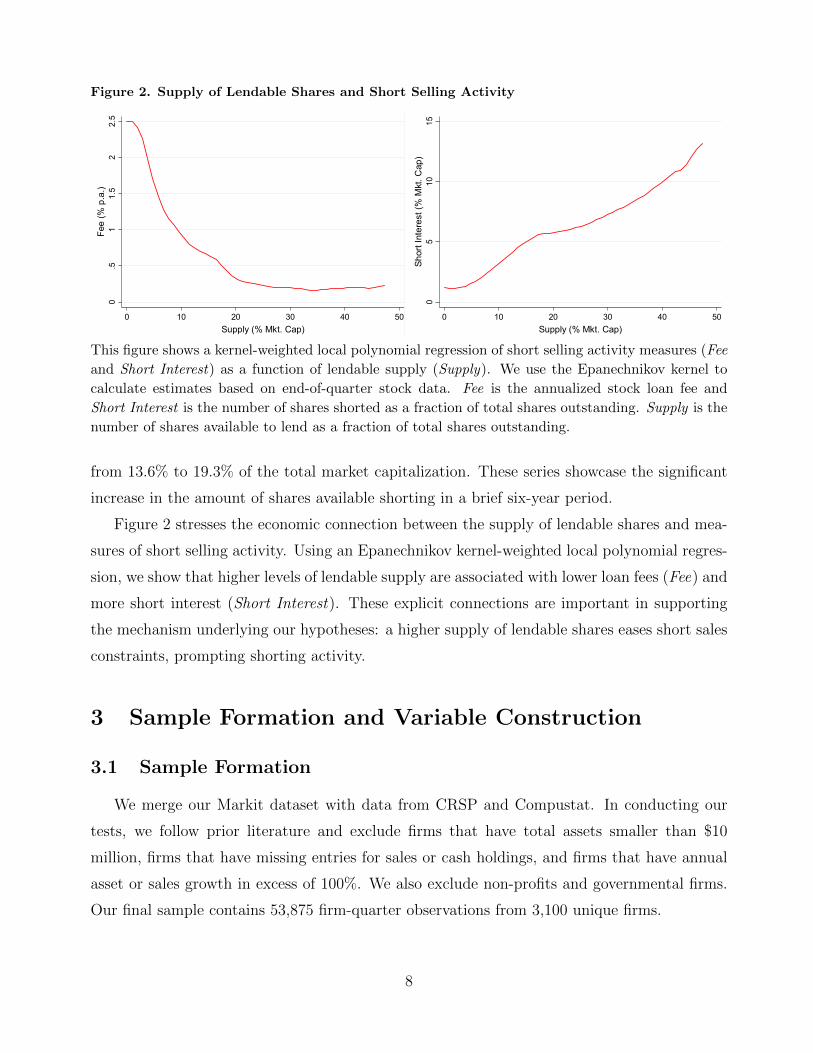
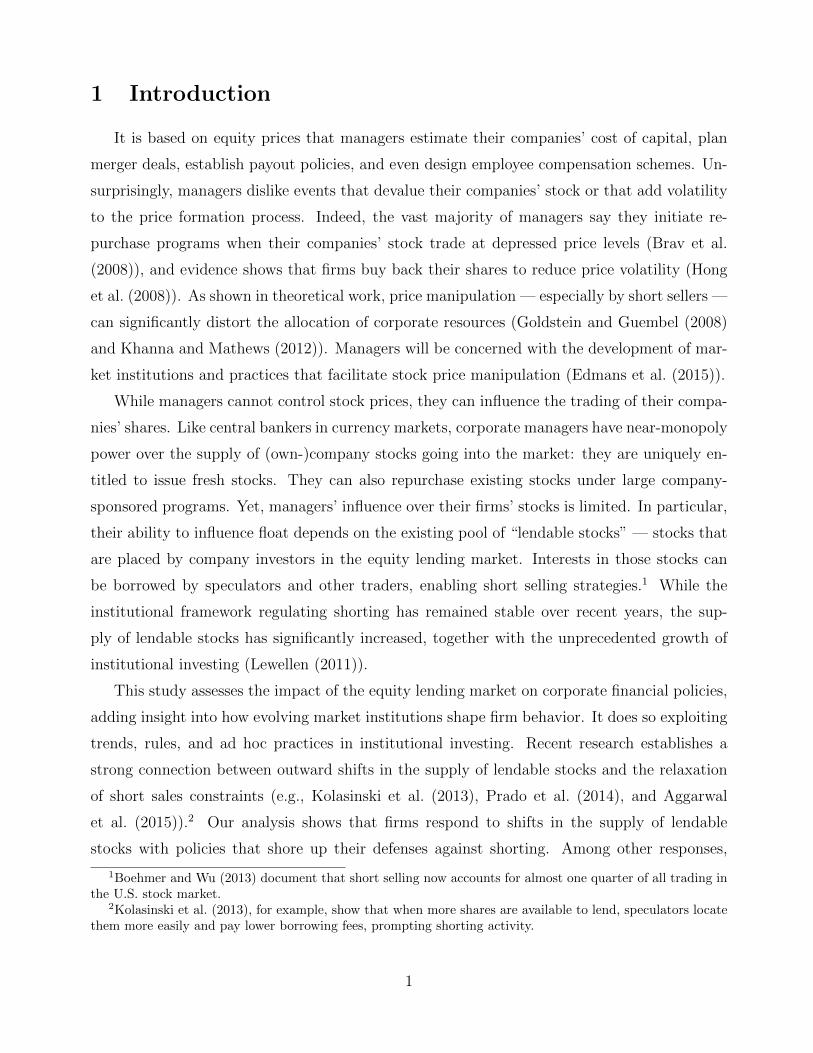
Figure 2. Supply of Lendable Shares and Short Selling Activity
0.5
11.
52
2.5
Fee
(% p
.a.)
0 10 20 30 40 50Supply (% Mkt. Cap)
05
1015
Shor
t Int
eres
t (%
Mkt
. Cap
)
0 10 20 30 40 50Supply (% Mkt. Cap)
This figure shows a kernel-weighted local polynomial regression of short selling activity measures (Fee
and Short Interest) as a function of lendable supply (Supply). We use the Epanechnikov kernel to
calculate estimates based on end-of-quarter stock data. Fee is the annualized stock loan fee and
Short Interest is the number of shares shorted as a fraction of total shares outstanding. Supply is the
number of shares available to lend as a fraction of total shares outstanding.
from 13.6% to 19.3% of the total market capitalization. These series showcase the significant
increase in the amount of shares available shorting in a brief six-year period.
Figure 2 stresses the economic connection between the supply of lendable shares and mea-
sures of short selling activity. Using an Epanechnikov kernel-weighted local polynomial regres-
sion, we show that higher levels of lendable supply are associated with lower loan fees (Fee) and
more short interest (Short Interest). These explicit connections are important in supporting
the mechanism underlying our hypotheses: a higher supply of lendable shares eases short sales
constraints, prompting shorting activity.
3 Sample Formation and Variable Construction
3.1 Sample Formation
We merge our Markit dataset with data from CRSP and Compustat. In conducting our
tests, we follow prior literature and exclude firms that have total assets smaller than $10
million, firms that have missing entries for sales or cash holdings, and firms that have annual
asset or sales growth in excess of 100%. We also exclude non-profits and governmental firms.
Our final sample contains 53,875 firm-quarter observations from 3,100 unique firms.
8
3.2 Variables
Our analysis starts with standard empirical models of stock repurchase and cash savings.
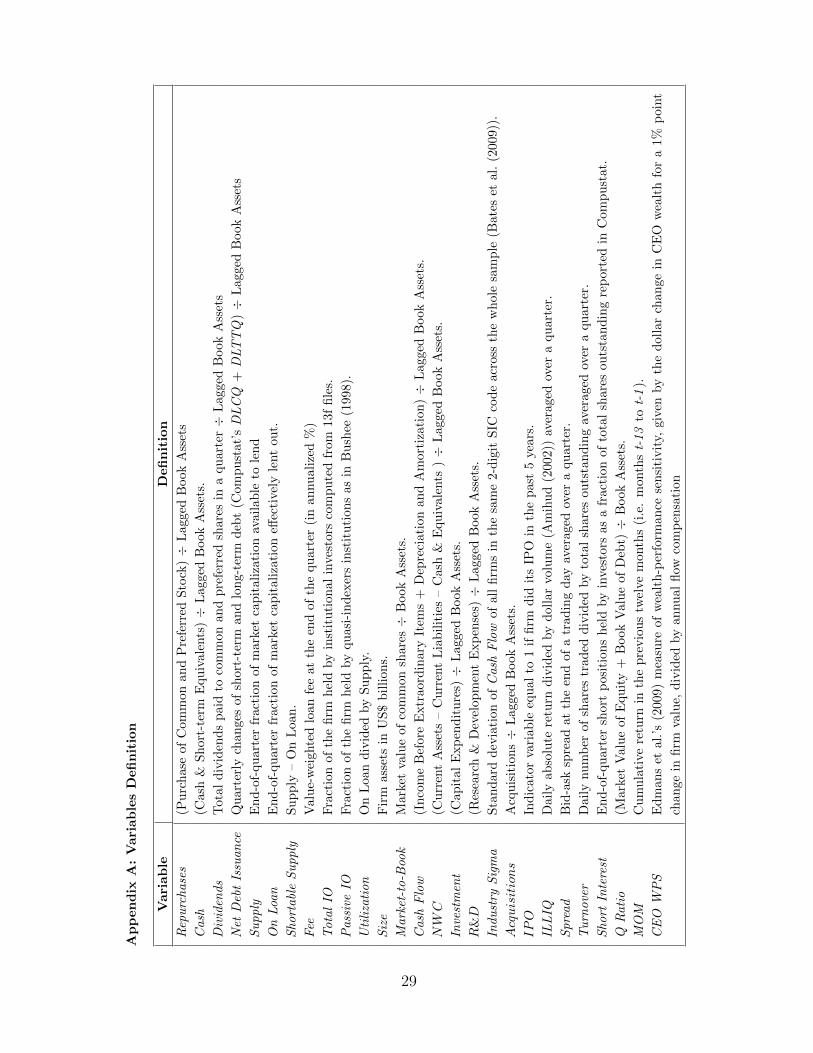
This section describes the variables used in our estimations. Variables are winsorized at the
1%-level to reduce the impact of outliers. Additional details on variable construction are given
in the Appendix.
3.2.1 Dependent Variables
Our main dependent variables measure a firm’s stock repurchases and cash holdings. We
define Repurchases as the ratio of stock repurchases by a firm in a given quarter (Compustat’s
mnemonic prstkc) scaled by the firm’s total assets (atq) in the prior quarter. Similarly, we com-
pute Cash by dividing a firm’s cash holdings in quarter t (cheq) by total assets in quarter t–1.11
3.2.2 Control Variables
Our basic set of control variables comes from a parsimonious model that includes Cash
Flow (computed as ibq + dpq), Market-to-Book ((prcc × csho + taq – ceq)/atq), and log Size
(atq), similar to Almeida et al. (2004). Following other studies in the stock repurchase and
cash literatures (Dittmar (2000), Grullon and Michaely (2002), and Bates et al. (2009)), we
extend that base set by adding net working capital (NWC) (or, actq – lctq – cheq), Invest-
ment (capx ), R&D (xrdq), and Acquisitions (aqc); where all variables are scaled by total assets.
Other variables in this set include a control for industry cash flow risk (Industry Sigma), which
is the standard deviation of cash flows of firms with similar 2-digit SIC codes, and an indicator
variable (IPO) that equals to 1 if the firm had its IPO in the past five years.
3.3 Descriptive Statistics
Table 1 reports the descriptive statistics of our sample. Supply and Shortable Supply rep-
resent, on average, some 22% and 17%, respectively, of a firm’s total market capitalization.
The average quarterly amount of share repurchases corresponds to 0.59% of total assets, but
over half of the firms do not buy back shares; similar to figures reported in Crane et al. (2014).
Firms keep an average of about 20% of their total assets as cash; similar to values reported
11Our inferences are the same if we subtract the amount of shares issued from observed repurchases (“netrepurchases”). Results are also robust to using a measure of “excess cash” that is computed relative to asize-BM-industry-adjusted benchmark value (cf. Pinkowitz et al. (2013)).
9
by Bates et al. (2009), among others. The statistics for the dependent and control variables in
our study are similar to those of prior studies and we omit a detailed discussion for brevity.
Table 1 About Here
4 Lendable Stocks, Repurchases, and Cash: Baseline
Fixed-Effects Estimations
We start our analysis by adding the supply of lendable stocks to standard corporate stock
repurchase and cash models. Our panel data specifications have the following form:
Yi,t+1 = α + βShortable Supply i,t + γ′Xi,t + ψi + θt + εi,t. (1)
The dependent variable Y is measured, alternatively, by Repurchases or Cash in the following
quarter; while the independent variable of interest, Shortable Supply, captures the excess lend-
able supply available for borrowing at the end of the current quarter. Two alternative sets of
control variables are considered in the matrix X. The first set contains Size, Cash Flow, and
Market-to-Book. The second set further adds NWC, Investment, R&D, Acquisitions, Indus-
try Sigma, and IPO. All models perform within-firm estimations where ψi captures firm-fixed
effects. One can think of the results returned as describing within-firm changes in financial poli-
cies (Repurchases and Cash) following firm-specific changes in Shortable Supply. The models
further account for time-fixed effects via θt, which absorbs year-quarter specific variation.
The OLS-FE estimations reported in Table 2 point to a positive response of stock repur-
chase activity and cash savings to shifts in the supply of lendable stocks. The results are
economically and statistically significant. For repurchases, the 0.008 coefficient shown in col-
umn (1) implies that a one-interquartile range (IQR) change in Shortable Supply is associated
with a 0.14% of total assets (= 0.008× 17.08%) increase in stock repurchases in the following
quarter. A similar coefficient is reported in column (2), when we control for a larger set of
variables. Estimates in columns (3) and (4) also point to economically significant increases in
cash holdings. A one-IQR change in Shortable Supply is associated with a 1.44% increase in
cash-to-asset ratios, equivalent to 7.1% of the sample average for cash holdings.
Table 2 About Here
10
The results from Table 2 are consistent with the argument that firms increase their stock
repurchases and cash balances when there are more stocks available for shorting; that is, when
short sellers face fewer constraints. Inferences based on estimates reported in the table are,
nevertheless, limited by the lack of exogenous variation in the supply of lendable stocks. In
the remainder of the analysis, we strive to identify the impact of exogenous shifts in lendable
supply on share repurchases and cash policies.
5 “Global” Instrumental Variables Estimation using Pas-
sive Institutional Ownership
Our baseline estimations suggest that the supply of lendable stocks influences corporate
repurchases and savings over and above traditional drivers of those activities. It is difficult,
however, to rule out the possibility that endogenous biases may confound our inferences. For
example, D’Avolio (2002) shows that institutional ownership is a key driver of lendable supply.
At the same time, institutions could pick stocks based on characteristics that are related to re-
purchases and savings decisions. As such, one could argue that institutional ownership should
be included in Eq. (1). Whether or not we include institutional ownership in our models, we
still find a significant, positive impact of supply of lendable stocks on corporate repurchases
and cash. Critically, however, the simple inclusion of institutional ownership (or other ob-
servable confounders) as a control variable in standard repurchase and cash regressions will
not thoroughly address the issue of supply endogeneity. As we discuss in turn, understand-
ing the dynamics of recent developments in institutional investing is useful for the purpose of
identifying our tests.
5.1 Test Set-Up
Institutions have dramatically increased their corporate equity ownership in the last 20
years.12 There has been, in particular, a substantial growth in passive institutional ownership.
This form of ownership is driven by market preferences that dictate “investing styles” and
make investment funds interested in particular stocks for as long as they belong to an index
or fulfill a “profile.” Notably, the stock selection processes of these investors make it unlikely
that their holdings are driven by (costly) considerations such as active corporate monitoring
12The average institutional ownership of public companies in the U.S. grew from 40% in 1995 to 70% in 2012.
11
and disciplining; considerations more often correlated with observed firm financial policies (e.g.
Ben-David et al. (2014) and Massa et al. (2015)). These very market dynamics are posited
by original theoretical work by Grossman and Stiglitz (1980), where, in equilibrium, market
investors prefer not to bear the cost of monitoring individual firms (see also Wurgler (2011)).
Passive investors like index funds and ETFs regularly engage in equity lending. Indeed,
Evans et al. (2014) show that passive funds have a much higher propensity to lend in this market
than active funds. In what follows, we exploit changes in passive institutional ownership to
identify variation in the supply of lendable stocks within an instrumental variables framework
that follows Aggarwal et al. (2015) and Massa et al. (2015). In particular, our instrument choice
is motivated by two important features of passive investing. First, securities lending provides
an important source of revenue that allows passive investors to improve their competitive
performance through lower management fee charges. Second, their main investment objective
is to replicate targeted benchmark returns, making it unlikely that passive ownership is affected
by firm-specific policies. This setting naturally lends itself to the proposed IV approach. To
wit, increases in passive ownership should lead to increases in the supply of lendable stocks
(inclusion restriction). Yet, these shifts are born out of dynamics in the competition for funds
in the index investment industry and are otherwise unrelated to individual firms’ policies
(exclusion restriction).
Thomson-Reuters institutional holdings data collected from SEC 13F filings allow us to
compute institutional ownership for each stock in a given quarter. With these data, we adopt
Bushee’s (1998) investor classification methodology to gauge the fraction of the firm’s stock
held by “Quasi-Indexers” funds and use it as a proxy for passive ownership of the firm (Passive
IO).13 Passive investment funds are defined by the SEC as those that have “investment results
corresponding to the movements of a specified index,” without the need for managers to select
stocks on an active basis.
Our IV system’s first-stage regression is written as follows:
Shortable Supply i,t = α1 + δPassive IOi,t + φ′Xi,t + κi + µt + ξi,t, (2)
where Shortable Supply is instrumented by Passive IO. The second stage is written as:
Yi,t+1 = α2 + β Shortable Supply i,t + γ′Xi,t + ψi + θt + εi,t, (3)
13Brian Bushee’s classification is at http://acct.wharton.upenn.edu/faculty/bushee/IIvars.html.
12
where Shortable Supply i,t is the first-stage’s estimate of Shortable Supply. Our IV regressions
also include firm- and year-quarter-effects, with standard errors clustered at the firm level.
5.2 Results
Panel A of Table 3 displays the first-stage coefficients of our IV system. As expected, Pas-
sive IO is an important shifter of lendable supply. A 1% increase in Passive IO, for example,
increases Shortable Supply by 0.33% (0.32%) for the sample of firms with Repurchases (Cash)
data. Notably, the first-stage tests for weak identification (Weak ID) strongly reject the null
hypothesis of weak instrumental power.
Table 3 About Here
Panel B reports the second-stage estimation, using the instrumented values of lendable
supply ( Shortable Supply) as the main independent variable. Results from these estimations
confirm our earlier inferences: increases in the supply of lendable stocks prompt firms to re-
purchase more stocks and save more cash. To illustrate the economic meaning of our results,
we note that the 0.299 coefficient for Shortable Supply in column (4) implies that a one-IQR
increase in Shortable Supply is associated with a 5.1% increase in Cash, equivalent to a 25.1%
spread relative to the mean Cash value. The IV estimations of Table 3 imply a causal relation
whereby a relaxation in short sales constraints leads to managerial actions aimed at shoring
up company defenses against short sellers.
6 “Local” Instrumental Variables Using Index Recon-
stitutions
A remarkable trend in institutional investing in the last decade is the growth of “index
investing.” In this investment category, funds are solely concerned with the goal of having
portfolio returns that mimic as closely as possible the returns of their benchmark indices.
Those funds’ managers pursue their desired style by minimizing “tracking errors,” which is
achieved by a careful, dynamic rebalancing of the stocks in their portfolios so as to reflect the
stocks in the targeted index. Because the composition of market indices changes discretely on
a regular basis, one may use index changes to gauge “locally exogenous shifts” in the supply of
13
lendable stocks. These dynamics are outside of firm managers’ control and represent a sharp,
localized shift in lendable supply. In this section, we use changes in index membership of a
given stock as the exogenous source of variation in the supply of lendable stocks (“local IV”).
6.1 Institutional Setting
On the last trading day of May of each year, Russell’s equity indices are formed, with
eligible stocks being ranked by Russell’s proprietary measure of stock market capitalization.
The largest 1,000 firms are included in the Russell 1000 index while the next 2,000 make up
the Russell 2000. Small changes in the capitalization of firms ranked near the 1000th position
cut-off make stocks move between these indices. Following the May index assignment, portfolio
weights are reconstituted on the last Friday in June and index weights computed based on a
free-float measure of market capitalization estimated by Russell.
An estimated $186 billion were invested in passive funds targeting the Russell 1000 and
2000 indices in 2011 (Chang et al. (2015)). Critically, a stock at the bottom of the Russell 1000
index will have a very small weight in the index and will thus be ignored by index investors.
If the stock, however, moves to the top of the Russell 2000, then any funds that benchmark
the Russell 2000 will have to buy it to minimize the tracking error.14 These stocks will witness
sudden drops in passive institutional ownership.
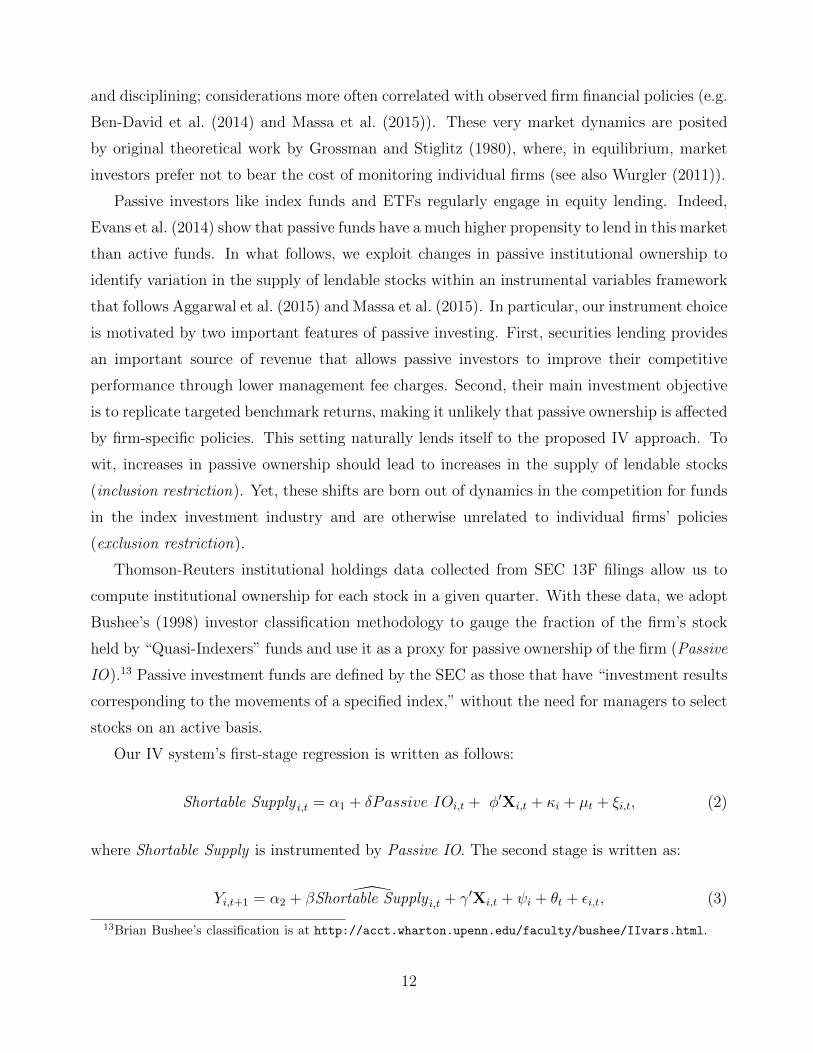
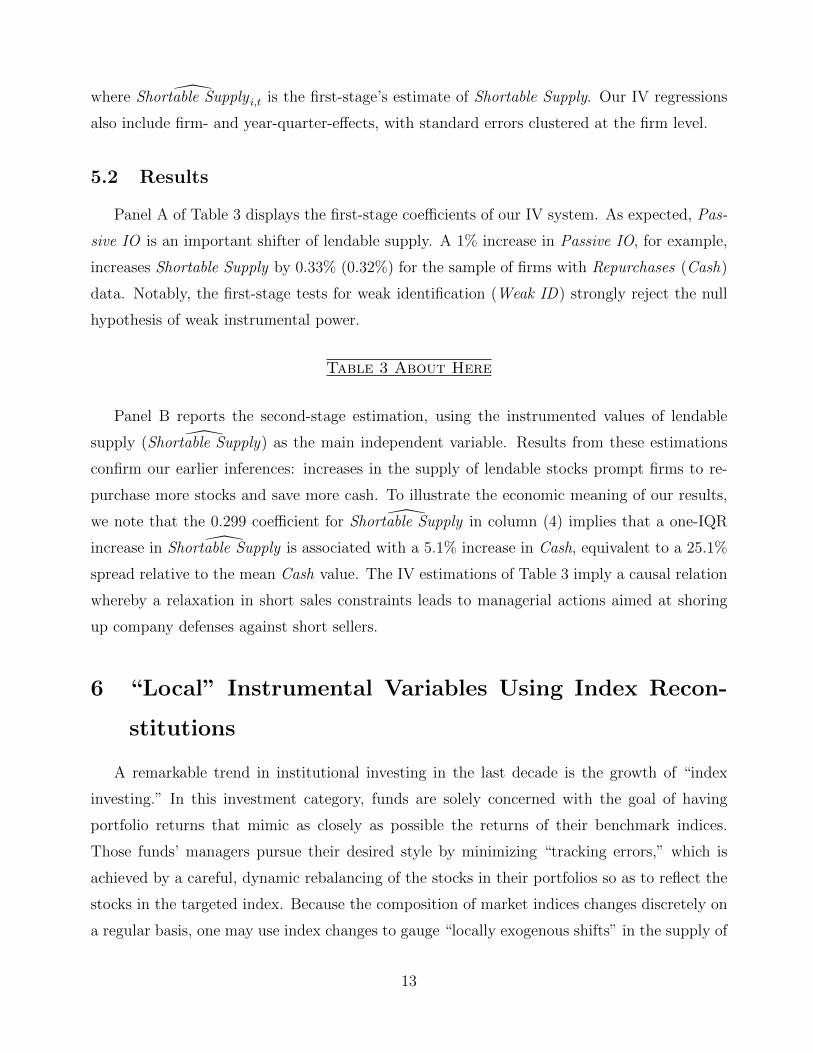
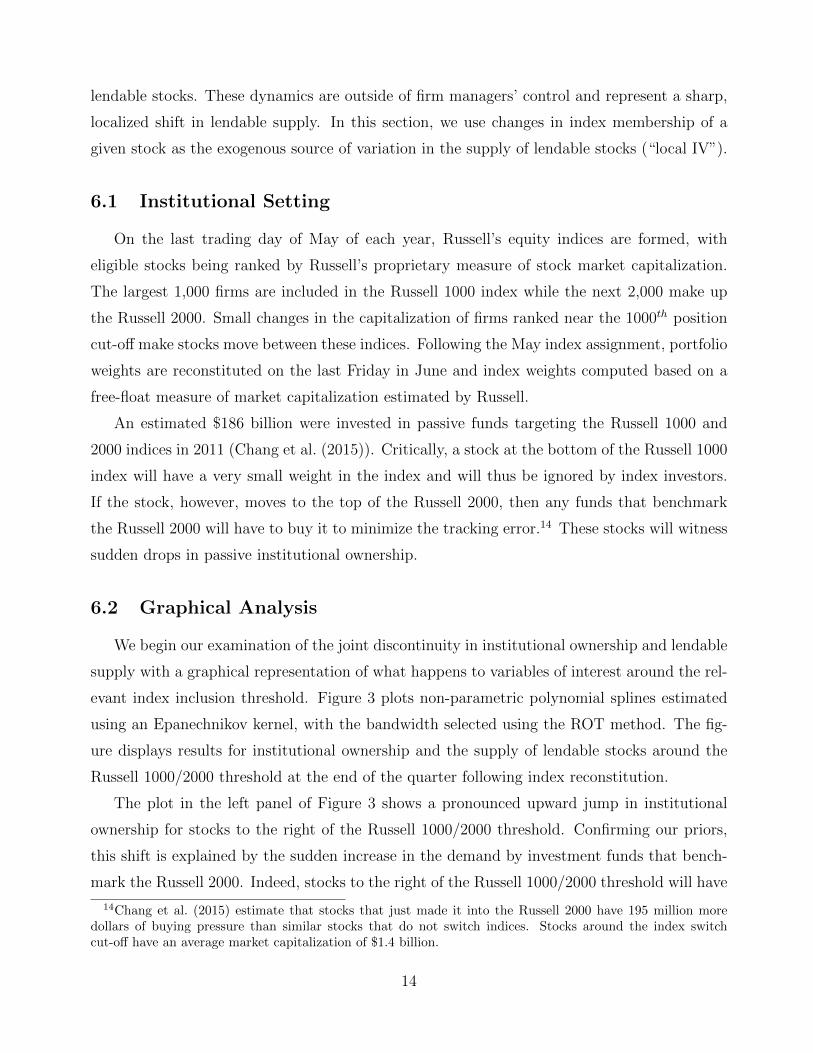
6.2 Graphical Analysis
We begin our examination of the joint discontinuity in institutional ownership and lendable
supply with a graphical representation of what happens to variables of interest around the rel-
evant index inclusion threshold. Figure 3 plots non-parametric polynomial splines estimated
using an Epanechnikov kernel, with the bandwidth selected using the ROT method. The fig-
ure displays results for institutional ownership and the supply of lendable stocks around the
Russell 1000/2000 threshold at the end of the quarter following index reconstitution.
The plot in the left panel of Figure 3 shows a pronounced upward jump in institutional
ownership for stocks to the right of the Russell 1000/2000 threshold. Confirming our priors,
this shift is explained by the sudden increase in the demand by investment funds that bench-
mark the Russell 2000. Indeed, stocks to the right of the Russell 1000/2000 threshold will have
14Chang et al. (2015) estimate that stocks that just made it into the Russell 2000 have 195 million moredollars of buying pressure than similar stocks that do not switch indices. Stocks around the index switchcut-off have an average market capitalization of $1.4 billion.
14
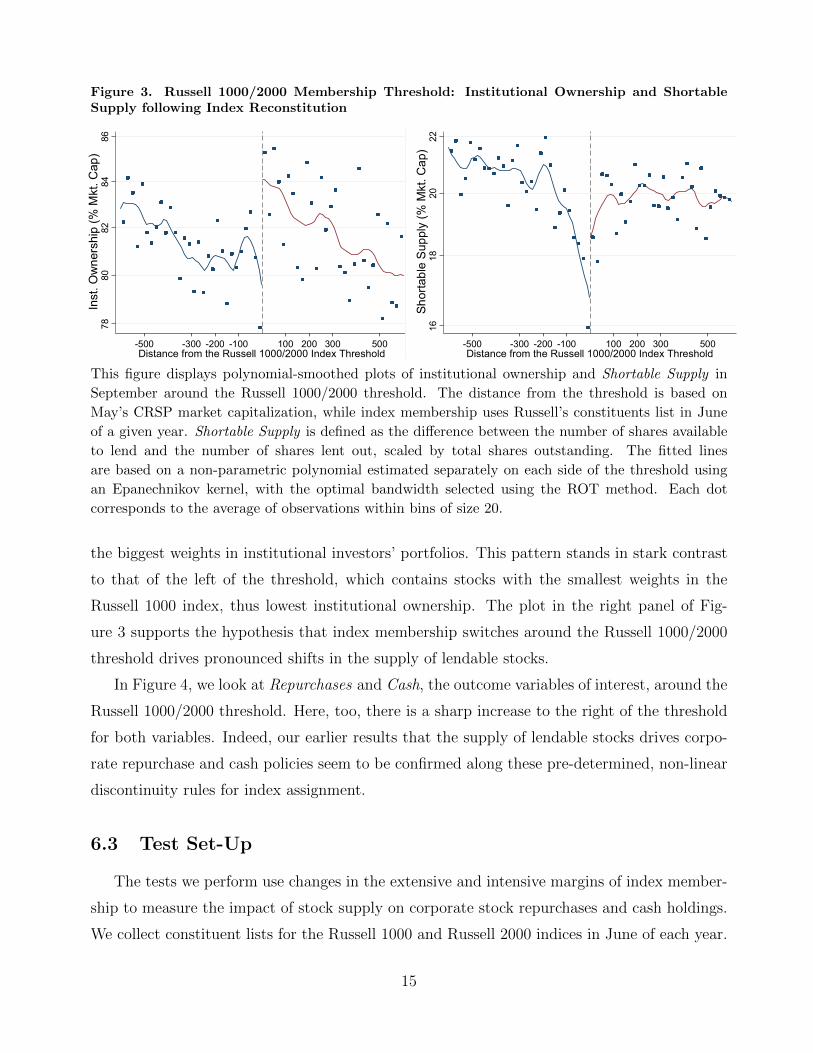
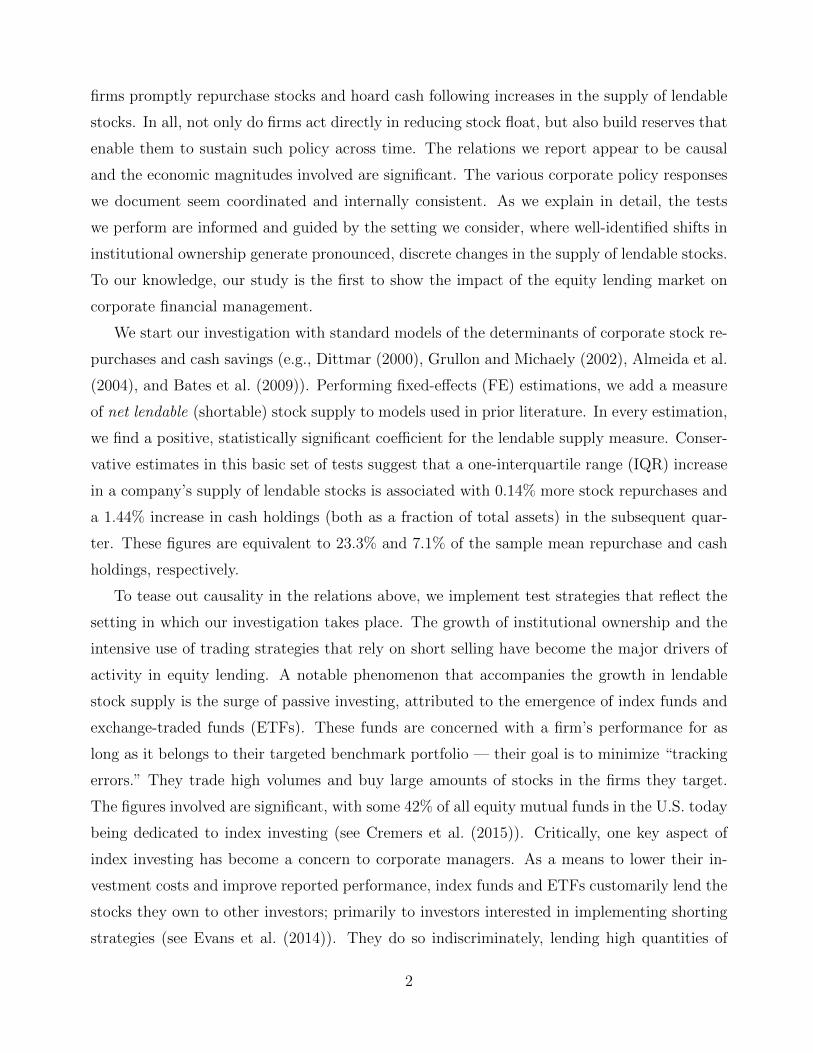
Figure 3. Russell 1000/2000 Membership Threshold: Institutional Ownership and ShortableSupply following Index Reconstitution
7880
8284
86In
st. O
wne
rshi
p (%
Mkt
. Cap
)
-500 -300 -200 -100 500300200100Distance from the Russell 1000/2000 Index Threshold
1618
2022
Shor
tabl
e Su
pply
(% M
kt. C
ap)
-500 -300 -200 -100 500300200100Distance from the Russell 1000/2000 Index Threshold
This figure displays polynomial-smoothed plots of institutional ownership and Shortable Supply in
September around the Russell 1000/2000 threshold. The distance from the threshold is based on
May’s CRSP market capitalization, while index membership uses Russell’s constituents list in June
of a given year. Shortable Supply is defined as the difference between the number of shares available
to lend and the number of shares lent out, scaled by total shares outstanding. The fitted lines
are based on a non-parametric polynomial estimated separately on each side of the threshold using
an Epanechnikov kernel, with the optimal bandwidth selected using the ROT method. Each dot
corresponds to the average of observations within bins of size 20.
the biggest weights in institutional investors’ portfolios. This pattern stands in stark contrast
to that of the left of the threshold, which contains stocks with the smallest weights in the
Russell 1000 index, thus lowest institutional ownership. The plot in the right panel of Fig-
ure 3 supports the hypothesis that index membership switches around the Russell 1000/2000
threshold drives pronounced shifts in the supply of lendable stocks.
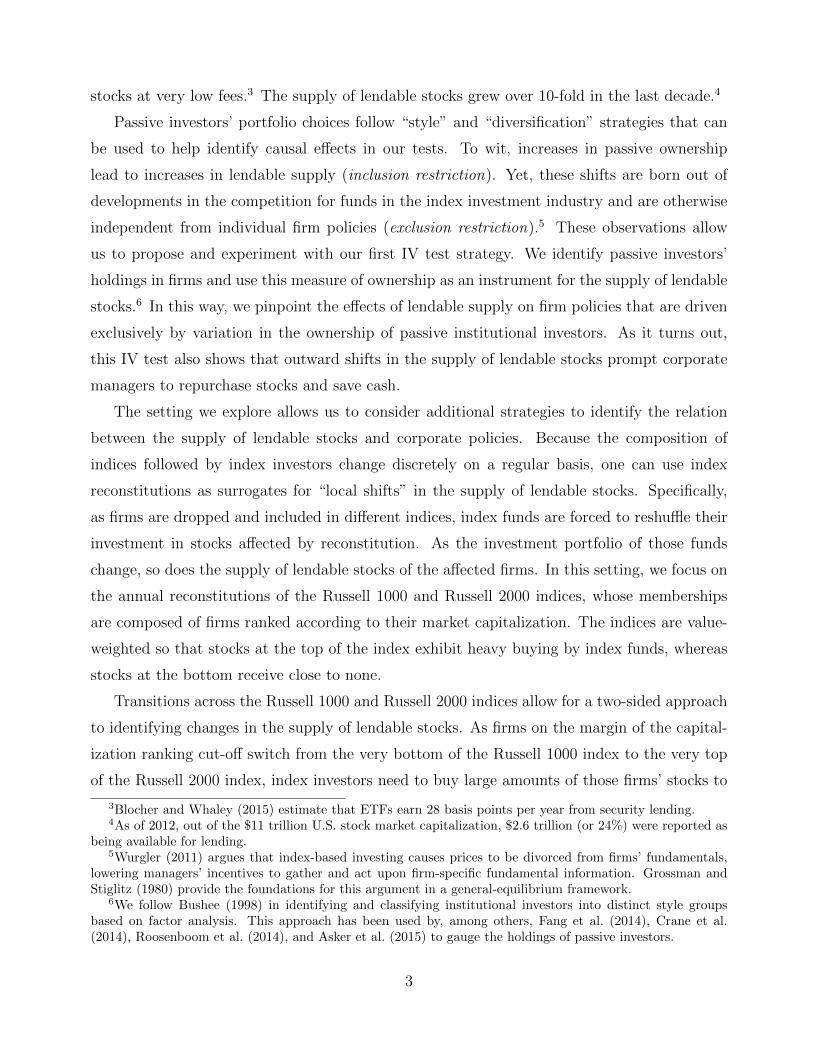
In Figure 4, we look at Repurchases and Cash, the outcome variables of interest, around the
Russell 1000/2000 threshold. Here, too, there is a sharp increase to the right of the threshold
for both variables. Indeed, our earlier results that the supply of lendable stocks drives corpo-
rate repurchase and cash policies seem to be confirmed along these pre-determined, non-linear
discontinuity rules for index assignment.
6.3 Test Set-Up
The tests we perform use changes in the extensive and intensive margins of index member-
ship to measure the impact of stock supply on corporate stock repurchases and cash holdings.
We collect constituent lists for the Russell 1000 and Russell 2000 indices in June of each year.
15
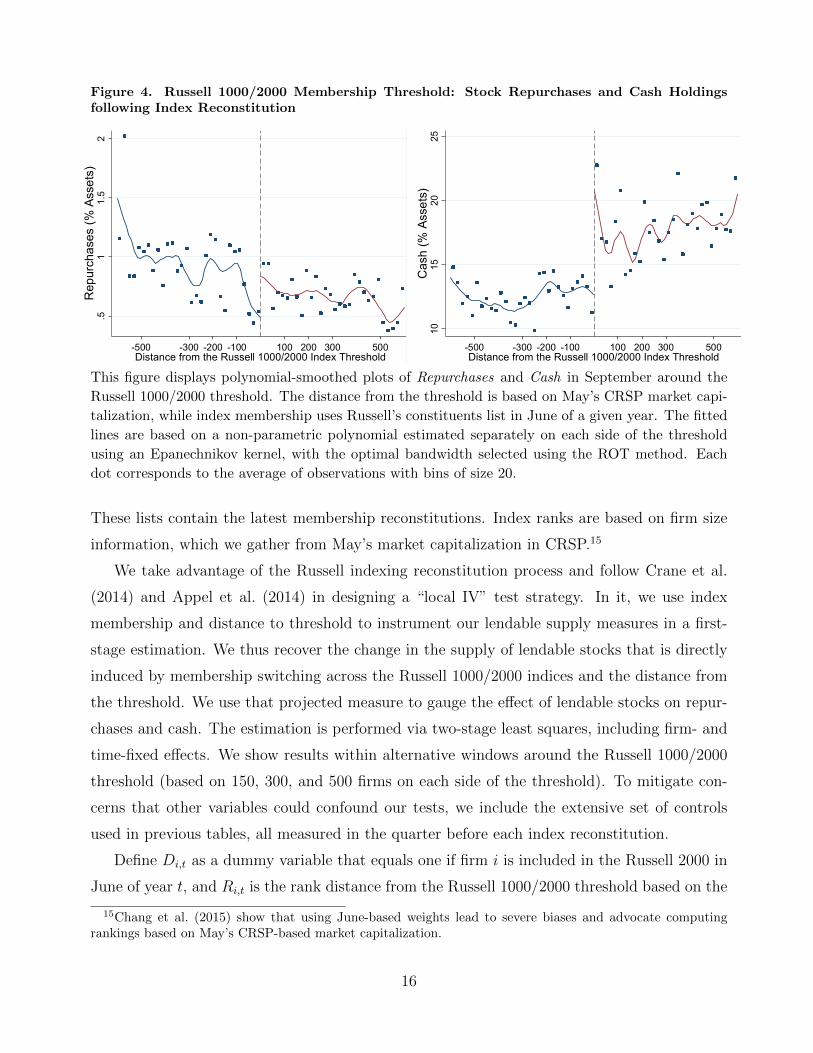
Figure 4. Russell 1000/2000 Membership Threshold: Stock Repurchases and Cash Holdingsfollowing Index Reconstitution
.51
1.5
2R
epur
chas
es (%
Ass
ets)
-500 -300 -200 -100 500300200100Distance from the Russell 1000/2000 Index Threshold
1015
2025
Cas
h (%
Ass
ets)
-500 -300 -200 -100 500300200100Distance from the Russell 1000/2000 Index Threshold
This figure displays polynomial-smoothed plots of Repurchases and Cash in September around the
Russell 1000/2000 threshold. The distance from the threshold is based on May’s CRSP market capi-
talization, while index membership uses Russell’s constituents list in June of a given year. The fitted
lines are based on a non-parametric polynomial estimated separately on each side of the threshold
using an Epanechnikov kernel, with the optimal bandwidth selected using the ROT method. Each
dot corresponds to the average of observations with bins of size 20.
These lists contain the latest membership reconstitutions. Index ranks are based on firm size
information, which we gather from May’s market capitalization in CRSP.15
We take advantage of the Russell indexing reconstitution process and follow Crane et al.
(2014) and Appel et al. (2014) in designing a “local IV” test strategy. In it, we use index
membership and distance to threshold to instrument our lendable supply measures in a first-
stage estimation. We thus recover the change in the supply of lendable stocks that is directly
induced by membership switching across the Russell 1000/2000 indices and the distance from
the threshold. We use that projected measure to gauge the effect of lendable stocks on repur-
chases and cash. The estimation is performed via two-stage least squares, including firm- and
time-fixed effects. We show results within alternative windows around the Russell 1000/2000
threshold (based on 150, 300, and 500 firms on each side of the threshold). To mitigate con-
cerns that other variables could confound our tests, we include the extensive set of controls
used in previous tables, all measured in the quarter before each index reconstitution.
Define Di,t as a dummy variable that equals one if firm i is included in the Russell 2000 in
June of year t, and Ri,t is the rank distance from the Russell 1000/2000 threshold based on the
15Chang et al. (2015) show that using June-based weights lead to severe biases and advocate computingrankings based on May’s CRSP-based market capitalization.
16

CRSP market capitalization in May (centered at zero around the index threshold). Our first-
stage regression estimates Shortable Supply as a function of Russell 2000 membership dummy,
Di,t, and distance from the Russell 1000/2000 threshold, Ri,t. The specification also includes
a term for the interaction of Di,t and Ri,t, as well as a set X of control variables. Standard
errors are clustered at the firm level. The model can be written as:
Shortable Supply i,t = αi + µt + τ0Di,t + τiRi,t + κiDi,t ∗Ri,t + γ′Xi,t + ξi,t. (4)
In the second stage, we regress stock repurchases and corporate cash on the component
of excess supply that is explained by index membership changes and index rankings from the
first stage. The model can be written as follows:
Yi,t = ψi + θt + γ′ Shortable Supply i,t + β′Xi,t + ξi,t, (5)
where Yi,t is the relevant corporate outcome variable ∈ {Repurchases; Cash} in the quarter
following index reconstitution (October-end data).
Panel A of Table 4 reports the first-stage results. Estimates in this panel show that Short-
able Supply becomes significantly higher as firms switch from the Russell 1000 into the Russell
2000 index. The coefficients for Di,t imply that if a firm migrates from the Russell 1000 index
to the Russell 2000 index, there is a sharp positive shock to the supply of lendable stocks, with
all the coefficients being positive and statistically significant. In addition, estimates returned
for Ri,t and Di,t ∗Ri,t imply that Shortable Supply is also a function of whether the stock is to
the left or right of the threshold and of the distance from the threshold between the Russell
1000 and the Russell 2000 indices (weight ranking). In particular, the lower is the firm’s rank
position in the Russell 2000, the smaller is the increase in the firm’s Shortable Supply, since
the less important it is for index investors to add the firm’s stock to their portfolios.
Table 4 About Here
Panel B presents the second-stage estimation results. Notably, similarly to the “global IV”
regressions that use Passive IO as an instrument in Table 3, the alternative “local IV” regres-
sions of Table 4 yield positive and statistically coefficients for the impact of instrumented Short-
able Supply on Repurchases and Cash. To gauge the economic impact of a hypothetical shift in
the supply of lendable stocks, we compare the expected difference in stock repurchases and cash
17
holdings due to the predicted differences in lendable supply between a firm ranked 150 places
below the Russell 1000/2000 threshold and another ranked 150 places above that threshold.
Using the first-stage estimates shown in column (1) of Panel A, we can show that the predicted
difference in Shortable Supply is equal to 3.37%. Combining this value with the 0.097 coefficient
in column (1) of Panel B results in a difference in Repurchases equal to 0.33% of total assets;
equivalent to 55% of the sample average. An equivalent calculation for Cash using estimates
in column (4) predict a difference in Cash of 2.62%; equivalent to 13% of the sample average.
Taken altogether, results built on index reconstitutions (“local IV”) confirm our more gen-
eral (fixed-effects and “global IV”) model estimates of a strong, positive impact of the supply
of lendable stocks on stock repurchases and cash savings. These results suggest that managers
modify companies’ financial policies preempting relaxations in shorting constraints.
7 Managing Resources in Response to Shifts in Lend-
able Stock Supply
7.1 Substitution Effect between Repurchases and Cash
Our results show that firms both repurchase stocks and save cash following outward shifts in
the supply of lendable stocks. Naturally, corporate resources are limited, and for our proposed
mechanism to be warranted repurchase and savings should show some degree of substitution
in achieving the same goal. In particular, it is likely that managers substitute share buybacks
with increases in cash balances to deter short sellers, leading to a differential impact of Short-
able Supply on Repurchases conditional on the amount of cash the firm has saved (binding
budget constraint).
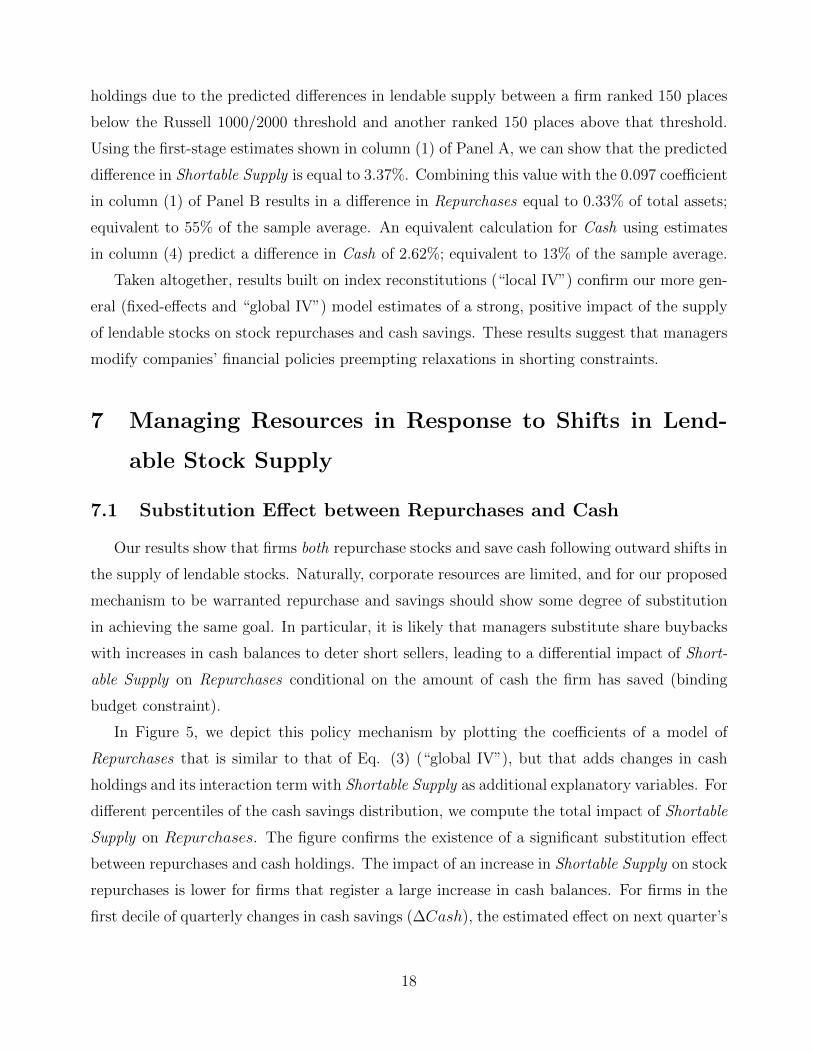
In Figure 5, we depict this policy mechanism by plotting the coefficients of a model of
Repurchases that is similar to that of Eq. (3) (“global IV”), but that adds changes in cash
holdings and its interaction term with Shortable Supply as additional explanatory variables. For
different percentiles of the cash savings distribution, we compute the total impact of Shortable
Supply on Repurchases. The figure confirms the existence of a significant substitution effect
between repurchases and cash holdings. The impact of an increase in Shortable Supply on stock
repurchases is lower for firms that register a large increase in cash balances. For firms in the
first decile of quarterly changes in cash savings (∆Cash), the estimated effect on next quarter’s
18
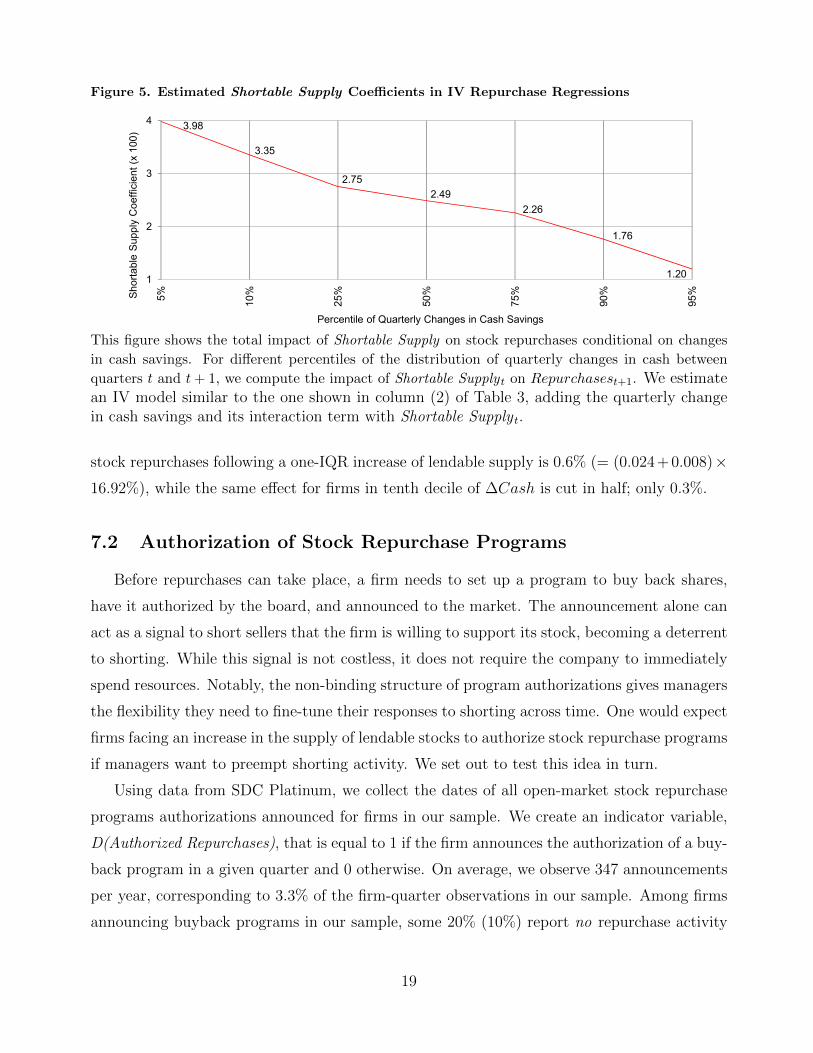
Figure 5. Estimated Shortable Supply Coefficients in IV Repurchase Regressions
3.98
3.35
2.752.49
2.26
1.76
1.201
2
3
4
5% 10%
25%
50%
75%
90%
95%Sh
orta
ble
Supp
ly C
oeffi
cien
t (x
100)
Percentile of Quarterly Changes in Cash Savings
This figure shows the total impact of Shortable Supply on stock repurchases conditional on changes
in cash savings. For different percentiles of the distribution of quarterly changes in cash between
quarters t and t+ 1, we compute the impact of Shortable Supply t on Repurchasest+1. We estimatean IV model similar to the one shown in column (2) of Table 3, adding the quarterly changein cash savings and its interaction term with Shortable Supply t.
stock repurchases following a one-IQR increase of lendable supply is 0.6% (= (0.024 + 0.008)×16.92%), while the same effect for firms in tenth decile of ∆Cash is cut in half; only 0.3%.
7.2 Authorization of Stock Repurchase Programs
Before repurchases can take place, a firm needs to set up a program to buy back shares,
have it authorized by the board, and announced to the market. The announcement alone can
act as a signal to short sellers that the firm is willing to support its stock, becoming a deterrent
to shorting. While this signal is not costless, it does not require the company to immediately
spend resources. Notably, the non-binding structure of program authorizations gives managers
the flexibility they need to fine-tune their responses to shorting across time. One would expect
firms facing an increase in the supply of lendable stocks to authorize stock repurchase programs
if managers want to preempt shorting activity. We set out to test this idea in turn.
Using data from SDC Platinum, we collect the dates of all open-market stock repurchase
programs authorizations announced for firms in our sample. We create an indicator variable,
D(Authorized Repurchases), that is equal to 1 if the firm announces the authorization of a buy-
back program in a given quarter and 0 otherwise. On average, we observe 347 announcements
per year, corresponding to 3.3% of the firm-quarter observations in our sample. Among firms
announcing buyback programs in our sample, some 20% (10%) report no repurchase activity
19
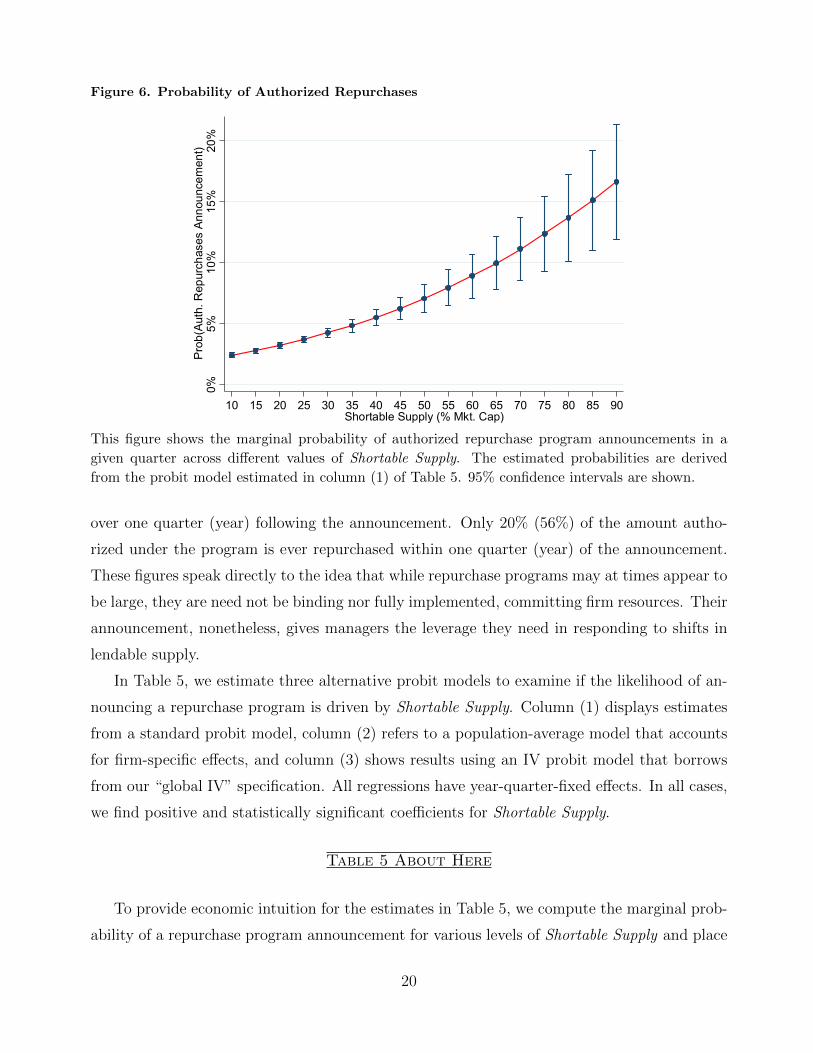
Figure 6. Probability of Authorized Repurchases
0%5%
10%
15%
20%
Prob
(Aut
h. R
epur
chas
es A
nnou
ncem
ent)
10 15 20 25 30 35 40 45 50 55 60 65 70 75 80 85 90Shortable Supply (% Mkt. Cap)
This figure shows the marginal probability of authorized repurchase program announcements in a
given quarter across different values of Shortable Supply. The estimated probabilities are derived
from the probit model estimated in column (1) of Table 5. 95% confidence intervals are shown.
over one quarter (year) following the announcement. Only 20% (56%) of the amount autho-
rized under the program is ever repurchased within one quarter (year) of the announcement.
These figures speak directly to the idea that while repurchase programs may at times appear to
be large, they are need not be binding nor fully implemented, committing firm resources. Their
announcement, nonetheless, gives managers the leverage they need in responding to shifts in
lendable supply.
In Table 5, we estimate three alternative probit models to examine if the likelihood of an-
nouncing a repurchase program is driven by Shortable Supply. Column (1) displays estimates
from a standard probit model, column (2) refers to a population-average model that accounts
for firm-specific effects, and column (3) shows results using an IV probit model that borrows
from our “global IV” specification. All regressions have year-quarter-fixed effects. In all cases,
we find positive and statistically significant coefficients for Shortable Supply.
Table 5 About Here
To provide economic intuition for the estimates in Table 5, we compute the marginal prob-
ability of a repurchase program announcement for various levels of Shortable Supply and place
20
the results in Figure 5. The coefficients shown in column (1) imply that the marginal an-
nouncement probability for a firm in the 25th percentile of Shortable Supply is around 4%.
Firms in the 75th percentile, in contrast, have marginal probabilities that are almost three
times larger, around 12%. Managers are likely to request the immediate authorization of share
repurchase programs when their firms face an increase in lendable supply.
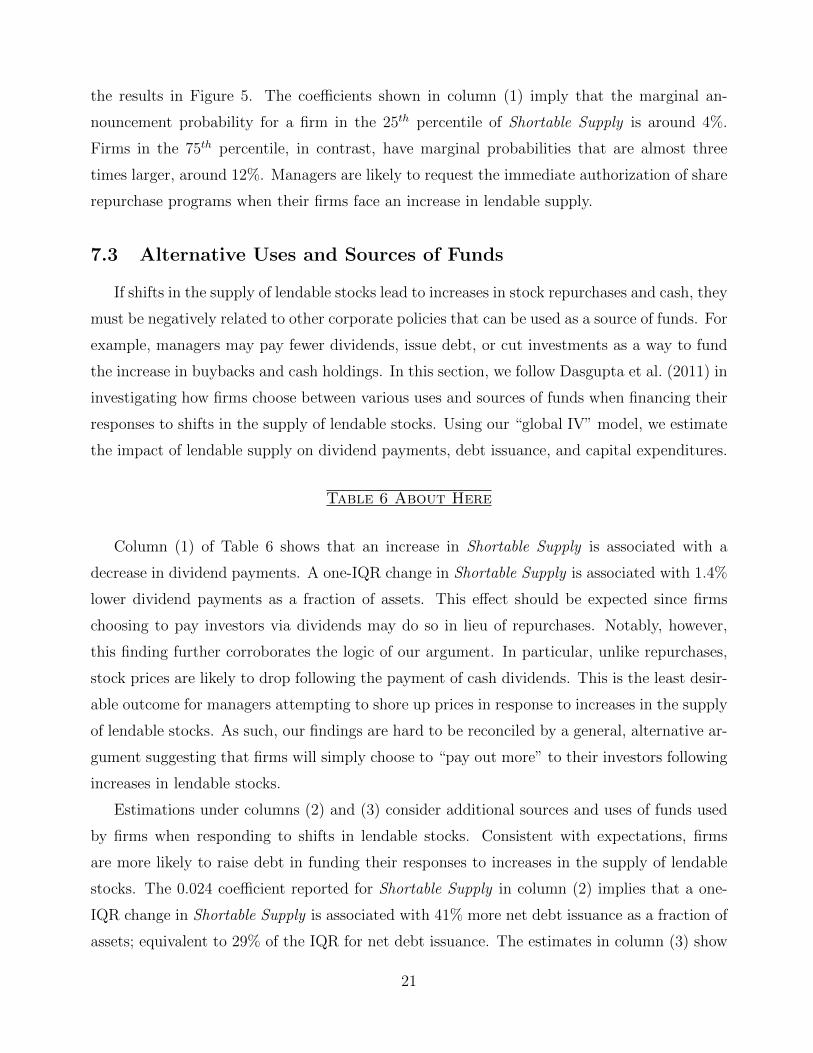
7.3 Alternative Uses and Sources of Funds
If shifts in the supply of lendable stocks lead to increases in stock repurchases and cash, they
must be negatively related to other corporate policies that can be used as a source of funds. For
example, managers may pay fewer dividends, issue debt, or cut investments as a way to fund
the increase in buybacks and cash holdings. In this section, we follow Dasgupta et al. (2011) in
investigating how firms choose between various uses and sources of funds when financing their
responses to shifts in the supply of lendable stocks. Using our “global IV” model, we estimate
the impact of lendable supply on dividend payments, debt issuance, and capital expenditures.
Table 6 About Here
Column (1) of Table 6 shows that an increase in Shortable Supply is associated with a
decrease in dividend payments. A one-IQR change in Shortable Supply is associated with 1.4%
lower dividend payments as a fraction of assets. This effect should be expected since firms
choosing to pay investors via dividends may do so in lieu of repurchases. Notably, however,
this finding further corroborates the logic of our argument. In particular, unlike repurchases,
stock prices are likely to drop following the payment of cash dividends. This is the least desir-
able outcome for managers attempting to shore up prices in response to increases in the supply
of lendable stocks. As such, our findings are hard to be reconciled by a general, alternative ar-
gument suggesting that firms will simply choose to “pay out more” to their investors following
increases in lendable stocks.
Estimations under columns (2) and (3) consider additional sources and uses of funds used
by firms when responding to shifts in lendable stocks. Consistent with expectations, firms
are more likely to raise debt in funding their responses to increases in the supply of lendable
stocks. The 0.024 coefficient reported for Shortable Supply in column (2) implies that a one-
IQR change in Shortable Supply is associated with 41% more net debt issuance as a fraction of
assets; equivalent to 29% of the IQR for net debt issuance. The estimates in column (3) show
21
that firms are also more likely to reduce their investment spending, with the –0.02 coefficient
found for Shortable Supply being associated with a 34% IQR drop in capital expenditures.
Taken altogether, the results in Table 6 suggest that the increases in stock repurchases
and cash holdings shown in Table 3 are funded by reductions in dividend payments, increases
in debt issuance, and cuts in capital expenditures. These various policies seem coordinated
and internally consistent with the idea that firms significantly alter the management of their
resources in responding to shifts in the supply of lendable stocks.
8 Effect Heterogeneity
Our inferences can be further evaluated by investigating if the relationship between the
supply of lendable stocks and corporate policies change with respect to certain firm character-
istics. For example, the amount of repurchases needed to support share prices may vary with
stock liquidity (see Cesari et al. (2012)) or with the sensitivity of CEO compensation to stock
prices (Edmans et al. (2009)). Indeed, there are several dimensions by which the effects we
report should vary across firms. In this section, we investigate four such dimensions: (1) stock
liquidity, (2) short sales demand, (3) stock price valuation, and (4) CEO wealth–performance
sensitivity to stock prices. For brevity, we focus on Repurchases as the relevant policy variable,
collecting all of our results in Table 7 below.
8.1 Stock Liquidity
Managers’ reactions to a relaxation in short sales constraints should naturally depend on the
price impact of company-sponsored stock repurchase programs. On this front, research shows
that the price impact of stock repurchases is higher for illiquid stocks (Cesari et al. (2012)).
This implies that for a given increase in Shortable Supply, managers of firms whose stocks are
illiquid would need to repurchase fewer shares to generate desired price response to the threat
of shorting. Exploring this logic, we use measures of ex-ante liquidity to test if firms react less
strongly to increases in the supply of lendable stocks when trading shares is more difficult.
Our tests capture alternative dimensions of stock illiquidity by using three measures: Ami-
hud’s (2002) ILLIQ, bid-ask spreads (Spread), and stock turnover (Turnover). In each quarter,
we sort firms according to a given measure and select those firms in the lowest and highest
quintiles. We create an indicator variable, D(Split), that is equal to 1 if the firm’s stock is
22
“illiquid” in a quarter (i.e., in the top quintile of ILLIQ and Spread, or in the lowest quintile
of Turnover) and equal to 0 if it is “liquid” (in the bottom quintile of ILLIQ and Spread, or
in the top quintile of Turnover). We estimate an instrumental variables model similar to that
presented in Table 3 (“global IV”), but including D(Split) and the Shortable Supply*D(Split)
interaction term as additional variables. Accordingly, the second-stage regression is given by:
Repurchasesi,t+1 = α + β1 Shortable Supply i,t + β2D(Split)
+β3 Shortable Supply ∗D(Split)i,t + γ′Xi,t + ψi + θt + εi,t. (6)
Across all of the illiquidity measures under columns (1)–(3) in Table 7, we find that more
illiquid stocks exhibit a lower sensitivity of stock repurchases to changes in the supply of lend-
able stocks. The results are consistent with the idea that managers of firms with more illiquid
stocks need to repurchases relatively fewer shares to achieve a given price impact. Column (3),
for example, implies that a unit increase in Shortable Supply increases stock repurchases by 0.05
for firms in the top quintile of stock turnover, but by only 0.01 for those in the lowest quintile.
Consistent with our story, the degree by which investors can trade shares is sensibly taken into
account by managers when deciding how to respond to changes in the supply of lendable stocks.
Table 7 About Here
8.2 Demand for Shorting
An increase in the supply of lendable stocks may be meaningless if the demand for shorting
is low. In particular, an increase in Shortable Supply may not lead to more shorting if short
sales constraints were not binding in the first place. This suggests that the impact of Shortable
Supply on repurchases should be higher for stocks facing ex-ante tighter short sales constraints.
We explore this source of cross-sectional variation in turn.
Short Interest denotes the short interest for the firm’s shares, defined as the number of
shares shorted reported in Compustat at the end of the quarter divided by the number of
shares outstanding. This variable has been previously used as proxy of short sales constraints
(see, e.g., Asquith et al. (2005)). Firms in the top quintile of short interest (i.e., D(Split) = 1)
are likely to have a higher pent-up demand for shorting. Accordingly, for those firms, an
increase in the supply of lendable stocks may significantly reduce short sales constraints and
allow more shorting to take place, prompting managers to increase repurchases more aggres-
23
sively. This hypothesis is supported by the coefficients estimated in column (4) of Table 7,
where the interaction between Shortable Supply and D(Split) returns a positive and significant
coefficient. A relaxation in short sales constraints for stocks with higher short sales demand
enables more short selling to take place. As expected, managers in these firms, in particular,
react by repurchasing relative more shares in an attempt to support prices. This dynamic
supports the hypothesis that managerial decisions regarding stock repurchases are affected by
lendable supply and are further modulated by the demand for shorting in place.
8.3 Price and Value Pressure
We also investigate how stock valuation modulates the impact of lendable supply on firm
policies. When prices are at historically low levels, short-sellers are less likely to target a com-
pany (D’Avolio (2002) and Hanson and Sunderam (2013)). In this scenario, an increase in the
supply of lendable stocks may not prompt shorting, nor prompt firms to hike their repurchase
activity. Alternatively, when prices are high, short sellers may try to profit by shorting the
stock. In this scenario, managers should be particularly interested in repurchasing stocks to
preempt shorting.
In column (5) of Table 7, we use Q ratios to measure the extent to which shares are ar-
guably overvalued. This measure has been used as a proxy of firm valuating in several prior
studies (e.g., Lang et al. (1989), Baker et al. (2003), and Polk and Sapienza (2009)). In our
empirical model, the indicator variable D(Split) assigns the value of 1 (of 0) to firms in the top
(bottom) quintile of the Q distribution. Similarly, in column (6) we use stock price momentum
(MOM ) in the previous 12 months to capture firms that experienced extreme price run-ups.
Accordingly, D(Split) assigns the value of 1 (of 0) to firms in the top (bottom) quintile of the
MOM distribution.
The D(Split) coefficients in columns (5)–(6) show that repurchases are smaller when firms
have high Q ratios and high price increases in the past 12 months, consistent with the hy-
pothesis that, generally, managers do not engage in buybacks when stocks seem overvalued.
Notably, however, the coefficient for the interaction between Shortable Supply and D(Split) is
positive and statistically significant in both cases. The results imply that the effects of shifts
in the supply of lendable stocks on repurchases are indeed greater for firms whose stocks are
likely to be perceived as overvalued.
24
8.4 Managerial Incentives
One could argue that managers whose wealth is more sensitive to stock prices may have
more incentives to repurchase stocks following an increase in the supply of lendable stocks.
Accordingly, we evaluate how the impact of Shortable Supply varies with managerial wealth
sensitivity to stock prices. We do so using the wealth–performance sensitivity measure, CEO
WPS, computed by Edmans et al. (2009). This measure is only available for the 2006–2009
period and is defined as the dollar change in CEO wealth for a one percent change in firm
value, divided by annual flow compensation. The estimated 0.029 coefficient for the Shortable
Supply*D(Split) interaction in column (7) shows that high (top quintile) CEO WPS firms
repurchase more than twice as many shares as firms in the bottom quintile of CEO WPS.
In other words, managers are far more likely to initiate stock repurchase programs when the
value of their personal compensation packages are threatened by (shorting) activity that is
facilitated by increases in the supply of lendable stocks.
The results from this section are important in corroborating our inferences. They show
that increases in the supply of lendable stocks lead company managers to conduct more ag-
gressive buyback policies when their stocks are ex-ante more liquid and have higher demand
for shorting. Corporate responses are also more pronounced when stocks have observed an
increase in their values prior to shifts in the supply of lendable stocks. Notably, managers are
more aggressive in their responses when their wealth is more sensitive to stock price.
9 Concluding Remarks
We examine whether the rise of equity lending and short selling have shaped managerial
actions consistent with the notion of supporting share prices. Short selling activity and its
impact on share prices can alter expectations and affect corporate policies. We find that
managers react to an increase in the ease of shorting shares in their companies by increasing
repurchase activity and accumulating cash war chests. These actions seem to be financed by
debt issuance as well as investment cuts and reductions in dividend payments.
In designing our tests, we combine several unique datasets and techniques. Those tests
are informed and guided by the unique institutional setting we study. We use variation in
stock ownership by passive investors to identify shifts to the supply of lendable stocks that
are unrelated to changes in corporate financial policies. We also consider the reconstitution
25

of Russell indices as an alternative — albeit more local — identification strategy and find
similar conclusions. The effects we document are stronger for firms whose stocks are ex-ante
more liquid, have higher pent-up demand for shorting, are relatively overvalued, and whose
managerial compensation is more sensitive to stock prices. Our results uncover important,
new effects that capital markets and institutions exert on corporate policies. We believe that
understanding these effects is important for researchers, managers, and policymakers alike as
capital markets evolve and present new challenges to all of its participants.
26
References
Aggarwal, R., Saffi, P. A. C., and Sturgess, J. (2015). The role of institutional investors invoting: Evidence from the securities lending market. Journal of Finance, 70(5):2309–2346.
Almeida, H., Campello, M., and Weisbach, M. S. (2004). The cash flow sensitivity of cash.Journal of Finance, 59(4):1777–1804.
Amihud, Y. (2002). Illiquidity and stock returns: Cross-section and time-series effects. Journalof Financial Markets, 5(1):31–56.
Appel, I., Gormley, T. A., and Keim, D. B. (2014). Passive investors, not passive owners.Working Paper.
Asker, J., Farre-Mensa, J., and Ljungqvist, A. (2015). Corporate investment and stock marketlisting: A puzzle? Review of Financial Studies, 28(2):342–390.
Asquith, P., Pathak, P. A., and Ritter, J. R. (2005). Short interest, institutional ownershipand stock returns. Journal of Financial Economics, 78:243–276.
Baker, M., Stein, J. C., and Wurgler, J. (2003). When does the market matter? Stockprices and the investment of equity-dependent firms. The Quarterly Journal of Economics,118(3):969–1005.
Bates, T. W., Kahle, K. M., and Stulz, R. M. (2009). Why do U.S. firms hold so much morecash than they used to? Journal of Finance, 64(5):1985–2021.
Ben-David, I., Franzoni, F., and Moussawi, R. (2014). Do ETFs increase volatility? NBERWorking Papers 20071, National Bureau of Economic Research, Inc.
Blocher, J. and Whaley, R. E. (2015). Passive investing: The role of securities lending. WorkingPaper.
Boehmer, E. and Wu, J. J. (2013). Short selling and the price discovery process. Review ofFinancial Studies, 26(2):287–322.
Brav, A., Graham, J. R., Harvey, C. R., and Michaely, R. (2008). Managerial response to theMay 2003 dividend tax cut. Financial Management, 37(4):611–624.
Bushee, B. J. (1998). The influence of institutional investors on myopic R&D investmentbehavior. The Accounting Review, 73(3):pp. 305–333.
Cesari, A. D., Espenlaub, S., Khurshed, A., and Simkovic, M. (2012). The effects of ownershipand stock liquidity on the timing of repurchase transactions. Journal of Corporate Finance,18(5):1023 – 1050.
Chang, Y.-C., Hong, H., and Liskovich, I. (2015). Regression discontinuity and the price effectsof stock market indexing. Review of Financial Studies, 28(1):212–246.
Christoffersen, S. E., Geczy, C. C., Musto, D. K., and Reed, A. V. (2005). Crossborder dividendtaxation and the preferences of taxable and nontaxable investors: Evidence from Canada.Journal of Financial Economics, 78(1):121–144.
Christoffersen, S. E. K., Geczy, C. C., Musto, D. K., and Reed, A. V. (2007). Vote tradingand information aggregation. Journal of Finance, 62(6):2897–2929.
Crane, A., Michenaud, S., and Weston, J. (2014). The effects of institutional ownership onpayout policy: A regression discontinuity design approach. Rice University Working Paper.
Cremers, M., Ferreira, M. A., Matos, P. P., and Starks, L. T. (2015). Indexing and active fundmanagement: International evidence. Journal of Financial Economics, Forthcoming.
Dasgupta, S., Noe, T. H., and Wang, Z. (2011). Where did all the dollars go? The effect ofcash flows on capital and asset structure. Journal of Financial and Quantitative Analysis,46:1259–1294.
D’Avolio, G. (2002). The market for borrowing stock. Journal of Financial Economics, 66(2-3):271–306.
Dittmar, A. K. (2000). Why do firms repurchase stock? The Journal of Business, 73(3):331–55.Edmans, A., Gabaix, X., and Landier, A. (2009). A multiplicative model of optimal ceo
incentives in market equilibrium. Review of Financial Studies, 22(12):4881–4917.
27
Edmans, A., Goldstein, I., and Jiang, W. (2015). Feedback effects, asymmetric trading, andthe limits to arbitrage. American Economic Review, 105(12):3766–97.
Evans, R., Ferreira, M. A., and Prado, M. P. (2014). Equity lending, investment restrictions,and fund performance. Working paper.
Fang, V. W., Tian, X., and Tice, S. (2014). Does stock liquidity enhance or impede firminnovation? Journal of Finance, 69(5):2085–2125.
Ferreira, M. A., Massa, M., and Matos, P. (2010). Shareholders at the gate? Institutionalinvestors and cross-border mergers and acquisitions. Review of Financial Studies, 23(2):601–644.
Fresard, L. (2010). Financial strength and product market behavior: The real effects of cor-porate cash holdings. Journal of Finance, 65(3):1097–1122.
Goldstein, I. and Guembel, A. (2008). Manipulation and the allocational role of prices. Reviewof Economic Studies, 75(1):133–164.
Grossman, S. J. and Stiglitz, J. E. (1980). On the impossibility of informationally efficientmarkets. American Economic Review, 70(3):393–408.
Grullon, G. and Michaely, R. (2002). Dividends, share repurchases, and the substitutionhypothesis. Journal of Finance, 57(4):1649–1684.
Hanson, S. G. and Sunderam, A. (2013). The growth and limits of arbitrage: Evidence fromshort interest. Review of Financial Studies.
Hong, H., Wang, J., and Yu, J. (2008). Firms as buyers of last resort. Journal of FinancialEconomics, 88(1):119–145.
Khanna, N. and Mathews, R. D. (2012). Doing battle with short sellers: The conflicted roleof blockholders in bear raids. Journal of Financial Economics, 106(2):229–246.
Kolasinski, A. C., Reed, A. V., and Ringgenberg, M. C. (2013). A multiple lender approachto understanding supply and search in the equity lending market. Journal of Finance,68(2):559–595.
Lang, L., Stulz, R., and Walkling, R. A. (1989). Managerial performance, Tobin’s Q, and thegains from successful tender offers. Journal of Financial Economics, 24(1):137–154.
Lewellen, J. (2011). Institutional investors and the limits of arbitrage. Journal of FinancialEconomics, 102(1):62–80.
Massa, M., Zhang, B., and Zhang, H. (2015). The invisible hand of short selling: Does shortselling discipline earnings management? Review of Financial Studies, 28(6):1701–1736.
Pinkowitz, L., Sturgess, J., and Williamson, R. (2013). Do cash stockpiles fuel cash acquisi-tions? Journal of Corporate Finance, 23(0):128–149.
Polk, C. and Sapienza, P. (2009). The stock market and corporate investment: A test ofcatering theory. Review of Financial Studies, 22(1):187–217.
Prado, M. P., Saffi, P. A. C., and Sturgess, J. (2014). Ownership structure, limits to arbitrageand stock returns: Evidence from the equity lending market. Working Paper.
Roosenboom, P., Schlingemann, F. P., and Vasconcelos, M. (2014). Does stock liquidity affectincentives to monitor? Evidence from corporate takeovers. Review of Financial Studies,27(8):2392–2433.
Saffi, P. A. C. and Sigurdsson, K. (2011). Price efficiency and short-selling. Review of FinancialStudies, 24(3):821–852.
Simkovic, M. (2009). The effect of mandatory disclosure on open-market repurchases. BerkeleyBusiness Law Journal, 6(1):96–130.
Stephens, C. P. and Weisbach, M. (1998). Actual share reacquisitions in open-market repur-chase programs. Journal of Finance, 53(1):313–333.
Wurgler, J. (2011). On the economic consequences of index-linked investing. In Allen, W.,Khurana, R., Lorsch, J., and Rosenfeld, G., editors, Challenges to Business in the Twenty-First Century: The Way Forward. American Academy of Arts and Sciences.
28
Ap
pen
dix
A:
Vari
ab
les
Defi
nit
ion
Vari
ab
leD
efi
nit
ion
Repurchases
(Pu
rch
ase
ofC
omm
onan
dP
refe
rred
Sto
ck)÷
Lagged
Book
Ass
ets
Cash
(Cas
h&
Sh
ort-
term
Equ
ivale
nts
)÷
Lagged
Book
Ass
ets.
Dividen
ds
Tot
ald
ivid
end
sp
aid
toco
mm
on
an
dp
refe
rred
share
sin
aqu
art
er÷
Lagged
Book
Ass
ets
Net
DebtIssuance
Qu
arte
rly
chan
ges
ofsh
ort-
term
an
dlo
ng-t
erm
deb
t(C
om
pu
stat’
sDLCQ
+DLTTQ
)÷
Lagged
Book
Ass
ets
Supply
En
d-o
f-qu
arte
rfr
acti
onof
mark
etca
pit
ali
zati
on
avail
ab
leto
len
d
OnLoan
En
d-o
f-qu
arte
rfr
acti
onof
mark
etca
pit
ali
zati
on
effec
tive
lyle
nt
ou
t.
ShortableSupply
Su
pp
ly–
On
Loa
n.
Fee
Val
ue-
wei
ghte
dlo
anfe
eat
the
end
of
the
qu
art
er(i
nan
nu
ali
zed
%)
TotalIO
Fra
ctio
nof
the
firm
hel
dby
inst
itu
tion
al
inve
stors
com
pu
ted
from
13f
file
s.
PassiveIO
Fra
ctio
nof
the
firm
hel
dby
qu
asi
-in
dex
ers
inst
itu
tion
sas
inB
ush
ee(1
998).
Utilization
On
Loa
nd
ivid
edby
Su
pp
ly.
Size
Fir
mas
sets
inU
S$
bil
lion
s.
Market-to-B
ook
Mar
ket
valu
eof
com
mon
share
s÷
Book
Ass
ets.
Cash
Flow
(In
com
eB
efor
eE
xtr
aord
inary
Item
s+
Dep
reci
ati
on
an
dA
mort
izati
on
)÷
Lagged
Book
Ass
ets.
NWC
(Cu
rren
tA
sset
s–
Cu
rren
tL
iab
ilit
ies
–C
ash
&E
qu
ivale
nts
)÷
Lagged
Book
Ass
ets.
Investmen
t(C
apit
alE
xp
end
itu
res)÷
Lagged
Book
Ass
ets.
R&D
(Res
earc
h&
Dev
elop
men
tE
xp
ense
s)÷
Lagged
Book
Ass
ets.
Industry
Sigma
Sta
nd
ard
dev
iati
onof
Cash
Flow
of
all
firm
sin
the
sam
e2-d
igit
SIC
cod
eacr
oss
the
wh
ole
sam
ple
(Bate
set
al.
(2009))
.
Acquisitions
Acq
uis
itio
ns÷
Lag
ged
Book
Ass
ets.
IPO
Ind
icat
orva
riab
leeq
ual
to1
iffi
rmdid
its
IPO
inth
ep
ast
5ye
ars
.
ILLIQ
Dai
lyab
solu
tere
turn
div
ided
by
dollar
volu
me
(Am
ihu
d(2
002))
aver
aged
over
aqu
art
er.
Spread
Bid
-ask
spre
adat
the
end
of
atr
ad
ing
day
aver
aged
over
aqu
art
er.
Turnover
Dai
lynu
mb
erof
shar
estr
ad
edd
ivid
edby
tota
lsh
are
sou
tsta
nd
ing
aver
aged
over
aqu
art
er.
Short
Interest
En
d-o
f-qu
arte
rsh
ort
pos
itio
ns
hel
dby
inve
stors
as
afr
act
ion
of
tota
lsh
are
sou
tsta
nd
ing
rep
ort
edin
Com
pu
stat.
QRatio
(Mar
ket
Val
ue
ofE
qu
ity
+B
ook
Valu
eof
Deb
t)÷
Book
Ass
ets.
MOM
Cu
mu
lati
vere
turn
inth
ep
revio
us
twel
ve
month
s(i
.e.
month
st-13
tot-1
).
CEO
WPS
Ed
man
set
al.’
s(2
009)
mea
sure
of
wea
lth
-per
form
an
cese
nsi
tivit
y,giv
enby
the
doll
ar
chan
ge
inC
EO
wea
lth
for
a1%
poin
t
chan
gein
firm
valu
e,d
ivid
edby
an
nu
al
flow
com
pen
sati
on
29
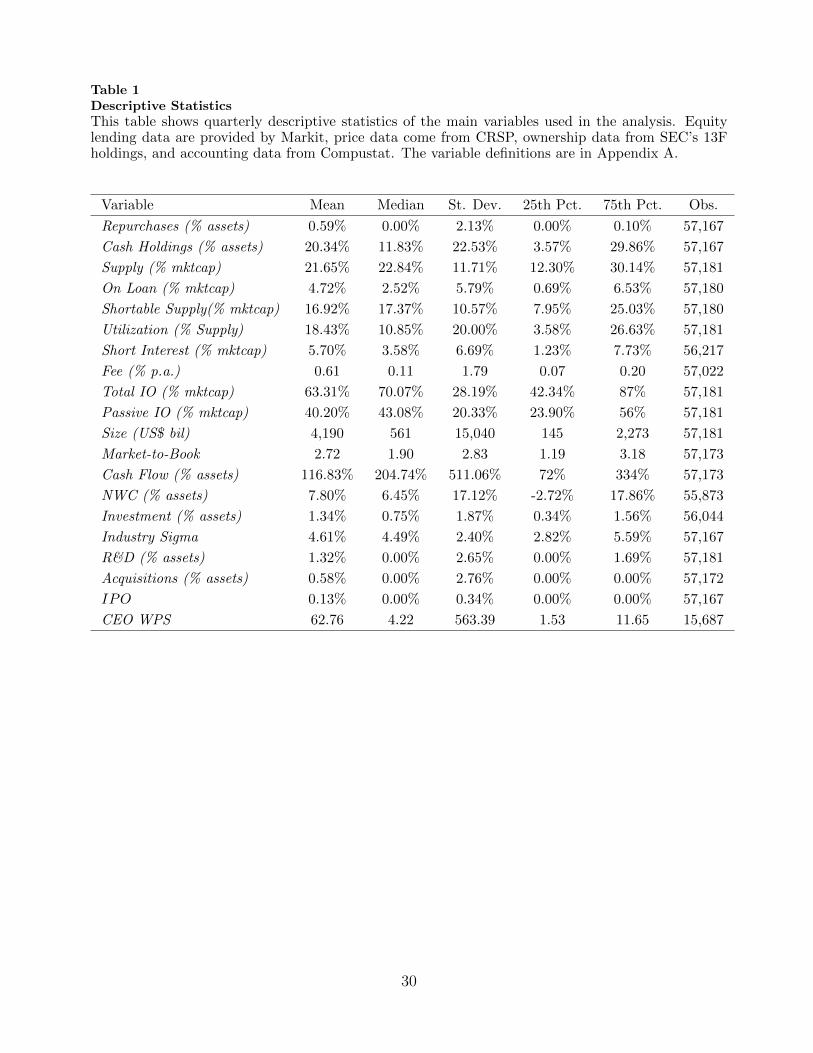
Table 1Descriptive StatisticsThis table shows quarterly descriptive statistics of the main variables used in the analysis. Equitylending data are provided by Markit, price data come from CRSP, ownership data from SEC’s 13Fholdings, and accounting data from Compustat. The variable definitions are in Appendix A.
Variable Mean Median St. Dev. 25th Pct. 75th Pct. Obs.
Repurchases (% assets) 0.59% 0.00% 2.13% 0.00% 0.10% 57,167
Cash Holdings (% assets) 20.34% 11.83% 22.53% 3.57% 29.86% 57,167
Supply (% mktcap) 21.65% 22.84% 11.71% 12.30% 30.14% 57,181
On Loan (% mktcap) 4.72% 2.52% 5.79% 0.69% 6.53% 57,180
Shortable Supply(% mktcap) 16.92% 17.37% 10.57% 7.95% 25.03% 57,180
Utilization (% Supply) 18.43% 10.85% 20.00% 3.58% 26.63% 57,181
Short Interest (% mktcap) 5.70% 3.58% 6.69% 1.23% 7.73% 56,217
Fee (% p.a.) 0.61 0.11 1.79 0.07 0.20 57,022
Total IO (% mktcap) 63.31% 70.07% 28.19% 42.34% 87% 57,181
Passive IO (% mktcap) 40.20% 43.08% 20.33% 23.90% 56% 57,181
Size (US$ bil) 4,190 561 15,040 145 2,273 57,181
Market-to-Book 2.72 1.90 2.83 1.19 3.18 57,173
Cash Flow (% assets) 116.83% 204.74% 511.06% 72% 334% 57,173
NWC (% assets) 7.80% 6.45% 17.12% -2.72% 17.86% 55,873
Investment (% assets) 1.34% 0.75% 1.87% 0.34% 1.56% 56,044
Industry Sigma 4.61% 4.49% 2.40% 2.82% 5.59% 57,167
R&D (% assets) 1.32% 0.00% 2.65% 0.00% 1.69% 57,181
Acquisitions (% assets) 0.58% 0.00% 2.76% 0.00% 0.00% 57,172
IPO 0.13% 0.00% 0.34% 0.00% 0.00% 57,167
CEO WPS 62.76 4.22 563.39 1.53 11.65 15,687
30
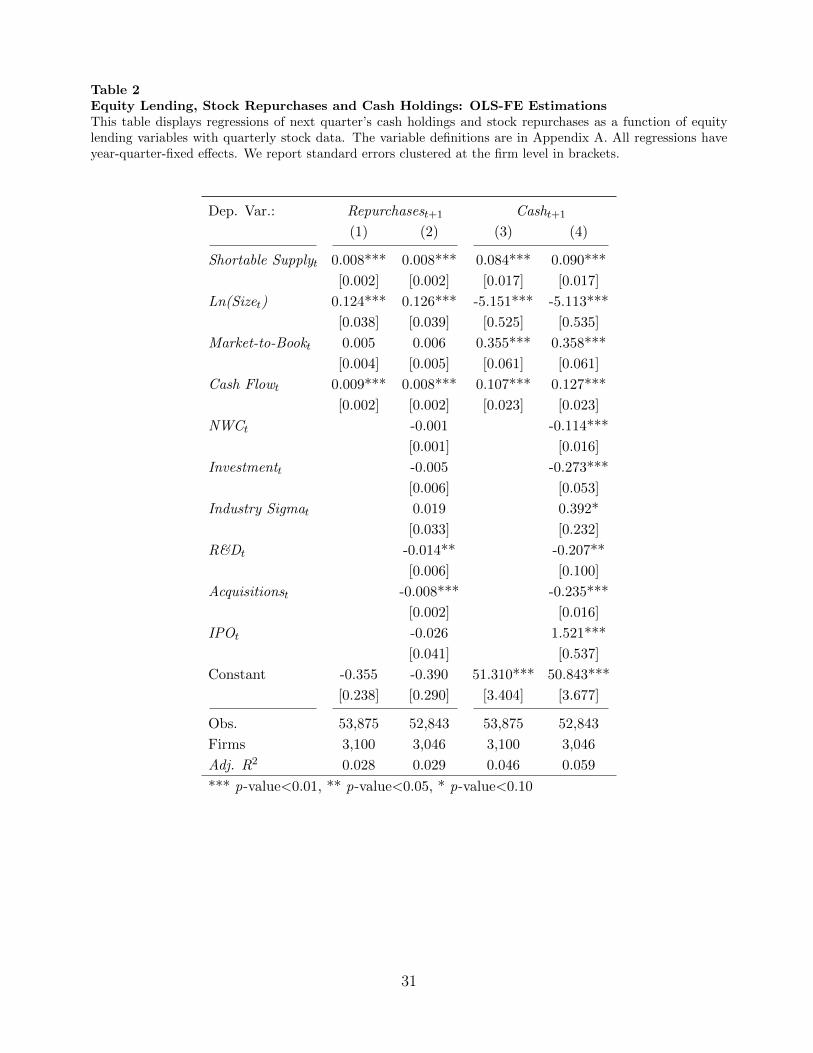
Table 2Equity Lending, Stock Repurchases and Cash Holdings: OLS-FE EstimationsThis table displays regressions of next quarter’s cash holdings and stock repurchases as a function of equitylending variables with quarterly stock data. The variable definitions are in Appendix A. All regressions haveyear-quarter-fixed effects. We report standard errors clustered at the firm level in brackets.
Dep. Var.: Repurchasest+1 Casht+1
(1) (2) (3) (4)
Shortable Supplyt 0.008*** 0.008*** 0.084*** 0.090***
[0.002] [0.002] [0.017] [0.017]
Ln(Sizet) 0.124*** 0.126*** -5.151*** -5.113***
[0.038] [0.039] [0.525] [0.535]
Market-to-Bookt 0.005 0.006 0.355*** 0.358***
[0.004] [0.005] [0.061] [0.061]
Cash Flowt 0.009*** 0.008*** 0.107*** 0.127***
[0.002] [0.002] [0.023] [0.023]
NWCt -0.001 -0.114***
[0.001] [0.016]
Investmentt -0.005 -0.273***
[0.006] [0.053]
Industry Sigmat 0.019 0.392*
[0.033] [0.232]
R&Dt -0.014** -0.207**
[0.006] [0.100]
Acquisitionst -0.008*** -0.235***
[0.002] [0.016]
IPOt -0.026 1.521***
[0.041] [0.537]
Constant -0.355 -0.390 51.310*** 50.843***
[0.238] [0.290] [3.404] [3.677]
Obs. 53,875 52,843 53,875 52,843
Firms 3,100 3,046 3,100 3,046
Adj. R2 0.028 0.029 0.046 0.059
*** p-value<0.01, ** p-value<0.05, * p-value<0.10
31
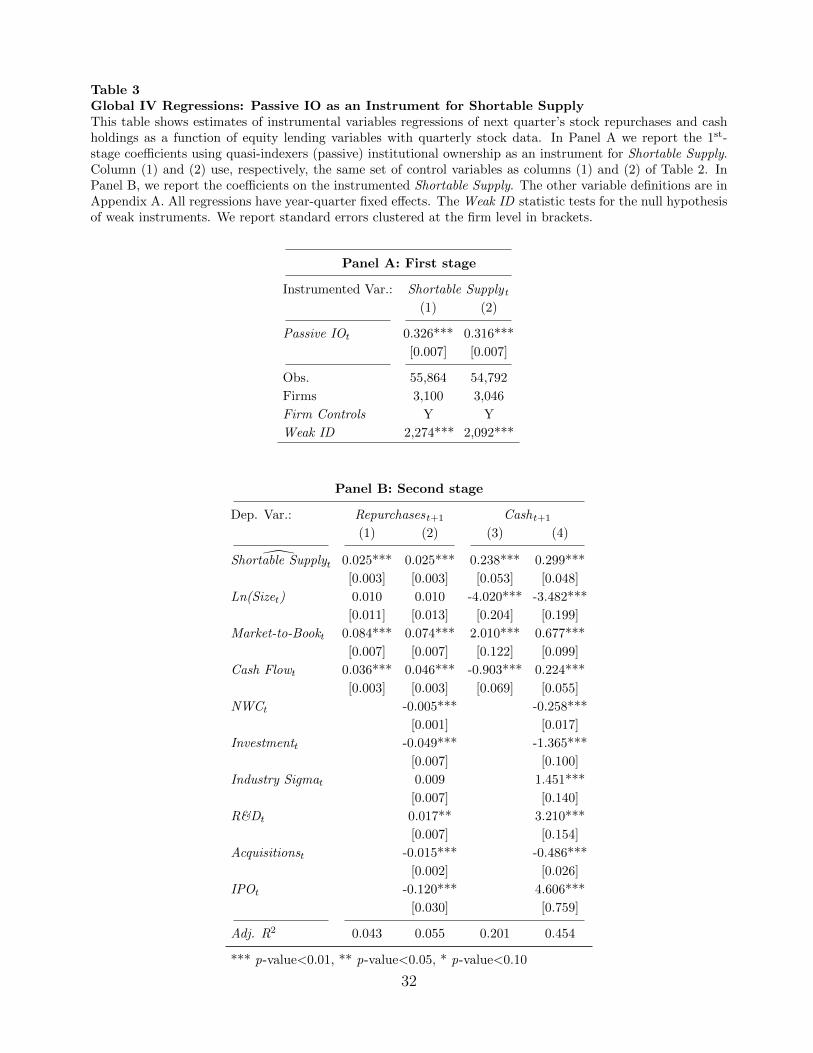
Table 3Global IV Regressions: Passive IO as an Instrument for Shortable SupplyThis table shows estimates of instrumental variables regressions of next quarter’s stock repurchases and cashholdings as a function of equity lending variables with quarterly stock data. In Panel A we report the 1st-stage coefficients using quasi-indexers (passive) institutional ownership as an instrument for Shortable Supply.Column (1) and (2) use, respectively, the same set of control variables as columns (1) and (2) of Table 2. InPanel B, we report the coefficients on the instrumented Shortable Supply. The other variable definitions are inAppendix A. All regressions have year-quarter fixed effects. The Weak ID statistic tests for the null hypothesisof weak instruments. We report standard errors clustered at the firm level in brackets.
Panel A: First stage
Instrumented Var.: Shortable Supplyt
(1) (2)
Passive IOt 0.326*** 0.316***
[0.007] [0.007]
Obs. 55,864 54,792
Firms 3,100 3,046
Firm Controls Y Y
Weak ID 2,274*** 2,092***
Panel B: Second stage
Dep. Var.: Repurchasest+1 Casht+1
(1) (2) (3) (4)
Shortable Supplyt 0.025*** 0.025*** 0.238*** 0.299***
[0.003] [0.003] [0.053] [0.048]
Ln(Sizet) 0.010 0.010 -4.020*** -3.482***
[0.011] [0.013] [0.204] [0.199]
Market-to-Bookt 0.084*** 0.074*** 2.010*** 0.677***
[0.007] [0.007] [0.122] [0.099]
Cash Flowt 0.036*** 0.046*** -0.903*** 0.224***
[0.003] [0.003] [0.069] [0.055]
NWCt -0.005*** -0.258***
[0.001] [0.017]
Investmentt -0.049*** -1.365***
[0.007] [0.100]
Industry Sigmat 0.009 1.451***
[0.007] [0.140]
R&Dt 0.017** 3.210***
[0.007] [0.154]
Acquisitionst -0.015*** -0.486***
[0.002] [0.026]
IPOt -0.120*** 4.606***
[0.030] [0.759]
Adj. R2 0.043 0.055 0.201 0.454
*** p-value<0.01, ** p-value<0.05, * p-value<0.10
32
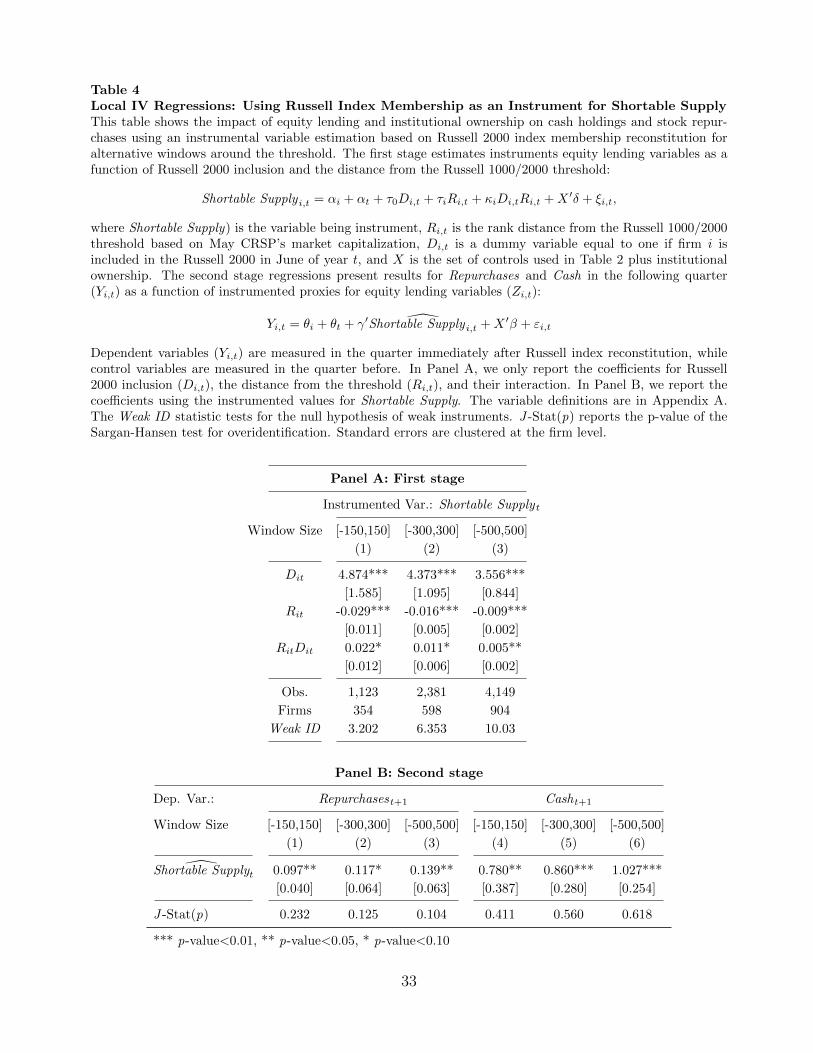
Table 4Local IV Regressions: Using Russell Index Membership as an Instrument for Shortable SupplyThis table shows the impact of equity lending and institutional ownership on cash holdings and stock repur-chases using an instrumental variable estimation based on Russell 2000 index membership reconstitution foralternative windows around the threshold. The first stage estimates instruments equity lending variables as afunction of Russell 2000 inclusion and the distance from the Russell 1000/2000 threshold:
Shortable Supply i,t = αi + αt + τ0Di,t + τiRi,t + κiDi,tRi,t +X ′δ + ξi,t,
where Shortable Supply) is the variable being instrument, Ri,t is the rank distance from the Russell 1000/2000threshold based on May CRSP’s market capitalization, Di,t is a dummy variable equal to one if firm i isincluded in the Russell 2000 in June of year t, and X is the set of controls used in Table 2 plus institutionalownership. The second stage regressions present results for Repurchases and Cash in the following quarter(Yi,t) as a function of instrumented proxies for equity lending variables (Zi,t):
Yi,t = θi + θt + γ′ Shortable Supply i,t +X ′β + εi,t
Dependent variables (Yi,t) are measured in the quarter immediately after Russell index reconstitution, whilecontrol variables are measured in the quarter before. In Panel A, we only report the coefficients for Russell2000 inclusion (Di,t), the distance from the threshold (Ri,t), and their interaction. In Panel B, we report thecoefficients using the instrumented values for Shortable Supply. The variable definitions are in Appendix A.The Weak ID statistic tests for the null hypothesis of weak instruments. J -Stat(p) reports the p-value of theSargan-Hansen test for overidentification. Standard errors are clustered at the firm level.
Panel A: First stage
Instrumented Var.: Shortable Supplyt
Window Size [-150,150] [-300,300] [-500,500]
(1) (2) (3)
Dit 4.874*** 4.373*** 3.556***
[1.585] [1.095] [0.844]
Rit -0.029*** -0.016*** -0.009***
[0.011] [0.005] [0.002]
RitDit 0.022* 0.011* 0.005**
[0.012] [0.006] [0.002]
Obs. 1,123 2,381 4,149
Firms 354 598 904
Weak ID 3.202 6.353 10.03
Panel B: Second stage
Dep. Var.: Repurchasest+1 Casht+1
Window Size [-150,150] [-300,300] [-500,500] [-150,150] [-300,300] [-500,500]
(1) (2) (3) (4) (5) (6)
Shortable Supplyt 0.097** 0.117* 0.139** 0.780** 0.860*** 1.027***
[0.040] [0.064] [0.063] [0.387] [0.280] [0.254]
J -Stat(p) 0.232 0.125 0.104 0.411 0.560 0.618
*** p-value<0.01, ** p-value<0.05, * p-value<0.10
33
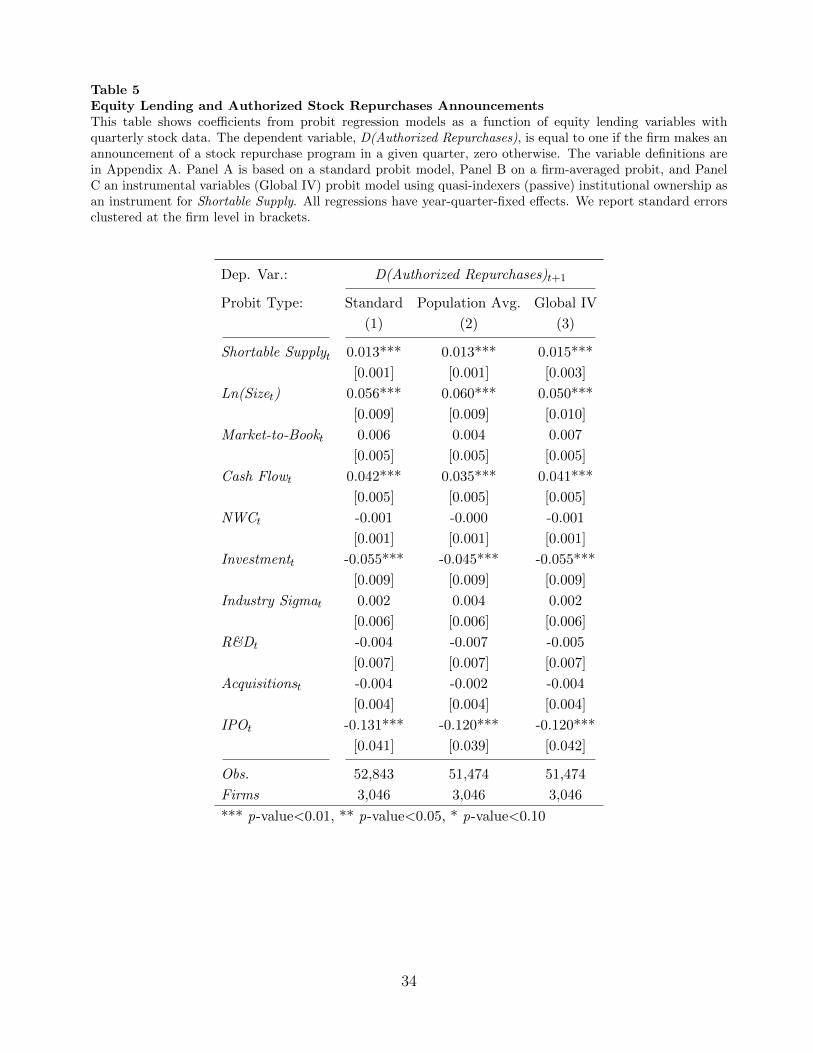
Table 5Equity Lending and Authorized Stock Repurchases AnnouncementsThis table shows coefficients from probit regression models as a function of equity lending variables withquarterly stock data. The dependent variable, D(Authorized Repurchases), is equal to one if the firm makes anannouncement of a stock repurchase program in a given quarter, zero otherwise. The variable definitions arein Appendix A. Panel A is based on a standard probit model, Panel B on a firm-averaged probit, and PanelC an instrumental variables (Global IV) probit model using quasi-indexers (passive) institutional ownership asan instrument for Shortable Supply. All regressions have year-quarter-fixed effects. We report standard errorsclustered at the firm level in brackets.
Dep. Var.: D(Authorized Repurchases)t+1
Probit Type: Standard Population Avg. Global IV
(1) (2) (3)
Shortable Supplyt 0.013*** 0.013*** 0.015***
[0.001] [0.001] [0.003]
Ln(Sizet) 0.056*** 0.060*** 0.050***
[0.009] [0.009] [0.010]
Market-to-Bookt 0.006 0.004 0.007
[0.005] [0.005] [0.005]
Cash Flowt 0.042*** 0.035*** 0.041***
[0.005] [0.005] [0.005]
NWCt -0.001 -0.000 -0.001
[0.001] [0.001] [0.001]
Investmentt -0.055*** -0.045*** -0.055***
[0.009] [0.009] [0.009]
Industry Sigmat 0.002 0.004 0.002
[0.006] [0.006] [0.006]
R&Dt -0.004 -0.007 -0.005
[0.007] [0.007] [0.007]
Acquisitionst -0.004 -0.002 -0.004
[0.004] [0.004] [0.004]
IPOt -0.131*** -0.120*** -0.120***
[0.041] [0.039] [0.042]
Obs. 52,843 51,474 51,474
Firms 3,046 3,046 3,046
*** p-value<0.01, ** p-value<0.05, * p-value<0.10
34
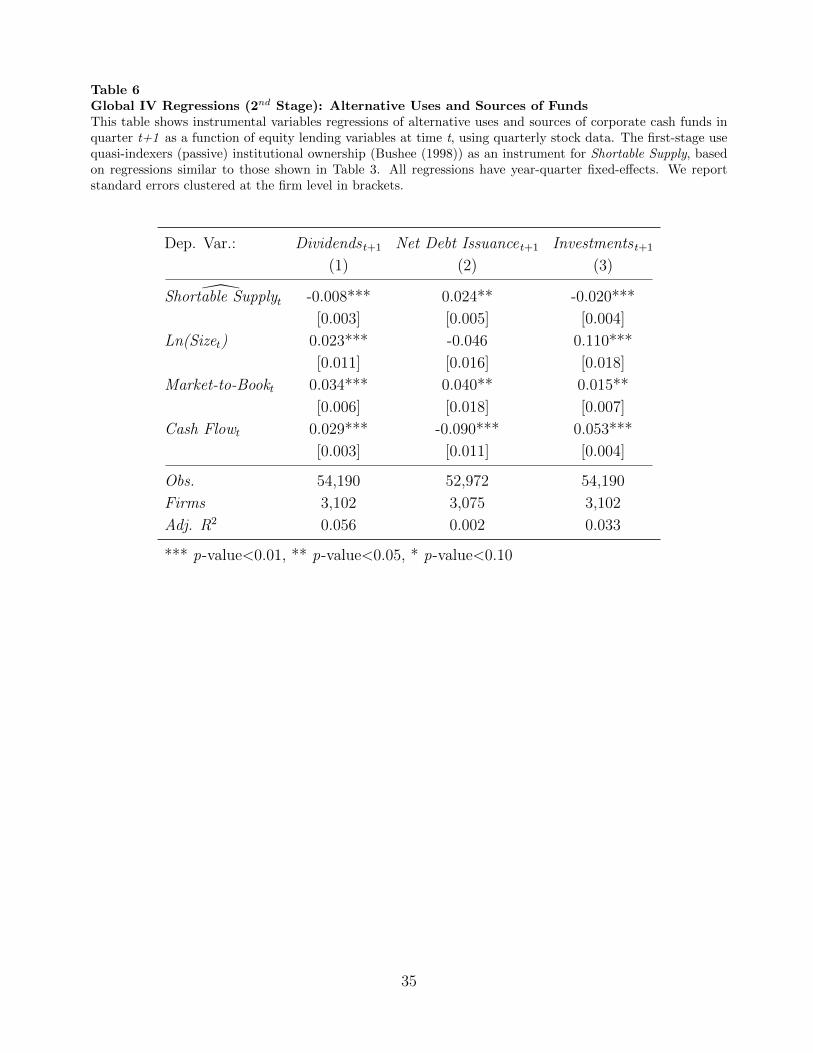
Table 6Global IV Regressions (2nd Stage): Alternative Uses and Sources of FundsThis table shows instrumental variables regressions of alternative uses and sources of corporate cash funds inquarter t+1 as a function of equity lending variables at time t, using quarterly stock data. The first-stage usequasi-indexers (passive) institutional ownership (Bushee (1998)) as an instrument for Shortable Supply, basedon regressions similar to those shown in Table 3. All regressions have year-quarter fixed-effects. We reportstandard errors clustered at the firm level in brackets.
Dep. Var.: Dividends t+1 Net Debt Issuancet+1 Investments t+1
(1) (2) (3)
Shortable Supplyt -0.008*** 0.024** -0.020***
[0.003] [0.005] [0.004]
Ln(Sizet) 0.023*** -0.046 0.110***
[0.011] [0.016] [0.018]
Market-to-Bookt 0.034*** 0.040** 0.015**
[0.006] [0.018] [0.007]
Cash Flowt 0.029*** -0.090*** 0.053***
[0.003] [0.011] [0.004]
Obs. 54,190 52,972 54,190
Firms 3,102 3,075 3,102
Adj. R2 0.056 0.002 0.033
*** p-value<0.01, ** p-value<0.05, * p-value<0.10
35
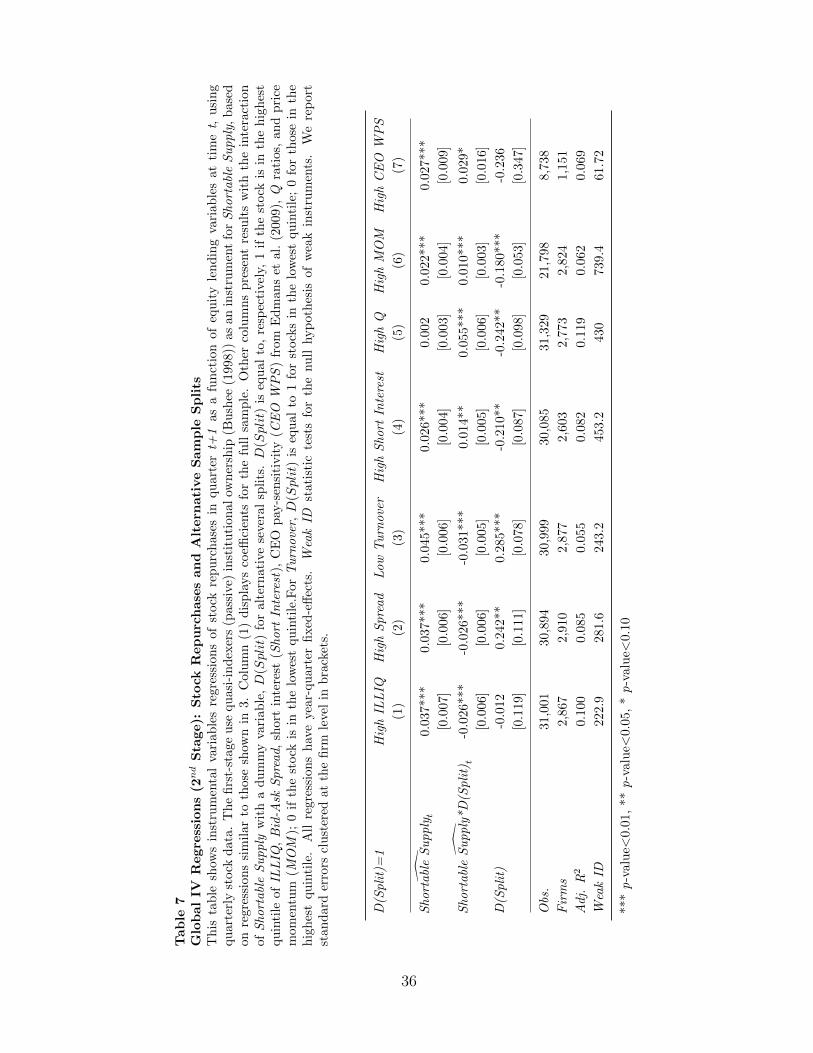
Tab
le7
Glo
bal
IVR
egre
ssio
ns
(2nd
Sta
ge):
Sto
ckR
epu
rch
ase
san
dA
ltern
ati
ve
Sam
ple
Sp
lits
Th
ista
ble
show
sin
stru
men
tal
vari
able
sre
gres
sion
sof
stock
rep
urc
hase
sin
qu
art
ert+
1as
afu
nct
ion
of
equ
ity
len
din
gva
riab
les
at
tim
et,
usi
ng
qu
arte
rly
stock
dat
a.T
he
firs
t-st
age
use
qu
asi-
ind
exer
s(p
ass
ive)
inst
itu
tion
al
own
ersh
ip(B
ush
ee(1
998))
as
an
inst
rum
ent
forShortableSupply
,b
ase
don
regr
essi
ons
sim
ilar
toth
ose
show
nin
3.C
olu
mn
(1)
dis
pla
ys
coeffi
cien
tsfo
rth
efu
llsa
mp
le.
Oth
erco
lum
ns
pre
sent
resu
lts
wit
hth
ein
tera
ctio
nof
ShortableSupply
wit
ha
du
mm
yva
riab
le,D
(Split)
for
alt
ern
ati
ve
seve
ral
splits
.D
(Split)
iseq
ual
to,
resp
ecti
vely
,1
ifth
est
ock
isin
the
hig
hes
tqu
inti
leof
ILLIQ
,Bid-A
skSpread,
shor
tin
tere
st(Short
Interest
),C
EO
pay
-sen
siti
vit
y(C
EO
WPS
)fr
om
Ed
man
set
al.
(2009),
Qra
tios,
an
dp
rice
mom
entu
m(M
OM
);0
ifth
est
ock
isin
the
low
est
qu
inti
le.F
orTurnover,D
(Split)
iseq
ual
to1
for
stock
sin
the
low
est
qu
inti
le;
0fo
rth
ose
inth
eh
igh
est
qu
inti
le.
All
regr
essi
ons
hav
eye
ar-q
uar
ter
fixed
-eff
ects
.WeakID
stati
stic
test
sfo
rth
enu
llhyp
oth
esis
of
wea
kin
stru
men
ts.
We
rep
ort
stan
dar
der
rors
clu
ster
edat
the
firm
leve
lin
bra
cket
s.
D(Split)=1
HighIL
LIQ
HighSpread
Low
Turnover
HighShort
Interest
HighQ
HighMOM
HighCEO
WPS
(1)
(2)
(3)
(4)
(5)
(6)
(7)
ShortableSupply
t0.
037*
**0.0
37***
0.0
45***
0.0
26***
0.0
02
0.0
22***
0.0
27***
[0.0
07]
[0.0
06]
[0.0
06]
[0.0
04]
[0.0
03]
[0.0
04]
[0.0
09]
ShortableSupply*D(Split)
t-0
.026
***
-0.0
26***
-0.0
31***
0.0
14**
0.0
55***
0.0
10***
0.0
29*
[0.0
06]
[0.0
06]
[0.0
05]
[0.0
05]
[0.0
06]
[0.0
03]
[0.0
16]
D(Split)
-0.0
120.2
42**
0.2
85***
-0.2
10**
-0.2
42**
-0.1
80***
-0.2
36
[0.1
19]
[0.1
11]
[0.0
78]
[0.0
87]
[0.0
98]
[0.0
53]
[0.3
47]
Obs.
31,0
0130,8
94
30,9
99
30,0
85
31,3
29
21,7
98
8,7
38
Firms
2,86
72,9
10
2,8
77
2,6
03
2,7
73
2,8
24
1,1
51
Adj.
R2
0.10
00.0
85
0.0
55
0.0
82
0.1
19
0.0
62
0.0
69
WeakID
222.
9281.6
243.2
453.2
430
739.4
61.7
2
***p
-val
ue<
0.01
,**
p-v
alu
e<0.
05,
*p
-val
ue<
0.1
0
36