Embed Size (px)
Citation preview

The Risk of Reform: How US Healthcare Systems are Responding
Paul Posey CEO, Ascension Care Management & President, Risk Services
Transforming Healthcare - Health Policy, Digital Health and Data Privacy: Who pays the bill? Swiss Re Center for Global Dialogue

2
We’re going to make American Healthcare Great Again!!
Paul Posey @pposeyjr


4
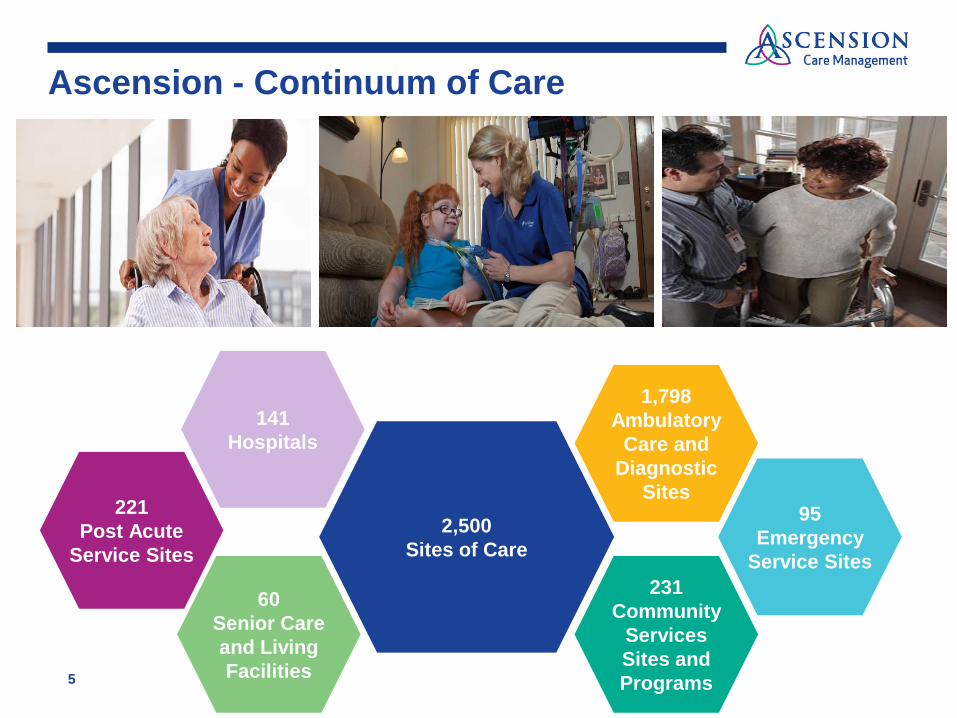
Ascension - Continuum of Care
5
2,500 Sites of Care
1,798 Ambulatory
Care and Diagnostic
Sites 95
Emergency Service Sites
221 Post Acute
Service Sites
60 Senior Care and Living Facilities
231 Community
Services Sites and Programs
141 Hospitals

6
Ascension – US Healthcare Presence
Sites of Care 2,500
Acute Care Hospitals 111
Rehabilitation Hospitals 6
Behavioral Health Hospitals 9
Long-Term Acute Care Hospitals 2
Joint Venture Hospitals (<50% ownership) 13
Available Beds 22,416
Associates 160,000
Affiliated Physicians 36,000
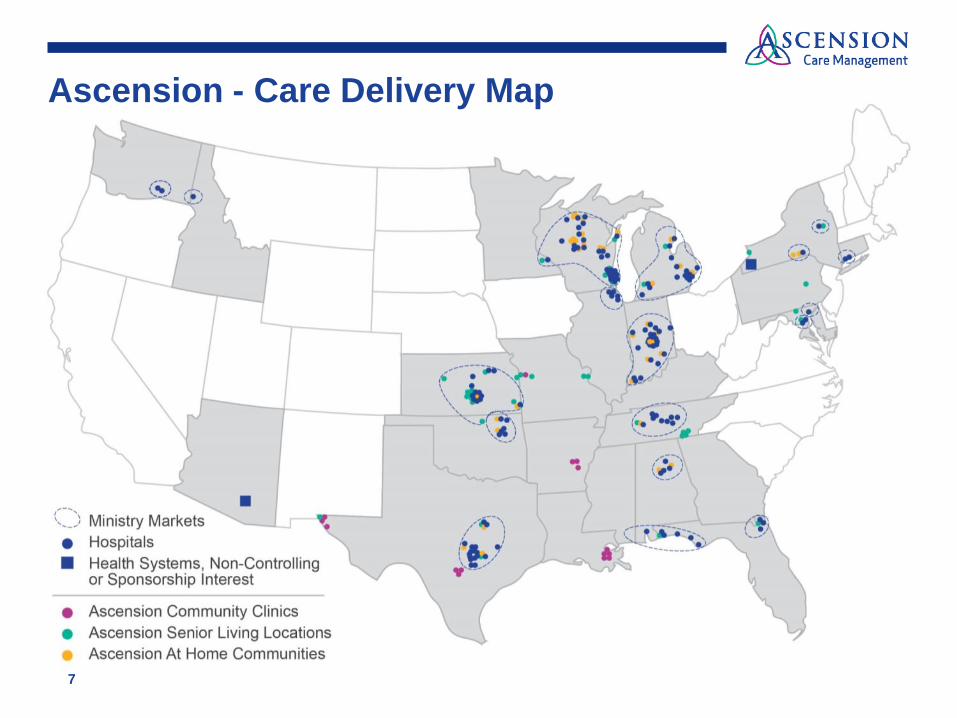
Ascension - Care Delivery Map
7
8
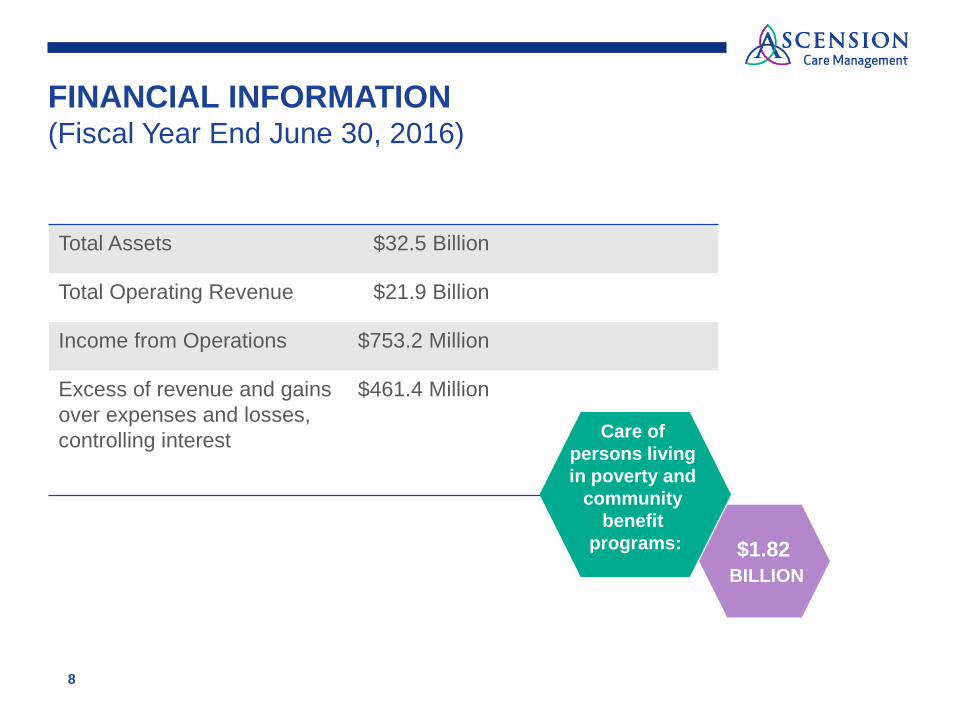
FINANCIAL INFORMATION (Fiscal Year End June 30, 2016)
Total Assets $32.5 Billion
Total Operating Revenue $21.9 Billion
Income from Operations $753.2 Million
Excess of revenue and gains $461.4 Million over expenses and losses, controlling interest
Care of persons living in poverty and
community benefit
programs:
$1.82 BILLION
*
U.S. Healthcare Trends Impacts on Payers and Providers

Spending Back on the Rise
© The Advisory Board Company - advisory.com 10
6.5% 6.3%
4.8% 3.8% 3.9% 3.9% 4.1%
3.6%
5.0% 5.8%
0%1%2%3%4%5%6%7%8%9%
10%
2006 2007 2008 2009 2010 2011 2012 2013 2014 2015
“U.S. Health-Care Spending Is on the Rise Again”
“Health care spending growth hits 10-year high”
“Health Spending Is Rising More Sharply Again”

US Healthcare - 2015 17.8% of GDP $3.2 Trillion
11

Crisis in the Making for Payers and Providers
12
2008 Stock Market Crash • Reserve positions deteriorate • Investment income erodes
2009-10 Economic Recession • Increasing unemployment • Employer-sponsored benefits cut
2010 “Obamacare” Passed • Substantial Cuts to Medicare Advantage Programs • Minimum Medical Loss Ratios Limit Profits • Long term reductions to hospital payments

Patient Protection and Affordable Care Act Obamacare
• Many More Americans Have Health Insurance
• Individuals Can Now Obtain Insurance
• Preventive and Wellness Visits under Medicare
• 30M (10%) of Americans Still Uninsured
• 40-50% lack liquid assets to cover deductibles1
• Carriers pulling out of Exchanges
13
1 Kaiser Family Foundation -Consumer Assets and Patient Cost Sharing Mar 11, 2015 | Gary Claxton, Matthew Rae, and Nirmita Panchal

Patient Protection and Affordable Care Act Health Plan Impacts
Children on Parents’ Plan
to Age 26
No Lifetime Limits on Coverage
Individual Mandates
Minimum MLR’s
No Pre-Existing
Condition Exclusions
No Health Based
Underwriting
14

15 Source: Oliver Wyman 2015
Healthcare Reform – Massive Shift to Risk Provider Impacts

16
Healthcare Reform – Medicare Risk Models Provider Impacts
Bundled Payments
Shared Savings
Shared Risk
Full Risk
• Comprehensive Primary Care Plus (CPC+)
• Medicare Shared Savings Program (MSSP) Track 1
• MSSP Track 1+4
• MSSP Track 2
• MSSP Track 3
• Next Generation ACO Model (NGACO) (80% share rate)
• NGACO (100% share rate)
PCMH Payments
• BPCI1
• CJR2
• The Oncology Care Model Two-Sided Risk Arrangement
• EPM3
Alternative Payment Models
Source: HHS, “Progress Towards Achieving Better Care, Smarter Spending, Healthier People,” available at: http://www.hhs.gov/, accessed February 2015; Health Care Advisory Board interviews and analysis. © The Advisory Board - 2017
1)Bundled Payments for Care Improvement. 2)Comprehensive Care for Joint Replacement Model. 3)Episode Payment Models. 4)MACRA Final Rule established Track 1+ with details to follow, set to start in 2018.
50% HHS goal for percent of
Medicare payment in alternative models by 2018

February 8, 2017 17
Medicare Value Based Care Purchasing Programs
3,087 hospitals in VBP program
1,700 hospitals received bonus payment
792 hospitals received net payment increases
After Accounting for Penalties1 Few Hospitals Receive Bonuses
Source: Rau J, “1,700 Hospitals Win Quality Bonuses From Medicare, But Most Will Never Collect,” Kaiser Health News, January 22, 2015, available at: kaiserhealthnews.org; Health Care Advisory Board interviews and analysis. © The Advisory Board - 2017
1)Hospital-Acquired Condition Reduction Program, Hospital Readmissions Reduction Program.

February 8, 2017 18
Accountable Care Organizations Mixed Results for Providers
30%
21%
48%
MSSP ACOs Share in Savings 2015
Held Spending Below Benchmark, Earned Shared Savings
Reduced Spending, Did Not Qualify
for Shared Savings
Did Not Hold Spending Below Benchmark
Source: CMS. “Fast Facts: All Medicare Shared Savings Program (Shared Savings Program) ACOs,” April 2016, “Pioneer ACO Model Frequently Asked Questions,” May 2016, available at www.cms.gov; Kocot and White. Health Affairs Blog. “Medicare ACOs: Incremental Progress, But Performance Varies,” September 2016, available at www.healthaffairs.org/blog; Health Care Advisory Board interviews and analysis.
1)Medicare Shared Savings Program. 2)Percentages may not add to 100 due
to rounding.

Medicare Access and CHIP Reauthorization Act “MACRA”
19 Source: McKinsey Medicare Growth Model. Includes Medicare and dual eligible
All providers will now be “at risk” with CMS for Medicare fee-for-service patients 1 Preparatory time is short—the first performance period starts in January 2017 2 Small providers will be disproportionately affected by the change in reimbursement 3 CMS wants other insurers to follow its lead and has incorporated many “all insurer” components 4 There will likely be second order implications (e.g., physician practice consolidation) 5
The Shift to Risk Old Ways of Looking at New Problems

Managing Complex Risk Systems is Not New
9,535
8,513
7,553
6,337 6,210 6,272 6,368 6,241 6,147 5,815 5,728 5,642 5,642
4,000
5,000
6,000
7,000
8,000
9,000
10,000
FY06 FY07 FY08 FY09 FY10 FY11 FY12 FY13 FY14 FY15 FY16 FY17 FY18
Ascension Professional Liability Cost Per Occupied Bed Equivalent
Loss cost per exposure (at $1 million)
40.8% Reduction
21
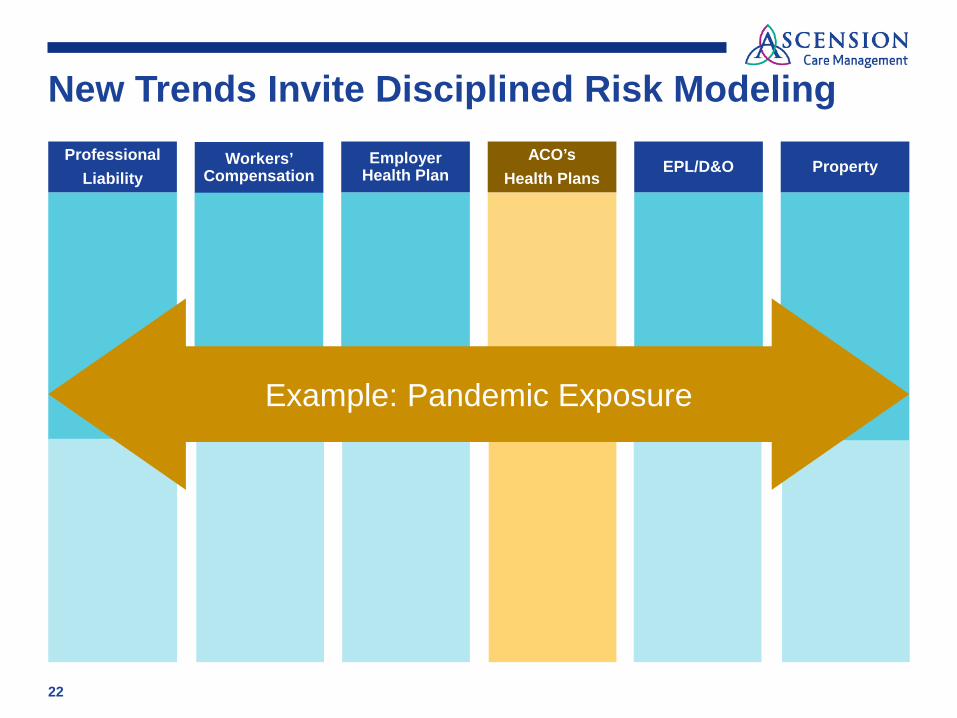
Professional Liability
Workers’ Compensation
Employer Health Plan
ACO’s Health Plans
EPL/D&O Property
Example: Pandemic Exposure
New Trends Invite Disciplined Risk Modeling
22
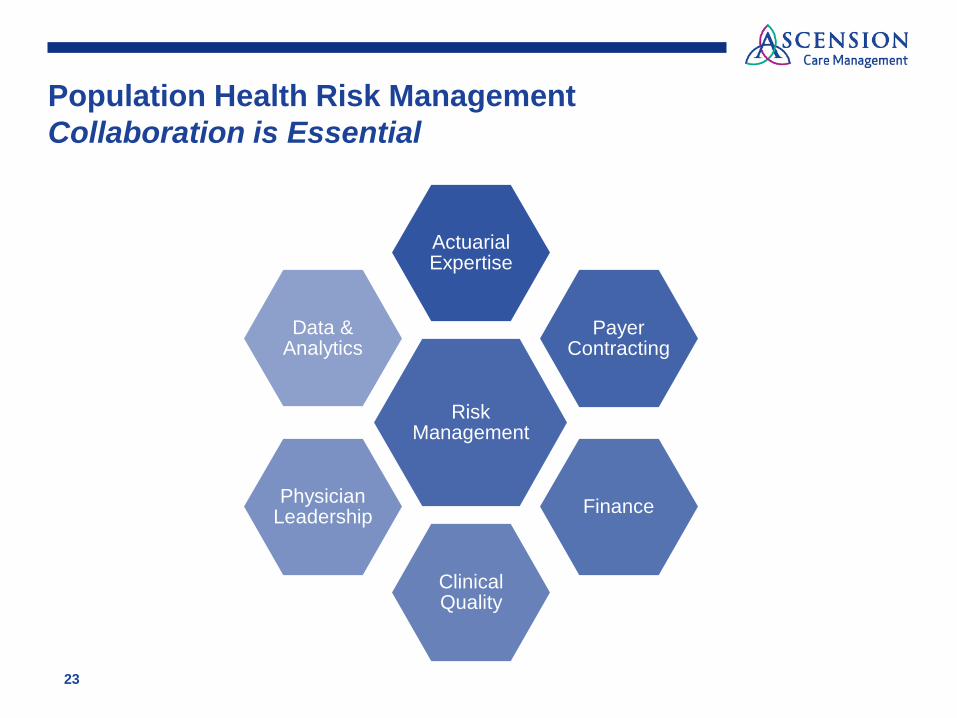
Population Health Risk Management Collaboration is Essential
23
Risk Management
Actuarial Expertise
Payer Contracting
Finance
Clinical Quality
Physician Leadership
Data & Analytics

24
The Path to Risk Sharing: System Integration ▪ Provider coordination and workflow technology
tools ▪ Chronic disease management programs with
standardized protocols
▪ Information and transparency tools
▪ Patient access tools ▪ Patient experience tools (e.g.,
satisfaction assessments) ▪ Customer service / navigation
(e.g., 24/7 hotline to answer patient clinical questions)
▪ Social service access and coordination
▪ Payer-provider incentive models & managements
▪ Provider-physicians incentive models & management
▪ Provider & physician performance management (e.g. performance reviews)
▪ Provider risk readiness assessment
▪ Foundational analytics – risk adjustment, risk stratification, patient attribution, care gap
▪ Governance, strategy and alignment across the network
▪ Ambulatory care management / practice transformation (e.g. care coordinators, practice coaches)
▪ Acute & post-acute care coordination (inpatient / discharge care protocols)
▪ Documentation and accurate coding (training, reports, reviews, and appropriate risk scoring)
▪ Cost and utilization analytics ▪ Quality and outcome analytics ▪ Physician reporting – e.g.,
performance reports, care gap reports, specialist profiles to PCPs
Source: McKinsey Medicare Growth Model. Includes Medicare and dual eligibles

What How Why
26
Paul J. Posey, Jr. is CEO of Ascension Care Management in St. Louis, Missouri, a subsidiary of Ascension Health Alliance (“Ascension”), the largest not-for-profit health system in the U.S. and the world's largest Catholic health system. Ascension Care Management serves more than 10,000 providers, 710,000 plan members and numerous governmental, commercial and self-funded payers through a suite of population health management services. Mr. Posey is also President of Ascension Risk Services (ARS) which provides risk finance, risk mitigation and claims management for professional liability, executive risk and property and casualty programs for Ascension.
Prior to joining Ascension, Mr. Posey served as Chief Executive Officer of Canopy Claims Management, LLC, of Orlando, Fla., providing expert policyholder representation in complex property claims. He also spent seventeen years with Sedgwick Claims Management Services in Memphis, Tenn., most recently as Chief Operating Officer. Mr. Posey earned a Juris Doctorate degree from the University of Memphis, and both a Bachelor of Arts and a Master of Business Administration from Christian Brothers University, Memphis. He is a Trustee for Christian Brothers University in Memphis, and has served on numerous community, industry and religious boards.
Speaker

Basic Copyright Notice & Disclaimer
©2017 This presentation is copyright protected. All rights reserved. You may download or print out a hard copy for your private or internal use. You are not permitted to create any modifications or derivatives of this presentation without the prior written permission of the copyright owner.
This presentation is for information purposes only and contains non-binding indications. Any opinions or views expressed are of the author and do not necessarily represent those of Swiss Re. Swiss Re makes no warranties or representations as to the accuracy, comprehensiveness, timeliness or suitability of this presentation for a particular purpose. Anyone shall at its own risk interpret and employ this presentation without relying on it in isolation. In no event will Swiss Re be liable for any loss or damages of any kind, including any direct, indirect or consequential damages, arising out of or in connection with the use of this presentation.