Embed Size (px)
DESCRIPTION
Unemployment
Citation preview
CLOSUP Working Paper Series Number 28
April 2010
The Risk of Unemployment among Disadvantaged and Advantaged Male Workers, 1968-2003
Benjamin J. Keys, University of Michigan
Sheldon Danziger, National Poverty Center, Gerald R. Ford School of Public
Policy, University of Michigan
This paper is available online at http://closup.umich.edu
Any opinions, findings, conclusions, or recommendations expressed in this material are those of the author(s) and do not necessarily reflect the view of the Center for Local, State, and Urban Policy or any sponsoring agency
Center for Local, State, and Urban Policy Gerald R. Ford School of Public Policy
University of Michigan

Abstract
The Risk of Unemployment among Disadvantaged and Advantaged Male Workers, 1968‐20031 Benjamin J. Keys and Sheldon Danziger, University of Michigan
Over the last three decades, structural changes in the American labor market eliminated many highly‐paid, stable jobs that had previously been available to workers with a high school diploma or less. Job security is important, particularly for the least advantaged, who may be less able to adjust to income losses than other workers and less able to plan for the future when jobs are not secure. Job loss is likely to have deleterious consequences for less‐educated workers as they are less likely than others to receive severance packages and more likely to have difficulty finding new jobs. This paper addresses several questions about changes in employment stability over the last three decades: How likely is it that a man who is employed in one year is unemployed two years later? Conversely, how likely is it that a man who is unemployed in one year is employed two years later? How have these probabilities changed over time? How do trends in employment security differ for workers classified by education and race? We analyze longitudinal data from the Panel Study of Income Dynamics (PSID) for the period from 1968 through 2003. We compare the unemployment risk of employed male household heads classified by age, educational attainment, and race. We find that younger, less‐educated, and minority male workers have a higher risk of becoming unemployed over at two‐year period and a lower probability of moving from unemployment back to employment. 1This project was supported in part by funds provided by the U.S. Department of Health and Human Services, Office of the Assistant Secretary for Planning and Evaluation, #5 U01PE000001‐05 and #1 U01 AE000002‐01. Any opinions and conclusions expressed are solely those of the authors and should not be construed as representing opinions or policy of any agency of the Federal government.
1
The Risk of Unemployment among Disadvantaged and Advantaged Male Workers, 1968-2003
Benjamin J. Keys and Sheldon Danziger, University of Michigan1
January 21, 2008 I. Introduction
Over the last three decades, structural changes in the American labor market
eliminated many highly-paid, stable jobs that had previously been available to workers
with a high school diploma or less. Even though unemployment rates for much of the past
decade have been lower than they were from the mid-1970s through the early 1990s, the
relative economic position of less-educated male workers is lower now than it was a
quarter century ago. For example, among workers between the ages of 15 and 54 who
where high school dropouts, real hourly wage rates in 2004 were nine percent below their
1979 levels; among high school graduates in the same age range, real wages in 2004 were
only five percent higher than in 1979 (Blank, Danziger and Schoeni, 2006). Declines in
the extent of unionization, erosion of the real value of the minimum wage, increased
globalization of labor and product markets, increased immigration, and a technology-
driven wage premium for college graduates have all contributed to the labor market
problems of less-educated workers (Freeman, 2007).
Job security is important, particularly for disadvantaged workers who have fewer
financial resources to cushion income losses than other workers and are less able to plan
for the future when jobs are insecure. Job losses have more deleterious consequences for
less-educated workers who are less likely than other workers to receive severance packages
and more likely than others to have difficulty finding new jobs. This paper addresses

2
several questions about changes in employment stability over the last three decades: How
likely is it that a man who is employed when interviewed in one year is unemployed when
interviewed two years later? Conversely, how likely is it that a man who is unemployed
when interviewed in one year is employed when interviewed two years later? How have
these probabilities changed over time? How do trends in employment security differ for
workers classified by education and race?
We analyze longitudinal data from the Panel Study of Income Dynamics (PSID) for
the period from 1968 through 2003. We compare the risk of unemployment for employed
male household heads classified by age (20-30, 31-40, 41-50, 51-62), educational
attainment (high school dropout, high school diploma, some college, college graduate), and
race (white, black). We focus on transitions into and out of unemployment as
unemployment most frequently reflects involuntary job loss. We do not analyze
individuals who have exited from employment to being out of the labor force, because our
data do not distinguish between those who left jobs and the labor force for personal
reasons, such as to attend school or to retire early, and those who stopped looking for work
because they thought no jobs were available (discouraged workers). We find that younger,
less-educated, and minority male workers have a higher risk of unemployment at the end
of a two-year period, and also have a lower probability of returning to work after having
been unemployed.
The next section briefly reviews previous studies. Section III describes our data
and methods. Section IV presents our results and section V summarizes key findings.
II. Previous studies

3
Because Farber (2008) reviews the previous literature, we mention only studies that
are closely related to our analysis.2 Young workers usually work at a series of jobs after
completing their education. Topel and Ward (1992) estimate that a typical male holds
seven jobs in his first ten years in the labor market. Thus, we control for a worker’s age.
Fairlie and Kletzer (1998) document that black men were about 25 percent more likely to
experience job displacement than whites during the 1980s (4.8 vs. 3.8 percent per year). In
addition, black displaced workers were 30 percent less likely to be re-employed by the next
survey (44 vs. 61 percent). These differences can be attributed partly to the fact that black
men had on average completed fewer years of schooling than white men. Thus, we control
for racial and educational differences in estimating the risk of unemployment and the
likelihood that an unemployed worker returns to employment, and we also calculate the
risk of unemployment for separate race and education categories.
Business cycle fluctuations strongly affect the likelihood of job loss. After
accounting for business cycle fluctuations, Diebold, Neumark, and Polsky (1997) conclude
that job stability was roughly constant over the 1973 to 1991 period. However, job
retention rates fell for less-educated and African-American workers, relative to higher-
educated and white employees. We account for the business cycle by evaluating how the
risk of unemployment for various workers is affected by fluctuations in the national
unemployment rate and how this risk has varied during each of the last several decades to
see if there have been secular trends that are unrelated to cyclical fluctuations.
Our methodology draws heavily from that of two prior studies. Gottschalk and
Moffitt (1999) analyze three measures of job insecurity: the probability that a job ends

4
involuntarily, the probability of starting a spell of non-employment (either becoming
unemployed or leaving the labor force) conditional on involuntary job loss, and the
probability that the subsequent job has lower wages than the involuntarily terminated job.
They find that all three probabilities were generally unchanged from the early 1980s
through the mid-1990s. Valletta (1999) finds that between 1976 and 1991, the annual
likelihood of involuntary dismissals increased from 4.1 to 5.5 percent for men, with the
unemployment rate being the strongest predictor of dismissals, and that higher job tenure
and higher wages are negatively related to the probability of job loss.3
Building on these studies, we estimate the effects of business cycles, differences
across decades, and demographic characteristics on the likelihood that a man working at
one interview is unemployed when interviewed two years later and that an unemployed
worker in one year has returned to work two years later. Our study period is longer than
those of other authors. We estimate both unemployment and re-employment probabilities,
and examine how these probabilities and the factors that influence them vary by race, age,
and educational attainment.
III. Data and Methods
The Panel Study of Income Dynamics (PSID) has followed the same individuals
from 1968 to the present. In each year, our sample includes male household heads
between the ages of 20 and 62 who are not students and who have valid race, gender, and
education information. The PSID gathers the employment information we use only from
household heads, which means that a young adult living with his parents is not a PSID
head and is not included. We analyze the risk of unemployment over the period from 1968

5
to 2003, using all 35 years of the panel data, and extending the results of recent studies
through the economic boom of the 1990s and the period of slow economic growth
following the 2001 recession.4
We define unemployment risk as the likelihood that an individual who is employed
at one PSID interview is unemployed at the interview two years later. For any year t, our
sample consists of men who worked at the time t-2 interview. We define a man as having
exited from employment to unemployment if he was not working but was searching for a
job at the time t interview. We define a man as having exited from unemployment to
employment if he was unemployed at the time t-2 interview but was working when
interviewed at time t.5
We now describe trends in employment and unemployment for workers classified
by education and race. Then we estimate regressions that control for demographic
attributes, the business cycle, and secular trends (See, Valletta 1999).
IV. Results
a. Trends
Figure 3.1 shows the employment rate from 1968 through 2003 for male household
heads between the ages of 20 and 62, classified by educational attainment. The rate for
college graduates (top line) is about 95 percent for most years between 1968 and the early
1990s; the rate then declined to about 90 percent after 1994. The employment rates for
high school graduates and those with some college (the second and third lines) follow
roughly the same pattern, although the long-run decline is somewhat greater. About 95
6
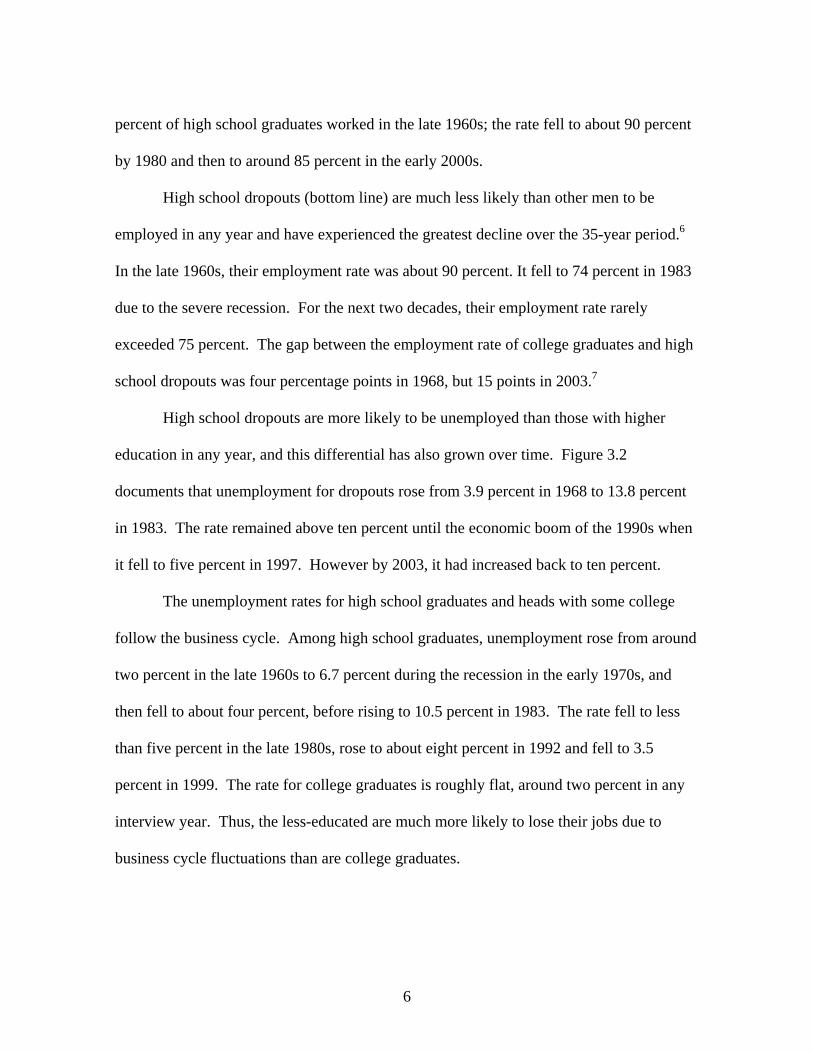
percent of high school graduates worked in the late 1960s; the rate fell to about 90 percent
by 1980 and then to around 85 percent in the early 2000s.
High school dropouts (bottom line) are much less likely than other men to be
employed in any year and have experienced the greatest decline over the 35-year period.6
In the late 1960s, their employment rate was about 90 percent. It fell to 74 percent in 1983
due to the severe recession. For the next two decades, their employment rate rarely
exceeded 75 percent. The gap between the employment rate of college graduates and high
school dropouts was four percentage points in 1968, but 15 points in 2003.7
High school dropouts are more likely to be unemployed than those with higher
education in any year, and this differential has also grown over time. Figure 3.2
documents that unemployment for dropouts rose from 3.9 percent in 1968 to 13.8 percent
in 1983. The rate remained above ten percent until the economic boom of the 1990s when
it fell to five percent in 1997. However by 2003, it had increased back to ten percent.
The unemployment rates for high school graduates and heads with some college
follow the business cycle. Among high school graduates, unemployment rose from around
two percent in the late 1960s to 6.7 percent during the recession in the early 1970s, and
then fell to about four percent, before rising to 10.5 percent in 1983. The rate fell to less
than five percent in the late 1980s, rose to about eight percent in 1992 and fell to 3.5
percent in 1999. The rate for college graduates is roughly flat, around two percent in any
interview year. Thus, the less-educated are much more likely to lose their jobs due to
business cycle fluctuations than are college graduates.

7
Figure 3.3 shows the employment rate separately for African-American and white
men. The sharp decline in employment over the 35-year period for blacks is similar to that
for all high school dropouts. In the late 1960s, black and white males were employed at
similar rates (88 and 92 percent in 1969, respectively). The racial gap widened to nine
percentage points by 1979 (84 vs. 93 percent) and to 13 points by 1983 (76 vs. 87 percent)
before narrowing during the 1990s boom. In 2003, only 77 percent of black male
household heads and 86 percent of whites were employed. As shown below, educational
attainment differences contribute to this racial employment gap.
The unemployment rate for African-American men exceeds that for whites (Figure
3.4). While both series show cyclical patterns, black men are more likely to lose their jobs
during economic downturns. The unemployment rate spiked for blacks in the mid-1970s,
early 1980s, and early 1990s. Between 1979 and 1983, the unemployment rose from 7.7 to
15.4 percent for blacks and from 1.7 to 6.2 percent for whites. Between 1997 and 2003,
the white rate increased from 2.1 to 3.7 percent, whereas the black rate increased from 5.7
to 9.4 percent. These data include only household heads who have lower unemployment
rates than other men; also, men between the ages of 20 and 62 have lower rates than those
of younger and older men.
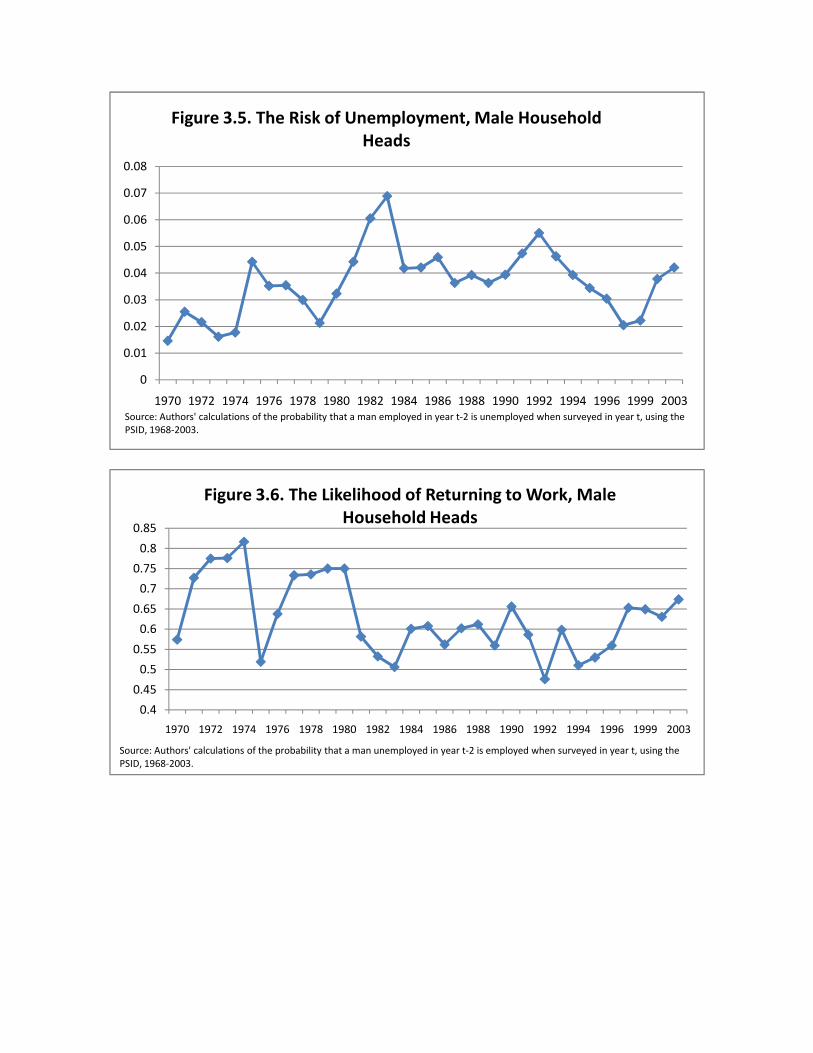
Figure 3.5 takes advantage of the panel nature of the PSID data and shows the
probability that a male employed at the year t-2 interview was unemployed at the year t
interview. This risk of unemployment was highest in 1983—6.9 percent of men working
at the 1981 interview were out of work and searching for jobs when interviewed two years
later. This two-year exit probability fell to 3.6 percent in 1989, rose to 5.5 percent in 1992,

8
declined to 2.2 percent in 1999 and then increased to 4.2 percent in 2003. The pattern from
the early 1980s to the mid-1990s is consistent with changes in the national unemployment
rate over the business cycle.
Figure 3.6 shows the probability that an unemployed worker at the t-2 interview
was working at the year t interview. The exit from unemployment to employment is
highest in good economic times--the early 1970s, late 1970s, and late 1990s. Among men
unemployed in 1981, 50 percent were employed in 1983; in contrast, among men
unemployed in 1997, 65 percent had returned to work in 1999. The upward trend in recent
years, despite the increased risk of unemployment shown in Figure 3.5, indicates that the
effects of the 2001 recession on the likelihood of re-employment were relatively modest.
Unemployed workers have a harder time finding jobs now than in the late 1970s, but have
an easier time than in the 1980s and early 1990s.
Regression analysis allows us to identify how age, race, educational attainment,
and the business cycle affect the risk of unemployment and the probability that the
unemployed return to work that are shown in Figures 3.5 and 3.6. The regression
coefficients shown in the tables below represent deviations from a baseline exit
probability. The baseline worker is defined as a white male college graduate between the
ages of 51-62 in the early 2000s. A coefficient greater than one indicates that a man with
different attributes (e.g., race or age or education) is more likely to experience an exit than
a man with the baseline attributes; a coefficient less than one indicates that the man is less
likely to exit.8
b. Regression Results
9
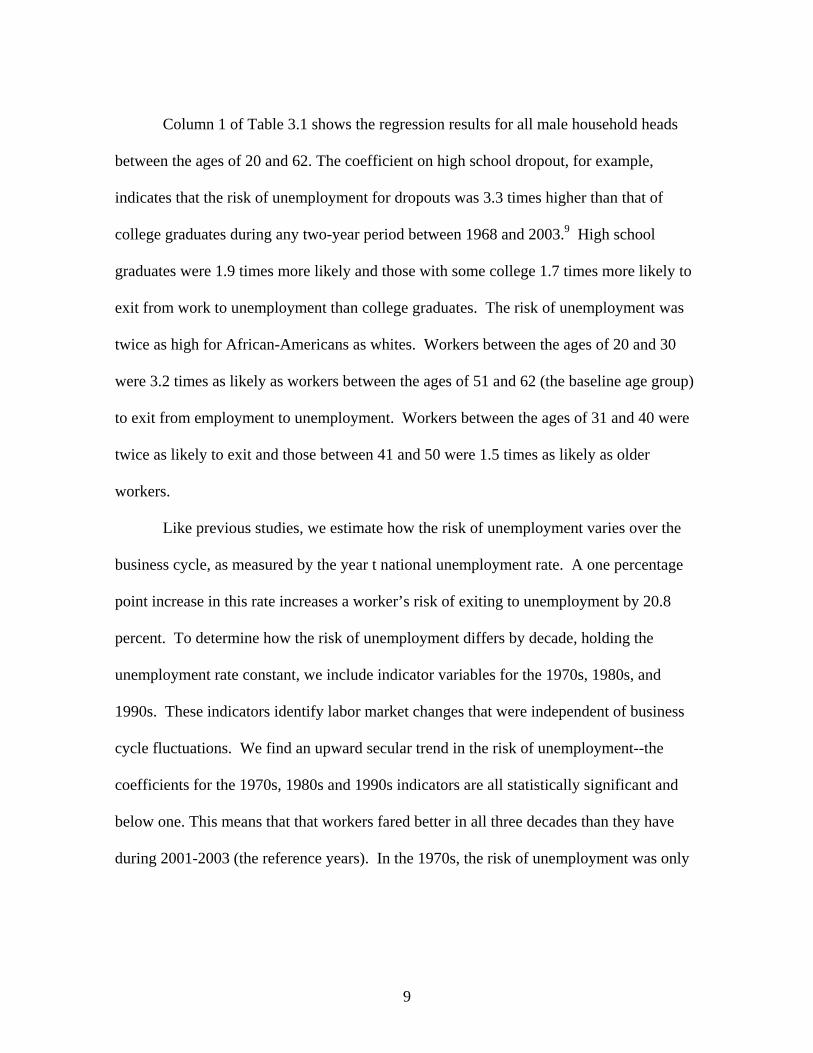
Column 1 of Table 3.1 shows the regression results for all male household heads
between the ages of 20 and 62. The coefficient on high school dropout, for example,
indicates that the risk of unemployment for dropouts was 3.3 times higher than that of
college graduates during any two-year period between 1968 and 2003.9 High school
graduates were 1.9 times more likely and those with some college 1.7 times more likely to
exit from work to unemployment than college graduates. The risk of unemployment was
twice as high for African-Americans as whites. Workers between the ages of 20 and 30
were 3.2 times as likely as workers between the ages of 51 and 62 (the baseline age group)
to exit from employment to unemployment. Workers between the ages of 31 and 40 were
twice as likely to exit and those between 41 and 50 were 1.5 times as likely as older
workers.
Like previous studies, we estimate how the risk of unemployment varies over the
business cycle, as measured by the year t national unemployment rate. A one percentage
point increase in this rate increases a worker’s risk of exiting to unemployment by 20.8
percent. To determine how the risk of unemployment differs by decade, holding the
unemployment rate constant, we include indicator variables for the 1970s, 1980s, and
1990s. These indicators identify labor market changes that were independent of business
cycle fluctuations. We find an upward secular trend in the risk of unemployment--the
coefficients for the 1970s, 1980s and 1990s indicators are all statistically significant and
below one. This means that that workers fared better in all three decades than they have
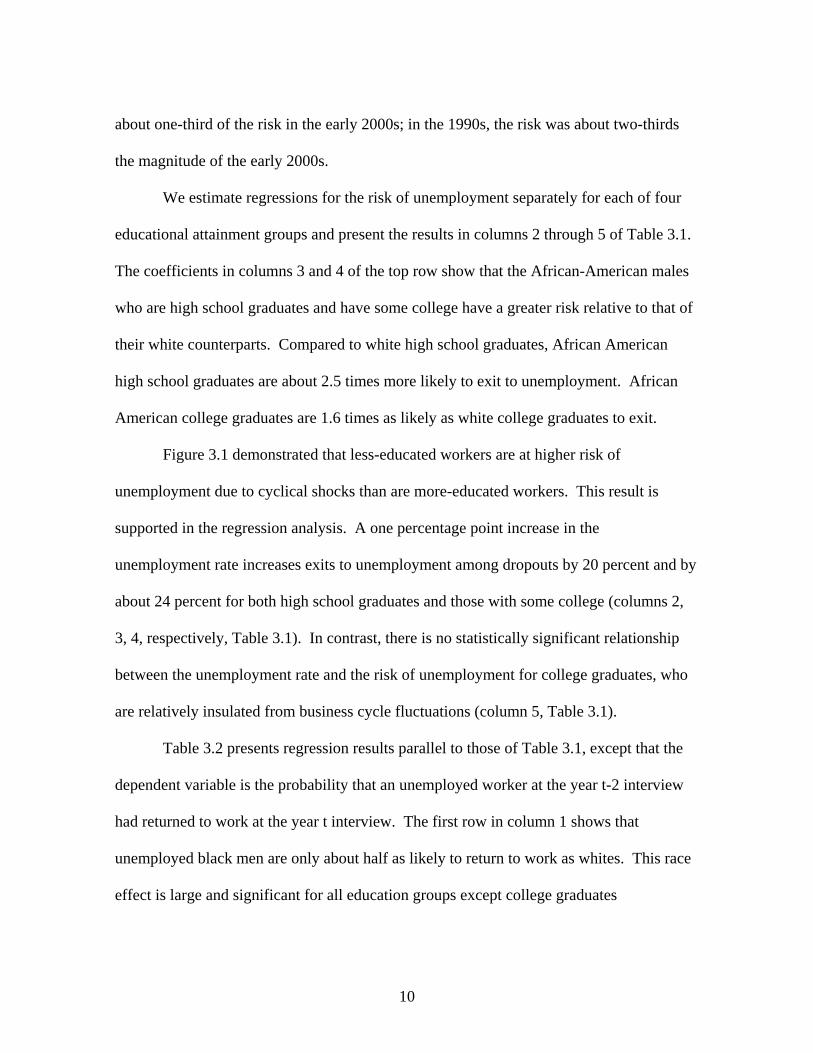
during 2001-2003 (the reference years). In the 1970s, the risk of unemployment was only
10
about one-third of the risk in the early 2000s; in the 1990s, the risk was about two-thirds
the magnitude of the early 2000s.
We estimate regressions for the risk of unemployment separately for each of four
educational attainment groups and present the results in columns 2 through 5 of Table 3.1.
The coefficients in columns 3 and 4 of the top row show that the African-American males
who are high school graduates and have some college have a greater risk relative to that of
their white counterparts. Compared to white high school graduates, African American
high school graduates are about 2.5 times more likely to exit to unemployment. African
American college graduates are 1.6 times as likely as white college graduates to exit.
Figure 3.1 demonstrated that less-educated workers are at higher risk of
unemployment due to cyclical shocks than are more-educated workers. This result is
supported in the regression analysis. A one percentage point increase in the
unemployment rate increases exits to unemployment among dropouts by 20 percent and by
about 24 percent for both high school graduates and those with some college (columns 2,
3, 4, respectively, Table 3.1). In contrast, there is no statistically significant relationship
between the unemployment rate and the risk of unemployment for college graduates, who
are relatively insulated from business cycle fluctuations (column 5, Table 3.1).
Table 3.2 presents regression results parallel to those of Table 3.1, except that the
dependent variable is the probability that an unemployed worker at the year t-2 interview
had returned to work at the year t interview. The first row in column 1 shows that
unemployed black men are only about half as likely to return to work as whites. This race
effect is large and significant for all education groups except college graduates

11
(coefficients are below 1.0 and significant in columns 2 through 4, but about 1.0 and not
significant in column 5). Thus, holding education constant, black workers have a higher
risk of unemployment than white workers (Table 3.1), and, except for college graduates,
are also less likely to find a new job after having lost one (Table 3.2).
Workers between the ages of 20 and 30 are 3.2 times more likely to lose a job than
51 to 62 year olds (Table 3.1, column 1), but are 1.5 times more likely to return to work
after experiencing unemployment (Table 3.2, column 1). Older unemployed workers may
pursue new jobs less aggressively, whether because they have access to early retirement
benefits or disability benefits or because they are more disillusioned about their
employment prospects.
A one percentage point increase in the national unemployment rate is associated
with a 10 percent decline in the likelihood that an unemployed man returns to work (0.906,
column 1). This business cycle effect is concentrated among high school dropouts and
those who have completed some college (significant coefficients in columns 2 and 4). The
probability that unemployed college graduates return to work does not vary significantly
with the unemployment rate.
Unemployed workers in the 1970s were about 70 percent more likely to return to
work two years later than were unemployed workers in 2001-2003. Returns to work in the
1980s and 1990s were not significantly different than in the most recent years.
c. Variations in Predicted Exit Probabilities
We use the regression coefficients from a specification like the one shown in Table
3.1, but with separate regressions for whites and blacks, to estimate predicted probabilities
12
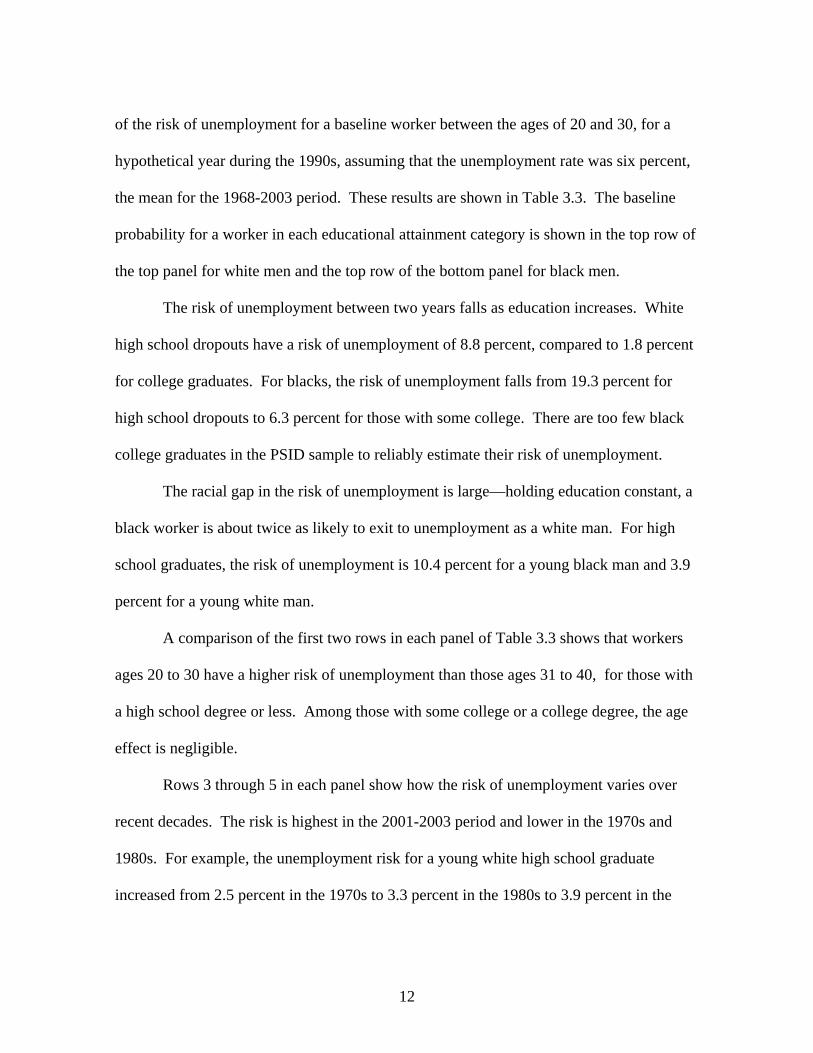
of the risk of unemployment for a baseline worker between the ages of 20 and 30, for a
hypothetical year during the 1990s, assuming that the unemployment rate was six percent,
the mean for the 1968-2003 period. These results are shown in Table 3.3. The baseline
probability for a worker in each educational attainment category is shown in the top row of
the top panel for white men and the top row of the bottom panel for black men.
The risk of unemployment between two years falls as education increases. White
high school dropouts have a risk of unemployment of 8.8 percent, compared to 1.8 percent
for college graduates. For blacks, the risk of unemployment falls from 19.3 percent for
high school dropouts to 6.3 percent for those with some college. There are too few black
college graduates in the PSID sample to reliably estimate their risk of unemployment.
The racial gap in the risk of unemployment is large—holding education constant, a
black worker is about twice as likely to exit to unemployment as a white man. For high
school graduates, the risk of unemployment is 10.4 percent for a young black man and 3.9
percent for a young white man.
A comparison of the first two rows in each panel of Table 3.3 shows that workers
ages 20 to 30 have a higher risk of unemployment than those ages 31 to 40, for those with
a high school degree or less. Among those with some college or a college degree, the age
effect is negligible.
Rows 3 through 5 in each panel show how the risk of unemployment varies over
recent decades. The risk is highest in the 2001-2003 period and lower in the 1970s and
1980s. For example, the unemployment risk for a young white high school graduate
increased from 2.5 percent in the 1970s to 3.3 percent in the 1980s to 3.9 percent in the

13
1990s to 4.1 percent in the recent period. For a young black high school graduate, the
unemployment risk over these periods rose from 7.3 to 9.5 to 10.4 to 22.5 percent.
The bottom two rows in each panel of Table 3.3 document that there are large
business cycle effects for less-educated workers. An increase in the national
unemployment rate from 3.5 to 9.7 percent--the best and worst rates over the 35-year study
period--raises the risk of unemployment from 1.9 to 8.9 percent for white high school
graduates and from 6.5 to 17.7 percent for black high school graduates.
In Table 3.4, we use regression coefficients like those in Table 3.2, but estimated
separately for white and black men, to compute predicted probabilities of exiting from
unemployment back into employment. The baseline worker is again a male household
head between the ages of 20 and 30 in the 1990s, evaluated at the mean unemployment rate
over the study period. Larger numbers represent better outcomes, indicating the likelihood
that a worker who was unemployed at the interview two years ago was working at the
current interview.
The most educated are much more likely to return to work than the least educated.
For example, 88.8 percent of unemployed white college graduates return to work compared
to 68.5 percent of high school graduates. About two-thirds of unemployed blacks with
some college, but only 39.6 percent of black high school dropouts returned to work.
The racial gap in returning to work is large among those with a high school degree
or less. Unemployed white high school graduates are 20 percentage points more likely to
get a new job than blacks high school graduates—77.2 compared to 57.3 percent.
14
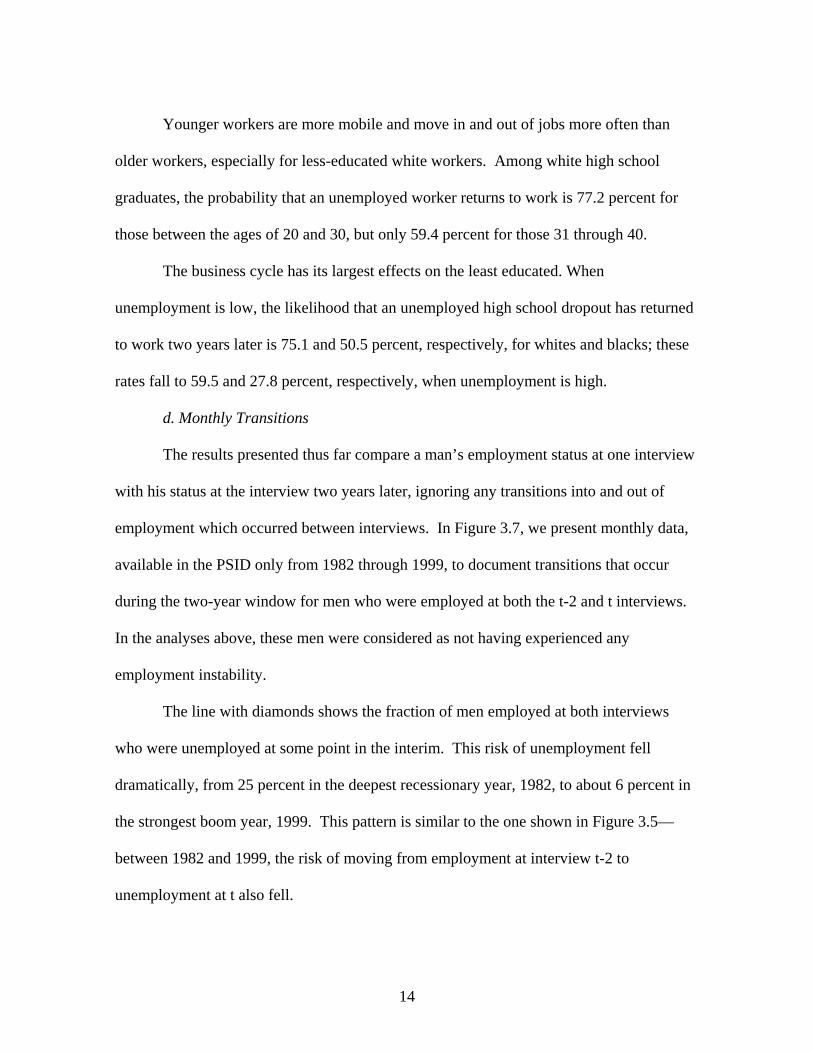
Younger workers are more mobile and move in and out of jobs more often than
older workers, especially for less-educated white workers. Among white high school
graduates, the probability that an unemployed worker returns to work is 77.2 percent for
those between the ages of 20 and 30, but only 59.4 percent for those 31 through 40.
The business cycle has its largest effects on the least educated. When
unemployment is low, the likelihood that an unemployed high school dropout has returned
to work two years later is 75.1 and 50.5 percent, respectively, for whites and blacks; these
rates fall to 59.5 and 27.8 percent, respectively, when unemployment is high.
d. Monthly Transitions
The results presented thus far compare a man’s employment status at one interview
with his status at the interview two years later, ignoring any transitions into and out of
employment which occurred between interviews. In Figure 3.7, we present monthly data,
available in the PSID only from 1982 through 1999, to document transitions that occur
during the two-year window for men who were employed at both the t-2 and t interviews.
In the analyses above, these men were considered as not having experienced any
employment instability.
The line with diamonds shows the fraction of men employed at both interviews
who were unemployed at some point in the interim. This risk of unemployment fell
dramatically, from 25 percent in the deepest recessionary year, 1982, to about 6 percent in
the strongest boom year, 1999. This pattern is similar to the one shown in Figure 3.5—
between 1982 and 1999, the risk of moving from employment at interview t-2 to
unemployment at t also fell.

15
The line with squares in Figure 3.7 shows the fraction of men who switched
employers during the two years between interviews without experiencing any
unemployment. The fraction who switched jobs increased from about eight percent over a
two-year period in the early 1980s to about 15 percent in 1999. These results reflect the
business cycle and are consistent with the declines in tenure with a single employer
documented by Farber (2007).10
When we estimate regressions using the 1982-1999 monthly data (not shown), the
results are similar to those reported in Table 3.1. The risk of experiencing any month of
unemployment during a two-year period is higher for African Americans, for those with
less education, and for younger workers.
V. Summary
We have analyzed changes in the risk of unemployment and the likelihood that the
unemployed return to work using 35 years of panel data and documented that the labor
market prospects of the disadvantaged worsened relative to those of more advantaged
workers. Differences in trends in the employment rate and unemployment rate of low-
skilled and minority household heads are large. Among male heads of household between
the ages of 20 and 62, the gap between the employment rate of college graduates and that
of high school dropouts was four percentage points in 1968, but rose to 15 points in 2003.
The racial employment gap also increased over these years from two to nine percentage
points.
The risk of unemployment is higher for less-educated and black workers than for
college graduates and white workers. The risk of unemployment rises and falls as the

16
economy moves into and out of recessions. However, the risk, holding the unemployment
rate constant, has increased in each decade from the 1970s to the present. Less-educated
and minority workers face a dual disadvantage in the labor market: they are more likely to
lose a job and, at any unemployment rate, are less likely to find a new one.
17
References Rebecca M. Blank, Sheldon Danziger and Robert Schoeni, “Work and Poverty During
the Past Quarter Century,” in Working and Poor: How Economic and Policy Changes are Affecting Low-Wage Workers, ed. Rebecca M. Blank, Sheldon
Danziger and Robert Schoeni (New York: Russell Sage Foundation, 2006): 1-20. Johanne Boisjoly, Greg J. Duncan, and Timothy Smeeding, “The Shifting Incidence of
Involuntary Job Losses from 1968 to 1992,” Industrial Relations 37(2) (1998): 207-231. Francis X. Diebold, David Neumark, and Daniel Polsky, “Job Stability in the United
States,” Journal of Labor Economics 15(2) (1997): 206-233. Robert W. Fairlie and Lori G. Kletzer, “Jobs Lost, Jobs Regained: An Analysis of
Black/White Differences in Job Displacement in the 1980s,” Industrial Relations 37(4) (1998): 460-477.
Henry S. Farber, “Mobility and Stability: The Dynamics of Job Change in Labor
Markets,” in Handbook of Labor Economics, Vol. 3, ed. Orley Ashenfelter and David Card (London: Elsevier Press, 1999), 2439-2483.
Henry S. Farber, “Employment Insecurity: The Decline in Worker-Firm Attachment in the United States,” in K. Newman, ed. This Volume (2008). Richard B. Freeman, America Works: Critical Thoughts on the Exceptional U.S. Labor
Market (New York: Russell Sage Foundation, 2007). Peter Gottschalk and Robert Moffitt, “Changes in Job Instability and Insecurity Using
Monthly Survey Data,” Journal of Labor Economics 17(4) (1999): S91-S126. David Neumark, ed., On the Job: Is Long-Term Employment a Thing of the Past? (New
York: Russell Sage Foundation, 2000). Robert H. Topel and Michael P. Ward, “Job Mobility and the Careers of Young Men,”
Quarterly Journal of Economics 107(2) (1992): 439-479. Robert G. Valletta, “Declining Job Security,” Journal of Labor Economics 17(4) (1999): S170-S197.

18
1 Benjamin J. Keys is a doctoral student in economics and Sheldon Danziger is the H. J.
Meyer Distinguished University Professor of Public Policy and co-director of the National
Poverty Center at the Gerald R. Ford School of Public Policy, University of Michigan.
Rebecca Blank, Charles Brown, Brian Cadena, Peter Gottschalk, Katherine Newman,
Robert Schoeni, and an anonymous referee provided helpful comments on a prior draft;
David Ratner provided excellent research assistance. This project was supported in part by
funds provided by the U.S. Department of Health and Human Services, Office of the
Assistant Secretary for Planning and Evaluation, #5 U01 PE000001-05 and #1 U01
AE000002-01. Any opinions and conclusions expressed are solely those of the authors
and should not be construed as representing opinions or policy of any agency of the
Federal government.
2 Neumark (2000) and Farber (1999) also summarize related studies of employment
security.
3 See, Boisjoly et al. (1998) for analysis of patterns of involuntary job loss in the PSID.
4 Interviews were conducted annually between 1968 and 1997 and biennially after that
date. As a result, we analyze the change in employment status over two-year periods
between 1968 and 2003.
5 We do not evaluate work experiences between interviews. That is, some men who
worked at both the t-2 and t interviews, were unemployed at some time between these
interviews, but are not counted as having exited to unemployment by our interview-to-
interview method. For selected years, one can evaluate employment histories between

19
interviews (Gottschalk and Moffitt 1999). For these years, we present results which are
similar to the interview-to-interview results we discuss in Section IV. d.
6 Our sample includes men who are between the ages of 20 and 62 in each year. Thus, in
each year of the 35-year study period, men who were 19 in the previous year enter the
sample and those who were 62 age out of the sample. Because the new entrants have
completed more years of schooling than the older workers exiting the sample, the average
education of the sample and of the workforce increases over time. For example, high
school dropouts were 39 percent of our sample in 1968, but only 13 percent in 2003;
college graduates increased from 15 to 29 percent of the sample over these years. Thus,
while we document that the relative risk of unemployment has increased more for high
school dropouts than for more-educated workers, the reader should note that dropouts now
represent a much smaller share of the workforce than they did in 1968.
7 These male employment rate trends in the PSID are similar to those in the Current
Population Survey. For example, between 1970 and 1999, among white men between the
ages of 25 and 54, the employment rate fell by 17 percentage points for high school
dropouts and by 5 points for men with at least a high school degree, but not a college
degree (Data not shown; provided to the authors by Deborah Reed, Public Policy Institute
of California).
8 We estimate logistic regressions for male household heads in which the dependent
variable is 1 if a worker at the time of the t-2 interview was unemployed when interviewed
two years later. Coefficients are presented as log-odds ratios.
9 The first (t-2) year in the PSID is 1968, so the first t year in the tables is 1970.

20
10 We have estimated regression models similar to those in Tables 3.1 and 3.2 that utilize
the monthly work history data that are available for the 1982-1999 period. Results are
available on request from the authors.
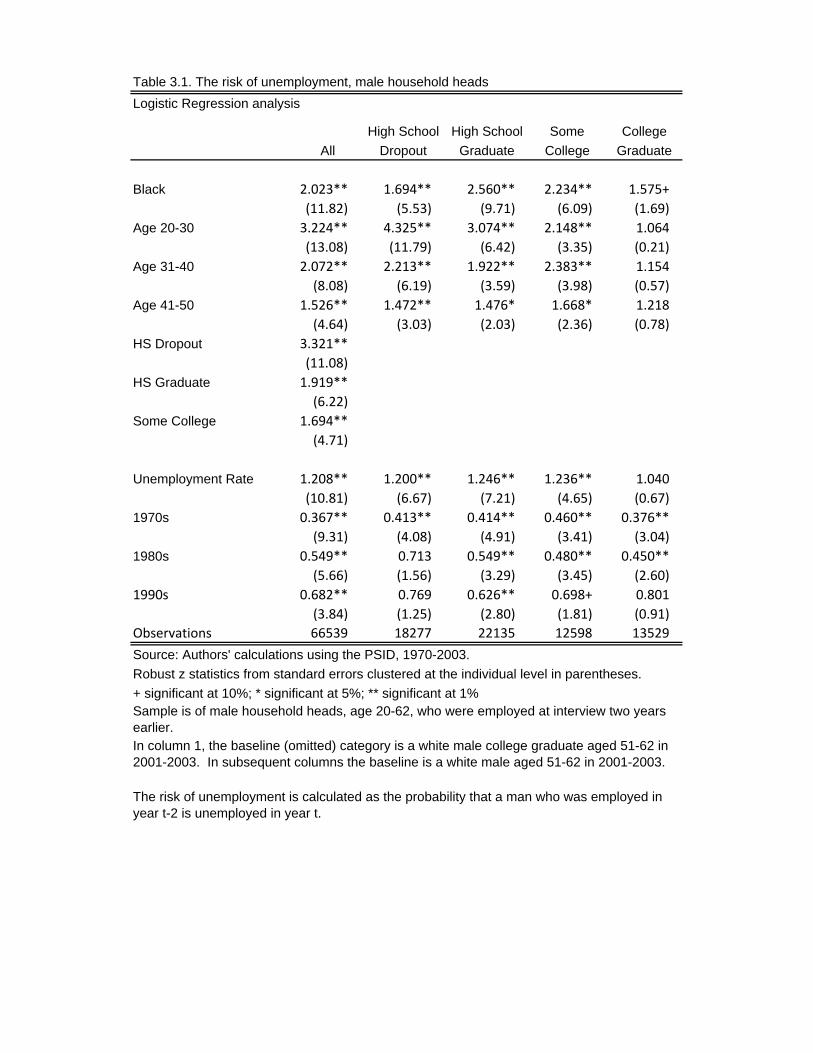
Table 3.1. The risk of unemployment, male household headsLogistic Regression analysis
High School High School Some CollegeAll Dropout Graduate College Graduate
Black 2.023** 1.694** 2.560** 2.234** 1.575+(11.82) (5.53) (9.71) (6.09) (1.69)
Age 20-30 3.224** 4.325** 3.074** 2.148** 1.064(13.08) (11.79) (6.42) (3.35) (0.21)
Age 31-40 2.072** 2.213** 1.922** 2.383** 1.154(8.08) (6.19) (3.59) (3.98) (0.57)
Age 41-50 1.526** 1.472** 1.476* 1.668* 1.218(4.64) (3.03) (2.03) (2.36) (0.78)
HS Dropout 3.321**(11.08)
HS Graduate 1.919**(6.22)
Some College 1.694**(4.71)
Unemployment Rate 1.208** 1.200** 1.246** 1.236** 1.040(10.81) (6.67) (7.21) (4.65) (0.67)
1970s 0.367** 0.413** 0.414** 0.460** 0.376**(9.31) (4.08) (4.91) (3.41) (3.04)
1980s 0.549** 0.713 0.549** 0.480** 0.450**(5.66) (1.56) (3.29) (3.45) (2.60)
1990s 0.682** 0.769 0.626** 0.698+ 0.801(3.84) (1.25) (2.80) (1.81) (0.91)
Observations 66539 18277 22135 12598 13529
Source: Authors' calculations using the PSID, 1970-2003.Robust z statistics from standard errors clustered at the individual level in parentheses.+ significant at 10%; * significant at 5%; ** significant at 1%
In column 1, the baseline (omitted) category is a white male college graduate aged 51-62 in 2001-2003. In subsequent columns the baseline is a white male aged 51-62 in 2001-2003.
Sample is of male household heads, age 20-62, who were employed at interview two years earlier.
The risk of unemployment is calculated as the probability that a man who was employed in year t-2 is unemployed in year t.

Table 3.2. The likelihood of returning to work, male household headsLogistic Regression analysis
High School High School Some CollegeAll Dropout Graduate College Graduate
Black 0.483** 0.445** 0.542** 0.376** 1.047(7.70) (5.73) (3.94) (3.98) (0.09)
Age 20-30 1.510** 1.353 1.700* 1.319 3.539+(2.91) (1.64) (2.04) (0.66) (1.74)
Age 31-40 1.161 1.055 1.128 1.306 2.199(1.02) (0.27) (0.45) (0.67) (1.25)
Age 41-50 1.081 1.404 0.892 1.104 0.694(0.46) (1.49) (0.40) (0.23) (0.55)
HS Dropout 0.436**(3.26)
HS Graduate 0.576*(2.16)
Some College 0.752(1.05)
Unemployment Rate 0.906** 0.864** 0.968 0.860+ 1.046(3.06) (3.10) (0.57) (1.76) (0.31)
1970s 1.720** 1.828+ 1.441 2.492 1.122(2.60) (1.68) (1.04) (1.64) (0.16)
1980s 1.056 1.411 0.715 1.124 0.920(0.26) (0.97) (1.00) (0.25) (0.12)
1990s 0.840 0.864 0.706 1.209 1.109(0.91) (0.42) (1.09) (0.41) (0.20)
Observations 3714 1658 1222 558 276Source: Authors' calculations using the PSID, 1970-2003.Robust z statistics from standard errors clustered at the individual level in parentheses.+ significant at 10%; * significant at 5%; ** significant at 1%
In column 1, the baseline (omitted) category is a white male college graduate aged 51-62 in 2001-2003. In subsequent columns the baseline is a white male aged 51-62 in 2001-2003.
Sample is of male household heads, age 20-62, who were unemployed at interview two years earlier.
The likelihood of returning to work is calculated as the probability that a man who was unemployed in year t-2 is employed in year t.

Table 3.3. Predicted Risk of Unemployment, Male household heads
High School High School Some CollegeDropout Graduate College Graduate
White male Baseline: Baseline 8.8 3.9 3.3 1.8 Age 31-40 5.2 2.6 3.8 1.8 1970s 5.4 2.5 1.9 1.0 1980s 7.5 3.3 2.5 1.3 2001-2003 12.9 4.1 4.0 2.3 Minimum unemployment (3.5) 4.4 1.9 2.3 1.6 Maximum unemployment (9.7) 18.9 8.9 5.1 2.0
Black male baseline: Baseline 19.3 10.4 6.3 * Age 31-40 9.9 6.4 6.8 * 1970s 10.3 7.3 5.9 * 1980s 18.7 9.5 3.9 * 2001-2003 21.0 22.5 11.0 * Minimum unemployment (3.5) 14.7 6.5 2.5 * Maximum unemployment (9.7) 26.1 17.7 17.5 *Source: Authors' calculations using PSID, 1970-2003.
Baseline individual is a male head of household between the ages of 20-30, in the 1990s with the mean unemployment rate over the 1968-2003 period.
These use the specification from columns 2-5 of table 1 (estimated separately for whites and blacks) to predict exits to unemployment. Sample is restricted to male household heads, age 20-62, who were employed in the interview two years prior.
There are too few black college graduates in the PSID (38 per year) to make a meaningful prediction.
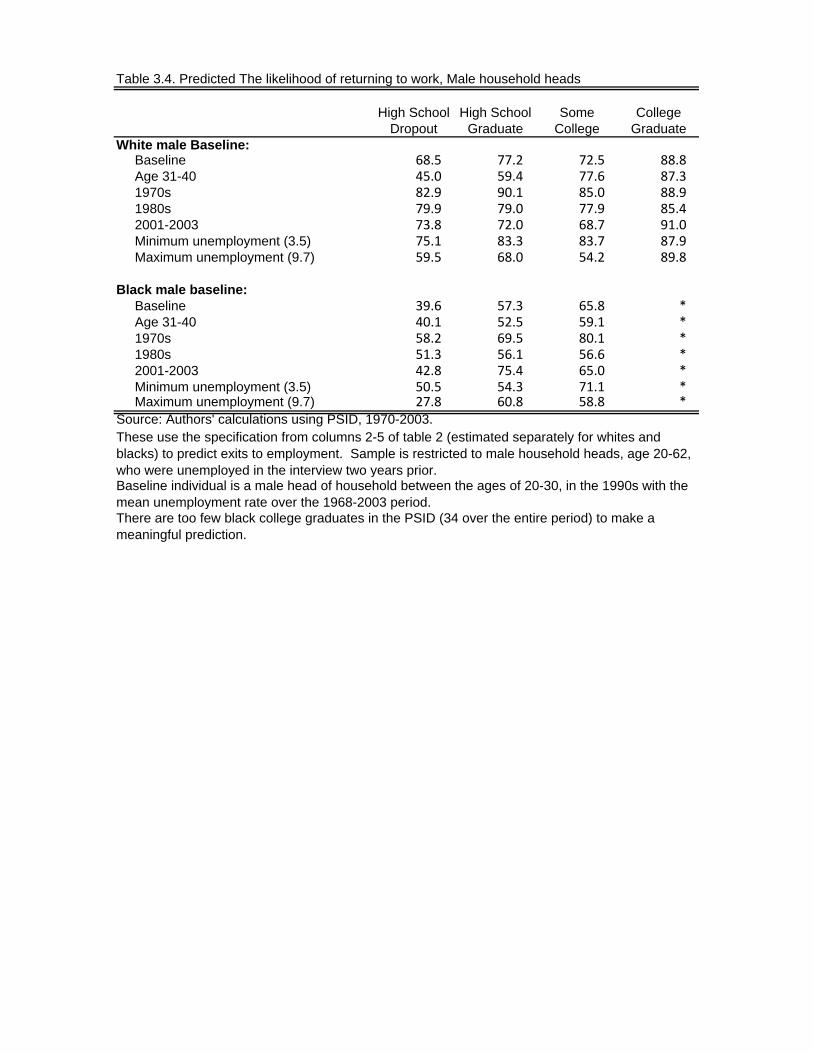
Table 3.4. Predicted The likelihood of returning to work, Male household heads
High School High School Some CollegeDropout Graduate College Graduate
White male Baseline: Baseline 68.5 77.2 72.5 88.8 Age 31-40 45.0 59.4 77.6 87.3 1970s 82.9 90.1 85.0 88.9 1980s 79.9 79.0 77.9 85.4 2001-2003 73.8 72.0 68.7 91.0 Minimum unemployment (3.5) 75.1 83.3 83.7 87.9 Maximum unemployment (9.7) 59.5 68.0 54.2 89.8
Black male baseline: Baseline 39.6 57.3 65.8 * Age 31-40 40.1 52.5 59.1 * 1970s 58.2 69.5 80.1 * 1980s 51.3 56.1 56.6 * 2001-2003 42.8 75.4 65.0 * Minimum unemployment (3.5) 50.5 54.3 71.1 * Maximum unemployment (9.7) 27.8 60.8 58.8 *Source: Authors' calculations using PSID, 1970-2003.These use the specification from columns 2-5 of table 2 (estimated separately for whites and blacks) to predict exits to employment. Sample is restricted to male household heads, age 20-62, who were unemployed in the interview two years prior.Baseline individual is a male head of household between the ages of 20-30, in the 1990s with the mean unemployment rate over the 1968-2003 period.There are too few black college graduates in the PSID (34 over the entire period) to make a meaningful prediction.

0.7
0.75
0.8
0.85
0.9
0.95
1
1968 1971 1974 1977 1980 1983 1986 1989 1992 1995 1999
Figure 3.1. Employment Rate of Male Household Heads, by Education
HS dropout
HS grad
Some college
College grad
Source: Authors' calculations using the PSID, 1968‐2003.
Figure 3.2. Unemployment Rate of Male Household Heads by Education
0
0.02
0.04
0.06
0.08
0.1
0.12
0.14
0.16
1968 1971 1974 1977 1980 1983 1986 1989 1992 1995 1999
Heads, by Education
HS dropout
HS grad
Some college
College grad
Source: Authors' calculations using the PSID, 1968‐2003.

0.7
0.75
0.8
0.85
0.9
0.95
1968 1971 1974 1977 1980 1983 1986 1989 1992 1995 1999
Figure 3.3. Employment Rate of Male Household Heads, by Race
White males
Black males
Source: Authors' calculations using the PSID, 1968‐2003.
Figure 3.4. Unemployment Rate of Male Household
0
0.02
0.04
0.06
0.08
0.1
0.12
0.14
0.16
0.18
1968 1971 1974 1977 1980 1983 1986 1989 1992 1995 1999
Heads, by Race
White males
Black males
Source: Authors' calculations using the PSID, 1968‐2003.
0
0.01
0.02
0.03
0.04
0.05
0.06
0.07
0.08
1970 1972 1974 1976 1978 1980 1982 1984 1986 1988 1990 1992 1994 1996 1999 2003
Figure 3.5. The Risk of Unemployment, Male Household Heads
Source: Authors' calculations of the probability that a man employed in year t‐2 is unemployed when surveyed in year t, using the PSID, 1968‐2003.
Figure 3 6 The Likelihood of Returning to Work Male
0.4
0.45
0.5
0.55
0.6
0.65
0.7
0.75
0.8
0.85
1970 1972 1974 1976 1978 1980 1982 1984 1986 1988 1990 1992 1994 1996 1999 2003
Figure 3.6. The Likelihood of Returning to Work, Male Household Heads
Source: Authors' calculations of the probability that a man unemployed in year t‐2 is employed when surveyed in year t, using the PSID, 1968‐2003.

0
0.05
0.1
0.15
0.2
0.25
0.3
1982 1984 1986 1988 1990 1992 1994 1996 1999
Figure 3.7. Likelihood of an unemployment spell or job switch among male household heads employed in both
year t‐2 and year t
Unemployment spell
Job switch
Source: Authors' calculations using the PSID, 1968‐2003.