Embed Size (px)
Citation preview

Strictly confidential
September 2014
Earnings Presentation
The road less travelled
1
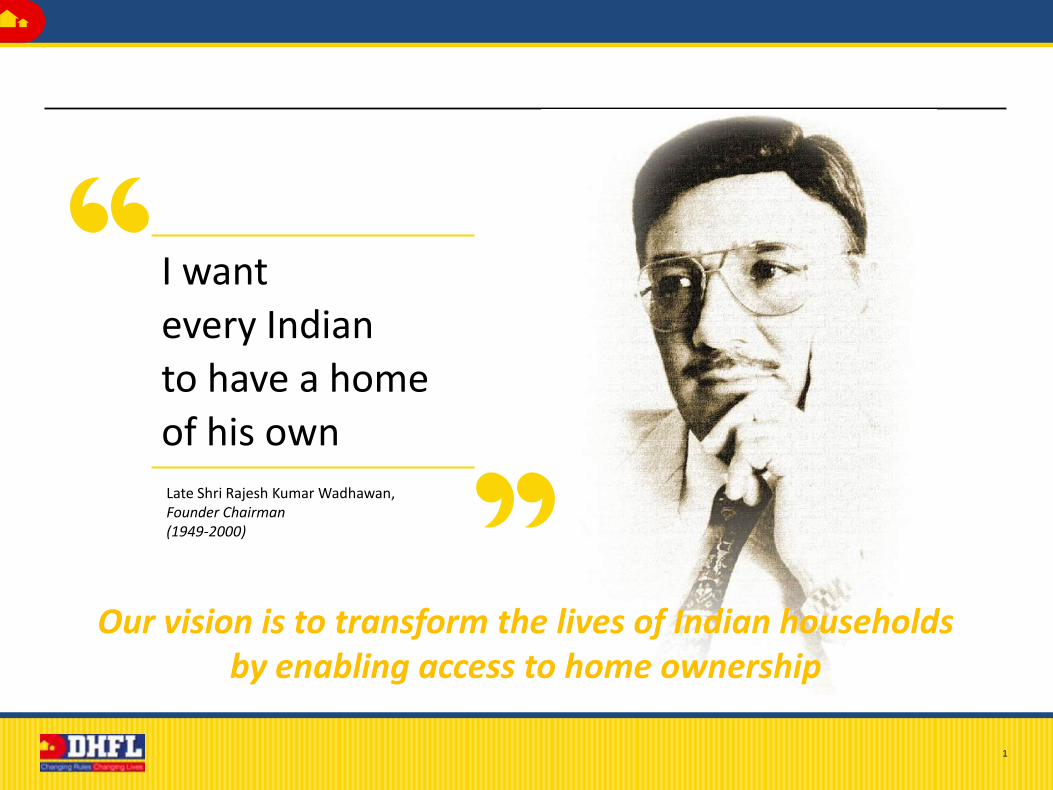
I want
every Indian
to have a home
of his ownLate Shri Rajesh Kumar Wadhawan,Founder Chairman(1949-2000)
Our vision is to transform the lives of Indian households by enabling access to home ownership
DHFL overview
Section 1
3
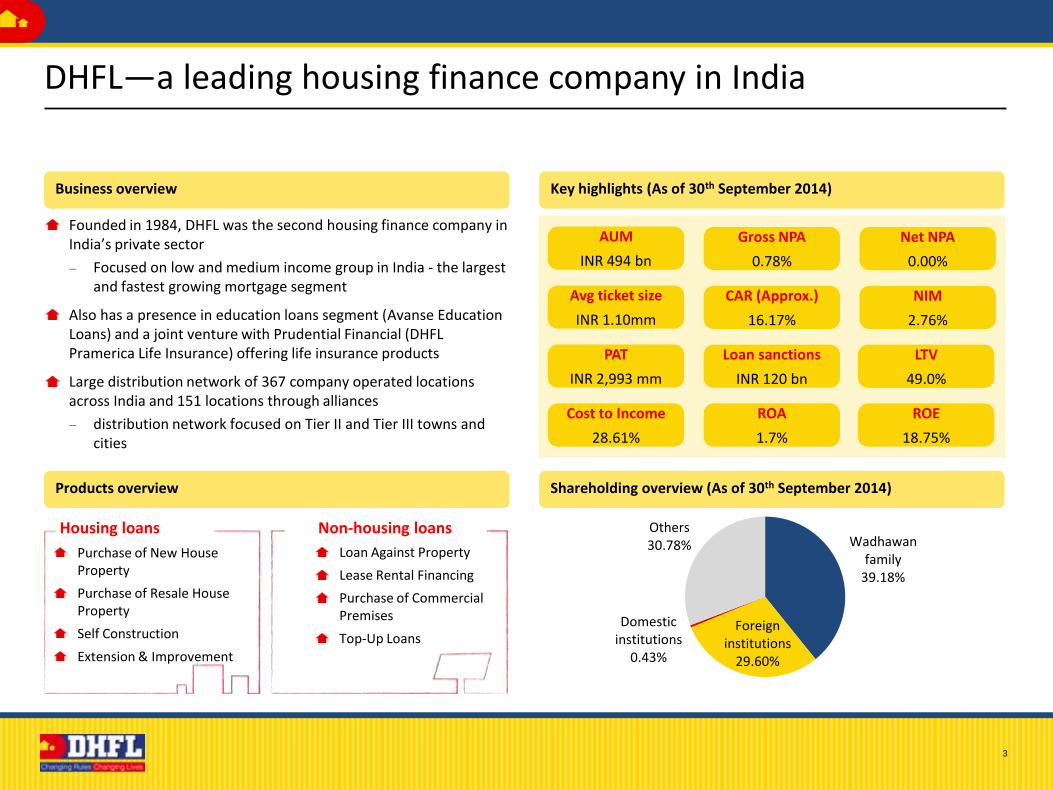
DHFL—a leading housing finance company in India
Key highlights (As of 30th September 2014)Business overview
Founded in 1984, DHFL was the second housing finance company in India’s private sector
– Focused on low and medium income group in India - the largest and fastest growing mortgage segment
Also has a presence in education loans segment (Avanse Education Loans) and a joint venture with Prudential Financial (DHFL Pramerica Life Insurance) offering life insurance products
Large distribution network of 367 company operated locations across India and 151 locations through alliances
– distribution network focused on Tier II and Tier III towns and cities
Products overview
Loan Against Property
Lease Rental Financing
Purchase of Commercial Premises
Top-Up Loans
Purchase of New House Property
Purchase of Resale House Property
Self Construction
Extension & Improvement
Housing loans Non-housing loans
AUM
INR 494 bn
Gross NPA
0.78%
Net NPA
0.00%
Avg ticket size
INR 1.10mm
CAR (Approx.)
16.17%
NIM
2.76%
PAT
INR 2,993 mm
Loan sanctions
INR 120 bn
LTV
49.0%
Cost to Income
28.61%
ROA
1.7%
ROE
18.75%
Shareholding overview (As of 30th September 2014)
Wadhawan family
39.18%
Foreign institutions
29.60%
Domestic institutions
0.43%
Others30.78%
4
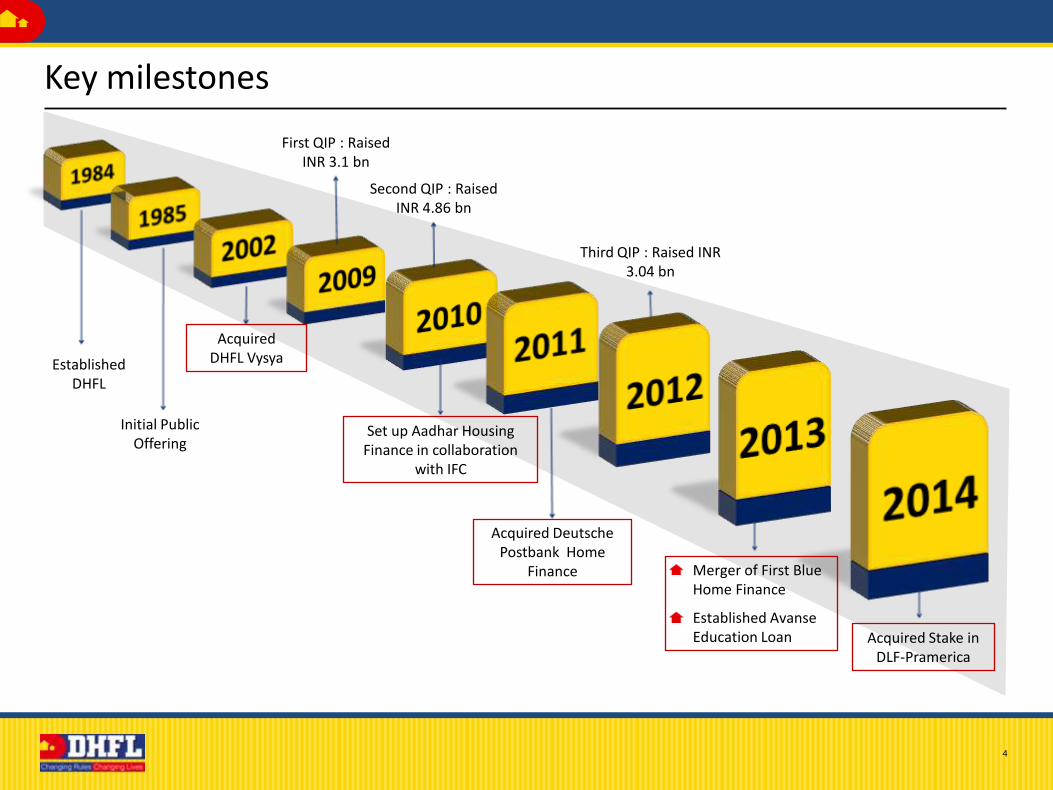
Key milestones
Established DHFL
Initial Public Offering
Acquired DHFL Vysya
First QIP : Raised INR 3.1 bn
Second QIP : Raised INR 4.86 bn
Set up Aadhar Housing Finance in collaboration
with IFC
Acquired Deutsche Postbank Home
Finance
Third QIP : Raised INR 3.04 bn
Merger of First Blue Home Finance
Established AvanseEducation Loan Acquired Stake in
DLF-Pramerica
Key company highlights
Section 2
6
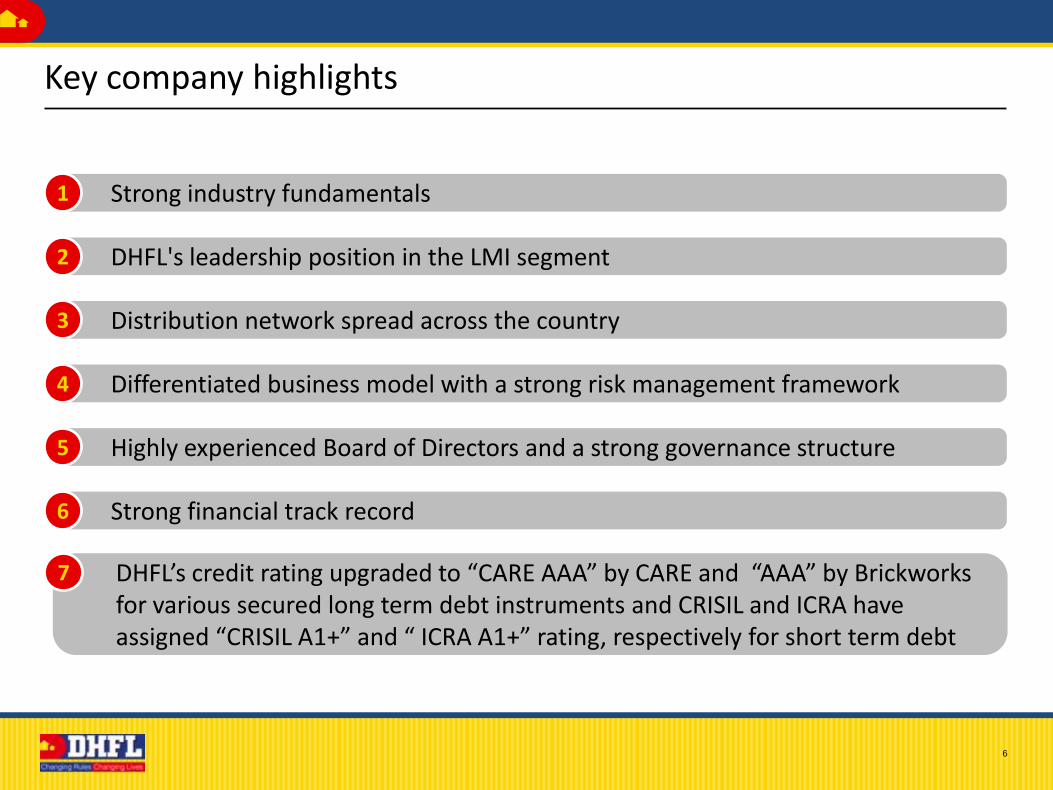
Key company highlights
• Strong industry fundamentals1
• DHFL's leadership position in the LMI segment2
• Distribution network spread across the country3
• Differentiated business model with a strong risk management framework4
• Highly experienced Board of Directors and a strong governance structure5
• Strong financial track record 6
• DHFL’s credit rating upgraded to “CARE AAA” by CARE and “AAA” by Brickworks for various secured long term debt instruments and CRISIL and ICRA have assigned “CRISIL A1+” and “ ICRA A1+” rating, respectively for short term debt
7
7
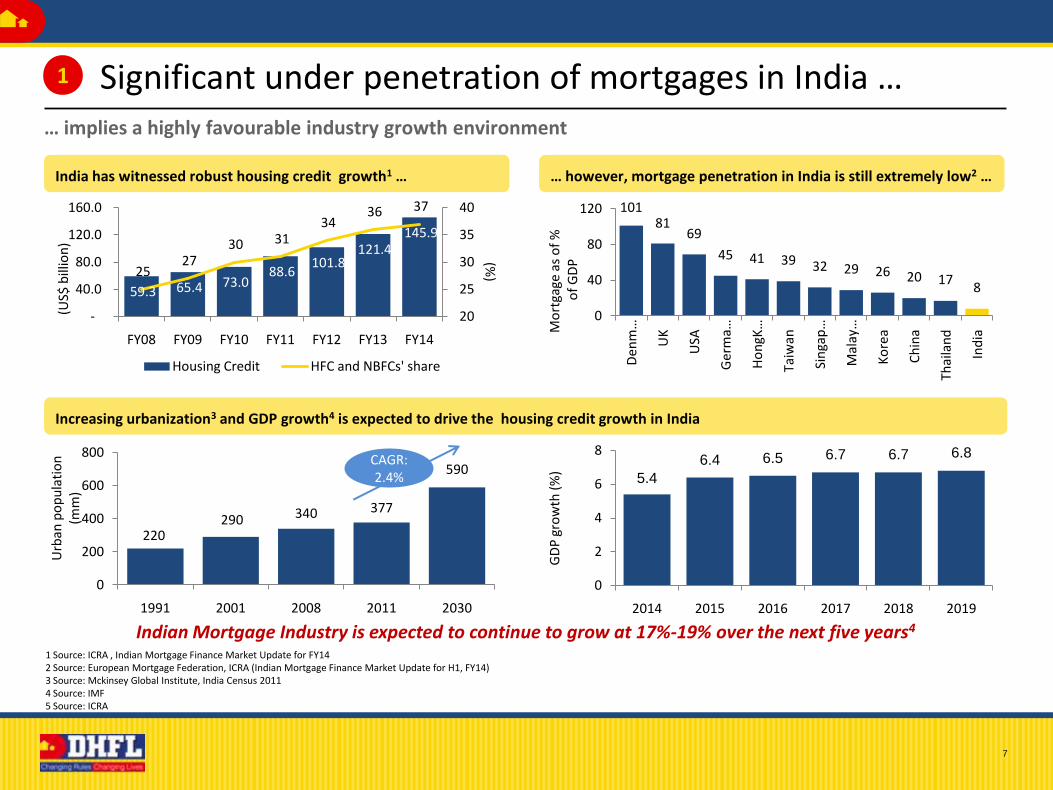
Increasing urbanization3 and GDP growth4 is expected to drive the housing credit growth in India
… however, mortgage penetration in India is still extremely low2 …India has witnessed robust housing credit growth1 …
Significant under penetration of mortgages in India …… implies a highly favourable industry growth environment
1
0
40
80
120
Den
m…
UK
USA
Ger
ma…
Ho
ngK
…
Taiw
an
Sin
gap
…
Mal
ay…
Ko
rea
Ch
ina
Thai
lan
d
Ind
iaMo
rtga
ge a
s o
f %
of
GD
P
10181
69
45 41 39 32 29 26 20 178
0
2
4
6
8
2014 2015 2016 2017 2018 2019
GD
P g
row
th (
%)
5.4
6.4 6.5 6.7 6.7 6.8
220290 340 377
590
0
200
400
600
800
1991 2001 2008 2011 2030
Urb
an p
op
ula
tio
n
(mm
)
Indian Mortgage Industry is expected to continue to grow at 17%-19% over the next five years4
CAGR: 2.4%
1 Source: ICRA , Indian Mortgage Finance Market Update for FY142 Source: European Mortgage Federation, ICRA (Indian Mortgage Finance Market Update for H1, FY14)3 Source: Mckinsey Global Institute, India Census 20114 Source: IMF 5 Source: ICRA
59.3 65.4 73.0 88.6
101.8 121.4
145.9
25 27
30 31 34
36 37
20
25
30
35
40
-
40.0
80.0
120.0
160.0
FY08 FY09 FY10 FY11 FY12 FY13 FY14
(%)
(US$
bill
ion
)
Housing Credit HFC and NBFCs' share
8
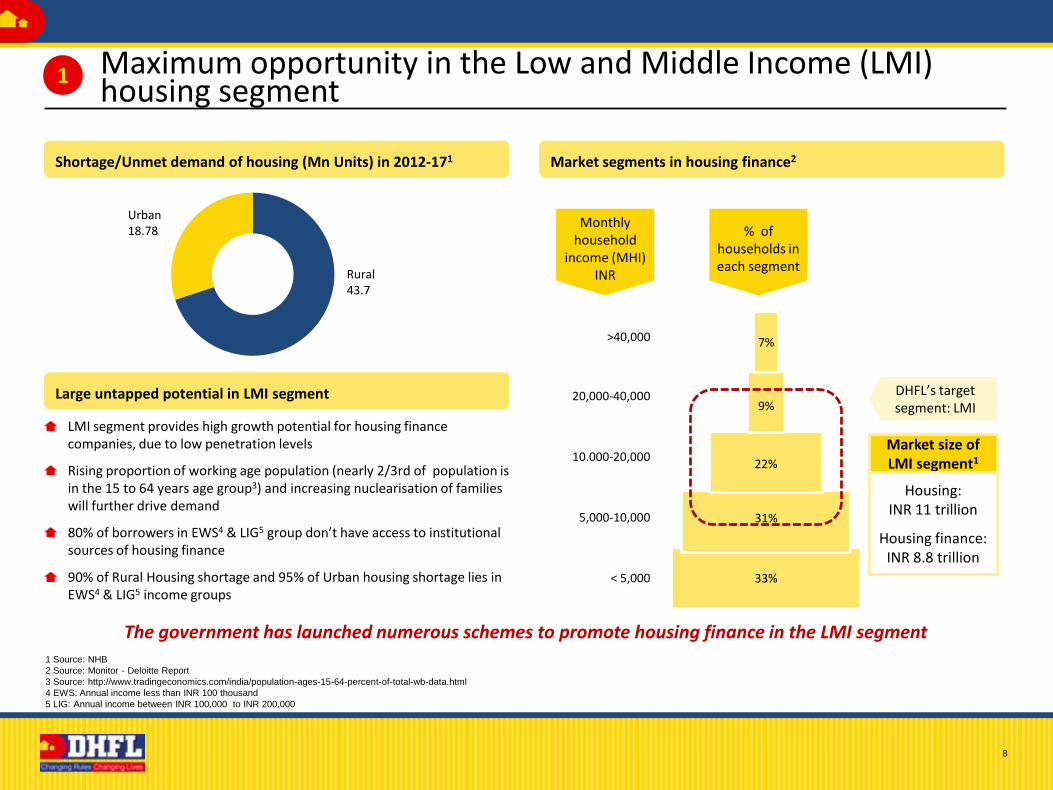
LMI segment provides high growth potential for housing finance companies, due to low penetration levels
Rising proportion of working age population (nearly 2/3rd of population is in the 15 to 64 years age group3) and increasing nuclearisation of families will further drive demand
80% of borrowers in EWS4 & LIG5 group don’t have access to institutional sources of housing finance
90% of Rural Housing shortage and 95% of Urban housing shortage lies in EWS4 & LIG5 income groups
Large untapped potential in LMI segment
Market segments in housing finance2
Rural43.7
Urban18.78
Shortage/Unmet demand of housing (Mn Units) in 2012-171
housing segment
1 Source: NHB
2 Source: Monitor - Deloitte Report
3 Source: http://www.tradingeconomics.com/india/population-ages-15-64-percent-of-total-wb-data.html
4 EWS: Annual income less than INR 100 thousand
5 LIG: Annual income between INR 100,000 to INR 200,000
The government has launched numerous schemes to promote housing finance in the LMI segment
33%
31%
22%
9%
7%
< 5,000
DHFL’s target segment: LMI
% of households in each segment
Market size of LMI segment1
Housing: INR 11 trillion
Housing finance: INR 8.8 trillion
5,000-10,000
10.000-20,000
20,000-40,000
>40,000
Monthly household
income (MHI)INR
Maximum opportunity in the Low and Middle Income (LMI)1
9
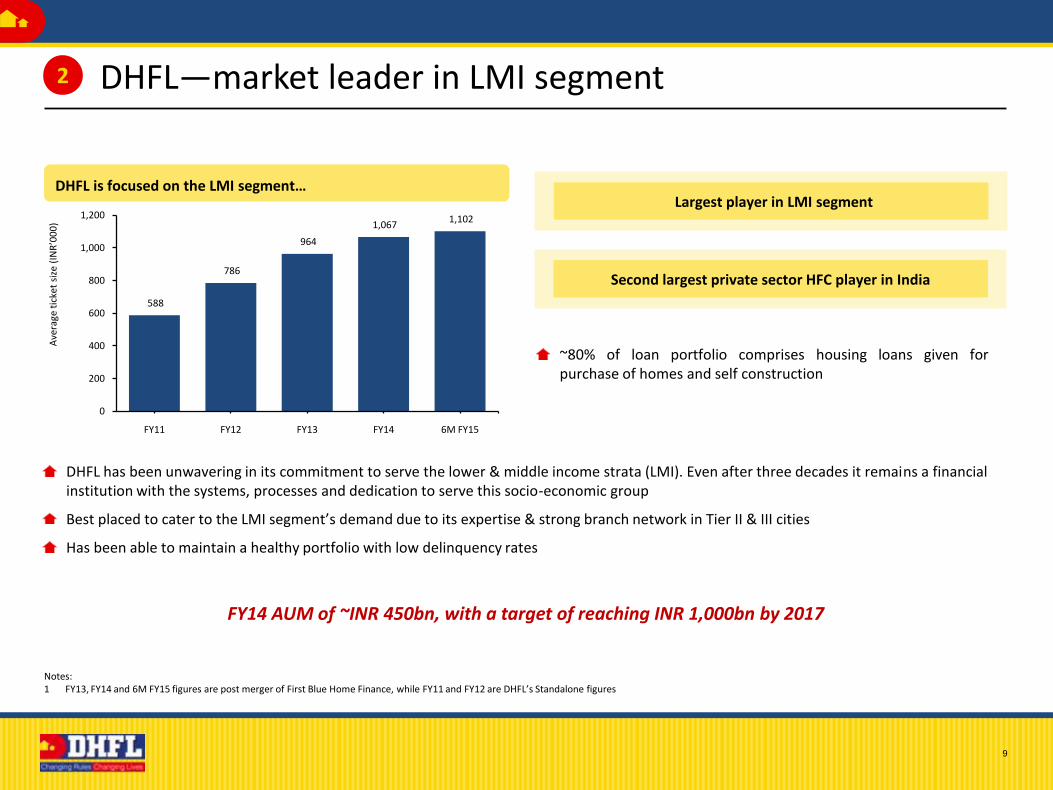
DHFL has been unwavering in its commitment to serve the lower & middle income strata (LMI). Even after three decades it remains a financial institution with the systems, processes and dedication to serve this socio-economic group
Best placed to cater to the LMI segment’s demand due to its expertise & strong branch network in Tier II & III cities
Has been able to maintain a healthy portfolio with low delinquency rates
DHFL is focused on the LMI segment…
Notes:1 FY13, FY14 and 6M FY15 figures are post merger of First Blue Home Finance, while FY11 and FY12 are DHFL’s Standalone figures
DHFL—market leader in LMI segment2
FY14 AUM of ~INR 450bn, with a target of reaching INR 1,000bn by 2017
Largest player in LMI segment
Second largest private sector HFC player in India
~80% of loan portfolio comprises housing loans given forpurchase of homes and self construction
588
786
964
1,067 1,102
0
200
400
600
800
1,000
1,200
FY11 FY12 FY13 FY14 6M FY15
Ave
rage
tic
ket
size
(IN
R’0
00
)
10
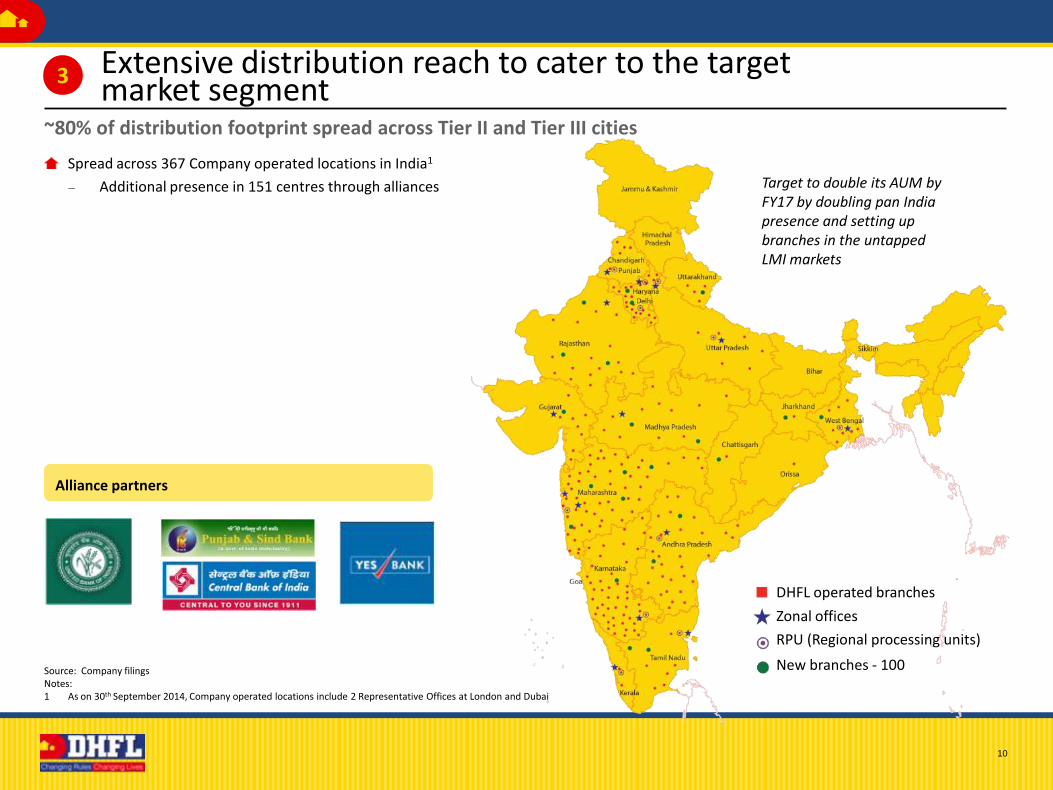
Alliance partners
market segment3 Extensive distribution reach to cater to the target
DHFL operated branches
Zonal offices
RPU (Regional processing units)
New branches - 100
Spread across 367 Company operated locations in India1
– Additional presence in 151 centres through alliances Target to double its AUM by FY17 by doubling pan India presence and setting up branches in the untapped LMI markets
Source: Company filingsNotes:1 As on 30th September 2014, Company operated locations include 2 Representative Offices at London and Dubai
~80% of distribution footprint spread across Tier II and Tier III cities
11
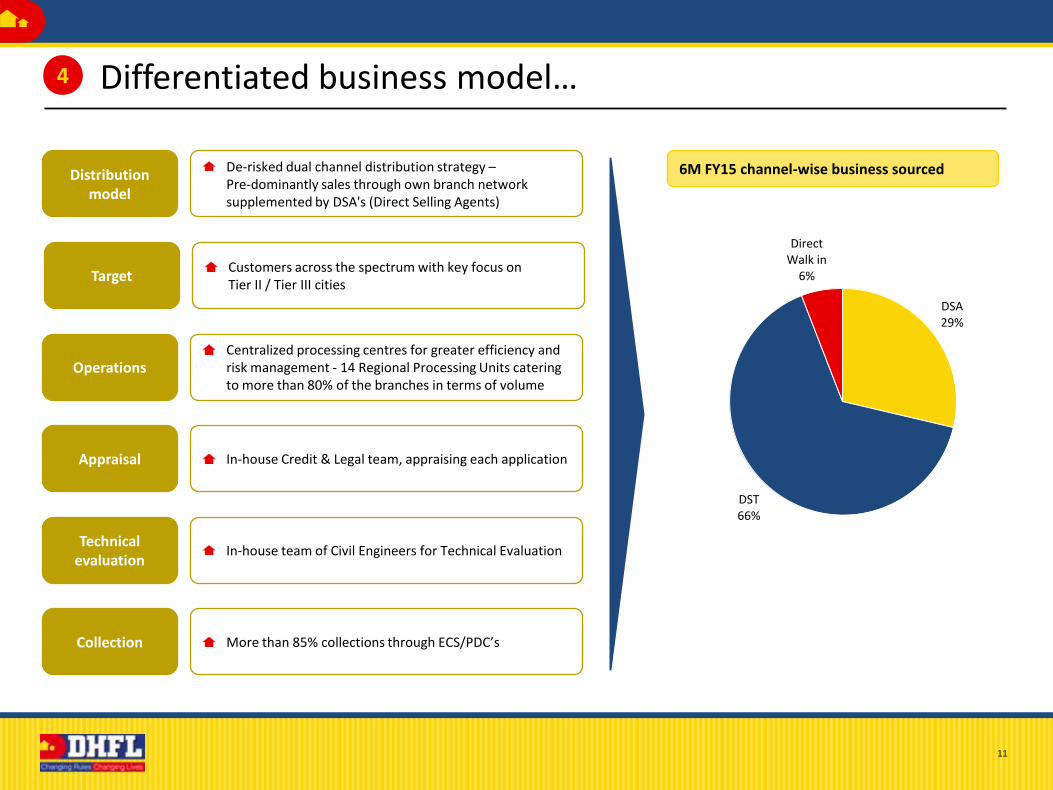
Differentiated business model…
De-risked dual channel distribution strategy –Pre-dominantly sales through own branch network supplemented by DSA's (Direct Selling Agents)
Distribution model
Customers across the spectrum with key focus on Tier II / Tier III cities
Target
In-house Credit & Legal team, appraising each applicationAppraisal
4
Centralized processing centres for greater efficiency and risk management - 14 Regional Processing Units catering to more than 80% of the branches in terms of volume
Operations
In-house team of Civil Engineers for Technical EvaluationTechnical
evaluation
More than 85% collections through ECS/PDC’sCollection
6M FY15 channel-wise business sourced
DSA29%
DST66%
Direct Walk in
6%
12
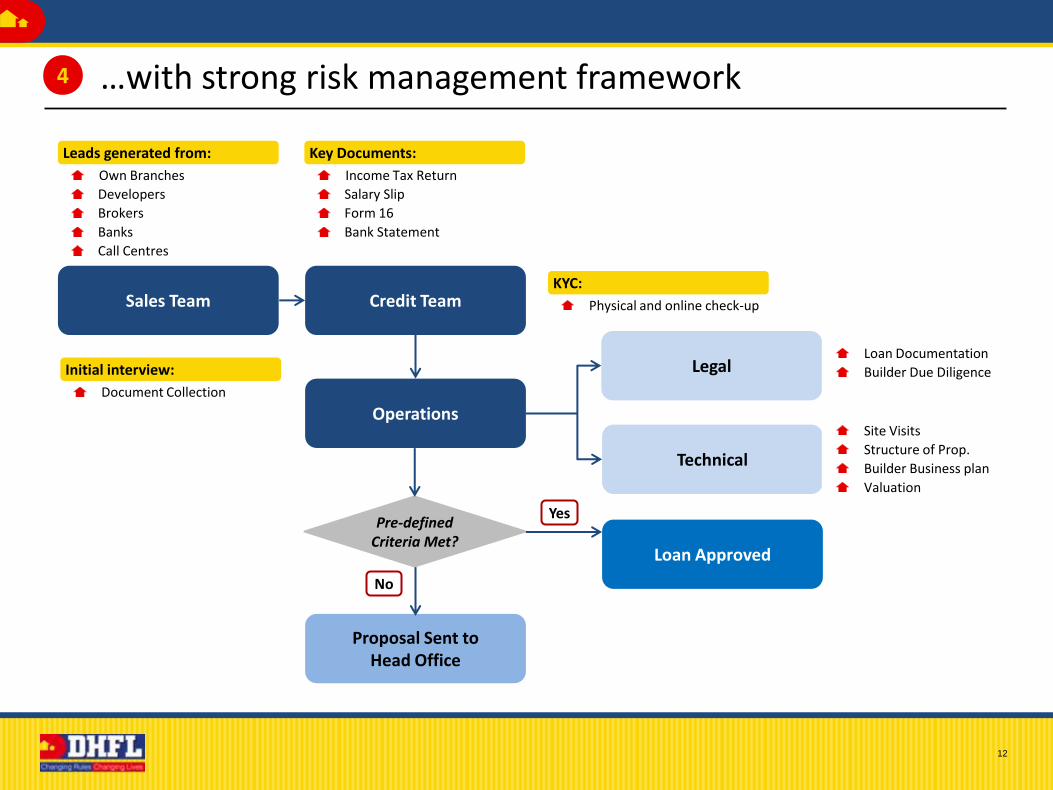
…with strong risk management framework
Credit Team
Proposal Sent to Head Office
Pre-defined Criteria Met?
Loan Approved
Technical
Sales Team
Operations
Legal
4
Own Branches
Developers
Brokers
Banks
Call Centres
Income Tax Return
Salary Slip
Form 16
Bank Statement
Leads generated from: Key Documents:
Document Collection
Initial interview:
No
Yes
Loan Documentation
Builder Due Diligence
Site Visits
Structure of Prop.
Builder Business plan
Valuation
Physical and online check-up
KYC:
13
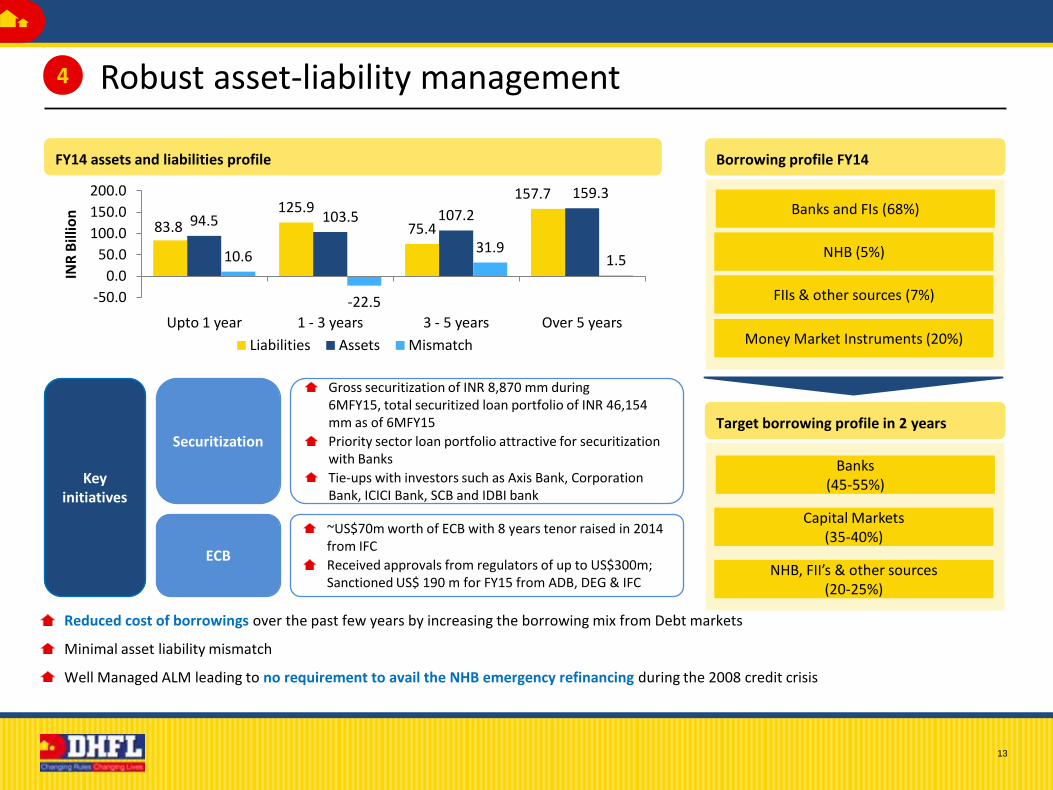
Target borrowing profile in 2 years
Borrowing profile FY14FY14 assets and liabilities profile
Robust asset-liability management4
Banks and FIs (68%)
NHB (5%)
FIIs & other sources (7%)
Money Market Instruments (20%)
Banks (45-55%)
Capital Markets (35-40%)
NHB, FII’s & other sources (20-25%)
Reduced cost of borrowings over the past few years by increasing the borrowing mix from Debt markets
Minimal asset liability mismatch
Well Managed ALM leading to no requirement to avail the NHB emergency refinancing during the 2008 credit crisis
Gross securitization of INR 8,870 mm during 6MFY15, total securitized loan portfolio of INR 46,154mm as of 6MFY15
Priority sector loan portfolio attractive for securitization with Banks
Tie-ups with investors such as Axis Bank, Corporation Bank, ICICI Bank, SCB and IDBI bank
Securitization
~US$70m worth of ECB with 8 years tenor raised in 2014 from IFC
Received approvals from regulators of up to US$300m; Sanctioned US$ 190 m for FY15 from ADB, DEG & IFC
ECB
Key initiatives
83.8125.9
75.4
157.7
94.5 103.5 107.2
159.3
10.6
-22.5
31.91.5
-50.0
0.0
50.0
100.0
150.0
200.0
Upto 1 year 1 - 3 years 3 - 5 years Over 5 years
INR
Bill
ion
Liabilities Assets Mismatch
14
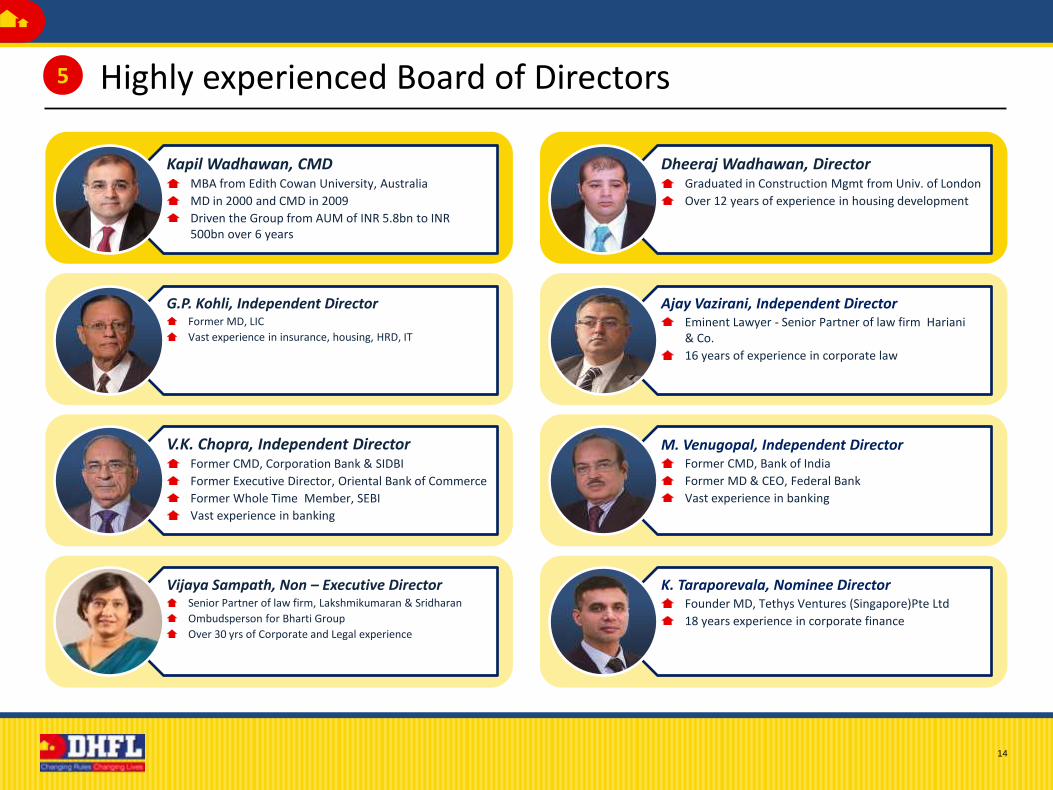
Highly experienced Board of Directors5
Kapil Wadhawan, CMDMBA from Edith Cowan University, Australia
MD in 2000 and CMD in 2009
Driven the Group from AUM of INR 5.8bn to INR 500bn over 6 years
Dheeraj Wadhawan, DirectorGraduated in Construction Mgmt from Univ. of London
Over 12 years of experience in housing development
G.P. Kohli, Independent DirectorFormer MD, LIC
Vast experience in insurance, housing, HRD, IT
Vijaya Sampath, Non – Executive DirectorSenior Partner of law firm, Lakshmikumaran & Sridharan
Ombudsperson for Bharti Group
Over 30 yrs of Corporate and Legal experience
V.K. Chopra, Independent DirectorFormer CMD, Corporation Bank & SIDBI
Former Executive Director, Oriental Bank of Commerce
Former Whole Time Member, SEBI
Vast experience in banking
M. Venugopal, Independent DirectorFormer CMD, Bank of India
Former MD & CEO, Federal Bank
Vast experience in banking
Ajay Vazirani, Independent DirectorEminent Lawyer - Senior Partner of law firm Hariani& Co.
16 years of experience in corporate law
K. Taraporevala, Nominee DirectorFounder MD, Tethys Ventures (Singapore)Pte Ltd
18 years experience in corporate finance
15
FY13
FY14
FY14
Awards and recognition
BEST EMPLOYER BRAND AWARD at IPE BFSI Awards
Mr. Kapil Wadhawan among the Top 100 CEO’s in the Business Today Listing
The Greatest Corporate Leaders of India – Leadership Awards in Financial Services by India’s Greatest
Amongst India’s 50 Biggest Financial Companies in India
DHFL is recognised as a Power Brand amongst the top 200 brands in India by M/S Planman Marcom
2nd Asia’s Best Employer Brand Award for Excellence in HR through Technology
India’s Top 100 Best Companies to work for – Great Place To Work Institute, India in Association with Economic Times
FY12
FY11
FY11
2010
16
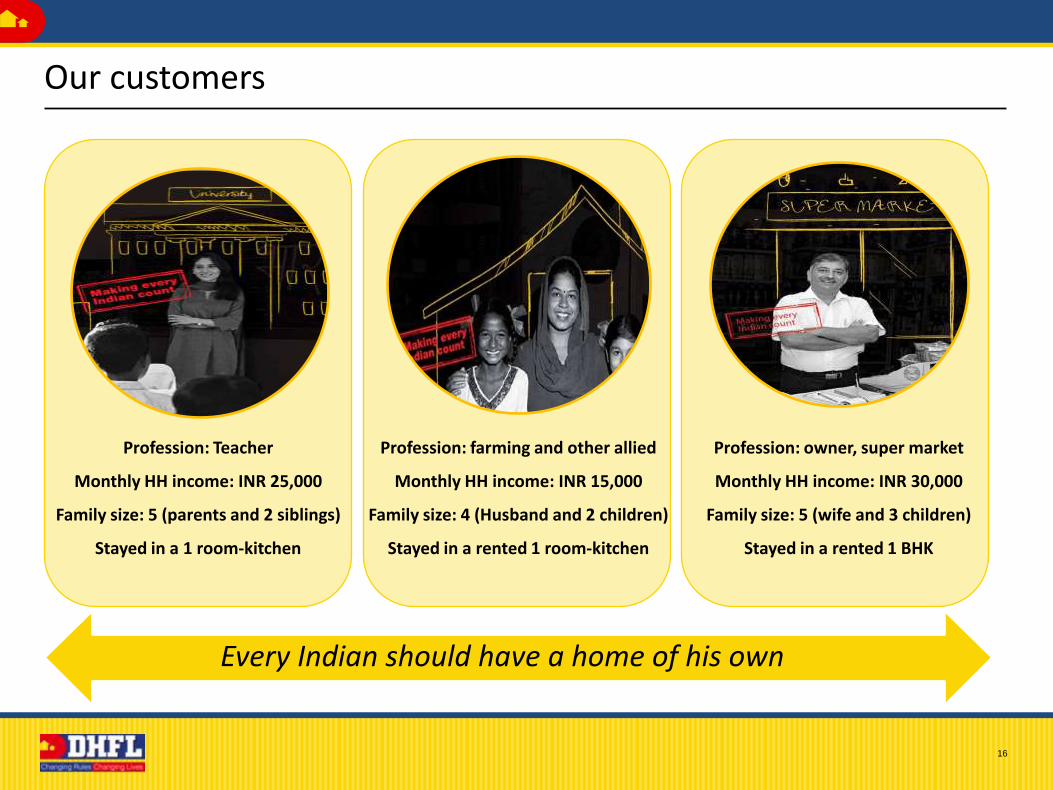
Our customers
Every Indian should have a home of his own
Profession: Teacher
Monthly HH income: INR 25,000
Family size: 5 (parents and 2 siblings)
Stayed in a 1 room-kitchen
Profession: farming and other allied
Monthly HH income: INR 15,000
Family size: 4 (Husband and 2 children)
Stayed in a rented 1 room-kitchen
Profession: owner, super market
Monthly HH income: INR 30,000
Family size: 5 (wife and 3 children)
Stayed in a rented 1 BHK

Section 3
Financial overview
18
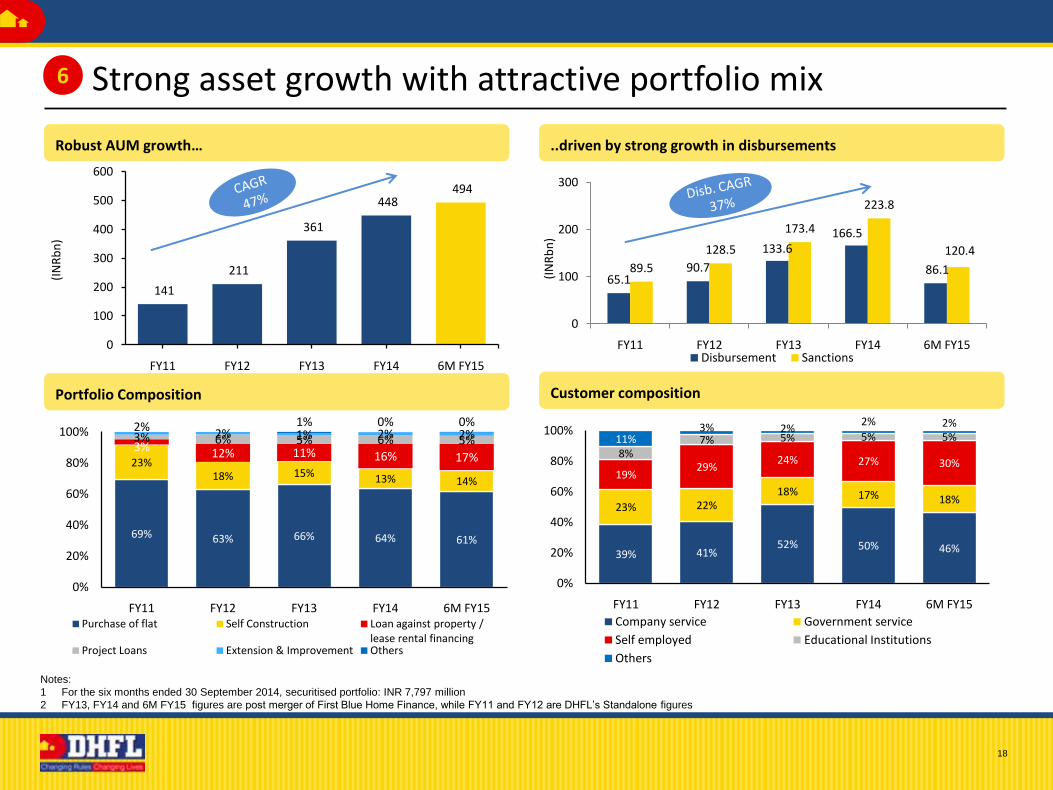
69% 63% 66% 64% 61%
23%18% 15% 13% 14%
3% 12% 11% 16% 17%
3% 6% 5% 6% 5%2%
2% 1% 2% 2%1% 0% 0%
0%
20%
40%
60%
80%
100%
FY11 FY12 FY13 FY14 6M FY15Purchase of flat Self Construction Loan against property /
lease rental financingProject Loans Extension & Improvement Others
141
211
361
448 494
0
100
200
300
400
500
600
FY11 FY12 FY13 FY14 6M FY15
(IN
Rb
n)
Customer compositionPortfolio Composition
..driven by strong growth in disbursementsRobust AUM growth…
Strong asset growth with attractive portfolio mix
65.190.7
133.6166.5
86.1 89.5
128.5
173.4
223.8
120.4
0
100
200
300
FY11 FY12 FY13 FY14 6M FY15
(IN
Rb
n)
Disbursement Sanctions
Notes:
1 For the six months ended 30 September 2014, securitised portfolio: INR 7,797 million
2 FY13, FY14 and 6M FY15 figures are post merger of First Blue Home Finance, while FY11 and FY12 are DHFL’s Standalone figures
6
39% 41%52% 50% 46%
23% 22%18% 17% 18%
19%29%
24% 27% 30%8%
7% 5% 5% 5%11%3% 2%
2% 2%
0%
20%
40%
60%
80%
100%
FY11 FY12 FY13 FY14 6M FY15
Company service Government service
Self employed Educational Institutions
Others
19
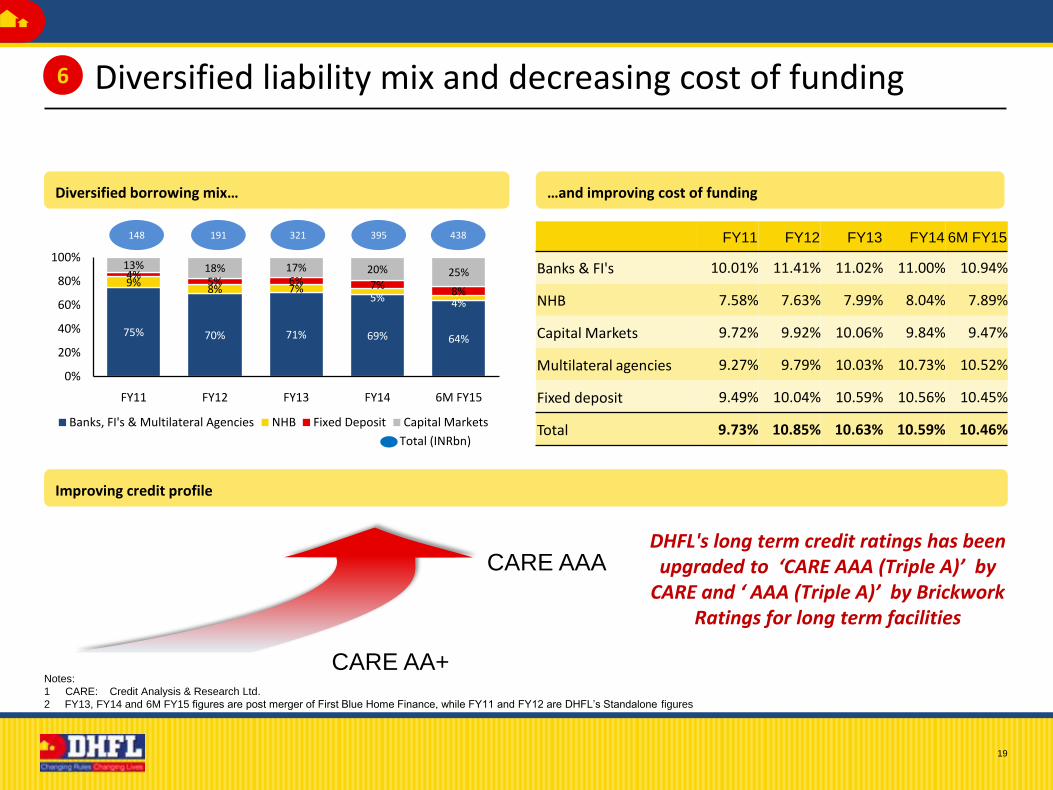
75% 70% 71% 69% 64%
9%8% 7%
5% 4%
4%5% 6% 7%
8%
13% 18% 17% 20% 25%
0%
20%
40%
60%
80%
100%
FY11 FY12 FY13 FY14 6M FY15
Banks, FI's & Multilateral Agencies NHB Fixed Deposit Capital Markets
DHFL's long term credit ratings has been upgraded to ‘CARE AAA (Triple A)’ by
CARE and ‘ AAA (Triple A)’ by Brickwork Ratings for long term facilities
Improving credit profile
…and improving cost of fundingDiversified borrowing mix…
Diversified liability mix and decreasing cost of funding6
148 191 321 438
CARE AAA
CARE AA+
FY11 FY12 FY13 FY14 6M FY15
Banks & FI's 10.01% 11.41% 11.02% 11.00% 10.94%
NHB 7.58% 7.63% 7.99% 8.04% 7.89%
Capital Markets 9.72% 9.92% 10.06% 9.84% 9.47%
Multilateral agencies 9.27% 9.79% 10.03% 10.73% 10.52%
Fixed deposit 9.49% 10.04% 10.59% 10.56% 10.45%
Total 9.73% 10.85% 10.63% 10.59% 10.46%Total (INRbn)
Notes:
1 CARE: Credit Analysis & Research Ltd.
2 FY13, FY14 and 6M FY15 figures are post merger of First Blue Home Finance, while FY11 and FY12 are DHFL’s Standalone figures
395
20
Provision for contingenciesLoan to value ratio
CAR (%) and Tier 1 (%)Gross/net NPA
Superior asset quality6
Notes:
1 FY13, FY14 and 6M FY15 figures are post merger of First Blue Home Finance, while FY11 and FY12 are DHFL’s Standalone figures
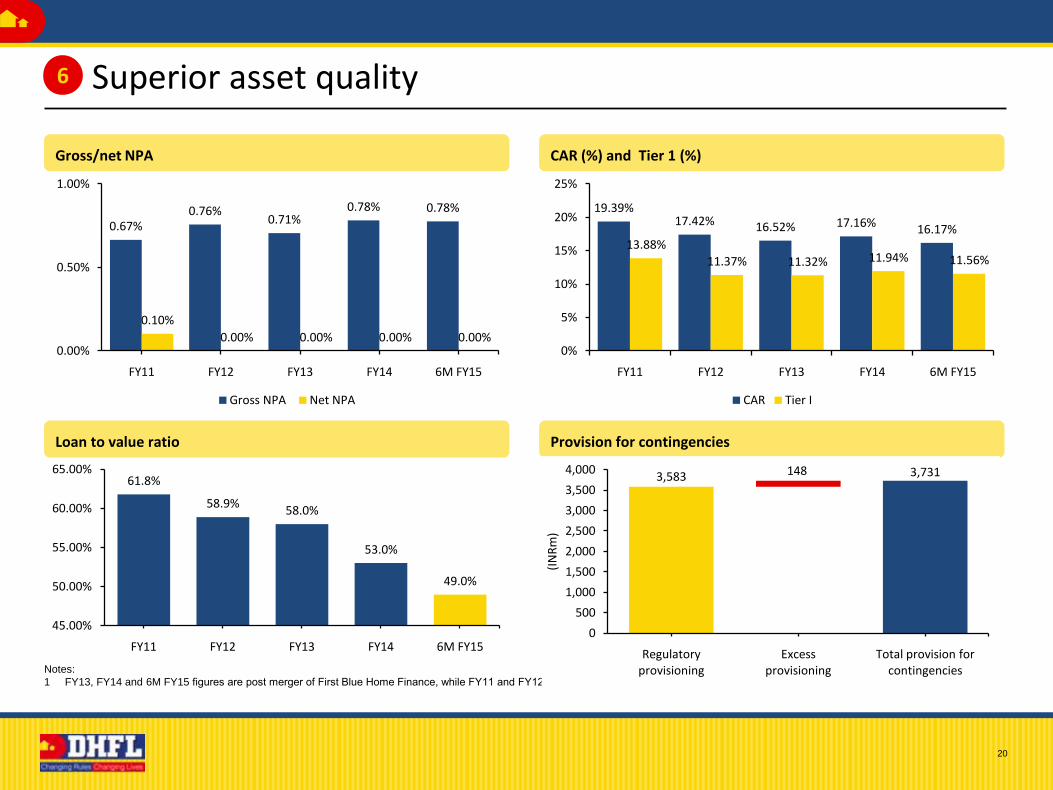
61.8%
58.9%58.0%
53.0%
49.0%
45.00%
50.00%
55.00%
60.00%
65.00%
FY11 FY12 FY13 FY14 6M FY15
3,583 148 3,731
0
500
1,000
1,500
2,000
2,500
3,000
3,500
4,000
Regulatory provisioning
Excess provisioning
Total provision for contingencies
(IN
Rm
)
0.67%0.76%
0.71%0.78% 0.78%
0.10%
0.00% 0.00% 0.00% 0.00%0.00%
0.50%
1.00%
FY11 FY12 FY13 FY14 6M FY15
Gross NPA Net NPA
19.39%17.42% 16.52% 17.16% 16.17%
13.88%
11.37% 11.32% 11.94% 11.56%
0%
5%
10%
15%
20%
25%
FY11 FY12 FY13 FY14 6M FY15
CAR Tier I
21
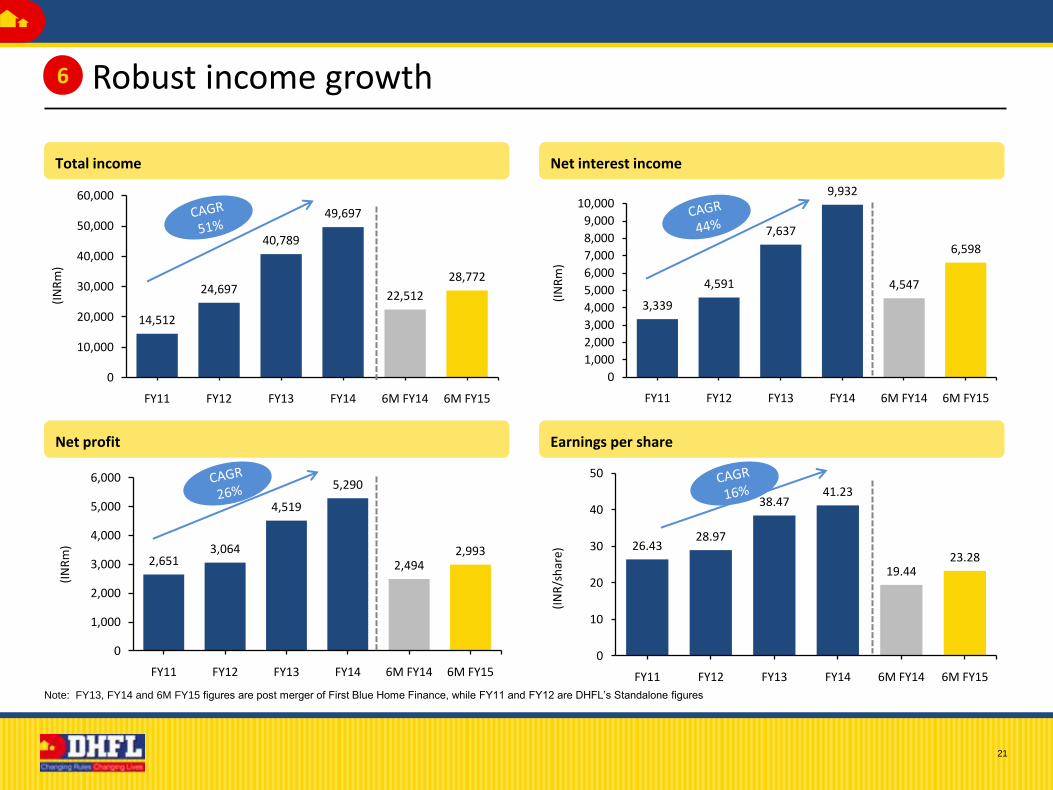
2,6513,064
4,519
5,290
2,4942,993
0
1,000
2,000
3,000
4,000
5,000
6,000
FY11 FY12 FY13 FY14 6M FY14 6M FY15
(IN
Rm
)
3,339
4,591
7,637
9,932
4,547
6,598
0
1,000
2,000
3,000
4,000
5,000
6,000
7,000
8,000
9,000
10,000
FY11 FY12 FY13 FY14 6M FY14 6M FY15
(IN
Rm
)26.43
28.97
38.4741.23
19.4423.28
0
10
20
30
40
50
FY11 FY12 FY13 FY14 6M FY14 6M FY15
(IN
R/s
har
e)
14,512
24,697
40,789
49,697
22,512
28,772
0
10,000
20,000
30,000
40,000
50,000
60,000
FY11 FY12 FY13 FY14 6M FY14 6M FY15
(IN
Rm
)
Earnings per shareNet profit
Net interest incomeTotal income
Robust income growth6
Note: FY13, FY14 and 6M FY15 figures are post merger of First Blue Home Finance, while FY11 and FY12 are DHFL’s Standalone figures
22
RoAA
Cost to income ratio
RoAE
NIM
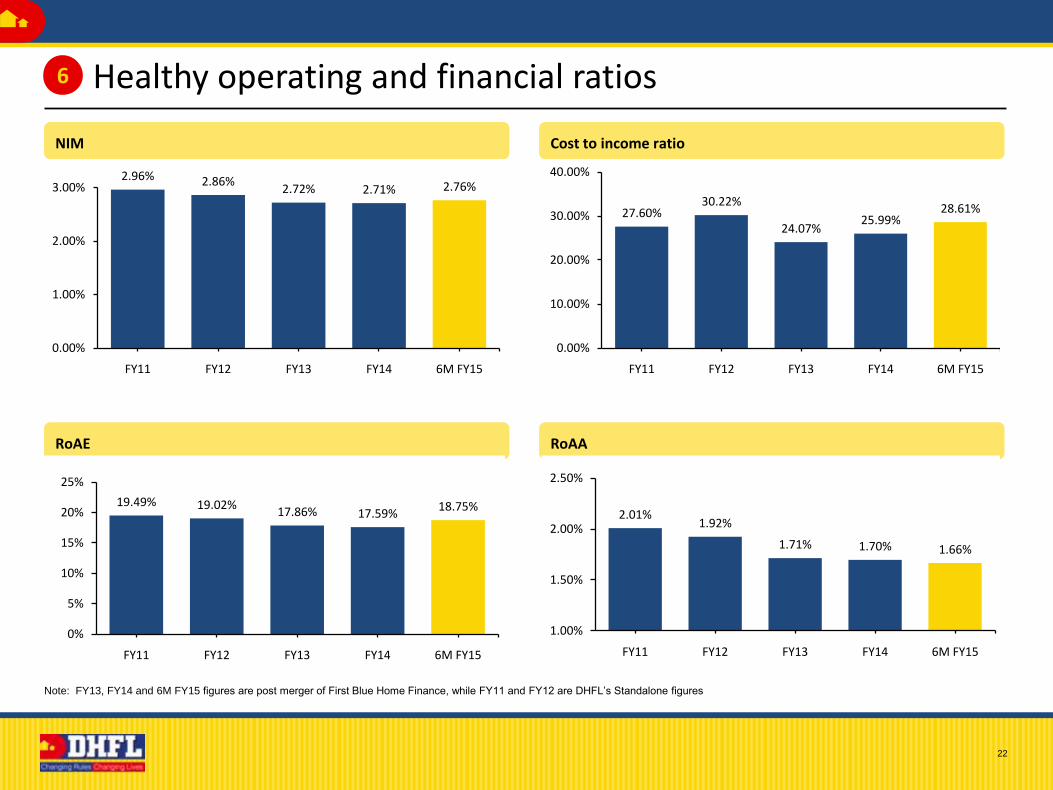
Healthy operating and financial ratios6
Note: FY13, FY14 and 6M FY15 figures are post merger of First Blue Home Finance, while FY11 and FY12 are DHFL’s Standalone figures
27.60%30.22%
24.07%25.99%
28.61%
0.00%
10.00%
20.00%
30.00%
40.00%
FY11 FY12 FY13 FY14 6M FY15
19.49% 19.02%17.86% 17.59%
18.75%
0%
5%
10%
15%
20%
25%
FY11 FY12 FY13 FY14 6M FY15
2.01%1.92%
1.71% 1.70% 1.66%
1.00%
1.50%
2.00%
2.50%
FY11 FY12 FY13 FY14 6M FY15
2.96% 2.86%2.72% 2.71% 2.76%
0.00%
1.00%
2.00%
3.00%
FY11 FY12 FY13 FY14 6M FY15
Section 4
Other information
24
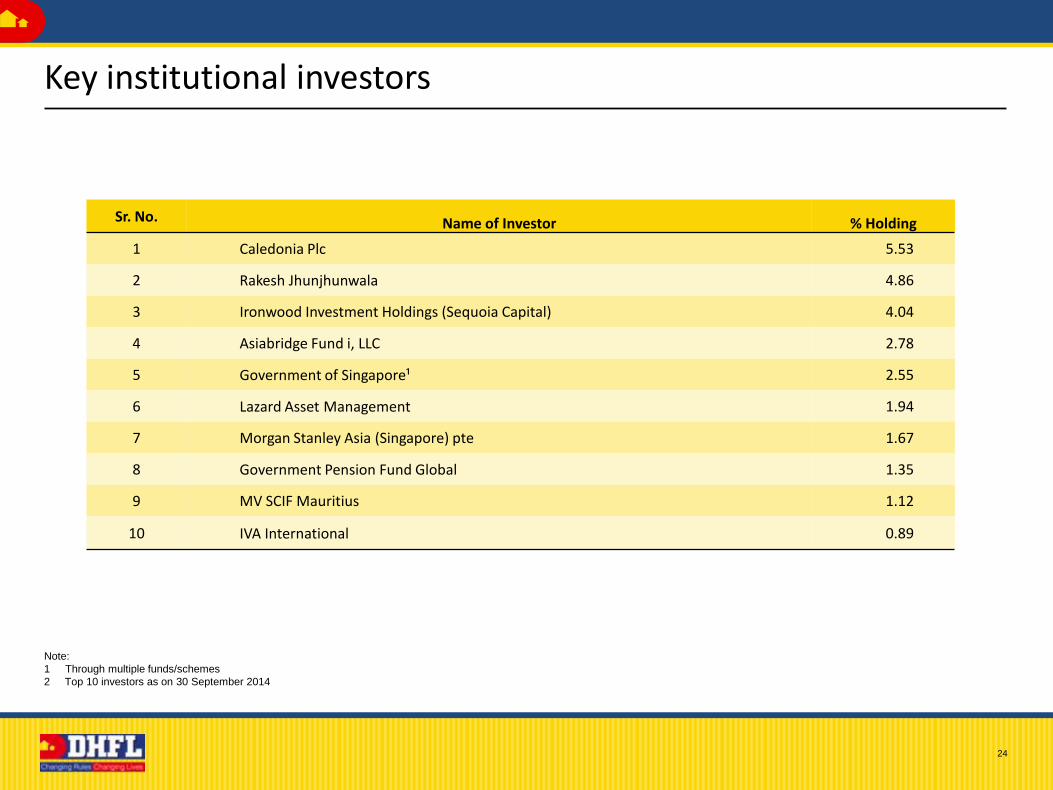
Key institutional investors
Note:
1 Through multiple funds/schemes
2 Top 10 investors as on 30 September 2014
Sr. No. Name of Investor % Holding
1 Caledonia Plc 5.53
2 Rakesh Jhunjhunwala 4.86
3 Ironwood Investment Holdings (Sequoia Capital) 4.04
4 Asiabridge Fund i, LLC 2.78
5 Government of Singapore¹ 2.55
6 Lazard Asset Management 1.94
7 Morgan Stanley Asia (Singapore) pte 1.67
8 Government Pension Fund Global 1.35
9 MV SCIF Mauritius 1.12
10 IVA International 0.89
25
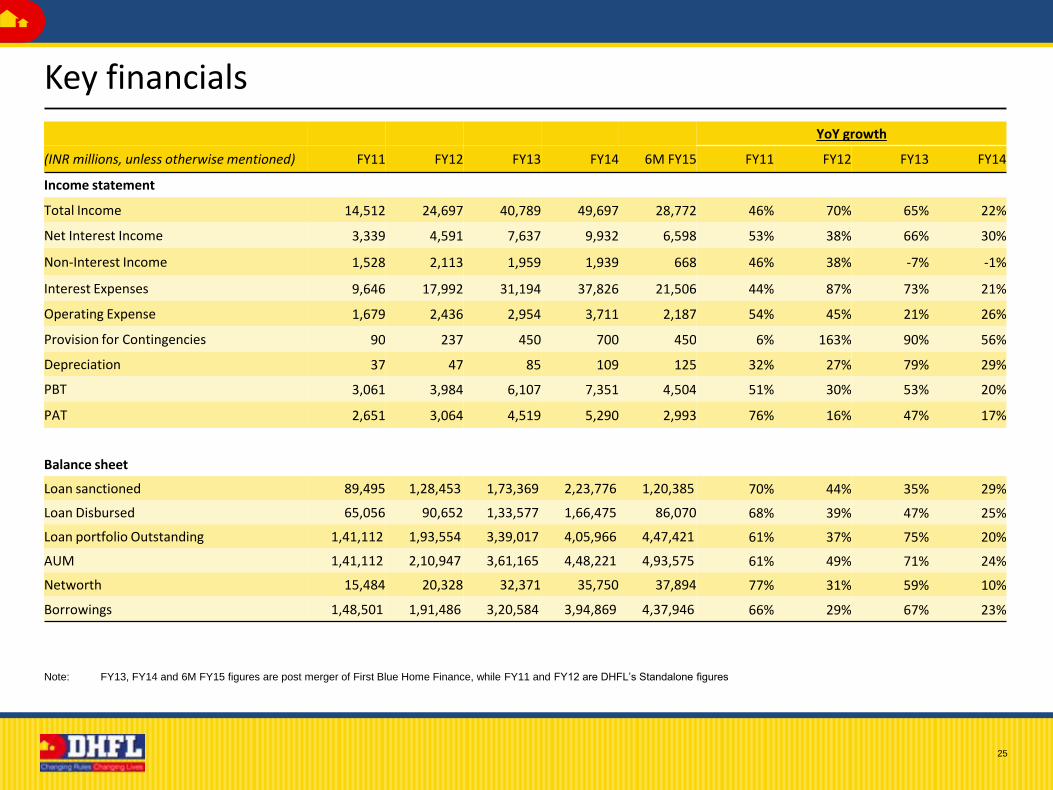
Key financials
Note: FY13, FY14 and 6M FY15 figures are post merger of First Blue Home Finance, while FY11 and FY12 are DHFL’s Standalone figures
YoY growth
(INR millions, unless otherwise mentioned) FY11 FY12 FY13 FY14 6M FY15 FY11 FY12 FY13 FY14
Income statement
Total Income 14,512 24,697 40,789 49,697 28,772 46% 70% 65% 22%
Net Interest Income 3,339 4,591 7,637 9,932 6,598 53% 38% 66% 30%
Non-Interest Income 1,528 2,113 1,959 1,939 668 46% 38% -7% -1%
Interest Expenses 9,646 17,992 31,194 37,826 21,506 44% 87% 73% 21%
Operating Expense 1,679 2,436 2,954 3,711 2,187 54% 45% 21% 26%
Provision for Contingencies 90 237 450 700 450 6% 163% 90% 56%
Depreciation 37 47 85 109 125 32% 27% 79% 29%
PBT 3,061 3,984 6,107 7,351 4,504 51% 30% 53% 20%
PAT 2,651 3,064 4,519 5,290 2,993 76% 16% 47% 17%
Balance sheet
Loan sanctioned 89,495 1,28,453 1,73,369 2,23,776 1,20,385 70% 44% 35% 29%
Loan Disbursed 65,056 90,652 1,33,577 1,66,475 86,070 68% 39% 47% 25%
Loan portfolio Outstanding 1,41,112 1,93,554 3,39,017 4,05,966 4,47,421 61% 37% 75% 20%
AUM 1,41,112 2,10,947 3,61,165 4,48,221 4,93,575 61% 49% 71% 24%
Networth 15,484 20,328 32,371 35,750 37,894 77% 31% 59% 10%
Borrowings 1,48,501 1,91,486 3,20,584 3,94,869 4,37,946 66% 29% 67% 23%
26
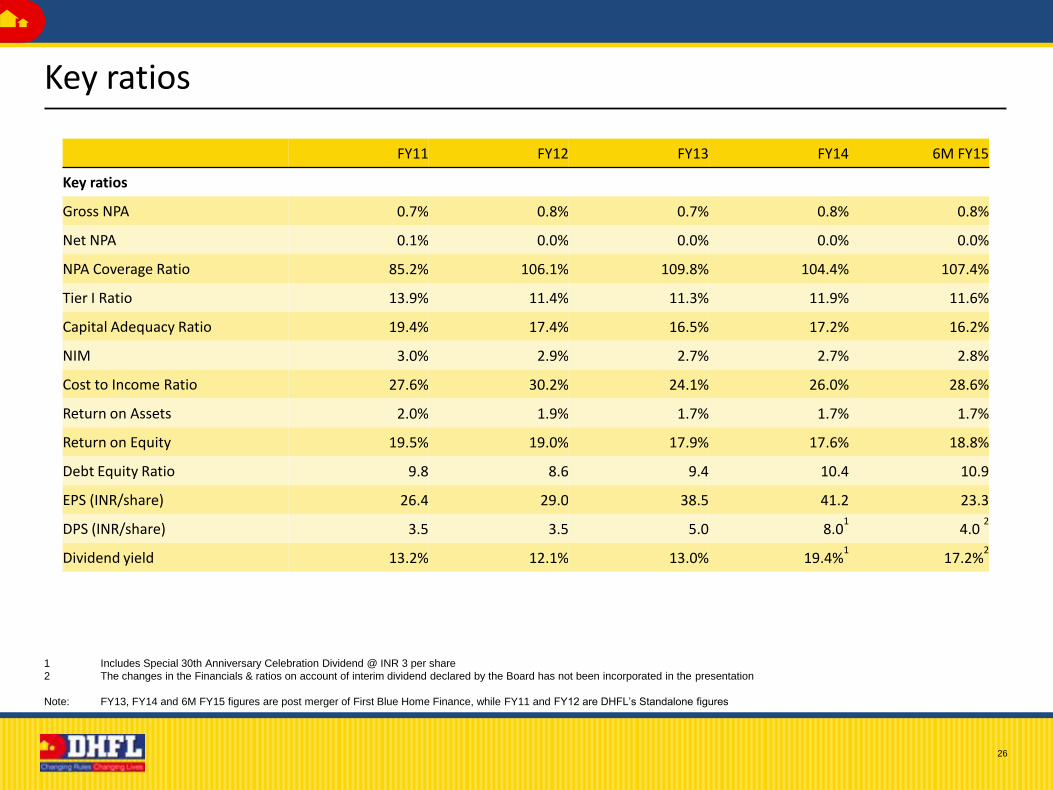
Key ratios
1 Includes Special 30th Anniversary Celebration Dividend @ INR 3 per share
2 The changes in the Financials & ratios on account of interim dividend declared by the Board has not been incorporated in the presentation
Note: FY13, FY14 and 6M FY15 figures are post merger of First Blue Home Finance, while FY11 and FY12 are DHFL’s Standalone figures
FY11 FY12 FY13 FY14 6M FY15
Key ratios
Gross NPA 0.7% 0.8% 0.7% 0.8% 0.8%
Net NPA 0.1% 0.0% 0.0% 0.0% 0.0%
NPA Coverage Ratio 85.2% 106.1% 109.8% 104.4% 107.4%
Tier I Ratio 13.9% 11.4% 11.3% 11.9% 11.6%
Capital Adequacy Ratio 19.4% 17.4% 16.5% 17.2% 16.2%
NIM 3.0% 2.9% 2.7% 2.7% 2.8%
Cost to Income Ratio 27.6% 30.2% 24.1% 26.0% 28.6%
Return on Assets 2.0% 1.9% 1.7% 1.7% 1.7%
Return on Equity 19.5% 19.0% 17.9% 17.6% 18.8%
Debt Equity Ratio 9.8 8.6 9.4 10.4 10.9
EPS (INR/share) 26.4 29.0 38.5 41.2 23.3
DPS (INR/share) 3.5 3.5 5.0 8.01
4.0 2
Dividend yield 13.2% 12.1% 13.0% 19.4%1
17.2%2
27
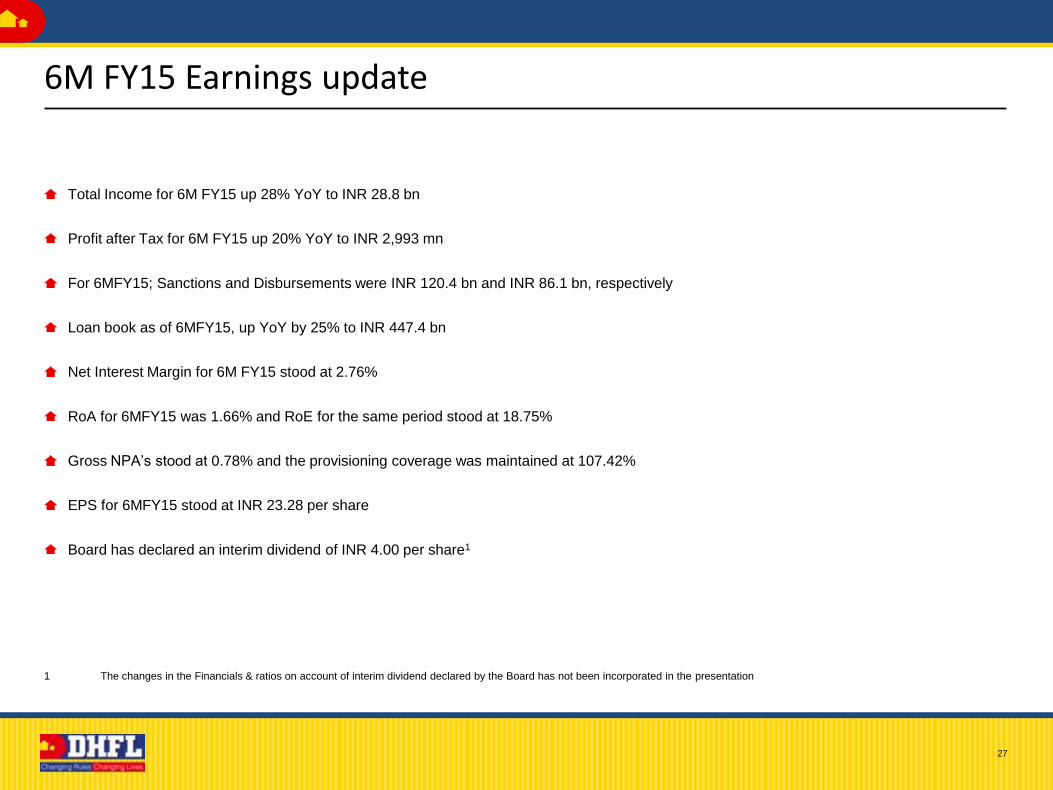
6M FY15 Earnings update
Total Income for 6M FY15 up 28% YoY to INR 28.8 bn
Profit after Tax for 6M FY15 up 20% YoY to INR 2,993 mn
For 6MFY15; Sanctions and Disbursements were INR 120.4 bn and INR 86.1 bn, respectively
Loan book as of 6MFY15, up YoY by 25% to INR 447.4 bn
Net Interest Margin for 6M FY15 stood at 2.76%
RoA for 6MFY15 was 1.66% and RoE for the same period stood at 18.75%
Gross NPA’s stood at 0.78% and the provisioning coverage was maintained at 107.42%
EPS for 6MFY15 stood at INR 23.28 per share
Board has declared an interim dividend of INR 4.00 per share1
1 The changes in the Financials & ratios on account of interim dividend declared by the Board has not been incorporated in the presentation

Section 5
Group
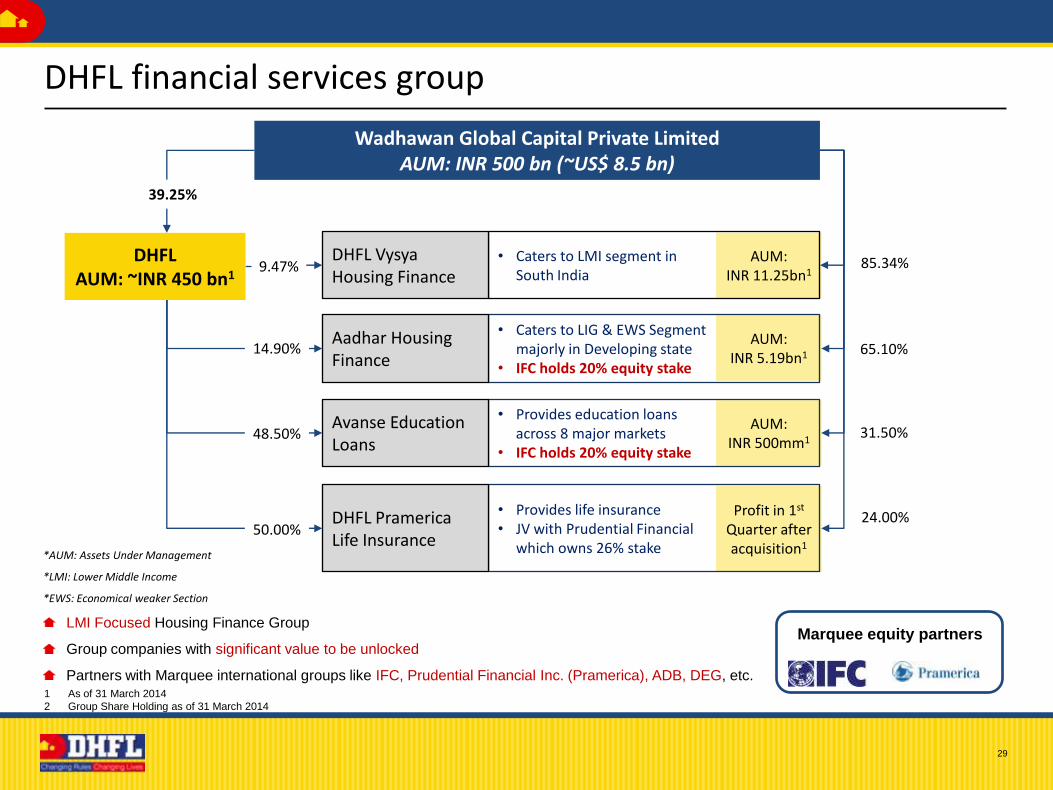
29
AUM: INR 11.25bn1
AUM: INR 5.19bn1
AUM:INR 500mm1
Profit in 1st
Quarter after acquisition1
DHFL financial services group
Wadhawan Global Capital Private LimitedAUM: INR 500 bn (~US$ 8.5 bn)
• Caters to LMI segment in South India
• Caters to LIG & EWS Segment majorly in Developing state
• IFC holds 20% equity stake
• Provides education loans across 8 major markets
• IFC holds 20% equity stake
• Provides life insurance• JV with Prudential Financial
which owns 26% stake
DHFL VysyaHousing Finance
Aadhar Housing Finance
Avanse Education Loans
DHFL PramericaLife Insurance
39.25%
9.47%
14.90%
48.50%
50.00%
85.34%
65.10%
31.50%
24.00%
*AUM: Assets Under Management
*LMI: Lower Middle Income
*EWS: Economical weaker Section
Marquee equity partnersLMI Focused Housing Finance Group
Group companies with significant value to be unlocked
Partners with Marquee international groups like IFC, Prudential Financial Inc. (Pramerica), ADB, DEG, etc.
DHFLAUM: ~INR 450 bn1
1 As of 31 March 2014
2 Group Share Holding as of 31 March 2014
30
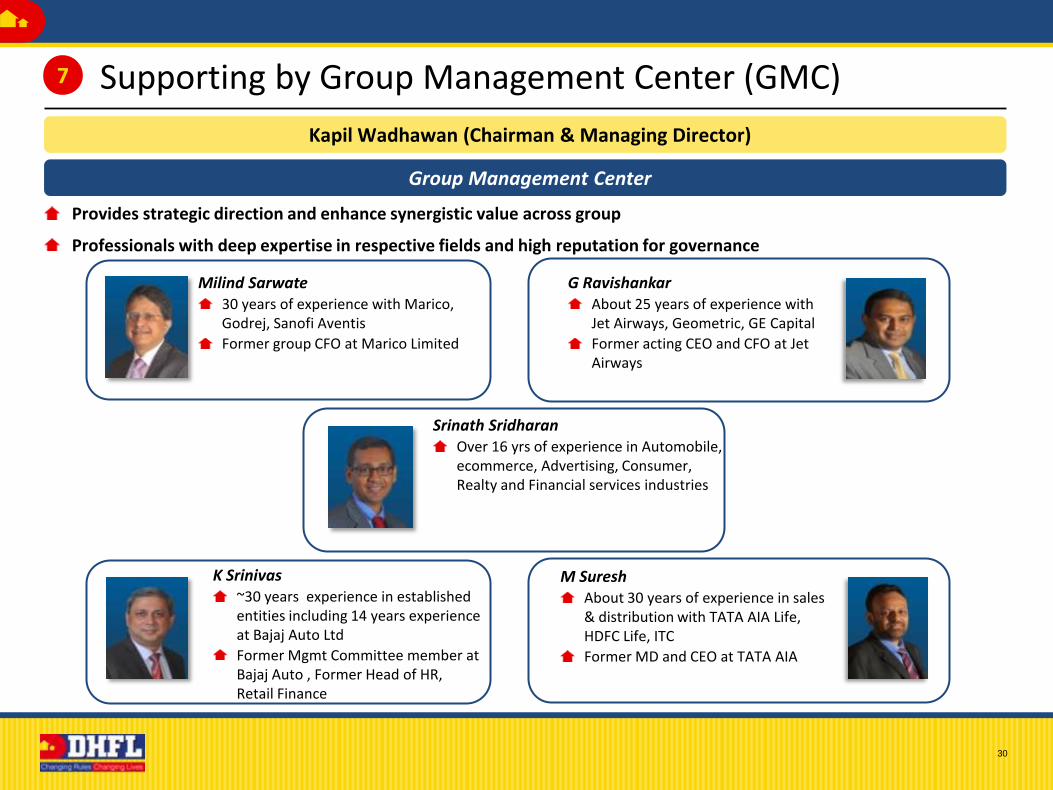
Kapil Wadhawan (Chairman & Managing Director)
Supporting by Group Management Center (GMC)7
Group Management Center
Provides strategic direction and enhance synergistic value across group
Professionals with deep expertise in respective fields and high reputation for governance
G RavishankarAbout 25 years of experience with Jet Airways, Geometric, GE Capital
Former acting CEO and CFO at Jet Airways
Milind Sarwate30 years of experience with Marico, Godrej, Sanofi Aventis
Former group CFO at Marico Limited
K Srinivas~30 years experience in established entities including 14 years experience at Bajaj Auto Ltd
Former Mgmt Committee member at Bajaj Auto , Former Head of HR, Retail Finance
M SureshAbout 30 years of experience in sales & distribution with TATA AIA Life, HDFC Life, ITC
Former MD and CEO at TATA AIA
Srinath SridharanOver 16 yrs of experience in Automobile, ecommerce, Advertising, Consumer, Realty and Financial services industries
31
Maximum ticket size capped at INR 0.6 million
Generates business through seven low income states in India viz; UP, MP, Bihar, Chhattisgarh, Jharkhand, West Bengal and Orissa
Presence in 60 locations as on FY141
IFC has picked up a 20% equity stake in the company
Aadhar Housing Finance
Serves the most Underserved segment
DHFL Vysya Housing Finance
Engaged in the LMI Strata
Entities engaged in the LMI and the Underserved strata
The Average Ticket size stood at INR 0.7 million as on FY141
Has operations in South India, viz., Karnataka, Andhra Pradesh, Tamil Nadu & Kerala
Presence in 29 locations as on FY141
As on FY14, the Company made home loan disbursements of INR 3.63 billion1
Note:
1 As of 31 March 2014
8
32
Outstanding Portfolio - INR 500 million
Loans Sanctioned - INR 1,036 million
Loans disbursed - INR 512 million
Average Ticket size - INR 1.9 million
Product Mix:
Domestic : INR 155 million
Abroad : INR 345 million
Total Income - INR 60 million
Highlights of FY141
Avanse Financial Services
Enabling education, Empowering youth
Forayed into Education loans business in 2013
IFC holds 20% stake in the Company
Business Coverage across 8 major educational markets of the country –include Mumbai, Delhi & Pune being exclusive Avanse branches, with additional coverage through 180 DHFL Centres
Note:
1 As of 31 March 2014
8
33
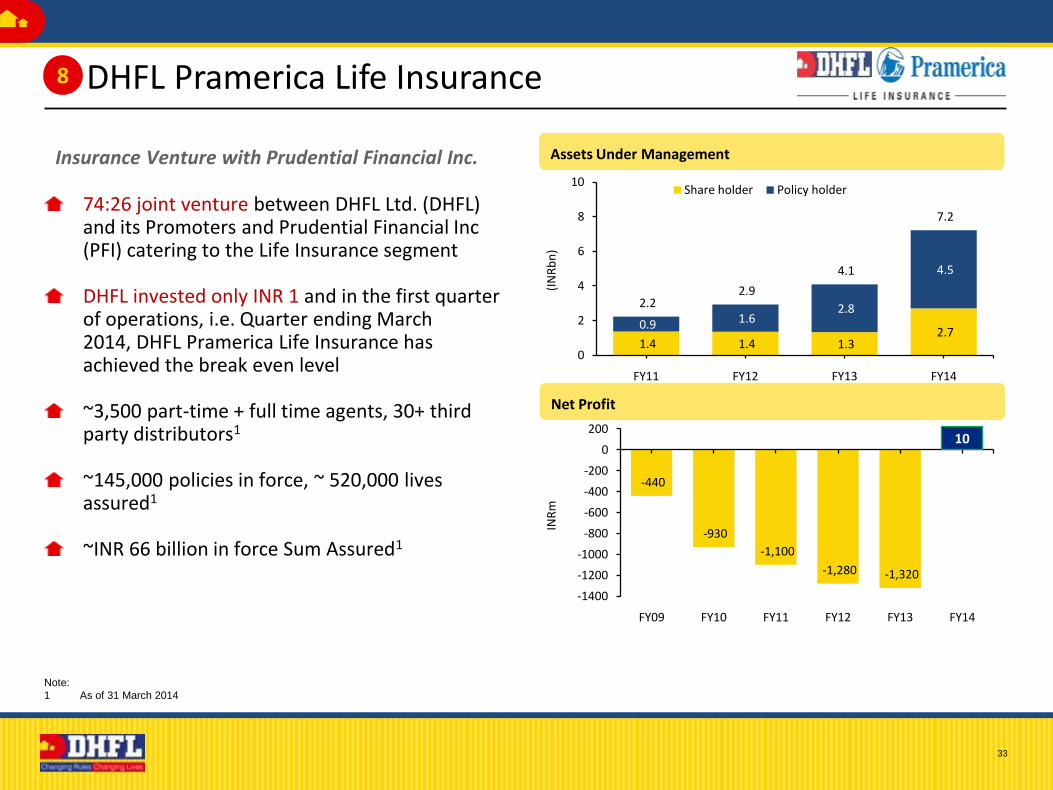
1.4 1.4 1.3 2.7
0.9 1.6 2.8
4.5
2.2 2.9
4.1
7.2
0
2
4
6
8
10
FY11 FY12 FY13 FY14
(IN
Rb
n)
Share holder Policy holder
Assets Under Management
74:26 joint venture between DHFL Ltd. (DHFL) and its Promoters and Prudential Financial Inc (PFI) catering to the Life Insurance segment
DHFL invested only INR 1 and in the first quarter of operations, i.e. Quarter ending March 2014, DHFL Pramerica Life Insurance has achieved the break even level
~3,500 part-time + full time agents, 30+ third party distributors1
~145,000 policies in force, ~ 520,000 lives assured1
~INR 66 billion in force Sum Assured1
Insurance Venture with Prudential Financial Inc.
DHFL Pramerica Life Insurance
Net Profit
-440
-930
-1,100
-1,280 -1,320
-1400
-1200
-1000
-800
-600
-400
-200
0
200
FY09 FY10 FY11 FY12 FY13 FY14
INR
m
10
8
Note:
1 As of 31 March 2014
34
This presentation may contain statements about events and expectations that may be “forward-looking,” including those relating to general businessplans and strategy of Dewan Housing Finance Corporation Ltd. (“DHFL") and its subsidiaries, its future outlook and growth prospects, and futuredevelopments in its businesses and its competitive and regulatory environment. Actual results may differ materially from these forward-lookingstatements due to a number of risks and uncertainties, including future changes or developments in DHFL and its subsidiaries business, itscompetitive environment, its ability to implement its strategies and initiatives and respond to technological changes and political, economic,regulatory and social conditions in India. All financial data in this presentation is obtained from the Audited Financial Statements, basis which theratios are calculated. This presentation does not constitute a prospectus, offering circular or offering memorandum or an offer invitation or asolicitation of any offer to purchase or sell, any shares of DHFL should not be considered or construed in any manner whatsoever as arecommendation that any person should subscribe for or purchase any of DHFL's shares. None of the projections, expectations, estimates orprospects in this presentation should be construed as a forecast implying any indicative assurance or guarantee of future performance, nor that theassumptions on which such future projections, expectations, estimates, or prospects have been prepared are complete or comprehensive.
By accepting this presentation, ledges and agrees that this presentation is strictly confidential and shall not be copied, published, distributed ortransmitted to any person, in whole or in part, by any means, in any form under any circumstances whatsoever. The recipient further represents andwarrants that: (i) it is lawfully able to receive this presentation under the laws of the jurisdiction in which it is located and / or any other applicablelaws, (ii) it is not a U.S. person, (iii) this presentation is furnished to it and has been received outside of the United States, and (iv) it will notreproduce, publish, disclose, redistribute or transmit this presentation.
Disclaimer
Contact
Thank You