Embed Size (px)
Citation preview
The Role of Base Excision Repair in Regulating Endotoxin Induced
Inflammation
A thesis submitted to The University of Manchester for the Degree of Doctor of Philosophy (PhD) in the Faculty
of Medical and Human Sciences
2012
Alan Carter
School of Medicine
Health Sciences Research Group Occupational and Environmental Health
Ph.D. Thesis 2012 Alan Carter
2
Table of contents……………………………………………………………………………….2 List of Figures…………………………………………………………………………………...5 List of Tables……………………………………………………………………………….….10 List of Abbreviations…………………………………………………………………………12 Abstract………………………………………………………………………………………....15 Declaration……………………………………………………………………………………..16 Copyright Statement………………………………………………………………………..16 Acknowledgements………………………………………………………………………….17 1. Introduction............................................................................. 18
1.1. Structure of Endotoxin .............................................................. 19
1.2. Endotoxin Induced Inflammation ............................................... 21
1.2.1. LPS Recognition ................................................................. 21
1.2.2. Activation of the inflammatory response .............................. 21
1.2.3. Inflammatory Signalling ...................................................... 22
1.2.3.1. Fibroblasts ................................................................... 24
1.2.3.2. Human Polymophonuclear Leukocytes ........................... 25
1.3. The Endotoxin Paradox ............................................................. 26
1.4. Factors affecting the inflammation response to endotoxin. .......... 27
1.5. BER Proteins and Endotoxin Induced Inflammation..................... 31
1.6. DNA Glycosylases and Endotoxin Induced Inflammation ............. 32
1.7. Oxidative Damage .................................................................... 34
1.7.1. Reactive Oxygen Species .................................................... 34
1.7.2. Oxidative Adenine Damage ................................................. 39
1.7.3. Oxidative Thymine Damage ................................................ 40
1.7.4. Oxidative Cytosine Damage ................................................ 41
1.7.5. Spontaneous Base Removal ................................................ 41
1.7.6. DNA strand breaks ............................................................. 42
1.7.7. Lipid peroxidation ............................................................... 43
1.8. DNA Repair .............................................................................. 44
1.8.1. Base Excision Repair ........................................................... 45
1.8.2. DNA Glycosylases ............................................................... 47
1.8.2.1. OGG1 .......................................................................... 49
1.8.2.2. NTH1 .......................................................................... 52
1.8.2.3. NEIL1 .......................................................................... 54
1.8.2.4. NEIL2 .......................................................................... 56
1.9. Hypothesis ............................................................................... 59
2. Materials and Methods ............................................................ 61
2.1. Materials .................................................................................. 61
2.1.1. Buffer composition ............................................................. 61
2.1.2. Tissue culture media .......................................................... 62
2.1.3. PCR primers ....................................................................... 62
2.1.4. Molecular biology reagents ................................................. 65
2.1.5. Protein analysis reagents .................................................... 65
2.1.6. Equipment ......................................................................... 66
2.1.7. Transgenic Mouse and MEF sources .................................... 66
2.2. Methods ................................................................................... 67
2.2.1. Mouse Colony Management ................................................ 67
2.2.2. Mouse Colony Characterisation ............................................ 67
Ph.D. Thesis 2012 Alan Carter
3
2.2.3. LPS Induced Organ Damage ............................................... 68
2.2.4. Induction of Immune Response ........................................... 68
2.2.5. Establishment of MEF cultures from mouse embryos ............ 68
2.2.6. MEF culture........................................................................ 70
2.2.7. Treatment of MEFs with LPS ............................................... 70
2.2.8. Genomic DNA extraction ..................................................... 71
2.2.9. Polymerase Chain Reaction (PCR) Genotyping ...................... 71
2.2.10. Agarose Gel Electrophoresis .............................................. 72
2.2.11. RNA extraction ................................................................. 72
2.2.12. Reverse transcription (RT) ................................................ 73
2.2.13. Protein Analysis ................................................................ 73
2.2.13.1. Protein extraction from mouse tissues ......................... 73
2.2.13.2. Protein quantification .................................................. 74
2.2.13.3. Western blot .............................................................. 74
2.2.13.4. ELISA ........................................................................ 75
2.2.13.5. Myeloperoxidase Assay ............................................... 76
2.2.13.6. Malondialdehyde Assay ............................................... 76
2.2.13.7. Glutathione Assay....................................................... 77
2.2.14. Statistical Analysis ............................................................ 78
3. Mouse models: Generation and characterisation .................... 79
3.1. Introduction ............................................................................. 79
3.1.1. Aims .................................................................................. 80
3.2. Results .................................................................................... 81
3.2.1. NEIL1 Mouse Colony........................................................... 81
3.2.1.1. Preparation of NEIL1 Knockout Mice. ............................. 81
3.2.1.2. Confirmation of Genotype. ............................................ 82
3.2.1.3. Viability and Mortality of NEIL1 mice. ............................ 84
3.2.1.4. NEIL1 Mouse Weights .................................................. 85
3.2.2. NEIL2 Mouse Colony........................................................... 91
3.2.2.1. Genotyping .................................................................. 91
3.2.2.2. Western and RT-PCR .................................................... 92
3.2.3. OGG1 Mouse Colony ........................................................... 94
3.2.3.1. OGG1 Mouse Genotyping .............................................. 94
3.3. Discussion ................................................................................ 95
4. Cytokine Output of DNA Glycosylase Disrupted Cells ........... 101
4.1. Introduction ............................................................................ 101
4.1.1. Aims ................................................................................. 102
4.2. Results ................................................................................... 102
4.2.1. TLR4 mRNA Transcription Analysis ..................................... 102
4.2.2. Cytokine Output from LPS Challenged MEF Cells ................. 103
4.3. Discussion ............................................................................... 108
5. Effects of NEIL1 Gene Knockout on Endotoxin Induced Inflammation ............................................................................. 113
5.1. Introduction ............................................................................ 113
5.1.1. Aims ................................................................................. 114
5.2. Results ................................................................................... 114
5.2.1. Cytokine Output in LPS Challenged NEIL1-/- Mice ................. 114
5.2.2. Myeloperoxidase activity in LPS challenged NEIL1-/- mice ..... 118
Ph.D. Thesis 2012 Alan Carter
4
5.2.3. Malondialdehyde content in LPS challenged NEIL1-/- mice .... 126
5.2.4. Glutathione levels in LPS challenged NEIL1-/- mice ............... 133
5.2.5. Age related cytokine output NEIL1-/- mice ........................... 141
5.3. Discussion ............................................................................... 141
6. Effects of OGG1 Gene Knockout on Endotoxin Induced Inflammation ............................................................................. 153
6.1. Introduction ............................................................................ 153
6.1.1. Aims ................................................................................. 154
6.2. Results ................................................................................... 154
6.2.1. Cytokine Output in LPS Challenged OGG1-/- Mice ................. 154
6.2.2. Myeloperoxidase Activity in LPS Challenged OGG1-/- Mice ..... 159
6.2.3. Malondialdehyde Content in LPS Challenged OGG1-/- Mice .... 167
6.2.1. Glutathione Activity in LPS Challenged OGG1-/- Mice ............ 174
6.3. Discussion ............................................................................... 182
7. Overall Discussion ................................................................. 190
8. References……………………………………………………………….202
Main text word count including figures and tables : 41,001
Ph.D. Thesis 2012 Alan Carter
5
Index of Figures
Figure 1.1: A schematic view of the structure of LPS 20
Figure 1.2: The Recognition of LPS and Activation of the Immune
Response in Macrophages 22
Figure 1.3: Generation of Antimicrobial Reactive Oxygen and Reactive
Nitrogen Species 26
Figure 1.4: Differences in Three Dimensional Shape of LPS from
Different Sources 28
Figure 1.5: Hypothesis linking Lipid A configuration to Cytokine Output
29
Figure 1.6: Comparison of Changes to Cytokine Production after LPS
Stimulation in PARP1 and OGG1 Knockout Mice 33
Figure 1.7: Production of Superoxide Radical and Hydrogen Peroxide by
the Electron Transport Chain 35
Figure 1.8: The Fenton Reaction 37
Figure 1.9: Formation of Oxidised Guanine Products 38
Figure 1.10: 8-oxoG paired with cytosine and mispaired with adenine 39
Figure 1.11: Formation of Oxidised Adenine Products 39
Figure 1.12: Formation of Oxidised Thymine Products 40
Figure 1.13: Formation of Oxidised Cytosine Products 41
Figure 1.14: Formation of an AP site 42
Figure 1.15: Lipid Peroxidation 43
Figure 1.16: Composition of malondialdehyde and 4-hydrooxyalkenal 44
Figure 1.17: Monofunctional DNA glycosylase BER (I), bifunctional
APE1 dependant BER (II) and independent (III) pathways
46
Figure 1.18: Sequence alignment of critical domains of NEIL1 and NEIL2
with E. coli Nei/Fpg 54
Figure 3.1: Diagram of the NEIL1 Knockout Construct and Genotyping
Results 81
Figure 3.2: Pedegree of NEIL1-/- Mice 82
Figure 3.3: Confirmation of a NEIL1 Null Phenotype 83
Ph.D. Thesis 2012 Alan Carter
6
Figure 3.4: The distribution of genotypes from HET x HET breeding
pairs of NEIL1 Transgenic Mice 84
Figure 3.5: Average litter composition from NEIL1 colony 85
Figure 3.6: Mortality rates of Male and Female Neil1 Transgenic Mice 86
Figure 3.7: NEIL1 Transgenic male and female mouse weights over 12
Months 87
Figure 3.8: Length and BMI of NEIL1 Transgenic Mice 88
Figure 3.9: Male NEIL1 transgenic mouse organ weight comparisons 89
Figure 3.10: Female NEIL1 transgenic mouse organ weight comparisons
90
Figure 3.11: Diagram of the NEIL2 Knockout Construct and Genotyping
Results 92
Figure 3.12: Confirmation of a NEIL2 Null Phenotype 93
Figure 3.13: Diagram of the OGG1 Knockout Construct and Genotyping
Results 94
Figure 3.14: The creation of transgenic mice can result in linkage
disequilibrium 97
Figure 4.1: RT-PCR for TLR4 102
Figure 4.2: IL-6 output of wildtype and knockout MEF cell lines 105
Figure 4.3: IL-10 output of wildtype and knockout MEF cell lines 106
Figure 4.4: MCP-1 output of wildtype and knockout MEF cell lines 107
Figure 5.1: IL-4 concentrations in blood serum taken from NEIL1
transgenic mice 115
Figure 5.2: IL-6 concentrations in blood serum taken from NEIL1
transgenic mice 116
Figure 5.3: IL-10 concentrations in blood serum taken from NEIL1
transgenic mice 117
Figure 5.4: IL-12 concentrations in blood serum taken from NEIL1
transgenic mice 118
Figure 5.5: MPO activity in heart tissues of NEIL1 transgenic mice
exposed to LPS 121
Ph.D. Thesis 2012 Alan Carter
7
Figure 5.6: MPO activity levels in lung tissues of NEIL1 transgenic mice
exposed to LPS 122
Figure 5.7: MPO activity in liver tissues of NEIL1 transgenic mice exposed
to LPS 123
Figure 5.8: MPO activity in kidney tissues of NEIL1 transgenic mice
exposed to LPS 124
Figure 5.9: MPO activity in ileum tissues of NEIL1 transgenic mice
exposed to LPS 125
Figure 5.10: MDA levels in heart tissues of NEIL1 transgenic mice exposed
to LPS 128
Figure 5.11: MDA levels in lung tissues of NEIL1 transgenic mice exposed
to LPS 129
Figure 5.12: MDA levels in liver tissues of NEIL1 transgenic mice exposed
to LPS 130
Figure 5.13: MDA levels in kidney tissues of NEIL1 transgenic mice
exposed to LPS 131
Figure 5.14: MDA levels in ileum tissues of NEIL1 transgenic mice exposed
to LPS 132
Figure 5.15: GSH levels in heart tissues of NEIL1 transgenic mice exposed
to LPS 135
Figure 5.16: GSH levels in lung tissues of NEIL1 transgenic mice exposed
to LPS 136
Figure 5.17: GSH levels in liver tissues of NEIL1 transgenic mice exposed
to LPS 137
Figure 5.18: GSH levels in kidney tissues of NEIL1 transgenic mice
exposed to LPS 138
Figure 5.19: GSH levels in ileum tissues of NEIL1 transgenic mice exposed
to LPS 139
Figure 5.20: IL-4 concentrations in blood serum taken from NEIL1
transgenic mice 142
Figure 5.21: IL-6 concentrations in blood serum taken from NEIL1
transgenic mice 143
Ph.D. Thesis 2012 Alan Carter
8
Figure 5.22: IL-10 concentrations in blood serum taken from NEIL1
transgenic mice 144
Figure 5.23: IL-12 concentrations in blood serum taken from NEIL1
transgenic mice 145
Figure 6.1: IL-4 concentrations in blood serum taken from OGG1
transgenic mice 155
Figure 6.2: IL-6 concentrations in blood serum taken from OGG1
transgenic mice 156
Figure 6.3: IL-10 concentrations in blood serum taken from OGG1
transgenic mice 157
Figure 6.4: IL-12 concentrations in blood serum taken from OGG1
transgenic mice 158
Figure 6.5: MPO activity in heart tissues of OGG1 transgenic mice
exposed to LPS 161
Figure 6.6: MPO activity in lung tissues of OGG1 transgenic mice exposed
to LPS 162
Figure 6.7: MPO activity levels in liver tissues of OGG1 transgenic mice
exposed to LPS 163
Figure 6.8: MPO activity in kidney tissues of OGG1 transgenic mice
exposed to LPS 164
Figure 6.9: MPO activity in ileum tissues of OGG1 transgenic mice
exposed to LPS 165
Figure 6.10: MDA levels in heart tissues of OGG1 transgenic mice exposed
to LPS 169
Figure 6.11: MDA levels in lung tissues of OGG1 transgenic mice exposed
to LPS 170
Figure 6.12: MDA levels in liver tissues of OGG1 transgenic mice exposed
to LPS 171
Figure 6.13: MDA levels in kidney tissues of OGG1 transgenic mice
exposed to LPS 172
Figure 6.14: MDA levels in ileum tissues of OGG1 transgenic mice exposed
to LPS 173
Ph.D. Thesis 2012 Alan Carter
9
Figure 6.15: GSH levels in heart tissues of OGG1 transgenic mice exposed
to LPS 177
Figure 6.16: GSH levels in lung tissues of OGG1 transgenic mice exposed
to LPS 178
Figure 6.17: GSH levels in liver tissues of OGG1 transgenic mice exposed
to LPS 179
Figure 6.18: GSH levels in kidney tissues of OGG1 transgenic mice
exposed to LPS 180
Figure 6.19: GSH levels in ileum tissues of OGG1 transgenic mice exposed
to LPS 181
Figure 6.20: Pathways involved in the generation and degradation of
oxidants and the effects of OGG1 knockout at key
endpoints 184
Figure 6.21: Proposed model of PARP-1 inhibition by oestrogen 188
Figure 7.1: Alterations in organ activity due to adrenaline and observed
levels of GSH in NEIL1-/- mice 197
Ph.D. Thesis 2012 Alan Carter
10
Index of Tables
Table 1.1: The generation of major ROS and major avenues of protection
36
Table 1.2: Human DNA glycosylases located in the nuclei and the DNA
damage that they remove 48
Table 2.1: Molecular Biology Buffers 61
Table 2.2: Protein Analysis Buffers 62
Table 2.3: Tissue Culture Media 62
Table 2.4: PCR Genotyping Primers 63
Table 2.5: RT-PCR Primers 64
Table 3.1: Summary of Phenotypes of DNA Glycosylase Deficient Mice 100
Table 4.1: Comparison of IL-6 results between untreated and treated DNA
glycosylase deficient MEF cells 105
Table 4.2: Comparison of IL-10 results between untreated and treated
DNA glycosylase deficient MEF cells 106
Table 4.3: Comparison of MCP-1 results between untreated and treated
DNA glycosylase deficient MEF cells 107
Table 4.4 Summary of Results from cytokine assays 108
Table 5.1: MPO activity in tissues of NEIL1 transgenic mice exposed to LPS
120
Table 5.2: MDA levels in tissues of NEIL1 transgenic mice exposed to LPS
127
Table 5.3: GSH levels in tissues of NEIL1 transgenic mice exposed to LPS
134
Table 5.4: Summary of NEIL1 transgenic mouse blood serum cytokine
Results 146
Table 5.5: Summary of NEIL1 transgenic mouse organ damage results
147
Table 6.1: MPO activity in tissues of OGG1 transgenic mice exposed to LPS
160
Ph.D. Thesis 2012 Alan Carter
11
Table 6.2: MDA levels in tissues of OGG1 transgenic mice exposed to LPS
168
Table 6.3: GSH levels in tissues of OGG1 transgenic mice exposed to LPS
175
Table 6.4: Summary of OGG1 transgenic mouse cytokine Results 182
Table 6.5: Summary of OGG1 transgenic mouse organ damage results
183
Table 7.1: Summary and comparison of NEIL1 and OGG1 cytokine output
results when compared with those of WT animals 191
Table 7.2: Summary and comparison of NEIL1 and OGG1 organ damage
results 192
Ph.D. Thesis 2012 Alan Carter
12
List of Abbreviations
2-OH-A 2-hydroxyadenine
5′dRP 5′-deoxyribose-5-phosphate
5,6-DHU 5,6-dihydrouracil
5-FoU 5-formyluracil
5-FU 5-fluorouracil
5-HMU 5-hydroxymethyluracil
5-OHC 5-hydroxycystosine
5-OHU 5-hydroxyuracil
8-oxoA 7,8-dihydro-8-oxoadenine
8-oxoG 7,8-dihydro-8-oxoguanine
AP-1 Activator protein 1
APE1 Apurinic endonuclease 1
AP site Apurinic/apyrimidinic sites
BPI Bactericidal/permeability-increasing protein
Cg Cytosine glycol
DEP Diesel exhaust particles
ddH2O Double distilled water
DMSO Dimethyl sulfoxide
DSB Double strand breaks
DTNB 5,5’-dithio-bis(2-nitrobenzoic acid)
Egr-1 Early growth response 1
ERα Oestrogen receptor-α
FapyA 4,6-diamino-5-formamidopyrimidine
FapyG 6-diamino-4-hydroxy-5-formamidoguanine
GR Glutathione reductase
GPX Glutathione peroxidise
GSH Glutathione
H2O2 Hydrogen peroxide
HAE 4-hydroxyalkenals
HET Heterozygous
Ph.D. Thesis 2012 Alan Carter
13
HhH Helix-hairpin-helix
IFN-γ Interferon γ
IL-1 Interleukin 1
iNOS inducible nitric oxide synthase
IRAK Interleukin-1 receptor-associated kinase
KDO 2-keto-3-deoxyoctonic acid
KO Knockout
KPE Potassium phosphate EDTA
LBP LPS binding protein
LPS Lipopolysaccharide
MAC Membrane attack complex
MAPK1 Mitogen-activated protein kinase 1
MAPK8/JNK Mitogen-activated protein kinase 8
MDA Malondialdehyde
MIP1α Macrophage inflammatory protein 1
MMR Mismatch repair
MPG N-methylpurine-DNA glycosylase
MPO Myeloperoxidase
MyD88 Myeloid differentiation primary response gene
88
NADPH Nicotinamide adenine dinucleotide phosphate
NER Nucleotide excision repair
NEIL1/2 Nei endonuclease VIII-like 1/2
NFκβ Nuclear factor κβ
NO Nitric oxide
NOX NADPH oxidase
NTH1 Nth endonuclease III-like
O-2 Superoxide
OGG1 8-Oxoguanine glycosylase
PARP1 Poly (ADP-Ribose) Polymerase-1
PBS Phosphate buffered saline
PCNA Proliferating cell nuclear antigen
Ph.D. Thesis 2012 Alan Carter
14
PCR Polymerase chain reaction
PNK Polynucleotide kinase
Pol β DNA polymerase β
PUA 3′-phospho-α,β-unsaturated aldehyde
RPA Replication protein A
RT-PCR Reverse transcriptase - PCR
ROS Reactive oxygen species
SOD Superoxide dismutase
SMUG1 Single-strand selective Monofunctional Uracil
DNA Glycosylase
SSB Single strand breaks
TEMED N,N,N,N-tetramethyl-ethylenediamine
Tg Thymine glycol
Th1 T-helper 1
Th2 T helper 2
TLR4 Toll like receptor 4
TNF-α Tumour necrosis factor α
TRAF6 TNF receptor associated factor
Ug Uracil glycol
UNG2 Uracil-DNA glycosylase 2
WT Wildtype
Ph.D. Thesis 2012 Alan Carter
15
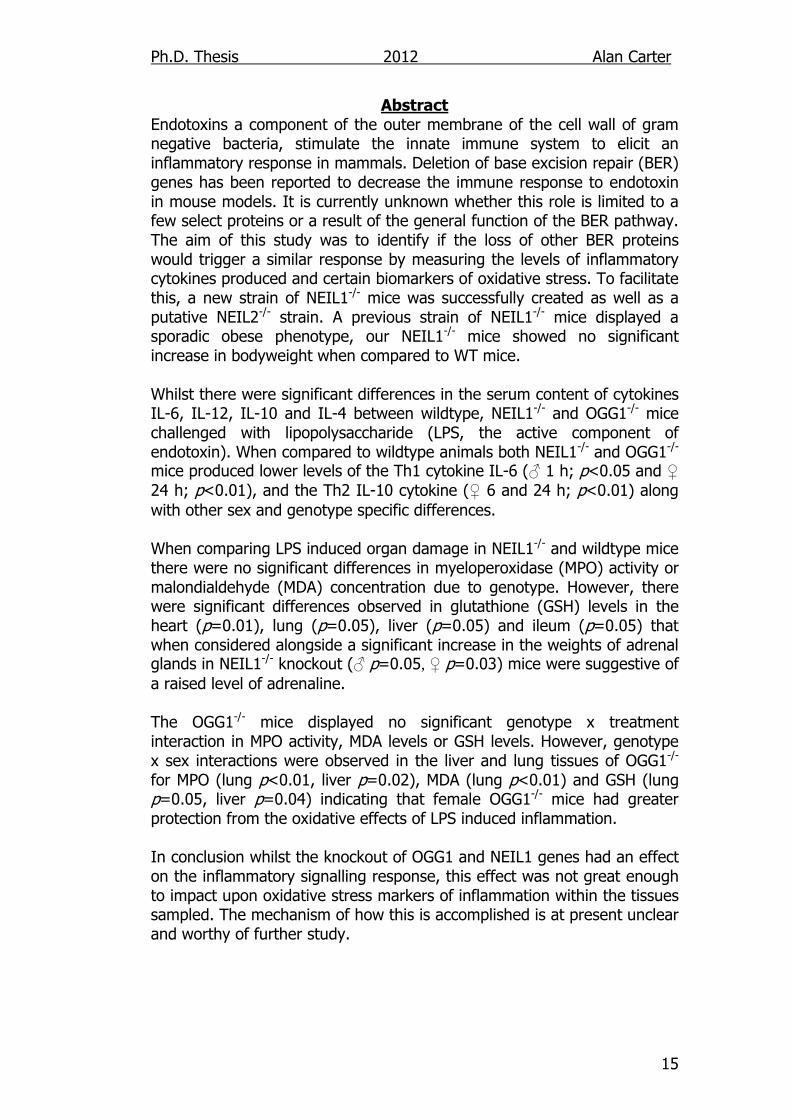
Abstract Endotoxins a component of the outer membrane of the cell wall of gram negative bacteria, stimulate the innate immune system to elicit an inflammatory response in mammals. Deletion of base excision repair (BER) genes has been reported to decrease the immune response to endotoxin in mouse models. It is currently unknown whether this role is limited to a few select proteins or a result of the general function of the BER pathway. The aim of this study was to identify if the loss of other BER proteins would trigger a similar response by measuring the levels of inflammatory cytokines produced and certain biomarkers of oxidative stress. To facilitate this, a new strain of NEIL1-/- mice was successfully created as well as a putative NEIL2-/- strain. A previous strain of NEIL1-/- mice displayed a sporadic obese phenotype, our NEIL1-/- mice showed no significant increase in bodyweight when compared to WT mice. Whilst there were significant differences in the serum content of cytokines IL-6, IL-12, IL-10 and IL-4 between wildtype, NEIL1-/- and OGG1-/- mice challenged with lipopolysaccharide (LPS, the active component of endotoxin). When compared to wildtype animals both NEIL1-/- and OGG1-/- mice produced lower levels of the Th1 cytokine IL-6 (♂ 1 h; p<0.05 and ♀ 24 h; p<0.01), and the Th2 IL-10 cytokine (♀ 6 and 24 h; p<0.01) along with other sex and genotype specific differences. When comparing LPS induced organ damage in NEIL1-/- and wildtype mice there were no significant differences in myeloperoxidase (MPO) activity or malondialdehyde (MDA) concentration due to genotype. However, there were significant differences observed in glutathione (GSH) levels in the heart (p=0.01), lung (p=0.05), liver (p=0.05) and ileum (p=0.05) that when considered alongside a significant increase in the weights of adrenal glands in NEIL1-/- knockout (♂ p=0.05, ♀ p=0.03) mice were suggestive of a raised level of adrenaline. The OGG1-/- mice displayed no significant genotype x treatment interaction in MPO activity, MDA levels or GSH levels. However, genotype x sex interactions were observed in the liver and lung tissues of OGG1-/- for MPO (lung p<0.01, liver p=0.02), MDA (lung p<0.01) and GSH (lung p=0.05, liver p=0.04) indicating that female OGG1-/- mice had greater protection from the oxidative effects of LPS induced inflammation. In conclusion whilst the knockout of OGG1 and NEIL1 genes had an effect on the inflammatory signalling response, this effect was not great enough to impact upon oxidative stress markers of inflammation within the tissues sampled. The mechanism of how this is accomplished is at present unclear and worthy of further study.
Ph.D. Thesis 2012 Alan Carter
16
Declaration “No portion of the work referred to in the thesis has been submitted in
support of an application for another degree or qualification of this or
any other university or other institute of learning.”
Copyright Statement
(i) The author of this thesis (including any appendices and/or schedules to
this thesis) owns any copyright in it (the “Copyright”) and s/he has given
TheUniversity of Manchester the right to use such Copyright for any
administrative, promotional, educational and/or teaching purposes.
(ii) Copies of this thesis, either in full or in extracts, may be made only in
accordance with the regulations of the John Rylands University Library of
Manchester. Details of these regulations may be obtained from the
Librarian. This page must form part of any such copies made.
(iii) The ownership of any patents, designs, trade marks and any and all
other intellectual property rights except for the Copyright (the “Intellectual
Property Rights”) and any reproductions of copyright works, for example
graphs and tables (“Reproductions”), which may be described in this
thesis, may not be owned by the author and may be owned by third
parties. Such Intellectual Property Rights and Reproductions cannot and
must not be made available for use without the prior written permission of
the owner(s) of the relevant Intellectual Property Rights and/or
Reproductions.
(iv) Further information on the conditions under which disclosure,
publication and exploitation of this thesis, the Copyright and any
Intellectual Property Rights and/or Reproductions described in it may take
place is available from the Head of School of Medicine.
Ph.D. Thesis 2012 Alan Carter
17
Acknowledgements
I would like to thank my supervisors Dr. Andrew Povey and Dr. Rhoderick
Elder, for their guidance and support throughout the course of this
research project, and my advisor Dr. Rachel Watson. I would also like to
thank the British Cotton Growing Association for providing the funding to
make this work possible.
I would also like to acknowledge the help I received from the members of
staff at the Transgenic Animals Facility at The University of Manchester,
especially Ian Townsend, Ruth Jones and Karen Fry. Also special thanks
should go to those who helped me learn some of the finer techniques Dr.
Mel Heeran and Brian A. Tefler.
A special mention should go to my colleagues in the Biomarkers Lab who
in addition to giving me moral support made the atmosphere we worked
in fun, a special thanks to W.M. Md. Saad whose work on the confirmation
of the NEIL2 knockout is found within. Finally I would like to thank all my
family and friends who supported me through their kind (and sometimes
less than kind - but needed) advice, caring words and thoughtful actions.
Ph.D. Thesis 2012 Alan Carter
18
1. Introduction
Cotton workers, and other workers exposed to organic dusts, have been
observed to exhibit byssinosis (Mberikunashe et al., 2010; McKERROW et
al., 1958; ROACH and SCHILLING 1960). Symptoms include coughing,
shortness of breath and difficulty breathing. These were more pronounced
when the persons returned to work after the weekend, and then subsided
the following day leading to the moniker “Monday Asthma” (Liu, 2007).
Originally it was assumed that this was due to a build up of plant matter in
the airways of these workers (ROACH and SCHILLING 1960), but later it
was found to be due to the presence of endotoxins, potent inducers of
neutrophilic airway inflammation, carried on the dust (Cavagna et al.,
1969; Radon, 2006). Smokers can also exhibit similar symptoms due to
endotoxin carried with the smoke particles from tobacco (Hasday et al.,
1999). A person’s sensitivity to endotoxin induced inflammation has been
shown to be affected by their genetic makeup (Eder et al., 2004).
Endotoxin is composed of complexes of lipooligosaccharrides, lipoproteins
and lipopolysacharide (LPS), a substance found exclusively as part of the
outer membrane of the cell wall of gram negative bacteria; indeed 3-10%
of the dry weight of these bacteria is endotoxin (Fan and Cook 2004;
Vaara, 1999). All sources of gram negative phospholipid contain this
substance including blebs, vesicles and fragments of dead cells (Prins,
1996; Radon, 2006; Vaara, 1999). Hence humans can therefore be
exposed to LPS in several ways including working in the presence of
organic dust, smoking, exposure to invasive gram negative bacteria via
injury, and exposure to intestinal bacteria during surgery (Beutler and
Rietschel 2003; Hasday et al., 1999).
Endotoxin activates the innate immune system, that portion of the
immune system which defends the host from organisms in a generic

Ph.D. Thesis 2012 Alan Carter
19
manner, in an attempt to destroy any bacterial invaders. Once bacteria are
killed, however, the endotoxins in their membrane continue to stimulate
the immune system fuelling further response (Prins, 1996). This escalating
response can lead to severe systemic inflammation, which manifests as
fever, increased heart and respiratory rates, and is described as endotoxic
(septic) shock (Beutler and Rietschel 2003). In order to understand why
this occurs, it is important to further discuss the structure of endotoxin
and the immune response to it, in further detail.
1.1. Structure of Endotoxin
Endotoxin refers to a mixture of bacterial cell surface molecules mainly
consisting of LPS but including lipooligosaccharrides and lipoproteins.
Alternatively, the term LPS refers to a pure substance which is not found
in nature. The structure of LPS is shown in Figure 1.1. The molecule
consists of four major domains, an O-antigenic polysaccharide, an outer
core oligosaccharide, an inner core oligosaccharide and an acylated
diglucosamine head group (lipid A) (Rietschel et al., 1994).
The O-antigenic polysaccharide consists of a repeating structure of one to
eight glycosyl residues, the structure of which varies between serotypes.
The size range of the O-antigenic polysaccharide chain is comparatively
specific to a bacterial species although there is some heterogeneity, even
within LPS from the same colony, in the length of these molecules. This is
seen as an evolutionary measure in order to protect the bacterium from
complement immune measures and phagocytosis by macrophages
(Aspinall et al., 1996; Beutler and Rietschel 2003; Rietschel et al., 1994).
The outer core oligosaccharide consists of the common hexoses D-
glucose, D-galactose, and N-acetyl-D-glucosamine. It is more uniform in
composition than the O-antigenic polysaccharide and indeed only five
different core types have been found in E. coli serotypes (Aspinall et al.,
1996; Rietschel et al., 1994). The inner core oligosaccharide is composed
Ph.D. Thesis 2012 Alan Carter
20
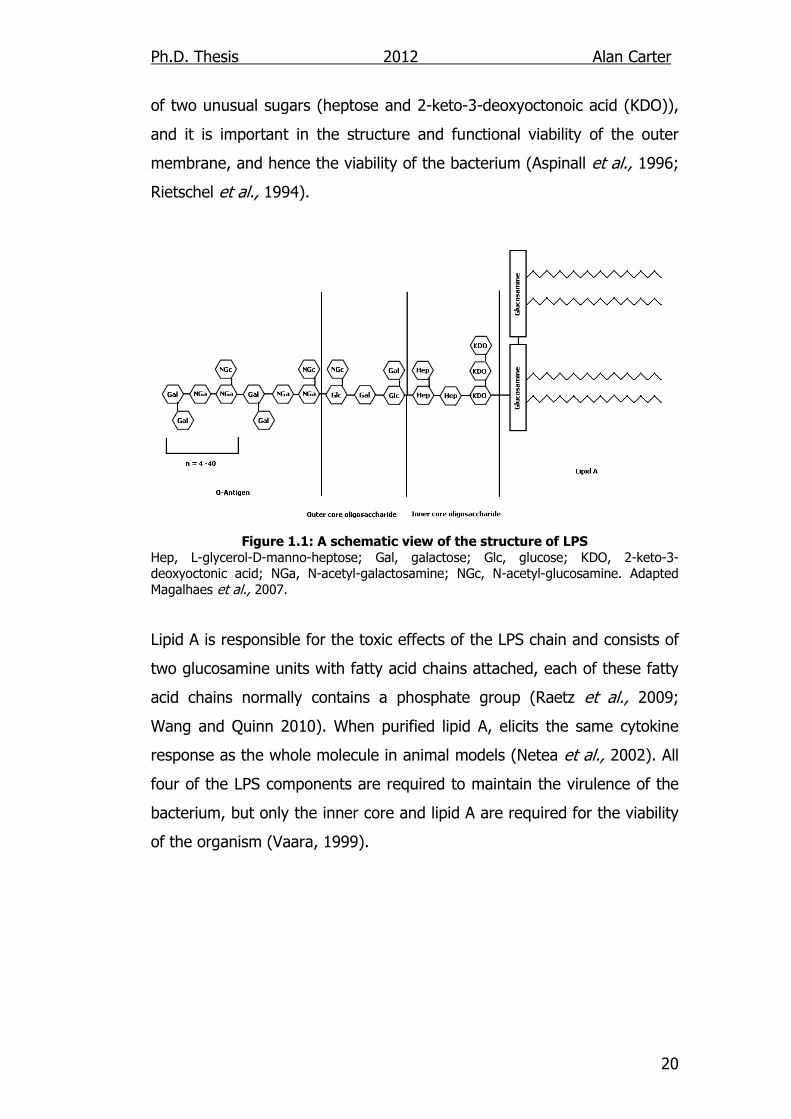
of two unusual sugars (heptose and 2-keto-3-deoxyoctonoic acid (KDO)),
and it is important in the structure and functional viability of the outer
membrane, and hence the viability of the bacterium (Aspinall et al., 1996;
Rietschel et al., 1994).
Figure 1.1: A schematic view of the structure of LPS
Hep, L-glycerol-D-manno-heptose; Gal, galactose; Glc, glucose; KDO, 2-keto-3-deoxyoctonic acid; NGa, N-acetyl-galactosamine; NGc, N-acetyl-glucosamine. Adapted Magalhaes et al., 2007.
Lipid A is responsible for the toxic effects of the LPS chain and consists of
two glucosamine units with fatty acid chains attached, each of these fatty
acid chains normally contains a phosphate group (Raetz et al., 2009;
Wang and Quinn 2010). When purified lipid A, elicits the same cytokine
response as the whole molecule in animal models (Netea et al., 2002). All
four of the LPS components are required to maintain the virulence of the
bacterium, but only the inner core and lipid A are required for the viability
of the organism (Vaara, 1999).

Ph.D. Thesis 2012 Alan Carter
21
1.2. Endotoxin Induced Inflammation
1.2.1. LPS Recognition
The inflammatory response is an innate response generally to invasive
pathogens, and occurs in two forms namely, an acute response which is
direct response to a stimuli, e.g. tissue damage, and a chronic response
which can lead to arthritis and the wasting associated with certain cancers
(Gupta et al., 2011; Matsukawa et al., 1997).
Endotoxin is recognised by host cells after binding to recognition sites on
their membranes, a process which requires the mediation of LPS-binding
protein (LBP). In vitro, without LBP, large concentrations (>1mg/ml) of
LPS are needed to activate macrophages. In vivo however, due to the
presence of LBP, only nanogram amounts of LPS are required for cellular
recognition, and an inflammatory response (Moore et al., 1976; Watson
and Riblet 1974; Watson and Riblet 1975).
LBP shares many features with other phospholipid binding proteins, and
works mainly as a transport protein. LBP first breaks down endotoxin from
large complexes so that separated LPS molecules can be transported to
target receptor, CD14/toll like receptor 4 (TLR4) as shown in Figure 1.2
(Paulos et al., 2007). Alternatively the LPS is transported by LBP to high-
density lipoproteins where it becomes unable to activate the immune
response and is removed from the system. Thus LBP is important for both
the recognition and removal of LPS (Beutler and Rietschel 2003; Martin,
2000).
1.2.2. Activation of the inflammatory response
One of the primary signalling cells in the LPS inflammatory response is the
monocyte which is present in all tissues (Butterfield et al., 2006). TLR4
having recognised LPS, then activates a number of proteins including
NADPH oxidase (NOX) proteins which catalyse the formation of superoxide
Ph.D. Thesis 2012 Alan Carter
22
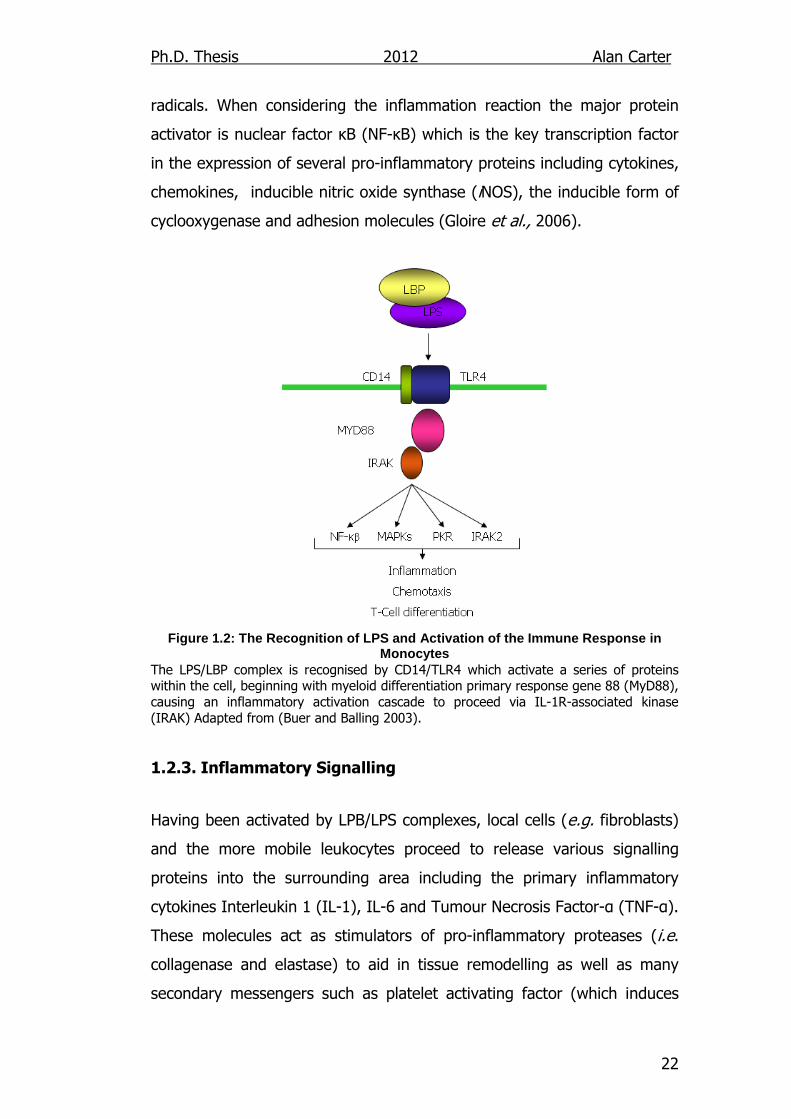
radicals. When considering the inflammation reaction the major protein
activator is nuclear factor κB (NF-κB) which is the key transcription factor
in the expression of several pro-inflammatory proteins including cytokines,
chemokines, inducible nitric oxide synthase (iNOS), the inducible form of
cyclooxygenase and adhesion molecules (Gloire et al., 2006).
Figure 1.2: The Recognition of LPS and Activation of the Immune Response in
Monocytes The LPS/LBP complex is recognised by CD14/TLR4 which activate a series of proteins within the cell, beginning with myeloid differentiation primary response gene 88 (MyD88), causing an inflammatory activation cascade to proceed via IL-1R-associated kinase
(IRAK) Adapted from (Buer and Balling 2003).
1.2.3. Inflammatory Signalling
Having been activated by LPB/LPS complexes, local cells (e.g. fibroblasts)
and the more mobile leukocytes proceed to release various signalling
proteins into the surrounding area including the primary inflammatory
cytokines Interleukin 1 (IL-1), IL-6 and Tumour Necrosis Factor-α (TNF-α).
These molecules act as stimulators of pro-inflammatory proteases (i.e.
collagenase and elastase) to aid in tissue remodelling as well as many
secondary messengers such as platelet activating factor (which induces
Ph.D. Thesis 2012 Alan Carter
23
vasodilation and wound healing), prostaglandins (to induce vasodilation)
and reactive oxygen species (ROS; increasing proinflammatory cytokine
release) (Moller and Villiger 2006; Naik and Dixit 2011).
The release of the prostaglandins PGE2 and PGF2 influences the
contraction and relaxation of the blood vessels leading to greater vascular
permeability (vasodilation;(Williams, 1979)). The subsequent movement of
fluids influences several physiological changes including a raise in local
temperature, and the movement of neutrophils and macrophages from the
blood stream to the local areas. These cells are drawn by chemotaxis
(following concentrations of attractant proteins). Once at the source of the
chemotactic agents the neutrophils, macrophages and monocytes continue
releasing cytokoines and chemokines as well as beginning the process of
phagocytosis (DiStasi and Ley 2009).
IL-6 is often used as a measure of immune response as it is induced in
large quantities by LPS, and is released by fibroblasts (Van, 1990). Whilst
increased IL-6 levels are used to denote a greater level of inflammation, it
is in fact a pleiotropic cytokine as it acts as both a pro-inflammatory and
anti-inflammatory signal. It increases inflammation by directly increasing
macrophage activity. However, it also activates the release of
adrenocorticotrophic hormone which triggers the release of cortisol and
IL-10, both of which lead to a reduction in inflammation (Moller and
Villiger 2006).
IL-10 is also released from fibroblasts and activated macrophages, which
also release IL-12. These Th2 cytokines modulate the production of
cytokines from T lymphocytes and fibroblasts, including the
chemoattractants IL-8 and MIP-1α which recruit more neutrophils to the
surrounding area by chemotaxis (Maloney et al., 2005; Martinez et al.,
2004; Reed and Milton 2001; Wan et al., 2000; Wang et al., 2005). IL-12
increases the effectiveness of T helper 1 (Th1) cells, modulators of the
Ph.D. Thesis 2012 Alan Carter
24
innate immune system, in the area of endotoxin challenge by further
promoting the production of lymphokines and interferon-γ, which trigger
the proliferation of cytotoxic T-cells and further activate the macrophages
so that they become more aggressive. These ‘angry’ macrophages also
release proinflammatory molecules, such as IL-1 and TNF-α, at a much
greater rate (Moller and Villiger 2006).
The differentiation of T helper 2 (Th2) cells is initiated by IL-4, and these
cells then create more IL-4 in a self promoting feedback loop (Takeda et
al., 1996). The release of IL-10 increases the activity of Th2 cells which in
turn activate B-cells increasing antibody production. IL-10 also inhibits the
production of IL-12 by macrophages, thus ensuring that antibody
production is kept at a maximum and that the Th1 cells are not over-
stimulated into an auto-immune reaction (Wan et al., 2000).
1.2.3.1. Fibroblasts Fibroblasts, connective tissue cells which secrete an extracellular matrix
rich in collagen and other macromolecules had previously not been
considered to produce inflammatory substances in significant amounts.
More recently they have been shown to aid in the initiation of
inflammatory cascades throught the release of proinflammatory cytokines
such as IL-6 (Van, 1990), but their major effects on the inflammatory
response come via the induction of bone marrow derived immune cells,
such as neutrophils and macrophages, to the area of infection through the
release of chemokines such as IL-8, MCP-1 and MIP-1α (Maloney et al.,
2005; Smith et al., 1997; Wang et al., 2005).
As fibroblasts can be cultured relatively easily when compared to other
immune cells, they have become a staple in in vitro experiments
measuring cytokine secretion. For instance they have been used in
experiments to define TLR activity and specificity (Kurt-Jones et al., 2004).
Ph.D. Thesis 2012 Alan Carter
25
1.2.3.2. Human Polymophonuclear Leukocytes
Human polymorphonuclear leukocytes (neutrophils, basophils and
eosinophils) are important in the defence of the body from external
pathogens such as bacteria and fungi, and are attracted to the site of
invasion by macrophage release of IL-8, MCP-1 and Macrophage
inflammatory protein 1 (MIP-1α) (Martinez et al., 2004). Once at the site
of endotoxin challenge these cells attempt to remove bacterial invaders
directly by phagocytosis, then releasing many cytotoxic granules which
assist in the destruction and disposal of invasive organisms (Faurschou
and Borregaard 2003). Of the many granules released, two interact
directly with LPS; lysozyme which binds to LPS rendering it inactive, and
bactericidal/permeability-increasing protein (BPI) which binds to the lipid A
section of LPS, enabling other bactericides to reach the inner membrane
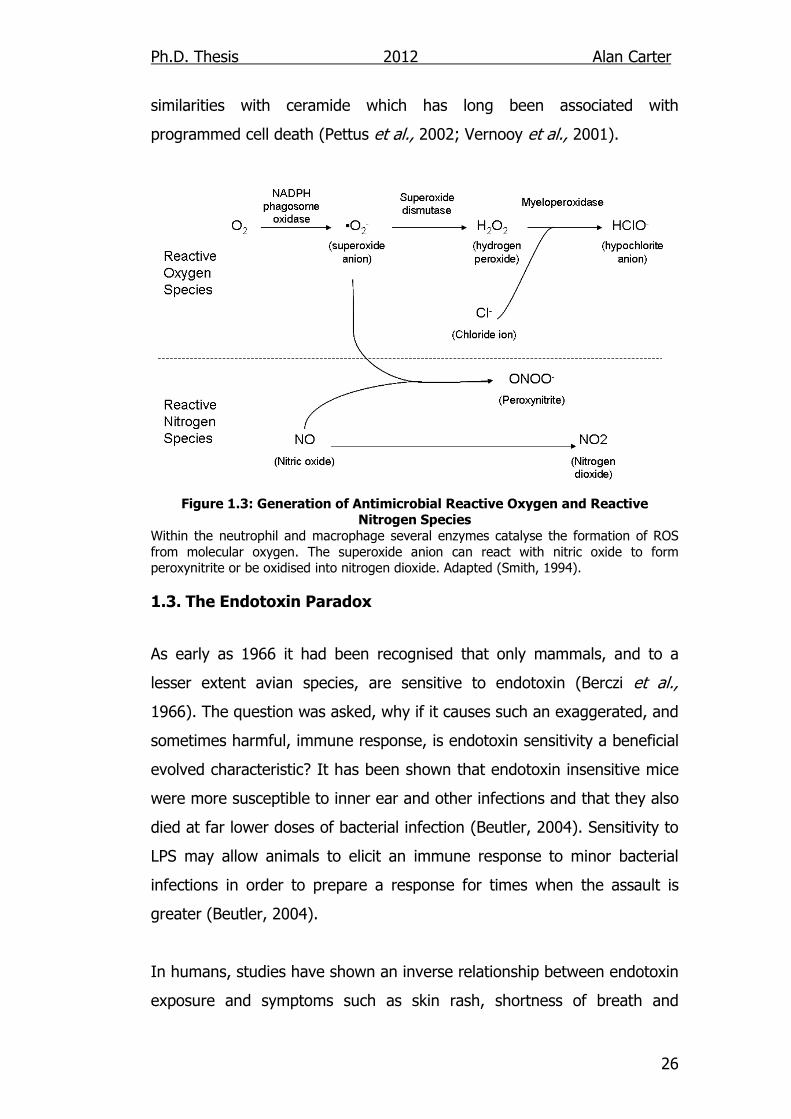
(Faurschou and Borregaard 2003). During the course of phagocytosis the
neutrophil produces ROS, including superoxide and hydrogen peroxide,
and hypochlorite which are highly effective at killing the invading organism
by directly damaging the cell (Figure 1.3) (Faurschou and Borregaard
2003).
As neutrophils are rapidly attracted to a site of bacterial invasion, great
numbers of them can accumulate and this can lead to problems when
they undergo necrotic lysis as this releases the ROS contained within the
cell (Figure 1.3). Cytotoxic compounds in one area can cause a variety of
problems including greater vascular permeability, oedema, oxidative stress
and eventually apoptosis (Vernooy et al., 2001). However, not all cellular
apoptosis is due to the action of neutrophils, as it has been shown that
LPS can stimulate lung cells to undergo apoptosis in the absence of an
inflammatory immune response. It has been proposed that the lipid A
portion of the LPS molecule can activate the apoptosis pathways due to its
Ph.D. Thesis 2012 Alan Carter
26
similarities with ceramide which has long been associated with
programmed cell death (Pettus et al., 2002; Vernooy et al., 2001).
Figure 1.3: Generation of Antimicrobial Reactive Oxygen and Reactive Nitrogen Species
Within the neutrophil and macrophage several enzymes catalyse the formation of ROS from molecular oxygen. The superoxide anion can react with nitric oxide to form peroxynitrite or be oxidised into nitrogen dioxide. Adapted (Smith, 1994).
1.3. The Endotoxin Paradox
As early as 1966 it had been recognised that only mammals, and to a
lesser extent avian species, are sensitive to endotoxin (Berczi et al.,
1966). The question was asked, why if it causes such an exaggerated, and
sometimes harmful, immune response, is endotoxin sensitivity a beneficial
evolved characteristic? It has been shown that endotoxin insensitive mice
were more susceptible to inner ear and other infections and that they also
died at far lower doses of bacterial infection (Beutler, 2004). Sensitivity to
LPS may allow animals to elicit an immune response to minor bacterial
infections in order to prepare a response for times when the assault is
greater (Beutler, 2004).
In humans, studies have shown an inverse relationship between endotoxin
exposure and symptoms such as skin rash, shortness of breath and
Ph.D. Thesis 2012 Alan Carter
27
coughing, and that in environments where endotoxin exposure occurs,
cases of asthma are reduced (Braun-Fahrlander et al., 2002). Exposure to
endotoxin and the subsequent release of cytokines may assist in the
maturation of Th1 modulated immunity reducing the risk of atopic
sensitisation (Braun-Fahrlander et al., 2002; Douwes et al., 2000;
McElvenny et al., 2011).
It has also been shown that cotton workers have less than the expected
level of lung cancers (Enterline et al., 1985; McElvenny et al., 2011). In
comparisons between animal farmers and crop farmers, it has been found
that those working with animals, who in theory are exposed to greater
quantities of endotoxin from bacteria in faeces, experience a reduced risk
of lung cancer (Lange et al., 2003). There is also epidemiological evidence
that endotoxin protects against the formation of cancer directly, those
who give up smoking experience a short period of increased lung cancer
risk (Lange et al., 2005), and it is believed that once smoking ceases this
protective effect of endotoxin no longer acts on cancers already initiated
by the carcinogenic compounds in cigarette smoke (Lange et al., 2005).
As a result has been hypothesised that the direct or indirect activity of
endotoxin reduces the ability of cancers to develop (Lange et al., 2005).
In two studies, rabbits and guinea pigs were exposed to airborne
endotoxins and the metastasis levels within the lungs were measured. In
both cases the animals exposed to endotoxin had significantly reduced
levels of cancer (Rylander, 2002).
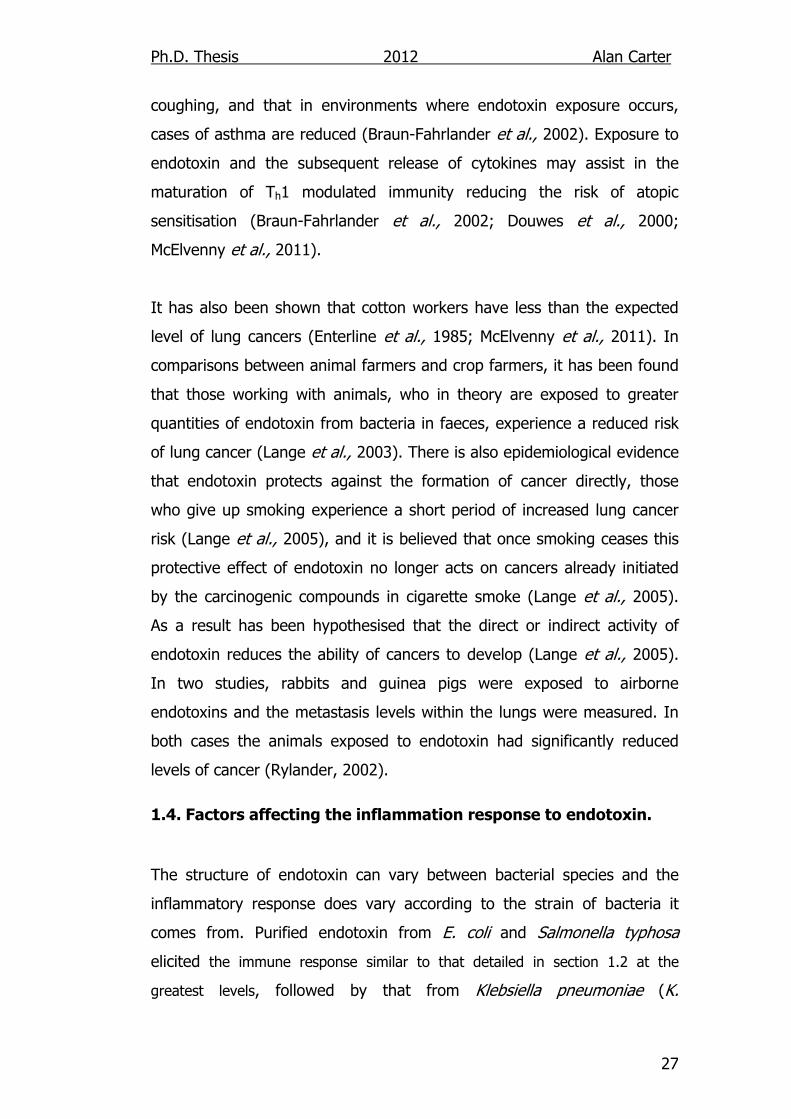
1.4. Factors affecting the inflammation response to endotoxin. The structure of endotoxin can vary between bacterial species and the
inflammatory response does vary according to the strain of bacteria it
comes from. Purified endotoxin from E. coli and Salmonella typhosa
elicited the immune response similar to that detailed in section 1.2 at the
greatest levels, followed by that from Klebsiella pneumoniae (K.
Ph.D. Thesis 2012 Alan Carter
28
pneumoniae) and Pseuudomonas aeruginosa (P. aeruginosa). Additionally,
the response over time was significantly different according to which
‘species’ of LPS was administered. Specifically, treatment with endotoxin
from K. pneumoiae caused a comparatively higher IL-1β, IL-10 and MCP-1
production, and a reduction in the amount of TNF-α secreted. More
extremely, endotoxin from P. aeruginosa, only stimulated the release of
MIP-1α and IL-1β after 4 and 8 hours respectively, whilst exhibiting almost
no response in the release of TNF-α, interferon γ (IFN-γ) or IL-10 at any
time point whilst all other LPSs tested initiated reactions after 4h (Mathiak
et al., 2003; Schromm et al., 1998).
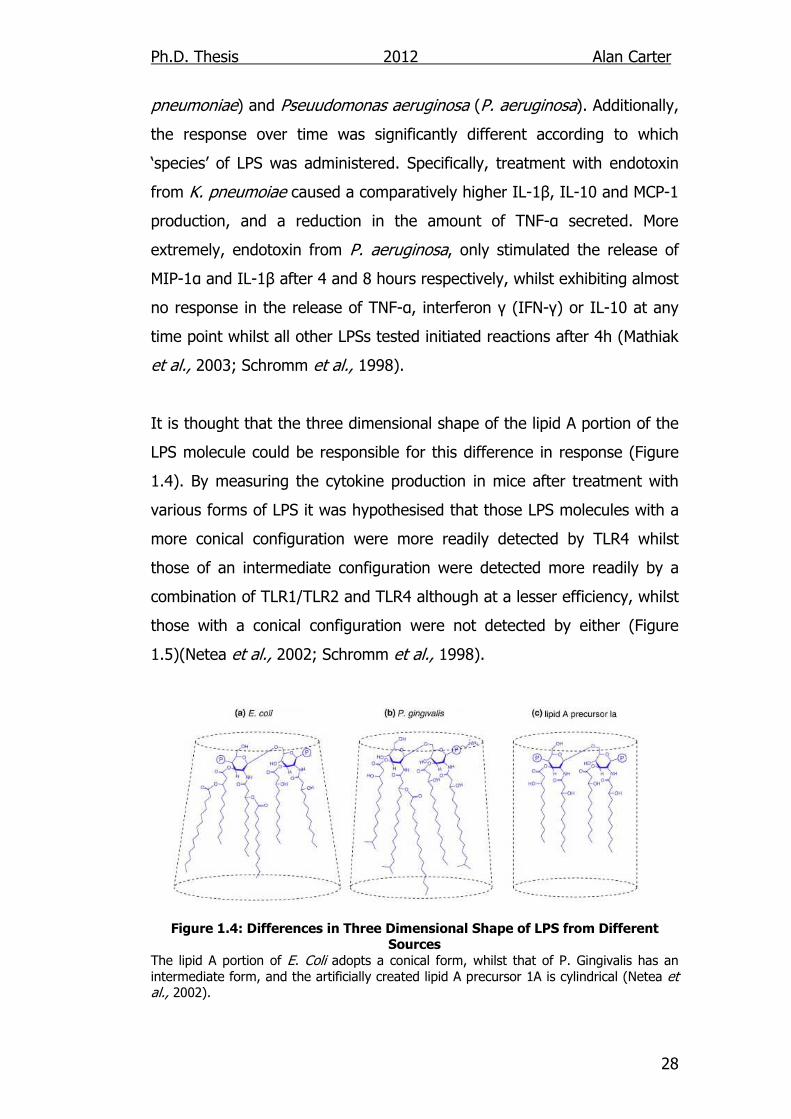
It is thought that the three dimensional shape of the lipid A portion of the
LPS molecule could be responsible for this difference in response (Figure
1.4). By measuring the cytokine production in mice after treatment with
various forms of LPS it was hypothesised that those LPS molecules with a
more conical configuration were more readily detected by TLR4 whilst
those of an intermediate configuration were detected more readily by a
combination of TLR1/TLR2 and TLR4 although at a lesser efficiency, whilst
those with a conical configuration were not detected by either (Figure
1.5)(Netea et al., 2002; Schromm et al., 1998).
Figure 1.4: Differences in Three Dimensional Shape of LPS from Different Sources
The lipid A portion of E. Coli adopts a conical form, whilst that of P. Gingivalis has an intermediate form, and the artificially created lipid A precursor 1A is cylindrical (Netea et al., 2002).
Ph.D. Thesis 2012 Alan Carter
29
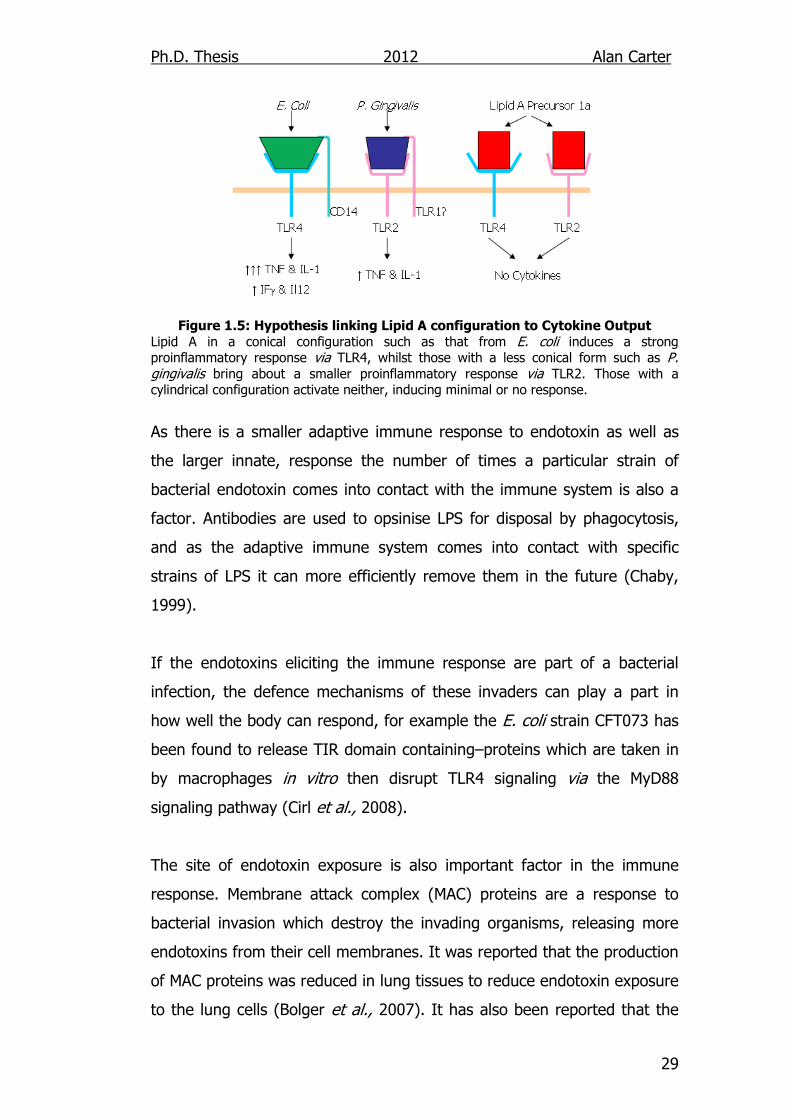
Figure 1.5: Hypothesis linking Lipid A configuration to Cytokine Output
Lipid A in a conical configuration such as that from E. coli induces a strong proinflammatory response via TLR4, whilst those with a less conical form such as P. gingivalis bring about a smaller proinflammatory response via TLR2. Those with a cylindrical configuration activate neither, inducing minimal or no response.
As there is a smaller adaptive immune response to endotoxin as well as
the larger innate, response the number of times a particular strain of
bacterial endotoxin comes into contact with the immune system is also a
factor. Antibodies are used to opsinise LPS for disposal by phagocytosis,
and as the adaptive immune system comes into contact with specific
strains of LPS it can more efficiently remove them in the future (Chaby,
1999).
If the endotoxins eliciting the immune response are part of a bacterial
infection, the defence mechanisms of these invaders can play a part in
how well the body can respond, for example the E. coli strain CFT073 has
been found to release TIR domain containing–proteins which are taken in
by macrophages in vitro then disrupt TLR4 signaling via the MyD88
signaling pathway (Cirl et al., 2008).
The site of endotoxin exposure is also important factor in the immune
response. Membrane attack complex (MAC) proteins are a response to
bacterial invasion which destroy the invading organisms, releasing more
endotoxins from their cell membranes. It was reported that the production
of MAC proteins was reduced in lung tissues to reduce endotoxin exposure
to the lung cells (Bolger et al., 2007). It has also been reported that the
Ph.D. Thesis 2012 Alan Carter
30
endotoxin induced response by lung wall epithelial cells produces a greater
ratio of IL-10 to IL-12 when compared to similarly stimulated blood borne
responses (Wan et al., 2000). This would suggest an effort from the
lungs, which are exposed to endotoxin more regularly, to reduce harmful
inflammation responses and promote the opsonisation of pathogens for
disposal by phagocytosis (Bolger et al., 2007).
The subjects sex has an effect on the inflammatory response to
endotoxin. It has been observed that females have a resistance to the
effects of acute inflammation, whilst their prognosis in more long term
inflammatory disorders is poorer (Lefévre et al., 2012).
In PARP-1 inhibited mice males responded less to endotoxin induced
inflammation when compared to WT animals (measured by TNFα output),
however the TNFα output of female WT mice began at a lower level and
the inhibition of PARP-1 did not alter this output. In order to identify if this
was due to the low output of TNFα in female mice further groups of WT
and PARP-1 inhibited mice were treated with a more robust amount of
LPS. Again no significant difference was observed between normal and
PARP-1 inhibited serum TNFα concentrations (Mabley et al., 2005b).
There are two proposed reasons for this sex difference in inflammation,
firstly that it is to do with hormones specifically oestrogen. Treatment of
LPS treated tissues with oestrogen has been shown to reduce the
production of MCP-1 from the brain, arteries and macrophages, IL-6 from
the arteries and MIP2-α from the brain when compared to those treated
with LPS alone (Nilsson, 2007). More recently it has also been described
that X chromosome linked genes such as CD99, which plays a role in
leukocyte diapedesis, may also contribute to the noted sex difference
(Lefévre et al., 2012).
Ph.D. Thesis 2012 Alan Carter
31
Other genetic factors also have a role in determining the magnitude of the
endotoxin induced inflammatory response. It was shown that both
C3H/HeJ and C57BL/10ScCr mice which exhibit endotoxic
hyporesponsiveness both had mutations in the TLR4 gene (Qureshi et al.,
1999). It was later reported that similar mutations in the human TLR4
gene also contribute to a lessened inflammatory response to endotoxin
(Arbour et al., 2000). A host of gene deletions have also been recognised
to effect endotoxin induced inflammation including signal transducer and
activator of transcription 3 and Cyclooxygenase 1 and 2 (Kano et al.,
2003; Martin et al., 2006).
1.5. BER Proteins and Endotoxin Induced Inflammation
Proteins not initially thought to be involved in modulating the
inflammatory response have been discovered to have such a function.
These include certain proteins linked with base excision repair. PARP1, a
DNA damage sensor for single and double stranded breaks, was the first
BER protein to be implicated in the inflammatory response. This was
discovered through the use of PARP1-/- knockout mice which showed a
marked decrease in inflammation induced by caecal ligation and puncture,
which results in the extrusion of gut content into the peritoneal cavity,
when compared to wildtype mice. There was also a significant reduction in
TNF-α (1059 ± 166 pg/ml vs. 1529 ± 122 pg/ml), IL-6 (approx. 28 ± 2
ng/ml vs. 40 ± 4 ng/ml) and IL-10 (4750 ± 2274 pg/ml vs. 6875 ± 2076
pg/ml) plasma concentrations when compared with wildtype mice 24 h
after caecal ligation. Similarly MPO activity was also reduced in PARP1-/-
gut (approx. 3.2 ± 0.5 mU/m protein vs. 5.8 ± 0.4 mU/mg protein) and
lung (approx. 180 ± 15 mU/m protein vs. 370 ± 30 mU/mg protein)
tissues after 24 h. Survival rates of PARP1-/- mice after caecal ligation were
also significantly higher compared to PARP+/+ (20% vs. 4% survival)
(Soriano et al., 2002; Virag and Szabo 2002).
Ph.D. Thesis 2012 Alan Carter
32
This is probably due to the regulatory control PARP1 has on certain
proteins, including iNOS. PARP1 also has been found to be a co-factor
with NF-κB and AP-1, key inflammation transcription factors (Kiefmann et
al., 2004). A suggested model for the role of PARP1 has been described by
Virag and Szabo. The invasion of microbial particles activates neutrophils
in the local area, leading to the release of ROS from these monocytes in
order to damage, and kill the invaders. ROS release leads to DNA damage
and causes the activation of PARP1, which in turn triggers chemokine and
inflammatory cytokine production via NF-κB and AP-1 leading to the
further recruitment of neutrophils to the area of invasion (Virag and Szabo
2002).
APE1 is involved in redox reactions throughout the cell and is important in
the regulation of many systems. Indeed APE1-/- mouse foetuses are
unable to develop beyond implantation (Xanthoudakis et al., 1996).
Expression of APE1 is activated by the presence of ROS (Yang et al.,
2007). APE1 activates transcription factors NF-κΒ and AP-1 by the
reduction of active cystine residues (Ando et al., 2008). Indeed the down
regulation of APE1, via antisense cDNA and siRNA, attenuates NF-κΒ and
AP-1 activation (Daily et al., 2001; Fung and Demple 2005). Therefore it
can be hypothesised that a reduction in APE1 activity within the cell would
reduce cytokine and chemokine output from leukocytes, reducing the
inflammation reaction in a similar fashion to that of PARP1.
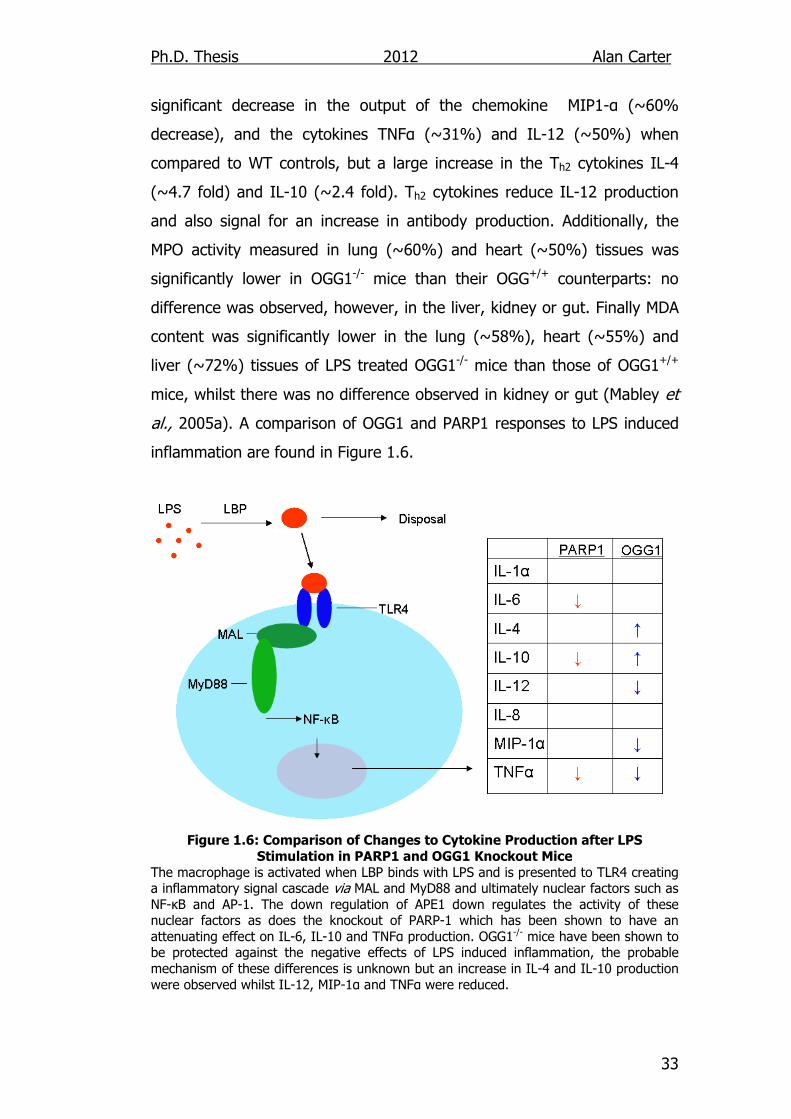
1.6. DNA Glycosylases and Endotoxin Induced Inflammation More specific base excision repair proteins, such as DNA glycosylases
which remove modified DNA bases, have also been shown to alter the
inflammatory response. It has been reported that 8-Oxoguanine
glycosylase-/- (OGG1-/-) mice are resistant to the damage caused by
endotoxin induced inflammation, indicating that this protein may also have
a role in the regulation of inflammation (Mabley et al., 2005a). When
given intraperitoneal injections of LPS (80 mg/kg) OGG1-/- mice showed a
Ph.D. Thesis 2012 Alan Carter
33
significant decrease in the output of the chemokine MIP1-α (~60%
decrease), and the cytokines TNFα (~31%) and IL-12 (~50%) when
compared to WT controls, but a large increase in the Th2 cytokines IL-4
(~4.7 fold) and IL-10 (~2.4 fold). Th2 cytokines reduce IL-12 production
and also signal for an increase in antibody production. Additionally, the
MPO activity measured in lung (~60%) and heart (~50%) tissues was
significantly lower in OGG1-/- mice than their OGG+/+ counterparts: no
difference was observed, however, in the liver, kidney or gut. Finally MDA
content was significantly lower in the lung (~58%), heart (~55%) and
liver (~72%) tissues of LPS treated OGG1-/- mice than those of OGG1+/+
mice, whilst there was no difference observed in kidney or gut (Mabley et
al., 2005a). A comparison of OGG1 and PARP1 responses to LPS induced
inflammation are found in Figure 1.6.
Figure 1.6: Comparison of Changes to Cytokine Production after LPS
Stimulation in PARP1 and OGG1 Knockout Mice
The macrophage is activated when LBP binds with LPS and is presented to TLR4 creating a inflammatory signal cascade via MAL and MyD88 and ultimately nuclear factors such as NF-κΒ and AP-1. The down regulation of APE1 down regulates the activity of these nuclear factors as does the knockout of PARP-1 which has been shown to have an attenuating effect on IL-6, IL-10 and TNFα production. OGG1-/- mice have been shown to be protected against the negative effects of LPS induced inflammation, the probable mechanism of these differences is unknown but an increase in IL-4 and IL-10 production were observed whilst IL-12, MIP-1α and TNFα were reduced.
Ph.D. Thesis 2012 Alan Carter
34
It has also been reported that the inflammatory response to Helicobacter
pylori, a gram negative bacterium, was reduced in OGG1 deficient mice.
OGG1-/- mice displayed less gut inflammation and histological lesions
compared to WT mice, as well as a lowered tendancy to recruit
polymorphonuclear cells (neutrophils, basophils and eosinophils) to the
gut tissue (OGG1-/- 33% vs. OGG1+/+ 100%). In these mice a reduction in
the mRNA expression of iNOS was also observed (Touati et al., 2006).
These results then suggest that OGG1 has a role in the expression of pro-
inflammatory proteins in response to Gram-negative bacteria (Mabley et
al., 2005a; Touati et al., 2006). In contrast it has been reported, that
when exposed to diesel exhaust particles (DEP; inhaled 20 mg/m3) the
difference between the macrophage and neutrophil population in BAL fluid
between wildtype and OGG1-/- mice was negligible, although there was a
~58% reduction in IL-6 mRNA production in OGG1-/- lung tissue when
compared to that of OGG1+/+ (Risom et al., 2007).
1.7. Oxidative Damage
The number of neutrophils and macrophages at the site of injury during
inflammation increase dramatically. When these cells die they are subject
to necrotic lysis and release reactive oxygen species into the area. The
original purpose of these molecules was bactericidal, but they are also
damaging to the host tissues and can damage anything they come into
contact with (Smith, 1994). This includes DNA which has its own repair
systems in place, the one most associated with oxidised bases is base
exscision repair (Slupphaug et al., 2003).
1.7.1. Reactive Oxygen Species
DNA damage is classified as any alteration to DNA structure or chemistry.
The agents that react with DNA to cause this damage come from two
sources, exogenous sources (i.e outside of the body) including ionizing
radiation, solar radiation and environmental carcinogens such as tobacco
Ph.D. Thesis 2012 Alan Carter
35
smoke, and endogenous sources (i.e. inside the body) such as the by
products of aerobic respiration (Droge, 2002). Perhaps the most important
of these is oxidative stress due to both the metabolism of xenobiotic
compounds and the ubiquitous nature of endogenous ROS (Hazra et al.,
2002a).
Whilst each of us is dependent on oxygen for respiration, the reduction of
oxygen in normal aerobic respiration causes ROS to be formed as energy
is produced by the electron transport chain in the inner mitochondrial
membrane (Figure 1.7) (Turrens, 2003). Additionally, as previously
mentioned, ROS are also released in mammalian cells as part of the
inflammatory response (Beutler, 2004).
There are many methods of reducing the amount of ROS within the cell,
for example the enzymes catalase, superoxide dismutase and the
glutathione S-transferase family of enzymes, as well as reducing agents
like vitamins A, C and E (Oakley, 2005; Slupphaug et al., 2003).
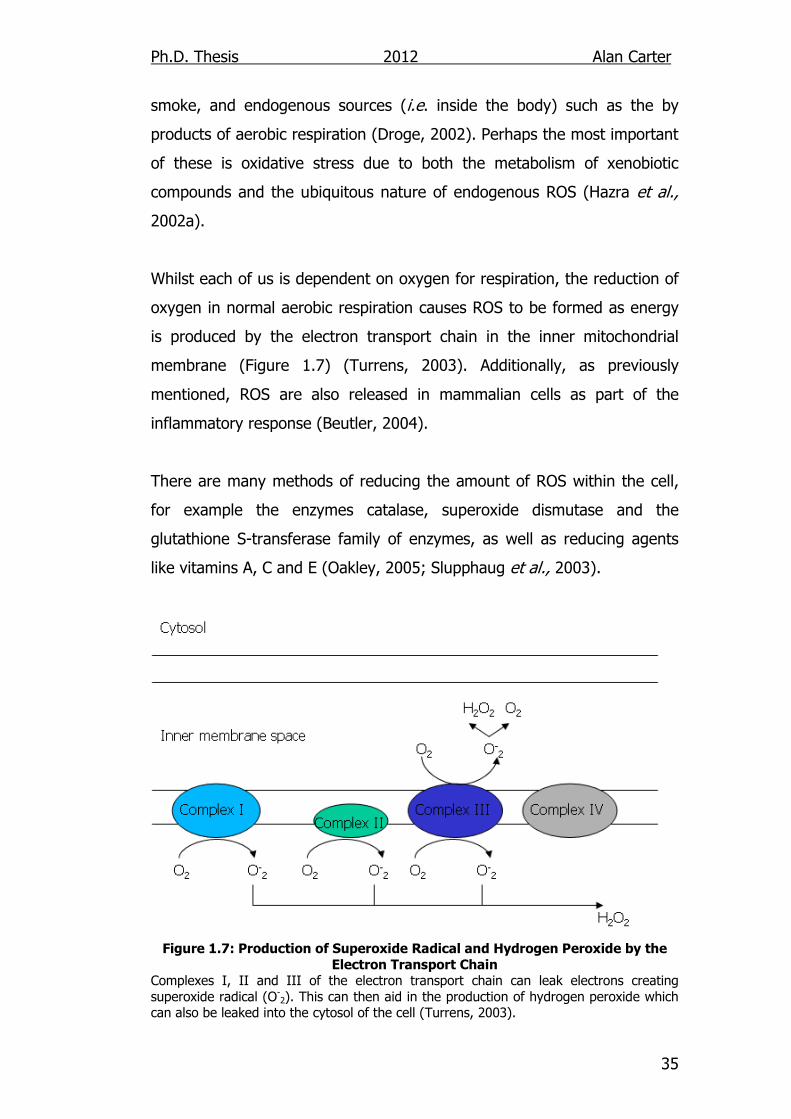
Figure 1.7: Production of Superoxide Radical and Hydrogen Peroxide by the
Electron Transport Chain Complexes I, II and III of the electron transport chain can leak electrons creating superoxide radical (O-
2). This can then aid in the production of hydrogen peroxide which can also be leaked into the cytosol of the cell (Turrens, 2003).
Ph.D. Thesis 2012 Alan Carter
36
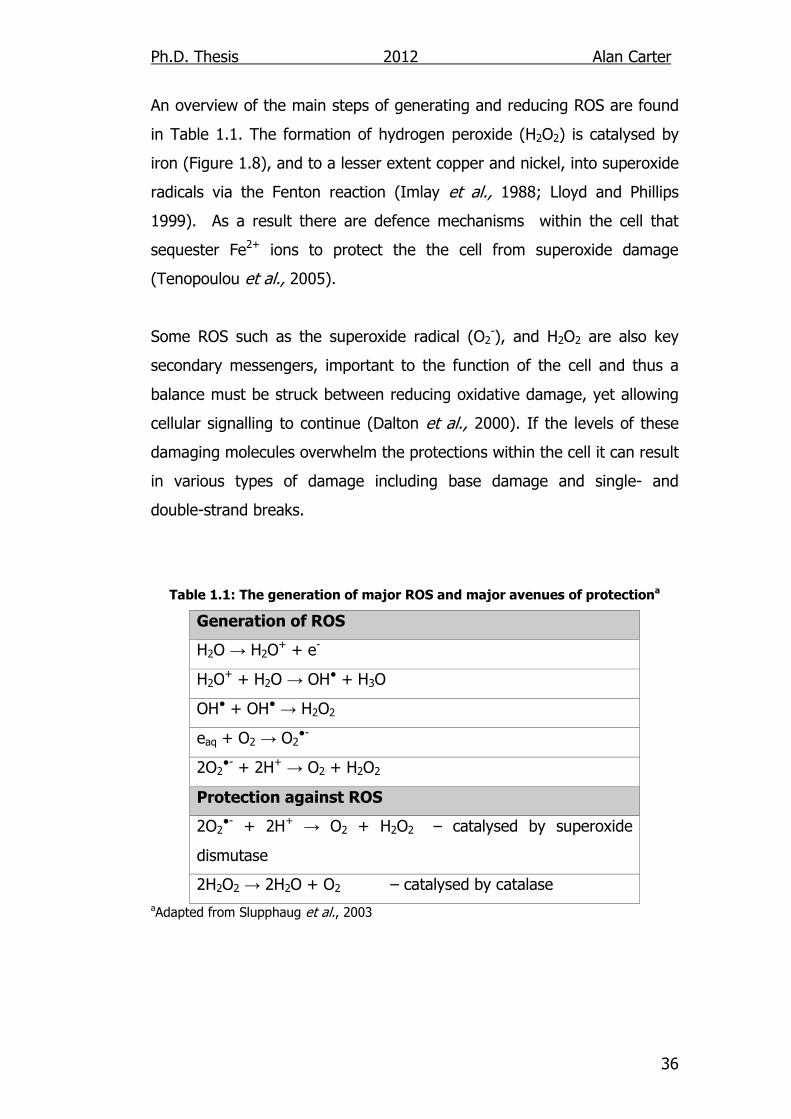
An overview of the main steps of generating and reducing ROS are found
in Table 1.1. The formation of hydrogen peroxide (H2O2) is catalysed by
iron (Figure 1.8), and to a lesser extent copper and nickel, into superoxide
radicals via the Fenton reaction (Imlay et al., 1988; Lloyd and Phillips
1999). As a result there are defence mechanisms within the cell that
sequester Fe2+ ions to protect the the cell from superoxide damage
(Tenopoulou et al., 2005).
Some ROS such as the superoxide radical (O2-), and H2O2 are also key
secondary messengers, important to the function of the cell and thus a
balance must be struck between reducing oxidative damage, yet allowing
cellular signalling to continue (Dalton et al., 2000). If the levels of these
damaging molecules overwhelm the protections within the cell it can result
in various types of damage including base damage and single- and
double-strand breaks.
Table 1.1: The generation of major ROS and major avenues of protectiona
Generation of ROS
H2O → H2O+ + e-
H2O+ + H2O → OH● + H3O
OH● + OH● → H2O2
eaq + O2 → O2●-
2O2●- + 2H+ → O2 + H2O2
Protection against ROS
2O2●- + 2H+ → O2 + H2O2 – catalysed by superoxide
dismutase
2H2O2 → 2H2O + O2 – catalysed by catalase
aAdapted from Slupphaug et al., 2003
Ph.D. Thesis 2012 Alan Carter
37
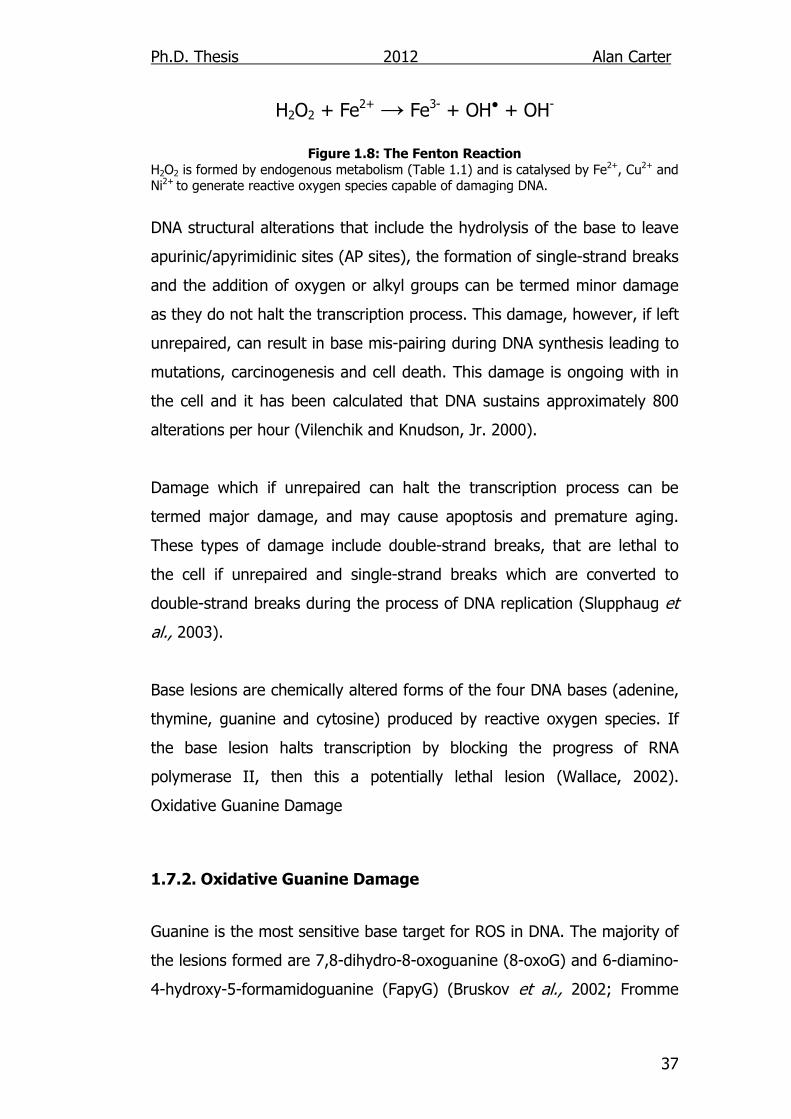
H2O2 + Fe2+ → Fe3- + OH● + OH-
Figure 1.8: The Fenton Reaction
H2O2 is formed by endogenous metabolism (Table 1.1) and is catalysed by Fe2+, Cu2+ and Ni2+ to generate reactive oxygen species capable of damaging DNA.
DNA structural alterations that include the hydrolysis of the base to leave
apurinic/apyrimidinic sites (AP sites), the formation of single-strand breaks
and the addition of oxygen or alkyl groups can be termed minor damage
as they do not halt the transcription process. This damage, however, if left
unrepaired, can result in base mis-pairing during DNA synthesis leading to
mutations, carcinogenesis and cell death. This damage is ongoing with in
the cell and it has been calculated that DNA sustains approximately 800
alterations per hour (Vilenchik and Knudson, Jr. 2000).
Damage which if unrepaired can halt the transcription process can be
termed major damage, and may cause apoptosis and premature aging.
These types of damage include double-strand breaks, that are lethal to
the cell if unrepaired and single-strand breaks which are converted to
double-strand breaks during the process of DNA replication (Slupphaug et
al., 2003).
Base lesions are chemically altered forms of the four DNA bases (adenine,
thymine, guanine and cytosine) produced by reactive oxygen species. If
the base lesion halts transcription by blocking the progress of RNA
polymerase II, then this a potentially lethal lesion (Wallace, 2002).
Oxidative Guanine Damage
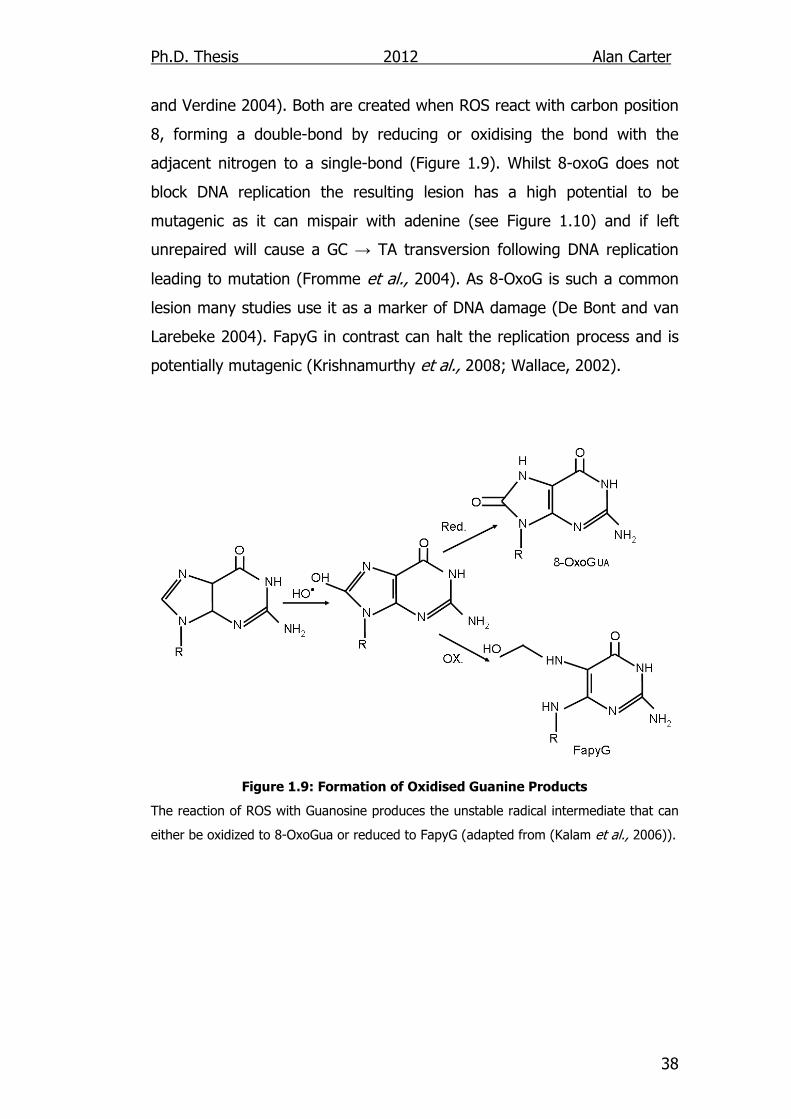
1.7.2. Oxidative Guanine Damage
Guanine is the most sensitive base target for ROS in DNA. The majority of
the lesions formed are 7,8-dihydro-8-oxoguanine (8-oxoG) and 6-diamino-
4-hydroxy-5-formamidoguanine (FapyG) (Bruskov et al., 2002; Fromme
Ph.D. Thesis 2012 Alan Carter
38
and Verdine 2004). Both are created when ROS react with carbon position
8, forming a double-bond by reducing or oxidising the bond with the
adjacent nitrogen to a single-bond (Figure 1.9). Whilst 8-oxoG does not
block DNA replication the resulting lesion has a high potential to be
mutagenic as it can mispair with adenine (see Figure 1.10) and if left
unrepaired will cause a GC → TA transversion following DNA replication
leading to mutation (Fromme et al., 2004). As 8-OxoG is such a common
lesion many studies use it as a marker of DNA damage (De Bont and van
Larebeke 2004). FapyG in contrast can halt the replication process and is
potentially mutagenic (Krishnamurthy et al., 2008; Wallace, 2002).
Figure 1.9: Formation of Oxidised Guanine Products
The reaction of ROS with Guanosine produces the unstable radical intermediate that can
either be oxidized to 8-OxoGua or reduced to FapyG (adapted from (Kalam et al., 2006)).
Ph.D. Thesis 2012 Alan Carter
39
Figure 1.10: 8-oxoGua paired with cytosine and mispaired with adenine
adapted from Fromme et al., 2004
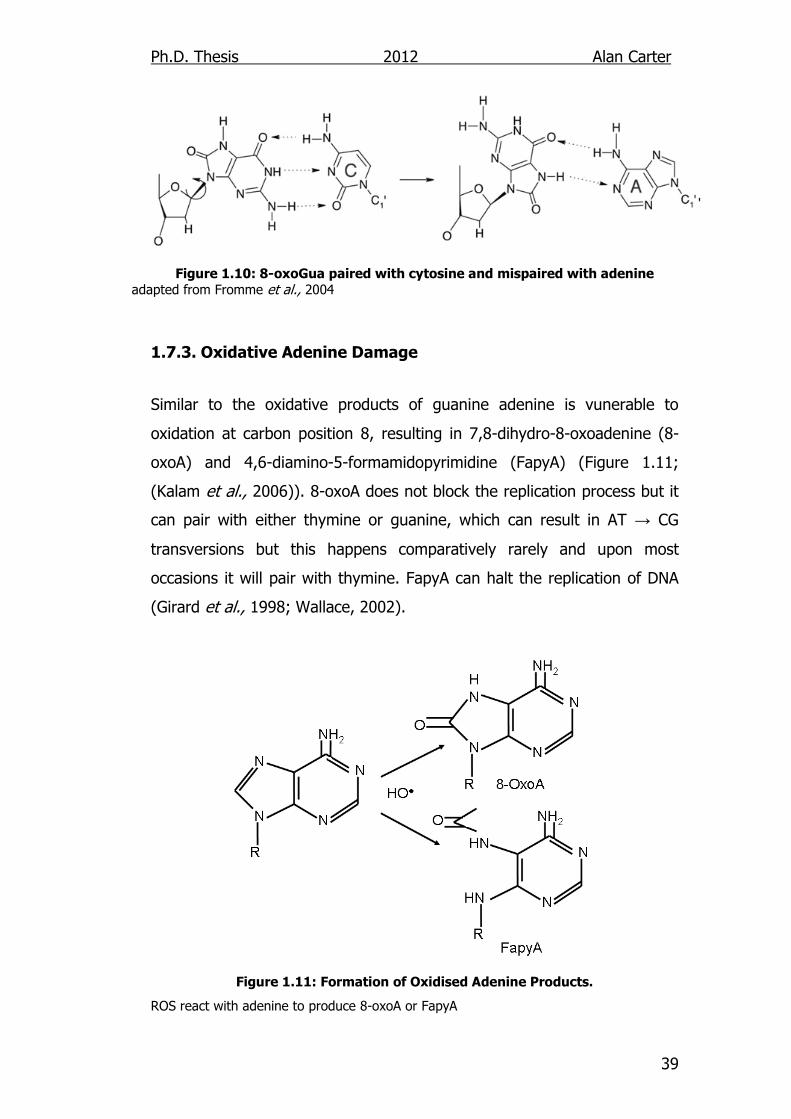
1.7.3. Oxidative Adenine Damage
Similar to the oxidative products of guanine adenine is vunerable to
oxidation at carbon position 8, resulting in 7,8-dihydro-8-oxoadenine (8-
oxoA) and 4,6-diamino-5-formamidopyrimidine (FapyA) (Figure 1.11;
(Kalam et al., 2006)). 8-oxoA does not block the replication process but it
can pair with either thymine or guanine, which can result in AT → CG
transversions but this happens comparatively rarely and upon most
occasions it will pair with thymine. FapyA can halt the replication of DNA
(Girard et al., 1998; Wallace, 2002).
Figure 1.11: Formation of Oxidised Adenine Products.
ROS react with adenine to produce 8-oxoA or FapyA
Ph.D. Thesis 2012 Alan Carter
40
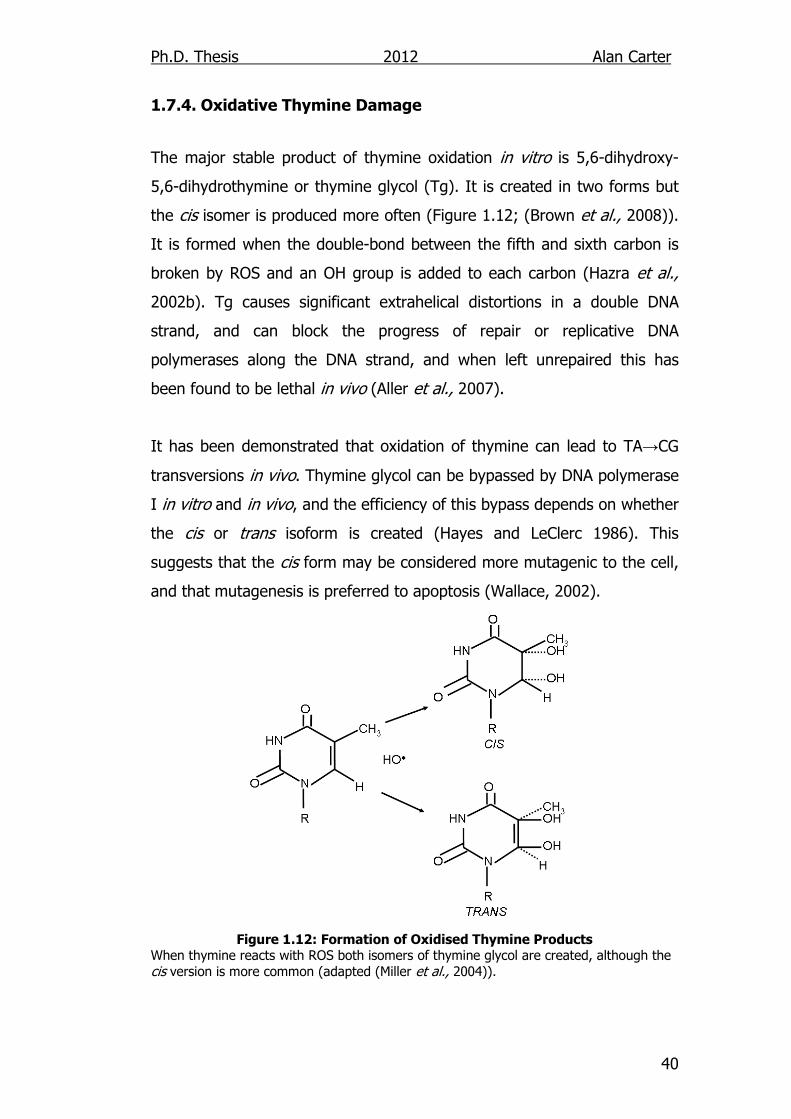
1.7.4. Oxidative Thymine Damage
The major stable product of thymine oxidation in vitro is 5,6-dihydroxy-
5,6-dihydrothymine or thymine glycol (Tg). It is created in two forms but
the cis isomer is produced more often (Figure 1.12; (Brown et al., 2008)).
It is formed when the double-bond between the fifth and sixth carbon is
broken by ROS and an OH group is added to each carbon (Hazra et al.,
2002b). Tg causes significant extrahelical distortions in a double DNA
strand, and can block the progress of repair or replicative DNA
polymerases along the DNA strand, and when left unrepaired this has
been found to be lethal in vivo (Aller et al., 2007).
It has been demonstrated that oxidation of thymine can lead to TA→CG
transversions in vivo. Thymine glycol can be bypassed by DNA polymerase
I in vitro and in vivo, and the efficiency of this bypass depends on whether
the cis or trans isoform is created (Hayes and LeClerc 1986). This
suggests that the cis form may be considered more mutagenic to the cell,
and that mutagenesis is preferred to apoptosis (Wallace, 2002).
Figure 1.12: Formation of Oxidised Thymine Products When thymine reacts with ROS both isomers of thymine glycol are created, although the cis version is more common (adapted (Miller et al., 2004)).
Ph.D. Thesis 2012 Alan Carter
41
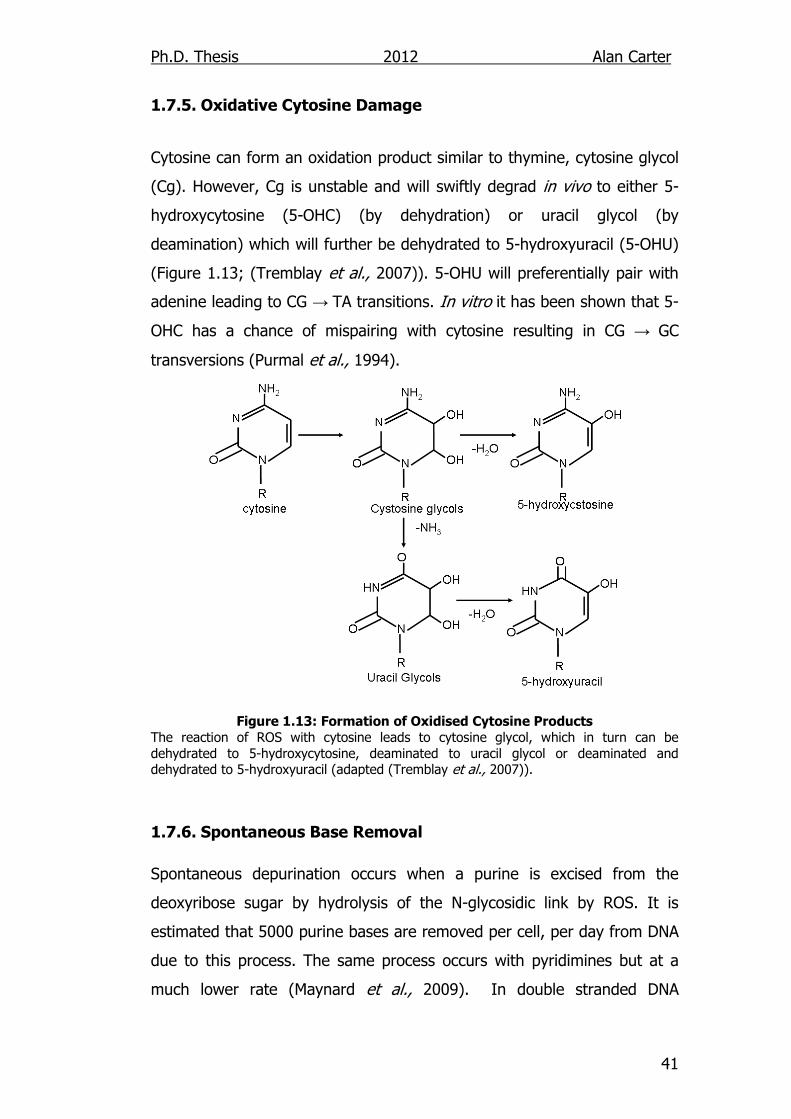
1.7.5. Oxidative Cytosine Damage
Cytosine can form an oxidation product similar to thymine, cytosine glycol
(Cg). However, Cg is unstable and will swiftly degrad in vivo to either 5-
hydroxycytosine (5-OHC) (by dehydration) or uracil glycol (by
deamination) which will further be dehydrated to 5-hydroxyuracil (5-OHU)
(Figure 1.13; (Tremblay et al., 2007)). 5-OHU will preferentially pair with
adenine leading to CG → TA transitions. In vitro it has been shown that 5-
OHC has a chance of mispairing with cytosine resulting in CG → GC
transversions (Purmal et al., 1994).
Figure 1.13: Formation of Oxidised Cytosine Products
The reaction of ROS with cytosine leads to cytosine glycol, which in turn can be dehydrated to 5-hydroxycytosine, deaminated to uracil glycol or deaminated and dehydrated to 5-hydroxyuracil (adapted (Tremblay et al., 2007)).
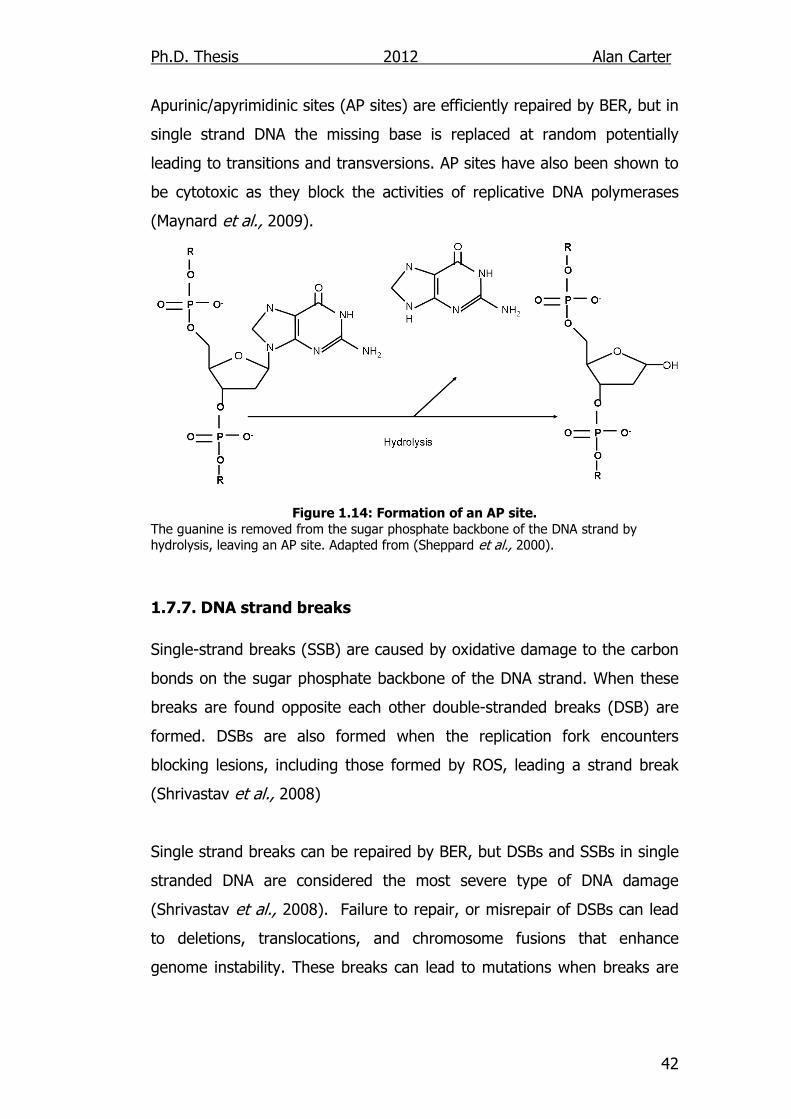
1.7.6. Spontaneous Base Removal Spontaneous depurination occurs when a purine is excised from the
deoxyribose sugar by hydrolysis of the N-glycosidic link by ROS. It is
estimated that 5000 purine bases are removed per cell, per day from DNA
due to this process. The same process occurs with pyridimines but at a
much lower rate (Maynard et al., 2009). In double stranded DNA
Ph.D. Thesis 2012 Alan Carter
42
Apurinic/apyrimidinic sites (AP sites) are efficiently repaired by BER, but in
single strand DNA the missing base is replaced at random potentially
leading to transitions and transversions. AP sites have also been shown to
be cytotoxic as they block the activities of replicative DNA polymerases
(Maynard et al., 2009).
Figure 1.14: Formation of an AP site.
The guanine is removed from the sugar phosphate backbone of the DNA strand by hydrolysis, leaving an AP site. Adapted from (Sheppard et al., 2000).
1.7.7. DNA strand breaks Single-strand breaks (SSB) are caused by oxidative damage to the carbon
bonds on the sugar phosphate backbone of the DNA strand. When these
breaks are found opposite each other double-stranded breaks (DSB) are
formed. DSBs are also formed when the replication fork encounters
blocking lesions, including those formed by ROS, leading a strand break
(Shrivastav et al., 2008)
Single strand breaks can be repaired by BER, but DSBs and SSBs in single
stranded DNA are considered the most severe type of DNA damage
(Shrivastav et al., 2008). Failure to repair, or misrepair of DSBs can lead
to deletions, translocations, and chromosome fusions that enhance
genome instability. These breaks can lead to mutations when breaks are
Ph.D. Thesis 2012 Alan Carter
43
incorrectly repaired, and trigger apoptosis in order to prevent the
propagation of mutant or cancerous cells (Shrivastav et al., 2008).
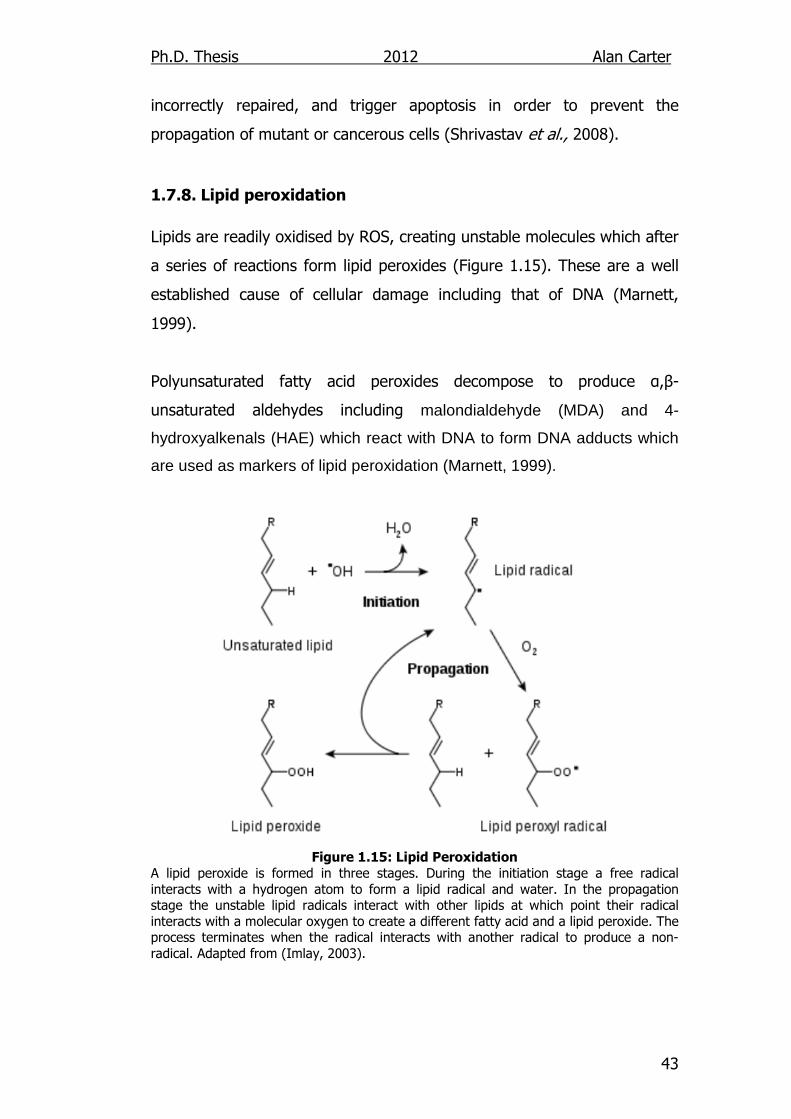
1.7.8. Lipid peroxidation Lipids are readily oxidised by ROS, creating unstable molecules which after
a series of reactions form lipid peroxides (Figure 1.15). These are a well
established cause of cellular damage including that of DNA (Marnett,
1999).
Polyunsaturated fatty acid peroxides decompose to produce α,β-
unsaturated aldehydes including malondialdehyde (MDA) and 4-
hydroxyalkenals (HAE) which react with DNA to form DNA adducts which
are used as markers of lipid peroxidation (Marnett, 1999).
Figure 1.15: Lipid Peroxidation
A lipid peroxide is formed in three stages. During the initiation stage a free radical interacts with a hydrogen atom to form a lipid radical and water. In the propagation stage the unstable lipid radicals interact with other lipids at which point their radical interacts with a molecular oxygen to create a different fatty acid and a lipid peroxide. The process terminates when the radical interacts with another radical to produce a non-radical. Adapted from (Imlay, 2003).
Ph.D. Thesis 2012 Alan Carter
44
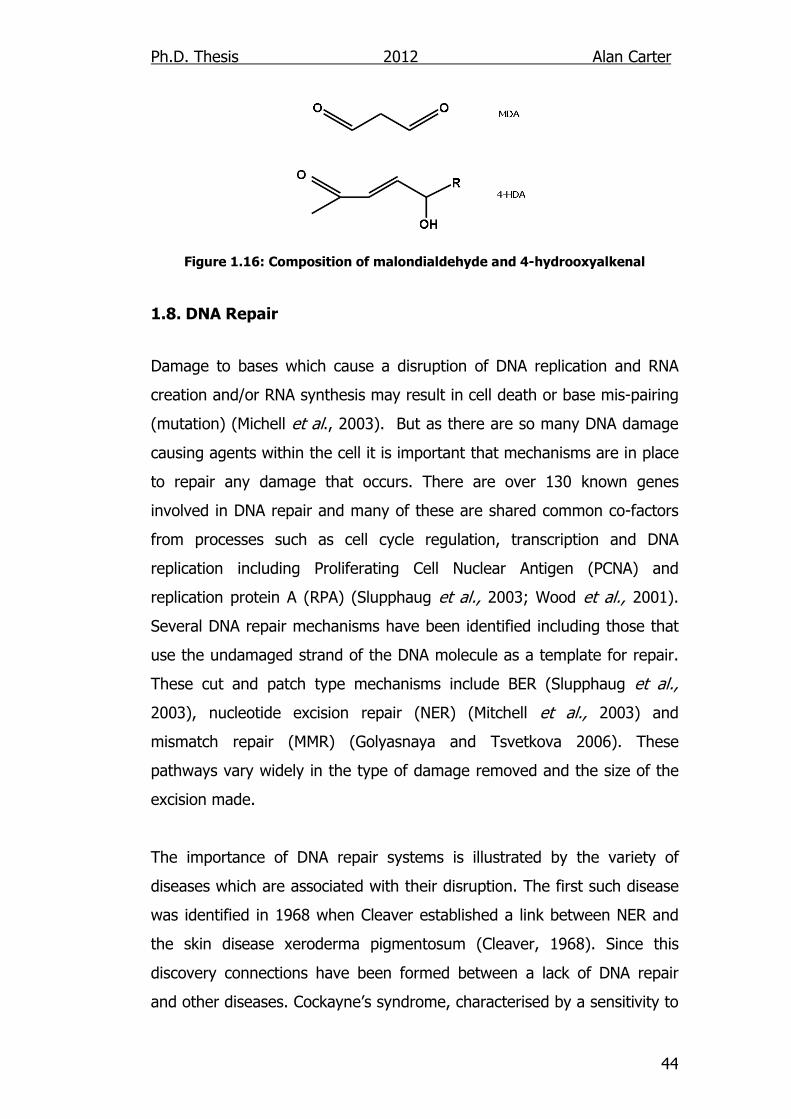
Figure 1.16: Composition of malondialdehyde and 4-hydrooxyalkenal
1.8. DNA Repair
Damage to bases which cause a disruption of DNA replication and RNA
creation and/or RNA synthesis may result in cell death or base mis-pairing
(mutation) (Michell et al., 2003). But as there are so many DNA damage
causing agents within the cell it is important that mechanisms are in place
to repair any damage that occurs. There are over 130 known genes
involved in DNA repair and many of these are shared common co-factors
from processes such as cell cycle regulation, transcription and DNA
replication including Proliferating Cell Nuclear Antigen (PCNA) and
replication protein A (RPA) (Slupphaug et al., 2003; Wood et al., 2001).
Several DNA repair mechanisms have been identified including those that
use the undamaged strand of the DNA molecule as a template for repair.
These cut and patch type mechanisms include BER (Slupphaug et al.,
2003), nucleotide excision repair (NER) (Mitchell et al., 2003) and
mismatch repair (MMR) (Golyasnaya and Tsvetkova 2006). These
pathways vary widely in the type of damage removed and the size of the
excision made.
The importance of DNA repair systems is illustrated by the variety of
diseases which are associated with their disruption. The first such disease
was identified in 1968 when Cleaver established a link between NER and
the skin disease xeroderma pigmentosum (Cleaver, 1968). Since this
discovery connections have been formed between a lack of DNA repair
and other diseases. Cockayne’s syndrome, characterised by a sensitivity to
Ph.D. Thesis 2012 Alan Carter
45
light and the appearance of premature aging, and trichothiodystrophy,
which causes mental and physical retardation, are also associated with
NER (Lehmann, 2003) and Hereditary nonpolyposis colorectal cancer is
associated with defects in MMR (Abdel-Rahman et al., 2005). Until 2003 it
was thought that base excision repair was not linked to any inherited
disease due to the large overlap in the function of BER proteins with other
mechanisms (Krokan et al., 2000; Slupphaug et al., 2003). However, links
between MUTYH and an autosomal recessive syndrome of adenomatous
colorectal polyposis and very high colorectal cancer risk have been
observed (Cheadle and Sampson 2003). Additionally, the single-strand
breaks that are created as intermediates in the BER process have been
implicated in the progression of neurodegenerative diseases such as
spinocerebellar ataxia (Caldecott, 2003). Links have also been made
between cancer (e.g. lung, skin, leukaemia and breast) and
polymorphisms in BER proteins although these tend to be weak, such as
that for OGG1 which has shown no consistant conections with any form of
cancer (Hung et al., 2005). Polβ, however, has shown a strong connection
with cancers, as ~30% of human tumours express Polβ variants (Starcevic
et al., 2004).
1.8.1. Base Excision Repair
BER is the main mechanism used to remove non-helix distorting DNA base
lesions (Slupphaug et al., 2003). However BER can also repair the
consequences of base deamination, spontaneous hydrolysis of the N-
glycosidic bond and SSBs (Fromme and Verdine 2004). Repair is initiated
by one of a group of enzymes named DNA glycosylases, which remove
damaged bases from DNA leaving the sugar phosphate backbone intact
(Hazra et al., 2002a). Many different DNA glycosylases have been
identified, and as a result there are several methods of excising damaged
bases and repairing the subsequent AP site. These can be split into three
major mechanisms of action: (i) monofunctional glycosylase APE1
dependent pathway, (ii) bifunctional glycosylase APE1 dependent pathway
Ph.D. Thesis 2012 Alan Carter
46
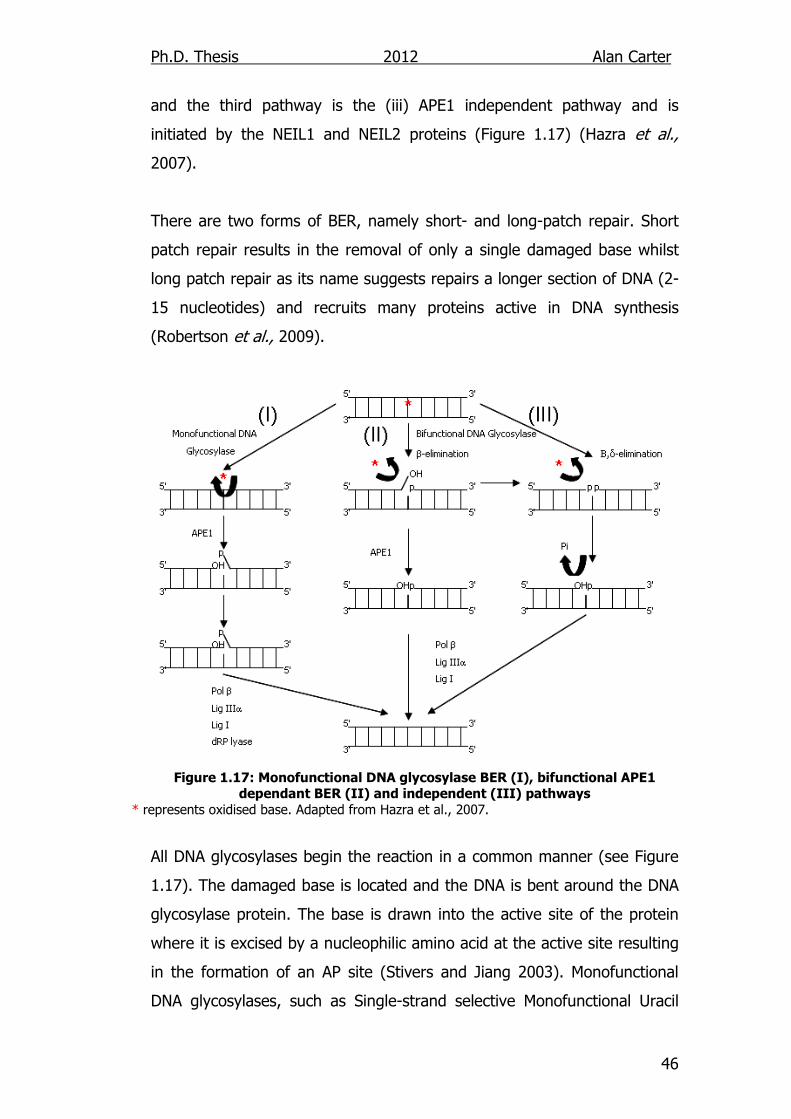
and the third pathway is the (iii) APE1 independent pathway and is
initiated by the NEIL1 and NEIL2 proteins (Figure 1.17) (Hazra et al.,
2007).
There are two forms of BER, namely short- and long-patch repair. Short
patch repair results in the removal of only a single damaged base whilst
long patch repair as its name suggests repairs a longer section of DNA (2-
15 nucleotides) and recruits many proteins active in DNA synthesis
(Robertson et al., 2009).
Figure 1.17: Monofunctional DNA glycosylase BER (I), bifunctional APE1 dependant BER (II) and independent (III) pathways
* represents oxidised base. Adapted from Hazra et al., 2007.
All DNA glycosylases begin the reaction in a common manner (see Figure
1.17). The damaged base is located and the DNA is bent around the DNA
glycosylase protein. The base is drawn into the active site of the protein
where it is excised by a nucleophilic amino acid at the active site resulting
in the formation of an AP site (Stivers and Jiang 2003). Monofunctional
DNA glycosylases, such as Single-strand selective Monofunctional Uracil
Ph.D. Thesis 2012 Alan Carter
47
DNA Glycosylase (SMUG1), then require APE1 to cleave the DNA strand 5′
to the AP site leaving a 5′-deoxyribose-5-phosphate (5′dRP) and 3′-OH
(Christmann et al., 2003). This configuration blocks normal DNA
polymerase activity. Poly (ADP-Ribose) Polymerase-1 (PARP1) then
mediates the attachment of DNA polymerase β (Pol β) to the DNA strand,
which adds a single nucleotide to the 5' end of the nick. The dRP lyase
activity of Pol β removes the sugar phosphate moiety and the process is
completed by either DNA Ligases I or III, which repairs the sugar
phosphate backbone of the DNA.
DNA glycosylases such as OGG1 and NTH1 act like monofunctional
glycosylases but also have an AP lyase activity that incises the AP site via
β-elimination, thus the term bifunctional DNA glycosylases. This process
leaves a 5′-dRP and a 3′-phospho-α,β-unsaturated aldehyde (PUA). This is
a substrate for APE1 which cleaves the 3' PUA leaving a 3′-OH group
(Figure 1.17) (Dianov et al., 2003; Izumi et al., 2003). Pol β and DNA
ligase III/XRCC1 can seal the nick and the repair process is complete
(Dianov et al., 2003).
The APE independent pathway is proposed to be used by bifunctional DNA
glycosylases such as NEIL1 and 2. This takes advantage of the 5' and 3'
phosphates produced during β,δ-elimination to utilise polynucleotide
kinase (PNK) instead of APE1, to generate the 3′ OH group (Figure 1.17)
(Hazra et al., 2007).
1.8.2. DNA Glycosylases
The major DNA glycosylases specialised for removal of oxidised base
lesions in BER can be split into three families. First are monofunctional
glycosylases such as; N-methylpurine-DNA glycosylase (MPG) which
removes alkylated bases from DNA, Uracil-DNA glycosylase 2 (UNG2) and
SMUG1 which remove uracil residues from DNA. Second are bifunctional
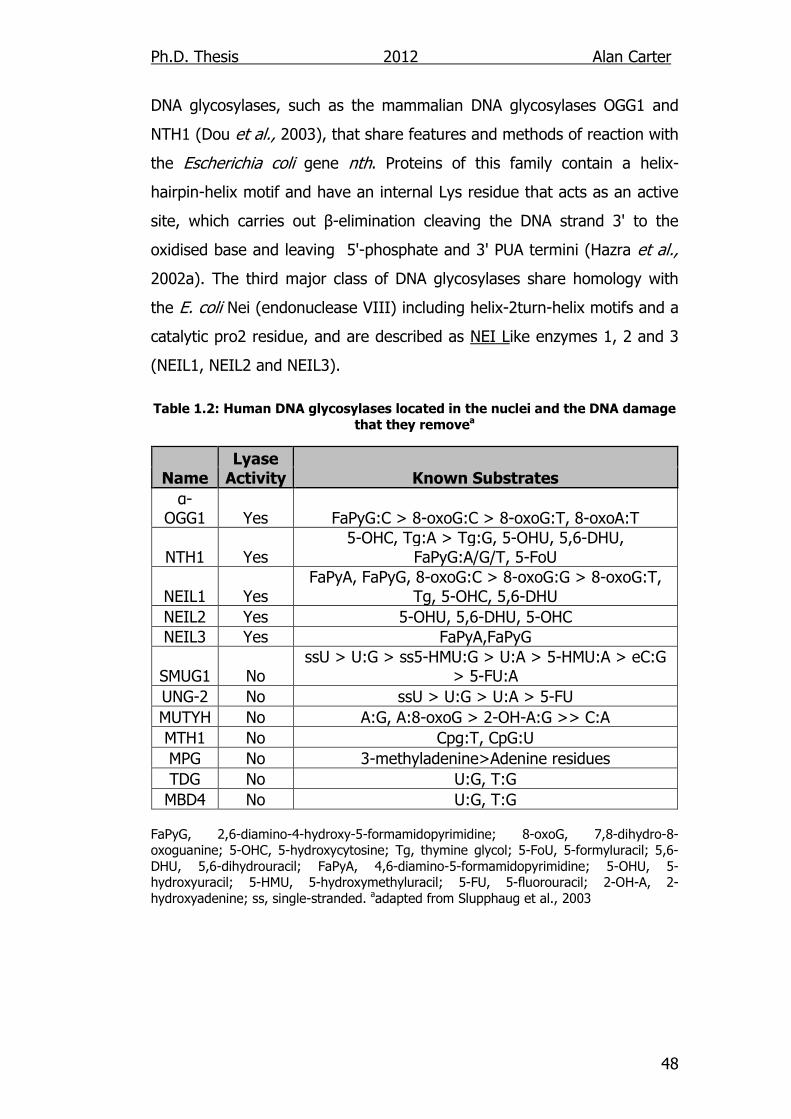
Ph.D. Thesis 2012 Alan Carter
48
DNA glycosylases, such as the mammalian DNA glycosylases OGG1 and
NTH1 (Dou et al., 2003), that share features and methods of reaction with
the Escherichia coli gene nth. Proteins of this family contain a helix-
hairpin-helix motif and have an internal Lys residue that acts as an active
site, which carries out β-elimination cleaving the DNA strand 3' to the
oxidised base and leaving 5'-phosphate and 3' PUA termini (Hazra et al.,
2002a). The third major class of DNA glycosylases share homology with
the E. coli Nei (endonuclease VIII) including helix-2turn-helix motifs and a
catalytic pro2 residue, and are described as NEI Like enzymes 1, 2 and 3
(NEIL1, NEIL2 and NEIL3).
Table 1.2: Human DNA glycosylases located in the nuclei and the DNA damage
that they removea
FaPyG, 2,6-diamino-4-hydroxy-5-formamidopyrimidine; 8-oxoG, 7,8-dihydro-8-oxoguanine; 5-OHC, 5-hydroxycytosine; Tg, thymine glycol; 5-FoU, 5-formyluracil; 5,6-DHU, 5,6-dihydrouracil; FaPyA, 4,6-diamino-5-formamidopyrimidine; 5-OHU, 5-hydroxyuracil; 5-HMU, 5-hydroxymethyluracil; 5-FU, 5-fluorouracil; 2-OH-A, 2-hydroxyadenine; ss, single-stranded. aadapted from Slupphaug et al., 2003
Name Lyase Activity Known Substrates
α-OGG1 Yes FaPyG:C > 8-oxoG:C > 8-oxoG:T, 8-oxoA:T
NTH1 Yes 5-OHC, Tg:A > Tg:G, 5-OHU, 5,6-DHU,
FaPyG:A/G/T, 5-FoU
NEIL1 Yes FaPyA, FaPyG, 8-oxoG:C > 8-oxoG:G > 8-oxoG:T,
Tg, 5-OHC, 5,6-DHU
NEIL2 Yes 5-OHU, 5,6-DHU, 5-OHC NEIL3 Yes FaPyA,FaPyG
SMUG1 No ssU > U:G > ss5-HMU:G > U:A > 5-HMU:A > eC:G
> 5-FU:A
UNG-2 No ssU > U:G > U:A > 5-FU
MUTYH No A:G, A:8-oxoG > 2-OH-A:G >> C:A
MTH1 No Cpg:T, CpG:U
MPG No 3-methyladenine>Adenine residues
TDG No U:G, T:G
MBD4 No U:G, T:G
Ph.D. Thesis 2012 Alan Carter
49
1.8.2.1. OGG1
OGG1 is the mammalian homologue of the MUTM gene in E. Coli (Arai et
al., 1997). The human DNA glycosylases α-OGG1 and β-OGG1 are
produced by alternative splicing of the same DNA transcript found on
chromosome 3p26. The full code for OGG1 consists of 8 exons, and α-
Ogg1 is a result of the transcription of exons 1-7 which results in the
formation of a protein of weight 39 KDa, whilst β-Ogg1 is formed when
exons 1-6 and 8 are transcribed and produce a protein 47 KDa in weight.
The structure indicates that OGG1 contains both a zinc finger and a helix-
hairpin-helix (HhH) DNA binding site (Arai et al., 1997).The OGG1 proteins
are found ubiquitously throughout the body in the nucleus and
mitochondrion. It is transcribed in greater amounts in thymus, testis,
kidneys, intestine and brain tissues (Radicella et al., 1997).
In its human form α-OGG1 is located in the nucleus and excises 8-OxoA
opposite T, 8-OxoG opposite C and T and both FapyG and meFapyG
opposite C (Table 1.2), whereas the mouse form only excises 8-oxoG
lesions opposite C and T (Audebert et al., 2000; Campalans et al., 2007;
Dherin et al., 1999). The structure of the hOGG1 protein suggests that it
makes contact with the base opposite 8-oxoG through hydrogen bonds to
hydrogen acceptors of the paired base. This may explain the different
levels of affinity it has for certain pairings (Banerjee and Verdine 2006).
Human β-OGG1 is located in the mitochondrial matrix, but its role in the
repair of mtDNA is unknown as it does not have any detectable DNA
glycosylase or AP lyase activity (Hashiguchi et al., 2004). Indeed it has
been suggested that while 8-oxoG glycosylase activity has been detected
in the mitochondrial matrix, this is the result of α-OGG1 activity in the
mitochondria rather than that of β-OGG1 (Bohr, 2002; Hashiguchi et al.,
2004). β-OGG1, however, is thought to play a role in the regulation of
apoptosis within the cell, as an over expression of the protein was shown
to have a protective effect when the cells were challenged with xanthine
Ph.D. Thesis 2012 Alan Carter
50
oxidase induced ROS (Dobson et al., 2002; Ruchko et al., 2005). Further
studies have linked β-OGG1 with oxidant induced apoptosis, noting that its
disruption increases programmed cell death (Panduri et al., 2009).
Whilst Ogg1 expression is not affected by the cell cycle, it has been
proposed that Ogg1 expression can be induced by certain exogenous
signals such as oxidative stress (Risom et al., 2007). There are many
layers of regulation on the activity of OGG1 including product inhibition
(Sidorenko et al., 2008), reversible phosphorylation and nitric oxide (NO)
inactivation (Jaiswal et al., 2001). In the presence of APE1 the efficiency
of OGG1 can improve up to 5 fold (Hill et al., 2001) and APE1 may thus
have a role in facilitating product dissociation of OGG1. Phosphorylation
has also been shown to regulate OGG1 activity and cellular localisation.
The exact location of the phosphorylation site is yet to be confirmed, four
have been identified, but preliminary in silico analysis has identified
serine326 as a likely target for protein kinase A (Smart et al., 2006; Svilar
et al., 2011). The adjacent cysteine is able to form a thiolate anion that is
susceptible to oxidation. The secondary messenger NO has been shown to
disrupt the zinc finger motif through the process of thiol nitrosylation,
which causes the ejection of the zinc ion and irreversible loss of catalytic
activity (Jaiswal et al., 2001).
When there are mutations in the OGG1 gene, incidence of cancer and
other age related diseases thought to have links with DNA damage are not
clearly increased, but this thought to be due to the presence of other BER
proteins acting as backups, or that the mutation has no functional effect
(Osterod et al., 2001). When considering specific polymorphisms
alterations at codon 326 (Ser/Cys and Cys/Cys) are the ones most
documented. It has been shown in MEFs that these polymorphisms lead to
the accumulation of FaPyG within the cell (Bravard et al., 2009; Smart et
al., 2006). A higher risk of several cancers has been linked with this
Ph.D. Thesis 2012 Alan Carter
51
polymorphism including lung (Kohno et al., 2006), gastric (Farinati et al.,
2008), prostate (Chen et al., 2003), and orolaryngeal (Elahi et al., 2002).
Conversely there have been several studies that have shown no links with
this polymorphism and the risk of specific cancers including breast cancer
(Vogel et al., 2003), colorectal (Hansen et al., 2005) and Stomach
(Hanaoka et al., 2001).
The mouse OGG1 gene is found on chromosome 6 and shares 83% amino
identity with the human α-OGG1, evidence for OGG1 activity has been
identified in mouse mitochondria. It has been suggested that mOGG1 is
distributed throughout the cell, to where it is needed via active transport
involving the cells microtubules (Conlon et al., 2004). Again OGG1 is found
ubiquitously in the mouse but is at its highest levels in tissue extracted
from the testes (Rosenquist et al., 1997).
In OGG1 knockout mice reported thus far no significant difference has
been observed in the viability, appearance or survival when compared to
wildtype mice. In the 12 month period that these mice were studied there
was no increased incidence of cancer in the mice (Klungland et al., 1999).
However, it has been reported, in a different strain of OGG1-/- mice, that
the incidence of lung cancer increased after 19 months of observation
(Sakumi et al., 2003) It was also reported that the accumulation of 8-oxoG
residues did increase when compared with wildtype mice. In nuclear DNA
there was a tissue specific increase of 10 – 100 % (testes and liver
respectively) in 8-oxoG residues. The removal of oxidised guanines from
the DNA was not halted completely though, and there was significantly
slower repair in the knockout line. In the mitochondria disruption of the
OGG1 gene can cause 8-oxoG to accumulate to 20 times the amount
found in normal cells it has been shown that this has no significant effect
on the respiratory function of the mitochondria (Stuart et al. 2004, de
Souza-Pinto et al., 2001).
Ph.D. Thesis 2012 Alan Carter
52
1.8.2.2. NTH1
The mammalian homologue of E. coli nth, or endonuclease III, is NTH1.
The gene encoding the human form of this protein is found on
chromosome 16p13 and comprises 6 exons (Martin et al., 2004). The
NTH1 protein has a mass of 34 KDa and is expressed throughout the body
within the nucleus of cells, although it is more highly expressed in the
heart, liver and brain tissues, and least expressed in muscle tissue (Gros
et al., 2002; Hazra et al., 2002b; Ikeda et al., 2002). As well as the
conserved HhH DNA binding motif present in other nth like DNA
glycosylases, it also has a 4Fe-4S cluster loop motif which helps to locate
the enzyme more accurately onto the DNA molecule (Gros et al., 2002;
Izumi et al., 2003). The two iron-sulphur clusters form a pocket with the
catalytically active Lys120 and Asp138 at its mouth.
NTH1 expression is cell cycle dependant, with expression low during the
G0-G1 phases, but increased at the start of S-phase where it reached its
maximum level. This suggests a link between NTH1 expression and DNA
synthesis (Luna et al., 2000). Like OGG1, NTH1 is also substrate inhibited
and the addition of APE increases its efficiency at removing Tg from DNA
~3 fold (Marenstein et al., 2003). NTH1 activity has been shown to be
modulated by XPG, a structure-specific endonuclease involved in NER, and
P53, thus connecting BER with NER and p53-dependent damage response
pathways. Both of these interactions stimulate NTH1 activity; XPG at the
RNA transcription complex and p53 during DNA damage sensing (Oyama
et al., 2004). The transcription factor YB-1 has also been shown to
increase the rate of lyase activity in vitro (Marenstein et al., 2003). NTH1
was shown to bind to PCNA, but was not stimulated as a result of such
binding (Dou et al., 2008). However it has been theorised that the
interaction with PCNA, could play a coordinating role during S phase
(Oyama et al., 2004) and that PCNA in the replication machinery recruits
Ph.D. Thesis 2012 Alan Carter
53
NTH1 to Tg lesion when the DNA replication machinery stalls (Oyama et
al., 2004).
As a bifunctional DNA glycosylase NTH1 can remove specific base lesions
via β-elimination (Dizdaroglu et al., 1999). The substrates that NTH1
removes most efficiently are the oxidised pyrimidines shown in Table 1.2.
Of these products thymine glycol (Tg) is toxic, unlike 8-oxoG which is
mutagenic. Tg halts the progress of replicative DNA polymerases and, if
not removed, can lead to cell death (Izumi et al., 2003).
The mouse NTH1 gene is located on chromosome 17 and comprises 6
exons. The resulting protein has a mass of 37 kDa and shares 84% amino
acid identity with hNTH1 and shares similar substrate specificity (Sarker et
al., 1998). Whilst human NTH1 protein is exclusively transported to the
nucleus, mouse NTH1 protein is transported to the mitochondria (Ikeda et
al., 2002).
NTH1-/- mice do not show any phenotypical difference to wildtype mice in
terms of viability, growth rate, age related differences and cancer risk
(Parsons and Elder 2003). In the genomic DNA of NTH1-/- mice Tg seemed
to be removed at normal rates suggesting a functional backup that repairs
oxidised pyridimines is involved. However, Tg was not observed to be
removed at all from mitochondrial extracts (Karahalil et al., 2003; Parsons
and Elder 2003). NTH1-/- cells showed no increased sensitivity to
menadione, H2O2 or X-ray treatments, and still removed Tg lesions,
although it was reported that they did so at a slower rate with substantial
amounts of BER intermediates detected after treatment when none were
detected in WT cells (Parsons and Elder 2003). In NTH1-/- mouse thymus,
removal of Tg was observed, interestingly this cleavage was greater
against Tg:G than Tg:A base pairs (Ocampo et al., 2002). However there
was no Tg excision activity observed in liver mitochondrial extracts from a
different strain of NTH1-/- mice (Karahalil et al., 2003).

Ph.D. Thesis 2012 Alan Carter
54
1.8.2.3. NEIL1
The fact that NTH1 knockout mice appear phenotypically normal was
crucial in the discovery of the NEIL1 and NEIL2 proteins, as it was
discovered that in the absence of NTH1 other as yet unknown proteins
were repairing Tg (Hazra et al., 2002a). Of these proteins NEIL1 was
identified as a backup for NTH1, as the substrates it excises are similar
(Takao et al., 2002a).
The NEIL1 gene is located on chromosome 15 at location q24.2 and
comprises 10 exons, the subsequent protein has a mass of 44 KDa and is
present in both the nucleus and the mitochondria of the cell (Hazra et al.,
2002a; Vartanian et al., 2006; Zody et al., 2006).
As an APE independent enzyme (Figure 1.17), NEIL1 performs β,δ-
elimination. Whilst it contains a DNA binding motif (a helix-2turn-helix), it
does not contain the expected zinc finger DNA binding motif, although it
does contain a ‘zincless finger’ which has been proposed to fill a similar
role (Doublie et al., 2004). The suggested active site is a conserved Pro2
at the N-terminal (Figure 1.18) (Hazra et al., 2002a).
Figure 1.18: Sequence alignment of critical domains of NEIL1 andNEIL2 with
E. coli Nei andFpg adapted from Hazra et al., 2007
NEIL1 is a bi-functional DNA glycosylase/AP lyase protein that removes a
wide range of oxidised bases from DNA (Table 1.2) (Shinmura et al.,
2004; Takao et al., 2002a). It has been suggested that as NEIL1 can
excise the same substrates as OGG1 that it could be a functional back up.
Ph.D. Thesis 2012 Alan Carter
55
However, it excises 8-oxoG from double stranded DNA at a much slower
rate than OGG1 (Hazra et al., 2002a; Morland et al., 2002).
Expression of human NEIL1 varies throughout the body with levels higher
in the pancreas, liver and thymus than the testis and muscle (Hazra et al.,
2002b). Significantly it is expressed 6-7 times more abundantly during the
S-phase of the cell cycle than during the G0-G1 phase. This contrasts with
that of other DNA glycosylases such as OGG1 whose expression is not
significantly affected by the cell cycle (Hazra et al., 2002a). This co-
ordinated change in expression and the wide range of lesions repaired,
suggest that NEIL1 is involved in the repair of damaged bases at the
replication fork (Takao et al., 2002a). This is further supported by the
work of Dou et al. who showed that NEIL1 (and NEIL2) can function as
DNA glycosylases in a bubble structure of DNA and on single- and double-
stranded DNA, and indeed the catalytic activity of NEIL1 is greater when
repairing single-stranded DNA (Dou et al., 2003).
FEN1, PCNA and CSB proteins have been shown to increase the activity of
NEIL1 in vitro (Dou et al., 2003; Hegde et al., 2008; Muftuoglu et al.,
2009). NEIL1 has also been shown to interact with DNA polβ and DNA
ligase IIIα. This suggests that the enzyme may have a role in DNA repair
co-ordination rather than being a less efficient backup for OGG1 (Dou et
al., 2003). Interestingly, whilst no direct interaction has been observed
between NEIL1 and OGG1, the presence of NEIL1 has been shown to
increase the efficiency of OGG1 in vitro, and is due to the NEIL1 protein
higher affinity for AP sites. It is also suggested that NEIL1 is acting as a
backup for APE1 to stimulate 8-oxoG repair (Hazra et al., 2007; Mokkapati
et al., 2004b). A study of various hNEIL1 polymorphisms as shown that a
reduction in the efficiency of the NEIL1 protein may be involved in the
pathogenesis of gastric cancers (Shinmura et al., 2004).
Ph.D. Thesis 2012 Alan Carter
56
The mouse NEIL1 gene is located on chromosome 9 at location 9c and
comprises 9 exons. The subsequent protein has a mass of 44 KDa and is
present in the nucleus of the cell (Morland et al., 2002). Expression levels
for NEIL1 vary between mouse tissues with levels highest in the prostate
ovary brain and spleen. Again the expression of the mouse NEIL1 protein
is cell cycle dependant, with the greatest expression in S-phase (Hazra et
al., 2002a). When compared with WT controls, the mortality rate of Neil1-
deficient cell lines high in response to low doses of γ-irradiation (3 min in
a Gammacell-40 Cesium irradiator at a dose rate of 0.75 Gy/mim)
(Rosenquist et al., 2003).
Whilst NEIL1 knockout mice do not show any immediate effects on weight
and viability, Vartanian et al. (2006) reported that a high proportion of
mice within the colony had been found to exhibited symptoms similar to
the human metabolic syndrome. This occurred in all of the male knockout
mice in the study and a large proportion of the female mice, with the
males being much more seriously obese than the females after around 8
months. Additionally serum levels of leptin were siginificantly higher in
NEIL1-/- mice. It was suggested that the symptoms associated the with
metabolic syndrome may have been caused by a build up of DNA damage
in the mitochondria disrupting metabolic processes (Vartanian et al.,
2006). A further breeding pair from this colony was housed in a different
animal facility but the resulting offspring did not display any of the
symptoms previously documented (Chan et al., 2009). However more
recently the link between NEIL1 and obesity has been renewed due to
data showing a significantly greater susceptability to obesity and reduction
in voluntary exercise, and it is now thought that the disruption of the
NEIL1 protein is a predisposing factor to obesity (Sampath et al., 2011).
1.8.2.4. NEIL2
The NEIL2 gene is located on chromosome 8 at position p23.1, it contains
five exons and codes for a protein with a mass of 37 KDa and is located
Ph.D. Thesis 2012 Alan Carter
57
mainly in the nucleus (Nusbaum et al., 2006). The protein sequence
indicates several conserved sequences that are also found in the NEIL1
protein including a catalytic proline terminal, the catalytic lysine residue,
the H2TH binding motif and additionally a zinc finger motif (Figure 1.18)
(Hazra et al., 2007). Like NEIL1, NEIL2 can perform APE independant β/δ
elimination and acts primarily on 5-OHU, as well as other oxidised
cytosines (see Table 1.2) (Dou et al., 2003; Hazra et al., 2002b).
NEIL2 mRNA is found ubiquitously throughout the body, but at different
levels depending on the tissues examined. High gene expression has been
reported in skeletal muscle and testis, and low expression levels in lung,
liver, spleen, thymus, prostate, and ovaries (Morland et al., 2002). The
tissue specificity of this enzyme seems to compensate for NEIL1 and NTH1
as the latter two enzymes are expressed less in muscle and testis,
whereas NEIL2 levels are higher in these two tissues. NEIL2 has a greater
affinity with the replication bubble structure of DNA than NEIL1, but unlike
NEIL1 its expression is not connected to that of the cell cycle. This
suggests that NEIL2 may be involved in global base excision repair, but it
can be inferred that it is connected with DNA replication and transcription
due to its ability to bind with single- and double-stranded DNA (Dou et al.,
2003; Hazra et al., 2002b; Takao et al., 2002b).
NEIL2 activity can be increased by interactions with YB-1, or decreased by
interacting with pyridoxal-5′-phosphate (Das et al., 2007b; Grin et al.,
2010). NEIL2 has also been shown to stably interact with the p300
transcriptional cofactor which acetylates Lys sites of proteins. The
acetylation of Lys49 of NEIL2 is the most effective target which leads to
inhibition of DNA glycosylase and AP lyase activity. Acetylation of other
Lys residues does not produce an inhibitory effect, indicating that
reversible modification of Lys49 could regulate the activity of NEIL2
(Bhakat et al., 2004).
Ph.D. Thesis 2012 Alan Carter
58
The mouse NEIL2 gene is located on chromosome 14 D1. It contains five
exons and codes for a protein with a mass of 37 KDa and is located mainly
in the nucleus (Church et al., 2009). To date no NEIL2-/- mice have been
reported.
Ph.D. Thesis 2012 Alan Carter
59
1.9. Hypothesis “If DNA glcosylases, specifically NEIL1, NEIL2, OGG1 and NTH1, are
involved in the regulation of endotoxin induced inflammation and then the
knockout of these genes, in murine models, will result in a reduction in the
inflammatory response to endotoxin.”
In order to test this hypothesis the following objectives will be carried out:
I. The molecular characterisation of new NEIL1-/- and NEIL2-/-
knockout mouse strains.
II. The identification of any phenotypes in the gross physiology of
NEIL1-/- and NEIL2-/- knockout mouse strains.
III. The maintainance of colonies of NEIL1-/-, OGG1-/- and NEIL2-/- mice
(Chapter 3).
IV. Creating murine embryonic fibroblasts (MEFs) from WT, OGG1-/-
NEIL1-/- and NEIL2-/- mouse strains.
V. Using the resulting MEF strains in conjunction with pre-existing MEF
cultures (NTH1-/- and [OGG1/NTH1] -/-) as models of inflammation
to identify the magnitude and the nature of this reduction in
inflammatory response due to the disruption of base excision repair
enzymes by measuring the levels of IL-6, IL-10 and MIP-1α
released from the MEFs after exposure to LPS (Chapter 4).
VI. Identifying the extent to which the knockout of NEIL1 and OGG1
reduces the immune response to LPS induced inflammation in
whole animal models by:-
a. Establishing whether levels of cytokines IL-6, IL-12, IL-10
and IL-4 differ between NEIL1-/-, OGG1-/- and WT mouse
serum, at basal and LPS treated levels.
Ph.D. Thesis 2012 Alan Carter
60
b. Establishing whether levels of MPO, MDA and GSH are
altered between NEIL1-/-, OGG1-/- and WT mouse tissues, at
basal and LPS treated levels (Chapters 5&6).
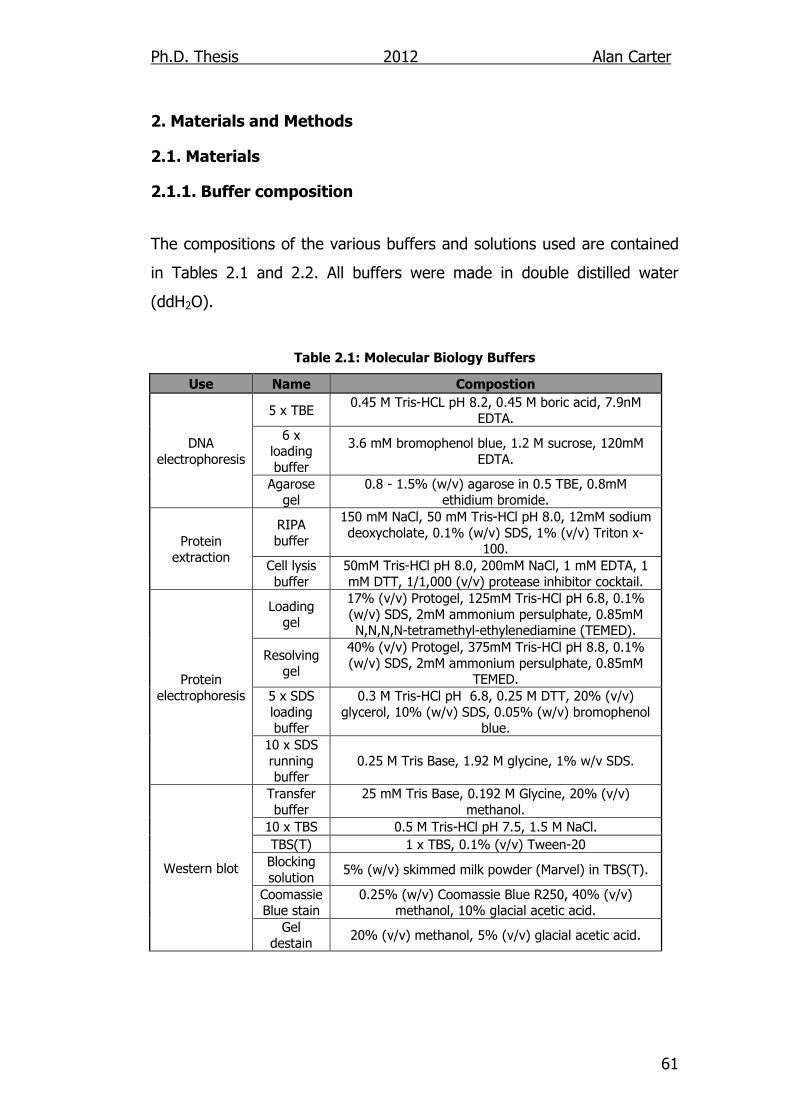
Ph.D. Thesis 2012 Alan Carter
61
2. Materials and Methods
2.1. Materials
2.1.1. Buffer composition
The compositions of the various buffers and solutions used are contained
in Tables 2.1 and 2.2. All buffers were made in double distilled water
(ddH2O).
Table 2.1: Molecular Biology Buffers
Use Name Compostion
DNA electrophoresis
5 x TBE 0.45 M Tris-HCL pH 8.2, 0.45 M boric acid, 7.9nM
EDTA. 6 x
loading buffer
3.6 mM bromophenol blue, 1.2 M sucrose, 120mM EDTA.
Agarose gel
0.8 - 1.5% (w/v) agarose in 0.5 TBE, 0.8mM ethidium bromide.
Protein extraction
RIPA buffer
150 mM NaCl, 50 mM Tris-HCl pH 8.0, 12mM sodium deoxycholate, 0.1% (w/v) SDS, 1% (v/v) Triton x-
100. Cell lysis buffer
50mM Tris-HCl pH 8.0, 200mM NaCl, 1 mM EDTA, 1 mM DTT, 1/1,000 (v/v) protease inhibitor cocktail.
Protein electrophoresis
Loading gel
17% (v/v) Protogel, 125mM Tris-HCl pH 6.8, 0.1% (w/v) SDS, 2mM ammonium persulphate, 0.85mM N,N,N,N-tetramethyl-ethylenediamine (TEMED).
Resolving gel
40% (v/v) Protogel, 375mM Tris-HCl pH 8.8, 0.1% (w/v) SDS, 2mM ammonium persulphate, 0.85mM
TEMED. 5 x SDS loading buffer
0.3 M Tris-HCl pH 6.8, 0.25 M DTT, 20% (v/v) glycerol, 10% (w/v) SDS, 0.05% (w/v) bromophenol
blue. 10 x SDS running buffer
0.25 M Tris Base, 1.92 M glycine, 1% w/v SDS.
Western blot
Transfer buffer
25 mM Tris Base, 0.192 M Glycine, 20% (v/v) methanol.
10 x TBS 0.5 M Tris-HCl pH 7.5, 1.5 M NaCl.
TBS(T) 1 x TBS, 0.1% (v/v) Tween-20
Blocking solution
5% (w/v) skimmed milk powder (Marvel) in TBS(T).
Coomassie Blue stain
0.25% (w/v) Coomassie Blue R250, 40% (v/v) methanol, 10% glacial acetic acid.
Gel destain
20% (v/v) methanol, 5% (v/v) glacial acetic acid.
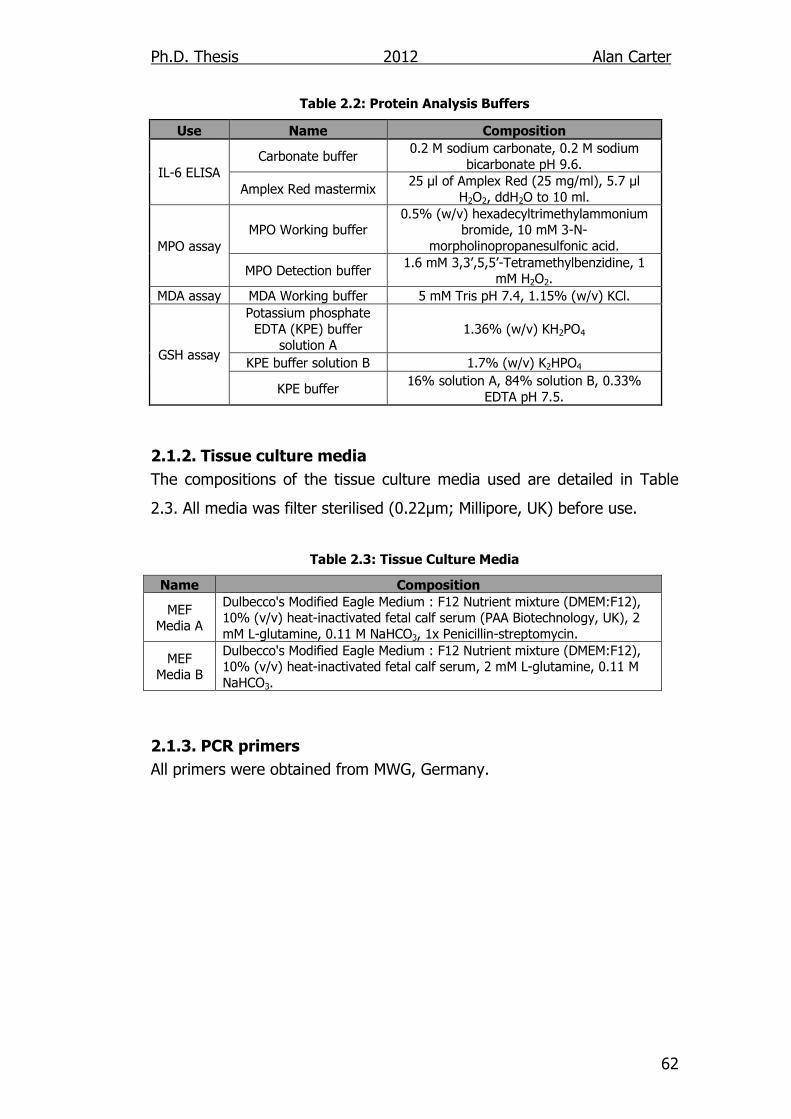
Ph.D. Thesis 2012 Alan Carter
62
Table 2.2: Protein Analysis Buffers
Use Name Composition
IL-6 ELISA Carbonate buffer
0.2 M sodium carbonate, 0.2 M sodium bicarbonate pH 9.6.
Amplex Red mastermix 25 µl of Amplex Red (25 mg/ml), 5.7 µl
H2O2, ddH2O to 10 ml.
MPO assay MPO Working buffer
0.5% (w/v) hexadecyltrimethylammonium bromide, 10 mM 3-N-
morpholinopropanesulfonic acid.
MPO Detection buffer 1.6 mM 3,3’,5,5’-Tetramethylbenzidine, 1
mM H2O2.
MDA assay MDA Working buffer 5 mM Tris pH 7.4, 1.15% (w/v) KCl.
GSH assay
Potassium phosphate EDTA (KPE) buffer
solution A 1.36% (w/v) KH2PO4
KPE buffer solution B 1.7% (w/v) K2HPO4
KPE buffer 16% solution A, 84% solution B, 0.33%
EDTA pH 7.5.
2.1.2. Tissue culture media The compositions of the tissue culture media used are detailed in Table
2.3. All media was filter sterilised (0.22µm; Millipore, UK) before use.
Table 2.3: Tissue Culture Media
Name Composition
MEF Media A
Dulbecco's Modified Eagle Medium : F12 Nutrient mixture (DMEM:F12), 10% (v/v) heat-inactivated fetal calf serum (PAA Biotechnology, UK), 2 mM L-glutamine, 0.11 M NaHCO3, 1x Penicillin-streptomycin.
MEF Media B
Dulbecco's Modified Eagle Medium : F12 Nutrient mixture (DMEM:F12), 10% (v/v) heat-inactivated fetal calf serum, 2 mM L-glutamine, 0.11 M NaHCO3.
2.1.3. PCR primers All primers were obtained from MWG, Germany.
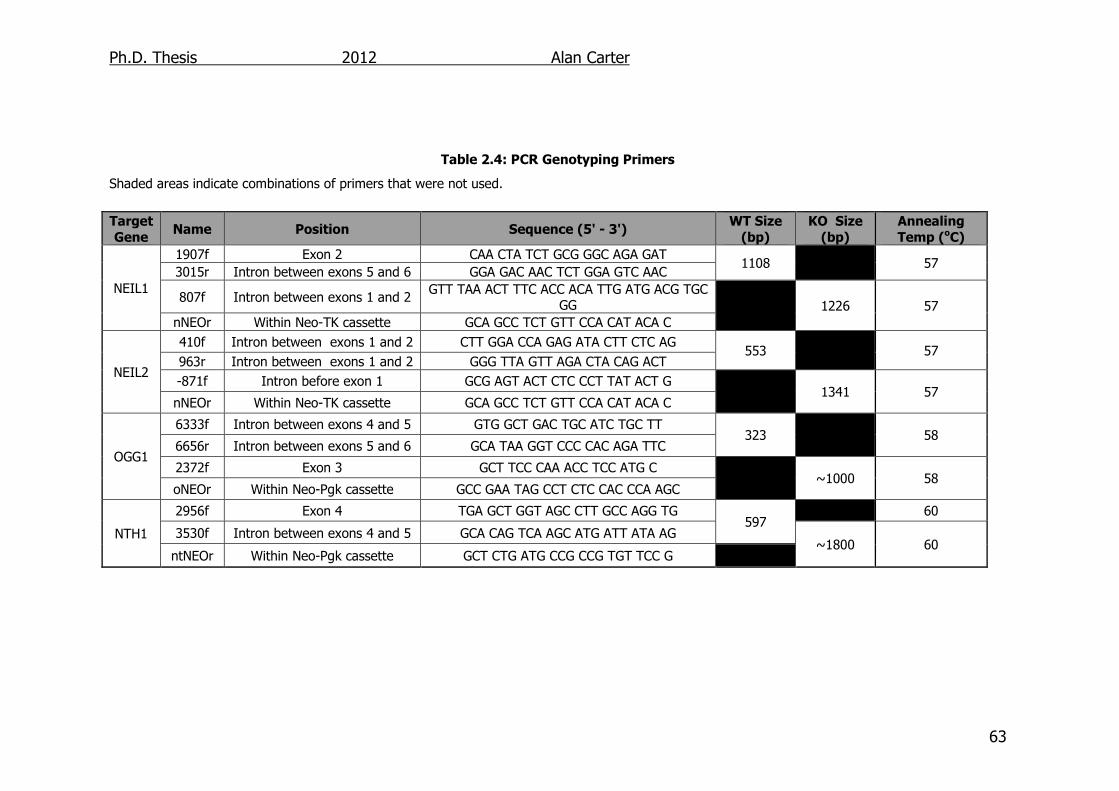
Ph.D. Thesis 2012 Alan Carter
63
Table 2.4: PCR Genotyping Primers
Shaded areas indicate combinations of primers that were not used.
Target
Gene Name Position Sequence (5' - 3')
WT Size
(bp)
KO Size
(bp)
Annealing
Temp (oC)
NEIL1
1907f Exon 2 CAA CTA TCT GCG GGC AGA GAT 1108 57
3015r Intron between exons 5 and 6 GGA GAC AAC TCT GGA GTC AAC
807f Intron between exons 1 and 2 GTT TAA ACT TTC ACC ACA TTG ATG ACG TGC
GG 1226 57 nNEOr Within Neo-TK cassette GCA GCC TCT GTT CCA CAT ACA C
NEIL2
410f Intron between exons 1 and 2 CTT GGA CCA GAG ATA CTT CTC AG 553 57
963r Intron between exons 1 and 2 GGG TTA GTT AGA CTA CAG ACT
-871f Intron before exon 1 GCG AGT ACT CTC CCT TAT ACT G 1341 57
nNEOr Within Neo-TK cassette GCA GCC TCT GTT CCA CAT ACA C
OGG1
6333f Intron between exons 4 and 5 GTG GCT GAC TGC ATC TGC TT 323 58
6656r Intron between exons 5 and 6 GCA TAA GGT CCC CAC AGA TTC
2372f Exon 3 GCT TCC CAA ACC TCC ATG C ~1000 58
oNEOr Within Neo-Pgk cassette GCC GAA TAG CCT CTC CAC CCA AGC
NTH1
2956f Exon 4 TGA GCT GGT AGC CTT GCC AGG TG 597
60
3530f Intron between exons 4 and 5 GCA CAG TCA AGC ATG ATT ATA AG ~1800 60
ntNEOr Within Neo-Pgk cassette GCT CTG ATG CCG CCG TGT TCC G
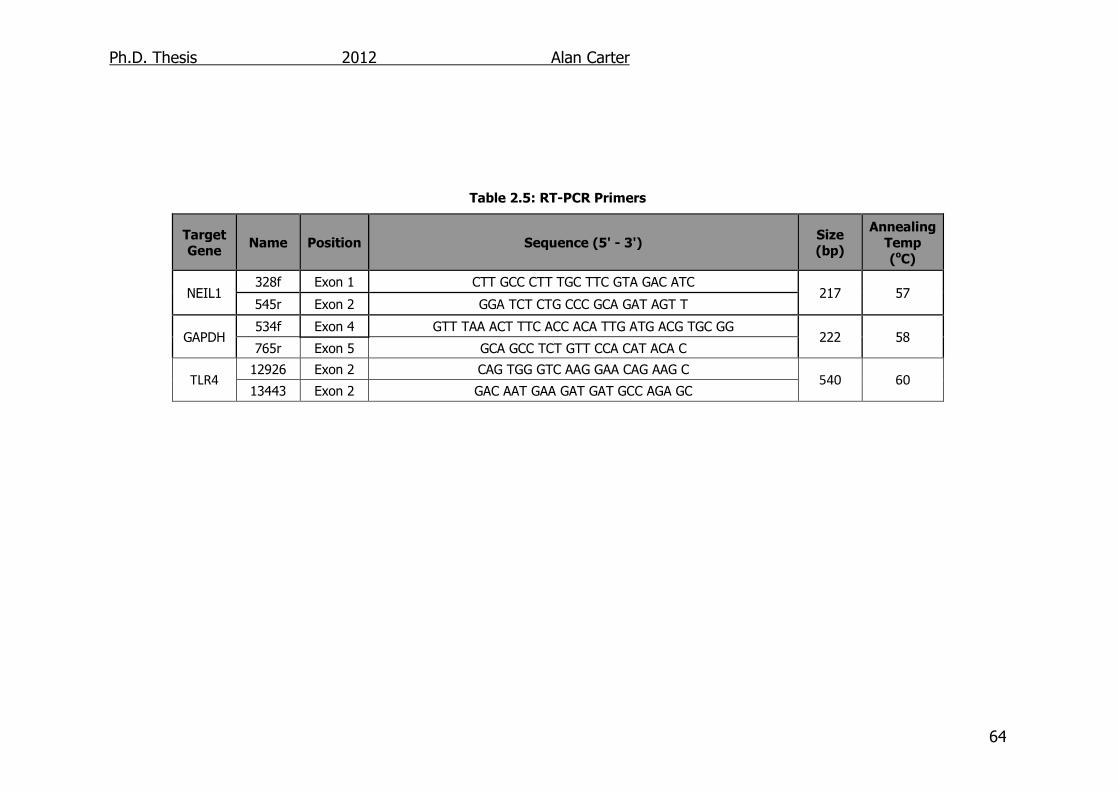
Ph.D. Thesis 2012 Alan Carter
64
Table 2.5: RT-PCR Primers
Target Gene
Name Position Sequence (5' - 3') Size (bp)
Annealing Temp
(oC)
NEIL1 328f Exon 1 CTT GCC CTT TGC TTC GTA GAC ATC
217 57 545r Exon 2 GGA TCT CTG CCC GCA GAT AGT T
GAPDH 534f Exon 4 GTT TAA ACT TTC ACC ACA TTG ATG ACG TGC GG
222 58 765r Exon 5 GCA GCC TCT GTT CCA CAT ACA C
TLR4 12926 Exon 2 CAG TGG GTC AAG GAA CAG AAG C
540 60 13443 Exon 2 GAC AAT GAA GAT GAT GCC AGA GC
Ph.D. Thesis 2012 Alan Carter
65
2.1.4. Molecular biology reagents
All reagents obtained from Sigma-Aldrich except:-
- AMV reverse transcriptase (10 U/µl): Roche Applied Biosciences, UK.
- Reverse transcription random primers, RNasin (40 U/µl): Promega, UK.
- Restriction endonucleases Xmn1 (10 U/Xl) and associated buffers: New
England Biolabs, UK.
- BIOTaq polymerase (10 U/µl) and associated buffer, Bio-X-Act long DNA
polymerase (10 U/µl) and associated buffer, dNTPs and HyperLadder I:
Bioline,UK.
- Direct PCR (cell) and Direct PCR (ear) lysis buffer: Viagen Biotech, US.
- RNeasy minikit, DNeasy blood and tissue kit: Qiagen, UK.
2.1.5. Protein analysis reagents
All reagents obtained from Sigma-Aldrich except:-
- Precision plus protein-all blue standards and DC protein assay:
Bio-Rad, UK.
- Protogel (30% Acrylamide / 0.8% bisacrylamide) solution: National
Diagnostics, US.
- Enhanced chemiluminescent (ECL) advanced western blot detection kit,
and HiBond 0.45 Xm ECL nitrocellulose membrane: Amersham, UK.
- Antibodies, Abcam, UK.
- Horseradish peroxidase (HRP)-conjugated goat anti-rabbit secondary
antibodies: Dakocytomation, Denmark.
- Nylon Membranes, positively charged: Roche Applied Sciences, UK.
- Labeling and Detection - DIG system for in situ hybridiasation: Roche
Applied Sciences, UK.
Ph.D. Thesis 2012 Alan Carter
66
- ELISA Kits – eBioscience, UK
- Heparin Sodium (with preservative) 25,000 i.u./5ml, Wockhardt UK Ltd.
- Amersham Hyperfilm – Amersham, UK
2.1.6. Equipment
The following equipment was used:
- Multimode scanner: TyphoonTM 9400 (accompanying software for image
quantification: ImageQuant TL TM): GE Healthcare, UK.
- Spectrophotometric plate reader: SPECTRAmax PLUS 384 (software:
SOFTmax PRO): Molecular Devices, US.
- NanoDrop 1000 spectrophotometer: Thermo Fisher Scientific, UK.
- PAGE electrophoresis and western-blot: Mini-Protean 3 cell vertical
electrophoresis system and Mini Trans-Blot cell blotting system: Bio-Rad,
UK.
- Sonicator: Sonopuls HD2070 MS72 sonicator, Bandelin electronics,
GmbH&Co., Germany.
- Fluorescent plate reader: FluoroSkan Ascent (accompanying software:
Ascent SoftwareTM version 2.4): Thermo Scientific, UK.
- PCR Machines: Techne TC-3000G, Geneflow; DNA Thermal Cycler 480,
Perkin Elmer. Thermal Cycler, Hybaid PCR, OmniGene.
2.1.7. Transgenic Mouse and MEF sources NEIL1-/- and NEIL2-/- knockout mice were generated by Dr. Rhod Elder using
published protocols (Perez-Campo et al., 2007). OGG1-/- mice had been
designed previously (Klungland et al., 1999) and were obtained from
embryos stored at the Patterson Institute. All MEFs used of these genotype
Ph.D. Thesis 2012 Alan Carter
67
were derived from these mice and in addition from from NTH1-/- (Elder and
Dianov 2002) and [NTH1/OGG1]-/- (Karahalil et al., 2003) mice.
2.2. Methods
2.2.1. Mouse Colony Management
Heterozygous (HET) NEIL1, putative NEIL2 and OGG1 female mice were
backcrossed to a C57Bl/6J male. A HET male from the resulting offspring was
selected at random to breed to further C57B1/6J females for a further five
generations. Various HET mice were intercrossed and produced mice for
initial phenotypic characterisation. Knockout x knockout (KO x KO) and
wildtype x wildtype (WT x WT) mice were interbred to produce mice for
experimental purposes such as the creation of MEFs. All mice were housed in
solid floored cages where food and water were provided ad libitum.
2.2.2. Mouse Colony Characterisation
The offspring of HET X HET crosses were housed in boxes separated by sex
and litter, and these became the characterisation group. Mouse body weight
was then measured at monthly intervals and mice were also examined to
detect outward phenotypic changes. After 12 months the NEIL1 mice were
sacrificed by cervical dislocation and scalp to tail length of the mouse
measured. Major organs were also taken and the weights of the heart, lungs,
liver, kidney, spleen, omentum fat, reproductive organs (testes and both
ovaries and uteris in male and female mice respectivly) and adrenal glands
measured. Six male and six female mice of each genotype had blood samples
taken by cardiac puncture whilst under terminal anaesthetic (isoflurane) to be
used with cytokine ELISA’s.
Ph.D. Thesis 2012 Alan Carter
68
2.2.3. LPS Induced Organ Damage
For MPO, MDA and GSH assays, the wildtype, NEIL1-/- and OGG1-/- mice to be
treated with LPS were first weighed individually, then injected i.p. with the
appropriate amount of LPS (20 mg/kg) in phosphate buffered saline (PBS; pH
7.4). After 12 h the mice were sacrificed by cervical dislocation and the heart,
lungs, liver, kidneys, and a section of ileum were removed and snap frozen in
liquid nitrogen. These were then stored at -80oC.
2.2.4. Induction of Immune Response
For cytokine assays the wildtype, NEIL1-/- and OGG1-/- mice to be treated
with LPS were first weighed individually, then injected i.p. with the
appropriate amount of LPS (2 mg/kg) in PBS. After 1, 6 or 24 h the mice
were placed under terminal anaesthetic (isoflurane) and exsanguinated by
cardiac puncture after which they were killed by cervical dislocation. The
blood was stored on ice with heparin (0.05 ml/ml blood). Blood samples were
then centrifuged for 15 min at 8000 g and the supernatant removed to a
separate Eppendorf. Both cells and supernatant were than stored at -80oC.
2.2.5. Establishment of MEF cultures from mouse embryos
In order to establish wildtype, NEIL1-/- and OGG1-/- MEF cell lines WT x WT
and KO x KO pairings were set up in order to produce the required offspring.
The females of these pairings were checked daily for vaginal plugging that
would indicate that mating had occurred. Thirteen days after plugging was
observed the pregnant mouse was killed by cervical dislocation, the uterus
removed, and placed in filtered phosphate buffered saline (PBS).
The individual embryos were then removed from the uterus and separated
from the placenta. The head was cut off and stored for genotyping.
Ph.D. Thesis 2012 Alan Carter
69
Additionally the umbilical chord and internal organs (heart, liver, kidney &
gut) were excised from the embryo, and the embryo was then washed in PBS
to remove any remaining debris. Using a scalpel blade the remaining tissue
was minced finely, and 1 ml of 0.5 µg/ml trypsin added. To ensure sufficient
primary breakdown of the embryo, the trypsin/embryo mixture was aspirated
through a 1000 µl pipette tip. The mixture was then incubated in a water
bath for 30 min at 37°C, mixing at 10 min intervals.
In order to wash out the trypsin the mixture was diluted in 6 ml of MEF
media A, and was then centrifuged for 5 min at 126 g. At this point a jelly like
substance may have formed in the supernatant and this was kept and the
rest of the supernatant discarded, and cells from the pellet and jelly
resuspended in 1 ml MEF media A. The cells were then plated onto 25 cm2
(T25) vented cell culture flasks and incubated with 3 ml of MEF media A in a
humidified atmosphere containing 5% CO2 and 3% O2. After a day, when the
cells had reached confluence, they were washed with PBS, 250 µl of Trypsin
added and the cells incubated at 37°C. When all cells had detached from the
flask, 2 ml of MEF media A was added and the mixture transferred to a sterile
centrifuge tube. Cells were centrifuged for 5 min at 126 g, the supernatant
discarded and the pellet was resuspended in 1 ml of MEF media A. This was
then placed in a new T25 and 3 ml of primary MEF culture medium A added.
When the cells in this flask had grown to confluence they were removed from
the flask by trypsinisation and after centrifugation in MEF media A, the cells
were resuspended in media containing 10% dimethyl sulfoxide (DMSO),
transferred to a labelled cryotube and placed on ice for 30 min before being
placed in storage in a -80oC freezer.
Ph.D. Thesis 2012 Alan Carter
70
2.2.6. MEF culture
NTH1-/- and [OGG1/NTH]-/- MEFs were taken from stocks held in liquid N2.
Cells were thawed rapidly in a 37°C water bath, and 6 ml of MEF media B,
held at room temperature, added slowly. To wash out the DMSO, the cells
were centrifuged at 126 g for 5 min, the supernatant discarded and the cells
resuspended in MEF media B. All MEFs were incubated at 37°C in 75 cm2
(T75) vented flasks in a humidified atmosphere containing 5% CO2 and 3%
O2.
Cells were passaged upon reaching confluence by washing cells in PBS,
trypsinising them with 750 µl of Trypsin-EDTA and incubating at 37°C. When
all the cells had been detached from the flask, 6 ml of MEF media B was
added and the mixture transferred to a sterile centrifuge tube. Cells were
centrifuged for 5 min at 126 g, the supernatant discarded and the pellet was
resuspended in 1 ml of MEF media B. The MEFs were then counted using a
haemocytometer and 6 x 10⁴ cells plated in a new T75 flask containing 10 ml
of medium B.
At regular stages, stocks of MEFs were frozen for future use; cells were
pelleted by centrifugation and the supernatant discarded. The cells were then
resuspended in 1 ml of MEF media B containing 10% DMSO, and transferred
to a labelled cryotube, which was placed on ice for 30 min before storage in a
-80oC freezer.
2.2.7. Treatment of MEFs with LPS
Duplicate samples of 2 x 10⁵ MEF cells of each genotype WT, OGG1-/-,
NTH1-/-, [OGG1/NTH1]-/- and NEIL1-/-) were plated in separate wells in a 24-
well plate. Controls were incubated with 1 ml of MEF media B only, while the
Ph.D. Thesis 2012 Alan Carter
71
experimental samples were treated with 1 ml of MEF media B containing 0.25
µg/ml purified LPS from Escherichia coli serotype 127:B8. Plates were then
incubated for 18 h before the supernatant was aspirated into clean Eppendorf
tubes and frozen.
2.2.8. Genomic DNA extraction
DNA was extracted from a variety of sources, including earpunches, heads of
embryos and MEF cells. Such material was placed into a clean 0.5 ml
Eppendorf tube. One hundred and fifty microlitres of the appropriate
DirectPCR Lysis Reagent was added (Direct PCR ear for earpunch and head
pieces, Direct PCR cell for cells). The samples were then incubated for 5 – 6 h
at 55°C with occasional agitation (~ every 2 h) to ensure all the material
came into contact with the lysis solution. At the end of the incubation,
samples were examined visually to ensure that complete lysis of the material
had occurred. If not the mixture was then left until lysis had been completed
(up to overnight). After lysis, the temperature was increased to 85°C for 45
min to inactivate the Proteinase K. DNA concentration was determined prior
to storage by measuring the absorbance of the solution at 260 nm using a
Nanodrop spectrophotometer. For quality control purposes, the ratio of
absorbance at λ = 260 and 280 nm and at λ = 260 and 230 nm were
monitored and values from 1.8 to 2.2 were accepted as good quality
indicators.
2.2.9. Polymerase Chain Reaction (PCR) Genotyping For each 50 µl reaction, 1.5 µl of the appropriate DNA solution (section
2.2.8) was used, to which was added; 5µl of 10x Taq buffer, 0.5 µl of dNTPs
(25 mM), 1 µl of forward primer (10 pmol/µl), 1 µl of reverse primer (10
pmol/µl), 0.2 µl of Taq DNA polymerase and 38.8 µl of H2O. The PCR
Ph.D. Thesis 2012 Alan Carter
72
amplification cycle was as follows; 95oC for 1 min; 95oC for 30 s
(denaturing), ~60oC (varies according to primer used; Table 2.4) for 30 s
(annealing), and 72oC for 1 min (elongation) for 30 cycles; 72oC for 5 min
and 25oC for 1 s.
2.2.10. Agarose Gel Electrophoresis Agarose gels were prepared by melting agarose in 0.5 x TBE in a microwave.
6 µl of loading buffer was added to each 50 µl PCR reaction and 15 µl of this
was then added into each well. In order to estimate fragment size, one well
was loaded with 3 µl of a DNA marker (Hyper Ladder I). For DNA fragments
below 1 kb a 1.5% agarose gel was used whilst for those fragments above 1
kb a 0.8% agarose gel was required. Electrophoresis was performed in 0.5x
TBE at 90 V for approximately 45 min. Results were visualised by using a
TyphoonTM laser, scanning at 532 nm.
2.2.11. RNA extraction
For total RNA extraction, 2 x 10⁵ MEF cells were trypsinised (section 2.2.6)
and pelleted in a centrifuge at 8000 g for 10 min. A RNeasy mini prep kit was
used according to manufacturer’s instructions. Cells were disrupted by adding
600 µl of buffer RLT and the mixture homogenised by passing the lysate at
least 5 times through a blunt 20–gauge needle attached to a syringe. 600 µl
of 70% ethanol was added to the homogenised lysate which was mixed by
pipetting and 700 µl of the resulting mixture added to an RNeasy spin column
placed in a 2 ml collection tube. This was centrifuged at 8000 g for 15 s and
the flow through discarded. Seven hundred microlitres of buffer RW1 was
added to the spin column, the mixture centrifuged at 8000 g for 15 s and the
flow through discarded. The column membrane was washed by adding
500 µl of buffer RPE and centrifuging at 8000 g for 15 s and discarding the
flow through; this step was repeated but with this centrifugation step lasting
Ph.D. Thesis 2012 Alan Carter
73
2 min in order to dry the membrane. The spin column was placed in a clean
1.5 ml collection tube and 30 µl of RNase free water was added to the
column. This was centrifuged at 8000 g for 2 min to elute the RNA. Total RNA
concentration was determined by measuring the optical density of the
solutions at λ= 260 nm using an ND-1000 spectrophotometer (NanoDrop
Technologies).
2.2.12. Reverse transcription (RT)
1.5 µg of RNA was dissolved in 11.75 µl of RNase free water and incubated
for 10 min at 70°C. The mRNA was reverse-transcribed into first strand cDNA
by adding 4 µl MgCl2 (25 mM), 2 µl 10x reverse transcriptase buffer, 1 µl
dNTPs (10 mM), 1 µl random primers and 0.25 µl AMV reverse transcriptase.
The samples were then incubated at the following temperatures: 25oC for 10
min, 42oC for 1 h, 95oC for 5 min and 0oC for 10 mins. The PCR step was
performed with Taq DNA polymerase as previously described (section 2.2.9)
using 1 µl of cDNA with an annealing temperature of 60oC.
2.2.13. Protein Analysis
2.2.13.1. Protein extraction from mouse tissues
Approximately 5 mg of mouse tissue was added into a clean mortar, which
was kept cool over ice, 300 µl cold RIPA buffer added and the organ was
disrupted using a pestel. The solution was transferred to a 1.5 ml Eppendorf
tube and agitated for 2 h on ice. The sample was centrifuged at 8000 g for
20 min at 4°C, and the supernatant was removed. 20 µl of the supernatant
was used for protein quantification (see 2.2.13.2). An additional supernatant
aliquot, to be used for the western blot, was diluted in 1 x SDS-PAGE loading
buffer and denatured by heating to 95°C for 5 min.
Ph.D. Thesis 2012 Alan Carter
74
2.2.13.2. Protein quantification
Diluted protein samples (10 µl, 1/5 - 1/25 dilution) and a range of bovine
serum albumin (BSA) protein standards (10 µl, 0 – 2.0 µg/µl) were mixed
with 200 µl of Bio-Rad DC protein assay reagent, in triplicate, in a 96-well
plate. The absorbance at 595 nm was measured in each well using a plate
reader. Protein concentration in the supernatant was determined using the
standard curve.
2.2.13.3. Western blot
Up to 50 µg of cell lysate (see 2.2.13.1) in 1 x SDS buffer was separated on a
12 or 16 % polyacrylamide gel (Protogel) by electrophoresis for 1 h at 200 V,
in SDS running buffer. A blue pre-stained molecular weight marker was
included in each gel. A positive control in the form of protein from a WT
animal was also included. The proteins were then transferred onto a
nitrocellulose membrane by electro-blotting for 1 h at 100 V, in ice cold
western blotting transfer buffer. The membrane was then incubated in
blocking solution for 1 h at RT and then incubated with primary antibody in
blocking solution (dilution: 1/2000) for 1 h at room temperature. After three
washes in TBS(T), the membrane was incubated with HRP conjugated
secondary antibody in blocking solution (dilution: 1/1,000) for 1 h at RT. The
blot was then washed three times in TBS(T) prior to ECL detection according
to the manufacturer’s instructions. Briefly, the membrane was drained and 1
ml of a 50:50 mixture of reagent A and reagent B was poured over the
membrane and incubated for 5 min at room temperature. The membrane
was drained of the excess ECL reagent and exposed to ECL-sensitive film.
Ph.D. Thesis 2012 Alan Carter
75
2.2.13.4. ELISA
To each well of a Maxisorp 96-well plate, 50 µl of carbonate buffer containing
25 µg/ml rat monoclonal anti-(mouse)interleukin-6 IgG was added, and
incubated overnight at 4oC. Each well was washed twice with PBS and
blocked with 100 µl of PBS containing 5% (w/v) non-fat milk (NFM) and
incubated at room temperature for a further 2 h. Each well was washed twice
with PBS before triplicate samples of 50 µl of either, increasing
concentrations of IL-6 in tissue culture medium, or each sample was added to
a well. Following incubation for 2 h at room temperature, the plate was
washed three times in PBS and 50 µl of rabbit polyclonal anti-(mouse)
interleukin-6 IgG diluted 1:2000 in PBS containing 0.5% (w/v) NFM was then
added to each well. After incubation at room temperature for 2 h, the plate
was washed 3 times with PBS-Tween 20, 50 µl of goat anti-rabbit IgG
conjugated with horseradish peroxidase diluted 1:2000 in PBS containing
0.5% (w/v) NFM added, and the plate incubated at 4°C for a further 16 h.
Plates were then washed a further 3 times with PBS containing 1% Tween 20
and 50 µl of Amplex Red mastermix was added. After 5 min the plate was
transferred to a TyphoonTM laser system, and fluorescence visualised by
scanning at 580 nm. A standard curve was produced using the results from
the known levels of IL-6 and this was used to determine the levels of IL-6 in
the cell supernatants.
All other ELISAs were obtained from eBioscience: the is described in brief. 50
µl of sample was placed into each well of a 96 well plate along with a
standard curve of the protein to be examined, and incubated overnight at
4oC. The wells were then emptied and washed 3 times in PBS-T, 100 µl of
blocking solution added, and incubated for 1 h at RT. Again the wells were
emptied, washed 5 times with PBS-T, 50 µl of primary antibody solution
added and incubated for 2 h at RT. After another 5 washes with PBS-T, 50 µl
Ph.D. Thesis 2012 Alan Carter
76
of the detection antibody solution was added to the wells and incubated for a
further 30 min. Again the wells were washed 5 times with PBS-T and 50 µl of
the developer solution was added. The development was halted after 10 min
by the addition of 25 µl of 2N H2SO4. The absorbance was then read at 650
nm and compared with the standard curve to identify the protein content of
the original samples.
2.2.13.5. Myeloperoxidase Assay
The protocol was adapted from Graff et al., 1998. ~25 mg tissue samples
were weighed and placed in 1.5 ml Eppendorf tubes containing 5 µl/mg MPO
working buffer. This was sonicated over ice for 2 s and the resulting solution
centrifuged at 8000 g for 15 min. After discarding the supernatant the pellet
was resuspended in 500 µl of MPO working buffer (Graff et al., 1998).
The resulting mixture was sonicated over ice for 20 s and then snap frozen,
after which it was thawed. This procedure was repeated twice. The resulting
solution was centrifuged at 8000 g for 10 min and stored on ice.
An aliquot of the supernatant was diluted 1:2 in working buffer and a DC
protein assay was performed (Section 2.2.13.2). To 10 µl of diluted
supernatant 190 µl of detection buffer was added and the absorbance read at
650 nm every 30 s for 2 mins. This was compared to the protein result from
the DC assay to give a result measured in mU(MPO)/mg protein.
2.2.13.6. Malondialdehyde Assay
The protocol was adapted from Mabley et al., 2005a. Tissue samples were
weighed (~20 mg) and placed in MDA working buffer (100mg/ml) inside a
1.5 ml Eppendorf tube. This was then sonicated for 5 s. In a separate 1.5 ml
Eppendorf, 75 µl of homogenate was placed to which was added 546 µl 0.8%
Ph.D. Thesis 2012 Alan Carter
77
(w/v) thiobarbutic acid, 75 µl 8.1% (v/v) SDS, 546 µl 20% (v/v) acetic acid
(pH 3.5) and 225 µl distilled H2O. An external standard was created using
1,1,3,3-tetramethoxypropane (0 – 14 mmol). All solutions were heated to
90oC for 45 min and the absorbance measured on a microplate reader at 532
nm. Protein in each sample was measured using a DC protein assay (see
2.2.12.2). MDA were adjusted to give a result measured in nMol(MDA)/mg
protein (Mabley et al., 2005a).
2.2.13.7. Glutathione Assay
The protocol was adapted from Rahman et al., 2006. Tissue samples (~20
mg) were weighed and placed in 1.5 ml Eppendorf tubes containing 5 µl/ml
0.6% (w/v) sulfosalcylic acid solution (if assaying liver 5% (w/v)
metaphosphoric acid was added as well). The mixture was sonicated over ice
for 5 s and centrifuged at 3000 g at 4oC for 10 min. The supernatant was
then removed and stored at 4oC up to 1 h before use. Samples were diluted
1/20 in ddH2O immediately before use (Rahman et al., 2006).
20 µl of the diluted samples were added to wells on a 96 well plate. 2 mg of
both 5,5’-dithio-bis(2-nitrobenzoic acid) (DTNB) and Nicotinamide adenine
dinucleotide phosphate (NADPH), and 40 µl of glutathione reductase (GR)
were each added to separate vials of 3 ml KPE buffer. DTNB and GR solutions
were mixed together equally and 120 µl added to each well. The samples
were incubated at room temperature for 30 s and 60 µl of NADPH solution
was added. Absorbance was read at 412 nm immediately and every 30 s for
2 min. Results were compared to a standard curve of glutathione (GSH).
Protein content was measured using a DC protein assay (2.2.13.2) and GSH
levels reported as nmol(GSH)/mg protein.
Ph.D. Thesis 2012 Alan Carter
78
2.2.14. Statistical Analysis
In order to compare numbers of pups of each genotype in each litter a chi
squared test was performed. To compare survival rates of each genotype a
log-rank analysis was performed.
When comparing cell cytokine production and mouse cytokine production
one-way ANOVAs were performed. ANOVAs were performed when comparing
weights, and as there were 3 groups of mice (WT, HET and KO) a LDS post
hoc test was performed. When comparing organ damage results (MPO, MDA
and GSH) factorial analyses were performed using a 3-way ANOVA. Sample
size was calculated using a statistical power of 0.8. A p<0.05 was considered
statistically significant.

Ph.D. Thesis 2012 Alan Carter
79
3. Mouse models: Generation and characterisation
3.1. Introduction
The first NEIL1-/- mice were reported in 2006; there was no immediate
difference observed in weight or viability of the mice when compared to
NEIL1+/+ mice. However, after 6-10 months all the male mice in the third
generation became significantly overweight when compared to the WT mice
(mean weight 50 g vs. 28 g), and the female mice were also overweight, but
to a less severe degree (mean 32 g vs. 28 g). The abdominal cavity of both
male and female NEIL1-/- mice was found to contain extensive fat deposits,
and their livers were significantly larger due to fat storage. The plasma of the
NEIL1-/- mice also contained elevated concentrations of leptin, which is
usually noted with elevated fat deposits, but not insulin (at fasting and fed
conditions) which would also be expected (Hoffler et al., 2009). Increased fat
deposits and hyperleptinemia were consistent with the human disease
metabolic syndrome. It is suggested by Vartanian et al. that the build up of
DNA damage in the mitochondria of the NEIL1-/- mice was disrupting the
metabolic processes. Other intermittent phenotypes observed included
reduced subcutaneous fat deposits, skin ulcerations, joint inflammation,
infertility and cancers (Vartanian et al., 2006). However when mice taken
from this colony were bred in a different animal facility, no obese phenotype
was observed in any of the mice bred there despite several years of
continuous breeding (Chan et al., 2009). This suggested that there may have
been another reason for the increased fat content in this strain of NEIL1-/-
mice. In a follow up paper the same group, at Oregon Health and Science
University, have shown that with an increase in oxidative damage (caused by
a high fat diet) a greater percentage of male and female mice exhibit markers
the metabolic syndrome, such as increased weight and hyperleptinemia
(Sampath et al., 2011). This supports the mitochondrial damage model
Ph.D. Thesis 2012 Alan Carter
80
previously mentioned which suggested that the metabolic syndrome
phenotype is not caused wholly by the absence of the NEIL1 gene, but its
removal does increase the mouse’s susceptibility to the symptom. The
removal of any protein which repairs oxidative damage in the mitochondria
could then contribute to the condition (Sampath et al., 2011). Indeed, in one
strain of OGG1-/- mice it has been reported that male OGG1-/- mice were
significantly heavier than OGG1+/+ mice after 24 -28 weeks (Arai et al.,
2006).
More work has been done to identify the effects of the knockout of OGG1 in
vivo. An OGG1-/- mouse was first documented in 1999, and there were no
significant differences in viability, and they were indistinguishable from
OGG1+/- and OGG1+/+ mice up to 18 months of age (Klungland et al., 1999).
In a different strain of OGG1-/- mice it was noted that after 19 months the
incidence of cancer in the animals increased (Sakumi et al., 2003).
In contrast to this work on NEIL1 and OGG1, very little work has been done
on the effects of NEIL2 in vivo, and whilst a few binding partners have been
identified to this date no NEIL2-/- mice have been reported (Bhakat et al.,
2004; Das et al., 2007b; Grin et al., 2010).
3.1.1. Aims
The objectives of this chapter are to:
I. Confirm that the disruption of the NEIL1 and NEIL2 genes have
resulted in the absence of NEIL1 and NEIL2 proteins respectively in
newly developed strains of mice.
II. Identify any phenotype in the gross physiology of these NEIL1-/- and
NEIL2-/- mice, especially pertaining to symptoms similar to the human
metabolic sydrome.

Ph.D. Thesis 2012 Alan Carter
81
III. Confirm the presence of the OGG1 knockout construct in the genomic
DNA of OGG1-/- mice.
3.2. Results
3.2.1. NEIL1 Mouse Colony
3.2.1.1. Preparation of NEIL1 Knockout Mice.
The NEIL1 mouse colony was created from two NEIL1+/- chimeras created
from ES cells prepared by Dr. Rhod Elder (Perez-Campo et al., 2007). Animals
in this colony were genotyped by PCR (Figure 3.1) and so identified as either
wildtype (NEIL1+/+, WT), heterozygous (NEIL1+/-, HET) and knockout
(NEIL1-/-, KO) mice. The appropriate mice identified from these PCRs were
then used in the selective breeding of the NEIL1-/- line and backcrossing to a
C57/B16J background (Figure 3.2).
Figure 3.1: Pedegree of NEIL1 Transgenic Mice
♂ Chimera 83 was crossed with a ♀ C57/B16J mouse to produce a litter of WT and HET animals. Then a ♂ C57/B16J and HET ♀ 29 were bred together to produce a backcross, from the resulting litter ♂ 130 was used to further backcross the animals. HET male 20 was crossed with HET ♀ (22 and 25) to produce a litter containing WT, HET and KO animals. These mice were then be used to produce further WT (140 x 121), KO (139 x 146) and HET (138 x 119 & 120) litters.
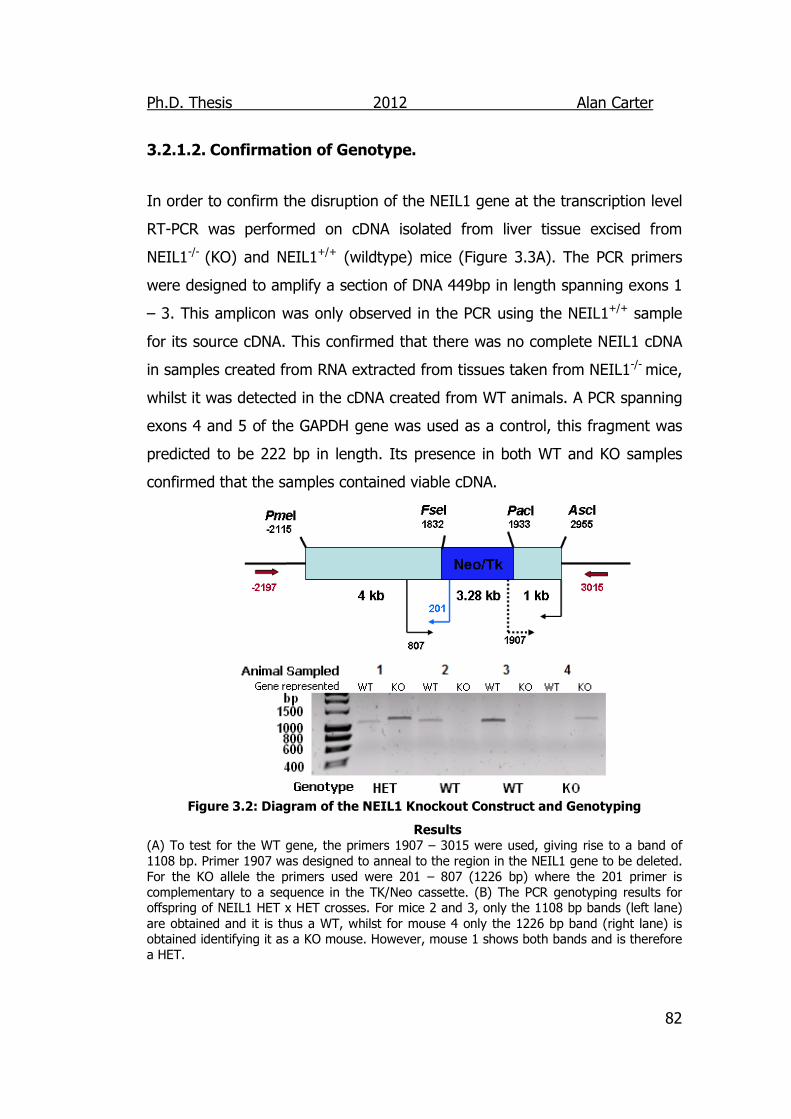
Ph.D. Thesis 2012 Alan Carter
82
3.2.1.2. Confirmation of Genotype.
In order to confirm the disruption of the NEIL1 gene at the transcription level
RT-PCR was performed on cDNA isolated from liver tissue excised from
NEIL1-/- (KO) and NEIL1+/+ (wildtype) mice (Figure 3.3A). The PCR primers
were designed to amplify a section of DNA 449bp in length spanning exons 1
– 3. This amplicon was only observed in the PCR using the NEIL1+/+ sample
for its source cDNA. This confirmed that there was no complete NEIL1 cDNA
in samples created from RNA extracted from tissues taken from NEIL1-/- mice,
whilst it was detected in the cDNA created from WT animals. A PCR spanning
exons 4 and 5 of the GAPDH gene was used as a control, this fragment was
predicted to be 222 bp in length. Its presence in both WT and KO samples
confirmed that the samples contained viable cDNA.
Figure 3.2: Diagram of the NEIL1 Knockout Construct and Genotyping
Results
(A) To test for the WT gene, the primers 1907 – 3015 were used, giving rise to a band of 1108 bp. Primer 1907 was designed to anneal to the region in the NEIL1 gene to be deleted. For the KO allele the primers used were 201 – 807 (1226 bp) where the 201 primer is complementary to a sequence in the TK/Neo cassette. (B) The PCR genotyping results for offspring of NEIL1 HET x HET crosses. For mice 2 and 3, only the 1108 bp bands (left lane) are obtained and it is thus a WT, whilst for mouse 4 only the 1226 bp band (right lane) is obtained identifying it as a KO mouse. However, mouse 1 shows both bands and is therefore a HET.
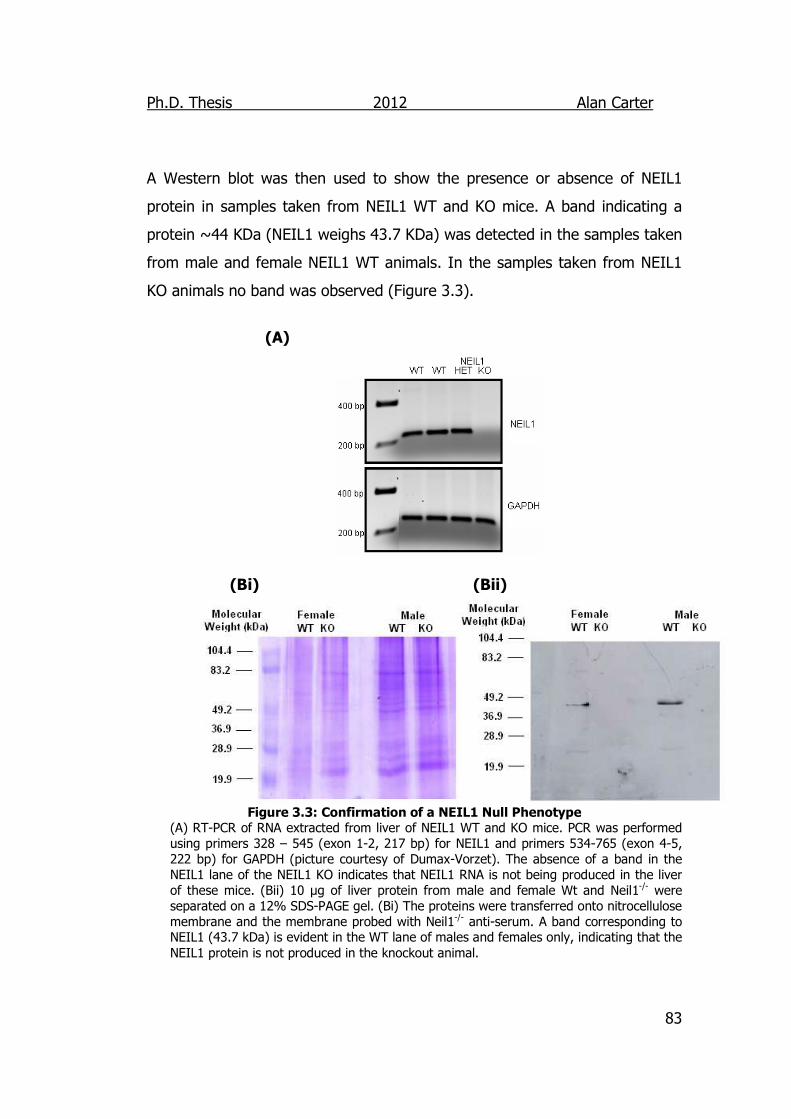
Ph.D. Thesis 2012 Alan Carter
83
A Western blot was then used to show the presence or absence of NEIL1
protein in samples taken from NEIL1 WT and KO mice. A band indicating a
protein ~44 KDa (NEIL1 weighs 43.7 KDa) was detected in the samples taken
from male and female NEIL1 WT animals. In the samples taken from NEIL1
KO animals no band was observed (Figure 3.3).
(A)
(Bi) (Bii)
Figure 3.3: Confirmation of a NEIL1 Null Phenotype
(A) RT-PCR of RNA extracted from liver of NEIL1 WT and KO mice. PCR was performed using primers 328 – 545 (exon 1-2, 217 bp) for NEIL1 and primers 534-765 (exon 4-5, 222 bp) for GAPDH (picture courtesy of Dumax-Vorzet). The absence of a band in the NEIL1 lane of the NEIL1 KO indicates that NEIL1 RNA is not being produced in the liver of these mice. (Bii) 10 µg of liver protein from male and female Wt and Neil1-/- were separated on a 12% SDS-PAGE gel. (Bi) The proteins were transferred onto nitrocellulose membrane and the membrane probed with Neil1-/- anti-serum. A band corresponding to NEIL1 (43.7 kDa) is evident in the WT lane of males and females only, indicating that the NEIL1 protein is not produced in the knockout animal.
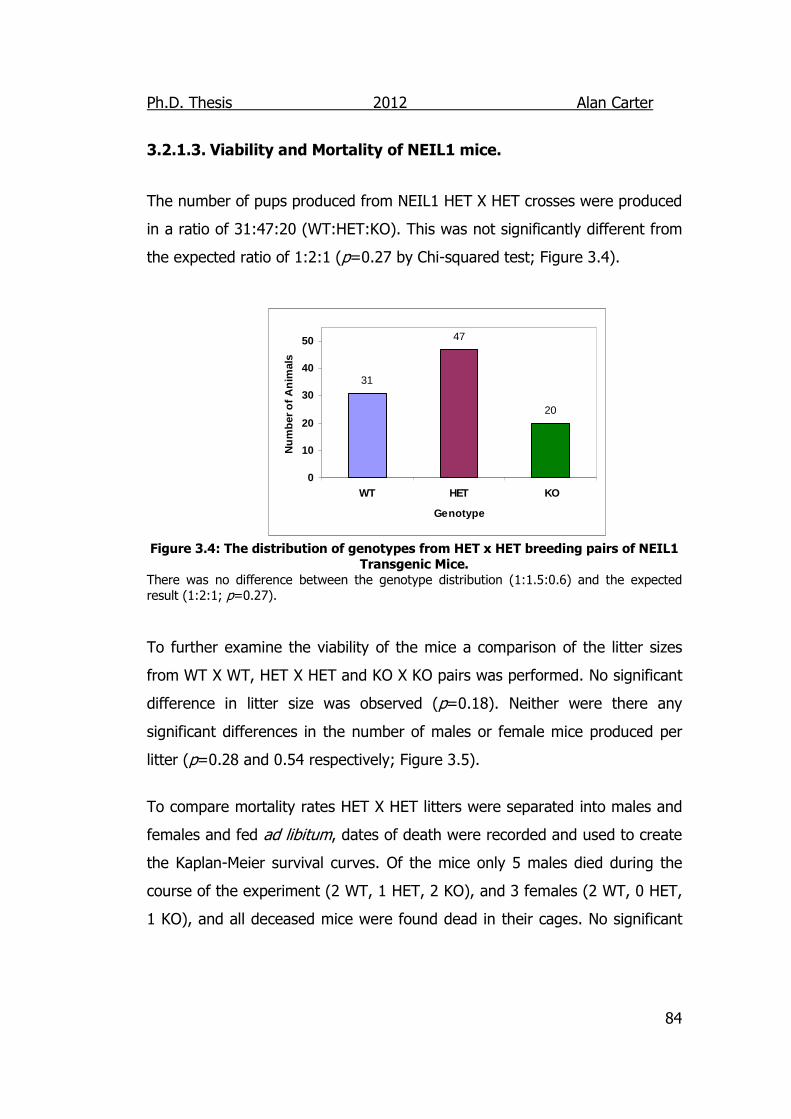
Ph.D. Thesis 2012 Alan Carter
84
3.2.1.3. Viability and Mortality of NEIL1 mice.
The number of pups produced from NEIL1 HET X HET crosses were produced
in a ratio of 31:47:20 (WT:HET:KO). This was not significantly different from
the expected ratio of 1:2:1 (p=0.27 by Chi-squared test; Figure 3.4).
31
47
20
0
10
20
30
40
50
WT HET KO
Genotype
Nu
mb
er o
f A
nim
als
Figure 3.4: The distribution of genotypes from HET x HET breeding pairs of NEIL1
Transgenic Mice.
There was no difference between the genotype distribution (1:1.5:0.6) and the expected result (1:2:1; p=0.27).
To further examine the viability of the mice a comparison of the litter sizes
from WT X WT, HET X HET and KO X KO pairs was performed. No significant
difference in litter size was observed (p=0.18). Neither were there any
significant differences in the number of males or female mice produced per
litter (p=0.28 and 0.54 respectively; Figure 3.5).
To compare mortality rates HET X HET litters were separated into males and
females and fed ad libitum, dates of death were recorded and used to create
the Kaplan-Meier survival curves. Of the mice only 5 males died during the
course of the experiment (2 WT, 1 HET, 2 KO), and 3 females (2 WT, 0 HET,
1 KO), and all deceased mice were found dead in their cages. No significant
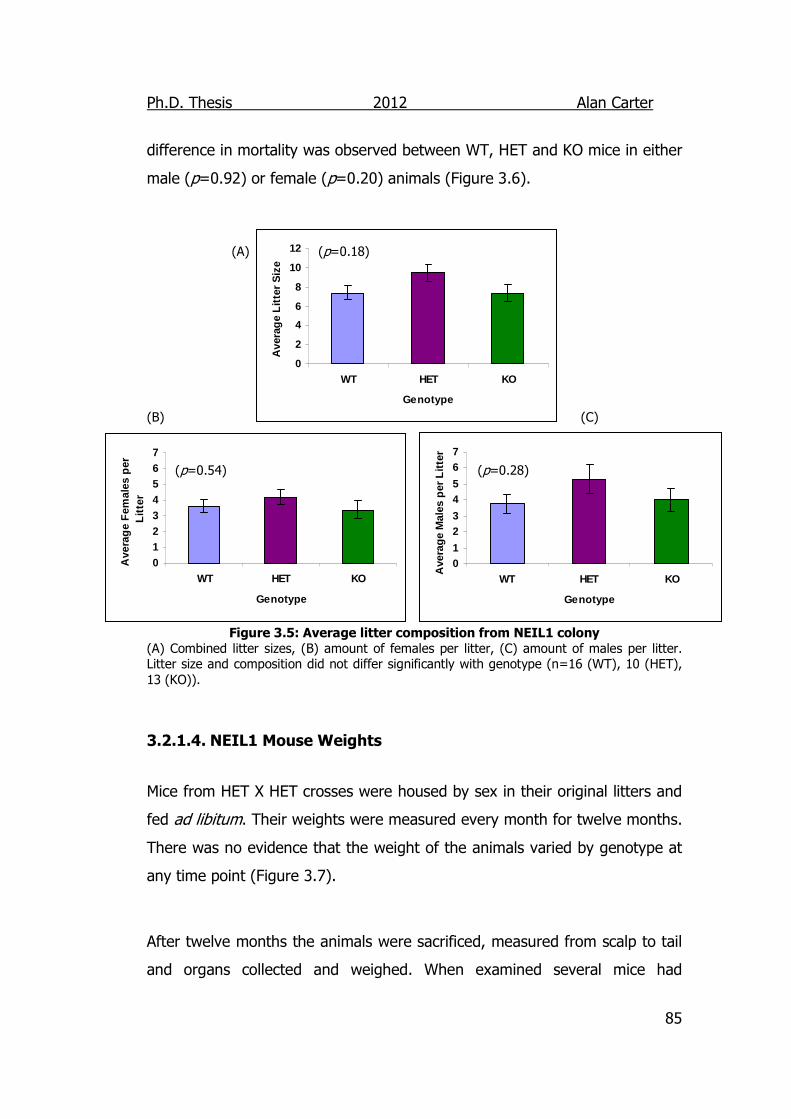
Ph.D. Thesis 2012 Alan Carter
85
01
23
45
67
WT HET KO
Genotype
Ave
rag
e M
ales
per
Lit
ter
01234567
WT HET KO
Genotype
Ave
rag
e F
emal
es p
er
Lit
ter
0
2
4
6
8
10
12
WT HET KO
Genotype
Ave
rag
e L
itte
r S
ize
difference in mortality was observed between WT, HET and KO mice in either
male (p=0.92) or female (p=0.20) animals (Figure 3.6).
(A) (p=0.18)
(B) (C)
(p=0.54) (p=0.28)
Figure 3.5: Average litter composition from NEIL1 colony
(A) Combined litter sizes, (B) amount of females per litter, (C) amount of males per litter. Litter size and composition did not differ significantly with genotype (n=16 (WT), 10 (HET), 13 (KO)).
3.2.1.4. NEIL1 Mouse Weights
Mice from HET X HET crosses were housed by sex in their original litters and
fed ad libitum. Their weights were measured every month for twelve months.
There was no evidence that the weight of the animals varied by genotype at
any time point (Figure 3.7).
After twelve months the animals were sacrificed, measured from scalp to tail
and organs collected and weighed. When examined several mice had
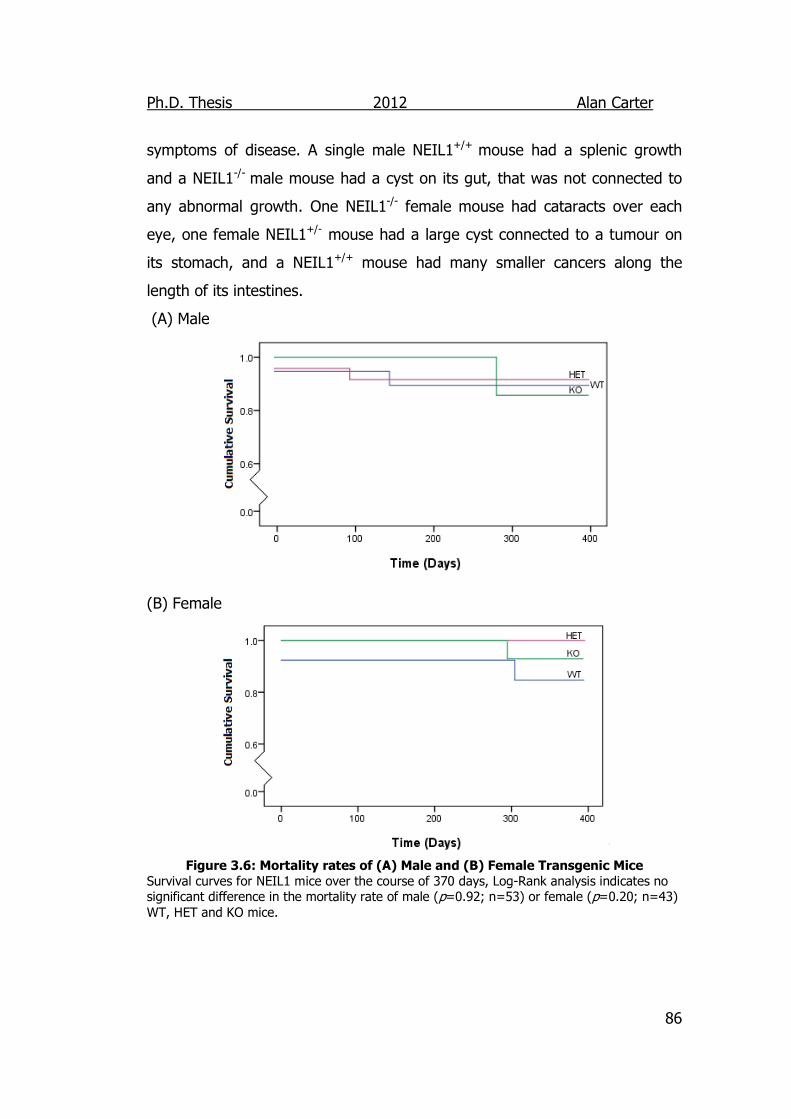
Ph.D. Thesis 2012 Alan Carter
86
symptoms of disease. A single male NEIL1+/+ mouse had a splenic growth
and a NEIL1-/- male mouse had a cyst on its gut, that was not connected to
any abnormal growth. One NEIL1-/- female mouse had cataracts over each
eye, one female NEIL1+/- mouse had a large cyst connected to a tumour on
its stomach, and a NEIL1+/+ mouse had many smaller cancers along the
length of its intestines.
(A) Male
(B) Female
Figure 3.6: Mortality rates of (A) Male and (B) Female Transgenic Mice
Survival curves for NEIL1 mice over the course of 370 days, Log-Rank analysis indicates no significant difference in the mortality rate of male (p=0.92; n=53) or female (p=0.20; n=43) WT, HET and KO mice.
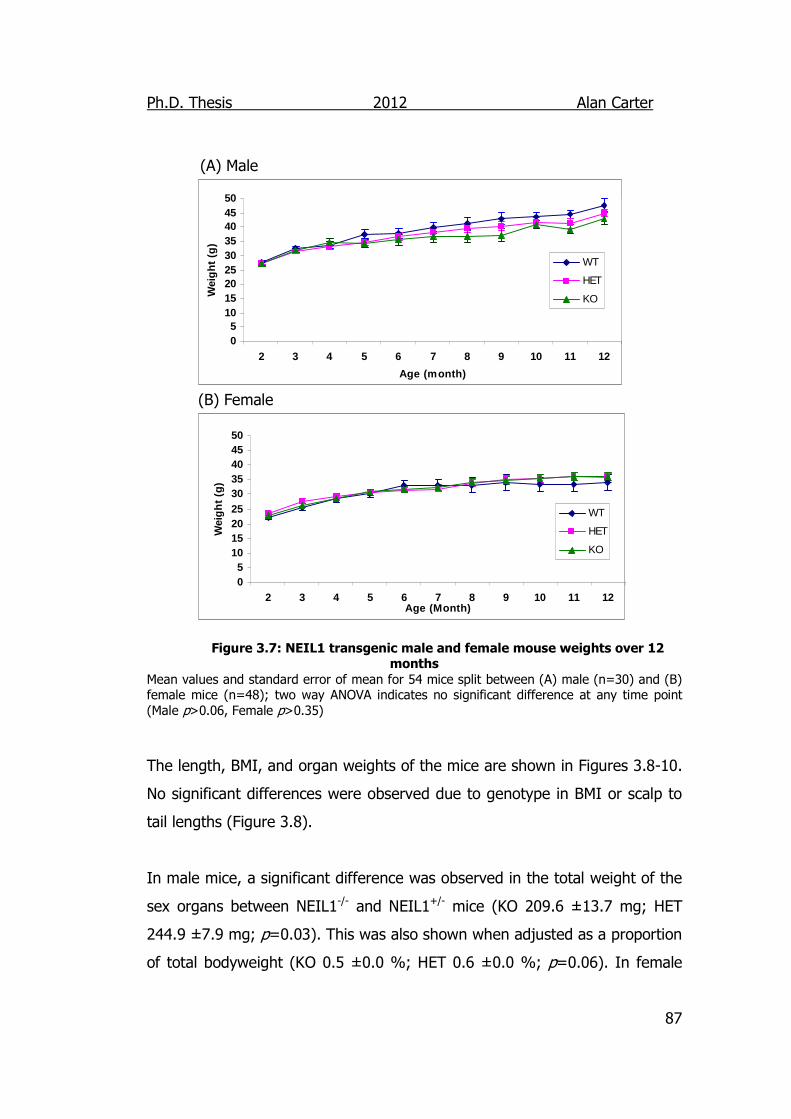
Ph.D. Thesis 2012 Alan Carter
87
(A) Male
05
101520253035404550
2 3 4 5 6 7 8 9 10 11 12
Age (month)
Wei
gh
t (g
)
WT
HET
KO
(B) Female
05
101520253035404550
2 3 4 5 6 7 8 9 10 11 12Age (Month)
Wei
gh
t (g
)
WT
HET
KO
Figure 3.7: NEIL1 transgenic male and female mouse weights over 12 months
Mean values and standard error of mean for 54 mice split between (A) male (n=30) and (B) female mice (n=48); two way ANOVA indicates no significant difference at any time point (Male p>0.06, Female p>0.35)
The length, BMI, and organ weights of the mice are shown in Figures 3.8-10.
No significant differences were observed due to genotype in BMI or scalp to
tail lengths (Figure 3.8).
In male mice, a significant difference was observed in the total weight of the
sex organs between NEIL1-/- and NEIL1+/- mice (KO 209.6 ±13.7 mg; HET
244.9 ±7.9 mg; p=0.03). This was also shown when adjusted as a proportion
of total bodyweight (KO 0.5 ±0.0 %; HET 0.6 ±0.0 %; p=0.06). In female
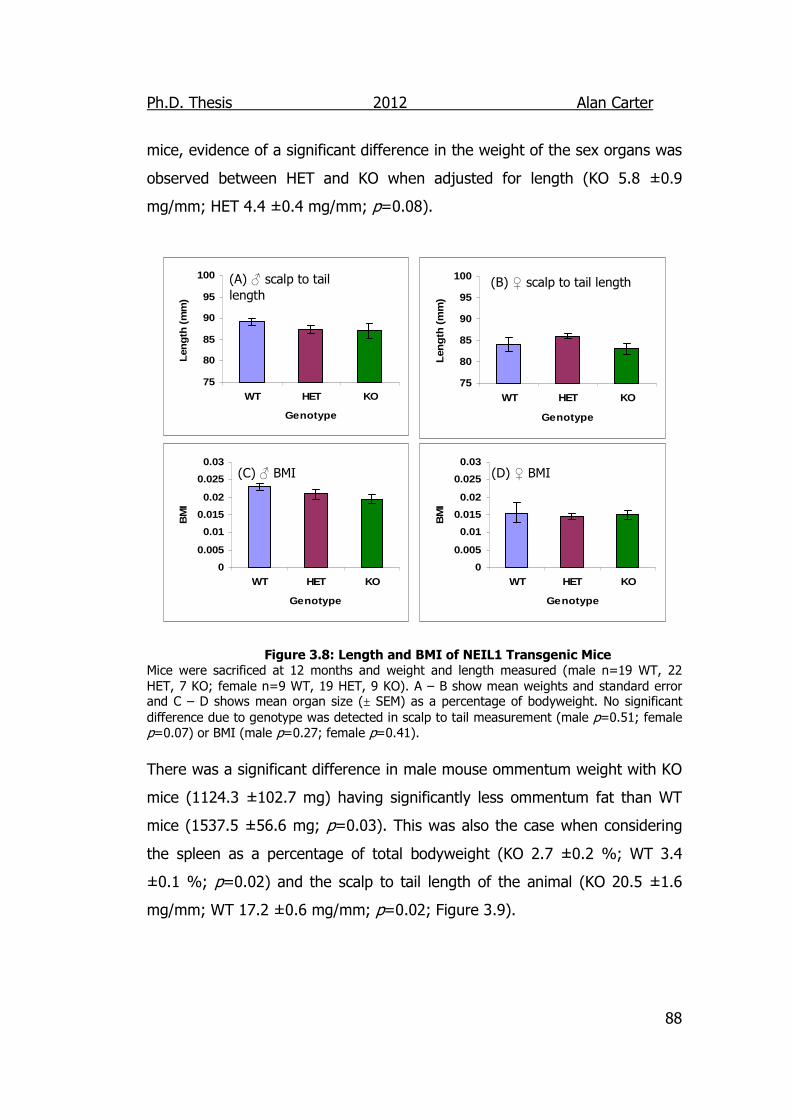
Ph.D. Thesis 2012 Alan Carter
88
75
80
85
90
95
100
WT HET KO
Genotype
Len
gth
(m
m)
75
80
85
90
95
100
WT HET KO
Genotype
Len
gth
(m
m)
0
0.005
0.01
0.015
0.02
0.025
0.03
WT HET KO
Genotype
BM
I
0
0.005
0.01
0.015
0.02
0.025
0.03
WT HET KO
Genotype
BM
I
mice, evidence of a significant difference in the weight of the sex organs was
observed between HET and KO when adjusted for length (KO 5.8 ±0.9
mg/mm; HET 4.4 ±0.4 mg/mm; p=0.08).
(A) ♂ scalp to tail length
(C) ♂ BMI
(B) ♀ scalp to tail length
(D) ♀ BMI
Figure 3.8: Length and BMI of NEIL1 Transgenic Mice Mice were sacrificed at 12 months and weight and length measured (male n=19 WT, 22 HET, 7 KO; female n=9 WT, 19 HET, 9 KO). A – B show mean weights and standard error and C – D shows mean organ size (± SEM) as a percentage of bodyweight. No significant difference due to genotype was detected in scalp to tail measurement (male p=0.51; female p=0.07) or BMI (male p=0.27; female p=0.41).
There was a significant difference in male mouse ommentum weight with KO
mice (1124.3 ±102.7 mg) having significantly less ommentum fat than WT
mice (1537.5 ±56.6 mg; p=0.03). This was also the case when considering
the spleen as a percentage of total bodyweight (KO 2.7 ±0.2 %; WT 3.4
±0.1 %; p=0.02) and the scalp to tail length of the animal (KO 20.5 ±1.6
mg/mm; WT 17.2 ±0.6 mg/mm; p=0.02; Figure 3.9).
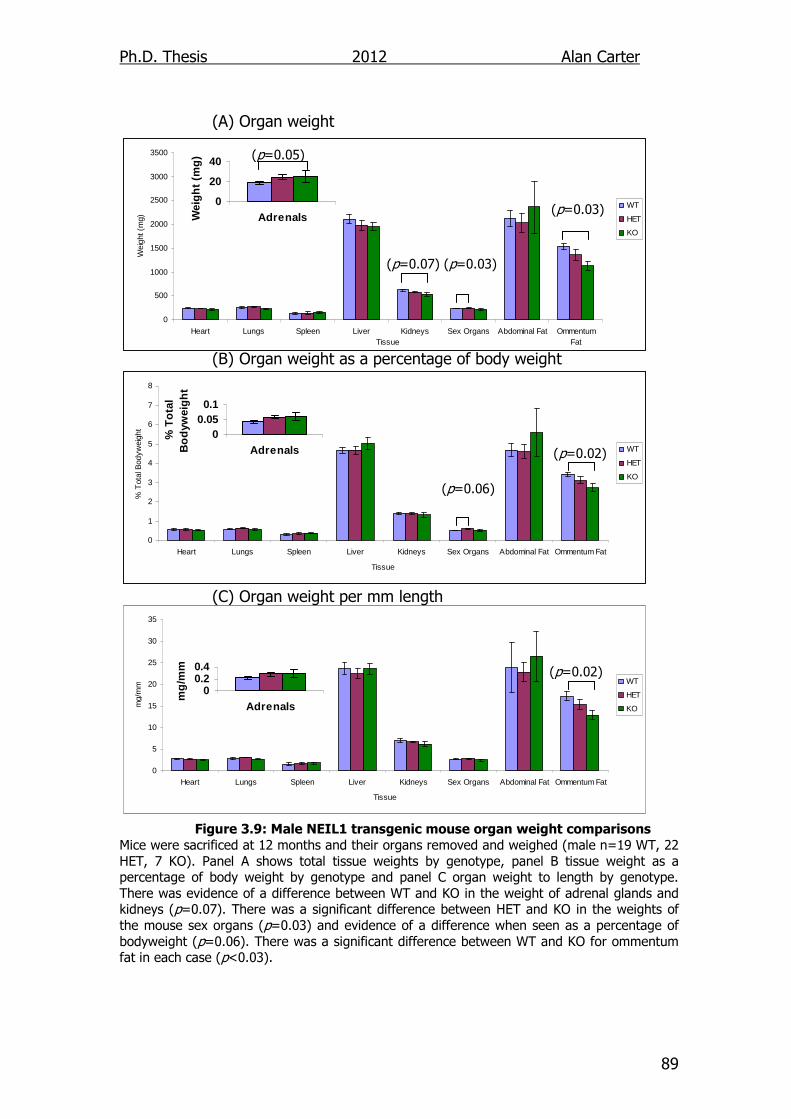
Ph.D. Thesis 2012 Alan Carter
89
0
500
1000
1500
2000
2500
3000
3500
Heart Lungs Spleen Liver Kidneys Sex Organs Abdominal Fat OmmentumFatTissue
Wei
ght (
mg)
WT
HET
KO
0
1
2
3
4
5
6
7
8
Heart Lungs Spleen Liver Kidneys Sex Organs Abdominal Fat Ommentum Fat
Tissue
% T
otal
Bod
ywei
ght
WT
HET
KO
0
20
40
AdrenalsWei
gh
t (m
g)
00.050.1
Adrenals
% T
ota
l B
od
ywei
gh
t
0
5
10
15
20
25
30
35
Heart Lungs Spleen Liver Kidneys Sex Organs Abdominal Fat Ommentum Fat
Tissue
mg/
mm WT
HET
KO
(A) Organ weight
(p=0.05)
(p=0.03) (p=0.07) (p=0.03) (B) Organ weight as a percentage of body weight
(p=0.02) (p=0.06)
(C) Organ weight per mm length (p=0.02)
Figure 3.9: Male NEIL1 transgenic mouse organ weight comparisons
Mice were sacrificed at 12 months and their organs removed and weighed (male n=19 WT, 22 HET, 7 KO). Panel A shows total tissue weights by genotype, panel B tissue weight as a percentage of body weight by genotype and panel C organ weight to length by genotype. There was evidence of a difference between WT and KO in the weight of adrenal glands and kidneys (p=0.07). There was a significant difference between HET and KO in the weights of the mouse sex organs (p=0.03) and evidence of a difference when seen as a percentage of bodyweight (p=0.06). There was a significant difference between WT and KO for ommentum fat in each case (p<0.03).
00.20.4
Adrenals
mg
/mm
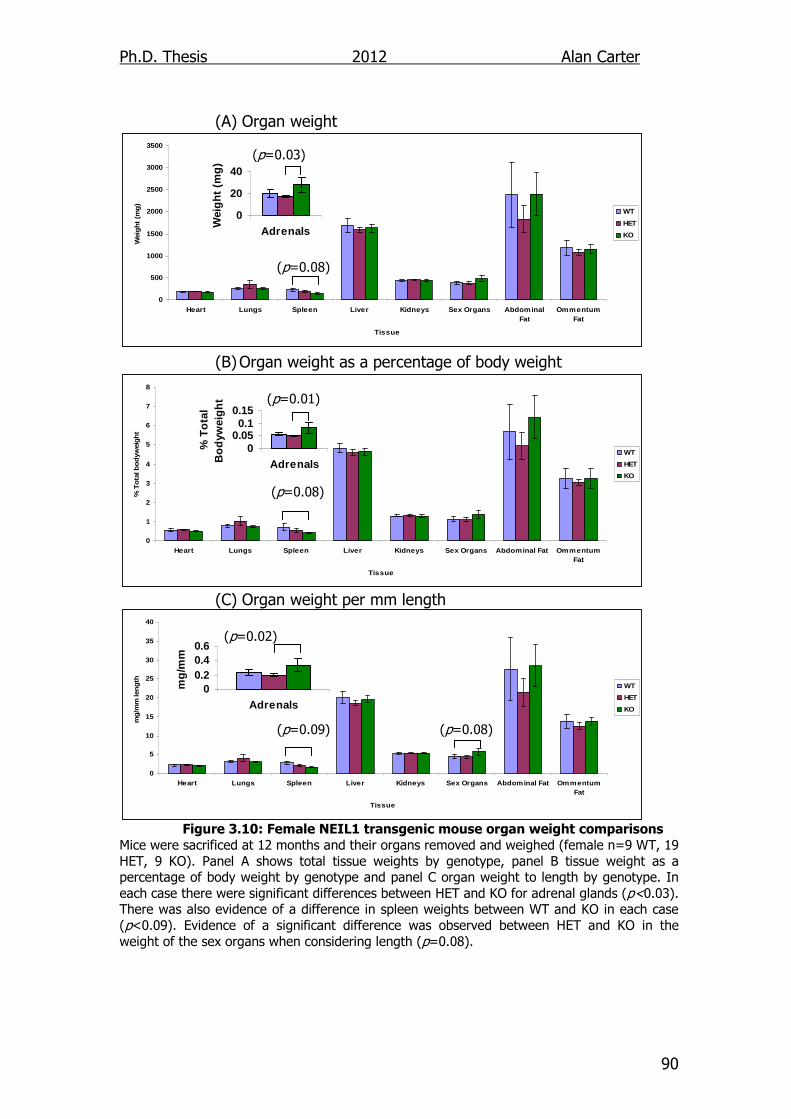
Ph.D. Thesis 2012 Alan Carter
90
0
500
1000
1500
2000
2500
3000
3500
Heart Lungs Spleen Liver Kidneys Sex Organs AbdominalFat
OmmentumFat
Tissue
Wei
gh
t (m
g)
WT
HET
KO
0
1
2
3
4
5
6
7
8
Heart Lungs Spleen Liver Kidneys Sex Organs Abdominal Fat OmmentumFat
Tissue
% T
ota
l bo
dyw
eig
ht
WT
HET
KO
0
5
10
15
20
25
30
35
40
Heart Lungs Spleen Liver Kidneys Sex Organs Abdominal Fat OmmentumFat
Tissue
mg
/mm
len
gth
WT
HET
KO
0
20
40
AdrenalsW
eig
ht
(mg
)
00.050.1
0.15
Adrenals
% T
ota
l B
od
ywei
gh
t
00.20.40.6
Adrenals
mg
/mm
(A) Organ weight (p=0.03)
(p=0.08) (B) Organ weight as a percentage of body weight
(p=0.01)
(p=0.08)
(C) Organ weight per mm length
(p=0.02)
(p=0.09) (p=0.08)
Figure 3.10: Female NEIL1 transgenic mouse organ weight comparisons
Mice were sacrificed at 12 months and their organs removed and weighed (female n=9 WT, 19 HET, 9 KO). Panel A shows total tissue weights by genotype, panel B tissue weight as a percentage of body weight by genotype and panel C organ weight to length by genotype. In each case there were significant differences between HET and KO for adrenal glands (p<0.03). There was also evidence of a difference in spleen weights between WT and KO in each case (p<0.09). Evidence of a significant difference was observed between HET and KO in the weight of the sex organs when considering length (p=0.08).
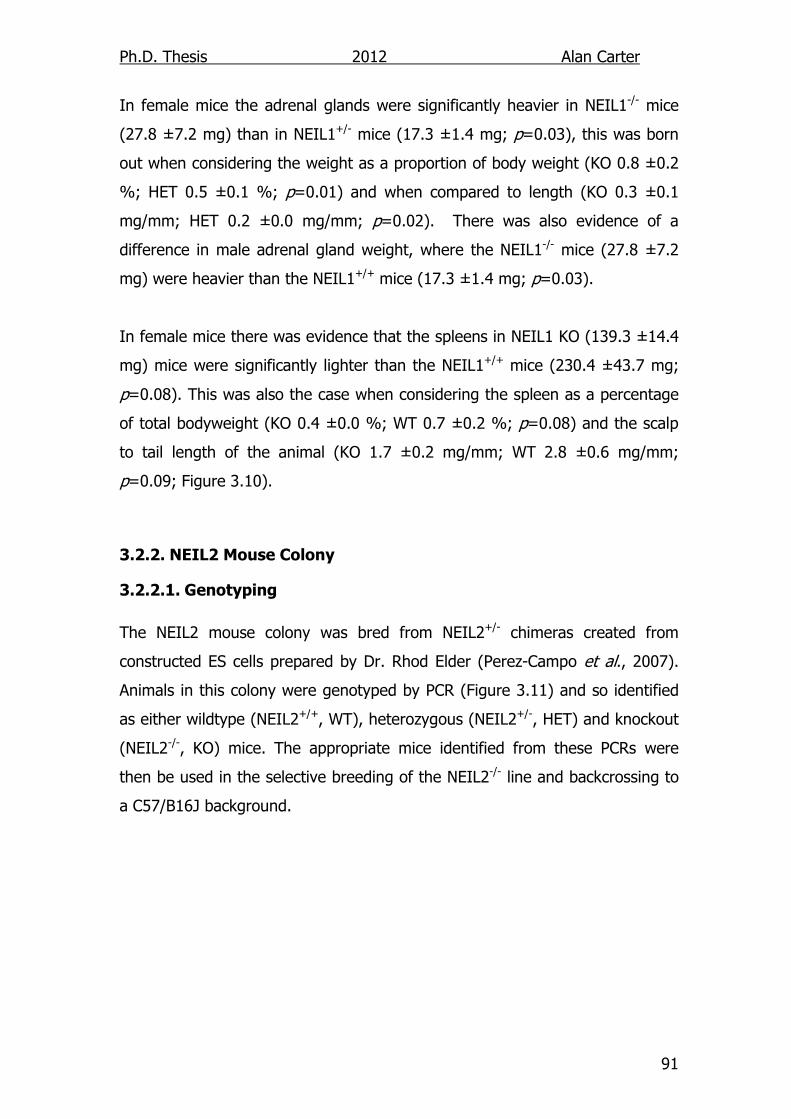
Ph.D. Thesis 2012 Alan Carter
91
In female mice the adrenal glands were significantly heavier in NEIL1-/- mice
(27.8 ±7.2 mg) than in NEIL1+/- mice (17.3 ±1.4 mg; p=0.03), this was born
out when considering the weight as a proportion of body weight (KO 0.8 ±0.2
%; HET 0.5 ±0.1 %; p=0.01) and when compared to length (KO 0.3 ±0.1
mg/mm; HET 0.2 ±0.0 mg/mm; p=0.02). There was also evidence of a
difference in male adrenal gland weight, where the NEIL1-/- mice (27.8 ±7.2
mg) were heavier than the NEIL1+/+ mice (17.3 ±1.4 mg; p=0.03).
In female mice there was evidence that the spleens in NEIL1 KO (139.3 ±14.4
mg) mice were significantly lighter than the NEIL1+/+ mice (230.4 ±43.7 mg;
p=0.08). This was also the case when considering the spleen as a percentage
of total bodyweight (KO 0.4 ±0.0 %; WT 0.7 ±0.2 %; p=0.08) and the scalp
to tail length of the animal (KO 1.7 ±0.2 mg/mm; WT 2.8 ±0.6 mg/mm;
p=0.09; Figure 3.10).
3.2.2. NEIL2 Mouse Colony
3.2.2.1. Genotyping The NEIL2 mouse colony was bred from NEIL2+/- chimeras created from
constructed ES cells prepared by Dr. Rhod Elder (Perez-Campo et al., 2007).
Animals in this colony were genotyped by PCR (Figure 3.11) and so identified
as either wildtype (NEIL2+/+, WT), heterozygous (NEIL2+/-, HET) and knockout
(NEIL2-/-, KO) mice. The appropriate mice identified from these PCRs were
then be used in the selective breeding of the NEIL2-/- line and backcrossing to
a C57/B16J background.
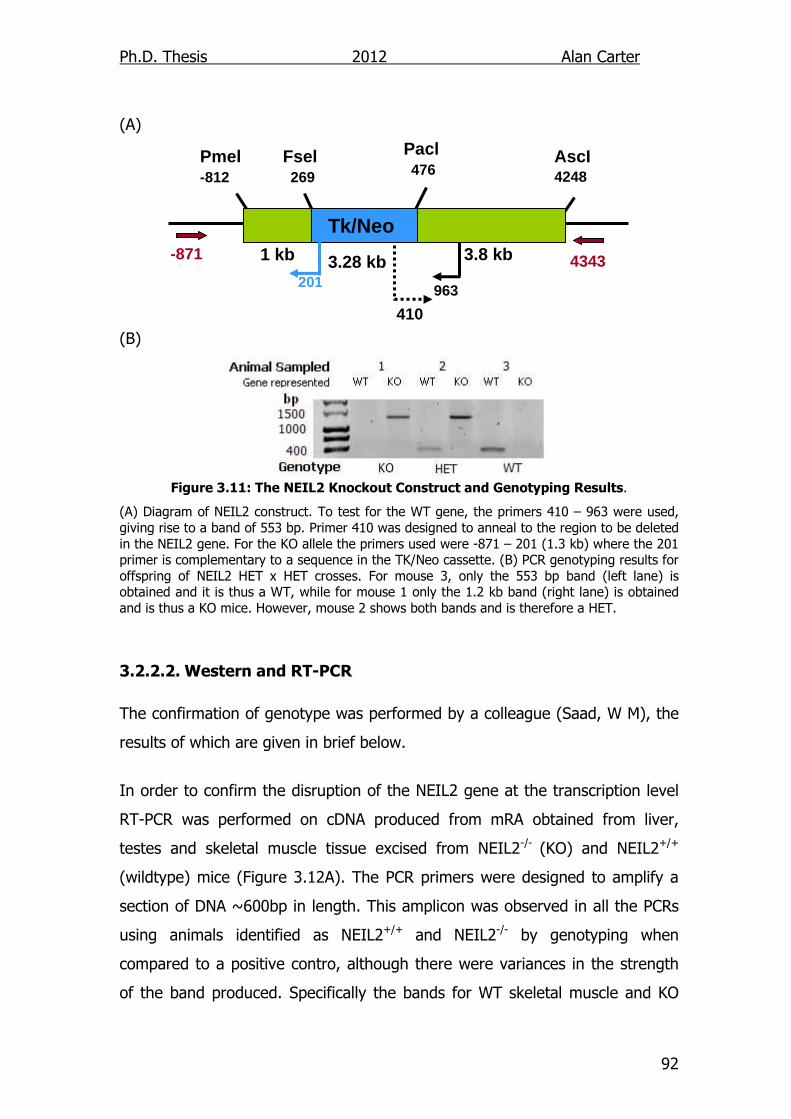
Ph.D. Thesis 2012 Alan Carter
92
(A)
(B)
Figure 3.11: The NEIL2 Knockout Construct and Genotyping Results.
(A) Diagram of NEIL2 construct. To test for the WT gene, the primers 410 – 963 were used, giving rise to a band of 553 bp. Primer 410 was designed to anneal to the region to be deleted in the NEIL2 gene. For the KO allele the primers used were -871 – 201 (1.3 kb) where the 201 primer is complementary to a sequence in the TK/Neo cassette. (B) PCR genotyping results for offspring of NEIL2 HET x HET crosses. For mouse 3, only the 553 bp band (left lane) is obtained and it is thus a WT, while for mouse 1 only the 1.2 kb band (right lane) is obtained and is thus a KO mice. However, mouse 2 shows both bands and is therefore a HET.
3.2.2.2. Western and RT-PCR The confirmation of genotype was performed by a colleague (Saad, W M), the
results of which are given in brief below.
In order to confirm the disruption of the NEIL2 gene at the transcription level
RT-PCR was performed on cDNA produced from mRA obtained from liver,
testes and skeletal muscle tissue excised from NEIL2-/- (KO) and NEIL2+/+
(wildtype) mice (Figure 3.12A). The PCR primers were designed to amplify a
section of DNA ~600bp in length. This amplicon was observed in all the PCRs
using animals identified as NEIL2+/+ and NEIL2-/- by genotyping when
compared to a positive contro, although there were variances in the strength
of the band produced. Specifically the bands for WT skeletal muscle and KO
Tk/Neo 3.8 kb 3.28 kb 1 kb
-812 476 269
963
Pmel Fsel Pacl AscI
201
4248
410
-871 4343
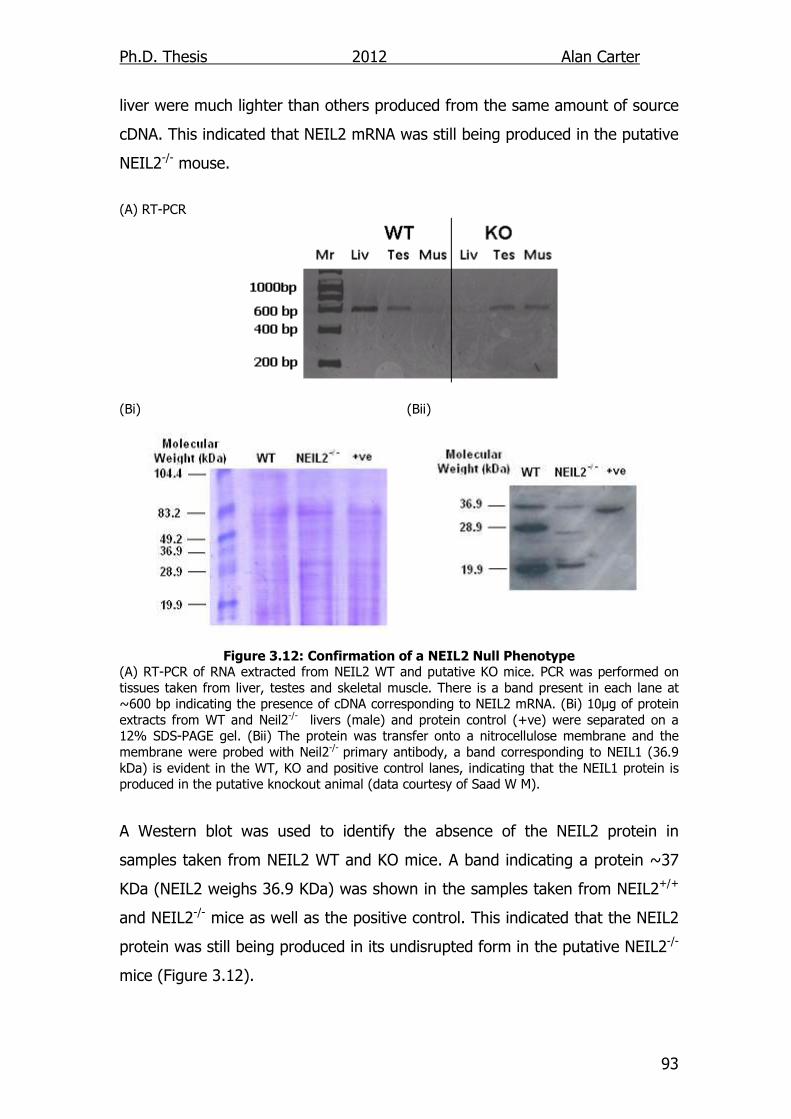
Ph.D. Thesis 2012 Alan Carter
93
liver were much lighter than others produced from the same amount of source
cDNA. This indicated that NEIL2 mRNA was still being produced in the putative
NEIL2-/- mouse.
(A) RT-PCR
(Bi) (Bii)
Figure 3.12: Confirmation of a NEIL2 Null Phenotype (A) RT-PCR of RNA extracted from NEIL2 WT and putative KO mice. PCR was performed on tissues taken from liver, testes and skeletal muscle. There is a band present in each lane at ~600 bp indicating the presence of cDNA corresponding to NEIL2 mRNA. (Bi) 10µg of protein extracts from WT and Neil2-/- livers (male) and protein control (+ve) were separated on a 12% SDS-PAGE gel. (Bii) The protein was transfer onto a nitrocellulose membrane and the membrane were probed with Neil2-/- primary antibody, a band corresponding to NEIL1 (36.9 kDa) is evident in the WT, KO and positive control lanes, indicating that the NEIL1 protein is produced in the putative knockout animal (data courtesy of Saad W M).
A Western blot was used to identify the absence of the NEIL2 protein in
samples taken from NEIL2 WT and KO mice. A band indicating a protein ~37
KDa (NEIL2 weighs 36.9 KDa) was shown in the samples taken from NEIL2+/+
and NEIL2-/- mice as well as the positive control. This indicated that the NEIL2
protein was still being produced in its undisrupted form in the putative NEIL2-/-
mice (Figure 3.12).
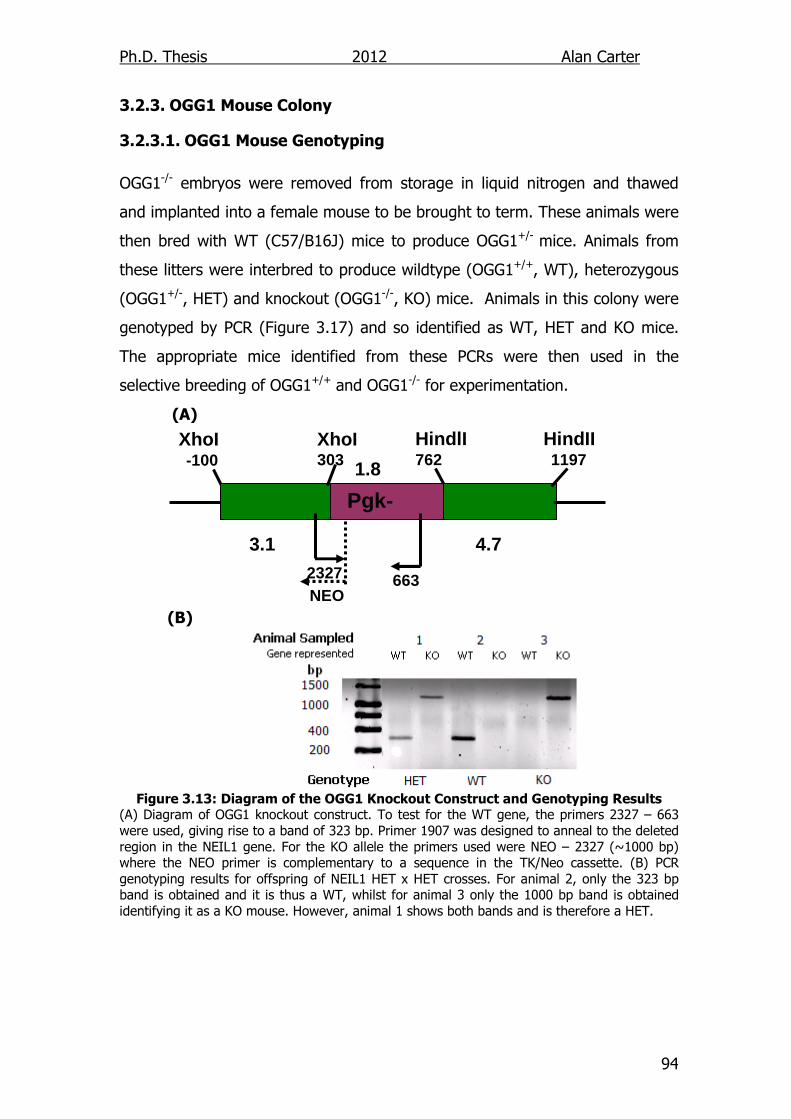
Ph.D. Thesis 2012 Alan Carter
94
3.2.3. OGG1 Mouse Colony
3.2.3.1. OGG1 Mouse Genotyping OGG1-/- embryos were removed from storage in liquid nitrogen and thawed
and implanted into a female mouse to be brought to term. These animals were
then bred with WT (C57/B16J) mice to produce OGG1+/- mice. Animals from
these litters were interbred to produce wildtype (OGG1+/+, WT), heterozygous
(OGG1+/-, HET) and knockout (OGG1-/-, KO) mice. Animals in this colony were
genotyped by PCR (Figure 3.17) and so identified as WT, HET and KO mice.
The appropriate mice identified from these PCRs were then used in the
selective breeding of OGG1+/+ and OGG1-/- for experimentation.
(A)
(B)
Figure 3.13: Diagram of the OGG1 Knockout Construct and Genotyping Results
(A) Diagram of OGG1 knockout construct. To test for the WT gene, the primers 2327 – 663 were used, giving rise to a band of 323 bp. Primer 1907 was designed to anneal to the deleted region in the NEIL1 gene. For the KO allele the primers used were NEO – 2327 (~1000 bp) where the NEO primer is complementary to a sequence in the TK/Neo cassette. (B) PCR genotyping results for offspring of NEIL1 HET x HET crosses. For animal 2, only the 323 bp band is obtained and it is thus a WT, whilst for animal 3 only the 1000 bp band is obtained identifying it as a KO mouse. However, animal 1 shows both bands and is therefore a HET.
Pgk-Neo
3.1 kb
1.8 kb
4.7 kb
-100 3033
7620
11976
HindIIl
HindlII
XhoI XhoI
NEO 6632327

Ph.D. Thesis 2012 Alan Carter
95
3.3. Discussion
In order to identify phenotypes displayed by DNA glycosylase deficient mice, a
new strain of NEIL1-/- mice has been created. PCR, RT-PCR and western blot
procedures indicate that disruption of the NEIL1 gene has proved a success.
The PCR test to identify changes in genomic mouse DNA of the mice has
proved the existence of both the WT gene and the correctly placed KO
cassette within the colony (Figure 3.1). RT-PCR has also indicated the lack of
NEIL1 mRNA production within the tested animals (Figure 3.3).
Furthermore, the western blotting indicates that the NEIL1 protein, whilst
present in NEIL1+/+ animals, is not detected in the tissues of the NEIL1-/- mice.
The band produced from samples taken from WT animals is at the expected
position on the blot to be identified as the NEIL1 protein (Figure 3.3; 43.7
kDa), but there is also a lighter band at ~28 kDa. When the NEIL1 protein was
first reported the western blot identifying it had several bands one of which
was around 25 kDa (Takao et al., 2002a).
When considering the mean weights of other C57BL/6 mice colonies in which
the mouse weights rarley exceed 35 g (males) and 30 g (females) (Arai et al.,
2006; Goodrick et al., 1990), compared to this the weights of the mice in this
colony are very high, especially those of WT males who at 12 months have a
mean weight of 47.7 g. So whilst this does not directly support the theory that
the lack of the NEIL1 protein leads to the onset of metabolic syndrome, these
animals are already very large, a factor that perhaps eclipses any differences
that would be shown from the knockout of the NEIL1 gene.
The NEIL1-/- mice reported here did not display a comparatively obese
phenotype when compared to their WT siblings, nor was the extensive
abdominal fat described by Vartanian et al., (2006) found in the NEIL1-/- mice.
Indeed, the ommentum fat content of the NEIL1-/- was significantly lighter
than that of the NEIL1+/+ mice. Previous observations of NEIL1-/- mice have
also described enlarged livers and kidneys due to fatty deposits within them
Ph.D. Thesis 2012 Alan Carter
96
(Vartanian et al., 2006). This was not observed in the newly developed
NEIL1-/- mice. Indeed there was a suggestion that the kidneys of the male
NEIL1-/- mice were lighter than those of the NEIL1+/+ mice although this was
found to be non-significant after adjustment for weight and length.
Significant differences were observed between weights of reproductive tissues
and adrenal glands. Changes in the weights of reproductive tissues are often
synonymous with changes in the output of the hormones associated with
them, (eg. testosterone in males) or a sign of greater hormone output from
other sources (eg. FSH in females; (Hewitt and Korach 2003; Jin et al., 2008)).
The increase in the size of the adrenal glands is suggestive of an increase in
adrenalin production. All of these hormones affect behaviour, and in the recent
paper by Sampath et al. (2011) small changes in behaviour were noted to the
mouse circadian rhythms. The mice seemed to be active for more of the light
dark cycle, but they did not engage in much exercise during this time,
preferring to eat.
One reason for the apparent differences in the two NEIL1-/- strains could be
the genes foreign to C57BL/6 mice flanking the NEIL1 gene. This problem
stems from the fact that the ES cells that are used to create the chimera for
the knockout are usually from a different strain of mice (Tc-1) to the
background that the KO gene will be backcrossed onto (C57BL/6). Thus, not
only the disrupted gene will be transmitted to their progenitors but any genes
that are on the same allele. When comparing the knockout animals created
with this method with wild-type animals, most of these transmitted genes will
not pose a problem, due to their independence from the knockout gene
(Wolfer et al., 2002).
However, for any genes linked to the targeted gene a “linkage disequilibrium”
will be created, because the null mutation will be flanked by two foreign
genes, and the wild-type locus flanked by two C57BL/6 genes. This could
cause an effect that would be confused for an overt phenotype. This can be
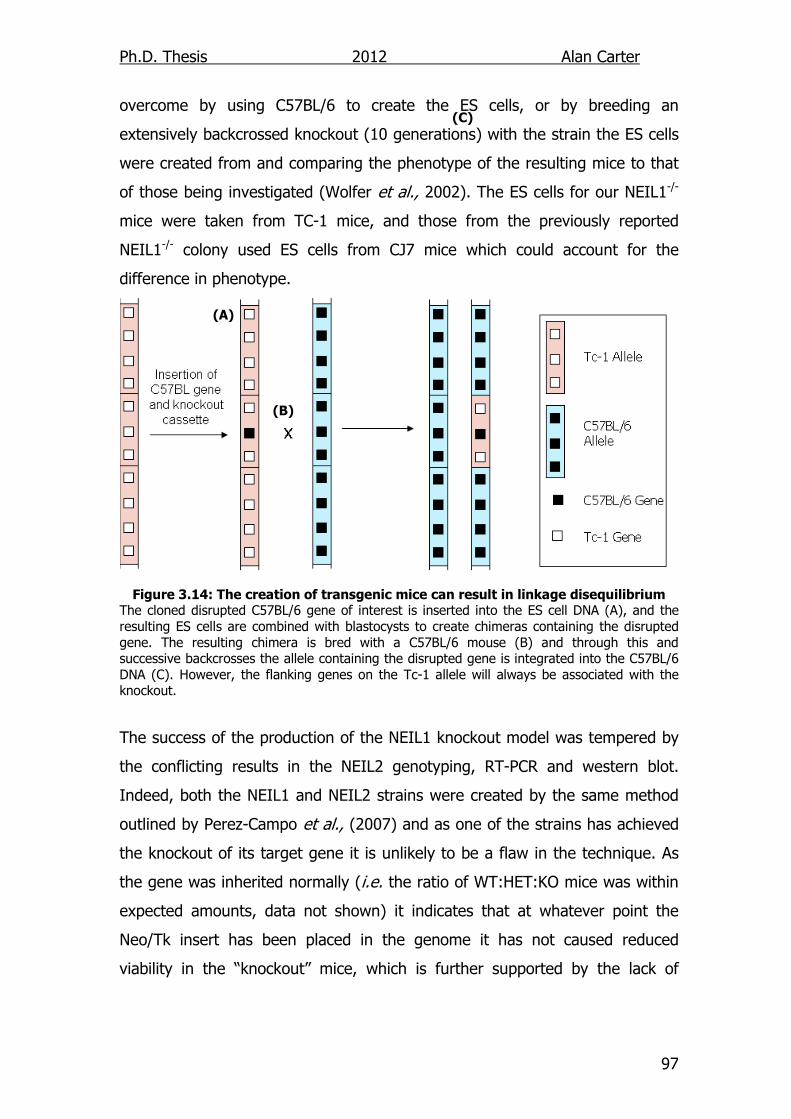
Ph.D. Thesis 2012 Alan Carter
97
overcome by using C57BL/6 to create the ES cells, or by breeding an
extensively backcrossed knockout (10 generations) with the strain the ES cells
were created from and comparing the phenotype of the resulting mice to that
of those being investigated (Wolfer et al., 2002). The ES cells for our NEIL1-/-
mice were taken from TC-1 mice, and those from the previously reported
NEIL1-/- colony used ES cells from CJ7 mice which could account for the
difference in phenotype.
Figure 3.14: The creation of transgenic mice can result in linkage disequilibrium The cloned disrupted C57BL/6 gene of interest is inserted into the ES cell DNA (A), and the resulting ES cells are combined with blastocysts to create chimeras containing the disrupted gene. The resulting chimera is bred with a C57BL/6 mouse (B) and through this and successive backcrosses the allele containing the disrupted gene is integrated into the C57BL/6 DNA (C). However, the flanking genes on the Tc-1 allele will always be associated with the knockout.
The success of the production of the NEIL1 knockout model was tempered by
the conflicting results in the NEIL2 genotyping, RT-PCR and western blot.
Indeed, both the NEIL1 and NEIL2 strains were created by the same method
outlined by Perez-Campo et al., (2007) and as one of the strains has achieved
the knockout of its target gene it is unlikely to be a flaw in the technique. As
the gene was inherited normally (i.e. the ratio of WT:HET:KO mice was within
expected amounts, data not shown) it indicates that at whatever point the
Neo/Tk insert has been placed in the genome it has not caused reduced
viability in the “knockout” mice, which is further supported by the lack of
(A)
(B)
(C)
Ph.D. Thesis 2012 Alan Carter
98
significant difference observed in the mortality of NEIL2+/+, NEIL2+/- or the
putative NEIL2-/- mice.
Several reasons for the failure of the knockout can be postulated: (i) the
Tk/Neo insert is located in the wrong position, (ii) there could be a duplicate
NEIL2 gene, (iii) conserved portions of the NEIL2 gene are being spliced from
another region of the genomic DNA. None of these explain fully why PCR
genotyping gives the expected sized bands for the primers used and why
apparently KO, HET and WT NEIL2 animals are created. In order to determine
the actual positioning of the Tk/Neo insert the technique fluorescent in situ
hybridization could be used which would at least confirm that the insert was on
the correct chromosome. A further assay that could be performed would be an
activity assay on purified “NEIL2” protein obtained from putative NEIL2-/- mice.
This would confirm that the protein identified on the western blot was a
functional NEIL2, rather than a similar sized, and shaped protein that the
antibody recognized.
The lack of a strong observable phenotype in the NEIL1 knockout animals is
hardly surprising, as in most cases the deletion of a DNA glycosylase results in
very little overt phenotypic change (Table 3.1). This is theorized to be due to
the overlapping functions of the DNA glycosylases meaning that they act as
functional backups for each other (Parsons and Elder 2003). These backups
mean that BER is available to the cell even if there are dysfunctional DNA
glycosylases, as knockouts of more downstream BER proteins which cannot be
functionally backed up, such as APE1, Pol β, DNA ligase I & III and XRCC1 are
lethal to the cell (Larsen et al., 2007). There is one exception to this trend,
TDG, which has been found to be embryonic lethal when disrupted in the
mouse genome. This is suggested to be due to TDG’s activity in maintaining
chromatin throughout cell development, and that the knockout of this gene
results in the loss of epigenetic control (Cortazar et al., 2011). In most cases it
takes a double knockout of two DNA glycosylases which excise similar lesions
to cause a major response such as that of [OGG1/MUTYH]-/- which causes the
Ph.D. Thesis 2012 Alan Carter
99
50% survival age to drop to 10.3 months, when compared to OGG1-/-,
MUTYH-/- and WT animals whose 50% survival age was never below 18 m.
Increased tumor incidence in the [OGG1/MUTYH]-/- mice from two months of
age was suggested to be due to the build up in mutations in the codon 12
region of the K-Ras oncogene (Xie et al., 2004).
This implies the question which two DNA repair genes would be best to knock
out in a mouse model. Future work could be best served by considering the
properties of NEIL1, in order to test the hypothesis that it is damage within the
mitochondria that causes the symptoms of metabolic syndrome, another DNA
glycosylase that operates in the mitochondria, such as OGG1 in which one
strain of knockout mice has also shown increased weight of KO mice (Arai et
al., 2006), could be knocked out. When a working NEIL2 model is presented it
would be good to create a [NEIL1/NEIL2]-/- to study the effects of the loss of
single strand BER within the cell.
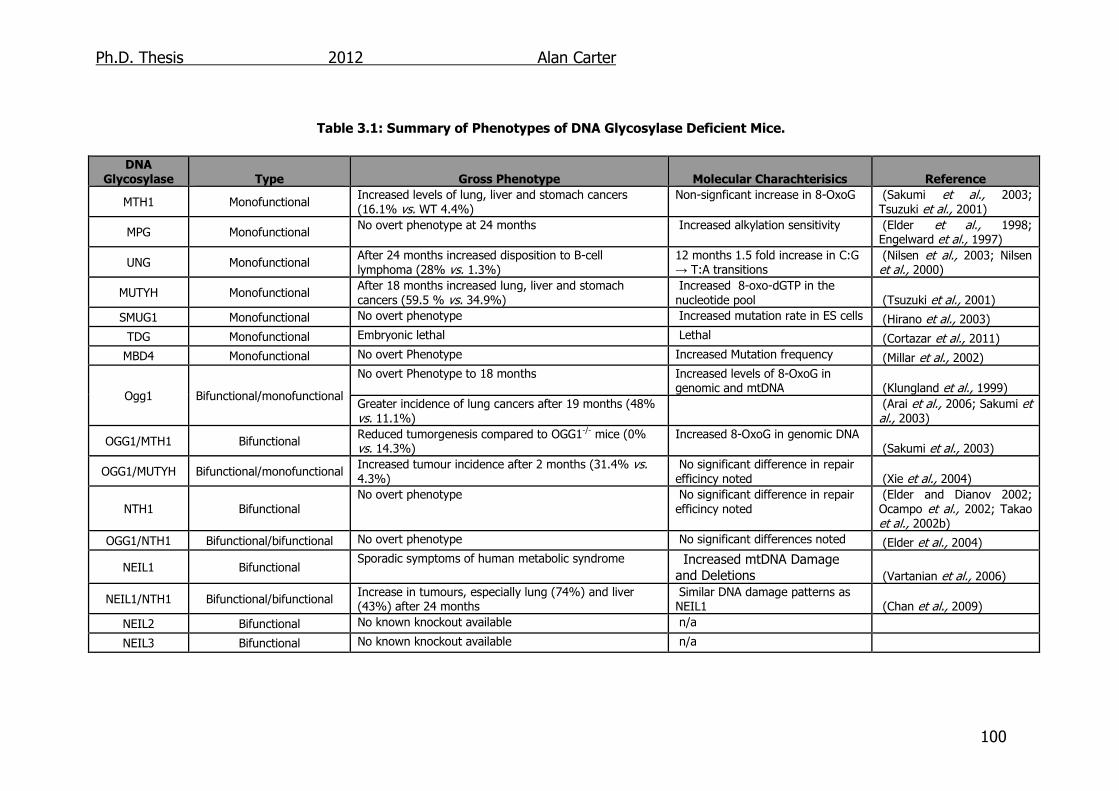
Ph.D. Thesis 2012 Alan Carter
100
Table 3.1: Summary of Phenotypes of DNA Glycosylase Deficient Mice.
DNA
Glycosylase Type Gross Phenotype Molecular Charachterisics Reference
MTH1 Monofunctional Increased levels of lung, liver and stomach cancers (16.1% vs. WT 4.4%)
Non-signficant increase in 8-OxoG (Sakumi et al., 2003; Tsuzuki et al., 2001)
MPG Monofunctional No overt phenotype at 24 months Increased alkylation sensitivity (Elder et al., 1998;
Engelward et al., 1997)
UNG Monofunctional After 24 months increased disposition to B-cell lymphoma (28% vs. 1.3%)
12 months 1.5 fold increase in C:G → T:A transitions
(Nilsen et al., 2003; Nilsen et al., 2000)
MUTYH Monofunctional After 18 months increased lung, liver and stomach cancers (59.5 % vs. 34.9%)
Increased 8-oxo-dGTP in the nucleotide pool (Tsuzuki et al., 2001)
SMUG1 Monofunctional No overt phenotype Increased mutation rate in ES cells (Hirano et al., 2003)
TDG Monofunctional Embryonic lethal Lethal (Cortazar et al., 2011)
MBD4 Monofunctional No overt Phenotype Increased Mutation frequency (Millar et al., 2002)
Ogg1 Bifunctional/monofunctional
No overt Phenotype to 18 months Increased levels of 8-OxoG in genomic and mtDNA (Klungland et al., 1999)
Greater incidence of lung cancers after 19 months (48% vs. 11.1%)
(Arai et al., 2006; Sakumi et al., 2003)
OGG1/MTH1 Bifunctional Reduced tumorgenesis compared to OGG1-/- mice (0% vs. 14.3%)
Increased 8-OxoG in genomic DNA (Sakumi et al., 2003)
OGG1/MUTYH Bifunctional/monofunctional Increased tumour incidence after 2 months (31.4% vs. 4.3%)
No significant difference in repair efficincy noted (Xie et al., 2004)
NTH1 Bifunctional No overt phenotype No significant difference in repair
efficincy noted (Elder and Dianov 2002; Ocampo et al., 2002; Takao et al., 2002b)
OGG1/NTH1 Bifunctional/bifunctional No overt phenotype No significant differences noted (Elder et al., 2004)
NEIL1 Bifunctional Sporadic symptoms of human metabolic syndrome Increased mtDNA Damage
and Deletions (Vartanian et al., 2006)
NEIL1/NTH1 Bifunctional/bifunctional Increase in tumours, especially lung (74%) and liver (43%) after 24 months
Similar DNA damage patterns as NEIL1 (Chan et al., 2009)
NEIL2 Bifunctional No known knockout available n/a
NEIL3 Bifunctional No known knockout available n/a
Ph.D. Thesis 2012 Alan Carter
101
4. Cytokine Output of DNA Glycosylase Disrupted Cells
4.1. Introduction The creation of a new strain of NEIL1-/- mice has been described and no overt
phenotype was found in unchallenged animals (Chapter 3). Other mouse
knockout models of the bifunctional DNA glycosylases OGG1 and NTH1 have
already been created and no observable overt phenotype was also observed
in these animals (Elder and Dianov 2002; Klungland et al., 1999). Neither was
there any overt phenotype described in the double knockout of
[OGG1/NTH1] (Parsons and Elder 2003).
Several proteins linked to BER have been identified as having links with the
inflammatory response including PARP-1, APE-1, OGG1 and MUTYH. PARP-1
and APE-1 knockouts reduce the inflammatory response via an attenuation of
the redox sensitive transcription factor NF-κβ transcription factor (Ando et al.,
2008; Virag and Szabo 2002). There is also a reduction in inflammation
noted in the OGG1-/- models of LPS induced inflammation and Helicobacter
Pylori induced gut inflammation (Mabley et al., 2005b; Touati et al., 2006).
Previously MEF’s have been used in the study of the DNA repair/damage
response of KO mice, although no in vitro studies have been carried out to
identify any alterations in MEF response to LPS in any DNA glycosylase
deficient models. (Elder and Dianov 2002; Le Page F. et al., 2000).
Additionally fibroblasts are a good model when studying the inflammatory
response, as they participate in the inflammatory and wound healing
processes by producing various cytokines and immune mediators in response
to LPS and other antigens (Ivor, 1994). The inflammatory response to LPS is
initiated through the TLR4 receptor, the cellular response includes the release
of various signalling molecules including IL-1, IL-6, IL-8, IL-10, MCP-1, MIP-
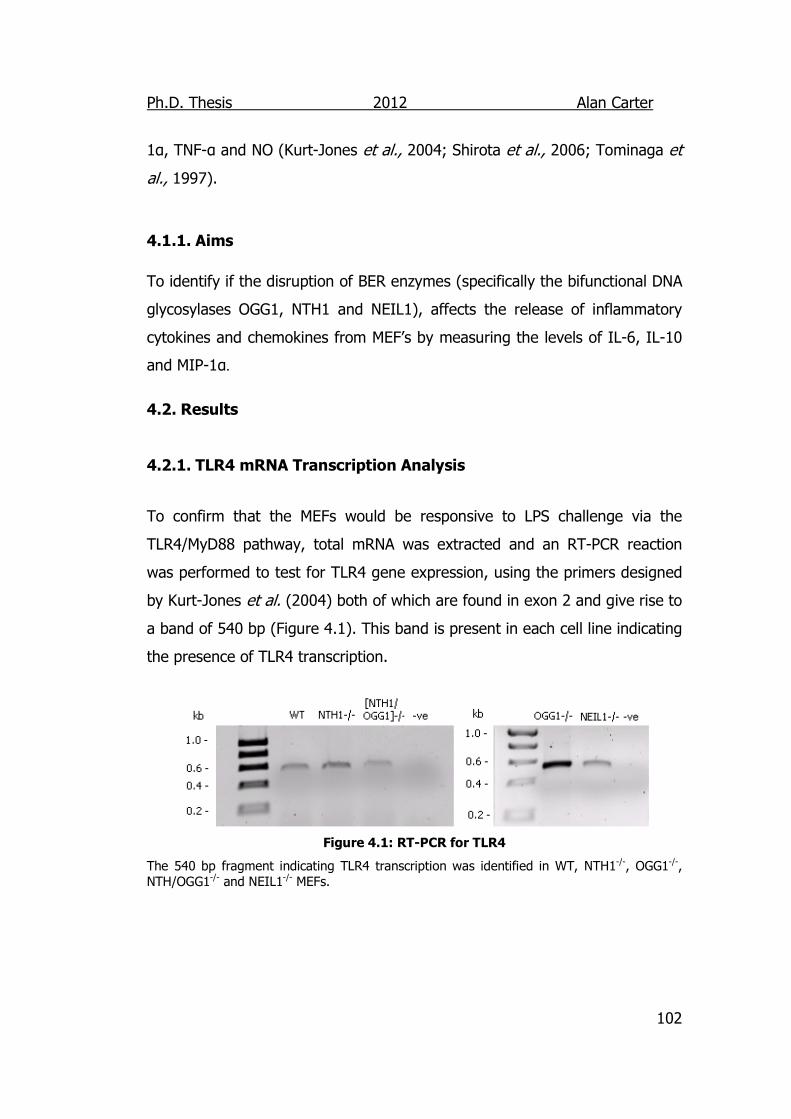
Ph.D. Thesis 2012 Alan Carter
102
1α, TNF-α and NO (Kurt-Jones et al., 2004; Shirota et al., 2006; Tominaga et
al., 1997).
4.1.1. Aims To identify if the disruption of BER enzymes (specifically the bifunctional DNA
glycosylases OGG1, NTH1 and NEIL1), affects the release of inflammatory
cytokines and chemokines from MEF’s by measuring the levels of IL-6, IL-10
and MIP-1α.
4.2. Results
4.2.1. TLR4 mRNA Transcription Analysis
To confirm that the MEFs would be responsive to LPS challenge via the
TLR4/MyD88 pathway, total mRNA was extracted and an RT-PCR reaction
was performed to test for TLR4 gene expression, using the primers designed
by Kurt-Jones et al. (2004) both of which are found in exon 2 and give rise to
a band of 540 bp (Figure 4.1). This band is present in each cell line indicating
the presence of TLR4 transcription.
Figure 4.1: RT-PCR for TLR4
The 540 bp fragment indicating TLR4 transcription was identified in WT, NTH1-/-, OGG1-/-, NTH/OGG1-/- and NEIL1-/- MEFs.
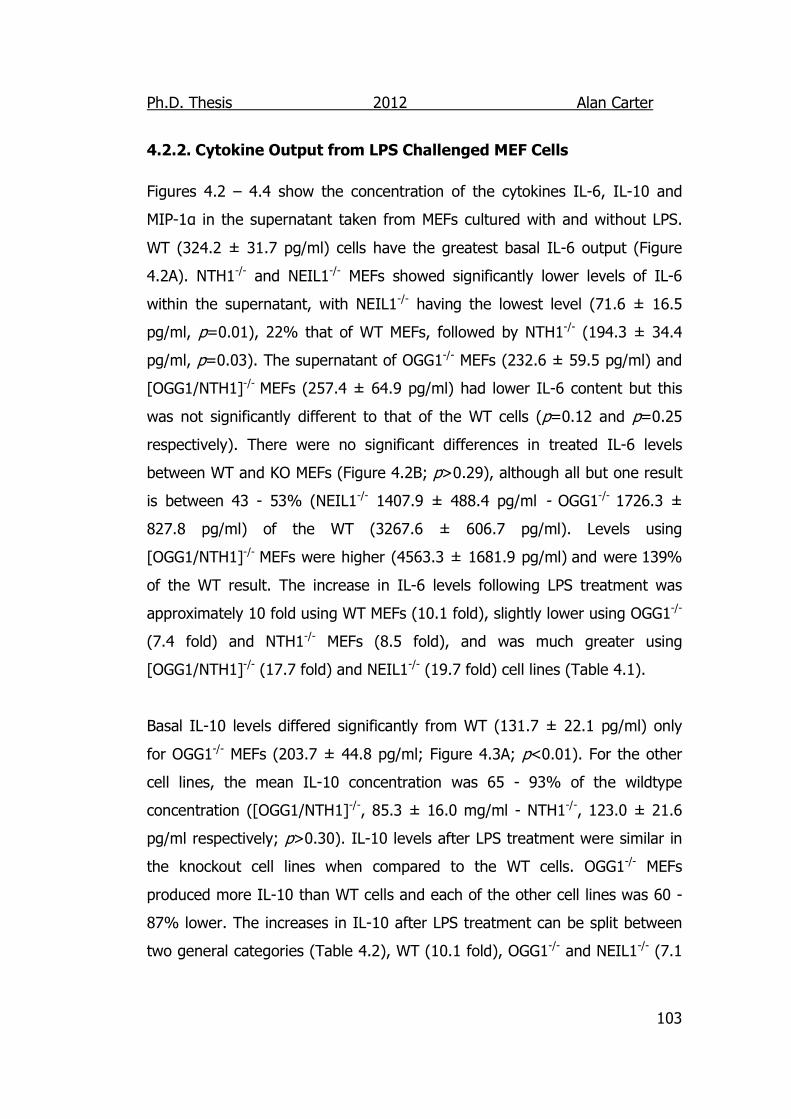
Ph.D. Thesis 2012 Alan Carter
103
4.2.2. Cytokine Output from LPS Challenged MEF Cells Figures 4.2 – 4.4 show the concentration of the cytokines IL-6, IL-10 and
MIP-1α in the supernatant taken from MEFs cultured with and without LPS.
WT (324.2 ± 31.7 pg/ml) cells have the greatest basal IL-6 output (Figure
4.2A). NTH1-/- and NEIL1-/- MEFs showed significantly lower levels of IL-6
within the supernatant, with NEIL1-/- having the lowest level (71.6 ± 16.5
pg/ml, p=0.01), 22% that of WT MEFs, followed by NTH1-/- (194.3 ± 34.4
pg/ml, p=0.03). The supernatant of OGG1-/- MEFs (232.6 ± 59.5 pg/ml) and
[OGG1/NTH1]-/- MEFs (257.4 ± 64.9 pg/ml) had lower IL-6 content but this
was not significantly different to that of the WT cells (p=0.12 and p=0.25
respectively). There were no significant differences in treated IL-6 levels
between WT and KO MEFs (Figure 4.2B; p>0.29), although all but one result
is between 43 - 53% (NEIL1-/- 1407.9 ± 488.4 pg/ml - OGG1-/- 1726.3 ±
827.8 pg/ml) of the WT (3267.6 ± 606.7 pg/ml). Levels using
[OGG1/NTH1]-/- MEFs were higher (4563.3 ± 1681.9 pg/ml) and were 139%
of the WT result. The increase in IL-6 levels following LPS treatment was
approximately 10 fold using WT MEFs (10.1 fold), slightly lower using OGG1-/-
(7.4 fold) and NTH1-/- MEFs (8.5 fold), and was much greater using
[OGG1/NTH1]-/- (17.7 fold) and NEIL1-/- (19.7 fold) cell lines (Table 4.1).
Basal IL-10 levels differed significantly from WT (131.7 ± 22.1 pg/ml) only
for OGG1-/- MEFs (203.7 ± 44.8 pg/ml; Figure 4.3A; p<0.01). For the other
cell lines, the mean IL-10 concentration was 65 - 93% of the wildtype
concentration ([OGG1/NTH1]-/-, 85.3 ± 16.0 mg/ml - NTH1-/-, 123.0 ± 21.6
pg/ml respectively; p>0.30). IL-10 levels after LPS treatment were similar in
the knockout cell lines when compared to the WT cells. OGG1-/- MEFs
produced more IL-10 than WT cells and each of the other cell lines was 60 -
87% lower. The increases in IL-10 after LPS treatment can be split between
two general categories (Table 4.2), WT (10.1 fold), OGG1-/- and NEIL1-/- (7.1
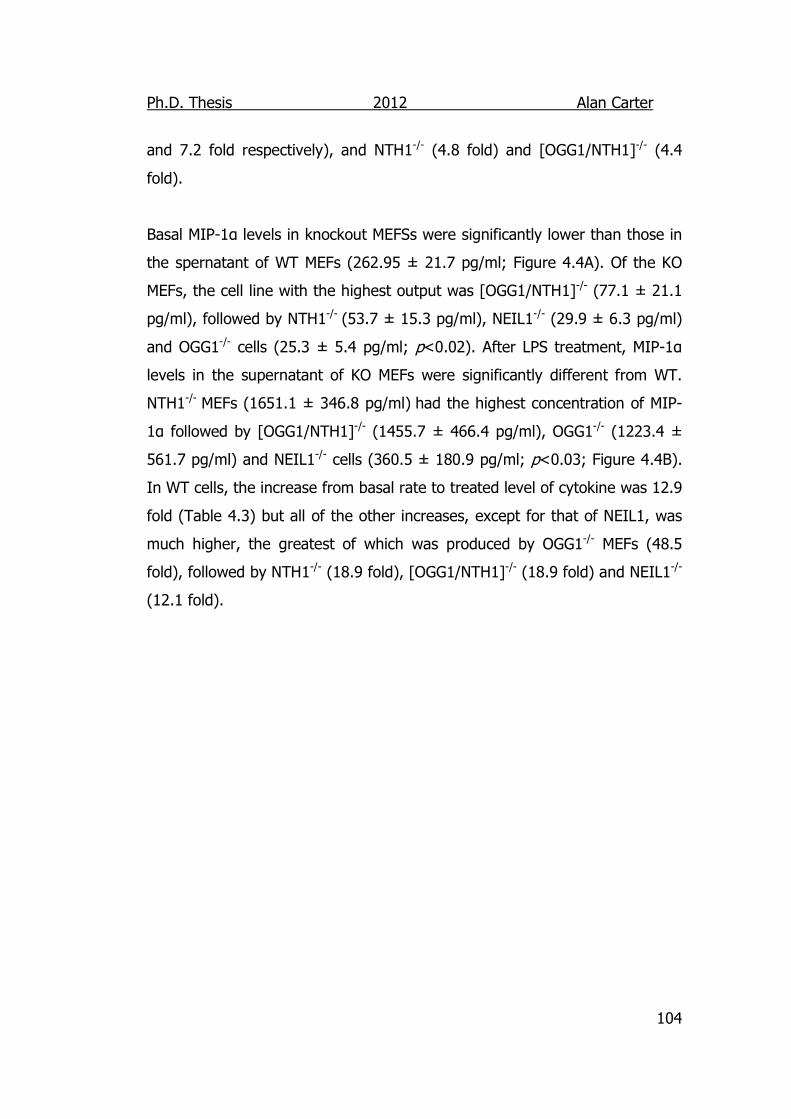
Ph.D. Thesis 2012 Alan Carter
104
and 7.2 fold respectively), and NTH1-/- (4.8 fold) and [OGG1/NTH1]-/- (4.4
fold).
Basal MIP-1α levels in knockout MEFSs were significantly lower than those in
the spernatant of WT MEFs (262.95 ± 21.7 pg/ml; Figure 4.4A). Of the KO
MEFs, the cell line with the highest output was [OGG1/NTH1]-/- (77.1 ± 21.1
pg/ml), followed by NTH1-/- (53.7 ± 15.3 pg/ml), NEIL1-/- (29.9 ± 6.3 pg/ml)
and OGG1-/- cells (25.3 ± 5.4 pg/ml; p<0.02). After LPS treatment, MIP-1α
levels in the supernatant of KO MEFs were significantly different from WT.
NTH1-/- MEFs (1651.1 ± 346.8 pg/ml) had the highest concentration of MIP-
1α followed by [OGG1/NTH1]-/- (1455.7 ± 466.4 pg/ml), OGG1-/- (1223.4 ±
561.7 pg/ml) and NEIL1-/- cells (360.5 ± 180.9 pg/ml; p<0.03; Figure 4.4B).
In WT cells, the increase from basal rate to treated level of cytokine was 12.9
fold (Table 4.3) but all of the other increases, except for that of NEIL1, was
much higher, the greatest of which was produced by OGG1-/- MEFs (48.5
fold), followed by NTH1-/- (18.9 fold), [OGG1/NTH1]-/- (18.9 fold) and NEIL1-/-
(12.1 fold).
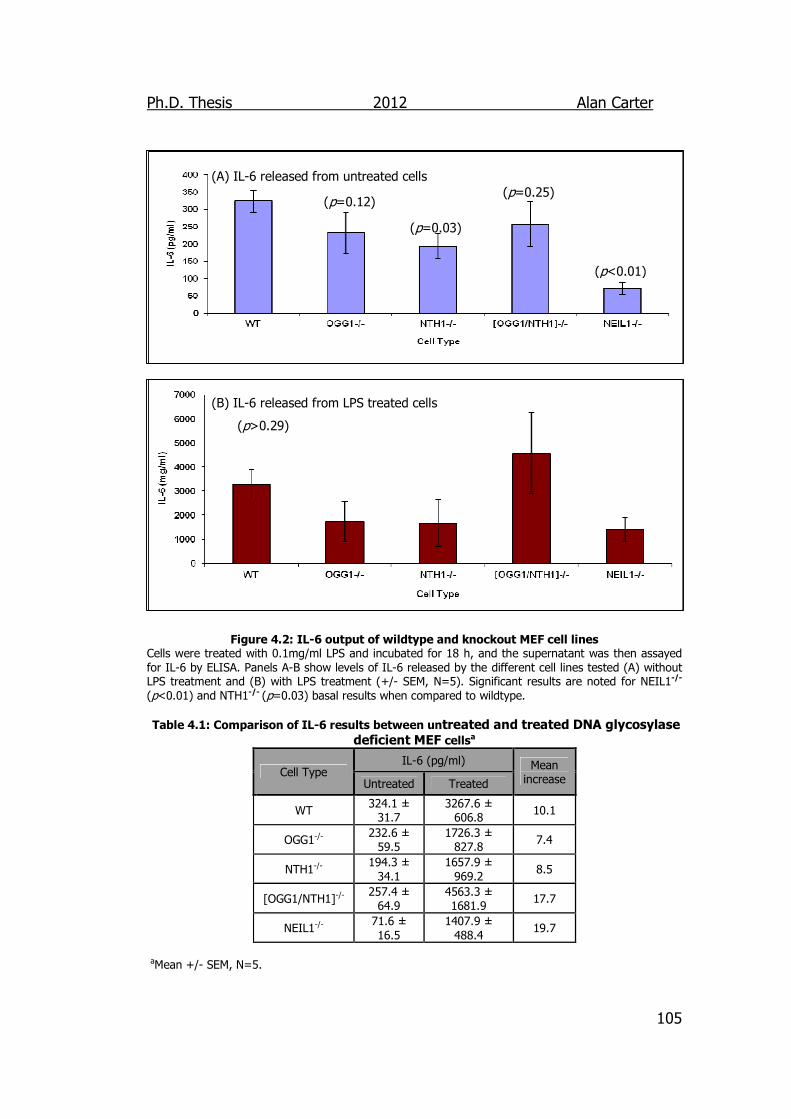
Ph.D. Thesis 2012 Alan Carter
105
(A) IL-6 released from untreated cells
(B) IL-6 released from LPS treated cells
Figure 4.2: IL-6 output of wildtype and knockout MEF cell lines Cells were treated with 0.1mg/ml LPS and incubated for 18 h, and the supernatant was then assayed for IL-6 by ELISA. Panels A-B show levels of IL-6 released by the different cell lines tested (A) without LPS treatment and (B) with LPS treatment (+/- SEM, N=5). Significant results are noted for NEIL1-/- (p<0.01) and NTH1-/- (p=0.03) basal results when compared to wildtype.
Table 4.1: Comparison of IL-6 results between untreated and treated DNA glycosylase deficient MEF cellsa
Cell Type IL-6 (pg/ml) Mean
increase Untreated Treated
WT 324.1 ± 31.7
3267.6 ± 606.8
10.1
OGG1-/- 232.6 ± 59.5
1726.3 ± 827.8
7.4
NTH1-/- 194.3 ± 34.1
1657.9 ± 969.2
8.5
[OGG1/NTH1]-/- 257.4 ± 64.9
4563.3 ± 1681.9
17.7
NEIL1-/- 71.6 ± 16.5
1407.9 ± 488.4
19.7
aMean +/- SEM, N=5.
(p>0.29)
(p<0.01)
(p=0.03)
(p=0.12) (p=0.25)
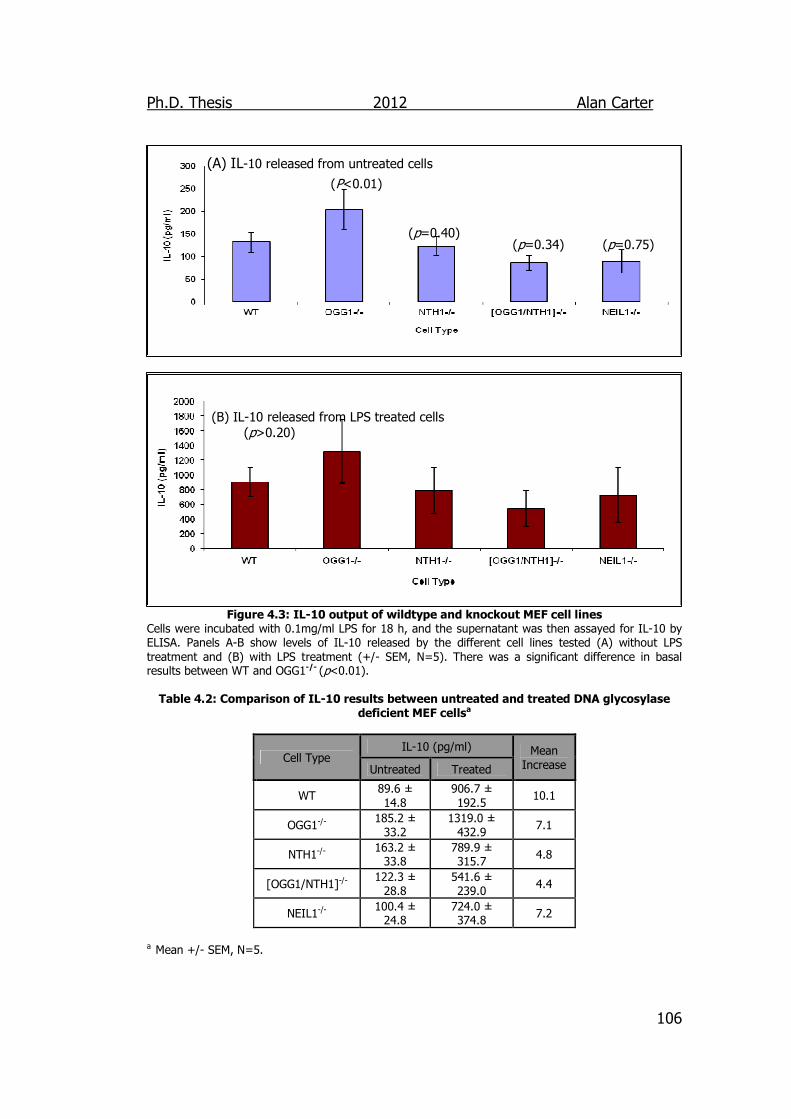
Ph.D. Thesis 2012 Alan Carter
106
(A) IL-10 released from untreated cells
(B) IL-10 released from LPS treated cells (p>0.20)
Figure 4.3: IL-10 output of wildtype and knockout MEF cell lines Cells were incubated with 0.1mg/ml LPS for 18 h, and the supernatant was then assayed for IL-10 by ELISA. Panels A-B show levels of IL-10 released by the different cell lines tested (A) without LPS treatment and (B) with LPS treatment (+/- SEM, N=5). There was a significant difference in basal results between WT and OGG1-/- (p<0.01). Table 4.2: Comparison of IL-10 results between untreated and treated DNA glycosylase
deficient MEF cellsa
Cell Type IL-10 (pg/ml) Mean
Increase Untreated Treated
WT 89.6 ± 14.8
906.7 ± 192.5
10.1
OGG1-/- 185.2 ± 33.2
1319.0 ± 432.9
7.1
NTH1-/- 163.2 ± 33.8
789.9 ± 315.7
4.8
[OGG1/NTH1]-/- 122.3 ± 28.8
541.6 ± 239.0
4.4
NEIL1-/- 100.4 ± 24.8
724.0 ± 374.8
7.2
a Mean +/- SEM, N=5.
(p=0.40) (p=0.75) (p=0.34)
(P<0.01)
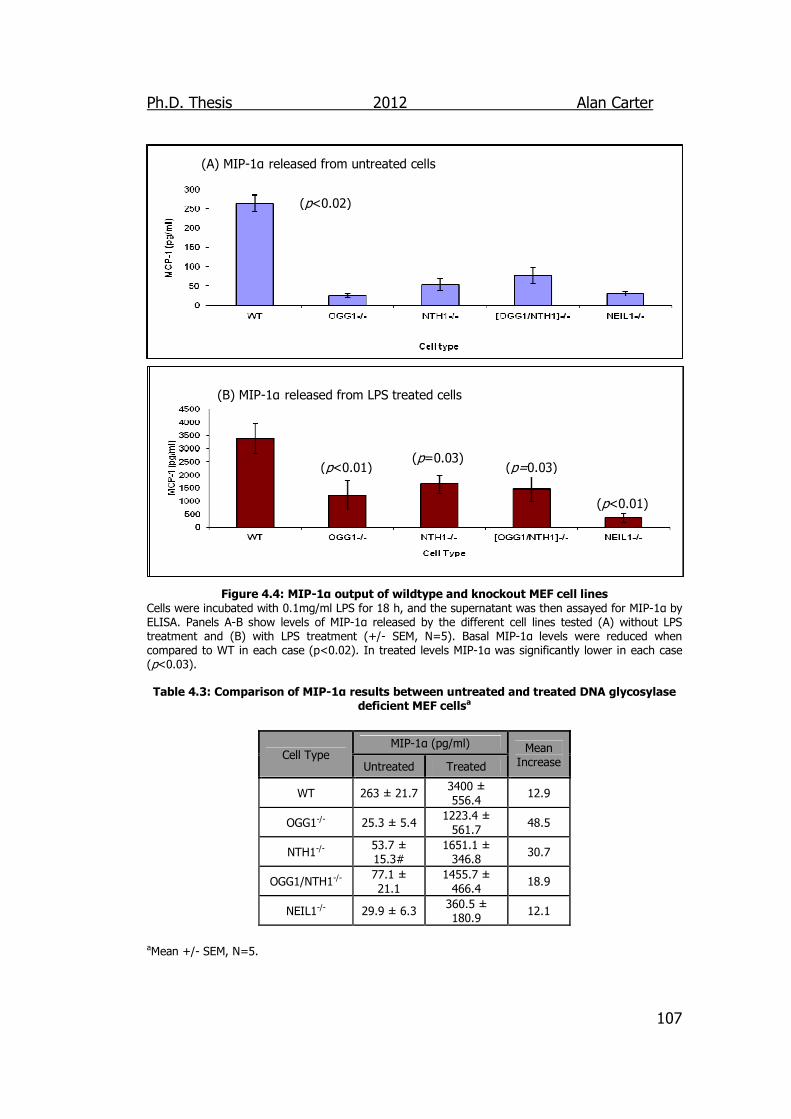
Ph.D. Thesis 2012 Alan Carter
107
(A) MIP-1α released from untreated cells
(B) MIP-1α released from LPS treated cells
Figure 4.4: MIP-1α output of wildtype and knockout MEF cell lines
Cells were incubated with 0.1mg/ml LPS for 18 h, and the supernatant was then assayed for MIP-1α by ELISA. Panels A-B show levels of MIP-1α released by the different cell lines tested (A) without LPS treatment and (B) with LPS treatment (+/- SEM, N=5). Basal MIP-1α levels were reduced when compared to WT in each case (p<0.02). In treated levels MIP-1α was significantly lower in each case (p<0.03). Table 4.3: Comparison of MIP-1α results between untreated and treated DNA glycosylase
deficient MEF cellsa
Cell Type MIP-1α (pg/ml) Mean
Increase Untreated Treated
WT 263 ± 21.7 3400 ± 556.4
12.9
OGG1-/- 25.3 ± 5.4 1223.4 ± 561.7
48.5
NTH1-/- 53.7 ± 15.3#
1651.1 ± 346.8
30.7
OGG1/NTH1-/- 77.1 ± 21.1
1455.7 ± 466.4
18.9
NEIL1-/- 29.9 ± 6.3 360.5 ± 180.9
12.1
aMean +/- SEM, N=5.
(p=0.03)
(p=0.03)
(p<0.01)
(p<0.01)
(p<0.02)
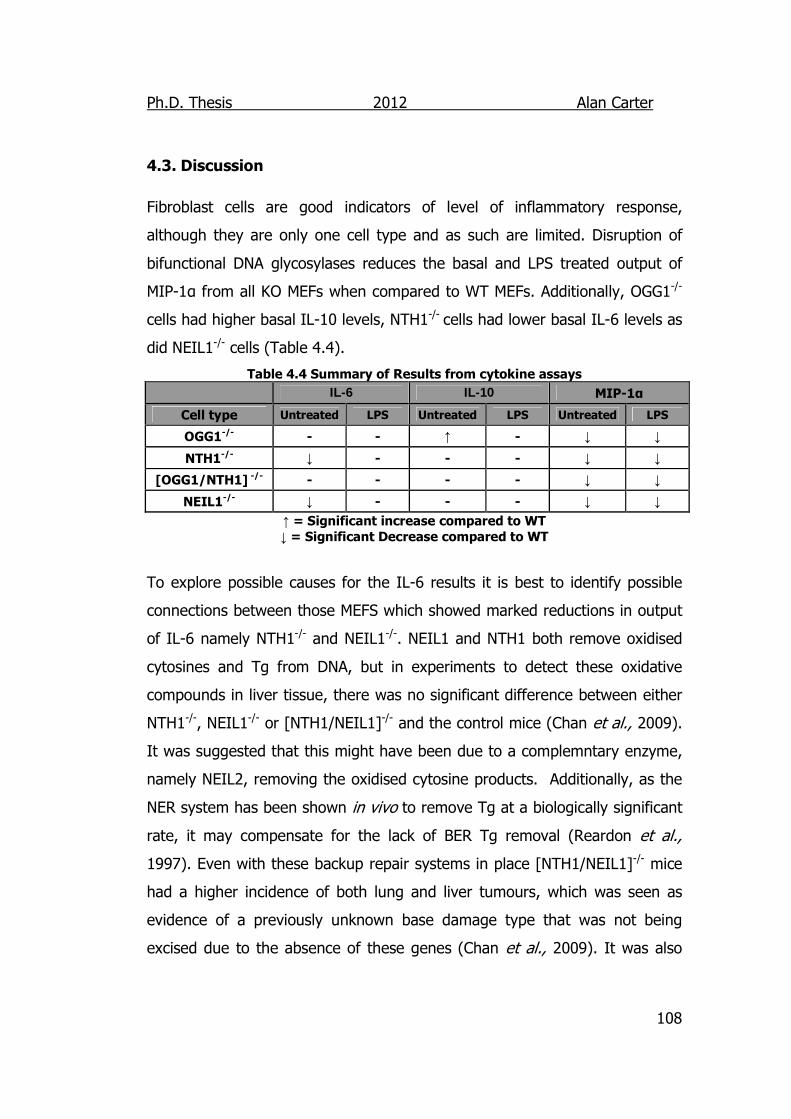
Ph.D. Thesis 2012 Alan Carter
108
4.3. Discussion Fibroblast cells are good indicators of level of inflammatory response,
although they are only one cell type and as such are limited. Disruption of
bifunctional DNA glycosylases reduces the basal and LPS treated output of
MIP-1α from all KO MEFs when compared to WT MEFs. Additionally, OGG1-/-
cells had higher basal IL-10 levels, NTH1-/- cells had lower basal IL-6 levels as
did NEIL1-/- cells (Table 4.4).
Table 4.4 Summary of Results from cytokine assays
IL-6 IL-10 MIP-1α
Cell type Untreated LPS Untreated LPS Untreated LPS
OGG1-/- - - ↑ - ↓ ↓
NTH1-/- ↓ - - - ↓ ↓
[OGG1/NTH1] -/- - - - - ↓ ↓
NEIL1-/- ↓ - - - ↓ ↓
↑ = Significant increase compared to WT ↓ = Significant Decrease compared to WT
To explore possible causes for the IL-6 results it is best to identify possible
connections between those MEFS which showed marked reductions in output
of IL-6 namely NTH1-/- and NEIL1-/-. NEIL1 and NTH1 both remove oxidised
cytosines and Tg from DNA, but in experiments to detect these oxidative
compounds in liver tissue, there was no significant difference between either
NTH1-/-, NEIL1-/- or [NTH1/NEIL1]-/- and the control mice (Chan et al., 2009).
It was suggested that this might have been due to a complemntary enzyme,
namely NEIL2, removing the oxidised cytosine products. Additionally, as the
NER system has been shown in vivo to remove Tg at a biologically significant
rate, it may compensate for the lack of BER Tg removal (Reardon et al.,
1997). Even with these backup repair systems in place [NTH1/NEIL1]-/- mice
had a higher incidence of both lung and liver tumours, which was seen as
evidence of a previously unknown base damage type that was not being
excised due to the absence of these genes (Chan et al., 2009). It was also
Ph.D. Thesis 2012 Alan Carter
109
surmised that this unidentified damage type would be highly damaging as it
caused the initiation of cancers in the normally resistant liver tissues (Chan et
al., 2009). If there is such an oxidised base it may be that its reduced
excision from the DNA causes a reduction in the basal release of the
proinflamatory cytokine IL-6. Both NTH1 and NEIL1 are capable of β-
elimination in the BER process, although NEIL1 is also thought to be capable
of APE1 independent β,δ-elimination (Elder and Dianov 2002; Takao et al.,
2002b), but there are no protein intermediates that would be specific to
these two proteins in the BER system to account for why only cells from
these strains produced a reduced basal IL-6 level.
PCNA is a protein which binds to both NEIL1, increasing NEIL1 activity, and
NTH1, the activity of which remains unchanged (Dou et al., 2008; Oyama et
al., 2004). This protein links both NEIL1 and NTH1 to the S-phase as PCNA
plays a role in DNA replication at this point (Kisielewska et al., 2005).
Additionally, due to the positive correlation between PCNA concentration and
severity of inflammation, PCNA has been used as a marker for inflammation
in inflammatory bowel disease and several types of cancer including liver
(Ding et al., 2005; Harrison et al., 1993). As basal IL-6 is also linked to
embryonic development and organ regeneration (Chan et al., 2009; Lee,
1992), this could indicate that a disruption in the NTH1 and NEIL1 genes may
have a deleterious effect at this stage, although our own and previous work
with NTH1 and NEIL1 mice does not suggest one (Chapter 3) (Chan et al.,
2009; Elder and Dianov 2002; Ocampo et al., 2002; Takao et al., 2002a;
Vartanian et al., 2006).
When considering the output of IL-6 it is intersting that the double knockout
of [OGG1/NTH1]-/- showed a greater fold increase (17.5) in output than both
OGG1-/- (8.5) and NTH1-/- (7.4) cells (Table 4.1). It would be logical to
conclude that as the OGG1-/- and NTH1-/- cells both displayed reductions in
Ph.D. Thesis 2012 Alan Carter
110
IL-6 output compared to WT cells, that the double knockout of these proteins
would show a similar, if not addative effect. However there is a precedent for
double knockouts of DNA glycosylases leading to unexpected results. A strain
of OGG1-/- mice was reported to exhibit increased carcinogenesis after 19
months; the double [OGG1/MTH1] knockout was expected to increase the
mouse susceptibility to cancer. However, whilst the double knockout did
increase the occurrence of oxidised base lesions significantly no cancers
found in the animals (Sakumi et al., 2003). The reasoning for this unexpected
result was suspected to be either (i) a build up of oxidised purines
suppressing tumourgenesis by interfering with oncogenic processes or that
(ii) a tumour suppressor gene was transferred from the ES cells on the same
allele as the disrupted MTH1 gene, and was not removed through
backcrossing ((Sakumi et al., 2003); See comments on linkage disequilibrium,
section 3.5)).
As both single knockout cell types used in this study showed a decreased IL-6
response it would suggest that the unexpected result may be due to
increased oxidised bases in the DNA. It has already been reported that an
increase in oxidised lipids in an area can stimulate an immune response of
increased IL-8 and MIP-1α (Berliner and Watson 2005). However, if a similar
effect was in effect here it would most probably also result in a significant
increase in MIP-1α output which is not shown here. It would still be
interesting however, to identify if there was a change in immune response
from cells with greater levels of DNA base oxidation.
Another potential reason for this unexpected result may be is due to the
difference in passage number between the [OGG1/NTH1]-/- stock that were
thawed from stocks of immortalised cells and the WT, OGG1-/- and NEIL1-/-
MEFs which were all created from primary cells; and the NTH1-/- which were
thawed from stocks at passage 10. The immortalised cells may have
Ph.D. Thesis 2012 Alan Carter
111
spontaneously mutated to increase IL-6 production, especially as they are
from a model that is already prone to mutation due to the disruption of BER
processes.
The increased output of basal IL-10 from the OGG1-/- mice is interesting as
IL-10 is most often seen as an anti-inflammatory cytokine, it is a sign of a
concerted anti-inflammatory response from any of the cells rather than a
blanket effect reduction seen in other cell lines such as the treated NTH1-/-
cells.
The reduction in MIP-1α outputs of both basal and treated DNA glycosylase
knockout cells was reduced significantly in all cases. A reason for the
seemingly reduced levels of MIP-1α could be that the WT cells that the DNA
glycosylase knockout cells are compared to are producing an abnormally
large amount of MIP-1α. However, other work with LPS as a ligand has
shown similar levels of MIP-1α being produced from WT MEF’s (Kurt-Jones et
al., 2004). A reduction in MIP-1α would indicate that less neutrophils would
be recruited to the area of inflammation. This would cause a net reduction in
the amount of ROS accumulated in the region and thus less MPO, MDA and
more GSH to be observed indicating, less DNA damage occurring.
The IL-6 released from OGG1-/-, NTH1-/- and NEIL1-/- cells after stimulation
also seemed less than that of WT cells, although not significantly. This could
be explained by a suppression of NF-κβ, but, this would result in a global
suppression of cytokine production (Donadelli et al., 2000). The rise in IL-10
output in OGG1-/- cells would suggest a controlled change in inflammatory
response.
NEIL1-/- cells had the lowest output of MIP-1α both at basal and LPS treated
levels, indicating that the neutrophil response and thus ROS levels in the
Ph.D. Thesis 2012 Alan Carter
112
inflammatory response would be lower than in other strains of animals.
Whilst the effectiveness of MEF’s as a model of immune reactions has already
been discussed (section 4.1), the fact remains that they are colonies of a
single cell type and that as such only the accumulation of the measured
cytokines can be known, there are no mechanisms in place for the dispersal
and clearing of unwanted cytokines. In vivo experiments will be able to give
more detail, on the cytokine response in the body at specific time points and
give more details on how this response relates to neutrophil infiltration and
oxidative damage.
Ph.D. Thesis 2012 Alan Carter
113
5. Effects of NEIL1 Gene Knockout on Endotoxin Induced Inflammation
5.1. Introduction
The first protein linking BER to the inflammatory response was PARP-1 in a
model of septic shock. Septic shock was induced via. caecal ligation and
puncture, which resulted in the extrusion of gut contents into the peritoneal
cavity inducing a multi-bacterial response (Soriano et al., 2002; Virag and
Szabo 2002). In PARP1-/- mice there was a reduction in the plasma
concentration of TNF-α, IL-6 and IL-10 cytokines when compared to that of
PARP-1+/+ mice. There was also a reduction in MPO activity and MDA levels in
PARP-1-/- mice indicating that there was a protective effect against the
deleterious effects of inflammation in the PARP1 knockout (Soriano et al.,
2002). OGG1-/- mice have also shown resistance to the deleterious effects of
inflammation induced by LPS and Helicobacter Pylori, with animals displaying
decreased mortality and reduced gut inflammation respectively (Mabley et al.,
2005a; Touati et al., 2006).
NEIL1-/- mice have been described as having symptoms of metabolic
syndrome, a human disease which has been associated with raised serum
levels of the inflammatory markers IL-6, TNFα and fibrinogen (Mabley et al.,
2005a; Touati et al., 2006). However in later studies this phenotype has been
shown to be inconsistent and it has been suggested that the absence of
NEIL1 increases susceptibility to increased weight (metabolic syndrome;
(Chan et al., 2009; Sampath et al., 2011)). A new NEIL1-/- mouse strain has
recently been developed (Chapter 3), and these animals will thus be used to
identify if the NEIL1 protein modifies LPS induced inflammation in order to
further study the links between LPS induced inflammation and the BER
pathway.
Ph.D. Thesis 2012 Alan Carter
114
5.1.1. Aims
To identify the extent to which NEIL1 determines the immune response to
LPS by:
1) Establishing whether seum levels of IL-6, IL-12, IL-10 and IL-4 differ
between NEIL1-/- and NEIL1+/+ mice, at baseline or after LPS
treatment.
2) Identifying whether any LPS induced changes in MPO activity, GSH
levels and MDA levels differ between NEIL1-/- and NEIL1+/+ mice.
3) Determining if the effects of oxidative damage caused by age are
altered in NEIL1-/- mice when compared to NEIL1+/+ mice.
5.2. Results
5.2.1. Cytokine Output in LPS Challenged NEIL1-/- Mice
Figures 5.1 – 5.4 present interleukin concentrations present in the blood
serum of mice injected with LPS (2 mg/kg i.p.) after 0, 1, 6 and 24 h (mean
± SEM; n=6). IL-4 concentrations were not significantly different at any time
point when comparing male NEIL1+/+ and NEIL1-/- mice (Figure 5.1A). There
was, however, a significant difference between WT and KO female mice at 6
h; here the NEIL1+/+ mice had more IL-4 within the serum than NEIL1-/- mice
(216.9 ± 37.0 pg/ml vs. 63.9 ± 15.9 pg/ml; Figure 5.1B; p<0.01).
IL-6 concentrations were significantly different between male WT and KO
mice at baseline (WT 340.8 ± 12.0 pg/ml vs. KO 7.3 ± 5.6 pg/ml; p<0.01), 1
h (WT 5383.5 ± 378.2 pg/ml vs. KO 6690.0 ± 492.7 pg/ml; p=0.04) and 24
h (WT 390.6 ± 458.6 pg/ml vs. KO 29.0 ± 17.7 pg/ml; p<0.01). At 0 and 24
h the WT concentration of IL-6 was higher than KO levels, whilst at 6h the
KO levels were higher than WT levels (Figure 5.2A). There were significant
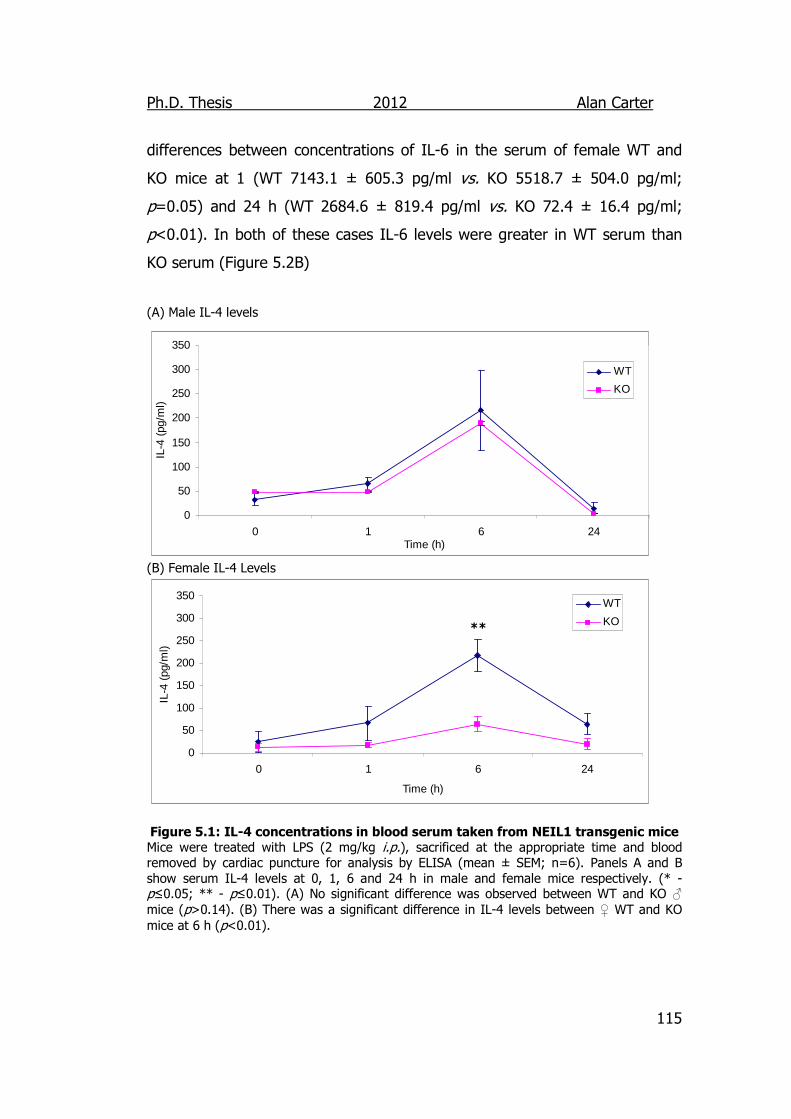
Ph.D. Thesis 2012 Alan Carter
115
differences between concentrations of IL-6 in the serum of female WT and
KO mice at 1 (WT 7143.1 ± 605.3 pg/ml vs. KO 5518.7 ± 504.0 pg/ml;
p=0.05) and 24 h (WT 2684.6 ± 819.4 pg/ml vs. KO 72.4 ± 16.4 pg/ml;
p<0.01). In both of these cases IL-6 levels were greater in WT serum than
KO serum (Figure 5.2B)
(A) Male IL-4 levels
0
50
100
150
200
250
300
350
0 1 6 24Time (h)
IL-4
(pg
/ml)
WT
KO
(B) Female IL-4 Levels
0
50
100
150
200
250
300
350
0 1 6 24
Time (h)
IL-4
(pg
/ml)
WT
KO
Figure 5.1: IL-4 concentrations in blood serum taken from NEIL1 transgenic mice Mice were treated with LPS (2 mg/kg i.p.), sacrificed at the appropriate time and blood removed by cardiac puncture for analysis by ELISA (mean ± SEM; n=6). Panels A and B show serum IL-4 levels at 0, 1, 6 and 24 h in male and female mice respectively. (* - p≤0.05; ** - p≤0.01). (A) No significant difference was observed between WT and KO ♂ mice (p>0.14). (B) There was a significant difference in IL-4 levels between ♀ WT and KO mice at 6 h (p<0.01).
**
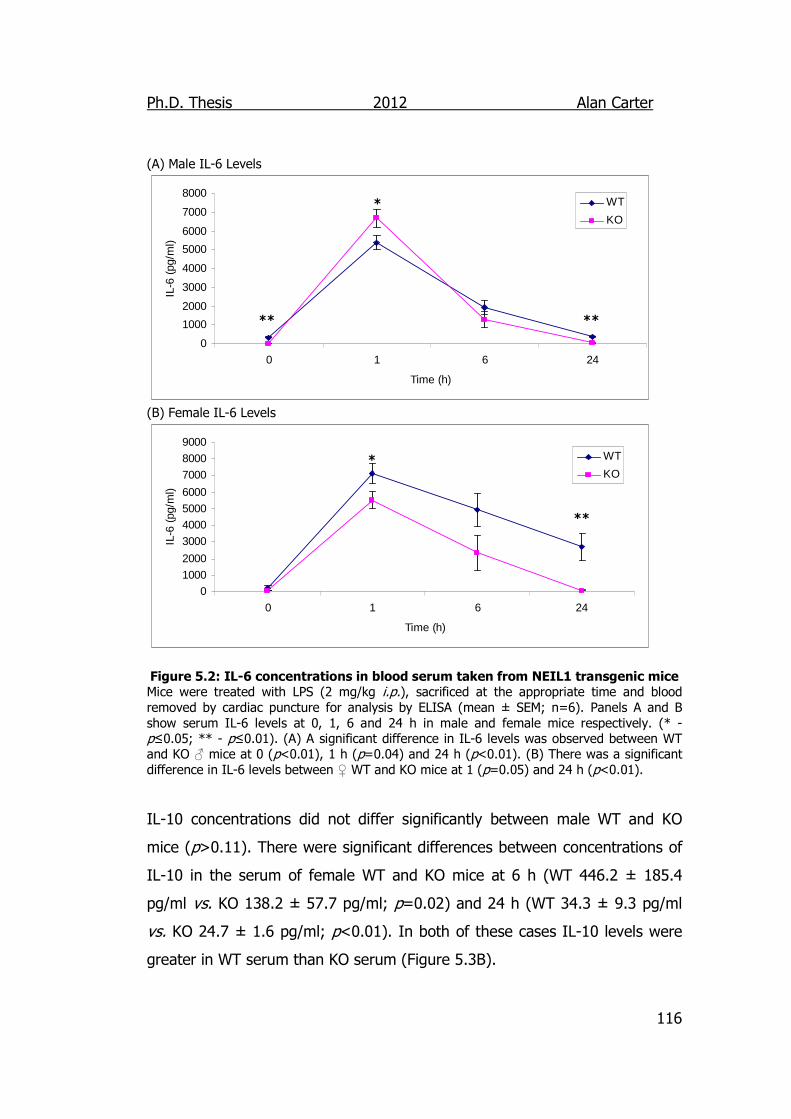
Ph.D. Thesis 2012 Alan Carter
116
(A) Male IL-6 Levels
0
1000
2000
3000
4000
5000
6000
7000
8000
0 1 6 24
Time (h)
IL-6
(pg
/ml)
WT
KO
(B) Female IL-6 Levels
0
1000
2000
3000
4000
5000
6000
7000
8000
9000
0 1 6 24
Time (h)
IL-6
(pg
/ml)
WT
KO
Figure 5.2: IL-6 concentrations in blood serum taken from NEIL1 transgenic mice Mice were treated with LPS (2 mg/kg i.p.), sacrificed at the appropriate time and blood removed by cardiac puncture for analysis by ELISA (mean ± SEM; n=6). Panels A and B show serum IL-6 levels at 0, 1, 6 and 24 h in male and female mice respectively. (* - p≤0.05; ** - p≤0.01). (A) A significant difference in IL-6 levels was observed between WT and KO ♂ mice at 0 (p<0.01), 1 h (p=0.04) and 24 h (p<0.01). (B) There was a significant difference in IL-6 levels between ♀ WT and KO mice at 1 (p=0.05) and 24 h (p<0.01).
IL-10 concentrations did not differ significantly between male WT and KO
mice (p>0.11). There were significant differences between concentrations of
IL-10 in the serum of female WT and KO mice at 6 h (WT 446.2 ± 185.4
pg/ml vs. KO 138.2 ± 57.7 pg/ml; p=0.02) and 24 h (WT 34.3 ± 9.3 pg/ml
vs. KO 24.7 ± 1.6 pg/ml; p<0.01). In both of these cases IL-10 levels were
greater in WT serum than KO serum (Figure 5.3B).
*
**
**
**
*
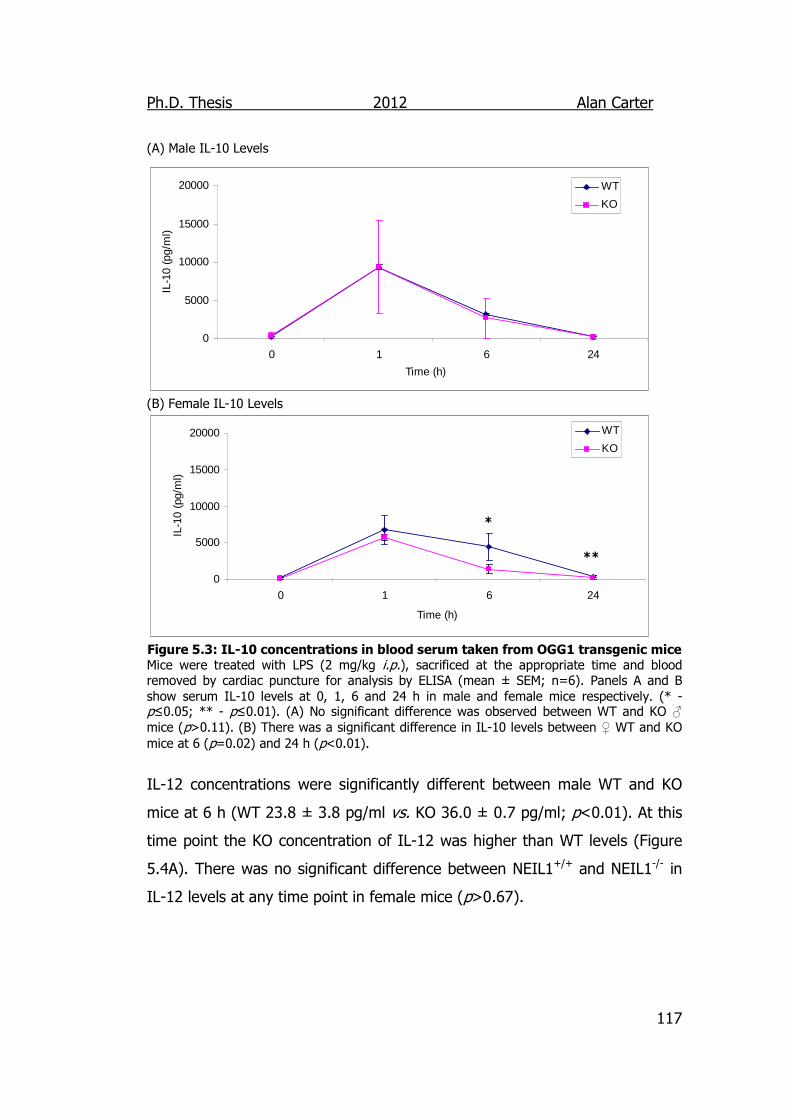
Ph.D. Thesis 2012 Alan Carter
117
(A) Male IL-10 Levels
0
5000
10000
15000
20000
0 1 6 24
Time (h)
IL-1
0 (p
g/m
l)
WT
KO
(B) Female IL-10 Levels
0
5000
10000
15000
20000
0 1 6 24
Time (h)
IL-1
0 (p
g/m
l)
WT
KO
Figure 5.3: IL-10 concentrations in blood serum taken from OGG1 transgenic mice Mice were treated with LPS (2 mg/kg i.p.), sacrificed at the appropriate time and blood removed by cardiac puncture for analysis by ELISA (mean ± SEM; n=6). Panels A and B show serum IL-10 levels at 0, 1, 6 and 24 h in male and female mice respectively. (* - p≤0.05; ** - p≤0.01). (A) No significant difference was observed between WT and KO ♂ mice (p>0.11). (B) There was a significant difference in IL-10 levels between ♀ WT and KO mice at 6 (p=0.02) and 24 h (p<0.01).
IL-12 concentrations were significantly different between male WT and KO
mice at 6 h (WT 23.8 ± 3.8 pg/ml vs. KO 36.0 ± 0.7 pg/ml; p<0.01). At this
time point the KO concentration of IL-12 was higher than WT levels (Figure
5.4A). There was no significant difference between NEIL1+/+ and NEIL1-/- in
IL-12 levels at any time point in female mice (p>0.67).
*
**
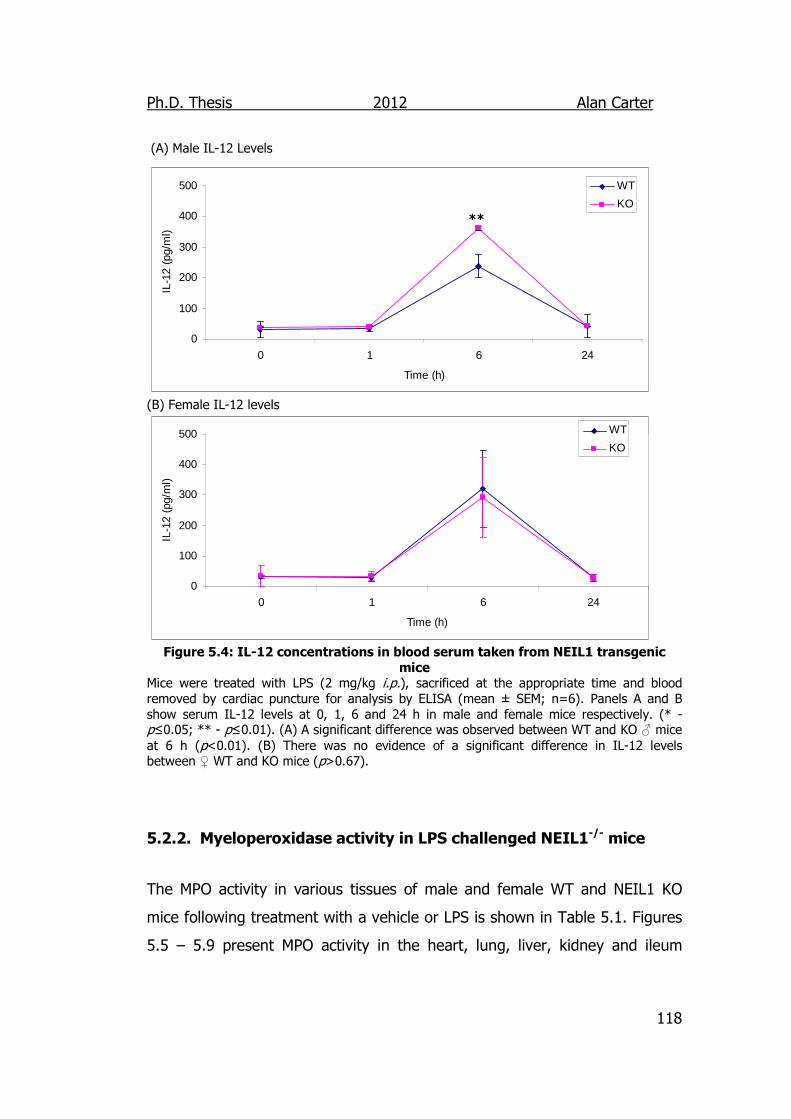
Ph.D. Thesis 2012 Alan Carter
118
(A) Male IL-12 Levels
0
100
200
300
400
500
0 1 6 24
Time (h)
IL-1
2 (p
g/m
l)
WT
KO
(B) Female IL-12 levels
0
100
200
300
400
500
0 1 6 24
Time (h)
IL-1
2 (p
g/m
l)
WT
KO
Figure 5.4: IL-12 concentrations in blood serum taken from NEIL1 transgenic
mice Mice were treated with LPS (2 mg/kg i.p.), sacrificed at the appropriate time and blood removed by cardiac puncture for analysis by ELISA (mean ± SEM; n=6). Panels A and B show serum IL-12 levels at 0, 1, 6 and 24 h in male and female mice respectively. (* - p≤0.05; ** - p≤0.01). (A) A significant difference was observed between WT and KO ♂ mice at 6 h (p<0.01). (B) There was no evidence of a significant difference in IL-12 levels between ♀ WT and KO mice (p>0.67).
5.2.2. Myeloperoxidase activity in LPS challenged NEIL1-/- mice
The MPO activity in various tissues of male and female WT and NEIL1 KO
mice following treatment with a vehicle or LPS is shown in Table 5.1. Figures
5.5 – 5.9 present MPO activity in the heart, lung, liver, kidney and ileum
**
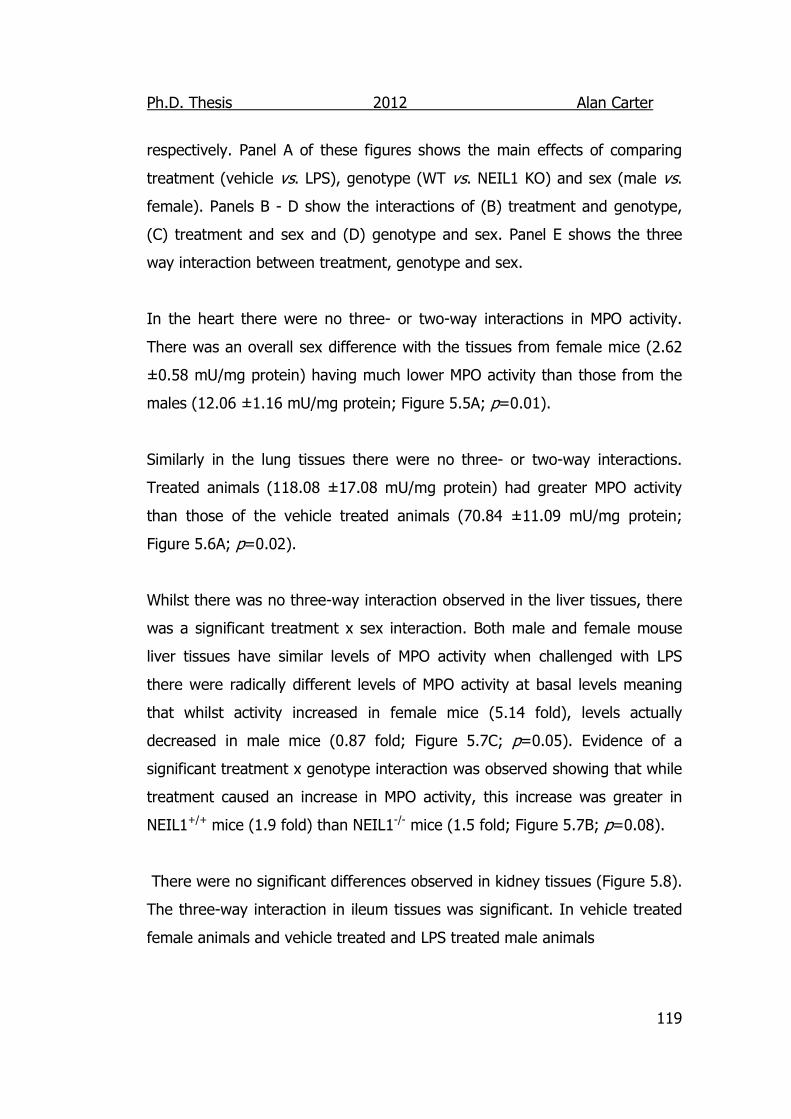
Ph.D. Thesis 2012 Alan Carter
119
respectively. Panel A of these figures shows the main effects of comparing
treatment (vehicle vs. LPS), genotype (WT vs. NEIL1 KO) and sex (male vs.
female). Panels B - D show the interactions of (B) treatment and genotype,
(C) treatment and sex and (D) genotype and sex. Panel E shows the three
way interaction between treatment, genotype and sex.
In the heart there were no three- or two-way interactions in MPO activity.
There was an overall sex difference with the tissues from female mice (2.62
±0.58 mU/mg protein) having much lower MPO activity than those from the
males (12.06 ±1.16 mU/mg protein; Figure 5.5A; p=0.01).
Similarly in the lung tissues there were no three- or two-way interactions.
Treated animals (118.08 ±17.08 mU/mg protein) had greater MPO activity
than those of the vehicle treated animals (70.84 ±11.09 mU/mg protein;
Figure 5.6A; p=0.02).
Whilst there was no three-way interaction observed in the liver tissues, there
was a significant treatment x sex interaction. Both male and female mouse
liver tissues have similar levels of MPO activity when challenged with LPS
there were radically different levels of MPO activity at basal levels meaning
that whilst activity increased in female mice (5.14 fold), levels actually
decreased in male mice (0.87 fold; Figure 5.7C; p=0.05). Evidence of a
significant treatment x genotype interaction was observed showing that while
treatment caused an increase in MPO activity, this increase was greater in
NEIL1+/+ mice (1.9 fold) than NEIL1-/- mice (1.5 fold; Figure 5.7B; p=0.08).
There were no significant differences observed in kidney tissues (Figure 5.8).
The three-way interaction in ileum tissues was significant. In vehicle treated
female animals and vehicle treated and LPS treated male animals
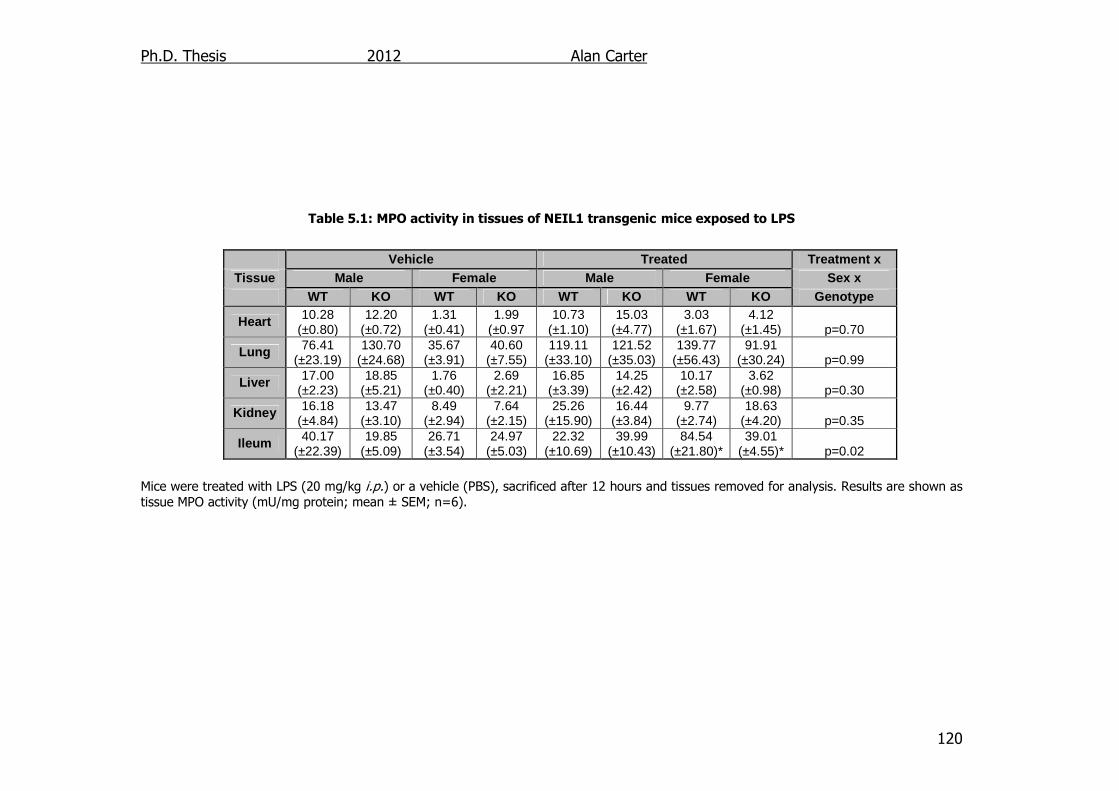
Ph.D. Thesis 2012 Alan Carter
120
Table 5.1: MPO activity in tissues of NEIL1 transgenic mice exposed to LPS Mice were treated with LPS (20 mg/kg i.p.) or a vehicle (PBS), sacrificed after 12 hours and tissues removed for analysis. Results are shown as tissue MPO activity (mU/mg protein; mean ± SEM; n=6).
Vehicle Treated Treatment x Tissue Male Female Male Female Sex x
WT KO WT KO WT KO WT KO Genotype
Heart 10.28 (±0.80)
12.20 (±0.72)
1.31 (±0.41)
1.99 (±0.97
10.73 (±1.10)
15.03 (±4.77)
3.03 (±1.67)
4.12 (±1.45) p=0.70
Lung 76.41 (±23.19)
130.70 (±24.68)
35.67 (±3.91)
40.60 (±7.55)
119.11 (±33.10)
121.52 (±35.03)
139.77 (±56.43)
91.91 (±30.24) p=0.99
Liver 17.00 (±2.23)
18.85 (±5.21)
1.76 (±0.40)
2.69 (±2.21)
16.85 (±3.39)
14.25 (±2.42)
10.17 (±2.58)
3.62 (±0.98) p=0.30
Kidney 16.18 (±4.84)
13.47 (±3.10)
8.49 (±2.94)
7.64 (±2.15)
25.26 (±15.90)
16.44 (±3.84)
9.77 (±2.74)
18.63 (±4.20) p=0.35
Ileum 40.17 (±22.39)
19.85 (±5.09)
26.71 (±3.54)
24.97 (±5.03)
22.32 (±10.69)
39.99 (±10.43)
84.54 (±21.80)*
39.01 (±4.55)* p=0.02
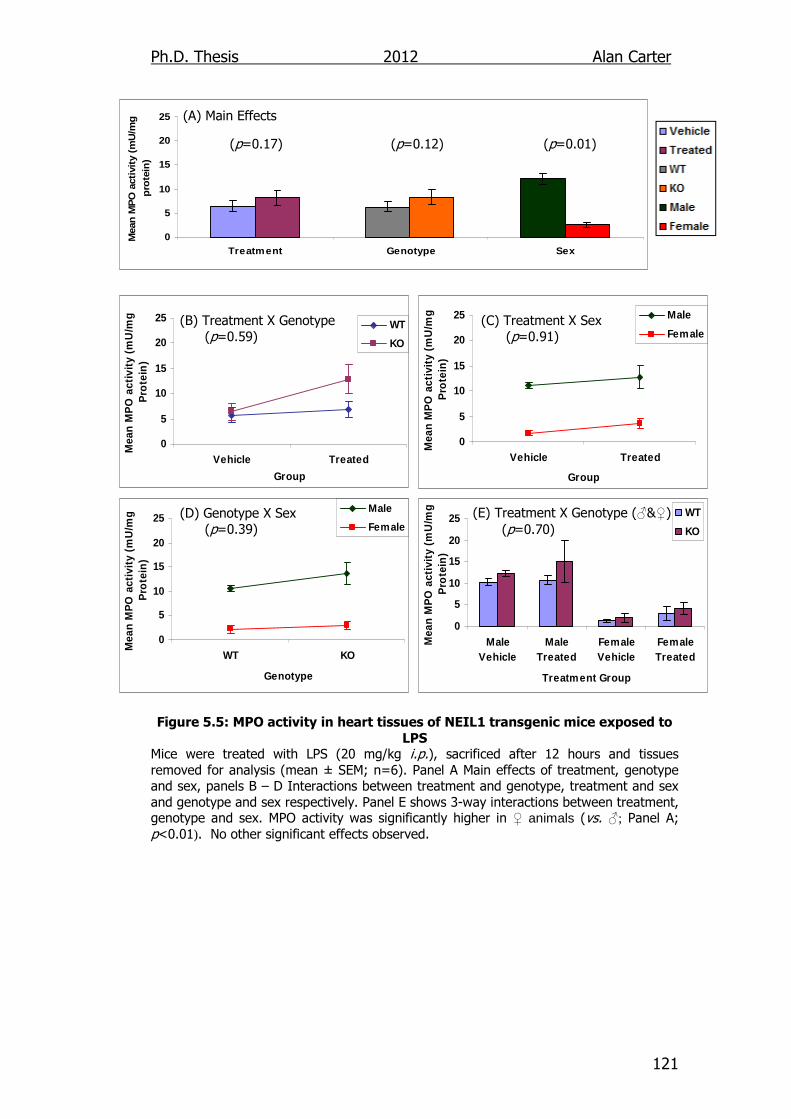
Ph.D. Thesis 2012 Alan Carter
121
0
5
10
15
20
25
Treatment Genotype Sex
Mea
n M
PO
act
ivit
y (m
U/m
g
pro
tein
)
0
5
10
15
20
25
Vehicle Treated
Group
Mea
n M
PO
act
ivit
y (m
U/m
g
Pro
tein
)
WT
KO
0
5
10
15
20
25
WT KO
Genotype
Mea
n M
PO
act
ivit
y (m
U/m
g
Pro
tein
)
Male
Female
0
5
10
15
20
25
Vehicle Treated
Group
Mea
n M
PO
act
ivit
y (m
U/m
g
Pro
tein
)
Male
Female
0
5
10
15
20
25
MaleVehicle
MaleTreated
FemaleVehicle
FemaleTreated
Treatment Group
Mea
n M
PO
act
ivit
y (m
U/m
g
Pro
tein
)
WT
KO
(A) Main Effects
(p=0.17) (p=0.12) (p=0.01)
(B) Treatment X Genotype (p=0.59) (D) Genotype X Sex (p=0.39)
(C) Treatment X Sex (p=0.91) (E) Treatment X Genotype (♂&♀) (p=0.70)
Figure 5.5: MPO activity in heart tissues of NEIL1 transgenic mice exposed to
LPS Mice were treated with LPS (20 mg/kg i.p.), sacrificed after 12 hours and tissues removed for analysis (mean ± SEM; n=6). Panel A Main effects of treatment, genotype and sex, panels B – D Interactions between treatment and genotype, treatment and sex and genotype and sex respectively. Panel E shows 3-way interactions between treatment, genotype and sex. MPO activity was significantly higher in ♀ animals (vs. ♂; Panel A; p<0.01). No other significant effects observed.
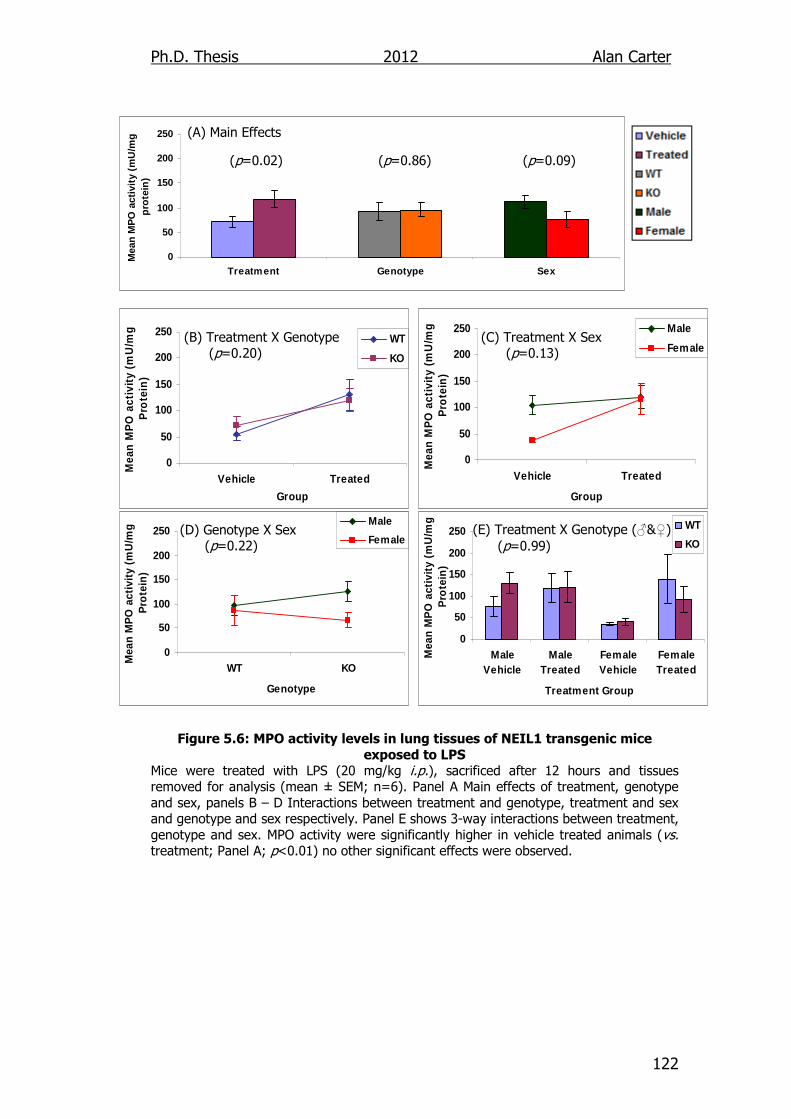
Ph.D. Thesis 2012 Alan Carter
122
0
50
100
150
200
250
Treatment Genotype Sex
Mea
n M
PO
act
ivit
y (m
U/m
g
pro
tein
)
0
50
100
150
200
250
Vehicle Treated
Group
Mea
n M
PO
act
ivit
y (m
U/m
g
Pro
tein
)
WT
KO
0
50
100
150
200
250
Vehicle Treated
Group
Mea
n M
PO
act
ivit
y (m
U/m
g
Pro
tein
)
Male
Female
0
50
100
150
200
250
WT KO
Genotype
Mea
n M
PO
act
ivit
y (m
U/m
g
Pro
tein
)
Male
Female
0
50
100
150
200
250
MaleVehicle
MaleTreated
FemaleVehicle
FemaleTreated
Treatment Group
Mea
n M
PO
act
ivit
y (m
U/m
g
Pro
tein
)
WT
KO
(A) Main Effects
(p=0.02) (p=0.86) (p=0.09) (B) Treatment X Genotype (p=0.20) (D) Genotype X Sex (p=0.22)
(C) Treatment X Sex (p=0.13) (E) Treatment X Genotype (♂&♀) (p=0.99)
Figure 5.6: MPO activity levels in lung tissues of NEIL1 transgenic mice
exposed to LPS Mice were treated with LPS (20 mg/kg i.p.), sacrificed after 12 hours and tissues removed for analysis (mean ± SEM; n=6). Panel A Main effects of treatment, genotype and sex, panels B – D Interactions between treatment and genotype, treatment and sex and genotype and sex respectively. Panel E shows 3-way interactions between treatment, genotype and sex. MPO activity were significantly higher in vehicle treated animals (vs. treatment; Panel A; p<0.01) no other significant effects were observed.
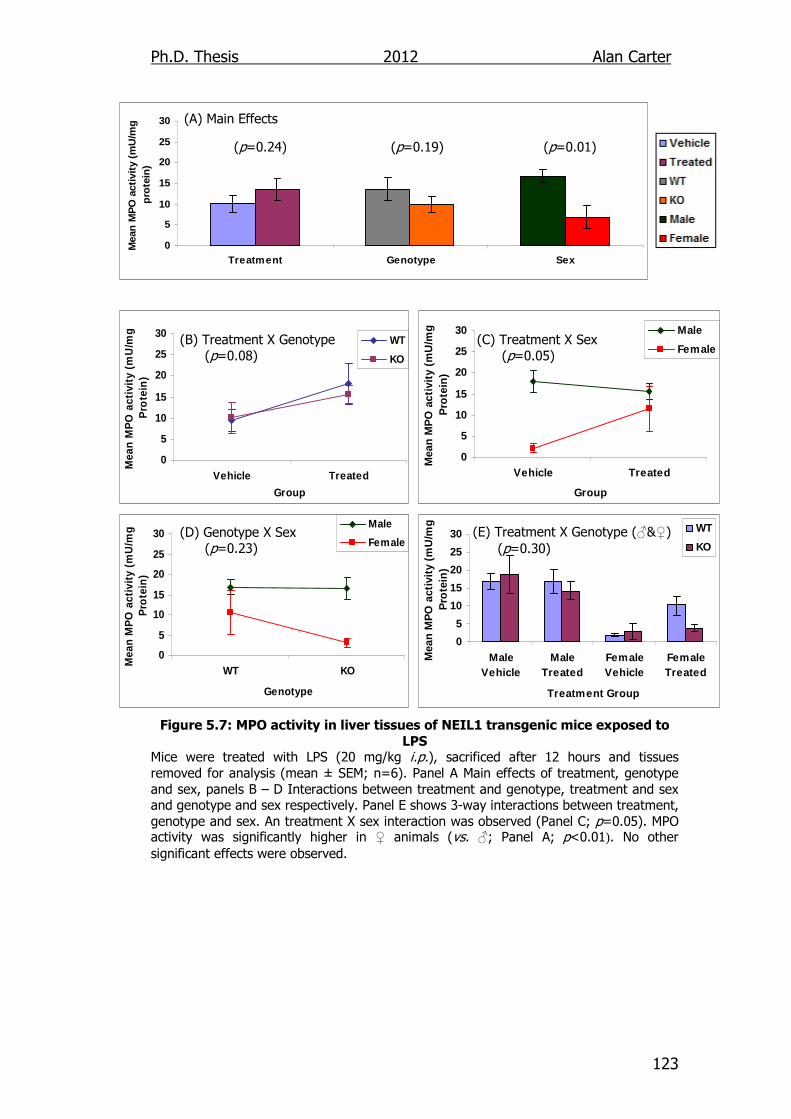
Ph.D. Thesis 2012 Alan Carter
123
0
5
10
15
20
25
30
Treatment Genotype Sex
Mea
n M
PO
act
ivit
y (m
U/m
g
pro
tein
)
0
5
10
15
20
25
30
Vehicle Treated
Group
Mea
n M
PO
act
ivit
y (m
U/m
g
Pro
tein
)
WT
KO
0
5
10
15
20
25
30
Vehicle Treated
Group
Mea
n M
PO
act
ivit
y (m
U/m
g
Pro
tein
)
Male
Female
0
5
10
15
20
25
30
WT KO
Genotype
Mea
n M
PO
act
ivit
y (m
U/m
g
Pro
tein
)
Male
Female
0
5
10
15
20
25
30
MaleVehicle
MaleTreated
FemaleVehicle
FemaleTreated
Treatment Group
Mea
n M
PO
act
ivit
y (m
U/m
g
Pro
tein
)
WT
KO
(A) Main Effects
(p=0.24) (p=0.19) (p=0.01)
(B) Treatment X Genotype (p=0.08) (D) Genotype X Sex (p=0.23)
(C) Treatment X Sex (p=0.05) (E) Treatment X Genotype (♂&♀) (p=0.30)
Figure 5.7: MPO activity in liver tissues of NEIL1 transgenic mice exposed to
LPS Mice were treated with LPS (20 mg/kg i.p.), sacrificed after 12 hours and tissues removed for analysis (mean ± SEM; n=6). Panel A Main effects of treatment, genotype and sex, panels B – D Interactions between treatment and genotype, treatment and sex and genotype and sex respectively. Panel E shows 3-way interactions between treatment, genotype and sex. An treatment X sex interaction was observed (Panel C; p=0.05). MPO activity was significantly higher in ♀ animals (vs. ♂; Panel A; p<0.01). No other significant effects were observed.
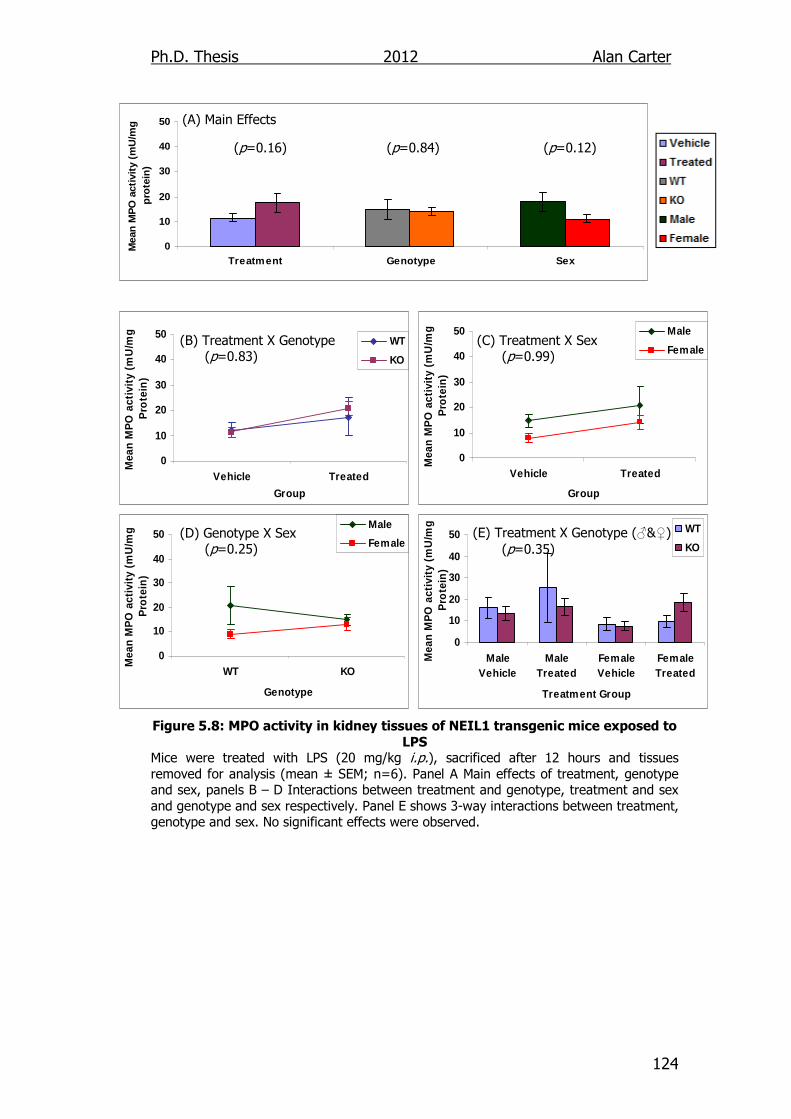
Ph.D. Thesis 2012 Alan Carter
124
0
10
20
30
40
50
Treatment Genotype Sex
Mea
n M
PO
act
ivit
y (m
U/m
g
pro
tein
)
0
10
20
30
40
50
Vehicle Treated
Group
Mea
n M
PO
act
ivit
y (m
U/m
g
Pro
tein
)
WT
KO
0
10
20
30
40
50
Vehicle Treated
Group
Mea
n M
PO
act
ivit
y (m
U/m
g
Pro
tein
)
Male
Female
0
10
20
30
40
50
WT KO
Genotype
Mea
n M
PO
act
ivit
y (m
U/m
g
Pro
tein
)
Male
Female
0
10
20
30
40
50
MaleVehicle
MaleTreated
FemaleVehicle
FemaleTreated
Treatment Group
Mea
n M
PO
act
ivit
y (m
U/m
g
Pro
tein
)
WT
KO
(A) Main Effects
(p=0.16) (p=0.84) (p=0.12)
(B) Treatment X Genotype (p=0.83) (D) Genotype X Sex (p=0.25)
(C) Treatment X Sex (p=0.99) (E) Treatment X Genotype (♂&♀) (p=0.35)
Figure 5.8: MPO activity in kidney tissues of NEIL1 transgenic mice exposed to
LPS Mice were treated with LPS (20 mg/kg i.p.), sacrificed after 12 hours and tissues removed for analysis (mean ± SEM; n=6). Panel A Main effects of treatment, genotype and sex, panels B – D Interactions between treatment and genotype, treatment and sex and genotype and sex respectively. Panel E shows 3-way interactions between treatment, genotype and sex. No significant effects were observed.
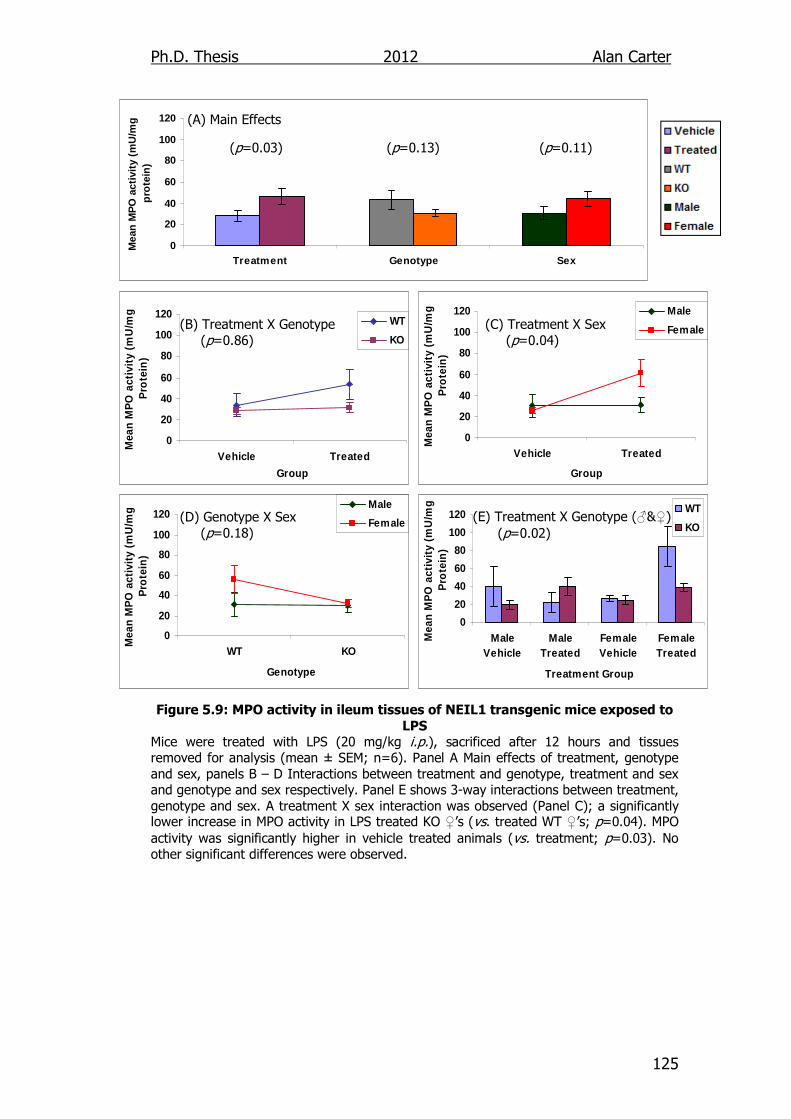
Ph.D. Thesis 2012 Alan Carter
125
0
20
40
60
80
100
120
Treatment Genotype Sex
Mea
n M
PO
act
ivit
y (m
U/m
g
pro
tein
)
0
20
40
60
80
100
120
Vehicle Treated
Group
Mea
n M
PO
act
ivit
y (m
U/m
g
Pro
tein
)
WT
KO
0
20
40
60
80
100
120
Vehicle Treated
Group
Mea
n M
PO
act
ivit
y (m
U/m
g
Pro
tein
)
Male
Female
0
20
40
60
80
100
120
WT KO
Genotype
Mea
n M
PO
act
ivit
y (m
U/m
g
Pro
tein
)
Male
Female
0
20
40
60
80
100
120
MaleVehicle
MaleTreated
FemaleVehicle
FemaleTreated
Treatment Group
Mea
n M
PO
act
ivit
y (m
U/m
g
Pro
tein
)
WT
KO
(A) Main Effects
(p=0.03) (p=0.13) (p=0.11)
(B) Treatment X Genotype (p=0.86) (D) Genotype X Sex (p=0.18)
(C) Treatment X Sex (p=0.04) (E) Treatment X Genotype (♂&♀) (p=0.02)
Figure 5.9: MPO activity in ileum tissues of NEIL1 transgenic mice exposed to
LPS Mice were treated with LPS (20 mg/kg i.p.), sacrificed after 12 hours and tissues removed for analysis (mean ± SEM; n=6). Panel A Main effects of treatment, genotype and sex, panels B – D Interactions between treatment and genotype, treatment and sex and genotype and sex respectively. Panel E shows 3-way interactions between treatment, genotype and sex. A treatment X sex interaction was observed (Panel C); a significantly lower increase in MPO activity in LPS treated KO ♀’s (vs. treated WT ♀’s; p=0.04). MPO activity was significantly higher in vehicle treated animals (vs. treatment; p=0.03). No other significant differences were observed.
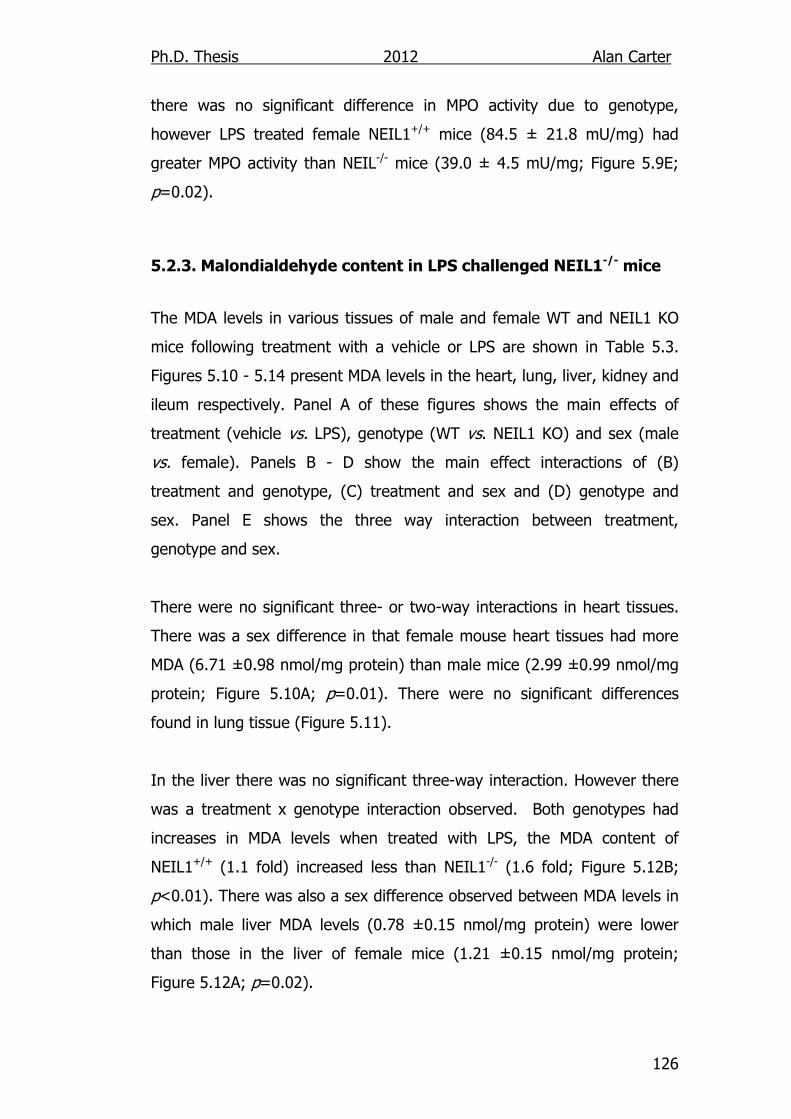
Ph.D. Thesis 2012 Alan Carter
126
there was no significant difference in MPO activity due to genotype,
however LPS treated female NEIL1+/+ mice (84.5 ± 21.8 mU/mg) had
greater MPO activity than NEIL-/- mice (39.0 ± 4.5 mU/mg; Figure 5.9E;
p=0.02).
5.2.3. Malondialdehyde content in LPS challenged NEIL1-/- mice
The MDA levels in various tissues of male and female WT and NEIL1 KO
mice following treatment with a vehicle or LPS are shown in Table 5.3.
Figures 5.10 - 5.14 present MDA levels in the heart, lung, liver, kidney and
ileum respectively. Panel A of these figures shows the main effects of
treatment (vehicle vs. LPS), genotype (WT vs. NEIL1 KO) and sex (male
vs. female). Panels B - D show the main effect interactions of (B)
treatment and genotype, (C) treatment and sex and (D) genotype and
sex. Panel E shows the three way interaction between treatment,
genotype and sex.
There were no significant three- or two-way interactions in heart tissues.
There was a sex difference in that female mouse heart tissues had more
MDA (6.71 ±0.98 nmol/mg protein) than male mice (2.99 ±0.99 nmol/mg
protein; Figure 5.10A; p=0.01). There were no significant differences
found in lung tissue (Figure 5.11).
In the liver there was no significant three-way interaction. However there
was a treatment x genotype interaction observed. Both genotypes had
increases in MDA levels when treated with LPS, the MDA content of
NEIL1+/+ (1.1 fold) increased less than NEIL1-/- (1.6 fold; Figure 5.12B;
p<0.01). There was also a sex difference observed between MDA levels in
which male liver MDA levels (0.78 ±0.15 nmol/mg protein) were lower
than those in the liver of female mice (1.21 ±0.15 nmol/mg protein;
Figure 5.12A; p=0.02).
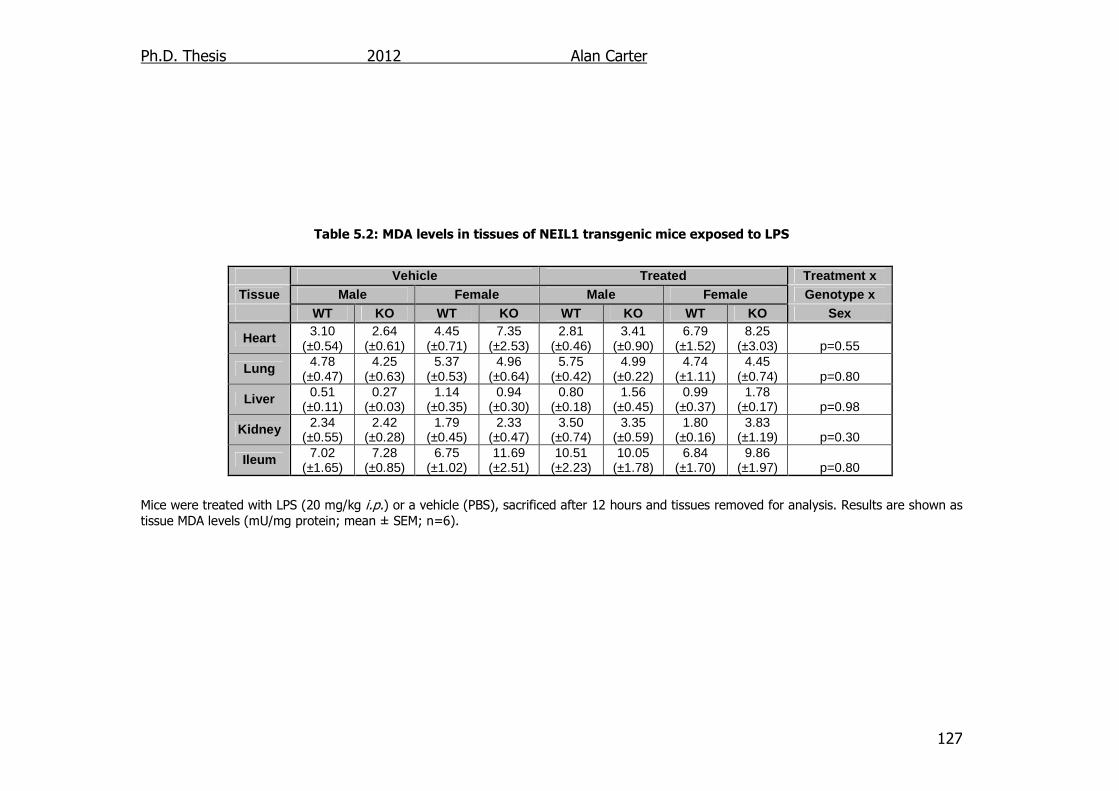
Ph.D. Thesis 2012 Alan Carter
127
Table 5.2: MDA levels in tissues of NEIL1 transgenic mice exposed to LPS
Mice were treated with LPS (20 mg/kg i.p.) or a vehicle (PBS), sacrificed after 12 hours and tissues removed for analysis. Results are shown as tissue MDA levels (mU/mg protein; mean ± SEM; n=6).
Vehicle Treated Treatment x Tissue Male Female Male Female Genotype x
WT KO WT KO WT KO WT KO Sex
Heart 3.10 (±0.54)
2.64 (±0.61)
4.45 (±0.71)
7.35 (±2.53)
2.81 (±0.46)
3.41 (±0.90)
6.79 (±1.52)
8.25 (±3.03) p=0.55
Lung 4.78 (±0.47)
4.25 (±0.63)
5.37 (±0.53)
4.96 (±0.64)
5.75 (±0.42)
4.99 (±0.22)
4.74 (±1.11)
4.45 (±0.74) p=0.80
Liver 0.51 (±0.11)
0.27 (±0.03)
1.14 (±0.35)
0.94 (±0.30)
0.80 (±0.18)
1.56 (±0.45)
0.99 (±0.37)
1.78 (±0.17) p=0.98
Kidney 2.34 (±0.55)
2.42 (±0.28)
1.79 (±0.45)
2.33 (±0.47)
3.50 (±0.74)
3.35 (±0.59)
1.80 (±0.16)
3.83 (±1.19) p=0.30
Ileum 7.02 (±1.65)
7.28 (±0.85)
6.75 (±1.02)
11.69 (±2.51)
10.51 (±2.23)
10.05 (±1.78)
6.84 (±1.70)
9.86 (±1.97) p=0.80
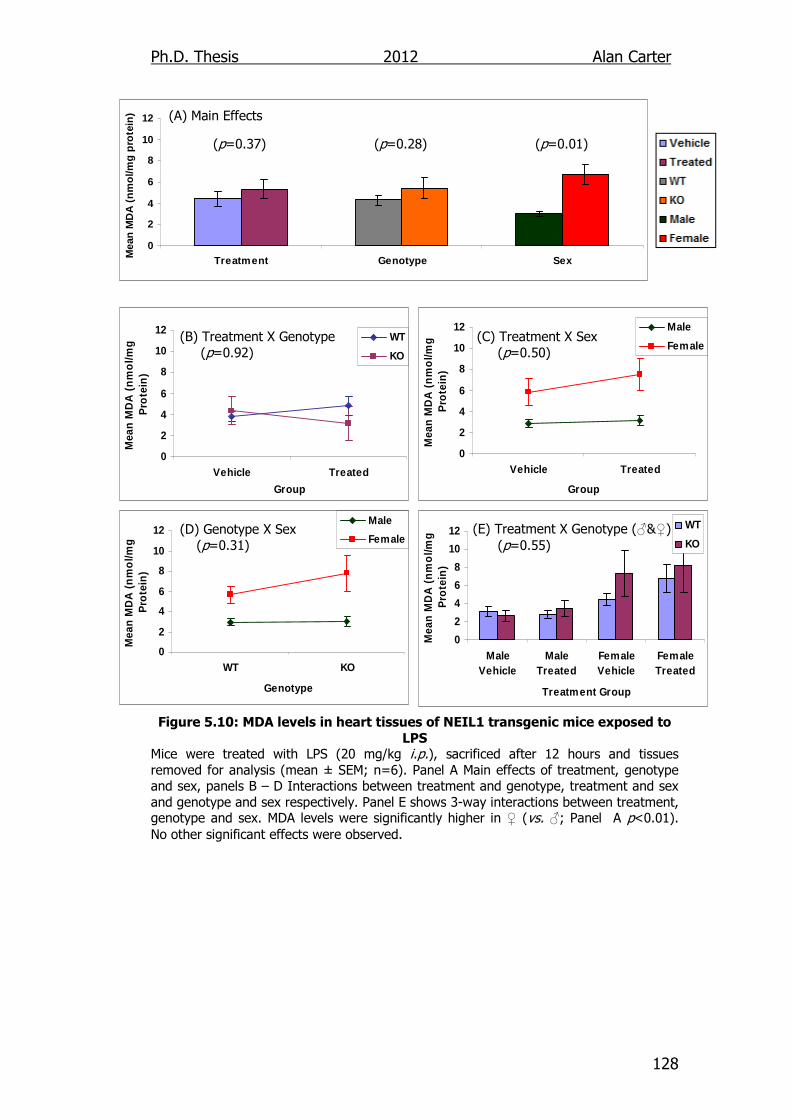
Ph.D. Thesis 2012 Alan Carter
128
0
2
4
6
8
10
12
Treatment Genotype SexMea
n M
DA
(n
mo
l/mg
pro
tein
)
0
2
4
6
8
10
12
Vehicle Treated
Group
Mea
n M
DA
(n
mo
l/mg
P
rote
in)
WT
KO
0
2
4
6
8
10
12
Vehicle Treated
Group
Mea
n M
DA
(n
mo
l/mg
P
rote
in)
Male
Female
0
2
4
6
8
10
12
WT KO
Genotype
Mea
n M
DA
(n
mo
l/mg
P
rote
in)
Male
Female
0
2
4
6
8
10
12
MaleVehicle
MaleTreated
FemaleVehicle
FemaleTreated
Treatment Group
Mea
n M
DA
(n
mo
l/mg
P
rote
in)
WT
KO
(A) Main Effects
(p=0.37) (p=0.28) (p=0.01)
(B) Treatment X Genotype (p=0.92) (D) Genotype X Sex (p=0.31)
(C) Treatment X Sex (p=0.50) (E) Treatment X Genotype (♂&♀) (p=0.55)
Figure 5.10: MDA levels in heart tissues of NEIL1 transgenic mice exposed to
LPS Mice were treated with LPS (20 mg/kg i.p.), sacrificed after 12 hours and tissues removed for analysis (mean ± SEM; n=6). Panel A Main effects of treatment, genotype and sex, panels B – D Interactions between treatment and genotype, treatment and sex and genotype and sex respectively. Panel E shows 3-way interactions between treatment, genotype and sex. MDA levels were significantly higher in ♀ (vs. ♂; Panel A p<0.01). No other significant effects were observed.
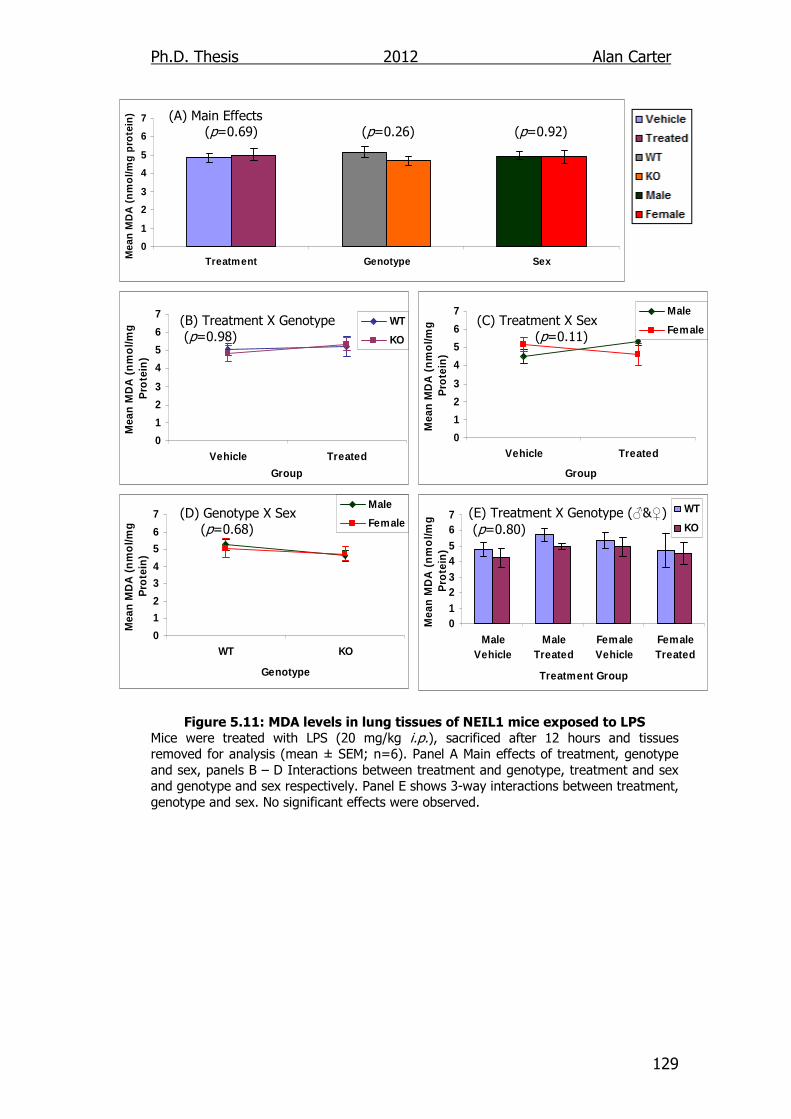
Ph.D. Thesis 2012 Alan Carter
129
0
1
2
3
4
5
6
7
Treatment Genotype SexMea
n M
DA
(n
mo
l/mg
pro
tein
)
0
1
2
3
4
5
6
7
Vehicle Treated
Group
Mea
n M
DA
(n
mo
l/mg
P
rote
in)
WT
KO
0
1
2
3
4
5
6
7
Vehicle Treated
Group
Mea
n M
DA
(n
mo
l/mg
P
rote
in)
Male
Female
0
1
2
3
4
5
6
7
WT KO
Genotype
Mea
n M
DA
(n
mo
l/mg
P
rote
in)
Male
Female
01234567
MaleVehicle
MaleTreated
FemaleVehicle
FemaleTreated
Treatment Group
Mea
n M
DA
(n
mo
l/mg
P
rote
in)
WT
KO
(A) Main Effects (p=0.69) (p=0.26) (p=0.92)
(B) Treatment X Genotype (p=0.98) (D) Genotype X Sex (p=0.68)
(C) Treatment X Sex (p=0.11) (E) Treatment X Genotype (♂&♀) (p=0.80)
Figure 5.11: MDA levels in lung tissues of NEIL1 mice exposed to LPS Mice were treated with LPS (20 mg/kg i.p.), sacrificed after 12 hours and tissues removed for analysis (mean ± SEM; n=6). Panel A Main effects of treatment, genotype and sex, panels B – D Interactions between treatment and genotype, treatment and sex and genotype and sex respectively. Panel E shows 3-way interactions between treatment, genotype and sex. No significant effects were observed.
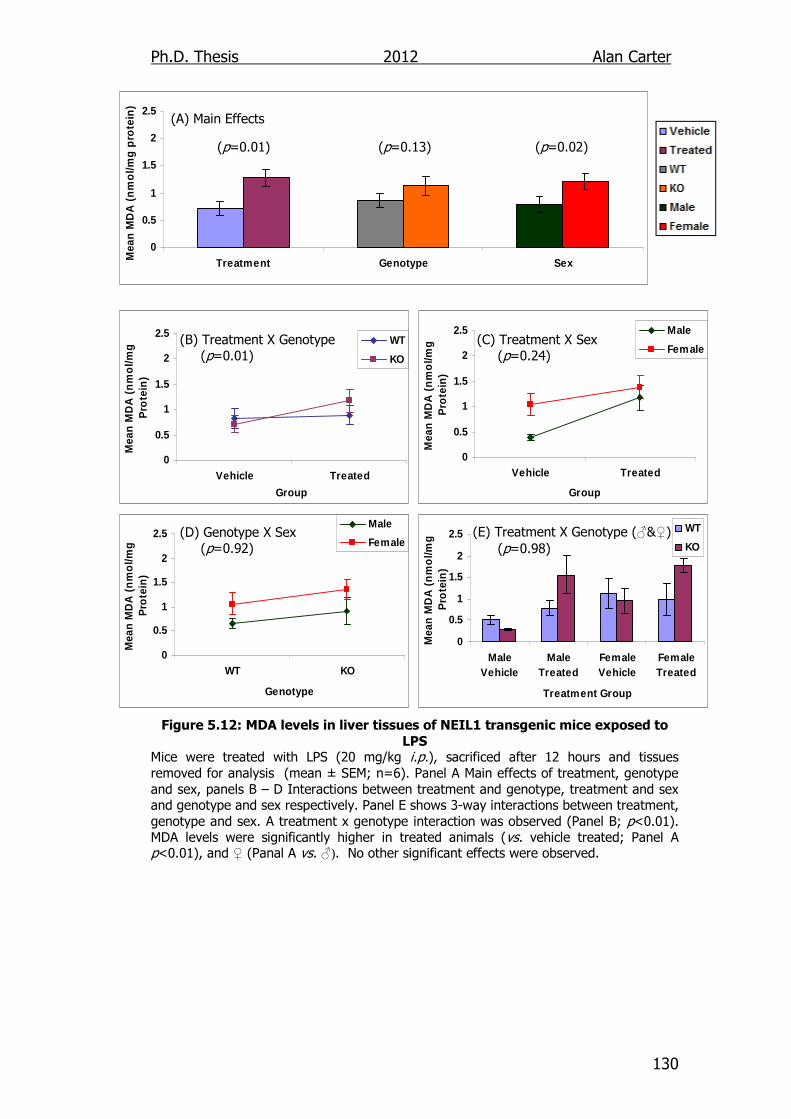
Ph.D. Thesis 2012 Alan Carter
130
0
0.5
1
1.5
2
2.5
Treatment Genotype SexMea
n M
DA
(n
mo
l/mg
pro
tein
)
0
0.5
1
1.5
2
2.5
Vehicle Treated
Group
Mea
n M
DA
(n
mo
l/mg
P
rote
in)
WT
KO
0
0.5
1
1.5
2
2.5
Vehicle Treated
Group
Mea
n M
DA
(n
mo
l/mg
P
rote
in)
Male
Female
0
0.5
1
1.5
2
2.5
WT KO
Genotype
Mea
n M
DA
(n
mo
l/mg
P
rote
in)
Male
Female
0
0.5
1
1.5
2
2.5
MaleVehicle
MaleTreated
FemaleVehicle
FemaleTreated
Treatment Group
Mea
n M
DA
(n
mo
l/mg
P
rote
in)
WT
KO
(A) Main Effects
(p=0.01) (p=0.13) (p=0.02)
(B) Treatment X Genotype (p=0.01) (D) Genotype X Sex (p=0.92)
(C) Treatment X Sex (p=0.24) (E) Treatment X Genotype (♂&♀) (p=0.98)
Figure 5.12: MDA levels in liver tissues of NEIL1 transgenic mice exposed to
LPS Mice were treated with LPS (20 mg/kg i.p.), sacrificed after 12 hours and tissues removed for analysis (mean ± SEM; n=6). Panel A Main effects of treatment, genotype and sex, panels B – D Interactions between treatment and genotype, treatment and sex and genotype and sex respectively. Panel E shows 3-way interactions between treatment, genotype and sex. A treatment x genotype interaction was observed (Panel B; p<0.01). MDA levels were significantly higher in treated animals (vs. vehicle treated; Panel A p<0.01), and ♀ (Panal A vs. ♂). No other significant effects were observed.
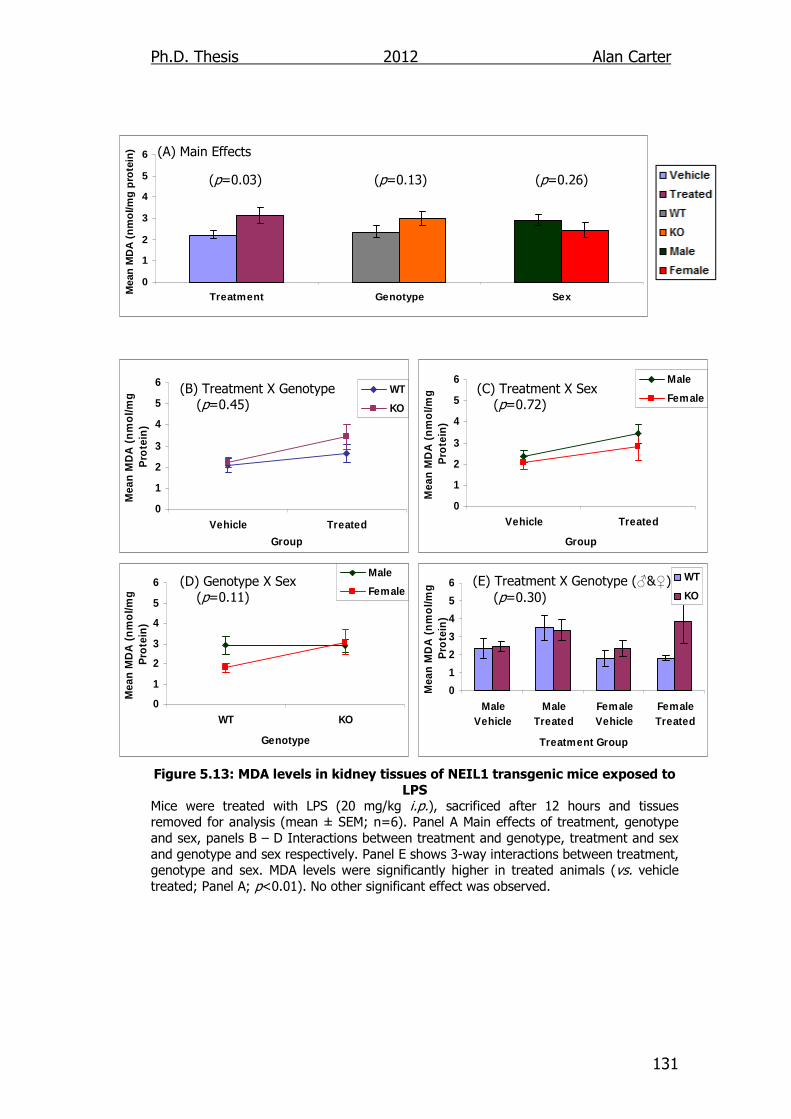
Ph.D. Thesis 2012 Alan Carter
131
0
1
2
3
4
5
6
Treatment Genotype SexMea
n M
DA
(n
mo
l/mg
pro
tein
)
0
1
2
3
4
5
6
Vehicle Treated
Group
Mea
n M
DA
(n
mo
l/mg
P
rote
in)
WT
KO
0
1
2
3
4
5
6
Vehicle Treated
Group
Mea
n M
DA
(n
mo
l/mg
P
rote
in)
Male
Female
0
1
2
3
4
5
6
WT KO
Genotype
Mea
n M
DA
(n
mo
l/mg
P
rote
in)
Male
Female
0
1
2
3
4
5
6
MaleVehicle
MaleTreated
FemaleVehicle
FemaleTreated
Treatment Group
Mea
n M
DA
(n
mo
l/mg
P
rote
in)
WT
KO
(A) Main Effects
(p=0.03) (p=0.13) (p=0.26)
(B) Treatment X Genotype (p=0.45) (D) Genotype X Sex (p=0.11)
(C) Treatment X Sex (p=0.72) (E) Treatment X Genotype (♂&♀) (p=0.30)
Figure 5.13: MDA levels in kidney tissues of NEIL1 transgenic mice exposed to
LPS Mice were treated with LPS (20 mg/kg i.p.), sacrificed after 12 hours and tissues removed for analysis (mean ± SEM; n=6). Panel A Main effects of treatment, genotype and sex, panels B – D Interactions between treatment and genotype, treatment and sex and genotype and sex respectively. Panel E shows 3-way interactions between treatment, genotype and sex. MDA levels were significantly higher in treated animals (vs. vehicle treated; Panel A; p<0.01). No other significant effect was observed.
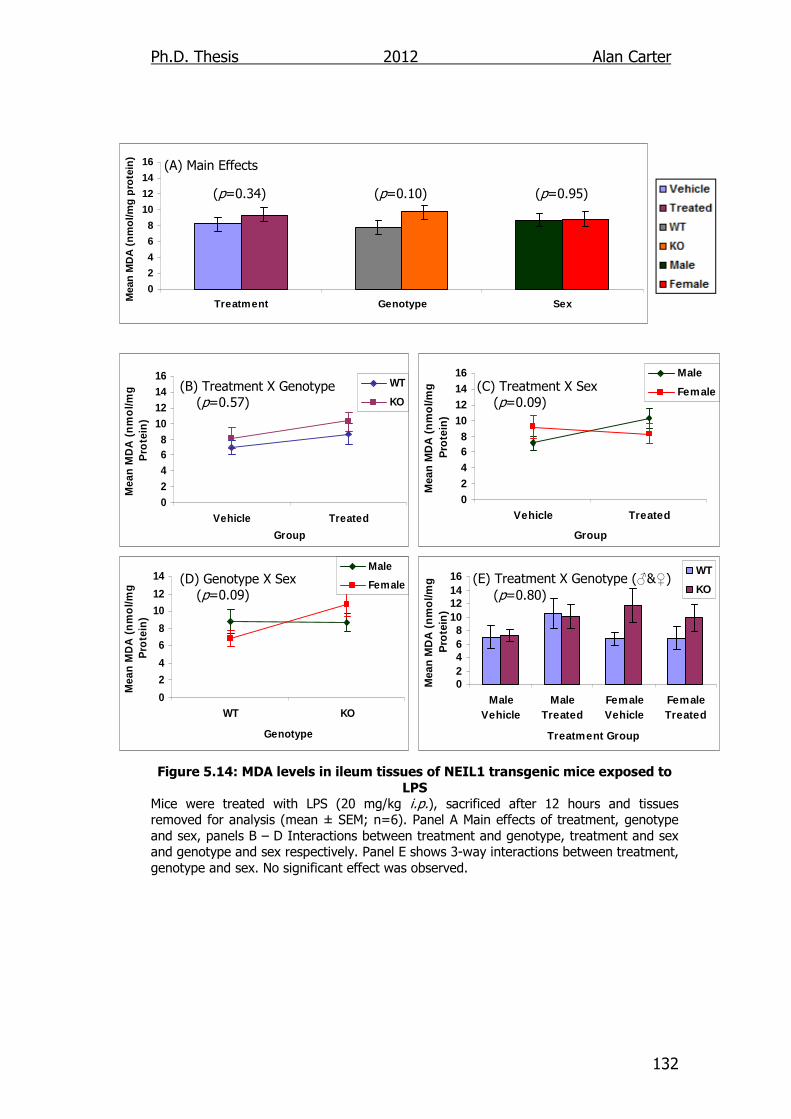
Ph.D. Thesis 2012 Alan Carter
132
0
2
4
6
8
10
12
14
16
Treatment Genotype SexMea
n M
DA
(n
mo
l/mg
pro
tein
)
02468
10121416
Vehicle Treated
Group
Mea
n M
DA
(n
mo
l/mg
P
rote
in)
WT
KO
02468
10121416
Vehicle Treated
Group
Mea
n M
DA
(n
mo
l/mg
P
rote
in)
Male
Female
0
2
4
6
8
10
12
14
WT KO
Genotype
Mea
n M
DA
(n
mo
l/mg
P
rote
in)
Male
Female
02468
10121416
MaleVehicle
MaleTreated
FemaleVehicle
FemaleTreated
Treatment Group
Mea
n M
DA
(n
mo
l/mg
P
rote
in)
WT
KO
(A) Main Effects
(p=0.34) (p=0.10) (p=0.95)
(B) Treatment X Genotype (p=0.57) (D) Genotype X Sex (p=0.09)
(C) Treatment X Sex (p=0.09) (E) Treatment X Genotype (♂&♀) (p=0.80)
Figure 5.14: MDA levels in ileum tissues of NEIL1 transgenic mice exposed to
LPS Mice were treated with LPS (20 mg/kg i.p.), sacrificed after 12 hours and tissues removed for analysis (mean ± SEM; n=6). Panel A Main effects of treatment, genotype and sex, panels B – D Interactions between treatment and genotype, treatment and sex and genotype and sex respectively. Panel E shows 3-way interactions between treatment, genotype and sex. No significant effect was observed.
Ph.D. Thesis 2012 Alan Carter
133
In the kidney and liver tissues there were no significant three- or two-way
interactions. In the kidney there was a significant difference observed
between vehicle treated and LPS treated mouse tissues as vehicle treated
animals (2.22 ±0.02 nmol/mg protein) have lower MDA levels than LPS
treated animals (3.12 ±0.37 nmol/mg protein; Figure 5.13A; p=0.03).
There were no significant interactions or differences observed in MDA
levels in ileum tissues (Figure 5.14).
5.2.4. Glutathione levels in LPS challenged NEIL1-/- mice
The GSH levels in various tissues of male and female WT and OGG1 KO
mice following treatment with a vehicle or LPS are shown in Table 5.3.
Figures 5.15 – 5.19 present GSH levels in the heart, lung, liver, kidney and
ileum respectively. Panel A of these figures shows the main effects
comparing treatment (vehicle vs. LPS), genotype (WT vs. NEIL1 KO) and
sex (male vs. female). Panels B - D show the interactions of (B) treatment
and genotype, (C) treatment and sex and (D) genotype and sex. Panel F
shows the three-way interaction between treatment, genotype and sex.
There were no three-way interactions observed in the results for any
tissue. There was a genotype x sex interaction in the heart. Whilst GSH
levels were lower in NEIL-/- animals than NEIL1+/+ animals there was a
greater reduction in the female animals (0.6 fold) than the males (0.8
fold; Figure 5.15D; p<0.01). There was also a decrease in GSH levels
observed due to treatment, with vehicle treated mice (0.34 ±0.03
nmol/mg protein) having greater GSH levels than LPS treated mice (0.27
±0.04 nmol/mg protein; Figure 5.15A; p=0.01).
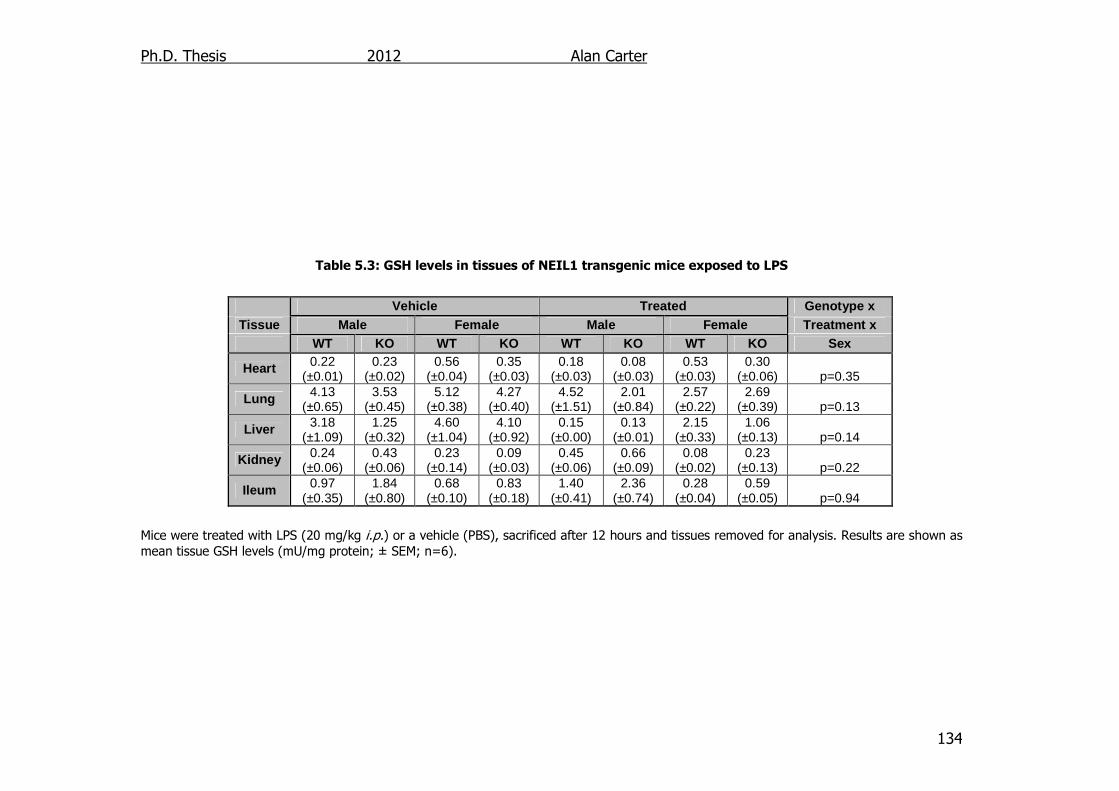
Ph.D. Thesis 2012 Alan Carter
134
Table 5.3: GSH levels in tissues of NEIL1 transgenic mice exposed to LPS
Mice were treated with LPS (20 mg/kg i.p.) or a vehicle (PBS), sacrificed after 12 hours and tissues removed for analysis. Results are shown as mean tissue GSH levels (mU/mg protein; ± SEM; n=6).
Vehicle Treated Genotype x Tissue Male Female Male Female Treatment x
WT KO WT KO WT KO WT KO Sex
Heart 0.22 (±0.01)
0.23 (±0.02)
0.56 (±0.04)
0.35 (±0.03)
0.18 (±0.03)
0.08 (±0.03)
0.53 (±0.03)
0.30 (±0.06) p=0.35
Lung 4.13 (±0.65)
3.53 (±0.45)
5.12 (±0.38)
4.27 (±0.40)
4.52 (±1.51)
2.01 (±0.84)
2.57 (±0.22)
2.69 (±0.39) p=0.13
Liver 3.18 (±1.09)
1.25 (±0.32)
4.60 (±1.04)
4.10 (±0.92)
0.15 (±0.00)
0.13 (±0.01)
2.15 (±0.33)
1.06 (±0.13) p=0.14
Kidney 0.24 (±0.06)
0.43 (±0.06)
0.23 (±0.14)
0.09 (±0.03)
0.45 (±0.06)
0.66 (±0.09)
0.08 (±0.02)
0.23 (±0.13) p=0.22
Ileum 0.97 (±0.35)
1.84 (±0.80)
0.68 (±0.10)
0.83 (±0.18)
1.40 (±0.41)
2.36 (±0.74)
0.28 (±0.04)
0.59 (±0.05) p=0.94
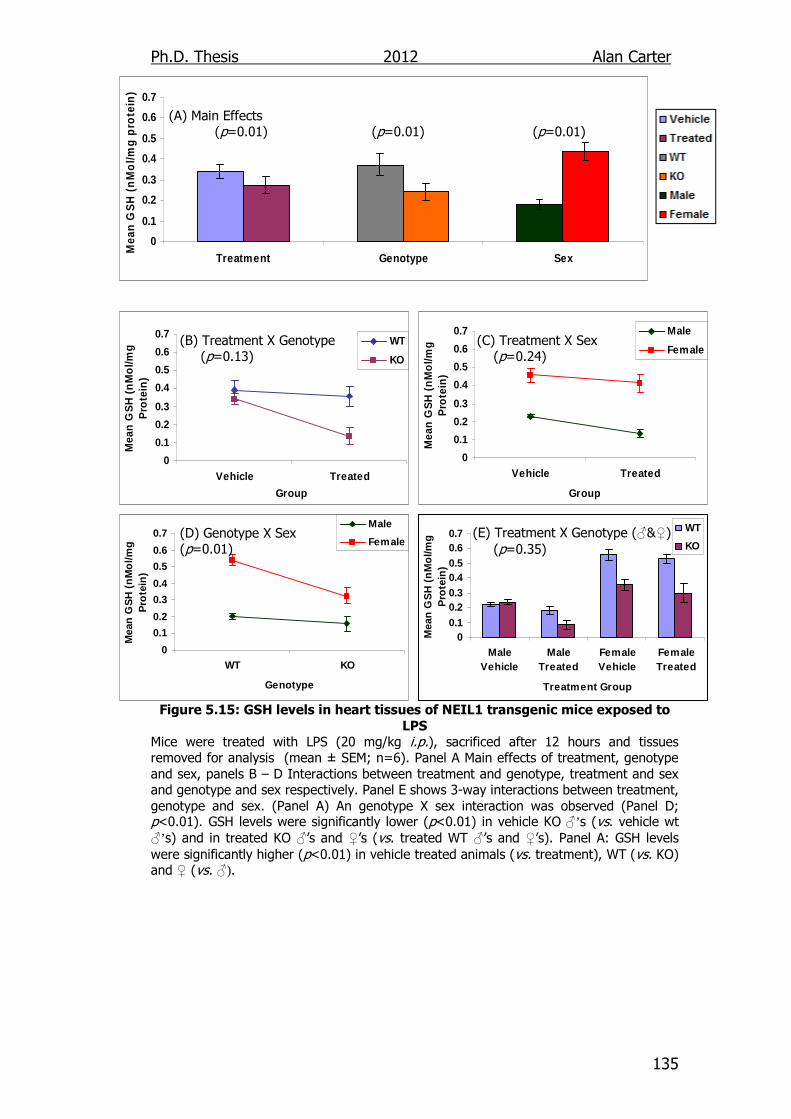
Ph.D. Thesis 2012 Alan Carter
135
0
0.1
0.2
0.3
0.4
0.5
0.6
0.7
WT KO
Genotype
Mea
n G
SH
(n
Mo
l/mg
P
rote
in)
Male
Female
00.10.20.30.40.50.60.7
MaleVehicle
MaleTreated
FemaleVehicle
FemaleTreated
Treatment Group
Mea
n G
SH
(n
Mo
l/mg
P
rote
in)
WT
KO
0
0.1
0.2
0.3
0.4
0.5
0.6
0.7
Treatment Genotype Sex
Mea
n G
SH
(n
Mo
l/mg
pro
tein
)
0
0.1
0.2
0.3
0.4
0.5
0.6
0.7
Vehicle Treated
Group
Mea
n G
SH
(n
Mo
l/mg
P
rote
in)
WT
KO
0
0.1
0.2
0.3
0.4
0.5
0.6
0.7
Vehicle Treated
Group
Mea
n G
SH
(n
Mo
l/mg
P
rote
in)
Male
Female
(A) Main Effects (p=0.01) (p=0.01) (p=0.01)
(B) Treatment X Genotype (p=0.13) (D) Genotype X Sex (p=0.01)
(C) Treatment X Sex (p=0.24) (E) Treatment X Genotype (♂&♀) (p=0.35)
Figure 5.15: GSH levels in heart tissues of NEIL1 transgenic mice exposed to
LPS Mice were treated with LPS (20 mg/kg i.p.), sacrificed after 12 hours and tissues removed for analysis (mean ± SEM; n=6). Panel A Main effects of treatment, genotype and sex, panels B – D Interactions between treatment and genotype, treatment and sex and genotype and sex respectively. Panel E shows 3-way interactions between treatment, genotype and sex. (Panel A) An genotype X sex interaction was observed (Panel D; p<0.01). GSH levels were significantly lower (p<0.01) in vehicle KO ♂’s (vs. vehicle wt ♂’s) and in treated KO ♂’s and ♀’s (vs. treated WT ♂’s and ♀’s). Panel A: GSH levels were significantly higher (p<0.01) in vehicle treated animals (vs. treatment), WT (vs. KO) and ♀ (vs. ♂).
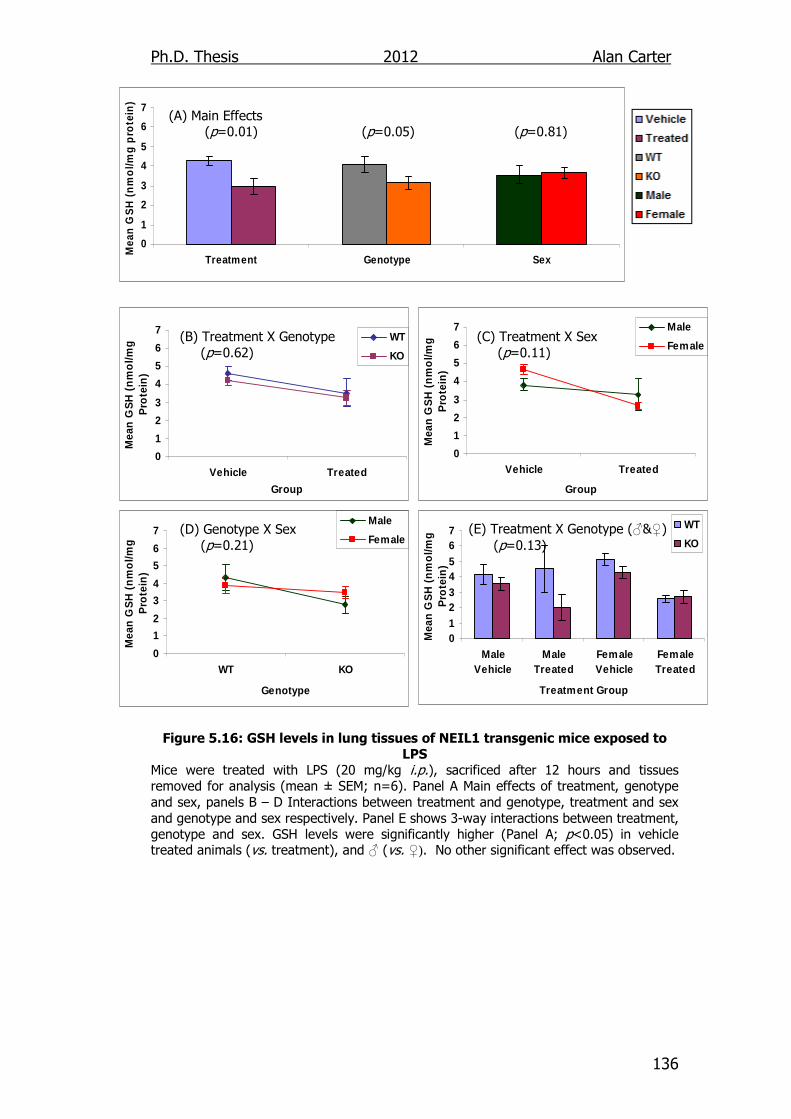
Ph.D. Thesis 2012 Alan Carter
136
0
1
2
3
4
5
6
7
Treatment Genotype Sex
Mea
n G
SH
(n
mo
l/mg
pro
tein
)
0
1
2
3
4
5
6
7
Vehicle Treated
Group
Mea
n G
SH
(n
mo
l/mg
P
rote
in)
WT
KO
0
1
2
3
4
5
6
7
Vehicle Treated
Group
Mea
n G
SH
(n
mo
l/mg
P
rote
in)
Male
Female
0
1
2
3
4
5
6
7
WT KO
Genotype
Mea
n G
SH
(n
mo
l/mg
P
rote
in)
Male
Female
01234567
MaleVehicle
MaleTreated
FemaleVehicle
FemaleTreated
Treatment Group
Mea
n G
SH
(n
mo
l/mg
P
rote
in)
WT
KO
(A) Main Effects (p=0.01) (p=0.05) (p=0.81)
(B) Treatment X Genotype (p=0.62) (D) Genotype X Sex (p=0.21)
(C) Treatment X Sex (p=0.11) (E) Treatment X Genotype (♂&♀) (p=0.13)
Figure 5.16: GSH levels in lung tissues of NEIL1 transgenic mice exposed to LPS
Mice were treated with LPS (20 mg/kg i.p.), sacrificed after 12 hours and tissues removed for analysis (mean ± SEM; n=6). Panel A Main effects of treatment, genotype and sex, panels B – D Interactions between treatment and genotype, treatment and sex and genotype and sex respectively. Panel E shows 3-way interactions between treatment, genotype and sex. GSH levels were significantly higher (Panel A; p<0.05) in vehicle treated animals (vs. treatment), and ♂ (vs. ♀). No other significant effect was observed.
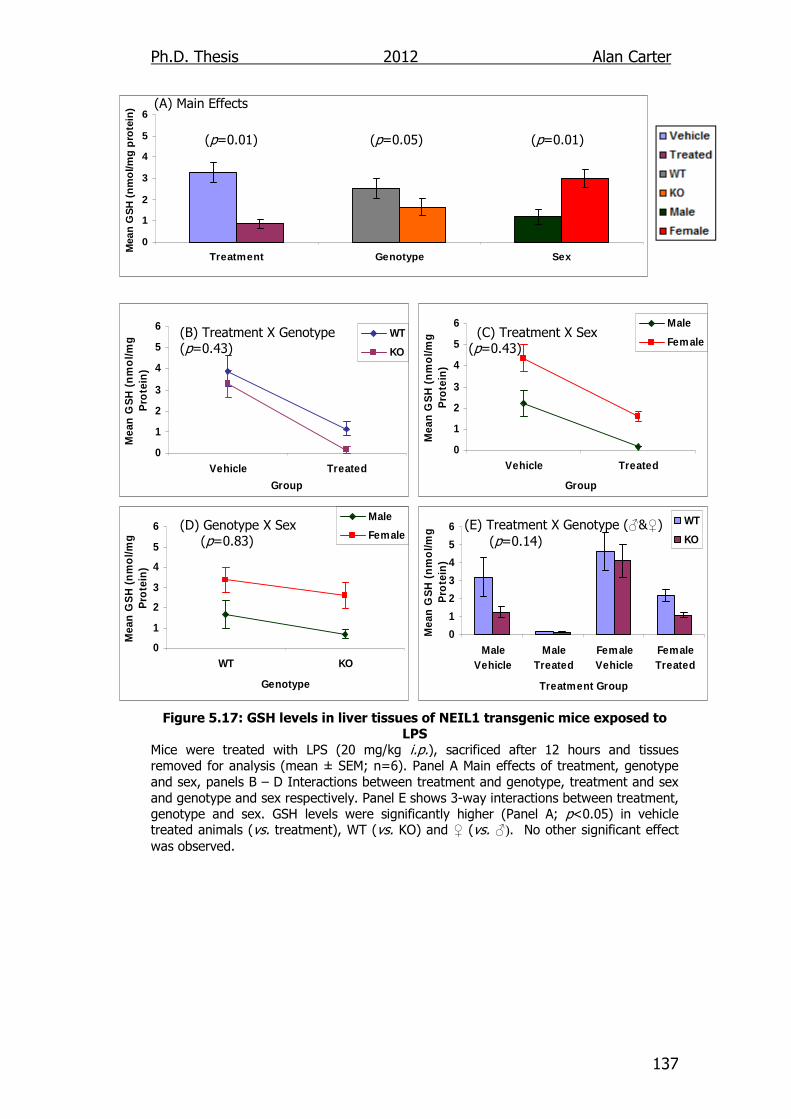
Ph.D. Thesis 2012 Alan Carter
137
0
1
2
3
4
5
6
Treatment Genotype Sex
Mea
n G
SH
(n
mo
l/mg
pro
tein
)
0
1
2
3
4
5
6
Vehicle Treated
Group
Mea
n G
SH
(n
mo
l/mg
P
rote
in)
WT
KO
0
1
2
3
4
5
6
Vehicle Treated
Group
Mea
n G
SH
(n
mo
l/mg
P
rote
in)
Male
Female
0
1
2
3
4
5
6
WT KO
Genotype
Mea
n G
SH
(n
mo
l/mg
P
rote
in)
Male
Female
0
1
2
3
4
5
6
MaleVehicle
MaleTreated
FemaleVehicle
FemaleTreated
Treatment Group
Mea
n G
SH
(n
mo
l/mg
P
rote
in)
WT
KO
(A) Main Effects
(p=0.01) (p=0.05) (p=0.01)
(B) Treatment X Genotype (p=0.43) (D) Genotype X Sex (p=0.83)
(C) Treatment X Sex (p=0.43) (E) Treatment X Genotype (♂&♀) (p=0.14)
Figure 5.17: GSH levels in liver tissues of NEIL1 transgenic mice exposed to LPS
Mice were treated with LPS (20 mg/kg i.p.), sacrificed after 12 hours and tissues removed for analysis (mean ± SEM; n=6). Panel A Main effects of treatment, genotype and sex, panels B – D Interactions between treatment and genotype, treatment and sex and genotype and sex respectively. Panel E shows 3-way interactions between treatment, genotype and sex. GSH levels were significantly higher (Panel A; p<0.05) in vehicle treated animals (vs. treatment), WT (vs. KO) and ♀ (vs. ♂). No other significant effect was observed.
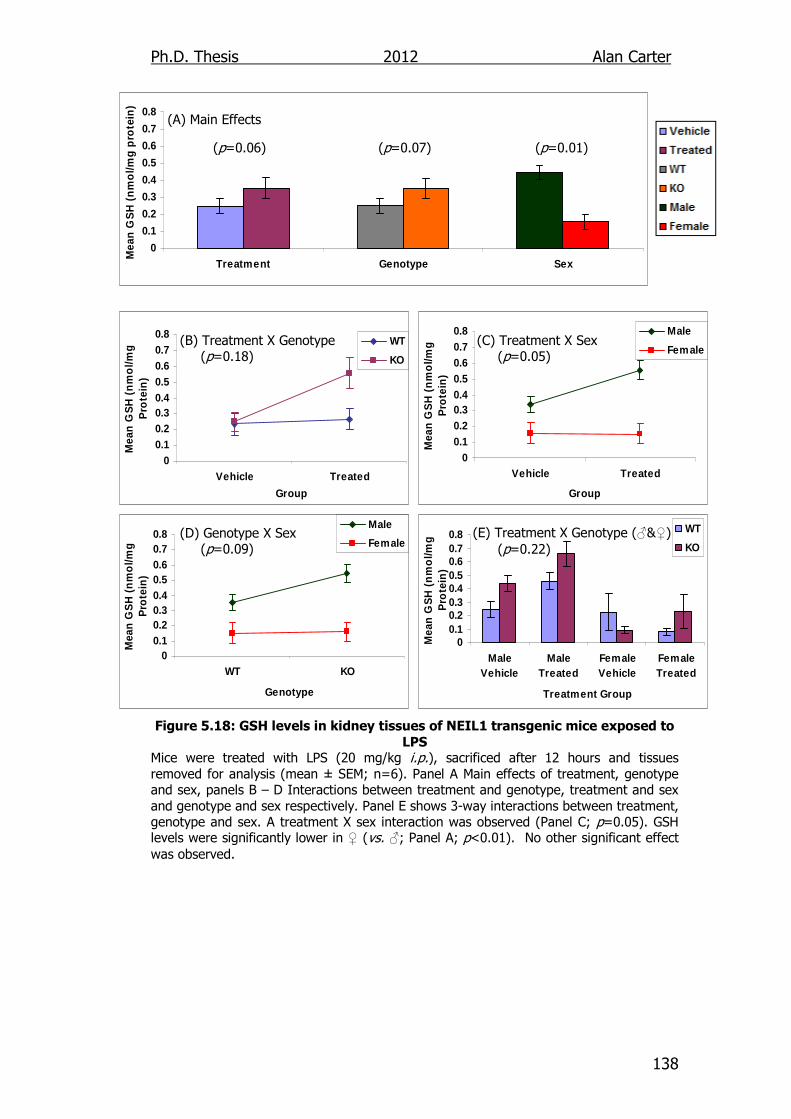
Ph.D. Thesis 2012 Alan Carter
138
0
0.1
0.2
0.3
0.4
0.5
0.6
0.7
0.8
Treatment Genotype Sex
Mea
n G
SH
(n
mo
l/mg
pro
tein
)
00.10.20.30.40.50.60.70.8
Vehicle Treated
Group
Mea
n G
SH
(n
mo
l/mg
P
rote
in)
WT
KO
00.10.20.30.40.50.60.70.8
Vehicle Treated
Group
Mea
n G
SH
(n
mo
l/mg
P
rote
in)
Male
Female
00.10.20.30.40.50.60.70.8
WT KO
Genotype
Mea
n G
SH
(n
mo
l/mg
P
rote
in)
Male
Female
00.10.20.30.40.50.60.70.8
MaleVehicle
MaleTreated
FemaleVehicle
FemaleTreated
Treatment Group
Mea
n G
SH
(n
mo
l/mg
P
rote
in)
WT
KO
(A) Main Effects
(p=0.06) (p=0.07) (p=0.01)
(B) Treatment X Genotype (p=0.18) (D) Genotype X Sex (p=0.09)
(C) Treatment X Sex (p=0.05) (E) Treatment X Genotype (♂&♀) (p=0.22)
Figure 5.18: GSH levels in kidney tissues of NEIL1 transgenic mice exposed to
LPS Mice were treated with LPS (20 mg/kg i.p.), sacrificed after 12 hours and tissues removed for analysis (mean ± SEM; n=6). Panel A Main effects of treatment, genotype and sex, panels B – D Interactions between treatment and genotype, treatment and sex and genotype and sex respectively. Panel E shows 3-way interactions between treatment, genotype and sex. A treatment X sex interaction was observed (Panel C; p=0.05). GSH levels were significantly lower in ♀ (vs. ♂; Panel A; p<0.01). No other significant effect was observed.
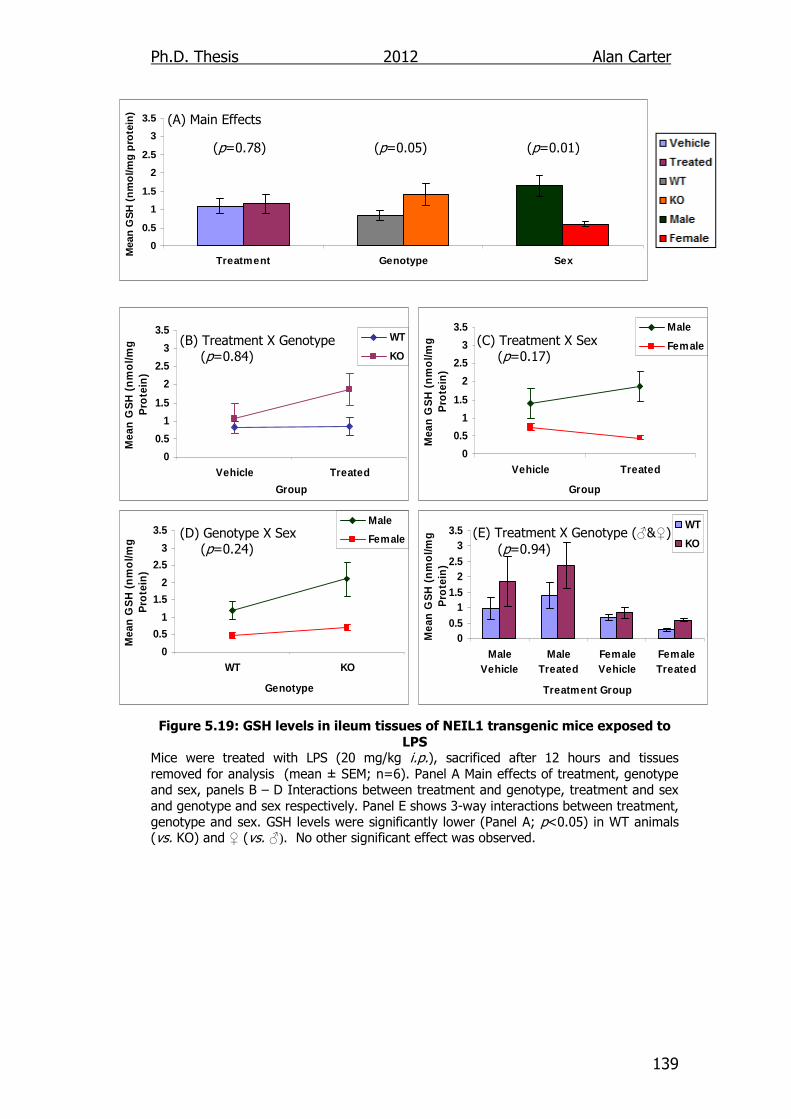
Ph.D. Thesis 2012 Alan Carter
139
0
0.5
1
1.5
2
2.5
3
3.5
Treatment Genotype Sex
Mea
n G
SH
(n
mo
l/mg
pro
tein
)
0
0.5
1
1.5
2
2.5
3
3.5
Vehicle Treated
Group
Mea
n G
SH
(n
mo
l/mg
P
rote
in)
WT
KO
0
0.5
1
1.5
2
2.5
3
3.5
Vehicle Treated
Group
Mea
n G
SH
(n
mo
l/mg
P
rote
in)
Male
Female
0
0.5
1
1.5
2
2.5
3
3.5
WT KO
Genotype
Mea
n G
SH
(n
mo
l/mg
P
rote
in)
Male
Female
00.5
11.5
22.5
33.5
MaleVehicle
MaleTreated
FemaleVehicle
FemaleTreated
Treatment Group
Mea
n G
SH
(n
mo
l/mg
P
rote
in)
WT
KO
(A) Main Effects
(p=0.78) (p=0.05) (p=0.01)
(B) Treatment X Genotype (p=0.84) (D) Genotype X Sex (p=0.24)
(C) Treatment X Sex (p=0.17) (E) Treatment X Genotype (♂&♀) (p=0.94)
Figure 5.19: GSH levels in ileum tissues of NEIL1 transgenic mice exposed to
LPS Mice were treated with LPS (20 mg/kg i.p.), sacrificed after 12 hours and tissues removed for analysis (mean ± SEM; n=6). Panel A Main effects of treatment, genotype and sex, panels B – D Interactions between treatment and genotype, treatment and sex and genotype and sex respectively. Panel E shows 3-way interactions between treatment, genotype and sex. GSH levels were significantly lower (Panel A; p<0.05) in WT animals (vs. KO) and ♀ (vs. ♂). No other significant effect was observed.
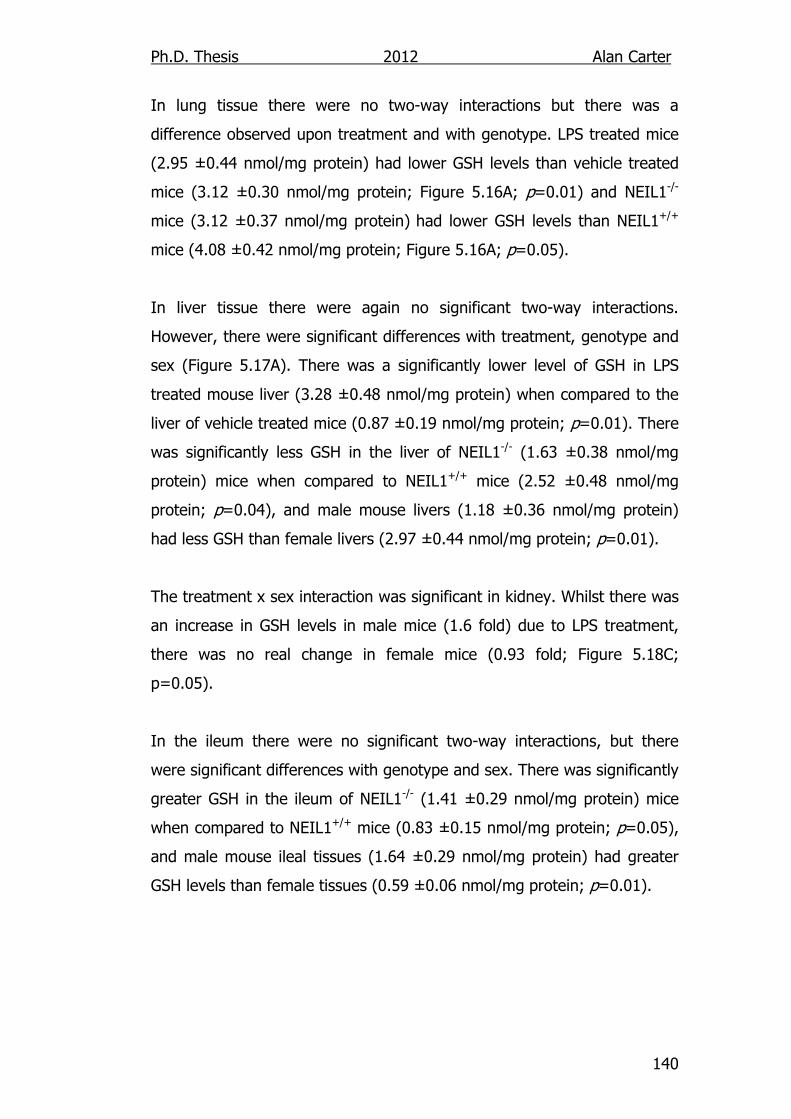
Ph.D. Thesis 2012 Alan Carter
140
In lung tissue there were no two-way interactions but there was a
difference observed upon treatment and with genotype. LPS treated mice
(2.95 ±0.44 nmol/mg protein) had lower GSH levels than vehicle treated
mice (3.12 ±0.30 nmol/mg protein; Figure 5.16A; p=0.01) and NEIL1-/-
mice (3.12 ±0.37 nmol/mg protein) had lower GSH levels than NEIL1+/+
mice (4.08 ±0.42 nmol/mg protein; Figure 5.16A; p=0.05).
In liver tissue there were again no significant two-way interactions.
However, there were significant differences with treatment, genotype and
sex (Figure 5.17A). There was a significantly lower level of GSH in LPS
treated mouse liver (3.28 ±0.48 nmol/mg protein) when compared to the
liver of vehicle treated mice (0.87 ±0.19 nmol/mg protein; p=0.01). There
was significantly less GSH in the liver of NEIL1-/- (1.63 ±0.38 nmol/mg
protein) mice when compared to NEIL1+/+ mice (2.52 ±0.48 nmol/mg
protein; p=0.04), and male mouse livers (1.18 ±0.36 nmol/mg protein)
had less GSH than female livers (2.97 ±0.44 nmol/mg protein; p=0.01).
The treatment x sex interaction was significant in kidney. Whilst there was
an increase in GSH levels in male mice (1.6 fold) due to LPS treatment,
there was no real change in female mice (0.93 fold; Figure 5.18C;
p=0.05).
In the ileum there were no significant two-way interactions, but there
were significant differences with genotype and sex. There was significantly
greater GSH in the ileum of NEIL1-/- (1.41 ±0.29 nmol/mg protein) mice
when compared to NEIL1+/+ mice (0.83 ±0.15 nmol/mg protein; p=0.05),
and male mouse ileal tissues (1.64 ±0.29 nmol/mg protein) had greater
GSH levels than female tissues (0.59 ±0.06 nmol/mg protein; p=0.01).
Ph.D. Thesis 2012 Alan Carter
141
5.2.5. Age related cytokine output NEIL1-/- mice
Figures 5.20 – 5.23 detail IL concentrations in mouse blood of animals
sacrificed at 6-8 weeks and 12 months. Panel A shows the age x genotype x
sex interaction, panels B – D detail age x genotype, age x sex and genotype x
sex interactions respectively and panel E shows the main effects.
There were no significant differences observed in IL-4 concentrations although
there was evidence of a significant effect in the sex x age interaction as female
mouse IL-4 levels increased with age (2.20 fold), whilst male IL-4 levels
decreased slightly (0.78 fold; p=0.07).
There was no evidence of an age x genotype x sex interaction in Il-6 levels.
The genotype x age interaction was significant in that whilst the blood IL-6
concentration was similar at 12 months, it was significantly higher at 6-8
weeks in WT mice (28.14 ± 7.54 pg/ml) than NEIL1 KO mice (15.88 ± 9.78
pg/ml), meaning that the reduction due to age was considerably greater in WT
mice (p>0.01). There is a significant genotype x sex interaction observed in
IL-10 levels as whilst IL-10 levels reduced due to disruption of the NEIL1 gene
in female mice (0.54 fold) levels it actually increased in male mice (1.73 fold;
p=0.02). There were no significant differences in IL-12 concentration.
5.3. Discussion
Previous work has identified several BER related genes that are associated
with modulating the inflammatory response (Ando et al., 2008; Mabley et al.,
2005a; Touati et al., 2006; Virag and Szabo 2002). Here we show that the
disruption of the NEIL1 gene reduces initial IL-6 production, but levels of pro-
and anti-inflammatory cytokines indicate an overall increase
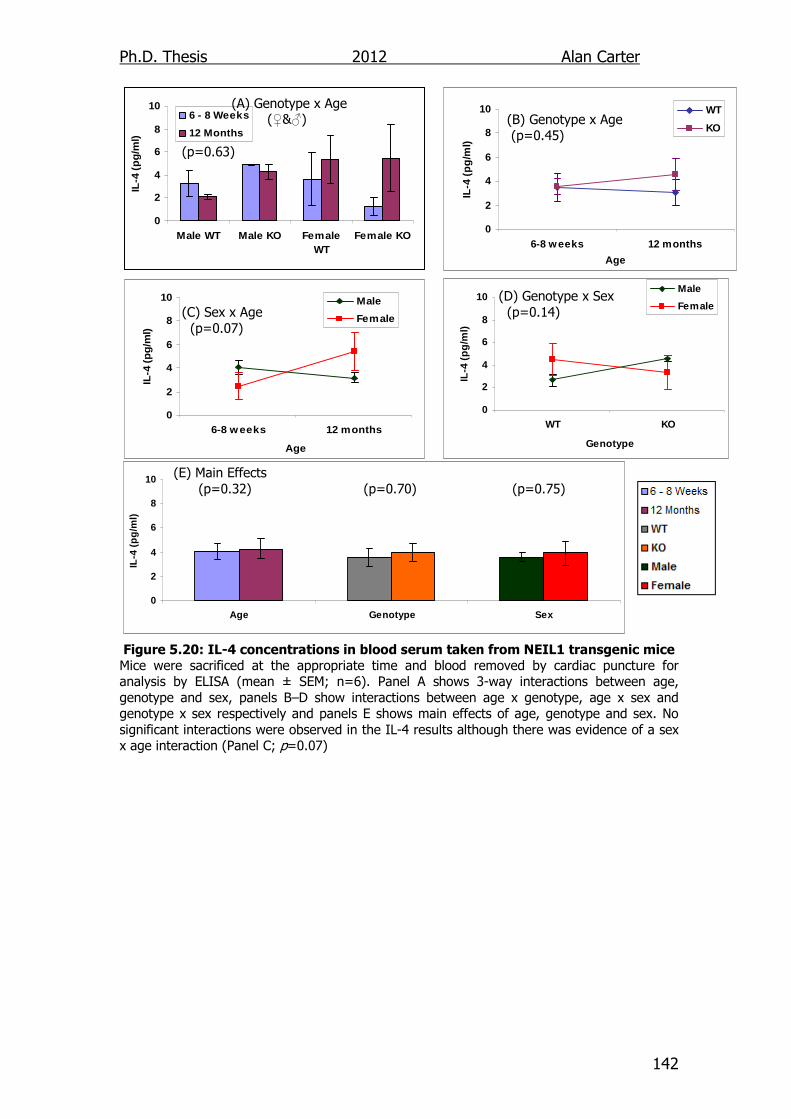
Ph.D. Thesis 2012 Alan Carter
142
0
2
4
6
8
10
Age Genotype Sex
IL-4
(p
g/m
l)
0
2
4
6
8
10
6-8 w eeks 12 months
Age
IL-4
(p
g/m
l)
WT
KO
0
2
4
6
8
10
6-8 w eeks 12 months
Age
IL-4
(p
g/m
l)
Male
Female
0
2
4
6
8
10
WT KO
Genotype
IL-4
(p
g/m
l)
Male
Female
0
2
4
6
8
10
Male WT Male KO FemaleWT
Female KO
IL-4
(p
g/m
l)
6 - 8 Weeks
12 Months
(A) Genotype x Age (♀&♂) (p=0.63) (C) Sex x Age (p=0.07)
(B) Genotype x Age (p=0.45) (D) Genotype x Sex (p=0.14)
(E) Main Effects (p=0.32) (p=0.70) (p=0.75)
Figure 5.20: IL-4 concentrations in blood serum taken from NEIL1 transgenic mice Mice were sacrificed at the appropriate time and blood removed by cardiac puncture for analysis by ELISA (mean ± SEM; n=6). Panel A shows 3-way interactions between age, genotype and sex, panels B–D show interactions between age x genotype, age x sex and genotype x sex respectively and panels E shows main effects of age, genotype and sex. No significant interactions were observed in the IL-4 results although there was evidence of a sex x age interaction (Panel C; p=0.07)
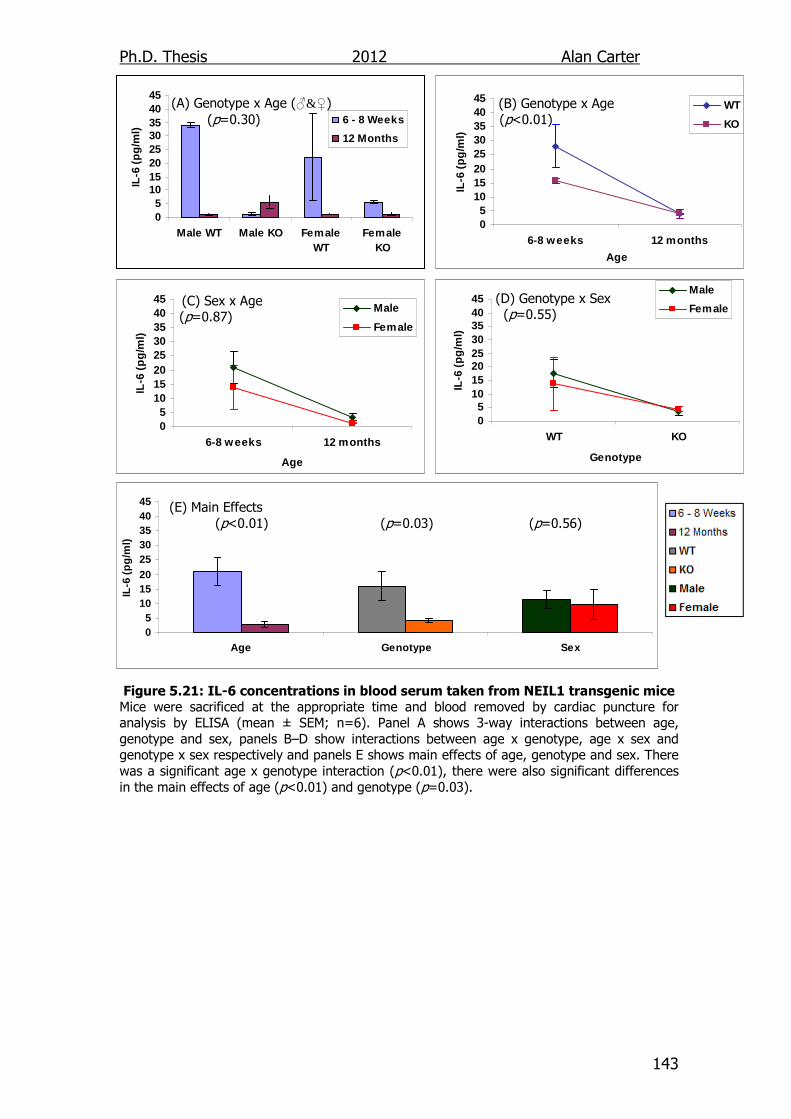
Ph.D. Thesis 2012 Alan Carter
143
05
1015202530354045
Age Genotype Sex
IL-6
(p
g/m
l)
05
1015202530354045
Male WT Male KO FemaleWT
FemaleKO
IL-6
(p
g/m
l)6 - 8 Weeks
12 Months
05
1015202530354045
6-8 weeks 12 months
Age
IL-6
(p
g/m
l)
WT
KO
05
1015202530354045
6-8 weeks 12 months
Age
IL-6
(p
g/m
l)
Male
Female
05
1015202530354045
WT KO
GenotypeIL
-6 (
pg
/ml)
Male
Female
(A) Genotype x Age (♂&♀) (p=0.30) (C) Sex x Age (p=0.87)
(B) Genotype x Age (p<0.01)
(D) Genotype x Sex (p=0.55)
(E) Main Effects (p<0.01) (p=0.03) (p=0.56)
Figure 5.21: IL-6 concentrations in blood serum taken from NEIL1 transgenic mice Mice were sacrificed at the appropriate time and blood removed by cardiac puncture for analysis by ELISA (mean ± SEM; n=6). Panel A shows 3-way interactions between age, genotype and sex, panels B–D show interactions between age x genotype, age x sex and genotype x sex respectively and panels E shows main effects of age, genotype and sex. There was a significant age x genotype interaction (p<0.01), there were also significant differences in the main effects of age (p<0.01) and genotype (p=0.03).
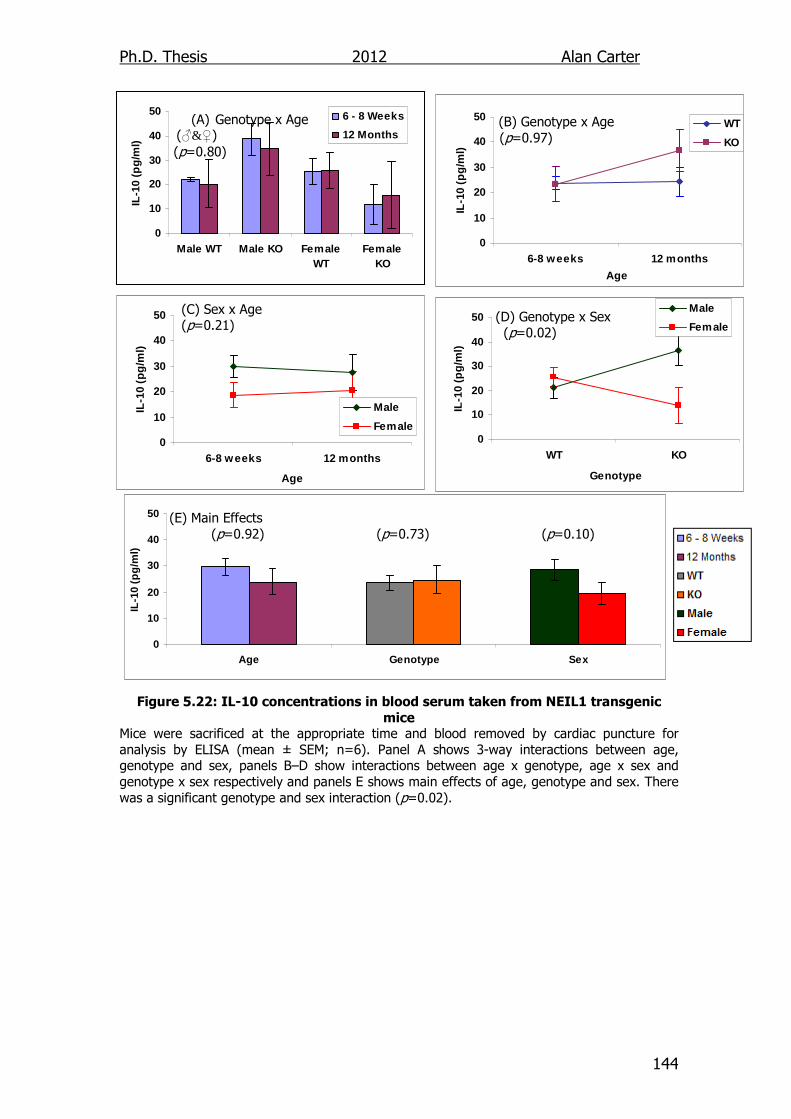
Ph.D. Thesis 2012 Alan Carter
144
0
10
20
30
40
50
Male WT Male KO FemaleWT
FemaleKO
IL-1
0 (p
g/m
l)
6 - 8 Weeks
12 Months
0
10
20
30
40
50
Age Genotype Sex
IL-1
0 (p
g/m
l)
0
10
20
30
40
50
6-8 weeks 12 months
Age
IL-1
0 (p
g/m
l)
WT
KO
0
10
20
30
40
50
6-8 weeks 12 months
Age
IL-1
0 (p
g/m
l)
Male
Female0
10
20
30
40
50
WT KO
Genotype
IL-1
0 (p
g/m
l)
Male
Female
(A) Genotype x Age
(♂&♀) (p=0.80)
(C) Sex x Age (p=0.21)
(B) Genotype x Age (p=0.97)
(D) Genotype x Sex (p=0.02)
(E) Main Effects (p=0.92) (p=0.73) (p=0.10)
Figure 5.22: IL-10 concentrations in blood serum taken from NEIL1 transgenic
mice Mice were sacrificed at the appropriate time and blood removed by cardiac puncture for analysis by ELISA (mean ± SEM; n=6). Panel A shows 3-way interactions between age, genotype and sex, panels B–D show interactions between age x genotype, age x sex and genotype x sex respectively and panels E shows main effects of age, genotype and sex. There was a significant genotype and sex interaction (p=0.02).
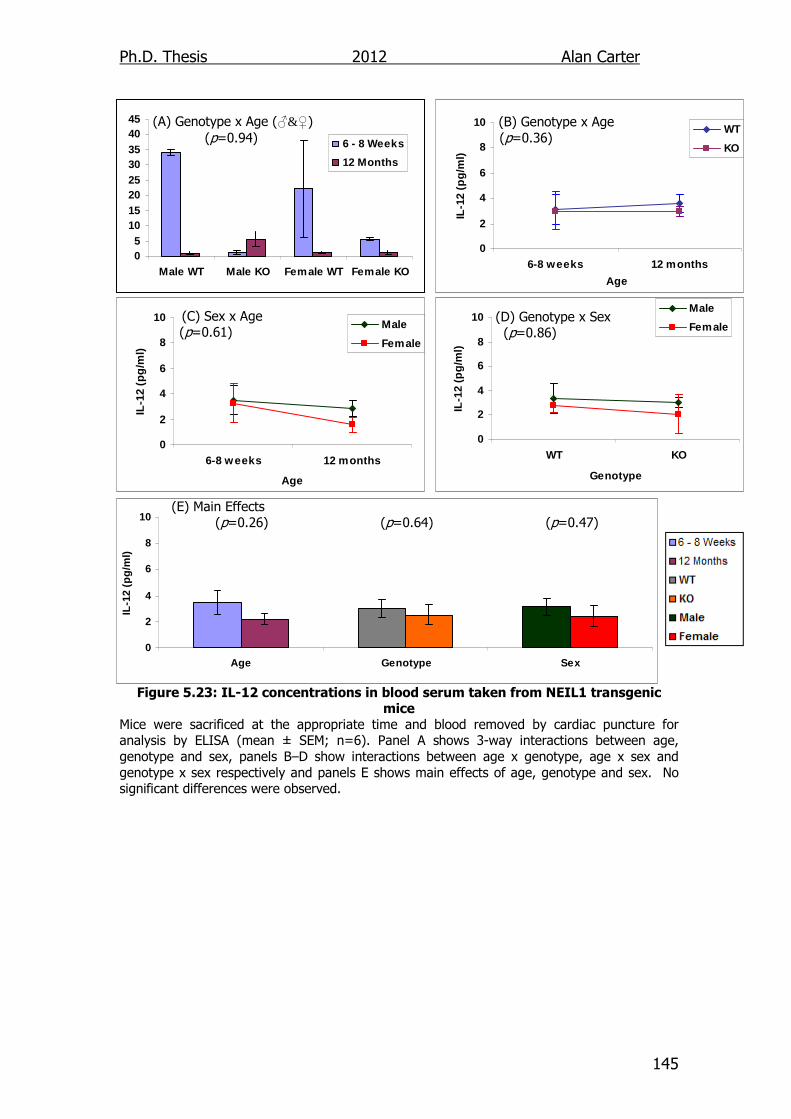
Ph.D. Thesis 2012 Alan Carter
145
05
1015202530354045
Male WT Male KO Female WT Female KO
6 - 8 Weeks
12 Months
0
2
4
6
8
10
Age Genotype Sex
IL-1
2 (p
g/m
l)
0
2
4
6
8
10
6-8 weeks 12 months
Age
IL-1
2 (p
g/m
l)
WT
KO
0
2
4
6
8
10
6-8 weeks 12 months
Age
IL-1
2 (p
g/m
l)
Male
Female
0
2
4
6
8
10
WT KO
Genotype
IL-1
2 (p
g/m
l)
Male
Female
(A) Genotype x Age (♂&♀) (p=0.94) (C) Sex x Age (p=0.61)
(B) Genotype x Age (p=0.36)
(D) Genotype x Sex (p=0.86)
(E) Main Effects (p=0.26) (p=0.64) (p=0.47)
Figure 5.23: IL-12 concentrations in blood serum taken from NEIL1 transgenic mice
Mice were sacrificed at the appropriate time and blood removed by cardiac puncture for analysis by ELISA (mean ± SEM; n=6). Panel A shows 3-way interactions between age, genotype and sex, panels B–D show interactions between age x genotype, age x sex and genotype x sex respectively and panels E shows main effects of age, genotype and sex. No significant differences were observed.
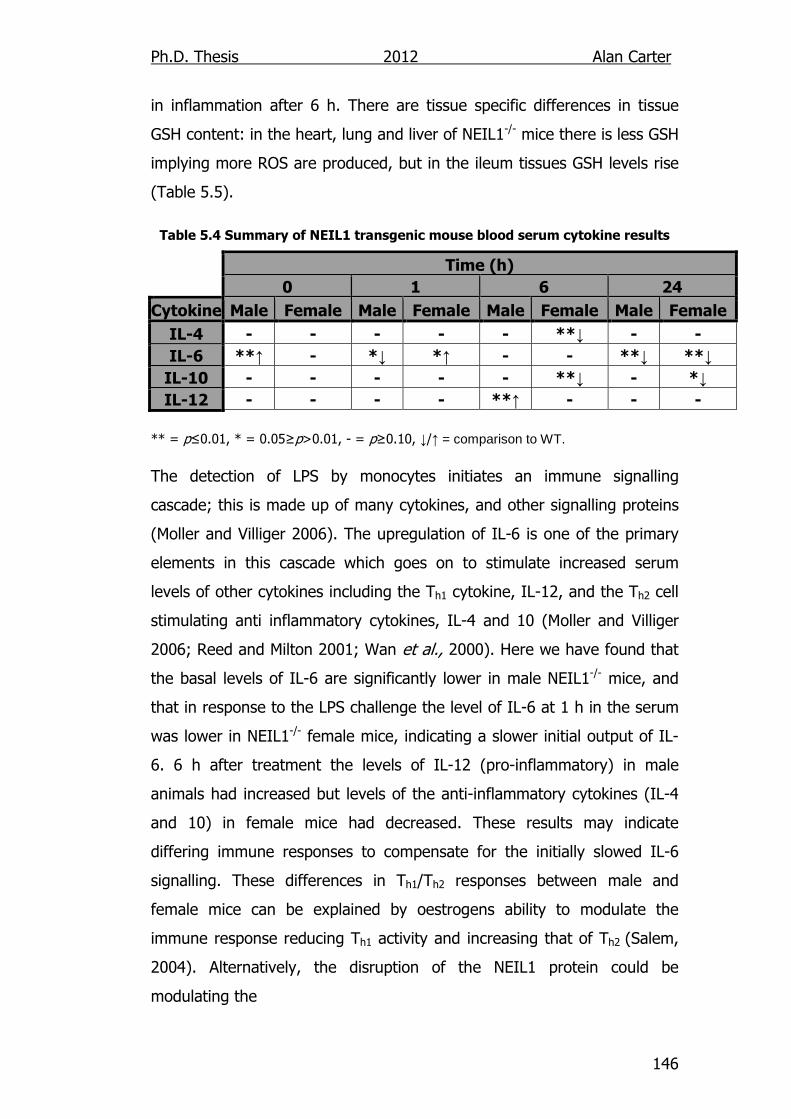
Ph.D. Thesis 2012 Alan Carter
146
in inflammation after 6 h. There are tissue specific differences in tissue
GSH content: in the heart, lung and liver of NEIL1-/- mice there is less GSH
implying more ROS are produced, but in the ileum tissues GSH levels rise
(Table 5.5).
Table 5.4 Summary of NEIL1 transgenic mouse blood serum cytokine results
** = p≤0.01, * = 0.05≥p>0.01, - = p≥0.10, ↓/↑ = comparison to WT. The detection of LPS by monocytes initiates an immune signalling
cascade; this is made up of many cytokines, and other signalling proteins
(Moller and Villiger 2006). The upregulation of IL-6 is one of the primary
elements in this cascade which goes on to stimulate increased serum
levels of other cytokines including the Th1 cytokine, IL-12, and the Th2 cell
stimulating anti inflammatory cytokines, IL-4 and 10 (Moller and Villiger
2006; Reed and Milton 2001; Wan et al., 2000). Here we have found that
the basal levels of IL-6 are significantly lower in male NEIL1-/- mice, and
that in response to the LPS challenge the level of IL-6 at 1 h in the serum
was lower in NEIL1-/- female mice, indicating a slower initial output of IL-
6. 6 h after treatment the levels of IL-12 (pro-inflammatory) in male
animals had increased but levels of the anti-inflammatory cytokines (IL-4
and 10) in female mice had decreased. These results may indicate
differing immune responses to compensate for the initially slowed IL-6
signalling. These differences in Th1/Th2 responses between male and
female mice can be explained by oestrogens ability to modulate the
immune response reducing Th1 activity and increasing that of Th2 (Salem,
2004). Alternatively, the disruption of the NEIL1 protein could be
modulating the
Time (h)
0 1 6 24
Cytokine Male Female Male Female Male Female Male Female
IL-4 - - - - - **↓ - -
IL-6 **↑ - *↓ *↑ - - **↓ **↓
IL-10 - - - - - **↓ - *↓
IL-12 - - - - **↑ - - -
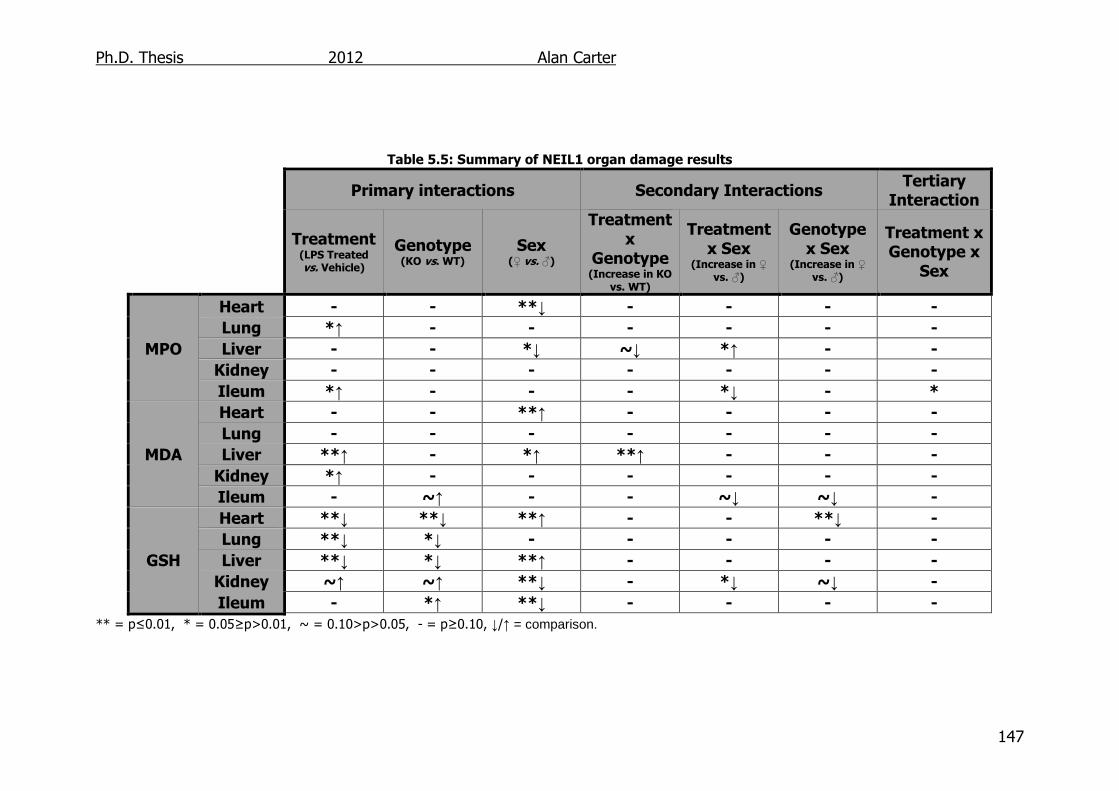
Ph.D. Thesis 2012 Alan Carter
147
Table 5.5: Summary of NEIL1 organ damage results
** = p≤0.01, * = 0.05≥p>0.01, ~ = 0.10>p>0.05, - = p≥0.10, ↓/↑ = comparison.
Primary interactions Secondary Interactions Tertiary
Interaction
Treatment (LPS Treated vs. Vehicle)
Genotype (KO vs. WT)
Sex (♀ vs. ♂)
Treatment x
Genotype (Increase in KO
vs. WT)
Treatment x Sex
(Increase in ♀ vs. ♂)
Genotype x Sex
(Increase in ♀ vs. ♂)
Treatment x Genotype x
Sex
MPO
Heart - - **↓ - - - -
Lung *↑ - - - - - -
Liver - - *↓ ~↓ *↑ - -
Kidney - - - - - - -
Ileum *↑ - - - *↓ - *
MDA
Heart - - **↑ - - - -
Lung - - - - - - -
Liver **↑ - *↑ **↑ - - -
Kidney *↑ - - - - - -
Ileum - ~↑ - - ~↓ ~↓ -
GSH
Heart **↓ **↓ **↑ - - **↓ -
Lung **↓ *↓ - - - - -
Liver **↓ *↓ **↑ - - - -
Kidney ~↑ ~↑ **↓ - *↓ ~↓ -
Ileum - *↑ **↓ - - - -
Ph.D. Thesis 2012 Alan Carter
148
activation of transcription factors such as NF-κβ and AP-1,
maybe via. PARP1 or APE1. In order to discern if this is the case
electrophoretic mobility-shift assays could be performed using cell extracts
from cultured cells (Abdel-Latif et al., 2004).
The chemoattractants such as MIP-1α released as part of this signaling
cascade induce leukocytes, in particular neutrophils, to the area of
invasion. These cells produce an array of bactericidal compounds,
including ROS and RNS. These oxidizing compounds are produced via. a
network of enzymes including superoxide dismutase (SOD) and
myeloperoxidase (MPO), the activity of which can be measured as an
indication of neutrophil infiltration. In mice treated with LPS (80 mg/kg
i.p.) a significant increase in MPO activity can be measured after 4 h and
this activity continues to increase up to 24 h (Kabir et al., 2002; Yamashita
et al., 2000). In the case of these NEIL1-/- mice there was no significant
difference in MPO levels compared to NEIL1+/+ mice, this indicated a
reduced chemoattractant activity as suggested in the results from the
NEIL1-/- cells (section 4.2).
ROS produced by neutrophils, of course, are not specifically bactericidal
and a build up of these compounds can cause cellular damage. One
measure of this damage is MDA levels. Previous studies have shown that
when mice are treated with LPS the MDA concentrations in the liver,
kidney, lung, gut and heart tissues are raised significantly, although not
significantly so in brain tissue (Mabley et al., 2005a; Sebai et al.,
2010)accumulation of ROS within the system, which are then neutralised
via the GSH pathway. Interestingly there have been cases observed when
the immune response has shown markers of oxidative damage to increase
without an increase in neutrophil aggregation, in these cases it is thought
to be due to an increase in NO secondary messengers released as part of
inflammation (Pheng et al., 1995).
Ph.D. Thesis 2012 Alan Carter
149
Raised levels of NO have been shown to increase the creation of Tg in
replicated DNA significantly. TG can block the progress of repair or
replicative DNA polymerases along the DNA strand (Aller et al., 2007).
NEIL1 has been implicated in the S-phase and repair within the replication
fork. Thus the reduced release of Tg from the ssDNA, due to the knockout
of NEIL1, could potentially be extending the S-phase and disrupting
production of both cytokines and neutrophils (Orr et al., 2007; Orren et
al., 1997).
NEIL1 has also been shown to interact with several proteins that have no
effect on the activity of NEIL1 including DNA ligase IIIα, polβ and OGG1
(Mokkapati et al., 2004a). DNA ligase and polβ both interact with XRCC1,
and whilst XRCC1 has no catalytic properties of its own it does interact
with both PARP-1 and APE1 (Mutamba et al., 2011). Mutations in XRCC1
have been shown to be associated with various inflammation-associated
malignancies including an increase the prevalence of breast cancer (Duell
et al., 2001) and reduced susceptibility to oesophageal (Lee et al., 2001),
lung (Ratnasinghe et al., 2001) and bladder cancers (Stern et al., 2001).
Additionally these proteins also interact with PARP-1 (Mutamba et al.,
2011), the knockout of which has been shown to reduce the immune
response to endotoxin (Virag and Szabo 2002). However, this inhibition is
thought to be due to a blanket reduction in all cytokine activity due to the
inhibition of NF-κβ and AP-1 with which it has been shown to be a co-
factor with (Kiefmann et al., 2004). This was not observed in the
developed NEIL1-/- mice which exhibited both increases and decreases in
cytokine production.
A number of proteins have been shown to interact with NEIL1 increasing
its activity including FEN-1, PCNA, CSB and WRN (Das et al., 2007a; Dou
et al., 2008; Hegde et al., 2008; Muftuoglu et al., 2009). WRN has also
Ph.D. Thesis 2012 Alan Carter
150
been shown to be linked to inflammation; siRNA inhibition of this protein
has been shown to increase both IL-6 production and the activation of NF-
κβ (Turaga et al., 2009). As NEIL1 is activated by WRN and there was no
overall increase in inflammatory damage it is probable that this is not the
pathway by which inflammation is modulated.
FEN-1 as with many of these proteins does also interact with PARP-1
(Bouchard et al., 2003) and has been implicated in autoimmunity
disorders, chronic inflammation and cancer formation (Kucherlapati et al.,
2002; Lam et al., 2006; Zheng et al., 2007). More recently it was
suggested that the upregulation of this protein was responsible for the
increased inflammatory mediated cancer risk. The mechanism implicated
in this rise in inflammatory signals was the hypomethylation of key
promoter signals, leading to the hyperexpression of genes (Singh et al.,
2008). The lack of NEIL1 protein to bind with may therefore increase free
FEN-1 proteins within the cell reducing promoter methylation, and thus
increasing these inflammatory signals.
PCNA interacts with NEIL1 during the S-phase as it plays a role in DNA
replication at this point (Kisielewska et al., 2005). Additionally, due to the
positive correlation between PCNA concentration and severity of
inflammation, PCNA has been used as a marker for inflammation in
inflammatory bowel disease and several types of cancer including liver
(Ding et al., 2005; Harrison et al., 1993).
Little is known how the CSB protein may influence inflammatory response
but in an experiment in which CSB-/- mice were exposed to ozone, the
basal IL-6 levels in these mice were higher and the IL-6 response of the
mice in question was accelerated whilst the accumulation of oxidative
damage was decreased (Kooter et al., 2008). Whilst there was an
increased basal IL-6 level in the male NEIL1-/- mice, the IL-6 production
was not accelerated as it was in the CSB-/- mice. Although no mechanism
Ph.D. Thesis 2012 Alan Carter
151
for CSB affecting the immune response has been forthcoming, the
removal of the NEIL1 protein may result in excess “free” CSB within the
cell.
Each of these proteins, including NEIL1 itself, can be linked to
inflammation via APE1. This enzymes expression is activated by the
presence of ROS such as those released by the innate immune response
(Yang et al., 2007). APE1 activates transcription factors NF-κΒ and AP-1
by the reduction of active cystine residues (Ando et al., 2008). The down
regulation of the disruption of APE1 activity has been shown to decrease
the activation of transcription factors NF-κΒ and AP-1 (Daily et al., 2001;
Fung and Demple 2005).
As the mice got older, basal levels of the cytokine IL-6 decreased,
however aging is more often cited as causing increased IL-6 production
(Daynes et al., 1993; Ershler et al., 1993), but there is controversy on this
point as cases exist where no change (Beharka et al., 2001) or a decrease
is observed (Boehmer et al., 2004; Goodman and Stein 1994; Sharman et
al., 2001). These NEIL1-/- mice had initially reduced basal levels of IL-6
which reduced to similar levels as WT mice at 12 months. A decrease in
basal IL-6 is thought to be due to reduced efficiency in the transcription
pathways, particularly the JNK and p38 pathways (Boehmer et al., 2004;
Goodman and Stein 1994) or due to the deregulation of IL-6 with age,
due to inhibition of NF-κβ by an increase in Th2 activity (Ye and Johnson
2001). Another hypothesis is that in younger mice, IL-6 plays a role in
developmental processes such as osteoclastogenesis, vascular
development and the development of the brain and that the basal level of
IL-6 reduces when it is no longer needed (Sharman et al., 2001).
The large numbers of proteins that may link through NEIL1 to
inflammation indicate that the BER repair system and inflammation may
be linked at several points, however there are many points where the BER
Ph.D. Thesis 2012 Alan Carter
152
system “bottlenecks” i.e. after APE1 has cleaved the 3' PUA leaving a gap
that can be repaired by Pol β and DNA ligase III/XRCC1.
In conclusion, the knockout of the NEIL1 gene seems to slow the initiation
of the immune response, although this is compensated for by an increase
in the proinflammatory cytokine, IL-12, in males and a decrease in the
anti-inflammatory ILs 10 and 4 in the blood serum. Additionally there was
no difference in levels of MPO or MDA between NEIL1-/- and NEIL1+/+
mice, although there was differences observed between overall GSH,
indicating a mild ROS increase. The results shed more light on how
previously identified BER proteins may have modulated inflammation but
more work need to be done to identify the specific pathway.
Ph.D. Thesis 2012 Alan Carter
153
6. Effects of OGG1 Gene Knockout on Endotoxin Induced Inflammation
6.1. Introduction
As outlined previously base excision repair proteins such as PARP-1, APE-
1 and MUTYH have been implicated in the regulation of the immune
system in response to endotoxin (Sections 1.3.1. & 1.3.2.) (Casorelli et al.,
2010; Virag and Szabo 2002). There is also evidence that another base
excision repair protein, OGG1, may have potentially protective effects
against endotoxin or helicobacter pylori induced inflammation (Mabley et
al., 2005a; Touati et al., 2006). This was first reported in 2005 when it
was shown that after LPS treatment (55 mg/kg i.p.) the mortality in OGG1-
/- mice was lower than that in wildtype animals. The levels of the IL-12
and TNF-α in blood plasma were reduced in OGG1-/- mice when compared
with OGG1+/+ mice as were levels of MIP-1α. Additionally, levels of anti-
inflammatory cytokines IL-4 and IL-10 were increased in the plasma of the
OGG1-/- mice when compared to OGG1+/+ mice, indicating an overall
suppression of the immune system. MPO activity in heart and lung tissues
was significantly reduced in OGG1-/- mice, compared to OGG1+/+ mice
after the mice were challenged with 80 mg/kg LPS (i.p.). Additionally MDA
levels were also reduced in the lung, heart and liver of OGG1-/- mice when
compared to their OGG1+/+ counterparts. These results suggest that the
reduction in levels of pro-inflammatory cytokines and chemokines, and the
increase in anti-inflammatory cytokines reduced neutrophil recruitment
and activation, which in turn attenuated the production of MDA (Mabley et
al., 2005a).
The same strain of OGG1-/- mice, this time bred onto a Big blue mouse
background useful for the observation of mutations (Hill et al., 1999),
infected with the gram-negative bacteria helicobacter pylori (H. pylori)
exhibited less severe histological lesions of the gastric mucosa than those
of OGG1+/+ mice. Additionally, infiltration of polymorphonuclear cells
Ph.D. Thesis 2012 Alan Carter
154
(neutrophils, basophils and eosinophils) was observed in the gut tissue of
33% of OGG1-/- mice treated with H. Pylori , compared to 100% of the
OGG1+/+ mice, indicating that the recruitment of these cells was also
attenuated (Touati et al., 2006).
These studies support the hypothesis that there is a link between OGG1
and the inflammatory response, but this evidence has not been confirmed
by other sources.
6.1.1. Aims To identify the extent to which OGG1 determines the immune response to
LPS induced inflammation by:
1. Establishing whether levels of IL-6, IL-12, IL-10 and IL-4 differ
between OGG1-/- and OGG1+/+ mouse serum, at baseline and
after LPS treatment.
2. Identify whether changes in MPO activity, GSH levels and MDA
levels induced by LPS differ between OGG1-/- and OGG1+/+ mice.
6.2. Results
6.2.1. Cytokine Output in LPS Challenged OGG1-/- Mice
Figures 6.1 – 6.4 present interleukin concentrations measured in blood
serum of mice after 0, 1, 6 and 24 h after injection with LPS (2 mg/kg i.p.;
mean ± SEM; n=6). There was a significant difference in IL-4 levels
between WT and KO male mice at 6 h, here the OGG1+/+ (18.1 ± 0.9
pg/ml) mice having more IL-4 in their serum than OGG1-/- mice (12.9 ±
2.4 pg/ml; Figure 6.1A; p=0.05). IL-4 concentrations were not
significantly different at any time point when comparing female OGG1+/+
and OGG1-/- mice (p>0.55).
Serum IL-6 concentrations were significantly different between male WT
and KO mice at baseline (WT 5.2 ± 1.4 pg/ml vs. KO 1.8 ± 0.6 pg/ml;
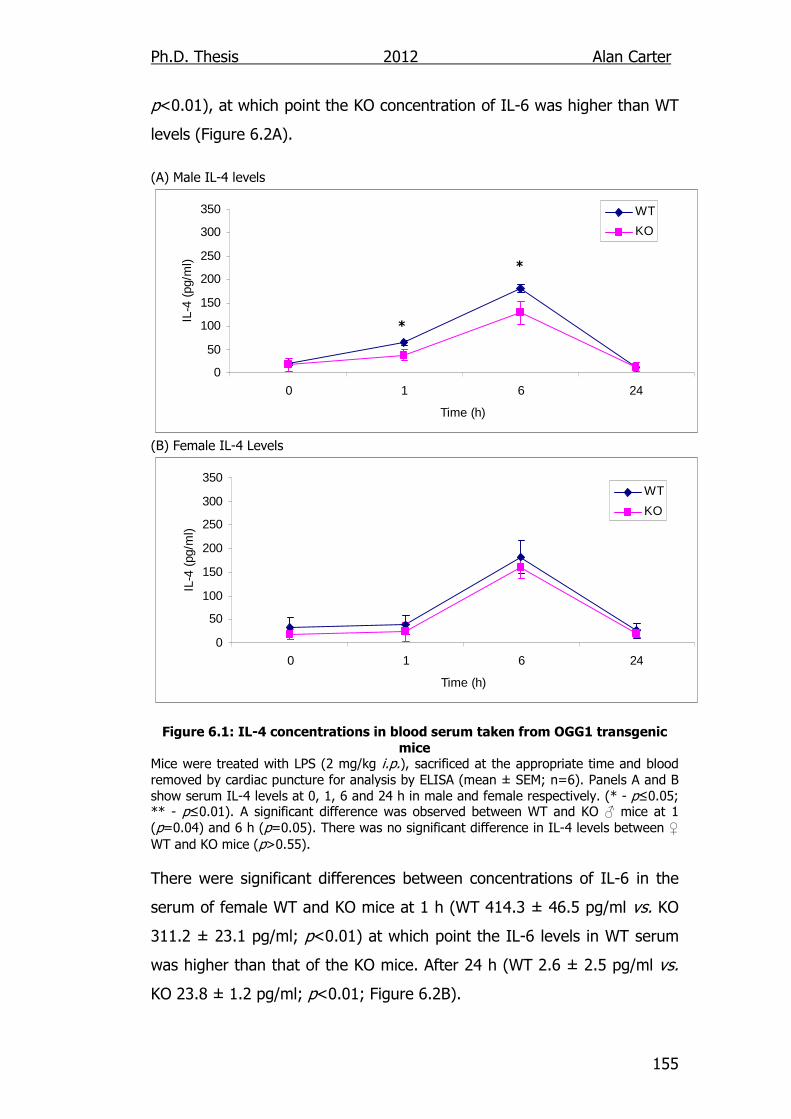
Ph.D. Thesis 2012 Alan Carter
155
p<0.01), at which point the KO concentration of IL-6 was higher than WT
levels (Figure 6.2A).
(A) Male IL-4 levels
0
50
100
150
200
250
300
350
0 1 6 24
Time (h)
IL-4
(pg
/ml)
WT
KO
(B) Female IL-4 Levels
0
50
100
150
200
250
300
350
0 1 6 24
Time (h)
IL-4
(pg
/ml)
WT
KO
Figure 6.1: IL-4 concentrations in blood serum taken from OGG1 transgenic
mice Mice were treated with LPS (2 mg/kg i.p.), sacrificed at the appropriate time and blood removed by cardiac puncture for analysis by ELISA (mean ± SEM; n=6). Panels A and B show serum IL-4 levels at 0, 1, 6 and 24 h in male and female respectively. (* - p≤0.05; ** - p≤0.01). A significant difference was observed between WT and KO ♂ mice at 1 (p=0.04) and 6 h (p=0.05). There was no significant difference in IL-4 levels between ♀ WT and KO mice (p>0.55).
There were significant differences between concentrations of IL-6 in the
serum of female WT and KO mice at 1 h (WT 414.3 ± 46.5 pg/ml vs. KO
311.2 ± 23.1 pg/ml; p<0.01) at which point the IL-6 levels in WT serum
was higher than that of the KO mice. After 24 h (WT 2.6 ± 2.5 pg/ml vs.
KO 23.8 ± 1.2 pg/ml; p<0.01; Figure 6.2B).
*
*
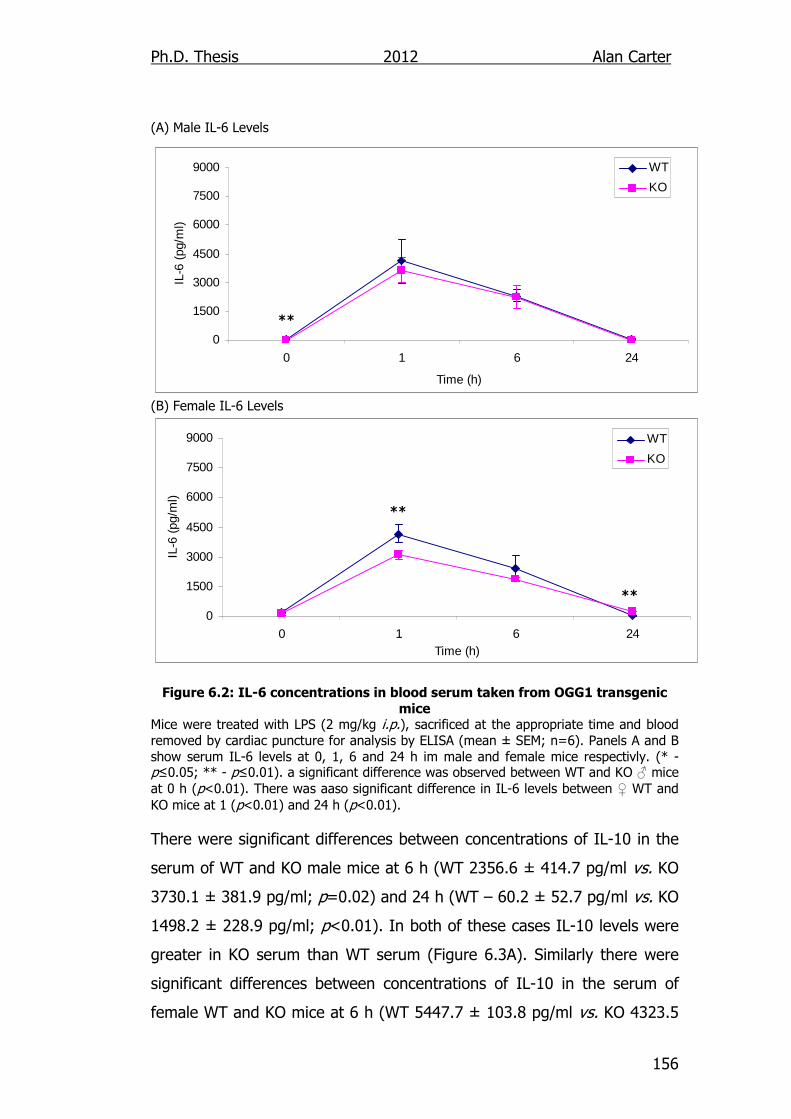
Ph.D. Thesis 2012 Alan Carter
156
(A) Male IL-6 Levels
0
1500
3000
4500
6000
7500
9000
0 1 6 24
Time (h)
IL-6
(pg
/ml)
WT
KO
(B) Female IL-6 Levels
0
1500
3000
4500
6000
7500
9000
0 1 6 24Time (h)
IL-6
(pg
/ml)
WT
KO
Figure 6.2: IL-6 concentrations in blood serum taken from OGG1 transgenic
mice Mice were treated with LPS (2 mg/kg i.p.), sacrificed at the appropriate time and blood removed by cardiac puncture for analysis by ELISA (mean ± SEM; n=6). Panels A and B show serum IL-6 levels at 0, 1, 6 and 24 h im male and female mice respectivly. (* - p≤0.05; ** - p≤0.01). a significant difference was observed between WT and KO ♂ mice at 0 h (p<0.01). There was aaso significant difference in IL-6 levels between ♀ WT and KO mice at 1 (p<0.01) and 24 h (p<0.01).
There were significant differences between concentrations of IL-10 in the
serum of WT and KO male mice at 6 h (WT 2356.6 ± 414.7 pg/ml vs. KO
3730.1 ± 381.9 pg/ml; p=0.02) and 24 h (WT – 60.2 ± 52.7 pg/ml vs. KO
1498.2 ± 228.9 pg/ml; p<0.01). In both of these cases IL-10 levels were
greater in KO serum than WT serum (Figure 6.3A). Similarly there were
significant differences between concentrations of IL-10 in the serum of
female WT and KO mice at 6 h (WT 5447.7 ± 103.8 pg/ml vs. KO 4323.5
**
**
**
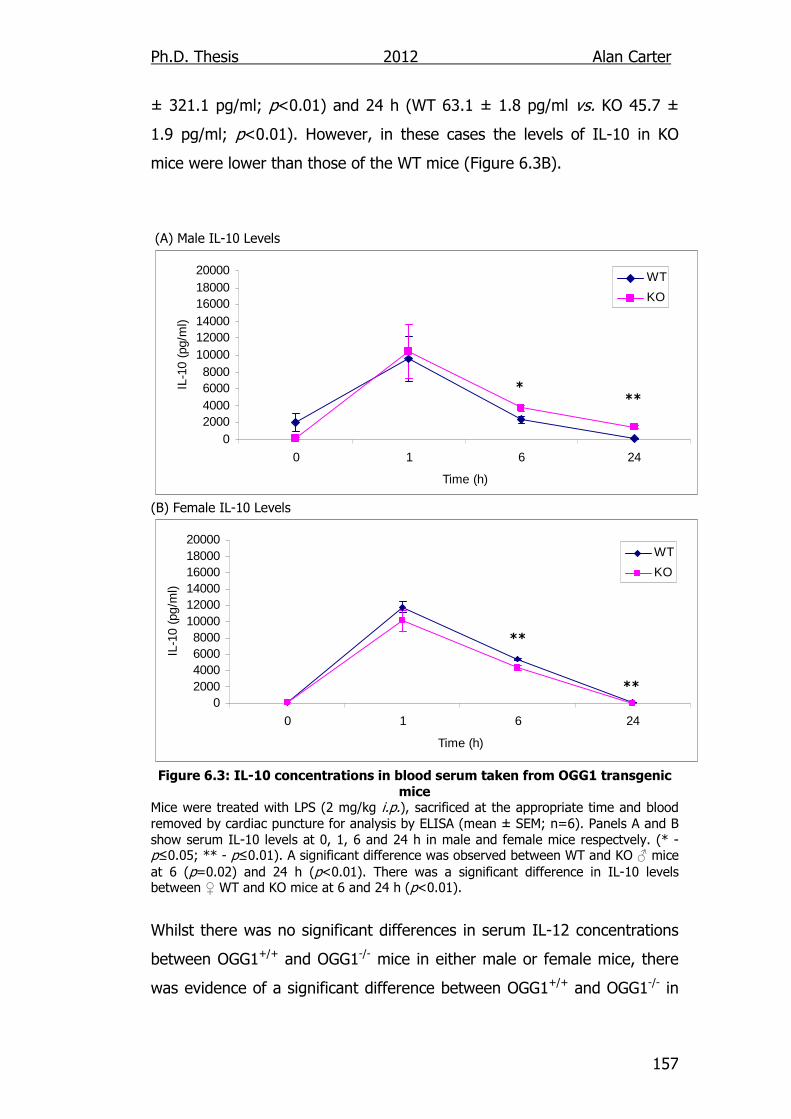
Ph.D. Thesis 2012 Alan Carter
157
± 321.1 pg/ml; p<0.01) and 24 h (WT 63.1 ± 1.8 pg/ml vs. KO 45.7 ±
1.9 pg/ml; p<0.01). However, in these cases the levels of IL-10 in KO
mice were lower than those of the WT mice (Figure 6.3B).
(A) Male IL-10 Levels
02000400060008000
100001200014000160001800020000
0 1 6 24
Time (h)
IL-1
0 (p
g/m
l)
WT
KO
(B) Female IL-10 Levels
02000400060008000
100001200014000160001800020000
0 1 6 24
Time (h)
IL-1
0 (p
g/m
l)
WT
KO
Figure 6.3: IL-10 concentrations in blood serum taken from OGG1 transgenic
mice Mice were treated with LPS (2 mg/kg i.p.), sacrificed at the appropriate time and blood removed by cardiac puncture for analysis by ELISA (mean ± SEM; n=6). Panels A and B show serum IL-10 levels at 0, 1, 6 and 24 h in male and female mice respectvely. (* - p≤0.05; ** - p≤0.01). A significant difference was observed between WT and KO ♂ mice at 6 (p=0.02) and 24 h (p<0.01). There was a significant difference in IL-10 levels between ♀ WT and KO mice at 6 and 24 h (p<0.01).
Whilst there was no significant differences in serum IL-12 concentrations
between OGG1+/+ and OGG1-/- mice in either male or female mice, there
was evidence of a significant difference between OGG1+/+ and OGG1-/- in
* **
**
**
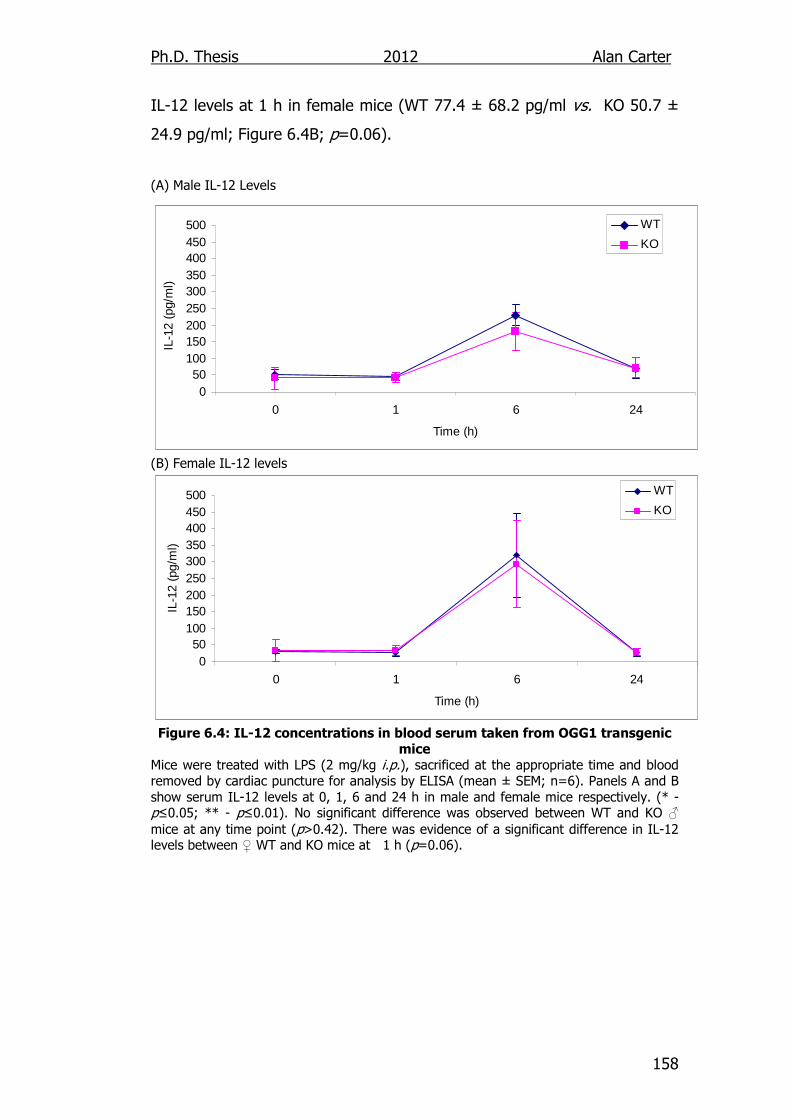
Ph.D. Thesis 2012 Alan Carter
158
IL-12 levels at 1 h in female mice (WT 77.4 ± 68.2 pg/ml vs. KO 50.7 ±
24.9 pg/ml; Figure 6.4B; p=0.06).
(A) Male IL-12 Levels
050
100150200250300350400450500
0 1 6 24
Time (h)
IL-1
2 (p
g/m
l)
WT
KO
(B) Female IL-12 levels
050
100150200250300350400450500
0 1 6 24
Time (h)
IL-1
2 (p
g/m
l)
WT
KO
Figure 6.4: IL-12 concentrations in blood serum taken from OGG1 transgenic
mice Mice were treated with LPS (2 mg/kg i.p.), sacrificed at the appropriate time and blood removed by cardiac puncture for analysis by ELISA (mean ± SEM; n=6). Panels A and B show serum IL-12 levels at 0, 1, 6 and 24 h in male and female mice respectively. (* - p≤0.05; ** - p≤0.01). No significant difference was observed between WT and KO ♂ mice at any time point (p>0.42). There was evidence of a significant difference in IL-12 levels between ♀ WT and KO mice at 1 h (p=0.06).
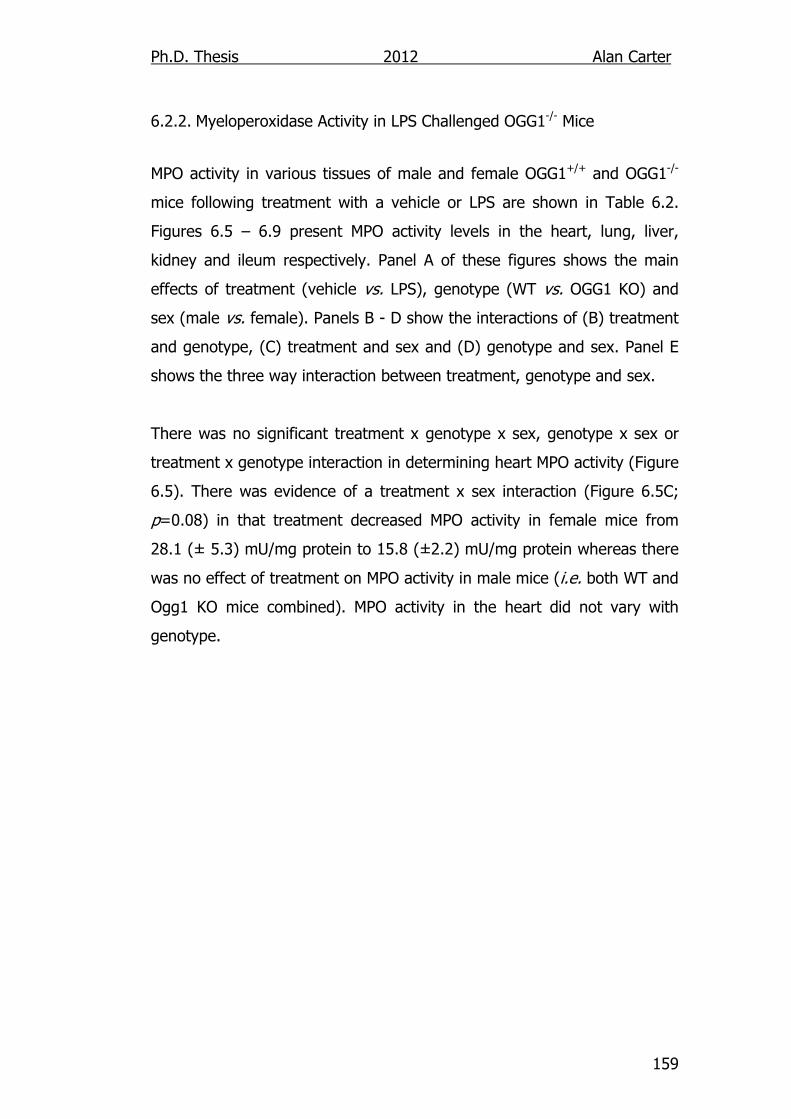
Ph.D. Thesis 2012 Alan Carter
159
6.2.2. Myeloperoxidase Activity in LPS Challenged OGG1-/- Mice
MPO activity in various tissues of male and female OGG1+/+ and OGG1-/-
mice following treatment with a vehicle or LPS are shown in Table 6.2.
Figures 6.5 – 6.9 present MPO activity levels in the heart, lung, liver,
kidney and ileum respectively. Panel A of these figures shows the main
effects of treatment (vehicle vs. LPS), genotype (WT vs. OGG1 KO) and
sex (male vs. female). Panels B - D show the interactions of (B) treatment
and genotype, (C) treatment and sex and (D) genotype and sex. Panel E
shows the three way interaction between treatment, genotype and sex.
There was no significant treatment x genotype x sex, genotype x sex or
treatment x genotype interaction in determining heart MPO activity (Figure
6.5). There was evidence of a treatment x sex interaction (Figure 6.5C;
p=0.08) in that treatment decreased MPO activity in female mice from
28.1 (± 5.3) mU/mg protein to 15.8 (±2.2) mU/mg protein whereas there
was no effect of treatment on MPO activity in male mice (i.e. both WT and
Ogg1 KO mice combined). MPO activity in the heart did not vary with
genotype.
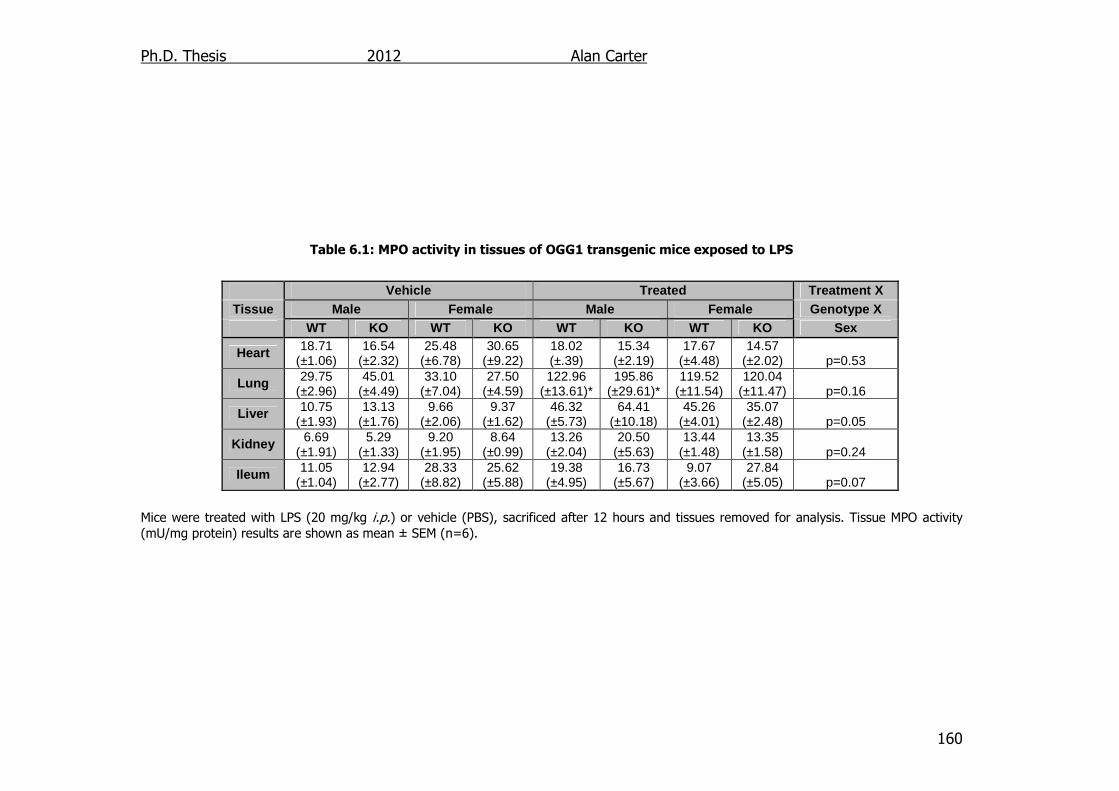
Ph.D. Thesis 2012 Alan Carter
160
Table 6.1: MPO activity in tissues of OGG1 transgenic mice exposed to LPS
Mice were treated with LPS (20 mg/kg i.p.) or vehicle (PBS), sacrificed after 12 hours and tissues removed for analysis. Tissue MPO activity (mU/mg protein) results are shown as mean ± SEM (n=6).
Vehicle Treated Treatment X Tissue Male Female Male Female Genotype X
WT KO WT KO WT KO WT KO Sex
Heart 18.71 (±1.06)
16.54 (±2.32)
25.48 (±6.78)
30.65 (±9.22)
18.02 (±.39)
15.34 (±2.19)
17.67 (±4.48)
14.57 (±2.02) p=0.53
Lung 29.75 (±2.96)
45.01 (±4.49)
33.10 (±7.04)
27.50 (±4.59)
122.96 (±13.61)*
195.86 (±29.61)*
119.52 (±11.54)
120.04 (±11.47) p=0.16
Liver 10.75 (±1.93)
13.13 (±1.76)
9.66 (±2.06)
9.37 (±1.62)
46.32 (±5.73)
64.41 (±10.18)
45.26 (±4.01)
35.07 (±2.48) p=0.05
Kidney 6.69 (±1.91)
5.29 (±1.33)
9.20 (±1.95)
8.64 (±0.99)
13.26 (±2.04)
20.50 (±5.63)
13.44 (±1.48)
13.35 (±1.58) p=0.24
Ileum 11.05 (±1.04)
12.94 (±2.77)
28.33 (±8.82)
25.62 (±5.88)
19.38 (±4.95)
16.73 (±5.67)
9.07 (±3.66)
27.84 (±5.05) p=0.07
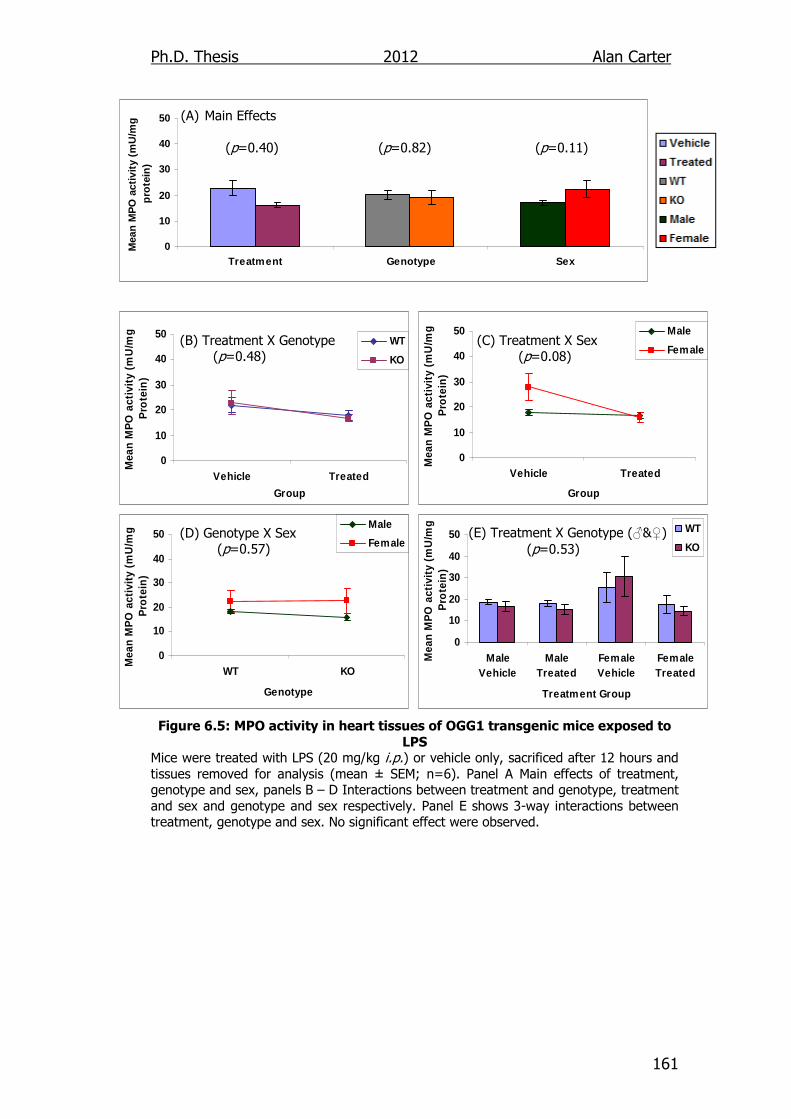
Ph.D. Thesis 2012 Alan Carter
161
0
10
20
30
40
50
Treatment Genotype Sex
Mea
n M
PO
act
ivit
y (m
U/m
g
pro
tein
)
0
10
20
30
40
50
Vehicle Treated
Group
Mea
n M
PO
act
ivit
y (m
U/m
g
Pro
tein
)
WT
KO
0
10
20
30
40
50
Vehicle Treated
Group
Mea
n M
PO
act
ivit
y (m
U/m
g
Pro
tein
)
Male
Female
0
10
20
30
40
50
WT KO
Genotype
Mea
n M
PO
act
ivit
y (m
U/m
g
Pro
tein
)
Male
Female
0
10
20
30
40
50
MaleVehicle
MaleTreated
FemaleVehicle
FemaleTreated
Treatment Group
Mea
n M
PO
act
ivit
y (m
U/m
g
Pro
tein
)
WT
KO
(A) Main Effects
(p=0.40) (p=0.82) (p=0.11)
(B) Treatment X Genotype (p=0.48) (D) Genotype X Sex (p=0.57)
(C) Treatment X Sex (p=0.08) (E) Treatment X Genotype (♂&♀) (p=0.53)
Figure 6.5: MPO activity in heart tissues of OGG1 transgenic mice exposed to
LPS Mice were treated with LPS (20 mg/kg i.p.) or vehicle only, sacrificed after 12 hours and tissues removed for analysis (mean ± SEM; n=6). Panel A Main effects of treatment, genotype and sex, panels B – D Interactions between treatment and genotype, treatment and sex and genotype and sex respectively. Panel E shows 3-way interactions between treatment, genotype and sex. No significant effect were observed.
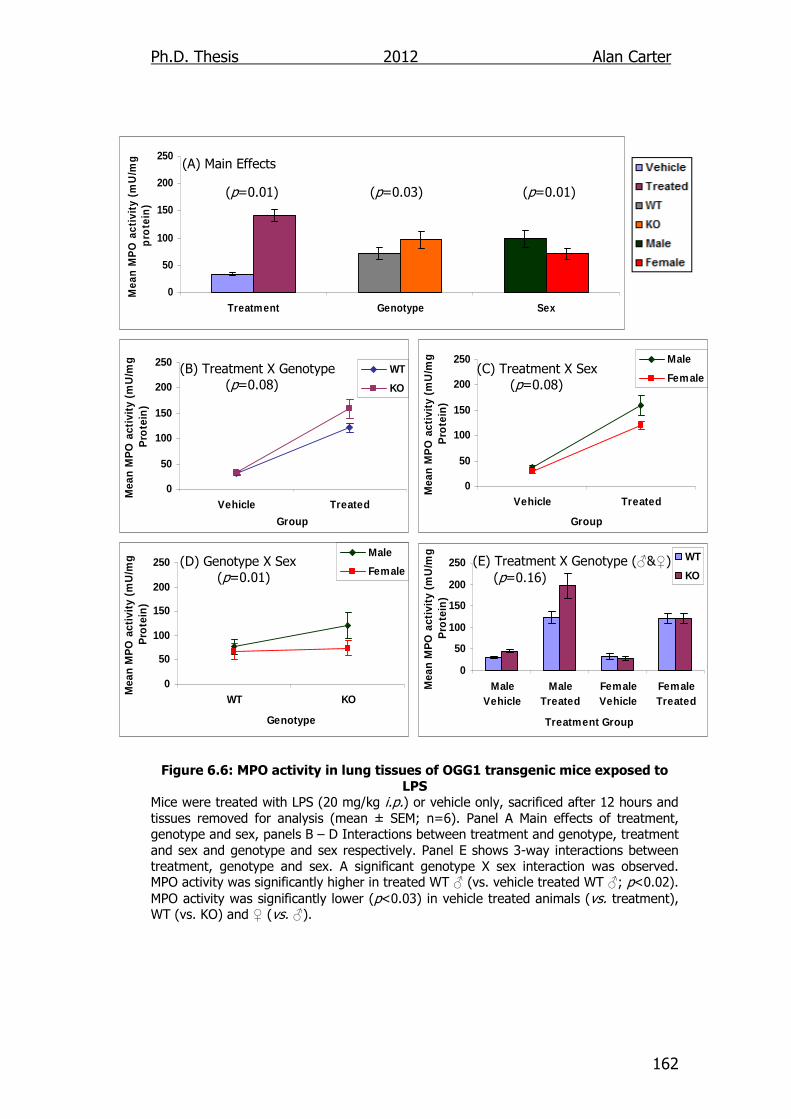
Ph.D. Thesis 2012 Alan Carter
162
0
50
100
150
200
250
Treatment Genotype Sex
Mea
n M
PO
act
ivit
y (m
U/m
g
pro
tein
)
0
50
100
150
200
250
Vehicle Treated
Group
Mea
n M
PO
act
ivit
y (m
U/m
g
Pro
tein
)
WT
KO
0
50
100
150
200
250
Vehicle Treated
Group
Mea
n M
PO
act
ivit
y (m
U/m
g
Pro
tein
)
Male
Female
0
50
100
150
200
250
WT KO
Genotype
Mea
n M
PO
act
ivit
y (m
U/m
g
Pro
tein
)
Male
Female
0
50
100
150
200
250
MaleVehicle
MaleTreated
FemaleVehicle
FemaleTreated
Treatment Group
Mea
n M
PO
act
ivit
y (m
U/m
g
Pro
tein
)
WT
KO
(A) Main Effects
(p=0.01) (p=0.03) (p=0.01) (B) Treatment X Genotype (p=0.08) (D) Genotype X Sex (p=0.01)
(C) Treatment X Sex (p=0.08) (E) Treatment X Genotype (♂&♀) (p=0.16)
Figure 6.6: MPO activity in lung tissues of OGG1 transgenic mice exposed to
LPS Mice were treated with LPS (20 mg/kg i.p.) or vehicle only, sacrificed after 12 hours and tissues removed for analysis (mean ± SEM; n=6). Panel A Main effects of treatment, genotype and sex, panels B – D Interactions between treatment and genotype, treatment and sex and genotype and sex respectively. Panel E shows 3-way interactions between treatment, genotype and sex. A significant genotype X sex interaction was observed. MPO activity was significantly higher in treated WT ♂ (vs. vehicle treated WT ♂; p<0.02). MPO activity was significantly lower (p<0.03) in vehicle treated animals (vs. treatment), WT (vs. KO) and ♀ (vs. ♂).
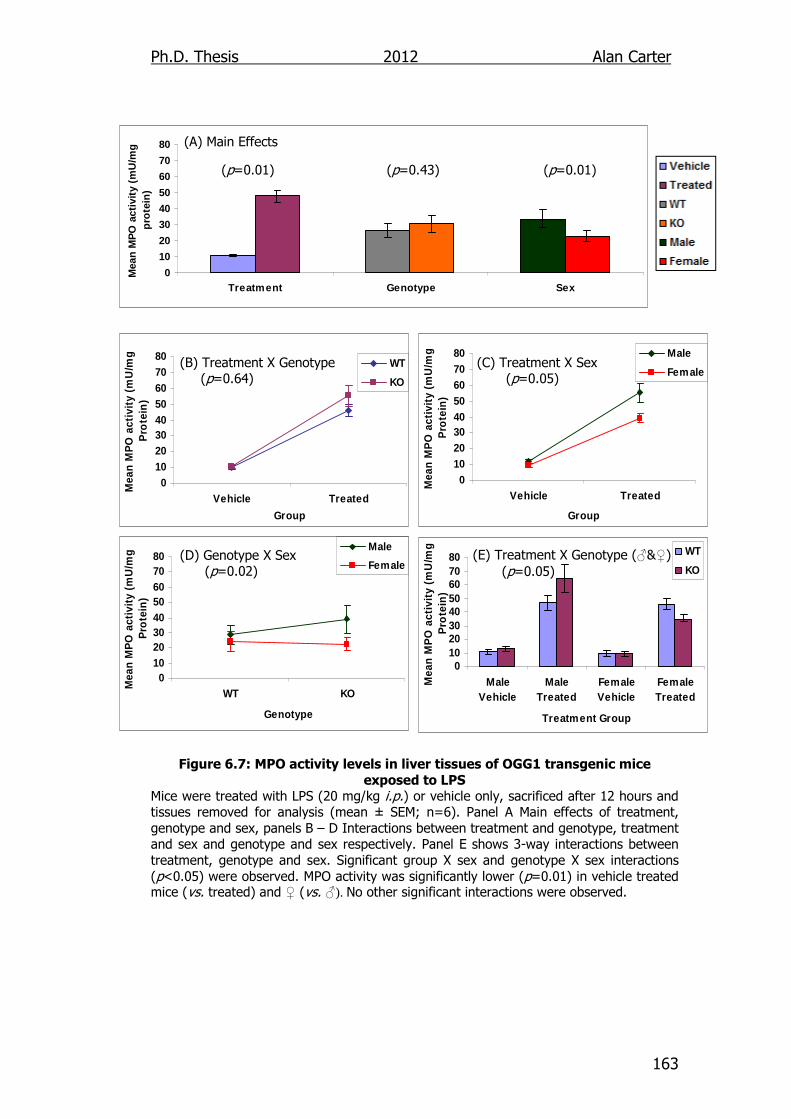
Ph.D. Thesis 2012 Alan Carter
163
0
10
20
30
40
50
60
70
80
Treatment Genotype Sex
Mea
n M
PO
act
ivit
y (m
U/m
g
pro
tein
)
01020304050607080
Vehicle Treated
Group
Mea
n M
PO
act
ivit
y (m
U/m
g
Pro
tein
)
WT
KO
01020304050607080
Vehicle Treated
Group
Mea
n M
PO
act
ivit
y (m
U/m
g
Pro
tein
)
Male
Female
01020304050607080
WT KO
Genotype
Mea
n M
PO
act
ivit
y (m
U/m
g
Pro
tein
)
Male
Female
01020304050607080
MaleVehicle
MaleTreated
FemaleVehicle
FemaleTreated
Treatment Group
Mea
n M
PO
act
ivit
y (m
U/m
g
Pro
tein
)
WT
KO
(A) Main Effects
(p=0.01) (p=0.43) (p=0.01)
(B) Treatment X Genotype (p=0.64) (D) Genotype X Sex (p=0.02)
(C) Treatment X Sex (p=0.05) (E) Treatment X Genotype (♂&♀) (p=0.05)
Figure 6.7: MPO activity levels in liver tissues of OGG1 transgenic mice
exposed to LPS Mice were treated with LPS (20 mg/kg i.p.) or vehicle only, sacrificed after 12 hours and tissues removed for analysis (mean ± SEM; n=6). Panel A Main effects of treatment, genotype and sex, panels B – D Interactions between treatment and genotype, treatment and sex and genotype and sex respectively. Panel E shows 3-way interactions between treatment, genotype and sex. Significant group X sex and genotype X sex interactions (p<0.05) were observed. MPO activity was significantly lower (p=0.01) in vehicle treated mice (vs. treated) and ♀ (vs. ♂). No other significant interactions were observed.
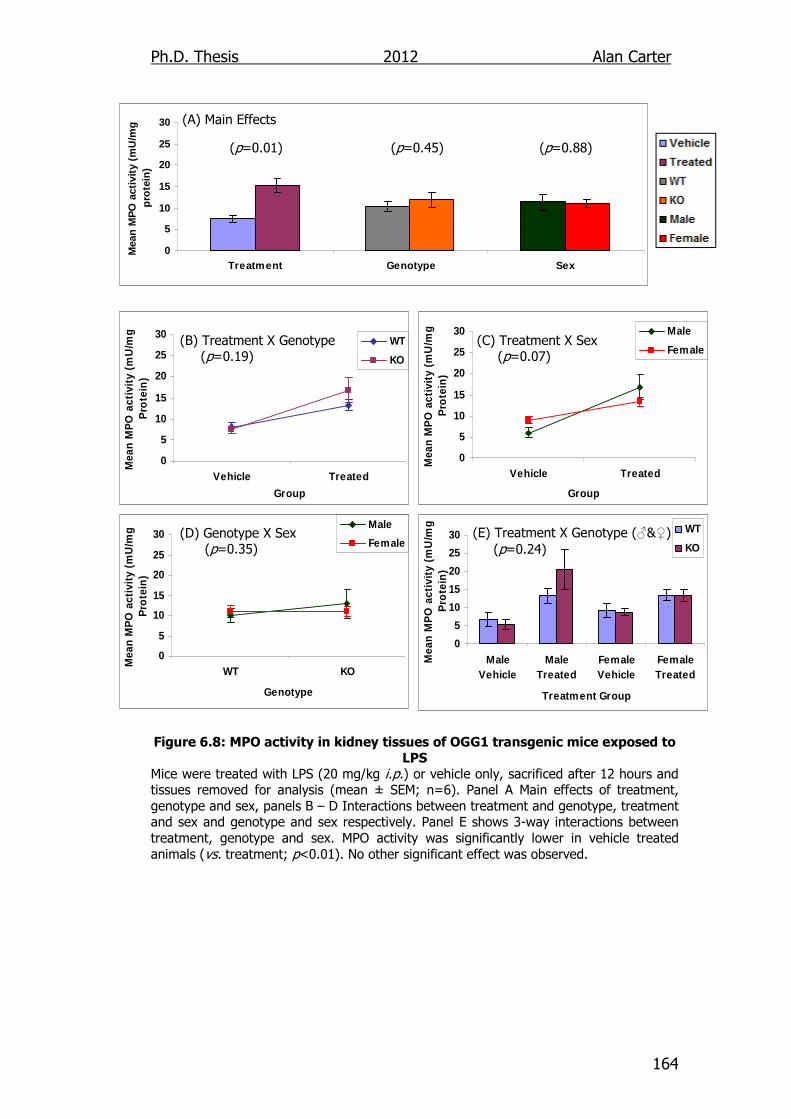
Ph.D. Thesis 2012 Alan Carter
164
0
5
10
15
20
25
30
Treatment Genotype Sex
Mea
n M
PO
act
ivit
y (m
U/m
g
pro
tein
)
0
5
10
15
20
25
30
Vehicle Treated
Group
Mea
n M
PO
act
ivit
y (m
U/m
g
Pro
tein
)
WT
KO
0
5
10
15
20
25
30
Vehicle Treated
Group
Mea
n M
PO
act
ivit
y (m
U/m
g
Pro
tein
)
Male
Female
0
5
10
15
20
25
30
WT KO
Genotype
Mea
n M
PO
act
ivit
y (m
U/m
g
Pro
tein
)
Male
Female
0
5
10
15
20
25
30
MaleVehicle
MaleTreated
FemaleVehicle
FemaleTreated
Treatment Group
Mea
n M
PO
act
ivit
y (m
U/m
g
Pro
tein
)
WT
KO
(A) Main Effects
(p=0.01) (p=0.45) (p=0.88)
(B) Treatment X Genotype (p=0.19) (D) Genotype X Sex (p=0.35)
(C) Treatment X Sex (p=0.07) (E) Treatment X Genotype (♂&♀) (p=0.24)
Figure 6.8: MPO activity in kidney tissues of OGG1 transgenic mice exposed to
LPS Mice were treated with LPS (20 mg/kg i.p.) or vehicle only, sacrificed after 12 hours and tissues removed for analysis (mean ± SEM; n=6). Panel A Main effects of treatment, genotype and sex, panels B – D Interactions between treatment and genotype, treatment and sex and genotype and sex respectively. Panel E shows 3-way interactions between treatment, genotype and sex. MPO activity was significantly lower in vehicle treated animals (vs. treatment; p<0.01). No other significant effect was observed.
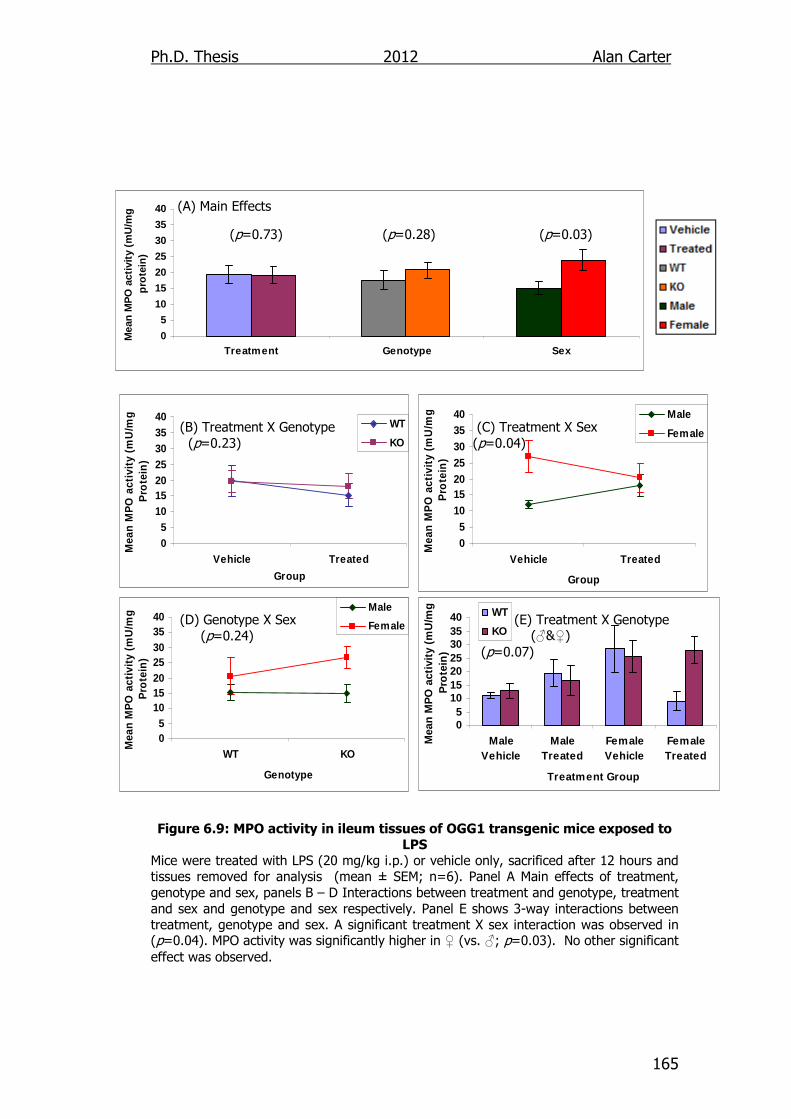
Ph.D. Thesis 2012 Alan Carter
165
05
10152025303540
Vehicle Treated
Group
Mea
n M
PO
act
ivit
y (m
U/m
g
Pro
tein
)
WT
KO
0
5
10
15
20
25
30
35
40
Treatment Genotype Sex
Mea
n M
PO
act
ivit
y (m
U/m
g
pro
tein
)
05
10152025303540
Vehicle Treated
Group
Mea
n M
PO
act
ivit
y (m
U/m
g
Pro
tein
)
Male
Female
05
10152025303540
WT KO
Genotype
Mea
n M
PO
act
ivit
y (m
U/m
g
Pro
tein
)
Male
Female
05
10152025303540
MaleVehicle
MaleTreated
FemaleVehicle
FemaleTreated
Treatment Group
Mea
n M
PO
act
ivit
y (m
U/m
g
Pro
tein
)
WT
KO
(A) Main Effects
(p=0.73) (p=0.28) (p=0.03)
(B) Treatment X Genotype (p=0.23) (D) Genotype X Sex (p=0.24)
(C) Treatment X Sex (p=0.04) (E) Treatment X Genotype (♂&♀) (p=0.07)
Figure 6.9: MPO activity in ileum tissues of OGG1 transgenic mice exposed to
LPS Mice were treated with LPS (20 mg/kg i.p.) or vehicle only, sacrificed after 12 hours and tissues removed for analysis (mean ± SEM; n=6). Panel A Main effects of treatment, genotype and sex, panels B – D Interactions between treatment and genotype, treatment and sex and genotype and sex respectively. Panel E shows 3-way interactions between treatment, genotype and sex. A significant treatment X sex interaction was observed in (p=0.04). MPO activity was significantly higher in ♀ (vs. ♂; p=0.03). No other significant effect was observed.
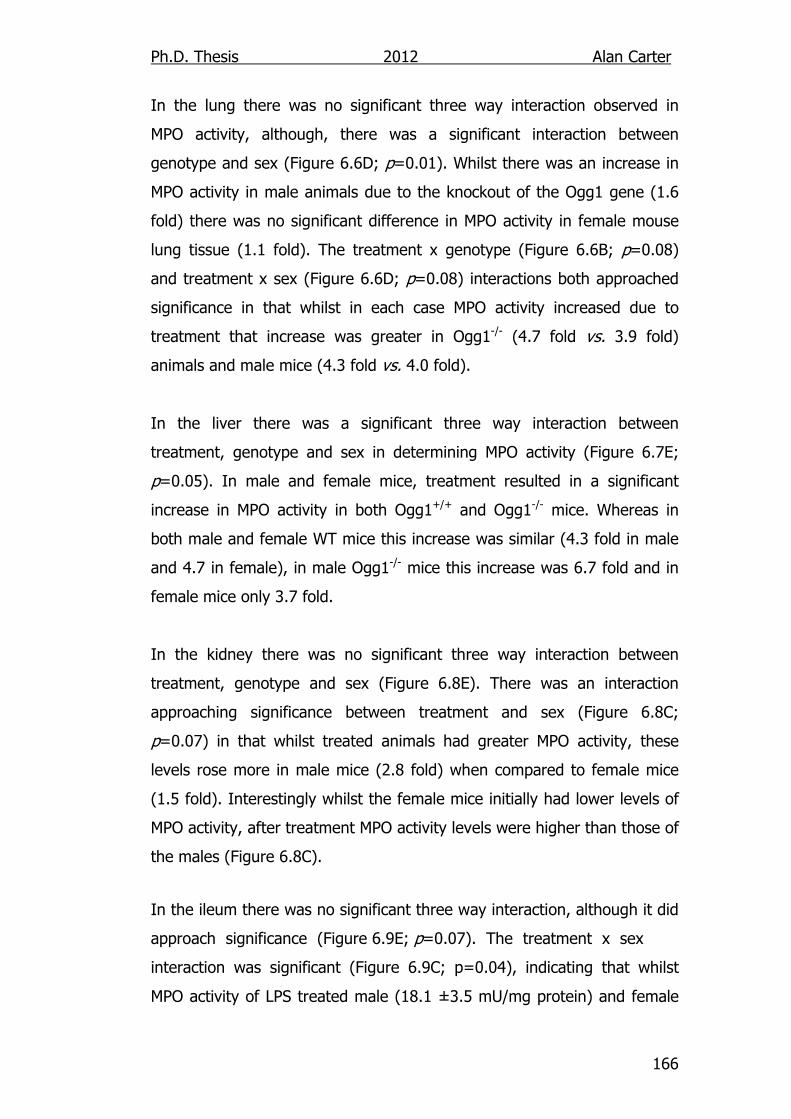
Ph.D. Thesis 2012 Alan Carter
166
In the lung there was no significant three way interaction observed in
MPO activity, although, there was a significant interaction between
genotype and sex (Figure 6.6D; p=0.01). Whilst there was an increase in
MPO activity in male animals due to the knockout of the Ogg1 gene (1.6
fold) there was no significant difference in MPO activity in female mouse
lung tissue (1.1 fold). The treatment x genotype (Figure 6.6B; p=0.08)
and treatment x sex (Figure 6.6D; p=0.08) interactions both approached
significance in that whilst in each case MPO activity increased due to
treatment that increase was greater in Ogg1-/- (4.7 fold vs. 3.9 fold)
animals and male mice (4.3 fold vs. 4.0 fold).
In the liver there was a significant three way interaction between
treatment, genotype and sex in determining MPO activity (Figure 6.7E;
p=0.05). In male and female mice, treatment resulted in a significant
increase in MPO activity in both Ogg1+/+ and Ogg1-/- mice. Whereas in
both male and female WT mice this increase was similar (4.3 fold in male
and 4.7 in female), in male Ogg1-/- mice this increase was 6.7 fold and in
female mice only 3.7 fold.
In the kidney there was no significant three way interaction between
treatment, genotype and sex (Figure 6.8E). There was an interaction
approaching significance between treatment and sex (Figure 6.8C;
p=0.07) in that whilst treated animals had greater MPO activity, these
levels rose more in male mice (2.8 fold) when compared to female mice
(1.5 fold). Interestingly whilst the female mice initially had lower levels of
MPO activity, after treatment MPO activity levels were higher than those of
the males (Figure 6.8C).
In the ileum there was no significant three way interaction, although it did
approach significance (Figure 6.9E; p=0.07). The treatment x sex
interaction was significant (Figure 6.9C; p=0.04), indicating that whilst
MPO activity of LPS treated male (18.1 ±3.5 mU/mg protein) and female
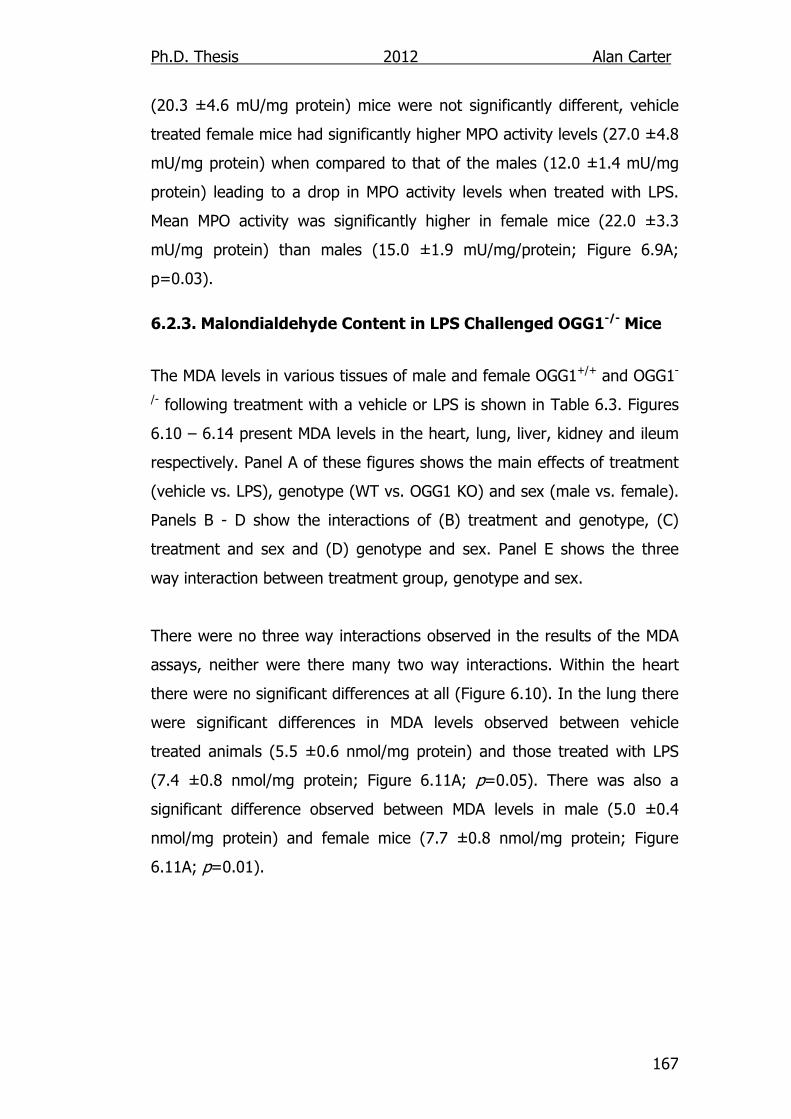
Ph.D. Thesis 2012 Alan Carter
167
(20.3 ±4.6 mU/mg protein) mice were not significantly different, vehicle
treated female mice had significantly higher MPO activity levels (27.0 ±4.8
mU/mg protein) when compared to that of the males (12.0 ±1.4 mU/mg
protein) leading to a drop in MPO activity levels when treated with LPS.
Mean MPO activity was significantly higher in female mice (22.0 ±3.3
mU/mg protein) than males (15.0 ±1.9 mU/mg/protein; Figure 6.9A;
p=0.03).
6.2.3. Malondialdehyde Content in LPS Challenged OGG1-/- Mice
The MDA levels in various tissues of male and female OGG1+/+ and OGG1-
/- following treatment with a vehicle or LPS is shown in Table 6.3. Figures
6.10 – 6.14 present MDA levels in the heart, lung, liver, kidney and ileum
respectively. Panel A of these figures shows the main effects of treatment
(vehicle vs. LPS), genotype (WT vs. OGG1 KO) and sex (male vs. female).
Panels B - D show the interactions of (B) treatment and genotype, (C)
treatment and sex and (D) genotype and sex. Panel E shows the three
way interaction between treatment group, genotype and sex.
There were no three way interactions observed in the results of the MDA
assays, neither were there many two way interactions. Within the heart
there were no significant differences at all (Figure 6.10). In the lung there
were significant differences in MDA levels observed between vehicle
treated animals (5.5 ±0.6 nmol/mg protein) and those treated with LPS
(7.4 ±0.8 nmol/mg protein; Figure 6.11A; p=0.05). There was also a
significant difference observed between MDA levels in male (5.0 ±0.4
nmol/mg protein) and female mice (7.7 ±0.8 nmol/mg protein; Figure
6.11A; p=0.01).
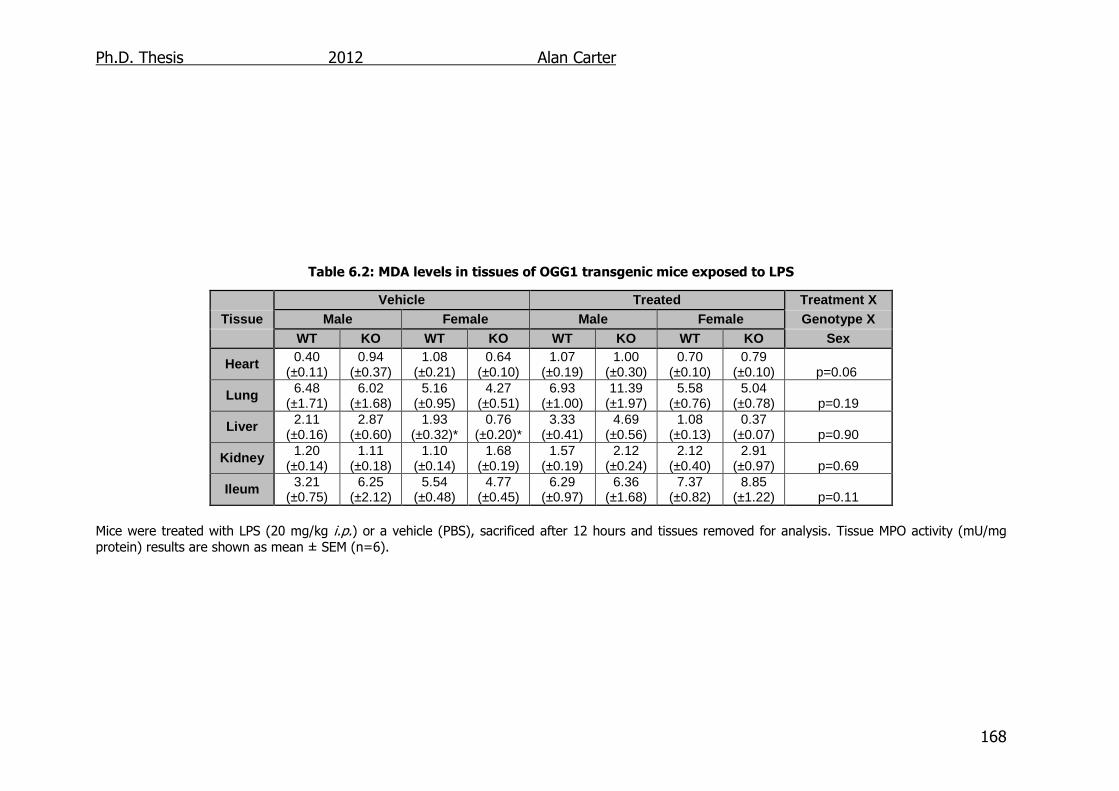
Ph.D. Thesis 2012 Alan Carter
168
Table 6.2: MDA levels in tissues of OGG1 transgenic mice exposed to LPS
Mice were treated with LPS (20 mg/kg i.p.) or a vehicle (PBS), sacrificed after 12 hours and tissues removed for analysis. Tissue MPO activity (mU/mg protein) results are shown as mean ± SEM (n=6).
Vehicle Treated Treatment X Tissue Male Female Male Female Genotype X
WT KO WT KO WT KO WT KO Sex
Heart 0.40 (±0.11)
0.94 (±0.37)
1.08 (±0.21)
0.64 (±0.10)
1.07 (±0.19)
1.00 (±0.30)
0.70 (±0.10)
0.79 (±0.10) p=0.06
Lung 6.48 (±1.71)
6.02 (±1.68)
5.16 (±0.95)
4.27 (±0.51)
6.93 (±1.00)
11.39 (±1.97)
5.58 (±0.76)
5.04 (±0.78) p=0.19
Liver 2.11 (±0.16)
2.87 (±0.60)
1.93 (±0.32)*
0.76 (±0.20)*
3.33 (±0.41)
4.69 (±0.56)
1.08 (±0.13)
0.37 (±0.07) p=0.90
Kidney 1.20 (±0.14)
1.11 (±0.18)
1.10 (±0.14)
1.68 (±0.19)
1.57 (±0.19)
2.12 (±0.24)
2.12 (±0.40)
2.91 (±0.97) p=0.69
Ileum 3.21 (±0.75)
6.25 (±2.12)
5.54 (±0.48)
4.77 (±0.45)
6.29 (±0.97)
6.36 (±1.68)
7.37 (±0.82)
8.85 (±1.22) p=0.11
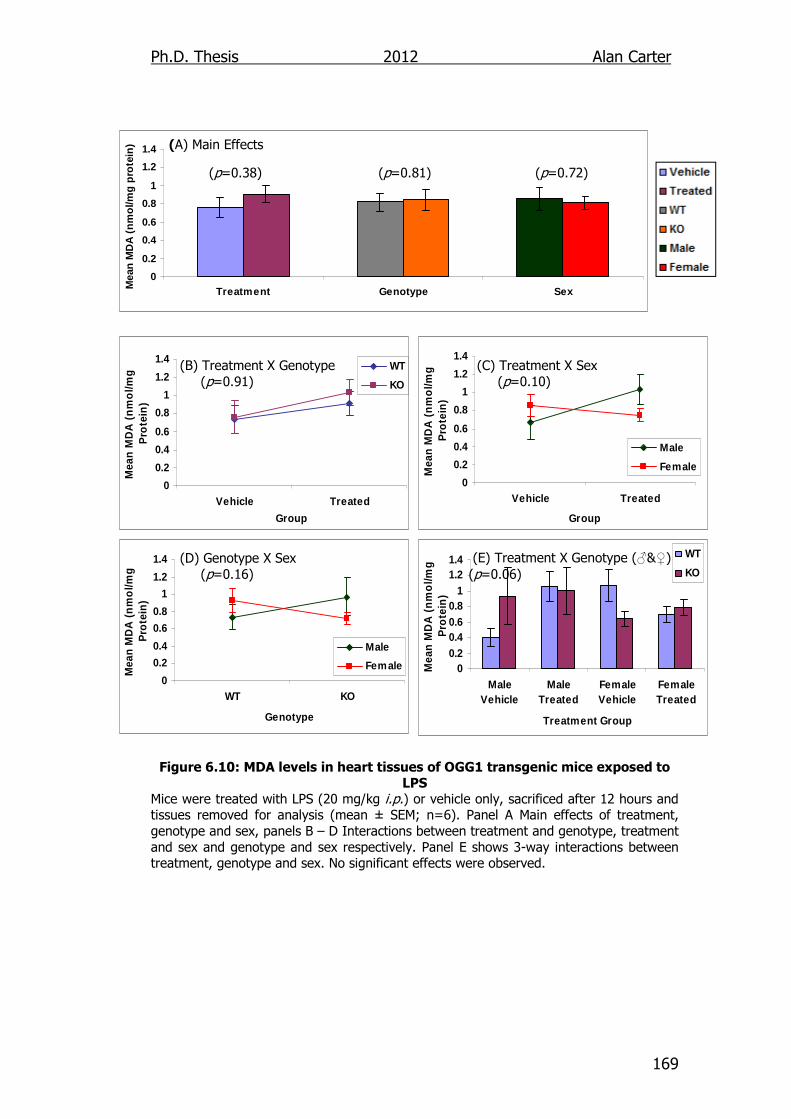
Ph.D. Thesis 2012 Alan Carter
169
0
0.2
0.4
0.6
0.8
1
1.2
1.4
Treatment Genotype SexMea
n M
DA
(n
mo
l/mg
pro
tein
)
0
0.2
0.4
0.6
0.8
1
1.2
1.4
Vehicle Treated
Group
Mea
n M
DA
(n
mo
l/mg
P
rote
in)
WT
KO
0
0.2
0.4
0.6
0.8
1
1.2
1.4
Vehicle Treated
Group
Mea
n M
DA
(n
mo
l/mg
P
rote
in)
Male
Female
0
0.2
0.4
0.6
0.8
1
1.2
1.4
WT KO
Genotype
Mea
n M
DA
(n
mo
l/mg
P
rote
in)
Male
Female 00.20.40.60.8
11.21.4
MaleVehicle
MaleTreated
FemaleVehicle
FemaleTreated
Treatment Group
Mea
n M
DA
(n
mo
l/mg
P
rote
in)
WT
KO
(A) Main Effects
(p=0.38) (p=0.81) (p=0.72)
(B) Treatment X Genotype (p=0.91) (D) Genotype X Sex (p=0.16)
(C) Treatment X Sex (p=0.10) (E) Treatment X Genotype (♂&♀) (p=0.06)
Figure 6.10: MDA levels in heart tissues of OGG1 transgenic mice exposed to LPS
Mice were treated with LPS (20 mg/kg i.p.) or vehicle only, sacrificed after 12 hours and tissues removed for analysis (mean ± SEM; n=6). Panel A Main effects of treatment, genotype and sex, panels B – D Interactions between treatment and genotype, treatment and sex and genotype and sex respectively. Panel E shows 3-way interactions between treatment, genotype and sex. No significant effects were observed.
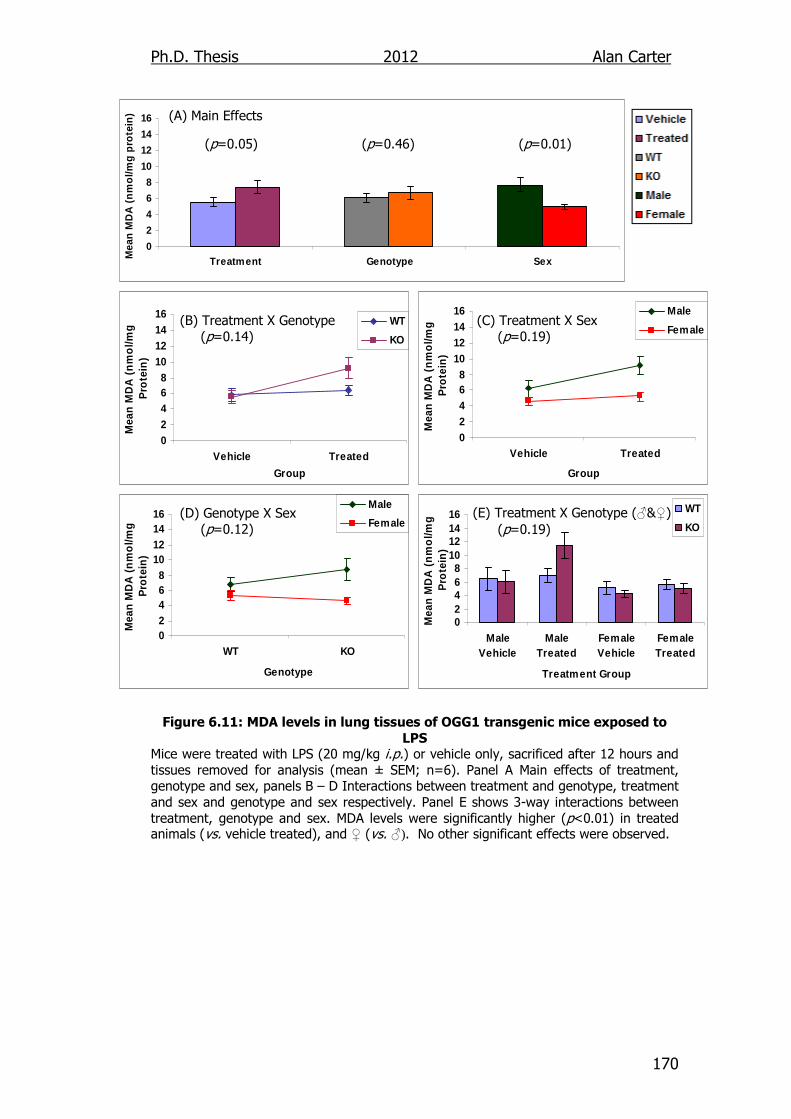
Ph.D. Thesis 2012 Alan Carter
170
0
2
4
6
8
10
12
14
16
Treatment Genotype SexMea
n M
DA
(n
mo
l/mg
pro
tein
)
02468
10121416
Vehicle Treated
Group
Mea
n M
DA
(n
mo
l/mg
P
rote
in)
WT
KO
02468
10121416
Vehicle Treated
Group
Mea
n M
DA
(n
mo
l/mg
P
rote
in)
Male
Female
02468
10121416
WT KO
Genotype
Mea
n M
DA
(n
mo
l/mg
P
rote
in)
Male
Female
02468
10121416
MaleVehicle
MaleTreated
FemaleVehicle
FemaleTreated
Treatment Group
Mea
n M
DA
(n
mo
l/mg
P
rote
in)
WT
KO
(A) Main Effects
(p=0.05) (p=0.46) (p=0.01) (B) Treatment X Genotype (p=0.14) (D) Genotype X Sex (p=0.12)
(C) Treatment X Sex (p=0.19) (E) Treatment X Genotype (♂&♀) (p=0.19)
Figure 6.11: MDA levels in lung tissues of OGG1 transgenic mice exposed to
LPS Mice were treated with LPS (20 mg/kg i.p.) or vehicle only, sacrificed after 12 hours and tissues removed for analysis (mean ± SEM; n=6). Panel A Main effects of treatment, genotype and sex, panels B – D Interactions between treatment and genotype, treatment and sex and genotype and sex respectively. Panel E shows 3-way interactions between treatment, genotype and sex. MDA levels were significantly higher (p<0.01) in treated animals (vs. vehicle treated), and ♀ (vs. ♂). No other significant effects were observed.
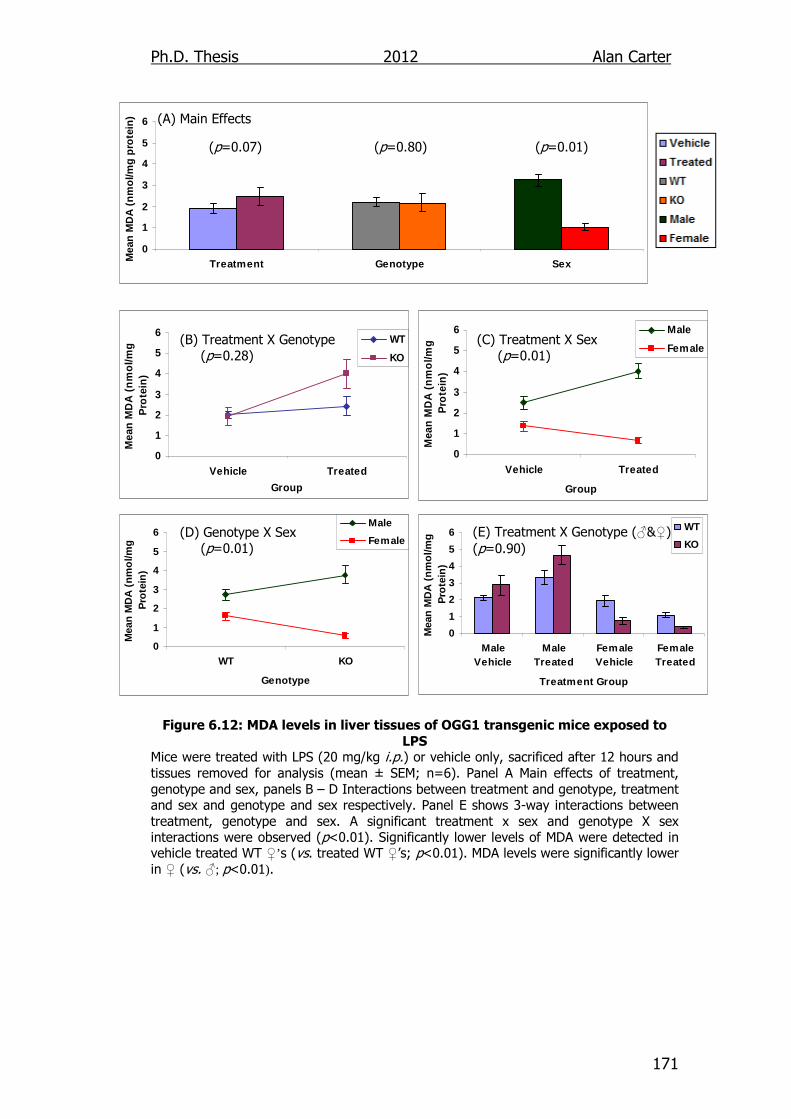
Ph.D. Thesis 2012 Alan Carter
171
0
1
2
3
4
5
6
Treatment Genotype SexMea
n M
DA
(n
mo
l/mg
pro
tein
)
0
1
2
3
4
5
6
Vehicle Treated
Group
Mea
n M
DA
(n
mo
l/mg
P
rote
in)
WT
KO
0
1
2
3
4
5
6
Vehicle Treated
Group
Mea
n M
DA
(n
mo
l/mg
P
rote
in)
Male
Female
0
1
2
3
4
5
6
WT KO
Genotype
Mea
n M
DA
(n
mo
l/mg
P
rote
in)
Male
Female
0
1
2
3
4
5
6
MaleVehicle
MaleTreated
FemaleVehicle
FemaleTreated
Treatment Group
Mea
n M
DA
(n
mo
l/mg
P
rote
in)
WT
KO
(A) Main Effects
(p=0.07) (p=0.80) (p=0.01)
(B) Treatment X Genotype (p=0.28) (D) Genotype X Sex (p=0.01)
(C) Treatment X Sex (p=0.01) (E) Treatment X Genotype (♂&♀) (p=0.90)
Figure 6.12: MDA levels in liver tissues of OGG1 transgenic mice exposed to
LPS Mice were treated with LPS (20 mg/kg i.p.) or vehicle only, sacrificed after 12 hours and tissues removed for analysis (mean ± SEM; n=6). Panel A Main effects of treatment, genotype and sex, panels B – D Interactions between treatment and genotype, treatment and sex and genotype and sex respectively. Panel E shows 3-way interactions between treatment, genotype and sex. A significant treatment x sex and genotype X sex interactions were observed (p<0.01). Significantly lower levels of MDA were detected in vehicle treated WT ♀’s (vs. treated WT ♀’s; p<0.01). MDA levels were significantly lower in ♀ (vs. ♂; p<0.01).
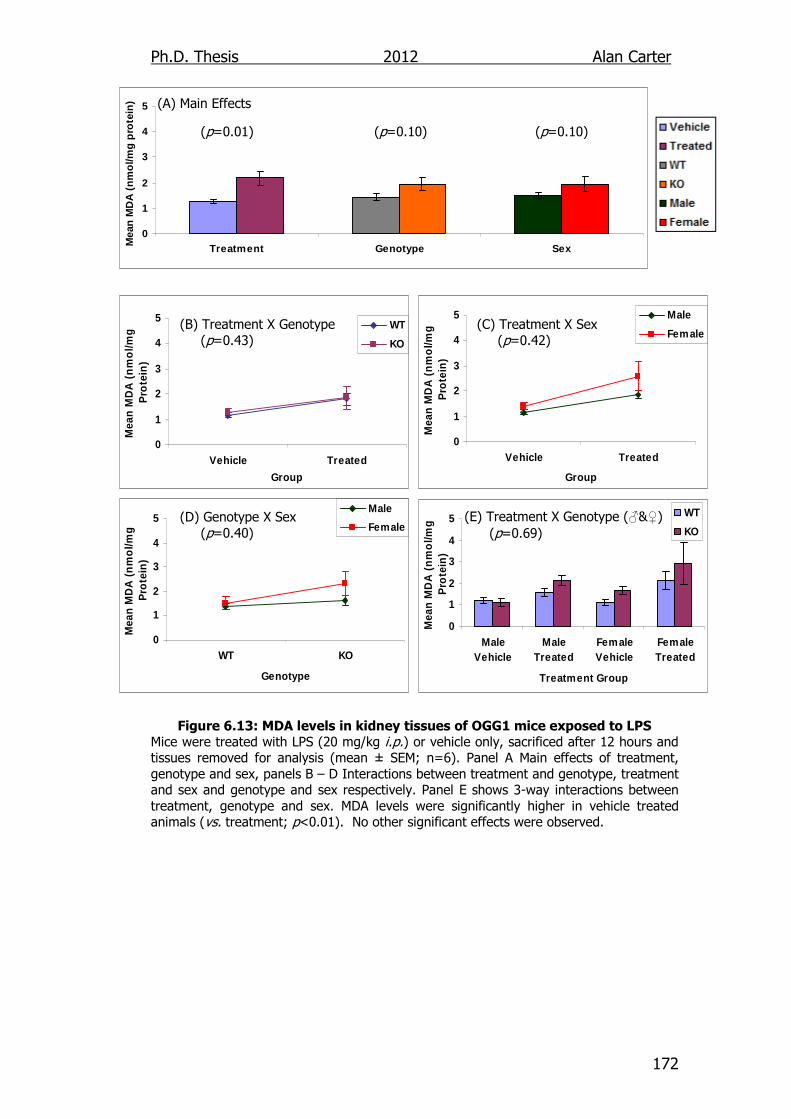
Ph.D. Thesis 2012 Alan Carter
172
0
1
2
3
4
5
Treatment Genotype SexMea
n M
DA
(n
mo
l/mg
pro
tein
)
0
1
2
3
4
5
Vehicle Treated
Group
Mea
n M
DA
(n
mo
l/mg
P
rote
in)
WT
KO
0
1
2
3
4
5
Vehicle Treated
Group
Mea
n M
DA
(n
mo
l/mg
P
rote
in)
Male
Female
0
1
2
3
4
5
WT KO
Genotype
Mea
n M
DA
(n
mo
l/mg
P
rote
in)
Male
Female
0
1
2
3
4
5
MaleVehicle
MaleTreated
FemaleVehicle
FemaleTreated
Treatment Group
Mea
n M
DA
(n
mo
l/mg
P
rote
in)
WT
KO
(A) Main Effects
(p=0.01) (p=0.10) (p=0.10)
(B) Treatment X Genotype (p=0.43) (D) Genotype X Sex (p=0.40)
(C) Treatment X Sex (p=0.42) (E) Treatment X Genotype (♂&♀) (p=0.69)
Figure 6.13: MDA levels in kidney tissues of OGG1 mice exposed to LPS Mice were treated with LPS (20 mg/kg i.p.) or vehicle only, sacrificed after 12 hours and tissues removed for analysis (mean ± SEM; n=6). Panel A Main effects of treatment, genotype and sex, panels B – D Interactions between treatment and genotype, treatment and sex and genotype and sex respectively. Panel E shows 3-way interactions between treatment, genotype and sex. MDA levels were significantly higher in vehicle treated animals (vs. treatment; p<0.01). No other significant effects were observed.

Ph.D. Thesis 2012 Alan Carter
173
0
2
4
6
8
10
12
Treatment Genotype SexMea
n M
DA
(n
mo
l/mg
pro
tein
)
0
2
4
6
8
10
12
Vehicle Treated
Group
Mea
n M
DA
(n
mo
l/mg
P
rote
in)
WT
KO
0
2
4
6
8
10
12
Vehicle Treated
Group
Mea
n M
DA
(n
mo
l/mg
P
rote
in)
Male
Female
0
2
4
6
8
10
12
WT KO
Genotype
Mea
n M
DA
(n
mo
l/mg
P
rote
in)
Male
Female
0
2
4
6
8
10
12
MaleVehicle
MaleTreated
FemaleVehicle
FemaleTreated
Treatment Group
Mea
n M
DA
(n
mo
l/mg
P
rote
in)
WT
KO
(A) Main Effects
(p=0.01) (p=0.24) (p=0.18)
(B) Treatment X Genotype (p=0.83) (D) Genotype X Sex (p=0.46)
(C) Treatment X Sex (p=0.40) (E) Treatment X Genotype (♂&♀) (p=0.11)
Figure 6.14: MDA levels in ileum tissues of OGG1 transgenic mice exposed to
LPS Mice were treated with LPS (20 mg/kg i.p.) or vehicle only, sacrificed after 12 hours and tissues removed for analysis (mean ± SEM; n=6). Panel A Main effects of treatment, genotype and sex, panels B – D Interactions between treatment and genotype, treatment and sex and genotype and sex respectively. Panel E shows 3-way interactions between treatment, genotype and sex. MDA levels were significantly higher in treated animals (vs. vehicle treated; p<0.01). No other significant effects were observed.
Ph.D. Thesis 2012 Alan Carter
174
In liver tissues significant treatment x sex (Figure 6.12C; p=0.01) and
genotype x sex (Figure 6.12D; p=0.01) interactions were observed. The
treatment x sex interaction reflects that whilst the male animals
responded to the LPS treatment with an increase in MDA (1.6 fold), there
was a decrease observed in the female animals (0.5 fold). Similarly whilst
there was an increase in MDA levels (1.4 fold) in liver tissues from male
mice due to the knockout of the OGG1 gene, the female animals seemed
to have a decrease in MDA levels (0.4 fold) in the liver.
In the kidney, there was only one significant difference and that was
between the two treatment groups (Figure 6.13A), the vehicle treated
animals had significantly lower levels of MDA (1.3 ±0.1 nmol/mg protein)
than those of the animals treated with LPS (2.2 ±0.3 nmol/mg protein;
p=0.01). Similarly this was the only difference in the ileum tissues
showing again that vehicle treated animals had lower levels of MDA (4.9
±1.0 nmol/mg protein) than those treated with LPS (7.2 ±0.6 nmol/mg
protein; Figure 6.14A; p=0.01). There were no other significant
differences at any level in both organs.
6.2.1. Glutathione Activity in LPS Challenged OGG1-/- Mice
The GSH levels in various tissues of male and female OGG1+/+ and OGG1-
/- mice following treatment with a vehicle or LPS is shown in Table 6.4.
Figures 6.15 – 6.19 present GSH activity levels in the heart, lung, liver,
kidney and ileum respectively. Panel A of these figures shows the main
effects of treatment (vehicle vs. LPS), genotype (WT vs. OGG1 KO) and
sex (male vs. female). Panels B - D show the interactions of (B) treatment
and genotype, (C) treatment and sex and (D) genotype and sex. Panel E
shows the three way interaction between treatment, genotype and sex.
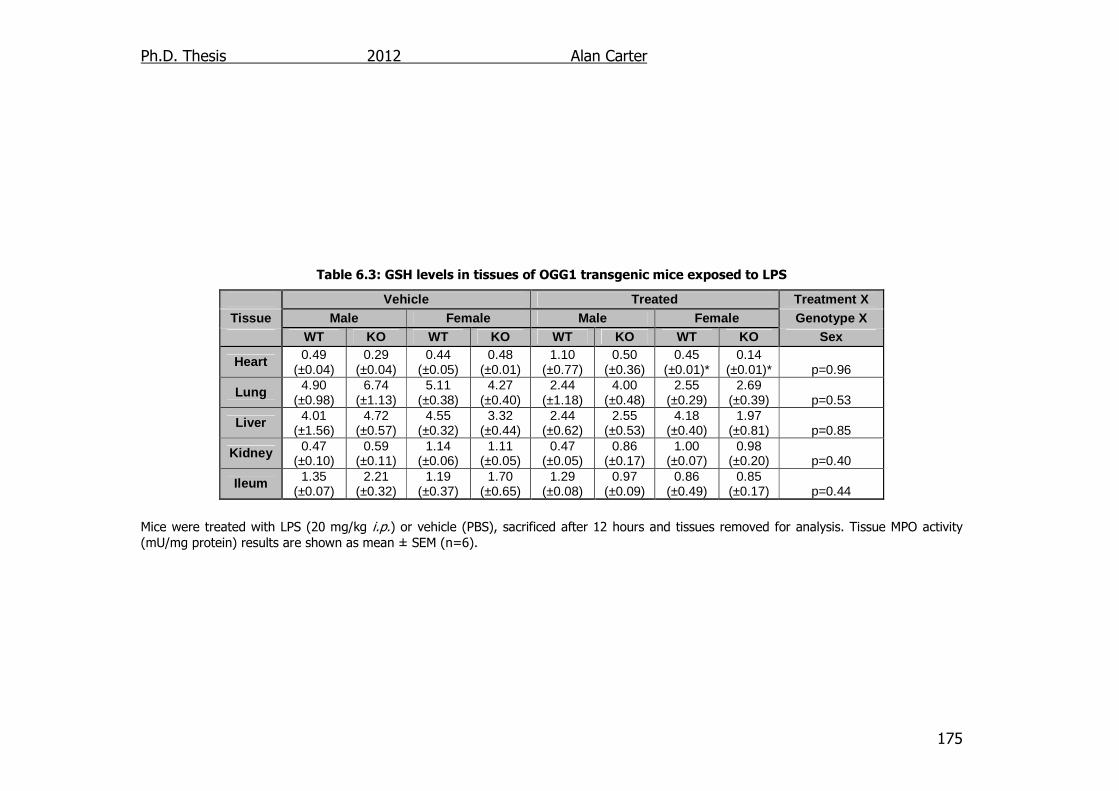
Ph.D. Thesis 2012 Alan Carter
175
Table 6.3: GSH levels in tissues of OGG1 transgenic mice exposed to LPS
Mice were treated with LPS (20 mg/kg i.p.) or vehicle (PBS), sacrificed after 12 hours and tissues removed for analysis. Tissue MPO activity (mU/mg protein) results are shown as mean ± SEM (n=6).
Vehicle Treated Treatment X Tissue Male Female Male Female Genotype X
WT KO WT KO WT KO WT KO Sex
Heart 0.49 (±0.04)
0.29 (±0.04)
0.44 (±0.05)
0.48 (±0.01)
1.10 (±0.77)
0.50 (±0.36)
0.45 (±0.01)*
0.14 (±0.01)* p=0.96
Lung 4.90 (±0.98)
6.74 (±1.13)
5.11 (±0.38)
4.27 (±0.40)
2.44 (±1.18)
4.00 (±0.48)
2.55 (±0.29)
2.69 (±0.39) p=0.53
Liver 4.01 (±1.56)
4.72 (±0.57)
4.55 (±0.32)
3.32 (±0.44)
2.44 (±0.62)
2.55 (±0.53)
4.18 (±0.40)
1.97 (±0.81) p=0.85
Kidney 0.47 (±0.10)
0.59 (±0.11)
1.14 (±0.06)
1.11 (±0.05)
0.47 (±0.05)
0.86 (±0.17)
1.00 (±0.07)
0.98 (±0.20) p=0.40
Ileum 1.35 (±0.07)
2.21 (±0.32)
1.19 (±0.37)
1.70 (±0.65)
1.29 (±0.08)
0.97 (±0.09)
0.86 (±0.49)
0.85 (±0.17) p=0.44
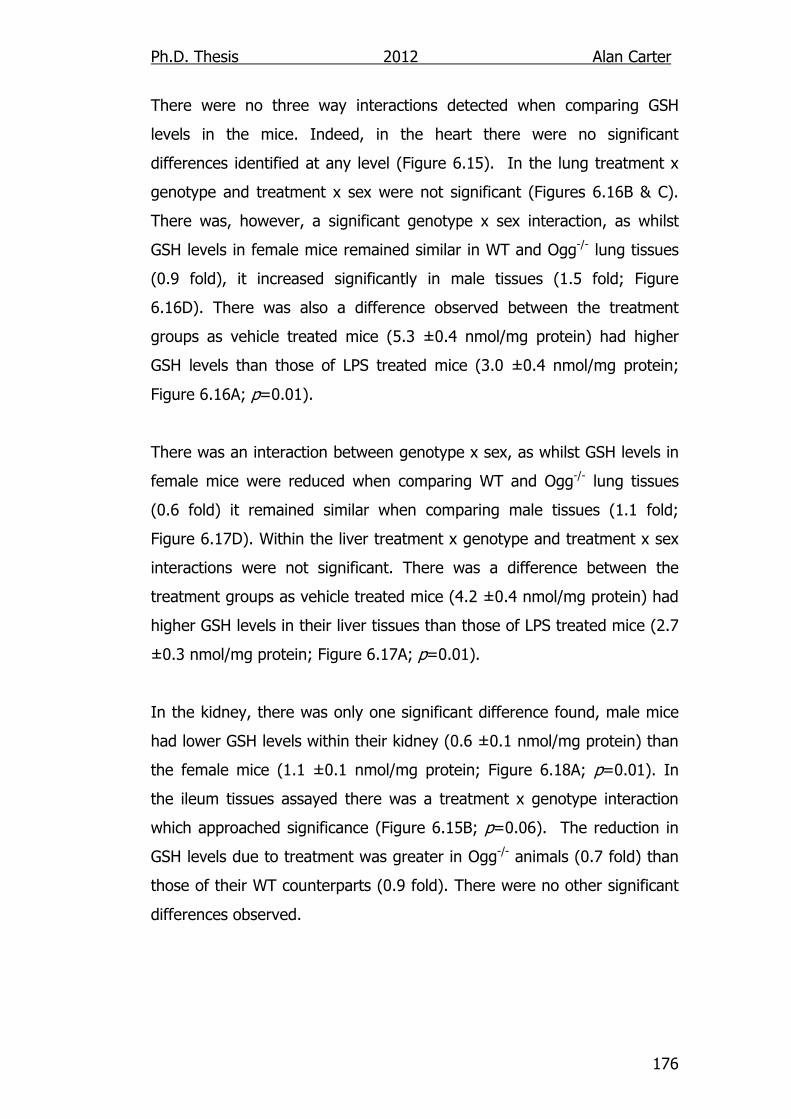
Ph.D. Thesis 2012 Alan Carter
176
There were no three way interactions detected when comparing GSH
levels in the mice. Indeed, in the heart there were no significant
differences identified at any level (Figure 6.15). In the lung treatment x
genotype and treatment x sex were not significant (Figures 6.16B & C).
There was, however, a significant genotype x sex interaction, as whilst
GSH levels in female mice remained similar in WT and Ogg-/- lung tissues
(0.9 fold), it increased significantly in male tissues (1.5 fold; Figure
6.16D). There was also a difference observed between the treatment
groups as vehicle treated mice (5.3 ±0.4 nmol/mg protein) had higher
GSH levels than those of LPS treated mice (3.0 ±0.4 nmol/mg protein;
Figure 6.16A; p=0.01).
There was an interaction between genotype x sex, as whilst GSH levels in
female mice were reduced when comparing WT and Ogg-/- lung tissues
(0.6 fold) it remained similar when comparing male tissues (1.1 fold;
Figure 6.17D). Within the liver treatment x genotype and treatment x sex
interactions were not significant. There was a difference between the
treatment groups as vehicle treated mice (4.2 ±0.4 nmol/mg protein) had
higher GSH levels in their liver tissues than those of LPS treated mice (2.7
±0.3 nmol/mg protein; Figure 6.17A; p=0.01).
In the kidney, there was only one significant difference found, male mice
had lower GSH levels within their kidney (0.6 ±0.1 nmol/mg protein) than
the female mice (1.1 ±0.1 nmol/mg protein; Figure 6.18A; p=0.01). In
the ileum tissues assayed there was a treatment x genotype interaction
which approached significance (Figure 6.15B; p=0.06). The reduction in
GSH levels due to treatment was greater in Ogg-/- animals (0.7 fold) than
those of their WT counterparts (0.9 fold). There were no other significant
differences observed.
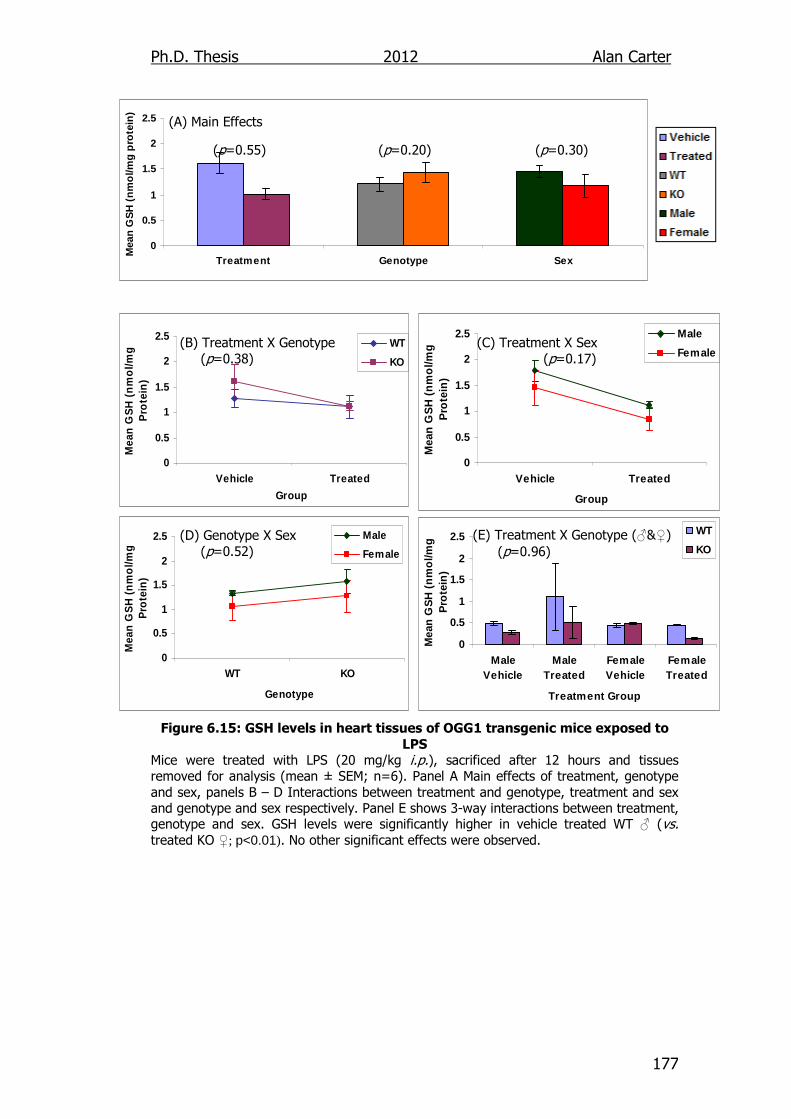
Ph.D. Thesis 2012 Alan Carter
177
0
0.5
1
1.5
2
2.5
Treatment Genotype Sex
Mea
n G
SH
(n
mo
l/mg
pro
tein
)
0
0.5
1
1.5
2
2.5
Vehicle Treated
Group
Mea
n G
SH
(n
mo
l/mg
P
rote
in)
WT
KO
0
0.5
1
1.5
2
2.5
Vehicle Treated
Group
Mea
n G
SH
(n
mo
l/mg
P
rote
in)
Male
Female
0
0.5
1
1.5
2
2.5
WT KO
Genotype
Mea
n G
SH
(n
mo
l/mg
P
rote
in)
Male
Female
0
0.5
1
1.5
2
2.5
MaleVehicle
MaleTreated
FemaleVehicle
FemaleTreated
Treatment Group
Mea
n G
SH
(n
mo
l/mg
P
rote
in)
WT
KO
(A) Main Effects
(p=0.55) (p=0.20) (p=0.30)
(B) Treatment X Genotype (p=0.38) (D) Genotype X Sex (p=0.52)
(C) Treatment X Sex (p=0.17) (E) Treatment X Genotype (♂&♀) (p=0.96)
Figure 6.15: GSH levels in heart tissues of OGG1 transgenic mice exposed to
LPS Mice were treated with LPS (20 mg/kg i.p.), sacrificed after 12 hours and tissues removed for analysis (mean ± SEM; n=6). Panel A Main effects of treatment, genotype and sex, panels B – D Interactions between treatment and genotype, treatment and sex and genotype and sex respectively. Panel E shows 3-way interactions between treatment, genotype and sex. GSH levels were significantly higher in vehicle treated WT ♂ (vs. treated KO ♀; p<0.01). No other significant effects were observed.
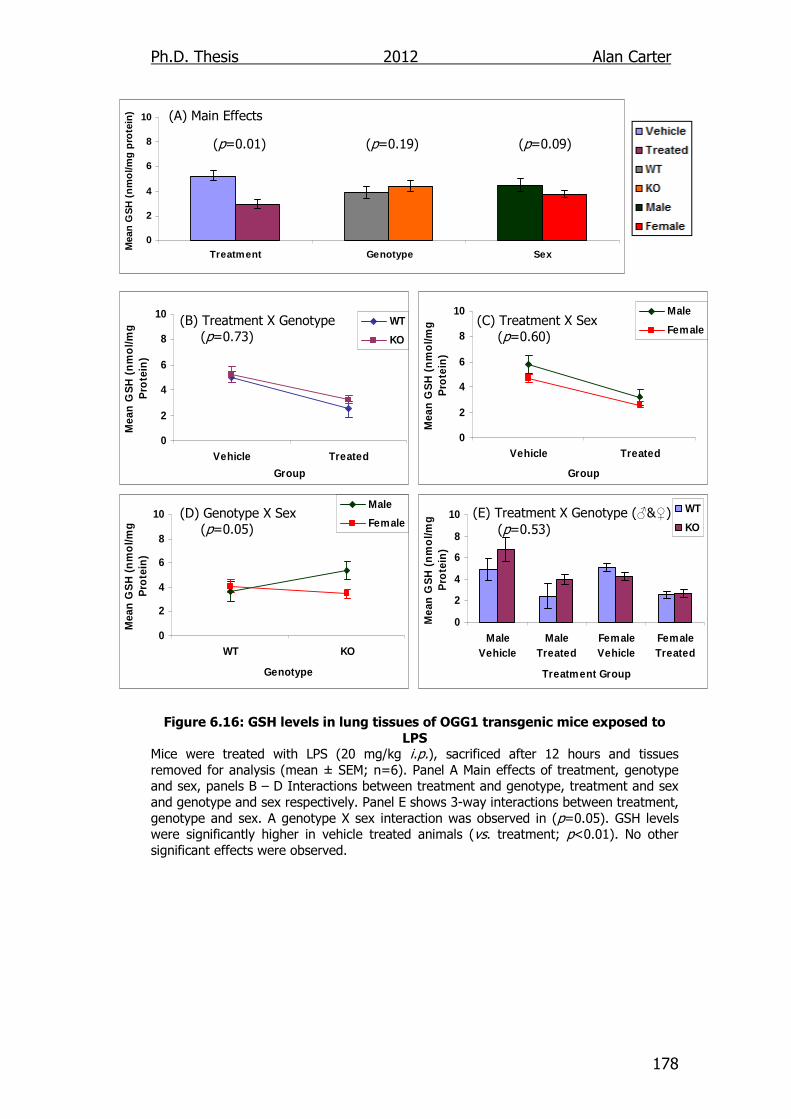
Ph.D. Thesis 2012 Alan Carter
178
0
2
4
6
8
10
Treatment Genotype Sex
Mea
n G
SH
(n
mo
l/mg
pro
tein
)
0
2
4
6
8
10
Vehicle Treated
Group
Mea
n G
SH
(n
mo
l/mg
P
rote
in)
WT
KO
0
2
4
6
8
10
Vehicle Treated
Group
Mea
n G
SH
(n
mo
l/mg
P
rote
in)
Male
Female
0
2
4
6
8
10
WT KO
Genotype
Mea
n G
SH
(n
mo
l/mg
P
rote
in)
Male
Female
0
2
4
6
8
10
MaleVehicle
MaleTreated
FemaleVehicle
FemaleTreated
Treatment Group
Mea
n G
SH
(n
mo
l/mg
P
rote
in)
WT
KO
(A) Main Effects
(p=0.01) (p=0.19) (p=0.09) (B) Treatment X Genotype (p=0.73) (D) Genotype X Sex (p=0.05)
(C) Treatment X Sex (p=0.60) (E) Treatment X Genotype (♂&♀) (p=0.53)
Figure 6.16: GSH levels in lung tissues of OGG1 transgenic mice exposed to
LPS Mice were treated with LPS (20 mg/kg i.p.), sacrificed after 12 hours and tissues removed for analysis (mean ± SEM; n=6). Panel A Main effects of treatment, genotype and sex, panels B – D Interactions between treatment and genotype, treatment and sex and genotype and sex respectively. Panel E shows 3-way interactions between treatment, genotype and sex. A genotype X sex interaction was observed in (p=0.05). GSH levels were significantly higher in vehicle treated animals (vs. treatment; p<0.01). No other significant effects were observed.
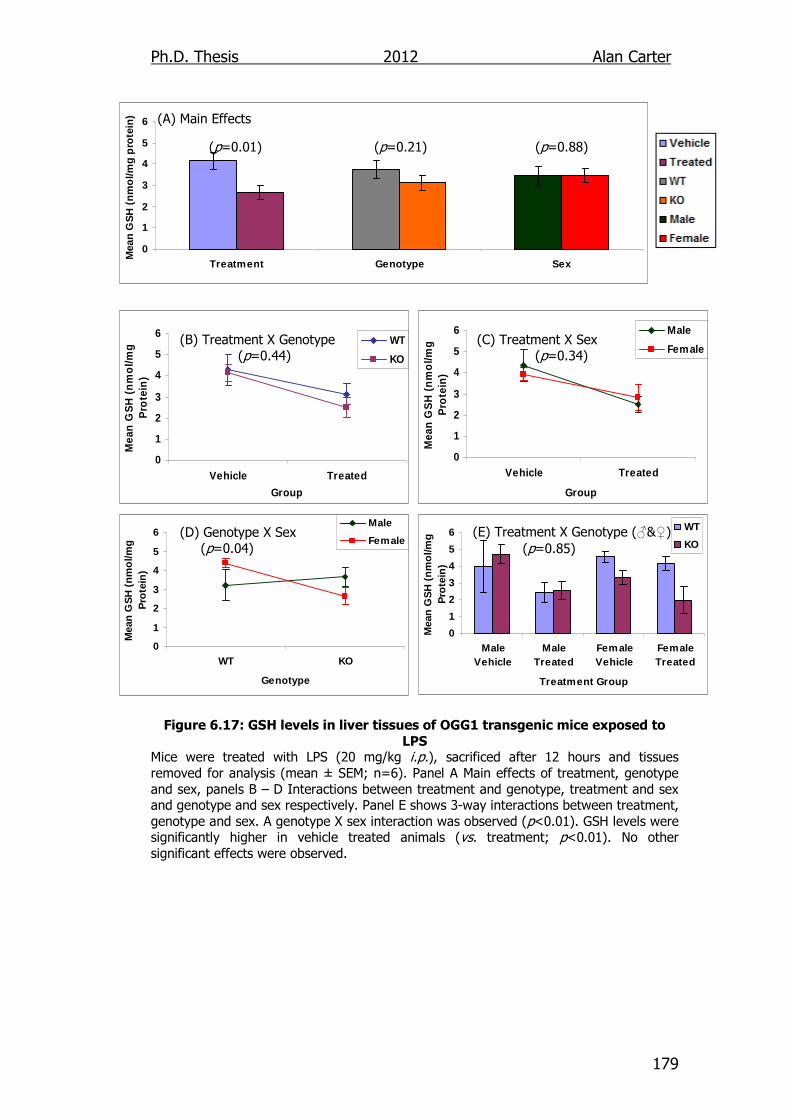
Ph.D. Thesis 2012 Alan Carter
179
0
1
2
3
4
5
6
Treatment Genotype Sex
Mea
n G
SH
(n
mo
l/mg
pro
tein
)
0
1
2
3
4
5
6
Vehicle Treated
Group
Mea
n G
SH
(n
mo
l/mg
P
rote
in)
WT
KO
0
1
2
3
4
5
6
Vehicle Treated
Group
Mea
n G
SH
(n
mo
l/mg
P
rote
in)
Male
Female
0
1
2
3
4
5
6
WT KO
Genotype
Mea
n G
SH
(n
mo
l/mg
P
rote
in)
Male
Female
0
1
2
3
4
5
6
MaleVehicle
MaleTreated
FemaleVehicle
FemaleTreated
Treatment Group
Mea
n G
SH
(n
mo
l/mg
P
rote
in)
WT
KO
(A) Main Effects
(p=0.01) (p=0.21) (p=0.88)
(B) Treatment X Genotype (p=0.44) (D) Genotype X Sex (p=0.04)
(C) Treatment X Sex (p=0.34) (E) Treatment X Genotype (♂&♀) (p=0.85)
Figure 6.17: GSH levels in liver tissues of OGG1 transgenic mice exposed to
LPS Mice were treated with LPS (20 mg/kg i.p.), sacrificed after 12 hours and tissues removed for analysis (mean ± SEM; n=6). Panel A Main effects of treatment, genotype and sex, panels B – D Interactions between treatment and genotype, treatment and sex and genotype and sex respectively. Panel E shows 3-way interactions between treatment, genotype and sex. A genotype X sex interaction was observed (p<0.01). GSH levels were significantly higher in vehicle treated animals (vs. treatment; p<0.01). No other significant effects were observed.
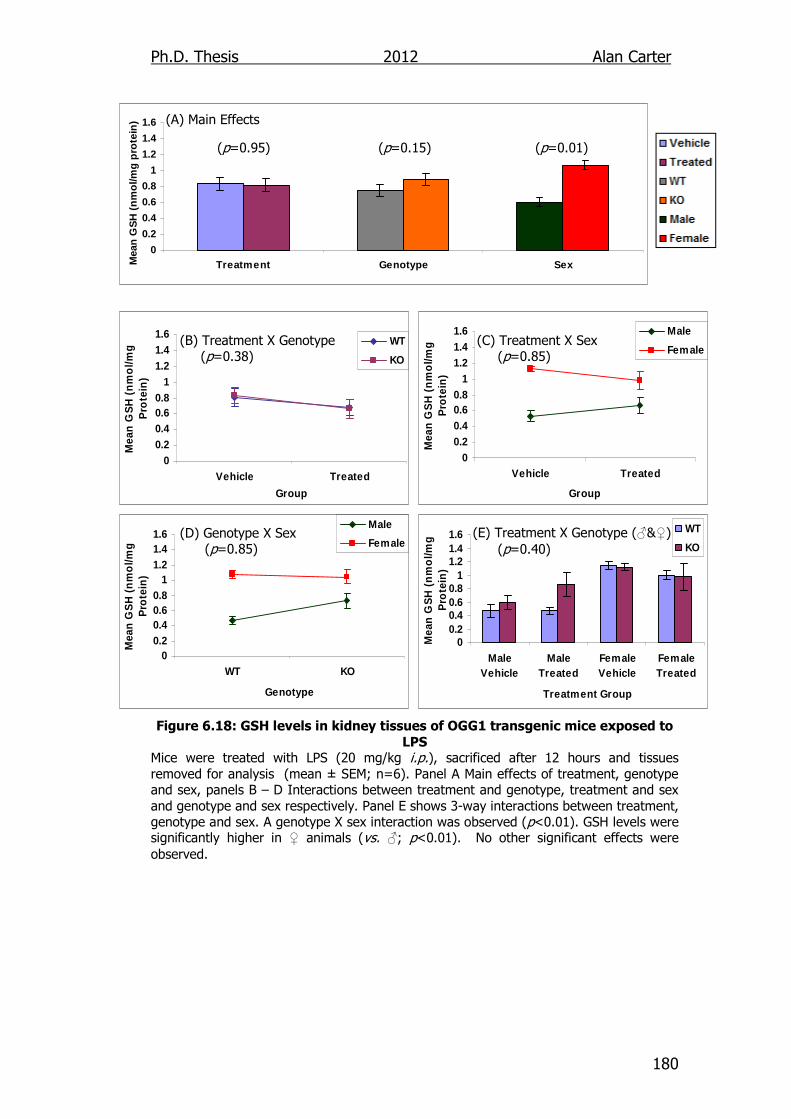
Ph.D. Thesis 2012 Alan Carter
180
0
0.2
0.4
0.6
0.8
1
1.2
1.4
1.6
Treatment Genotype SexMea
n G
SH
(n
mo
l/mg
pro
tein
)
00.20.40.60.8
11.21.41.6
Vehicle Treated
Group
Mea
n G
SH
(n
mo
l/mg
P
rote
in)
WT
KO
00.20.40.60.8
11.21.41.6
Vehicle Treated
Group
Mea
n G
SH
(n
mo
l/mg
P
rote
in)
Male
Female
00.20.40.60.8
11.21.41.6
WT KO
Genotype
Mea
n G
SH
(n
mo
l/mg
P
rote
in)
Male
Female
00.20.40.60.8
11.21.41.6
MaleVehicle
MaleTreated
FemaleVehicle
FemaleTreated
Treatment Group
Mea
n G
SH
(n
mo
l/mg
P
rote
in)
WT
KO
(A) Main Effects
(p=0.95) (p=0.15) (p=0.01)
(B) Treatment X Genotype (p=0.38) (D) Genotype X Sex (p=0.85)
(C) Treatment X Sex (p=0.85) (E) Treatment X Genotype (♂&♀) (p=0.40)
Figure 6.18: GSH levels in kidney tissues of OGG1 transgenic mice exposed to
LPS Mice were treated with LPS (20 mg/kg i.p.), sacrificed after 12 hours and tissues removed for analysis (mean ± SEM; n=6). Panel A Main effects of treatment, genotype and sex, panels B – D Interactions between treatment and genotype, treatment and sex and genotype and sex respectively. Panel E shows 3-way interactions between treatment, genotype and sex. A genotype X sex interaction was observed (p<0.01). GSH levels were significantly higher in ♀ animals (vs. ♂; p<0.01). No other significant effects were observed.

Ph.D. Thesis 2012 Alan Carter
181
0
0.5
1
1.5
2
2.5
3
Treatment Genotype Sex
Mea
n G
SH
(n
mo
l/mg
pro
tein
)
0
0.5
1
1.5
2
2.5
3
Vehicle Treated
Group
Mea
n G
SH
(n
mo
l/mg
P
rote
in)
WT
KO
0
0.5
1
1.5
2
2.5
3
Vehicle Treated
Group
Mea
n G
SH
(n
mo
l/mg
P
rote
in)
Male
Female
0
0.5
1
1.5
2
2.5
3
WT KO
Genotype
Mea
n G
SH
(n
mo
l/mg
P
rote
in)
Male
Female
0
0.5
1
1.5
2
2.5
3
MaleVehicle
MaleTreated
FemaleVehicle
FemaleTreated
Treatment Group
Mea
n G
SH
(n
mo
l/mg
P
rote
in)
WT
KO
(A) Main Effects
(p=0.01) (p=0.25) (p=0.17)
(B) Treatment X Genotype (p=0.06) (D) Genotype X Sex (p=0.97)
(C) Treatment X Sex (p=0.89) (E) Treatment X Genotype (♂&♀) (p=0.44)
Figure 6.19: GSH levels in ileum tissues of OGG1 mice exposed to LPS Mice were treated with LPS (20 mg/kg i.p.), sacrificed after 12 hours and tissues removed for analysis (mean ± SEM; n=6). Panel A Main effects of treatment, genotype and sex, panels B – D Interactions between treatment and genotype, treatment and sex and genotype and sex respectively. Panel E shows 3-way interactions between treatment, genotype and sex. GSH levels were significantly higher in vehicle treated animals (vs. treated; p<0.01).
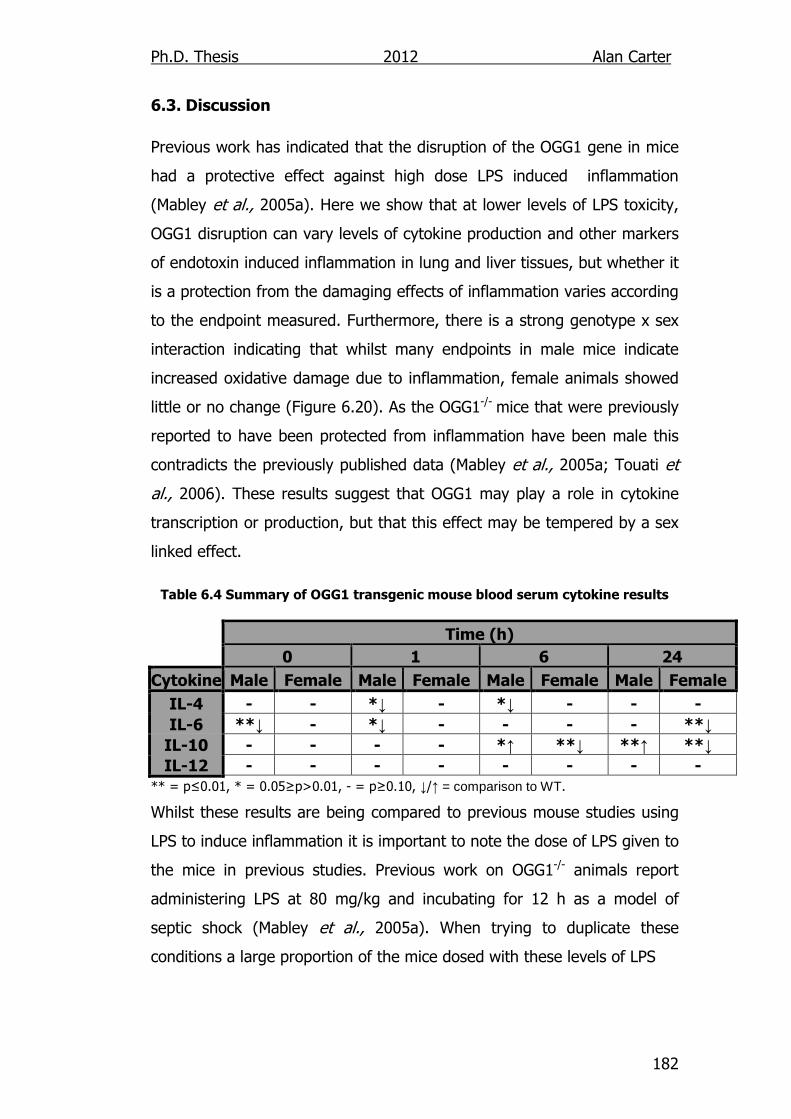
Ph.D. Thesis 2012 Alan Carter
182
6.3. Discussion Previous work has indicated that the disruption of the OGG1 gene in mice
had a protective effect against high dose LPS induced inflammation
(Mabley et al., 2005a). Here we show that at lower levels of LPS toxicity,
OGG1 disruption can vary levels of cytokine production and other markers
of endotoxin induced inflammation in lung and liver tissues, but whether it
is a protection from the damaging effects of inflammation varies according
to the endpoint measured. Furthermore, there is a strong genotype x sex
interaction indicating that whilst many endpoints in male mice indicate
increased oxidative damage due to inflammation, female animals showed
little or no change (Figure 6.20). As the OGG1-/- mice that were previously
reported to have been protected from inflammation have been male this
contradicts the previously published data (Mabley et al., 2005a; Touati et
al., 2006). These results suggest that OGG1 may play a role in cytokine
transcription or production, but that this effect may be tempered by a sex
linked effect.
Table 6.4 Summary of OGG1 transgenic mouse blood serum cytokine results
** = p≤0.01, * = 0.05≥p>0.01, - = p≥0.10, ↓/↑ = comparison to WT.
Whilst these results are being compared to previous mouse studies using
LPS to induce inflammation it is important to note the dose of LPS given to
the mice in previous studies. Previous work on OGG1-/- animals report
administering LPS at 80 mg/kg and incubating for 12 h as a model of
septic shock (Mabley et al., 2005a). When trying to duplicate these
conditions a large proportion of the mice dosed with these levels of LPS
Time (h)
0 1 6 24
Cytokine Male Female Male Female Male Female Male Female
IL-4 - - *↓ - *↓ - - -
IL-6 **↓ - *↓ - - - - **↓
IL-10 - - - - *↑ **↓ **↑ **↓
IL-12 - - - - - - - -
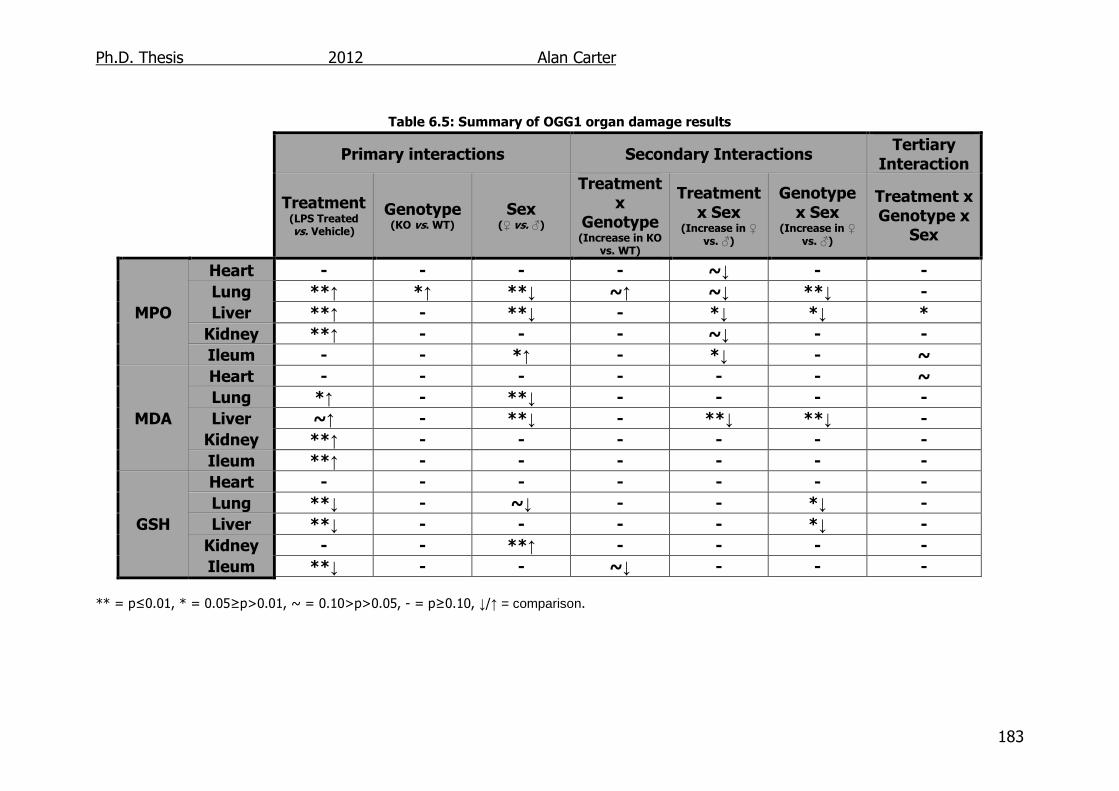
Ph.D. Thesis 2012 Alan Carter
183
Table 6.5: Summary of OGG1 organ damage results
** = p≤0.01, * = 0.05≥p>0.01, ~ = 0.10>p>0.05, - = p≥0.10, ↓/↑ = comparison.
Primary interactions Secondary Interactions Tertiary
Interaction
Treatment (LPS Treated vs. Vehicle)
Genotype (KO vs. WT)
Sex (♀ vs. ♂)
Treatment x
Genotype (Increase in KO
vs. WT)
Treatment x Sex
(Increase in ♀ vs. ♂)
Genotype x Sex
(Increase in ♀ vs. ♂)
Treatment x Genotype x
Sex
MPO
Heart - - - - ~↓ - -
Lung **↑ *↑ **↓ ~↑ ~↓ **↓ -
Liver **↑ - **↓ - *↓ *↓ *
Kidney **↑ - - - ~↓ - -
Ileum - - *↑ - *↓ - ~
MDA
Heart - - - - - - ~
Lung *↑ - **↓ - - - -
Liver ~↑ - **↓ - **↓ **↓ -
Kidney **↑ - - - - - -
Ileum **↑ - - - - - -
GSH
Heart - - - - - - -
Lung **↓ - ~↓ - - *↓ -
Liver **↓ - - - - *↓ -
Kidney - - **↑ - - - -
Ileum **↓ - - ~↓ - - -
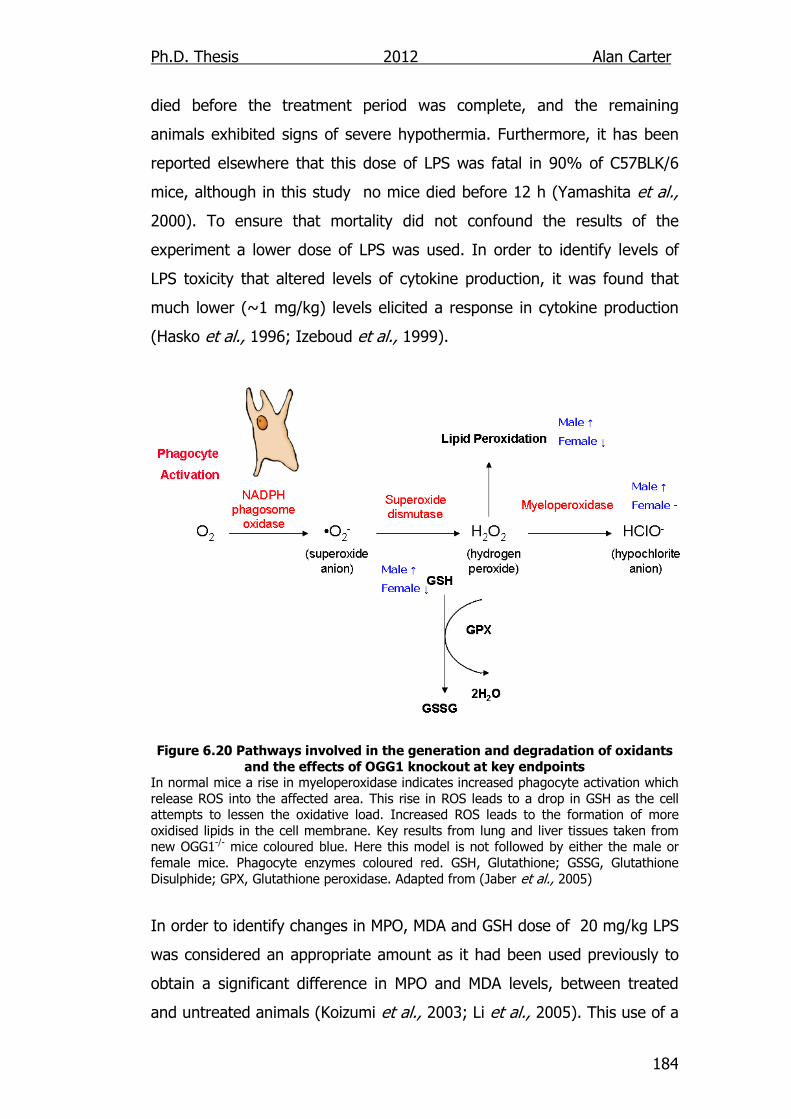
Ph.D. Thesis 2012 Alan Carter
184
died before the treatment period was complete, and the remaining
animals exhibited signs of severe hypothermia. Furthermore, it has been
reported elsewhere that this dose of LPS was fatal in 90% of C57BLK/6
mice, although in this study no mice died before 12 h (Yamashita et al.,
2000). To ensure that mortality did not confound the results of the
experiment a lower dose of LPS was used. In order to identify levels of
LPS toxicity that altered levels of cytokine production, it was found that
much lower (~1 mg/kg) levels elicited a response in cytokine production
(Hasko et al., 1996; Izeboud et al., 1999).
Figure 6.20 Pathways involved in the generation and degradation of oxidants
and the effects of OGG1 knockout at key endpoints In normal mice a rise in myeloperoxidase indicates increased phagocyte activation which release ROS into the affected area. This rise in ROS leads to a drop in GSH as the cell attempts to lessen the oxidative load. Increased ROS leads to the formation of more oxidised lipids in the cell membrane. Key results from lung and liver tissues taken from new OGG1-/- mice coloured blue. Here this model is not followed by either the male or female mice. Phagocyte enzymes coloured red. GSH, Glutathione; GSSG, Glutathione Disulphide; GPX, Glutathione peroxidase. Adapted from (Jaber et al., 2005)
In order to identify changes in MPO, MDA and GSH dose of 20 mg/kg LPS
was considered an appropriate amount as it had been used previously to
obtain a significant difference in MPO and MDA levels, between treated
and untreated animals (Koizumi et al., 2003; Li et al., 2005). This use of a
Ph.D. Thesis 2012 Alan Carter
185
lower dose of LPS may have contributed to the lack of a treatment effect
in the heart , kidney and ileum that had been noted in a previous study of
OGG1-/- mice (Mabley et al., 2005a), and may explain why less significant
differences were observed overall.
In OGG1-/- male mice the observed significant decrease in IL-6 levels at 1
and 6 h indicate an increase Th1 response, whilst increased levels of the
anti-inflammatory cytokine between 6 and 24 h would suggest a reduced
inflammatory response, the reduction in IL-4 would suggest a lessened
anti-inflammatory response. The increase in MPO activity and MDA also
suggests that a larger number of neutrophils were attracted to the lung
and liver. These endpoints together indicate that whilst there was an
overall reduction in measured pro-inflammatory signals, larger amounts of
neutrophils were being attracted to the area. Furthermore, greater
amounts of GSH were present where suggesting that either (i) less ROS
were being neutralised by (GPX) or SOD (ii) more GSH was being
produced within the tissues. As in all tissues except the heart, basal levels
of GSH were higher in OGG1-/- male mice than OGG1+/+ male mice
(Figures 6.16E – 6.19E; non-significant) hypothesis (ii) seems plausible.
Alternatively in female mouse serum samples, the low basal levels of IL-6
and a slower initial build up of this cytokine leads to reduced levels of both
IL-4 and 10, signifying that the initiation of the inflammatory response
would be depressed but the decrease in the regulatory anti-inflammatory
cytokines IL-4 and IL-10 would suggest that overall innate inflammatory
response may be unchanged. The lack of significant change in MPO
activity does indeed indicate this (Figure 6.6D & 6.7D). A decrease in GSH
however does suggest that either (i) more ROS are being neutralised by
glutathione peroxidise (GPX) or that (ii) less glutathione is being
produced within the tissues. Basal levels of GSH are lower in all tissues
from female mice except the heart (Figures 6.16E – 6.19E; non-
significant), leading to a hypothesis that the differing male and female
Ph.D. Thesis 2012 Alan Carter
186
GSH levels are an adaptation to the scale of the immune response within
the animals. Indeed oxidative stress has been shown to up regulate GPX
mRNA transcription and activity (Esposito et al., 1999). The lowered MDA
levels in the lung and liver tissues from female mice would then be
another indication of an increase in ROS neutralisation through the
GSH/GSSG pathway.
Oestrogen can act as an antioxidant and this has been shown ex vivo and
in vivo (Leal et al., 1998; Prokai et al., 2003; Sugioka et al., 1987; Zhang
et al., 2007). During pregnancy, where oestrogen production is increased
IL-10 and IL-4 (Th2) activity is observed (Ito et al., 2001). After
intratracheal LPS administration hypothermia and airway hyper
responsiveness are greater in male mice than female mice (Card et al.,
2006). The response markers to LPS induced inflammation (TNFα and
MIP1α) in female mice are reduced when compared to those in male mice
(Mabley et al., 2005b). Additionally it has been shown that the removal of
the ovaries in WT mice nullifies this protection with cytokine activity
becoming comparable to that of their male counterparts (Speyer et al.,
2005). In our study we see that the knockout of the OGG1 gene seems to
be causing increased oxidative damage in males, but this is reduced in
females due to the protective effects detailed.
In order to identify mechanisms that may be causing this differing effect
of the OGG1 knockout it is important to note that during a state of
inflammation the activity of OGG1 is subject to NO mediated inhibition,
whilst there is a simultaneous increase in cellular 8-OxoG (Jaiswal et al.,
2001). This is due to the redox mediated down regulation of OGG1, and it
may be that under the duress of inflammation the cell prioritises the
accumulation of 8-OxoG to OGG1 activity (Jaiswal et al., 2000; Jaiswal et
al., 2001). One reason proposed for this by Radek and Bodogh (2010) is
that in the process of DNA repair OGG1 removes a base causing the
creation of single stranded gaps and nicks in the DNA backbone. These

Ph.D. Thesis 2012 Alan Carter
187
gaps and nicks may then be recognised by DNA-damage-dependent
kinases, which can trigger an inflammatory response. Thus in OGG1-/-
mice there are fewer gaps created and inflammation may be curtailed.
Indeed in the pancreatic islet cells of patients with the inflammatory
disease, type II diabetes, there is reduced OGG1 activity in the nucleus
whilst mitochondrial DNA repair continues as normal (Radak and Boldogh
2010; Tyrberg et al., 2002).
It has been argued that the increase of 8-oxodG within the cell can reduce
inflammation by inhibiting Rac1/2, subsequently regulating the redox-
sensitive NF-κβ pathway by the activation of the NADPH oxidase complex
(Ock et al., 2011b). Additionally it was shown that the inhibition of Rac1
can affect the STAT3 signalling pathway which is associated with chronic
inflammatory diseases (Kim et al., 2006; Ock et al., 2011a).
It has already been shown that female mice are more resistant to
oxidative stress than those of males (Du et al., 2004). Here we report that
female OGG1-/- mice are more resistant to LPS induced inflammation than
male OGG1-/- mice. Could the reduced inflammatory response that is
reported in other female mice be reducing the oxidative damage to the
cell further so that there are fewer strand breaks, reducing the feed back
from gap dependant kinases and thus reducing inflammation more? In
order to identify if inflammation increased in the presence of increased
single strand breaks, SSB’s could be induced in vivo utilising increased
concentrations of LPS or with cells in vitro using H2O2 or UV radiation to
induce the breaks (Frankenberg-Schwager et al., 2008).
Additionally this observed effect could be the result of OGG1 interacting
with other proteins as gender differences have also been observed in the
protective effect of the PARP-1 inhibite mice. Whilst PARP-1 inhibited male
mice showed a marked decrease in TNFα output (~50%) after LPS
challenge (1 mg/kg i.p.) compared to non-inhibited animals (~1025 vs.
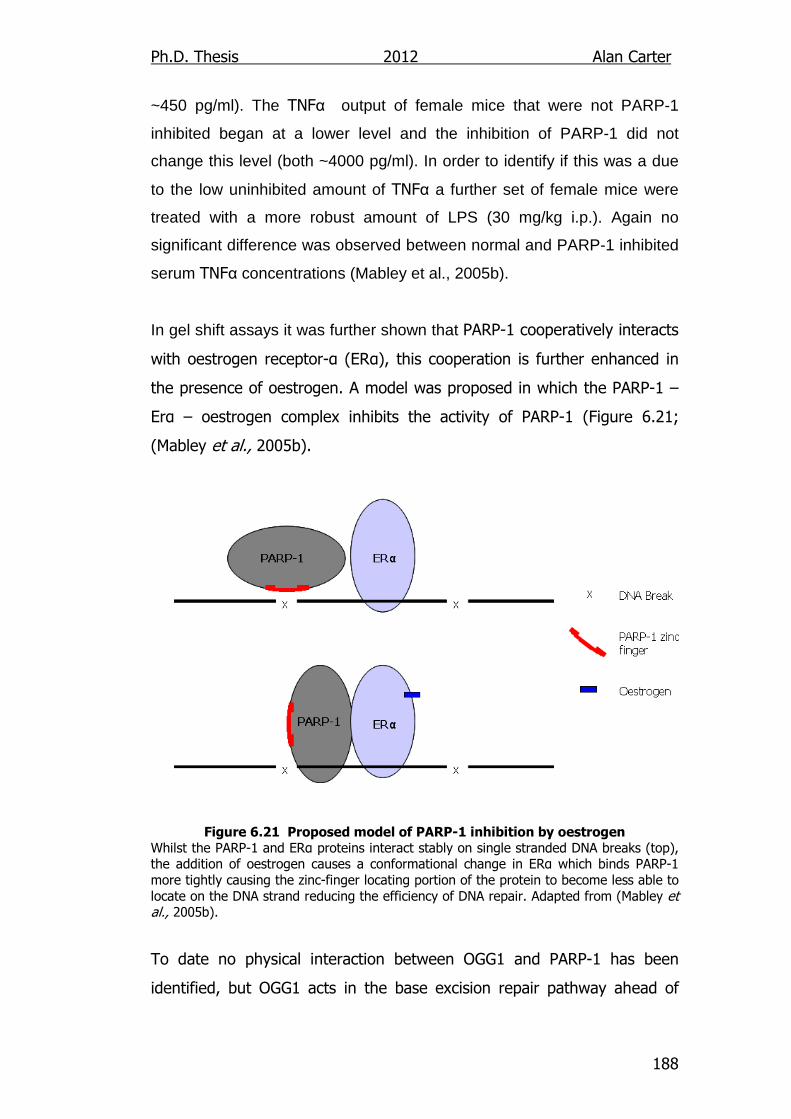
Ph.D. Thesis 2012 Alan Carter
188
~450 pg/ml). The TNFα output of female mice that were not PARP-1
inhibited began at a lower level and the inhibition of PARP-1 did not
change this level (both ~4000 pg/ml). In order to identify if this was a due
to the low uninhibited amount of TNFα a further set of female mice were
treated with a more robust amount of LPS (30 mg/kg i.p.). Again no
significant difference was observed between normal and PARP-1 inhibited
serum TNFα concentrations (Mabley et al., 2005b).
In gel shift assays it was further shown that PARP-1 cooperatively interacts
with oestrogen receptor-α (ERα), this cooperation is further enhanced in
the presence of oestrogen. A model was proposed in which the PARP-1 –
Erα – oestrogen complex inhibits the activity of PARP-1 (Figure 6.21;
(Mabley et al., 2005b).
Figure 6.21 Proposed model of PARP-1 inhibition by oestrogen Whilst the PARP-1 and ERα proteins interact stably on single stranded DNA breaks (top), the addition of oestrogen causes a conformational change in ERα which binds PARP-1 more tightly causing the zinc-finger locating portion of the protein to become less able to locate on the DNA strand reducing the efficiency of DNA repair. Adapted from (Mabley et al., 2005b).
To date no physical interaction between OGG1 and PARP-1 has been
identified, but OGG1 acts in the base excision repair pathway ahead of
Ph.D. Thesis 2012 Alan Carter
189
PARP-1. If the inflammatory effect of PARP-1 is triggered by its detection
of DNA breaks then the removal of the OGG1 protein and the subsequent
reduction in these breaks would reduce its inflammatory effect. In order to
identify if this were the case PARP-1 activity could be assessed by the
quantity of poly (ADP-ribose) (PAR) polymers produced in OGG1-/- extracts
or in peripheral blood mononuclear cells from OGG1-/- mice (Tentori et al.,
2003). If no link were found between OGG1 and PARP-1 it may be
interesting to determine if transcription factor activation, such as NF-κβ,
was altered in OGG1-/- mice, and proceed to identify the process by which
inflammation is mediated by OGG1.
If proved to be a modifying factor in inflammation the OGG1 protein could
conceivably be targeted as a therapy for combating inflammation based
disease. It has the advantage that (in mice) OGG1s disruption has few
short term side effects (Klungland et al., 1999). Care would have to be
taken however in long term use as older mice experienced higher rates of
cancer (Sakumi et al., 2003) and polymorphisms of the gene in human
populations have shown variable links with various cancers including lung
(Kohno et al., 2006), gastric (Farinati et al., 2008) and prostate cancers
(Chen et al., 2003).
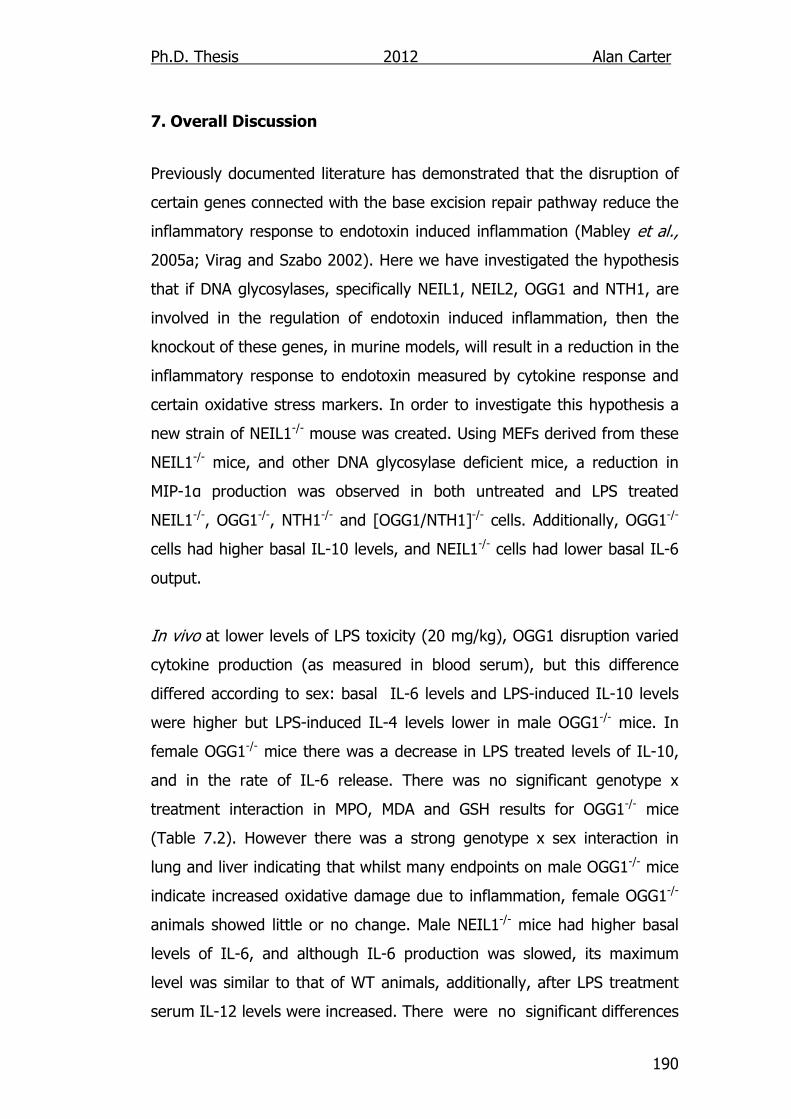
Ph.D. Thesis 2012 Alan Carter
190
7. Overall Discussion
Previously documented literature has demonstrated that the disruption of
certain genes connected with the base excision repair pathway reduce the
inflammatory response to endotoxin induced inflammation (Mabley et al.,
2005a; Virag and Szabo 2002). Here we have investigated the hypothesis
that if DNA glycosylases, specifically NEIL1, NEIL2, OGG1 and NTH1, are
involved in the regulation of endotoxin induced inflammation, then the
knockout of these genes, in murine models, will result in a reduction in the
inflammatory response to endotoxin measured by cytokine response and
certain oxidative stress markers. In order to investigate this hypothesis a
new strain of NEIL1-/- mouse was created. Using MEFs derived from these
NEIL1-/- mice, and other DNA glycosylase deficient mice, a reduction in
MIP-1α production was observed in both untreated and LPS treated
NEIL1-/-, OGG1-/-, NTH1-/- and [OGG1/NTH1]-/- cells. Additionally, OGG1-/-
cells had higher basal IL-10 levels, and NEIL1-/- cells had lower basal IL-6
output.
In vivo at lower levels of LPS toxicity (20 mg/kg), OGG1 disruption varied
cytokine production (as measured in blood serum), but this difference
differed according to sex: basal IL-6 levels and LPS-induced IL-10 levels
were higher but LPS-induced IL-4 levels lower in male OGG1-/- mice. In
female OGG1-/- mice there was a decrease in LPS treated levels of IL-10,
and in the rate of IL-6 release. There was no significant genotype x
treatment interaction in MPO, MDA and GSH results for OGG1-/- mice
(Table 7.2). However there was a strong genotype x sex interaction in
lung and liver indicating that whilst many endpoints on male OGG1-/- mice
indicate increased oxidative damage due to inflammation, female OGG1-/-
animals showed little or no change. Male NEIL1-/- mice had higher basal
levels of IL-6, and although IL-6 production was slowed, its maximum
level was similar to that of WT animals, additionally, after LPS treatment
serum IL-12 levels were increased. There were no significant differences
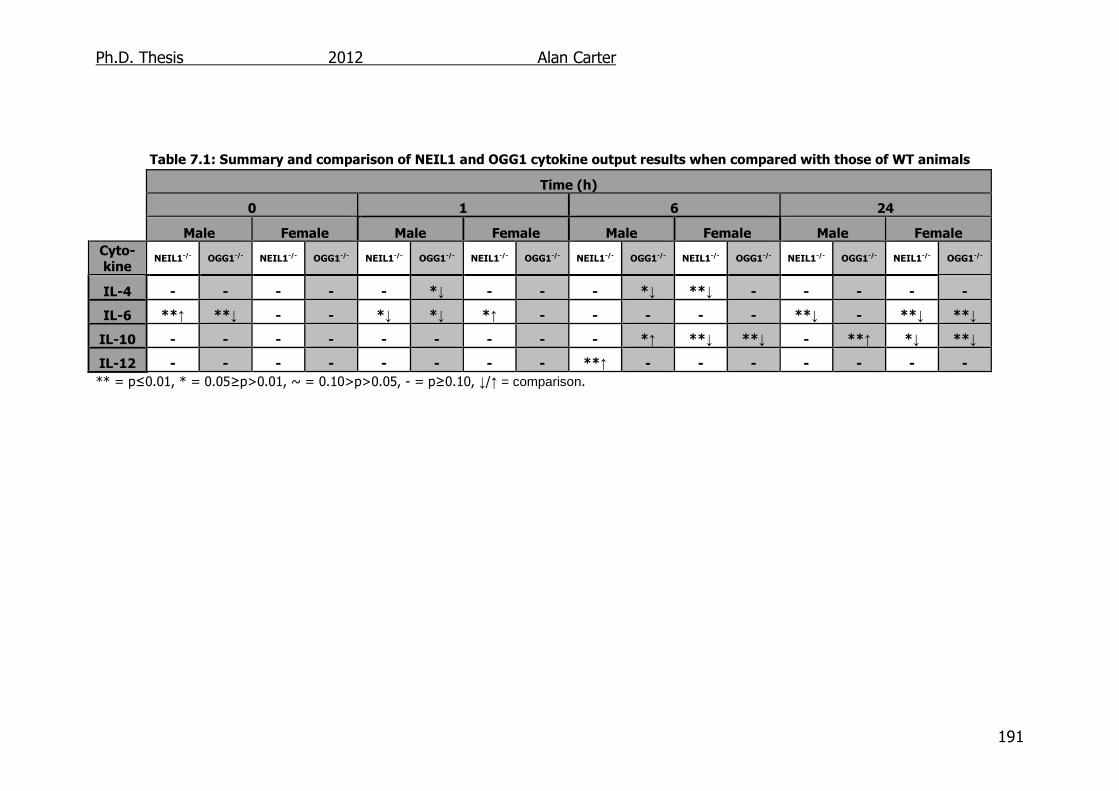
Ph.D. Thesis 2012 Alan Carter
191
Table 7.1: Summary and comparison of NEIL1 and OGG1 cytokine output results when compared with those of WT animals
** = p≤0.01, * = 0.05≥p>0.01, ~ = 0.10>p>0.05, - = p≥0.10, ↓/↑ = comparison.
Time (h)
0 1 6 24
Male Female Male Female Male Female Male Female
Cyto-kine
NEIL1-/- OGG1-/- NEIL1-/- OGG1-/- NEIL1-/- OGG1-/- NEIL1-/- OGG1-/- NEIL1-/- OGG1-/- NEIL1-/- OGG1-/- NEIL1-/- OGG1-/- NEIL1-/- OGG1-/-
IL-4 - - - - - *↓ - - - *↓ **↓ - - - - -
IL-6 **↑ **↓ - - *↓ *↓ *↑ - - - - - **↓ - **↓ **↓
IL-10 - - - - - - - - - *↑ **↓ **↓ - **↑ *↓ **↓
IL-12 - - - - - - - - **↑ - - - - - - -
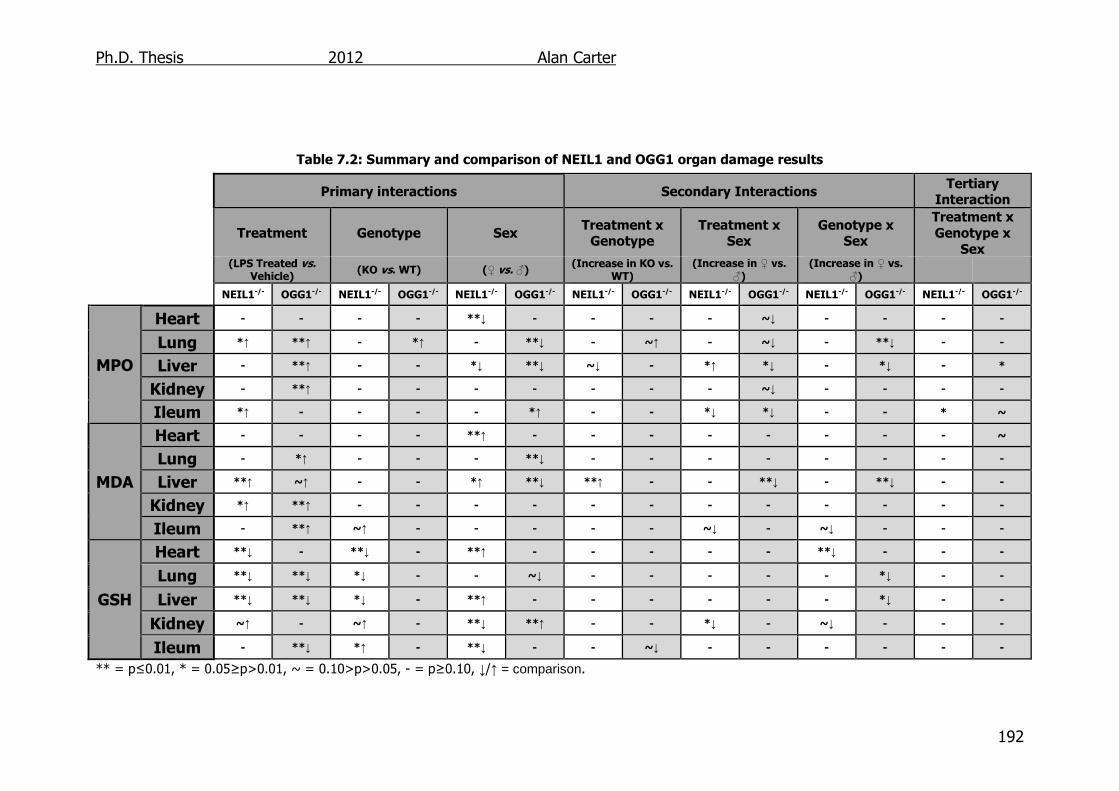
Ph.D. Thesis 2012 Alan Carter
192
Table 7.2: Summary and comparison of NEIL1 and OGG1 organ damage results
** = p≤0.01, * = 0.05≥p>0.01, ~ = 0.10>p>0.05, - = p≥0.10, ↓/↑ = comparison.
Primary interactions Secondary Interactions
Tertiary Interaction
Treatment Genotype Sex Treatment x Genotype
Treatment x Sex
Genotype x Sex
Treatment x
Genotype x
Sex
(LPS Treated vs. Vehicle)
(KO vs. WT) (♀ vs. ♂) (Increase in KO vs.
WT) (Increase in ♀ vs.
♂) (Increase in ♀ vs.
♂)
NEIL1-/- OGG1-/- NEIL1-/- OGG1-/- NEIL1-/- OGG1-/- NEIL1-/- OGG1-/- NEIL1-/- OGG1-/- NEIL1-/- OGG1-/- NEIL1-/- OGG1-/-
MPO
Heart - - - - **↓ - - - - ~↓ - - - -
Lung *↑ **↑ - *↑ - **↓ - ~↑ - ~↓ - **↓ - -
Liver - **↑ - - *↓ **↓ ~↓ - *↑ *↓ - *↓ - *
Kidney - **↑ - - - - - - - ~↓ - - - -
Ileum *↑ - - - - *↑ - - *↓ *↓ - - * ~
MDA
Heart - - - - **↑ - - - - - - - - ~
Lung - *↑ - - - **↓ - - - - - - - -
Liver **↑ ~↑ - - *↑ **↓ **↑ - - **↓ - **↓ - -
Kidney *↑ **↑ - - - - - - - - - - - -
Ileum - **↑ ~↑ - - - - - ~↓ - ~↓ - - -
GSH
Heart **↓ - **↓ - **↑ - - - - - **↓ - - -
Lung **↓ **↓ *↓ - - ~↓ - - - - - *↓ - -
Liver **↓ **↓ *↓ - **↑ - - - - - - *↓ - -
Kidney ~↑ - ~↑ - **↓ **↑ - - *↓ - ~↓ - - -
Ileum - **↓ *↑ - **↓ - - ~↓ - - - - - -
Ph.D. Thesis 2012 Alan Carter
193
with genotype in the MPO and MDA levels of NEIL1-/- mice although there
was an indication that GSH levels were raised in the heart, lung and liver
tissues and decreased in the ileum. These in vivo results indicate that at
this level of LPS there was a variable change in cytokine production, but
that this change is not great enough to change neutrophil recruitment
enough to reduce oxidative damage markers.
When cytokine release between OGG1-/- and NEIL1-/- mice was compared
(Table 7.1) it can be seen that the deletion of DNA glycosylases NEIL1 and
OGG1 has similar effects reducing the concentration of the cytokines in IL-
6 (male 1 h and female 24 h) and IL-10 (female 6 and 24 h) in serum
samples. This indicates that both Th1 and Th2 responses were affected by
the knockout of these DNA glycosylases. The differences in male and
female responses shown are probably due to the differences in oestrogen
levels, as higher physiological levels of oestrogen modulate the immune
from a Th1 mediated response to that of Th2 mediated response (Gilmore et
al., 1997; Salem, 2004; Whitacre, 2001).
Additionally the interaction between genotype x sex was only observed
strongly in the OGG1-/- mice. There was however, no genotype x
treatment interaction observed in the case of either NEIL1-/- or OGG1-/-
mice, indicating that whilst there was a general change in cytokine
activity, neutrophil aggregation and ROS production were not affected
significantly. Perhaps this can be explained somewhat by the reduction in
MIP-1α production noted in all knockout MEF cell types, as a reduction in
the production of this chemokine would reduce the accumulation of
leukocytes.
The pathway by which the NEIL1 and OGG1 proteins modulate the
immune system can be surmised to be a different from that of PARP1 as
while PARP1 knockout resulted in a reduced output of all measured
cytokines, this was not apparent in OGG1-/- and NEIL1-/- mice as cytokine
Ph.D. Thesis 2012 Alan Carter
194
output also increased. The effect of PARP1 may be due to it’s interaction
with NF-κβ (Virag and Szabo 2002). Similarly APE1 can also be discounted
as it activates NF-κβ via redox reactions meaning a lack of this enzyme
would result in a complete reduction in all cytokines (Ando et al., 2008).
It would be interesting to study if the NEIL1 protein is inhibited during
inflammatory processes as is OGG1 by NO (Jaiswal et al., 2000; Jaiswal et
al., 2001), but currently there is no literature on the subject. If it were
found to be so it would add weight to the theory that damage dependant
kinases are responsible for the increase in inflammation (Hofseth et al.,
2003). The disruption of the OGG1 gene has previously been reported to
reduce the inflammatory response (Mabley et al., 2005a; Touati et al.,
2006). OGG1 is inhibited in the inflammatory reaction by NO, it is thought
that this inhibition is preferable to the creation of gaps in the DNA strand
due to the removal of oxidised bases (Jaiswal et al., 2001). These gaps
have been implicated in the inflammatory response as their presence
actives DNA damage dependent kinases which can trigger inflammation
through the activation of p53 (Gudkov et al., 2011). As NEIL1 has been
shown to interact with OGG1, indeed it is suggested that OGG1 activity is
stimulated in the presence of NEIL1 (Mokkapati et al., 2004a), then the
disruption of the NEIL1 gene may reduce inflammatory activity in a similar
manner to NO, but on a permanent basis. This may come someway to
explaining the change in IL-6 basal and 1 h levels due to reduced initial
immune signalling. It may also explain the reduction in MPO activity as
there would be less MIP-1α produced during the immune response.
Disruption of bifunctional DNA glycosylases was also found to reduce the
basal and LPS induced output of MIP-1α from all BER KO MEFs when
compared to WT cells. As MIP-1α is a potent chemokine that attracts
neutrophils to the area of infection, this would suggest a decrease in
neutrophil activity in vivo. It is interesting to note that basal and LPS
stimulated MPO activity was not affected by genotype in either the
Ph.D. Thesis 2012 Alan Carter
195
NEIL1-/- or OGG1-/- mouse models. It could be the case that in the in vivo
model there are other regulatory systems available to overcome the
effects a potential loss in MIP-1α output. Additionally, OGG1-/- cells had
higher basal IL-10 levels, whilst in the whole animal model this was also
not observed. Indeed NEIL1-/- cells had lower basal IL-6 output, whilst the
male animals showed a marked increase in basal rates of IL-6. In line with
previously published material detailing the use of MEF’s, the cells were not
used after passage 10 so as to reduce the risk of possible mycoplasma
infections and mutations being the cause of any reported effects (Khobta
et al., 2009).
During the course of this study two new strains of mice were created,
namely a NEIL1-/- mouse and a putative NEIL2-/- mouse. Assays examining
the NEIL1-/- genomic DNA (PCR), mRNA (RT-PCR) and protein (western
blot) have confirmed the success of this model. As a previous colony of
NEIL1-/- mice had displayed a sporadic phenotype that shared similar
symptoms with the human metabolic syndrome, a colony of these animals
was kept for an extended period of time in order to discern if a similar
phenotype would be observed (Vartanian et al., 2006). Whilst there was
no significant difference in overall weight between the NEIL1+/+ and
NEIL1-/- mice, a significant difference was observed in the weight of
ommentum fat surrounding the intestinal tract of the NEIL1-/- male mice.
This indicates less overall fat in these animals, showing that the obese
phenotype did not appear in these NEIL1-/- mice. There is however data
indicating that the size of the adrenal glands was increased in NEIL1-/-
mice and that the reproductive organs of the NEIL1-/- female mice was
increased whilst the testes size of male NEIL1-/- mice was decreased. This
suggests that there may be hormonal differences in the mice including
raised oestrogen levels in the NEIL1-/- female knockout animals and
lowered testosterone levels in the NEIL1-/- male mice as changes in the
production of the appropriate hormone effects the size of these organs
(Kenagy and Trombulak 1986; Wood, 2000). Interestingly it has been
Ph.D. Thesis 2012 Alan Carter
196
observed that in cases of obesity in humans the concentration of blood
born testosterone decreases and oestrogen increases (Kley et al., 1979).
It was not discerned in this study whether the increase in adrenal gland
size raised adrenaline output, as some diseases such as
Phenochromocytoma do increase adrenal size and output (Strong et al.,
2008), whereas Addison’s disease does not but it increases the cortex
layer around the gland reducing the size of the adrenaline producing
medulla (Zelissen et al., 1995).
There were overall differences in the tissue GSH content in that levels
were lower in the heart, lung and liver of NEIL1-/- mice, but elevated in
the ileum. In order to investigate why there could be changes in the GSH
levels but not in MPO or MDA levels, other known differences in the
NEIL1-/- mice were examined. As both male and female animals produce
both testosterone and oestrogen, the reduction in male testes weight and
increase in female sex organ weight suggest a shift in the ratio of
testosterone:oestrogen toward a larger proportion of oestrogen in both
male and female NEIL1 mice. However as oestrogen has been shown to
be an antioxidant this would not account for lowered levels of GSH (Leal
et al., 1998; Prokai et al., 2003; Sugioka et al., 1987; Zhang et al., 2007).
It is also possible that a change in the levels of serum adrenaline,
suggested by the increased adrenal gland size, could alter the levels of
ROS and therefore GSH within the tissues mentioned. As adrenaline
affects the fight or flight response an increase in its output affects
different organs and systems in different ways. Heart rate and lung
respiration increase, causing a raised generation of ROS in those organs
(Sarker et al., 2009). In the liver an increase in adrenaline stimulates
glycogenolysis, and increases mitochondrial ROS creation via. NADPH
oxidase (Diaz-Cruz et al., 2007) The presence of adrenaline additionally
reduces the metabolic activity in ileum tissues by restricting blood flow to
the area potentially reducing the creation of ROS (Konstantinidis et al.,
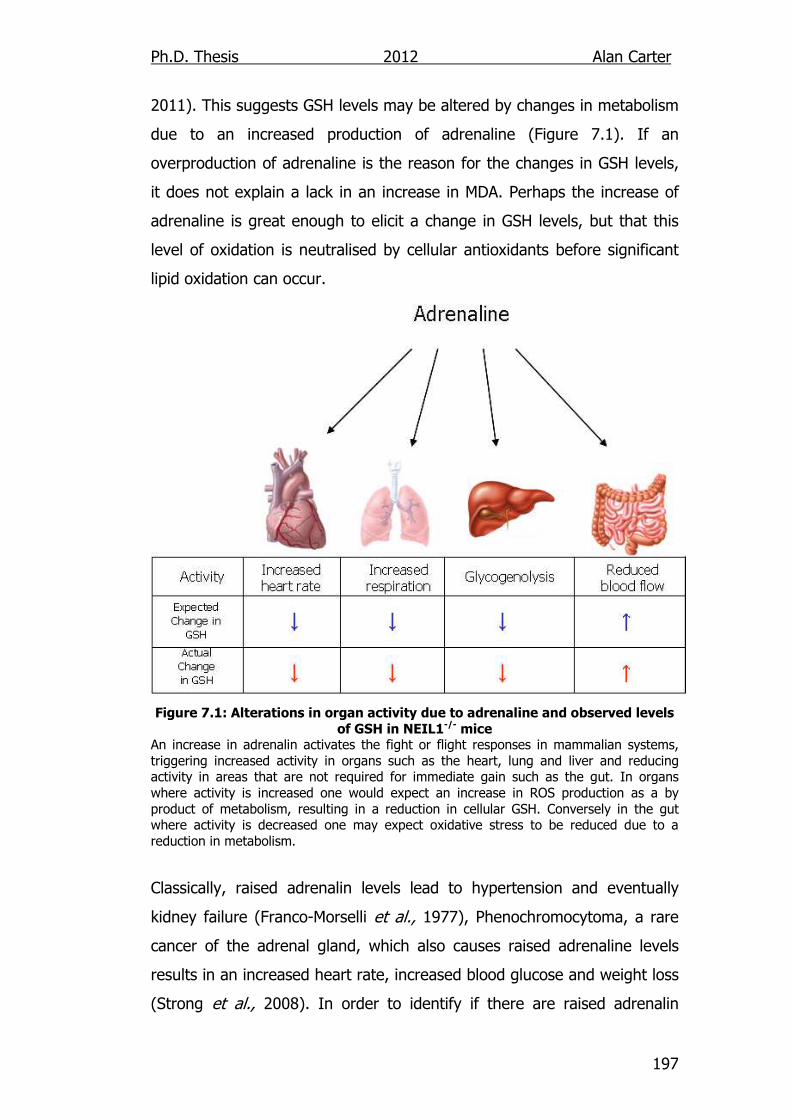
Ph.D. Thesis 2012 Alan Carter
197
2011). This suggests GSH levels may be altered by changes in metabolism
due to an increased production of adrenaline (Figure 7.1). If an
overproduction of adrenaline is the reason for the changes in GSH levels,
it does not explain a lack in an increase in MDA. Perhaps the increase of
adrenaline is great enough to elicit a change in GSH levels, but that this
level of oxidation is neutralised by cellular antioxidants before significant
lipid oxidation can occur.
Figure 7.1: Alterations in organ activity due to adrenaline and observed levels
of GSH in NEIL1-/- mice An increase in adrenalin activates the fight or flight responses in mammalian systems, triggering increased activity in organs such as the heart, lung and liver and reducing activity in areas that are not required for immediate gain such as the gut. In organs where activity is increased one would expect an increase in ROS production as a by product of metabolism, resulting in a reduction in cellular GSH. Conversely in the gut where activity is decreased one may expect oxidative stress to be reduced due to a reduction in metabolism.
Classically, raised adrenalin levels lead to hypertension and eventually
kidney failure (Franco-Morselli et al., 1977), Phenochromocytoma, a rare
cancer of the adrenal gland, which also causes raised adrenaline levels
results in an increased heart rate, increased blood glucose and weight loss
(Strong et al., 2008). In order to identify if there are raised adrenalin
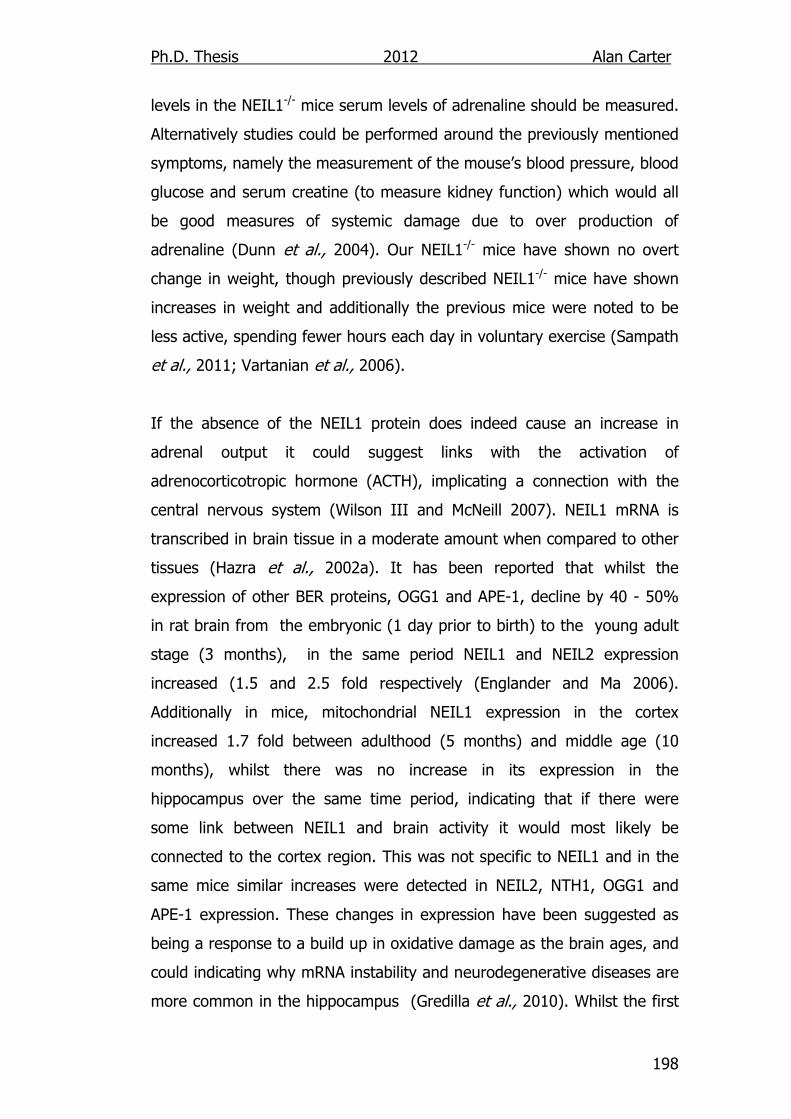
Ph.D. Thesis 2012 Alan Carter
198
levels in the NEIL1-/- mice serum levels of adrenaline should be measured.
Alternatively studies could be performed around the previously mentioned
symptoms, namely the measurement of the mouse’s blood pressure, blood
glucose and serum creatine (to measure kidney function) which would all
be good measures of systemic damage due to over production of
adrenaline (Dunn et al., 2004). Our NEIL1-/- mice have shown no overt
change in weight, though previously described NEIL1-/- mice have shown
increases in weight and additionally the previous mice were noted to be
less active, spending fewer hours each day in voluntary exercise (Sampath
et al., 2011; Vartanian et al., 2006).
If the absence of the NEIL1 protein does indeed cause an increase in
adrenal output it could suggest links with the activation of
adrenocorticotropic hormone (ACTH), implicating a connection with the
central nervous system (Wilson III and McNeill 2007). NEIL1 mRNA is
transcribed in brain tissue in a moderate amount when compared to other
tissues (Hazra et al., 2002a). It has been reported that whilst the
expression of other BER proteins, OGG1 and APE-1, decline by 40 - 50%
in rat brain from the embryonic (1 day prior to birth) to the young adult
stage (3 months), in the same period NEIL1 and NEIL2 expression
increased (1.5 and 2.5 fold respectively (Englander and Ma 2006).
Additionally in mice, mitochondrial NEIL1 expression in the cortex
increased 1.7 fold between adulthood (5 months) and middle age (10
months), whilst there was no increase in its expression in the
hippocampus over the same time period, indicating that if there were
some link between NEIL1 and brain activity it would most likely be
connected to the cortex region. This was not specific to NEIL1 and in the
same mice similar increases were detected in NEIL2, NTH1, OGG1 and
APE-1 expression. These changes in expression have been suggested as
being a response to a build up in oxidative damage as the brain ages, and
could indicating why mRNA instability and neurodegenerative diseases are
more common in the hippocampus (Gredilla et al., 2010). Whilst the first
Ph.D. Thesis 2012 Alan Carter
199
of the two studies implicates that NEIL1 and NEIL2 are important in the
mature brain, the second study indicates that the specific difference is not
in the mitochondria of either the cortex or hippocampus, suggesting that
the ability to repair within the bubble structure genomic DNA is important
to the mature brain. It would be interesting to identify which areas of the
brain, rather than just general brain tissue, show marked difference in
BER protein expression, and how the disruption of DNA glycosylases
affects their function.
When attempting to confirm the success of the NEIL2 knockout only the
PCR of genomic DNA suggested that NEIL2-/- mice had been generated
and that the Tk/Neo cassette was present in the genomic DNA, and in the
correct position. However, RT-PCR indicated that undisrupted mRNA was
being produced and western blots indicated that a protein of the
appropriate size was present that bound to anti-NEIL2 IgG. This is a
discrepancy that at the moment we are unable to explain with any
certainty. Further investigation into the positioning of the Tk/Neo cassette
could be performed using techniques such as fluorescence in situ
hybridization, this may not result in this NEIL2 model being validated as
the western blot and RT-PCR confirm the presence of NEIL2 protein, but it
would confirm the chromosomal positioning of the insert perhaps leading
to greater understanding of the reason that the knockout was
unsuccessful.
Further understanding of the role of DNA glycosylases in the inflammatory
response to endotoxin could be elucidated by the performing of further
experiments upon the organs that had already been analysed for MPO,
MDA and GSH. Portions of these organs have been fixed in formalin
solution which would make it possible for histological analysis of the
samples to be performed. This would be useful in identifying and
phenotyping the infiltrating cells to the areas of inflammation.
Ph.D. Thesis 2012 Alan Carter
200
In order to further examine if a DNA glycosylase affects the inflammation
response to endotoxin it may be useful to perform some additional work
on double DNA glycosylase knockout mice. This is due to the redundancy
built into the base excision repair system. Interesting pairings to look at
may would be those with similar substrates such as [OGG1/NEIL1]-/- and
[NEIL1/NTH1]-/-. A [NEIL1/NTH1]-/- mouse has already been produced and
has shown particular susceptibility to pulmonary and hepatic tumours
(Chan et al., 2009).
As a new NEIL1-/- model has been described that does not seem to exhibit
the same phenotype as previously presented models it may be interesting
to identify if the DNA damage response is effected in a similar fashion. In
MEF cells treated with DNA damaging agents such as H2O2 this could be
examined using comet assays. To compare the accumulation of oxidised
bases, such as FapyA, FapyG and 8-oxo-G, over the course of a lifetime
gas chromatography/mass spectrometry could be used.
In conclusion we have found that the deletion of DNA glycosylases has led
to reduction in cytokine outputs (IL-6 and IL-10) when challenged with
LPS but also had very little effect on the physiological markers MPO, MDA
and GSH. This indicates that whilst the disruption of these genes may
reduce inflammatory signalling this reduction is not great enough to lessen
the oxidative stress caused during the inflammatory response. This could
be due to the levels of LPS used to elicit the response in our experiments.
Indeed the sex of the subjects seemed to have a more protective effect
on inflammatory response. These results point to DNA glycosylases being
a poor target for anti-inflammatory therapies in all but the severest of
cases.
Furthermore the previously reported obesity phenotype in the NEIL1-/-
mice was not noted in this strain of mice, although there is evidence of
possible hormonal changes, specifically increased oestrogen and
Ph.D. Thesis 2012 Alan Carter
201
adrenaline, in the animals. The results for tissue GSH in NEIL1-/- mice we
observed a pattern similar to that of raised adrenal output.
Ph.D. Thesis 2012 Alan Carter
202
8.0 References
Abdel-Latif MM, O'Riordan J, Windle HJ, Carton E, Ravi N, Kelleher D and Reynolds JV (2004) NF-kappaB activation in esophageal adenocarcinoma: relationship to Barrett's metaplasia, survival, and response to neoadjuvant chemoradiotherapy. Ann. Surg. 239 (4) 491 - 500
Abdel-Rahman WM, Ollikainen M, Kariola R, Jarvinen HJ, Mecklin JP, Nystrom-Lahti M, Knuutila S and Peltomaki P (2005) Comprehensive characterization of HNPCC-related colorectal cancers reveals striking molecular features in families with no germline mismatch repair gene mutations. Oncogene. 24 (9) 1542 - 1551
Aller P, Rould MA, Hogg M, Wallace SS and Doublie S (2007) A structural rationale for stalling of a replicative DNA polymerase at the most common oxidative thymine lesion, thymine glycol. Proc. Natl. Acad. Sci. U. S. A. 104 (3) 814 - 818
Ando K, Hirao S, Kabe Y, Ogura Y, Sato I, Yamaguchi Y, Wada T and Handa H (2008) A new APE1/Ref-1-dependent pathway leading to reduction of NF-kappaB and AP-1, and activation of their DNA-binding activity. Nucl. Acids. Res. 36 (13) 4327 - 4336
Arai K, Morishita K, Shinmura K, Kohno T, Kim SR, Nohmi T, Taniwaki M, Ohwada S and Yokota J (1997) Cloning of a human homolog of the yeast OGG1 gene that is involved in the repair of oxidative DNA damage. Oncogene. 14 (23) 2857 - 2861
Arai T, Kelly VP, Minowa O, Noda T and Nishimura S (2006) The study using wild-type and Ogg1 knockout mice exposed to potassium bromate shows no tumor induction despite an extensive accumulation of 8-hydroxyguanine in kidney DNA. Toxicology. 221 (2-3) 179 - 186
Arbour NC, Lorenz E, Schutte BC, Zabner J, Kline JN, Jones M, Frees K, Watt JL and Schwartz DA (2000) TLR4 mutations are associated with endotoxin hyporesponsiveness in humans. Nat. Genet. 25 (2) 187 - 191
Aspinall GO, Monteiro MA, Pang H, Walsh EJ and Moran AP (1996) Lipopolysaccharide of the Helicobacter pylori type strain NCTC 11637 (ATCC 43504): structure of the O antigen chain and core oligosaccharide regions. Biochemistry. 35 (7) 2489 - 2497
Audebert M, Radicella JP and Dizdaroglu M (2000) Effect of single mutations in the OGG1 gene found in human tumors on the substrate specificity of the Ogg1 protein. Nucleic Acids Research. 28 (14) 2672 - 2678
Ph.D. Thesis 2012 Alan Carter
203
Banerjee A and Verdine GL (2006) A nucleobase lesion remodels the interaction of its normal neighbor in a DNA glycosylase complex. Proc. Natl. Acad. Sci. U. S. A. 103 (41) 15020 - 15025
Beharka AA, Meydani M, Wu D, Leka LS, Meydani A and Meydani SN (2001) Interleukin-6 production does not increase with age. J. Gerontol. A Biol. Sci. Med. Sci. 56 (2) B81 - B88
Berczi I, Bertok L and Bereznai T (1966) Comparative studies on the toxicity of Escherichia coli lipopolysaccharide endotoxin in various animal species. Can. J. Microbiol. 12 (5) 1070 - 1071
Berliner JA and Watson AD (2005) A role for oxidized phospholipids in atherosclerosis. N. Engl. J. Med. 353 (1) 9 - 11
Beutler B and Rietschel ET (2003) Innate immune sensing and its roots: the story of endotoxin. Nat. Rev. Immunol. 3 169 - 176
Beutler B (2004) Innate immunity: an overview. Molecular Immunology. 40 (12) 845 - 859
Bhakat KK, Hazra TK and Mitra S (2004) Acetylation of the human DNA glycosylase NEIL2 and inhibition of its activity. Nucleic Acids Research. 32 (10) 3033 - 3039
Boehmer ED, Goral J, Faunce DE and Kovacs EJ (2004) Age-dependent decrease in Toll-like receptor 4-mediated proinflammatory cytokine production and mitogen-activated protein kinase expression. J. Leukoc. Biol. 75 (2) 342 - 349
Bohr VA (2002) Repair of oxidative DNA damage in nuclear and mitochondrial DNA, and some changes with aging in mammalian cells. Free Radic. Biol. Med. 32 (9) 804 - 812
Bolger MS, Ross DS, Jiang H, Frank MM, Ghio AJ, Schwartz DA and Wright JR (2007) Complement levels and activity in the normal and LPS-injured lung. Am. J. Physiol Lung Cell Mol. Physiol. 292 (3) L748 - L759
Bouchard VJ, Rouleau M and Poirier GG (2003) PARP-1, a determinant of cell survival in response to DNA damage. Exp. Hemat. 31 (6) 446 - 454
Braun-Fahrlander C, Riedler J, Herz U, Eder W, Waser M, Grize L, Maisch S, Carr D, Gerlach F, Bufe A, Lauener RP, Schierl R, Renz H, Nowak D and von ME (2002) Environmental exposure to endotoxin and its relation to asthma in school-age children. N. Engl. J Med. 347 (12) 869 - 877
Bravard A, Vacher M, Moritz E, Vaslin L, Hall J, Epe B and Radicella JP (2009) Oxidation status of human OGG1-S326C polymorphic variant determines cellular DNA repair capacity. Cancer Res. 69 (8) 3642 - 3649
Ph.D. Thesis 2012 Alan Carter
204
Brown KL, Adams T, Jasti VP, Basu AK and Stone MP (2008) Interconversion of the cis-5R,6S- and trans-5R,6R-thymine glycol lesions in duplex DNA. J. Am. Chem. Soc. 130 (35) 11701 - 11710
Bruskov VI, Malakhova LV, Masalimov ZK and Chernikov AV (2002) Heat-induced formation of reactive oxygen species and 8-oxoguanine, a biomarker of damage to DNA. Nucleic Acids Research. 30 (6) 1354 - 1363
Buer J and Balling R (2003) Mice, microbes and models of infection. Nat. Rev. Genet. 4 (3) 195 - 205
Butterfield TA, Best TM and Merrick MA (2006) The dual roles of neutrophils and macrophages in inflammation: a critical balance between tissue damage and repair. J. Athl. Train. 41 (4) 457 - 465
Caldecott KW (2003) DNA Single-Strand Break Repair and Spinocerebellar Ataxia. Cell. 112 (1) 7 - 10
Campalans A, Amouroux R, Bravard A, Epe B and Radicella JP (2007) UVA irradiation induces relocalisation of the DNA repair protein hOGG1 to nuclear speckles. J. Cell Sci. 120 (Pt 1) 23 - 32
Card JW, Carey MA, Bradbury JA, DeGraff LM, Morgan DL, Moorman MP, Flake GP and Zeldin DC (2006) Gender differences in murine airway responsiveness and lipopolysaccharide-induced inflammation. J. Immunol. 177 (1) 621 - 630
Casorelli I, Pannellini T, de Luca G, Degan P, Chiera F, Iavarone I, Giuliani A, Butera A, Boirivant M, Musiani P and Bignami M (2010) The Mutyh Base Excision Repair Gene Influences the Inflammatory Response in a Mouse Model of Ulcerative Colitis. PLoS. One. 5 (8)
Cavagna G, Foa V and Vigliani EC (1969) Effects in man and rabbits of inhalation of cotton dust or extracts and purified endotoxins. Br. J. Ind. Med. 26 (4) 314 - 321
Chaby R (1999) Strategies for the control of LPS-mediated pathophysiological disorders. Drug Discov. Today. 4 (5) 209 - 221
Chan MK, Ocampo-Hafalla MT, Vartanian V, Jaruga P, Kirkali G, Koenig KL, Brown S, Lloyd RS, Dizdaroglu M and Teebor GW (2009) Targeted deletion of the genes encoding NTH1 and NEIL1 DNA N-glycosylases reveals the existence of novel carcinogenic oxidative damage to DNA. DNA Repair. 8 (7) 786 - 794
Cheadle JP and Sampson JR (2003) Exposing the MYtH about base excision repair and human inherited disease. Hum. Mol. Genet. 12 R159 - R165
Ph.D. Thesis 2012 Alan Carter
205
Chen L, Elahi A, Pow-Sang J, Lazarus P and Park J (2003) Association between polymorphism of human oxoguanine glycosylase 1 and risk of prostate cancer. J. Urol. 170 (6 Pt 1) 2471 - 2474
Christmann M, Tomicic MT, Roos WP and Kaina B (2003) Mechanisms of human DNA repair: an update. Toxicology. 193 (1-2) 3 - 34
Church DM, Goodstadt L, Hillier LW, Zody MC, Goldstein S, She X, Bult CJ, Agarwala R, Cherry JL, DiCuccio M, Hlavina W, Kapustin Y, Meric P, Maglott D, Birtle Z, Marques AC, Graves T, Zhou S, Teague B, Potamousis K, Churas C, Place M, Herschleb J, Runnheim R, Forrest D, mos-Landgraf J, Schwartz DC, Cheng Z, Lindblad-Toh K, Eichler EE and Ponting CP (2009) Lineage-specific biology revealed by a finished genome assembly of the mouse. PLoS. Biol. 7 (5) e1000112 -
Cirl C, Wieser A, Yadav M, Duerr S, Schubert S, Fischer H, Stappert D, Wantia N, Rodriguez N, Wagner H, Svanborg C and Miethke T (2008) Subversion of Toll-like receptor signaling by a unique family of bacterial Toll/interleukin-1 receptor domain-containing proteins. Nat. Med. 14 (4) 399 - 406
Cleaver JE (1968) Defective repair replication of DNA in xeroderma pigmentosum. Nature. 218 (5142) 652 - 656
Conlon KA, Zharkov DO and Berrios M (2004) Cell cycle regulation of the murine 8-oxoguanine DNA glycosylase (mOGG1): mOGG1 associates with microtubules during interphase and mitosis. DNA Repair (Amst). 3 (12) 1601 - 1615
Cortazar D, Kunz C, Selfridge J, Lettieri T, Saito Y, MacDougall E, Wirz A, Schuermann D, Jacobs AL, Siegrist F, Steinacher R, Jiricny J, Bird A and Schar P (2011) Embryonic lethal phenotype reveals a function of TDG in maintaining epigenetic stability. Nature. 470 (7334) 419 - 423
Daily D, Vlamis-Gardikas A, Offen D, Mittelman L, Melamed E, Holmgren A and Barzilai A (2001) Glutaredoxin protects cerebellar granule neurons from dopamine-induced apoptosis by activating NF-kappa B via Ref-1. J. Biol. Chem. 276 (2) 1335 - 1344
Dalton TP, Dieter MZ, Yang Y, Shertzer HG and Nebert DW (2000) Knockout of the mouse glutamate cysteine ligase catalytic subunit (Gclc) gene: embryonic lethal when homozygous, and proposed model for moderate glutathione deficiency when heterozygous. Biochem. Biophys. Res. Commun. 279 (2) 324 - 329
Das A, Boldogh I, Lee JW, Harrigan JA, Hegde ML, Piotrowski J, de Souza PN, Ramos W, Greenberg MM, Hazra TK, Mitra S and Bohr VA (2007a) The human Werner syndrome protein stimulates repair of oxidative DNA base
Ph.D. Thesis 2012 Alan Carter
206
damage by the DNA glycosylase NEIL1. J. Biol. Chem. 282 (36) 26591 - 26602
Das S, Chattopadhyay R, Bhakat KK, Boldogh I, Kohno K, Prasad R, Wilson SH and Hazra TK (2007b) Stimulation of NEIL2-mediated oxidized base excision repair via YB-1 interaction during oxidative stress. J. Biol. Chem. 282 (39) 28474 - 28484
Daynes RA, Araneo BA, Ershler WB, Maloney C, Li GZ and Ryu SY (1993) Altered regulation of IL-6 production with normal aging. Possible linkage to the age-associated decline in dehydroepiandrosterone and its sulfated derivative. J. Immunol. 150 (12) 5219 - 5230
De Bont R and van Larebeke N (2004) Endogenous DNA damage in humans: a review of quantitative data. Mutagenesis. 19 (3) 169 - 185
Dherin C, Radicella JP, Dizdaroglu M and Boiteux S (1999) Excision of oxidatively damaged DNA bases by the human alpha-hOgg1 protein and the polymorphic alpha-hOgg1(Ser326Cys) protein which is frequently found in human populations. Nucleic Acids Research. 27 (20) 4001 - 4007
Dianov GL, Sleeth KM, Dianova II and Allinson SL (2003) Repair of abasic sites in DNA. Mutat. Res. 531 (1-2) 157 - 163
Diaz-Cruz A, Guinzberg R, Guerra R, Vilchis M, Carrasco D, Garcia-Vazquez FJ and Pina E (2007) Adrenaline stimulates H2O2 generation in liver via NADPH oxidase. Free Radic. Res. 41 (6) 663 - 672
Ding X, Hiraku Y, Ma N, Kato T, Saito K, Nagahama M, Semba R, Kuribayashi K and Kawanishi S (2005) Inducible nitric oxide synthase-dependent DNA damage in mouse model of inflammatory bowel disease. Cancer Sci. 96 (3) 157 - 163
DiStasi MR and Ley K (2009) Opening the flood-gates: how neutrophil-endothelial interactions regulate permeability. Trends Immunol. 30 (11) 547 - 556
Dizdaroglu M, Karahalil B, Senturker S, Buckley TJ and Roldan-Arjona T (1999) Excision of products of oxidative DNA base damage by human NTH1 protein. Biochemistry. 38 (1) 243 - 246
Dobson AW, Grishko V, LeDoux SP, Kelley MR, Wilson GL and Gillespie MN (2002) Enhanced mtDNA repair capacity protects pulmonary artery endothelial cells from oxidant-mediated death. Am. J. Physiol Lung Cell Mol. Physiol. 283 (1) L205 - L210
Donadelli R, Abbate M, Zanchi C, Corna D, Tomasoni S, Benigni A, Remuzzi G and Zoja C (2000) Protein traffic activates NF-kB gene signaling and promotes MCP-1-dependent interstitial inflammation. Am. J. Kidney Dis. 36 (6) 1226 - 1241
Ph.D. Thesis 2012 Alan Carter
207
Dou H, Mitra S and Hazra TK (2003) Repair of oxidized bases in DNA bubble structures by human DNA glycosylases NEIL1 and NEIL2. J. Biol. Chem. 278 (50) 49679 - 49684
Dou H, Theriot CA, Das A, Hegde ML, Matsumoto Y, Boldogh I, Hazra TK, Bhakat KK and Mitra S (2008) Interaction of the human DNA glycosylase NEIL1 with proliferating cell nuclear antigen. The potential for replication-associated repair of oxidized bases in mammalian genomes. J. Biol. Chem. 283 (6) 3130 - 3140
Doublie S, Bandaru V, Bond JP and Wallace SS (2004) The crystal structure of human endonuclease VIII-like 1 (NEIL1) reveals a zincless finger motif required for glycosylase activity. Proc. Natl. Acad. Sci. U. S. A. 101 (28) 10284 - 10289
Douwes J, Zuidhof A, Doekes G, van der Zee SC, Wouters I, Boezen MH and Brunekreef B (2000) (1-->3)-beta-D-glucan and endotoxin in house dust and peak flow variability in children. Am. J. Respir. Crit. Care Med. 162 (4 Pt 1) 1348 - 1354
Droge W (2002) Free radicals in the physiological control of cell function. Physiol Rev. 82 (1) 47 - 95
Du L, Bayir H, Lai Y, Zhang X, Kochanek PM, Watkins SC, Graham SH and Clark RS (2004) Innate gender-based proclivity in response to cytotoxicity and programmed cell death pathway. J. Biol. Chem. 279 (37) 38563 - 38570
Duell EJ, Millikan RC, Pittman GS, Winkel S, Lunn RM, Tse CK, Eaton A, Mohrenweiser HW, Newman B and Bell DA (2001) Polymorphisms in the DNA repair gene XRCC1 and breast cancer. Cancer Epidemiol. Biomarkers Prev. 10 (3) 217 - 222
Dunn SR, Qi Z, Bottinger EP, Breyer MD and Sharma K (2004) Utility of endogenous creatinine clearance as a measure of renal function in mice. Kidney Int. 65 (5) 1959 - 1967
Eder W, Klimecki W, Yu L, von Mutius E, Riedler J, Braun-Fahrlander C, Nowak D and Martinez FD (2004) Toll-like receptor 2 as a major gene for asthma in children of European farmers. J. Allergy Clin. Immunol. 113 (3) 482 - 488
Elahi A, Zheng Z, Park J, Eyring K, McCaffrey T and Lazarus P (2002) The human OGG1 DNA repair enzyme and its association with orolaryngeal cancer risk. Carcinogenesis. 23 (7) 1229 - 1234
Elder RH and Dianov GL (2002) Repair of dihydrouracil supported by base excision repair in mNTH1 knock-out cell extracts. J. Biol. Chem. 277 (52) 50487 - 50490
Ph.D. Thesis 2012 Alan Carter
208
Elder RH, Jansen JG, Weeks RJ, Willington MA, Deans B, Watson AJ, Mynett KJ, Bailey JA, Cooper DP, Rafferty JA, Heeran MC, Wijnhoven SW, van Zeeland AA and Margison GP (1998) Alkylpurine-DNA-N-glycosylase knockout mice show increased susceptibility to induction of mutations by methyl methanesulfonate. Mol. Cell Biol. 18 (10) 5828 - 5837
Elder RH, Rosenquist TA and Parsons JL (2004) Characterisation of [NTH1,OGG1]-/- mice. Proc Amer Assoc Cancer Res. 45
Engelward BP, Weeda G, Wyatt MD, Broekhof JL, de WJ, Donker I, Allan JM, Gold B, Hoeijmakers JH and Samson LD (1997) Base excision repair deficient mice lacking the Aag alkyladenine DNA glycosylase. Proc Natl. Acad. Sci. U. S. A. 94 (24) 13087 - 13092
Englander EW and Ma H (2006) Differential modulation of base excision repair activities during brain ontogeny: Implications for repair of transcribed DNA. Mech. Age. Dev. 127 (1) 64 - 69
Enterline PE, Sykora JL, Keleti G and Lange JH (1985) Endotoxins, cotton dust, and cancer. Lancet. 2 (8461) 934 - 935
Ershler WB, Sun WH, Binkley N, Gravenstein S, Volk MJ, Kamoske G, Klopp RG, Roecker EB, Daynes RA and Weindruch R (1993) Interleukin-6 and aging: blood levels and mononuclear cell production increase with advancing age and in vitro production is modifiable by dietary restriction. Lymphokine Cytokine Res. 12 (4) 225 - 230
Esposito LA, Melov S, Panov A, Cottrell BA and Wallace DC (1999) Mitochondrial disease in mouse results in increased oxidative stress. Proc. Natl. Acad. Sci. U. S. A. 96 (9) 4820 - 4825
Fan H and Cook JA (2004) Molecular mechanisms of endotoxin tolerance. J. Endotoxin Res. 10 (2) 71 - 84
Farinati F, Cardin R, Bortolami M, Nitti D, Basso D, de BM, Cassaro M, Sergio A and Rugge M (2008) Oxidative DNA damage in gastric cancer: CagA status and OGG1 gene polymorphism. Int. J. Cancer. 123 (1) 51 - 55
Faurschou M and Borregaard N (2003) Neutrophil granules and secretory vesicles in inflammation. Microbes Infect. 5 (14) 1317 - 1327
Franco-Morselli R, Elghozi JL, Joly E, Di GS and Meyer P (1977) Increased plasma adrenaline concentrations in benign essential hypertension. Br. Med. J. 2 (6097) 1251 - 1254
Frankenberg-Schwager M, Becker M, Garg I, Pralle E, Wolf H and Frankenberg D (2008) The role of nonhomologous DNA end joining, conservative homologous recombination, and single-strand annealing in
Ph.D. Thesis 2012 Alan Carter
209
the cell cycle-dependent repair of DNA double-strand breaks induced by H2O2 in mammalian cells. Radiat. Res. 170 (6) 784 - 793
Fromme JC, Banerjee A, Huang SJ and Verdine GL (2004) Structural basis for removal of adenine mispaired with 8-oxoguanine by MutY adenine DNA glycosylase. Nature. 427 (6975) 652 - 656
Fromme JC and Verdine GL (2004) Base excision repair. Adv. Protein Chem. 69 1 - 41
Fung H and Demple B (2005) A vital role for Ape1/Ref1 protein in repairing spontaneous DNA damage in human cells. Mol. Cell. 17 (3) 463 - 470
Gilmore W, Weiner LP and Correale J (1997) Effect of estradiol on cytokine secretion by proteolipid protein-specific T cell clones isolated from multiple sclerosis patients and normal control subjects. J. Immunol. 158 (1) 446 - 451
Girard PM, D'Ham C, Cadet J and Boiteux S (1998) Opposite base-dependent excision of 7,8-dihydro-8-oxoadenine by the Ogg1 protein of Saccharomyces cerevisiae. Carcinogenesis. 19 (7) 1299 - 1305
Gloire G, Legrand-Poels S and Piette J (2006) NF-[kappa]B activation by reactive oxygen species: Fifteen years later. Biochem. Pharmacol. 72 (11) 1493 - 1505
Golyasnaya NV and Tsvetkova NA (2006) Mismatch repair. Mol. Biol. 40 (2) 183 - 193
Goodman L and Stein GH (1994) Basal and induced amounts of interleukin-6 mRNA decline progressively with age in human fibroblasts. J. Biol. Chem. 269 (30) 19250 - 19255
Goodrick CL, Ingram DK, Reynolds MA, Freeman JR and Cider N (1990) Effects of intermittent feeding upon body weight and lifespan in inbred mice: interaction of genotype and age. Mech. Age. Dev. 55 (1) 69 - 87
Graff G, Gamache DA, Brady MT, Spellman JM and Yanni JM (1998) Improved myeloperoxidase assay for quantitation of neutrophil influx in a rat model of endotoxin-induced uveitis. J. Pharacol. Toxicol. 39 (3) 169 - 178
Gredilla R, Garm C, Holm R, Bohr VA and Stevnsner T (2010) Differential age-related changes in mitochondrial DNA repair activities in mouse brain regions. Neurobiol. Aging. 31 (6) 993 - 1002
Grin IR, Rieger RA and Zharkov DO (2010) Inactivation of NEIL2 DNA glycosylase by pyridoxal phosphate reveals a loop important for substrate binding. Biochem. Biophys. Res. Commun. 394 (1) 100 - 105
Ph.D. Thesis 2012 Alan Carter
210
Gros L, Saparbaev MK and Laval J (2002) Enzymology of the repair of free radicals-induced DNA damage. Oncogene. 21 (58) 8905 - 8925
Gudkov AV, Gurova KV and Komarova EA (2011) Inflammation and p53: A Tale of Two Stresses. Gene. Canc. 2 (4) 503 - 516
Gupta SC, Kim JH, Kannappan R, Reuter S, Dougherty PM and Aggarwal BB (2011) Role of nuclear factor kappaB-mediated inflammatory pathways in cancer-related symptoms and their regulation by nutritional agents. Exp. Biol. Med. 236 (6) 658 - 671
Hanaoka T, Sugimura H, Nagura K, Ihara M, Li XJ, Hamada GS, Nishimoto I, Kowalski LP, Yokota J and Tsugane S (2001) hOGG1 exon7 polymorphism and gastric cancer in case-control studies of Japanese Brazilians and non-Japanese Brazilians. Cancer Lett. 170 (1) 53 - 61
Hansen R, Saebo M, Skjelbred CF, Nexo BA, Hagen PC, Bock G, Bowitz L, I, Johnson E, Aase S, Hansteen IL, Vogel U and Kure EH (2005) GPX Pro198Leu and OGG1 Ser326Cys polymorphisms and risk of development of colorectal adenomas and colorectal cancer. Cancer Lett. 229 (1) 85 - 91
Harrison RF, Reynolds GM and Rowlands DC (1993) Immunohistochemical evidence for the expression of proliferating cell nuclear antigen (PCNA) by non-proliferating hepatocytes adjacent to metastatic tumours and in inflammatory conditions. J. Pathol. 171 (2) 115 - 122
Hasday JD, Bascom R, Costa JJ, Fitzgerald T and Dubin W (1999) Bacterial endotoxin is an active component of cigarette smoke. Chest. 115 (3) 829 - 835
Hashiguchi K, Stuart JA, de Souza-Pinto NC and Bohr VA (2004) The C-terminal alphaO helix of human Ogg1 is essential for 8-oxoguanine DNA glycosylase activity: the mitochondrial beta-Ogg1 lacks this domain and does not have glycosylase activity. Nucleic Acids Res. 32 (18) 5596 - 5608
Hasko G, Szabo C, Nemeth ZH, Kvetan V, Pastores SM and Vizi ES (1996) Adenosine receptor agonists differentially regulate IL-10, TNF-alpha, and nitric oxide production in RAW 264.7 macrophages and in endotoxemic mice. J. Immunol. 157 (10) 4634 - 4640
Hayes RC and LeClerc JE (1986) Sequence dependence for bypass of thymine glycols in DNA by DNA polymerase I. Nucleic Acids Res. 14 (2) 1045 - 1061
Hazra TK, Izumi T, Boldogh I, Imhoff B, Kow YW, Jaruga P, Dizdaroglu M and Mitra S (2002a) Identification and characterization of a human DNA glycosylase for repair of modified bases in oxidatively damaged DNA. Proc. Natl. Acad. Sci. U. S. A. 99 (6) 3523 - 3528
Ph.D. Thesis 2012 Alan Carter
211
Hazra TK, Kow YW, Hatahet Z, Imhoff B, Boldogh I, Mokkapati SK, Mitra S and Izumi T (2002b) Identification and characterization of a novel human DNA glycosylase for repair of cytosine-derived lesions. J. Biol. Chem. 277 (34) 30417 - 30420
Hazra TK, Das A, Das S, Choudhury S, Kow YW and Roy R (2007) Oxidative DNA damage repair in mammalian cells: A new perspective. DNA Repair. 6 (4) 470 - 480
Hegde ML, Theriot CA, Das A, Hegde PM, Guo Z, Gary RK, Hazra TK, Shen B and Mitra S (2008) Physical and functional interaction between human oxidized base-specific DNA glycosylase NEIL1 and flap endonuclease 1. J. Biol. Chem. 283 (40) 27028 - 27037
Hewitt SC and Korach KS (2003) Oestrogen receptor knockout mice: roles for oestrogen receptors alpha and beta in reproductive tissues. Reproduction. 125 (2) 143 - 149
Hill JW, Hazra TK, Izumi T and Mitra S (2001) Stimulation of human 8-oxoguanine-DNA glycosylase by AP-endonuclease: potential coordination of the initial steps in base excision repair. Nucleic Acids Research. 29 (2) 430 - 438
Hill KA, Buettner VL, Glickman BW and Sommer SS (1999) Spontaneous mutations in the Big Blue-« transgenic system are primarily mouse derived. Mutat. Res. -Rev. Mut. R. 436 (1) 11 - 19
Hirano S, Tominaga Y, Ichinoe A, Ushijima Y, Tsuchimoto D, Honda-Ohnishi Y, Ohtsubo T, Sakumi K and Nakabeppu Y (2003) Mutator phenotype of MUTYH-null mouse embryonic stem cells. J. Biol. Chem. 278 (40) 38121 - 38124
Hoffler U, Hobbie K, Wilson R, Bai R, Rahman A, Malarkey D, Travlos G and Ghanayem BI (2009) Diet-induced obesity is associated with hyperleptinemia, hyperinsulinemia, hepatic steatosis, and glomerulopathy in C57Bl/6J mice. Endocrine. 36 (2) 311 - 325
Hofseth LJ, Saito S, Hussain SP, Espey MG, Miranda KM, Araki Y, Jhappan C, Higashimoto Y, He P, Linke SP, Quezado MM, Zurer I, Rotter V, Wink DA, Appella E and Harris CC (2003) Nitric oxide-induced cellular stress and p53 activation in chronic inflammation. Proc. Natl. Acad. Sci. U. S. A. 100 (1) 143 - 148
Hung RJ, Hall J, Brennan P and Boffetta P (2005) Genetic polymorphisms in the base excision repair pathway and cancer risk: a HuGE review. Am. J. Epidemiol. 162 (10) 925 - 942
Ph.D. Thesis 2012 Alan Carter
212
Ikeda S, Kohmoto T, Tabata R and Seki Y (2002) Differential intracellular localization of the human and mouse endonuclease III homologs and analysis of the sorting signals. DNA Repair (Amst). 1 (10) 847 - 854
Imlay JA (2003) Pathways of oxidative damage. Annu. Rev. Microbiol. 57 395 - 418
Imlay JA, Chin SM and Linn S (1988) Toxic DNA damage by hydrogen peroxide through the Fenton reaction in vivo and in vitro. Science. 240 (4852) 640 - 642
Ito A, Bebo BF, Jr., Matejuk A, Zamora A, Silverman M, Fyfe-Johnson A and Offner H (2001) Estrogen treatment down-regulates TNF-alpha production and reduces the severity of experimental autoimmune encephalomyelitis in cytokine knockout mice. J. Immunol. 167 (1) 542 - 552
Ivor J (1994) The ins and outs of fibroblast growth factors. Cell. 78 (4) 547 - 552
Izeboud CA, Monshouwer M, van Miert AS and Witkamp RF (1999) The beta-adrenoceptor agonist clenbuterol is a potent inhibitor of the LPS-induced production of TNF-alpha and IL-6 in vitro and in vivo. Inflamm. Res. 48 (9) 497 - 502
Izumi T, Wiederhold LR, Roy G, Roy R, Jaiswal A, Bhakat KK, Mitra S and Hazra TK (2003) Mammalian DNA base excision repair proteins: their interactions and role in repair of oxidative DNA damage. Toxicology. 193 (1-2) 43 - 65
Jaber BL, Pereira BJ, Bonventre JV and Balakrishnan VS (2005) Polymorphism of host response genes: implications in the pathogenesis and treatment of acute renal failure. Kidney Int. 67 (1) 14 - 33
Jaiswal M, LaRusso NF, Burgart LJ and Gores GJ (2000) Inflammatory cytokines induce DNA damage and inhibit DNA repair in cholangiocarcinoma cells by a nitric oxide-dependent mechanism. Cancer Res. 60 (1) 184 - 190
Jaiswal M, LaRusso NF, Nishioka N, Nakabeppu Y and Gores GJ (2001) Human Ogg1, a protein involved in the repair of 8-oxoguanine, is inhibited by nitric oxide. Cancer Res. 61 (17) 6388 - 6393
Jin H, Jiang B, Tang J, Lu W, Wang W, Zhou L, Shang W, Li F, Ma Q, Yang Y and Chen M (2008) Serum visfatin concentrations in obese adolescents and its correlation with age and high-density lipoprotein cholesterol. Diabetes Res. Clin. Prac. 79 (3) 412 - 418
Ph.D. Thesis 2012 Alan Carter
213
Kabir K, Gelinas JP, Chen M, Chen D, Zhang D, Luo X, Yang JH, Carter D and Rabinovici R (2002) Characterization of a murine model of endotoxin-induced acute lung injury. Shock. 17 (4) 300 - 303
Kalam MA, Haraguchi K, Chandani S, Loechler EL, Moriya M, Greenberg MM and Basu AK (2006) Genetic effects of oxidative DNA damages: comparative mutagenesis of the imidazole ring-opened formamidopyrimidines (Fapy lesions) and 8-oxo-purines in simian kidney cells. Nucleic Acids Res. 34 (8) 2305 - 2315
Kano A, Wolfgang MJ, Gao Q, Jacoby J, Chai GX, Hansen W, Iwamoto Y, Pober JS, Flavell RA and Fu XY (2003) Endothelial cells require STAT3 for protection against endotoxin-induced inflammation. J. Exp. Med. 198 (10) 1517 - 1525
Karahalil B, de Souza-Pinto NC, Parsons JL, Elder RH and Bohr VA (2003) Compromised incision of oxidized pyrimidines in liver mitochondria of mice deficient in NTH1 and OGG1 glycosylases. J. Biol. Chem. 278 (36) 33701 - 33707
Kenagy GJ and Trombulak SC (1986) Size and function of mammalian testes in relation to body size. J. Mam. 67 (1) 1 - 22
Khobta A, Kitsera N, Speckmann B and Epe B (2009) 8-Oxoguanine DNA glycosylase (Ogg1) causes a transcriptional inactivation of damaged DNA in the absence of functional Cockayne syndrome B (Csb) protein. DNA Repair. 8 (3) 309 - 317
Kiefmann R, Heckel K, Doerger M, Schenkat S, Kupatt C, Stoeckelhuber M, Wesierska-Gadek J and Goetz AE (2004) Role of PARP on iNOS pathway during endotoxin-induced acute lung injury. Intensive Care Med. 30 (7) 1421 - 1431
Kim HS, Ye SK, Cho IH, Jung JE, Kim DH, Choi S, Kim YS, Park CG, Kim TY, Lee JW and Chung MH (2006) 8-hydroxydeoxyguanosine suppresses NO production and COX-2 activity via Rac1/STATs signaling in LPS-induced brain microglia. Free Radic. Biol. Med. 41 (9) 1392 - 1403
Kisielewska J, Lu P and Whitaker M (2005) GFP-PCNA as an S-phase marker in embryos during the first and subsequent cell cycles. Biol. Cell. 97 (3) 221 - 229
Kley HK, Solbach HG, McKinnan JC and Kruskemper HL (1979) Testosterone decrease and oestrogen increase in male patients with obesity. Acta Endocrinol. (Copenh). 91 (3) 553 - 563
Klungland A, Rosewell I, Hollenbach S, Larsen E, Daly G, Epe B, Seeberg E, Lindahl T and Barnes DE (1999) Accumulation of premutagenic DNA

Ph.D. Thesis 2012 Alan Carter
214
lesions in mice defective in removal of oxidative base damage. Proc. Natl. Acad. Sci. U. S. A. 96 (23) 13300 - 13305
Kohno T, Kunitoh H, Toyama K, Yamamoto S, Kuchiba A, Saito D, Yanagitani N, Ishihara S, Saito R and Yokota J (2006) Association of the OGG1-Ser326Cys polymorphism with lung adenocarcinoma risk. Cancer Sci. 97 (8) 724 - 728
Koizumi K, Poulaki V, Doehmen S, Welsandt G, Radetzky S, Lappas A, Kociok N, Kirchhof B and Joussen AM (2003) Contribution of TNF-alpha to leukocyte adhesion, vascular leakage, and apoptotic cell death in endotoxin-induced uveitis in vivo. Invest Ophthalmol. Vis. Sci. 44 (5) 2184 - 2191
Konstantinidis A, Valatas V, Ntelis V, Balatsos V, Karoumpalis I, Hatzinikoloaou A, Manolakopoulos S, Vafiadis I, Archimandritis A and Skandalis N (2011) Endoscopic treatment for high-risk bleeding peptic ulcers: a comparison of epinephrine alone with epinephrine plus ethanolamine. Annals of Gastro. 24 (2) 101 - 107
Kooter IM, Frederix K, Spronk HM, Boere AJ, Leseman DL, van SH, ten CH and Cassee FR (2008) Lung inflammation and thrombogenic responses in a time course study of Csb mice exposed to ozone. J. Appl. Toxicol. 28 (6) 779 - 787
Krishnamurthy N, Haraguchi K, Greenberg MM and David SS (2008) Efficient removal of formamidopyrimidines by 8-oxoguanine glycosylases. Biochemistry. 47 (3) 1043 - 1050
Krokan HE, Nilsen H, Skorpen F, Otterlei M and Slupphaug G (2000) Base excision repair of DNA in mammalian cells. FEBS Letters. 476 (1-2) 73 - 77
Kucherlapati M, Yang K, Kuraguchi M, Zhao J, Lia M, Heyer J, Kane MF, Fan K, Russell R, Brown AM, Kneitz B, Edelmann W, Kolodner RD, Lipkin M and Kucherlapati R (2002) Haploinsufficiency of Flap endonuclease (Fen1) leads to rapid tumor progression. Proc. Natl. Acad. Sci. U. S. A. 99 (15) 9924 - 9929
Kurt-Jones EA, Sandor F, Ortiz Y, Bowen GN, Counter SL, Wang TC and Finberg RW (2004) Use of murine embryonic fibroblasts to define Toll-like receptor activation and specificity. J. Endotoxin. Res. 10 (6) 419 - 424
Lam JS, Seligson DB, Yu H, Li A, Eeva M, Pantuck AJ, Zeng G, Horvath S and Belldegrun AS (2006) Flap endonuclease 1 is overexpressed in prostate cancer and is associated with a high Gleason score. BJU. Int. 98 (2) 445 - 451
Ph.D. Thesis 2012 Alan Carter
215
Lange JH, Mastrangelo G, Fadda E, Priolo G, Montemurro D, Buja A and Grange JM (2005) Elevated lung cancer risk shortly after smoking cessation: Is it due to a reduction of endotoxin exposure? Med. Hypotheses. 65 (3) 534 - 541
Lange JH, Mastrangelo G, Fedeli U, Fadda E, Rylander R and Lee E (2003) Endotoxin exposure and lung cancer mortality by type of farming: is there a hidden dose-response relationship? Ann. Agric. Environ. Med. 10 (2) 229 - 232
Larsen E, Meza TJ, Kleppa L and Klungland A (2007) Organ and cell specificity of base excision repair mutants in mice. Mutat. Res. -Fund. Mol. M. 614 (1-2) 56 - 68
Le Page F., Klungland A, Barnes DE, Sarasin A and Boiteux S (2000) Transcription coupled repair of 8-oxoguanine in murine cells: the ogg1 protein is required for repair in nontranscribed sequences but not in transcribed sequences. Proc. Natl. Acad. Sci. U. S. A. 97 (15) 8397 - 8402
Leal AM, Ruiz-Larrea MBa, Mart-¦¦ünez R and Lacort M (1998) Cytoprotective actions of estrogens against tert-butyl hydroperoxide-induced toxicity in hepatocytes. Biochem. Pharmacol. 56 (11) 1463 - 1469
Lee FD (1992) The role of interleukin-6 in development. Dev. Biol. 151 (2) 331 - 338
Lee JM, Lee YC, Yang SY, Yang PW, Luh SP, Lee CJ, Chen CJ and Wu MT (2001) Genetic polymorphisms of XRCC1 and risk of the esophageal cancer. Int. J. Cancer. 95 (4) 240 - 246
Lefévre N, Corazza F, Duchateau J, Desir J and Casimir G (2012) Sex Differences in Inflammatory Cytokines and CD99 Expression Following In Vitro LPS Stimulation. Shock.
Lehmann AR (2003) DNA repair-deficient diseases, xeroderma pigmentosum, Cockayne syndrome and trichothiodystrophy. Biochimie. 85 (11) 1101 - 1111
Li L, Bhatia M, Zhu YZ, Zhu YC, Ramnath RD, Wang ZJ, Anuar FB, Whiteman M, Salto-Tellez M and Moore PK (2005) Hydrogen sulfide is a novel mediator of lipopolysaccharide-induced inflammation in the mouse. FASEB J. 19 (9) 1196 - 1198
Liu AH (2007) Hygiene theory and allergy and asthma prevention. Paediatr. Perinat. Epidemiol. 21 Suppl 3 2 - 7
Lloyd DR and Phillips DH (1999) Oxidative DNA damage mediated by copper(II), iron(II) and nickel(II) fenton reactions: evidence for site-specific mechanisms in the formation of double-strand breaks, 8-
Ph.D. Thesis 2012 Alan Carter
216
hydroxydeoxyguanosine and putative intrastrand cross-links. Mutat. Res. 424 (1-2) 23 - 36
Luna L, Bjoras M, Hoff E, Rognes T and Seeberg E (2000) Cell-cycle regulation, intracellular sorting and induced overexpression of the human NTH1 DNA glycosylase involved in removal of formamidopyrimidine residues from DNA. Mutat. Res. 460 (2) 95 - 104
Mabley JG, Pacher P, Deb A, Wallace R, Elder RH and Szabo C (2005a) Potential role for 8-oxoguanine DNA glycosylase in regulating inflammation. FASEB J. 19 (2) 290 - 292
Mabley JG, Horvath EM, Murthy KGK, Zsengeller Z, Vaslin A, Benko R, Kollai M and Szabo C (2005b) Gender Differences in the Endotoxin-Induced Inflammatory and Vascular Responses: Potential Role of Poly(ADP-ribose) Polymerase Activation. Journal of Pharmacology And Experimental Therapeutics. 315 (2) 812 - 820
Maloney G, Schroder M and Bowie AG (2005) Vaccinia virus protein A52R activates p38 mitogen-activated protein kinase and potentiates lipopolysaccharide-induced interleukin-10. J. Biol. Chem. 280 (35) 30838 - 30844
Marenstein DR, Chan MK, Altamirano A, Basu AK, Boorstein RJ, Cunningham RP and Teebor GW (2003) Substrate specificity of human endonuclease III (hNTH1). Effect of human APE1 on hNTH1 activity. J. Biol. Chem. 278 (11) 9005 - 9012
Marnett LJ (1999) Lipid peroxidation-DNA damage by malondialdehyde. Mutat. Res. 424 (1-2) 83 - 95
Martin J, Han C, Gordon LA, Terry A, Prabhakar S, She X, Xie G, Hellsten U, Chan YM, Altherr M, Couronne O, Aerts A, Bajorek E, Black S, Blumer H, Branscomb E, Brown NC, Bruno WJ, Buckingham JM, Callen DF, Campbell CS, Campbell ML, Campbell EW, Caoile C, Challacombe JF, Chasteen LA, Chertkov O, Chi HC, Christensen M, Clark LM, Cohn JD, Denys M, Detter JC, Dickson M, mitrijevic-Bussod M, Escobar J, Fawcett JJ, Flowers D, Fotopulos D, Glavina T, Gomez M, Gonzales E, Goodstein D, Goodwin LA, Grady DL, Grigoriev I, Groza M, Hammon N, Hawkins T, Haydu L, Hildebrand CE, Huang W, Israni S, Jett J, Jewett PB, Kadner K, Kimball H, Kobayashi A, Krawczyk MC, Leyba T, Longmire JL, Lopez F, Lou Y, Lowry S, Ludeman T, Manohar CF, Mark GA, McMurray KL, Meincke LJ, Morgan J, Moyzis RK, Mundt MO, Munk AC, Nandkeshwar RD, Pitluck S, Pollard M, Predki P, Parson-Quintana B, Ramirez L, Rash S, Retterer J, Ricke DO, Robinson DL, Rodriguez A, Salamov A, Saunders EH, Scott D, Shough T, Stallings RL, Stalvey M, Sutherland RD, Tapia R, Tesmer JG, Thayer N, Thompson LS, Tice H, Torney DC, Tran-Gyamfi M, Tsai M, Ulanovsky LE, Ustaszewska A, Vo N, White PS, Williams AL, Wills PL, Wu JR, Wu K, Yang J, Dejong P, Bruce D, Doggett NA, Deaven L, Schmutz J,
Ph.D. Thesis 2012 Alan Carter
217
Grimwood J, Richardson P, Rokhsar DS, Eichler EE, Gilna P, Lucas SM, Myers RM, Rubin EM and Pennacchio LA (2004) The sequence and analysis of duplication-rich human chromosome 16. Nature. 432 (7020) 988 - 994
Martin SP, Hortelano S, Bosca L and Casado M (2006) Cyclooxygenase 2: understanding the pathophysiological role through genetically altered mouse models. Front Biosci. 11 2876 - 2888
Martin TR (2000) Recognition of Bacterial Endotoxin in the Lungs. Am. J. Respir. Cell Mol. Biol. 23 128 - 132
Martinez FO, Sironi M, Vecchi A, Colotta F, Mantovani A and Locati M (2004) IL-8 induces a specific transcriptional profile in human neutrophils: synergism with LPS for IL-1 production. Eur. J. Immunol. 34 (8) 2286 - 2292
Mathiak G, Kabir K, Grass G, Keller H, Steinringer E, Minor T, Rangger C and Neville LF (2003) Lipopolysaccharides from different bacterial sources elicit disparate cytokine responses in whole blood assays. Int. J. Mol. Med. 11 (1) 41 - 44
Matsukawa A, Yoshimura T, Miyamoto K, Ohkawara S and Yoshinaga M (1997) Analysis of the inflammatory cytokine network among TNF alpha, IL-1 beta, IL-1 receptor antagonist, and IL-8 in LPS-induced rabbit arthritis. Lab Invest. 76 (5) 629 - 638
Maynard S, Schurman SH, Harboe C, de Souza-Pinto NC and Bohr VA (2009) Base excision repair of oxidative DNA damage and association with cancer and aging. Carcinogenesis. 30 (1) 2 - 10
Mberikunashe J, Banda S, Chadambuka A, Gombe NT, Shambira G, Tshimanga M and Matchaba-Hove R (2010) Prevalence and risk factors for obstructive respiratory conditions among textile industry workers in Zimbabwe, 2006. Pan Afr. Med. J. 6 (1)
McElvenny DM, Hurley MA, Lenters V, Heederik D, Wilkinson S and Coggon D (2011) Lung cancer mortality in a cohort of UK cotton workers: an extended follow-up. Br J Cancer. 105 (7) 1054 - 1060
McKERROW CB, McDERMOTT M, GILSON JC and SCHILLING RS (1958) Respiratory function during the day in cotton workers: a study in byssinosis. Br. J. Ind. Med. 16 75 - 83
Millar CB, Guy J, Sansom OJ, Selfridge J, MacDougall E, Hendrich B, Keightley PD, Bishop SM, Clarke AR and Bird A (2002) Enhanced CpG mutability and tumorigenesis in MBD4-deficient mice. Science. 297 (5580) 403 - 405
Ph.D. Thesis 2012 Alan Carter
218
Miller H, Fernandes AS, Zaika E, McTigue MM, Torres MC, Wente M, Iden CR and Grollman AP (2004) Stereoselective excision of thymine glycol from oxidatively damaged DNA. Nucleic Acids Res. 32 (1) 338 - 345
Mitchell JR, Hoeijmakers JH and Niedernhofer LJ (2003) Divide and conquer: nucleotide excision repair battles cancer and ageing. Curr. Opin. Cell Biol. 15 (2) 232 - 240
Mokkapati SK, Wiederhold L, Hazra TK and Mitra S (2004a) Stimulation of DNA glycosylase activity of OGG1 by NEIL1: functional collaboration between two human DNA glycosylases. Biochemistry. 43 (36) 11596 - 11604
Mokkapati SK, Wiederhold L, Hazra TK and Mitra S (2004b) Stimulation of DNA glycosylase activity of OGG1 by NEIL1: functional collaboration between two human DNA glycosylases. Biochemistry. 43 (36) 11596 - 11604
Moller B and Villiger PM (2006) Inhibition of IL-1, IL-6, and TNF-alpha in immune-mediated inflammatory diseases. Springer Semin. Immunopathol. 27 (4) 391 - 408
Moore RN, Goodrum KJ and Berry LJ (1976) Mediation of an endotoxic effect by macrophages. J Reticuloendothel. Soc. 19 (3) 187 - 197
Morland I, Rolseth V, Luna L, Rognes T, Bjoras M and Seeberg E (2002) Human DNA glycosylases of the bacterial Fpg/MutM superfamily: an alternative pathway for the repair of 8-oxoguanine and other oxidation products in DNA. Nucleic Acids Res. 30 (22) 4926 - 4936
Muftuoglu M, de Souza-Pinto NC, Dogan A, Aamann M, Stevnsner T, Rybanska I, Kirkali G, Dizdaroglu M and Bohr VA (2009) Cockayne syndrome group B protein stimulates repair of formamidopyrimidines by NEIL1 DNA glycosylase. J. Biol. Chem. 284 (14) 9270 - 9279
Mutamba JT, Svilar D, Prasongtanakij S, Wang XH, Lin YC, Dedon PC, Sobol RW and Engelward BP (2011) XRCC1 and base excision repair balance in response to nitric oxide. DNA Repair. 10 (12) 1282 - 1293
Naik E and Dixit VM (2011) Mitochondrial reactive oxygen species drive proinflammatory cytokine production. J. Exp. Med. 208 (3) 417 - 420
Netea MG, van Deuren M, Kullberg BJ, Cavaillon JM and Van der Meer JWM (2002) Does the shape of lipid A determine the interaction of LPS with Toll-like receptors? Trends Immunol. 23 (3) 135 - 139
Nilsen H, Stamp G, Andersen S, Hrivnak G, Krokan HE, Lindahl T and Barnes DE (2003) Gene-targeted mice lacking the Ung uracil-DNA glycosylase develop B-cell lymphomas. Oncogene. 22 (35) 5381 - 5386
Ph.D. Thesis 2012 Alan Carter
219
Nilsen H, Rosewell I, Robins P, Skjelbred CF, Andersen S, Slupphaug G, Daly G, Krokan HE, Lindahl T and Barnes DE (2000) Uracil-DNA Glycosylase (UNG)-Deficient Mice Reveal a Primary Role of the Enzyme during DNA Replication. Mol. Cell. 5 (6) 1059 - 1065
Nilsson BO (2007) Modulation of the inflammatory response by estrogens with focus on the endothelium and its interactions with leukocytes. Inflamm. Res. 56 (7) 269 - 273
Nusbaum C, Mikkelsen TS, Zody MC, Asakawa S, Taudien S, Garber M, Kodira CD, Schueler MG, Shimizu A, Whittaker CA, Chang JL, Cuomo CA, Dewar K, FitzGerald MG, Yang X, Allen NR, Anderson S, Asakawa T, Blechschmidt K, Bloom T, Borowsky ML, Butler J, Cook A, Corum B, DeArellano K, DeCaprio D, Dooley KT, Dorris L, III, Engels R, Glockner G, Hafez N, Hagopian DS, Hall JL, Ishikawa SK, Jaffe DB, Kamat A, Kudoh J, Lehmann R, Lokitsang T, Macdonald P, Major JE, Matthews CD, Mauceli E, Menzel U, Mihalev AH, Minoshima S, Murayama Y, Naylor JW, Nicol R, Nguyen C, O'Leary SB, O'Neill K, Parker SC, Polley A, Raymond CK, Reichwald K, Rodriguez J, Sasaki T, Schilhabel M, Siddiqui R, Smith CL, Sneddon TP, Talamas JA, Tenzin P, Topham K, Venkataraman V, Wen G, Yamazaki S, Young SK, Zeng Q, Zimmer AR, Rosenthal A, Birren BW, Platzer M, Shimizu N and Lander ES (2006) DNA sequence and analysis of human chromosome 8. Nature. 439 (7074) 331 - 335
Oakley AJ (2005) Glutathione transferases: new functions. Curr. Opin. Struc. Biol. 15 (6) 716 - 723
Ocampo MT, Chaung W, Marenstein DR, Chan MK, Altamirano A, Basu AK, Boorstein RJ, Cunningham RP and Teebor GW (2002) Targeted deletion of mNth1 reveals a novel DNA repair enzyme activity. Mol. Cell Biol. 22 (17) 6111 - 6121
Ock CY, Kim EH, Hong H, Hong KS, Han YM, Choi KS, Hahm KB and Chung MH (2011a) Prevention of colitis-associated colorectal cancer with 8-hydroxydeoxyguanosine. Cancer Prev. Res. (Phila). 4 (9) 1507 - 1521
Ock CY, Hong KS, Choi KS, Chung MH, Kim Ys, Kim JH and Hahm KB (2011b) A novel approach for stress-induced gastritis based on paradoxical anti-oxidative and anti-inflammatory action of exogenous 8-hydroxydeoxyguanosine. Biochem. Pharmacol. 81 (1) 111 - 122
Orr Y, Wilson DP, Taylor JM, Bannon PG, Geczy C, Davenport MP and Kritharides L (2007) A kinetic model of bone marrow neutrophil production that characterizes late phenotypic maturation. Am. J. Physiol Regul. Integr. Comp Physiol. 292 (4) R1707 - R1716
Orren DK, Petersen LN and Bohr VA (1997) Persistent DNA damage inhibits S-phase and G2 progression, and results in apoptosis. Mol. Biol. Cell. 8 (6) 1129 - 1142

Ph.D. Thesis 2012 Alan Carter
220
Osterod M, Hollenbach S, Hengstler JG, Barnes DE, Lindahl T and Epe B (2001) Age-related and tissue-specific accumulation of oxidative DNA base damage in 7,8-dihydro-8-oxoguanine-DNA glycosylase (Ogg1) deficient mice. Carcinogenesis. 22 (9) 1459 - 1463
Oyama M, Wakasugi M, Hama T, Hashidume H, Iwakami Y, Imai R, Hoshino S, Morioka H, Ishigaki Y, Nikaido O and Matsunaga T (2004) Human NTH1 physically interacts with p53 and proliferating cell nuclear antigen. Biochem. Biophys. Res. Commun. 321 (1) 183 - 191
Panduri V, Liu G, Surapureddi S, Kondapalli J, Soberanes S, de Souza-Pinto NC, Bohr VA, Budinger GRS, Schumacker PT, Weitzman SA and Kamp DW (2009) Role of mitochondrial hOGG1 and aconitase in oxidant-induced lung epithelial cell apoptosis. Free Radic. Biol. Med. 47 (6) 750 - 759
Parsons JL and Elder RH (2003) DNA N-glycosylase deficient mice: a tale of redundancy. Mutat. Res. 531 (1-2) 165 - 175
Paulos CM, Kaiser A, Wrzesinski C, Hinrichs CS, Cassard L, Boni A, Muranski P, Sanchez-Perez L, Palmer DC, Yu Z, Antony PA, Gattinoni L, Rosenberg SA and Restifo NP (2007) Toll-like receptors in tumor immunotherapy. Clin. Cancer Res. 13 (18 Pt 1) 5280 - 5289
Perez-Campo FM, Spencer HL, Elder RH, Stern PL and Ward CM (2007) Novel vectors for homologous recombination strategies in mouse embryonic stem cells: An ES cell line expressing EGFP under control of the 5T4 promoter. Exp. Cell. Res. 313 (16) 3604 - 3615
Pettus BJ, Chalfant CE and Hannun YA (2002) Ceramide in apoptosis: an overview and current perspectives. Biochimica et Biophysica Acta (BBA) - Molecular and Cell Biology of Lipids. 1585 (2-3) 114 - 125
Pheng LH, Francoeur C and Denis M (1995) The involvement of nitric oxide in a mouse model of adult respiratory distress syndrome. Inflammation. 19 (5) 599 - 610
Prins JM (1996) Antibiotic induced release of endotoxin - clinical data and human studies. J. Endotoxin Res. 3 (3) 269 - 273
Prokai L, Prokai-Tatrai K, Perjesi P, Zharikova AD, Perez EJ, Liu R and Simpkins JW (2003) Quinol-based cyclic antioxidant mechanism in estrogen neuroprotection. Proc. Natl. Acad. Sci. U. S. A. 100 (20) 11741 - 11746
Purmal AA, Kow YW and Wallace SS (1994) Major oxidative products of cytosine, 5-hydroxycytosine and 5-hydroxyuracil, exhibit sequence context-dependent mispairing in vitro. Nucleic Acids Res. 22 (1) 72 - 78
Ph.D. Thesis 2012 Alan Carter
221
Qureshi ST, Lariviere L, Leveque G, Clermont S, Moore KJ, Gros P and Malo D (1999) Endotoxin-tolerant mice have mutations in Toll-like receptor 4 (Tlr4). J. Exp. Med. 189 (4) 615 - 625
Radak Z and Boldogh I (2010) 8-Oxo-7,8-dihydroguanine: Links to gene expression, aging, and defense against oxidative stress. Free Radic. Biol. Med. 49 (4) 587 - 596
Radicella JP, Dherin C, Desmaze C, Fox MS and Boiteux S (1997) Cloning and characterization of hOGG1, a human homolog of the OGG1 gene of Saccharomyces cerevisiae. Proc. Natl. Acad. Sci. U. S. A. 94 (15) 8010 - 8015
Radon K (2006) The two sides of the "endotoxin coin". Occup. Environ. Med. 63 (1) 73 - 8, 10
Raetz CR, Guan Z, Ingram BO, Six DA, Song F, Wang X and Zhao J (2009) Discovery of new biosynthetic pathways: the lipid A story. J. Lipid Res. 50 Suppl S103 - S108
Rahman I, Kode A and Biswas SK (2006) Assay for quantitative determination of glutathione and glutathione disulfide levels using enzymatic recycling method. Nat. Protoc. 1 (6) 3159 - 3165
Ratnasinghe D, Yao SX, Tangrea JA, Qiao YL, Andersen MR, Barrett MJ, Giffen CA, Erozan Y, Tockman MS and Taylor PR (2001) Polymorphisms of the DNA repair gene XRCC1 and lung cancer risk. Cancer Epidemiol. Biomarkers Prev. 10 (2) 119 - 123
Reardon JT, Bessho T, Kung HC, Bolton PH and Sancar A (1997) In vitro repair of oxidative DNA damage by human nucleotide excision repair system: possible explanation for neurodegeneration in xeroderma pigmentosum patients. Proc. Natl. Acad. Sci. U. S. A. 94 (17) 9463 - 9468
Reed CE and Milton DK (2001) Endotoxin-stimulated innate immunity: A contributing factor for asthma. J. Allergy Clin. Immunol. 108 (2) 157 - 166
Rietschel ET, Kirikae T, Schade FU, Mamat U, Schmidt G, Loppnow H, Ulmer AJ, Zahringer U, Seydel U, Di PF and . (1994) Bacterial endotoxin: molecular relationships of structure to activity and function. FASEB J. 8 (2) 217 - 225
Risom L, Dybdahl M, Moller P, Wallin H, Haug T, Vogel U, Klungland A and Loft S (2007) Repeated inhalations of diesel exhaust particles and oxidatively damaged DNA in young oxoguanine DNA glycosylase (OGG1) deficient mice. Free Radic. Res. 41 (2) 172 - 181
ROACH SA and SCHILLING RS (1960) A clinical and environmental study of byssinosis in the Lancashire cotton industry. Br. J. Ind. Med. 17 1 - 9
Ph.D. Thesis 2012 Alan Carter
222
Robertson AB, Klungland A, Rognes T and Leiros I (2009) DNA repair in mammalian cells: Base excision repair: the long and short of it. Cell Mol. Life Sci. 66 (6) 981 - 993
Rosenquist TA, Zaika E, Fernandes AS, Zharkov DO, Miller H and Grollman AP (2003) The novel DNA glycosylase, NEIL1, protects mammalian cells from radiation-mediated cell death. DNA Repair (Amst). 2 (5) 581 - 591
Rosenquist TA, Zharkov DO and Grollman AP (1997) Cloning and characterization of a mammalian 8-oxoguanine DNA glycosylase. Proc. Natl. Acad. Sci. U. S. A. 94 (14) 7429 - 7434
Ruchko M, Gorodnya O, LeDoux SP, Alexeyev MF, Al-Mehdi AB and Gillespie MN (2005) Mitochondrial DNA damage triggers mitochondrial dysfunction and apoptosis in oxidant-challenged lung endothelial cells. Am. J. Physiol Lung Cell Mol. Physiol. 288 (3) L530 - L535
Rylander R (2002) Endotoxin in the environment--exposure and effects. J. Endotoxin Res. 8 (4) 241 - 252
Sakumi K, Tominaga Y, Furuichi M, Xu P, Tsuzuki T, Sekiguchi M and Nakabeppu Y (2003) Ogg1 knockout-associated lung tumorigenesis and its suppression by Mth1 gene disruption. Cancer Res. 63 (5) 902 - 905
Salem ML (2004) Estrogen, a double-edged sword: modulation of TH1- and TH2-mediated inflammations by differential regulation of TH1/TH2 cytokine production. Curr. Drug Targets. Inflamm. Allergy. 3 (1) 97 - 104
Sampath H, Batra AK, Vartanian V, Carmical JR, Prusak D, King IB, Lowell B, Earley LF, Wood TG, Marks DL, McCullough AK and Stephen R (2011) Variable penetrance of metabolic phenotypes and development of high-fat diet-induced adiposity in NEIL1-deficient mice. Am. J. Physiol Endocrinol. Metab. 300 (4) E724 - E734
Sarker AH, Ikeda S, Nakano H, Terato H, Ide H, Imai K, Akiyama K, Tsutsui K, Bo Z, Kubo K, Yamamoto K, Yasui A, Yoshida MC and Seki S (1998) Cloning and characterization of a mouse homologue (mNthl1) of Escherichia coli endonuclease III. J. Mol. Biol. 282 (4) 761 - 774
Sarker K, Hashim MA, Hossain MA and Lucky NS (2009) Caudal epidural analgesia in calves using different local analgesics. J. Bangladesh Agri. Uni. 7 (1) 53 - 56
Schromm AB, Brandenburg K, Loppnow H, Zahringer U, Rietschel ET, Carroll SF, Koch MH, Kusumoto S and Seydel U (1998) The charge of endotoxin molecules influences their conformation and IL-6-inducing capacity. J. Immunol. 161 (10) 5464 - 5471
Ph.D. Thesis 2012 Alan Carter
223
Sebai H, Sani M, Ghanem-Boughanmi N+ and Aouani E (2010) Prevention of lipopolysaccharide-induced mouse lethality by resveratrol. Food Chem. Toxicol. 48 (6) 1543 - 1549
Sharman K, Sharman E, Campbell A and Bondy SC (2001) Reduced basal levels and enhanced LPS response of IL-6 mRNA in aged mice. J. Gerontol. A Biol. Sci. Med. Sci. 56 (12) B520 - B523
Sheppard TL, Ordoukhanian P and Joyce GF (2000) A DNA enzyme with N-glycosylase activity. Proc. Natl. Acad. Sci. U. S. A. 97 (14) 7802 - 7807
Shinmura K, Tao H, Goto M, Igarashi H, Taniguchi T, Maekawa M, Takezaki T and Sugimura H (2004) Inactivating mutations of the human base excision repair gene NEIL1 in gastric cancer. Carcinogenesis. 25 (12) 2311 - 2317
Shirota H, Ishii KJ, Takakuwa H and Klinman DM (2006) Contribution of interferon-beta to the immune activation induced by double-stranded DNA. Immunology. 118 (3) 302 - 310
Shrivastav M, De Haro LP and Nickoloff JA (2008) Regulation of DNA double-strand break repair pathway choice. Cell Res. 18 (1) 134 - 147
Sidorenko VS, Nevinsky GA and Zharkov DO (2008) Specificity of stimulation of human 8-oxoguanineΓÇôDNA glycosylase by AP endonuclease. Biochem. Bioph. Res. Co. 368 (1) 175 - 179
Singh P, Yang M, Dai H, Yu D, Huang Q, Tan W, Kernstine KH, Lin D and Shen B (2008) Overexpression and hypomethylation of flap endonuclease 1 gene in breast and other cancers. Mol. Cancer Res. 6 (11) 1710 - 1717
Slupphaug G, Kavli B and Krokan HE (2003) The interacting pathways for prevention and repair of oxidative DNA damage. Mutat. Res. 531 (1-2) 231 - 251
Smart DJ, Chipman JK and Hodges NJ (2006) Activity of OGG1 variants in the repair of pro-oxidant-induced 8-oxo-2'-deoxyguanosine. DNA Repair. 5 (11) 1337 - 1345
Smith JA (1994) Neutrophils, host defense, and inflammation: a double-edged sword. J. Leukoc. Biol. 56 (6) 672 - 686
Smith RS, Smith TJ, Blieden TM and Phipps RP (1997) Fibroblasts as sentinel cells. Synthesis of chemokines and regulation of inflammation. Am. J. Pathol. 151 (2) 317 - 322
Soriano FG, Liaudet L, Szabo E, Virag L, Mabley JG, Pacher P and Szabo C (2002) Resistance to acute septic peritonitis in poly(ADP-ribose) polymerase-1-deficient mice. Shock. 17 (4) 286 - 292
Ph.D. Thesis 2012 Alan Carter
224
Speyer CL, Rancilio NJ, McClintock SD, Crawford JD, Gao H, Sarma JV and Ward PA (2005) Regulatory effects of estrogen on acute lung inflammation in mice. Am. J. Physiol Cell Physiol. 288 (4) C881 - C890
Starcevic D, Dalal S and Sweasy JB (2004) Is there a link between DNA polymerase beta and cancer? Cell Cycle. 3 (8) 998 - 1001
Stern MC, Umbach DM, van Gils CH, Lunn RM and Taylor JA (2001) DNA repair gene XRCC1 polymorphisms, smoking, and bladder cancer risk. Cancer Epidemiol. Biomarkers Prev. 10 (2) 125 - 131
Stivers JT and Jiang YL (2003) A mechanistic perspective on the chemistry of DNA repair glycosylases. Chem. Rev. 103 (7) 2729 - 2759
Strong VE, Kennedy T, Al-Ahmadie H, Tang L, Coleman J, Fong Y, Brennan M and Ghossein RA (2008) Prognostic indicators of malignancy in adrenal pheochromocytomas: clinical, histopathologic, and cell cycle/apoptosis gene expression analysis. Surgery. 143 (6) 759 - 768
Sugioka K, Shimosegawa Y and Nakano M (1987) Estrogens as natural antioxidants of membrane phospholipid peroxidation. FEBS Letters. 210 (1) 37 - 39
Svilar D, Goellner EM, Almeida KH and Sobol RW (2011) Base excision repair and lesion-dependent subpathways for repair of oxidative DNA damage. Antioxid. Redox. Signal. 14 (12) 2491 - 2507
Takao M, Kanno S, Kobayashi K, Zhang QM, Yonei S, van der Horst GT and Yasui A (2002a) A back-up glycosylase in Nth1 knock-out mice is a functional Nei (endonuclease VIII) homologue. J. Biol. Chem. 277 (44) 42205 - 42213
Takao M, Kanno S, Shiromoto T, Hasegawa R, Ide H, Ikeda S, Sarker AH, Seki S, Xing JZ, Le XC, Weinfeld M, Kobayashi K, Miyazaki J, Muijtjens M, Hoeijmakers JH, van der HG and Yasui A (2002b) Novel nuclear and mitochondrial glycosylases revealed by disruption of the mouse Nth1 gene encoding an endonuclease III homolog for repair of thymine glycols. EMBO J. 21 (13) 3486 - 3493
Takeda K, Tanaka T, Shi W, Matsumoto M, Minami M, Kashiwamura S, Nakanishi K, Yoshida N, Kishimoto T and Akira S (1996) Essential role of Stat6 in IL-4 signalling. Nature. 380 (6575) 627 - 630
Tenopoulou M, Doulias PT, Barbouti A, Brunk U and Galaris D (2005) Role of compartmentalized redox-active iron in hydrogen peroxide-induced DNA damage and apoptosis. Biochem. J. 387 (Pt 3) 703 - 710
Tentori L, Leonetti C, Scarsella M, D'Amati G, Vergati M, Portarena I, Xu W, Kalish V, Zupi G, Zhang J and Graziani G (2003) Systemic administration of GPI 15427, a novel poly(ADP-ribose) polymerase-1
Ph.D. Thesis 2012 Alan Carter
225
inhibitor, increases the antitumor activity of temozolomide against intracranial melanoma, glioma, lymphoma. Clin. Cancer Res. 9 (14) 5370 - 5379
Tominaga K, Kirikae T and Nakano M (1997) Lipopolysaccharide (LPS)-induced IL-6 production by embryonic fibroblasts isolated and cloned from LPS-responsive and LPS-hyporesponsive mice. Mol. Immunol. 34 (16-17) 1147 - 1156
Touati E, Michel V, Thiberge JM, Ave P, Huerre M, Bourgade F, Klungland A and Labigne A (2006) Deficiency in OGG1 protects against inflammation and mutagenic effects associated with H. pylori infection in mouse. Helicobacter. 11 (5) 494 - 505
Tremblay S, Gantchev T, Tremblay L, Lavigne P, Cadet J and Wagner JR (2007) Oxidation of 2'-deoxycytidine to four interconverting diastereomers of N1-carbamoyl-4,5-dihydroxy-2-oxoimidazolidine nucleosides. J. Org. Chem. 72 (10) 3672 - 3678
Tsuzuki T, Egashira A, Igarashi H, Iwakuma T, Nakatsuru Y, Tominaga Y, Kawate H, Nakao K, Nakamura K, Ide F, Kura S, Nakabeppu Y, Katsuki M, Ishikawa T and Sekiguchi M (2001) Spontaneous tumorigenesis in mice defective in the MTH1 gene encoding 8-oxo-dGTPase. Proc Natl. Acad. Sci. U. S. A. 98 (20) 11456 - 11461
Turaga RV, Paquet ER, Sild M, Vignard J, Garand C, Johnson FB, Masson JY and Lebel M (2009) The Werner syndrome protein affects the expression of genes involved in adipogenesis and inflammation in addition to cell cycle and DNA damage responses. Cell Cycle. 8 (13) 2080 - 2092
Turrens JF (2003) Mitochondrial formation of reactive oxygen species. J. Physiol. 552 (Pt 2) 335 - 344
Tyrberg B, Anachkov KA, Dib SA, Wang-Rodriguez J, Yoon KH and Levine F (2002) Islet Expression of the DNA Repair Enzyme 8-oxoguanosine DNA Glycosylase (OGG1) in Human Type 2 Diabetes. BMC Endocr. Disord. 2 2 - 2
Vaara M (1999) Lipopolyscharride and the Permeability of the Bacterial Outer Membrane. 10 (2) 31 - 38
Van SJ (1990) Interleukin-6: an overview. Annu. Rev. Immunol. 8 253 - 278
Vartanian V, Lowell B, Minko IG, Wood TG, Ceci JD, George S, Ballinger SW, Corless CL, McCullough AK and Lloyd RS (2006) The metabolic syndrome resulting from a knockout of the NEIL1 DNA glycosylase. Proc. Natl. Acad. Sci. U. S. A. 103 (6) 1864 - 1869
Ph.D. Thesis 2012 Alan Carter
226
Vernooy JHJ, Dentener MA, van Suylen RJ, Buuman WA and Wouters EFM (2001) Intratracheal instillation of lipopolysaccharide in mice induces apoptosis in bronchial epithelial cells: No role for tumor necrosis factor-a and infiltrating neutrophils. Am. J. Respir. Cell Mol. Biol. 24 569 - 576
Vilenchik MM and Knudson AG, Jr. (2000) Inverse radiation dose-rate effects on somatic and germ-line mutations and DNA damage rates. Proc. Natl. Acad. Sci. U. S. A. 97 (10) 5381 - 5386
Virag L and Szabo C (2002) The therapeutic potential of poly(ADP-ribose) polymerase inhibitors. Pharmacol. Rev. 54 (3) 375 - 429
Vogel U, Nexo BA, Olsen A, Thomsen B, Jacobsen NR, Wallin H, Overvad K and Tjonneland A (2003) No association between OGG1 Ser326Cys polymorphism and breast cancer risk. Cancer Epidemiol. Biomarkers Prev. 12 (2) 170 - 171
Wallace SS (2002) Biological consequences of free radical-damaged DNA bases. Free Radic. Biol. Med. 33 (1) 1 - 14
Wan GH, Li CS and Lin RH (2000) Airborne endotoxin exposure and the development of airway antigen-specific allergic responses. Clin. Exp. Allergy. 30 (3) 426 - 432
Wang JP, Kurt-Jones EA, Shin OS, Manchak MD, Levin MJ and Finberg RW (2005) Varicella-zoster virus activates inflammatory cytokines in human monocytes and macrophages via Toll-like receptor 2. J. Virol. 79 (20) 12658 - 12666
Wang X and Quinn PJ (2010) Lipopolysaccharide: Biosynthetic pathway and structure modification. Prog. Lipid. Res. 49 (2) 97 - 107
Watson J and Riblet R (1974) Genetic control of responses to bacterial lipopolysaccharides in mice. I. Evidence for a single gene that influences mitogenic and immunogenic respones to lipopolysaccharides. J. Exp. Med. 140 (5) 1147 - 1161
Watson J and Riblet R (1975) Genetic control of responses to bacterial lipopolysaccharides in mice. II. A gene that influences a membrane component involved in the activation of bone marrow-derived lymphocytes by lipipolysaccharides. J. Immunol. 114 (5) 1462 - 1468
Whitacre CC (2001) Sex differences in autoimmune disease. Nat. Immunol. 2 (9) 777 - 780
Williams TJ (1979) Prostaglandin E2, prostaglandin I2 and the vascular changes of inflammation. Br. J. Pharmacol. 65 (3) 517 - 524
Wilson III DM and McNeill DR (2007) Base excision repair and the central nervous system. Neuroscience. 145 (4) 1187 - 1200
Ph.D. Thesis 2012 Alan Carter
227
Wolfer DP, Crusio WE and Lipp HP (2002) Knockout mice: simple solutions to the problems of genetic background and flanking genes. Trends Neurosci. 25 (7) 336 - 340
Wood C (2000) Future trends in human reproduction. Aust. N. Z. J. Obstet. Gynaecol. 40 (2) 127 - 132
Wood RD, Mitchell M, Sgouros J and Lindahl T (2001) Human DNA repair genes. Science. 291 (5507) 1284 - 1289
Xanthoudakis S, Smeyne RJ, Wallace JD and Curran T (1996) The redox/DNA repair protein, Ref-1, is essential for early embryonic development in mice. Proc. Natl. Acad. Sci. U. S. A. 93 (17) 8919 - 8923
Xie Y, Yang H, Cunanan C, Okamoto K, Shibata D, Pan J, Barnes DE, Lindahl T, McIlhatton M, Fishel R and Miller JH (2004) Deficiencies in mouse Myh and Ogg1 result in tumor predisposition and G to T mutations in codon 12 of the K-ras oncogene in lung tumors. Cancer Res. 64 (9) 3096 - 3102
Yamashita T, Kawashima S, Ohashi Y, Ozaki M, Ueyama T, Ishida T, Inoue N, Hirata K, Akita H and Yokoyama M (2000) Resistance to endotoxin shock in transgenic mice overexpressing endothelial nitric oxide synthase. Circulation. 101 (8) 931 - 937
Yang D, Elner SG, Bian ZM, Till GO, Petty HR and Elner VM (2007) Pro-inflammatory cytokines increase reactive oxygen species through mitochondria and NADPH oxidase in cultured RPE cells. Exp. Eye Res. 85 (4) 462 - 472
Ye SM and Johnson RW (2001) An age-related decline in interleukin-10 may contribute to the increased expression of interleukin-6 in brain of aged mice. Neuroimmunomodulation. 9 (4) 183 - 192
Zelissen PMJ, Bast EJEG and Croughs RJM (1995) Associated Autoimmunity in Addison's Disease. J. Autoimmun. 8 (1) 121 - 130
Zhang L, Fujii S and Kosaka H (2007) Effect of oestrogen on reactive oxygen species production in the aortas of ovariectomized Dahl salt-sensitive rats. J. Hypertens. 25 (2) 407 - 414
Zheng L, Dai H, Zhou M, Li M, Singh P, Qiu J, Tsark W, Huang Q, Kernstine K, Zhang X, Lin D and Shen B (2007) Fen1 mutations result in autoimmunity, chronic inflammation and cancers. Nat. Med. 13 (7) 812 - 819
Zody MC, Garber M, Adams DJ, Sharpe T, Harrow J, Lupski JR, Nicholson C, Searle SM, Wilming L, Young SK, Abouelleil A, Allen NR, Bi W, Bloom T, Borowsky ML, Bugalter BE, Butler J, Chang JL, Chen CK, Cook A, Corum B, Cuomo CA, de Jong PJ, DeCaprio D, Dewar K, FitzGerald M, Gilbert J,
Ph.D. Thesis 2012 Alan Carter
228
Gibson R, Gnerre S, Goldstein S, Grafham DV, Grocock R, Hafez N, Hagopian DS, Hart E, Norman CH, Humphray S, Jaffe DB, Jones M, Kamal M, Khodiyar VK, LaButti K, Laird G, Lehoczky J, Liu X, Lokyitsang T, Loveland J, Lui A, Macdonald P, Major JE, Matthews L, Mauceli E, McCarroll SA, Mihalev AH, Mudge J, Nguyen C, Nicol R, O'Leary SB, Osoegawa K, Schwartz DC, Shaw-Smith C, Stankiewicz P, Steward C, Swarbreck D, Venkataraman V, Whittaker CA, Yang X, Zimmer AR, Bradley A, Hubbard T, Birren BW, Rogers J, Lander ES and Nusbaum C (2006) DNA sequence of human chromosome 17 and analysis of rearrangement in the human lineage. Nature. 440 (7087) 1045 - 1049