Embed Size (px)
Citation preview

RESEARCH & DEVELOP ME NT I N FO RM AT1 0 N
PCA R&D Serial No. 2054
The Role of Concrete Cover in Crack Control Criteria
and Corrosion Protection
by R. G. Oesterle
0 Portland Cement Association 1997

TABLE OF CONTENTS
INTRODU~ON ........................................................................ 1
1 .1 Background ......................................................................... 1 1.2 Need for Re-evaluation ............................................................ 3 1.3 Objectives of Study ............................................................... 4
REVIEW OF BUILDING CODE PROVISIONS ..................................... 6 2.1 History of ACI Code Provisions ................................................. 6 2.2 Other Building Codes .............................................................. 7 2.3 Proposed Revisions to ACI Code ............................................... 10
EXPERIMENTAL CRACK WIDTH DATA ......................................... 11
3.1 Review of Data .................................................................... 11 3.2 3.3 Effective Concrete Area. A ..................................................... 14 3.4 Local Effective Reinforcement Ratio. pe ....................................... 14
Concrete Cover. & ................................................................ 12
RE-EVALUATION OF ACI CRACK CONTROL .................................. 18
NEED FOR CRACK CONTROL ................................................... 19
5.1 Crack Control for Corrosion Protection. ....................................... 19 5.2 Crack Control for Aesthetics ..................................................... 22
CONCLUSIONS AND RECOMMENDATIONS ................................... 24
A C ~ O ..MENT ................................................................ 25
REFERENCES ........................................................................... 25
APPENDIX A .
APPENDIX B . ACI COMMITT'EE 224 PROPOSED REVISIONS TO ACI 3 18
CALCULATED VERSUS MEASURED CRACK WIDTH WITH DATA SORTED BY 4
DATA SORTED BY A APPENDIX C . CALCULATED VERSUS MEASURED CRACKWIDTHWlTH
APPENDIX I) * CALCULATED VERSUS MEASURED CRACK WIDTH WITH DATA SORTED BY pt
i

THE ROLE OF CONCRETE COVER IN CRACK CONTROL CRITERIA AND CORROSION PROTECTION
by Ralph G. Oesterle*
1 .O INTRODUCTION
1.1 Background
The use of concrete as an efficient structural material relies on the combination of portland cement concrete and steel reinforcement. Concrete provides compressive strength and steel provides tensile strength. A great advantage of this combination is that, while corrosion is typically a major concern with use of steel, portland cement concrete, with high alkalinity and a process called passivation, provides an excellent environment for protection of steel from corrosion. With a pH of 12.5 or greater, a microscopic oxide layer is formed on the steel surface which prohibits corrosion. Therefore,, for a durable concrete structure, actions which disrupt the passive protection layer and lower the pH level in the concrete are to be avoided.
Cracking of concrete has been intuitively related to disruption of the protective layer and, therefore, to corrosion of steel reinforcement. However, for efficient use of the concept of reinforced concrete, c r a c b g cannot be avoided. Cracking of the concrete must occur if the steel is to be used effectively. Therefore, engineers have traditionally used what was considered a common sense approach to minimizing corrosion by attempting to maintain limitations on crack width. Crack control has commonly been considered essential to control corrosion(1).
Stemming from studies carried out in Sweden starting in 1943 to limit crack widths in highway bridges@), signficant research was carried out through the 1950s and 1960s to determine relationships between concrete crack width and design parameters of reinforced concrete. This crack control research combined with increased use of Grade 60 reinforcement and use of the strength design approach lead to incorporation of structural building code requirements for proper distribution of flexural reinforcement to control cracking. These building code requirements were instituted in the 1970s(3) and are still in use today. Current structural codes in the United States and elsewhere utilize a limiting value of a z-factor to provide distribution of flexural reinforcement for controlling crack widths when the design yield strength of reinforcement exceeds 40 h i . The limiting z-factor values are related to limiting crack widths through the Gergely-Lutz (G-L) relationship between crack width and steel stress(3).
To understand the relationship between crack width and steel stress, a basic understanding of crack behavior of reinforced concrete is nee&d. Initial cracks form in reinforced concrete members through response of a concrete member as a gross section. Following formation of the initial cracks, the normal stress in the concrete at the cracks is zero and reinforcement spanning the cracks carries tensile stress. With increased load on the member inducing higher tensile stress on the steel, tendency for further cracks to form between the initial cracks depends on the ability of the reinforcement to transfer tensile stress into the surrounding concrete. If sufficient tensile stress is transferred back into the concrete(4) away from the initial cracks through bond stress between the steel and concrete, the concrete will crack again between the initial cracks. A greater capacity of reinforcement
* Senior Principal Structural Engineer, Smctural Engineering Group, Consmction Technology Laboratories, Skokie, Illinois 60077
1

to msfe r stress into surrounding concrete results in a decreased spacing between cracks. For a specific steel stress, a smaller spacing between cracks results in a smaller crack width at each crack
Crack spacing and crack width is dependent on many factors including the bond characteristics of the steel reinforcement, the ratio of reinforcement area to surrounding concrete m a , and the tensile strength of the surrounding concrete. The bond capacity between the reinforcement and concrete depends on the bar diameter and on the concrete cover over the steel bar. For an equivalent steel cross sectional area, using several smaller diameter bars in place of one larger diameter bar increases the bar surface area and therefore, the bond transfer capacity. Bond stress capacity is limited by splitting stresses in the cover concrete. Inkeasing the cover, up to a certain value, increases maximum bond stress. Smaller diameter bars require less cover to prevent splitting stresses.
Based on analyses of data by Gergely and Lutz(5) from a number of experimental programs, a relationship between crack width, w, steel stress, fs, concrete cover, &, and surrounding concrete area, A, was developed. This relationship was utilized in the building codes in the United Statesg), to defme a z factor.
The parameters c& and A are illustrated in Fig. 1. The maximum crack width is intended to be limited by limiting the z-factor to a specific value.
L clear Cover, c
Effective Concrete Area A = 2 d ~
FIG. 1 PARAMETERS USED IN Z-FACTOR CALCULATIONS.
2

1.2 Need for Re-evaluatlon
Use of the z-factor to minimize corrosion through crack control came under debate in the 198Od6). The use of crack control was questioned from two aspects. The f i s t aspect is a consequence of steel distribution. When providing a quantity of tensile steel area, As, in a flexural member, one way to maintain a low z-factor is to maintain a low area of surrounding concrete, A, in Equation [l]. Therefore, use of the z-factor will tend to result in relatively smaller diameter, more closely spaced bars. For a given steel s t r e s s , this distribution of steel results in more tightly spaced, small width cracks. This crack distribution, however, creates more locations where the passive protection layer can be disrupted. Also, for the same total As, a larger number of smaller diameter bars has a greater surface area, and, therefore, may be affected to a greater degree once corrosion starts. The result is that unless corrosion is truly prohibited from occurring by maintaining mck widths below some limiting value, crack width control could actually lead to greater corrosion. As further discussed in Section 5.1 of this report, tests and field studies indicate that, when considering corrosion over the life span of reinforced concrete structures, there is no practical crack width limit that will prohibit corrosion.
The second aspect of questioning crack control through use of the z-factor stems from the presence of the term &, in Equation [ 11. The term & in a flexural element is the concrete cover from the concrete tension surface to the center of the closest steel bar, A lower value of & in Equation [ 11 results in a lower value of z. Therefore, a design engineer would tend to use minimum concrete cover on reinforcement to maintain a low z- factor. The use of low cover, however, is contradictory to results of corrosion studies@). These studies indicate increased concrete cover provides increased corrosion protection. An engineer that wants to use increased cover to provide better corrosion protection will have difficulty in meeting the code requirements for the z-factor limit. This problem would commonly occur in the top reinforcement of a slab for a parking garage, bridge deck or pier.
Figure 2 demonstrates the sensitivity of maximum bar spacing in a one-way slab required to stay within code limiting values of z as the value of & is increased. Figure 2 shows that, for exterior exposure conditions, maximum bar spacing quickly becomes unreasonably tight as & increases beyond 2 in. It should be noted that for cast-in-place reinforced concrete exposed to weather, the minimum clear cover required by the code for No. 6 bars and larger is 2-in. Therefore, minimum & for a No. 6 bar is 2.38-in. If the designer wants to increase cover to increase corrosion protection, the resulting design will most probably have to violate the z-factor limit. For foundation concrete cast against earth, the required 3-in. minimum clear cover cannot be satisfied practically without violating the z-factor limit. This is paradoxical in that the z-factor limit is in the code supposedly to ensure corrosion protection but it cannot be met practically if an engineer wants to increase cover to get better corrosion protection. Therefore, there was a need to reevaluate the z- factor limit requirements in the current building codes.
ACI Committee 224 has considered the problems with the current z-factor approach to crack control and has proposed revisions to the ACI 3 18 Building Code. The proposed revision, presented to ACI 318 for balloting in the fall of 1994 would permit designers to use a value of & in Equation [ 11 that is based on the applicable minimum concrete cover requirements rather than the actual cover to be used in construction. A copy of the proposed code revisions is included in Appendix A of this report. The proposed revisions would allow designers to increase concrete cover beyond minimum cover requirements without being penalized by the limiting z-factor. However, the designer will then be using data in an empirical design equation that does not represent the actual physical conditions. The proposed code revisions did not propose any limitations on the actual concrete cover used by the designer. The proposed revisions did, however, include limitations on the spacing of bars as an alternate design criterion. The spacing limitations will theoretically result in limiting crack widths to the same values that the current z-factor limits result in if
3

the concrete cover over the reinforcement corresponds to &, I 2 in. in slab and in. in beams with maximum steel stress of 36 ksi. The commentary to the proposed code change warns that use of additional cover may result in greater surface crack widths. However, no limitations on actual concrete cover are specified.
The proposed revisions were not approved by ACI 318 in the 1994 balloting and were retuned to Committee 224 for further study. There is a need to study the ramifications of the proposed code revisions.
I 2-1/2
1.3 Objectlves of Study
The objectives of the study presented in this report are:
1. To examine the background and history of the z-factor approach and to reevaluate its validity in providing corrosion protection and crack width control, particularly for concrete elements with large cover over the reinforcement.
2. To determine if there is sufficient justification and available data to develop a modified or alternate approach.
3. To establish a research plan to accomplish development of an alternate approach if needed.
4. To provide a state-of-the-art report detailing findings and recommendations to resolve the questions regarding the z-factor approach.
The study was accomplished within the following tasks: 1. Review of literature and experimental data related to development of the z-factor
approach. 2. Review of literature related to cracking and corrosion in reinforced concrete. 3. Perform crack width calculations using select formulations including the Gergely-
Lutz relationship and proposed ACI Code Revisions for comparison with experimental data for reinforcement with relatively large cover.
4, Synthesize information into a report.
15
10
ALLOWABLE SPACING, Smax,
in.
5
0 I I
I I
I I
I I
I i
1 2 3 4 5 0
dc, in
FIG. 2 RELATIONSHIP BETWEEN MAXIMUM BAR SPACING IN A ONE-WAY SLAB AND d, FOR Z = 145 KIPS/IN. FOR EXTERIOR EXPOSURE AND fs = 36 KSI.
5

2.0 REVIEW OF BUILDING CODE PROVISIONS
2.1 History of ACI Code Provisions
As early as 1943, investigations have been ongoing to study the concepts Iegarding the mechanisms of crack formation. General equations for width and spacing of tensile cracks were presented in a paper by Watstein and Parsons in 1943(4). In Sweden, a special investigation of crack formation was instigated by Professor Whtlund of the Royal Institute of Technology, Stockholm@). Research continued on through the 1950s and 1960s(4) which lead to building code design criteria in the 1970s.
The ACI 3 18-63(7) addressed crack control simply by requiring the use of deformed reinforcement and by specifying that: “Tension reinforcement shall be well distributed in the zones of maximum concrete tension and in the flanges of T-Beams.” Most probably stemming from increased use of Grade 60 reinforcement and use of strength design, both resulting in higher service load strain, significantly more attention was paid to crack control in ACI 3 18-7 l(3). The background equation behind the new provisions in ACI 3 18-7 1 was the crack width versus steel stress relationships developed by Gergely and Lutz(5). The relationships were developed based on extensive statistical evaluation of data from six different experimental investigations@-13). The evaluation considered both crack width on the bottom of the flexural member and on the side of the member. The statistical evaluation considered a relatively large number of regression analyses with various foxms and combinations of variables looking for best fit with experimental data by a least squares of deviations criterion. The following recommended equation for bottom crack width based on this study became the background equation for the ACI 318-71 Code Provisions(3).
where: Wb =
R =
fs =
tb =
A =
Maximum bottom crack width in constant moment region, (0.001 in.) Ratio of the distance from neutral axis to the bottom of member to the distance from neutral axis to the centroid of reinforcement Reinforcing steel stress, ( h i ) Bottom cover measured h m the center of the lowest bar, (in.)
Average concrete area around a reinforcing bar, (in.*) (NOTE: & in Equation [ 1 J is equivalent to tb in Equation [2]. Also, the ACI 318 Commentary replaced R with the designation p)
Rather than use specific crack width limits in the code, the committee responsible for the code crack control provisions wanted to use a simple crack control parameter similar to a T factor approach used in Sweden@* 14). Use of a specific crack width limit implies more accuracy in crack width calculations than can be realistically accomplished. Use of a parameter such as the T factor was thought to emphasize design for good flexural steel distribution rather than limiting each crack to a specific value, To accomplish this, the z-factor was introduced by Professor Nawy in his evaluation of proposed crack control criteria(1).
The code limits for z-factor calculated using Equation [ 11 in this report are currently 175 kips/in. for interior exposure and 145 kips/in, for exterior exposure. These limits relate to crack widths of 0.016 in. and 0.013 in. respectively from Equation [2] utilizing R=1.2. The crack widths related to the z-factor limits are very similar to the Swedish limits(*) of 0.014 to 0,015 in. for calculated crack width at dead load plus 1/2 live load.
6

It is interesting to note that, in the statistical evaluation of various parameters, Gergely and Lutz stated that it is difficult to select an equation that fits all the sets of data well. In addition to 3 K A , several other parameters, including 4 n , were good variables. The 4 f i is a parameter suggested by Kaar and Mattock(10) and Kaar and Hognestad(l l) for the following crack width relationship:
Gergely and Lutz recommended the parameter 3 K A rather than 4fi because it was dimensionally correct and, in general, fit the data better.
In Nawy’s evaluatiodl), both Equation [2] and [3] were considered. Nawy showed that the Gergely-Luu equation (Equation[ 21) and the Kaar-Mattock equation (Equation [3]) fit the data approximately as well. Nawy recommended the Gergely and Lutz equation because it was consistently a little more conservative in determining an acceptable steel stress for limiting cracking. However, results using the Kaar-Mattock equation were not significantly different. H u s h and Ferguson(l5) also evaluated both Equation [2] and [3] and found that both equations agreed reasonably well with their test data.
An interesting observation on the accuracy of Equation [2] and use of the z-factor was pointed out by HalvorsenW. To simplify calculations, the R ratio is typically assumed to be a constant 1.2 in calculation of the z-factor from Equation [2], whereas it was a variable in the data analyzed by Gergely and Lutz in developing Equation [2]. Halvorsen demonstrated the typical range for R is approximately 1.1 to 1.4 dependent on member depth, reinforcement ratio and concrete strength. The use of a constant R desensitizes the calculation of crack width to the variations of section properties. In addition, crack width is a direct function of R, whereas it is a function of the third root of tbA. Therefore, the equation is more sensitive to variation in R than to variation in tbA.
Other major observations about the accuracy of crack width calculations include: 1.
2.
3 .
Measured crack spacing and crack width can vary from the average values by at least t 50%(9* 15).
The crack width at the level of the reinforcement is significantly less than the crack width at the surface of the concrete member(l5~ 16).
Cracking behavior is altered as concrete cover becomes large. H~gnes tad(~) noted that with large cover, secondary cracks form that don’t extend to the tension face of the beam. Husain and Ferguson(l5) observed that, for other conditions being equal, the crack width at the beam tension face varied almost linearly with the cover up to 2.25 in. in their test specimens. However, crack widths in specimens with 3 in. clear cover were significantly greater than extrapolation from the linear trend with smaller covers would suggest.
2.2 Other Building Codes
Although different crack width criteria might be expected in different countries due to varying climate conditions(l7), many other codes such as Canadian Code~(l83~9) are adaptations of the ACI z-factor approach using Gergely-Lutz equation with the primary difference being conversion to metric units. It is interesting to note, however, that prior to the ACI 318-71 code, supplements to the AASHTO bridge specifications contained crack control criteria. These supplements, published by the U.S. Bureau of Public Road in 1966 and 1969(14, 20, 21), were issued to provide strength design criteria. Limiting crack widths based on exposure were tabulated and the Kaar-Mattock equation was stipulated for calculation of crack width at the level of the reinforcement, Following publication of ACI 318-71, however, a modification to the factor approach based on the Gergely-Lutz equation was adopted in the bridge spe~ i f i ca t ion . (~~~ 22)
7

European C o d e ~ ( ~ 3 , ~ ) have more complex relationships for determining crack widths. Whereas the ACI z-factor is a simplified approach based essentially on one empirical equation, the CEB-FIP Model Code(23) utilizes a complex series of equations to model the basic mechanics of stress transfer between the steel and concrete to calculate a crack width. The fundamental crack width formula in CEB-FIP is as follows:
Wk = Is, m u (Esm - Ecm - Ecs) [41 where:
Wk = The characteristic crack width, ls, m a = Maximum length of bar over which bond slip between the steel and
concrete occur contributing to the width of the crack,
Esm = Average steel strain within ls, max,
Qm = Average concrete strain within Is, mm,
QS = Shrinkage strain of concrete (contraction would have a negative value).
The CEB-FIP Code presents a detailed approach to determining the strains in Equation [4] including consideration for:
1. Whether the stress state is in a condition of forming new cracks or a stable crack condition has been reached.
2. Tensile strength of concrete. 3 , Modular ratio of steel to concrete. 4, Ratio of area of reinforcement to m a of surrounding concrete. 5 . Bar diameter. 6 . Bond slip. Equation [4] does not have explicit consideration of concrete cover but stipulates that
the thickness of cover (plus transverse steel if needed) should be selected to insure full bond development without longitudinal cracking.
Although CEB-FIP places more emphasis on details in the calculations for crack width than the Gergely and Lutz relationship used far the ACI 31 8 Code, the role of crack width with respect to corrosion is de-emphasized in the CEB-FIP code. Corrosion risk is stated to be predominantly dependent on concrete impermeability and thickness of cover with crack width king of minor importance. In a design guide developed by a CEB Task Group(25) to solve technical aspects of premature degradation of concrete structures, it was pointed out that both carbon dioxide and chlorides penetrate through to the steel layer through cracked concrete some order of magnitude faster than through uncracked concrete, Also, the time to depassivation of the protective layer depends on crack width. However, the time difference between a 0.007 in. and a 0.015 in. crack is negligible as compared to the life of the structure. Figure 3 illustrates the relationship between the time to depassivation and crack width from Reference 25. Although the time is generally decreasing with increasing crack width, the time to depassivation from these data only range from approximately 1 to 6 years. Therefore, the crack width becomes inconsequential for long term durability. A crack width limit is not specified in the CEB- FIP Code but the commentary implies that 0.3 mm (0.012 in.) is generally satisfactory.
The CEB-FIP approach is based on a classical bond slip model of cracking such that the concrete crack width is the accumulation of relative slip between the bar and the concrete. The Eurocode 2, however, incorporates, to some extent, a no-slip model initially proposed by Base, et a1(26). In a study comparing crack widths in concrete with both plain
8

(smooth) bars and deformed bars, Base concluded that crack width at the surface of the concrete is primarily a function of the elastic recovery of the concrete between cracks and the restraining influence of nearby reinforcement. Cracks taper from a certain width on the surface of the concrete to near zero at the steel-concrete interface. Within the effective area of concrete surrounding a bar, the width of a crack is directly proportional to the distance from the point of measurement of the crack to the surface of the nearest reinforcing bar. Base, et al proposed the following crack width relationship:
wmax = 3 , 3 ~ Em where:
c = concrete cover Em = mean strain in the reinforcement
Time to Depassivat ion
(years)
L
0 I I I I 0 0.005 0.01 0 0.01 5 0.020
Crack Width (in)
FIG. 3 RELATIONSHIP BETWEEN DEPASSIVATION TIME AND CRACK WIDTH (THE SCATTER DEPENDS ON THE ENVIRONMENT, THE COVER, AND THE NATURE OF ANY DEPOSITS) REF. 25.
9

The real behavior is probably a combination of the bond-slip behavior and the no-slip behavior. Beeby(271, therefore, proposed the following relationship based on a combination of the two behaviors:
where: kl, k;! = empirical constants
$ = bardiameter p = reinforcement ratio
The crack width formulation in the Eunxode(24) is based on the combination model
where:
where:
p = coefficient relating the average crack width to the design value k1 = coefficient taking account of the bond properties of the bar k2 = coefficient taking account of the form of strain distribution
pr = the effective reinforcement ratio = A,
&, eff = effective tension area of concrete Ac,eff
A crack width limit of 0.3 mm (0,012 in.) is also given in the Eurocode 2. However, there is also an apparent &emphasis of crack width for corrosion protection by European engineers. Somerville in his review of past, present and suggested future procedures for producing durable concrete(28) did not even mention crack control. Emphasis was placed on permeability and the four “c”s, mix - Gonstituents, cover, compaction, and curing. Beeby(@ demonstrates that there is no clear relationship between crack width and corrosion. However, Beeby stressed maintaining minimum cover and minimum quality concrete for protection of the reinforcement.
2.3 Proposed Revisions to ACI Code
ACI Committee 224 on cracking has realized the problems associated with crack control, cover, and corrosion protections and has proposed revisions, A copy of a recent proposal is included in Appendix A of this report. Basically, in order not to penalize the designer for adding more cover, the proposed revisions allow the z-factor to be determined using Eq [ 11 with the & parameter based not on the actual 6, but on a & determined using applicable minimum concrete cover specified in the ACI 318 code. As an example, consider a one way slab reinforced with No. 5 bars at 6 in. on center. Section 7.7.1 of ACI 318 requires a No. 5 bar in concrete exposed to earth or weather to have 1-1/2 in. minimum concrete clear cover. With this clear cover, the & value is 1-1/2 in. plus 1/2 the bar diameter. Therefore, & is 1.81 in. The A value is 21.72 sq in. If a designer, however, wants to use 2-1/2 in. clear cover for improved corrosion protection, the actual 4 parameter is 2.81 in. and the actual A parameter is 33.72 s q in., however, the designer would still use the & of 1.81 and A of 21.72 in Eq [l] to determine z. The z-factor for fs = 36 ksi using & = 1.81 and A = 21,72 sq in. is 122 kipdin. which is less than 145 kips/in. and is therefore
10

adequate for exterior exposure. The value of z for fs = 36 ksi using the actual 6 of 2.8 1 in. and A of 33.72 sq in. would be 162 kips/in. This z-factor would not be acceptable un&r the current code provisions. The calculated crack width using the Gergely-Lutz equation for f, = 36 ksi, using & = 1.81 in. and A = 21.72 sq in. is 0.01 1 in. If the actual & of 2.81 in. and A of 33.72 sq in. are used in the Gergely-Lutz equation, the calculated crack width would be 0.015 in.
The proposed code revisions allow some relief for designers to provide additional cover. However, it is questionable that the modified z-factor calculations are serving a purpose if the calculations are made for a condition that does not actually exist. In addition, the proposed revision apparently does not include any limits on cover. Therefore, the use of large cover could result in conditions that are, well outside the bounds of the database of experimental data used to develop the Gergely-Lutz equation and z-factor and could result in large unsightly cracks. The value in continuing to calculate a z-factor if it does not relate to the actual conditions is in doubt, particularly when considering the inaccuracy of crack width calculations when actual conditions are used as shown in the following section of this report.
3.0 EXPERIMENTAL CRACK WIDTH DATA
3.1 Review of Data
In order to re-evaluate the z-factor approach in the current code and assess the proposed modifications, the background of the Gergely-Lutz equation was investigated in this study and the sensitivity of the z-factor to & was evaluated. This was accomplished by first assembling a database of crack width and steel stress from the same sources of data used in the Gergely-Lutz study. Data used to develop Eq [2] for maximum bottom crack width included data from Hognestad,@) Kaar-Mattock,(lO) Kaar-Hognestad,(ll) Clark,(l2) and Riisch-Rehrn(l3). The data for the reevaluation study included similar data from each of these references but in some cases the number of observations was limited. For the Kaar- Mattock data,(lO) the only tabulated crack width data in the reference was crack widths at a steel stress of 40 ksi. Other data was available from plots of crack width versus steel stress. However, for this study only the tabulated data in the reference was used. This limited the number of observations to 18 as compared to the 65 observations reportedly used in the Gergely-Lutz study. For the Kaar-Hognestad double-T girder data,(ll) only the tabulated crack width data at 40 ksi steel stress was used limiting the data to 22 observations as compared to 46 reportedly used by Gergely-Lutz.
The Clark d a d 2 ) was the dominant data source in the Gergely-Lutz study accounting for 54 of the total 106 specimens and 326 of the total 632 observations. The Clark data(l2) was tabulated for each specimen with maximum crack widths measured at 15,20,25,30, 35,40 and 45 ksi steel stress. Since limited data was used for other sources, it was decided to use only the data reported by Clark at 20,30, and 40 ksi. Data from the Hognestad(9) and Rusch-Rehm(13) sources were presumably similar to data in the Gergely- Lutz study* The Rush-Rehm data was limited to those specimens with reinforcement deformation patterns that were representative of reinforcement used in the United States as was the Rush-Rehm data used in the Gergely-Lutz study. The total data base for the re-evaluation in this study included 393 observations on 106 specimens versus 632 observations on 106 specimens used in the Gergely-Luu study,
over the range of three significant parameters. These parameters include the concrete cover, 4, the effective concrete area A, and the local effective reinforcement ratio pt = AdA. In addition to the Gergely-Lutz equation, Eq [2], the Kaar-MattFk equation, Eq [3], and the CEB-FIP approach, Eq [4] were used to determine calculated crack widths.
The data were analyzed considering all the data as a whole and then within specific incremental ranges of data to assess how well the equations fit the data within each range,
11
Assessment of data included comparison of measured versus calculated crack width

The Gergely-Lutz equation Eq [2] was derived using data that included a variable R ratio (p in ACI 318) dependent on the specimen configuration. However, the z factor was derived assuming a constant R of 1.2 to simplify the calculations. Therefore, an R ratio of 1.2 was assumed for all data evaluated in this study. The goodness of fit is demonstrated using a correlation coefficient (r) between the calculated and measured data and also using a mean squared error (MSE). The mean squared error or mean squared deviation was determined as:
1 " " 1
M S E = - C y2
where: n = number of observations y = error in crack width calculation = (w, - wca)
W m = measured crack width in 0.001 in. units Wca = calculated crack width in 0,001 in. units
The correlation coefficient (r) is a measure of linear dependence between two sets of data. An r value of 1.0 would indicate the crack width equation is a perfect predictor of crack width. An r value of zero indicates no linear correlation. The MSE is used as a relative indicator of goodness of fit for the three approaches to predict crack width. A lower MSE indicates a better fit of the calculated to measured data.
3.2 Concrete Cover, dc
The data was frst analyzed considering parameter, & (note: & = tb in Eq [2]). The 6 parameter is the concrete cover from the surface of the concrete to the center of the closest bar. As a minimum, 4 includes the clear cover plus one-half bar diameter. If transverse steel is used, such as stimps in beams, the diameter of the transverse steel adds to the & term.
Figure 4 shows the distribution of & for the 393 observations on 106 specimens. The majority of the crack width data (85%) is from test specimens with d, less than or equal to 2 in. Within the 2 < & 2 2.5 range, all the data is between 2.0 and 2.20 in. There are only 15 data points (3.8%) with d, larger than 2,20 in. For data from the experimental investigation by Clark,(12) which was the basis for the 0.076 coefficient in Eq [2], 13 of 54 specimens had a & larger than 2.0 in. and one specimen had a 4 larger than 2.2 in. The majority of specimens (29 out of 54) had a 4 of 1.0 in. or less.
It should be noted that, for concrete with No, 6 bars or larger exposed to weather, the specified minimum code clear cover is 2 in. The minimum &, therefore, without transverse steel, would be 2.38 in. for a No, 6 bar.
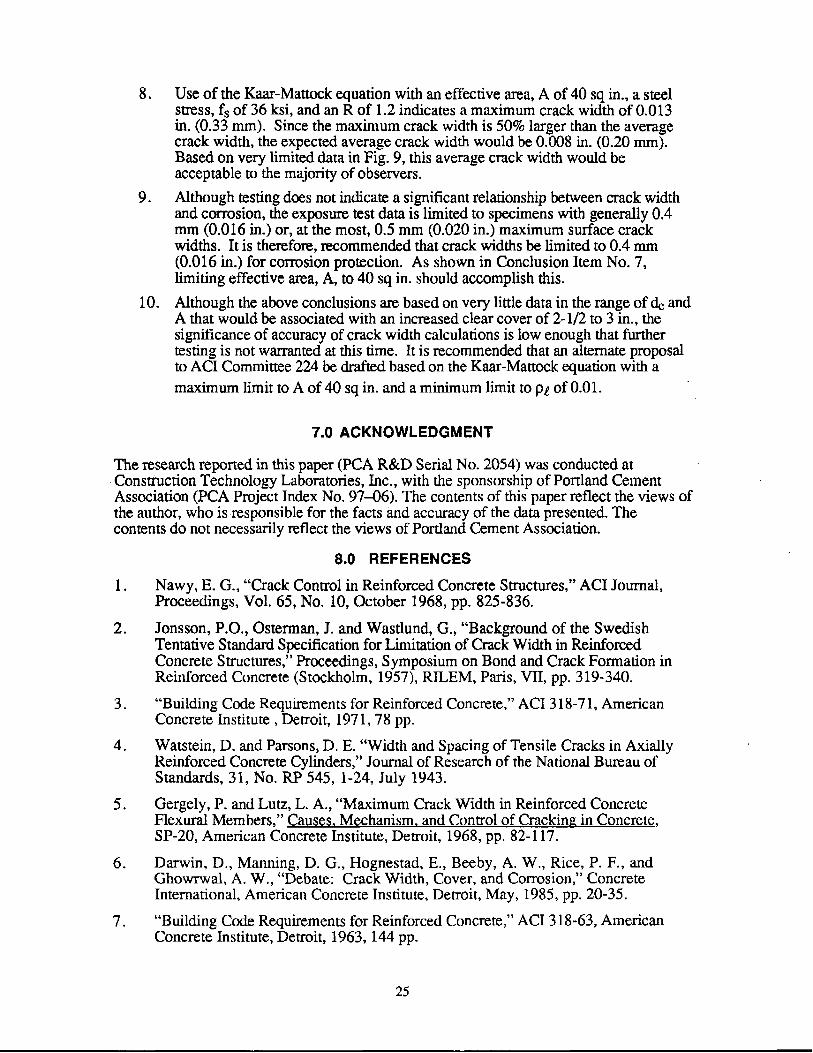
Table 1 shows the calculated correlation coefficients and mean squared error for the data as a whole and within specific ranges of & for the Gergely-Lutz (G-L) equation, the Kaar-Mattock (K-M) equation and the CEB-FIP (CEB) approach. Plots of calculated versus measured crack widths for these data are included in Appendix B of this report. The analyses indicate that, as a whole, the Kaar-Mattock equation has the smallest error and is consistently as good or better than the Gergely-Lutz or CEB-FIP approach over the specific ranges of data, particularly for the larger 4 data. These data, however, also show the sparsity of data for 4 values that represent slabs or beams exposed to weather with minimum clear cover, let alone additional clear cover.
12

Histogram of Depth of Cover
c, w
0 + 1
t
0.5 in. Intervals
I I I I I I
2 3 4
dc, Depth of Cover (in.)
FIG. 4 DISTRIBUTION OF DEPTH OF COVER, d, IN SPECIMENS USED FOR CRACK WIDTH STUDY.

3.3 Effective Concrete Area, A
The effective area of concrete surrounding a reinforcement bar is a significant parameter in the Gergely-Lutz equation and the only parameter, other than reinforcement stress, in the Kaar-Mattock equation. Figure 5 shows the distribution of A for 393 observations on 106 specimens. The majority of the data (76%) is for A less than or equal to 15 sq in, For comparison purposes, with a No. 6 bar with 2 in. minimum clear cover and & = 2.38 in., an area, A, of 15 sq in. corresponds with a center-to-center spacing of 3,15 in. The area of 15 sq in. may be representative of area in beams but is relatively small for slabs or top flanges of T-beams.
Table 2 shows the calculated correlation coefficients and mean squared error for the data as a whole and within specific ranges of A. Plots of calculated versus measured crack widths for these data are included in Appendix C of this report.
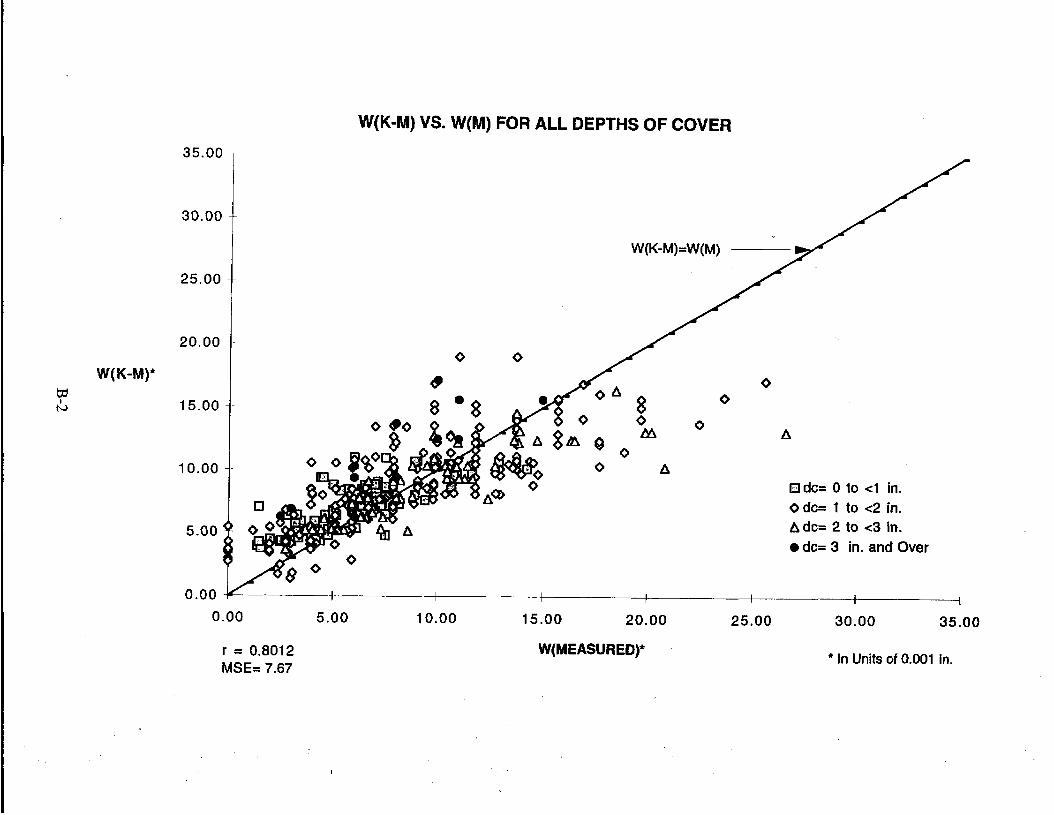
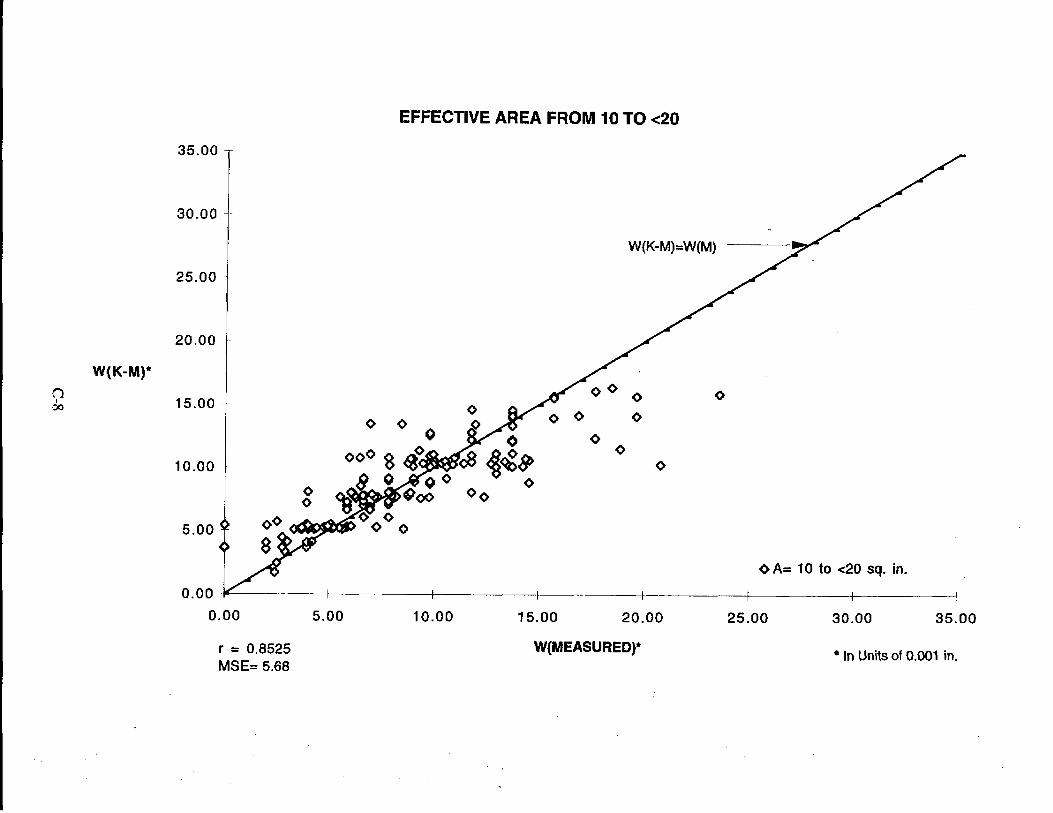
For the data as a whole, the results are the same as in Table 1 with the Kaar-Mattock equation having the highest correlation coefficient and lowest mean squared error. Also, the mar-Mattock equation is as good or better than the other two approach across the specific ranges of data, particularly for the larger values of A between 30 to 40 sq in,
3.4 Local Effective Reinforcement Ratio, p1
The ratio of reinforcement cross sectional area, A,, to the local effective concrete area, A, surrounding the bar is a parameter used in the equations within the CEB-FLP approach. The three approaches to calculating crack width were therefore examined within specific ranges of pt to investigate if there were any particular relative deficiencies in the Gergely- Lutz equation or Kaar-Mattock equation that do not explicitly include consideration for p i as a parameter.
Figure 6 shows the distribution of pp for the 393 observations on 106 specimens, Table 3 shows the calculated correlation coefficients and mean squared error for the data as a whole and within specific ranges. Plots of calculated versus measured crack widths for these data are included in Appendix D of this report.
For the data as a whole, the results are the same as in Tables 1 and 2. The data in Table 3 shows that both the CEB-FP and Gar-Mattock equations do not fit well for data with pp < 0.01. Although this observation is based on very limited data, it would be expected that, with the low relative m a of steel, there is not enough tensile force in the reinforcement at working stress levels to produce well distributed cracking in the concrete. The value of pt = 0.01 corresponds approximately to No. 4 bars with minimum 1-1/2 in clear cover at 6 in. on center and could be considered a lower bound to pp for a realistic configuration in a structure requiring crack control. The three. approaches to calculate crack width fit the data approximately equally well over the other ranges of data,
14

TABLE 1 COMPARISON OF CALCULATED AND MEASURED CRACK WIDTHS SORTED BY CONCRETE COVER, dc
dcIn.
AUData
0 to <1 1 to c2 2 to <3 3 and over
No. of Obs. In Group
393
82 240
59 12
Correlation Coefficient
No. of A in.* Obs. in
Group
G-L I K-M I CEB
Correlation Coefficient Mean Squared Error"
G-L K-M CEB G-L K-M CEB
0.754 0.801 0.729
0.754 0.801 0,729
0.784 0.757 0.780 0.840 0.853 0.808 0.733 0.754 0.694 0.061 0.487 0.072
0.816 0.763 0.827 0.789 0.806 0.774 0.839 0.831 0.595 0.724 0.843 0.838
9.05 7.67 13.41
5.81 6.67 8.38 6.13 5.68 10.78
14.72 10.85 17.64 77.8 1 39.64 113,37
Mean Squared Error*
No. of Correlation Coefflclent Mean Squared Error" P Obs. in
Group G-L K-M CEB G-L K-M CEB
All Data 393 0.754 0.801 0.729 9.05 7.67 13.41
0 to <O.Ol 6 0.500 0.181 0.178 20.66 24.16 225.46 0.01 to 4.02 42 0,572 0.707 0.669 24.08 10.64 19.18 0.02 to <0.03 122 0.857 0.865 0.851 7.09 6.78 8.72 0.03 to <0.05 134 0.761 0.782 0.819 9.17 8.45 9.01
,0.05 and over 89 0.813 0.764 0.813 3.70 5.23 9.46
G-L I K-M I CEB
9.05 7.67 13.41
3.25 4.70 4.08 8.35 7.95 12.72 7.68 9.27 24.72
69.53 14.68 35.43
TABLE 2 COMPARISON OF CALCULATED AND MEASURED CRACK WIDTHS SORTED BY EFFECTIVE CONCRETE AREA, A
0 to <lo 10 to <20 20 to <30 30 to <40
TABLE 3 COMPARISON OF CALCULATED AND MEASURED CRACK WIDTHS SORTED BY LOCAL REINFORCEMENT RATIO, pt = As/A
15

140
120
I00
Number of 80
z Observations
6 0
+
Histogram of Effective Areas
5 sq. in. Increments
t t 111 0 5 10 1 5 20 2 5 30 35 4 0
A, Effective Area (sq. in.)
FIG. 5 DISTRIBUTION OF EFFECTIVE AREA, A IN SPECIMENS USED FOR CRACK WIDTH STUDY.

Histogram of Reinforcement Ratios
6 0
5 0
Number - -- of 4 0 4
Observations 30 --
0 0.01 0.02
0.005 Intervals
I L I I I I r I I I I
0:03 ' 0.04 01.05 0'.06 0.07 0.08 0.09
pr , Reinforcement Ratio
FIG. 6 DISTRIBUTION OF LOCAL REINFORCEMENT RATIO, pf IN SPEClMENS USED FOR CRACK WIDTH STUDY.

4.0 REEVALUATION OF ACI CRACK CONTROL
The ACI 3 18 crack control provisions are based on the Gergely-Lutz crack width equation. Figure 2 of this report demonstrates that, for uniformly spaced reinforcement in one-way slabs or top flanges on T-beams, the allowable maximum spacing to meet exterior exposure z-factor guidelines is extremely sensitive to the concrete cover, &. The maximum allowable spacing drops to impractically tight spacing as & increases beyond 2 in. whereas minimum clear cover required by the code for No. 6 bars and larger is 2 in.
Review of the background experimental crack width data and comparison with calculated data in Section 3.0 of this report indicates the following:
1.
2.
3.
4.
5 .
As shown in Fig. 4, the majority of the data (85%) is from test specimens with 4 less than or equal to 2 in. For the limited data with & of 2 in. to <3 in., the relatively simple Kaar-Mattock equation fits the data approximately as well as the Gergely-Luu equation and significantly better than the much more complex CEB-FIP equation. For the very limited data with & of 3 in. or greater, the Kaar-Mattock equation provides the best fit for calculated crack width. For the very limited data with effective concrete area, A, of 30 sq in. or greater which corresponds with providing larger cover, the relatively simply Kam-Mattock equation fits the data significantly better than the equally simple Gergely-Lutz equation or much more complex CEB-FIP approach. The Kaar-Mattock equation provides the best fit for the data taken as a whole and provides a relatively good fit across the ranges of &, A, and pi.
Considering a z-factor of 145 kip/in. for exterior exposure with a steel stress of 36 ksi, the maximum spacing for uniformly spaced bars in a slab is:
32.67 Smax =dc2
This is the equation for the cuwe in Fig 2. The maximum spacing is a function of the
If the Kaar-Mattock equation were used to develop a z-factor similar to Eq [ 11, the z- inverse of the square of &.
equation would be:
4 z = f s dx
with an R = 1.2 and a crack width corresponding to the z-limit of 145 (w = 0.013 in.) using the Gergely-Lutz equation, the z-limit for Eq [9] would be 95. If fs is taken as 36 ksi, the maximum spacing equation analogous to Eq [8] is:
24.25 Smax =------ 4
This equation is presented along with Eq [8] in Fig. 7. It is noted that S m a in Eq [lo] is less sensitive to increasing 4. Also, however, it can easily be shown that Eq (101 is related to an effective area, A, of 48.5 sq in. This larger area is beyond the database of the experimental crack width data. To limit the effective area to 40 sq in., the maximum spacing equation simply becomes:
20 s m a x = q
18
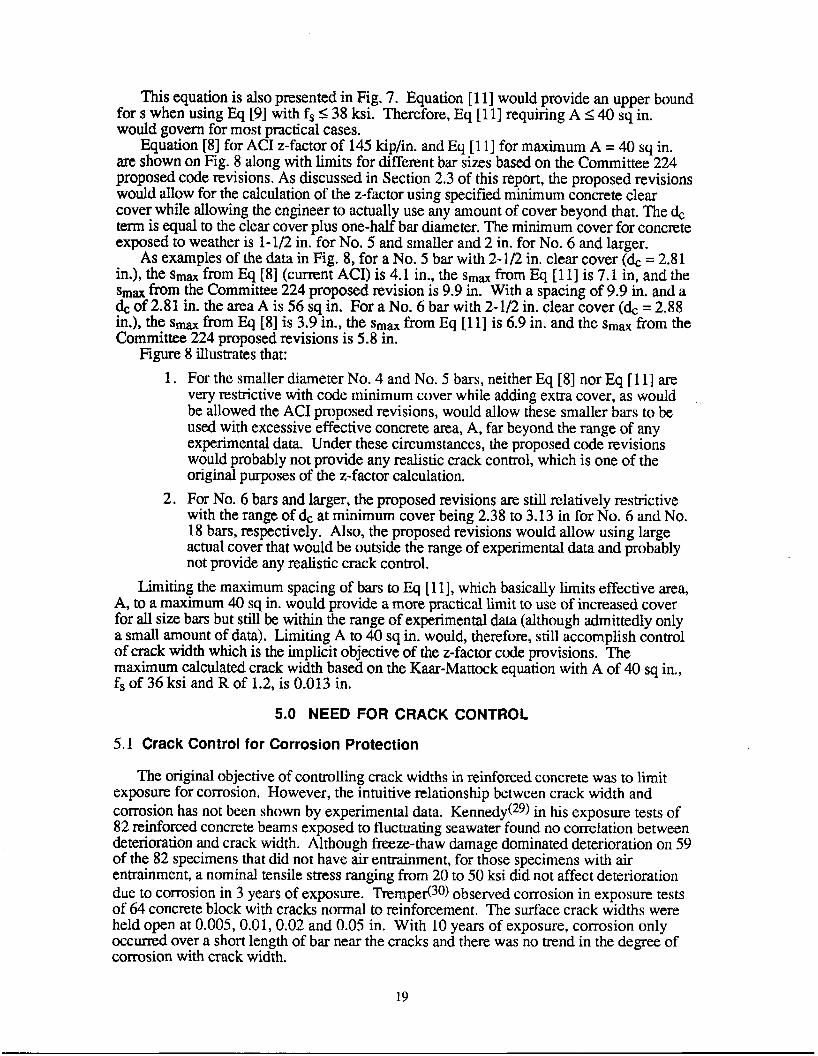
This equation is also presented in Fig. 7. Equation [ 1 11 would provide an upper bound for s when using Eq [9] with fs I 38 ksi. Therefore, Eq [ 111 requiring A I 40 sq in. would govern for most practical cases.
Equation [8] for ACI z-factor of 145 kip/in. and Eq [ 1 11 for maximum A = 40 sq in. are shown on Fig. 8 along with limits for different bar sizes based on the Committee 224 proposed code revisions. As discussed in Section 2,3 of this report, the proposed revisions would allow for the calculation of the z-factor using specified minimum concrete clear cover while allowing the engineer to actually use any amount of cover beyond that. The & term is equal to the clear cover plus one-half bar diameter. The minimum cover for concrete exposed to weather is 1- 1/2 in. for No. 5 and smaller and 2 in. for No. 6 and larger.
As examples of the data in Fig. 8, for a No. 5 bar with 2-1/2 in. clear cover (4 = 2.81 in.), the S m a from Eq [8] (current ACI) is 4.1 in., the Smm from Eq [ 1 11 is 7.1 in, and the Smm from the Committee 224 proposed revision is 9.9 in. With a spacing of 9.9 in. and a & of 2.81 in. the area A is 56 sq in. For a No. 6 bar with 2-1/2 in. clear cover (& = 2.88 in.), the s w from Eq [8] is 3.9 in., the Smm from Eq [l 11 is 6.9 in. and the Smm from the Committee 224 proposed revisions is 5.8 in.
Figure 8 illustrates that: 1. For the smaller diameter No. 4 and No. 5 bars, neither Eq [8] nor Eq [ 1 11 are
very restrictive with code minimum cover while adding extra cover, as would be allowed the ACT proposed revisions, would allow these smaller bars to be used with excessive effective concrete area, A, far beyond the range of any experimental data. Under these circumstances, the proposed code revisions would probably not provide any realistic crack control, which is one of the original purposes of the z-factor calculation.
2. For No. 6 bars and larger, the proposed revisions are still relatively restrictive with the range of & at minimum cover being 2.38 to 3.13 in for No. 6 and No. 18 bars, respectively. Also, the proposed revisions would allow using large actual cover that would be outside the range of experimental data and probably not provide any realistic crack control.
Limiting the maximum spacing of bars to Eq [ 111, which basically limits effective area, A, to a maximum 40 sq in, would provide a more practical limit to use of increased cover for all size bars but still be within the range of experimental data (although admittedly only a small amount of data). Limiting A to 40 sq in. would, therefore, still accomplish control of crack width which is the implicit objective of the z-factor code provisions. The maximum calculated crack width based on the Kaar-Mattock equation with A of 40 sq in., fs of 36 ksi and R of 1.2, is 0.013 in.
5.0 NEED FOR CRACK CONTROL
5.1 Crack Control for Corrosion Protection
The original objective of controlling crack widths in reinforced concrete was to limit exposure for corrosion. However, the intuitive relationship between crack width and corrosion has not been shown by experimental data. Kenned~(~9) in h is exposure tests of 82 reinforced concrete beams exposed to fluctuating seawater found no correlation between deterioration and crack width. Although freeze-thaw damage dominated deterioration on 59 of the 82 specimens that did not have air entrainment, for those specimens with air entrainment, a nominal tensile stress ranging from 20 to 50 ksi did not affect deterioration due to corrosion in 3 years of exposure. Trernper(30) observed corrosion in exposure tests of 64 concrete block with cracks normal to reinforcement. The surface crack widths were held open at 0.005, 0.01,0.02 and 0.05 in, With 10 years of exposure, corrosion only occurred over a short length of bar near the cracks and there was no trend in the degree of corrosion with crack width.
19

1 5
10
ALLOWABLE SPACING, Smax,
in.
5
0 -
I
I EQ[8] i
I I
I I
I I
I I
I I
2 3 4 5 0 1
dc, in
FIG. 7 RELATIONSHIP BETWEEN MAXIMUM BAR SPACING IN A ONE-WAY SLAB AND 4 FOR EQ[8], (101 AND [ 11 1.
20

1 5
10
ALLOWABLE SPACING, Smax,
in.
0 -
0
A '\ No.6 \\
I I
1 I
I I I
I I
1 2 3 4 5
dc, in
FIG. 8 RELATIONSHIP BE" MAxlMUM BAR SPACING IN A ONE-WAY S U B AND d, INCLUDING LIMITS FOR SELECTED BAR SIZES USING PROPOSED REVISIONS TO ACI CODE ALLOWING Z TO BE CALCULATED BASED ON MINIMUM CLEAR COVER REQUIREMENTS RATHER THAN ACTUAL CLEAR COVER.
21

In a study of the influence of climate on corrosion of reinforcement in reinforced concrete in hot c0untries,(3~) a Elationship between width of cracks and the extent of corrosion was found using 400 concrete prisms with crack widths ranging from 0.1 to 0.5 mm (0.004 to 0.02 in.) exposed to 4 different environments, The heaviest corrosion was found on the reinforcement at the location of the cracks. The extent of carbonation near the reinforcement in the vicinity of cracks was found to be a function of crack width. Using length of the corrosion patch as the basis for quantifying corrosion, the extent of corrosion was almost directly proportional to crack width and corrosion spread further around the bars with larger crack widths. However, on the whole, the corrosion was described as superficial and the exposure tests were only observed for 5 years.
Francois and Arliguie(32) studied the correlation between cracking and corrosion. They concluded that with cracking, aggressive ions quickly reach the reinforcement regardless of the crack width. The extent of corrosion, was affected by the level of stress in the reinforcement which would correlate with crack width. The increase in observed corrosion, however, was not related directly to crack width but was related to the increase in damage of the paste-aggregate interface and therefore increased permeability with increasing tensile stress in the bar. This damage occurs at the level of the bar near transverse macrocracks. The exposure tests were conducted for a seven year period. Francois and Arliguie concluded that the width of crack had no bearing on development of corrosion but the depth of cover is an essential parameter.
Ohta(33) conducted long term exposure tests with 149 pairs of beams with open cracks exposed to sea air for up to 20 years. This study indicated that at 10 years exposure, specimens with a larger cover of 40 mm (1.57 in.) had a degree of corrosion dependent of crack width when evaluated by loss of section area. However, after 20 years of exposure, this affect disappears. Concrete cover was the most important parameter for corrosion protection.
Gergely,(34) in his evaluation of the role of cover in reinforced concrete concluded that tests and field studies have indicated that the initiation of corrosion is not influenced much by the width of transverse cracks as long as the cracks are not over 0.4 mm (0.015 in.). The total amount of corrosion is influenced very little by the crack width and even whether transverse cracks are present. Gergely emphasized that permeability of concrete and thickness of cover are primary factors in reducing corrosion. Also, however, he determined that tests indicate an increase in cover beyond 2.5 in. is generally not beneficial.
The CEB Task Group 20 formed to develop guidelines for durable concrete structured25) concluded that both Co;! and chlorides may penetrate through cracks some order of magnitude faster than through uncracked concrete and the time to depassivation is dependent on the crack width. However, the time difference between a 0.007 in. and 0,015 in. crack is negligible compared to the life span of reinforced concrete structures. The absolute value of crack widths in the normal range of 0.4 mm is of minor importance compared to the quality of concrete cover in terms of thickness and impermeability.
5.2 Crack Control for Aesthetics
Although the traditional primary objective of crack control has been to limit corrosion, a secondary objective has been appearance. While testing has shown that there is not a significant correlation between crack control and corrosion, it is still reasonable to limit cracking for appearance purposes. However, the acceptance criteria is uncertain.
of occupancy or use of the structure, location of the member, surface finish, whether the crack is exposed to wetting and drying, possible discoloration by leakage or dirt, and the viewers knowledge of the significance of cracks in reinforced concrete.
Halvorsen(l4) summarized two related surveys of crack width perception(35936). The second survey was reportedly designed to eliminate parameters of structural consequences, crack length, surface texture, and variation in width along the length from influencing the
As Gergely points out,(M) acceptable crack width would be expected to depend on type
22

t 4 w
100
90 4
80 -
Viewers’ 60 - Finding Crack 5 0 .
Acceptable (“w 40.
20 I
10 -
0 -
Crack Width (mm)
0 0.1 0.2 0.3 0.4 0.5 0.6 0.7 0.8 I t I f t 1 1 I
8 Architects
Engineers
A Lay Public
I I I I I 1 0.005 0.01 0 0.01 5 0.020 0.025 0.030 0.035
Crack Width (in)
FIG. 9 VIEWER REACTION TO CRACKS OF DFFFERENT WIDTH [AFTER HALVORSEN,(I4) HALDANE(3611

perception of acceptable crack width. Figure 9(36) taken from this study indicates how various groups perceived acceptable crack widths. The groups consisted of 18 architects, 35 engineers and 60 members of the lay public. It is apparent from these data that perception in the range of 0.2 rnm (0.008 in.) to 0.4 mm (0.016 in.) varied significantly between the groups. However, a crack width of 0.2 mm (0.008 in.) would be acceptable to the majority. A crack width of 0.3 mm (0.012 in.) would be acceptable to approximately 50% of the observers and a crack width greater than 0.4 mm (0.016 in.) is generally unacceptable.
6.0 CONCLUSIONS AND RECOMMENDATIONS
The following conclusions and recommendations are based on review of literature and crack width data accomplished in this study:
1 .
2.
3.
4.
5 .
6 .
7 .
In situations where improved corrosion protection is desirable such as slabs in parking stmctms, or decks of bridges or piers, it is advisable to increase concrete cover of reinforcement beyond the code minimum specified but not beyond 2-1/2 to 3 in. There is apparently no additional corrosion protection benefit with a larger cover and cracking behavior is apparently altered with large cover such that crack predictive models are not applicable and larger crack widths may be expected. In addition to cover, factors providing low permeability of the concrete including low water cement ratio, good compaction and adequate curing should be emphasized to design engineers as essential factors to limit corrosion. Engineers currently consider these factors as related to concrete strength, but not necessarily durability and corrosion protection. The Gergely-Lutz equation for crack width is relatively sensitive to the value of concrete cover, 4. However, test results used to develop the equation included very little data from specimens with concrete cover in the range suggested for improved corrosion protection. The sensitivity of the z-factor to increasing & is predominantly based on data with small 4 of 2 in. or less. The R ratio in the Gergely-Lutz equation is typically assumed to be a constant 1.2 in calculation of the z-factor, whereas it was a variable in the data analyzed by Gergely and Lutz. The typical range for R is approximately 1.1 to 1.4 dependent on member depth, reinforcement ratio and concrete strength. The use of a constant R desensitizes the calculation of crack width to the variations of section properties. The Raar-Mattock equation has the best fit for the crack width data in general (evaluated using a constant R of 1.2) and has a better fit for the limited data with larger cover (4) or large effective area, A, than the Gergely-Lutz and CEB equations. The Kaar-Mattock equation does not have the high sensitivity to increasing & that is exhibited by the Gergely-Lutz equation. Therefore, maximum bar spacing with increasing cover is not as restrictive. Based on available data reviewed in this study, the local effective concrete area, A, should be limited to a maximum of 40 sq in. and the local effective reinforcement ratio, pc, should be limited to a minimum of 0,Ol. If A is limited to a maximum of 40 sq in., the pc limit of 0.01 would only affect No, 5 bars and smaller.
24
8.
9.
10.
Use of the Kaar-Mattock equation with an effective area, A of 40 sq in., a steel s a s s , fs of 36 ksi, and an R of 1.2 indicates a maximum crack width of 0.013 in. (0.33 mm). Since the maximum crack width is 50% larger than the average crack width, the expected average crack width would be 0.008 in. (0.20 mm). Based on very limited data in Fig. 9, this average crack width would be acceptable to the majority of observers. Although testing does not indicate a sign5cant relationship between crack width and corrosion, the exposure test data is limited to specimens with generally 0.4 mrn (0.016 in.) or, at the most, 0.5 mm (0.020 in.) maximum surface crack widths. It is therefore, Iecommended that crack widths be limited to 0.4 mm (0.016 in.) for Corrosion protection. As shown in Conclusion Item No. 7, limiting effective area, A, to 40 sq in. should accomplish this. Although the above conclusions are based on very little data in the range of & and A that would be associated with an increased clear cover of 2-1/2 to 3 in., the significance of accuracy of crack width calculations is low enough that further testing is not warranted at this time, It is recommended that an alternate proposal to ACI Committee 224 be drafted based on the Kaar-Mattock equation with a maximum limit to A of 40 sq in. and a minimum limit to pt of 0.01.
7.0 ACKNOWLEDGMENT
The research reported in this paper (PCA R&D Serial No. 2054) was conducted at Construction Technology Laboratories, Inc., with the sponsorship of Portland Cement Association (PCA Project Index No. 9746). The contents of this paper reflect the views of the author, who is responsible for the facts and accuracy of the data presented. The contents do not necessarily reflect the views of Portland Cement Association.
8.0 REFERENCES
1.
2.
3.
4.
5 .
6 ,
7 .
Nawy, E. G., “Crack Control in Reinforced Concrete Structures,” ACI Journal, Proceedings, Vol. 65, No. 10, October 1968, pp. 825-836.
Jonsson, P.O., Osterman, J. and Wastlund, G., “Background of the Swedish Tentative Standard Specjflcation for Limitation of Crack Width in Reinforced Concrete Structures,” Proceedings, Symposium on Bond and Crack Formation in Reinforced Concrete (Stockholm, 1957), RILEM, Paris, VII, pp. 319-340.
“Building Code Requirements for Reinforced Concrete,” ACI 3 18-7 1, American Concrete Institute , Detroit, 1971,78 pp.
Watstein, D. and Parsons, D. E. “Width and Spacing of Tensile Cracks in Axially Reinforced Concrete Cylinders,” Journal of Research of the National Bureau of Standards, 31, No. RP 545, 1-24, July 1943.
Gergely, P. and Lutz, L. A., “Maximum Crack Width in Reinforced Concrete Flexural Members,” Causes, Mechanism. and Control of Cracking in Concrete, SP-20, American Concrete Institute, Detroit, 1968, pp. 82-1 17.
Darwin, D., Manning, D, G,, Hognestad, E., Beeby, A. W., Rice, P. F., and Ghowrwal, A. W., “Debate: Crack Width, Cover, and Corrosion,” Concrete International, American Concrete Institute, Detroit, May, 1985, pp. 20-35.
“Building Code Requirements for Reinforced Concrete,” ACI 3 18-63, American Concrete Institute, Detroit, 1963, 144 pp.
25

8.
9.
10
11 .
12.
13.
14,
15.
16.
17.
18.
19.
20.
21.
22.
23.
Brams, B., “Crack Width and Crack Spacing in Reinforced Concrete Members,” ACI Journal, Proceedings, Vol. 62, No. 10, October 1965, pp. 1237-1256. Hognestad, E., “High Strength Bars as Concrete Reinforcement: Part 2 - Control of Cracking,” Journal, PCA Research and Development Laboratories, Vol. 4, No. 1,
Kaar, P. H., and Mattock, A. H., “High Strength Bars as Concrete Reinforcement: Part 5 - Control of Cracking,” Journal, PCA Research and Development Laboratories, Vol. 5 , No. 1, January 1963, pp. 15-38.
Raar, P. H., and Hognestad, E., “High Strength Bars as Concrete Reinforcement: Part 7 - Control of Cracking in T-Beam Flanges,” Journal, FCA Research and Development Laboratories, Vol. 7, No. 1, January 1965, pp. 42-53.
January 1962, pp. 46-62.
Clark, A. P., “Cracking in Reinforced Concrete Flexural Members,” ACI Journal, Proceedings, Vol. 52, No. 8, April 1956, pp. 851-862. Riisch, H., and Rehm, G., “Versuche Mit Beton Formstahlen, Deutscher Ausschuss Fur Stahlbeton, Bulletin: No. 140, Part 1, 1963, No. 160, Part 2, 1963 and No. 165, Part 3, 1964.
Halvorsen, G. T. “Code Requirements for Crack Control,” Paper SP104-15 ACI Special Publication SP104, Concre te and Concrete Co nstruch ‘on, American Concrete Institute, Detroit, 1987, pp. 275-322. Husain, S. I., and Ferguson, P. M., “Flexural Crack Width at the Bars in Reinforced Concrete Beams,” Research Report 102-IF, Center for Highway Research, University of Texas at Austin, June 1968,35 pp.
Watstein, D., and Mathey, R. G., “Width of Cracks in Concrete at the Surface of Reinforcing Steel Evaluated by Means of Tensile Bond Specimens,” ACI Journal, Proceedings, Vol. 56, No. 1, July 1959, pp. 47-56.
Broms, B. and Raab, A., “The Fundamental Concepts of the Cracking Phenomenon in Reinforced Concrete Beams,” Report No. 310, School of Civil Engineering, Cornell University, Ithaca, September 1961.
CSA Committee A23.3, CAN 3-A23.3-M84, “Design of Concrete Structures for Buildings,” Canadian Standards Association, Rexdale, Canada, 1989,28 1 pp.
“Ontario Highway Bridge Design Code,” 1983, Highway Engineering Division, Ministry of Transportation and Communications, Toronto, Ontario, Canada, 1993,
Erickson, E. L., and Paulet, E, G., “Strength and Serviceability Criteria: Reinforced Concrete Bridge Members -- Ultimate Strength Design,” Bridge Division, Bureau of Public Roads, U. S. Department of Transportation. 1966. Paulet, E. G., “Strength and Serviceability Criteria: Reinforced Concrete Bridge Members -- Ultimate Design,” 2nd Edition, Bridge Division, Bureau of Public Road, U. S. Department of Transportation, 1969,97 pp.
American Association of State Highway and Transportation Officials, “Interim AASHTO Bridge Specifications,” Washington, D.C., 1974.
“CEB-FIP Model Code 1990” Final Draft, 1991, Comitle Euro-International Du Beton, Lausanne, Switzerland, 199 1.
357 pp.
26

24.
25.
26.
27.
28.
29.
30.
31.
32.
33.
34.
35.
36.
BSI Publication DD Env. 1992-1-1: 1992. Eurocode 2: Design of Concrete Structures. Part 1. General Rules and Rules for Buildings, British Standards Institute, London, 1992.
“Durable Concrete Structures, Design Guide,” CEB General Task Group, 20, Comite’ Euro-International Du Beton, Thomas Telford Sewices Ltd., London, 1992, 112 pp.
Base, G. D., Read, J. B., Beeby, A. W., and Taylor, H. P. U., “An Investigation of the Crack Control Characteristics of Various Types of Bar in Reinforced Concrete Beams,” Research Report 18, Part I, Cement and Concrete Association, London,
Beeby, A. W., “The Prediction of Crack Widths in Hardened Concrete,”
Somerville, G., “The Design Life of Concrete Structures,” The Structural Enpineer, Val. 64A, No. 2, United Kingdom, February 1986, pp. 60-71,
Kennedy, T. B., “Tensile Crack Exposure Tests or Stressed Reinforced Concrete Beams,” ACI Journal, Vol. 56, No. 6, Detroit, June 1956, pp. 1049-1063.
Tremper, B., “The Corrosion of Reinforcing Steel in Cracked Concrete,” ACI Journal, Vol. 43, No. 6, Detroit, June 1947, pp. 1137-1 14.
Raphael, M. and Shalon, R., “A Study of the Influence of Climate on Corrosion of Reinforcement,” Proceedings of RILEM symposium on Concrete and Reinforced Concrete in Hot Countries, Vol 1, Building Research Station, Technion, Israel Institute of Technology, Haifa, 1971, pp. 77-96.
Francois, R. and Arliguie, G., “Reinforced Concrete: Correlation Between Cracking and Corrosion,” ACI Special Publication, SP126, Durability of Concrete, Second International Conference, Vol II Montreal, 199 1, pp. 122 1 - 1239.
Ohta, T., “Corrosion of Reinforced Steel in Concrete Exposed to Sea Air,” ACI Special Publication, SP 126, Durabilitv a n c r e t e , Second International Conference, Vol. I, Montreal, 1991, pp. 459-477.
Gergely, P., “Role of Cover and Bar Spacing in Reinforced Concrete,” ACI Special Publication, SP75, Simificant Developments in Engineering Practice and Research: A Tribute to Chester P. Siess, American Concrete Institute, Detroit, pp. 133-147,
Cowan, J., and Haldane, D., “Professional Opinions on Crack Widths,” Concrete (London), Vol. 5 , No. 11, November 1971, pl. 348-350.
Haldane, D., “The Importance of Cracking in Reinforced Concrete Members,” Proceeding, International Conference on Performance of Building Structures, Glasgow University, Pentech Press, Ltd., United Kingdom, 1976, pp. 99-109,
44 PP-
ctural EnPineer, Vol. 57A, No. 1, United Kingdom, January 1979, pp. 9-17.
27

APPENDIX A
ACI Committee 224 Proposed Revisions to ACI 3 18

1 2 3 4 5 6 7 8 9
10 11 12 13 14 15 16 17 18 19 20 21 22 23 24 25 26 27 28 29 30 31 32 33 34 35 36 37 38 39 40 41 42 43 44 45 46 47 48 49
ACI 224 proporad RcvidoM to Seuion 1Od.l through 10U ACI 31889 and ACI 31SR49 11 August 1994 P W l
CODE COMMENTARY
muvisions may not be adwua& 3 0 control a c k widths when CDOX\!
Crack width k inhenrryr rubjeet to wide w e ? even in eanful laboratory work and is influeneed by sh&kagc and other rimbdependtnt cfieas. The bexc crack control is obtained when the steel reinfoment is well dismbuted over the zone of m m u m concrete tension.
A- 1

1 2 3 4 5 6 7
9 10 11 12 13 14 15 16 17 18 19 20 21 22 23 24 25 26 27 28 29 30 31 32 33 34 35 36 37 38 39 40 41 42 43 44 45 46 47 48 49 50 51 52
a
53 54 55
lo= . Dis&ibution of flwd r a n f O r c m r c n t i l I ~ r l a b s s h s l l be as requked by 13.4.
1063 - Flcnrral tension reinlorcement shall be well dism”butd within &urn fleaVal t k o n zones of member cross d o n as required by 10.6.4.
lOdA - When design yield s&rcngtJ~ 5 for tension reinforcement a d 40,OOO psi, M d o n s of maximum positive and negative moment shall be so proporcioned that the quantify z given by
&actor mahod as- ‘bedin 10.6.4. An alternate n~ 1- procedure that meets th c intent of 10.6.4 is offcrrd w c the -licit calm lation of the L factor.
bl 10.65 tQ . .
RlOA.4 Eq. (1W) twill prouidc a dipmbution that wil l muonably
cqwtion is written in a form mncrolflaruralaa&ing. The
empharidng reinfordng dctsils lather than QacL width W, per sc. It is b a d on the GcrgcIy-Lue expression:
w - 0.076 fa ’fi (10-4)
d m not a d 175 kips per in. for
A-2

1 2 3 4 5 6 7 8 9
10 11 I2 13 14 15 16 17 18 19
21 22 23 24 2s 26 27 28 29 30 31 32 33 34 3s 36 37 38 39 40 41 42 43 44 45 4.6 47 48 49 so 51 52 53 54 55 56 57 58 59
m
in whiellw is in units of 0.001 in. Tooimpliq.pmaidderign,an 8-e value of 12 is used for fJ (ratio of to the neutral odr from the a m m e W o n fiber and fmm the centroid of the main
' lauh,rhovnthatthc G - h a qmssion oppk -nably to one
about 135 for aOar rlsbs nther than the value of 12 u d for benrn~ Aoeordingty it wwld be eonsi&ent to redue0 the maximum values for z by the faaor l2/135.
rCinf0~). Iabonitoryt.csts
WpySlabL ~ . v e r p g e n t i o p i s
of z = 175 ThSnumenerlkrmtatlons and 145 k i p per in. for intuior and &or -, m w to limiting uadc widths of 0.016 and O.Ol3 in.
. . . .
The effeaive tension arm of concrete sumnding the prindpal reinfo- is deflmcd as having the same ccnmid as the reinforcement Mor#mr, this ~ t c a is to btboundsdby the surfaces of the cross section and a rtraight line parallel to the neutral axia Computation of the dfeaivc - per bar, A (set notation definition), b musaatcd by the exampic dlm in Fq* 1 O h in which the e#luoid of the main reinforonncnt irr located 3.64 in. from the bottom of the beam.
Thc effeake tmsion a m is then takm as t w i a 3 a in. times the beam Width b. Divided by the number of barq this gives 17.6 oq in. pcr bar.
. . . surfaoe js d h b l e to UK a lamer n U mbq gf smaller diameter bars &cad of a fear lamcr m 'amctcr bara
mtd t- as wcU as the Get~ck-W co U atiom indicate that fhe Prtater the conmet c wver the wider the surfaa aa&. Howmer. it JJ known that in& con- !per h D r o v e s the durabilitv of p n m t e . A d a * t e h DI
a& on the thi&ness of d, mav be b the concrete aw er for the muumum cover re~uitrmmu in Sec. 7-7 allows the desimer to increase conmet e
- . .
A-3

1 2 3 4 5 6 7 8 9
10 11 12 13 14 15 16 17 18 19 20 21 22 23 24 25 26 27 28 29 30 31 32 33 34 35 36 37 38 39 40 41 42 43 44 45 46 47 48 49 50 51 52 53 54 55 56 57 58 59
A 4

Beam exposed to weather
%n.. additional cover selected by
Use 2 in. minimum cover (ftc.7.7) in *
woluotion of dc in. Eq. 10-4. designer for improved
durability
Fig. 10.a - 2-factor t e q u i x m = wt be satisfied at code-tr9rtf-d
cover; a d d i z i d c m r W be added without p e d q
A-5

1 2 3 4 5 6 7
9 10 11 u 13 14 15 16 17 18 19 20 21 22 23 24 25 26 27 28 29 30 31 32 33 34 35 36 37 38 39 40 41 42 43 44 45 46 47 43 49 50 51 52 53 54 55 56 57 58 59
a
10.4, The
Iwidth. Hmrmer,widcraa& are not d d a c d M e n t a l to the durability of the strumre.
A-6

APPENDIX B
Calculated Versus Measured Crack Width with Data Sorted by
W(M) = Measured Crack Width
W(G-L) = Calculated Crack Width Using the Gergely-Lutz Equation
W(K-M) = Calculated Crack Width Using the Kaar-Mattock Equation
W(CEB) = Calculated Crack Width Using the CEB-FIP Relationships

W(G-L) VS. W(M) FOR ALL DEPTHS OF COVER
W (G- L)’ W CL
35*00 T /
8 0 20-oo i I 0
15.00 4 10.00
5.00
0.00
8 0 * 0
--t
0
0
0 A
A 0 0 A
5-
dc= 0 to dc= 1 to dc= 2 to dc= 3 in.
<I in. <2 in. <3 in. and Over
-I
0 .oo 5.00 10.00 15.00 20.00 25.00 30.00 35.00
W( MEASU RED)” In Units of 0.001 in. r = 0.7537 MSE= 9.05
W(K-M) VS. W(M) FOR ALL DEPTHS OF COVER
35.00 T
W( K-M)*
W (K-M) =W (M)
30.00
25.00
20.00 4 / 0
0
A 0 15.00 - -
0 0 10.00 - 0 A 8 d c = 0 to <1 in. 0 dc= f to <2 in. Adc= 2 to <3 in. a dc= 3 in. and Over
W O 0
AQ
0.00 -v I I I I I I I
5.00 10.00 15.00 20.00 25.00 30.00 35.00 0.00
r = 0.8012 MSE= 7.67
W(MEASURED)’ * In Units of 0.001 in.

W(CEB) VS. W(M) FOR ALL DEPTHS OF COVER
35.00 -
30.00 --
25.00 --
20.00 --
W(CEB)* 15.00 w G
I 10.00
5.00 1 A 0
* 8 0 a
A 0 mdc= 0 to <1 in.
Ode= 1 to <2 In. Adc= 2 to <3 in. 0.00
0 0 0 dc= 3 in. and Over
-5.00 ‘ I I I I p I I I
0.00 5.00 10.00 15.00 20.00 25.00 30.00 35.00
W(MEASURED)’ t = 0.7290 MSE= 13.41
* In Units of 0.001 in.

td b.
35.00
30.00
25.00
20.00 --
W(G-L)*
DEPTH OF COVER FROM 0 TO <I
--
--
0.00 2.00 4.00 6.00 8.00 10.00 12.00 14.00 f 6.00
r = 0.8163 MSE= 3.25
W(MEASURED)* In Units of 0.001 in.

35.00
30.00
25 .OO
20.00
W(K-M)* td Iln 15.00
10.00
5.00 -
DEPTH OF COVER FROM 0 TO 4
W( K-M)= W( M)
0.00 -
0.00 2 .oo 4.00 6.00 8.00
r = 0.7632 W(MEASURED)” MSE= 4.70
10.00 12.00 14-00 16.00
In Units of 0.001 in.

35.00
30.00
25.00 --
20.00 -~
DEPTH OF COVER FROM 0 TO el -
--
15.00
10.00
5.00
adc= 0 to <I in.
0.00
0.00 2.00 4.00 6.00 8.00 10.00 12.00 14.00 16.00
r = 0.8266 MSE= 4.08
W(MEASURED)’ In Units of 0.001 in.

W (G - L)'
DEPTH OF COVER FROM 1 TO <2
35*00 T /-
30.00
25.00
20.00
15.00 1 A V 0
0 0
0 A A O a
U
0 8 0
8 0 0
0 0
f
ode= 1 to <2 in. 0.00 Y I I 1 1 1 1 f
0.00 5.00 10.00 15.00 20.00 25.00 30.00 35.00
r = 0.7893 MSE= 8.35
W(MEASURED)" In Units of 0.001 in.

DEPTH OF COVER FROM 1 TO <2
35.00 T 1
Ode= 1 to c2 in.
0.00 5.00 10.00 15.00 20.00 25.00 30.00 35.00
r = 0.8061 MSE= 7.95
W(MEASURED)’ In Units of 0.001 in.

DEPTH OF COVER FROM 1 TO 4
35.00
30.00
25.00
20.00
W(CEB)' 15.00 td 43
10.00
5.00
0.00 0 0 0
0 dc= 1 to <2 in.
-5 .00
20.00 25.00 30.00 35.00 0.00 5.00 10.00 15.00
In Units of 0.001 in. r = 0.7742 MSE= 12.72 W(MEASURED)"

W(G-L)* m 0 +
DEPTH OF COVER FROM 2 TO 4
A- 35.00 T
30.00
25.00 t W(G-L)=W(M) 4
20.00
I 15.00 -
10.00 + - M a y
/-
A
A dc= 2 to <3 in. I I 1 I I 0.00 t-------------i
0.0 5.0 10.0 15.0 20.0 25.0 30.0 35.0
r = 0.8393 MSE= 7.68
W(MEASURE0)I In Units of 0.001 in.

DEPTH OF COVER FROM 2 TO <3
25.00 t . . . 4
W( K-M)' W c L
A
20.00 ~-
15.00 - -
10.00 -~ A
Adc= 2 to <3 in. I I I I i
0.0 5.0 10.0 15.0 20.0 25.0 30.0 35.0
r = 0.8311 MSE= 9.27
W(MEASURED)* In Units of 0.001 in.

W(CEB)*
DEPTH OF COVER FROM 2 TO c3
35.00
30.00
25.00
20.00
15.00
10.00
5.00
0.00
A
A dc= 2 to <3 in. I 1 A + -+- I I I I
5.0 10.0 15.0 20.0 25.0 30.0 35.0
-5.00 I- 0.0 r = 0.5947
W(MEASURED)’ In Units of 0.001 in. MSE= 24.72

DEPTH OF COVER FROM 3 AND OVER
35.00
30.00
25.00 --
W( G-L)‘
-
20.00 t
9
9
15.00
10.00
5.00
0.00
adc= 3 in. and Over
0.0 2.0 4.0 6.0 8.0 10.0 12.0 14.0 16.0
r = 0.7241 MSE= 69.53
W(MEASURED)’ In Units of 0.OO-i in.

35.00
30.00
25.00
20 .00
W W(K-M)* CL
15.00 - P
DEPTH OF COVER FROM 3 AND OVER
W(K-M)=W(M) 0
10.00 I 0
e 0
0.0 2.0 4.0 6 .0 8.0 10.0 12.0 14.0 16.0
r = 0.8428 MSE= 14.68
W(MEASUREDF In Units of 0.001 in.

DEPTH Of COVER FROM 3 AND OVER
35.00
30.00
25.00
20.00
W W(CEB)* c v1
15.00
10.00
5.00
0.00
0
@dc= 3 in. and Over
0.0 2.0 4.0 6.0 8 .0 10.0 12.0 14.0 16.0
r = 0.8384 MSE= 35.43
W(M EASlJRED)* In Units of 0.001 in.

APPENDIX C
Calculated Versus Measured Crack Width with Data Sorted by A
W(M) = Measured Crack Width
W(G-L) = Calculated Crack Width Using the Gergely-Lutz Equation
W(K-M) = Calculated Crack Width Using the Kaar-Mattock Equation
W(CEB) = Calculated Crack Width Using the CEB-FIP Relationships

35.00
30.00
25.00
20.00
W(G-L)*
15.00 P c.
10.00
5.00
0.00
W(G-L) VS. W(M) FOR ALL EFFECTIVE AREAS
0 W (G-L)= W( M)
0
0 0
0
A= 0 to c10 sq. in. 0 A= 10 to c20 sq. in. A A = 20 to <30 sq. in. 0 A= 30 to c40 sq. in.
Y I I I I I 1 I
0.0 5.0 10.0 15.0 20.0 25.0 30.0 35.0
r = 0.7537 MSE= 9.05
W(MEASURED)" In Units of 0.001 in.

W(K-M) VS. W(M) FOR ALL EFFECTIVE AREAS
35.00
30.00
25.00
20.00
W( K-M)" r ) iL 15.00
10.00
5.00 !
I 0.00 -
A 0
0 El
0 El A= 0 TO 4 0 sq. in. oA= 10 to <20 sq. in. A A = 20 to <30 sq. in. oA= 30 to 4 0 sq. in.
I I I I I f I
0.0 5.0 10.0 15.0 20.0 25.0 30.0 35.0
r = 0.8012 MSE= 7.67
W(MEASUREI3)' In Units of 0.001 in.

W(CEB)*
WICES) VS. W(M) FOR ALL EFFECTIVE AREAS
! 25.00
20.00
I W(CEB)=W(M)
15.00
10.00
5.00
0.00
0
A
15.0 W-
5.0
8 0
03
0
0
---+--- 20.0
-5.00
r = 0.7290 MSE= 13.41
0
W(MEASURED)”
A
0 0
OA= 0 to 4 0 sq. in. OA= 10 to c20 sq. in. A A = 20 to c30 sq. in. o A= 30 to c40 sq. in.
25.0 30.0 35.0
1 I 1
In Units of 0.001 in.

EFFECTIVE AREA FROM 0 TO 4 0
15.00 -
0 0
30.00 -1 W(G-L)=W (M)
25.00
// 20.00 -1 # W(G-L)"
I 10.00 a\c 0
0 El EBO
0 8
ra 5.00 1 0.00 -- I b I 1 I I I I 1
0.0 5.0 10.0 15.0 20 .o 25.0 30.0 35.0
r = 0.7841 MSE= 5.81
W( MEASURED)* In Units of 0.001 in.

EFFECTIVE AREA FROM 0 TO 4 0
35.00
30.00
25.00
20.00
W(K-M)*
f 5.00 P VI
10.00 -
5.00
H A = 0 to 4 0 sq. in.
0.00 0.0 5.0 10.0 15.0 20.0 25.0 30.0 35.0
r = 0.7567 MSE= 6.67
W( MEASURED)” In Units of 0.001 in.

W(CEB)"
35.00 T
30.00
! 25.00
20.00
15.00
EFFECTIVE AREA FROM 0 TO 4 0
HA= 0 to 4 0 sq. n. 1 I I + 1 I
0.0 5.0 10.0 15.0 20.0 25.0 30.0 35.0 r = 0.7801 MSE= 8.38 W(MEASURED)'
-5.00
In Units of 0.001 in.

W( G-L)*
EFFECTIVE AREA FROM 10 TO <20
15.00 -1 0 0 0 0 "
0 O 0
10.00
5.00
o A= 10 to <20 sq. in. 0.00 I 1 1 1 1
0.00 5.00 10.00 15.00 20.00 25 .OO 30.00 35.00
r = 0.8396 MSE= 6.1 3
W(MEASURED)' In Units of 0.001 in.
EFFECTIVE AREA FROM 10 TO 4 0
W( K-M)'
W(K-M)=W(M)
25.00
0
OA= 10 to c20 sq. in. I I 1 I
0.00 5.00 10.00 15.00 20.00 25.00 30.00 35.00
r = 0.8525 MSE= 5.68
W(MEASURED)* In Units of 0.001 in.

35.00 -
30.00 -~
25.00 --
20.00 --
0 A= 10 to <20 sq. in.
i W(CEB)" 15.00
P \o
10.00
5.00 1
EFFECTIVE AREA FROM 10 TO c20
0 0
0
0
0.00
r = 0.8075 MSE= 10.78
* In Units of 0.001 in. W(MEASURED)*

30.00
EFFECTIVE AREA FROM 20 TO <30
-
W (G- L)=W (M) 4 ft
A
i t A A M
A h M
A M A
A
A A = 20 to 430 sq. in. I I I I 0.00 t 1-
0.00 5.00 10.00 15.00 20.00 25.00 30.00 35.00
r = 0.7332 MSE= 14.72
W( MEASURED)" In Units of 0.001 in.

35.00
30.00
25.00
20.00
W(K-M)'
15.00 (7 w c3
EFFECTIVE AREA FROM 20 TO c30
A A
A
W(K-M)=W(M) 4
10.00 --
AA= 20 to ~ 3 0 sq. in. I I I I
1 I 1
0.00 5.00 10.00 15.00 20.00 25.00 30.00 35.00
r = 0.7535 MSE= 10.85
W(MEASURED)* In Units of 0,001 in.

EFFECTIVE AREA FROM 20 TO c30
W(CEB)*
/ 35.00 T
30.00 / I W(CEB)=W(M) -;/
25.00
20.00
A 15.00 t 10.00 --
A A A
A
n A = 20 to c30 sq. in. I I I 1
-5.00 ! I- I 1
0.00 5.00 10.00 15.00 20.00 25.00 30.00 35.00 r = 0.6941 MSE= 17.64 W(MEASURED)” In Units of 0.001 in.
30.00
25 .00
20.00
W(G-t ) ’ 15.00 n
10.00
5.00
0
0
0
0
EFFECTtVE AREA FROM 30 TO <40
0
0.00 0.0 5.0 10.0 15.0 20.0 25.0 30.0
r = 0.0605 MSE= 77.81
W( MEASURED)” In Units of 0.001 in.

30.00
25.00
20.00
W(K-M)* 15.00 (7 w P
10.00
5.00
0.00
EFFECTIVE AREA FROM 30 TO e40
0
0
0
0.0 5 .0 10.0 15.0 20.0
r = 0.4865 MSE= 39.64
W(MEASURED)*
25.0 30.0
In Units of 0.001 in.

1 30.00
25.00 --
20.00 ~~
15.00 --
W(CEB)’
10.00 - - P c v1
5.00 --
EFFECTIVE AREA FROM 30 TO c40
0
0
oA= 30 to <40 sq. in. 0 I
t i
0.0 5 . 0 10.0 15.0 20.0 25.0 30.0 r = 0.0722
W(MEASURED)*
-5.00
In Units of 0.001 in. MSE= 113.37

APPENDIX D
Calculated Versus Measured Crack Width with Data Sorted by pe
W(M) = Measured Crack Width
W(G-L) = Calculated Crack Width Using the Gergely-Lutz Equation
W(K-M) = Calculated Crack Width Using the Kaar-Mattock Equation
W(CEB) = Calculated Crack Width Using the CEB-FIP Relationships
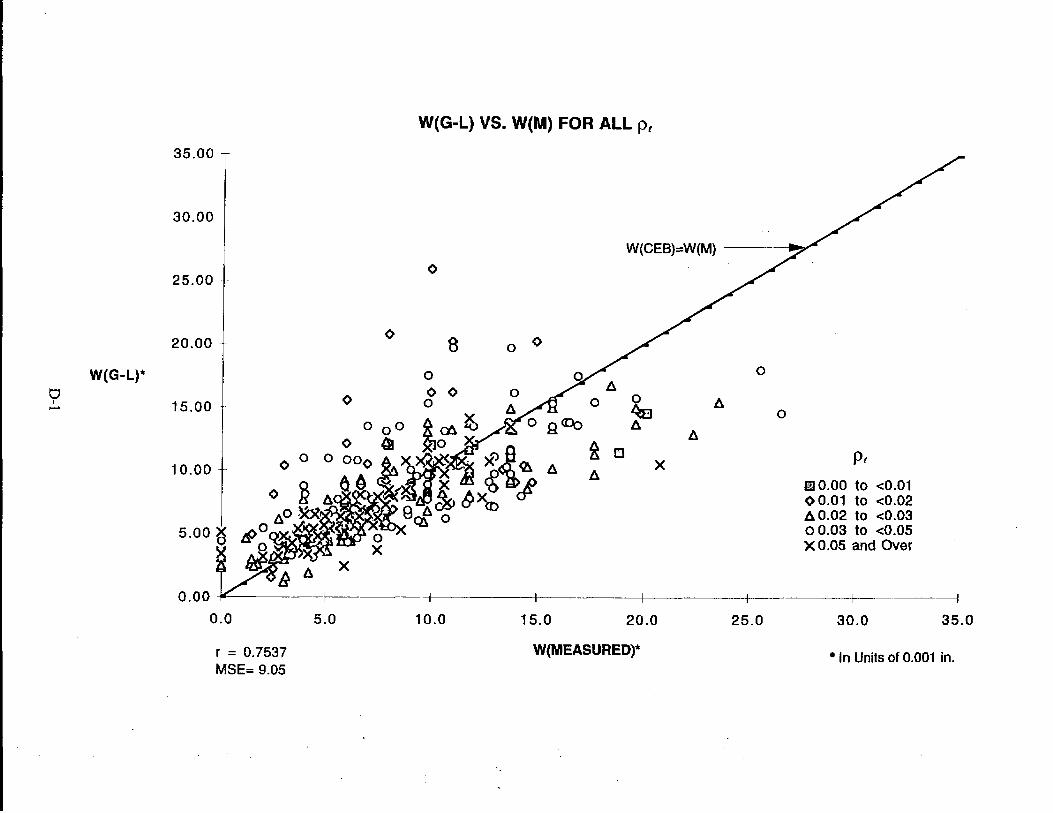
35.00 -
30.00 --
25.00 --
20.00 -- I
W (G - L)* I 15.00 - -
I 10.00
5.00
0.00
W(G-L) VS. W(M) FOR ALL pc
0
0 0
0 A
PI ~ 0 . 0 0 to co.01 00.01 to <0.02 AO.02 to ~0.03 00.03 to 4 . 0 5 XO.05 and Over
I
Y I 1 I 1 I I
0.0 5.0 10.0 15.0 20.0 25.0 30.0 35.0
r = 0.7537 MSE= 9.05
W(MEASURED)* In Units of 0.001 in.

W(K-An) VS. W(M) FOR ALL pc 35.00
30.00
25.00
20.00
W (K-M)*
15.00
10.00
5.00
0.00
0 A
0 A
Pf 8 0 TO c0.01 00.01 to c0.02 A0.02 to c0.03 00.03 to ~ 0 . 0 5 XO.05 and Over
X
I I I I 1
I I 1
0.0 5.0 10.0 15.0 20.0 25.0 30.0 35 .0
r = 0.8012 MSE= 7.67
W(MEASURED)* In Units of 0.001 in.

35.00
30.00
25.00
20.00 --
W(CEB)* 15.00 -- I 10.00
-
~-
--
5.00 - - I 0.00
WICEB) VS. W(M) FOR ALL pr
A 0 Q - o x ! * o
0 A
A 4!i i9
8 0 ?.DO* Pt a0 to 4 . 0 1 00.01 to c0.02 m m AO.02 to c0.03 00.03 to ~ 0 . 0 5
L A X A qqw A
-5.00 ! t I 1 I I p I 1 I I
0.0 5.0 10.0 t 5.0 20.0 25.0 30.0 35.0 r = 0.7290 MSE= 13.41 W(MEASURED)" In Units of 0.001 in.

35.00
30.00
25.00
20.00
W (G - t)* zz 15.00
ptFROM 0 TO c0.01
10.00 -
Pf 5.00 --
BO.00 to cO.01 --- - 0.0 5.0 10.0 f 5.0 20.0 25.0 30.0 35.0
r = 0.4997 MSE= 20.66
W(MEASURED). * In Units of 0.001 in.

W( K-M)* t;’ wl
0.0 5.0
r = 0.1812 MSE= 24.16
pcFFIOM 0 TO ~0.01
10.0 15.0
W(MEASURED)”
20.0 25.0
In Units of 0.001 in.

25.00
20.00
15.00
W(CE8)" 10.00
5.00
0.00
-5.00
plFROM 0 TO <0.01
Pl
mo.00 to cO.01
0.0 5 .0 r = 0.1784 MSE= 225.46
.- I -I -____ 0 a- +-- 10.0 15.0 20.0 25.0
W(MEASURED)* * In Units of 0.001 in.

plF80M 0.01 TO c0.02
W (G- L)
j 25.00
20.00
15.00
10.00
5.00
0.00
0
0
0 0
0 0
Pc 00.01 to c0.02
0.0 2.0 4.0 6.0 8.0 10.0 12.0 14.0 t 6.0 18.0 20.0
r = 0.5720 MSE= 24.08
W(MEASURED)’ In Units of 0,001 in.
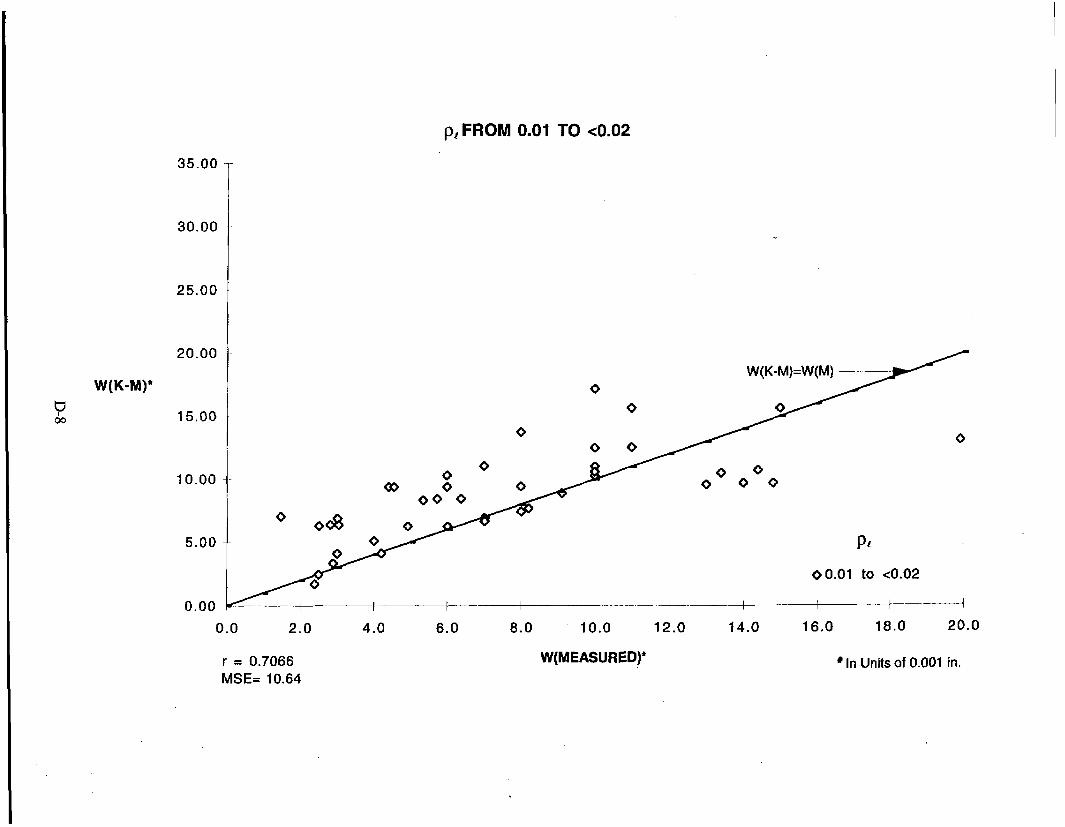
ptFROM 0.01 TO <0.02
30.00
25.00
20.00
15-00
10.00
5.00
0.00
W (K-M)=W(M) 4
0.0 2.0 4.0 6.0 8.0 10.0 12.0 14.0 16.0 18.0 20.0
r = 0.7066 MSE= 10.64
W(MEASURED)’ In Units of 0.001 in.

p(FR0M 0.01 TO ~ 0 . 0 2
30.00 - I 35.00
25.00
1 20.00 0
W(CEB)* 15.00 4 10.00
0.00
0
0
Pf 00.01 to <0.02
-5.00 &--- ; t 1 1 1 1 1 1 1
0.0 2.0 4.0 6 .0 8 .0 10.0 12.0 14.0 16.0 18.0 20.0
I = 0.6688 MSE= 19.18
W(1wEASlJRED)’ In Units of 0.001 in.

prFROM 0.02 TO c0.03
W( G-L)'
/ 35.00 T
T 20.00
I
15.00 4
5.00
0 .oo I
A
Pc AO.02 to
I t
e0.03
' 0.00 5.00 10.00 15-00 20 .oo 25.00 30.00 35.00
r = 0.8569 MSE= 7.09
W(MEASURED)I In Units of 0.001 in.

p(FR0M 0.02 TO 4.03
35.00
30.00
25.00
20.00
15.00
10.00
A A A a
A 4 A
PI ao.02 to ~0.03
I I I I I
I i
0.00 5.00 10.00 15.00 20.00 25.00 30.00 35.00
r = 0.8647 MSE= 6.78
W(MEASURED)” In Units of 0.001 in.
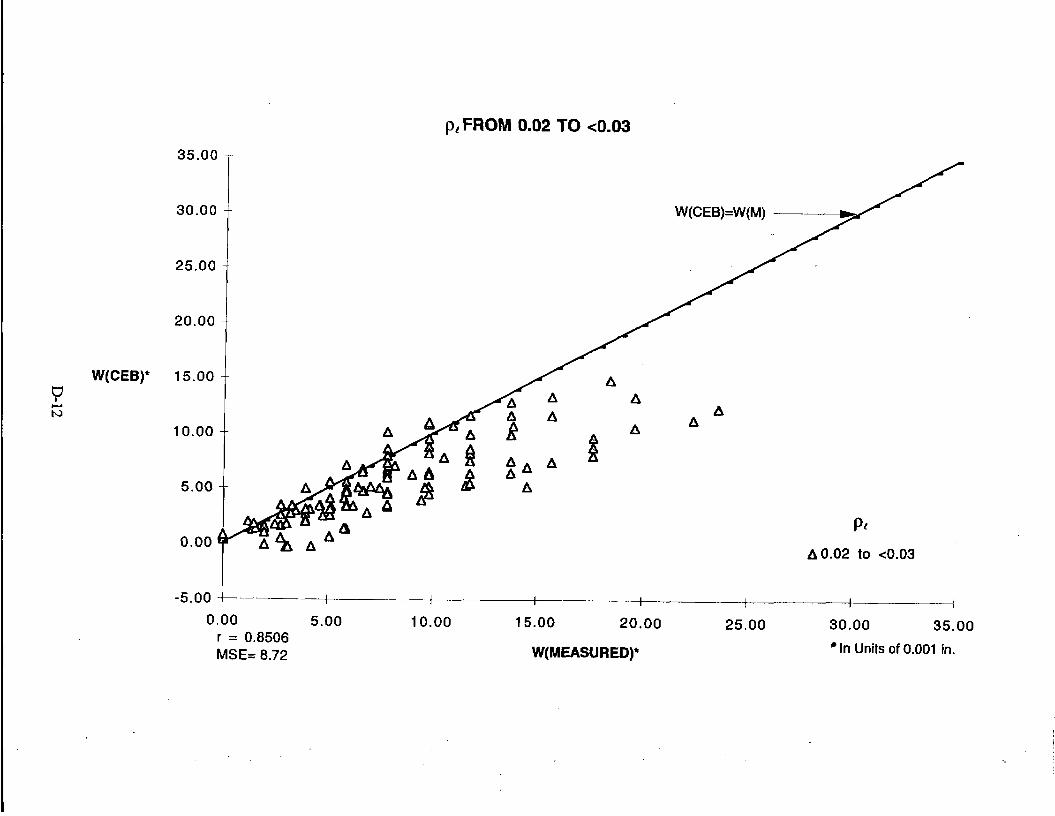
p,FROM 0.02 TO 4.03
35.00 -
30.00 --
25.00 --
20.00 --
I W(CEB)* 15.00 P n h)
10.00
5.00
0.00
A A
A
i A
A
Pc AO.02 to 4 . 0 3
-5.00 t- I I I 1 I 1 I I 1
5 .OO 10.00 15.00 20.00 25.00 30.00 35.00 0.00 r = 0.8506 MSE= 0.72 W(MEASURED)* In Units of 0.001 in.

p,FROM 0.03 TO <0.05
30.00
25.00
20.00
W(G-t ) * 0
15.00
10.00
PI 5.00
00 .03 to ~ 0 . 0 5
0.00
25.00 30.00 0.00 5 .00 f 0.00 15.00 20.00
0
r = 0.7609 MSE= 9.17
W(MEASURED)* In Units of 0.001 in.

pcFROM 0.03 TO 4 .05
35.00
30.00
25.00
20.00
W(K-M)*
15.00 P z
10.00
5.00
0.00
0 0
0
0
0
0
Pc 00.03 to 4 . 0 5
I I I
0.00 5.00 10.00 15-00 20.00 25.00 30.00
r = 0.7823 MSE= 0.45
W(MEASURED)’ In Units of O.OOf in.

1 35.00
W(CEB)’
plFROM 0.03 TO 4.05
0
5.00 f 0.00 15.00 20.00 25.00 30.00 0.00
r = 0.8189 MSE= 9.01
W(MEASURED)” In Units of 0.001 In.

pc FROM 0.05 AND OVER
W(G-L)"
35.00 -
30.00 --
25.00 --
20.00 -
15.00 - -
10.00 --
XO.05 and Over
' 5.00 10.00 15.00 20.00 25.00 30.00 35.00 0.00
X
1 = 0.8127 MSE= 3.70
W(MEASURE0Y In Units of 0.001 in.

pt FROM 0.05 AND OVER
35.00
30.00
25.00 --
20.00 --
-
--
I 10.00
5.00
X
XO.05 and Over 0.00 - 1 I 1 I I
15.00 20.00 25.00 30.00 35.00
0.00 kk 5.00 10.00 I
r = 0.7640 MSE= 5.23
W(MEASURED)’ In Units of O.OOt in.

p r FROM 0.05 AND OVER
35.00 -
30.00 --
25.00 --
20.00 - -
15.00 -~
10.00 - -
PI 5.00 --
XO.05 and Over 0.00
10.00 15.00 20.00 25.00 30.00 35.00 0.00 5.00
I = 0.0125 MSE= 9.46
W(MEASURED)” * In Units of 0.001 in.