Embed Size (px)
Citation preview

Survey Research and MethodologyUNL-GALLUP Research Center
Survey Research and MethodologyUNL-GALLUP Research Center
The Role of Device Type and RespondentCharacteristics in Internet Panel Survey
Breakoff
The Role of Device Type and RespondentCharacteristics in Internet Panel Survey
Breakoff
Allan L. McCutcheon
AAPOR Annual Conference
May 17, 2015
11

Survey Research and MethodologyUNL-GALLUP Research Center
Survey Research and MethodologyUNL-GALLUP Research Center
Acknowledgement and Disclaimer
• This material is based upon work supported by theNational Science Foundation under grant No. SES1132015.
• Any opinions, findings, and conclusions orrecommendations expressed in thismaterial/presentation are those of the author and do notnecessarily reflect the views of the National ScienceFoundation.

Survey Research and MethodologyUNL-GALLUP Research Center
Survey Research and MethodologyUNL-GALLUP Research Center
Web Surveys and Online Panels
• Internet surveys have emerged rapidly over the past decade or so– Inside Research estimates that in 2012, the online survey business had grown from
nothing a decade and a half earlier to more than $1.8 billion• This represents 43% of all surveys in the U.S.
– Adam Phillips estimates that about 80% of all interviews in UK are now done on theInternet (Research, 19 March 2015)
– Almost all (85%) of that growth came at the expense of traditional methods• Face-to-face• Telephone
• Important advantages of online survey data collection– Lower cost of data collection– Faster turnaround time for data collection– Target hard-to-reach small populations
• Also, important disadvantages of online survey data collection– Challenges of collecting probability samples
• Makes population estimates difficult• Panel attrition
– Low response rates– Not all members of public have access (CPS, 2010, est. 71.7%)
• Age correlated (18-24, 92.4%; 55+, 57.9)• Income, education, urban/rural

Survey Research and MethodologyUNL-GALLUP Research Center
Survey Research and MethodologyUNL-GALLUP Research Center
The Emergence of Web Surveysand Online Panels
• Challenges of existing (i.e., phone) technology– Caller id (Callegaro, McCutcheon & Ludwig 2009)– Falling response rates (Pew Research Center 2012)
• Resistance to online surveys has been similar to theemergence of telephone surveying– Skepticism on the part of professional practitioners– Resistance by many with vested interest in older technologies
• Still, the profession eventually adopts the newtechnology– AAPOR Report on Online Panels (POQ, Winter, 2010)
44

Survey Research and MethodologyUNL-GALLUP Research Center
Survey Research and MethodologyUNL-GALLUP Research Center
Respondents’ Motivations(Baker et al. 2010)
• Contingent incentive– Fixed: money or points– Variable: lottery or sweepsteaks
• Self-expression– Having one’s views heard– Registering one’s opinion
• Entertainment– Curiosity– Enjoy doing surveys
• Social comparison– What do others think– “Helpers,” being part of online community
• Convenience
55

Survey Research and MethodologyUNL-GALLUP Research Center
Survey Research and MethodologyUNL-GALLUP Research Center
66
Overview of the Gallup Panel
• Nationally representative, probability-based– Not an opt-in panel
• Built off of randomly generatedtelephone/ address sample
• Multi-mode– Panelists can be surveyed by phone,
web, mail• No incentives for participation• Up to 4 members per household can join• Gallup maintains extensive profiles of
each member
Survey Research and MethodologyUNL-GALLUP Research Center
Survey Research and MethodologyUNL-GALLUP Research Center
77
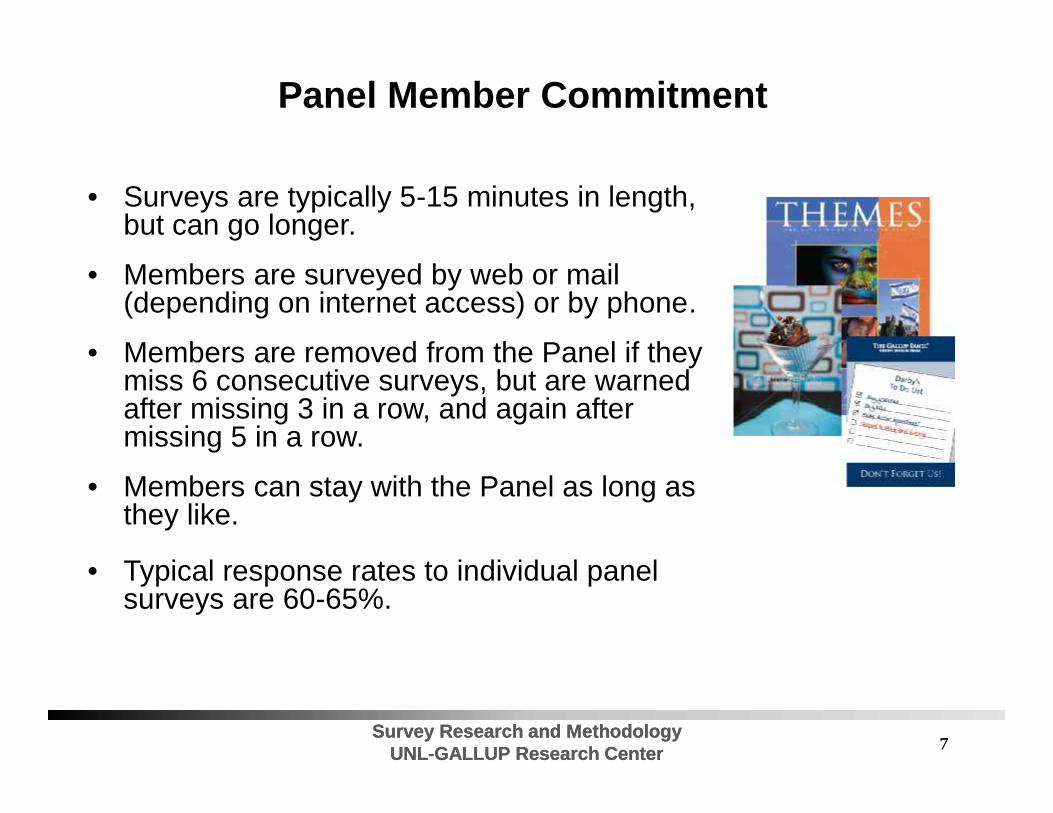
Panel Member Commitment
• Surveys are typically 5-15 minutes in length,but can go longer.
• Members are surveyed by web or mail(depending on internet access) or by phone.
• Members are removed from the Panel if theymiss 6 consecutive surveys, but are warnedafter missing 3 in a row, and again aftermissing 5 in a row.
• Members can stay with the Panel as long asthey like.
• Typical response rates to individual panelsurveys are 60-65%.

Survey Research and MethodologyUNL-GALLUP Research Center
Survey Research and MethodologyUNL-GALLUP Research Center
Attrition: McCutcheon, Rao, Kaminska (2014)
• Here, we extend our previously published work.
• For those who were recruited by the experiment, weanalyze the effect of panel recruitment and panelparticipation factors (after controlling for memberdemographics) on two attributes of the panel operation:
– Attrition rates
– Survey completion rates• Ratio of total number of surveys completed and total number of
surveys assigned in their panel lifetime
Survey Research and MethodologyUNL-GALLUP Research Center
Survey Research and MethodologyUNL-GALLUP Research Center
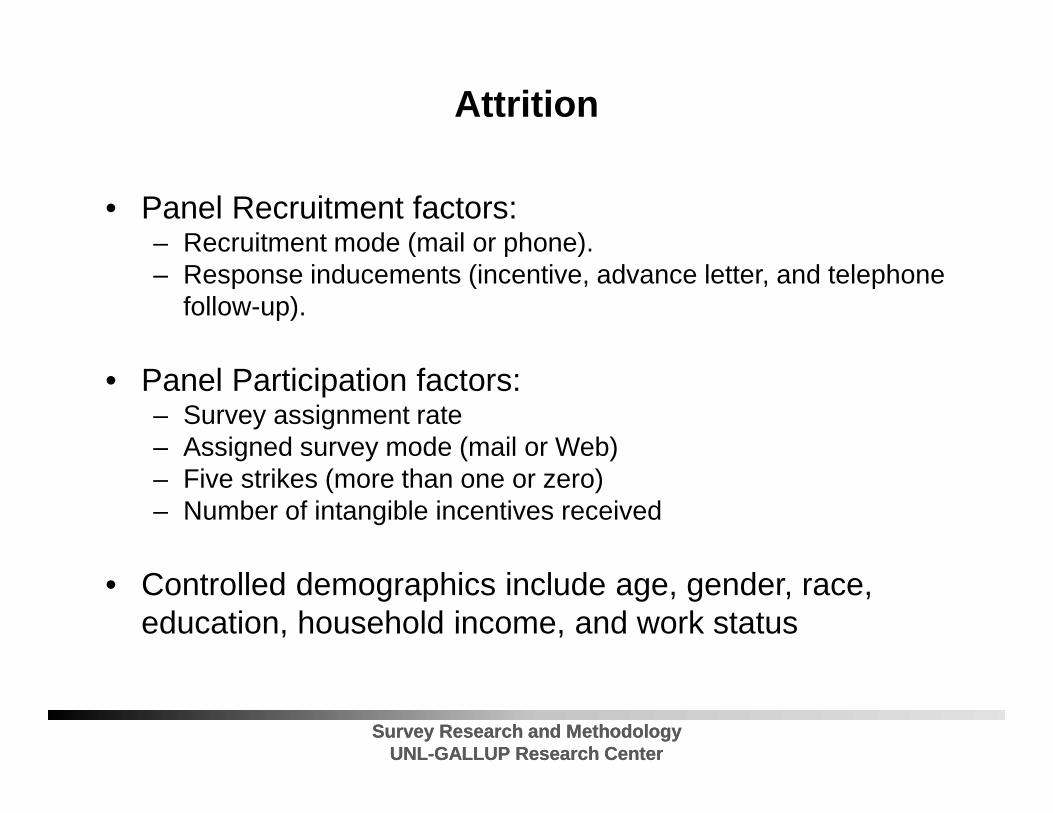
Attrition
• Panel Recruitment factors:– Recruitment mode (mail or phone).– Response inducements (incentive, advance letter, and telephone
follow-up).
• Panel Participation factors:– Survey assignment rate– Assigned survey mode (mail or Web)– Five strikes (more than one or zero)– Number of intangible incentives received
• Controlled demographics include age, gender, race,education, household income, and work status

Survey Research and MethodologyUNL-GALLUP Research Center
Survey Research and MethodologyUNL-GALLUP Research Center
Breakoff:Evidence from Gallup Panel
• Device: not all breakoffs lead to attrition– Handhelds 3 times more likely to lead to breakoff (6% vs. 2%)– Handheld breakoffs nearly 5 times more likely to complete at least
one more wave of panel data collection– Tablet and computer breakoff less likely to result in continuation
• Complexity leads to higher breakoff rate– Grids are complex and should be avoided– Increase in words per page leads to slow down and breakoff
• Non-engaging topics contribute to breakoff
• Slowing down (response latency), net of other factors, signalspotential breakoff
• Respondent engagement
1010

Survey Research and MethodologyUNL-GALLUP Research Center
Survey Research and MethodologyUNL-GALLUP Research Center
Breakoff:Evidence from Gallup Panel
• Device: not all breakoffs lead to attrition– Handhelds 3 to 4.5 times more likely to lead to breakoff when not
optimized (e.g., 7% vs. 2%)• Optimization is form of Responsive design
– Handheld breakoffs nearly 5 times more likely to complete at leastone more wave of panel data collection
– Tablet and computer breakoff less likely to result in continuation
• Complexity leads to higher breakoff rate– Grids are complex and should be avoided– Increase in words per page leads to slow down and breakoff
• Slowing down (response latency), net of other factors, signalspotential breakoff
• Respondent burden
1111

Survey Research and MethodologyUNL-GALLUP Research Center
Survey Research and MethodologyUNL-GALLUP Research Center
Breakoff and Attrition in Web Surveys andOnline Panels
• Paradata holds great promise in helping us betterunderstand when, and possibly why, respondentsbreakoff and attrit
• Can we use it to help reduce breakoff and attrition?– Help contain survey costs– Help maintain representativeness
• Relies on the leverage-salience theory of surveyparticipation (Groves, Singer, Corning 2000)
1212

Survey Research and MethodologyUNL-GALLUP Research Center
Survey Research and MethodologyUNL-GALLUP Research Center
Four Types of Data for Online Surveys
• Substantive data (survey responses)• Paradata (process data)
– Time of day survey taken– Data device (operating system, version)– Response latency– Back-ups, changes– Complexity (question, page)
• Metadata– Codebook– Data collection agency/firm– Field dates
• Auxiliary data– From external (e.g., commercial data bases)– E.g., neighborhood characteristics
1313

Survey Research and MethodologyUNL-GALLUP Research Center
Survey Research and MethodologyUNL-GALLUP Research Center
Adaptive/Responsive Design
• Changes in the survey design in an effort to maximizeresponse rate (Groves and Heeringa 2006, Wagoner 2008)– In panels – reduce breakoff and attrition
• Typically ‘tailored’ to accommodate characteristics ofrespondents– We know a lot about panel members
• Numerous forms of possible adaptive/responsive designs– Incentives (Trussell and Lavrakas 2004)– Mode– Questionnaire
• ‘Branching’• Optimizing• Questions: Leverage-Saliency theory (Singer, Groves and Corning
2000)
1414
Survey Research and MethodologyUNL-GALLUP Research Center
Survey Research and MethodologyUNL-GALLUP Research Center
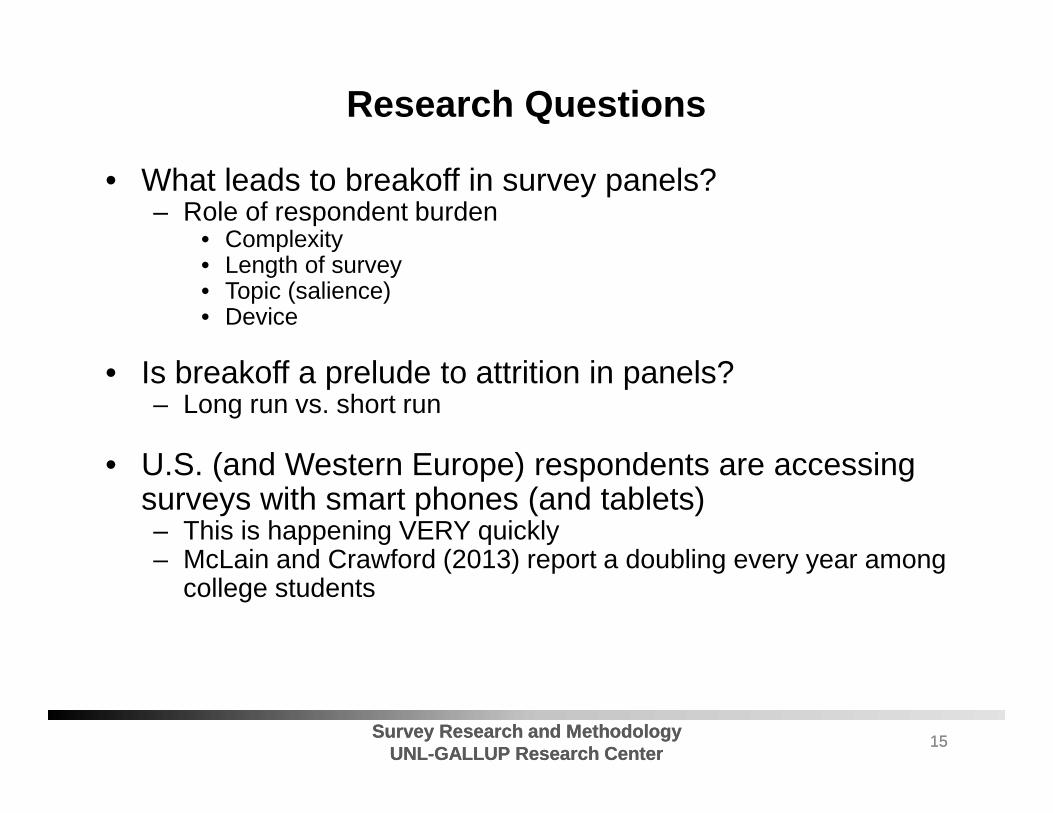
Research Questions
• What leads to breakoff in survey panels?– Role of respondent burden
• Complexity• Length of survey• Topic (salience)• Device
• Is breakoff a prelude to attrition in panels?– Long run vs. short run
• U.S. (and Western Europe) respondents are accessingsurveys with smart phones (and tablets)– This is happening VERY quickly– McLain and Crawford (2013) report a doubling every year among
college students
1515

Survey Research and MethodologyUNL-GALLUP Research Center
Survey Research and MethodologyUNL-GALLUP Research Center
Smartphones Overtake Other Cells

Survey Research and MethodologyUNL-GALLUP Research Center
Survey Research and MethodologyUNL-GALLUP Research Center
Device Type Trends in Gallup Panel
1717
0
0.02
0.04
0.06
0.08
0.1
0.12
0.14
0.16
0.18
Apr
-12
May
-12
Jun-
12
Jul-1
2
Aug
-12
Sep
-12
Oct
-12
Nov
-12
Dec
-12
Jan-
13
Feb-
13M
ar-1
3
Apr
-13
May
-13
Jun-
13
Jul-1
3
Aug
-13
Sep
-13
Oct
-13
Nov
-13
Dec
-13
Jan-
14
Feb-
14M
ar-1
4
Apr
-14
May
-14
Jun-
14
Jul-1
4
Aug
-14
Phone
Tablet

Survey Research and MethodologyUNL-GALLUP Research Center
Survey Research and MethodologyUNL-GALLUP Research Center
Who Uses What Device?: Computer as Baseline(July 2014: P < .0005)
Phone Odds RatioAge 0.946Education 0.907Women 1.207Constant 4.408
TabletAge ----Education ----Women 1.408Constant 7.603
1818

Survey Research and MethodologyUNL-GALLUP Research Center
Survey Research and MethodologyUNL-GALLUP Research Center
Breakoff by Device Type:The Importance of Optimizing
1919
Month of Initial Data Collection
Device Type4/12 5/12 6/12 9/12 11/12 12/12 1/13 3/13 4/13 7/13 8/13 10/13 11/13 12/13 4/14
Computer 1.29 3.40 1.68 2.03 1.84 1.65 3.23 3.68 1.46 1.64 3.95 1.90 5.06 11.55 1.53
Tablet 2.61 4.19 1.77 2.59 2.04 2.03 3.40 3.96 1.78 2.68 4.83 1.87 4.36 9.77 0.96
Handheld 6.19 10.04 6.38 6.33 6.36 6.55 10.39 12.53 6.92 5.76 8.83 3.96 7.50 13.50 3.21Odd rationHandheld toComputer 4.8 2.9 3.8 3.1 3.5 3.9 3.2 3.4 4.7 3.5 2.2 2.1 1.5 1.2 2.1
Total 20,139 20,063 19,008 18,065 16,946 17,358 17,134 15,977 15,958 17,475 15,472 16,909 16,944 12,672 10,711

Survey Research and MethodologyUNL-GALLUP Research Center
Survey Research and MethodologyUNL-GALLUP Research Center
Breakoff by Device Type:The Importance of Optimizing
2020
Month of Initial Data Collection
Device Type4/12 5/12 6/12 9/12 11/12 12/12 1/13 3/13 4/13 7/13 8/13 10/13 11/13 12/13 4/14
Computer 1.29 3.40 1.68 2.03 1.84 1.65 3.23 3.68 1.46 1.64 3.95 1.90 5.06 11.55 1.53
Tablet 2.61 4.19 1.77 2.59 2.04 2.03 3.40 3.96 1.78 2.68 4.83 1.87 4.36 9.77 0.96
Handheld 6.19 10.04 6.38 6.33 6.36 6.55 10.39 12.53 6.92 5.76 8.83 3.96 7.50 13.50 3.21Odds ratioHandheld toComputer 4.8 2.9 3.8 3.1 3.5 3.9 3.2 3.4 4.7 3.5 2.2 2.1 1.5 1.2 2.1
Total 20,139 20,063 19,008 18,065 16,946 17,358 17,134 15,977 15,958 17,475 15,472 16,909 16,944 12,672 10,711

Survey Research and MethodologyUNL-GALLUP Research Center
Survey Research and MethodologyUNL-GALLUP Research Center
Optimizing for SmartphonesBefore After
2121

Survey Research and MethodologyUNL-GALLUP Research Center
Survey Research and MethodologyUNL-GALLUP Research Center
Optimizing for SmartphonesVertical Scrolling works – Horizontal Does Not
2222

Survey Research and MethodologyUNL-GALLUP Research Center
Survey Research and MethodologyUNL-GALLUP Research Center
Breakoff Logistic Regressions (Odd Ratios)2012-2013 Panel Waves
2323
4/12 5/12 6/12 9/12 11/12 12/12 1/13 3/13 4/13
Phone 3.86*** 2.48*** 3.30*** 2.57*** 2.88*** 3.91*** 2.81*** 3.10*** 3.72***
Tablet 1.84** .1.16 0.99 1.19 1.05 1.22 1.03 1.04 1.14
Gender(female) 1.32* 1.06 2.09*** 1.86*** 1.14 0.91 0.89 0.99 1.48***
Age 0.98*** 0.98*** 0.98*** .98*** 0.98*** 0.99 0.98*** 0.98*** 0.98***
Constant 0.03*** 0.09*** 0.01*** 0.02*** 0.04*** 0.03*** 0.10*** 0.09*** 0.03***
Chi-square 112.3*** 114.9*** 122.4*** 113.6*** 87.7*** 76.7*** 121.7*** 124.8*** 124.3***

Survey Research and MethodologyUNL-GALLUP Research Center
Survey Research and MethodologyUNL-GALLUP Research Center
Breakoff Logistic Regressions (Odd Ratios)2012-2013 Panel Waves
2424
4/12 5/12 6/12 9/12 11/12 12/12 1/13 3/13 4/13
Phone 3.86*** 2.48*** 3.30*** 2.57*** 2.88*** 3.91*** 2.81*** 3.10*** 3.72***
Tablet 1.84** .1.16 0.99 1.19 1.05 1.22 1.03 1.04 1.14
Gender(female) 1.32* 1.06 2.09*** 1.86*** 1.14 0.91 0.89 0.99 1.48***
Age 0.98*** 0.98*** 0.98*** .98*** 0.98*** 0.99 0.98*** 0.98*** 0.98***
Constant 0.03*** 0.09*** 0.01*** 0.02*** 0.04*** 0.03*** 0.10*** 0.09*** 0.03***
Chi-square 112.3*** 114.9*** 122.4*** 113.6*** 87.7*** 76.7*** 121.7*** 124.8*** 124.3***

Survey Research and MethodologyUNL-GALLUP Research Center
Survey Research and MethodologyUNL-GALLUP Research Center
Who Breaks Off?(July 2014: P < .0005)
Variable Odd RatioPhone 1.985
Age 0.979
Education ----
Women 1.801
Tenure (/100 days) 0.982
Constant 0.102
2525

Survey Research and MethodologyUNL-GALLUP Research Center
Survey Research and MethodologyUNL-GALLUP Research Center
Page Characteristics at Time of Breakoff(July 2014)
2626
Page Word Count
Previous 71.9
Breakoff 72.9
Current 94.0

Survey Research and MethodologyUNL-GALLUP Research Center
Survey Research and MethodologyUNL-GALLUP Research Center
Conclusions• Once started on a survey, older web panelists are less likely
to breakoff
• Those who initiate a survey on a phone/handheld device aremore likely to breakoff– Optimization helps
• Preliminary indications are that breakoffs from a phone areless likely to lead to attrition.– Breakoffs on a phone more likely to complete the survey at the next
invitation (though on a computer or tablet)
• Implications– Need to offer a ‘smart phone-friendly’ format– May have important implications for device effects, similar to what
has been observed in mode effects
2727
Survey Research and MethodologyUNL-GALLUP Research Center
Survey Research and MethodologyUNL-GALLUP Research Center
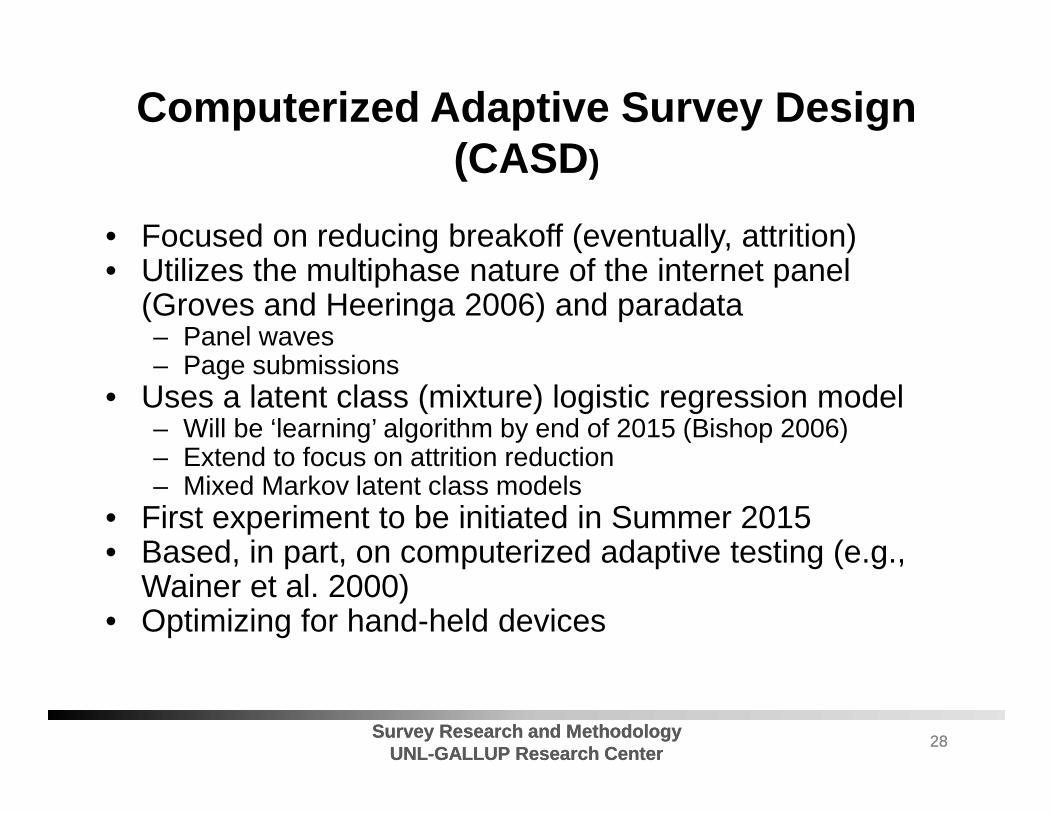
Computerized Adaptive Survey Design(CASD)
• Focused on reducing breakoff (eventually, attrition)• Utilizes the multiphase nature of the internet panel
(Groves and Heeringa 2006) and paradata– Panel waves– Page submissions
• Uses a latent class (mixture) logistic regression model– Will be ‘learning’ algorithm by end of 2015 (Bishop 2006)– Extend to focus on attrition reduction– Mixed Markov latent class models
• First experiment to be initiated in Summer 2015• Based, in part, on computerized adaptive testing (e.g.,
Wainer et al. 2000)• Optimizing for hand-held devices
2828

Survey Research and MethodologyUNL-GALLUP Research Center
Survey Research and MethodologyUNL-GALLUP Research Center
Some of What We Know
Q14_1 How interesting did you find the following topics that were surveyed in 2012?
1 Not at all interesting
2
3
4
5 Extremely interesting
7 Does not apply
Q14_1A Health, healthcare, and wellbeing
Q14_1B Workplace issues
Q14_1C Media usage
Q14_1D Social issues and elections
Q14_1E Retail/Customer experiences
Q14_1F World affairs
2929

Survey Research and MethodologyUNL-GALLUP Research Center
Survey Research and MethodologyUNL-GALLUP Research Center
Proof of Concept Experiment
• Model estimation using paradata in real time to predictlikelihood of breakoff– Fixed characteristics (e.g., demographics, device)– Dynamic characteristics (e.g., time spent, back-ups, changes)
• Threshold considerations– Better false positives than false negatives
• Paging – always a page behind
• Random split-half– One half – no intervention– Other half – intervention of self-defined ‘interesting topics’
• Leverage-saliency theory
3030

Survey Research and MethodologyUNL-GALLUP Research Center
Survey Research and MethodologyUNL-GALLUP Research Center
Future of Survey Research
• Declining response rates– CATI response rates at 10%
• Caller ID• Declining landline• Increasing refusal• Cell phone limitations (manual dialing)
– Web surveys have low response rates• Difficult to get reasonable sampling frames online
• Promise of panels– Must still deal with respondent engagement– Ease of response– Mobility and timing
• “Personal assistants” (Avatars)– Test-to-speach– Natural language recognition (Siri, Cortana, Simon)– Digitized assistants (Nvidia Face Works Tech Demo)
3131

Survey Research and MethodologyUNL-GALLUP Research Center
Survey Research and MethodologyUNL-GALLUP Research Center
Passive Data Collection
3232

Survey Research and MethodologyUNL-GALLUP Research Center
Survey Research and MethodologyUNL-GALLUP Research Center
Conclusions
• Technology will play an increasing role in surveyresearch
• Statistics will play an increasing role in survey research– Analysis of data and paradata– Predictive modeling (CASD, predictive analytics)– Linkage algorithms for administrative, auxiliary, geo- data
• New forms of data and paradata, such as social media,will need to be explored– Public opinion– Health issues
• Epidemics– Employment/unemployment– Financial
3333

Survey Research and MethodologyUNL-GALLUP Research Center
Survey Research and MethodologyUNL-GALLUP Research Center
Thank youThank you
Allan L. [email protected]
3434

Survey Research and MethodologyUNL-GALLUP Research Center
Survey Research and MethodologyUNL-GALLUP Research Center
McCutcheon, A. L., Rao, K., & Kaminska, O. (2014). TheUntold Story of Multi-Mode(Online and Mail) ConsumerPanels: From Optimal Recruitment to Retention andAttrition in M. Callegaro, R. Baker, J. Bethlehem, A. Göritz,J. Krosnick, and P. Lavrakas (eds.) Online Panel Research:A Data Quality Perspective. Wiley.
Publication details:
Background
Rao, K., Kaminska, O., & McCutcheon, A. L. (2010).Recruiting Probability Samples for a Multi-ModeResearch Panel with Internet and Mail Components.Public Opinion Quarterly, 74(1), 68-84.