Embed Size (px)
Citation preview

THE ROLE OF DIETARY FAT IN HYPOTHALAMIC INSULIN AND LEPTIN
RESISTANCE AND THE PATHOGENESIS OF OBESITY
By
Kelly Ann Posey
Dissertation
Submitted to the Faculty of the
Graduate School of Vanderbilt University
in partial fulfillment of the requirements
for the degree of
DOCTOR OF PHILOSOPHY
in
Molecular Physiology and Biophysics
August, 2009
Nashville, TN
Approved:
Alan D. Cherrington, PhD
Richard M. O’Brien, PhD
Owen P. McGuinness, PhD
Larry L. Swift, PhD
Maureen A. Gannon, PhD

ii
ACKNOWLEDGEMENTS
This work would not be possible without the help of so many others. Although I
cannot begin to thank all of those involved or even express in words my gratitude, I
would like to acknowledge the following. First of all the Molecular Physiology and
Biophysics department deserves a thank you for their continued support of all the
graduate students. We have the privilege to work with wonderful faculty members and
staff that always place the best interest of the student first. In particular, I would like to
acknowledge Angie Pernell, Dr. Chuck Cobb, and Dr. Danny Winder for their support
and guidance in navigating the maze that is graduate school. A special thanks to Angie
for being an advocate and a friend, and for going above and beyond to make our
graduate school experience as painless as possible.
I am also grateful for my dissertation committee members Dr. Alan Cherrington,
Dr. Owen McGuinness, Dr. Richard O’Brien, Dr. Maureen Gannon, and Dr. Larry Swift
for their insightful comments and suggestions in regard to my dissertation work. All of
them freely offered there guidance and support whenever necessary and helped me
grow as a scientist. But more importantly than that, they helped me grow as an
individual. Thank you so much for that.
The Wasserman laboratory also deserves a special thank you for giving me my
start at Vanderbilt, for teaching me so much, and for remaining great friends over the
years. Dave Wasserman and the members of his laboratory are a special group of
people who are always willing to help, share reagents, and answer my questions. I am
truly grateful to Dave Wasserman for his guidance, humor, and advice when I felt as
though I were adrift in the vast ocean of graduate school.
Of course I have to thank the past and present members of the Niswender
laboratory for making it an enjoyable place to work. I must thank Dr. John Stafford for

iii
his refreshingly positive attitude in the lab and for answering my many questions and
offering some sage advice to me as a graduate student. Also, Dr. Fang Yu for her sense
of humor, which never failed to make me laugh, and for her willingness to help no matter
what. Sanaz Saadat and Le Zhang are wonderful technicians and friends who made the
long hours we spent in the surgery and animal rooms together more fun. Leena George,
for the “life” discussions shared over lunch or coffee that always lasted longer than they
should. And Maxine Turney, who is a relentless scientist with a vast knowledge that only
comes with experience, the one who really runs the lab, and most importantly a true
friend. Nothing would be possible in the lab without Maxine. Dr. Richard Printz is one of
the most kind and patient human beings I’ve had the pleasure to meet. We would talk
science for hours, everything from the small details to the big picture, and I am a better
scientist for it. Not only that, but Richard also had the ability to gently tell me the truth
when I needed to hear it and to encourage me when I needed that too. For all this, I am
truly grateful. Certainly, we wouldn’t be here without Dr. Kevin Niswender. He is a
brilliant man with a pure excitement for science, whose eternal optimism in finding the
good even amidst the “failures” can’t help but be contagious. Thank you for always
believing in me even when I didn’t believe in myself, for pushing me even when I pushed
back, and for never limiting the realm of possibilities in the lab. Thank you.
To my family; Mom and Dad, thank you for all your love and support through the
years. Thank you for being just a phone call away and for the words of encouragement
when life seemed overwhelming. You have been a source of strength to continue on
this long and difficult journey and I wouldn’t be here without you. I couldn’t ask for better
parents. And last, but certainly not least, my wonderful husband Shane. Thank you for
loving me despite my craziness and my quirks, and for always laughing at my silliness.
And thank you for being a part of my life; it has been an exciting journey so far. I can’t
wait to see where it takes us.

iv
“Failure is only the opportunity to begin again more intelligently.”
-Henry Ford

v
TABLE OF CONTENTS
Page
ACKNOWLEDGEMENTS ............................................................................................... ii LIST OF TABLES ............................................................................................................ viii LIST OF FIGURES ........................................................................................................... ix Chapter I. BACKGROUND AND SIGNIFICANCE .................................................................... 1 Obesity Epidemic ................................................................................................. 1 Energy Homeostasis ............................................................................................ 2 Adiposity Signals .................................................................................................. 5 Leptin ......................................................................................................... 7 Insulin ......................................................................................................... 8 Central Nervous System ...................................................................................... 9 Anabolic neurons (NPY/AgRP Neurons) .................................................. 10 Catabolic neurons (POMC Neurons) ....................................................... 11 Hypothalamic Leptin signaling and action ................................................ 12 Hypothalamic Insulin signaling and action ............................................... 15 Integrated Regulation of Energy Homeostasis ................................................... 18 Short-term Signals ................................................................................... 18 Whole-body Physiology ............................................................................ 20 Obesity: Disrupted Energy Homeostasis ........................................................... 22 Leptin Resistance .................................................................................... 24 Insulin Resistance .................................................................................... 25 Potential Mechanisms Involved in High-Fat Diet-Induced Obesity ..................... 26 Dietary Fat ................................................................................................ 26 Toll-Like Receptor 4 ................................................................................. 27 Inflammatory IKKβ Signaling .................................................................... 31 Pathogenesis of High-Fat Diet-Induced Obesity ................................................ 33 Overview and Aims of Dissertation .................................................................... 35 II. MATERIALS AND METHODS ................................................................................ 39 Animal Care ...................................................................................................... 39 Rats .......................................................................................................... 39 Mice .......................................................................................................... 41 ICV Cannulation ................................................................................................ 41 Body Composition Analysis ............................................................................... 42 Intraperitoneal Glucose Tolerance Test ............................................................. 43 Pair-Feeding Study ........................................................................................... 43 Fatty Acid Infusion ............................................................................................. 44 LC-CoA Measurements ..................................................................................... 45 IKKβ Inhibitor Study .......................................................................................... 45 Cholecystokinin Study ....................................................................................... 46 Insulin and Leptin Sensitivity Measurements .................................................... 46 Protein Extraction and Quantification ................................................................ 47

vi
SDS PAGE and Western Immunoblotting ......................................................... 47 Enzyme-Linked Immunosorbent Assay (ELISA) ............................................... 48 RNA Isolation and Quantitative Real-Time RT-PCR ......................................... 49 Plasma Hormone and Metabolite Measurements ............................................. 50 Statistical Analyses ........................................................................................... 51 III. OBESOGENIC PROPERTIES OF HIGH FAT DIETS ENRICHED WITH LONG CHAIN FATTY ACIDS OF VARING SATURATION ....................................................... 52 Introduction ....................................................................................................... 52 Results .............................................................................................................. 53 Saturation Dependent Effects of Dietary Fat in Long Evans Rats ............ 53 Effects on Body Weight, Adiposity, and Plasma Hormones ........... 53 Effects on Food Intake and Energy Expenditure ............................ 54 Effects of a Restricted High-Fat Diet ........................................................ 58 Effects on Body Weight and Adiposity ........................................... 58 Effects on Glucose Tolerance ........................................................ 60 High-Fat Feeding, Independent of Increased Caloric Intake is Sufficient to Induce Hypothalamic Insulin Resistance ............................. 60 High-Fat Feeding, Independent of Increased Caloric Intake is Sufficient to Activate Inflammatory Molecules .......................................... 62 Discussion .......................................................................................................... 65 IV. SATURATED FAT ACTIVATES INFLAMMATORY PATHWAYS AND IMPAIRS INSULIN SIGNALING DIRECTLY WITHIN THE HYPOTHALAMUS ............................. 71 Introduction ....................................................................................................... 71 Results .............................................................................................................. 72 ICV Infusion of Fatty Acids Leads to Hypothalamic Accumulation of LC-CoA, Activation of IKKβ, and Impaired Insulin Signaling ................... 72 IKKβ Inhibitor Represses Consumption of a High-Fat, but not a Low-Fat, Diet ........................................................................................... 73 IKKβ Inhibitor Increases Insulin Signaling in High-Fat Fed, Obese Rats ......................................................................................................... 74 Discussion ......................................................................................................... 74 V. DEFICIENCY OF THE PRO-INFLAMMATORY SIGNALING MOLECULE, TLR4, REDUCES BODY WEIGHT AND ADIPOSITY .............................................................. 82 Introduction ....................................................................................................... 82 Results .............................................................................................................. 84 Mouse Model of TLR4 deficiency ............................................................. 84 Effect of TLR4 Deficiency on Body Weight and Composition ................ 85 Effect of TLR4 Deficiency on Food Intake and Energy Expenditure ...... 88 Effect of TLR4 Deficiency on Glucose Tolerance..................................... 95 Effect of TLR4 Deficiency on Lipid Metabolism ........................................ 95 Effect of TLR4 Deficiency on Inflammatory IKKβ Signaling .................... 96 Discussion ......................................................................................................... 99

vii
VI. HIGH-FAT DIET-INDUCED HYPOTHALAMIC INSULIN AND LEPTIN RESISTANCE ARE TEMPORALLY AND MECHANISTICALLY DISTINCT AT THE ONSET OF OBESITY .................................................................................................. 108 Introduction ...................................................................................................... 108 Results ............................................................................................................ 109 Relative Insulin Sensitivity in Central and Peripheral Tissues ................ 109 Early Onset of High-fat Diet-induced Obesity........................................ 110 Accumulation of Long Chain CoA and Activation of IKKβ with High-Fat Feeding ................................................................................. 112 Progression of Insulin and Leptin Resistance with High-Fat Feeding .. 114 Food Intake Response to Cholecystokinin ............................................ 117 Inhibition of IKKβ Reduces Food Intake in Setting of Elevated pIKKβ .. 119 Discussion ........................................................................................................ 119 VII. SUMMARY AND FUTURE DIRECTIONS ............................................................ 128 Appendices A. Baseline Metabolic Parameters of High-Fat Diet Induced Obese Rat Model ............................................................................................ 137 B. Efficacy and Dose Response of IKK Inhibition.................................................. 138 C. Kaolin Intake Test of Visceral Illness with IKK Inhibition .................................. 139 D. CCK Dose Response ....................................................................................... 140 E. Comparison of Pharmacological ICV Insulin Infusion and Physiological Insulin Response to a Fasting-Refeeding Cycle ............................................. 141 REFERENCES ............................................................................................................. 142

viii
LIST OF TABLES
Table Page
1. Composition of Diets ................................................................................................... 40
2. Saturation Dependent Effects of Dietary Fat ............................................................... 70
3. Metabolic Effects of a Restricted High-Fat Diet .......................................................... 70
4. Metabolic Profile of Male Mice .................................................................................. 106
5. Metabolic Profile of Female Mice .............................................................................. 107

ix
LIST OF FIGURES
Figure Page
1. Diagram of Energy Balance .......................................................................................... 4
2. Model of Central Nervous System Control of Energy Homeostasis .............................. 6
3. Neuronal Leptin Receptor Signaling Cascade ............................................................ 14
4. Neuronal Insulin Receptor Signaling Cascade ............................................................ 17
5. Integration of Central and Peripheral Signals in the Regulation of Energy Homeostasis ................................................................................................................... 23 6. Reciprocal Modulation of Toll-like Receptor 4 Signaling Cascade .............................. 30
7. Proposed Cellular Mechanism of Fatty Acid-Induced Insulin Resistance ................... 34
8. Hypothalamic LC-CoA Accumulation and IKKβ Activity in Obese, HF Fed Rats ........ 36
9. Saturation Dependent Effects of Dietary Fats on Obesity ........................................... 55
10. Saturation Dependent Effects of Dietary Fat on Food Intake and Feed Efficiency ... 57
11. Intermediate Effects of a Restricted High-Fat Diet on Body Weight and Adiposity ... 59 12. Effect of a Restricted High-Fat Diet on Glucose Tolerance....................................... 61
13. High-Fat Feeding, Independent of Increased Caloric Intake, Induces Hypothalamic Insulin Resistance ........................................................................................................... 63 14. High-Fat Feeding, Independent of Increased Caloric Intake, Activates Hypothalamic Inflammatory Signaling Pathways ............................................................ 64
15. Effect of Intracerebroventricular Fatty Acid Infusion on Hypothalamic Long-Chain Acyl-CoA Content, IKKβ Activity, and Insulin Signaling .................................................. 75 16. Effect of Pharmacological IKK Inhibitor on Food Intake ............................................ 76
17. Effect of Pharmacological IKK Inhibitor on Hypothalamic Insulin Signaling in HF Fed, Obese Rats. .................................................................................................. 77 18. Mouse Model of TLR4 deficiency: LPS response ..................................................... 86
19. Mouse Model of TLR4 deficiency: TLR4 mRNA ....................................................... 87

x
20. Effect of TLR4 Deficiency on Body Weight and Adiposity ......................................... 89
21. Effect of TLR4 Deficiency on Food Intake. .............................................................. 92
22. Effect of TLR4 Deficiency on Feed and Energy Efficiency ........................................ 93
23. Effect of TLR4 Deficiency on Energy Expenditure .................................................... 94
24. Effect of TLR4 Deficiency on Glucose Tolerance ..................................................... 97
25. Effect of TLR4 Deficiency on a Major Regulator of Hepatic Lipid Metabolism .......... 98
26. Effect of TLR4 Deficiency on IKKβ Activity ............................................................. 100
27. Effect of Dietary Fat Intake on Relative Insulin Sensitivity in Central and Peripheral Tissues ........................................................................................................ 111 28. Early Onset of High-Fat Diet-Induced Obesity ........................................................ 113
29. Effect of High-Fat Feeding on Hypothalamic Long Chain CoA Content and IKKβ Activity at the Onset of Diet-Induced Obesity ................................................ 115 30. Hypothalamic Insulin and Leptin Sensitivity at the Onset of Diet-Induced Obesity .......................................................................................................................... 116
31. Plasma Insulin and Leptin Profile at the Onset of Diet-Induced Obesity ................. 118
32. Food Intake Response to Cholecystokinin at the Onset of Diet-Induced Obesity ... 120
33. Effect of Pharmacological IKK Inhibitor on Food Intake at the Onset of Diet-Induced Obesity ..................................................................................................... 121 34. Summary of Relative Changes in Key Molecular Mediators in the Pathogenesis of Diet-Induced Obesity with High-Fat Feeding................................................................. 127

1
CHAPTER I
BACKGROUND AND SIGNIFICANCE
Obesity Epidemic
Obesity has reached epidemic proportions in the United States with
approximately two-thirds of the adult population and nearly one-fifth of children and
adolescents classified as overweight or obese [1]. With tremendous consequences to
our personal health and society as a whole, the obesity epidemic has become one of the
foremost health concerns facing our nation today. It is well established that obesity
increases the risk of many diseases and health conditions including cardiovascular
disease, Type 2 Diabetes Mellitus (T2DM), hypertension, dyslipidemia, liver disease,
osteoarthritis, and certain forms of cancer, with risk increasing progressively as adiposity
increases. Furthermore, obesity is associated with an increase in mortality such that
obese individuals have a 10 to 50 percent increased risk of death from all causes
compared to healthy weight individuals [2]. According to a recent study, for the first time
in two centuries the current generation of children in the United States may have shorter
life expectancies than their parents by as much as 5yrs, if the rapid rise in childhood
obesity remains unchecked [136]. In addition to the health problems associated with the
obesity epidemic, obesity also has a significant economic impact on the United States
health care system. For example, medical expenses attributed to overweight and
obesity accounted for 9.1 percent of total medical expenditures in the United States for
1998 according to one study [63]; a number that may be even higher today and does not
include the indirect costs associated with related diseases and complications attributed
to obesity. It is truly difficult to quantify the full impact of the obesity epidemic to our
health, quality of life, economy, and society.

2
According to the National Institutes of Health, obesity and overweight together
are the second leading cause of preventable death in the United States. However, no
effective therapy currently exists to combat the obesity epidemic. Through
understanding the causes and pathogenesis of obesity, it may be possible to design
therapeutic targets aimed at both the treatment and prevention of obesity and associated
complications.
Energy Homeostasis
Even more striking than the consequences of the obesity epidemic is the
dramatic rate at which the prevalence of obesity has increased over the last 25 yrs in the
United States [120]. This rapid increase in the prevalence of obesity could be
misinterpreted as evidence that body weight is not regulated. However, abundant
experimental evidence suggests that body weight is a tightly regulated variable. For
example, Bernstein et al. [21] demonstrated this regulation in an experiment in which a
group of rats were force-fed via gastric catheters to a significant level of obesity
compared to freely feeding, lean rats. After several months of force-feeding the obese
group, treatment was terminated and animals were allowed to feed freely. Both groups
were then followed for changes in body weight. Interestingly, within a few weeks the
obese group lost all the excess body weight generated by force-feeding at which point
the growth rate of the obese group matched that of the lean group. The rapid weight
loss observed in the obese group was primarily mediated by a reduction in voluntary
food intake. However, changes in food intake alone could not account for the entire
weight loss observed in the obese group suggesting energy expenditure was elevated.
In addition, the “experimental obesity in man” studies describe a similar phenomenon of
tight body weight regulation in humans [170]. In these studies, subjects were given a
monetary incentive to consume as many calories as possible to generate a significant

3
amount of weight gain. After significant weight gain was achieved compared to baseline
levels, the monetary incentive to over-consume was removed but the subjects still
received free access to food. As observed in the rat study, the subjects lost all the
excess body weight accrued during the incentivized feeding period and returned to their
original body weight within a few months. During this weight loss period, food intake
was drastically reduced and only returned to normal levels when body weight was
restored to basal levels. In addition, it was noted that the amount of calories required to
gain and subsequently maintain the elevated body weight was greater than expected
based on the subjects’ basal energy requirements. This suggested that over-
consumption resulted in an increase in total energy expenditure. Together, the results
from these studies and others demonstrate that body weight can be tightly regulated and
provides evidence for the existence of a system regulating energy balance. This
regulation is known as energy homeostasis.
Energy homeostasis is defined as the physiological process whereby energy
intake is matched to expenditure over time to promote the stability of body fuel stored in
the form of fat. Energy intake is determined by the calories consumed from food,
whereas energy expenditure is determined by a variety of components including basal
metabolic rate, physical activity consisting of exercise and non-exercise activity, and the
thermic effect of food. When energy intake is equivalent to energy expenditure body
weight is stable; termed neutral energy balance. When energy intake exceeds energy
expenditure, weight gain occurs and is termed positive energy balance. Conversely,
when energy expenditure exceeds energy intake, weight loss occurs and is termed
negative energy balance. This concept of energy balance is illustrated in Figure 1.
However, this is a very simplistic depiction of a highly complex physiological
process. Current models of energy homeostasis indicate that the regulation of body
adiposity occurs via a classical endocrine negative feedback loop involving the adiposity

4
Figure 1. Diagram of Energy Balance
Changes in body weight are determined by the relative balance between food intake and energy expenditure.
Neutral Energy BalanceWeight Maintenance
Negative Energy BalanceWeight Loss
Positive Energy BalanceWeight Gain
Food Intake Energy Expenditure

5
signals insulin and leptin (Figure 2). In this model, insulin and leptin circulate in
concentrations proportional to body fat content and act within the hypothalamus where
they modulate both anabolic and catabolic neural circuits that regulate food intake and
energy expenditure to maintain energy balance. For example, in response to an
increase in body adiposity, elevated insulin and leptin levels repress anabolic neural
circuits that stimulate food intake and inhibit energy expenditure while simultaneously
activating catabolic neural circuits that inhibit food intake and increase energy
expenditure. These combined effects result in negative energy balance to restore
adiposity to basal levels. Conversely, circulating insulin and leptin levels decrease in
response to reductions in body adiposity. In this setting, the activity of anabolic neural
circuits is increased and the activity of catabolic neural circuits is decreased, ultimately
resulting in a state of positive energy balance and the restoration of adiposity to basal
levels.
Adiposity Signals
Conceptually an adiposity signal must meet the following criteria (reviewed in
[163]); it should be secreted into the plasma in proportion to body fat stores and enter
the CNS in proportion to plasma levels, receptors for a putative signal should be
expressed by brain neurons involved in energy intake, central administration of a
putative adiposity signal should reduce food intake, and finally, deficiency (or inhibition)
of the adiposity signal should increase food intake. To date, insulin and leptin are the
only known molecules to fulfill the criteria of adiposity signals.

6
Figure 2. Model of Central Nervous System Control of Energy Homeostasis
The adiposity signals insulin and leptin circulate in concentrations proportional to body fat content and act within the hypothalamus to regulate both anabolic and catabolic neural circuits. These insulin and leptin sensitive neural pathways interact with other regulatory circuits to modulate food intake and energy expenditure, ultimately resulting in the regulation of energy balance and maintenance of adipose stores. Figure adapted from Schwartz et al.. [163].
+
–
+
Fat Stores
Anabolic
Catabolic
FoodIntake
Energy Expenditure
Energy Balance
CNS
– +
+
+
+ –
AdipositySignals• Metabolic Rate
• Physical Activity–
–
Leptin Insulin
7
Leptin
The existence of adiposity signals in the regulation of energy homeostasis was
first supported by the “parabiosis” experiments conducted in the 1970s which concluded
that genetically obese ob/ob mice lacked a circulating factor that inhibited feeding,
whereas obese mice with a different gene mutation (db/db) were resistant to this factor
[43, 44]. In 1994, Zhang and colleagues identified the adipose tissue hormone leptin as
the protein encoded by the ob gene and which is mutated in ob/ob mice to induce
obesity [210].
Since its discovery, leptin, the product of the ob gene, has been extensively
studied. Leptin is a 167 amino acid hormone produced almost exclusively in adipose
tissue [210] and its secretion is influenced by both the total amount of fat stores as well
as short-term changes in energy status [46] [154] in which leptin production is stimulated
by insulin and inhibited by fasting [110]. Consistent with its function as an adiposity
signal, leptin circulates in proportion to body adiposity [46] and leptin transport across
the blood-brain barrier occurs by a saturable receptor-mediated process [12].
Consistent with the entry of leptin to the CNS from the plasma is the observation that
leptin concentrations in human cerebrospinal fluid directly correlate with plasma
concentrations [161]. Furthermore, leptin receptors are expressed by key hypothalamic
neurons involved in energy homeostasis [37, 114] and direct administration of leptin into
the CNS reduces food intake and body weight in a dose dependent manner [194].
Combined with data indicating leptin deficiency (ob/ob) and leptin receptor mutation
(db/db) result in severe genetic obesity, this information supports a role for leptin as an
adiposity signal.

8
Insulin
In addition to the glucoregulatory effects of the pancreatic hormone, insulin has
also been implicated in the hypothalamic control of energy homeostasis. Work
conducted in the late 1970s and early 1980s first demonstrated the existence of neural
circuits that respond to insulin and regulate food intake and adipose mass [202, 203].
Like leptin, the secretion of insulin is influenced by the total amount of fat stores as well
as by short-term changes in energy balance [7, 28, 144]. In addition, insulin shares
many of the characteristics of leptin, making it a candidate adiposity signal. Circulating
insulin concentrations are proportional to adiposity and insulin enters the CNS in
proportion to its plasma level [162] by a receptor mediated, saturable transport process
across brain capillary endothelial cells [18]. Insulin receptors are also expressed by the
same key hypothalamic neurons involved in energy homeostasis as leptin receptors [16].
In addition, central administration of insulin reduces food intake and body weight in a
dose dependent manner [202] whereas neuron-specific loss of insulin receptors results
in obesity [33].
The concept that insulin functions as a catabolic adiposity signal via regulation of
key hypothalamic neurons is not well appreciated. Much of the reason for this is that
insulin is primarily known as a prototypical anabolic hormone and for its glucoregulatory
role in peripheral tissues. However, that insulin exerts opposing actions in the CNS and
periphery is actually consistent with the concept of an endocrine negative feedback loop
in the regulation of adipose stores [132]. As with most physiological systems, when a
signaling pathway is “turned on”, a downstream signal is often generated that will “turn
off” the pathway. The same is true in insulin’s regulation of energy homeostasis. The
peripheral anabolic actions of insulin to regulate glucose uptake and promote energy
storage are balanced by the central catabolic actions of insulin to reduce energy stores

9
by decreasing food intake and increasing energy expenditure. Together these opposing
actions of insulin coordinately support an optimal body composition.
Central Nervous System
The hypothalamus contains numerous histologically distinct nuclei and has been
shown to be an important site in the regulation of energy homeostasis [201]. Rapid
progress has been made over the last several years in identifying hypothalamic neuron
populations that contain specific neurotransmitters, receptors, and other factors
important in the regulation of energy homeostasis. In particular, the arcuate nucleus of
the hypothalamus (ARC) is uniquely positioned to receive and respond to an array of
information pertaining to energy homeostasis. Located around the base of the third
ventricle, it lies immediately above the median eminence. Capillaries in the underlying
median eminence lack tight junctions and thus this region is thought to effectively lie
outside the blood–brain barrier [32] allowing the ARC neurons ready access to
information from both short-term and long-term signals of energy homeostasis. The
ARC contains both “anabolic” and “catabolic” neuron populations which interact with
each other and send projections to downstream neurons within the hypothalamus, the
forebrain, and the motor and autonomic areas of the brainstem to regulate energy
homeostasis either directly or via connections with other brain nuclei [23, 201]. Anabolic
pathways are defined herein as those that promote positive energy balance by
stimulating food intake and reducing energy expenditure. Conversely, catabolic
pathways are defined as those that promote negative energy balance by inhibiting food
intake and increasing energy expenditure.
Within the CNS, a variety of neuropeptides have been shown to either increase
or decrease food intake and also influence energy expenditure (reviewed in [124].
Neurons containing neuropeptide Y (NPY; [39, 103] and agouti-related protein (AgRP;

10
[108, 135, 173] in the ARC were identified as anabolic effectors and neurons containing
pro-opiomelanocortin (POMC; [201, 207] were identified as key catabolic effectors, both
of which are responsive to insulin and leptin.
Anabolic NPY/AgRP Neurons
Since its discovery in 1982 [181], neuropeptide Y (NPY) has been identified as a
major brain neuropeptide which is highly expressed in neurons of the hypothalamic
arcuate nucleus [122] and is involved in the regulation of energy homoeostasis. The
most well known effect of NPY, its ability to stimulate food intake, was first demonstrated
by injection of the peptide into the third ventricle of rodents [39, 103]. In accordance with
these observations, food-deprived rats show marked increases in NPY concentrations in
the ARC [19], which are paralleled by increases in hypothalamic NPY mRNA [29]. After
refeeding, increases in regional NPY concentrations and NPY release fall towards
normal [155]. Furthermore, injection of NPY into the third ventricle of rodents also
reduces energy expenditure [24]. This effect may be explained by a reduction in
sympathetic nerve activity that stimulates heat production in brown adipose tissue [56].
NPY also acts as an insulin secretagogue via the autonomic nervous system thereby
facilitating triglyceride deposition in peripheral tissues [209]. Together, these findings
support a role for NPY as an anabolic hormone in the central regulation of energy
homeostasis which causes a shift to positive energy expenditure.
However, studies in NPY knockout (-/-) mice suggest the presence of
compensatory pathways in the control of energy homeostasis since these animals
exhibit normal growth and a normal hyperphagic response to fasting [61]. One
candidate is agouti-related peptide (AgRP), a molecule which is co-expressed in most
NPY neurons in the ARC [201]. AgRP, like NPY, stimulates feeding when administered
centrally and [135] levels are elevated in the hypothalamus of fasted rats [104]. Thus,

11
AgRP also appears to mediate anabolic pathways in the regulation of energy
homeostasis.
In the brain, AgRP is synthesized exclusively in the ARC by neurons that project
to adjacent hypothalamic areas [124] and it is an endogenous antagonist of the
melanocortin 3/4 receptors in the catabolic pathway of energy homeostasis [201]. The
demonstration that AgRP mRNA is abundantly co-localized with NPY identifies
NPY/AgRP neurons as a unique subset that is capable of increasing food intake via two
different mechanisms: by increasing NPY signaling and decreasing the catabolic
melanocortin signaling pathway [72].
The primary physiological role of the anabolic NPY/AgRP neurons appears to be
to sense and respond to states of negative energy balance. Accordingly, neuronal
activity increases in these neurons following a critical fall in the body’s energy stores and
function to restore normal energy balance and body fat stores [201].
Catabolic POMC Neurons
A major effector of the catabolic pathway of energy homeostasis is pro-
opiomelanocortin expressing neurons (POMC) of the hypothalamus. The POMC gene is
expressed in the hypothalamic arcuate nucleus [207], and undergoes tissue-specific
post-translational processing [148]. In the hypothalamus POMC is processed to produce
α-melanocyte-stimulating hormone (α-MSH, [148]), which exerts a tonic inhibitory control
on food intake and energy storage through its actions in the CNS. In addition, recall that
the anabolic neuropeptide AgRP is an endogenous antagonist of melanocortin receptor
signaling and represents one of several sites of crosstalk which exist between these two
circuits. Thus, the integration of energy homeostatic signals is a complex and
interconnected process such that changes in one of the effector pathways can directly or
indirectly influence the opposing effector pathway.

12
The primary physiological role of POMC neurons appears to be to sense and
respond to states of positive energy balance. These neurons are activated in response
to both short- and long-term signals of nutrient excess. Overall, data indicate that
POMC neurons act homeostatically to restore normal energy balance and body fat
stores under conditions of energy surplus.
Hypothalamic Leptin Signaling and Action
In the ARC, both the anabolic NPY/AgRP and catabolic POMC neurons express
the long form of the leptin receptor and are responsive to changes in leptin [37, 114].
Although several splice variants of the leptin receptor exist, the “long form” of the
receptor (Ob-Rb) is critical to signal transduction [97] whereas the short form receptors
are thought to be involved in the transport across the blood-brain barrier [186].
Importantly, the long form of the receptor is highly expressed in the hypothalamus [60,
62, 115]. The leptin signaling pathway is briefly reviewed below (Figure 3).
The leptin receptor represents a typical class-I cytokine receptor and like other
class-I cytokine receptors, the leptin receptor has no intrinsic enzymatic activity [180].
Thus, propagation of downstream signaling requires the associated tyrosine kinase,
janus-activated kinase-2 (Jak2)[90]. Leptin binding stimulates the activation of Jak2 via
auto-phosphorylation of the kinase [5]. Once activated, Jak2 phosphorylates several
tyrosine residues on the intracellular tail of the leptin receptor promoting the recruitment
of downstream signaling proteins [8, 199]. The family of signal transducers and
activators of transcription (STATs) are latent transcription factors recruited to activate
cytokine receptor/Jak kinase complexes [158]. Leptin signaling via Jak2 leads to
activation of STAT3 [187]. Tyrosine phosphorylation of STAT molecules by Jak induces
dimerization, nuclear translocation, and transcriptional activation of these molecules
[158]. Activation of the leptin receptor leads to its own feedback inhibition of the
13
signaling pathway by inducing transcription of suppressor of cytokine signaling-3
(SOCS-3) in a STAT3-dependent manner [26]. In addition to the STAT3 dependent
effects of leptin, at least some of the hypothalamic effects of leptin appear to be
mediated by phosphoinositide-3 kinase (PI3K) signaling. The PI3K pathway is also
involved in the regulation of gene transcription and may potentially induce rapid non-
genomic events affecting neuronal activity and neuropeptide release.
The leptin response in ARC neurons is coordinately regulated to maintain energy
homeostasis via regulation of neuropeptide gene expression as well as neuronal activity
and neuropeptide release [69, 147]. For example, leptin inhibits the anabolic NPY/AgRP
neurons and suppresses expression of these orexigenic neuropeptides via both STAT3
dependent and independent mechanisms [17, 163]. Recall that NPY/AgRP neurons
tonically inhibit catabolic POMC neurons via synapses with these neurons in the ARC.
Thus, leptin induced hyperpolarization of NPY/AgRP neurons (i.e. inhibition), leads to a
reduction in neurotransmitter release and disinhibition of POMC neurons [58] resulting in
reduced food intake and increased energy expenditure. Conversely, decreased or
deficient leptin activity increases food intake and reduces energy expenditure by
activating anabolic NPY/AgRP neurons and inhibiting catabolic POMC neurons such that
production and release of orexigenic neuropeptides is increased and production and
release of anorexigenic neuropeptides is decreased [59]. In addition, leptin signaling
activates and depolarizes the catabolic POMC neurons leading to an increase in POMC
synthesis and neuropeptide release [48, 182] thereby resulting in reduced food intake
and increased energy expenditure [35, 112]. The effect of leptin to increase energy
expenditure appears to be mediated by an increase in sympathetic nervous system
activity [74]. Taken together, leptin induces a spectrum of responses that leads to
negative energy balance and reduced adiposity.

14
Figure 3. Neuronal Leptin Receptor Signaling Cascade
Leptin binding to ObRb leads to activation of the intracellular tyrosine kinase, Jak2, associated with the membrane-proximal regions of the receptor. Activated Jak2 then phosphorylates a number of cellular substrates including several tyrosine residues on the intracellular tail of the leptin receptor which recruits STAT3 to the receptor where it is phosphorylated by Jak2. Once phosphorylated, STAT3 molecules dimerize, translocate to the nucleus, and induce transcription of several target genes including SOCS-3. SOCS-3 expression leads to feedback inhibition of the leptin receptor signaling pathway. The PI3K pathway is also involved in the regulation of gene transcription and may potentially induce rapid non-genomic events affecting neuronal activity and neuropeptide release. Figure adapted from Bjorbaek et al. [25].
ObRb
pY
pY1138
Leptin
pY985pY1077pY
pY
Nucleus Transcription of target genes(including socs3 & neuropeptides)
pY
JAK2JAK2
SOCS3
Stat3
Stat3
IRS 1/2pY
PI3K
Neuronal activity
Neuropeptideexpression
?

15
Hypothalamic Insulin Signaling and Action
The signaling mechanism and the biological effects of insulin have primarily been
studied in classical insulin target tissues, such as skeletal muscle, fat, and liver, with
respect to glucose uptake, regulation of cell proliferation, gene expression and the
suppression of hepatic glucose production. However, insulin receptors are widely
expressed throughout the brain, including the POMC and the NPY/AgRP neurons within
the ARC [16], and recent work has focused on elucidating the signaling pathways and
mechanisms underlying the anorexigenic effects of insulin within the hypothalamus.
. The signaling pathway is similar in neuronal cells and is briefly reviewed here
(Figure 4, detailed review in [200]). Insulin action is mediated by the insulin receptor
(IR), a member of the family of tyrosine kinase receptors. Binding of insulin activates the
intrinsic tyrosine kinase activity of the receptor, leading to the autophosphorylation of
several tyrosine residues on the intracellular portion of the receptor. Insulin receptor
substrate (IRS) proteins are then recruited to the IR and activated by IR mediated
tyrosine phosphorylation. Following this phosphorylation step, IRS proteins activate
PI3K, which consists of a p85 regulatory subunit and a p110 catalytic domain.
Interaction between the p85 subunit and activated IRS molecule activates the p110
domain of PI3K, which catalyzes the phosphorylation of membrane bound
phosphatidylinositol (4,5)-bisphosphate (PIP2) to phosphatidylinositol (3,4,5)-
trisphosphate (PIP3). PIP3 functions as an active signal transduction factor leading to
the activation of several downstream signaling molecules including 3-phosphoinositide-
dependent kinase-1 (PDK1). PDK1 is a serine/threonine kinase, which in turn activates
protein kinase B (PKB, also called Akt). Activation of PKB mediates multiple
downstream effects of insulin signaling including the phosphorylation and exclusion of
the transcription factor FoxO1 from the nucleus thereby regulating neuropeptide gene

16
expression. For example, a recent study indicates that activation of FoxO1 promotes
opposite patterns of coactivator-corepressor exchange at the AgRP and POMC
promoters such that AgRP gene expression is activated and POMC gene expression is
inhibited [89].
As with leptin, the energy homeostatic effects of insulin in the CNS are mediated
by neuropeptide gene expression as well as neuronal activity and neuropeptide release.
The anabolic NPY/AgRP neurons are inhibited by insulin and this inhibition is thought to
mediate some of the anorectic actions of insulin [160]. For example, insulin was found
to reduce the firing rate, and thus release of neuropeptide Y, in a population of
NPY/AgRP neurons [175]. The effect of insulin to inhibit these neurons is dependent on
signaling via PI3K and the opening of ATP-sensitive K+ channels [175]. In addition,
central administration of insulin reduces the expression of the orexigenic NPY gene in
the ARC [160, 172]. Conversely, the catabolic POMC neurons are activated by insulin
resulting in an increase in POMC gene expression and release of the anorexigenic
peptide, α-MSH [20]. Upregulation of α-MSH appears to mediate at least some of the
anorexigenic effects of insulin since administration of a melanocortin antagonist prevents
the observed insulin-induced reduction in food intake [20]. However, central insulin
administration reduces weight to a greater extent than can be accounted for by reduced
caloric intake alone [204] suggesting a role for insulin in the regulation of energy
expenditure. Thus insulin, like leptin, induces a spectrum of responses that lead to the
loss of body fat stores.
Together, insulin and leptin interact with neural circuits within the CNS that exert
potent unidirectional effects on energy balance. These neural circuits include those that
stimulate food intake and reduce energy expenditure to promote weight gain (anabolic
pathways) and those that reduce food intake and increase energy expenditure to
promote weight loss (catabolic pathways). In response to increases in adiposity, and

17
Figure 4. Neuronal Insulin Receptor Signaling Cascade
Binding of insulin to the extracellular α-subunits of the insulin receptor induces a conformational change thereby activating the tyrosine kinase activity of the β-subunits resulting in receptor auto-phosphorylation and subsequent phosphorylation of intracellular IRS proteins. PI3K is recruited to phosphorylated IRS proteins leading to activation of the p110 catalytic subunit of PI3K which mediates the conversion of PIP2 to PIP3 thereby initiating downstream signaling via serine/threonine kinases (i.e. PDK and PKB). These signals result in the diverse biological effects of insulin signaling in the CNS including regulation of gene transcription by FOXO proteins. Like leptin, insulin activation of PI3K in hypothalamic neurons and appears to alter neuronal activity and neuropeptide release. Figure adapted from Plum et al.. [141].
IR
IRS 1/2
pYpY
pYpY PIP2
PIP3
PI3K
PDK1/PDK2
PKB
GSK3β
FOXOProtein synthesis/neuronal survival
Gene transcription(e.g. neuropeptides)
Insulin
Neuronal activity
β‐subunit
α‐subunit
p85 p110

18
elevated levels of insulin and leptin act within the CNS to inhibit anabolic pathways
stimulate catabolic pathways. Conversely, in response to decreases in adiposity,
reduced levels of insulin and leptin act within the CNS to “activate” anabolic pathways
(i.e. remove inhibition) and “inhibit” catabolic pathways (i.e. reduce activation). This
coordinated regulation promotes the stability of body fat stores over time.
Integrated Regulation of Energy Homeostasis
The “lipostatic model” of energy homeostasis linking food intake to the amount of
energy stored as fat mass in the body as originally articulated by Kennedy [85],
postulated that signals proportional to the size of fat stores become integrated with
“other” regulators of food intake (i.e. short-term signals). These short-term regulators of
food intake can include extrinsic signals, such as social factors and the environment, as
well as intrinsic signals including those generated in proportion to fat mass (i.e. the
aforementioned adiposity signals) and those generated in response to the consumption
of food [204]. The long-term maintenance of body weight and fat mass is determined by
the short-term regulation of food intake and energy expenditure on a day to day basis
and from meal to meal such that sustained changes in these two factors, over time, will
lead to collective long-term effects on body weight and fat mass. Therefore, it is
important to understand the relationship between the short- and long-term regulation of
food intake and energy expenditure.
Short-term Signals
The ability of short-term signals to impact meal size and number appears to be
modulated, either directly or indirectly, by the size of the adipose mass and hence the
adiposity signals insulin and leptin [123, 204]. The adiposity signals act as long-term
signals to suppress food intake by interacting with the short-term meal-related signals. It
19
is through this interaction between long-term adiposity signals and short-term meal-
related signals that the control of food intake is integrated into the homeostasis of fat
stores. Overall, energy homeostasis maintains fat mass stores over time through daily
regulation of meal size and meal number [86] in the setting of long-term regulation.
The existence of meal-generated signals, including satiety factors, was first
documented in the early 1970s when it was found that administration of the gut peptide
cholecystokinin (CCK) to rats prior to food administration caused a dose-dependent
decrease in meal size [66]. Since then, satiety factors have been extensively studied.
Satiety factors are generated in response to the detection, processing, and absorption of
food; accumulate during food consumption; contribute to meal termination; and thereby
determine meal size [204]. In addition, there is evidence of an association between
meal size and the interval to subsequent meal initiation [96] suggesting that factors
determining meal initiation are coupled to those terminating the meal.
Several key features of satiety factors have been identified and are summarized
briefly (reviewed in [204]). First, when administered exogenously, satiety factors reduce
meal size. Second, blocking the action of endogenous satiety factors with specific
antagonists increases meal size. Third, satiety factors can synergistically influence meal
size by combining with other satiety factors. Fourth, at doses that elicit modest
reductions of meal size, satiety factors do not induce nausea or distress in animals.
Fifth, satiety factors signal to the brain via afferent nerves as well as via receptors within
the brain. Finally, the repeated administration of satiety factors does not alter body
weight despite effects on meal size. For example, while the repeated administration of
CCK to rats at the onset of every meal effectively reduces the size of each meal, there is
a compensatory increase in the number of meals initiated such that cumulative food
intake remains the same and energy balance is maintained [196]. Thus, although satiety

20
factors can potently affect food intake over the course of individual meals, they have
limited influence on long-term adiposity by themselves.
As satiety factors signal meal termination, a complimentary signal exists that can
initiate meal consumption. The first peripheral orexigenic hormone, ghrelin, was
identified as a twenty-eight-amino acid peptide produced mainly in the stomach [67].
The secretion of ghrelin depends largely on nutritional state with circulating ghrelin levels
increasing prior to and decreasing shortly after a meal [91] indicating a potential role for
this hormone in meal initiation and satiety. Accordingly, the preprandial increase in
ghrelin levels correlate with hunger scores in healthy humans and initiate meals in the
absence of time and food-related cues [50]. Ghrelin enhances food intake by increasing
the number of meals without altering meal size [83]. The appetite inducing effects of
ghrelin are proposed to occur via three different pathways [92]. First, ghrelin released
into the bloodstream from the stomach may cross the blood-brain barrier and bind to its
receptors in the hypothalamus. Second, ghrelin may reach the brain through vagal
afferents to the hindbrain. Third, ghrelin produced locally in the hypothalamus may
directly affect the various hypothalamic nuclei. At the level of the hypothalamus, ghrelin
stimulates the activity of NPY/AgRP expressing neurons and has an inhibitory effect on
POMC neurons [91]. Peripherally, ghrelin stimulates gastrointestinal motility, gastric
acid secretion, and pancreatic exocrine secretion [49] and also has an effect on immune
cell activation and inflammation [91].
Whole-body Physiology
Energy homeostasis is a complex process involving integrated whole-body
physiology. Although studies have shown the arcuate nucleus of the hypothalamus to
be an important site in the regulation of energy homeostasis by the adiposity signals
insulin and leptin, the integration of homeostatic signals involves multiple brain areas

21
and peripheral tissues [201]. Additional interoceptive information reaches ARC neurons
via abundant intra- and extra- hypothalamic connections. Neural inputs to the ARC from
regions in the forebrain carry information pertaining to sensory perception, reward
expectancies, learned associations, and other emotional needs and behaviors [201]. In
the brainstem, the nucleus of the solitary tract (NTS), area postrema, and dorsal motor
nucleus of the vagus have all also been implicated in the regulation of energy
homeostasis [127]. For example, information from satiety factors generated in the
gastrointestinal tract is conveyed to the NTS, located in the brainstem, via afferent
nerves as well as via receptors within the brain itself [174, 183]. Information then passes
anteriorly through the brainstem to the hypothalamus and other forebrain areas where
there are extensive reciprocal connections between the hypothalamus and the
brainstem. Energy intake is coordinated on the basis of information received by both
regions [163] [45, 54].
In addition to its role in regulating food intake, the hypothalamus also regulates
energy storage and expenditure in part through its connections to the autonomic nervous
system. The parasympathetic nervous system, through the vagus nerve, promotes
energy storage, whereas sympathetic nervous system (SNS) activation increases
energy expenditure. The parasympathetic system transmits signals via projections from
the hypothalamus to the dorsal motor nucleus of the vagus, which in turn innervates the
viscera, including the pancreatic β-cell [80]. Vagal modulation of β-cell function
promotes a stoichiometrically excessive insulin hypersecretion in response to a fixed
glucose load thereby increasing lipogenesis [80]. Conversely, hormonal, nutrient, and
environmental changes modify the activity of projections from other key nuclei of the
hypothalamus which lead to SNS activation. SNS activation tends to mobilize energy
stores by the following mechanisms: (1) increased circulating catecholamines stimulate
glucagon secretion, which antagonizes insulin’s effects and indirectly inhibits insulin

22
secretion; (2) thyroid mediated increase in energy expenditure; (3) increased blood flow
and oxygen consumption in skeletal muscle; and (4) increased thermogenesis and
lipolysis via activation of β3-adrenergic receptors in adipose tissue [80].
Although functions as complex as feeding behavior and energy metabolism are
undoubtedly controlled by many peptide and non-peptide neurotransmitters interacting at
different levels, the coordinated regulation of these opposing pathways via the adiposity
signals, insulin and leptin, is central to the maintenance of long-term energy
homeostasis mediated by primary neurons located in the ARC. Figure 5 illustrates the
integration of peripheral signals to the central nervous system, the reciprocal pathways
between regions of the hypothalamus and the hindbrain, and the coordinated response
back to the periphery to regulate adipose mass and complete the feedback loop.
Obesity: Disrupted Energy Homeostasis
Despite the evidence supporting a role for the hypothalamus in the regulation of
energy homeostasis, the prevalence of obesity in the United States is increasing at an
alarming rate. While the mechanisms involved in the development of obesity remain to
be fully elucidated, the obese state has been well studied and characterized. It is well
known that obesity is characterized by peripheral insulin resistance, but what is less well
appreciated is that obesity seems to be characterized by hypothalamic resistance to the
adiposity signals, insulin and leptin. Obese individuals have markedly increased serum
insulin [7] and leptin [46] levels, reflecting an increase in body adipose mass, yet food
intake and energy expenditure are not appropriately regulated as would be predicted
based on the homeostatic feedback loop described. This suggests that the homeostatic
effects of insulin and leptin are impaired at the level of the CNS, indicative of
hypothalamic resistance. Generally speaking, obesity represents a state of positive
energy balance (weight gain) in which energy intake exceeds energy expenditure and

23
Figure 5. Integration of Central and Peripheral Signals in the Regulation of Energy Homeostasis Hormonal, nutrient, and environmental cues provide information to the hypothalamus and hindbrain regarding short-term energy metabolism and long-term energy stores. The hypothalamus elicits anorexigenic (green arrows) and orexigenic (red arrows) signals to the paraventricular nucleus (PVN) and lateral hypothalamic area (LHA) which leads to efferent outputs from the hindbrain to promote energy storage via activation of the parasympathetic nervous system (vagus nerve) or promote energy expenditure via activation of the sympathetic nervous system. Figure adapted from Isganaitis et al.. [80].
PVN LHA
ARC hindbrain
Adiposity signals
Satiety signals
adipose
GI tract
pancreas
Insulin
Leptin
CCK
muscle
Ghrelin
SNS

24
the effects of the adiposity signals insulin and leptin fail to appropriately reduce adipose
stores via regulation of the hypothalamic circuits controlling food intake and energy
expenditure.
Leptin resistance
A number of potential mechanisms have been postulated to underlie central
leptin resistance in obesity including defects in leptin transport across the blood-brain
barrier, leptin receptor signaling, as well as downstream neurons and signaling
molecules that mediate the effects of leptin. Except for leptin-deficient obese mice, most
obese mammals have elevated plasma concentrations of leptin [46], yet they exhibit
inappropriate levels of food intake and energy expenditure for the given level of leptin
[64]. The observation that leptin administered directly into the brain is more potent at
curbing appetite in obese mice than peripherally administered leptin has led to
speculation that leptin resistance is due to limited availability of the hormone in the CNS
[188]. Low CSF leptin levels have been documented in several rodent models of obesity
including high-fat feeding and evidence indicates leptin transport is decreased in obesity
[10]. However, resistance to the food lowering effects of centrally administered leptin is
also observed in genetically obese and HF fed, obese rodents [51, 105], unpublished
observations). Thus, inadequate transport does not fully explain the CNS leptin
resistance seen in obesity, but appears to be a contributing factor. In addition, the ability
of leptin to activate the downstream signaling molecule, STAT3, in hypothalamic
neurons is reduced when mice are fed a high-fat diet [57] suggesting a defect in leptin
signaling. These data suggest that dietary fat may be involved in multiple sites of
hypothalamic leptin resistance from delivery to downstream signaling events by currently
unknown mechanisms.

25
Insulin resistance
Similar mechanisms have been postulated to underlie hypothalamic insulin
resistance in obesity. Like leptin, most obese mammals have elevated plasma
concentrations of insulin [7, 46] yet exhibit inappropriate levels of food intake and energy
expenditure for the level of insulin [64, 204]. Uptake of insulin from the plasma to the
brain appears to be reduced in obese Zucker rats [178] and high-fat fed dogs [82],
suggesting that insulin transport is a site of resistance. However, previous work from our
laboratory has demonstrated resistance to the food lowering effects of insulin
administered directly into the brain in rats fed a high-fat diet [146]. Therefore inadequate
transport does not fully explain the CNS insulin resistance seen in obesity. Inactivation
of insulin signaling via serine phosphorylation of IRS proteins is a common feature of
peripheral insulin resistance [211] that is also implicated in the hypothalamus of high-fat
fed rats [52]. In addition, studies have shown that activation of PI3K in hypothalamic
neurons is required for the ability of centrally administered insulin to reduce food intake
and hyperpolarize NPY/AgRP neurons [133, 175]. Thus, impaired signal transduction is
another potential mechanism of central insulin resistance in high-fat diet-induced
obesity.
Although high-fat diet-induced obesity is characterized by hypothalamic insulin
and leptin resistance, the mechanisms involved remain to be fully elucidated. Of note
are the similarities between hypothalamic and peripheral insulin signaling as well as the
importance of PI3K signaling in both hypothalamic insulin and leptin function. Thus, it
seems reasonable that the mechanism of hypothalamic insulin and leptin resistance may
be analogous to those involved in peripheral insulin resistance and obesity. Since
insulin resistance has been extensively studied in peripheral tissues, findings from these
studies may shed light on the mechanisms of resistance present in the CNS. Here,
several mechanisms are explored that have been identified in the development of high-

26
fat diet-induced obesity and peripheral insulin resistance and may also be relevant in the
development of hypothalamic insulin and leptin resistance.
Potential Mechanisms Involved in High-Fat Diet-Induced-Obesity
Dietary Fat
Many factors are implicated in the development of obesity including dietary
components such as fat and fructose, reduced physical activity, genetic susceptibility,
stress, as well as a variety of other factors [30, 195]. Laboratory experiments in animals
and clinical studies in humans have repeatedly shown that diet, particularly dietary fat
and energy intake are strongly and positively associated with body weight gain [152,
197]. Evidence from cross-sectional and longitudinal epidemiological studies indicates
that a high-fat diet is an independent risk factor for increased adiposity and obesity [6]
such that there is a direct relationship between dietary fat content and the degree of
obesity from which a dose-response curve can be constructed [31, 70]. Furthermore,
the type of fatty acids in the diet as well as the efficiency of fatty acid metabolism is
reflected in both the plasma and body tissues and has profound effects on physiological
and pathophysiological processes in the body [130, 189, 190]. For example, the fatty
acid composition of the body is known to affect membrane properties, gene expression,
metabolic signaling, as well as energy expenditure [190]. These effects appear to be
modulated by fatty acid chain length, degree of fatty acid saturation, and background
diet [190]. The obesigenic properties and cellular effects of dietary fatty acids could
indicate of a role for these molecules in the development of hypothalamic insulin and
leptin resistance.
Essential for a role of dietary fat in the development of hypothalamic insulin and
leptin resistance is that fatty acid transport into the brain is an essential process

27
supplying fatty acids that are not locally synthesized and which are important signaling
molecules and components of the phospholipid membrane [73]. In addition, common
dietary fatty acids including palmitic acid also rapidly enter the brain and are primarily
derived from FA-albumin complexes and to a lesser extent from circulating lipoproteins
[176]. A current model of transport proposes that fatty acids cross the blood brain
barrier mainly via passive diffusion or potentially with the aid of intracellular fatty acid
binding proteins [73]. Acyl CoA synthetases then trap the fatty acids in the cell by
forming acyl CoA molecules. The metabolic fate of these molecules depends upon the
cellular needs and the specific fatty acid. In the brain, fatty acids function as structural
components of the cell, are thought to be oxidized for energy, and can potentially act as
signaling molecules [117].
Toll-Like Receptor 4
One recent target of fatty acid signaling that has been implicated in high-fat diet-
induced obesity is toll-like receptor 4. The toll-like receptors (TLRs) are receptors
expressed by cells of the innate immune system involved in the expression of
proinflammatory cytokines [4, 81]. TLRs are stimulated by structural motifs known as
pathogen-associated molecular patterns, or PAMPs, including lipopolysaccharide (LPS)
[4]. Studies in mice known to have a defective LPS response later identified TLR4 as
the specific “LPS receptor” [145]. LPS consists of three parts: lipid A, a core
oligosaccharide, and an O side chain [149]. The lipid A moiety of LPS is noteworthy in
that it is acylated with saturated fatty acids. Furthermore, removal of these acylated
saturated fatty acids results in complete loss of LPS activity and induces an antagonistic
effect on native lipid A [125, 143]. These results suggest that acylated fatty acids play a
critical role in ligand recognition and receptor activation of TLR4. Additional studies
have since demonstrated that saturated fatty acids, independently of LPS, induce TLR4

28
activity and downstream inflammatory markers whereas unsaturated fatty acids inhibit
activation of TLR4 signaling pathways [98, 99].
The expression of TLR4 has been reported in most tissues of the body, including
insulin-sensitive tissues [131] making TLR4 an intriguing target of fatty acid induced
insulin resistance. Consequently, the role of TLR4 in high fat diet-induced obesity and
insulin resistance has been studied in several models of TLR4 deficiency and in various
peripheral tissues. For example, Shi et al. [165] showed that high-fat feeding activated
TLR4 signaling and inflammatory markers in adipocytes and macrophages, but that this
effect was blunted in mice lacking TLR4. Furthermore, TLR4 deficient mice were
significantly protected from the ability of systemic lipid infusion to 1) suppress muscle
insulin signaling and 2) reduce insulin mediated changes in systemic glucose
metabolism [165]. Furthermore, mice with a loss-of-function mutation in TLR4 exhibit
improved insulin sensitivity and enhanced insulin-signaling capacity in adipose tissue,
muscle, and liver compared to control mice during high-fat feeding [184]. Additional
studies in these mice demonstrated reduced liver triglyceride content and reduced
expression of lipogenic and fibrotic markers with high-fat feeding compared to wild-type
controls, indicative of improved hepatic function [142]. Together, these data support a
link between TLR4 and high-fat diet-induced insulin resistance.
Elucidation of the TLR4 signaling pathway has revealed potential molecular
mechanisms of fatty acid induced insulin resistance. Briefly, ligand binding induces
oligomerization of the receptor and recruits downstream adaptor proteins. There are five
adaptor proteins including myeloid differentiation primary response gene 88 (MyD88)
[134]. TLR4 signaling has been divided into MyD88-dependent and MyD88-independent
pathways. From studies using MyD88-deficient macrophages, the MyD88 dependent
pathways were shown to be responsible for pro-inflammatory cytokine expression. Upon
stimulation, MyD88 recruits and activates downstream signaling molecules resulting in

29
activation of the IκB kinase (IKK) complex which phosphorylates inhibitor of kappa B
(IκB) proteins. This phosphorylation leads to the degradation of IκB proteins and the
subsequent translocation of the transcription factor NFκB, which controls the expression
of proinflammatory cytokines [109]. Together, this data suggests TLR4 is a link between
fatty acid signaling and inflammatory signaling pathways that have been implicated in
peripheral insulin resistance (Inflammation as a mediator of insulin resistance will be
discussed in detail below).
Phosphoinositide-3 kinase (PI3K) has been implicated in TLR4 signaling
pathways and is an important component of hypothalamic insulin and leptin signaling.
LPS, a TLR4 agonist, is known to activate PI3K and phosphorylation of PKB/Akt in cells
[121, 156]. PKB/Akt further phosphorylates its downstream signaling molecules and has
been shown to induce p65 phosphorylation resulting in enhanced NFκB transactivation
[111]. Additional studies have been performed to clearly delineate the relationship
between fatty acid-induced TLR4 activity and PI3K signaling. Through a series of
experiments utilizing inhibitors and dominant negative mutations of proteins in the TLR4
signaling pathway, Lee et al. determined that saturated fatty acid induced NFκB
activation and inflammatory gene expression was mediated at least in part by TLR4
signaling involving MyD88 and PI3K pathways [100]. These studies also established
that saturated and polyunsaturated fatty acids reciprocally modulate the TLR4 signaling
pathways. Saturated fatty acids induced TLR4 activation, phosphorylation of PKB/Akt,
and NFκB activation, whereas unsaturated fatty acids inhibited TLR4 activity,
phosphorylation of PKB/Akt, and NFκB activation ([100], Figure 6). This data links fatty
acids with components of the insulin and leptin signaling pathways (via PI3K) as well as
inflammatory signaling pathways.
In addition to TLR4 expression in most peripheral tissues, mRNA expression has
also been detected in the brain of humans [131]. Of all the TLR members, TLR4

30
Figure 6. Reciprocal Modulation of Toll-like Receptor 4 Signaling Cascade
Ligand binding induces oligomerization of the receptor and recruits downstream adaptor proteins and signaling cascades divided into MyD88-dependent and MyD88-independent pathways. Shown here is a MyD88-dependent signaling cascade that results in activation of the IKK-IκBα-NFκB pathway. Activation of IKKβ results in phosphorylation and targeted degradation of IκBα, thereby permitting translocation of the transcription factor NFκB to the nucleus where it controls the expression of proinflammatory cytokine target genes. NFκB activation and inflammatory gene expression is also mediated, at least in part, by TLR4 signaling involving PI3K-PKB signaling. In addition, TLR4 signaling activity is reciprocally modulated by saturated and unsaturated fatty acids such that saturated fatty acids induce activation of TLR4, PKB, and NFκB, whereas unsaturated fatty acids inhibit activity of these molecules. Figure adapted from Lee et al. [100].
TIRAP
Saturated fatty acids
TLR4 Unsaturated fatty acids
MYD88IRAK
IKKβ
MD‐2
PI3K
PKB
IκBα
NFκB
P
P
Nucleus NFκBP
Transcription of target genes
P

31
showed the highest expression in brain, liver, and skeletal muscle [131]. In rodents,
TLR4 expression has also been documented in the CNS [95] with a low to moderate
level of basal expression observed in the median eminence and several adjacent brain
regions including the ARC and other hypothalamic nuclei involved in energy
homeostasis [34]. Following a single injection of intravenous LPS (40ug/kg), TLR4 gene
expression within the ARC of Sprague-Dawley rats was significantly increased at 15min
but was quickly restored to basal levels by 30 min and down-regulated by 90 min [34].
Although levels were low under basal conditions, the constitutive expression of TLR4 in
these different brain regions as well as the response observed to LPS in the ARC,
suggests a potential role of TLR4 signaling in the hypothalamus. Activation of TLR4 by
dietary fatty acids could induce hypothalamic insulin (and leptin) resistance as observed
in peripheral tissues. Furthermore, hypothalamic insulin (and leptin) resistance could
potentially be mediated by the proinflammatory effects of TLR4.
Inflammatory IKKβ Signaling
Compelling evidence linking inflammation to insulin resistance derives from both
epidemiological studies and experimental data in humans and animal models.
Epidemiological data suggest that subclinical inflammation may represent an additional
novel risk factor in the development of obesity and T2DM [55, 159]. As such, obesity is
marked by a broad inflammatory response. The first molecular link between obesity and
inflammation was discovered by Hotamisligil et al. in 1993 [78] in work demonstrating the
inflammatory cytokine tumor necrosis factor α (TNFα) is constitutively expressed in
adipose tissue and over-expressed in rodent models of obesity. Conversely, body
weight reduction in obese individuals is associated with a reduction in both TNFα
expression and improved insulin sensitivity [77]. Furthermore, in support of a direct role
for inflammation in the development of insulin resistance, in vivo inhibition of TNFα in

32
obese rats significantly improved insulin sensitivity [78]. Since these initial findings, the
IKK/NFκB pathway has been implicated in the development of insulin resistance at the
cellular level and can be activated by several proinflammatory receptors [167] including
TLR4. These data provide convincing support for inflammation as a contributor to insulin
resistance, and provide insights into the underlying molecular pathways.
Inhibition of the IKKβ pathway (the catalytic subunit of the IKK complex) with high
doses of salicylates was originally used to lower blood glucose in diabetic patients [13,
151]. Although no longer used to treat diabetes, this effect of IKKβ inhibition to reduce
glucose levels led to studies investigating the relationship between IKKβ and insulin
sensitivity. Yuan et al. [208] reported that activation or over-expression of IKKβ
attenuated insulin signaling in cultured cells, whereas inhibition of IKKβ reversed insulin
resistance. Furthermore, heterozygous deletion of IKKβ protected mice against the
development of high-fat diet-induced insulin resistance [208]. These findings further
support the role of inflammation in the pathogenesis of high-fat diet-induced insulin
resistance, specifically via IKKβ signaling. The molecular mechanism of IKKβ induced
insulin resistance may involve both direct and indirect effects on the insulin signaling
pathway to induce resistance. As described previously, IKKβ induces transcriptional
activity via activation of the transcription factor NFκB. Several proinflammatory
cytokines are direct target genes of NFκB, including TNFα and Interluekin 6 (IL-6), both
of which are known inducers of insulin resistance [87]. In addition, evidence indicates a
direct effect of IKKβ on the insulin signaling pathways via its function as a
serine/threonine kinase. Serine phosphorylation of the insulin receptor and IRS proteins
by IKKβ reduces tyrosine phosphorylation and activity of these molecules thereby
preventing the association and activation of PI3K and downstream effects [211]. It
seems plausible that similar mechanisms may also be involved in the development of
hypothalamic insulin and leptin resistance.

33
Pathogenesis of High-Fat Diet-Induced-Obesity.
High-fat fed, insulin resistant animal models of obesity are characterized by
increased activation of IKKβ in peripheral tissues [168]. A significant amount of research
has focused on establishing cause versus consequence in this relationship between
dietary fat, inflammation, and insulin resistance in peripheral tissues. Studies have
demonstrated that infusion of FFAs induces peripheral insulin resistance [40] and that
FFA infusion activates PKCθ [71], a known activator or IKKβ [106], whereas inhibition of
IKKβ suppresses FFA-induced insulin resistance [88]. Furthermore, studies have shown
an even stronger relationship between the accumulation of intracellular fatty acids and
insulin resistance [93, 139, 140]. One model to explain this relationship suggests that
increases in plasma free fatty acids with high-fat feeding leads to the accumulation of
intracellular fatty acid metabolites, such as fatty acyl CoAs, diacylglycerol, and/or
ceramides. Accumulation of these molecules can then activate an inflammatory
signaling cascade involving IKKβ, which leads to serine phosphorylation of IRS proteins
and downregulation of the insulin signaling pathway [169]. In addition, it seems
plausible that activation of IKKβ through the TLR4 signaling pathway could also
contribute to insulin resistance via a similar mechanism (Figure 7).
Although the model of fatty acid induced insulin resistance was originally
described in peripheral tissues, a similar mechanism may also be involved in the
development of hypothalamic insulin (and leptin) resistance. In support of this
hypothesis, De Souza et al. demonstrated that the consumption of a fat-rich diet induces
the expression of several pro-inflammatory cytokines and inflammatory responsive
proteins in the hypothalamus which was associated with reduced insulin signaling and
increased serine phosphorylation of IR and IRS-2 compared to chow controls [52]. In
addition, previous work from our laboratory has demonstrated that high-fat fed obese
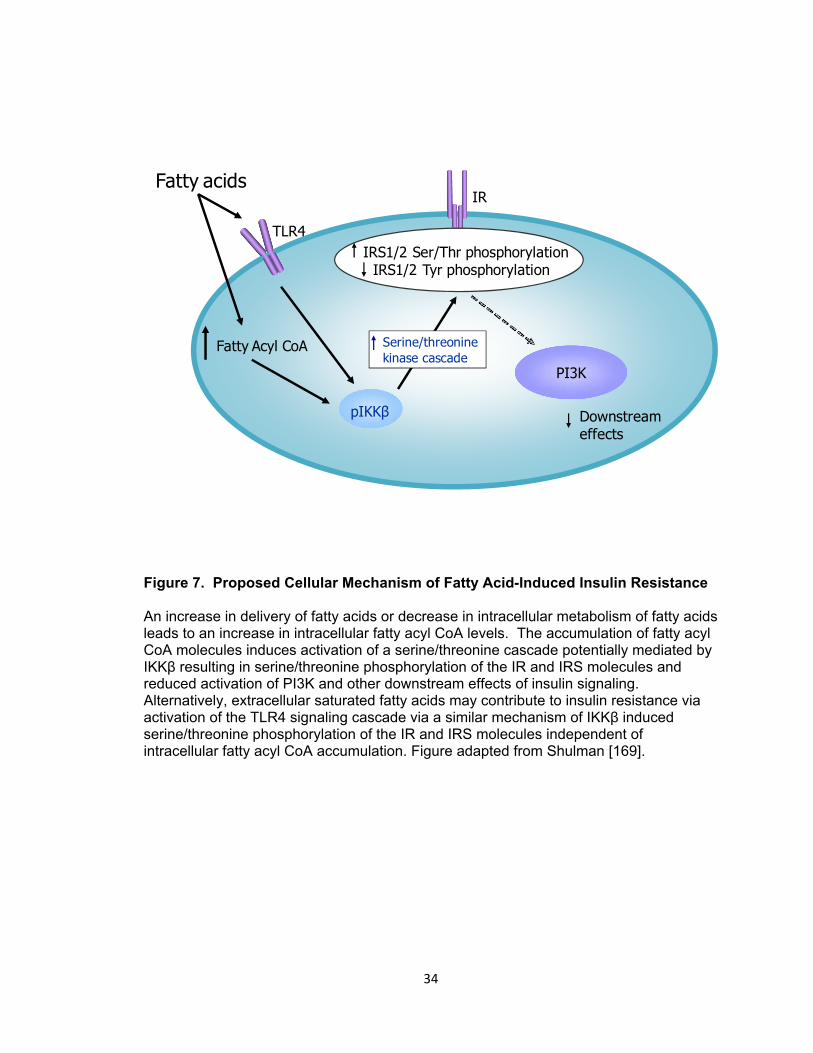
34
Figure 7. Proposed Cellular Mechanism of Fatty Acid-Induced Insulin Resistance
An increase in delivery of fatty acids or decrease in intracellular metabolism of fatty acids leads to an increase in intracellular fatty acyl CoA levels. The accumulation of fatty acyl CoA molecules induces activation of a serine/threonine cascade potentially mediated by IKKβ resulting in serine/threonine phosphorylation of the IR and IRS molecules and reduced activation of PI3K and other downstream effects of insulin signaling. Alternatively, extracellular saturated fatty acids may contribute to insulin resistance via activation of the TLR4 signaling cascade via a similar mechanism of IKKβ induced serine/threonine phosphorylation of the IR and IRS molecules independent of intracellular fatty acyl CoA accumulation. Figure adapted from Shulman [169].
Fatty acids
Fatty Acyl CoA
pIKKβ
IRS1/2 Ser/Thr phosphorylationIRS1/2 Tyr phosphorylation
PI3K
Downstream effects
IR
TLR4
Serine/threoninekinase cascade

35
rats, characterized by hypothalamic insulin and leptin resistance, have increased
accumulation of saturated long-chain CoA molecules and increased hypothalamic IKKβ
activity compared to low-fat fed controls ([146], Figure 8). These findings establish an
important association between consumption of a HF diet, inflammation, and insulin and
leptin resistance within key hypothalamic regions involved in the control of energy
homeostasis. Based on the current model of central nervous system control of energy
homeostasis described, resistance to the effects of insulin and leptin to maintain adipose
stores via regulation of hypothalamic circuits regulating food intake and energy
expenditure would result in positive energy balance and obesity. Thus, I hypothesize
that establishing cause versus consequence of central LC-CoA accumulation and IKKβ
activity in the development of hypothalamic insulin and leptin resistance will be crucial in
delineating the pathogenesis of high-fat diet-induced obesity.
Overview of Aims
In this body of work, I sought to elucidate the mechanisms involved in the
development of high-fat diet-induced hypothalamic insulin and leptin resistance and how
this may contribute to the onset of obesity. My overall hypothesis is that dietary fat
per se and not excess caloric intake contributes, either directly or indirectly, to the
development of hypothalamic insulin and leptin resistance resulting in impaired
regulation of body fat and the development of obesity.
The degree of fatty acid saturation, location of unsaturated bonds, and fatty acid
chain length, have all been shown to influence insulin sensitivity. The ability of fatty
acids to modulate these various physiological processes in a chain length and saturation
dependent manner suggests that fatty acids possess intrinsic obesogenic properties.
Thus, as described in Chapter III, I investigate the potential of dietary fats with varying
degrees of saturation to induce obesity and insulin resistance in free-feeding rats.

36
Figure 8. Hypothalamic LC-CoA Accumulation and IKKβ Activity in Obese, HF Fed Rats. Effect of DIO on hypothalamic long-chain fatty acyl-CoA content and inflammatory signaling. Hypothalamic content of palmitoyl-, stearoyl-, and oleoyl-CoA (A) and IKKβ phosphorylation (B) in low- and high-fat fed rats. Error bars represent the standard error of the mean (SEM). Student’s t-test was used to determine significance for comparisons between diet groups. * p<0.05, ** p<0.01.
0.0
0.5
1.0
1.5**
LF HFpI
KKβ
(rela
tive
dens
ity)
C16:0 C18:0 C18:10
10
20
30
LFHF
* *
rela
tive
LCC
oAco
nten
t/g ti
ssue
A B

37
However, it is well established that exposure to a high fat diet induces a characteristic
hyperphagic response in animal models of diet-induced obesity. This observation raises
the question of whether dietary fat simply represents a more calorically dense food
source. Therefore I also utilize a pair-feeding paradigm (i.e. caloric restriction of the HF
diet to the level of caloric intake of LF free-feeding animals) to delineate the obesogenic
effects of dietary fats from the increase in caloric intake observed with high-fat feeding.
In Chapter IV, I directly assess the effects of two structurally distinct fatty acids
that are major components of a common dietary fat (lard) on the hypothalamus. I sought
to determine whether exposure of the hypothalamus to excess saturated, but not
unsaturated fat leads to hypothalamic accumulation of LC-CoAs that trigger
inflammatory signaling (elevated IKKβ activity) and blunt insulin signaling in lean chow
fed rats given an acute icv infusion of the saturated fat palmitate or the monounsaturated
fat oleate.
The effect of the structural characteristics of dietary fatty acids on cellular
function, in this case insulin sensitivity, may be explained by a receptor-ligand like
interaction between specific fatty acids and “fat sensing” molecules. Although several
molecules are known to respond to fatty acids, we have identified Toll-like receptor 4
(TLR4) as a potential target of high-fat diet-induced hypothalamic resistance and
impaired body fat mass regulation. TLR4 signaling is activated by saturated fatty acids,
whereas unsaturated fatty acids inhibit saturated fatty acid-induced activation of TLR4
signaling [99]. In Chapter V, I investigate the effect of TLR4 deficiency on high-fat diet-
induced obesity and hypothalamic insulin resistance.
Current models of energy homeostasis clearly implicate hypothalamic insulin and
leptin signaling in the regulation of adipose stores. Accordingly, these signaling
pathways are thought to be disrupted in order for obesity to develop. In Chapter VI, I
examine the onset of high-fat diet-induced obesity to determine whether the initial onset

38
of hypothalamic insulin and leptin resistance in high-fat fed rats share a common time-
course and mechanism of development. If these changes in hypothalamic insulin and
leptin sensitivity are primary to the development of high-fat diet-induced obesity, then
they should occur prior to the accumulation of excess body fat. Thus, in these studies I
first compared relative insulin sensitivities in central and peripheral tissues of HF fed
rats, and second, determined whether the observed HF diet-induced changes in LC-CoA
and IKKβ activation occur over a time-course consistent with a role in the onset of
hypothalamic insulin and leptin resistance. These changes in insulin and leptin
sensitivity would in turn impair energy homeostasis, resulting in pathological weight gain
and obesity.
The findings and interpretations from the experiments presented in this
dissertation are summarized in Chapter VII. Study limitations and caveats are also
addressed. These results raise several unanswered questions and future directions for
study in understanding the mechanisms involved in the development of high-fat diet-
induced obesity.

39
CHAPTER II
MATERIALS AND METHODS
Animal Care and Husbandry
All animal studies were performed in accordance with the Vanderbilt Institutional
Animal Care and Use Committee guidelines under the supervision of the division of
Animal Care.
Rats
Male Long-Evans rats were purchased from Harlan Indianapolis and housed
individually when metabolic studies required an accurate measurement of food intake.
Diet induced obesity was generated by feeding animals ad libitum for 8-10 wks a
purified, micronutrient matched diet high in fat content relative to the low fat control diet
(45% fat relative to kcal content vs 10%, D12451 vs D12450, Research Diets Inc; New
Brunswick, NJ). Nutritional information for all diets and custom diets are shown in Table
1 (Research Diets Inc; New Brunswick, NJ). The established model of high, saturated
fat diet-induced obesity creates fasting hyperglycemia, hyperinsulinemia, impaired
glucose tolerance, and hypothalamic insulin and leptin resistance in rodents with many
characteristics similar to typical human obesity; thus it is an appropriate model for study.
Typical metabolic parameters of a diet high in saturated fat from our laboratory are
shown in Appendix A. In all diet studies, animals were acclimated to the low fat control
diet for 5-7 days and baseline body weight and adiposity were measured. Animals were
assigned to diet treatment groups after being randomized to minimize differences in
adiposity.

40
Table 1: Composition of Diets
LF
(D12450) HF
(D12451) MU
(custom) PU
(custom) O3
(custom) %kcal
Protein 20 20 20 20 20 Carbohydrate 70 35 35 35 35 Fat 10 45 45 45 45 kcal/gm 3.85 4.73 4.73 4.73 4.73
g Soybean Oil 25 25 25 25 25 Lard 20 177.5 0 0 0 High Oleic Safflower Oil 0 0 177.5 0 0
Safflower Oil 0 0 0 177.5 0 Menhaden Oil 0 0 0 0 177.5 Table 1: Macronutrient content and fat source are listed for all the diets used in rat and mouse studies. The diets enriched in unsaturated fatty acids (MU, PU, and O3) were custom formulated and matched to the macronutrient content of the HF diet except varying in fat source and fatty acid composition. All diets were purchased from Research Diets Inc (New Brunswick, NJ) and micronutrient matched.

41
Mice
Male and female wild-type (WT, C57BL/10SnJ) and TLR4 deficient (T4,
C57BL/10ScNJ) mice were purchased from Jackson laboratories for in house breeding.
The TLR4 deficient mice are homozygous for a null mutation that corresponds to
deletion of a 74-kb genomic fragment encompassing the TLR4 gene locus resulting in
absence of both mRNA and protein [145]. Lines were maintained separately to eliminate
potential differences caused by competition for nutrients, since T4 mice weigh
significantly less than their WT counterparts at weaning and throughout diet
administration. To confirm loss of TLR4 expression and function, a TLR4 receptor
ligand, lipopolysaccharide (LPS, 12.5 µg), was administered by intraperitoneal (ip)
injection to a cohort of WT and T4 male mice. Trunk blood, liver, and hypothalami were
collected 1 hour post-injection to measure plasma and tissue interleukin-6 (IL-6) levels, a
cytokine generated in response to LPS stimulation of the TLR4 receptor. Additionally, a
direct measure of TLR4 gene expression was made in WT and T4 mice by quantifying
TLR4 mRNA levels. For diet induced obesity studies, four-week old male and female
WT and T4 mice were fed a HF (60% kcal fat, see Table 1) or LF diet ad libitum for 10
wks. Food intake, body weight, and body composition were measured twice a week.
After 10 wks of diet administration, animals were sacrificed and tissues collected for
analyses. Trunk blood was collected for plasma metabolite measurements. Indirect
calorimetry studies were performed in a separate cohort of male WT and T4 mice in the
Mouse Metabolic Phenotyping Center at Vanderbilt University.
Intracerebroventricular (icv) Cannulation
Cannulation of the third ventricle in the brain allows perfusion of structures lying
adjacent to third ventricle, i.e. the hypothalamus. Placement of third ventricle cannula
into Long Evans rats was performed using proper sterile technique and under general

42
anesthesia induced and maintained by inhalation of isoflurane. Animals were secured in
a stereotaxic apparatus and the surgical area shaved and thoroughly cleaned with
Betadine. A small anterior to posterior incision was made along the midline of the head
and cleaned with sterile swabs to expose the skull. The skull was leveled and properly
aligned using lambda and bregma as reference points at the cranial plate junctions.
After removing a small section of the skull at the insertion site, the cannula was targeted
to the third ventricle by placing it 2.2 mm caudal to bregma and 7.5 mm ventral to the
midsagittal sinus. Dental cement (methyl methacrylate) was used to secure the cannula
in place and it was affixed to the skull by prior placement of three small screws that
served as anchor points. Antibiotic (ceftriaxone, 0.1 g/kg body weight, ip) was given on
the day of surgery and 2 days post-operatively. Animals were allowed to recover for 5-7
days after surgery during which body weight was monitored. Surgical recovery was
defined by steady weight gain and final body weight not less than 10% below pre-
surgery body weight. Correct placement of cannula was verified by an angiotensin II
drinking test. If the cannula is placed correctly, angiotensin II activates the thirst center
of the hypothalamus and direct administration to the third ventricle stimulates a
measurable thirst response (>5 mls per hour for a 350-400 g rat). For this test, 1 µl of a
10 ng/µl angiotensin II solution was injected via ICV cannula and water consumption was
measured over 30 min.
Body Composition Analysis
Body composition was determined by nuclear magnetic resonance (NMR)
spectroscopy to assess the percentage of body weight composed of adipose and lean
mass. These measurements were performed using the Echo MRI 700 (Echo Medical
Systems, Houston, TX) for rats and the Minspec mq7.5 (Bruker Instruments, city, state)
in the Mouse Metabolic Phenotyping Center at Vanderbilt University for mice. Animals

43
were weighed immediately prior to collecting body composition measurements and
measurements were performed at the same time of day throughout each study to
minimize any fluctuations due to feeding status of the animals. Measurement frequency
was from once a day to once a week, which was dependent upon the study protocol.
Animals were handled frequently and acclimated to the procedure prior to the start of
each study to minimize any stress or novelty responses.
Intraperitoneal Glucose Tolerance Test (IPGTT)
Glucose tolerance tests were performed in 4 hour fasted animals. Blood glucose
levels were measured prior to and after a bolus of ip glucose injection (50% dextrose
solution in saline) using blood collected from the tip of the tail (Freestyle Flash
glucometer, Abbott Laboratories, IL). In rats, blood glucose measurements were
collected at -20, 0, 20, 40, 60, 80, 100, and 120 min after a 3 g/kg lean mass dose of
glucose administered at time zero. In mice, blood glucose measurements were
collected at -30, 0, 5, 15, 30, 60, 90, and 120 min with a 1 g/kg lean mass dose of
glucose administered at the 0 minute time-point. The dose and time-points measured
were chosen based on previously reported data and reflect species differences in
glucose metabolism between rats and mice. As an index of glucose tolerance, the area
under the curve was calculated from the blood glucose profiles using the 0 minute time-
point value as the baseline.
Pair-Feeding Study
Male Long-Evans rats were divided into three treatment groups; low-fat, high-fat,
and high-fat diet that was pair-fed (PF). The low-fat and high-fat groups were given
unrestricted access to diet containing 10% or 45% kilocalories fat (Table 1), respectively.
The pair-fed group was given the same 45% high-fat diet, but access was limited to

44
match the caloric intake of the low-fat group and two-thirds of total daily calories were
given to pair-fed rats at “lights off” with the remaining one-third given at “lights on”. An
IPGTT was performed after 3 wks of diet administration. After 4 wks of diet
administration, 4 hour fasted blood glucose levels were measured and animals given an
intrapteritoneal injection of either saline or glucose (3 g/kg lean mass, 50% dextrose) to
stimulate insulin secretion. Blood glucose was measured again 15 min following
intrapteritoneal injection, animals were euthanized, and tissues collected for analysis of
p(S473)PKB, p(S177/181)IKKβ, and total IκBα levels. Trunk blood, a mixture of arterial
and venous blood collected via decapitation, was used for plasma insulin
measurements.
Fatty Acid Infusion
Palmitic (C 16:0) and oleic (C 18:1) fatty acids were obtained from Alltech
Associates, Inc (Deerfield, IL) and 100 mM stock solutions of each were prepared as
described by Cousin et al. [47]. Basically, fatty acids were dissolved in 0.1 M NaOH at
70 °C in a shaking water bath and then complexed with bovine serum albumin (BSA,
fatty acid-free) at 55 °C for 10 min to a final concentration of 1 mM fatty acid/10% BSA
solution. After cooling to room temperature, fatty acid solutions were sterile filtered (0.45
µm pore size membrane filter) and stored at -20 °C. On the day of a study, the fatty acid
solution was heated to 55 °C for 15 min and cooled to room temperature immediately
prior to use. Following a 6 hour fast, previously cannulated male Long Evans rats
maintained on standard chow diet (Lab Diet #5001) were subjected to icv infusion using
a micropump (Harvard Apparatus 11 Plus Syringe Pump, Holliston MA) of fatty acid or
vehicle at a rate of 0.5 µl/min for 4 hours, which delivers 0.5 nmoles fatty acid per minute
for a total dose of 120 nmoles. Animals were either euthanized and hypothalami
collected for biochemical analyses, e.g. measurement of long chain acyl-CoA (LC-CoA)
45
content, or non euthanized animals were further assessed, i.e. insulin sensitivity. To test
insulin sensitivity, following icv fatty acid infusion, an icv bolus injection of either insulin
or vehicle was administered. Animals were euthanized and hypothalami collected for
biochemical analyses.
Long Chain Acyl-CoA Measurements
For quantitative analysis of hypothalamic acyl-CoA content, samples were
prepared and CoA species purified on solid phase oligonucleotide purification columns,
according to Deutsch et al. [53]. Samples were derivatized with n-butylamine for gas
chromatography-electron ionization-mass spectrometry (GC-EI-MS) analysis, using a
15-m DB-1 column (J&W Scientific; Folsom, CA) and selected ion monitoring using a
Hewlett-Packard (HP) 6890 gas chromatograph coupled to an HP 5973 mass detector
operated in the positive EI mode. C16:0 (palmitoyl CoA), C18:0 (stearoyl CoA), and
C18:1 (oleoyl-CoA) were quantified by calculating their respective peak areas. A
synthetic standard (C17:0, heptadecanoyl CoA) was used as an internal control.
IKK Inhibitor Study
A pharmacological inhibitor of IKK (Inhibitor of kappa B kinase), PS-1145, was
purchased from Sigma (St. Louis, MO) and its efficacy was determined by western blot
analysis of its downstream target molecule, Inhibitor of kappaB alpha (IκBα), which is
degraded after IKK phosphorylation. Efficacy was determined from protein extracts
prepared from the hypothalami of rats given an icv dose of PS-1145 (3 μg in saline) into
the third ventricle (Appendix B). For food intake studies, icv cannulated animals were
fed either a low-fat or high-fat diet ad libitum for 8 wks and then received an icv dose of
either vehicle or PS-1145 (10 μg) following a 4 hour fast. Food intake was measured
over a 4 and 24 hour period after treatment. During food intake studies, animals were

46
also provided with kaolin pellets, a clay-like substance consumed in response to nausea
or ‘visceral illness’. Kaolin consumption was measured to monitor any indications of
visceral illness (a non-specific reduction in food intake) due to icv treatments [118]
(Appendix C). For insulin sensitivity measurements, animals were pretreated with PS-
1145 (3 µg) via icv injection for 6 hours prior to insulin sensitivity measurements
(described below) to determine the effect of IKK inhibition on insulin signaling.
Cholecystokinin Study
Rats were habituated to regular handling and injections (ip saline) for 1 week
prior to any study. Immediately prior to onset of the dark cycle and after a 4 hour fast,
either sulfated cholecystokinin (CCK) octapeptide (Bachem Inc; Torrance, CA) at a dose
of 0.5 μg or saline vehicle was injected via ip in a final volume of 2.0 ml. Food
consumption was measured for 30 min post ip injections (i.e., the first 30 min of the dark
cycle). The protocol was adapted from Morton et al. [123]. The selection of the CCK
dose was based on a dose-response study in which a 30-minute feeding response was
measured relative to vehicle (saline) after an ip injection of CCK doses at 0, 0.5, 1, and 5
µg just prior to onset of the dark cycle (Appendix D).
Insulin and Leptin Sensitivity Meaurements
Hypothalamic insulin and leptin sensitivity was assessed by measuring activation
of downstream signaling molecules in response to a direct insulin and leptin stimulation,
respectively. Cannulated animals received an icv injection of insulin (10 mU in 2 µl
saline), leptin (3 µg in 2 µl PBS, phosphate buffered saline) or vehicle (2 µl). Animals
were euthanized 60 min post-injection, and mediobasal hypothalami dissected, snap
frozen, and stored at -80°C for analyses. Insulin sensitivity was determined by
assessing insulin-stimulated activation (phosphorylation) of PKB/Akt, assessed by

47
western blotting for p(S473)Akt. The icv insulin dose that was used induces a similar
increase in hypothalamic pPKB as compared to the physiological insulin response
induced by a fasting-refeeding cycle (Appendix E). Leptin sensitivity was determined by
leptin-stimulated activation via phosphorylation of Stat3, assessed by western blotting for
p(Y705)Stat3. The icv leptin dose used in these studies is similar to those reported in
the literature to assess leptin action in the hypothalamus.
Protein Extraction and Quantification
Total protein was extracted from hypothalamus, liver, muscle, and plasma
samples. Tissues were sonicated in a solution of T-Per Tissue Protein Extraction Buffer
(Pierce/Thermo Scientific; Rockford, IL) containing 1:100 (v:v) of protease inhibitor
cocktail and 1:100 (v:v) of phosphatase inhibitor cocktail (Sigma; St. Louis, MO). For
muscle samples, prior to sonication, tissues were pulverized with a tissue pulverizer.
Following sonication, all samples were clarified by centrifugation at 10,000 x g for 20 min
at 4 °C. The protein extract (supernatant) was saved and its protein concentration
determined. Protein concentration was assessed in duplicate using a bicinchonic acid
colorimetric assay (Pierce/Thermo Scientific; Rockford, IL) performed according to the
manufacturer’s instructions with BSA as a protein standard. Samples were diluted with
T-Per buffer to the desired concentration for further analyses.
SDS PAGE and Western Immunoblotting
Protein samples were mixed with 4x XT Sample Buffer and 20x XT Reducing
Agent (Bio-Rad; Hercules, CA), heated to 85 °C for 10 min, and immediately loaded (20
µg total protein per lane) along with a Kaleidoscope Precision Plus Protein Standard
(Bio-Rad; Hercules, CA). Protein samples and standard were subjected to denaturing
electrophoresis on 10% Bis Tris gel with MOPS Running Buffer or 7% Tris Acetate gels

48
with XT Tricine Running Buffer using the Criterion XT Electrophoresis System according
to the manufacturer’s instructions (Bio-Rad; Hercules, CA). For immunoblotting, protein
was transferred from the gel to a 0.2 µm nitrocellulose membrane using the Criterion
Blotter module, according to the manufacturer’s instructions (Bio-Rad; Hercules, CA).
Membranes were then blocked in StartingBlock T20 blocking buffer
(Pierce/ThermoScientific; Rockford, IL) for 1 hour at room temperature and incubated
with primary antibody in blocking buffer overnight at 4 °C with gentle rocking, washed
three times in TBS (Tris Buffered Saline; 150mM NaCl, 20mM Tris pH 7.5) with 0.1%
(v/v) Tween 20 (Sigma) for 10 min at room temperature, and incubated with species-
specific peroxidase-conjugated secondary antibody in 50/50 blocking buffer and TBS-T
for 1 hour at room temperature. Wash steps repeated, and antibody detection was
performed using ECL Western Blotting Detection Reagents (Amersham Biosciences;
Piscataway, NJ ) and BioMax XAR scientific imaging film (Kodak; Rochester, NY). The
luminescent image corresponding to each protein of interest was analyzed by
densitometry using ImageJ software (National Institutes of Health, NIH).
Primary antibodies used for immunoblotting included: rabbit anti-p(S473)Akt
(1:1,000; #9271, Cell Signaling), rabbit anti-p(S177/181)IKKβ (1:1000; #2687, Cell
Signaling), rabbit anti-p(Y705)Stat3 (1:1000; #2687, Cell Signaling), total IκBα (1:1000;
#9242, Cell Signaling), and goat anti-actin (1:5000; sc-1616, Santa Cruz). Secondary
antibodies used for immunoblotting included: horseradish peroxidase-conjugated goat
anti-rabbit IgG (1:5000; W401B, Promega) and bovine anti-goat IgG (1:7500; sc-2350
Santa Cruz).
Enzyme Linked Immunosorbant Assay (ELISA)
IL- 6 levels, a measure of Toll-like Receptor4 (TLR4) stimulation by LPS, were
determined from plasma and tissue (liver and hypothalami) in wild-type and T4 mice

49
using a solid phase sandwich ELISA (Invitrogen; Carlsbad, CA). Briefly, a monoclonal
antibody specific for IL-6 is coated on the wells of a microtiter plate. Samples (500ug
plasma and 50ug tissue protein extracts) and standards are incubated in the wells and
IL-6 binds to the immobilized (capture) antibody. After washing, a biotinylated detection
antibody specific for IL-6 is added. During this second incubation, the detection antibody
binds to the immobilized IL-6 protein captured during the first incubation. After removal
of excess detection antibody, streptavidin-peroxidase (enzyme) is added. This binds to
the biotinylated detection antibody to complete the four-member sandwich (capture
antibody, protein, detection antibody, enzyme). After removal of all unbound enzyme, a
substrate solution is added which is acted upon by the bound enzyme to produce color.
The intensity of the colored product is directly proportional to the concentration of the IL-
6 in the sample. The absorbance of the color produced is measured
spectrophotometrically at 450 nm and the concentration of IL-6 in each plasma and
tissue sample is calculated from a standard curve generated from the absorbance
values of the standards. Sample values were normalized to the average value of those
obtained from low fat vehicle mice. All standards and samples were measured in
duplicate.
RNA Isolation and Quantitative Real-Time RT-PCR
Total RNA was extracted from liver tissue using TRIzol reagent (Invitrogen,
Carlsbad, CA) according to instructions from the manufacturer. Optical density
measurements of the reconstituted RNA were taken at A260 and A280 to determine the
concentration and the A260/280 ratio, to assess purity of the sample, using the Smart Spec
Plus spectrophotometer (Bio-Rad; Hercules, CA). RNA (1.0 µg) was reverse transcribed
(Multiscribe RT Reverse Transcriptase, Applied Biosystems) and amplified in a one-step
qRT-PCR reaction performed using the MyiQ Real-Time PCR Detection System with iQ

50
Real-Time SYBR Green PCR Supermix (Bio-Rad; Hercules, CA) and the following
mouse-specific primer sets: TLR4 (receptor) forward 5’-GTTCTTCTCCTGCCTGACAC-
3’ and reverse 5’-AGGGACTTTGCTGAGTTTCTG-3’, SCD-1 (metabolic enzyme)
forward 5’-CGTGGGTTGGCTGCTTGTG -3’ and reverse 5’-
GCTTCTCGGCTTTCAGGTCAG-3’, and mRPL13a (internal control) forward 5’-
AGATGCACTATCGGAAGAAGAAG-3’ and reverse 5’-
AGTCTTTATTGGGTTCACACCAG -3’. The starting quantity (SQ) of each sample was
calculated using a standard curve derived from a 2-fold serial dilution (0-50ng) of Mouse
Reference RNA (SABiosciences, Frederick, MD). The SQ mean was calculated for each
sample and normalized to the SQ mean of mRPL13a obtained from the same RNA
sample. These normalized values were used for subsequent comparison of the relative
abundance of each mRNA of interest between different mice and/or experimental
manipulation.
Plasma Hormone and Metabolite Measurements
For all studies, trunk blood was collected in EDTA tubes and placed on ice.
Samples were centrifuged at 500 x g for 10 min at 4 °C, the plasma supernatants were
transferred to a new tube and stored at -80°C. Plasma insulin and leptin concentrations
were assayed via radioimmunoassay (RIA) using a double antibody procedure by the
Hormone Assay and Analytical Services Core at Vanderbilt University with the
respective Rat Insulin and Leptin RIA Kits or Mouse Insulin and Leptin RIA Kits
(Linco/Millipore; St. Charles, MO). Plasma free fatty acids (FFA) levels were analyzed
using the Wako NEFA C Kit (Wako Chemicals Inc; Richmond, VA), an enzymatic
colorimetric assay conducted in 96-well plate format and absorbance measured
spectrophotometrically at 550 nm. A standard curve was constructed from known
concentrations of oleic acid (0.25-1.0mM) for sample calculations. All samples and

51
standards were run in duplicate. Plasma triglycerides were measured using an
enzymatic colorimetric assay (Riachem; San Diego, CA) conducted in a 96-well plate
and absorbance was measured spectrophotometrically at 520 nm. A standard curve
was constructed from known concentrations of triolein (0.5-10 mg/dl) for sample
calculations. All samples and standards were run in duplicate.
Statistical Analysis
Data were analyzed using GraphPad Prism v4.03. Briefly, mean +/- standard
error of the mean (SEM) is reported. Student’s T-test analysis was used for two-group
comparisons and one-way ANOVA was used for comparison of three or more groups
followed by the appropriate post hoc analysis to determine significance between the
groups. Repeated-measures two-way ANOVA with Bonferroni’s post-test was used to
determine points of significance in measurements over time between groups.
Correlation analyses using Pearson’s correlation was used to determine significance of
data relationships. p<0.05 was considered significant. Specific analyses performed and
sample sizes determined from power calculations are listed in figure and table legends
where appropriate.

52
CHAPTER III
OBESOGENIC PROPERTIES OF HIGH FAT DIETS ENRICHED WITH LONG CHAIN
FATTY ACIDS OF VARING SATURATION
Introduction
While many factors are implicated in the development of obesity, studies in
humans and animals have repeatedly shown that dietary fat and total energy intake are
strongly and positively associated with body weight gain and insulin resistance [197].
The fatty acid composition of the body, which is a reflection of dietary fat consumption
and fatty acid metabolism [130, 189], is known to affect several physiological processes
such as membrane properties, gene expression, metabolic signaling, and energy
expenditure [190]. These effects are dependent upon such structural properties of fatty
acids as chain length, degree of saturation, and location of unsaturated bonds [177,
190]. Therefore, I investigated the potential of specific long-chain fatty acid moieties to
induce obesity and insulin resistance in free-feeding rats.
It is well known that in animal models of diet-induced obesity, diets high in fat
content promote increased caloric intake. This raises the question of whether dietary fat
possesses inherent obesogenic properties or simply represents a more calorically dense
energy source compared to other macronutrients (~9 kcal/g of fat versus ~4 kcal/g of
carbohydrate or protein). To delineate the obesogenic effects of dietary fats from the
increase in caloric intake observed with high-fat feeding, I utilized a pair-feeding
paradigm. Pair feeding is restricting the consumption of a high-fat diet to the levels of
caloric intake observed in free feeding low-fat fed animals. I was able to assess the
contribution of intrinsic properties of dietary fat in the absence of increased caloric intake
on the development of obesity and insulin resistance. Together, the following studies

53
address the intrinsic properties of dietary fatty acids on whole body energy homeostasis
and the development of central and peripheral insulin resistance.
Results
Saturation Dependent Effects of Dietary Fat in Long Evans Rats
Effects on body weight, adiposity, and plasma hormones
Weight and adiposity matched male Long Evans rats were divided into five
dietary groups to investigate the saturation dependent effects of long-chain fatty acids on
whole body metabolism. High-fat (HF, 45% of total kcal from fat) and low-fat (LF, 10% of
total kcal from fat) groups were fed a lard-based diet which consisted of a mixture of
saturated, mono-unsaturated, and poly-unsaturated fatty acids with a composition of
40:45:10 parts, respectively. To determine the effect of specific fatty acid moieties in
high-fat diet induced obesity, the experimental groups were fed high-fat diets (also 45%
of total kcal from fat) enriched in specific long-chain fatty acids of varying degrees and
sites of unsaturation; namely mono-unsaturated (MU), omega-6 poly-unsaturated (PU),
and omega-3 polyunsatured (O3) fatty acids. Importantly, these fat type specific diets
contained the same number of calories per gram as the lard-based HF diet and the lard-
based HF diet is the only diet containing a significant amount of long-chain saturated fat.
Rats were housed individually and fed their respective diets ad libitum for 10 wks. The
duration of high-fat feeding was chosen based on previous data, which indicated that 8-
10 wks was sufficient to induce high-fat diet-induced obesity in Long Evans rats
(Appendix A). All data measurements and end-point analyses are reported in Table 2 (p
70).
Body weight and adiposity were measured twice a week throughout the
experiment (curves are shown in Figure 9A,B). After 10 wks of diet, the HF group
weighed significantly more than the LF group (Figure 9C; HF vs LF p<0.05). No other

54
high-fat diet treatment resulted in a significant gain in body weight compared to the LF
group (Figure 9C), which suggests that the saturated fatty acid component of the HF diet
was responsible for the weight gain associated with high-fat feeding. This supports
human evidence implicating saturated fatty acids in the development of diet-induced
obesity [41]. Both the HF and MU diet significantly increased adipose mass compared
to the LF diet (Figure 9D; HF vs LF p<0.01, MU vs LF p<0.05). However, there
appeared to be a graded effect of the various high-fat diets on adiposity such that as the
degree of unsaturation increased, adiposity decreased. The O3 group gaining the least
amount of fat mass, whereas the HF group gained the most amount of fat mass among
the high-fat diets thereby implicating the saturated fatty acid component of the HF diet in
the increased adiposity associated with HF feeding.
Fasting plasma leptin levels were also measured after 10 wks of diet and were
elevated in the HF group compared to the LF group (Figure 9E; p<0.01). Even when
normalized to body adiposity, significant hyperleptinemia was present in the HF group
compared to the LF group (Figure 9F; p<0.05) indicative of leptin resistance. However,
the other high-fat diets did not induce a significant increase in fasting leptin levels
compared to the LF group.
Effects on food intake and energy expenditure
High-fat diets are known to induce significant caloric intake compared to low-fat
diets ([198] and our observations). The excess caloric intake is thought to occur, in part,
from the caloric density of fat compared to carbohydrates and protein (9 kcal/g of fat vs.
4 kcal/g of carbohydrate or protein), as well as to the palatability of high-fat foods [198].
In this experiment, I determined whether the degree of fatty acid saturation altered the
intake of excess energy in response to high-fat feeding. Although all the high-fat diets
were similar in percent dietary fat content, food intake was not experimentally controlled,

55
Figure 9: Saturation Dependent Effects of Dietary Fats on Obesity Male Long Evans rats were fed either a 10%LF diet (LF), or 45% HF diets enriched in saturated (HF), mono-unsaturated (MU), omega-6 poly-unsaturated (PU), and omega-3 polyunsatured (O3) long-chain fatty acids for 10wks. A,B. Body weight and adiposity measurements. C,D. Cumulative body weight and fat mass gain over course of diet treatment. E,F. Absolute plasma leptin levels (4hr fasted) and leptin levels normalized to adiposity. Error bars represent the standard error of the mean (SEM). Two-way ANOVA with Bonferroni’s post-tests was used to determine significance in panels A,B (all diets compared to LF, black symbols represent HF vs LF comparison, dark grey symbols represent MU vs LF comparison). One-way ANOVA with Dunnett’s Multiple Comparison Test was used to determine significance of all groups compared to a control group in panels C-F (all diets compared to LF). * p<0.05, ** p<0.01, ***p<0.001, n=5-6 per group.
0 1 2 3 4 5 6 7 8 9 10
350
400
450
500
550 *
weeks
body
wei
ght(
g)
0 1 2 3 4 5 6 7 8 9 10
10
15
20
25
HFLF
MUPUO3
** ******
weeks
adip
osity
(%)
A
FE
DC
B
LF HF MU PU O30
50
100
150
200
250 *
body
wei
ghtg
ain
(g)
LF HF MU PU O30
10
20
30**
plas
ma
lept
in(n
g/m
l)
LF HF MU PU O30
50
100
150
**
fatm
ass
gain
(g)
*
LF HF MU PU O30.0
0.5
1.0
1.5
*
lept
in/a
dipo
sity

56
which allowed for any differences in energy intake to be observed between the different
high-fat diets. All high-fat diet groups consumed significantly more calories over the
course of the study than the LF group (Figure 10A; HF vs LF p<0.01, MU vs LF p<0.05,
PU vs LF p<0.01, O3 vs LF p<0.05). However, the group fed the lard-based HF diet
enriched in long-chain saturated fat consumed the most calories of all the diets high in
fat content and no major differences were observed in food intake between the
unsaturated high-fat diets.
Caloric intake may account for some, but potentially not all, of the differences
observed in body weight gain between the unsaturated high-fat diets (MU, PU, and O3)
compared to the lard-based HF diet enriched in long-chain saturated fat. The ability of
these diets to induce body weight gain was calculated as feed efficiency. Feed
efficiency indicates how effectively the body stores nutrients and accrues mass (as
opposed to utilizing nutrients for energy production), calculated as the amount of weight
gained per kilocalorie consumed (wt gain/kcal). Weight gain is a function of both food
intake and total energy expenditure such that changes in body weight are determined by
the relative balance between food intake and energy expenditure. Since body weight
gain and food intake are known, relative energy expenditure can be inferred from feed
efficiency calculations. For example, a high feed efficiency value (i.e. increased body
weight gain per calorie consumed) indicates that energy expenditure is relatively low.
Conversely, a low feed efficiency value (i.e. reduced body weight gain per calorie
consumed) indicates that energy expenditure is relatively high. No significant difference
was observed in feed efficiency between the LF and HF group (Student’s T-test, LF vs
HF p=0.2) indicating that energy expenditure is not appropriately increased with HF
feeding to maintain body weight in the setting of increased food intake. However, feed
efficiency values were significantly lower in all unsaturated high-fat diet groups
compared to the HF group (Figure 10B; MU vs HF p<0.01, PU vs HF p<0.05, O3 vs HF

57
Figure 10: Saturation Dependent Effects of Dietary Fat on Food Intake and Feed Efficiency. Cumulative food intake measurements (A) and feed efficiency calculations as an index of relative energy expenditure (B) following 10wks of diet treatment in rats. Error bars represent the SEM. One-way ANOVA with One-way ANOVA with Dunnett’s Multiple Comparison Test was used to determine significance of all groups compared to a control group (panel A vs. LF, panel B vs HF group). * p<0.05, ** p<0.01, n=6 per group.
B
A
LF HF MU PU O30
4000
4500
5000
5500
6000 ***
**
***cu
mul
ativ
e fo
odin
take
(kca
l)
LF HF MU PU O30.00
0.01
0.02
0.03
0.04
0.05
* ****
Feed
Effic
ienc
y(b
wga
in/k
cal)

58
p<0.01). These lower feed efficiency values suggest that per calorie consumed, the
animals fed unsaturated fat diets gained less body weight than animals fed the HF diet
containing saturated fat. This suggests that consumption of unsaturated fatty acids
increase energy expenditure to compensate for the increased caloric intake (observed
with all high-fat diets) to maintain energy homeostasis.
Effects of a Restricted High-Fat Diet
Effects on body weight and adiposity
Since animals fed the HF diet enriched in long-chain saturated fats consumed
excess energy with respect to their energy needs, the deleterious metabolic effects of
HF feeding could arise from increased energy intake, increased dietary fat content, or a
combination of both. To determine the contribution of excess caloric intake versus
intrinsic obesogenic properties of dietary fat, changes in body weight and adiposity were
measured in a separate study that included a group of pair-fed (PF) rats that were fed
the HF diet in an amount that was matched to the caloric intake of LF fed controls on a
daily basis. All data measurements and end-point analyses are reported in Table 3 for
reference (p 70). Total caloric intake of the PF group was precisely matched to the
average caloric intake of the LF group over the duration of the study (Figure11A). As
previously observed, ad libitum HF feeding significantly increased caloric intake
(p<0.001) and HF fed animals gained significantly more body weight (p<0.05) and
adipose mass (p<0.001) compared to LF fed controls (Figure 11A-E). Caloric restriction
in the PF group completely abolished the weight gain observed with high-fat feeding
compared to the LF group (Figure 11B,D), which suggests that body weight is a direct
corollary of caloric intake in these animals with no apparent effects on energy
expenditure. However, the PF group gained approximately 60% more fat mass than the
LF group and this equaled approximately 80% of the amount of fat mass accrued by the

59
Figure 11: Effects of a Restricted High-Fat Diet on Body Weight and Adiposity. Food intake of the pair-fed (PF) group was calorically matched to that of the low-fat (LF) diet group fed ad libitum. A. Cumulative food intake measurements. The high-fat (HF) group fed ad libitum consumed significantly more calories than both the LF and PF groups. B,C. Body weight and adiposity measurements. D,E. Cumulative body weight and fat mass gain over course of diet treatment. Error bars represent the SEM. Two-way ANOVA with Bonferroni’s post-tests was used to determine significance in panels B,C (all diets compared to LF group, black symbols represent HF vs LF comparison, grey symbols represent PF vs LF comparison). One-way ANOVA with Tukey’s post-hoc analysis was used to determine significance between all groups in panels A,D and E. * p<0.05, ** p<0.01, *** p<0.001, n=13-14 per group.
0 1 2 3 4
300
350
400
weeks on diet
body
wei
ght(
g)
LF HF PF0
10
20
30
40
50*
***
fatm
ass
gain
(g)
0 1 2 3 4
10
15
20HFPF
LF
***
***
*
weeks on diet
body
adip
osity
(%)
LF HF PF0
500
1000
1500
2000
2500 ******
cum
mul
ativ
e fo
odin
take
(kca
l)
ED
CB
A
LF HF PF0
50
100
150 **
body
wei
ghtg
ain
(g)

60
HF group (Figure 11C,E; fat mass gain PF vs LF p<0.05). Although pair-feeding did not
completely recapitulate the level of adiposity observed in the HF group, the amount of
long-chain saturated fat consumed by the PF group was 15% less than the HF group.
These data indicate that dietary long-chain saturated fats possess intrinsic obesogenic
properties which significantly contribute to alterations in body composition wherein
adiposity increases at the expense of lean mass.
Effects on glucose tolerance
A glucose tolerance test was performed to determine whether impaired glucose
tolerance generally observed with long-term high-fat feeding is mediated by excess
caloric intake or the intrinsic obesogenic properties of a diet enriched with long-chain
saturated fat. After 3 wks of diet treatment, the glucose excursion curves of the HF and
PF group were similarly elevated compared to the LF group (Figure 12A) although area
under the curve only reached significance in the PF group (Figure 12B; vs LF p<0.01).
This is likely attributable to the moderately elevated basal glucose levels observed in the
HF group as area under the curve was calculated from baseline glucose values. These
data suggest that inherent properties of dietary fat significantly contribute to the impaired
glucose tolerance associated with high-fat feeding by increasing adiposity.
High-Fat Feeding, Independent of Increased Caloric Intake is Sufficient to Induce
Hypothalamic Insulin Resistance
To determine whether dietary fat enriched in long-chain saturated fat,
independent of excess caloric intake, would impair hypothalamic insulin signaling, a
glucose bolus was administered via intraperitoneal injection to stimulate endogenous
insulin secretion and assess hypothalamic insulin sensitivity in vivo. Hypothalamic
tissue samples were collected 15 min post-injection and protein extracts assayed for

61
Figure 12: Effect of a Restricted High-Fat Diet on Glucose Tolerance Dietary fat content, independent of caloric intake, induced a similar blood glucose excursion (A) and elevated AUC in response to intraperitoneal glucose tolerance test (B) compared to LF fed animals. Error bars represent the SEM. Two-way ANOVA with Bonferroni’s post-tests was used to determine significance in panel A (black symbols represent HF vs LF comparison, grey symbols represent PF vs LF comparison). One-way ANOVA with Tukey’s post-hoc analysis was used to assess significance between groups in panel B. * p<0.05, ** p<0.01, n=9-11 per group.
LF HF PF0
2000400060008000
1000012000 **
p=0.06
AU
C
B
A
-20 0 20 40 60 80 100100
200
300
400
LFHFPF
****
time (min)
bloo
dgl
ucos
e(m
g/dl
)

62
activation of the downstream insulin signaling molecule PKB. Mean blood glucose
concentrations and plasma insulin levels were similarly elevated in all three groups
compared to vehicle controls following glucose injection despite slightly lower baseline
glucose and insulin levels in the PF group (likely owing to the longer period of fasting
imposed by the pair-feeding protocol; Figure 13A,B). High-fat feeding, in both restricted
and free-feeding animals, resulted in slightly higher baseline levels of phosphorylated
PKB at serine 473 (pPKB, phosphorylation site leading to activation) compared to LF fed
animals (Figure 13C, white bars). Baseline pPKB levels were not further increased in
response to glucose-stimulated insulin secretion in the HF or PF group, whereas in the
LF group, glucose-stimulated insulin secretion was associated with a significant increase
in pPKB (Figure 13C, white vs black bars; LF group p<0.01). Moreover, when plotted
versus plasma insulin levels, PKB phosphorylation was significantly correlated with
plasma insulin concentration in the LF group (Figure 13D; R=0.73, p<0.05), but not in
the HF or PF group.
High-Fat Feeding, Independent of Increased Caloric Intake, is Sufficient to
Activate Inflammatory Molecules
Previous observations from our laboratory demonstrated an activation of
hypothalamic proinflammatory signaling in high-fat fed obese rats as measured by an
increase in phosphorylation of IKKβ. To determine whether activation of IKKβ with high-
fat feeding is from excess caloric intake or intrinsic properties of a diet enriched in
saturated fat, hypothalamic activation of IKKβ (phosphorylated active form, pIKKβ) and
levels of the downstream target molecule, IκBα, were measured. Activation of IKKβ
leads to the phosphorylation and degradation of IκBα and subsequent activation of the
transcription factor NFκB to propagate proinflammatory signaling thought to contribute to
insulin resistance. The inflammatory signaling pathway was activated in the HF group

63
Figure 13: High-Fat Feeding, Independent of Increased Caloric Intake, Induces Hypothalamic Insulin Resistance. Effect of pair-feeding on glucose-stimulated hypothalamic insulin signaling. A. Effect of dietary fat content on blood glucose, B. plasma insulin, and C. PKB activity following 15-min vehicle (white bars) or glucose (3 g/kg lean mass; black bars) treatment administered intraperitonally. D. Relationship between plasma insulin levels and hypothalamic PKB activity. Error bars represent the SEM. Student’s t-test was used to determine significance for comparison within diet treatment groups in panels A-C. Pearson’s correlation was used to determine significance in panel D. ** p<0.01, *** p<0.001, n=6-7 per group.
D
B
C
A
LF HF PF0
100
200
300
glucose - + - + - +
*** *** ***
bloo
dgl
ucos
e(m
g/dl
)
LF HF PF0
2
4
6
- + - + - +
*** ******
plas
ma
insu
lin(n
g/m
l)
LF HF PF0.0
0.5
1.0
1.5
glucose - + - + - +
**
hypo
pPK
B(re
lativ
eun
its)
0 1 2 3 4 5 6 7
0.8
1.0
1.2
1.4
1.6
LFHFPFR=0.73
p=0.0167
insulin (mg/dl)
hypo
pPK
B(re
lativ
eun
its)

64
Figure 14: High-Fat Feeding, Independent of Increased Caloric Intake, Activates Hypothalamic Inflammatory Signaling Pathways Effect of pair-feeding on hypothalamic IKKβ activity. Pair-feeding resulted in increased hypothalamic phosphorylation of IKKβ (A) and decreased total IκBα content (B) following 4wks of diet treatment. Error bars represent the SEM. One-way ANOVA with Tukey’s post-hoc analysis was used to assess significance between groups * p<0.05, n=13-14 per group.
BA
LF HF PF LF HF PF0
5
10
15
tota
lα
(rel
ativ
eun
its)
0
5
10
15
pIK
Kβ
(rel
ativ
eun
its) *
*
IκB
*

65
as indicated by a ~30% increase in pIKKβ and ~30% reduction in total IκBα levels
compared to LF fed controls (Figure 14A,B; p<0.05 in panel B only). A similar effect was
observed in the PF group in which consumption of a high-fat diet, even when limited to
the caloric intake of the LF group, was associated with a significant increase in pIKKβ
and reduction in total IκBα levels (Figure 14A,B; PF vs LF p<0.05).
Discussion
It is well known that diets high in fat induce obesity and insulin resistance in
rodents and humans. Evidence suggests that the ability of high-fat feeding to induce
these effects is dependent upon both the amount and type of fatty acids in the diet [190].
In these studies the saturation dependent effects of long-chain fatty acids on whole body
energy homeostasis were investigated.
Long-Evans rats fed a high-fat diet enriched in long-chain saturated, but not
unsaturated, fatty acids were characterized by significantly elevated body weight and
body adiposity compared to low-fat fed rats after 10 wks of diet treatment. These
findings suggest that, whereas long-chain saturated fatty acids promote weight gain
associated with high-fat feeding, long-chain unsaturated fatty acids protect against high-
fat diet-induced weight gain. Furthermore, there appeared to be a graded effect of the
long-chain unsaturated high-fat diets on adiposity such that as the degree of
unsaturation increased, adiposity decreased. Notably, animals fed the omega-3
enriched high-fat diet gained the least amount of fat mass of all the high-fat diet fed
groups suggesting that the location of unsaturated bonds also determines the
obesogenic potential of specific fatty acids.
A current model of energy homeostasis proposes that body adiposity is regulated
by the hormones insulin and leptin [163]. Both hormones function as negative feedback
signals to reduce food intake and increase energy expenditure through actions mediated

66
by key brain regions involved in energy homeostasis [163]. In the setting of positive
energy balance (weight gain, energy intake in excess of expenditure), this model
predicts that increased circulating insulin and leptin levels elicit neuronal responses that
reduce food intake, increase energy expenditure, and protect against increases in fat
mass. Indeed, this integrated response is well-described in lean animals [164], but
appears to be disrupted in common forms of human obesity and in rodent models of
high-fat diet-induced obesity. In these forms of obesity, increased fat mass is
accompanied by elevated plasma insulin and leptin levels, yet, food intake remains
normal or elevated [102] and energy expenditure is hypothesized to be reduced for the
degree of adiposity. This suggests that DIO is characterized by functional hypothalamic
resistance to insulin [52] and leptin [126]; which in turn, contributes to pathological
weight gain and adiposity.
In these studies, elevated plasma leptin levels were accompanied by significant
hyperphagia (excess caloric intake) in the HF group compared to the LF control group
indicating functional hypothalamic resistance to leptin. However, the high-fat diets
enriched in unsaturated fatty acids did not induce a significant increase in fasting plasma
leptin levels compared to the LF group and the hyperphagic response was moderately
attenuated compared to the HF group. In addition, feed efficiency values for the high-fat
diets enriched in unsaturated fatty acids were significantly lower than the feed efficiency
value of the HF diet containing saturated fat. This suggests that energy expenditure is
relatively elevated in these groups and that unsaturated fatty acids may promote the
oxidation of excess energy. This concept is supported by evidence that the structure of
fatty acids appears to affect the degree of oxidation and deposition of fats. Animal and
human studies suggest that some fatty acids are prone to oxidation while others lead to
fat storage. For instance, evidence in the literature indicates that poly-unsaturated fatty
acids have higher oxidation rates than saturated fatty acids [42] and produce a greater

67
thermogenic effect [179], increase in oxygen consumption [166] and higher sympathetic
nervous stimulation [113] compared to saturated fatty acids due to both direct and
indirect effects of fatty acids on lipid metabolism and lipid metabolic genes.
Furthermore, in vivo and in vitro studies have shown that poly-unsaturated, but not
mono-unsaturated or saturated fatty acids, suppress the expression of lipogenic genes
[206]. This suggests that the consumption of unsaturated fatty acids increases energy
expenditure to compensate for the increase in caloric intake associated with high-fat
feeding to maintain body weight at levels similar to low-fat fed rats. This counter-
regulatory response suggests that hypothalamic insulin and leptin sensitivity remain, at
least partially, intact in the setting of an unsaturated fat diet, but not a saturated fat diet.
Together, these data suggest that long-chain saturated fatty acids are an important
contributing factor in the development of hypothalamic resistance to the adiposity
hormones after high-fat feeding.
Since animals placed on a high-fat diet are characteristically hyperphagic
(excess energy intake) (our observations and, [101, 205]), they are consequently
exposed to both excess calories and excess dietary fat. Although the previous data
implicate long-chain saturated fatty acids as the most potent contributing factor in high-
fat diet-induced obesity, the deleterious metabolic effects of high-fat feeding could arise
from increased energy intake, increased dietary fat content, or a combination of both.
To determine the contribution of excess caloric intake versus the intrinsic obesogenic
properties of dietary fat to diet-induced obesity, I performed a pair-feeding study. Caloric
restriction in the PF group completely abolished the weight gain observed with ad libitum
high-fat feeding; suggesting that body weight is a direct corollary of caloric intake in
these animals with no apparent effects on energy expenditure during this study.
However, the PF group gained approximately 60% more fat mass than the LF group,
which equaled approximately 80% of the amount of fat mass accrued by the HF group.

68
In addition, glucose tolerance was impaired with high-fat feeding independent of caloric
intake. Taken together, pair-feeding nearly recapitulated the level of adiposity achieved
in the free-feeding HF group and completely recapitulated the impaired glucose
tolerance associated with high-fat feeding. These data indicate that dietary fats possess
intrinsic obesogenic properties that significantly contribute to the deleterious metabolic
effects of high-fat feeding independent of caloric intake.
Fatty acids are also known to modulate the production of cytokines and
inflammatory responses. Saturated fatty acids are associated with pro-inflammatory
effects, whereas unsaturated fatty acids are associated with anti-inflammatory effects
[27, 192]. The pro-inflammatory signaling associated with the consumption of saturated
fat is known to induce peripheral insulin resistance by promoting inhibitory serine
phosphorylation of key elements within the insulin signaling pathway involving signal
transduction through the IKKβ pathway (a serine/threonine kinase cascade [76, 168]).
However, it has been unclear whether the effects of a high-fat diet enriched in long-
chain saturated fat on IKKβ activity and insulin sensitivity were mediated by excess
caloric intake or excess dietary fat.
Given the similarities in the insulin signal transduction pathway between central
and peripheral tissues, I hypothesized that a similar mechanism of high-fat diet-induced
peripheral insulin resistance occurs within the hypothalamus and asked whether it is
mediated by excess caloric intake or excess dietary fat. In these studies, I observed
insulin resistance in the hypothalamus of both calorically restricted and ad libitum high-
fat fed animals as evidenced by loss of glucose-stimulated insulin signaling above basal
levels. However, basal pPKB levels were moderately elevated in both HF and PF
groups compared to LF controls. This basal increase in hypothalamic pPKB levels with
HF feeding has been observed by others [185], but does not appear to couple with
insulin mediated changes in food intake and energy homeostasis. This basal increase in

69
pPKB could potentially be due to insulin independent activation of the PI3K-PKB
pathway as PI3K is a key regulatory protein involved in a variety of signaling cascades.
For example, recall that the inflammatory TLR4 pathway also induces PI3K-PKB
signaling associated with activation of the transcription factor NFκB (Chapter I).
Nevertheless, insulin failed to stimulate further phosphorylation of PKB in hypothalami of
HF and PF animals, and the increase in phosphorylation of PKB in response to insulin
stimulation appears to determine insulin action. In addition to the hypothalamic insulin
resistance observed with HF feeding, hypothalamic activity of the inflammatory molecule
IKKβ, a serine/threonine kinase, was increased in both calorically restricted and ad
libitum high-fat fed animals compared to LF fed controls. Taken together, HF feeding
induced hypothalamic inflammation and insulin resistance irrespective of whether
hyperphagia occurred, suggesting that dietary fats possess intrinsic obesogenic
properties.
In summary, these studies demonstrated a graded effect of dietary fatty acids on
adiposity, food intake, and feed efficiency in a saturation dependent manner and
specifically implicate long-chain saturated fatty acids as the most potent mediator of the
deleterious effects of high-fat feeding. Furthermore, a diet enriched in long-chain
saturated fat, independent of excess caloric intake, is sufficient to induce impaired
glucose tolerance, hypothalamic inflammation, and hypothalamic insulin resistance.
These findings support the hypothesis that dietary fat possesses intrinsic obesogenic
properties in a saturation dependent manner.

70
Table 2: Saturation Dependent Effects of Dietary Fat
LF HF MU PU O3 Body wt (g) 479 ± 13 531 ± 27* 502 ± 20 497 ± 10 476 ± 12 Body wt gain (g) 159 ±10 214 ± 16* 171 ± 17 168 ± 3 151 ± 7 Adiposity (%) 13.3 ± 1.4 20.4 ± 2.8* 20.0 ± 1.3* 18.2 ± 1.2 14.8 ± 1.3 Fat mass gain (g) 46 ± 6 99 ± 19** 86 ± 10* 72 ± 5 54 ± 6
Leptin (ng/dl) 7.4 ± 1.0 20.3 ± 4.7** 14.5 ± 2.9 11.8 ± 1.8 6.7 ± 1.6
Leptin/adiposity 0.56 ± 0.03 0.96 ± 0.12* 0.70 ± 0.07 0.63 ± 0.06 0.41 ± 0.06
Total food intake (kcal) 4714 ± 94 5594 ±
263*** 5281 ± 98* 5308 ± 72* 5175 ± 45
Feed efficiency (bw gain/kcal)
0.034 ± 0.002
0.037 ± 0.001
0.028 ± 0.001*,##
0.032 ± 0.000
0.029 ± 0.001##
Table 2: Metabolic parameters of rats following 10wks of diet treatment are reported as the group mean ± SEM. One-way ANOVA with Dunnett’s Multiple Comparison Test was used to determine significance of all groups compared to a control group. * symbols represent comparison to LF group and # symbols represent comparison to HF group. One symbol p<0.05, two symbols p<0.01, three symbols p<0.001, n=5-6 per group. Table 3: Metabolic Effects of a Restricted High-Fat Diet
LF HF PF Total food intake (kcal) 1890 ± 44 2235 ± 59*** 1906### Body wt (g) 394 ± 5 408 ± 9 388 ± 4 Body wt gain (g) 96 ± 3 114 ± 5** 96 ± 3## Adiposity (%) 14.3 ± 0.8 18.1 ± 1.0*** 16.6 ± 0.6 Fat mass gain (g) 21.1 ± 2.4 40.2 ± 3.6*** 33.0 ± 2.1# AUC 6872 ± 566 8566 ± 553 10230 ± 920** Basal glucose (mg/dl) 111 ± 9 120 ± 12 103 ± 10## Table 3: Metabolic parameters of rats following 4wks of diet treatment are reported as the group mean ± SEM. One-way ANOVA with Tukey’s post-hoc analysis was used to assess significance between groups. * symbols represent comparison to LF group and # symbols represent comparison to HF group. One symbol p<0.05, two symbols p<0.01, three symbols p<0.001, n=13-14 per group.

71
CHAPTER IV
SATURATED FAT ACTIVATES INFLAMMATORY PATHWAYS AND IMPAIRS INSULIN
SIGNALING DIRECTLY WITHIN THE HYPOTHALAMUS
Introduction
Diet-induced obesity is associated with hypothalamic resistance to the adiposity
feedback signals insulin and leptin [52, 126]. A potential mechanism of insulin
resistance in peripheral tissues proposes that intracellular accumulation of lipid
metabolites such as long-chain fatty acyl-CoA molecules can activate inflammatory
serine/threonine kinase signal transduction cascades involving IKKβ [169]. Activation of
IKKβ is known to induce peripheral insulin resistance by promoting inhibitory serine
phosphorylation of the insulin receptor and IRS proteins, thereby preventing the
association and activation of PI3K and other downstream effects [211].
Findings from the previous chapter suggest that the saturated fatty acid
component of a HF lard diet is the most potent mediator of the deleterious effects of
high-fat feeding and is sufficient to induce hypothalamic inflammation (activation of
IKKβ), and insulin resistance independent of excess caloric intake. The two primary fatty
acid components of lard are palmitate, a saturated fat, as well as oleate, a
monounsaturated fat. Thus, in this chapter I sought to determine whether the
deleterious effects of high-fat feeding are specifically attributable to 1) saturated, and not
unsaturated fat, and 2) direct action of saturated fat within the CNS on hypothalamic
inflammation and insulin resistance. Specifically, whether exposure of the hypothalamus
to excess saturated fat leads to hypothalamic accumulation of LC-CoAs that trigger
inflammatory signaling (elevated IKKβ activity) and blunt insulin signaling in lean chow
fed rats given an acute icv infusion of palmitate or oleate.

72
Results
ICV Infusion of Fatty Acids Leads to Hypothalamic Accumulation of LC-CoA,
Activation of IKKβ, and Impaired Insulin Signaling
To determine whether the effects of high-fat feeding on the accumulation of
hypothalamic LC-CoA content can be mimicked by an acute local elevation in the long-
chain saturated fatty acid palmitate, palmitic acid was infused via icv into the third
ventricle of the brain of rats maintained on a standard chow diet. Following the 4 hour
icv infusion of palmitate (0.5 nmole/min, 120 nmoles total), the hypothalamic content of
palmitoyl- and stearoyl-CoA (16:0 and 18:0 respectively), two saturated fatty acid
species, and oleoyl-CoA (18:1), a mono-unsaturated fatty acid species, were
significantly elevated compared to the control icv vehicle infusion group (Figure 15A;
white vs black bars: palmitoyl-CoA 14.9±1.3 vs 21.4±1.7, p<0.05; stearoyl-CoA 16.3±1.4
vs 23.2±1.5, p<0.01; oleoyl-CoA 17.9±1.3 vs 25.7±1.1, p<0.05). In addition to
accumulation of these hypothalamic LC-CoA fatty acid species; hypothalamic IKKβ
activity was significantly elevated with icv palmitate infusion compared to vehicle controls
(Figure 15B; ~15% increase in pIKKβ, p<0.05). Concomitant with increased LC-CoA
content and elevated IKKβ activity with palmitate infusion, the ability of icv insulin to
activate the downstream signaling molecule PKB was severely blunted with palmitate
infusion compared to vehicle controls in which activation of PKB was readily detected
(Figure 15C; veh-veh vs veh-ins 1.0±0.1 vs 1.8±0.2, p<0.01). To determine whether
hypothalamic LC-CoA accumulation would occur in response to a long-chain mono-
unsaturated fatty acid, oleic acid was also infused into the third ventricle of chow fed rats
(4 hour infusion, 0.5 nmole/min, 120 nmoles total). Oleic acid infusion failed to
significantly increase any of the fatty acid LC-CoA species measured above those in the
control vehicle group (Figure 15A, grey bars).

73
IKKβ Inhibitor Represses Consumption of a High-Fat, but not a Low-Fat, Diet
While the previous data demonstrate a clear association between saturated fat
induced IKKβ activity and insulin resistance, I sought to directly test the role of IKKβ in
high-fat diet-induced hypothalamic insulin resistance. Recall that insulin acts as a
catabolic hormone within the hypothalamus to reduce food intake and increase energy
expenditure. However, food intake is not appropriately reduced in response to
hyperinsulinemia associated with HF feeding indicative of hypothalamic insulin
resistance. Therefore, to test the role of IKKβ activity on hypothalamic insulin action, a
pharmacological inhibitor of IKK (PS-1145, 10 μg) was administered into the third
ventricle of rats fed either a high-fat (45%) or low-fat diet and 24 hour food intake
measured. As shown in Figure 16, this intervention had no effect on food intake in the
LF group (animals that are characterized by relatively low hypothalamic IKKβ activity).
In contrast, icv infusion of PS-1145 potently reduced 24 hour food intake in high-fat fed
rats (~50% reduction vs HF-veh, p<0.01) characterized by hyperinsulinemia and
increased hypothalamic IKKβ activity [146]. Efficacy of the inhibitor was confirmed in
previous studies by measurements of a downstream IKKβ target and signaling molecule,
IκBα. Activation of IKKβ leads to the phosphorylation and degradation of IκBα and
subsequent activation of the transcription factor NFκB to propagate proinflammatory
signaling thought to contribute to insulin resistance. Activation of IKKβ induces
phosphorylation and targeted ubiquitination/degradation of IκBα, thereby reducing
protein levels of IκBα. Inhibition of IKKβ would be expected to increase total IκBα
protein. Accordingly, hypothalamic IκBα content is significantly increased with inhibitor
treatment compared to vehicle controls (Appendix B; ~50% increase vs veh, p<0.05). In
addition, a dose-dependent effect on food intake was observed with inhibitor treatment
as a lower dose of PS1145 (3 µg icv) reduces 4 hour food intake, but not 24 hour food
intake (Appendix B). Since food intake was not reduced in LF fed rats, the feeding

74
effects of PS-1145 do not appear to be due to visceral or non-specific illness. In support
of this observation, inhibitor treatment did not increase kaolin consumption, a marker of
visceral illness in rodents (Appendix C, [118]).
IKKβ Inhibitor Increases Insulin Signaling in High-Fat Fed, Obese Rats
To further assess the role of IKKβ activity on hypothalamic insulin action, I
tested whether pretreatment with the IKK inhibitor would improve insulin stimulated
hypothalamic insulin signaling in high-fat fed rats. IKKβ activity is proposed to inhibit the
insulin signaling pathway; therefore, inhibition of the IKKβ activity would be expected to,
at least partially, restore activation of insulin signaling. Pretreatment with the IKK
inhibitor PS1145 (3 µg, 6 h prior to 10 mU icv insulin) in high-fat fed rats significantly
increased insulin stimulated phosphorylation of PKB in the hypothalamus (Figure 17;
1.8±0.1 vs 1.4±0.1, p<0.05). However, pretreatment with the IKK inhibitor alone (minus
insulin) had no affect on phosphorylation of PKB compared to high-fat fed rats without
inhibitor pretreatment.
Discussion
Abundant evidence in animals and humans implicates both exogenous (lipid
infusion) and endogenous (tissue long-chain acyl-CoAs) fatty acids in the pathogenesis
of insulin resistance induced by activation of intracellular inflammatory signals. For
example, long-chain acyl-CoA content and IKKβ signaling are elevated in skeletal
muscle sampled from morbidly obese, insulin-resistant humans [79]. In addition,
exposure of cultured cells to palmitate induces insulin resistance via activation of the
IKKβ/NF-κB signaling pathway [171]. A current model of peripheral insulin resistance
suggests that lipid mediated activation of pro-inflammatory signaling molecules may
contribute to impaired insulin signaling in the obese state. Previous observations from

75
Figure 15: Effect of Intracerebroventricular Fatty Acid Infusion on Hypothalamic Long-Chain Acyl-CoA Content, IKKβ Activity, and Insulin Signaling A. ICV infusion of palmitic acid (black bars), but not oleic acid (grey bars), leads to increased hypothalamic content of LC-CoA molecules compared to vehicle controls (white bars). B. ICV infusion of palmitic acid increases hypothalamic pIKKβ compared to vehicle controls and C. blunts insulin stimulated pPKB in the hypothalami of chow fed Long Evans rats. Error bars represent the standard error of the mean (SEM). One-way ANOVA with Dunnett’s Multiple Comparison Test was used to determine significance of icv infusion groups compared to the vehicle control group for each Acyl-CoA (panel A). Student’s t-test was used to determine significance in panels B (vehicle vs palmitate) and C (insulin vs vehicle treatment within each icv infusion group). * p<0.05, ** p<0.01, n=6-8 per group.
0.0
0.5
1.0
1.5
2.0 **
icv infusioninsulin - + - +
veh veh pal pal
hypo
pPKB
(rela
tive
units
)
veh pal
0.5
1.0
1.5*
hypo
pIKK
β(re
lativ
ede
nsity
)
A
C
B
0
10
20
30 vehpalole
* ** *pal
C16:0 C18:0 C18:1
rela
tive
LCCo
Aco
nten
t/g ti
ssue

76
Figure 16: Effect of Pharmacological IKK Inhibitor on Food Intake Pharmacological inhibition of hypothalamic IKK (icv, 10ug PS-1145) represses food intake in HF, but not LF, fed rats. Error bars represent the standard error of the mean (SEM). Student’s t-test was used to determine significance between inhibitor and vehicle treatment on food intake within each diet group. ** p<0.01, n=5-8 per group.
020406080
100120
inhibitor - + - +LF LF HF HFdiet
**
24hr
food
inta
ke(k
cal)

77
Figure 17: Effect of Pharmacological IKK Inhibitor on Hypothalamic Insulin Signaling in HF Fed, Obese Rats. Pharmacological inhibition of hypothalamic IKK enhances insulin-stimulated pPKB in HF fed, obese rats. Error bars represent the standard error of the mean (SEM). Two-tail student’s t-test was used to assess significance between vehicle and insulin treated groups. * p<0.05, ***p<0.001, n=4-5 per group.
0.0
0.5
1.0
1.5
2.0
2.5
****
insulin - + - + - +LF LF HF HF HF HFdiet
inhibitor - - - - + +
pPKB
(rela
tive
units
)

78
our laboratory and others [52] suggest that a similar mechanism of high-fat diet-induced
insulin resistance may also occur in the hypothalamus of obese animals. Thus, I sought
to extend my initial findings in high-fat diet-induced obesity to determine the ability of
fatty acids administered directly into the brain of lean, chow fed animals to induce
hypothalamic insulin resistance via a similar mechanism.
Long-term high-fat feeding is associated with the accumulation of saturated, but
not unsaturated, long chain fatty acyl-CoAs (LC-CoAs) within the hypothalamus of obese
rats [146]. To determine if saturated fatty acids mediate the increase in hypothalamic
LC-CoA content observed with HF feeding, I investigated the effects of icv palmitate
infusion in lean rats maintained on a standard chow diet. Palmitate infusion mimicked
the effects of high-fat feeding to increase hypothalamic content of the saturated LC-CoA
species, palmitoyl- and stearoyl-CoA, but unlike HF feeding also increased levels of the
unsaturated fatty acid, oleoyl-CoA. That oleoyl-CoA was also increased with icv
palmitate infusion, but not HF feeding, suggests that the hypothalamic accumulation of
LC-CoA under normal conditions (i.e. HF feeding) may also involve indirect effects of
dietary fat on hypothalamic lipid metabolism. In keeping with our hypothesis that
saturated fatty acids specifically increase hypothalamic LC-CoA content, infusion of the
monounsaturated fat, oleate, failed to induce a significant increase in any of the LC-CoA
species measured compared to vehicle controls. The accumulation of hypothalamic LC-
CoA is hypothesized to lead to activation of inflammatory signaling cascades involving
IKKβ.
Previous work from our laboratory has demonstrated that high-fat diet-induced
obesity is associated with both elevated LC-CoA content and activation of IKKβ in the
hypothalamus [146]. This effect was recapitulated with icv palmitate infusion in lean,
chow fed rats suggesting that saturated fatty acids are involved in the inflammatory
response induced by high-fat feeding. Activation of IKKβ can induce inhibitory serine

79
phosphorylation of components of the insulin signaling pathway and impair signal
transduction. This mechanism has been implicated in both the peripheral and central
insulin resistance associated with HF DIO. Concomitant with increased LC-CoA content
and elevated IKKβ activity, icv palmitate infusion in lean rats maintained on a standard
chow diet significantly blunted insulin signal transduction in the hypothalamus compared
to vehicle controls in which activation of PKB was readily detected. However, in contrast
to the effects of long-term HF feeding on phosphorylation of PKB, palmitate infusion did
not recapitulate the elevation in basal pPKB. This suggests that chronic exposure to
saturated fat is required to increase basal pPKB and impair insulin action via a
mechanism similar to long-term depression as discussed in Chapter III, whereas acute
exposure to saturated fat directly impairs insulin signal transduction. This raises the
possibility that dietary fat impairs hypothalamic insulin action via two distinct
mechanisms. Together, these observations support a model in which consumption of a
diet high in saturated fat contributes to the development of CNS insulin resistance
possibly via a mechanism involving either elevated circulating FFA levels or increased
de novo tissue synthesis of saturated fatty acids resulting in accumulation of LC-CoAs in
hypothalamic neurons. Furthermore, the finding that hypothalamic IKKβ signaling
increases in response to an acute icv infusion of palmitate supports my hypothesis of a
direct link between exposure to excess saturated fats and inflammatory signling within
the hypothalamus. While these data demonstrate a clear association between fatty acid
induced IKKβ activity and insulin resistance in the hypothalamus, they do not establish a
direct role of IKKβ in the development of fatty acid induced hypothalamic insulin
resistance.
As a direct link between IKKβ activity and insulin resistance has been
demonstrated in peripheral tissues [36, 208]; I sought to establish a similar relationship
in the hypothalamus of HF fed obese rats compared to LF fed lean controls using a

80
pharmacological inhibitor of IKK. Since HF feeding significantly increases hypothalamic
IKKβ activity and IKKβ activity is proposed to impair hypothalamic insulin action;
inhibition of the IKKβ signal would be expected to, at least partially, restore both the
behavioral and biochemical effects of insulin action. Recall that insulin acts as a
catabolic hormone within the hypothalamus to reduce food intake and increase energy
expenditure; effects that are blunted in HF DIO potentially via IKKβ mediated insulin
resistance. Accordingly, pharmacological inhibition of hypothalamic IKK potently
reduced food intake in HF fed rats characterized by increased IKKβ activity and
hypothalamic insulin resistance, but had no effect on food intake in LF fed rats
characterized by relatively low IKKβ activity and hypothalamic insulin sensitivity. In fact,
IKKβ inhibition reduced food intake in HF fed group to levels below that of LF fed
animals. A possible explanation is that HF fed animals are characterized by
hyperinsulinemia and hyperleptinemia. If IKKβ activity mediates resistance to these
hormones, removal of this signal will permit insulin and leptin signaling and reduce food
intake in proportion to the signal (greater than in LF group). In addition, pretreatment
with the IKK inhibitor in HF fed rats modestly, but significantly, increased insulin
stimulated activation of PKB in the hypothalamus of rats compared to insulin stimulation
alone. Together these data support a direct role of IKKβ in HF diet-induce insulin
resistance.
In conclusion, these studies demonstrated that icv infusion of a saturated fatty
acid (palmitate), but not an unsaturated fatty acid (oleate) recapitulated the effects of the
HF lard-based diet to increase hypothalamic LC-CoA content and induce hypothalamic
inflammation and insulin resistance. In addition, these studies demonstrate that
activation of IKKβ contributes to increased food intake and insulin resistance associated
with HF DIO. These results support a model in which cellular exposure to excess
nutrients, specifically saturated fat, triggers cellular inflammation and insulin resistance

81
that in turn contributes to the pathogenesis of obesity. The ability of specific fatty acids
to modulate the activation of inflammation may represent a potential mechanism of high-
fat diet-induced hypothalamic resistance and obesity. These saturation dependent
effects led me to identify potential “fat sensing” target molecules that may be involved in
the development of HF diet-induced obesity.

82
CHAPTER V
DEFICIENCY OF THE PRO-INFLAMMATORY SIGNALING MOLECULE, TLR4,
REDUCES BODY WEIGHT AND ADIPOSITY
Introduction
Obesity and Type II Diabetes Mellitus are characterized by central and peripheral
insulin resistance that in many cases is accompanied by a low-grade chronic
inflammatory state [38, 55, 159, 204]. Current models of high-fat diet-induced obesity
suggest that pro-inflammatory signaling molecules, when activated, can negatively
impact the insulin signaling cascade to induce insulin resistance in central and peripheral
tissues [52, 168, 169]. Although mechanisms linking dietary fat to pro-inflammatory
signaling in these tissues is poorly understood, a recent link has been made between
fatty acids implicated in high-fat diet-induced obesity and the toll-like receptor 4 (TLR4).
The toll-like receptor family members are expressed by cells as part of the innate
immune system and are linked to the promotion of pro-inflammatory cytokines [4, 81].
Lipopolysaccharide (LPS) of gram negative bacteria was identified as the original ligand
of TLR4 [145]; specifically, the lipid A component of LPS, which is composed of acylated
saturated fatty acids. This saturated acid component is responsible for ligand
recognition and receptor activation of TLR4, as removal of this component results in
complete loss of LPS activity [125, 143]. Additional studies have demonstrated that long
chain saturated fatty acids, independent of LPS, can function as a ligand and induce
TLR4 activity along with downstream pro-inflammatory signaling; whereas certain
unsaturated fatty acids act as antagonists of TLR4 signaling [98, 99]. Given that most
tissues of the body, including the brain and insulin-sensitive tissues, express TLR4 [34,

83
95, 131], TLR4 is an intriguing target for a mechanism linking dietary derived fatty acids,
pro-inflammatory signaling, and insulin resistance.
Elucidation of the TLR4 signaling pathway revealed that activation of IKKβ and
the IKK complex promoted the subsequent translocation of the transcription factor NFκB
to the nucleus where it regulates expression of several pro-inflammatory cytokines [109].
The IKKβ/NFκB pathway has been implicated in the development of insulin resistance
via both direct and indirect effects [167]. IKKβ can directly impair the insulin signaling
pathway via inhibitory serine phosphorylation of the insulin receptor and IRS proteins
thereby preventing the association and activation of PI3K and other downstream effects
as discussed in chapter IV [211]. In addition, activation of NFκB can indirectly impair
insulin action via transcription of pro-inflammatory cytokines, such as TNFα and IL-6,
both of which are known inducers of insulin resistance [36, 78]. Data from our laboratory
and presented here have defined a role of IKKβ centrally in HF DIO, and more
specifically a diet enriched in long-chain saturated fat (an endogenous TLR4 agonist).
Activation of IKKβ through the TLR4 signaling pathway induced by extracellular
saturated fatty acids, may thus contribute to the development of high-fat diet-induced
insulin resistance.
The role of TLR4 in high-fat diet-induced obesity and insulin resistance has been
studied in several models of TLR4 deficiency and in various peripheral tissues [142, 165,
184]. These studies support a link between TLR4 and high-fat diet-induced peripheral
insulin resistance via activation of inflammatory signals. However, lacking from these
original studies was discussion of a potential role for TLR4 in central insulin signaling
and regulation of energy homeostasis. Since TLR4 is 1) expressed in central tissues
associated with the regulation of energy homeostasis, 2) is regulated by dietary fat in a
saturation dependent manner, and 3) initiates an inflammatory signaling cascade
associated with insulin resistance; it is a likely candidate in the mechanism of high-fat

84
diet-induced hypothalamic resistance and obesity. It seems plausible that activation of
TLR4 by dietary fatty acids may also induce hypothalamic resistance via a similar
inflammatory mechanism as diet-induced obesity. Whether dietary fat activates
inflammatory molecules via TLR4 signaling in the hypothalamus to induce insulin
resistance and impair energy homeostasis is therefore an important unanswered
question. I hypothesize that loss of TLR4 will ameliorate high-fat DIO, in part, via
centrally mediated mechanisms.
Results
Mouse Model of TLR4 Deficiency
I utilized a mouse model of TLR4 deficiency to study the effects of TLR4
signaling on high-fat diet-induced obesity. Mice originally identified as unresponsive to
LPS were determined to lack the gene encoding TLR4 (C57BL/10ScNJ mice, T4). The
absence of the TLR4 gene in these mice was confirmed by assessing the inflammatory
response to LPS, an agonist of TLR4, and quantitative determination of mRNA levels.
LPS treatment failed to induce cytokine expression as measured by IL-6 levels and
TLR4 mRNA was undetectable in T4 mice (Figure 18 and 19 respectively). Baseline
plasma IL-6 levels were below assay detection (< 7.8 pg/ml) in both wild-type (WT) and
T4 male mice (Figure 18A). Following a single intraperitoneal injection of LPS plasma
cytokine levels of IL-6 were dramatically elevated in WT mice compared to vehicle
controls (3500±585 pg/ml). This effect was almost completely abolished in T4 mice
(160±30 pg/mg) and plasma IL-6 levels were significantly reduced compared to LPS
treated WT mice (p<0.001; Figure 18A). LPS treatment induced a significant increase in
liver IL-6 production in WT mice compared to vehicle controls (Figure 18B, # symbols;
WT-veh vs WT-LPS 4600±190 vs 3100±360 pg/ml, p<0.01), but had no effect in T4 mice
(T4-veh vs T4-LPS 1600±180 vs 1900±150 pg/ml, p=ns). Furthermore, the levels of IL-6

85
in livers of T4 mice were significantly lower than respective WT controls independent of
LPS treatment (Figure 18B, * symbols; WT-veh vs T4-veh, p<0.01; WT-LPS vs T4-LPS
p<0.001). Although LPS administered peripherally did not increase local IL-6 production
within the hypothalamus in either WT or T4 mice (Figure 18C; veh vs LPS, p=ns),
hypothalamic IL-6 levels were significantly lower in T4 mice compared to WT controls
independent of LPS treatment (T4 vs WT, vehicle groups, 86±11 vs 160±8 pg/mg,
p<0.01; LPS groups, 89±9 vs 140±23 pg/mg, p<0.01). In addition, TLR4 mRNA levels
were measured by real-time RT- PCR in liver samples of male and female mice. TLR4
message was detected in all WT mice, but not in T4 mice, confirming our model of TLR4
deficiency (Figure 19A,B). In addition, diet had no appreciable effect on TLR4
expression.
Effect of TLR4 Deficiency on Body Weight and Composition
As demonstrated in Chapter III, diets enriched in long-chain saturated fat
promote obesity. In addition these fats are also associated with chronic inflammation in
both rodents and humans [68]. Since saturated fatty acids are known to activate TLR4
and downstream inflammatory signaling pathways associated with insulin resistance and
obesity, I sought to determine whether deletion of TLR4 would protect against high-fat
diet-induced obesity. Male and female WT and T4 mice were placed on either a low-fat
(LF; 10%kcal from fat, Table 1) or high-fat (HF; 45%kcal from fat, Table 1) diet at 4 wks
of age and followed for 10 wks. All metabolic data values are listed in Table 4 and 5
(male and female data, respectively; p 105-6). Body weight curves and end-point
analyses are shown for both male and female mice (Figure 20A-H). Male and female
TLR4 deficient mice weighed significantly less than respective WT controls on the same
diet over the course of the 10 week study (Figure 20A,B). However, no overt growth
abnormalities were apparent in T4 male or female mice as body weight gain was similar

86
Figure 18: Mouse Model of TLR4 deficiency: LPS Response Plasma (A), liver (B), and hypothalamic (C) levels of the inflammatory cytokine IL-6 following intraperitoneal injection of vehicle or LPS (12.5µg, 1 hour), a TLR4 agonist, in WT (white bars) and TLR4 deficient male mice (T4, black bars). Error bars represent the standard error of the mean (SEM). One-way ANOVA with Bonferroni’s Multiple Comparison Test was used to determine significance between selected pairs. * symbols represent WT vs T4 comparisons within treatment groups, and # symbols represent veh vs LPS comparisons within each genotype. Two symbols p<0.01, three symbols p<0.001, n=4 per group.
A
B
C
0
1000
2000
3000
4000
5000
LPS - - + +
** ***
##
liver
IL-6
(pg/
mg
prot
ein)
0
200
400
600
800
1000
LPS - - + +
**
WTT4
**
hypo
IL-6
(pg/
mg
prot
ein)
0
1000
2000
3000
4000
5000
LPS - - + +
ndnd ***pl
asm
a IL
-6(p
g/m
gpr
otei
n)
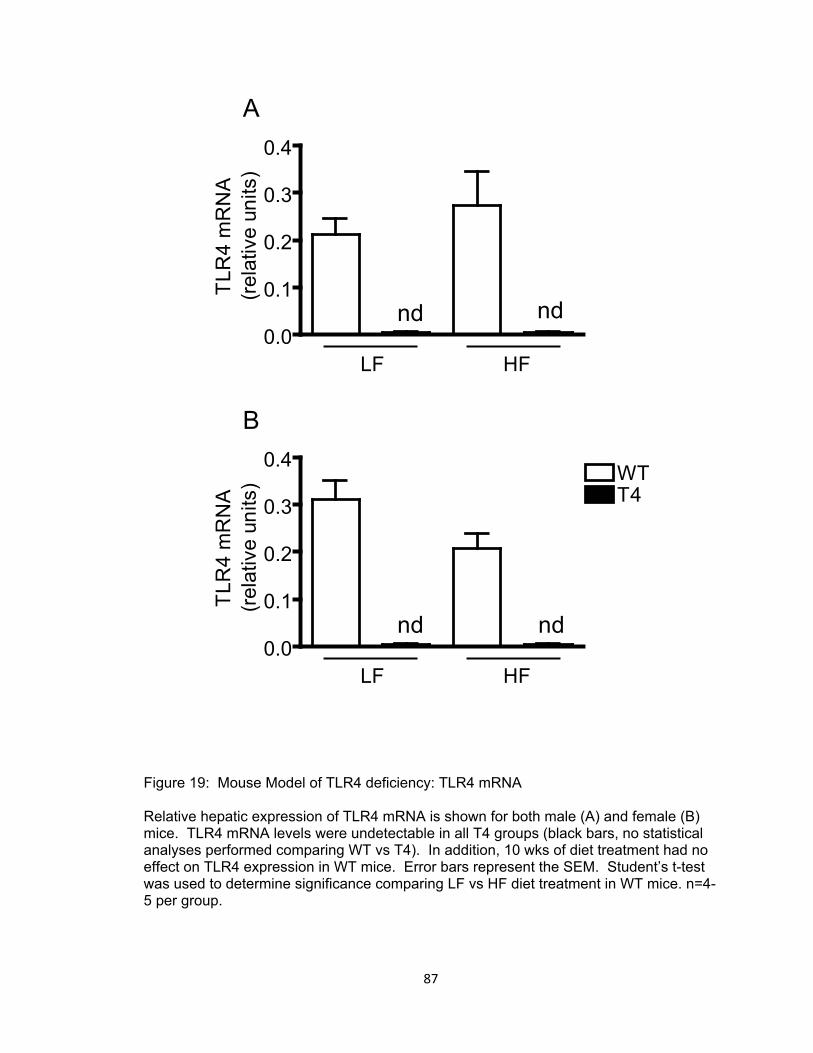
87
Figure 19: Mouse Model of TLR4 deficiency: TLR4 mRNA
Relative hepatic expression of TLR4 mRNA is shown for both male (A) and female (B) mice. TLR4 mRNA levels were undetectable in all T4 groups (black bars, no statistical analyses performed comparing WT vs T4). In addition, 10 wks of diet treatment had no effect on TLR4 expression in WT mice. Error bars represent the SEM. Student’s t-test was used to determine significance comparing LF vs HF diet treatment in WT mice. n=4-5 per group.
B
A
0.0
0.1
0.2
0.3
0.4
ndnd
HFLF
TLR
4m
RN
A(re
lativ
eun
its)
0.0
0.1
0.2
0.3
0.4 WTT4
nd nd
HFLF
TLR
4m
RN
A(re
lativ
eun
its)

88
to WT controls regardless of diet treatment (Figure 20C,D respectively). Body
composition analyses were performed to determine whether TLR4 deficiency altered
adiposity or merely resulted in a “smaller” body plan. After 10 wks of diet, T4 mice were
leaner and gained less fat mass than WT controls in both male and female mice (Figure
20E-H, T4 vs WT within diet treatments, all comparisons significant except LF female
group). High-fat feeding significantly increased adiposity in WT mice compare to LF fed
controls (WT-LF vs WT-HF; males p<0.001, females p<0.001). High-fat feeding induced
a similar increase in adiposity of male T4 mice (50% vs 55% in WT mice) although
absolute percent adiposity was significantly lower, whereas high-fat feeding had no
effect on adiposity in female T4 mice. Female T4 mice were completely protected from
HF diet-induced obesity.
Effect of TLR4 Deficiency on Food Intake and Energy Expenditure
Body weight and adiposity are regulated by the relative balance between food
intake and energy expenditure through the process of energy homeostasis. To
determine whether the differences in body weight and adiposity observed in TLR4
deficient mice could be attributed to a disruption of energy homeostasis, food intake and
energy expenditure were assessed in these mice. Food intake data was monitored
weekly and reported as cumulative caloric intake (Figure 21). TLR4 deficiency had no
effect on total food intake compared to WT controls except in LF fed female mice in
which food intake was slightly reduced (T4-LF vs WT-LF, ~10% lower, p<0.05). In
addition, TLR4 deficiency had no effect on high-fat diet-induced hyperphagia (excess
caloric intake). Food intake was similarly elevated in WT and T4 mice compared to LF
fed controls (~15% increase in male mice, ~20-25% increase in female mice).
Feed efficiency was calculated as an estimate of energy expenditure and is
shown in Figure 22. The rationale for estimating energy expenditure from feed efficiency

89
Figure 20: Effect of TLR4 Deficiency on Body Weight and Composition Body weight and adiposity measurements for male and female WT and TLR4 deficient. Error bars represent the SEM. Two-way ANOVA with Bonferroni post-tests was used to determine significance in panels A-B, E-F. Symbols above the lines represent WT vs T4 on HF diet, symbols below the lines represent WT vs T4 on LF diet. One-way ANOVA with Bonferroni’s Multiple Comparison Test was used to determine significance in panels C-D, G-H. * symbols represent WT vs T4 within diet, and # symbols represent LF vs HF within genotype. One symbol p<0.05, two symbols p<0.01, three symbols p<0.001, n=13-20 per group in male mice, n=8-11 per group in female mice.
0
5
10
15
20
HFLF
####
body
wei
ghtg
ain
(g)
Males Females
A
C
E
G
B
D
F
H
0 2 4 6 8 1010
20
30
40
* * *
*****
weeks on diet
body
wei
ght(
g)
0 2 4 6 8 1010
20
30
40
WT-LFWT-HFT4-LFT4-HF
* *****
weeks on diet
body
wei
ght(
g)
0 2 4 6 8 100
10
20
30
40
WT-LF
T4-LFWT-HF
T4-HF
***
weeks on diet
%ad
ipos
ity0
5
10
15
20
### ###
WTT4
body
wei
ghtg
ain
(g)
HFLF
0 2 4 6 8 100
10
20
30
40
*
***
***
**
weeks on diet
%ad
ipos
ity
0
2
4
6
8
10
HFLF
###
**
WTT4
fatm
ass
gain
(g)
0
2
4
6
8
10
HFLF HFLF HFLF
###
###
*
***
fatm
ass
gain
(g)

90
calculations was discussed in detail in Chapter III. Briefly, feed efficiency is calculated
as the amount of weight gained per kilocalorie consumed (wt gain/kcal) and indicates
how effectively the body stores nutrients and accrues mass (as opposed to utilizing
nutrients for energy production). Since body weight gain and food intake are known,
relative energy expenditure can be inferred based on the energy balance equation. No
differences were observed in feed efficiency between WT and T4 male mice within the
diet groups suggesting that TLR4 deficiency does not affect energy expenditure in male
mice. Furthermore, diet did not significantly affect feed efficiency in male mice (HF vs
LF, p=ns). In female mice, TLR4 deficiency did not significantly alter feed efficiency (WT
vs T4, within diet comparisons p=ns), but HF diet significantly increased feed efficiency
in both WT and T4 mice compared to their respective LF fed counterparts (HF vs LF,
~20% increase in WT and T4).
While feed efficiency addresses body weight gain and energy expenditure, a
related calculation addresses body composition and energy storage. Calculated as fat
mass gain divided by kilocalories consumed this value, termed energy efficiency,
indicates how effectively the body stores nutrients in the form of adipose stores (Figure
22C,D). Essentially, a relative increase in energy efficiency means that per calorie
consumed, more adipose tissue is accrued. In male mice, high-fat feeding induced a
significant increase in energy efficiency in both WT and T4 male mice compared to their
LF fed counterparts (Figure 22C; LF vs HF, p<0.001 in WT and T4). However, relative
to WT controls, energy efficiency was significantly reduced in T4 male mice fed both
diets (Figure 22C; T4 vs WT, ~50% decrease in LF p<0.05, and ~33% decrease in HF
p<0.001). In female mice, high-fat feeding induced a significant increase in energy
efficiency in WT mice (Figure 22D; HF vs LF, ~50% increase p<0.01), but had no effect

91
in T4 mice. Relative to WT controls, energy efficiency was significantly reduced in HF
fed T4 female mice (Figure 22D; T4 vs WT, ~50% decrease p<0.01).
To confirm the estimates of energy expenditure derived from the feed efficiency
calculations above, indirect calorimetry and activity measurements were collected before
and after 10 wks of HF feeding in a cohort of male mice (Figure 23A-C). Indirect
calorimetry provides an estimate of basal energy expenditure, calculated as heat
production from measurements of oxygen consumption and carbon dioxide production
(by-products of energy metabolism). Heat production was normalized to lean mass as
lean mass is considered to be metabolically active tissue accounting for the majority of
energy expenditure, as well as to account for differences observed in body weight and
body composition attributed to genotype and/or diet effects. In accordance with feed
efficiency calculations in male mice above, heat production (i.e. energy expenditure) was
similar across all groups (Figure 23A). In addition, no significant differences in
locomotor activity (# of beam crosses) were observed between WT and T4 mice, or
between baseline and 10 wks of HF diet (Figure 23B). Respiratory quotient (RQ) is an
index of substrate utilization calculated as the ratio of carbon dioxide production to
oxygen consumption. Based on oxidation equations for glucose and fat metabolism, a
RQ value of 1 indicates carbohydrate utilization, whereas a RQ value of 0.7 indicates
fatty acid utilization. The closer the RQ value to 1, the greater the proportion of
carbohydrates metabolized for energy, whereas the closer the RQ value to 0.7, the
greater the proportion of fatty acids metabolized for energy. No differences were
observed in the RQ values of WT and T4 mice at baseline or after 10 wks of high-fat
feeding indicating that TLR4 deficiency does not preferentially alter substrate utilization.
However, 10wks of high-fat feeding significantly reduced RQ in WT and T4 mice
compared to baseline levels (Figure 23C; HF vs LF, p<0.001 for both WT and T4).

92
Figure 21: Effect of TLR4 Deficiency on Food Intake Cumulative food intake in male (A) and female (B) mice. Error bars represent the SEM. One-way ANOVA with Bonferroni’s Multiple Comparison Test was used to determine significance between selected pairs. * symbols represent WT vs T4 within diet, and # symbols represent LF vs HF within genotype. One symbol p<0.05, three symbols p<0.001, n=13-20 per group in male mice, n=8-11 per group in female mice.
A
B
0
200
400
600
800
1000### ###
HFLF
cum
ulat
ive
food
inta
ke(k
cal)
0
200
400
600
800
1000WTT4
HFLF
*### ###
cum
ulat
ive
food
inta
ke(k
cal)

93
Figure 22. Effect of TLR4 Deficiency on Feed and Energy Efficiency Feed efficiency was calculated as an index of energy expenditure in male (A) and female (B) mice. A related calculation, energy efficiency, is an index of obesogenic potential in male (C) and female (D) mice. Error bars represent the SEM. One-way ANOVA with Bonferroni’s Multiple Comparison Test was used to determine significance between selected pairs. * symbols represent WT vs T4 within diet, and # symbols represent LF vs HF within genotype. One symbol p<0.05, two symbols p<0.01, three symbols p<0.001, n=13-20 per group in male mice, n=8-11 per group in female mice.
A
C
B
D
Males Females
0.00
0.01
0.02
0.03 WTT4
HFLF
# ##
bwga
in/k
cal
0.000
0.005
0.010
0.015
HFLF
##
**
WTT4
fatm
ass
gain
/kca
l
0.000
0.005
0.010
0.015
HFLF
*
###
###***
fatm
ass
gain
/kca
l
0.00
0.01
0.02
0.03
HFLF
bwga
in/k
cal

94
Figure 23: Effect of TLR4 Deficiency on Energy Expenditure Indirect calorimetry was used to assess energy expenditure in male mice before and after 10 wks of HF feeding. Heat production, normalized to lean mass (A), ambulatory activity (B), and respiratory quotient (C) values were measured in these mice. Error bars represent the SEM. One-way ANOVA with Bonferroni’s Multiple Comparison Test was used to determine significance between selected pairs. # symbols represent LF vs HF comparison within genotype, p<0.001, n=6-10 per group.
A
C
B
0.00
0.01
0.02
0.03
postprekc
al/h
r/lea
nm
ass
0
25000
50000
75000
postpre
ambu
lato
ryac
tivity
(#be
amcr
osse
s)
0.7
0.8
0.9
1.0
postpre
### ###
WTT4
RQ
(VC
O2/
VO
2)

95
Effect of TLR4 Deficiency on Glucose Tolerance
In order to determine if TLR4 deficiency had an effect on peripheral glucose
metabolism, an intraperitoneal glucose tolerance test (IPGTT, 1g/kg lean mass) was
performed following 10 wks of LF and HF feeding. No difference was observed in
fasting blood glucose, fasting plasma insulin, and glucose excursion curves quantified as
area under the curve (AUC) during an IPGTT between WT and T4 LF fed mice (Figure
24A-F, male and female mice). However, 10 wks of HF feeding induced fasting
hyperglycemia, hyperinsulinemia, and impaired glucose tolerance in WT male mice,
whereas TLR4 deficient male mice were completely protected from these effects. In
female mice, HF feeding did not significantly increase fasting blood glucose or impair
glucose tolerance in WT or T4 mice compared to respective LF fed controls and only
moderately elevated fasting plasma insulin levels (Figure 24B, D, F). Together, these
data suggest that female mice, independent of TLR4 deficiency, are relatively protected
from high-fat diet-induced impairments in glucose metabolism; a finding that has been
confirmed by others [153]. However, TLR4 deficiency protected male mice against
impaired glucose metabolism induced by HF feeding.
Effect of TLR4 Deficiency on Lipid Metabolism
The following parameters were assessed to determine whether the reduced
adiposity in TLR4 deficient mice is potentially due to gross alterations in lipid
metabolism; fasting plasma free fatty acids (FFA), triglycerides (TG), and leptin levels
(Tables 4,5; p 106-7), as well as mRNA levels of stearoyl CoA desaturase-1 (SCD-1;
Figure 25), a key mediator of lipid metabolism. No significant differences in plasma FFA
or TG levels were observed between WT and T4 male mice fed both diets (except WT
vs T4 fed LF diet, ~25% difference, p<0.05). In female mice, plasma FFAs and TGs
were significantly elevated in LF, but not HF, fed T4 mice compared to WT controls (T4

96
vs WT, LF diet, ~65% increase in FFA, ~35% increase in TGs). Plasma leptin levels
were significantly lower in HF fed T4 mice compared to WT controls (10.2±1.7 vs
43.1±0.9, p<0.001). While no differences were observed in leptin levels among female
mice, female leptin levels were comparable to levels observed in LF fed WT male mice.
SCD-1 is a delta-9 fatty acid desaturase; a lipogenic enzyme catalyzing the synthesis of
monounsaturated fatty acids. Along with palmitate, stearate is the major substrate for
the enzyme stearoyl-CoA desaturase, which catalyzes the conversion of stearate to
oleate [157]. Oleate is the preferred substrate of SCD-1 for the synthesis of TG and
other complex lipids [157]. Hepatic mRNA levels of SCD-1 are shown in Figure 25 (HF
diet only, WT and T4 male and female mice). SCD-1 mRNA levels were significantly
reduced in male T4 mice compared to WT controls (0.09±0.02 vs 0.28±0.06 relative
units, p<0.05) consistent with reduced liver TG accumulation observed in another mouse
model of TLR4 deficiency [142]. Although there was no difference in SCD-1 mRNA
levels of WT and T4 female mice, the levels of SCD-1 in female mice were comparable
to that of T4 male mice, i.e. significantly lower than WT male mice (WT, 0.14±0.02; T4,
0.09±0.01) suggestive of reduced liver TG accumulation and improved hepatic function.
Effect of TLR4 Deficiency on Inflammatory IKKβ Signaling
The phenotype of decreased body weight and adiposity combined with the
changes observed in glucose metabolism of TLR4 deficient mice suggests that TLR4 is
involved in energy homeostasis (i.e. central insulin and leptin sensitivity) and peripheral
insulin sensitivity. The association between high-fat diet induced obesity and
inflammation makes TLR4 a likely candidate as a potential mediator of this relationship
because it is activated by fatty acids in a saturation dependent manner and induces an
inflammatory signaling cascade known to be involved in the development of insulin
resistance. Thus, I investigated whether the metabolic effects of TLR4 are potentially

97
Figure 24: Effect of TLR4 Deficiency on Glucose Tolerance
An intraperitoneal glucose tolerance test was performed after 10 wks of diet treatment in male and female mice (A-B) and area under the curve was calculated from baseline blood glucose values as an index of glucose tolerance (C-D). Four hour fasting plasma insulin levels are shown in panels E,F. Error bars represent the SEM. Two-way ANOVA with Bonferroni post-tests was used to determine significance in panels A-B. Symbols above the lines represent WT vs T4 on HF diet. One-way ANOVA with Bonferroni’s Multiple Comparison Test was used to determine significance between selected pairs. * symbols represent WT vs T4 within diet, and # symbols represent LF vs HF within genotype. One symbol p<0.05, two symbols p<0.01, three symbols p<0.001, n=13-20 per group in male mice, n=8-11 per group in female mice.
A
C
E
B
D
F
Males Females
-30 0 30 60 90 12050
150
250
350
450WT-HF
T4-HF
WT-LF
T4-LF
*
time (min)
gluc
ose
(mg/
dl)
-30 0 30 60 90 12050
150
250
350
450 ***
**
time (min)
gluc
ose
(mg/
dl)
0
5000
10000
15000
20000
HFLF HFLF HFLF
###
***AU
C
0
5000
10000
15000
20000
HFLF HFLF HFLF
WTT4
AU
C
0.0
0.5
1.0
1.5WTT4
HFLF HFLF HFLF
#####
insu
lin(n
g/m
l)
0.0
0.5
1.0
1.5
HFLF HFLF HFLF
##
**
insu
lin(n
g/m
l)

98
Figure 25: Effect of TLR4 Deficiency on a Major Regulator of Hepatic Lipid Metabolism
Hepatic mRNA levels of stearoyl-CoA desaturase-1 (SCD-1) were determined by quantitative real-time reverse transcriptase PCR in HF fed male and female mice. Error bars represent the SEM. Student’s t-test was used to determine significance in male and female mice separately, WT vs T4. * p<0.05, n=4-5 per group in male and female mice
0.0
0.1
0.2
0.3
0.4 WTT4
femalemale
*
liver
SCD-
1m
RN
A(a
rbitr
ary
units
)

99
mediated via central or peripheral effects, or a combination of both. In this study,
hypothalamic pIKKβ levels were elevated following 10 wks of HF feeding in WT and T4
male mice compared to LF fed controls (Figure 26A; LF vs HF, WT 1.00±0.16 vs
1.46±0.20 relative density, p=0.08, T4 0.22±0.08 vs 1.02±0.08 relative density, p<0.01).
However, absolute levels of pIKKβ were lower in TLR4 deficient male mice compared
toWT controls (T4 vs WT; LF diet p<0.01, HF diet p=0.09). No differences were
observed in hypothalamic pIKKβ levels among female groups (Figure 26B). In the liver,
no differences in pIKKβ were observed between WT and T4 mice (Figure 26C,D).
Discussion
In these studies I utilized a mouse model of TLR4 deficiency to examine the
effects of TLR4 signaling in high-fat diet-induced obesity. Dietary fatty acids, specifically
saturated fatty acids, activate TLR4 and downstream inflammatory signaling molecules
associated with the development of insulin resistance. Previous work investigating TLR4
action in peripheral tissues supports a role for TLR4 in high-fat diet-induced insulin
resistance via activation of inflammatory molecules. Since TLR4 is also expressed in
regions of the central nervous system associated with the regulation of energy
homeostasis, I hypothesized that activation of TLR4 by dietary fatty acids may also
induce hypothalamic insulin resistance via a similar inflammatory mediated mechanism
in diet-induced obesity. The phenotype of decreased body weight and adiposity
combined with the changes observed in glucose metabolism of TLR4 deficient mice
indicates that TLR4 may be involved in both energy homeostasis (i.e. hypothalamic
insulin and leptin sensitivity) and peripheral insulin sensitivity. Thus, I investigated
whether these metabolic effects of TLR4 signaling were mediated via central effects,
peripheral effects, or a combination of both.

100
Figure 26: Effect of TLR4 Deficiency on IKKβ Activity Phosphorylation of IKKβ in hypothalamic (A-B) and liver (C-D) tissues in male and female mice. Error bars represent the SEM. One-way ANOVA with Bonferroni’s Multiple Comparison Test was used to determine significance between selected pairs. * symbols represent WT vs T4 within diet, and # symbols represent LF vs HF within genotype. Two symbols p<0.01, n=5-8 per group in male and female mice.
Males Females
A
C
B
D
0.0
0.5
1.0
1.5
2.0
**
##
HFLF
hypo
pIK
Kβ
(rela
tive
dens
ity)
0.0
0.5
1.0
1.5
2.0WTT4
HFLF
hypo
pIK
Kβ
(rela
tive
dens
ity)
0.0
0.5
1.0
1.5
2.0
HFLF
##
liver
pIKK
β(re
lativ
ede
nsity
)
0.0
0.5
1.0
1.5
2.0 WTT4
HFLF
liver
pIKK
β(re
lativ
ede
nsity
)

101
These studies were performed in both male and female mice. Of consequence
to these studies are the well appreciated gender specific metabolic differences. For
example, data from both clinical and experimental studies have revealed that in addition
to its well characterized role in sexual development and reproduction, the sex hormone
estrogen exerts beneficial effects on insulin action and glucose homeostasis [107]. In
experimental animal models, ovariectomy was shown to impair insulin sensitivity and
glucose metabolism, a deleterious metabolic effect reversed by chronic administration of
estrogen [94, 191]. Furthermore, evidence indicates that the estrogen receptor ERα is
the main receptor involved in energy balance [15] as global deletion of ERα results in
obese, insulin resistant mice [75]. Disruption of ERα in the hypothalamus leads to
weight gain, increased visceral adiposity, hyperphagia, hyperglycemia and impaired
energy expenditure in female mice [128]. However, the mechanisms by which estrogen
influence insulin sensitivity and glucose metabolism remains poorly understood. In light
of this, the results from male and female mice in these studies are discussed separately.
Since saturated fatty acids are known TLR4 ligands, a diet low in fat would be
expected to have a minimal effect on TLR4 activity, whereas a diet high in fat would be
expected to increase TLR4 activity in WT mice. Thus, in a setting of low TLR4 activity
(LF diet), I predicted there would be no significant differences between WT and TLR4
deficient mice. Conversely, in a setting of elevated TLR4 activity (HF diet), I predicted
there would be significant differences between WT and TLR4 deficient mice if TLR4 is a
determinant of high-fat diet-induced obesity. Final body weight and adiposity levels were
significantly reduced in LF fed female TLR4 deficient mice compared to WT controls.
Since an effect was observed with LF feeding, either only a small amount of dietary fat is
sufficient to activate TLR4 in WT mice, or TLR4 deficiency exerts additional anti-obesity
effects independent of diet. Furthermore, TLR4 deficient female mice were completely
protected from increased adiposity associated with HF feeding.
102
To determine whether the reduced body weight and adiposity observed in TLR4
deficient female mice could be attributed to altered energy homeostasis; food intake and
energy expenditure (approximated by feed efficiency calculations) were assessed in
these mice. Cumulative food intake was slightly reduced in LF fed T4 female mice
compared WT controls whereas TLR4 deficiency per se had no effect on energy
expenditure as calculated by feed efficiency. This could potentially explain the lower
body weight and adiposity in LF fed T4 mice. However, food intake was similarly
increased and energy expenditure similarly decreased with HF feeding in both WT and
T4 mice compared to LF fed controls indicating a state of positive energy balance. This
may explain the increase in body weight of both WT and T4 female mice compared to LF
fed controls. Thus, although T4 mice weighed less than WT controls, TLR4 deficiency
failed to protect female mice against HF diet-induced weight gain.
Although TLR4 deficiency did not protect against body weight gain, recall that T4
female mice were completely protected from increased adiposity associated with HF
feeding. Related to the concept of feed efficiency, energy efficiency calculations indicate
how well the body stores nutrients in the form of adipose mass. Results from these
calculations indicate that TLR4 deficient female mice store less energy in the form of
adipose mass per calorie consumed than WT mice. These data suggest that TLR4 may
be involved in the central regulation of adipose stores, potentially via TLR4 mediated
activation of IKKβ resulting in impaired hypothalamic insulin sensitivity and disrupted
energy homeostasis.
Although there were no clear differences in hypothalamic IKKβ activity in female
mice, there was a trend towards reduced pIKKβ levels in HF fed TLR4 deficient female
mice compared to HF fed WT controls (~30% reduction, p=ns) in support of my
hypothesis that reduced inflammatory signaling in the hypothalamus of TLR4 deficient
mice contributes to the reduced adiposity observed in these animals via improved

103
energy homeostasis. In addition, hepatic IKKβ activity and glucose tolerance were not
improved in TLR4 deficient mice suggesting that the reduced adiposity in T4 mice is not
due to peripheral effects. However, HF feeding failed to induce a significant
inflammatory response, increase plasma insulin and leptin levels, and only modestly
impaired glucose tolerance in female mice. The relative protection from high-fat diet
induced insulin resistance in female mice may be explained by the beneficial metabolic
effects of estrogen.
The same measurements and analyses were performed in male WT and T4
mice. As observed in female mice, final body weight and adiposity levels were
significantly lower in male T4 mice compared to WT controls independent of diet.
Although TLR4 deficiency did not completely protect male mice from diet-induced
obesity, loss of TLR4 activity improved overall energy homeostasis resulting in a lean
phenotype.
Energy homeostasis is maintained by the balance of food intake and energy
expenditure and these processes are largely regulated by hypothalamic insulin and
leptin signaling that become impaired in models of high-fat diet-induced obesity. To
determine whether the reduced body weight and adiposity observed in TLR4 deficient
male mice could be attributed to improved hypothalamic regulation of energy
homeostasis; food intake and energy expenditure were assessed in these mice.
However, TLR4 deficiency had no effect on cumulative food intake and energy
expenditure compared to WT mice. Although TLR4 deficiency did not significantly alter
food intake and energy expenditure, energy efficiency calculations indicate that for the
same caloric intake, TLR4 deficient male mice store less energy in the form of adipose
mass compared to WT controls independent of diet treatment and may account for the
reduced adiposity observed in these mice.
104
As described above, a reduction in hypothalamic inflammatory signaling may
contribute to the reduced adiposity observed in these mice via improved insulin
sensitivity and energy homeostasis. In line with this, hypothalamic pIKKβ levels were
reduced in T4 mice compared to WT controls independent of diet treatment, whereas no
differences were observed in hepatic pIKKβ levels. These data point to a centrally
mediated effect of TLR4 deficiency on adiposity. However, TLR4 deficiency also
improved high-fat diet-induced hyperglycemia, hyperinsulinemia and impaired glucose
tolerance compared to WT controls. These improvements in peripheral glucose
homeostasis could account for the reduced adiposity observed in these mice as well. In
accordance with a peripheral effect of TLR4, Stearoyl-CoA Desaturase 1 (SCD-1) mRNA
levels were reduced in male TLR4 deficient mice compared to WT controls. SCD-1
activity is involved in lipid metabolism and deficiency of SCD-1 reduces triglyceride
accumulation, protects against weight gain, and increases insulin sensitivity [119, 150].
Although the mechanism of increased SCD-1 in TLR4 deficient mice is unknown, this
could at least partially explain the improved glucose homeostasis and decreased
adiposity in male mice.
In conclusion, both male and female TLR4 deficient mice weigh less and are
leaner than respective WT controls on both a low-fat and high-fat diet suggesting a
potential role for TLR4 in the regulation of adipose stores. I propose that the reduced
adiposity observed in both male and female TLR4 deficient mice may occur via a
mechanism of decreased hypothalamic inflammatory signaling resulting in improved
adiposity hormone signaling and improved energy homeostasis. Although these results
suggest that TLR4 mediated inflammatory signaling within the hypothalamus may
contribute, at least in part, to modulation of energy homeostatic pathways and adipose
accumulation; based on our observations it is not possible to rule out other pathways
and mechanisms involved in the development of diet-induced obesity. Whether CNS

105
resistance occurs early in the course of HF feeding and actively contributes to increased
food intake, adiposity and peripheral insulin resistance characteristic of DIO is an
additional important question to be addressed.

106
Table 4: Metabolic Profile of Male Mice LF HF
WT T4 WT T4
Body wt (g) 30.1 ± 0.3 28.1 ± 0.4* 35.0 ± 0.8### 31.1 ± 0.9***,##
Body wt gain (g) 12.4 ± 0.4 12.7 ± 0.5 16.6 ± 0.7### 15.1 ± 1.0#
Adiposity (%) 15.9 ± 0.8 9.5 ± 0.6*** 29.2 ± 1.5### 22.2 ± 1.4***,###
Fat mass gain (g) 3.4 ± 0.3 1.8 ± 0.2* 8.8 ± 0.7### 5.9 ± 0.6***,###
Total food intake (kcal) 645 ± 5 642 ± 4 736 ± 5### 719 ±10###
Feed efficiency (bw gain/kcal) 0.019 ± 0.001 0.019 ± 0.001 0.023 ± 0.001 0.021 ± 0.001
Energy efficiency (fat gain/kcal) 0.005 ± 0.000 0.003 ±
0.000* 0.012 ± 0.001###
0.008 ± 0.001***,###
Heat Production (kcal/hr/g lean mass) 0.024 ± 0.001 0.025 ± 0.001 0.024 ± 0.000 0.023 ± 0.001
Locomotor Activity(# beam crosses) 51600 ± 7580 58500 ± 9070 57300 ± 9630 60900 ± 1280
Respiratory Quotient 0.89 ± 0.006 0.88 ± 0.005 0.77 ± 0.005###
0.75 ± 0.006###
AUC 4220 ± 330 4430 ± 390 13450 ± 2200### 6240 ± 680***
Glucose (mg/dl) 152 ± 7 136 ± 5 196 ± 11### 147 ± 4**
Insulin (ng/dl) 0.56 ± 0.12 0.48 ± 0.11 1.13 ± 0.14## 0.58 ± 0.05**
Leptin (ng/dl) 8.0 ± 0.9 2.8 ± 0.3 43.1 ± 3.9### 10.2 ± 1.7***,#
FFA (mmol/L) 0.41 ± 0.06 0.46 ± 0.05 0.43 ± 0.07 0.47 ± 0.06
TG (mg/dl) 126 ± 5 95 ± 6 112 ± 11 91 ± 6 Table 4: Metabolic parameters of male WT and TLR4 deficient (T4) mice following 10 wks of LF and HF feeding are reported as the group mean ± SEM. One-way ANOVA with Bonferroni’s Multiple Comparison Test was used to determine significance between selected pairs. * symbols represent WT vs T4 within diet, and # symbols represent LF vs HF within genotype. One symbol p<0.05, two symbols p<0.01, three symbols p<0.001, n=13-20 per group.

107
Table 5: Metabolic Profile of Female Mice
LF HF
WT T4 WT T4
Body wt (g) 22.3 ± 0.5 21.2 ± 0.2 25.9 ± 1.4## 23.0 ± 0.4*
Body wt gain (g) 7.7 ± 0.3 8.0 ± 0.2 11.6 ± 1.0### 12.0 ± 0.3###
Adiposity (%) 14.1 ± 0.7 11.2 ± 0.8 23.2 ± 2.4### 12.9 ± 1.1***
Fat mass gain (g) 1.8 ± 0.2 1.4 ± 0.2 4.5 ± 0.9### 2.2 ± 0.3** Total food intake (kcal) 559 ±11 520 ± 6* 663 ±15### 662 ±12###
Feed efficiency (bw gain/kcal) 0.014 ± 0.001 0.015 ± 0.000 0.016 ±
0.001# 0.018 ± 0.000##
Energy efficiency (fat mass gain/kcal) 0.003 ± 0.000 0.003 ± 0.000 0.007 ±
0.000## 0.003 ± 0.000**
AUC 3240 ± 345 3560 ± 210 4370 ± 220 4660 ± 510
Glucose (mg/dl) 120 ± 5 124 ± 4 120 ± 5 116 ± 2
Insulin (ng/dl) 0.26 ± 0.02 0.27 ± 0.03 0.40 ± 0.01## 0.44 ± 0.03###
Leptin (ng/dl) 5.5 ± 0.7 4.4 ± 0.8 6.5 ± 0.6 3.8 ± 0.9
FFA (mmol/L) 0.28 ± 0.02 0.46 ± 0.06* 0.25 ± 0.03 0.31 ± 0.04
TG (mg/dl) 89 ± 7 122 ± 11* 81 ± 5 75 ± 4### Table 5: Metabolic parameters of female WT and TLR4 deficient (T4) mice following 10 weels of LF and HF feeding are reported as the group mean ± SEM. One-way ANOVA with Bonferroni’s Multiple Comparison Test was used to determine significance between selected pairs. * symbols represent WT vs T4 within diet, and # symbols represent LF vs HF within genotype. One symbol p<0.05, two symbols p<0.01, three symbols p<0.001, n=8-11 per group.
108
CHAPTER VI
HIGH-FAT DIET-INDUCED HYPOTHALAMIC INSULIN AND LEPTIN RESISTANCE
ARE MECHANISTICALLY AND TEMPORALLY DISTINCT AT THE ONSET OF
OBESITY.
Introduction
Our laboratory previously demonstrated that high-fat feeding is associated with
hypothalamic accumulation of long-chain fatty acyl-CoA (LC-CoA) molecules and
activation of the pro-inflammatory molecule IKKβ in diet-induced obese rats. Work from
chapter III specifically implicated long-chain saturated fat in DIO independent of
increased caloric intake. In support of these findings, work from chapter IV
demonstrated that an acute icv infusion of a saturated fatty acid, palmitate, recapitulated
the hypothalamic effects observed with chronic HF feeding (i.e. accumulation of LC-CoA
and increased IKKβ activity) in lean chow fed rats. In these studies, long-chain
saturated fat impaired hypothalamic insulin signaling and this effect is proposed to occur
via a mechanism of LC-CoA induced inflammatory signaling similar to the mechanism of
insulin resistance described in peripheral tissues.
Current models of energy homeostasis clearly implicate hypothalamic insulin and
leptin signaling in the regulation of adipose stores. Accordingly, these signaling
pathways are thought to be disrupted in order for obesity to develop. Since insulin and
leptin can utilize common intracellular signal transduction pathways [Niswender 2004,
Niswender 2001], neuronal resistance to these hormones may involve the same or
similar mechanisms. Thus, I hypothesize that dietary long-chain saturated fats induce
hypothalamic insulin and leptin resistance via a mechanism of LC-CoA induced
inflammatory signaling, ultimately resulting in the development of obesity.

109
However, it is easy to imagine a scenario in which obesity leads to these
changes in LC-CoA accumulation and inflammatory signaling in the hypothalamus,
instead of these hypothalamic changes leading to obesity. Obesity is characterized by
peripheral insulin resistance, increased lipolysis, and elevated circulating FFA; all of
which could potentially lead to the accumulation of lipid within the hypothalamus. In
addition, obesity is often associated with low grade inflammation. This could account for
the activation of IKKβ within the hypothalamus. Together, these data would suggest that
obesity causes hypothalamic insulin and leptin resistance. I propose, however, that
high-fat feeding induces obesity via impairments in hypothalamic insulin and leptin
sensitivity that result in disrupted energy homeostasis. This is then exacerbated by
obesity and peripheral insulin resistance. To address this hypothesis, I first sought to
determine whether central resistance precedes peripheral resistance and second,
whether the high-fat diet-induced changes in LC-CoA and IKKβ activity occur over a
time-course consistent with a role in hypothalamic insulin and leptin resistance, thereby
disrupting energy homeostasis and resulting in obesity. If these changes are primary to
the development of HF DIO, then they should occur prior to the accumulation of excess
body fat. Thus, in the following studies I first compared relative insulin sensitivities in the
hypothalamus, liver, and muscle tissue of HF fed rats, and second, I determined whether
changes in LC-CoA accumulation and IKKβ activation may contribute to impaired
hypothalamic insulin and leptin signaling prior to the onset of obesity in HF fed rats.
Results
Relative Insulin Sensitivity in Central and Peripheral Tissues
To determine whether the hypothalamus is more susceptible to high-fat diet-
induced insulin resistance than peripheral tissues, I compared the relative insulin
sensitivity of key peripheral tissues to that observed in the hypothalamus of rats from the

110
pair-feeding study in chapter III. Relative insulin sensitivity was assessed by the ability
of a peripheral glucose bolus to induce insulin mediated activation of PKB in the liver,
skeletal muscle, and hypothalamus of rats fed a low-fat (LF) or high-fat diet (ad libitum,
HF, and pair-fed, PF, to the caloric intake of the LF group) for 4 wks (Figure 27A-F). In
all tissues of LF fed rats, phosphorylation of PKB was significantly elevated following
glucose injection compared to vehicle controls (Figure 27A-C, LF-glu vs LF-veh p<0.01).
This effect remained intact with high-fat feeding in liver and muscle tissues (Figure 27;
panel A, HF p<0.01 and PF p<0.001; panel B PF p<0.05), but was completely blunted in
the hypothalamus of high-fat fed rats (Figure 27C). Likewise, when plotted versus
plasma insulin levels, PKB phosphorylation was significantly correlated with plasma
insulin concentration in all tissues of the LF group indicating insulin sensitivity (Figure
27D-F). Insulin sensitivity appeared intact in liver tissue of HF fed animals (Figure 27;
panel D, HF p<0.001 and PF p<0.001) and in muscle tissue of calorically restricted HF
fed animals (Figure 27; panel E, PF p<0.001), whereas insulin-stimulated activation of
hypothalamic PKB was completely inhibited in HF fed animals (Figure 27F, HF and PF
p=ns). These data suggest that the hypothalamus may be more susceptible than
peripheral tissues to HF diet-induced insulin resistance.
Early Onset of High-fat Diet-induced Obesity
It is well documented that rats fed a high-fat diet gain significantly more body
weight and fat mass compared to low-fat fed controls over time. However, it is
remarkable how quickly this change occurs upon exposure to a high-fat diet. I observed
a predictable pattern of diet-induced obesity in which body weight significantly diverged
by six days (Figure 28A; p<0.05), and adiposity significantly diverged by three
days(Figure 28B; p<0.05) of ad libitum HF feeding compared to LF fed controls. In
addition, a predictable pattern of food intake was observed during this period at the

111
Figure 27: Effect of Dietary Fat Intake on Relative Insulin Sensitivity in Central and Peripheral Tissues A,B,C. Glucose stimulated pPKB in liver, skeletal muscle, and hypothalamus, respectively. D,E,F. Relationship between plasma insulin levels and phosphorylation of PKB in liver, skeletal muscle, and hypothalamus, respectively. Error bars represent the standard error of the mean (SEM). Student’s t-test was used to determine significance of glucose stimulated pPKB compared to vehicle controls for each diet treatment (A-C). Pearson’s correlation was used to determine significance of correlation within each diet treatment (D-F). n=4-6 per group for panels A-C, n=8-12 for panels D-F.
0 1 2 3 4 5 6 7
1
2
3
4LF, R=0.89, p<0.01HF, R=0.86, p<0.001PF; R=0.97, p<0.001
insulin (mg/dl)
liver
pPK
B(re
lativ
eun
its)
70 1 2 3 4 5 6
1
2
3
4LF, R=0.84, p<0.01HF, nsPF, R=0.96, p<0.001
insulin (mg/dl)
mus
cle
pPK
B(re
lativ
eun
its)
LF HF PF0
1
2
3
glucose - + - + - +
*******
liver
pPK
B(re
lativ
eun
its)
A B C
E F
LF HF PF0
1
2
3
- + - + - +
***
mus
clepP
KB(re
lativ
eun
its)
0 1 2 3 4 5 6 7
0.5
1.0
1.5
2.0 HFPF
insulin (mg/dl)hy
popP
KB(re
lativ
eun
its)
LF, R=0.73, p<0.05
- + - + - +LF HF PF
0.0
0.5
1.0
1.5 **
hypo
pPKB
(rela
tive
units
)
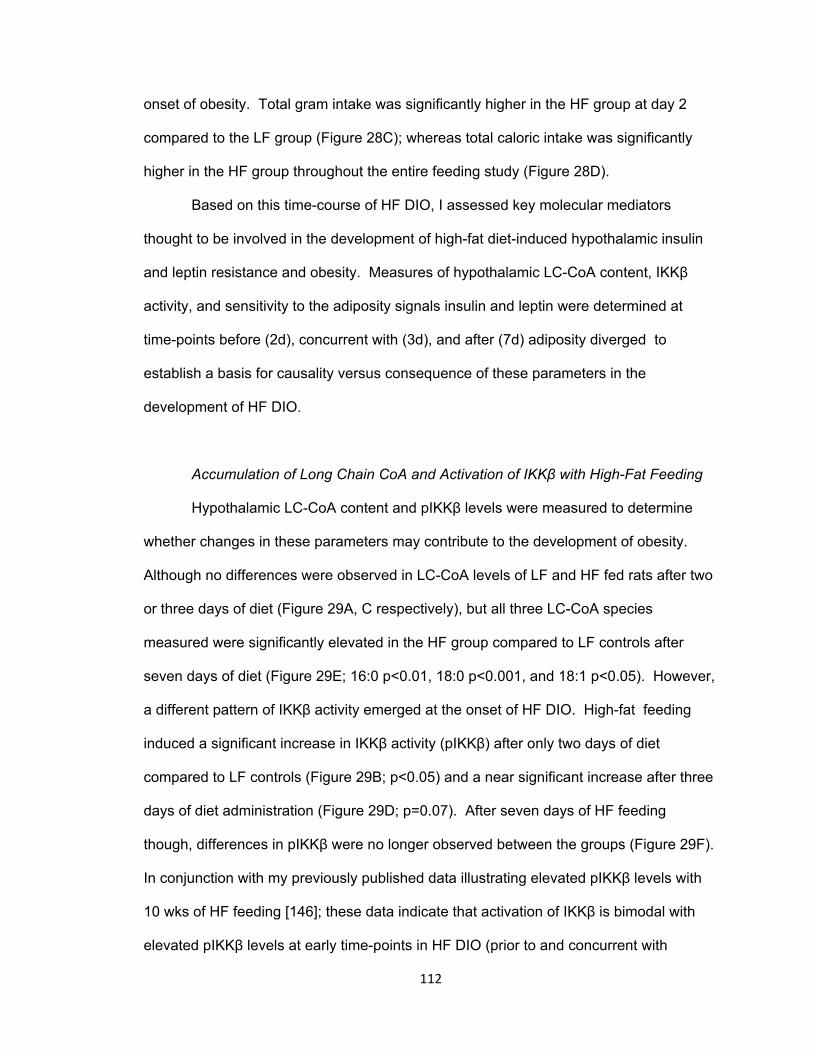
112
onset of obesity. Total gram intake was significantly higher in the HF group at day 2
compared to the LF group (Figure 28C); whereas total caloric intake was significantly
higher in the HF group throughout the entire feeding study (Figure 28D).
Based on this time-course of HF DIO, I assessed key molecular mediators
thought to be involved in the development of high-fat diet-induced hypothalamic insulin
and leptin resistance and obesity. Measures of hypothalamic LC-CoA content, IKKβ
activity, and sensitivity to the adiposity signals insulin and leptin were determined at
time-points before (2d), concurrent with (3d), and after (7d) adiposity diverged to
establish a basis for causality versus consequence of these parameters in the
development of HF DIO.
Accumulation of Long Chain CoA and Activation of IKKβ with High-Fat Feeding
Hypothalamic LC-CoA content and pIKKβ levels were measured to determine
whether changes in these parameters may contribute to the development of obesity.
Although no differences were observed in LC-CoA levels of LF and HF fed rats after two
or three days of diet (Figure 29A, C respectively), but all three LC-CoA species
measured were significantly elevated in the HF group compared to LF controls after
seven days of diet (Figure 29E; 16:0 p<0.01, 18:0 p<0.001, and 18:1 p<0.05). However,
a different pattern of IKKβ activity emerged at the onset of HF DIO. High-fat feeding
induced a significant increase in IKKβ activity (pIKKβ) after only two days of diet
compared to LF controls (Figure 29B; p<0.05) and a near significant increase after three
days of diet administration (Figure 29D; p=0.07). After seven days of HF feeding
though, differences in pIKKβ were no longer observed between the groups (Figure 29F).
In conjunction with my previously published data illustrating elevated pIKKβ levels with
10 wks of HF feeding [146]; these data indicate that activation of IKKβ is bimodal with
elevated pIKKβ levels at early time-points in HF DIO (prior to and concurrent with

113
Figure 28: Early Onset of High-Fat Diet-Induced Obesity
A,B. Daily body weight and adiposity measurements. C,D. Daily food intake measurements. Error bars represent the SEM. Two-way ANOVA with Bonferroni’s post-tests was used to determine significance. * p<0.05, ** p<0.01, ***p<0.001, n=22-24 per group.
-2 -1 0 1 2 3 4 5 6 7
8
10
12
14
16
LFHF
* *****
time (days)
%ad
ipos
ity
-2 -1 0 1 2 3 4 5 6 7
300
320
340
360* *
time (days)
body
wei
ght(
g)
BA
C
-2 -1 0 1 2 3 4 5 6 7
16
18
20
22**
time (days)
food
inta
ke(g
)
-2 -1 0 1 2 3 4 5 6 75060708090
100110120
LFHF
***
time (days)
food
inta
ke(k
cal)
D

114
increased adiposity, 2d and 3d respectively), levels restored to basal at an intermediate
time-points in HF DIO (after adiposity diverged, 7d), and levels again elevated with long-
term HF feeding (10wks).
Progression of Insulin and Leptin Resistance with High-Fat Feeding
To determine whether these changes in hypothalamic LC-CoA content and IKKβ
activity with HF feeding altered hypothalamic insulin and leptin sensitivity, activation of
their respective downstream signaling molecules PKB and Stat3 were assessed
following an icv infusion of insulin or leptin (Figure 30A-F). Insulin-mediated activation of
PKB, as determined by a significant increase in phosphorylation compared to vehicle
controls, was demonstrated in the LF group at all time-points measured (Figure
30A,C,E). Intact insulin signaling was also observed in the HF group after two and three
days of diet (Figure 30A,C). However, insulin-mediated phosphorylation of PKB was
completely blunted after seven days of HF diet (Figure 30E). Hypothalamic resistance to
insulin signal transduction occurred concurrently with the observation of increased
hypothalamic LC-CoA content after seven days of HF feeding. Leptin-mediated
activation of Stat3, as determined by a significant increase in phosphorylation compared
to vehicle controls, was demonstrated in the LF group at all time-points measured
(Figure30B,D,F). However, HF feeding impaired leptin-mediated phosphorylation of
Stat3 after two and three days of diet (Figure 30B,D), whereas leptin signaling was intact
after seven days of diet (Figure 30F). This pattern of hypothalamic sensitivity to leptin
signal transduction is inversely correlated with the pattern of IKKβ activity such that
when IKKβ activity is elevated, leptin signaling is impaired (2 and 3d of HF feeding).
Conversely, when IKKβ activity is restored to basal levels, leptin signaling is intact (7d of
HF feeding).

115
Figure 29: Effect of High-Fat Feeding on Hypothalamic Long Chain CoA Content and IKKβ Activity at the Onset of Diet-Induced Obesity Hypothalamic content of (A,C,E) palmitoyl-, stearoyl- and oleoyl-CoA and (B,D,F) phosphorylated IKKβ are shown prior to (2days), concurrent with (3days), and after (7days) adiposity diverges in HF fed animals compared to LF fed controls. Error bars represent the SEM. Student’s t-test was used to determine significance (points represent HF vs LF for each LC-CoA moiety and pIKKβ). * p<0.05, ** p<0.01, *** p<0.001, n=6-10 for panels A,C,E and n=5-6 per group for panels B,D,F.
0
10
20
30
40
**
***
*
LFHF
C16:0 C18:0 C18:1
rela
tive
LCC
oAco
nten
t/g ti
ssue
0
10
20
30
40
C16:0 C18:0 C18:1
rela
tive
LCC
oAco
nten
t/g ti
ssue
0
10
20
30
40
C16:0 C18:0 C18:1
rela
tive
LCC
oAco
nten
t/g ti
ssue
Day 2
Day 3
Day 7
LF HF0.0
0.5
1.0
1.5
2.0 *
hypo
pIK
Kβ
(rel
ativ
ede
nsity
)LF HF
0.0
0.5
1.0
1.5
2.0p=0.07
hypo
pIK
Kβ
(rel
ativ
ede
nsity
)
LF HF0.0
0.5
1.0
1.5
2.0
hypo
pIK
Kβ
(rela
tive
dens
ity)
A
C
E
B
D
F
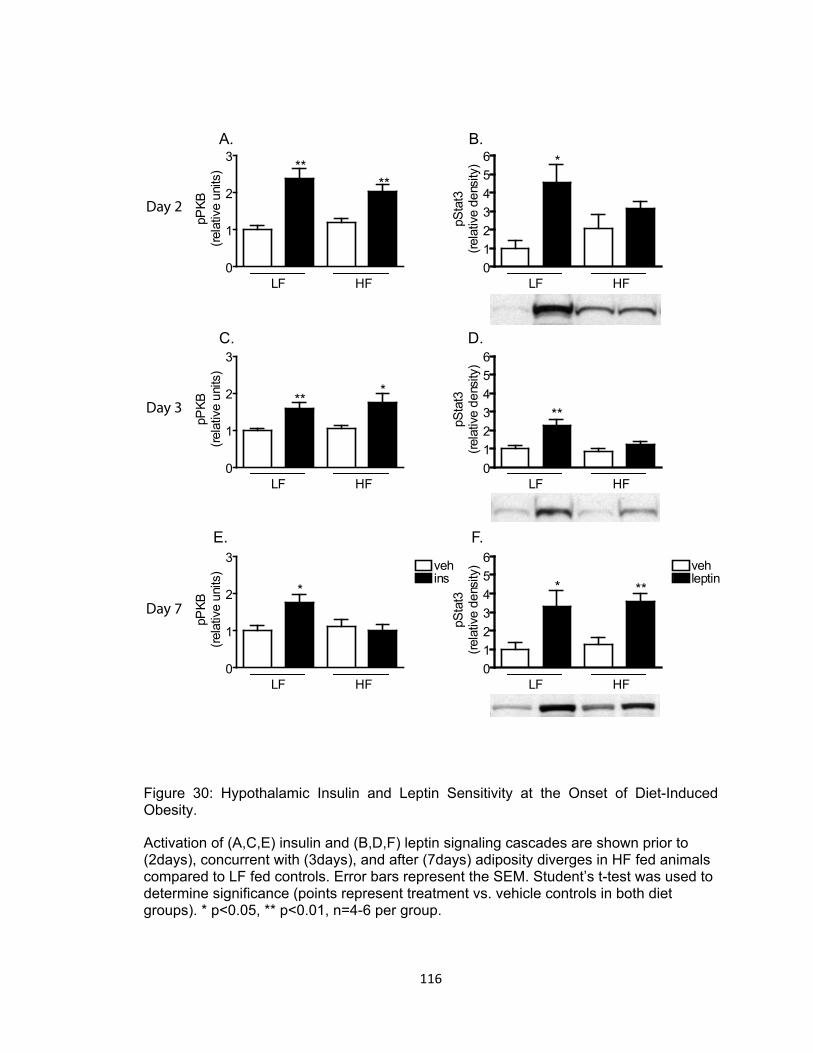
116
Figure 30: Hypothalamic Insulin and Leptin Sensitivity at the Onset of Diet-Induced Obesity. Activation of (A,C,E) insulin and (B,D,F) leptin signaling cascades are shown prior to (2days), concurrent with (3days), and after (7days) adiposity diverges in HF fed animals compared to LF fed controls. Error bars represent the SEM. Student’s t-test was used to determine significance (points represent treatment vs. vehicle controls in both diet groups). * p<0.05, ** p<0.01, n=4-6 per group.
A. B.
C. D.
E. F.
Day 2
Day 3
Day 7
0
1
2
3 vehins
HFLF
*
pPKB
(rela
tive
units
)
0
1
2
3
HFLF
****
pPKB
(rela
tive
units
)
0
1
2
3
HFLF
***
pPKB
(rela
tive
units
)
0123456
HFLF
*
pSta
t3(re
lativ
ede
nsity
)
0123456
HFLF
vehleptin
***
pSta
t3(re
lativ
ede
nsity
)0123456
HFLF
**pSta
t3(re
lativ
ede
nsity
)

117
Fasting plasma insulin and leptin levels were also measured at these key
timepoints. Although plasma insulin levels were slightly elevated in the HF group
compared to LF fed controls at each time-point measured, the differences failed to reach
statistical significance (Figure 31A). However, plasma leptin levels were significantly
higher in the HF group compared to LF fed controls at all time-points measured (Figure
31B; p<0.05 at 2, 3, and 7d).
Food Intake Response to Cholecystokinin
In addition to a direct measure of insulin and leptin signaling following icv infusion
of these hormones, I utilized an indirect method to probe hypothalamic insulin and leptin
sensitivity. Several studies have shown a clear relationship between the long-term
energy homeostatic circuits in the hypothalamus and the short-term satiety signals in the
hindbrain such that in the setting of hypothalamic resistance, the hindbrain is no longer
sensitive to the effects of short-term satiety signals on food intake [123].
I took advantage of this relationship to indirectly test hypothalamic insulin and leptin
sensitivity in our model of HF DIO by assessing 30min food intake following an ip
injection of cholecystokinin (CCK) in 4 hour fasted rats. Cholecystokinin is a meal-
generated satiety factor that signals meal termination and effectively reduces meal size.
The results of these studies at time-points of interest are shown in Figure 32.
Cholecystokinin effectively reduced food intake in the LF group by 35-60% at 2, 3, and 7
days of diet compared to vehicle controls (panels A, B, and C respectively). In the HF
group, CCK failed to reduce food intake at 2 and 3 days of diet compared to vehicle
controls (Figure 32A,B). However, the CCK effect was restored in the HF group and
reduced food intake by approximately 55% compared to vehicle controls after seven
days of diet (Figure 32C). These data suggest hypothalamic resistance occurs with 2
and 3 days of HF feeding; whereas hypothalamic sensitivity is intact after 7 days of HF

118
Figure 31: Plasma Insulin and Leptin Profile at the Onset of Diet-Induced Obesity. Effect of HF feeding on plasma (A) insulin and (B) leptin levels prior to (2days), concurrent with (3days), and after (7days) adiposity diverges. Error bars represent the SEM. Student’s t-test was used to determine significance (points represent HF vs LF diet at each time-point). * p<0.05, ** p<0.01 n=5-6 per group.
B
A
0123456
2d 3d 7d
*pl
asm
ain
sulin
(ng/
ml)
0
2
4
6
8
10 LFHF
*
2d 3d 7d
*
**
plas
ma
lept
in(n
g/m
l)

119
feeding. This pattern of hypothalamic sensitivity to CCK mimics the pattern of
hypothalamic leptin sensitivity demonstrated by icv injection.
Inhibition of IKKβ Reduces Food Intake in Setting of Elevated pIKKβ
To mechanistically test the role of IKKβ activity on hypothalamic sensitivity and
feeding behavior, 24 hour food intake was measured following pharmacological inhibition
of IKK via icv injection (same compound used in chapter IV, PS-1145, Figure 33A-C).
Inhibition of IKKβ significantly reduced 24 hour food intake in HF fed animals compared
to vehicle controls after 2 and 3 days of diet (p<0.001 and p<0.01, respectively), when
IKKβ activity was elevated, but not at 7 days of diet, when IKKβ activity was similar to
levels observed in LF fed controls. Inhibition of IKKβ did not affect food intake in LF fed
controls at any time-point.
Discussion
In previous chapters, both chronic high-fat feeding a diet enriched in saturated fat
(chapter III) and acute intracerebroventricular administration of saturated fat (chapter IV)
increased hypothalamic LC-CoA content and IKKβ activity in rats characterized by
impaired insulin and leptin signaling. In this chapter, I extended these findings to the
onset of diet-induced obesity to determine whether these changes are mechanistically
involved in the development of hypothalamic insulin and leptin resistance and obesity.
Hypothalamic resistance is proposed to occur via a mechanism similar to peripheral
insulin resistance in which accumulation of LC-CoA is thought to activate IKKβ and
induce downregulation of both the insulin and leptin signaling pathways within the
hypothalamus. Impaired hypothalamic insulin and leptin signaling would result in
disrupted energy homeostasis and lead to the development of obesity and peripheral
insulin resistance.

120
Figure 32: Food Intake Response to Cholecystokinin at the Onset of Diet-Induced Obesity. Food lowering response to CCK as an indirect measure of hypothalamic sensitivity (A) prior to, (B) concurrent with, and (C) after adiposity diverges in HF fed animals compared to LF fed controls. Error bars represent the SEM. Student’s t-test was used to determine significance between groups (points represent CCK vs vehicle treatment within each diet group). * p<0.05, ** p<0.01, n=6-8 per group.
A
B
C
Day 2
Day 3
Day 7
0
5
10
15
20
25
HFLF
*
30m
in fo
odin
take
(kca
l)
0
5
10
15
20
25
HFLF
*
30m
in fo
odin
take
(kca
l)
0
5
10
15
20
25
**
vehCCK
HFLF
**
30m
in fo
odin
take
(kca
l)

121
Figure 33: Effect of Pharmacological IKK Inhibitor on Food Intake at the Onset of Diet-Induced Obesity. Inhibition of IKKβ Reduces Food Intake in Setting of Elevated pIKKβ. Relative IKKβ activity (A) prior to, (B) concurrent with, and (C) after adiposity diverges in HF fed animals compared to LF fed controls. Error bars represent the SEM. Student’s t-test was used to determine significance (points represent IKK inhibitor vs vehicle treatment within each diet group). ** p<0.01, *** p<0.001, n=7-9 per group.
A
B
C
Day 2
Day 3
Day 7
020406080
100120
LF HF
***
24hr
food
inta
ke(k
cal)
020406080
100120
LF HF
**
24hr
food
inta
ke(k
cal)
020406080
100120
vehinhib
LF HF
24hr
food
inta
ke(k
cal)

122
The first premise of my hypothesis is that hypothalamic insulin and leptin
resistance cause disruption of energy homeostasis, which in turn leads to the
development of obesity and peripheral insulin resistance. Thus, hypothalamic resistance
is expected to occur prior to peripheral insulin resistance. Comparison of the relative
insulin sensitivity of central and peripheral tissues in calorically restricted HF fed animals
to LF fed controls (Figure 27, LF vs PF) indicated that the hypothalamus is more
susceptible to high-fat diet-induced insulin resistance than the liver and muscle. This
evidence is consistent with my hypothesis that hypothalamic resistance leads to the
development of peripheral insulin resistance associated with obesity.
According to my hypothesis, hypothalamic insulin and leptin resistance occurs
via a mechanism in which hypothalamic accumulation of LC-CoA molecules activate the
IKKβ pathway resulting in impaired insulin and leptin signal transduction. In order to
determine whether LC-CoA accumulation and activation of IKKβ occured in a time-frame
consistent with a role in the development of hypothalamic insulin and leptin resistance
and obesity, a time-course of high-fat diet-induced obesity was established in this rodent
model. In this model, a statistically significant increase in adiposity is consistently
observed by day 3 of ad libitum HF (45%kcal fat) feeding compared to LF fed controls.
Based on this time-course of HF DIO, hypothalamic LC-CoA content and IKKβ activity
were assessed at time-points before (2d), concurrent with (3d), and after (7d) adiposity
diverged to establish a basis for causality versus consequence of these parameters in
the development of HF diet-induced hypothalamic insulin and leptin resistance and
obesity. Significant hypothalamic accumulation of LC-CoA molecules was observed by
day seven of HF feeding, after adiposity diverged. These data indicate that hypothalamic
accumulation of LC-CoA is not required for the initial development of HF DIO but may be
necessary for the persistence of obesity. According to my hypothesis, the accumulation
of intracellular LC-CoA molecules induces activation of IKKβ signaling. If this hypothesis

123
is correct, a similar pattern of IKKβ activity would be expected to occur with HF feeding.
However, pIKKβ levels were significantly elevated after two and three days of HF
feeding; time-points prior to accumulation of hypothalamic LC-CoAs and prior to
increased adiposity. Together these data suggest that 1) hypothalamic LC-CoA
accumulation and IKKβ activity are temporally uncoupled with HF feeding at the onset of
obesity, 2) hypothalamic activation of IKKβ, but not LC-CoA accumulation, occurs in a
time-frame consistent with a potential role in the development of obesity, and 3)
hypothalamic activation of IKKβ is bimodal.
To determine whether hypothalamic accumulation of LC-CoA molecules and/or
activation of IKKβ could potentially play a role in the development of hypothalamic insulin
and leptin resistance, I assessed activation of the respective downstream signaling
molecules PKB and Stat3 following icv infusion of insulin or leptin. The adiposity signals
insulin and leptin are thought to have largely redundant functions and tightly coupled
signaling pathways in the hypothalamus. However, in these studies the sensitivities of
these two signals were uncoupled at the onset of HF DIO in this rodent model.
Hypothalamic insulin signaling remained intact prior to (2d) and concurrent with (3d) the
onset of obesity, but was completely blunted after adiposity diverged (7d). In contrast,
hypothalamic leptin signaling was impaired at time-points prior to (2d) and concurrent
with (3d) the onset of obesity, but was restored to levels observed in the LF fed controls
after seven days of diet. Thus, while insulin and leptin both function as adiposity
negative feedback signals within the hypothalamus, the development of HF diet-induced
hypothalamic insulin and leptin resistance are temporally and potentially mechanistically
distinct. The pattern of hypothalamic insulin resistance corresponded with the pattern of
LC-CoA accumulation such that when LC-CoA content was elevated, insulin signaling
was impaired. Conversely, the pattern of hypothalamic leptin resistance corresponded
with the pattern of IKKβ activity such that when pIKKβ was increased, leptin signaling

124
was impaired. Together, these results suggest that the accumulation of LC-CoA may be
mechanistically involved in the development of HF diet-induced hypothalamic insulin
resistance, whereas activation of IKKβ may be mechanistically involved in the
development of HF diet-induced hypothalamic leptin resistance. In addition, these
results indicate that hypothalamic leptin, but not insulin, resistance occurs in a time-
frame consistent with a causative role in the development of HF DIO and may be the
primary determinant in HF DIO.
To confirm the results observed in the insulin and leptin signaling studies, I
assessed hypothalamic sensitivity indirectly by determining the ability of a short-term
satiety signal, CCK, to modulate food intake. Studies have shown that in the setting of
hypothalamic insulin and leptin resistance, the hindbrain is no longer sensitive to the
effect of CCK to reduce meal size [123]. Peripheral administration of CCK failed to
reduce food intake in the HF group at time-points prior to (2d) and concurrent with (3d)
increased adiposity. This is consistent with the presence of hypothalamic resistance at
these time-points and corresponds with activation of IKKβ and impaired leptin signaling.
However, CCK administration effectively reduced food intake in HF fed animals after
seven days of diet; when hypothalamic leptin, but not insulin signaling, was intact. This
raises the possibility that hypothalamic modulation of the hindbrain response to CCK is
dependent upon leptin, but not insulin, signaling. This possibility is supported by
evidence in the literature demonstrating a synergistic relationship between leptin and
CCK in the regulation of food intake [14, 193].
To determine whether activation of IKKβ, associated with impaired leptin
signaling at the onset of HF DIO, directly alters hypothalamic regulation of energy
homeostasis, I investigated the effects of IKKβ activity on food intake. Central
administration of a pharmacological IKK inhibitor significantly reduced 24 hour food
intake in HF fed animals at time-points consistent with elevated IKKβ activity and

125
impaired leptin signaling, but had no effect on food intake at seven days of HF feeding;
when IKKβ activity was at basal levels and leptin signaling was intact. These data
support a direct role of IKKβ activity in the development of HF diet-induced hypothalamic
leptin resistance and disrupted energy homeostasis.
Together, the results from these studies both support and contradict my original
hypothesis that HF DIO occurs via a mechanism in which hypothalamic accumulation of
LC-CoA activates IKKβ and impairs hypothalamic insulin and leptin signaling, resulting in
disrupted energy homeostasis and the development of obesity. These findings are
summarized in the figure below (Figure 34) illustrating the relationship between
hypothalamic insulin and leptin sensitivity to hypothalamic LC-CoA accumulation, IKKβ
activity, and CCK sensitivity over the course of HF diet-induced obesity. Together these
data suggest that 1) LC-CoA accumulation and IKKβ activity are temporally and
mechanistically uncoupled in the hypothalamus at the onset of DIO; 2) insulin and leptin
resistance are temporally and mechanistically uncoupled in the hypothalamus at the
onset of DIO; and 3) suggests leptin, but not insulin, resistance is primary in the
development of obesity.
In light of the conclusions drawn from these findings, there are two important
points to discuss. First, in these studies HF DIO was defined to occur when adiposity
diverged (3d of diet). However, HF diet induced obesity results in both increased
adiposity as well as increased body weight in free-feeding rodents. The presence of
both increased adiposity and increased body weight was observed between six and
seven days of HF feeding; the time-point at which increased LC-CoA content and
impaired insulin signaling were observed. Thus, although accumulation of LC-CoA and
impaired insulin signaling did not occur in a time-frame consistent with a causative role
in the development of HF DIO as defined by increased adiposity, these changes may still
be an important determinant in the development of both increased adiposity and body
126
weight. Second, hypothalamic insulin and leptin signaling were assessed following
direct infusion of these hormones into the third ventricle. This route of administration
bypasses a potentially critical step in signal transduction, transport across the blood-
brain barrier. There is some experimental evidence to suggest that HF diets impair
receptor-mediated transport of insulin and leptin across the BBB [11, 82]. Thus,
hypothalamic resistance may potentially occur prior to the time-points observed in these
studies due to a reduction in transport across the BBB with HF feeding. Specifically,
hypothalamic insulin resistance may occur prior to seven days of HF feeding which could
potentially indicate a more prominent role of hypothalamic insulin signaling in the
development of HF DIO.

127
Figure 34: Summary of Relative Changes in Key Molecular Mediators in the Pathogenesis of Diet-Induced Obesity with High-Fat Feeding. Pattern of high-fat diet induced changes in LC-CoA (red line), pIKKβ (purple line), hypothalamic insulin (blue line) and leptin (green line) sensitivity, and CCK sensitivity (gold line) relative to low-fat fed controls in the development of obesity.
2 3 7days 10wks0
low
highInsulin sensitivity LC-CoA accumulation
Leptin sensitivity
pIKKβ
CCK sensitivity

128
CHAPTER VII
SUMMARY AND FUTURE DIRECTIONS
Obesity has rapidly become a worldwide epidemic with a seemingly
uncontrollable rise in prevalence over the last two decades. Evidence suggests that in
non-obese individuals, caloric intake is closely matched to energy expenditure to
maintain stable body weight and adiposity over time. The regulation of body adiposity
can be modeled as a classical endocrine feedback loop which involves the “adiposity
signals” insulin and leptin and the CNS. These hormones normally circulate in
proportion to body fat mass and directly interact with key neuronal subsets within the
CNS, one of these being the arcuate nucleus (ARC) of the mediobasal hypothalamus.
Insulin and leptin responsive neurons function coordinately in a series of neural circuits
that allow the CNS to co-regulate various aspects of energy homeostasis including food
intake and energy expenditure to promote the stability of body fat stores. Conversely,
obesity is a state of dysregulated energy homeostasis characterized by hypothalamic
resistance to the adiporegulatory effects of insulin and leptin. Understanding the
mechanism of hypothalamic resistance is integral in developing strategies to control the
obesity epidemic.
While many factors are implicated in the development of obesity, dietary fat
remains one of the most potent predictors of obesity [152, 197]. In chapter III, I
examined the obesogenic potential of various dietary fats. Results from these studies
demonstrated that dietary fats possess intrinsic obesogenic properties in a saturation
dependent manner and specifically implicated saturated fatty acids as the most potent
mediator of the deleterious effects of HF feeding. Furthermore, a diet enriched in

129
saturated fat, independent of excess nutrient intake, is sufficient to induce hypothalamic
resistance to the negative feedback adiposity signals and increase adiposity.
To determine whether the deleterious effects of high-fat feeding are specifically
attributable to direct action of saturated fat within the CNS; in Chapter IV I investigated
the direct effects of dietary fat in the brain of lean chow fed animals. More specifically,
whether exposure of the hypothalamus to excess saturated fat leads to hypothalamic
accumulation of LC-CoAs that trigger inflammatory signaling (elevated IKKβ activity) and
blunt insulin signaling in lean chow fed rats given an acute icv infusion of palmitate or
oleate. In these studies infusion of a saturated, but not unsaturated fat, mimicked the
effects of HF feeding to increase hypothalamic content of LC-CoA molecules, and
increase IKKβ activity in lean chow fed rats. Concomitant with increased LC-CoA
content and elevated IKKβ activity, icv palmitate infusion (i.e. saturated fatty acid) was
sufficient to significantly blunt the ability of insulin to activate the downstream signaling
molecule PKB in the hypothalamus. These results demonstrated a clear association
between increased LC-CoA content and IKKβ activity with impaired hypothalamic insulin
signaling. That pharmacological icv inhibition of IKK potently reduced food intake in
obese, HF fed rats characterized by increased IKKβ activity and hypothalamic insulin
resistance, but had no effect on food intake in LF fed rats (animals characterized by
relatively low hypothalamic IKKβ activity and hypothalamic insulin sensitivity) suggested
a direct role of IKKβ on insulin action to reduce food intake. Furthermore, hypothalamic
insulin signaling was enhanced in HF fed rats pretreated with the IKK inhibitor. These
results support a model similar to that of peripheral insulin resistance in which cellular
exposure to excess nutrients, particularly saturated fat, triggers cellular inflammation and
insulin resistance that in turn contributes to impaired energy homeostasis and the
development of obesity. The ability of specific fatty acids to modulate the activation of
inflammation may represent a potential mechanism of high-fat diet-induced hypothalamic

130
resistance and obesity. These structural effects led me to identify potential “fat sensing”
target molecules that may be involved in the development of HF diet-induced obesity.
Since fatty acids are known to function as endogenous ligands for various
receptors in a structure dependent manner; in Chapter V I investigated the role of the
innate immune receptor, TLR4, in the development of high-fat diet-induced hypothalamic
resistance and obesity. TLR4 was identified as a candidate in the mechanism of high-fat
diet-induced hypothalamic resistance and obesity since it is 1) expressed in central
tissues associated with the regulation of energy homeostasis, 2) is regulated by dietary
fat in a saturation dependent manner, and 3) initiates an inflammatory signaling cascade
associated with insulin resistance. Body weight and adiposity were significantly reduced
inTLR4 deficient mice compared to WT controls; an effect associated with reduced
plasma and tissue markers of inflammation in TLR4 deficient mice. In line with my
hypothesis, a reduction in inflammatory molecules may lead to improved hypothalamic
insulin and leptin signaling and promote energy homeostasis.
The phenotype of decreased body weight and adiposity in TLR4 deficient mice
compared to their respective WT controls suggested a potential role for TLR4 in the
regulation of adipose stores. Although these results suggested that TLR4 mediated
inflammatory signaling within the hypothalamus contributed, at least in part, to
modulation of energy homeostatic pathways and adipose accumulation; based on our
observations it was not possible to rule out other pathways and mechanisms involved in
the development of HF diet-induced hypothalamic resistance and obesity.
Whether hypothalamic resistance occurs early in the course of HF feeding and
actively contributes to increased food intake, adiposity, and peripheral insulin resistance
characteristic of DIO remains an important unanswered question. Data presented herein
have demonstrated that both chronic and acute exposure to saturated fatty acids
increase hypothalamic LC-CoA content and IKKβ activity in rats characterized by

131
impaired insulin and leptin signaling. In chapter VI, I extended these findings to the
onset of DIO to determine whether these changes are mechanistically involved in the
development of hypothalamic insulin and leptin resistance and obesity. I hypothesized
that dietary saturated fat induces hypothalamic insulin and leptin resistance via a
mechanism of LC-CoA induced inflammatory signaling, resulting in disrupted energy
homeostasis and the development of obesity and peripheral insulin resistance. Results
from these studies both supported and contradicted several aspects of this hypothesis.
While insulin and leptin both function as adiposity negative feedback signals within the
hypothalamus, the development of HF diet-induced hypothalamic insulin and leptin
resistance were temporally and potentially mechanistically distinct. Long-Chain CoA
accumulation appeared to be mechanistically involved in the development of insulin
resistance, whereas activation of IKKβ appeared to be mechanistically involved in the
development of leptin resistance. Furthermore, hypothalamic leptin, but not insulin,
resistance occurred in a time-frame consistent with a causative role in the development
of HF DIO.
While this body of work has focused on the role of long chain saturated fat in the
development of diet-induced obesity; several other interesting questions became evident
based on our findings that warrant further investigation. For example, when animals
were fed the HF diet restricted to the caloric intake of the LF fed animals (i.e. pair-fed),
total body weight gain was similar to the LF group yet the proportion of energy stored as
adipose tissue was significantly elevated. This difference in adiposity for the same
caloric intake may be explained by fuel partitioning, the allocation of metabolic fuels
among tissues and metabolic pathways. Under normal circumstances, fuel partitioning
serves to maintain a steady supply of energy-yielding substrates to meet the needs of
various tissues through the balance between fuel oxidation and storage [65]. However,
disturbances in fuel partitioning compromises energy balance such that an imbalance in

132
favor of fuel storage results in obesity [65]. Given the differences observed in the
obesogenic potential of the various fatty acid species we investigated, it is intriguing to
ask whether omega-3 or polyunsaturated fatty acids would have a different effect on
weight gain and adipose storage under the pair-feeding conditions. Furthermore, it
would be exciting to investigate the mechanisms involved in determining the metabolic
fate of ingested calories and how the lipid composition alters these mechanisms, either
via direct or indirect pathways and either centrally, peripherally, or a combination of both.
One of these potential targets of lipid action is the innate immune receptor TLR4.
Although we observed a reduction in whole body inflammation and improved body
composition in TLR4 deficient mice compared to WT mice on both diets, it is not possible
to attribute these effects entirely to improved central energy homeostatic signaling since
these animals were globally deficient in TLR4. Thus, it would be beneficial to determine
the contribution of TLR4 signaling specifically in the hypothalamus to HF diet-induced
insulin and leptin resistance and obesity via generation of brain specific TLR4 knock-out
mice or use of icv pharmacological agonists and antagonists. In fact, a recently
published paper investigated the effects of daily ip administration of a TLR4-inhibiting
antibody in rats fed a HF diet for 8 weeks. Results from these studies demonstrated that
inhibition of TLR4 attenuated weight gain and activation of inflammatory cytokines
associated with HF feeding [116]. Furthermore, Milanski et al. suggests that TLR4 acts
as a predominant molecular target for saturated fatty acids in the hypothalamus and is
an important mediator of hypothalamic dysfunction during the development of obesity
[116].
However, recall that TLR4 deficiency did not completely protect mice against HF
diet-induced increases in inflammation, body weight, and adiposity in our studies. This
suggests that additional pathways may be involved in the effects of dietary lipids to
induce inflammation and obesity. Studies have provided strong evidence for the

133
contribution of endoplasmic reticulum stress (ER stress) as a mechanism linking the
consumption of HF diets and obesity to insulin resistance [129, 138]. ER stress can be
induced by metabolic and nutritional factors such as high levels of glucose and lipids and
stimulates cytokine production [138]. Cytokine production induced by ER stress could
potentially lead to both insulin and leptin resistance in the hypothalamus making this an
interesting target for further research. Along these lines, a paper published within the
last several months, reported that increased hypothalamic ER stress inhibits leptin
receptor signaling and augments HF diet-induced obesity [137].
Another question which remains to be addressed is how dietary lipids ultimately
induce a signal within the hypothalamus and alter energy homeostasis within a relatively
short period of time at the onset of obesity. Upon ingestion of a HF meal, fatty acids are
transported via chylomicrons as trigylcerides to the liver where they are processed and
exported to the circulation attached to lipoprotein particles (VLDL). Fatty acids then
enter various tissues through a receptor mediated process. Lipoprotein receptors are
expressed at the blood-brain-barrier and may be involved in a direct effect of dietary fatty
acids in the development of hypothalamic resistance and impaired energy homeostasis.
However the contribution of fatty acids from lipoproteins is thought to be a small
proportion of total circulating fatty acids. The majority of circulating plasma fatty acids is
derived from adipose tissue and closely reflects the composition of lipid stores in the
adipose tissue. Adipose stores are relatively stable and changes in dietary lipid
composition would take weeks to months to become reflected in these pools. Thus, the
short-term effects of HF feeding are not likely due to direct effects of free fatty acids in
the hypothalamus but may be mediated by indirect effects of HF feeding. One possibility
could be the presence of a gut-derived signal, either a circulating factor or a neurally
mediated signal that changes in response to the ingestion of fat and alters hypothalamic
insulin and leptin sensitivity. While elucidation of a gut-derived signal is outside the

134
scope of this project, whether the effect of dietary fatty acids on hypothalamic sensitivity
is mediated directly or indirectly is an important question in the mechanism of HF DIO.
Potentially the most interesting finding from this work, however, is the disconnect
between the development of insulin and leptin resistance at the onset of obesity. One
limitation of these studies though is that the method used to assess insulin and leptin
sensitivity (icv infusion and downstream signaling) bypasses a potential site of
resistance at the level of hormone transport across the blood-brain barrier. Studies to
address transport as well as signaling could potentially reveal a different pattern of
insulin and leptin resistance than reported here (i.e. insulin resistance at earlier time-
points due to impaired transport) and warrants further investigation. Leptin transport and
action in the hypothalamus could possibly be assessed by peripheral administration of a
leptin dose and measurement of the food intake response and activation of the signaling
cascade. However, the leptin dose required to induce a hypothalamic response is cost
prohibitive in rats. Furthermore, this technique would not be suitable to test insulin
transport and action in the hypothalamus due to the hypoglycemic effects of a peripheral
insulin dose. Instead, insulin transport and action in the hypothalamus could be
assessed following a glucose bolus or following a fasting-refeeding paradigm to induce
pancreatic insulin secretion. However, the potency of these methods to stimulate insulin
secretion can vary across groups and the results not be directly comparable. Clearly
these approaches contain inherent flaws as well. However, transport across the blood-
brain barrier is still an important component of hypothalamic insulin and leptin action to
address at the onset of HF diet-induced obesity as evidence indicates that hormones
and circulating metabolites including nutritional status and triglycerides modulate the
blood-brain barrier transport system [9, 84].
In addition to the disconnect between the development of insulin and leptin
resistance is the bimodal response in leptin sensitivity we observed in our studies with

135
impaired leptin signaling at early and late time-points (day 2,3 and wk10) in the
development of obesity and intact signaling at the intermediate time-point (day 7). One
potential explanation for the early impairment in leptin signaling with high-fat feeding
could be evolutionary in origin. Under conditions of intermittent food supplies, the ability
to adapt to starvation is fundamentally important to the survival of the species. Along
these lines, evidence suggests that the dominant role of leptin occurs in response to
starvation to prevent depletion of energy stores [3]. With the availability of an energy-
dense food source, the apparent leptin “resistance” may actually be a permissive
response to temporarily allow overconsumption of the high-fat diet as a survival
mechanism for future periods of prolonged fasting despite the overabundance of nutrient
availability today and may partially explain genetic susceptibility to obesity. Another
potential explanation for leptin resistance is the influence of non-homeostatic factors in
the control of food intake including palatability and novelty in rodents [22]. It has been
hypothesized that cortico-limbic processes can override homeostatic regulatory circuits
via neural projections between the accumbens and the hypothalamus [22]. Leptin
signaling was restored following the initial exposure to high-fat diet and increase in food
intake (day 7), possibly as these initial responses were attenuated, but was again
impaired after prolonged exposure to high-fat diet. The leptin resistance following
prolonged exposure to high-fat diet may represent a “pathological” resistance in
response to dietary fat and occur via a different mechanism. Insight into both the early
and late mechanisms of leptin resistance may prove beneficial in the development of
pharmacological treatments for obesity.
In conclusion, this body of work has extended previous studies in our laboratory
investigating hypothalamic insulin and leptin resistance in HF fed obese rats and
describes potential mechanisms involved in the development of HF diet-induced
hypothalamic resistance and obesity. However, it is evident that more work is required

136
to tease out the exact mechanisms of hypothalamic insulin and leptin resistance as well
as the distinct roles of insulin and leptin function as adiposity signals in the
hypothalamus. Further elucidation of the mechanisms involved in the development of
diet-induced hypothalamic insulin and leptin resistance and distinct functional roles of
these adiposity hormones will aid in potential therapeutic treatments to curb the obesity
epidemic.

137
Appendix A. Baseline Metabolic Parameters of High-Fat Diet-Induced Obesity Model in Rats
Baseline metabolic parameters in a rat model of HF DIO. Effect of high-fat feeding on body weight (i), body adiposity (ii) and plasma insulin (iii) and leptin (iv) levels compared to low-fat fed controls. Plasma insulin (v) and leptin (vi) levels across groups are significantly correlated with changes in body adiposity, as is area under the curve (AUC, viii) of the glucose excursion curve during an intraperitoneal glucose tolerance test (vii). * p<0.05, **p<0.01.
iii.
i. ii.
iv.
0
5
10
15
20
25
seru
mle
ptin
(ng/
ml)
v. vi.
vii. viii.
diet fat content low high low high
-20 20 60 100 140 180100
200
300
400 low-fathigh-fat
time (min)
bloo
dgl
ucos
e(m
g/dl
)
0 1 2 3 4 5 6 7
5
10
15
20 low-fathigh-fat
weeks on diet
body
adip
osity
(%)
0 1 2 3 4 5 6 7
250
350
450 low-fathigh-fat
weeks on diet
body
wei
ght
(gra
ms)
**
**
012345
seru
min
sulin
(ng/
ml)
*
*
0 10 20 30 400
10
20
30 high fatlow-fat
R=0.93P<0.0001
serum leptin (ng/ml)
body
adip
osity
(%)
1 2 3 4 5 6 7 80
10
20
30 high-fatlow-fat
R=0.58P=0.009
serum insulin (ng/ml)
body
adip
osity
(%)
20 30 40 50 600
10
20
30 high-fatlow-fat
R=0.72P=0.0001
AUC (X1000)
body
adip
osity
(%)
*
*# #
**
** ** ****
**** ** ** **
**

138
Appendix B. Efficacy and Dose Response of IKK Inhibition
Pharmacological inhibition of IKK was confirmed by measurement of IκBα protein levels following treatment with PS-1145 (3µg). Efficacy of IKK inhibition was dose dependent as a lower dose reduced food intake at 4hr but not 24hr (3µg vs 10µg shown to reduce both 4 and 24hr food intake). * p<0.05
0
25
50
75
100
*
inhibitor - + - +time (hrs) 4 4 24 24
food
inta
ke(k
cal)
vehicle inhibitor0.0
0.5
1.0
1.5
2.0*
tota
lIκB
α(re
lativ
ede
nsity
)
i
ii

139
Appendix C. Kaolin Intake Test of Visceral Illness with IKK Inhibition
Effect of IKK inhibitor treatment on 24hr kaolin consumption, a marker of “visceral” or non-specific illness.
0
1
2
3
4
inhibitor - + - + LF LF HF HFdiet
kaol
in in
take
(g)

140
Appendix D. CCK Dose Response
Effect of intraperitoneal CCK on 30min food intake in 4hr fasted rats. ** p<0.01 compared to vehicle control (0ug dose).
0 0.5 1 50
1
2
3
4
**
**
**
CCK dose (ug)
30m
in fo
od in
take
(g)

141
Appendix E. Comparison of Pharmacological ICV Insulin Infusion and Physiological Insulin Response to a Fasting-Refeeding Cycle
Hypothalamic phosphorylation of PKB in response to physiological (refed, 4hr access to high-carb diet after fast) and pharmacological (ins, 10mu insulin icv) insulin stimulation in 24hr fasted rats compared to vehicle controls (veh). * p<0.05, ** p<0.01.
veh refed ins0.0
0.5
1.0
1.5
2.0
hypo
pP
KB
(rela
tive
units
)
***

142
REFERENCES
1. Chartbook on Trends in the Health of Americans Health. National Center for Health Statistics 2006, Hyattsville, MD: Public Health Service.
2. Clinical Guidelines on the Identification, Evaluation, and Treatment of Overweight
and Obesity in Adults-The Evidence Report. 1998, Bethesda, MD: National Institutes of Health, National Heart, Lung, and Blood Institute.
3. Ahima, R.S., et al., Role of leptin in the neuroendocrine response to fasting. Nature, 1996. 382(6588): p. 250-2.
4. Akira, S., S. Uematsu, and O. Takeuchi, Pathogen recognition and innate immunity. Cell, 2006. 124(4): p. 783-801.
5. Argetsinger, L.S., et al., Autophosphorylation of JAK2 on tyrosines 221 and 570 regulates its activity. Mol Cell Biol, 2004. 24(11): p. 4955-67.
6. Astrup, A., Healthy lifestyles in Europe: prevention of obesity and type II diabetes by diet and physical activity. Public Health Nutr, 2001. 4(2B): p. 499-515.
7. Bagdade, J.D., E.L. Bierman, and D. Porte, Jr., The significance of basal insulin levels in the evaluation of the insulin response to glucose in diabetic and nondiabetic subjects. J Clin Invest, 1967. 46(10): p. 1549-57.
8. Banks, A.S., et al., Activation of downstream signals by the long form of the leptin receptor. J Biol Chem, 2000. 275(19): p. 14563-72.
9. Banks, W.A., et al., Triglycerides induce leptin resistance at the blood-brain barrier. Diabetes, 2004. 53(5): p. 1253-60.
10. Banks, W.A., C.R. DiPalma, and C.L. Farrell, Impaired transport of leptin across the blood-brain barrier in obesity. Peptides, 1999. 20(11): p. 1341-5.
11. Banks, W.A., S.A. Farr, and J.E. Morley, The effects of high fat diets on the blood-brain barrier transport of leptin: failure or adaptation? Physiol Behav, 2006. 88(3): p. 244-8.

143
12. Banks, W.A., et al., Leptin enters the brain by a saturable system independent of insulin. Peptides, 1996. 17(2): p. 305-11.
13. Baron, S.H., Salicylates as hypoglycemic agents. Diabetes Care, 1982. 5(1): p. 64-71.
14. Barrachina, M.D., et al., Synergistic interaction between leptin and cholecystokinin to reduce short-term food intake in lean mice. Proc Natl Acad Sci U S A, 1997. 94(19): p. 10455-60.
15. Barros, R.P., U.F. Machado, and J.A. Gustafsson, Estrogen receptors: new players in diabetes mellitus. Trends Mol Med, 2006. 12(9): p. 425-31.
16. Baskin, D.G., et al., Insulin and insulin-like growth factors in the CNS. Trends Neurosci, 1988. 11(3): p. 107-11.
17. Bates, S.H., et al., STAT3 signalling is required for leptin regulation of energy balance but not reproduction. Nature, 2003. 421(6925): p. 856-9.
18. Baura, G.D., et al., Saturable transport of insulin from plasma into the central nervous system of dogs in vivo. A mechanism for regulated insulin delivery to the brain. J Clin Invest, 1993. 92(4): p. 1824-30.
19. Beck, B., et al., Rapid and localized alterations of neuropeptide Y in discrete hypothalamic nuclei with feeding status. Brain Res, 1990. 528(2): p. 245-9.
20. Benoit, S.C., et al., The catabolic action of insulin in the brain is mediated by melanocortins. J Neurosci, 2002. 22(20): p. 9048-52.
21. Bernstein, I.L., et al., Effect of force-feeding upon basal insulin levels of rats. Proc Soc Exp Biol Med, 1975. 150(2): p. 546-8.
22. Berthoud, H.R., Homeostatic and non-homeostatic pathways involved in the control of food intake and energy balance. Obesity (Silver Spring), 2006. 14 Suppl 5: p. 197S-200S.
23. Berthoud, H.R., Multiple neural systems controlling food intake and body weight. Neurosci Biobehav Rev, 2002. 26(4): p. 393-428.

144
24. Billington, C.J., et al., Effects of intracerebroventricular injection of neuropeptide Y on energy metabolism. Am J Physiol, 1991. 260(2 Pt 2): p. R321-7.
25. Bjorbaek, C. and B.B. Kahn, Leptin signaling in the central nervous system and the periphery. Recent Prog Horm Res, 2004. 59: p. 305-31.
26. Bjorbak, C., et al., SOCS3 mediates feedback inhibition of the leptin receptor via Tyr985. J Biol Chem, 2000. 275(51): p. 40649-57.
27. Blok, W.L., M.B. Katan, and J.W. van der Meer, Modulation of inflammation and cytokine production by dietary (n-3) fatty acids. J Nutr, 1996. 126(6): p. 1515-33.
28. Boden, G., et al., Effect of fasting on serum leptin in normal human subjects. J Clin Endocrinol Metab, 1996. 81(9): p. 3419-23.
29. Brady, L.S., et al., Altered expression of hypothalamic neuropeptide mRNAs in food-restricted and food-deprived rats. Neuroendocrinology, 1990. 52(5): p. 441-7.
30. Bray, G.A., Obesity: the disease. J Med Chem, 2006. 49(14): p. 4001-7.
31. Bray, G.A., S. Paeratakul, and B.M. Popkin, Dietary fat and obesity: a review of animal, clinical and epidemiological studies. Physiol Behav, 2004. 83(4): p. 549-55.
32. Broadwell, R.D. and M.W. Brightman, Entry of peroxidase into neurons of the central and peripheral nervous systems from extracerebral and cerebral blood. J Comp Neurol, 1976. 166(3): p. 257-83.
33. Bruning, J.C., et al., Role of brain insulin receptor in control of body weight and reproduction. Science, 2000. 289(5487): p. 2122-5.
34. Bsibsi, M., et al., Broad expression of Toll-like receptors in the human central nervous system. J Neuropathol Exp Neurol, 2002. 61(11): p. 1013-21.
35. Butler, A.A. and R.D. Cone, The melanocortin receptors: lessons from knockout models. Neuropeptides, 2002. 36(2-3): p. 77-84.
36. Cai, D., et al., Local and systemic insulin resistance resulting from hepatic activation of IKK-beta and NF-kappaB. Nat Med, 2005. 11(2): p. 183-90.

145
37. Cheung, C.C., D.K. Clifton, and R.A. Steiner, Proopiomelanocortin neurons are direct targets for leptin in the hypothalamus. Endocrinology, 1997. 138(10): p. 4489-92.
38. Chew, G.T., S.K. Gan, and G.F. Watts, Revisiting the metabolic syndrome. Med J Aust, 2006. 185(8): p. 445-9.
39. Clark, J.T., et al., Neuropeptide Y and human pancreatic polypeptide stimulate feeding behavior in rats. Endocrinology, 1984. 115(1): p. 427-9.
40. Clerk, L.H., S. Rattigan, and M.G. Clark, Lipid infusion impairs physiologic insulin-mediated capillary recruitment and muscle glucose uptake in vivo. Diabetes, 2002. 51(4): p. 1138-45.
41. Cnop, M., Fatty acids and glucolipotoxicity in the pathogenesis of Type 2 diabetes. Biochem Soc Trans, 2008. 36(Pt 3): p. 348-52.
42. Coiffier, E., R. Paris, and J. Lecerf, Effects of dietary saturated and polyunsaturated fat on lipoprotein lipase and hepatic triglyceride lipase activity. Comp Biochem Physiol B, 1987. 88(1): p. 187-92.
43. Coleman, D.L., Effects of parabiosis of obese with diabetes and normal mice. Diabetologia, 1973. 9(4): p. 294-8.
44. Coleman, D.L., Obese and diabetes: two mutant genes causing diabetes-obesity syndromes in mice. Diabetologia, 1978. 14(3): p. 141-8.
45. Cone, R.D., Anatomy and regulation of the central melanocortin system. Nat Neurosci, 2005. 8(5): p. 571-8.
46. Considine, R.V., et al., Serum immunoreactive-leptin concentrations in normal-weight and obese humans. N Engl J Med, 1996. 334(5): p. 292-5.
47. Cousin, S.P., et al., Free fatty acid-induced inhibition of glucose and insulin-like growth factor I-induced deoxyribonucleic acid synthesis in the pancreatic beta-cell line INS-1. Endocrinology, 2001. 142(1): p. 229-40.
48. Cowley, M.A., et al., Leptin activates anorexigenic POMC neurons through a neural network in the arcuate nucleus. Nature, 2001. 411(6836): p. 480-4.

146
49. Cummings, D.E., Ghrelin and the short- and long-term regulation of appetite and body weight. Physiol Behav, 2006. 89(1): p. 71-84.
50. Cummings, D.E., et al., Plasma ghrelin levels and hunger scores in humans initiating meals voluntarily without time- and food-related cues. Am J Physiol Endocrinol Metab, 2004. 287(2): p. E297-304.
51. Cusin, I., et al., The weight-reducing effect of an intracerebroventricular bolus injection of leptin in genetically obese fa/fa rats. Reduced sensitivity compared with lean animals. Diabetes, 1996. 45(10): p. 1446-50.
52. De Souza, C.T., et al., Consumption of a fat-rich diet activates a proinflammatory response and induces insulin resistance in the hypothalamus. Endocrinology, 2005. 146(10): p. 4192-9.
53. Deutsch, J., et al., Isolation and quantitation of long-chain acyl-coenzyme A esters in brain tissue by solid-phase extraction. Anal Biochem, 1994. 220(2): p. 321-3.
54. Drucker, D.J., The biology of incretin hormones. Cell Metab, 2006. 3(3): p. 153-65.
55. Duncan, B.B., et al., Low-grade systemic inflammation and the development of type 2 diabetes: the atherosclerosis risk in communities study. Diabetes, 2003. 52(7): p. 1799-805.
56. Egawa, M., H. Yoshimatsu, and G.A. Bray, Neuropeptide Y suppresses sympathetic activity to interscapular brown adipose tissue in rats. Am J Physiol, 1991. 260(2 Pt 2): p. R328-34.
57. El-Haschimi, K., et al., Two defects contribute to hypothalamic leptin resistance in mice with diet-induced obesity. J Clin Invest, 2000. 105(12): p. 1827-32.
58. Ellacott, K.L. and R.D. Cone, The central melanocortin system and the integration of short- and long-term regulators of energy homeostasis. Recent Prog Horm Res, 2004. 59: p. 395-408.
59. Elmquist, J.K., Hypothalamic pathways underlying the endocrine, autonomic, and behavioral effects of leptin. Physiol Behav, 2001. 74(4-5): p. 703-8.

147
60. Elmquist, J.K., et al., Distributions of leptin receptor mRNA isoforms in the rat brain. J Comp Neurol, 1998. 395(4): p. 535-47.
61. Erickson, J.C., et al., Endocrine function of neuropeptide Y knockout mice. Regul Pept, 1997. 70(2-3): p. 199-202.
62. Fei, H., et al., Anatomic localization of alternatively spliced leptin receptors (Ob-R) in mouse brain and other tissues. Proc Natl Acad Sci U S A, 1997. 94(13): p. 7001-5.
63. Finkelstein, E.A., I.C. Fiebelkorn, and G. Wang, National medical spending attributable to overweight and obesity: how much, and who's paying? Health Aff (Millwood), 2003. Suppl Web Exclusives: p. W3-219-26.
64. Frederich, R.C., et al., Leptin levels reflect body lipid content in mice: evidence for diet-induced resistance to leptin action. Nat Med, 1995. 1(12): p. 1311-4.
65. Friedman, M.I., Fuel partitioning and food intake. Am J Clin Nutr, 1998. 67(3 Suppl): p. 513S-518S.
66. Gibbs, J., R.C. Young, and G.P. Smith, Cholecystokinin decreases food intake in rats. J Comp Physiol Psychol, 1973. 84(3): p. 488-95.
67. Gil-Campos, M., et al., Ghrelin: a hormone regulating food intake and energy homeostasis. Br J Nutr, 2006. 96(2): p. 201-26.
68. Giugliano, D., A. Ceriello, and K. Esposito, The effects of diet on inflammation: emphasis on the metabolic syndrome. J Am Coll Cardiol, 2006. 48(4): p. 677-85.
69. Glaum, S.R., et al., Leptin, the obese gene product, rapidly modulates synaptic transmission in the hypothalamus. Mol Pharmacol, 1996. 50(2): p. 230-5.
70. Golay, A. and E. Bobbioni, The role of dietary fat in obesity. Int J Obes Relat Metab Disord, 1997. 21 Suppl 3: p. S2-11.
71. Griffin, M.E., et al., Free fatty acid-induced insulin resistance is associated with activation of protein kinase C theta and alterations in the insulin signaling cascade. Diabetes, 1999. 48(6): p. 1270-4.

148
72. Hahn, T.M., et al., Coexpression of Agrp and NPY in fasting-activated hypothalamic neurons. Nat Neurosci, 1998. 1(4): p. 271-2.
73. Hamilton, J.A. and K. Brunaldi, A model for fatty acid transport into the brain. J Mol Neurosci, 2007. 33(1): p. 12-7.
74. Haynes, W.G., et al., Sympathetic and cardiorenal actions of leptin. Hypertension, 1997. 30(3 Pt 2): p. 619-23.
75. Heine, P.A., et al., Increased adipose tissue in male and female estrogen receptor-alpha knockout mice. Proc Natl Acad Sci U S A, 2000. 97(23): p. 12729-34.
76. Hotamisligil, G.S., Inflammatory pathways and insulin action. Int J Obes Relat Metab Disord, 2003. 27 Suppl 3: p. S53-5.
77. Hotamisligil, G.S., et al., Increased adipose tissue expression of tumor necrosis factor-alpha in human obesity and insulin resistance. J Clin Invest, 1995. 95(5): p. 2409-15.
78. Hotamisligil, G.S., N.S. Shargill, and B.M. Spiegelman, Adipose expression of tumor necrosis factor-alpha: direct role in obesity-linked insulin resistance. Science, 1993. 259(5091): p. 87-91.
79. Houmard, J.A., et al., Effect of weight loss on insulin sensitivity and intramuscular long-chain fatty acyl-CoAs in morbidly obese subjects. Diabetes, 2002. 51(10): p. 2959-63.
80. Isganaitis, E. and R.H. Lustig, Fast food, central nervous system insulin resistance, and obesity. Arterioscler Thromb Vasc Biol, 2005. 25(12): p. 2451-62.
81. Janeway, C.A., Jr. and R. Medzhitov, Innate immune recognition. Annu Rev Immunol, 2002. 20: p. 197-216.
82. Kaiyala, K.J., et al., Obesity induced by a high-fat diet is associated with reduced brain insulin transport in dogs. Diabetes, 2000. 49(9): p. 1525-33.
83. Karhunen, L.J., et al., Effect of protein, fat, carbohydrate and fibre on gastrointestinal peptide release in humans. Regul Pept, 2008. 149(1-3): p. 70-8.

149
84. Kastin, A.J. and W. Pan, Dynamic regulation of leptin entry into brain by the blood-brain barrier. Regul Pept, 2000. 92(1-3): p. 37-43.
85. Kennedy, G.C., The role of depot fat in the hypothalamic control of food intake in the rat. Proc R Soc Lond B Biol Sci, 1953. 140(901): p. 578-96.
86. Kersten, A., J.H. Strubbe, and N.J. Spiteri, Meal patterning of rats with changes in day length and food availability. Physiol Behav, 1980. 25(6): p. 953-8.
87. Kim, J.H., R.A. Bachmann, and J. Chen, Interleukin-6 and insulin resistance. Vitam Horm, 2009. 80: p. 613-33.
88. Kim, J.K., et al., Prevention of fat-induced insulin resistance by salicylate. J Clin Invest, 2001. 108(3): p. 437-46.
89. Kitamura, T., et al., Forkhead protein FoxO1 mediates Agrp-dependent effects of leptin on food intake. Nat Med, 2006. 12(5): p. 534-40.
90. Kloek, C., et al., Regulation of Jak kinases by intracellular leptin receptor sequences. J Biol Chem, 2002. 277(44): p. 41547-55.
91. Klok, M.D., S. Jakobsdottir, and M.L. Drent, The role of leptin and ghrelin in the regulation of food intake and body weight in humans: a review. Obes Rev, 2007. 8(1): p. 21-34.
92. Korbonits, M., et al., Ghrelin--a hormone with multiple functions. Front Neuroendocrinol, 2004. 25(1): p. 27-68.
93. Krssak, M., et al., Intramyocellular lipid concentrations are correlated with insulin sensitivity in humans: a 1H NMR spectroscopy study. Diabetologia, 1999. 42(1): p. 113-6.
94. Kumagai, S., A. Holmang, and P. Bjorntorp, The effects of oestrogen and progesterone on insulin sensitivity in female rats. Acta Physiol Scand, 1993. 149(1): p. 91-7.
95. Laflamme, N. and S. Rivest, Toll-like receptor 4: the missing link of the cerebral innate immune response triggered by circulating gram-negative bacterial cell wall components. Faseb J, 2001. 15(1): p. 155-163.
150
96. Le Magnen, J. and S. Tallon, [The spontaneous periodicity of ad libitum food intake in white rats]. J Physiol (Paris), 1966. 58(3): p. 323-49.
97. Lee, G.H., et al., Abnormal splicing of the leptin receptor in diabetic mice. Nature, 1996. 379(6566): p. 632-5.
98. Lee, J.Y., et al., Differential modulation of Toll-like receptors by fatty acids: preferential inhibition by n-3 polyunsaturated fatty acids. J Lipid Res, 2003. 44(3): p. 479-86.
99. Lee, J.Y., et al., Saturated fatty acids, but not unsaturated fatty acids, induce the expression of cyclooxygenase-2 mediated through Toll-like receptor 4. J Biol Chem, 2001. 276(20): p. 16683-9.
100. Lee, J.Y., et al., Reciprocal modulation of Toll-like receptor-4 signaling pathways involving MyD88 and phosphatidylinositol 3-kinase/AKT by saturated and polyunsaturated fatty acids. J Biol Chem, 2003. 278(39): p. 37041-51.
101. Levin, B.E. and A.A. Dunn-Meynell, Defense of body weight depends on dietary composition and palatability in rats with diet-induced obesity. Am J Physiol Regul Integr Comp Physiol, 2002. 282(1): p. R46-54.
102. Levin, B.E. and A.A. Dunn-Meynell, Reduced central leptin sensitivity in rats with diet-induced obesity. Am J Physiol Regul Integr Comp Physiol, 2002. 283(4): p. R941-8.
103. Levine, A.S. and J.E. Morley, Neuropeptide Y: a potent inducer of consummatory behavior in rats. Peptides, 1984. 5(6): p. 1025-9.
104. Li, J.Y., et al., Agouti-related protein-like immunoreactivity: characterization of release from hypothalamic tissue and presence in serum. Endocrinology, 2000. 141(6): p. 1942-50.
105. Lin, S., et al., Development of high fat diet-induced obesity and leptin resistance in C57Bl/6J mice. Int J Obes Relat Metab Disord, 2000. 24(5): p. 639-46.
106. Lin, X., et al., Protein kinase C-theta participates in NF-kappaB activation induced by CD3-CD28 costimulation through selective activation of IkappaB kinase beta. Mol Cell Biol, 2000. 20(8): p. 2933-40.

151
107. Louet, J.F., C. LeMay, and F. Mauvais-Jarvis, Antidiabetic actions of estrogen: insight from human and genetic mouse models. Curr Atheroscler Rep, 2004. 6(3): p. 180-5.
108. Lu, D., et al., Agouti protein is an antagonist of the melanocyte-stimulating-hormone receptor. Nature, 1994. 371(6500): p. 799-802.
109. Lu, Y.C., W.C. Yeh, and P.S. Ohashi, LPS/TLR4 signal transduction pathway. Cytokine, 2008. 42(2): p. 145-51.
110. MacDougald, O.A., et al., Regulated expression of the obese gene product (leptin) in white adipose tissue and 3T3-L1 adipocytes. Proc Natl Acad Sci U S A, 1995. 92(20): p. 9034-7.
111. Madrid, L.V., et al., Akt stimulates the transactivation potential of the RelA/p65 Subunit of NF-kappa B through utilization of the Ikappa B kinase and activation of the mitogen-activated protein kinase p38. J Biol Chem, 2001. 276(22): p. 18934-40.
112. Marsh, D.J., et al., Response of melanocortin-4 receptor-deficient mice to anorectic and orexigenic peptides. Nat Genet, 1999. 21(1): p. 119-22.
113. Matsuo, T., et al., Sympathetic activity is lower in rats fed a beef tallow diet than in rats fed a safflower oil diet. Metabolism, 1995. 44(7): p. 934-9.
114. Mercer, J.G., et al., Coexpression of leptin receptor and preproneuropeptide Y mRNA in arcuate nucleus of mouse hypothalamus. J Neuroendocrinol, 1996. 8(10): p. 733-5.
115. Mercer, J.G., et al., Localization of leptin receptor mRNA and the long form splice variant (Ob-Rb) in mouse hypothalamus and adjacent brain regions by in situ hybridization. FEBS Lett, 1996. 387(2-3): p. 113-6.
116. Milanski, M., et al., Saturated fatty acids produce an inflammatory response predominantly through the activation of TLR4 signaling in hypothalamus: implications for the pathogenesis of obesity. J Neurosci, 2009. 29(2): p. 359-70.
117. Miller, J.C., J.M. Gnaedinger, and S.I. Rapoport, Utilization of plasma fatty acid in rat brain: distribution of [14C]palmitate between oxidative and synthetic pathways. J Neurochem, 1987. 49(5): p. 1507-14.

152
118. Mitchell, D., et al., Poison induced pica in rats. Physiol Behav, 1976. 17(4): p. 691-7.
119. Miyazaki, M., Y.C. Kim, and J.M. Ntambi, A lipogenic diet in mice with a disruption of the stearoyl-CoA desaturase 1 gene reveals a stringent requirement of endogenous monounsaturated fatty acids for triglyceride synthesis. J Lipid Res, 2001. 42(7): p. 1018-24.
120. Mokdad, A.H., et al., The continuing epidemics of obesity and diabetes in the United States. Jama, 2001. 286(10): p. 1195-200.
121. Monick, M.M., et al., Lipopolysaccharide activates Akt in human alveolar macrophages resulting in nuclear accumulation and transcriptional activity of beta-catenin. J Immunol, 2001. 166(7): p. 4713-20.
122. Morris, B.J., Neuronal localisation of neuropeptide Y gene expression in rat brain. J Comp Neurol, 1989. 290(3): p. 358-68.
123. Morton, G.J., et al., Leptin action in the forebrain regulates the hindbrain response to satiety signals. J Clin Invest, 2005. 115(3): p. 703-10.
124. Morton, G.J. and M.W. Schwartz, The NPY/AgRP neuron and energy homeostasis. Int J Obes Relat Metab Disord, 2001. 25 Suppl 5: p. S56-62.
125. Munford, R.S. and C.L. Hall, Detoxification of bacterial lipopolysaccharides (endotoxins) by a human neutrophil enzyme. Science, 1986. 234(4773): p. 203-5.
126. Munzberg, H., J.S. Flier, and C. Bjorbaek, Region-specific leptin resistance within the hypothalamus of diet-induced obese mice. Endocrinology, 2004. 145(11): p. 4880-9.
127. Murphy, K.G. and S.R. Bloom, Gut hormones and the regulation of energy homeostasis. Nature, 2006. 444(7121): p. 854-9.
128. Musatov, S., et al., Silencing of estrogen receptor alpha in the ventromedial nucleus of hypothalamus leads to metabolic syndrome. Proc Natl Acad Sci U S A, 2007. 104(7): p. 2501-6.
129. Nakatani, Y., et al., Involvement of endoplasmic reticulum stress in insulin resistance and diabetes. J Biol Chem, 2005. 280(1): p. 847-51.

153
130. Nikkari, T., et al., Fatty acid composition of serum lipid fractions in relation to gender and quality of dietary fat. Ann Med, 1995. 27(4): p. 491-8.
131. Nishimura, M. and S. Naito, Tissue-specific mRNA expression profiles of human toll-like receptors and related genes. Biol Pharm Bull, 2005. 28(5): p. 886-92.
132. Niswender, K.D., D.G. Baskin, and M.W. Schwartz, Insulin and its evolving partnership with leptin in the hypothalamic control of energy homeostasis. Trends Endocrinol Metab, 2004. 15(8): p. 362-9.
133. Niswender, K.D., et al., Insulin activation of phosphatidylinositol 3-kinase in the hypothalamic arcuate nucleus: a key mediator of insulin-induced anorexia. Diabetes, 2003. 52(2): p. 227-31.
134. O'Neill, L.A. and A.G. Bowie, The family of five: TIR-domain-containing adaptors in Toll-like receptor signalling. Nat Rev Immunol, 2007. 7(5): p. 353-64.
135. Ollmann, M.M., et al., Antagonism of central melanocortin receptors in vitro and in vivo by agouti-related protein. Science, 1997. 278(5335): p. 135-8.
136. Olshansky, S.J., et al., A potential decline in life expectancy in the United States in the 21st century. N Engl J Med, 2005. 352(11): p. 1138-45.
137. Ozcan, L., et al., Endoplasmic reticulum stress plays a central role in development of leptin resistance. Cell Metab, 2009. 9(1): p. 35-51.
138. Ozcan, U., et al., Endoplasmic reticulum stress links obesity, insulin action, and type 2 diabetes. Science, 2004. 306(5695): p. 457-61.
139. Pan, D.A., et al., Skeletal muscle triglyceride levels are inversely related to insulin action. Diabetes, 1997. 46(6): p. 983-8.
140. Perseghin, G., et al., Intramyocellular triglyceride content is a determinant of in vivo insulin resistance in humans: a 1H-13C nuclear magnetic resonance spectroscopy assessment in offspring of type 2 diabetic parents. Diabetes, 1999. 48(8): p. 1600-6.
141. Plum, L., M. Schubert, and J.C. Bruning, The role of insulin receptor signaling in the brain. Trends Endocrinol Metab, 2005. 16(2): p. 59-65.

154
142. Poggi, M., et al., C3H/HeJ mice carrying a toll-like receptor 4 mutation are protected against the development of insulin resistance in white adipose tissue in response to a high-fat diet. Diabetologia, 2007. 50(6): p. 1267-76.
143. Pohlman, T.H., R.S. Munford, and J.M. Harlan, Deacylated lipopolysaccharide inhibits neutrophil adherence to endothelium induced by lipopolysaccharide in vitro. J Exp Med, 1987. 165(5): p. 1393-402.
144. Polonsky, K.S., et al., Quantitative study of insulin secretion and clearance in normal and obese subjects. J Clin Invest, 1988. 81(2): p. 435-41.
145. Poltorak, A., et al., Defective LPS signaling in C3H/HeJ and C57BL/10ScCr mice: mutations in Tlr4 gene. Science, 1998. 282(5396): p. 2085-8.
146. Posey, K., et al., Hypothalamic proinflammatory lipid accumulation, inflammation, and insulin resistance in rats fed a high-fat diet. Am J Physiol Endocrinol Metab, 2008.
147. Powis, J.E., J.S. Bains, and A.V. Ferguson, Leptin depolarizes rat hypothalamic paraventricular nucleus neurons. Am J Physiol, 1998. 274(5 Pt 2): p. R1468-72.
148. Pritchard, L.E., A.V. Turnbull, and A. White, Pro-opiomelanocortin processing in the hypothalamus: impact on melanocortin signalling and obesity. J Endocrinol, 2002. 172(3): p. 411-21.
149. Raetz, C.R. and C. Whitfield, Lipopolysaccharide endotoxins. Annu Rev Biochem, 2002. 71: p. 635-700.
150. Rahman, S.M., et al., Stearoyl-CoA desaturase 1 deficiency elevates insulin-signaling components and down-regulates protein-tyrosine phosphatase 1B in muscle. Proc Natl Acad Sci U S A, 2003. 100(19): p. 11110-5.
151. Reid, J., A.I. Macdougall, and M.M. Andrews, Aspirin and diabetes mellitus. Br Med J, 1957. 2(5053): p. 1071-4.
152. Riccardi, G., R. Giacco, and A.A. Rivellese, Dietary fat, insulin sensitivity and the metabolic syndrome. Clin Nutr, 2004. 23(4): p. 447-56.
153. Ropero, A.B., et al., The role of estrogen receptors in the control of energy and glucose homeostasis. Steroids, 2008. 73(9-10): p. 874-9.

155
154. Rosenbaum, M., et al., Effects of gender, body composition, and menopause on plasma concentrations of leptin. J Clin Endocrinol Metab, 1996. 81(9): p. 3424-7.
155. Sahu, A., P.S. Kalra, and S.P. Kalra, Food deprivation and ingestion induce reciprocal changes in neuropeptide Y concentrations in the paraventricular nucleus. Peptides, 1988. 9(1): p. 83-6.
156. Salh, B., et al., Activation of phosphatidylinositol 3-kinase, protein kinase B, and p70 S6 kinases in lipopolysaccharide-stimulated Raw 264.7 cells: differential effects of rapamycin, Ly294002, and wortmannin on nitric oxide production. J Immunol, 1998. 161(12): p. 6947-54.
157. Sampath, H. and J.M. Ntambi, The fate and intermediary metabolism of stearic acid. Lipids, 2005. 40(12): p. 1187-91.
158. Schindler, C. and J.E. Darnell, Jr., Transcriptional responses to polypeptide ligands: the JAK-STAT pathway. Annu Rev Biochem, 1995. 64: p. 621-51.
159. Schmidt, M.I., et al., Markers of inflammation and prediction of diabetes mellitus in adults (Atherosclerosis Risk in Communities study): a cohort study. Lancet, 1999. 353(9165): p. 1649-52.
160. Schwartz, M.W., et al., Central insulin administration reduces neuropeptide Y mRNA expression in the arcuate nucleus of food-deprived lean (Fa/Fa) but not obese (fa/fa) Zucker rats. Endocrinology, 1991. 128(5): p. 2645-7.
161. Schwartz, M.W., et al., Cerebrospinal fluid leptin levels: relationship to plasma levels and to adiposity in humans. Nat Med, 1996. 2(5): p. 589-93.
162. Schwartz, M.W., et al., Kinetics and specificity of insulin uptake from plasma into cerebrospinal fluid. Am J Physiol, 1990. 259(3 Pt 1): p. E378-83.
163. Schwartz, M.W., et al., Central nervous system control of food intake. Nature, 2000. 404(6778): p. 661-71.
164. Seeley, R.J., et al., Behavioral, endocrine, and hypothalamic responses to involuntary overfeeding. Am J Physiol, 1996. 271(3 Pt 2): p. R819-23.
165. Shi, H., et al., TLR4 links innate immunity and fatty acid-induced insulin resistance. J Clin Invest, 2006. 116(11): p. 3015-25.

156
166. Shimomura, Y., T. Tamura, and M. Suzuki, Less body fat accumulation in rats fed a safflower oil diet than in rats fed a beef tallow diet. J Nutr, 1990. 120(11): p. 1291-6.
167. Shoelson, S.E., J. Lee, and A.B. Goldfine, Inflammation and insulin resistance. J Clin Invest, 2006. 116(7): p. 1793-801.
168. Shoelson, S.E., J. Lee, and M. Yuan, Inflammation and the IKK beta/I kappa B/NF-kappa B axis in obesity- and diet-induced insulin resistance. Int J Obes Relat Metab Disord, 2003. 27 Suppl 3: p. S49-52.
169. Shulman, G.I., Cellular mechanisms of insulin resistance. J Clin Invest, 2000. 106(2): p. 171-6.
170. Sims, E.A., et al., Experimental obesity in man. Trans Assoc Am Physicians, 1968. 81: p. 153-70.
171. Sinha, S., et al., Fatty acid-induced insulin resistance in L6 myotubes is prevented by inhibition of activation and nuclear localization of nuclear factor kappa B. J Biol Chem, 2004. 279(40): p. 41294-301.
172. Sipols, A.J., D.G. Baskin, and M.W. Schwartz, Effect of intracerebroventricular insulin infusion on diabetic hyperphagia and hypothalamic neuropeptide gene expression. Diabetes, 1995. 44(2): p. 147-51.
173. Small, C.J., et al., Effects of chronic central nervous system administration of agouti-related protein in pair-fed animals. Diabetes, 2001. 50(2): p. 248-54.
174. Smith, G.P., C. Jerome, and R. Norgren, Afferent axons in abdominal vagus mediate satiety effect of cholecystokinin in rats. Am J Physiol, 1985. 249(5 Pt 2): p. R638-41.
175. Spanswick, D., et al., Insulin activates ATP-sensitive K+ channels in hypothalamic neurons of lean, but not obese rats. Nat Neurosci, 2000. 3(8): p. 757-8.
176. Spector, A.A., Plasma free fatty acid and lipoproteins as sources of polyunsaturated fatty acid for the brain. J Mol Neurosci, 2001. 16(2-3): p. 159-65; discussion 215-21.

157
177. Stein, D.T., et al., The insulinotropic potency of fatty acids is influenced profoundly by their chain length and degree of saturation. J Clin Invest, 1997. 100(2): p. 398-403.
178. Stein, L.J., et al., Reduced effect of experimental peripheral hyperinsulinemia to elevate cerebrospinal fluid insulin concentrations of obese Zucker rats. Endocrinology, 1987. 121(5): p. 1611-5.
179. Takeuchi, H., et al., Diet-induced thermogenesis is lower in rats fed a lard diet than in those fed a high oleic acid safflower oil diet, a safflower oil diet or a linseed oil diet. J Nutr, 1995. 125(4): p. 920-5.
180. Tartaglia, L.A., et al., Identification and expression cloning of a leptin receptor, OB-R. Cell, 1995. 83(7): p. 1263-71.
181. Tatemoto, K., M. Carlquist, and V. Mutt, Neuropeptide Y--a novel brain peptide with structural similarities to peptide YY and pancreatic polypeptide. Nature, 1982. 296(5858): p. 659-60.
182. Thornton, J.E., et al., Regulation of hypothalamic proopiomelanocortin mRNA by leptin in ob/ob mice. Endocrinology, 1997. 138(11): p. 5063-6.
183. Travers, J.B., S.P. Travers, and R. Norgren, Gustatory neural processing in the hindbrain. Annu Rev Neurosci, 1987. 10: p. 595-632.
184. Tsukumo, D.M., et al., Loss-of-function mutation in Toll-like receptor 4 prevents diet-induced obesity and insulin resistance. Diabetes, 2007. 56(8): p. 1986-98.
185. Tsuneki, H., et al., Age-related insulin resistance in hypothalamus and peripheral tissues of orexin knockout mice. Diabetologia, 2008. 51(4): p. 657-67.
186. Uotani, S., et al., Functional properties of leptin receptor isoforms: internalization and degradation of leptin and ligand-induced receptor downregulation. Diabetes, 1999. 48(2): p. 279-86.
187. Vaisse, C., et al., Leptin activation of Stat3 in the hypothalamus of wild-type and ob/ob mice but not db/db mice. Nat Genet, 1996. 14(1): p. 95-7.
188. Van Heek, M., et al., Diet-induced obese mice develop peripheral, but not central, resistance to leptin. J Clin Invest, 1997. 99(3): p. 385-90.

158
189. van Staveren, W.A., et al., Validity of the fatty acid composition of subcutaneous fat tissue microbiopsies as an estimate of the long-term average fatty acid composition of the diet of separate individuals. Am J Epidemiol, 1986. 123(3): p. 455-63.
190. Vessby, B., et al., Desaturation and elongation of Fatty acids and insulin action. Ann N Y Acad Sci, 2002. 967: p. 183-95.
191. Wagner, J.D., et al., Insulin sensitivity and cardiovascular risk factors in ovariectomized monkeys with estradiol alone or combined with nomegestrol acetate. J Clin Endocrinol Metab, 1998. 83(3): p. 896-901.
192. Wallace, F.A., E.A. Miles, and P.C. Calder, Activation state alters the effect of dietary fatty acids on pro-inflammatory mediator production by murine macrophages. Cytokine, 2000. 12(9): p. 1374-9.
193. Wang, L., et al., Synergistic interaction between CCK and leptin to regulate food intake. Regul Pept, 2000. 92(1-3): p. 79-85.
194. Weigle, D.S., et al., Recombinant ob protein reduces feeding and body weight in the ob/ob mouse. J Clin Invest, 1995. 96(4): p. 2065-70.
195. Wells, J.C., The evolution of human fatness and susceptibility to obesity: an ethological approach. Biol Rev Camb Philos Soc, 2006. 81(2): p. 183-205.
196. West, D.B., D. Fey, and S.C. Woods, Cholecystokinin persistently suppresses meal size but not food intake in free-feeding rats. Am J Physiol, 1984. 246(5 Pt 2): p. R776-87.
197. West, D.B. and B. York, Dietary fat, genetic predisposition, and obesity: lessons from animal models. Am J Clin Nutr, 1998. 67(3 Suppl): p. 505S-512S.
198. Westerterp, K.R., Perception, passive overfeeding and energy metabolism. Physiol Behav, 2006. 89(1): p. 62-5.
199. White, D.W., et al., Leptin receptor (OB-R) signaling. Cytoplasmic domain mutational analysis and evidence for receptor homo-oligomerization. J Biol Chem, 1997. 272(7): p. 4065-71.
200. White, M.F., Insulin signaling in health and disease. Science, 2003. 302(5651): p. 1710-1.

159
201. Williams, G., et al., The hypothalamus and the control of energy homeostasis: different circuits, different purposes. Physiol Behav, 2001. 74(4-5): p. 683-701.
202. Woods, S.C., et al., Chronic intracerebroventricular infusion of insulin reduces food intake and body weight of baboons. Nature, 1979. 282(5738): p. 503-5.
203. Woods, S.C. and D. Porte, Jr., The central nervous system, pancreatic hormones, feeding, and obesity. Adv Metab Disord, 1978. 9: p. 283-312.
204. Woods, S.C., et al., Signals that regulate food intake and energy homeostasis. Science, 1998. 280(5368): p. 1378-83.
205. Woods, S.C., et al., A controlled high-fat diet induces an obese syndrome in rats. J Nutr, 2003. 133(4): p. 1081-7.
206. Worgall, T.S., et al., Polyunsaturated fatty acids decrease expression of promoters with sterol regulatory elements by decreasing levels of mature sterol regulatory element-binding protein. J Biol Chem, 1998. 273(40): p. 25537-40.
207. Yeo, G.S., et al., The role of melanocortin signalling in the control of body weight: evidence from human and murine genetic models. Qjm, 2000. 93(1): p. 7-14.
208. Yuan, M., et al., Reversal of obesity- and diet-induced insulin resistance with salicylates or targeted disruption of Ikkbeta. Science, 2001. 293(5535): p. 1673-7.
209. Zarjevski, N., et al., Chronic intracerebroventricular neuropeptide-Y administration to normal rats mimics hormonal and metabolic changes of obesity. Endocrinology, 1993. 133(4): p. 1753-8.
210. Zhang, Y., et al., Positional cloning of the mouse obese gene and its human homologue. Nature, 1994. 372(6505): p. 425-32.
211. Zick, Y., Insulin resistance: a phosphorylation-based uncoupling of insulin signaling. Trends Cell Biol, 2001. 11(11): p. 437-41.