Embed Size (px)
Citation preview

THE ROLE OF DUAL ENROLLMENT IN THE EDUCATIONAL ACHIEVEMENT OF
TECHNICAL COLLEGE STUDENTS
by
JULIE LYNN POST
(Under the Direction of Jay W. Rojewski,)
ABSTRACT
While economic issues have been blamed for persistent unemployment problems in the
U.S. and the state of Georgia, lack of competently trained workers is emerging as an even more
relevant issue. Increasingly, a large portion of available work requires some type of
postsecondary training. The transition between education systems in the U.S. revolving around
high school graduation, college entrance, necessity of remediation, and college completion seem
to be challenging.
Two-year postsecondary institutions offer multiple program goals for students including
certificates, diplomas, and associate degrees all requiring varying general and occupational
education coursework. Leveraging the assets of 2-year colleges, affordability of attending a 2-
year institution and an increase in attendance at these institutions, may offer a unique bridge for
U.S. educational systems, the workforce, and the economy. A wide range of postsecondary
enrollment options have been cited to possibly facilitate a bridge between systems and accelerate
student achievement. Dual enrollment is one option. Despite increased adoption of and attention
to dual enrollment options, relatively little research has been done to determine the impact of this
intervention on postsecondary student outcomes.

This correlational design study used archival data to examine the unique role of dual
enrollment, given the concomitant influence of other selected predictor variables, in explaining
three distinct indicators of the educational achievement of postsecondary students at technical
colleges in Georgia. Other predictor variables included race/ethnicity, gender, enrollment status,
and program level. Educational achievement was defined with three separate criterion variables
including grade point average at the technical college, college enrollment persistence, and
postsecondary credential attainment.
Regression analyses indicated that dual enrollment was a statistically significant predictor
of the likelihood of a higher GPA at the end of the first year, but negatively impacted the
likelihood that a student would persist to the second year. White students were more likely than
Black students to possess higher GPAs at the end of the first year. Black students were also less
likely than White to be persistent in enrolling in coursework Year 2. Men were less likely than
women to be retained. Full-time student enrollment was the only statistically significant
predictor of credential attainment within three years.
INDEX WORDS: Dual enrollment, Postsecondary achievement, Educational achievement, Two-year college, Technical college, Community college, Georgia, Technical College System of Georgia, Retention, Persistence, Credential attainment, GPA, Full-time/part-time enrollment, Gender, Race/ethnicity, Program level

THE ROLE OF DUAL ENROLLMENT IN THE EDUCATIONAL ACHIEVEMENT OF
TECHNICAL COLLEGE STUDENTS
by
JULIE LYNN POST
B.S., Northern Kentucky University, 1995
M.A.T., Marygrove College, 1999
A Dissertation Submitted to the Graduate Faculty of The University of Georgia in Partial
Fulfillment of the Requirements for the Degree
DOCTOR OF EDUCATION
ATHENS, GEORGIA
2013

© 2013
Julie Lynn Post
All Rights Reserved

THE ROLE OF DUAL ENROLLMENT IN THE EDUCATIONAL ACHIEVEMENT OF
TECHNICAL COLLEGE STUDENTS
by
JULIE LYNN POST
Major Professor: Jay W. Rojewski
Committee: Roger B. Hill J. Elaine Adams In Heok Lee
Electronic Version Approved:
Maureen Grasso Dean of the Graduate School The University of Georgia May 2013

iv
DEDICATION
First and foremost, I dedicate this dissertation with love and inspiration to my beautiful,
amazing, wonderful daughter. Haley, may you seize every opportunity to grow and learn, use to
the fullest the gifts God gave you, recognize the value of education, question everything always
seeking the answers, and pursue all your goals, hopes and dreams with unwavering perseverance,
hard work, and dedication. You are my sunshine, and I love you baby girl.
In addition, I also dedicate this work to my late father, Robert Gary Schoenberger, who
believed in diligence, perseverance, hard work, getting only what you earned, and who
encouraged me to take my education as far as I could go in the pursuit of being all I could be. I
miss you immensely Dad.

v
ACKNOWLEDGEMENTS
I wish to thank, first and foremost, my daughter and my husband. Thank you, Haley, for
adapting to mommy’s never-ending homework, bouts of tired grumpiness, occasional missed
events and limited time together. Your hugs, hidden notes, and beautiful smile are what got me
through. And most especially, Randy, for your patience in enduring the chaotic, busy years of
being married to a mother, higher education administrator, and doctoral student who had little
time or energy left to be much of a wife.
It is with immense gratitude that I acknowledge the wisdom and assistance of my major
professor, Dr. Jay Rojewski. Without your straightforward, honest support, occasional doses of
reality, random quips, and amusing comments; I would never have made it to the end. Your
guidance was invaluable. Also, thank you to committee members Dr. Hill and Dr. Adams for
your advice, attention, and time and Dr. Lee for all the fabulous statistical assistance.
It gives me great pleasure to acknowledge my Gwinnett Tech family….the perfect
workforce education inspiration. Without the friendship, cooperation, and flexibility of my
fantastic boss and mentor, I certainly couldn’t have accomplished this. I am also very
appreciative of the encouragement from my many colleagues, most notably my office mates and
fellow president’s cabinet members. Without your regular cheerleading and workload
assistance, I may have given up on numerous occasions.
Of course, this endeavor would not have been possible without the encouragement to
begin this journey and the constant support to see it to the end. For that, I thank family, dearest
friends, and emotional supporters; most especially VS, JH and SS. Lastly, thank you multiple
sclerosis, for making me stronger and more driven than I ever thought possible.

vi
TABLE OF CONTENTS
Page
ACKNOWLEDGEMENTS .............................................................................................................v
LIST OF TABLES ....................................................................................................................... viii
LIST OF FIGURES ....................................................................................................................... ix
CHAPTER
1 INTRODUCTION ...........................................................................................................1
Rationale ..........................................................................................................................1
Purpose Statement ...........................................................................................................8
Research Questions .........................................................................................................9
Conceptual Framework ...................................................................................................9
7 Importance of Study ......................................................................................................16
2 LITERATURE REVIEW ..............................................................................................18
Foundations ...................................................................................................................18
Criterion Variables of Postsecondary Achievement .....................................................41
Predictor Variables ........................................................................................................50
3 METHOD ......................................................................................................................52
Purpose Statement .........................................................................................................52
Research Questions .......................................................................................................52
Design ............................................................................................................................53
Participants ....................................................................................................................55
Procedure .......................................................................................................................59

vii
Data Collection ..............................................................................................................59
Data Analysis ................................................................................................................65
4 DATA ANALYSIS ........................................................................................................75
Research Question 1 - Student Characteristics ..............................................................76
Research Question 2 - GPA ...........................................................................................78
Research Question 3 - Retention ...................................................................................80
Research Question 4 - Credential Attainment ...............................................................82
5 CONCLUSIONS AND RECOMMENDATIONS .......................................................84
Summary .......................................................................................................................84
Conclusions ...................................................................................................................90
Implications for Dual Enrollment ..................................................................................99
Recommendations for Future Action ..........................................................................101
REFERENCES ............................................................................................................................103

viii
LIST OF TABLES
Page
Table 1: Disciplines and Theoretical Perspectives on Student Success .......................................42
Table 2: Characteristics of 2-year Postsecondary Students – Potential Influencing Variables .....................................................................................43
Table 3: Characteristics of 2-year Postsecondary Academic Achievement – Potential Criterion Variables .........................................................................................46
Table 4: Emerging Programs for Identifying and Measuring Student Progress and Achievement ...............................................................................48
Table 5: Demographics of Final Sample Used for Study .............................................................57
Table 6: Banner Data Elements and System Location of Selected Variable Data .......................63
Table 7: Research Questions and Corresponding Variable Descriptions with Analysis ..............68
Table 8: Regression Equations......................................................................................................71
Table 9: Demographic and Descriptive Statistics of Study Sample .............................................78
Table 10: Ordered Regression Results of GPA for Study Sample ...............................................80
Table 11: Logistic Regression Results of Year 2 Retention for Study Sample ............................81
Table 12: Logistic Regression Results of Graduation from 2-year Technical College in
Georgia for Study Sample .............................................................................................83

ix
LIST OF FIGURES
Page
Figure 1: Areas of Postsecondary Academic Achievement Influence ..........................................13
Figure 2: Histogram of GPA Continuous and GPA Grouped Variables ......................................66

1
CHAPTER 1 INTRODUCTION
Rationale
Unemployment and the Economy
While economic issues have been blamed for persistent unemployment problems in the
U.S. and the state of Georgia, lack of competently trained workers is emerging as an even more
relevant explanation for high rates of unemployment. Increasingly, a large portion of available
work requires some type of postsecondary training. In fact, by 2018 over half of the jobs in
Georgia will require postsecondary preparation (Carnevale, Smith, & Strohl, 2010).
Unfortunately, some businesses and industries have encountered difficulties in finding qualified
workers. A Manufacturing Institute and Deloitte (Rucket & Wilkins, 2011) report noted that
67% of manufacturers experienced moderate to severe shortages of qualified workers for skilled
production jobs. Deficiencies in the labor force have an impact on the ability of businesses to
expand and improve productivity. Apparently, available jobs exist, but an appropriately trained
workforce does not. Without properly trained employees, businesses cannot survive; hence,
aggravating a cycle of economic distresses (Rothwell & Berube, 2011).
High School Educational Concerns
Postsecondary training becomes more difficult when high school education is not
obtained. The national high school drop-out rate in 2011 was 8% (Aud, Hussar, Kena, Bianco,
Frohlich, Kemp, & Tahan, 2011). According to Georgia’s 2009-2010 Report Card (Governor’s
Office of Student Achievement, 2010), the state’s high school graduation rate was 80.8%,
meaning that 2 in every 10 students eligible to graduate did not earn a high school diploma. The
U.S. Bureau of Labor Statistics (2012) reported that in 2010 only 31% of all citizens over age 18

2
were high school graduates. Without a high school diploma, obtaining the extent of education
needed for success in the workforce becomes even more challenging. The U.S. Department of
Education Office of Vocational and Adult Education (Duncan & Dann-Messier, 2012) reported
that many high school students also lack career-focus. Therefore, students who do graduate high
school and subsequently enter postsecondary institutions are often unprepared for college-level
work in any career field.
High School to Postsecondary Education Transition
A high school diploma does not necessarily represent college readiness and a college
credential is increasingly more imperative for successful workforce entry. Interestingly, only
70% of high school graduates transition immediately to college. In addition, when these first-
year students do transition, more than one-third report having to take a remedial academic course
(Aud et al., 2011). Remedial courses are intended to bring students up to college-level general
education skills (Venezia, Kirst, & Antonio, 2003). The number of students requiring remedial
coursework increases to 40% for students who enter 2-year institutions (Aud et al., 2011). As
the workforce continues to change, adolescents can benefit from quality secondary training along
with a seamless transition to college that will then allow for successful entry into the workforce
(Venezia et al., 2003).
The transition between education systems in the U.S. revolving around high school
graduation, college entrance, necessity of remediation, and college completion seems to be
challenging (Boswell, 2001). Further, high school graduation rates do not portray the lack of
student readiness for college level work. Based on this, according to the Committee on
Measures of Student Success (2011), 2-year institutions have been earmarked to play a pivotal

3
role in increasing the education of Americans by getting students college ready and increasing
the number of college graduates in the United States.
Role of Community Colleges
Community colleges have broad missions and serve multiple stakeholders (Committee
on Measures of Student Success, 2011). Having been in existence for over 110 years, 2-year
postsecondary institutions have long held the hallmark of being flexible and rapid in response to
student, business, and community needs. Community colleges offer courses for credit to earn
certificates, diplomas, and associate degrees; as well as, non-credit courses and business and
industry training. However, community colleges face tremendous challenges in offering a wide
range of services to a growing population with diminishing funding (Phillipe & Sullivan, 2005).
Throughout the earlier 2010s, there was a great deal of discussion about the role of
community colleges in educational and economic development issues. Given a competitive,
technologically-driven world, community colleges seem to be the higher education venue most
sought for immediate work training, and the most quickly responsive to community education
and workforce needs (Zeidenberg & Bailey, 2010). The American Association of Community
Colleges (2011) noted that a majority of job openings by 2014 will require some postsecondary
education and already more than half the country’s undergraduate college students attend 2-year
institutions.
Two-year colleges have often been the route, at least for the beginning, of a student’s
college track. Now, even more than ever, this is true. Two-year college enrollment has
increased over 400% since 1965 to serving over 11.2 million credit and non-credit students at
1,158 public, independent, and tribal community colleges in the fall of 2002 (Phillippe &
Sullivan, 2005). It has been stated that its affordability is one reason for increased enrollment

4
(Zeidenberg & Bailey, 2010), and a general focus on student choice and community needs for
program offering influences is another (Phillippe & Sullivan, 2005). Leveraging the assets of 2-
year colleges, affordability of attending a 2-year institution, and an increase in attendance at
these institutions may offer a unique bridge for U.S. educational systems, workforce, and
economy (Crawford & Jervis, 2011).
Postsecondary Achievement
As 2-year institutions have received increased attention, effort has been directed toward
determining and measuring appropriate indicators of postsecondary achievement at these
institutions. Since the need for a college education to earn a sustainable living is more
imperative today than ever before, measurements of postsecondary achievement are at the
forefront of higher education discussions (Committee on Measures of Student Success, 2011). A
lack of rigor and meaning of the senior year of high school, unfocused career direction for
currently available jobs, rising college costs, prevalence of the need for remediation, and reduced
persistence that results in extended time to degree completion are all simmering topics among
government officials, as well as higher education leaders (Duncan & Dann-Messier, 2012).
However, the incidence of more challenges at this level climbs. Much concern revolves around
persistence and completion.
Increasing the number of graduates is of pronounced importance for economic growth
and self-sustainability. Yet, undergraduate enrollment in higher education has increased 34%
over the last decade and at a pace of 25% at the 2-year college level alone (Aud et al., 2011).
Two-year institutions offer multiple program goals for students including certificates, diplomas,
and associate degrees all requiring varying general and occupational education coursework. The
time to completion requirements also vary based on the skills required (Hirschy, Bremer, &

5
Castellano, 2011). Students enrolling at these institutions grow more and more diverse in their
age, race/ethnicity, socioeconomic status, college-readiness, and attendance habits (Phillipe &
Sullivan, 2005). All these characteristics differ from traditional 4-year institutions; therefore, the
normal measures and expectations of persistence and graduation must also differ (Hirschy et al.,
2011).
Persistence, also referred to as retention, is measured by whether a student enrolled in a
fall term, returns to continue studies the following fall term. At 2-year institutions throughout
the U.S., the rate of persistence was 58% for full-time students and only 40% for part-time
students in 2011. In evaluating graduation, also referred to as the completion rate, only 27% of
first-time full-time students completed their educational programs within 150% of the normal
time. Higher levels of earnings correspond to higher levels of education (Aud et al., 2011).
Dismal graduation and persistence rates suggest that students do not attain higher earnings, and
often times, only accumulate financial debt.
Bridging the Gap
The educational pipeline between high school and postsecondary education, along with
the troubling statistics at both levels, calls for these two systems to work together. Boswell
(2001) cited a wide range of postsecondary enrollment options that facilitate a bridge between
systems and accelerate student achievement. The options include concurrent high school and
college enrollment. Policymakers have called for implementing this concurrent high school and
college option for a multitude of reasons including limiting tuition costs, accelerating student
progress toward a degree, providing greater academic challenges and opportunities in high
school, and promoting student aspirations for college. All postsecondary enrollment options
require closer ties and collaboration between secondary and postsecondary institutions.

6
In reality, data suggests far too many students struggle with the transition from secondary
to postsecondary systems. Unfortunately, students lack the knowledge necessary to navigate
system changes. The options available, jobs accessible, and paths to success are often foreign to
families and students due to lack of exposure and unfamiliarity. Students and families need
introduction to practical knowledge and information, as well as assistance with navigating the
path (Hooker & Brand, 2010). Students need to acclimate to the social and academic demands of
college in order to ease the transition from secondary to postsecondary education and be
successful. Many researchers believe dual enrollment can do just that (Andrews, 2001; Bailey,
Hughes, & Karp, 2002, 2002; Boswell, 2001, Crockett-Bell, 2010; Edwards & Hughes, 2011;
Farrell & Seifert, 2007; Hugo, 2001; Karp, Calcagno, Hughes, Jeong, & Bailey, 2007; Mokher &
McLendon, 2009; Smith, 2007; Welsh, Brake, & Choi, 2005; Zeidenberg & Bailey, 2010).
Dual Enrollment
In addressing concerns of high school graduation and the need for postsecondary
academic remediation, as well as college persistence and completion, many state education
personnel are constantly searching for new ways to facilitate the educational pipeline from high
school to college and to the workforce. Dual enrollment is one option that has been available in
the U.S. for over 60 years (Mokher & McLendon, 2009). Dual enrollment refers to providing
high school students an opportunity to enroll in college-level courses and earn both high school
and college credit (Andrews, 2000, 2001, 2004; Bailey et al., 2002; Edwards & Hughes, 2011;
Karp et al., 2007; Smith, 2007; Welsh et al., 2005; Zeidenberg & Bailey, 2010). Since its
inception in the 1950s, dual enrollment has slowly, but gradually, been adopted throughout the
nation as a viable option for facilitating the transition from secondary to postsecondary education
(Andrews, 2001). Policy adoption, however, has been uneven, unpredictable, and slow.

7
Currently, 46 states have policies in place regarding dual enrollment and four have some sort of
secondary to postsecondary institutional-level agreements (Education Commission of the States,
2008).
Proponents posit that dual enrollment provides a more challenging senior year by
motivating students to work harder, affords them a wider array of curricular opportunities, and
helps them to transition to college-level demands (Andrews, 2001, 2004; Bailey et al., 2002;
Crockett-Bell, 2010; Karp et al., 2007). For students and families, dual enrollment aids with the
seamless transitional link between high school and college, shortens the time to a postsecondary
degree, and saves families time and money (Andrews, 2001, 2004; Bailey et al., 2002; Edwards
& Hughes, 2011; Farrell & Seifert, 2007; Karp et al., 2007; Mohker & McLendon, 2009; Smith,
2007; Zeidenberg & Bailey, 2010). Opponents raise concerns regarding conflicts in state
policies and financing, debates over whether students are college-ready, and possible
compromises in course rigor (Andrews, 2001; Bailey et al., 2002; Farrell & Seifert, 2007;
Mohker & McLendon, 2009; Smith, 2007).
Despite increased adoption of and attention to dual enrollment options, relatively little
research has been done to determine the impact of this intervention on postsecondary student
outcomes. The literature does not provide guidance on whether dual enrollment helps better
prepare students for college success. Does dual enrollment predict better postsecondary grade
point averages (GPA), aid in the persistence of students from year to year in college, or better
enable them to actually complete their college program in a reasonable amount of time? These
questions are the basis of this research study.
Literature on 2-year postsecondary education and dual enrollment yields quite a long list
of variables used to guide research evaluating academic achievement, identifying typologies of

8
students, and quantifying predictors of achievement. In addition to dual enrollment participation,
there are a multitude of factors that could contribute to academic success and an assortment of
ways to define and measure achievement based on the study outcomes desired (Horn, 2009).
Other predictor variables encountered include such factors as gender, age, race, socioeconomic
status, psychosocial factors, parent’s education, high school GPA, enrollment status, enrollment
level, and more (Hirschy et al., 2011).
Purpose Statement
The purpose of this correlational design study was to use archival data to examine the
unique role of dual enrollment, given the concomitant influence of other selected predictor
variables, in explaining three distinct indicators of the educational achievement of postsecondary
students at technical colleges in Georgia. Dual enrollment students are high school students
enrolled in college credit courses while still enrolled in high school and earning credit at both
institutions (Andrews, 2000, 2001, 2004; Bailey et al., 2002; Edwards & Hughes, 2011; Karp et
al., 2007; Mokher & McLendon, 2009; Smith, 2007; Welsh et al., 2005; Zeidenberg & Bailey,
2010). Other predictor variables included race/ethnicity, gender, enrollment status (categorized
as either full- or part-time), and program level (degree, diploma, or certificate). Educational
achievement was defined as three separate criterion variables including grade point average
(GPA) at the technical college at the end of the first year, college enrollment persistence defined
by enrollment (either enrolled or not enrolled in college coursework) the second year, and
postsecondary credential attainment (earning a degree, diploma, or technical certificate of credit
[TCC] from a technical college) within three years.

9
Research Questions
1. What are the characteristics of first-year technical college students including participation
in dual enrollment, race/ethnicity, gender, enrollment status, and program level?
2. What is the best set of predictors from those identified, including dual enrollment, for
explaining student GPA at the end of the first year of enrollment in postsecondary
technical college education?
3. What is the best set of predictors from those identified, including dual enrollment, for
retaining students in the technical college for a second year?
4. What is the best set of predictors from those identified, including dual enrollment, for
postsecondary credential attainment within three years of initial enrollment?
Conceptual Framework
Student success has been defined as “the degree to which individuals meet their
educational goals” (Hirschy et al., 2011, p. 312) and has been measured by a broad array of
potential outcomes. When focusing on the achievement of students in 2-year postsecondary
education, a variety of stakeholders exist including businesses, industries, individuals, families,
institutions, and government agencies. Psychology, sociology, education, and economics
researchers have attempted to develop theoretical frameworks that identify contributors to
postsecondary student achievement. Each framework reflects a particular perspective or interest,
often minimizing other important areas of influence (Hirschy et al., 2011). Considerations for
student characteristics, institutional best practices, and identifying factors have been developed,
but no one comprehensive theory exists to predict or explain postsecondary student achievement.
However, all theories do share some common themes. Therefore, for this study, a conceptual
framework was developed from theory, research, and practice to explain the academic

10
achievement of students in 2-year postsecondary education and guided the design and
implementation of the research study.
Evaluating student achievement or finding specific indicators of educational achievement
appear to focus on transition points that occur throughout students' educational paths (Horn,
2009). Key transition points can be used to track a student from high school graduation (and
determine college readiness), to college enrollment and achievement, and end with post-college
attainment (work outcomes or transfer to a 4-year college or university). While these transition
points envelope start to finish and appear to simplify the work of students and postsecondary
education institutions, they give attention to understanding the magnitude of measuring student
academic achievement (Perna & Thomas, 2008). The focus of this conceptual framework was
on 2-year postsecondary college enrollment and student achievement.
Not all benchmarks for student achievement are the same for all types of education
institutions due to different types of students and varying institutional missions and purposes.
Although there are a multitude of theories on predicting academic success, students at
community colleges, and even more so those in technical programs, are different than typical 4-
year university students. Education at the occupational, 2-year college level prepares students
with technical skills and knowledge for specific occupations. Programs at these institutions have
multiple exit points including associate degrees, diplomas, and short-term certificates; all with
the main goal of entering the workforce prepared for a specific career or trade (Hirschy et al.,
2011). In contrast, most traditional community college students tend to focus on preparation for
transfer to a 4-year institution for further education. To properly assess any 2-year college
student’s progress, researchers have attempted to identify suitable outcomes for measuring
achievement. Longitudinal benchmarks may include college enrollment, GPA, persistence,

11
attrition, transfer, career integration, program completion, and job attainment (Hirschy et al.,
2011; Horn, 2009; Perna & Thomas, 2008; Phillipe & Sullivan, 2005).
Hirschy et al. (2011) did not find an existing model that fit career and technical programs,
but used elements of several different models to develop their own. Their final model offers
awareness of what helps or hinders student progress and success in occupational programs at
community colleges. The importance of tracking students’ particular educational goals,
integrating the career variable, and expanding existing measures can assist institutions in
supporting occupational student success more accurately.
According to the National Center for Education Statistics (NCES) (Horn, 2009),
achievement of 2-year college students should be measured by a series of benchmarks to
determine if students are on track to complete their educational objective, whatever that objective
might be. Tinto (2007) produced theoretical articles explaining student persistence, why students
leave educational institutions and the importance of student engagement. Fortunately, in recent
years, many organizations (both private and governmental) have launched initiatives to attempt
to adequately assess 2-year and 4-year college and university student achievement. For example,
in conjunction with Tinto’s theory on predictors of student retention and degree completion,
NCES developed a measurement tool called the Community College Taxonomy (CCT) to
determine a student’s strength for degree completion (Horn, 2009).
Without addressing goals, motivations, or situational factors; the CCT tool uses
benchmarks or measuring points throughout a student’s college enrollment to determine the
likelihood of completion. Some of these benchmarks include academic indicators involving
college-level course readiness, retention or persistence, and credential attainment or transfer

12
(Horn, 2009). This measurement tool in conjunction with other similar initiatives formed the
basis for the framework of this study.
Although there are a lot of ideas on predictors of student achievement, no one theory
exists to align directly with this study. Figure 1 diagrams many areas of influence and potential
outcomes of achievement considered for this study. The focus of the study was on students
enrolled in 2-year technical colleges in Georgia. Benchmarks that specifically highlight
students’ postsecondary technical college academic achievement were used to establish study
parameters and guide data collection and interpretation. As a result of the review of literature on
postsecondary achievement and in consideration of 2-year college students, three particular
benchmarks at multiple points in a student’s path were used to define academic achievement.
First-year GPA, second-year persistence, and credential attainment were evaluated in
conjunction with selected student variables, including dual enrollment, to determine the value of
dual enrollment in explaining student postsecondary achievement at technical colleges in
Georgia. These variables emphasize benchmarks over the course of three years of student
enrollment.

13
Criterion Variables
Since most technical programs incorporate a mix of academic and occupational courses
(Hirschy et al., 2011), GPA is often used as an indicator of student achievement in course work.
GPA is a common measure of academic achievement found on student academic records in most
educational institutions. Academic performance is a strong predictor of success; and the strength
of many academic variables is attributable to first semester GPA. Students who start out strong
academically improve their chances of obtaining other positive educational outcomes (Gutierrez
& Dantes, 2009). GPA has also been used for competitive admission, maintenance of financial
aid, athletic eligibility, and academic honors. In order to successfully continue on an educational
path, courses must be taken, those courses must be passed in order to obtain credit, and the

14
grades earned contribute to the overall numeric value assigned to a student’s record. A positive
GPA has been shown to reflect a student’s educational commitment to their studies (Hirschy et
al., 2011).
Retention of students has become a regularly discussed topic for institutions of higher
education. Studies on interventions designed to enhance students’ persistence in their
coursework have been implemented, evaluated, and debated for years (Tinto, 2007). Theorists
use retention or persistence for conceptualizing and measuring student achievement and it is now
one of the most frequently examined student achievement measures (Perna & Thomas, 2008;
Tinto, 2007). Institutional, personal, situational, and emotional factors influence a student’s
decision to stay or leave. Theories capitalize on ideas of student connection and institutional
impact as influencers on persistence that ultimately lead to graduation (Tinto, 2007). Regardless
of reasons or factors, a student must persist to graduate; and therefore, it is a purposeful and
accurate predictor and measure of academic achievement.
Every student that enters a 2-year postsecondary education institution has a goal, e.g.,
degree, diploma, certificate, skill set, or coursework for academic transfer. At 2-year colleges,
those goals are best identified by admission to a program of study. Credential attainment or
graduation from a program of study is a goal for most students. Despite that desire, 2-year
colleges’ unique role of providing educational opportunities for all and accommodating a wide
range of student needs often translates to a large percentage of those students not obtaining the
intended credential (Horn, 2009). Credential attainment is clearly a measure of academic
success and the focus of much research. Many policies and practices are directed toward
achieving this outcome prior to entrance into the workforce (Perna & Thomas, 2008). Therefore,
this too, is a necessary measure of postsecondary academic achievement.

15
Predictor Variables
In educational research, certain student factors are evaluated for influence. Demographic
and enrollment pattern characteristics are often evaluated in conjunction with performance and
student achievement. In most studies, demographic factors are disaggregated for their effect on
educational achievement and for identifying necessary attention or intervention. These factors
include age, race/ethnicity, socioeconomic status, and gender. Because the mission of 2-year
institutions encompasses service to the entire community, it is common that the age, gender, and
race/ethnicity distribution of the student population is wide, ranging from those just exiting high
school to those returning from industry to upgrade job skills (Phillipe & Sullivan, 2005). In
some studies women students have been shown to outperform and persist at a greater rate than
men. Older students have been found to be more successful than younger students, but less
likely to graduate (D’Amico, Morgan, & Robertson, 2011; Gutierrez & Dantes, 2009; Porchea,
Allen, Robbins, & Phelps, 2010). Minority student populations are often studied, especially in 2-
year institutions where student diversity is prevalent, to identify how institutions can assist with
interventions designed to maximize success (Hirschy et al., 2011). Demographic characteristics
can be predictive factors in some educational measures. Therefore, this study used the
demographic variables of race/ethnicity and gender to determine their predictive value for the
criterion variables of academic achievement measured.
Most common evaluations of achievement measure only full-time students. However, at
the 2-year college level, a majority of students attend part-time and are often “employees who
study versus students who work” (Hirschy et al., 2011). Enrollment status can play a significant
role in persistence and credential attainment. Studies have shown that students who attend full-
time, especially in their first year, tend to be retained at a higher rate than those who attend part-
16
time (Horn, 2009). The enrollment status of students in this study was evaluated as a predictor
variable for academic achievement.
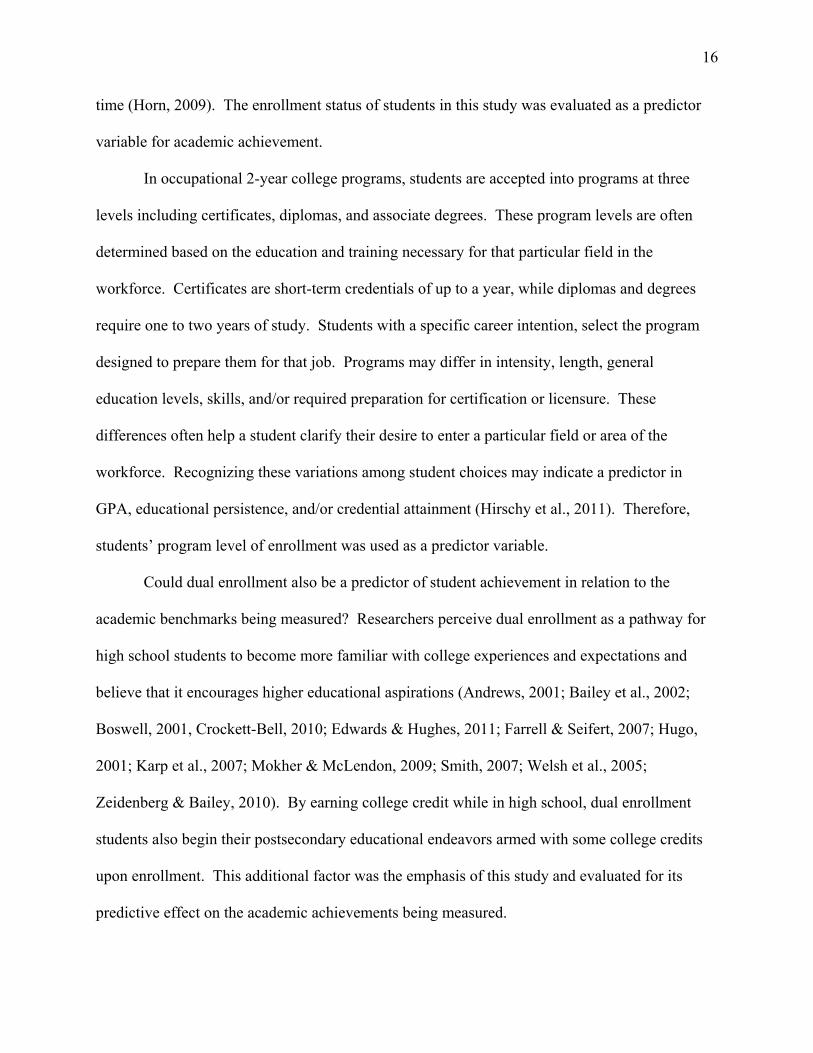
In occupational 2-year college programs, students are accepted into programs at three
levels including certificates, diplomas, and associate degrees. These program levels are often
determined based on the education and training necessary for that particular field in the
workforce. Certificates are short-term credentials of up to a year, while diplomas and degrees
require one to two years of study. Students with a specific career intention, select the program
designed to prepare them for that job. Programs may differ in intensity, length, general
education levels, skills, and/or required preparation for certification or licensure. These
differences often help a student clarify their desire to enter a particular field or area of the
workforce. Recognizing these variations among student choices may indicate a predictor in
GPA, educational persistence, and/or credential attainment (Hirschy et al., 2011). Therefore,
students’ program level of enrollment was used as a predictor variable.
Could dual enrollment also be a predictor of student achievement in relation to the
academic benchmarks being measured? Researchers perceive dual enrollment as a pathway for
high school students to become more familiar with college experiences and expectations and
believe that it encourages higher educational aspirations (Andrews, 2001; Bailey et al., 2002;
Boswell, 2001, Crockett-Bell, 2010; Edwards & Hughes, 2011; Farrell & Seifert, 2007; Hugo,
2001; Karp et al., 2007; Mokher & McLendon, 2009; Smith, 2007; Welsh et al., 2005;
Zeidenberg & Bailey, 2010). By earning college credit while in high school, dual enrollment
students also begin their postsecondary educational endeavors armed with some college credits
upon enrollment. This additional factor was the emphasis of this study and evaluated for its
predictive effect on the academic achievements being measured.

17
Importance of Study
Though the literature offers some encouraging information on dual enrollment, definitive
results of its relation to or prediction of postsecondary achievement have not been adequately
studied. Because existing research is sparse, available longitudinal data at state and national
levels is lacking, and past attempts to study this intervention have not always accounted for pre-
existing characteristics such as self-selection; the arguments in support of dual enrollment are not
completely convincing. Additional studies, such as this one, offer compelling evidence usable
for programs and policy. At the very least, this study increases awareness and knowledge of
dual enrollment practice. It might possibly spawn local, state, or even federal action to promote
dual enrollment as a transition opportunity for students. In the end, dual enrollment could also
impact the economy by encouraging higher educational aspirations for a more educated
workforce, through creating that seamless transition to college, offering a viable option for
students and parents; as well as, shortening time to a credential while saving money.

18
CHAPTER 2 LITERATURE REVIEW
Foundations
U.S. Economic Conditions in 2000s
The state of the U.S. economy throughout the mid- to late-2000s has been bleak, at best.
Paralleling problems in the business sector, the national unemployment rate peaked over 10.0%
in 2010 and has remained around 9.0% since then (U.S. Bureau of Labor Statistics [BLS], 2012).
Research has been conducted on the relationship between education and the labor market.
Metropolitan areas with large numbers of poorly educated workers have had consistently higher
unemployment rates (Rothwell & Berube, 2011). Even back in 2006, the benefits of college
attainment were clear. Those earning an associate’s degree or higher could expect to earn
$10,000 to $20,000 more per year than those without this credential (Vandal, 2009). However,
by 2010, only 22.6% of adults 18 years of age and over had an associate’s degree or higher level
of education in the United States (U.S. Census Bureau, 2010).
A recent report by the Manufacturing Institute and Deloitte (Rucket & Wilkins, 2011)
found that 67% of manufacturers report a moderate to severe shortage of qualified workers; most
of the shortage is in skilled production work. Manufacturers also reported that the skills
deficiencies they experienced when hiring from the labor force were having an impact on their
ability to expand and improve productivity. An apparent demand for workers exists, but the skill
levels of current workers do not appear to meet these demands. This situation is referred to as
structural unemployment by economists, meaning that there are too few workers with the skills
required for available occupations. This situation has been seen historically in recessions since
the early 1980s. An increase in demand for certain skill levels has outpaced supply (Rothwell &
Berube, 2011).

19
Need for Education
In September 2011, the federal government unveiled the American Jobs Act, designed to
create jobs by investing in public schools, community colleges, and preventing teacher layoffs.
One argument of the initiative is that education is no longer a potential path to opportunity; it has
become a requirement for success in the workplace. Recommendations by the Adult Education
and Workforce Development Organization (Council for Adult and Experiential Learning, 2009)
to the U.S. Department of Education (U.S. DOE) emphasized workforce development that
matches industry needs, as well as aligning all key agencies to build regional and state
partnerships to maximize resources and enhance economic development.
Educational problems first begin to manifest with high school graduation. The U.S.
Census Bureau (2010) reported that 31% of the population over age 18 does not possess a high
school diploma. In 2009, one in four high school students dropped out (Aud, Hussar, Kena,
Bianco, Frohlich, Kemp, & Tahan, 2011). Without a high school diploma, the path to education
needed for success in the workforce becomes even more challenging. The problem continues
when young people transition to postsecondary education. For example, less than three quarters
of high school graduates enter immediately into college after high school graduation. When
these first-year college students do transition, over a third report having to take one or more
academic remedial courses. That number increases to over 40% for those students who enter 2-
year postsecondary institutions (Aud et al., 2011). Not only is high school graduation an issue,
but challenges are compounded by academic readiness problems.
Bridge from Secondary to Postsecondary Education
The need for education exists, and better yet, quality educational change with seamless
transition to college credential attainment for successful workforce entrance (Venezia, Kirst, &

20
Antonio, 2003). A disconnect exists in the U.S. education systems. A high school diploma no
longer represents college readiness. Challenges begin with high school graduation, continue at
college entrance, are compounded by academic remediation, and culminate with college
persistence and completion (Boswell, 2001). Researchers note that lack of rigor and meaning in
the senior year of high school, need for remediation, and limited college completion have taken
the forefront of discussions (Mokher & McLendon, 2009). At local, state, and federal levels,
strategies must be implemented to facilitate smoother transitions from secondary to
postsecondary education.
According to the American Association of Community Colleges (AACC, 2011), the
majority of job openings in the U.S. by 2014 will require some postsecondary education and
more than half the country’s undergraduate college students now attend 2-year institutions. The
National Governor’s Association (NGA) found that among their members, governors and
policymakers, many recognize student achievement must be linked to the needs of the
marketplace so that higher education can help drive economic vitality. The NGA noted that
institutions of higher education, including community colleges, play a huge role in preparing and
educating our workforce (Sparks, Waits, & National Governor’s Association, 2011).
Two-Year Postsecondary Education
Two year colleges can play a significant role in economic development. Community and
technical colleges seem to be the higher education setting most nimble at providing immediate
training on demand and the most quickly responsive to their local business, industry, and public
needs (Zeidenberg & Bailey, 2010). For example, 80% of credentialed first responders in our
country were trained in community colleges (AACC, 2011). Having been in existence for over
110 years, 2-year colleges have always been known for being flexible and rapidly responsive to

21
learner and community needs. Accessibility is an accommodating factor for these educational
institutions, as well. In most areas of the country, communities have access to a 2-year college
campus, branch campus, or satellite center an hour or less drive from their homes (Phillipe &
Sullivan, 2005).
Description. A study of the role of community colleges in human resource development
and serving communities in multiple ways touted the accessibility of community and technical
colleges and their open admissions policies, low tuition costs, and convenient locations. The
study determined that community colleges have three main goals that include teaching
marketable vocational skills that lead to jobs, providing the first two years for transfer to
bachelor degree programs, and offering continuing education or community enrichment
opportunities (Zeidenberg & Bailey, 2010).
While community colleges serve a wide array of students, far from just the typical
college student, they are known for versatility in offerings and meeting the needs of local
communities. This can come in the form of college credit programs that lead to occupational
fields in which nursing and health have increased dramatically, to retraining workers, to meeting
the needs of underprepared high school graduates, offering enrichment courses, providing
certification and licensure classes, and tracking the needs of the local labor and industry in their
community. Because of their diversity in offerings, they serve a diverse population. Most offer
the associate degree as the highest credential earned and award over 700,000 of them annually in
addition to over 400,000 shorter term credentials. Typically, they serve more minority, low-
income, and first-generation students. Since their inception in 1901, a dramatic increase after
World War II, and a doubling in numbers in the 1960s, community colleges now total over 1,000
in the nation (Phillipe & Sullivan, 2005; Zeidenberg & Bailey, 2010).

22
These institutions are known for serving their constituents at all turns by improving high
school options through dual enrollment, providing developmental education for underprepared
high school graduates, offering classes at all times including online opportunities, providing
career pathways to citizens, and focusing on the local labor market needs. Their intimate
relationships with local business and industry garner them the ability to also play a distinct role
in economic development (Zeidenberg & Bailey, 2010).
Statistics. The National Center for Education Statistics (NCES) produces a report each
year on data collected in their Condition of Education report. Immediate college enrollment after
high school in 2009 was at 70%. Thirty-six percent of first-year students reported that they had
taken a remedial course. Clearly, earning a high school diploma does not guarantee readiness for
college. Of the first-time students enrolled in fall of 2009, 40% attended 2-year institutions and
60% of all part-time students entered 2-year colleges. For those fulltime students at 2-year
colleges, 42% of them reported taking a remedial course. To further assess the available data, a
measure of persistence is considered in the form of a retention rate. This is measured by
enrolling in the fall and returning the following year. At 2-year institutions, this rate in 2008
amounted to 58% for full-time students and 40% for part-time students (Aud et al., 2011).
More data has been reported on completion at 2-year colleges. Twenty-seven percent of
first-time fulltime students completed a certificate or associate’s degree in 150% of the normal
time. Higher levels of median earnings directly correspond to higher levels of education. With
graduation and persistence rates at this level, higher earnings are not attained at a rate useful for
economic stability (Aud et al., 2011).
One educational intervention developed years ago and growing rapidly is dual
enrollment, also referred to as dual-credit. Dual enrollment provides high school students an

23
opportunity to enroll in college-level courses and earn both high school and college credit
(Andrews, 2000, 2001, 2004; Bailey, Hughes, & Karp, 2002; Edwards & Hughes, 2011; Karp,
Calcagno, Hughes, Jeong, & Bailey, 2007; Mokher & McLendon, 2009; Smith, 2007; Welsh,
Brake, & Choi, 2005; Zeidenberg & Bailey, 2010).
Two-year institutions’ connection to the role of dual enrollment in today’s educational
systems seems automatic due to their willingness to serve all constituents in their community and
provide educational pathways for all types of students. This is evident given the available data
on dual enrollment. According to a U.S. DOE report by the NCES, 11,700 public high schools
(71% of all U.S. high schools) participated in dual enrollment in the 2002-2003 school year,
involving 51% of all postsecondary institutions (Kleiner & Lewis, 2005). A total of 813,000
high school students took at least one college credit course during that time period (Karp et al.,
2007). Ninety-eight percent of public 2-year colleges offered dual credit courses and 77% of all
dual enrollments took place at those institutions. While 4-year public and private institutions
together taught only 23% of the dual enrollment students (Kleiner & Lewis, 2005).
Proponents of dual enrollment programs assert numerous benefits for students, families,
educational institutions, and government funding. Dual enrollment could be a bridge for
successful secondary to postsecondary transition and success. It has not been implemented
quickly, consistently, or unilaterally across the U.S., but has been implemented by many states as
just such an initiative (Mokher & McLendon, 2009). Capitalizing on 2-year institutions’ service
to all constituents and their involvement with dual enrollment could provide a useful relationship
among systems.

24
Dual Enrollment History
In its inception, dual enrollment was a means to offer academically-advanced high school
students more challenging curriculum. Since the 1990s, its role has expanded, and the
opportunity afforded to a much wider range of students (Kim, Kirby, & Bragg, 2006). Mokher
and McLendon (2009) analyzed the adoption of dual enrollment policies across states, finding
that historically there has been a disconnect in policy and reform mechanisms between secondary
and postsecondary education systems. As there is now, in the past there were concerns over
college completion rates, a growing need for remediation upon entrance into postsecondary
education, and a perceived lack of academic rigor during the senior year of high school. States
education officials are always considering new ways to facilitate this transition from secondary
to postsecondary education and see the need for a more seamless path. Dual enrollment has
become a possible way to unite the two (Mokher & McLendon, 2009).
Proponents of dual enrollment see multiple benefits to students, families, postsecondary
institutions, and policy makers. Researchers have concluded that dual enrollment can help
acclimate students to the social and academic demands of college (Andrews, 2001; Bailey et al.,
2002; Boswell, 2001, Crockett-Bell, 2010; Edwards & Hughes, 2011; Farrell & Seifert, 2007;
Hugo, 2001; Karp et al., 2007; Mokher & McLendon, 2009; Smith, 2007; Welsh et al., 2005;
Zeidenberg & Bailey, 2010). Dual enrollment has also been said to offer better choices in the
pursuit of postsecondary education, shorten the time to complete a degree, save money for
families, improve the seamless efficiency of transition and, ultimately, provide the long-term
economic benefit of a more educated workforce (Bailey et al., 2002; Boswell, 2001; Crockett-
Bell, 2010; Farrell & Seifert, 2007; Karp et al., 2007; Mokher & McLendon, 2009; Zeidenberg &
Bailey, 2010). Other researchers have noted the prevalence of a lackadaisical senior year among

25
high school students and state that dual enrollment provides more academic challenge to
students, motivating them to work harder and make better use of their final year of secondary
education, (Andrews, 2001, 2004; Bailey et al., 2002; Crockett-Bell, 2010; Karp et al., 2007;
Smith, 2007; Welsh et al., 2005; Zeidenberg & Bailey, 2010) and that it may reduce the high
school dropout rate (Karp et al., 2007).
Dual enrollment criticisms include opinions that high school students may not be ready
for college-level work (Bailey et al., 2002; Farrell & Seifert, 2007; Mokher & McLendon, 2009),
that dual enrollment courses may not be of the same quality as regular college courses, or that
there is difficulty in balancing financial responsibility within the systems (Andrews, 2001;
Bailey et al., 2002; Boswell, 2001; Mokher & McLendon, 2009; Smith, 2007). Differences in
state policies on how dual enrollment is conducted and funded has also been cited as criticism for
support of dual enrollment due to the inconsistency of program design and requirements (Bailey
et al., 2002; Farrell & Seifert, 2007; Mokher & McLendon, 2009). Others see controversy with
the choice/type and location of courses taken, as well, as quality of certain instructors who teach
them (Krueger, 2006; Stacey, 2011).
Dual enrollment policies have developed gradually over the past three decades (Mokher
& McLendon, 2009), with actual programs first appearing as early as the 1950s (Andrews,
2001). California introduced a path-breaking effort in 1976 by adopting the first state-level dual
enrollment policy; this spawned an increase of subsequent states adopting the dual enrollment
concept. By the year 2000, all but two states had some form of postsecondary option programs
in place (Andrews, 2001) and only 10 were without state policies (Mokher & McLendon, 2009).
Even so, policy adoption has been uneven, unpredictable, and gradual. Now, 46 states have
policies in place regarding dual enrollment and the remaining four have some sort of secondary

26
to postsecondary institutional-level agreements (Education Commission of the States, 2008).
The entire nation, in some way, now acknowledges the need for offering high school students
dual enrollment options for earning college credit prior to graduation.
Mokher and McLendon (2009) used an event history analysis to examine influential
factors that predicted and shaped state involvement in dual enrollment policy-making using
longitudinal data from 1976 to 2005. Their findings showed that the spread of policy adoptions
was slow during the 30-year period. States with higher postsecondary enrollment in 2-year
institutions were more likely to adopt policies earlier. Those with consolidated governing boards
and those who previously adopted education reforms such as vouchers or merit aid programs
were also more likely to embrace dual enrollment policies. Lastly, dual enrollment adoption was
three times greater in states with Republican-controlled legislatures where there was a tendency
to favor policies promoting choice in education.
Dual Enrollment in Georgia
According to the Georgia Department of Education (DOE) (Barge, 2011), an umbrella of
postsecondary options called College Credit Now (CCN) exists in the state of Georgia that
includes multiple venues for earning college credit while in high school. According to the DOE,
the program’s intent is to facilitate the transition from high school to college with meaningful
educational challenges that will strengthen the number of high school graduates, and prepare
students for college and career opportunities. In effect, in was hoped to lead them to
postsecondary institutions for industry recognized certification or licensure, an associate and/or
higher college degree, and successful employment. The variation in programs is attributed to
funding, full- or part-time enrollment, and certain populations.

27
The umbrella of dual-credit offerings includes dual enrollment (college courses taken
during high school for concurrent high school and college credit), joint enrollment (student self-
pays and earns only college credit), Accel (a form of dual enrollment where only certain course
areas are eligible), Move On When Ready (MOWR) (full-time enrollment in a postsecondary
institution as a high school junior or senior), articulated credit (college credit for high school
coursework upon successfully passing exemption exam), residential programs (for talented and
gifted students), and early/gateway colleges (intervention for students not well-served by
traditional high school setting). The array of options stems from the various state funding
mechanisms in place to offer those opportunities. However, all are varying forms of dual
enrollment. Local school systems are required to share CCN opportunities with all 8th- through
11th-grade students and parents each year (Barge, 2011).
Eligibility differs slightly for each CCN program. Opportunities are available for eligible
11th- and 12th-grade high school students (only limited for 9th- and 10th-graders), to enroll full-
or part-time at eligible postsecondary institutions, provided they are legal Georgia residents
meeting U.S. citizenship requirements, and maintain satisfactory academic progress towards high
school graduation requirements. Some programs have high school grade point average
requirements (i.e., Accel, 3.0); but in most cases, students must meet the postsecondary
institution’s entrance requirements including application completion and acceptance to the
college, as well as, minimum placement test scores based on program level choice and courses
selected (Barge, 2011).
In Georgia, during the period from 2001 to 2004, 17,442 dual enrollment students were
served (Harnish & Lynch, 2005). Harnish and Lynch (2005) provided interesting trends
regarding the success of students in these courses and subsequent enrollment in college

28
immediately following graduation. According to the report, dual enrollment program options
grew and interest peaked in Georgia partially because of the state’s inclusion of dual enrollment
funding through the Helping Outstanding Pupils Educationally (HOPE) scholarship and grant
program. This made earning college credit more affordable and a viable option for students and
families.
However, for a period of time, funding to local secondary school systems was removed
when students participated in any dual enrollment coursework. Under the change in Georgia
governors, starting the 2011-2012 school year, funding was restored with the exception of
MOWR students because they attend the postsecondary institution fulltime. These policy
changes may again influence dual enrollment participation. According to the Technical College
System of Georgia (TCSG) enrollment statistics, dual enrollment participation peaked in 2003 at
7,999 students. That number began to decrease to 5,685 in 2009 and then to a low of 4,713 in
2011 (TCSG, 2003, 2009, 2011b); coincidently, when dual funding to both systems was
removed. As a result, enrollment may begin to grow again now that funding to both systems has
been restored through HOPE and state subsidizing. This prediction was reinforced by the
TCSG’s Commissioner, during a presentation at the system’s Leadership Summit, where he
established the goal of securing 15% of all Georgia 11th- and 12th-graders in dual enrollment by
2016 (Jackson, 2012).
Past Dual Enrollment Studies
The growth in dual enrollment participation nationally has been dramatic over the past 20
years; however, tracking data at the national level has been minimal. Some states publish their
dual enrollment participation, while many do not; and the lack of tracking students from high
school to postsecondary has further complicated research (Karp & Jeong, 2008). Much of the

29
literature on dual enrollment examines issues of importance, the structure of dual enrollment
programs, characteristics of students enrolled in dual enrollment programs, and secondary
achievement. Despite the increased national popularity of dual enrollment, few studies have
evaluated the postsecondary academic achievement of students who were previously enrolled in
dual enrollment programs (Bailey et al., 2002). While few studies do exist and offer promising
results as to the predictive nature of dual enrollment on postsecondary academic successes, none
are definitive and many do not control for issues such as dual enrollment motivation or
postsecondary entrance requirements. In addition, rigorous research design or statistical methods
were often not employed (Speroni, 2011). Several problems currently exist in attempting to
quantify the benefits of dual enrollment. While research does exist and significant resources
have been devoted to the expansion of such programs, there are no definitive results. Much of
the problem, in part, is due to the lack of appropriate data (Brand & Lerner, 2006; Karp & Jeong,
2008).
Certainly not nationally, but also not at most local or state levels, is data collected
longitudinally tracking students from high school to postsecondary endeavors and into the
workplace. Because of this, dual enrollment studies often focus on short-term outcomes in
which data can be obtained and measured (Karp & Jeong, 2008), or on qualitative data regarding
student attitudes and feelings (Brand & Lerner, 2006). Using available data presents yet another
concern. It has been difficult to extricate student self-selection bias from achievement successes
in a statistically significant fashion to provide empirical evidence that supports dual enrollment
initiatives (Cubberley, 2009). In many studies the information presented is anecdotal and, at
times, conducted on individual states or systems for the purpose of applauding the concept and
sustaining funding. Due to consideration for obvious results (i.e., college credit earned),

30
policymakers have advocated the benefits of dual enrollment when concrete evidence of
objective impact is sparse (Bailey et al., 2002).
Structure. Throughout the 2000s, many researchers have reflected on the structure and
makeup of dual enrollment programs. Some reviewed the various standards and plans across
many states, while others reported specific lessons learned in a particular state or district. Most
studies shared only their perception of the effectiveness of dual enrollment programs via
interviews and/or surveys without much statistical support (Andrews, 2001, 2004; Catron, 2001;
Farrell & Seifert, 2007; Hoffman, Vargas, & Santos, 2009; Jordan, 2001).
In the programs studied, most dual enrollment options were offered to only 11th- and
12th-graders. All dual enrollment program reviews reported student participation requiring
parent permission, academic eligibility requirements, required advisement, state policies in place,
financial arrangements for tuition, and the most common program relationships being with 2-
year colleges. Dual enrollment programs evaluated had common factors of importance including
the following: assurance of college integrity in the courses, meeting the needs of high school and
postsecondary curriculum requirements, transferability of course credit, qualified
faculty/instructors, and the need for strong relationships and leadership from both the secondary
and post-secondary systems. All reports accounted for course delivery requirements for
individual states. Some offered classes only on the high school campus, while others instructed
on the college campus, online, or a combination of formats (Andrews, 2001, 2004; Catron, 2001;
Farrell & Seifert, 2007, Hoffman et al., 2009; Jordan, 2001).
However, concerns over dual enrollment course rigor date back to the late 1990s. One
article in the Chronicle of Higher Education indicated professors and college admissions
personnel were confounded by the abundance and growth of dual enrollment and advanced

31
placement (AP) courses appearing as credit at their institutions. Such an increased interest
provided some the feeling that maybe the courses weren’t rigorous enough (Reisberg, 1998).
The University of Florida released a report concerting that dual enrollment students had to retake
courses upon entry to the university.
This report spawned a study by the State Board of Community Colleges in Florida
evaluating such assertions (Windham, 1997). The findings disputed the university’s claims. The
results indicated that the mean grade point average (GPA) of dual enrolled students subsequently
attending the university were higher, grades earned by dual enrollment students were higher than
those earned by regular students, and that dual enrollment students did better in subsequent
courses in sequence than regular students. Placement test pass rates were also shown to be
higher than that of other entering freshman. Proving opposition to the University’s statement,
findings also showed that less than 1% of dual enrollment students had to repeat courses. Lastly,
the concern over dual enrollment students earning too many credits was proven incorrect. The
study revealed that while some students had in fact taken 10 or more dual enrollment courses, the
average number was actually three or less (Windham, 1997).
Benefits. Dual enrollment effectively allows high school students to earn college and
high school credit simultaneously, shortens the time to obtain a degree, saves money on future
tuition costs, keeps students engaged in meaningful coursework during high school, helps
students gain familiarity with college for better transition, and raises student aspirations for
higher education (Andrews, 2001, 2004; Bailey et al., 2002; Boswell, 2001; Crockett-Bell, 2010;
Farrell & Seifert, 2007; Hoffman et al., 2009; Hugo, 2001; Marshall & Andrews, 2002). Some
saw dual enrollment as a direct path to obtaining a technical education degree (Bailey et al.,
2002; Hoffman et al., 2009). Others saw these programs as an opportunity for increasing

32
successful transition to college (Bailey et al., 2002; Marshall & Andrews, 2002). Several
researchers focused on dual enrollment as significant in aligning high school and postsecondary
education system expectations and requirements thereby easing the transition between the two
(Andrews, 2001, 2004; Boswell, 2001; Hoffman et al., 2009; Hugo, 2001; Marshall & Andrews,
2002). Dual enrollment may improve the image of attending college for some young people
(Marshall & Andrews, 2002), can be used as a recruitment tool for college enrollment (Crockett-
Bell, 2010), and allows students to take more responsibility for their education (Farrell & Seifert,
2007).
High school outcomes. A qualitative study by Jordan, Cavalluzzo, and Corallo (2006)
evaluated five middle college high school (MCHS) sites in Florida, Michigan, California, and
Tennessee. These MCHS sites focused on helping students at risk of high school failure, served
multiple secondary school districts, worked on a college campus, and aimed to graduate students
from high school with an associate degree as well as, a high school diploma. These schools
enrolled students of varying academic levels in grades 9-12. Through interviews with high
school and college personnel, board members, and faculty; perceptions of the impact of dual
enrollment were garnered. Results revealed positive perceptions of the dual enrollment
environment. Interviewees felt the program enhanced motivation, self-esteem, academic
success, and encouraged life changes for students. Other observations included the positive
effects of improving the quality of the high school experience, bridging the transition to college,
acclimating students to college work, and adding alternatives to the regular comprehensive high
school experience (Jordan et al., 2006).
Dual enrollment or advanced placement. Multiple options are available for high
school students to earn college credit prior to high school graduation. Some of these options

33
include dual enrollment, advanced placement (AP), international baccalaureate, articulated credit
(i.e., tech prep), and middle and early college high schools (i.e., career academies) (Boswell,
2001; Brand & Lerner, 2006; Cubberley, 2009; Fowler & Luna, 2009). While all these programs
offer some connection to postsecondary education and provide students challenge, exposure, and
involvement with higher learning; they also differ widely in location, instruction, length, and
college credit earned (Brand & Lerner, 2006).
In most cases, the two main competing programs in the standard high school are dual
enrollment and AP courses. Even though these two forms of accelerated learning have grown
across the nation, there is limited research on their overall effectiveness (Speroni, 2011). Parents
and students seem more familiar with AP courses due to the strong promotion by the publisher,
The College Board, and its relationship to the commonly recognized college entrance test, the
SAT. Regardless, both AP and dual enrollment programs afford students the opportunity to earn
college credit. Advanced placement courses consist of standardized curriculum, intended to be
college level, solely taught at the high school, and require a minimum score on an optional
standardized exam for college credit. Successful completion of the course itself garners only
high school credit and the minimum passing score is determined by the accepting college or
university. Conversely, dual enrollment courses are taught using an actual college course
syllabus, at the high school or on the college campus, and students receive both college and high
school credit upon successful completion of the course (Cubberley, 2009; Speroni, 2011). Few
research studies have attempted to compare outcomes of the two programs.
In 2010, a dissertation study was completed to determine if dual enrollment and/or AP
programs were potential predictors of academic achievement (Sherman Valentine, 2010). The
study analyzed performance indicators including first to second year persistence, first semester

34
college GPA, degree attainment, and time-to-degree completion. Using longitudinal data, first-
time traditional first-year students, who earned dual enrollment or AP credits prior to enrolling in
college, were studied. Students who participated in either or both of these programs had higher
retention (persistence from year one to year two) and 4-year graduation rates than students who
did not. Participation in dual enrollment and/or AP courses also significantly influenced
entrance test scores, GPA, and time-to-degree completion. Dual enrollment was found to show a
higher percentage of students graduating from college in three and a half years or less. Although
positive results were obtained, program participants and non-participants were compared. A
study of this nature does not account for academic aspirations, personal drive, or pre-existing
characteristics that may affect student achievement (Sherman Valentine, 2010).
In another study, Speroni (2011) also measured dual enrollment and AP outcomes. The
study found that both AP and dual enrollment courses increased a student’s likelihood of
enrolling in college after high school. Dual enrollment students enroll, overall, at a higher rate
than AP; but at a lower rate at 4-year institutions. No statistical significance was found at 4-year
institutions or with bachelor’s degree attainment, though, in the difference between dual
enrollment and AP rates. The effects of dual enrollment were only found for courses taken at the
community college campus, not those taken at the high school. Lastly, the study found that
students taking a combination of both dual enrollment and AP courses fare better than taking
only one or the other.
Lastly, Eimers and Mullen (2003), using 4-year university data only, also attempted to
quantify the relationships between AP and dual enrollment with postsecondary education
outcomes. Using regression analysis, the study examined dual enrollment and AP effects on
first-year GPA and second-year retention in college. Analysis, holding academic ability

35
constant, showed that those with AP credit have a higher GPA and that dual enrollment students
were the most likely to return the following fall.
In either situation, AP and dual enrollment students earn college credit early which
enables them to get a head start on credential attainment while attempting challenging
coursework during high school. Dual enrolled students certainly do no worse than students who
do not dual enroll (Eimers & Mullen, 2003), have garnered advance credit toward their program
of study shortening credits necessary to graduate (Speroni, 2011), and are likely the ones to
persist to completion (Sherman Valentine, 2010). For these reasons, Florida officials released a
report that determined enrolling students in dual enrollment courses yielded a better return on
investment for students. Of all dual enrollment courses taken at community colleges, 84% were
passed with a “C” or better. Conversely, the pass rate for all AP exams (which is required for
college credit) was only 46% meaning college credit for students was more likely through dual
enrollment than AP (Hughes, Alexander, & Scheuch, 2009).
Participation. Two particular studies found significant relationships between
educational aspirations and dual enrollment participation (Smith, 2007) and the incentives and
challenges offered by participation (O’Connor & Justice, 2008). Other top reasons cited for
participation include opportunities for an early start on college and getting some college credit
out of the way early (O’Connor & Justice, 2008). The location of dual enrollment programs also
makes a difference. Smith (2007) found that students enrolled on a college campus had higher
educational aspirations. O’Connor and Justice (2008) determined that the top reasons students
were hindered from participating in dual enrollment included finances, scheduling/time
commitments, preference for AP classes, lack of information or misinformation about dual

36
enrollment, feeling unprepared for college-level work, and choosing to enjoy an easier senior
year.
Transition to college. Using a variety of methods to collect qualitative information,
Crockett-Bell (2010) conducted interviews, gathered institutional data, and conducted a student
satisfaction survey to evaluate the transition of dual enrollment students to college in Southwest
Texas. Conclusions revolved around three areas including student transition to college,
transferability of dual credits earned, and satisfaction with the administration and impact of dual
enrollment programs. Results indicated that the program benefitted the high schools, students,
teachers, and colleges. College personnel saw the program as an opportunity for recruitment and
a creation of seamless transitions even though only 38% of students studied actually did
matriculate and remain enrolled in area colleges. High school teachers appreciated the
opportunity to teach college-level courses. Students indicated satisfaction with the quality of
instruction, the overall dual enrollment experience, and preparation for actual college-level work.
Ninety-eight percent of the college credits earned transferred to the cooperating college and 63%
of the students viewed the time and money saved as a major benefit. Even though a few
weaknesses were noted in communication and transfer of information, 85% of students still
highly recommended the program to other high school students and 43% felt better prepared for
the transition to college.
Postsecondary achievement. Few studies provide examples of investigations into the
relationship between dual enrollment and postsecondary academic achievement. Studies found
used dual enrollment participant information from programs in Pennsylvania, Florida, and New
York and evaluated high school graduation rates, first-semester college grade point average

37
(GPA), persistence to second year of college, credits earned after one year in college, degree
attainment, and time to degree completion (Karp et al., 2007; Speroni, 2011).
Karp et al. (2007) examined the achievement of dually enrolled students in New York
and Florida. Entire available existing data sets in a non-experimental study were used to assess
the short-term effects of dual enrollment participation on high school graduation and college
enrollment rates, enrollment intensity, first semester GPA, and persistence to second semester;
and long-term effects of persistence to second year, GPA, and credits earned. They used least
squares and logistic regression to compare career and technical education (CTE) students and
dual enrollment students on these selected outcomes. Controls were not in place to account for
dual enrollment participant characteristics, such as motivation; therefore, all results may not be
solely attributable to dual enrollment but possibly pre-existing factors.
Study findings from Florida indicated that dual enrollment was positively related to a
student’s likelihood of earning a high school diploma, enrollment in college, enrollment full-
time, and the likelihood of enrolling in a 4-year institution. Dual enrollment students were
significantly more likely to persist in college a second semester and have a higher GPA one year
after high school graduation than students who had not participated in dual enrollment. Of these
students enrolled in postsecondary institutions, their dual enrollment participation was positively
associated with the likelihood that they would remain enrolled in college two years after high
school. Dual enrollment students also earned more credits after three years and their cumulative
GPAs were significantly higher than non-dual enrollment peers (Karp et al., 2007).
Findings from New York’s College Now (overarching term used for the state’s dual
enrollment program) indicated that CTE participants were more likely than their peers to pursue
a bachelor degree, and there was also a positive relationship between dual enrollment and first

38
semester college GPA. College Now participation was also positively related to all three long-
term outcome variables of persistence, GPA after four semesters, and progress toward a degree
when intensity of enrollment was taken into effect (Karp et al., 2007).
Although Karp et al.’s (2007) study findings were encouraging for dual enrollment, not
enough restrictions were made for pre-existing characteristics of student motivation and
aspirations for college upon their decision to participate in dual enrollment in the first place. The
non-random nature of selecting to participate in dual enrollment could be an indicator for the
successes found. High school academic achievement as a precursor for participation in dual
enrollment was also not considered. However, the report indicates a positive association for
groups of students that have been known to struggle in postsecondary education, males and low-
income students. Therefore, while the results are positive, they are not a definitive statement
attesting to the absolute effects of dual enrollment.
A final study highlighted was a working paper for the National Center for Postsecondary
Research. In an attempt to provide rigorous analysis on the impact of dual enrollment, Speroni
(2011) selected Florida districts and conducted a study on the causal effect of dual enrollment on
student outcomes using regression discontinuity (RD) analysis. The researcher uses RD design
because it’s assumes that, except for the treatment of interest, other determinants of the outcome
will vary smoothly around whatever cutoff is used. This design compared the outcomes of
students who barely passed with those who barely missed the cutoff required GPA for algebra
enrollment. By conducting this analysis, the researcher eliminated the issue of self-selection by
students to enroll in dual enrollment because of the incremental bandwidth of students chosen
just above and below the cutoff scores. No evidence was found that just taking any dual
enrollment course improved high school graduation rates, college enrollment or college degree

39
attainment. However, there were large and significant effects on college enrollment and
graduation rates for those taking challenging dual enrollment courses such as algebra (Speroni,
2011).
Dual enrollment or high school coursework. High schools have played a key role in
shaping our nation. According to a research scientist at John Hopkins University (Balfanz,
2009), high schools began as purely academic, morphed to include workforce preparation, and
have since returned to academics as a transition from the industrial age to the information
technology age took place. Now, the trend in high school reform is moving in another direction
by being more focused, enduring many reforms, and implementing more rigorous coursework
and evaluation to be more effective. The change to college-level preparatory courses and the
availability of earning college credit while in high school signifies the adjustment to prepare
students for college success; but once again, workforce preparation became a secondary function
(Balfanz, 2009).
To reach the goal of advancement for all by adequately preparing all students for college
and the workplace, students must be provided a blend of academic and career and technical
education so that students may be college ready and career focused through enhanced
coursework (Balfanz, 2009). The average high school experience may be effective for some, but
communities, political leaders, parents, and students want other options. Providing
postsecondary options such as dual enrollment can afford alternative opportunities for students to
be successful in preparing for college and the workforce (Brand & Lerner, 2006). In order to
approach the multifaceted undertaking of preparing students for their future, multiple approaches
that offer flexibility and collaboration are necessary. Students need relevance in the form of
application outside of school, as well as, how to proceed in their next steps. Dual enrollment

40
options offer that college-knowledge necessary to prepare for future postsecondary enrollment
(Hooker & Brand, 2010) and the occupational course opportunities for workforce familiarity
with high-paying careers in industry (Rosenbaum, 2001).
Furthermore, business and industry professionals have shared their experiences with high
school graduates’ lack of preparation for the workforce. Indicated soft skills absent include
motivation, dependability, attention to quality (Rosenbaum, 2001); and applied skills such as
teamwork, critical thinking, professionalism, work ethics, and communication (Arkansas State
Department of Education, 2006; “Future Workforce,” 2006). Many employers feel that these are
skills that should be present in high school, need reinforcement at home, are influenced by
exposure to the workforce, and are essential for success (Arkansas State Department of
Education, 2006).
Students may find enhanced value in participating in dual enrollment in conjunction with
technical and community colleges offering occupational programs. Across the U.S., the value of
workforce preparation is at the forefront and mission of all technical colleges and community
colleges offering occupational programs. These institutions rely heavily on meeting business
and industry needs, as well as, incorporating the skills employers demand for the workplace
(Hirschy, Bremer, & Castellano, 2011). By adding real-world application and relevance to the
soft skills, in an environment laden with workforce preparation opportunities, high school
students could benefit from the experiences of being dually enrolled at these institutions. These
are skills necessary for students, across all fields, and can be meaningfully reinforced if
incorporated into the context of all material taught (Rosenbaum, 2001).

41
Criterion Variables of Postsecondary Educational Achievement
Not all benchmarks for student achievement are the same for all educational institutions
due to different types of students and varying organizational missions and purposes (Porchea,
Allen, Robbins, & Phelps, 2010). Researchers in psychology, sociology, education, and
economics have attempted to establish theoretical frameworks that identify contributors to
postsecondary student success, but each framework reflects a particular perspective or interest,
often diminishing other important areas of influence (Hirschy et al., 2011). Prior studies have
attempted to incorporate academic, psychosocial, socio-demographic, and situational factors to
outline postsecondary predictors of success (Porchea et al., 2010).
Perna and Thomas (2008) studied the theories of student success. Table 1 depicts the
various disciplines and their perspectives on theories or frameworks used to explain and
understand academic success. They recognized that there are similarities and differences among
education, psychology, sociology, and economic disciplines on what influences student success
as demonstrated in a review of research designs in top journals. While their reviewed research
concentrated on students, differences in the overall perspectives were specific to the discipline’s
focus. Based on their review, and considering multiple perspectives, they concluded that student
success was a longitudinal process marked by transitions. These transitions begin with college
readiness, are followed by college enrollment and achievement, and conclude with graduation or
labor market experiences. Prominent theories in education were found to include and combine
concepts from psychology, economics, sociology, and public policy.

42
Table 1
Disciplines and Theoretical Perspectives on Student Success
Discipline Prominent Theories/Concepts
Psychology Achievement/motivation, stereotype threat, parenting practices and relationships cognitive theories, psychopathology/stress/anxiety, personality traits, perceived social/cultural context
Sociology Cultural reproduction, status attainment, human capital, social network
Economics Human capital theory, consumer theory, broad economics
Education (a combination of the above and inclusion of more)
Economic Determinants of income, theories of public sector, expected utility, human capital
Sociological Habitus and cultural capital, Bourdieuian field analysis, network
Psychological Cognition and metacognition, predictive validity, self-efficacy, social cognitive theory of self-regulation
Public policy Affirmative action
Multiple theories Human/social/cultural capital, human capital/consumer theory
Educational conceptual models
Three-phase model of college choice, I-E-O, Involvement “theory,” Tinto’s model of student departure, Tipping point theory, Weidmann’s socialization model, Bean social integration model, no defined theory articulated
Note: Excerpts taken from summary of prevalence in literature by Perna and Thomas, 2008.
When focusing on the success of students in 2-year postsecondary education, a variety of
stakeholders exist including businesses, industries, students, families, institutions, and
government agencies (Hirschy et al., 2011). Because the reasons why students enroll in 2-year
institutions differ from 4-year colleges and universities, researchers have struggled with
identifying one theory or model (Porchea et al., 2010). Ideas on student characteristics,
institutional best practices, and identifying factors have been cultivated, but no one
comprehensive theory exists to predict or explain postsecondary student success.
Reviewing literature on 2-year postsecondary education and dual enrollment studies
yields enormous lists of variables used to guide research evaluating academic success,
identifying typologies of students, and/or quantifying predictors of success. Obviously, there are
a multitude of factors that could contribute to academic success and an assortment of ways to
define and measure it based on the study outcomes desired. Table 2 depicts influencing variables

43
encountered and researchers studied who used them. Common demographic variables include
gender, age, race, socioeconomic status, and psychosocial factors. Variables prior to college
enrollment comprise GPA, college credit earned in high school, placement test scores, necessity
of remediation, and CTAE participation. Lastly, postsecondary enrollment variables were
considered that included enrollment status and level, employment, family, income, commute,
campus involvement and support, and career integration.
Table 2.
Characteristics of 2-year Postsecondary Students – Potential Influencing Variables
Variables Studies reviewed with variable included
Demographic variables
Gender Fike & Fike, 2008; Gantt, 2010; Hirschy, Bremer, & Castellano, 2011; Karp, Calcagno, Hughes, Jeong, & Bailey, 2007; Porchea, Allen, Robbins, & Phelps, 2010; Sherman Valentine, 2010; Speroni, 2011
Age Fike & Fike, 2008; Gantt, 2010; Hirschy et al., 2011; Porchea et al., 2010
Race
(White, minority varying specificity)
Fike & Fike, 2008; Hirschy et al., 2011; Karp et al., 2007; Porchea et al., 2010; Sherman Valentine, 2010; Speroni, 2011
Socioeconomic status
(income, location, need-based aid)
Fike & Fike, 2008; Hirschy et al., 2011; Karp et al., 2007; Porchea et al., 2010; Speroni, 2011
Parents highest education level Fike & Fike, 2008; Gantt, 2010; Hirschy et al., 2011; Porchea et al., 2010
Psychosocial factors
(discipline, confidence, commitment, motivation, steadiness, social activity, social connection, etc.)
Hirschy et al., 2011; Porchea et al., 2010
Pre-college variables
HS GPA Eimers & Mullen, 2003; Hirschy et al., 2011; Karp et al., 2007; Porchea et al., 2010; Speroni, 2011
HS college credit
(dual enrollment/AP/articulated credit)
Eimers & Mullen, 2003; Gantt, 2010; Hirschy et al., 2011; Karp et al., 2007; Sherman Valentine, 2010; Speroni, 2011; Windham, 1997
Placement test
(SAT, ACT, COMPASS, etc.)
Eimers & Mullen, 2003; Hirschy et al., 2011; Porchea et al., 2010
Remediation Fike & Fike, 2008
CTAE Participation
(career pathway of study)
Hirschy et al., 2011; Karp et al., 2007
Transfer credit
(post-high school credits earned)
Gantt, 2010

44
Table 2. Characteristics of 2-year Postsecondary Students – Potential Influencing Variables (continued)
Variables Studies reviewed with variable included
Postsecondary enrollment variables
Enrollment status
(full time, part time)
Fike & Fike, 2008; Gantt, 2010; Hirschy et al., 2011; Porchea et al., 2010
Program level/goal
(certificate, diploma, degree, transfer)
Hirschy et al., 2011; Porchea et al., 2010
Employed while in school
(hours worked per week)
Gantt, 2010; Hirschy et al., 2011; Porchea et al., 2010
Family status – Caretaker
(# dependents)
Gantt, 2010; Hirschy et al., 2011
Annual income
(earnings)
Gantt, 2010; Hirschy et al., 2011
Campus involvement
(sports, clubs, etc.)
Gantt, 2010
Career integration
(exposure to intended work environment)
Hirschy et al., 2011
College commute
(distance/time/traffic to campus)
Gantt, 2010; Porchea et al., 2010
Campus support
(academic planning & advisement)
Fike & Fike, 2008; Gantt, 2010; Hirschy et al., 2011
Note: high school (HS), grade point average (GPA); general education development (GED); career, technical, agricultural education (CTAE)
Students at community colleges, and even more so those in technical programs, are
different from 4-year university students. Hirschy et al. (2011) examined multiple theories on
the persistence of students in postsecondary education. They posited that practitioners simply
want usable ways to help students succeed. Occupational education, at the 2-year college level,
prepares students with the academic and technical skills and knowledge for specific occupations.
These programs have multiple exit points including associate degrees, diplomas, and short-term
certificates; usually with the main goal of entering the workforce ready for a specific career or
trade (Hirschy et al., 2011). To properly assess any 2-year college student’s progress,
researchers have attempted to identify more suitable outcomes for measuring success.

45
Longitudinal achievement benchmarks may include college enrollment, success in remediation
sequence, GPA, persistence, attrition, transfer, career integration, completion, and job attainment
(Hirschy et al., 2011; Horn, 2009; Perna & Thomas, 2008; Phillipe & Sullivan, 2005).
Hirschy et al. (2011) found that none of the existing models fit 2-year postsecondary
career and technical programs, but elements were incorporated into the development of their
model. Their final model offers insight behind what helps or hinders student progress and
success in occupational programs at community colleges so that effective interventions can be
implemented. The importance of tracking these students’ particular educational goals,
integrating a career choice, and expanding existing success measures can assist institutions in
supporting occupational student achievement more accurately (Hirshy et al., 2011). Table 3
depicts criterion variables encountered and researchers who used them in practice. Measures
evaluated by researchers prior to postsecondary enrollment included GPA, high school
graduation, entrance test scores, and enrollment in college. Postsecondary achievement
measures included remediation completion, GPA, persistence, earned credential, completion
time, and placement in the workforce.

46
Table 3.
Characteristics of 2-year Postsecondary Academic Achievement – Potential Criterion Variables
Variable (potential measures) Studies reviewed with variable included
High school GPA* (0.0-4.0)
Karp, Calcagno, Hughes, Jeong, & Bailey, 2007
HS graduate* (earned high school diploma)
Karp et al., 2007; Speroni, 2011
Entrance test* (SAT, ACT, Compass, etc.)
Sherman Valentine, 2010
PS enrollment* (2-year or 4-year college/university)
Karp et al., 2007; Porchea, Allen, Robbins, & Phelps, 2010; Speroni, 2011; Windham, 1997
Developmental education (completed coursework, entered program)
Hirschy, Bremer, & Castellano, 2011; Speroni, 2011
College GPA (first term, first year, overall)
Eimers & Mullen, 2003; Karp et al., 2007; Sherman Valentine, 2010; Speroni, 2011; Windham, 1997
Persistence (retained term to term, year to year)
Eimers & Mullen, 2003; Fike & Fike, 2008; Hirschy et al., 2011; Karp et al., 2007; Sherman Valentine, 2010; Speroni, 2011
Credential attainment (degree, diploma, certificate, transfer, industry credential)
Gantt, 2010; Hirschy et al., 2011; Porchea et al., 2010; Sherman Valentine, 2010; Speroni, 2011
Time to completion (# terms, # years, etc.)
Gantt, 2010; Sherman Valentine, 2010
Employment (placement in workforce)
Hirschy et al., 2011
Note: *Used to assess dual enrollment effects on high school achievement; PS – postsecondary
In recent years, many organizations (both private and government) have launched
initiatives to attempt to properly assess 2-year and 4-year colleges and universities with the intent
of a more educated population. Shown in Table 4 is a sampling of prominent initiatives, as well
as their identified measures of accountability for increased student success. Evaluating student
success or finding specific indicators of educational achievement seem to focus on transition
points that occur throughout students' educational path (Horn, 2009). Specifically, these

47
indicators or key transition points in 2-year colleges can be used to track a student from high
school graduation (and determine college readiness), to college enrollment and achievement, and
end with post-college attainment (work outcomes or transfer to a 4-year college or university).
While the list of transition points simplifies the work of students and postsecondary education
institutions, it does give attention to understanding the extent of measuring student academic
achievement (Perna & Thomas, 2008) and evaluating benchmarks in consideration of varying
goals that may or may not include typical graduation with a typical degree.

48
Table 4.
Emerging Programs for Identifying and Measuring Student Progress and Achievement
Program Sponsor(s) Mission/Purpose Metrics/Measures of achievement
Complete College America (2011)
Carnegie Corporation; Gates, Ford, Kellogg, and Lumina foundations
Measure progress and success; by 2020 six out of 10 adults will have a college degree or a credential of value
-Context metrics: enrollment, completion ratio
-Progress metrics: remediation entry and success, success in first-year college courses, credit accumulation, retention, course completion
-Outcome metrics: time and credits to degree, degree production, graduation rates, transfer rates
-Disaggregated data by demographics
Voluntary Framework of Accountability (2012)
American Association of Community Colleges
National accountability system created by community colleges, for community colleges, to adequately measure the unique mission of community colleges
-Adult ed/GED measures, remedial education progress and success, credit hours earned/thresholds, retention, completion/transfer, CTE awards, licensure exam pass rates/state industry recognized credentials, employment
Community College Taxonomy (Horn, 2009)
National Center for Educational Statistics
To develop “portraits” of populations who attend community colleges to determine who’s likely to persist and complete
-Student classifications: strongly directed, moderately directed, not directed
-Attributes: intent to complete or transfer, attendance intensity, enrollment in a formal program of study
-Outcomes: 3-year retention, continuity of enrollment, first-year attrition
-IV’s: demographic an socioeconomic characteristics, academic preparation, enrollment and employment intensity
Achieving the Dream (Completion by Design) (2012)
Lumina Foundation, seven other founding investors
“Success starts with a credential”
Supporting student success: preventing loss, creating momentum
-Connection: college and career readiness, foster college-going norm, increase understanding of college requirements, dual enroll/early college/AP, college placement exam in high schools, enroll directly after high school
-Entry: diagnostic assessment and placement tools, mandatory advisement/attendance/life skills courses/declared courses of study, accelerated remediation, financial support, course redesign (further, faster, cheaper)
-Progress: innovative programs, leveraging technology, intentional/accelerated/competency-based programs of study in high –demand fields (STEM, healthcare), emergency aid
-Completion: mandatory intrusive advisement, transfer with credentials, remove graduation barriers, learn and earn programs combining credential attainment and work experience

49
Table 4 Emerging Programs for Identifying and Measuring Student Progress and Achievement (continued)
Program Sponsor(s) Mission/Purpose Metrics/Measures of achievement
Complete to Compete (Reyna, 2010)
National Governor’s Association
To increase degree completion for the nation’s competitiveness and long term economic growth with comprehensive consistent performance metrics to shape funding strategies and pinpoint areas for improvement
-Outcome metrics: degrees/certificates awarded, graduation rates, transfer rates, time and credits to degree
-Progress metrics: enrollment and success in remedial education, success in first-year college courses, credit accumulation, retention, course completion
Completion Matters
Learn and Earn (2010)
Bill & Melinda Gates Foundation
Improve institution performance, support more powerful and better informed student consumers, build commitment (local, state, national), build knowledge
-Reduce remediation time, enroll with greater intensity, increase persistence, increase enrollment in programs with labor market value, reduce time to credential, reduce cost per degree
-2025 goal: double the rate of low-income young adults who by age 26 earn a postsecondary credential with labor market value
College Completion Agenda
The Completion Arch
College Board Advocacy & Policy Center (2011)
-55% of 25-34-year olds holding at least an associate degree by 2025
-Completion Arch designed to present more than 150 indicators of student progress and success combining multiple sources including those above.
-Retention, graduation rate, degrees awarded
-Disaggregated data by demographics
-150+ indicators of student progress and success combining all above plans and others: broad areas include: enrollment, developmental education, progress (college milestones), progress (momentum), transfer and completion, employment outcomes
Sources: www.completecollege.org; www.completionarch.collegeboard.org; www.aacc.nche.edu/VFA; www.nces.ed.gov, Horn, 2009; www.achievingthedream.org; www.nga.org, Reyna, 2010; www.completionmatters.org; www.collegeboard.org

50
Predictor Variables
In educational research, demographic and enrollment pattern characteristics are often
evaluated in conjunction with performance and student success. Studies often disaggregate data
based on socioeconomic status, race/ethnicity, gender, and age. In 2-year institutions where all
types of diversity are prevalent, minority student populations are often studied to identify where
interventions and assistance can be provided (Hirschy et al., 2011). Also prevalent in 2-year
institutions is age diversity. With the mission of these institutions encompassing service to the
entire community, it is common that the age distribution of the student population is wide,
ranging from those just exiting high school to those returning from industry to upgrade job skills
(Phillipe & Sullivan, 2005). In some studies women students outperformed men and persisted at
greater rates than men. Older students have been found to be more successful than younger
students, but less likely to graduate (D’Amico, Morgan, & Robertson, 2011; Gutierrez & Dantes,
2009; Porchea et al., 2010). Demographic characteristics can be factors in some educational
measures.
Enrollment patterns can also play a role in student persistence and graduation
evaluations. Common national data sets, such as The Integrated Postsecondary Education Data
System through the National Center for Education Statistics, tend to only evaluate first-time,
full-time student progress. Studies have shown that students who attend full-time, especially in
their first year, tend to be retained at a higher rate than those who attend part-time (Horn, 2009).
However, in occupational or career programs, students are often part-time because they work
(Hirschy et al., 2011). Enrollment patterns can be a factor and should be considered in studies on
educational achievement.

51
In 2-year colleges, especially occupationally-focused institutions, students are often
accepted into programs at different levels including certificates, diplomas, or associate degrees.
The programs can range in length from less than a year to two years based on full-time
attendance. Skills necessary for employment determine the appropriate coursework and in turn,
required course work determines the time to completion. Programs may differ in intensity or
length, general education knowledge levels, specified occupational skills, or required preparation
for certification or licensure. Varying skills and program intensity determine a student’s desire
to enter a particular field for preparation for that area of the workforce. Recognizing these
variations among student expectations and experiences may indicate a predictor in success
(Hirschy et al., 2011).
Lastly, dual enrollment could also be a predictor in postsecondary academic success.
Though prior studies noted encourage dual enrollment for a multitude of reasons, more research
is necessary to determine its relationship to postsecondary achievement. Due in large part
because longitudinal data is not collected across systems, research is sparse and limited. Calls
for more evaluation and research of dual enrollment programs, participation, quality, funding,
high school outcomes, and postsecondary outcomes exist to determine the quantitative effects of
such endeavors and the potential policy impacts (Karp & Jeong, 2008).
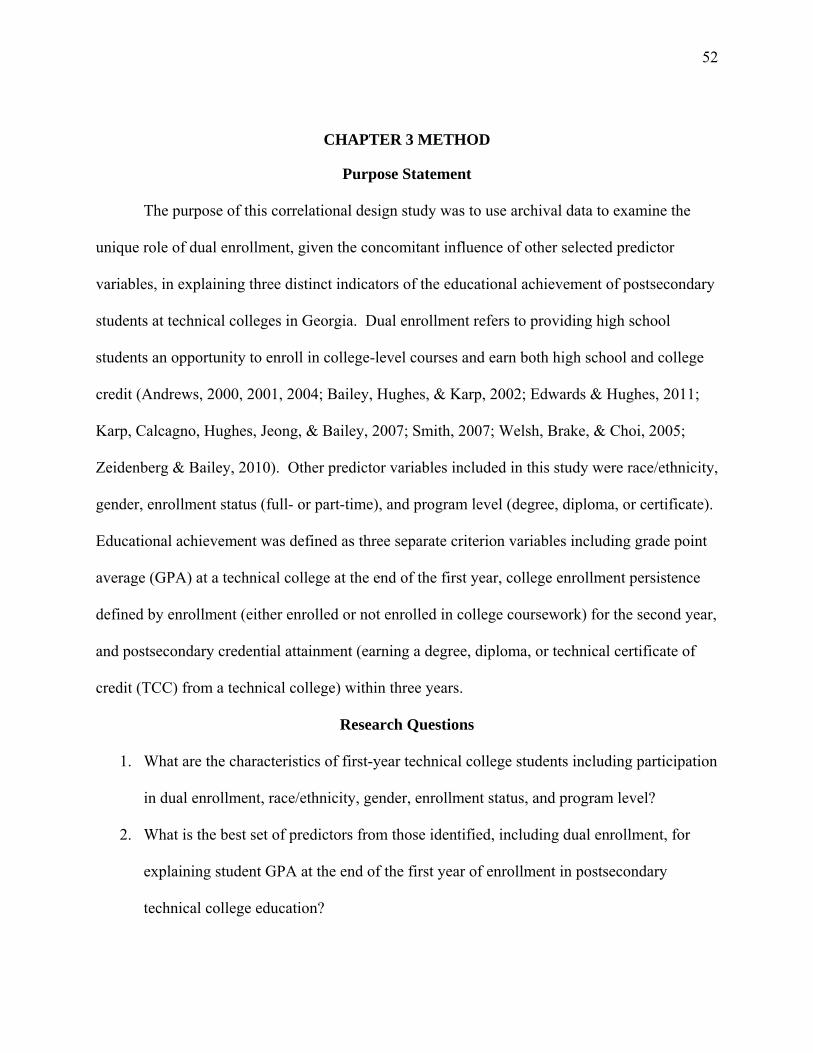
52
CHAPTER 3 METHOD
Purpose Statement
The purpose of this correlational design study was to use archival data to examine the
unique role of dual enrollment, given the concomitant influence of other selected predictor
variables, in explaining three distinct indicators of the educational achievement of postsecondary
students at technical colleges in Georgia. Dual enrollment refers to providing high school
students an opportunity to enroll in college-level courses and earn both high school and college
credit (Andrews, 2000, 2001, 2004; Bailey, Hughes, & Karp, 2002; Edwards & Hughes, 2011;
Karp, Calcagno, Hughes, Jeong, & Bailey, 2007; Smith, 2007; Welsh, Brake, & Choi, 2005;
Zeidenberg & Bailey, 2010). Other predictor variables included in this study were race/ethnicity,
gender, enrollment status (full- or part-time), and program level (degree, diploma, or certificate).
Educational achievement was defined as three separate criterion variables including grade point
average (GPA) at a technical college at the end of the first year, college enrollment persistence
defined by enrollment (either enrolled or not enrolled in college coursework) for the second year,
and postsecondary credential attainment (earning a degree, diploma, or technical certificate of
credit (TCC) from a technical college) within three years.
Research Questions
1. What are the characteristics of first-year technical college students including participation
in dual enrollment, race/ethnicity, gender, enrollment status, and program level?
2. What is the best set of predictors from those identified, including dual enrollment, for
explaining student GPA at the end of the first year of enrollment in postsecondary
technical college education?
53
3. What is the best set of predictors from those identified, including dual enrollment, for
retaining students in the technical college for a second year?
4. What is the best set of predictors from those identified, including dual enrollment, for
postsecondary credential attainment within three years of initial enrollment?
Design
The study used a quasi-experimental correlational design to analyze archival data. A
quasi-experimental design is one that does not control variables because participants are not
randomly assigned to comparison groups (Johnson & Christensen, 2012). Archival data has
been previously collected by another person or agency (Kluwin & Morris, 2006). By ensuring
that the research groups of interest (students who had participated in dual enrollment and a
comparable group of students who had not participated) met similar characteristics, such as time
of entry, age, and enrollment in the same system, some control over comparability was exercised.
A correlational research design was selected due to the use of archival data and because no
treatments or conditions were manipulated (Lewis, 2001).
The analysis examined data from the Technical College System of Georgia (TCSG)
Banner Student (2011a) database system. The TCSG oversees the state’s 25 technical colleges
and also supports adult literacy and economic and workforce development programs throughout
Georgia. The TCSG is separate from the University System of Georgia and consists of solely 2-
year technical colleges that, at the time, awarded Associate of Applied Science (AAS) degrees,
diplomas, and Technical Certificates of Credit (TCC) (TCSG, 2011c). For student record
administration, the TCSG colleges use the SunGard Higher Education’s (2011) Banner Student
data system. This system tracks a student from inquiry to admission through enrollment to
graduation. TCSG colleges’ collect all student data in the Banner Student system via student

54
self-identification from admissions applications, to prior records and program acceptance, to
grade data, course completion, and awards of credentials. All data is collected in this system to
form complete records of all personal and educational information for each student (TCSG,
2011a).
Working with archival data can present both advantages and disadvantages. Advantages
of using archival data include cost-effectiveness, time-effectiveness, and accessibility to larger
sets of data (Kluwin & Morris, 2006). In addition, following students longitudinally can be an
arduous task. However, accessibility to electronic student data systems makes the task far more
manageable. The ability to recast data to answer different research questions is almost limitless
(Elder, Pavalko, & Clipp, 1993).
Disadvantages of using archival data include potential difficulties in conforming existing
data with emerging research questions in a new study, initial data collection errors or bias, what
pieces of data are collected and the age of data or current relevance (Kluwin & Morris, 2006).
One of the biggest issues of possible concern is attempting to use data that was not collected to
answer new research questions outside its original or intended scope of collection (Elder et al.,
1993). While the data collected for TCSG students was not designed to answer my particular
research questions, educational enrollment records are collected to define permanent records of
students’ educational paths. These records can be and were assessed to evaluate the relationships
of multiple factors to student achievement.
The use of archival data was chosen because it allows analysis of longitudinal factors that
may explain postsecondary technical student achievement. Using the existing TCSG student
information system enabled analysis of student demographic data, educational milestones, and
academic achievements as students progressed through Georgia’s 2-year postsecondary system.

55
The TCSG has one unified system where all technical colleges store educational data for
students. A correlational design was the best way to study this population for the purpose of
evaluating cohorts of students and their achievement. This permanent data has existed in the
current Banner Student database since 2003 (TCSG, 2011d). Data from fall term of 2009
through summer term of 2012 on students, 18-20 years of age, entering the system with no
college credits from another college system was targeted for this analysis. The use of TCSG data
allowed for a larger population of students to be studied and encompassed all of Georgia
allowing for statewide representation.
Participants
Participants represented a multiple staged selection sample of students, ages 18-20, who
had entered a postsecondary technical college in Georgia after high school graduation, without
credits from another educational institution outside of the TCSG. This selection of participants
focused the scope of data and allowed for evaluation of several predictor variables of academic
achievement including the effect of dual enrollment. The population of students in the TCSG
under age 21, in the fall term of 2009, totaled nearly 29,000 (TCSG, 2010a). This age range and
selection criteria allowed for the best evaluation of educational milestones in postsecondary
technical college education upon exit from secondary school with a high school diploma or
general education development (GED) certificate. That population was reduced upon
elimination of those under 18 and those who enrolled in another college or university prior to
enrolling in a TCSG institution.
A stratified sample is one that results in selected groups that are either proportionately or
equally representative. Stratified samples avoid over- or under-representation of certain
pertinent variables being measured (Kruger, 2001). By dividing the population into exclusive

56
groups, an equal allocation multiple-staged sample allowed for random selection from each
group (Johnson & Christensen, 2012). In order to ensure equal representation of enrollment
participation, 400 dual enrolled and 400 non-dual enrolled students, was randomly selected from
the available data pool.
The selected sample provided the best grouping of students in order to track the transition
from high school to college and any potential effect of dual enrollment and other predictor
variables. Dual enrollment was likely to have the greatest influence on postsecondary enrollment
within a short amount of time after high school graduation. As a result, several groups were
eliminated, including older adults, returning students, or students who earned college credit from
other postsecondary institutions prior to TCSG college enrollment. In order to directly evaluate
the experiences of dual enrollment within a reasonable amount of time out of high school, the
sample had to include a balance of students with and without prior dual enrollment credit.
However, this also meant that I could not generalize results. Even so, this decision allowed for a
more focused investigation of the population of interest, dual enrollment students, which was
more integral to this study than generalizability. Because of the limited population of dual
enrollment students, 7,500 in 2008 (TCSG, 2011d), and the even smaller portion who
matriculated to a TCSG institution upon high school graduation, equal allocation was necessary
to ensure enough of these students were included.
The study sample, in the fall of 2009, was representative of the entire TCSG credit
population at that time (as well as students before and after them) on the basis of full-time/part-
time status, gender, and race/ethnicity. Demographic data for the sample was calculated and
then compared to the same data for the entire TCSG student enrollment in fall of 2009. For the
2009-2010 academic year, approximately 47% of entire TCSG population was identified as full-

57
time, while female students accounted for 62% of the population. Minority students represented
approximately 49% of the population, with Black students alone comprising 42% of the total
(TCSG, 2010b). Data on 12,402 students meeting the criteria for the study was provided. A
sample of 800 was randomly selected using SPSS software and comprised of 400 with prior dual
enrollment experience and 400 without. Review of that data showed that the characteristics of
the sample of 800 were similar to the entire TCSG student population for that term. For
example, the majority of the study sample were women, White, and enrolled part-time; while the
same held true for the TCSG. Diploma level program enrollment was also the highest for the
system as it was for the study’s sample. The sample breakdown is shown in Table 5.
Table 5.
Demographics of Final Sample Used for Study
Total n=800
Dual Enrolled n=400
Not Dual Enrolled n=400
n % n % n % Men 329 41.13 149 37.25 180 45.00 Women 471 58.88 251 62.75 220 55.00 White 462 57.75 219 54.75 243 60.75 Black 282 35.25 163 40.75 119 29.75 Other 56 7.00 18 4.50 38 9.50 Full-time 338 42.25 182 45.50 156 39.00 Part-time 462 57.75 218 54.50 244 61.00 Degree 93 11.63 24 6.00 69 17.25 Diploma 433 51.63 229 57.25 184 46.00 Certificate 294 36.75 147 36.75 147 36.75 Financially
disadvantaged 379 47.38 200 50.00 179 44.75
Received any financial aid
722 90.25 384 96.00 339 84.75
Retained 400 50.00 175 43.75 225 56.25 Graduated 111 13.88 63 15.75 48 12.00 Average GPA 1.81 1.92 1.70

58
One advantage of the TCSG archival student data was that it represented a permanent
longitudinal record of educational experiences that had no preference to location, sex,
race/ethnicity, income, or prior postsecondary educational experiences. Another is that
evaluating student data from the TCSG database encompasses students from across all of
Georgia. The disadvantage to using archival data included the possibility of unknown errors in
data entered by multiple individuals, from students to personnel, at individual colleges and the
potential for missing data needed for an effective evaluation.
Because the entire TCSG student population under 21 totaled nearly 29,000 in the fall of
2009 (TCSG, 2010a), a target sample of 800 who met the specified age range, began classes in
the fall of 2009, and had no prior college enrollment after high school was selected. Although
this sample is double the suggested size of 379 for a population of this size (Johnson &
Christensen, 2012), it was preferred in order to encompass enough dual and non-dual enrollment
students to yield sufficient results. However, with a large sample it was also possible that the
power and chance of statistical significance may have been inflated.
Three factors affect statistical power, including sample size, effect size, and alpha level.
Often, larger sample sizes result in more powerful tests, meaning that even small differences or
effects can be more easily detected, but can also yield statistical significance simply because of
that larger sample size (Lewis, 2001). Effect size is a measure of how well the independent and
dependent variables are related and the strength of that relationship (Johnson & Christensen,
2012). In regression, correlation is used to determine the direction and strength of variable
relationships to formulate an equation to predict or explain dependent variables (Portney &
Watkins, 2009). The regression coefficient (R) is already calculated for each variable
relationship, as a whole, or even for subsets of variables. Regression uses R2 (the coefficient of

59
determination) as well, to quantify the percentage of variability explained by the relationship.
This coefficient of determination (R2) is the effect size for multiple regression (Huck, 2008).
Using a sample of 800 from the TCSG student population, a beta of 0.08, and an alpha of
0.05 increased the power or strength of the statistical analysis. Beta represents the relative
importance of variation in the explanatory variables explained by the variation of the dependent
variables and the larger the value of the beta weight, the more influence that variable has in
prediction over chance. An alpha of 0.05 means that a result would happen by chance less than
five percent of the time (Moore, 2007). Given the focused nature of the specific cohort of age
and time, it provided a study powerful enough to determine statistical significance in the
relationships between the variable’s effects on the identified benchmarks of educational
achievement. Regression analyses identified factors to predict the best set of indicators for
academic achievement.
Procedure
Following research preparation and definition of study parameters, work was completed
with the TCSG officials to define the database. Data was collected from the TCSG in winter of
2012. Sample selection, regression coding, and data analysis occurred during early 2013.
Results were then compiled and the dissertation was completed and defended in April 2013.
Data Collection
The purpose of this study was to determine the relationship between selected student
factors and academic achievement in postsecondary technical education. Although a variety of
factors have been identified that may influence academic achievement in 2-year postsecondary
education, a particular interest of analysis was on the influence of dual enrollment. Dual
enrollment refers to providing high school students an opportunity to enroll in college-level

60
courses and earn both high school and college credit (Andrews, 2000, 2001, 2004; Bailey et al.,
2002; Edwards & Hughes, 2011; Karp et al., 2007; Smith, 2007; Welsh et al., 2005; Zeidenberg
& Bailey, 2010). Data was obtained from the TCSG out of its Banner student data system
through the Office of Data, Planning, and Research (TCSG, 2011d). The Banner student data
system houses all student information from application and admission through course completion
and graduation. Each college in the 2-year postsecondary system in Georgia collects, tracks, and
manages student information using the Banner system to report to the TCSG. Data was extracted
from that archival data in the TCSG Banner system.
Information stored in the system’s Banner student database was queried by a data analyst
from the TCSG central office to retrieve data based on specified criteria. The data requested
included student information from the fall 2009 cohort of TCSG degree, diploma, and certificate
students. Specifically, data on students who were ages 18 to 20, who had not obtained credit
from another postsecondary institution prior to admission to a TCSG college. Student
identification numbers are assigned upon acceptance to the colleges and were renumbered in the
data to be used as a unique identifier for each student and their longitudinal data in the study.
The entire set of data meeting the identified criteria was obtained from TCSG and a multiple
staged selection process randomly identified a sample of 800 to comprise the final data pool.
Data requested from the Office of Data, Planning, and Research, was provided in Excel format
for statistical analyses.
Specific data was provided for each student, including the following predictor variables:
participation in dual enrollment (yes or no), gender (male or female), race/ethnicity (White,
Black, or other minority [including Asian, Hispanic/Latino, American Indian/Alaskan Native,
Native Hawaiian/Other Pacific Island, non-resident alien, two or more races, and unknown]),

61
enrollment status (full- or part-time), and program level enrollment (degree, diploma, or
certificate). Criterion variables included grade point average (GPA) at the end of the first year
ranging from 0.0-4.0, persistence as measured by second year enrollment (yes or no), and
credential attainment (degree, diploma, or certificate) by end of the spring term in 2012 (yes or
no) (see Table 7).
The race/ethnicity of the system’s student population is mostly White or Black, with
other race/ethnicities representing less than 8% of the population (TCSG, 2010b). Therefore,
three categories of White, Black, and Other were used. Socioeconomic status and age were
eliminated from the variables selected. Given the small variation in age of 18- to 20-year old
students, it was likely that age would not have been a useful predictor variable and therefore
eliminated from the study data. One shortcoming of this archival data source is that
socioeconomic status is not collected. The system simply measures receipt of financial aid. At
the end of fiscal year 2010, 47% of the system’s students received Pell or Temporary Aid for
Needy Families (TANF) alone and 87% of the total student population received some sort of
need-based aid assistance and/or HOPE or local scholarship/grant (TCSG, 2010b). The same
comparable percentages were discovered with the sample population (see Table 5). Because of
the large percentage of students receiving aid, the inconclusive nature of self-selection pertaining
to need-based aid, and the wide availability of the HOPE grant and scholarship; this variable was
eliminated.
Data is entered into the Banner data system from multiple checkpoints during students'
progression through their education. Initial demographic information (age, gender,
race/ethnicity) and program level enrollment (degree, diploma, certificate) are self-identified,
verified with supporting documentation (birth certificate or driver’s license), and either entered

62
via online student submission of an application or through data entry by an admissions officer
from students' paper application. At that time, students are assigned a unique identifier for their
record in the form of a 9-digit student identification number.
When a student registers for classes, full-time or part-time status is established based on
the number of credit hours taken. Full-time consists of enrolling in more than 12 credit hours per
term, while part-time is any number less than 12 credit hours. Student GPA is calculated on the
basis of all grades earned in coursework taken, which are entered into the system by instructors
at the end of each term. Persistence is also automatically determined within the system when
students register for credit classes for any subsequent term during their second year at the
college.
A program major code is assigned to students based on the program in which they are
enrolled. This code indicates the course of study necessary for completion or graduation. Each
major code ends in a number that indicates the program level (i.e., 1=TCC, 2 or 4=diploma,
3=degree; see Table 6). Student data was collected at the end of the 2012 fiscal year, indicating
yes or no, whether each student graduated or completed a program (degree, diploma, or
certificate). Table 6 provides detailed information of the location and explanation of the data in
the Banner system.
Using demographic data and enrollment information (predictor variables), logistic and
ordered logistics regression analyses were conducted to determine which factors were the best
predictors of the indicators of academic achievement (dependent variables). Three
variables─first-year GPA, second-year enrollment (persistence), and credential attainment─
served as criterion variables reflecting academic achievement at three separate junctures in the
student’s educational path.

63
Table 6.
Banner Data Elements and System Location of Selected Variable Data
Variables Banner variable
Banner form
Banner field
Banner Table_Column
Accepted value Needed value
Unique identifier Student ID Number
SPAIDEN ID SPRIDEN_ID Auto-generated using Banner's ID Generation process, all ID's generated begin with a 9
Re-assigned, truncated or jumbled to eliminate future student identification
(a) 2009 cohort (b) Persistence year 2
Enrollment Term
SFAREGS Term SFRSTCR_TERM_ CODE
Enrollment term of course when a student is successfully registered, fields automatically populated from class schedule by SFAREGS into table SFRSTCR
(a) 201002 as first enrollment term(b) Any term FY2011 (201101, 201102, 201103, 201104)
New students Student Admit Type
SGASTDN Admit type SGBSTDN_ADMIT_ CODE
Admit/New Applicant - -15 (Regular admit/new applicant), -16 (Provisional Admit/New Applicant), and/or -18 (Special Admit/New Applicant)
(a) New students (b) Prior dual enrollment
Student Type SGASTDN Student type SGBSTDN_STYP_ CODE
Post-secondary option (data center code = 10) student taking PS courses that will apply towards HS diploma
(a) B (Beginning) 201002 (b) H (High school) prior to 201002 for prior dual enrollment identification, E1% prior to 201002, Code H
Program level Student Major 1 SGASTDN Major 1 SGBSTDN_MAJOR_ CODE_1
All major codes, ending digit signifies program level: 1=TCC, 2=diploma, 3=degree; Field indicates AAT (degree), CRT1 (TCC), DP2 or DP4 (diploma)
High school or GED only
Education Level SGASTDN Educ level SGBSTDN_EDVV_ CODE
00-20, Level 12 must have HS/Diploma/Grad date entered in SOAHSCH
12 (completed 12 years) or 20 (GED)
No prior college credit outside of DE
Prior PSEduc SOAPCOL Degree prior college
SORDEGR_DEGC_ CODE
Any approved valid college code contained in STVSBGI based on IPEDS codes
Must be blank indicating NO record of college credit or degrees at acceptance

64
Table 6. Banner Data Elements and System Location of Selected Variable Data (continued)
Variables Banner variable Banner form
Banner field
Banner Table_Column Accepted value Needed value
GPA GPA Hours SHATERM GPA hours
SHRTGPA_GPA_HOURS GPA hours calculated by banner system using attempted hours and earned hours
As assigned
Quality Points SHAINST Quality points
SHRTGPA_QUALITY_ POINTS
Quality Points are calculated by banner system using grade an hours fields
As assigned
GPA SHATERM GPA SHRTGPA_GPA_TYPE_ IND
GPA Calculated = I ; shows hrs attended, hours earned, GPA hours, and calculated GPA
Age Date of birth SPAPERS Date of birth
SPBPERS_BIRTH_DATE Student's date of birth 1989-1991 (age 18, 19, or 20 at start of term 201002)
Gender Gender SPAPERS Gender SPBPERS_SEX Male or female As assigned
Race/ethnicity Ethnicity SPAPERS New ethnicity
SPBPERS_ETHN_CDE 1=Not Hispanic or Latino 2= Hispanic or Latino
As assigned
Race SPAPERS Race GORPRAC_RACE_CDE 1=American Indian/Native Alaskan 2= Asian 3=Black or African American 4=Native Hawaiian/other Pacific Islander 5=White 6=Unknown 7=Non-resident Alien
As assigned
Credential attainment
Exit term SHADEGR Term SHRDGMR_TERM_ CODE_GRAD
Last term student attended classes, graduate term is taken from SHRDGMR
Any term 201002 through 201216
Award SHADEGR Major 1 SHRDGMR_MAJR_ CODE_1
Major code extracted from SHRDGMR
Major code of award obtained
Received SHADGMQ Outcome status
SHRDGMR_DEGS_CODE Awarded credential for major entered
"AW" indicates award obtained
Enrollment status (FT/PT)
Registered hours SFAREGS Credit hours
SFRSTCR_TERM_CRDIT_HR
Total hours registered for each course, added for total for term
<12= PT, >11=FT
Note. Information obtained from TCSG Data Elements Manual (2011a).

65
Data Analysis
Regression analysis was used to answer each of the research questions. An ex-post facto
design was used because archival data, gathered from the Technical College System of Georgia
(TCSG) student database of past enrolled students. Regression enabled me to examine the
relationships between selected predictor variables and three separate criterion variables (Huberty
& Hussein, 2001). Analysis results identified the variables, or set of variables, that were the best
predictors for academic achievement of students in technical colleges.
A unique identifier, a variation of the student identification number, was used to maintain
longitudinal information for each student. Selected predictor variables were entered for each
student, including prior dual enrollment status, gender, race/ethnicity, program level (degree,
diploma, certificate), and enrollment status (full- or part-time). These variables are categorical
and were collected based on the data collection format found in the student Banner system which
adheres to Integrated Postsecondary Education Data System (IPEDS) requirements established
by federal agencies. Race/ethnicity was broken down into three separate categories and program
level consisted of the three levels of program offerings in the TCSG colleges (see Table 7).
Predictor variables were included in each of the regression analyses to determine the best
set to variables to predict academic achievement. Academic achievement was measured
separately by three criterion variables. Descriptive statistics for each variable answered the first
research question, including frequency, mean, median, mode, standard deviation, variance,
range, and percentile (see Table 7).
The Banner System provided data for student grade point average (GPA) as a continuous
value ranging from 0.0 to 4.0. However, the GPA data revealed an unusually large number (121,
30.25%) of students with a GPA of 0.0 at the end of the first year, which did not represent the

66
normal distribution required for multiple regression. As a result, a decision was made to recode
GPA to align with standard practices used in educational institutions of equating GPA with alpha
grades. The data was recoded to reflect four grade categories (0.0-0.9, 1.0-1.9, 2.0-2.9, 3.0-4.0).
This coding simulates the categories commonly known as failing, below average, average, and
above average and reflects students receiving credit (2.0-2.9, 3.0-4.0) and not receiving credit
(0.0-0.9, 1.0-1.9). By recoding GPA, a more equal distribution between grade levels was
obtained (see Figure 2). The data for this research question was slightly adjusted to reflect the
coding scheme; and examined academic achievement as reflected by grades (GPA groups)
earned through coursework at the end of the first year of enrollment. Predictor variables were
evaluated using ordered logistic regression to determine the strongest predictive relationships for
this academic measure.
Research question 3 measured student retention, i.e., whether a student who had not
graduated enrolled in coursework after completing the first year of their educational program.
This variable measured academic achievement in terms of student persistence (continuation) in
coursework by enrolling in any term during the second year for additional credit toward
credential completion. Predictor variables were evaluated using logistic regression to determine
Figure 2. Histogram of GPA continuous and GPA grouped variables.

67
if one or a set of variables existed to predict whether students continued their college coursework
for a second year.
Research question 4 measured academic achievement by credential attainment, i.e.,
whether a student had reached certificate, diploma, or degree completion within three years of
enrollment. Technical colleges in Georgia have three levels of program enrollment, each having
different completion times. This research question measured, using logistic regression, whether
a student earned any credential within three years of college admission. Associate degrees can
range from 60 to 73 credit hours (3 to 6 terms full-time), while diplomas can range from 37 to 59
credit hours (3 to 5 terms full- time), and certificates from 9 to 36 credit hours (1 to 3 terms).
The three year time limit imposed for this study represents one and a half times the length of an
associate degree (9 terms), to up to more than three times the length of a certificate (TCSG,
2011c).

68
Table 7.
Research Questions and Corresponding Variable Descriptions with Analysis
Research question Predictor variables1 Criterion variables Analysis
1 What are the different characteristics of first-year technical college students?
Dual enrollment 1=Yes, 0=No
Gender 1=Men, 0=Women
Race/ethnicity (Dummy coded)
0,0=White (referent), 1,0=Black, 1,0=Other
Program level (Dummy coded)
0,0=Degree (referent), 1,0=Diploma, 1,0=Certificate
Enrollment status 1=Full-time, 0= Part-time
GPA (Recoded, ordinal)
0.00-0.99, 1.00-1.99, 2.00-2.99, 3.00-4.00
Retention (enroll year 2)
(Categorical) 1=Yes, 0=No
Graduate (Categorical) 1=Yes, 0=No
Descriptive statistics
2 What is the best set of predictors for explaining student grade point average at the end of the first year of enrollment in postsecondary technical college education?
GPA (Recoded, ordinal) 0.00-0.99, 1.00-1.99, 2.00-2.99, 3.00-4.00
Ordered logistic regression
3 What is the best set of predictors for retention in the technical college for a second year?
Retention (enroll year 2)
(Categorical) 1=Yes,0=No
Logistic regression
4 What is the best set of predictors for postsecondary credential attainment?
Graduate (Categorical) 1=Yes, 0=No
Logistic regression
Note. 1All predictor variables were used for each research question.
Correlational Research Design
Studies attempting to establish associations (or relationships) between variables use
correlational research designs (Lewis, 2001). The research questions in this study explored the
relationships between multiple independent variables and three dependent variables representing
postsecondary academic achievement. Multiple variables can interact with academic
achievement and each other simultaneously, so there may be correlation among explanatory
variables as well between explanatory variables and academic achievement. As a result, it is
important to determine which independent variables, alone or in conjunction with others, explain

69
the variation in achievement variables (Lewis, 2001). This relational question is best answered
using regression analysis.
The principal advantages of correlational designs over causal-comparative or
experimental designs include: the ability to analyze relationships among large sets of data, use
of numerous variables, and identification of associations and patterns either individually or in
combination with other variables. Correlation provides evidence about the degree of
relationships between variables (Gall, Gall, & Borg, 2007).
While correlation identifies and describes the existence and strength of relationships
between variables, regression is a more powerful statistical technique to explain or predict
quantifiable outcomes (Portney & Watkins, 2009). Regression analysis is one of the most
commonly used and flexible methods of quantitative analysis (Hardy, 1993) and can be applied
to an assortment of subjects (Schroeder, Sjoquist, & Stephan, 1986). Gall et al. (2007) noted that
educational researchers often want to conduct prediction studies to identify variables that project
various types of success. When using multiple variables, researchers are typically interested in
studying relationships among combinations of variables. Correlation forms the basis of
regression analysis or prediction studies.
Multiple Regression
Regression analysis refers to “a set of statistical procedures used to explain or predict the
values of a dependent variable based on the values of one or more independent variables”
(Johnson & Christensen, 2010, p. 472). Regression analysis provides a way to determine the
best straight line (regression line) that reflects the coordination of all data points to approximate
relationships between variables (Menard, 2002; Portney & Watkins, 2009; Schroeder et al.,
1986), or how a dependent (response or criterion) variable changes as independent (explanatory

70
or predictor) variables change (Moore, 2007). Regression accomplishes one of two things; to
predict a variable value based on the values of other variables or explain why values differ on a
particular variable (Huck, 2008).
The regression equation defines the regression line, or a line that best fits a pattern of
observations by making the vertical distances of all data points from the line as small as possible.
The regression line, or line of best fit, is calculated using the method of least squares where, of
all possible lines, the squared sum of all residuals (error represented by the distance between data
points and the line) is the smallest (Portney & Watkins, 2009; Schroeder et al., 1986). Two
important characteristics of any line are the slope (line steepness) and intercept (where the line
crosses the y-axis); these are also an important part of the regression equation (Johnson &
Christensen, 2010).
In its simplest form the regression equation is stated as y = a + bx;+e where y is the
predicted value (often shown as Ŷ), a is the intercept or the value of y when x = 0, b is the
slope/regression coefficient or the amount by which y changes when x increases by one unit, and
x is the known single independent variable score (Huck, 2008; Johnson & Christenson, 2010;
Portney & Watkins, 2009). Finding the least squares regression line and its corresponding
equation makes it easy to predict y from x (Moore, 2007). By using the regression equation and
its corresponding regression coefficient (b), values for x variable data points can be entered to
predict dependent variable value. In other words, participant scores for each predictor variable
are multiplied by their respective regression coefficients, then summed, and added to the
constant value to provide the best possible prediction score of the criterion variable (Johnson &
Christenson, 2010). Table 8 lists general regression equations, as well as dummy coding,
specific to this study.

71
Table 8.
Regression Equations
Standard regression equation Ŷ = a + b1X1+ e
Multiple regression equation Ŷ = a + b1X1 +b2X2 + … + bxXx + e
Ŷ =predicted score of dependent variable a = constant, intercept or where the regression line intersects the ordinate;
indicates the value of Y for the case where X=0 b = regression coefficient, slope of the line, how many predicted units of
change in the depend variable there are for any one unit increase in the independent variable
X = known score of independent variable
Dummy coding GNDR: men → 1=yes, 0=no (women) ETH: White → 1=yes, 0=no; Black → 1=yes, 0=no (if White=0 too, then other) DE: yes→ 1=yes , 0=no (then student had no previous DE) ENST: FT → 1=yes, 0=no, (then student was PT) PGMLVL: degree → 1=yes, 0=no; certificate→ 1=yes, 0 = no (if degree=0 too, then diploma)
Multiple regression equation ŶGPA = a + bGNDRmXGNDRm + (bETHwhDETHwh + bETHblDETHbl) + bDEyXDEy + bENSTftXENSTft + (bPGMLVLdegDPGMLVLdeg + bPGMLVLcertDPGMLVLcert) + e
Logistic regression equation logit [p(RET]) = a + bGNDRmXGNDRm + (bETHwhDETHwh + bETHblDETHbl) + bDEyXDEy + bENSTftXENSTft + (bPGMLVLdegDPGMLVLdeg + bPGMLVLcertDPGMLVLcert) +e
Note. GNDR=gender (man, woman), ETH=race/ethnicity (White, Black, other), DE=dual enrollment participation (yes/no), ENST=enrollment status (part time/fulltime), PGMLVL=program level (degree, certificate, diploma).
In regression, the correlation (regression) coefficient (r) measures the magnitude of the
relationship between a criterion variable and an independent variable. There are three elements
that are essential for regression analysis. They include the R, R2, and ΔR2 (Huck, 2008). The
correlation (regression) coefficient is represented by R and the relationship is based on some
combination of the multiple independent variables. The value of R will increase with each
variable that enters the analysis and the larger the R the better the prediction of the criterion
variable (Johnson & Christenson, 2010). R also provides an indication of how well the
regression equation fits or the degree to which the predicted scores correspond to the actual
scores (Huck, 2008). Using the simple Pearson correlation the multiple correlation (R) is

72
numerically assessed by the correlation between the y and x values to determine fit of the
equation (Huberty & Hussein, 2001). The process of calculating R2, or the coefficient of
determination, is used to measure the goodness of fit or relative closeness of the regression line
(Schroeder et al., 1986). By squaring the correlation coefficient (R) to arrive at the coefficient of
determination (R2) the percentage of total variance in the dependent variable explained by the
independent variable, or combination of independent variables, is defined (Johnson &
Christensen, 2010; Schroeder et al., 1986).
Regression analysis was chosen because no causal relationship can be defined between
dual enrollment and academic achievement due to numerous extraneous variables, yet, some
relationship may be determined. Variables were not compared against one another for statistical
significance, but instead, an assessment of relationships in establishing the correlation with and
without the other variables taken into account. Analyzing multiple variables can predict the
probability of the best possible combination or effect between any of the criterion variables and
the predictor variables studied. By using regression, the correlation provides a measure of how
well each dependent variable can be predicted from the set of independent variables (Huberty &
Hussein, 2001). The probability calculated in logistic regression shows the odds of a case being
classified into one category over the other (Menard, 2002). This analysis was the best
measurement of the effect of dual enrollment on the selected measures of academic achievement.
Advantages of using a regression analysis include accommodation of many variables,
allowance for control of many factors simultaneously with non-experimental data, and assistance
with building a model of prediction. Using archival educational data interjects many variables
into the picture of academic achievement. Multiple regression analysis allows many factors to
be considered simultaneously to determine which (or which combination) are the best set of

73
predictors for achievement (Huberty & Hussein, 2001). Because of its versatility, regression also
can be used to analyze data from many quantitative designs and manage multiple types of data
(Gall et al., 2007).
I used multiple variables of first-year college students to determine which combination of
these variables provided the best explanation (or prediction) of three different indicators of
academic achievement. Multiple regression is used when the criterion variable is continuous.
Logistic regression is used instead of multiple regression when the criterion variable is
categorical. Ordered logistic regression, a form of logistic regression, is used when the criterion
variable is composed of ordinal values (Warner, 2008). Logistic regression allowed me to use
multiple predictor variables (i.e., student information) to determine the ones that correlated best
with data reflecting the categorical criterion variable (i.e., academic achievement). Ordered
logistic regression was also used to examine one of my criterion variables, GPA, that was
recoded as an ordinal variable.
Logistic regression. Logistic regression was used to answer the third and fourth research
questions. Logistic regression examines the relationships between one or more predictor
variables and a dichotomous categorical criterion variable (e.g., retention-yes/no, credential
earned-yes/no). Logistic regression differs from linear regression in the types of independent
variables allowed, the ability to use subsets of independent variables for control purposes, and
the use of odds ratios instead of coefficients of determination (r2 or R2) to measure the strength
of association between predictor and criterion variables.
The concept of the odds ratio is analogous to R2 because it measures the strength of
association. However, it is considered more user-friendly because it presents results in an “A is x
times more likely than B” format to depict relationships rather than R2s explanation of variance

74
(Huck, 2008). Logistic regression focuses on the frequency of correct as opposed to incorrect
predictions or appearances in one or the other group (yes or no) of a dichotomous dependent
variable and how well the model minimizes errors of prediction. In simpler terms, logistic
regression attempts to identify the probability (odds) that a variable will be classified into one of
the two categories of the dependent variable (Menard, 2002). A logistic curve is created to
model the odds of the criterion variable based on a combination of the predictor variables. A
pseudo R2 statistic, exp(B), is created to summarize the strength of the relationship (Bewick,
Cheek, & Ball, 2005).
Ordered logistic regression. Ordered logistic regression, a form of logistic regression,
was used for the second research question because the criterion variable, GPA, was recoded into
ordinal categories that reflected standard grade ranges (GPAs in the ranges 0.00-0.99, 1.00-1.99,
2.00-2.99, and 3.00-4.00 were each combined into separate groups). Ordered logistic regression
is designed to accommodate a criterion variable with ordinal values. The analysis predicts the
odds of being in the highest category or rank ordering of the data (Warner, 2008). Just like
logistic regression, ordered logistic regression attempts to identify the probability (odds) that a
variable will be classified into the highest of the ordinal categories of the dependent variable
(Menard, 2002). A pseudo R2 statistic, exp(B), is also calculated to summarize the strength of the
relationship (Bewick et al., 2005).

75
CHAPTER 4 DATA ANALYSIS
Results
This correlational design study used archival data to examine the unique role of dual
enrollment, given the concomitant influence of other selected predictor variables, in explaining
three distinct indicators of the educational achievement of postsecondary students at technical
colleges in Georgia. Dual enrollment students are high school students enrolled in college credit
courses while still enrolled in high school and earning credit at both institutions (Andrews, 2000,
2001, 2004; Bailey, Hughes, & Karp, 2002; Edwards & Hughes, 2011; Karp, Calcagno, Hughes,
Jeong, & Bailey, 2007; Smith, 2007; Welsh, Brake, & Choi, 2005; Zeidenberg & Bailey, 2010).
Other predictor variables included race/ethnicity, gender, enrollment status (full- or part-time),
and program level (degree, diploma, or certificate). Educational achievement was defined as
three separate criterion variables including grade point average (GPA) at the technical college at
the end of the first year, college enrollment persistence defined by enrollment (either enrolled or
not enrolled in college coursework) the second year, and postsecondary credential attainment
(earning a degree, diploma, or technical certificate of credit [TCC] from that technical college)
within three years. The following research questions guided data analyses:
1. What are the characteristics of first-year technical college students including participation
in dual enrollment, race/ethnicity, gender, enrollment status, and program level?
2. What is the best set of predictors from those identified, including dual enrollment, for
explaining student GPA at the end of the first year of enrollment in postsecondary
technical college education?

76
3. What is the best set of predictors from those identified, including dual enrollment, for
retaining students in the technical college for a second year?
4. What is the best set of predictors from those identified, including dual enrollment, for
postsecondary credential attainment within three years of initial enrollment?
The study used an ex-post facto, correlational design to analyze archival data from the
Technical College System of Georgia (TCSG) Banner Student (2011a) database system.
Included in this analysis was data on students from fall term of 2009 through summer term of
2012, ages 18-20, who entered the system with no college credits from another college or
university system. Participants represented a multiple staged, random sample of students who
entered a postsecondary technical college in Georgia after high school graduation without credits
from another educational institution outside of the TCSG.
Data meeting the identified sampling criteria was obtained from TCSG. In order to
ensure equal representation of enrollment participation, the initial data set was separated by prior
dual and non-dual enrolled students. This data set included a total of 12,401 students meeting
the identified criteria; 475 (3.83%) students earned prior dual enrollment credit. After multi-
stage random selection, a sample of 800 total students was identified to comprise the final data
pool. To ensure balanced groups for analysis comparison of the academic achievement for the
dual enrollment effect, 400 prior dual enrollment and 400 no prior dual enrollment students, were
randomly selected using statistical software. Statistical analyses were conducted. The remainder
of this chapter details the results for each research question.
Research Question 1 - Student Characteristics
What are the characteristics of first-year technical college students including
participation in dual enrollment, race/ethnicity, gender, enrollment status, and program level?

77
Descriptive statistics were calculated on the sample of students randomly selected from
the data received from the TCSG. The sample mirrors the demographic breakdown of the entire
TCSG student population at that time. The entire TCSG student population in fall of 2009 had
more than 60% women, was just over 50% White, and slightly more than half enrolled part-time
(TCSG, 2010b). It’s interesting to note the large representation of women in both the entire
sample (59%) and even more so in the prior dual enrollment group (63%). White students were
represented as the majority of students with students of other races comprising a small portion of
the entire sample and even less of the dual enrollment portion of the sample. A majority of
students were enrolled in a diploma program. While an Associate of Applied Science (AAS)
degree is the highest available credential that can be earned, fewer students were enrolled in this
program option in all categories. Overall, 50% of students were retained from year one to year
two, and the breakdown was less for prior dual enrollment credit students (43.75%) and higher
for non-dual enrolled students (56.25%). The low sample graduation rate of 13.88% was similar
for both dual and non-dual enrollment groups. Even though a large portion (30.25%) of the
sample earned a 0.0 GPA at the end of the first year, the mean GPA for the entire sample was
1.81. After grouping GPA, the largest category was the 2.0-2.9 group which reflected average
performance. Students with prior dual enrollment credit earned a higher mean GPA (1.92) than
students without any dual enrollment credit (1.70). Specific demographic and descriptive
statistics are shown in Table 9.

78
Table 9.
Demographic and Descriptive Statistics of Study Sample
Demographic variables
Total n=800
Dual Enrolled n=400
Not Dual Enrolled n=400
n % n % n %
Men 329 41.13 149 37.25 180 45.00 Women 471 58.88 251 62.75 220 55.00 White 462 57.75 219 54.75 243 60.75 Black 282 35.25 163 40.75 119 29.75 Other 56 7.00 18 4.50 38 9.50 Full-time 338 42.25 182 45.50 156 39.00 Part-time 462 57.75 218 54.50 244 61.00 Degree 93 11.63 24 6.00 69 17.25 Diploma 433 51.63 229 57.25 184 46.00 Certificate 294 36.75 147 36.75 147 36.75 Retained 400 50.00 175 43.75 225 56.25 Graduated 111 13.88 63 15.75 48 12.00
M M M
GPA 1.81 1.92 1.70
Descriptive statistics for total sample
M Mdn Mode SD s2
GPA (0.00 – 4.00) 1.81 1.94 0.00 1.19 1.43 Retained (Y or N) Y 0.50 0.25 Graduated (Y or N) N 0.35 0.12
Research Question 2 - GPA
What is the best set of predictors from those identified, including dual enrollment, for
explaining student GPA at the end of the first year of enrollment in postsecondary technical
college education? Data for student GPA was provided as a continuous value ranging from 0.0
to 4.0. Due to the large number (n=121, 30.25%) of students showing a GPA of 0.00 at the end
of the first year, GPA was recoded to align with standard practices used in educational
79
institutions to reflect four grade categories (0.0-0.99, 1.0-1.99, 2.0-2.99, 3.0-4.0). This coding
(a) corresponds to GPA categories known as failing, below average, average, and above average,
and (b) also adequately reflects students receiving credit (2.0-2.99, 3.0-4.0) and those not
receiving credit (0.0-0.99, 1.0-1.99). Variables were evaluated using ordered logistic regression
to determine the strongest predictive relationships of the predictor variables with this academic
measure of achievement.
Model tests were reviewed using both Pearson’s goodness of fit and the Test of Parallel
Lines. These tests compared the odds that the explanatory variables had the same effect across
the different thresholds (each GPA category) of the dependent variable and whether the equation
was valid, finding no statistically significant differences (“Annotated SPSS Output, Ordered
Logistic”, n.d.). This result indicated that the regression model was a good fit for the data for
predicting the odds of the independent variables consistently across each dependent variable
group. Model Fitting Information results were statistically significant, denoting that the model
improved the likelihood of the outcome by including these variables. Nagelkerke’s pseudo R2, a
version of the R2 statistic used in multiple regression when data is not continuous, compared the
model’s expected versus observed values and indicated that 4.1% of the variance in the outcome
was explained by the combination of selected predictor variables. Numerous factors influence a
student’s GPA, making the explanation of GPA by the selected variables in this study rather
small. However, since the model was overall a good fit, results were interpreted.
Results identified two of the predictor variables as being statistically a significant
explanation of GPA. These included race/ethnicity and dual enrollment credit. When
controlling for other variables in the equation, White students were 1.86 times more likely than
Black students to earn a GPA between 3.0-4.0. In addition, the odds of a student’s GPA being in

80
the highest level were 1.49 times more likely for students with prior dual enrollment than
students without dual enrollment experience.
Table 10.
Ordered Regression Results of GPA for Study Sample
B SE Wald p exp(B)
No prior dual enrollment -0.401 0.132 9.273 0.002 1.49
Degree (vs. certificate) 0.063 0.221 0.082 0.774 1.03
Degree (vs. diploma) -0.169 0.211 0.643 0.423 0.84
White (vs. Black) 0.623 0.140 19.929 0.000 1.86
White (vs. Other) 0.104 0.255 0.166 0.683 1.11
Women 0.191 0.135 2.004 0.157 1.21
Part-time -0.149 0.131 1.295 0.255 0.86
Notes. All variables have df=1.
Research Question 3 – Retention
What is the best set of predictors from those identified, including dual enrollment, for
retaining students in technical college programs for a second year? To answer the third
research question, selected variables were used to assess the likelihood of students enrolling in
classes at any time during the year immediately after initial enrollment at the technical college.
A binary logistic regression was used to determine the strongest relationships between predictor
variables and this academic measure of achievement. Logistic regression examines relationships
between one or more predictor variables and a dichotomous categorical criterion variable.
The Omnibus Test of Model Coefficients, which analyzes the predictive capacity of the
regression equation, was statistically significant (p < 0.05, 0.05) meaning that there was a
significant effect of the combined variables on the criterion variable than chance alone
(“Annotated SPSS Output, Logistic”, n.d.). Nagelkerke’s pseudo R2 was used to compare the
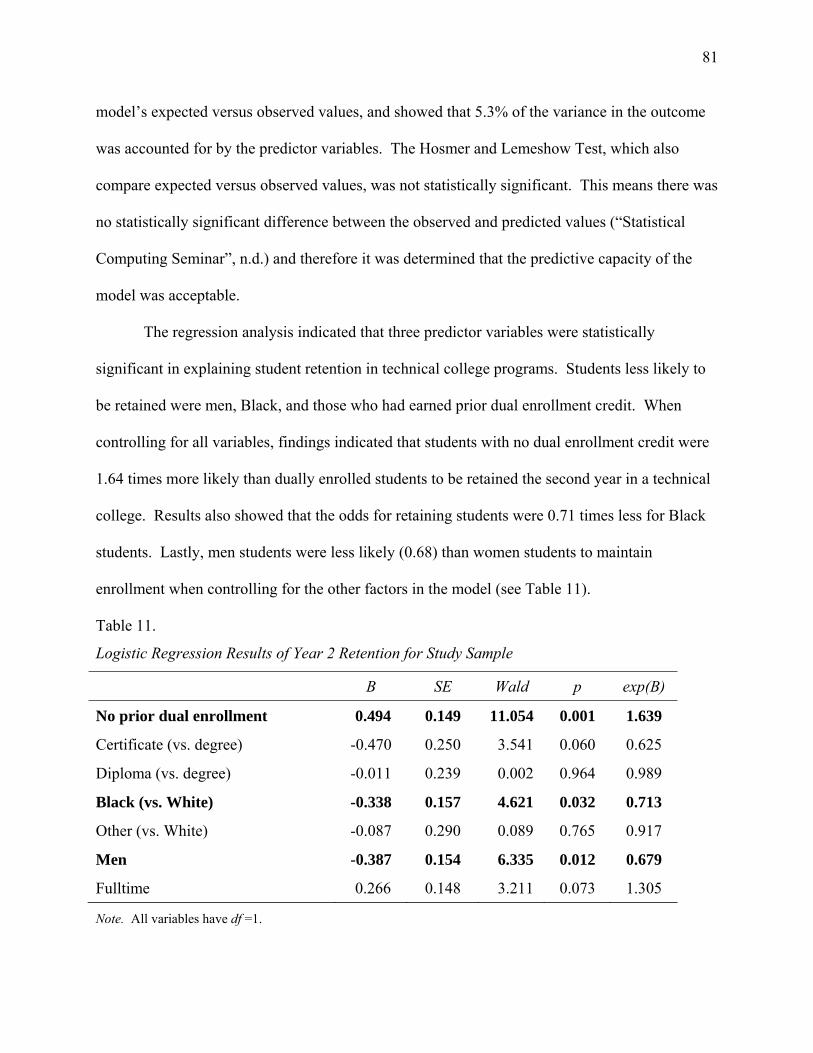
81
model’s expected versus observed values, and showed that 5.3% of the variance in the outcome
was accounted for by the predictor variables. The Hosmer and Lemeshow Test, which also
compare expected versus observed values, was not statistically significant. This means there was
no statistically significant difference between the observed and predicted values (“Statistical
Computing Seminar”, n.d.) and therefore it was determined that the predictive capacity of the
model was acceptable.
The regression analysis indicated that three predictor variables were statistically
significant in explaining student retention in technical college programs. Students less likely to
be retained were men, Black, and those who had earned prior dual enrollment credit. When
controlling for all variables, findings indicated that students with no dual enrollment credit were
1.64 times more likely than dually enrolled students to be retained the second year in a technical
college. Results also showed that the odds for retaining students were 0.71 times less for Black
students. Lastly, men students were less likely (0.68) than women students to maintain
enrollment when controlling for the other factors in the model (see Table 11).
Table 11.
Logistic Regression Results of Year 2 Retention for Study Sample
B SE Wald p exp(B)
No prior dual enrollment 0.494 0.149 11.054 0.001 1.639
Certificate (vs. degree) -0.470 0.250 3.541 0.060 0.625
Diploma (vs. degree) -0.011 0.239 0.002 0.964 0.989
Black (vs. White) -0.338 0.157 4.621 0.032 0.713
Other (vs. White) -0.087 0.290 0.089 0.765 0.917
Men -0.387 0.154 6.335 0.012 0.679
Fulltime 0.266 0.148 3.211 0.073 1.305
Note. All variables have df =1.

82
Research Question 4 – Credential Attainment
What is the best set of predictors from those identified, including dual enrollment, for
postsecondary credential attainment within three years of initial enrollment? The fourth and
final study question evaluated the model that provided the best set of predictors from the list
assembled for earning any award (degree, diploma, or certificate) within three years of first
enrollment. Variables were evaluated using binary logistic regression to determine the strongest
set of predictive relationships for this academic measure of achievement. The Omnibus Test of
Model Coefficients which tests the predictive capacity of the equation, was statistically
significant (p < 0.01, 0.005). Nagelkerke’s pseudo R2 compared the model’s expected versus
observed values, found that 4.5% of the variance in the outcome was accounted for by these
variables. All tests were consistent in indicating similar pseduo R2 values. The five variables
included in this regression equation accounted for only a small portion of postsecondary
academic achievement. The Hosmer and Lemeshow test, which compares expected versus
observed values, was not statistically significant. Therefore, it was determined that the
predictive capacity of the model was acceptable (p < 0.05, 0.931).
For credential attainment, only one variable was statistically significant at predicting
graduation by the end of three years and that variable was full- time enrollment. When
considering all variables included in the analysis, the odds of students enrolled full-time was
nearly double those enrolled part-time of earning a credential within three years of initial
enrollment (see Table 12).

83
Table 12.
Logistic Regression Results of Graduation from 2-year Technical College in Georgia for Study
Sample
B SE Wald p exp(B)
No prior dual enrollment -0.334 0.215 2.422 0.120 0.716
Certificate (vs. degree) 0.200 0.394 0.258 0.611 1.222
Diploma (vs. degree) 0.379 0.371 1.046 0.306 1.461
Black (vs. White) -0.159 0.224 0.507 0.476 0.853
Other (vs. White) -0.719 0.541 1.770 0.183 0.487
Men 0.350 0.217 2.595 0.107 1.418
Fulltime 0.687 0.228 9.068 0.003 1.988
Note. All variables have df=1.

84
CHAPTER 5 CONCLUSIONS AND RECOMMENDATIONS
Summary
Introduction
Current economic matters have diminished employment opportunities in the U.S. and in
Georgia. Added to this increased competition for available jobs, job requirements are also
increasing. For example, over half of all jobs in Georgia will require some level of
postsecondary education (Carnevale, Smith, & Strohl, 2010). Much of this education and
training can be provided by community colleges. In fact, more than half of U.S. undergraduate
students already attend 2-year institutions (American Association of Community Colleges,
2011). Because businesses need properly trained employees to survive and thrive, education is
imperative. However, according to the U.S. Bureau of Labor Statistics (2010), less than one-
third of citizens over age 18 earned a high school diploma; let alone, the education considered
indispensable for successful employment.
To complicate matters, only 70% of high school graduates transition immediately from
high school to college and more than one-third report having to take at least one remedial
academic course to be ready for college-level work (Aud, Hussar, Kena, Bianco, Frohlich,
Kemp, & Tahan, 2011). The workforce will continue to change and adapt to economic
conditions; a seamless shift from one education level to the next would allow citizens to adapt
and change, as well. Two-year post-secondary institutions, having long held the trademark of
being flexible and rapid in response to student, business, and community needs, may present a
unique bridge between systems and reduce these challenges (Crawford & Jervis, 2011, Phillipe
& Sullivan, 2005).

85
Boswell (2001) cited a wide range of postsecondary enrollment options that facilitate a
bridge between educational systems and accelerate student achievement, including concurrent
high school and college enrollment. Simultaneously, policymakers have called for implementing
concurrent high school and college options for a multitude of reasons including limiting tuition
costs, accelerating student progress toward a degree, providing greater academic challenges and
opportunities in high school, and promoting student aspirations for college.
In reality, far too many students struggle with making the transition from secondary to
postsecondary educational systems. Part of this difficulty may be attributed to a lack of the
knowledge necessary to navigate system changes. Available options, accessible jobs, and paths
to success are often foreign to families and students due to lack of exposure and familiarity
(Hooker & Brand, 2010). Many proponents of implementing options to ease this transition
believe dual enrollment might be one answer (Andrews, 2001; Bailey, Hughes, & Karp, 2002,
2002; Boswell, 2001, Crockett-Bell, 2010; Edwards & Hughes, 2011; Farrell & Seifert, 2007;
Hugo, 2001; Karp, Calcagno, Hughes, Jeong, & Bailey, 2007; Mokher & McLendon, 2009;
Smith, 2007; Welsh, Brake, & Choi, 2005; Zeidenberg & Bailey, 2010).
Dual enrollment provides high school students with opportunities to enroll in college-
level courses and earn both high school and college credit (Andrews, 2000, 2001, 2004; Bailey et
al., 2002; Edwards & Hughes, 2011; Karp et al., 2007; Smith, 2007; Welsh et al., 2005;
Zeidenberg & Bailey, 2010). Since its inception in the 1950s, dual enrollment has slowly, but
gradually, been adopted throughout the nation as a viable option for facilitating the transition
from secondary to postsecondary education (Andrews, 2001). In fact, the majority (98%) of
public 2-year colleges in the U.S. offer dual credit courses, and enroll over three-fourths of all
dual enrollment students in the country (Kleiner & Lewis, 2005).

86
Proponents maintain that dual enrollment provides a more challenging senior year by
motivating students to work harder, affording a wider array of curricular opportunities, and
supporting the transition to college-level demands (Andrews, 2001, 2004; Bailey et al., 2002;
Crockett-Bell, 2010; Karp et al., 2007). For students, dual enrollment provides a more seamless
transitional link between high school and college, shortens the time to a postsecondary degree,
and saves time and money. Researchers also recognize dual enrollment as a pathway for high
school students to become more familiar with college experiences and expectations and believe
that it encourages higher educational aspirations. Dual enrollment can also help acclimate
students to the social and academic demands of college and, ultimately provide the long-term
economic benefit of a more educated workforce (Andrews, 2001; Bailey et al., 2002; Boswell,
2001, Crockett-Bell, 2010; Edwards & Hughes, 2011; Farrell & Seifert, 2007; Hugo, 2001; Karp
et al., 2007; Mokher & McLendon, 2009; Smith, 2007; Welsh et al., 2005; Zeidenberg & Bailey,
2010).
Despite increased adoption of and attention to dual enrollment options, relatively little
research has been done to determine the impact of this intervention on postsecondary student
outcomes. Many of the problems that exist with quantifying the effect of dual enrollment
encompass the lack of appropriately tracked data on students (Brand & Lerner, 2006; Karp &
Jeong, 2008). Existing literature provides little guidance on whether dual enrollment truly helps
better prepare students for college success. Therefore, this study tested the contribution of dual
enrollment, along with other factors, on the academic achievement of students enrolled in 2-year
postsecondary programs.

87
Purpose
The purpose of this nonexperimental, correlational design study was to use archival data
to examine the unique role of dual enrollment, given the concomitant influence of other selected
predictor variables, in explaining three distinct indicators of the educational achievement of
postsecondary students at technical colleges in Georgia. Other predictor variables included
race/ethnicity, gender, enrollment status (categorized as either full- or part-time), and program
level (degree, diploma, or certificate). Educational achievement was defined as three separate
criterion variables including grade point average (GPA) at the technical college at the end of the
first year, college enrollment persistence defined by enrollment (either enrolled or not enrolled in
college coursework) the second year, and postsecondary credential attainment (earning a degree,
diploma, or technical certificate of credit [TCC] from a technical college) within three years.
Since the need for a college education to earn a sustainable living is more imperative
today than ever before, accurately measuring postsecondary achievement is at the forefront of
higher education discussions (Committee on Measures of Student Success, 2011). Key transition
points can be used to track a student from high school graduation (and determine college
readiness), to college enrollment and achievement, and end with post-college attainment (work
outcomes or transfer to a 4-year college or university). While these transition points comprise
start to finish and can appear to simplify the work of students and postsecondary education
institutions, they do give attention to understanding the magnitude of measuring student
academic achievement (Perna & Thomas, 2008). In addition, education at the occupational, 2-
year college level prepares students with technical skills and knowledge for specific occupations.
Programs at these institutions have multiple exit points including associate degrees, diplomas,
and short-term certificates; all with the main goal of entering the workforce prepared for a

88
specific career or trade (Hirschy, Bremer, & Castellano, 2011). Longitudinal benchmarks may
include college enrollment, GPA, persistence, attrition, transfer, career integration, program
completion, and job attainment (Hirschy et al., 2011; Horn, 2009; Perna & Thomas, 2008;
Phillipe & Sullivan, 2005). The differences in these technical college offerings call for a
multitude of benchmark measurements to evaluate success for the array of potential goals.
Method
A correlational design was used to analyze the archival data derived from the Technical
College System of Georgia (TCSG) Banner Student (2011a) database system. Archival data
allowed analysis of longitudinal factors that might explain postsecondary technical student
achievement. Using the existing TCSG student information system enabled analysis of student
demographic data, educational milestones, and academic achievements as students progressed
through Georgia’s 2-year postsecondary system. By analyzing data from the fall term of 2009
through summer term of 2012, participants represented a multiple-staged random sample of
students, ages 18-20, who entered a postsecondary technical college in Georgia after high school
graduation, without credits from another educational institution outside the TCSG.
In order to ensure equal representation of enrollment participation, 400 of each prior dual
and non-dual enrolled students were randomly selected from the provided data. Dual enrollment
was likely to have the greatest influence on postsecondary enrollment within a short amount of
time after high school graduation. The purpose of this study was to determine the relationship
between selected student factors and academic achievement in postsecondary technical
education. Although a variety of factors have been identified that may influence academic
achievement in 2-year postsecondary education, a particular interest of analysis was on the
influence of dual enrollment.

89
Predictor variables were participation in dual enrollment (yes or no), gender (male or
female), race/ethnicity (White, Black, or other minority [including Asian, Hispanic/Latino,
American Indian/Alaskan Native, Native Hawaiian/Other Pacific Island, non-resident alien, two
or more races, and unknown] ), enrollment status (full- or part-time), and program level
enrollment (degree, diploma, or certificate). Criterion variables included GPA at the end of the
first year ranging from 0.0–4.0, persistence as measured by second year enrollment (yes or no),
and credential attainment (earning any credential - degree, diploma, or certificate) by end of the
spring term in 2012 (yes or no).
Regression analyses were used to answer the following research questions: What are the
characteristics of first-year technical college students including participation in dual enrollment,
race/ethnicity, gender, enrollment status, and program level? What is the best set of predictors,
from those identified, for explaining student GPA at the end of the first year of enrollment in
postsecondary technical college education? What is the best set of predictors, from those
identified, for retaining students in the technical college for a second year? What is the best set of
predictors, from those identified, for postsecondary credential attainment within three years of
initial enrollment?
The first research question analyzed the descriptive statistics and the participation
breakdown of the sample. The second measured academic achievement in relation to GPA
earned through coursework at the end of the first year of enrollment, using ordinal regression, to
determine which had the strongest predictive relationship. The third research question measured,
using logistic regression, academic achievement in terms of student persistence in continuation
of coursework by enrolling in any term during the second year for additional credits toward

90
credential completion. Using logistic regression, the last research question measured whether a
student earned any credential within three years of admission to the college.
Findings
A majority of students were White, women, enrolled part-time, and enrolled in a diploma
level program. Sampling ensured that half of the students earned prior college credit through
dual enrollment and the demographic majorities were similar within these dual and non-dual
enrolled sub categories. Fifty percent of the sample was retained in year 2. This figure was
slightly higher for non-dual enrolled students (56.25%). The average GPA for the sample was
1.81; slightly higher for students with dual enrollment experiences (M=1.92), and slightly lower
for those with no dual enrollment credit (M=1.70). Less than 14.00% of all students in the
sample graduated by the end of the data collection period. Rates were marginally higher for dual
enrollment students (15.75%) and lower for non-dual enrollment students (12.00%).
Regression analyses indicated that dual enrollment was a statistically significant predictor
of the likelihood of a higher GPA at the end of the first year, but negatively impacted the
likelihood that a student would persist to the second year. When controlling for other variables,
White students were more likely than Black students to possess higher GPAs at the end of the
first year. Black students were less likely than White to be persistent in enrolling in coursework
Year 2. Men were less likely than women to be retained, as well. The only statistically
significant variable contributing to the likelihood of credential attainment within three years was
full-time student enrollment.
Conclusions
Measuring and analyzing academic achievement can be challenging due to the magnitude
of factors that can enhance some students’ success, while inhibiting others. In this study, along

91
with the dual credit experience, demographic and enrollment factors were included to determine
their effect on GPA, retention, and graduation. Using this select group of variables to measure
critical benchmarks in a student’s educational path is complicated in the technical college setting
in Georgia. As Hirshy et al. (2011) pointed out, students in technical colleges are diverse in age,
background, goal, enrollment type, and more. The National Profile of Community Colleges
(Phillipe & Sullivan, 2005) reported that 85.7% of public community college students possess at
least one risk factor (e.g., financially independent, delayed enrollment, enrolled part-time, have
dependents, are a single parent, work full-time, earned a GED, or had no high school diploma)
that can substantially impede college persistence. Most students experience multiple risk factors.
In 2004, 80% of public community college students worked and nearly 42% report being full-
time employees who study versus full-time students who work. The technical colleges in
Georgia are no different. Risk factors and their unique missions often deter 2-year colleges from
using common measurements of academic achievement to accurately determine success.
Georgia’s technical colleges are not typically the first choice for students, nor is their
value often understood or appreciated (V. Seals, personal communication, March 20, 2013). On
a regular basis, institutions in the system work against misconceptions regarding the trade school
stereotype many hold about technical colleges. Students who do choose a technical college may
very well enter with a program in mind to obtain training or retraining for a specific job. Many
others will use the technical college as a first step toward their end goal as a less costly
alternative for transferrable coursework upon admission to a 4-year college or university. Lastly,
some will enter after an unsuccessful attempt at a 4-year institution. Because technical colleges
in Georgia are not transfer institutions by mission and are under a separate system than 4-year
institutions, this can impose constraints on accurately measuring student retention and

92
completion. Because of the diverse nature of technical college students and their intentions, it
can be even more challenging to measure academic success especially without seamless data to
track students longitudinally from the start of their secondary educational training, through any
postsecondary education system, and into the workforce. Currently work is being done between
higher education systems in Georgia, albeit with slow progress, to attempt to remedy this
problem.
Research Question 1
It is interesting to note gender differences found in this analysis. Nearly 63% of students
with prior dual enrollment credit were women. While that mirrors overall enrollment in
community colleges, the academic performance of these females versus their male counterparts,
is noteworthy. In both the dual and non-dual enrolled groups, women had higher GPAs than
men, and 24% more women were retained from year one to year two. However, of those
students that are retained, a greater percentage of men dual enrolled students (+9%) actually
graduated than dual enrolled women students or any non-dual enrolled student. More women
students attended college full-time in the dual enrollment subgroup, but the reverse was true for
women students in the non-dual enrollment group. While more than half of the entire sample
enrolled in a diploma-level program, it was especially high (77%) for men dual enrolled students.
Technical college programs do draw students interested in the institution’s true mission
of direct workforce training. These programs include not only trades (e.g., welding, air
conditioning, construction), but also computer information systems programs (e.g.,
programming, networking) and health science programs (e.g., nursing, radiologic technology,
respiratory care, surgical technology, paramedicine). In fact, 80% of America’s first-responders
are trained in community colleges (AACC, 2011). Traditionally, men are drawn to trades

93
programs and women to health programs. Men may graduate at a higher rate than women
because trade programs are shorter diploma-level programs culminating in immediate job entry.
In contrast, health programs are competitive and space can be restricted due to clinical
requirements and limited enrollment spots. This could delay program graduation in anticipation
of a chance on a waiting list for program entry. In addition, if more women students are driven
to get a head start on college credit in high school, they may be more driven to transfer to a 4-
year institution to attain a higher educational degree.
Interestingly, nearly half of all students with dual credit enrolled in a health programs
upon admission to the technical college, while the percentage was less than a third for non-dual
students. A majority of health programs at technical colleges are competitive entry programs.
The pre-health certificate level designation is a holding zone of sorts for students to earn their
prerequisite courses for consideration for competitive admission to the actual health program of
choice. Twice as many students with dual enrollment credit enrolled in pre-health programs over
non-dual enrolled students. While there were 14% more women in the dual enrollment group
than the non-dual enrolled group, 60.96% of women in the dual enrolled group enrolled in health
programs, as opposed to only 47.27% of women in the non-dual enrollment group.
Also noteworthy are many other dynamics that could be accounted for when evaluating
the breakdown of students and their program choices in this sample. Degree programs are the
longest in length and the highest credential to be earned in Georgia’s 2-year system. Although
program level was not a statistically significant factor in any of the regression analyses, it could
shed some light on achievement based on the program level students select. For instance, in both
groups, the highest enrollment was in diploma-level programs. More non-dual enrollment
students enrolled in degree level programs than dual enrolled students. Certificate level

94
enrollment in both sub groups (dual and non-dual) was the same. Male dual enrolled students
predominantly (77.18%) enrolled in diploma level programs, while the majority of females
(58.57%) enrolled in certificates.
Outside of health programs, dual enrollment students tended to enroll in programs where
articulated credit (specified high school courses that can count for college credit [TCSG, 2013])
and dual enrollment course offerings are prevalent. Male student enrollment shifted more toward
trade programs within the dual enrolled subgroup. Sixty-eight males (45.64%) in the dually
enrolled group majored in a trade program. This could indicate the nature of articulated
coursework and dual enrolled courses not available in high school for fields immediately
available for entry upon successful completion of the technical coursework.
Higher enrollment in business type programs (e.g., accounting, management, marketing)
and the Technical Communications Specialist certificate was noted among non-dually enrolled
students. Since TCSG institutions are not part of the state’s university system and do not offer
degree programs designed for the sole purpose of completing courses for transfer to a 4-year
institution, students may want to capitalize on lower tuition rates at technical colleges. Students
who want to take only those courses that are transferrable, struggle with the specific program to
enter at the technical college. Some will select a program (usually an associate degree) that has
the courses they need for their intended major at their next institution; often times, available
general education courses drive that decision. Others may select a business degree major or are
encouraged to enter the Technical Communications Specialist certificate program which is
comprised of a large majority of degree level general education courses (V. Seals, personal
communication, March 20, 2013). Both programs allow for financial aid options, including
Georgia’s HOPE funding; whereas admission as a general education student, which is not a

95
program of study, does not make them eligible for financial aid. In the non-dual enrollment
group, 93 students (23.25%) enrolled in business or technical communications programs. This
could be an indicator of their choice to not complete at the technical college and transfer, instead,
to a 4-year institution for a higher credential.
The dual enrollment group had 30% more graduates than the non-dual enrolled group.
Three percent of the graduates obtained a credential higher than the one for which they enrolled,
while none of the non-dual credit students graduated at a higher level. The breakdown for the
non-dual enrolled group showed that about half graduated at the same program level in which
they entered, while the other half graduated with a lesser level credential. More than half of the
students in the dual enrolled subgroup graduated with the same or higher level credential than
indicated upon admission.
Research Question 2
Research has shown GPA to be a strong predictor of academic success and that the
strength of many subsequent academic variables can be attributable to first semester GPA.
Students who start out strong tend to improve their chances of further educational outcomes
(Gutierrez & Dantes, 2009). Dual enrollment proponents support the opinion that taking college
courses in high school will help better prepare students for the transition to and academic rigors
of higher education (Andrews, 2001; Bailey et al., 2002; Boswell, 2001, Crockett-Bell, 2010;
Edwards & Hughes, 2011; Farrell & Seifert, 2007; Hugo, 2001; Karp et al., 2007; Mokher &
McLendon, 2009; Smith, 2007; Welsh et al., 2005; Zeidenberg & Bailey, 2010). In this study,
dual enrollment was a significantly positive predictor of higher GPA at the end of students’ first
year at a technical college. This result coincides with studies conducted by Windham (1997),
Sherman Valentine (2010), and Karp et al. (2007) that also indicated the positive reltationship

96
between dual enrollment and college GPA. On one hand, these results are not surprising since
students demonstrated their motivation to achieve academically when they chose to take the dual
enrollment path in high school. However, it is also possible that completing dual enrollment
courses in high school provided students with a better awareness of and ability to meet the
academic demands of college-level coursework than students without this experience. This
finding could then be interpreted to support claims that dual enrollment improves students’
transition from high school to college.
Research Question 3
Aud et al. (2011) reported that persistence, or retention, of students at 2-year institutions
was approximately 58% for full-time students and 40% for part-time students. I found 50% of
first-year students also enrolled in courses the second year. Somewhat unexpectedly, that
number was greater for non-dually enrolled students (56%) and regression results also indicated
that they were more likely to be retained than dual enrolled students. Other researchers (Eimers
& Mullen, 2003; Sherman Valentine, 2010) found that dual enrollment was not a top predictive
factor of persistence for students. Instead, in this study, dual enrollment status appears to have
adversely affected students’ chances of persistence in the technical college system.
While this result is a bit surprising from the overall view that dual enrollment is a positive
influence on college persistence and success, there are other potential causes not considered.
Factors that influence a student’s decision to stay or leave an institution are wide-ranging and
numerous (Tinto, 2007). They can include institutional, personal, situational, and emotional
components not easily quantified or at all measured by this study. For example, the state-level
higher education system in Georgia does not adequately track student movement between
institutions in the different systems. Tracking that is done is conducted by a national agency and

97
is reported years later using limited national reporting data. Access to that information was not
available for the cohort in this study. It is possible that the educational motivation of dual
enrollment students drives them to seek higher degrees at university level institutions. If so,
students would not persist in 2-year programs but look to transfer to a 4-year program. In
contrast, non-dual enrollment students interested in completing a work-based program may have
been motivated to complete the program for obtaining employment. In addition, a handful
(n=13) of the dual enrolled students did graduate within three years, but were not retained Year
2. This could mean that they took a year off, but still managed to graduate in the 3-year time
frame. Therefore, persistence may have been adversely affected by movement between systems
or to private institutions and dual enrollment’s affect was not able to be measured.
Research Question 4
Obtaining a credential or graduating from a particular program of study is the goal of
most college students. However, 2-year colleges play a unique role in providing educational
opportunities for all and accommodating a wide range of student needs, desires, and goals; all of
which may not be met at those institutions (Horn, 2009). Nationally, 27% of first-time full-time
students complete a certificate or associate’s degree in 150% of the normal time (Aud et al.,
2011). In my study, only 13.88% of students studied earned a credential in 150% of the time,
which was a maximum of three years. While this number was slightly higher for students with
prior dual enrollment credit (15.75%), it still remains substantially below average.
In contrast to Sherman Valentine (2010) who found that dual enrollment students had
higher 4-year graduation rates and faster time-to-degree completion, I did not find the same
characteristics for this sample of 2-year college students. However, similar to Sherman
Valentine’s findings, a higher percentage of students with dual enrollment credit in this analysis

98
did graduate compared to those without dual enrollment credit. In addition, the dual enrollment
students graduated with the same or higher level credential than the one in which they enrolled.
Whereas, nearly half of the non-dual enrolled students graduated with a lesser level credential.
In the technical college system, programs often have embedded certificates that students
can obtain for multiple purposes. These can serve as early exit points from a program job-ready,
expanded specialization within the program area, or stepping stones to obtaining the program’s
highest level of a diploma or degree. Even though a majority of students were enrolled in
diploma-level programs, many of these students earned a lower credential within the three-year
period. Specifically, 80 of 111 graduates obtained a certificate, but only 34 of those 80 students
were actually enrolled in a certificate-level major. It is possible that the number of students
earning a credential in three years or less is either an early exit point for, or an embedded
certificate within, the degree- or diploma-level program in which they were enrolled. It could
also mean they would continue beyond the three year period to eventually obtain the higher
credential in which they enrolled.
The only variable that surfaced as a statistically significant predictor of graduation in
three years was full-time enrollment. While a larger number of dually enrolled students
graduated in three years, accounting for the loss of students in the cohort due to lack of
persistence in Year 2 may have affected the overall impact of this variable on academic success.
Once again, without knowing if completion of a technical college program was in fact the
students’ initial goal or, if obtaining a credential from an institution outside of this system was, a
true evaluation of the success of dual enrollment in predicting graduation cannot be achieved.
As with all dual enrollment studies, unobserved characteristics, such as students’ ability,
motivation, and true enrollment goals are not captured by achievement measures, but may be

99
correlated with dual enrollment program participation. The final goal for each student may not
always be accurately defined by the program they choose to enter. In Georgia, the cost of tuition
and the stipulations associated with available state assistance often drive the path of jumping
programs and institutions to obtain the “best bang for the buck.” These factors cannot be
adequately considered by the current data collected.
Implications for Dual Enrollment
This study did not determine definitively a positive or a negative impact for dual
enrollment on postsecondary outcomes. In reality, students still earn advanced credit that can
give them a head start in their college endeavors. That, in itself is a positive impact for students,
educational funding, and family finances. In this sample, dual enrollment did contribute to a
higher GPA for students their first year in college. This observation supports the argument that
dual enrollment prepares students for the rigors of college level course work, thereby creating a
more seamless transition to postsecondary education. Students who participate in dual
enrollment, especially in courses conducted on college campuses; do get unique exposure to
higher education. This certainly alleviates some of the foreign terms, unfamiliar requirements,
and unknown steps to enter and complete a higher education path supporting the transition from
one level to another. However, whether these same students would be just as successful without
having earned dual credit is still unknown.
While this study supports some of the claims of dual enrollment proponents, it is other
claims could not be validated. The results did not support the prospect that dual enrollment
might directly affected student retention and graduation by being a predictor for those measures
of academic achievement. The divided nature of two separate higher educational systems in
Georgia creates a more muddied avenue for students and a far less clear picture of results and

100
success as students attempt to find the path of least resistance and one financially viable for their
economic circumstances. In Georgia, lottery funds are dedicated for dual enrollment programs;
therefore, a more robust, adequate tracking system with attention to the final outcome for
students is imperative in appraising its value for the state. Given the desire for secondary
systems to maintain their budgeted source of funding for students in their schools, this could be a
deterrent for them to encourage participation in such dual enrollment programs where their
funding and headcount could be adversely affected. These factors appear problematic in
evaluating dual enrollment programs’ true fulfillment and value in Georgia.
The specific motivation for participating in dual enrollment at the technical college is an
unknown factor, also not yet sufficiently measured. Would these students be successful with or
without dual enrollment because of their own determination, family support, and/or high school
counselor encouragement? If all students participated in dual enrollment, would they all perform
at the same success rate? How well are Georgia’s dual enrollment opportunities shared and
emphasized with high school students and their parents, and does this impact participation and
outcome measurement? Is there a stigma associated with dual enrollment participation at the
technical colleges coupled with fewer dual enrollment options in the university system? Does
the availability of the HOPE grant and lower tuition at technical colleges persuade these students
to use these institutions as a stepping stone instead of a means for fulfilling their ultimate
educational goal? These unknown aspects could contribute significantly to measuring dual
enrollment’s impact on lives, education, and the economy.

101
Recommendations for Future Action
Further study is necessary to accurately evaluate the many factors that contribute to the
intended and perceived outcomes of dual enrollment. An intense assessment of dual enrollment
in Georgia should consider the following facets.
1. Create a system of seamless data to track students longitudinally from the start of their
secondary educational training, through any postsecondary education system, and into the
workforce. Identify and track actual student goals (transfer, program completion,
employment) at the onset of their postsecondary educational path for more accurate
measurement of attainment of those goals. This would help alleviate any impact of
institutional choices made to accommodate tuition cost savings.
2. Evaluate the dual enrollment concept, program options, and its implementation in
Georgia. Look at awareness and understanding of the vast array of dual enrollment
options by students, families, secondary guidance counselors, politicians, and the public.
Review marketing of dual enrollment options, assess buy-in by high school
administrators and systems, and research how well systems work together to promote and
offer dual enrollment opportunities, especially at technical colleges.
3. Study where, when, what, and if students chose to take their dual enrollment credit
further to assist with postsecondary endeavors.
a) Analyze the dual enrollment courses offered on college campuses versus those
offered at the high schools and their differences in rigor, preparation for college,
and assortment of course offerings.
102
b) Evaluate whether the dual enrollment credit earned was actually applicable and
contributive to the postsecondary path chosen by the student, program selected,
the credential obtained, and/or job attained in the workforce.
c) Assess the types of dual enrollment courses offered and their individual effect on
postsecondary achievement. Those courses offered and credit earned by students
should be evaluated in conjunction with the students’ postsecondary program
choices and goals. Technical course credit should be evaluated in direct
conjunction with postsecondary technical program achievement and job
placement. Conversely, dual credit earned in general education courses should be
evaluated differently in conjunction with any postsecondary work.
d) Measure whether dual enrollment participation predicts better outcomes for some
programs choices more than others.
4. Review the impact of increased enrollment in healthcare programs at technical colleges
and the effect of “holding zone” practices on competitive program entry, persistence,
credential attainment, measurement of educational achievement, as well as, effect of prior
dual enrollment credit earned.
5. Measure time to degree completion and job attainment for students who earned dual
enrollment credit. Use return on investment calculations to better evaluate dual
enrollment’s potential impact on job placement and, in turn, contribution to the economy
via student entrance into the workforce.

103
REFERENCES
Achieving the Dream. (2012). Completion by design framework. Supporting student success:
Preventing loss, creating momentum. Retrieved from
http://www.achievingthedream.org/sites/default/files/resources/CBD%20Framework%20
-%20Supporting%20Student%20Success.pdf
American Association of Community Colleges (AACC). (2011). Community college fast facts.
Retrieved from http://www.aacc.nche.edu/AboutCC/Documents/FactSheet2011.pdf
Andrews, H. A. (2000). Lessons learned from current state and national dual-credit programs.
New Directions for Community Colleges, 111, 31-39. doi:10.1002/cc.11104
Andrews, H. A. (2001). The dual credit phenomenon: Challenging secondary school students
across 50 states. Stillwater, OK: New Forum Press.
Andrews, H. A. (2004). Dual credit research outcomes for students. Community College Journal
of Research & Practice, 28(5), 415-422. doi:10.1080/1066892049044445
Annotated SPSS output. Logistic regression. (n.d.). UCLA: Statistical Consulting Group.
Retrieved from http://www.ats.ucla.edu/stat/spss/output/logit.htm
Annotated SPSS output. Ordered logistic regression. (n.d.). UCLA: Statistical Consulting
Group. Retrieved from http://www.ats.ucla.edu/stat/spss/output/ologit.htm
Arkansas State Department of Education. (2006). Business leader research. Preparedness of high
school seniors for entering the workforce. Little Rock, AK. Retrieved from http://proxy-
remote.galib.uga.edu/login?url=http://search.ebscohost.com/login.aspx?direct=true&db=
eric&AN=ED500211&site=eds-live

104
Aud, S., Hussar, W., Kena, G., Bianco, K., Frohlich, L., Kemp, J., & Tahan, K. (2011). The
condition of education 2011 (NCES 2011-033). Washington, DC: National Center for
Education Statistics.
Bailey, T. R., Hughes, K. L., & Karp, M. M. (2002). What role can dual enrollment programs
play in easing the transition between high school and postsecondary education? (ED-99-
CO-0160). Washington, DC: Office of Vocational and Adult Education.
Balfanz, R. (2009). Can the American high school become an avenue of advancement for all?
Future of Children. 19(1), 17-36.
Barge, J. D. (2011). Guidance for college credit now programs. Atlanta, GA: Georgia
Department of Education. Retrieved from http://www.gadoe.org/Curriculum-Instruction-
and-Assessment/CTAE/Documents/Guidance-For-Dual-Enrollment-FY12.pdf
Bewick, V., Cheek, L., & Ball, J. (2005). Statistics review 14: Logistic regression. Critical Care,
9(1), 112-118. doi:10.0086/cc3045
Boswell, K. (2001). State policy and postsecondary enrollment options: Creating seamless
systems. New Directions for Community Colleges, 113, 7-13. doi:10.1002/cc.3
Brand, B., & Lerner, J. B. (2006). The college ladder: Linking secondary and postsecondary
education for success for all students. Washington, DC: American Youth Policy Forum.
Carnevale, A. P., Smith, N., & Strohl, J. (2010). Help wanted: Projections of jobs and education
requirements through 2018. Washington, DC: Georgetown University Center on
Education and the Workforce.
Catron, R. K. (2001). Dual enrollment in Virginia. New Directions for Community Colleges, 113,
51-58. doi:10.1002/cc.8

105
College Board Advocacy & Policy Center. (2011). The college completion agenda:
Recommendation nine. Retrieved from
http://completionagenda.collegeboard.org/recommendations/9?quicktabs_1=1
College Board Advocacy & Policy Center. (2012). The completion arch: Measuring community
college student success. Retrieved from http://completionarch.collegeboard.org/
Committee on Measures of Student Success. (2011). A report to Secretary of Education Arne
Duncan. Retrieved from http://www2.ed.gov/about/bdscomm/list/cmss-committee-
report-final.pdf
Complete College America. (2011). Essential steps for states: Uniformly measure progress and
success. Retrieved from
http://www.completecollege.org/docs/CCA%20Essential%20Steps%20Common%20Mea
sures%20of%20Progress.pdf
Completion Matters. (2010). Postsecondary success: Learn and earn. Bill and Melinda Gates
Foundation. Retrieved from http://www.completionmatters.org/resource/postsecondary-
success-learn-and-earn-bill-and-melinda-gates-foundation
Council for Adult and Experiential Learning. (2009). Workforce and education strategies for
achieving national economic priorities: Adult education and workforce development
organizations recommendations for the U.S. Department of Education. Retrieved from
http://cael.org/pdfs/111_recstodolfromworkforceandadultedorgsfinal04150
Crawford, C., & Jervis, A. (2011). Community colleges today. Contemporary Issues in
Education Research, 4(8), 29-32.
Crockett-Bell, S. (2010). The dual credit program: Measuring the effectiveness on students'
transition from high school to college. Lexington, KY: Lambert Academic.

106
Cubberley, M. S. (2009). Advanced placement, international baccalaureate, and dual enrollment
programs: A seniors to sophomores primer. AURCO Journal, 15, 71-85.
D'Amico, M. M., Morgan, G. B., & Robertson, T. C. (2011). Student achievement in identified
workforce clusters: Understanding factors that influence student success. Community
College Journal of Research & Practice, 35, 773-790. doi:10.1080/10668920902813444
Duncan, A., & Dann-Messier, B. (2012). Scaling the community college summits: Challenges,
solutions, and commitments. Washington, DC: U.S. Department of Education Office of
Vocational and Adult Education. Retrieved from
http://www2.ed.gov/about/offices/list/ovae/pi/cclo/regional-summit-proceedings.pdf
Education Commission of the States. (2008). State notes: Dual enrollment. Retrieved from
http://mb2.ecs.org/reports/Report.aspx?id=950
Edwards, L., & Hughes, K. (2011). Dual enrollment for high school students. New York, NY:
Columbia University, Community College Research Center.
Eimers, M., & Mullen, R. (2003, May). Dual credit and advanced placement: Do they help
prepare students for success in college. Presented at the 43rd annual AIR Fall
Conference, Tampa, FL. Abstract retrieved from
https://uminfopoint.umsystem.edu/media/fa/planning/professional/DualCreditPaper_AIR.
Elder, G. H., Jr., Pavalko, E. K., & Clipp, E. C. (1993). Working with archival data: Studying
lives (Vol. 88). Newbury Park, CA: Sage.
Farrell, P. L., & Seifert, K. A. (2007). Lessons learned from a dual-enrollment partnership. New
Directions for Community Colleges, 139, 69-77. doi:10.1002/cc.294

107
Fike, D. S., & Fike, R. (2008). Predictors of first-year student retention in the community
college. Community College Review, 36(2), 68-88. doi:10.1177/0091552108320222
Fowler, M., & Luna, G. (2009). High school and college partnerships: Credit-based transition
programs. American Secondary Education, 38(1), 62-76.
Future workforce is ill-prepared, report says. (2006, December). In the loop. Professional Safety,
51(12), 6-6. Retrieved from http://proxy-
remote.galib.uga.edu/login?url=http://search.ebscohost.com/login.aspx?direct=true&db=
a9h&AN=23273317&site=ehost-live
Gall, M. D., Gall, J. P., & Borg, W. R. (2007). Educational research: An introduction (8th ed.).
Boston, MA: Pearson Education.
Gantt, A. J. (2010). Graduation rates of students in technical programs at an urban community
college. Community College Journal of Research and Practice, 34(3), 227-239.
doi:10.1080/10668920903504992
Governor’s Office of Student Achievement. (2010). 2009-2010 report card. State of Georgia.
Retrieved from
http://reportcard2010.gaosa.org/(S(p2zfov45zlp5ie45fetgb345))/k12/Indicators.aspX?ID=
ALL:ALL&TestKey=GradRate&TestType=indicators
Gutierrez, A., & Dantes, J. (2009). Practical model for the community college. Community
College Journal of Research & Practice, 33, 958-961. doi:10.1080/10668920903153261
Hardy, M. A. (1993). Regression with dummy variables (Vol. 93). Newbury Park, CA: Sage.
Harnish, D., & Lynch, R. L. (2005). Secondary to postsecondary technical education transitions:
An exploratory study of dual enrollment in Georgia. Career and Technical Education
Research, 30(3), 169-188. doi:10.5328/CTER30.3.169

108
Hirschy, A., Bremer, C., & Castellano, M. (2011). Career and technical education (CTE) student
success in community colleges: A conceptual model. Community College Review, 39(3),
296-318. doi:10.1177/0091552111416349
Hoffman, N., Vargas, J., & Santos, J. (2009). New directions for dual enrollment: Creating
stronger pathways from high school through college. New Directions for Community
Colleges, 145, 43-58. doi:10.1002/cc.354
Hooker, S., & Brand, B. (2010). College knowledge: A critical component of college and career
readiness. New Directions for Youth Development, 127, 75-85. doi:10.1002/yd.364
Horn, L. (2009). On track to complete? A taxonomy of beginning community college students
and their outcomes 3 years after enrolling: 2003-04 through 2006 (NCES 2009-152).
Washington, DC: U.S. Department of Education, National Center for Education
Statistics, Institute of Education Sciences.
Huberty, C. J. & Hussein, M. H.. (2001). Multiple regression analysis and multiple correlation
studies. In E. I. Farmer & J. W. Rojewski (Eds.), Research pathways: Writing
professional papers, theses and dissertations in workforce education (pp. 325-348). Blue
Ridge Summit, PA: University Press of America.
Huck, S. W. (2008). Reading statistics and research (5th ed.). Boston, MA: Pearson Education.
Hughes, J., Alexander, J., & Scheuch, K. (2009, July). Zoom: Dual enrollment participation,
2007-2008 (Edition 2009-03). Retrieved from the Florida Department of Education,
Florida College System at http://www.fldoe.org/cc/osas/evaluations/pdf/Zoom2009-
03.pdf
Hugo, E. B. (2001). Dual enrollment for underrepresented student populations. New Directions
for Community Colleges, 113, 67-72. doi:10.1002/cc.10

109
Jackson, R. (2012, April). 2012 leadership summit, April 24-26, 2012. Presented at the 2012
Leadership Summit meeting of the Technical College System of Georgia. Atlanta, GA.
Johnson, B., & Christensen, L. B. (2012). Educational research: Quantitative, qualitative, and
mixed approaches (4th ed.). Thousand Oaks, CA: Sage.
Jordan, T. C. (2001). Dual enrollment options: Columbus state community college model for
successful implementation. New Directions for Community Colleges, 113, 73-80.
doi:10.1002/cc.11
Jordan, W., Cavalluzzo, L., & Corallo, C. (2006). Community college and high school reform:
Lessons from five case studies. Community College Journal of Research & Practice, 30,
729-749. doi:10.1080/01411890500207530
Karp, M. M., & Jeong, D. W. (2008). Conducting research to answer your questions about dual
enrollment (ED-05-CO-0060). Washington, DC: U.S. Department of Education.
Karp, M. M., Calcagno, J. C., Hughes, K. L., Jeong, D. W., & Bailey, T. R. (2007). The
postsecondary achievement of participants in dual enrollment: An analysis of student
outcomes in two states. New York, NY: Columbia University, Community College
Research Center.
Kim, J., Kirby, C., & Bragg, D. (2006). Dual credit: Then and now. Champaign, IL: University
of Illinois at Urbana Champaign, Office of Community College Research and
Leadership. Retrieved from http://occrl.illinois.edu/files/InBrief/Brief-spring-06.pdf
Kleiner, B., & Lewis, L. (2005). Dual enrollment of high school students at postsecondary
institutions: 2002–03 (NCES 2005–008). Washington, DC: U.S. Department of
Education, National Center for Education Statistics. Retrieved from http://proxy-

110
remote.galib.uga.edu/login?url=http://search.ebscohost.com/login.aspx?direct=true&db=
eric&AN=ED484632&site=ehost-live
Kluwin, T. N., & Morris, C. S. (2006). Lost in a giant database: The potentials and pitfalls of
secondary analysis for deal education. American Annals of the Deaf, 161(2), 121-128.
doi:10.1353/aad.2006.0028
Krueger, C. (2006, March). Dual enrollment: Policy issues confronting state policymakers
[Policy Brief]. Denver, CO: Education Commission of the States. Retrieved from
http://www.ecs.org/clearinghouse/67/87/6787.pdf
Kruger, P. E. (2001). Determining appropriate sample size. In E. I. Farmer & J. W. Rojewski
(Eds.), Research pathways: Writing professional papers, theses and dissertations in
workforce education (pp. 247-258). Blue Ridge Summit, PA: University Press of
America.
Lewis, T. (2001). Designing quantitative research. In E. I. Farmer & J. W. Rojewski (Eds.),
Research pathways: Writing professional papers, theses and dissertations in workforce
education (pp. 175-199). Blue Ridge Summit, PA: University Press of America.
Marshall, R. P., & Andrews, H. A. (2002). Dual-credit outcomes: A second visit. Community
College Journal of Research & Practice, 26, 237-242.
doi:10.1080/106689202317245437
Menard, S. W. (2002). Applied logistic regression analysis (2nd ed., Vol. 106). Thousand Oaks,
CA: Sage.
Mokher, C. G., & McLendon, M. K. (2009). Uniting secondary and postsecondary education: An
event history analysis of state adoption of dual enrollment policies. American Journal of
Education, 115(2), 249-277. doi:10.1086/595668

111
Moore, D. S. (2007). The basic practice of statistics (4th ed.). New York, NY: W. H. Freeman.
O'Connor, K. B., & Justice, M. C. (2008). Evaluating dual credit enrollment at selected rural
northeast Texas high schools. Southeastern Teacher Education Journal, 1(1), 27-34.
Perna, L. W., & Thomas, S. L. (2008). Theoretical perspectives on student success:
Understanding the contributions of the disciplines [Monograph]. ASHE Higher Education
Report, 34(1), 1-87.
Phillippe, K. A., & Sullivan, L. G. (2005). National profile of community colleges: Trends and
statistics (4th ed.). Washington, DC: American Association of Community Colleges,
Community College Press.
Porchea, S. F., Allen, J., Robbins, S., & Phelps, R. P. (2010). Predictors of long-term enrollment
and degree outcomes for community college students: Integrating academic,
psychosocial, socio-demographic, and situational factors. Journal of Higher Education,
81(6), 680-708. doi:10.2307/40929572
Portney, L. G., & Watkins, M. P. (2009). Foundations of clinical research: Applications to
practice (3rd ed.). Upper Saddle River, NJ: Pearson Education.
Reisberg, L. (1998). Some professors question programs that allow high-school students to earn
college credits. Chronicle of Higher Education, 44(42), A39-A40.
Reyna, R. (2010). Complete to compete: Common college completion metrics: National
Governors Association Chair’s initiative. Retrieved from
http://www.nga.org/files/live/sites/NGA/files/pdf/1007COMMONCOLLEGEMETRICS.

112
Rosenbaum, J. E. (2001). High schools' role in college and workforce preparation: Do college-
for-all policies make high school irrelevant? Spotlight on student success. Philadelphia,
PA: Mid-Atlantic Lab for Student Success.
Rothwell, J., & Berube, A. (2011). Education, demand and unemployment in metropolitan
America. Metropolitan Policy Program at Brookings. Retrieved from
http://www.brookings.edu/~/media/Files/rc/papers/2011/0909_skills_unemployment_roth
well/0909_skills_unemployment_rothwell.pdf
Rucket, J., & Wilkins, J. (2011). WANTED: 600,000 skilled workers for manufacturing industry,
according to Deloitte and the Manufacturing Institute Survey. Boiling point? The skills
gap in U.S. manufacturing. Deloitte Services. The Manufacturing Institute. Retrieved
from
http://www.deloitte.com/view/en_US/us/press/ac4fa3e2f7213310VgnVCM3000001c56f0
0aRCRD.htm
Schroeder, L. D., Sjoquist, D. L., & Stephan, P. E. (1986). Understanding regression analysis:
An introductory guide (Vol. 57). Newbury Park, CA: Sage.
Sherman Valentine, A. N. (2010). Dual enrollment and advanced placement programs: A
comparison of persistence, student academic achievement, graduation completion and
time-to-degree attainment. (Doctoral Dissertation, Indiana University of Pennsylvania).
Retrieved from http://proxy-
remote.galib.uga.edu/login?url=http://search.ebscohost.com/login.aspx?direct=true&db=
psyh&AN=2010-99231-197&site=eds-live
Smith, D. (2007). Why expand dual-credit programs? Community College Journal of Research
& Practice, 31, 371-387. doi:10.1080/10668920600932884

113
Sparks, E., Waits, M., & National Governors Association. (2011). Degrees for what jobs?
Raising expectations for universities and colleges in a global economy. Washington, DC:
NGA Center for Best Practices. Retrieved from
http://www.nga.org/files/live/sites/NGA/files/pdf/1103DEGREESJOBS.PDF
Speroni, C. (2011). High school dual enrollment programs: Are we fast-tracking students too
fast? (NCPR working paper). Retrieved from National Center for Postsecondary
Research at
http://www.postsecondaryresearch.org/i/a/document/Speroni_NCPR_DualEnrollment_Re
gressionDiscontinuity.pdf
Stacey, G. W. (2011, December). Dual enrollment has large benefits for students but rigor and
location are critical, new studies find [Press release]. Retrieved from National Center for
Postsecondary Research at
http://www.postsecondaryresearch.org/i/a/document/DE_press_release.pdf
Statistical computing seminar. Proc logistic and logistic regression models. (n.d.). UCLA:
Statistical Consulting Group. Retrieved from
http://www.ats.ucla.edu/stat/sas/seminars/sas_logist/logistic1.htm
SunGard Higher Education. (2011). Banner student. Retrieved from
http://www.sungardhe.com/Solutions/Banner-Student/
Technical College System of Georgia (TCSG). (2003). End of year enrollment report, FY2003
[Data report]. Retrieved from Data, Planning and Research/Data Center at
https://kms.tcsg.edu/DPR/ReportsResearch/SystemSum.aspx
114
Technical College System of Georgia (TCSG). (2009). End of year enrollment report, FY2009
[Data report]. Retrieved from Data, Planning and Research/Data Center at
https://kms.tcsg.edu/DPR/ReportsResearch/SystemSum.aspx
Technical College System of Georgia (TCSG). (2010a). End of quarter enrollment report, Fall
2009, Term 201002 [Data report]. Retrieved from Data, Planning and Research/Data
Center at https://kms.tcsg.edu/DPR/ReportsResearch/SystemSum.aspx
Technical College System of Georgia (TCSG). (2010b). End of year enrollment report, FY2010
[Data report]. Retrieved from Data, Planning and Research/Data Center at
https://kms.tcsg.edu/DPR/ReportsResearch/SystemSum.aspx
Technical College System of Georgia (TCSG). (2011a). Data elements manual [Data file and
code book]. Retrieved from the Data Center of the Office of Data, Planning, and
Research at https://kms.tcsg.edu/DPR/AppSupport/RefMaterials.aspx
Technical College System of Georgia (TCSG). (2011b). End of year enrollment report, FY2011
[Data report]. Retrieved from Data, Planning and Research/Data Center at
https://kms.tcsg.edu/DPR/ReportsResearch/SystemSum.aspx
Technical College System of Georgia (TCSG). (2011c). General program standards. Retrieved
from http://www.dtae.org/teched/standards/general.html
Technical College System of Georgia (TCSG). (2011d). Knowledge management system.
Retrieved from https://kms.tcsg.edu/DPR/ReportsResearch/SystemSum.aspx
Technical College System of Georgia (TCSG). (2013). Dual credit. Retrieved from
https://tcsg.edu/fordualcredit.php#articulate

115
Tinto, V. (2007). Research and practice of student retention: What next? Journal of College
Student Retention: Research, Theory & Practice, 8(1), 1-19. doi:10.2190/4YNU-4TMB-
22DJ-AN4W
U.S. Bureau of Labor Statistics. (2012). Labor force statistics from the current population
survey. Retrieved from http://data.bls.gov/timeseries/LNS14000000
U.S. Census Bureau, Current Population Survey, 2010 Annual Social and Economic Supplement.
(2010). Educational attainment of the population 18 years and over, by age, sex, race,
and Hispanic origin. Retrieved from
http://www.census.gov/hhes/socdemo/education/data/cps/2010/tables.html
Vandal, B. (2009). Revving the education engine. Denver, CO: Education Commission of the
States. Retrieved from http://www.ecs.org/docs/RevvingEdEngine.pdf
Venezia, A., Kirst, M., & Antonio, A. (2003). Betraying the college dream. The Bridge Project.
Stanford Institute for Higher Education. Retrieved from Stanford University at
http://www.stanford.edu/group/bridgeproject/betrayingthecollegedream.pdf
Voluntary Framework of Accountability. (2012). Community college measures of effectiveness.
American Association of Community Colleges. Retrieved from
http://www.aacc.nche.edu/Resources/aaccprograms/VFAWeb/Documents/VFABrochure
%20LowResolution.pdf
Warner, P. (2008). Ordinal logistic regression. Journal of Family Planning & Reproductive
Health Care, 34, 169-170. doi:10.1783/147118908784734945
Welsh, J. F., Brake, N., & Choi, N. (2005). Student participation and performance in dual-credit
courses in a reform environment. Community College Journal of Research & Practice,
29, 199-213. doi:10.1080/10668920590901158

116
Windham, P. (1997). High school and community college dual enrollment: Issues of rigor and
transferability. Retrieved from ERIC database. (ED 413 936) at
http://www.eric.ed.gov/ERICWebPortal/search/recordDetails.jsp?ERICExtSearch_Searc
hValue_0=ED413936&searchtype=keyword&ERICExtSearch_SearchType_0=no&_pag
eLabel=RecordDetails&accno=ED413936&_nfls=false&source=ae
Zeidenberg, M., & Bailey, T. (2010). Human resource development and career and technical
education in American community colleges. New York, NY: Columbia University,
Community College Research Center.