Embed Size (px)
Citation preview
The Role of Human Capital in China’s Total Factor Productivity Growth: A cross-province analysis
Zheng WEI* and Rui HAO **
*Corresponding author Nottingham University Business School, The University of Nottingham Ningbo China 199 Taikang East Road, Ningbo, 315100, China Tel.: +86 (0)574 88180330 Fax: +86 (0)574 88180125 Email: [email protected] **Institute for Advanced Study (IAS) Shenzhen University, Shenzhen, China; China Economics and Management Academy (CEMA) Central University of Finance and Economics, Beijing, China Email: [email protected]
Abstract This paper studies the role of human capital in China’s provincial total factor productivity growth over 1985-2004. We adopt the stochastic frontier approach to measure productivity growth of Chinese provinces in terms of the Malmquist TFP index, and then assess the relationship between productivity growth and human capital. When measuring human capital, we particularly focus on the composition of human capital, represented by enrollment rates at various levels of schooling, as well as education quality. After controlling for endogeneity, we find that human capital has significant and positive effects on total factor productivity growth of Chinese provinces. However, when education quality is incorporated, productivity growth appears to be significantly enhanced by quality improvements in primary education only. We also find that regional impacts of human capital differ at various levels of schooling. In the eastern region of China, productivity growth is significantly attributed to secondary education. TFP growth in the central region is mainly promoted by primary and university education. Yet in the western region, primary education plays the most prominent role.
Keywords: Human capital, Total factor productivity growth, China
JEL classification: J24, O47, O16

The Role of Human Capital in China’s Total Factor Productivity Growth:
A cross-province analysis
1. Introduction The role of human capital1 in promoting total factor productivity (TFP) growth has been strongly supported by many economic theories. Nelson and Phelps (1966) argued that human capital can promote TFP growth by facilitating technology spillover. Romer (1990a, 1990b) and Aghion and Howitt (1998) contended that human capital can enhance productivity growth through accelerating domestic technological innovations. In the empirical literature, however, the impact of human capital on TFP growth is found to be mixed. Some studies reported a significant and positive estimated coefficient for human capital in the regressions of TFP growth (e.g. Fleisher and Chen, 1997; Vandenbussche et al., 2006; Fleisher et al., 2008), while others found a significantly negative estimated coefficient for human capital (e.g. Pritchett, 2001). Many reasons may give rise to these divergent results. Among them, the most widely addressed reasons include the endogeneity of human capital (Bils and Klenow, 2000; Krueger and Lindahl, 2001) and the inadequate measure of human capital particularly through neglecting human capital quality (Hanushek and Kimko, 2000; Bosworth and Collins, 2003). The difficulty of measuring TFP growth may also reinforce the ambiguity of the empirical evidence. Conventionally, TFP growth is measured by either growth accounting or time trend. As widely established, these measurements of TFP growth suffer greatly from many drawbacks2 (e.g. Knight and Sabot, 1987; Felipe, 1999; Lau and Park, 2003). Alternatively, TFP growth can be measured in terms of the Malmquist TFP index using the production frontier analysis (Färe et al., 1994; Fu et al., 1999; Wu, 2000; Hao, 2007; Wu, 2008). This measurement of TFP growth does not only get away from the drawbacks of conventional methods but also take account of technical efficiency change, which is an important component of TFP growth especially for developing countries. In this paper, we assess the relation between TFP growth and human capital in the case of the Chinese economy. Since the 1978 Economic Reform, the Chinese economy has experienced unprecedented growth. Human capital in terms of education has experienced remarkable changes both quantitatively and qualitatively. China’s human capital has accumulated at a rapid pace. The illiteracy rate of the Chinese population has largely ameliorated from 52 percent in 1964 to 9.31 percent in 2006, though the gender gap still persists, with 4.87 percent for male illiteracy and 13.72 percent for female. More Chinese people tend to pursue higher education. According to the National Bureau of Statistics (NBS) of China (2007), the number 1 In general, human capital may affect economic growth through three channels. It can accumulate as an input factor (e.g. Lucas, 1988; Mankiw et al., 1992), or attract physical capital investment (e.g. Benhabib and Spiegel, 1994; Chi, 2008), or enhance total factor productivity growth (e.g. Benhabib and Spiegel, 1994; Islam, 1995). In this paper, however, we narrow our focus on the impact of human capital on TFP growth, which is one of the hot-debated topics in recent studies. 2 For example, TFP growth measured by growth accounting is not able to be distinguished from residuals of estimation. TFP growth measured by time trend is subject to the specification of the production function. Both measures implicitly presume that all production units are fully efficient in production. These are discussed in detail in Section 3.

of students enrolled in secondary schools increased from 26.98 million to 27.94 million over 1978-2006, while that for universities rose from 0.4 million to 5.46 million. Meanwhile, TFP has substantially increased in the post-reform China. According to the World Bank (1997), China’s TFP growth was around 4.3 percent per annum, contributing to 52.4 percent of GDP growth over 1978-1995. Whether China’s rapid TFP growth is correlated with its improved human capital is an interesting topic to study. In this paper, we adopt the production frontier analysis to measure TFP growth in China. We then empirically assess the relation between China’s TFP growth and human capital by taking into account human capital quality and controlling for the possible endogeneity of human capital. Compared with the existing studies (e.g. Fleisher and Chen, 1997; Fleisher et al., 2008), our paper has four distinct features. First, inspired by the production frontier analysis, we measure TFP growth using the Malmquist TFP index based on the estimated results from the stochastic frontier approach (SFA). Second, in addition to the aggregate measure of human capital, namely average years of schooling which is applied in most studies, we particularly focus on human capital composition and its effect on TFP growth. We measure human capital composition by enrolment rates at three levels of schooling, including primary school, secondary school and university. Third, in addition to its quantity, we take into account human capital quality. The quality of aggregate human capital is measured by the share of government expenditure on education and the share of government expenditure on culture, education, science and public health. Teacher-student ratios at the three levels of schooling are used to proxy for the quality of human capital composition. Fourth, we also explore the distinct impacts of human capital components on TFP growth in China’s three geographic regions, namely the eastern, central and western regions. This may help deliver important policy implications for promoting China’s regional productivity growth in the future. Our empirical study is based on panel data for 30 Chinese provinces in 1985-2004. We apply the fixed-effects model to account for the unobserved province specific effects and take lagged values of explanatory variables to control for possible endogeneity. Using the aggregate measure of human capital in estimations, we find that human capital is positively and significantly related to TFP growth. This result does not change when human capital is measured by enrolment rates at primary and secondary schools and universities. When education quality is taken into account, productivity growth is still significantly attributable to three levels of school enrolments but insignificantly to quality changes in secondary and university education. It appears that only quality improvements in primary education have significantly growth-enhancing effects on TFP growth. Moreover, when investigating the regional impact of human capital components, we find that TFP growth in the eastern region is mainly attributed to secondary education; productivity growth in the central region is significantly associated with primary and university education, whereas primary education has its most significant and largest contribution to productivity growth in China’s western region. The paper is organized as follows. Section 2 previews China’s TFP growth and human capital changes in the post-reform period. Section 3 briefly reviews the relevant literature on the

effect of human capital on China’s TFP growth. Section 4 discusses the measure of China’s TFP growth rates, after providing some theoretical backgrounds for SFA and the Malmquist TFP index. Section 5 presents the empirical model specification and the data, and also discusses the estimation results in detail. Section 6 concludes the paper. 2. China’s TFP growth and human capital Since the 1978 economic reform, China’s TFP growth has been significantly improved. According to Chow (1993) and Chow and Li (2002), China’s TFP growth has risen to 2.6 percent per year in 1978-1998 in contrast to zero in the pre-reform period. The remarkable increase in TFP growth has greatly contributed to China’s economic growth. Using traditional growth accounting, the World Bank (1997) reported that China’s TFP grew at 4.3 percent per annum and contributed to 52.4 percent of GDP growth during the period 1978-1995. Wang and Yao (2003) measured TFP growth by traditional growth accounting, in which human capital represented by years of schooling is included. They found that TFP growth was 2.41 percent over 1978-1999, accounting for 25.4 percent of GDP growth in China. Islam et al. (2006) applied the dual approach to growth accounting. They reported that China’s TFP growth rate was around 2.95 percent per annum during 1978-2002 and accounted for 31.5 percent of GDP growth. Studies using the frontier analysis also report substantial improvements in China’s TFP growth. For example, Wu (2008) estimated a translog production function using SFA. He found that 26.61 percent of Chinese GDP growth was attributed to TFP growth, which grew at 2.94 percent per annum during 1993-2004. Henderson et al. (2005) applied the Data Envelopment Analysis to study the sources of China’s economic growth in 1978-2000. They found that the spurt in China’s labor productivity was attributable to technological change by 5.5 percent and efficiency improvement by 19.7 percent, in addition to the main driving force of physical capital accumulation. There are also pessimistic estimates of TFP growth in the literature. For example, Young (2003) reports a 1.4 percent of TFP growth in China, after making laborious adjustments on the data. Another skeptical voice is by Woo (1998), who argues that the net TFP growth rate in 1979-1993 ranges from 1.1 to 1.3 percent per annum. In sum, both the optimistic and pessimistic estimates show that TFP growth has increased in the post-reform period. Moreover, China’s TFP growth has contributed a substantially larger share to its economic growth than any other countries like South Korea and Japan in 1960-1993 (Liu, 2000). During the process of rapid economic development, China’s human capital accumulates at an increasing speed. This is particularly evident in higher educational attainment. Figure 1 plots the total number of student enrolled in primary school, secondary school and at university. Obviously, the number of student enrolled in universities increases steadily and rises dramatically particularly after 2000. This is due mainly to the implementation of the education reform which called for a large expansion in student enrolments in universities. As a result, universities enrolments increased from 1.14 million in 1980, to 5.56 million in 2000 and 17.38 million in 2006. Secondary school enrolments declined temporarily at the start of

economic transition. This might relate to the shutdown of some unqualified rural secondary schools (Emily et al., 2008). Since 1997, the number of students enrolled in secondary schools has started to rise. Nevertheless, primary school enrolments are found to decline especially after 1997. (Figure 1 here) Figure 2 shows the number of graduates at different levels of schooling. Similar patterns are observed. The number of students graduating from universities soared from 0.16 million in 1978 to 3.78 million in 2006. Secondary school graduates increased from 23.8 million to 27.9 million over 1978-2006. Primary school graduates decreased from 22.88 million in 1978 to 19.60 million in 1997 and 19.28 million in 2006. (Figure 2 here) The quality of education is such an important aspect of human capital that it cannot be neglected. It can be represented by input-based measures such as the teacher-student3 ratio, the qualification of teachers, per-pupil expenditures, and government expenditure on education. Alternatively, it can be represented by output-based measures, for example, national assessment of student achievements. This type of measures are generally regarded to be more effective and accurate (Hanushek and Kimko, 2000) than input-based quality measures. Unfortunately, the data for these measures are not available. Thereby, we have to rely on the input-based measures, including the teacher-student ratio and government expenditure on education, to display changes in China’s education quality in the post-reform period. (Figure 3 here) As Figure 3 shows, the teacher-student ratio of primary schools rose from 0.03 in 1978 to 0.05 in 2006. For secondary schools, it increased modestly from 0.05 to 0.06; whereas for universities, it decreased dramatically from 0.24 to 0.06 in 1978-2006. The teacher-student ratio reflects the number of teachers per student. Its increment may indicate improvements in education quality. Thus, increases in teacher-student ratios of China’s primary and secondary schools may imply improvements in their education quality. On the contrary, declines in the teacher-student ratio at Chinese universities imply the decreasing number of teachers relative to the expanding student enrollment particularly since the end of 1990s. In this sense, it might indicate quality declines of university education. (Figure 4 here)
3 In most human capital studies, for example, Barro (1991), the student-teacher ratio is used to proxy for education quality. It represents the average size of classes. It is negatively related to education quality and its increase indicates the possible decline in education quality. In this paper, however, we represent education quality by the teacher-student ratio, which has the same indication as the student-teacher ratio but is positively related to education quality. When including this ratio, the estimation results become more intuitive to interpret.

As shown in Figure 4, no matter in nominal or real terms, government expenditure on culture, education, science and public health and government appropriation for education have increased rapidly and continuously since the reform in 1978. In 1995, the Chinese government spent about 141.2 billion RMB Yuan on education, which accounts for 2.5 percent of GDP (Heckman, 2005). In 2005, government appropriation for education amounted to 516.1 billion and government expenditure on culture, education, science and public health reached 610.4 billion. (Table 1 here) Although the level of government investment in education has risen substantially, the share of government in total education expenditure has declined over time. As shown in Table 1, the total education expenditure increased dramatically especially after 2000. Nonetheless, the share of government appropriation for education has significantly declined from 84 percent to 61 percent in 1992-2005. In contrast, the share of tuition and miscellaneous fees has increased dramatically. In 2005, it amounted to 18.4 percent of total education expenditure. The increased education expenditure aggravates individual’s responsibility for education and may give rise to inequality in access to education, especially for children in poor rural areas and descendants of rural-urban migrants. 3. Literature review The theoretical literature suggests that human capital enhances total factor productivity growth. Human capital affects TFP growth by facilitating the adoption and implementation of new technology developed exogenously (Nelson and Phelps, 1966), and/or by promoting the domestic production of technological innovations (Romer, 1990a, 1990b; Aghion and Howitt, 1998). However, the significantly positive relation between human capital and TFP growth receives mixed evidence from empirical studies. For example, Benhabib and Spiegel (1994) specify a model in which human capital determinates a country’s ability to innovate and catch up with advanced technologies. They empirically examine this model using cross-country growth accounting regressions and find a positive effect of human capital in promoting TFP growth. Vandenbussche et al. (2006) provide empirical evidence showing that skilled human capital tends to have a higher growth-enhancing effect in countries closer to the technological frontier. Miller and Upadhyay (2000) highlight the role of human capital in determining the level of TFP, particularly in outward-oriented countries. Nonetheless, the study by Pritchett (2001) strongly questions the role of human capital in productivity growth and economic growth. His estimation results show a large and significantly negative impact of human capital on TFP growth. Many studies have examined the impact of human capital on China’s TFP growth, while mixed results are observed. For example, using China’s provincial-level data in 1978-1993, Fleisher and Chen (1997) estimate the effect of human capital on the level or growth rate of TFP, measured by growth accounting. After controlling for the possible endogeneity of human capital, they still find a positive and significant impact of human capital on the TFP level and
growth rate. Fleisher et al. (2008) also report the evidence of positive effects of human capital on TFP growth. They apply the model by Benhabib and Spiegel (1994) to estimate the effect of human capital on China’s TFP growth over 1988-2003. Their results show that human capital has positive and significant effects on technology spillover and a positive, albeit not always significant, effects on technological innovation. Nevertheless, Wei et al. (2001) include FDI, trade, R & D and human capital to represent technological progress in growth equations. They find that human capital have positive but insignificant effects on technological progress. The mixed empirical evidence may be due to many possible reasons. For example, it may be attributed to measurement errors in the international education dataset (Krueger and Lindahl, 2001; Bosworth and Collins, 2003) or the disturbance made by influential outliers in the dataset (Temple and Voth, 1998; Temple, 1999). Nevertheless, as strongly addressed in many studies (e.g. Bils and Klenow, 2000), the endogeneity of human capital may seriously bias the estimation results. The quantitative measures of human capital alone also give rise to misleading results (Beharman and Birdsall, 1983; Hanushek and Kimko, 2000; Wobmann, 2003). In addition, the ambiguity of the empirical evidence may relate to difficulties in measuring TFP growth. In existing studies of human capital, TFP growth is either measured by growth accounting or measured as a time trend in the estimated production function. The growth accounting measure of TFP growth is criticized for being subject to many restrictions, such as the specific form of the production function, constant returns to scale, and Hicks neutrality of technological progress (Lau and Park, 2003). Moreover, the measured TFP growth is merely a mechanical residual. It is neither distinguishable from measurement errors nor subject to tests of statistical hypotheses (Easterly and Levine, 2001). Nonetheless, in many studies, TFP growth is measured by taking the time differential of the estimated production function. Thus, the measure of TFP growth is not subject to the restrictions of growth accounting. However, it is criticized for neglecting technical efficiency change, which is argued to be the most relevant component of changes in TFP growth especially for developing countries (Nishimizu and Page, 1982; Färe et al., 1994; Felipe, 1999). An alternative approach to measure TFP growth is the frontier analysis with the Malmquist TFP index. The frontier analysis is not subject to the restrictive assumptions in growth accounting or time trend. It is more flexible in the selection of the production function, returns to scales, technology neutrality, and the distribution of the technical inefficiency term. TFP growth, represented in terms of the Malmquist index, does not only take account of technological progress but also technical efficiency change. In addition, the parametric frontier analysis, SFA, is also good at dealing with measurement errors in the dataset, which often occur in statistical data of developing countries (Coelli et al., 1997, p.219). In short, the mixed empirical evidence on China’s human capital and TFP growth may be due to many possible reasons. Although the endogeneity of human capital has been controlled for to some extent in a few studies, no special attention has been paid to the quality of human

capital. Nor has the measurement issue of TFP growth been addressed. To fill in the gaps, in this paper, we revisit the relationship between China’s TFP growth and human capital by measuring TFP growth by SFA and the Malmquist index, taking into account the quality of human capital, and controlling for the possible endogeneity of human capital. 4. Measure China’s TFP growth 4.1 Stochastic Frontier Approach and the Malmquist TFP index The most widely applied frontier analysis 4 is the output-oriented Stochastic Frontier Approach (SFA). It is independently proposed by Aigner, Lovell and Schmidt (1977) and Meeusen and van den Broeck (1977). The basic idea of SFA is that there is an unobserved best-practice production frontier corresponding to the set of maximum attainable output levels for a given combination of inputs. Production often occurs below the best-practice production frontier due to the presence of technical inefficiency. Following this idea, the stochastic frontier production model takes the form of (1) ln yi = xi
’ β + vi - ui , where i=1, 2, 3, …, N. in which yis are outputs; xis are vectors of explanatory variables; vis are independently and identically distributed normal random variables with zero mean and constant variance; and uis are identically and independently distributed non-negative random variables used to capture technical inefficiency, following a certain distribution such as the half-normal, truncated-normal, or even exponential distributions. Technical efficiency (TEi) is measured as the ratio of observed output to the corresponding stochastic frontier output. It measures the difference in the observed output of the firm relative to the output produced by a fully efficient firm using the same amount of inputs. It can be predicted by the following equation (2) TEi = yi / exp(xi
’ β + vi) = exp(xi’ β + vi - ui) / exp(xi
’ β + vi) = exp( - ui) The measured technical efficiency takes the value between zero and one. The closer the observed point is to the frontier, the higher is the technical efficiency of that firm. In panel data, the stochastic frontier model by Aigner, Lovell and Schmidt (1977) is written as (3) ln yit = xit
’ β + vit - uit , where i=1, 2, 3, …, N; t= 1, 2, 3, …, T. All variables have the same definitions and notations as in Equation (1) except that the time dimension, denoted by a subscript “t”, is included. The prediction of technical efficiency change is the same as before, (4) TEi = E [exp( - ui)|eit] , where eit = vit - uit To represent changes in TFP, we opt to use the Malmquist index. The Malmquist TFP index does not only take into account the technological change, represented by shifts of the frontier, but also the technical efficiency change, represented by shifts towards the frontier. Technically, it measures changes in TFP between two observed points as a ratio of the distance functions of each point relative to a common technology. When the distance functions are measured by
4 The content of this subsection is largely based on Coelli et al. (2005).
the stochastic frontier production model, the efficiency change index for firm i is the ratio of the observed technical efficiency in time period t to that in time s, that is, (5) TĖi = TEit / TEis The technical change index for firm i between period s and period t is computed by the geometric mean of two partial time derivatives of the production function, that is
(6) TṖ i = [(1+Əln yit /Ət ) ⋅ ( 1+Əln yis /Əs )]1/2
The product of these two indices gives the Malmquist TFP index, showing the TFP change between period s and period t, that is,
(7) Malmquist TFP indexi = TĖi ⋅ TṖ i = TEit / TEis ⋅ [(1+Əln yit /Ət )⋅ ( 1+Əln yis /Əs )]1/2
Note that a value of the Malmquist TFP index larger than one signifies improvements in TFP; a value equal to one implies the stagnation of TFP; while a value less than one indicates declines in TFP. 4.2 Specification of estimation and the Data We start by estimating the stochastic frontier production model in a translog form and then choose the most appropriate specification of the frontier production function using the Likelihood Ratio (LR) test. The use of the translog form of the production function has many advantages. The translog production function is not subject to the assumptions restricting the Cobb-Douglas production function, such as fixed returns to scale and unity elasticity of substitution (Coelli et al., 1997, p.35). It also allows the marginal rate of technical substitution to vary with time (Coelli et al, 2005, p.213). In other words, it allows for the existence of the non-Hicks neutral technology. The panel data version of the translog stochastic frontier production function is defined as: (8) ln Yit = β0 + βK lnKit + βL lnLit + 1/2 βKK (lnKit)2 + 1/2 βLL (lnLit)2 + βKL lnKit lnLit
+ βKt lnKit t + βLt lnLit t + βt t + βtt t2 + vit - uit in which Y, K, L and t are output, capital, labor and time trend respectively. We impose constant returns to scale5 (CRS) upon the production technology by assuming (9) βK + βL =1, βKt + βLt =0, βKK + βKL =0, βKL + βLL =0 Substituting Equation (9) into Equation (8), we have (10) ln Yit = β0 + βK lnKit + 1/2 βKK (lnKit)2 + βKt lnKit t + βt t + βtt t2 + vit - uit where y is output per unit of labor and k is capital per unit of labor. Following Battese and Coelli (1992), we specify the inefficiency term uit to be time varying and take the form of 5 It is important to impose this assumption of CRS on the estimated technology that is used to calculate the Malmquist TFP index. Otherwise, the measured TFP growth may be biased in the case of variable returns to scales (Grifell-Tatje and Lovell, 1995; Coelli et al., 1997). Nevertheless, recent research suggests that scale changes may also be taken into account using Diewert’s quadratic identity to derive the Malmquist TFP decomposition (e.g. Orea, 2002). Here, for simplicity, we do not account for scale changes but simply impose the CRS assumption on the technology.
(11) uit = exp [η (t-T)]⋅ ui where uit is assumed to be an identically and independently distributed generalized truncated-normal random variable, and η is an unknown scale of parameters to be estimated. If η=0, the inefficiency effects model becomes time-invariant. The data used for estimation covers 30 Chinese provinces in the period 1978-2005. Output is measured by real GDP per worker deflated by the implicit deflators provided by the National Bureau of Statistics of China (NBS). The labor force is measured as the number of employed workers. The provincial stock of physical capital is calculated in two steps. First, following Young (2000), we divide the provincial real investment in 1952 by 10 percent as our initial capital stock. Since our initial capital stock is estimated far from our sample period, the importance of its starting value is diminished over time due to depreciation. Second, we use the perpetual inventory method based on the equation Ki,t=Ii,t + Ki,t-1 (1-δ), where Ki,t and Ki,t-1 denote the capital stock at time period t and t-1 respectively, Ii,t is the real investment in fixed assets in time period t, and δ is the depreciation rate of capital. The real investment is calculated by deflating the gross fixed capital formation by the implicit investment deflators (1952-1995) and the price index of investment (1996-2005). The depreciation rate is assumed to be 9.6 percent according to Zhang et al. (2004). We opt to use the Maximum Likelihood (ML) estimator for its desirable properties. First, it is asymptotically efficient (Coelli et al., 2005, p.218). Moreover, in the ML estimator, the inefficiency effects and the regressors are assumed to be independent. This is consistent with our assumptions on the inefficiency term uit. Furthermore, rather than the traditional panel data estimators and all other corrected ordinary least squares methods, the ML estimator assumes that the most efficient firms have a greater influence on the shape of the estimated production frontier (Coelli et al., 2005, p.203). 4.3 Analysis of estimation results The estimation results are reported in Table 2. We run five regressions by the ML estimator. The column “Reg 1” shows the estimation results of the translog frontier production function as specified in equation (10) and equation (11). The columns “Reg 2”-“Reg 5”, show the results when certain variables are excluded from the specification of regression 1. Firstly, we test for the existence of technical inefficiency effects by the Likelihood Ratio (LR) test. The hypotheses of the test are specified as H0 : γ =0 against H1 : γ > 0 , with γ = σu
2 / (σu2 + σv
2), 0 ≤ γ ≤1. If the null hypothesis cannot be rejected, the technical inefficiency effects do not exist and the traditional average response function is an adequate representation of the data. Otherwise, the rejection of the null hypothesis indicates the presence of technical inefficiency effects, which lead production to deviate from the production frontier. Our results show that the null hypothesis can be rejected at the 1 percent level in all regressions. This implies the presence of technical inefficiency effects. Moreover, the estimated γ =0.882 with t-stat of 81.54 in regression 2 is significantly different from 1. This indicates that the stochastic frontier model

is significantly different from the deterministic frontier model in which no random errors are included. Therefore, deviations from the frontier are due to technical inefficiency effects and stochastic noise. (Table 2 here) Secondly, we select the appropriate model specification using the LR test. In regression 1, none of the estimated coefficients are significant. Once the variable of (lnk)2 is excluded6, all estimates are very significant at the 5 percent level in regression 2. The LR test of regression 3 against regression 2 indicates that the technical change is non-monotonic, captured by a significant time-squared variable. The LR test of regression 4 shows that the technology is non-neutral, indicated by a significant product of the time trend and capital variable. It also implies that the Cobb-Douglas form is inappropriate for the estimated production function. In regression 5, we assume the inefficiency effect follows the half-normal distribution with a zero mean, namely μ =0. However, the LR test against regression 2 indicates that the truncated-normal distribution of uit in regression 2 is an adequate representation of the data. In sum, we find that regression 2 gives the most appropriate representation of the data. The estimation results displayed in regression 2, show that GDP per worker is positively and significantly related to capital per worker, the time trend, and their product. The estimated coefficient of the time trend squared is negative and significant, implying that technological changes contribute to income at a diminishing rate. The estimated time differential is (0.022+0.007lnk-2*0.0002t). The estimated elasticity of capital per worker is (0.319+0.007*t). The significant estimated coefficient for η indicates that technical inefficiency effects are time-varying. 4.4 China’s TFP growth in 1979-2005 Based on the estimation results of the stochastic frontier function, we measure China’s TFP growth rates in 1979-2005 by the Malmquist TFP index. The detailed cumulative indices of TFP growth, technical efficiency change and technological change at the national level are reported in Appendix 1. Figure 5 presents the annual change in China’s TFP and its components at the national level. Both the Malmquist TFP index and its two component indices are larger than one, indicating improvements in China’s TFP, technological change and technical efficiency change. In 1979-2005, the average annual growth rate of TFP is approximately 4 percent in China. This finding falls to the range reported in most of the literature and is much closer to the figure reported by the World Bank (1997). Technological progress grows at around 3.5 percent per annum, while technical efficiency change is only around 0.7 percent per annum. Moreover, technical efficiency change is improved at a diminishing rate over time, indicated by a slightly declining slope of the curve. The decline in technical efficiency improvement is very trivial in 6 If we differentiate lny with respect to lnk and let it equal zero, we have 0.301+ 2*0.054*lnk*-0.009*t=0. As t falls between [1, 28], lnk* lies between [-2.704, -0.454]. As the value of lnk exceeds that of lnk*, it appears to be reasonable to exclude (lnk)2.

a range of -0.01 to -0.007 percent per annum but it reflects that economic reform has to some extent overemphasized technological progress at the cost of achieving technical efficiency improvements7. (Figure 5 here) Figure 6 illustrates the TFP index in the eastern, central and western regions of China. All values of the indices are always larger than one, implying that three regions experience remarkable improvements in their TFP. The coastal region has experienced the most rapid and largest TFP growth, driven mainly by its significant technological progress. TFP of the central region has a very similar pattern as that at the national level. In the western region, TFP grows at a decreasing growth rate and then starts increasing substantially at the end of the 1990s with the implementation of the West Development Strategy. (Figure 6 here) In sum, China’s TFP has experienced substantial growth since the Economic Reform. The acceleration in TFP is due mainly to the rapid increase in technological progress. Technical efficiency has improved but at a diminishing rate over time. In the next section, we empirically investigate the impact of human capital on measured TFP growth in China. 5. Estimate the role of human capital in TFP growth 5.1 Model specification, variables and data Using panel data for 30 Chinese provinces in the period 1985-2004, we investigate the relationship between human capital and productivity growth in China. The econometric model is specified as follows:
(12) TFṖi, t = α0 + α1 H i , t-1 + α2 X i, t-1 + θ i + ε i, t
where t and i denote the time period and province respectively, and ε is the random error
distributed identically and independently. The dependent variable, denoted by TFṖ, is the
growth rate of TFP. It is represented by the natural logarithm of the measured Malmquist TFP index. The explanatory variables are defined as follows: (a) H is a vector of human capital variables, which are our main variables of interest. It is represented either in the aggregate or by its composition. In addition, compatible measures of human capital quality are also included. (b) X is a vector of other control variables that may affect TFP growth. It includes foreign direct investment (FDI), the degree of openness (Openness) and a proxy for infrastructure (Transport). FDI is measured as the ratio of foreign direct investment to real GDP deflated at
7 Wu (2000) obtains similar results using SFA. He explains that China’s economic reform has resulted in significant improvements in technical efficiency as discussed in many studies like Borensztein and Ostry (1996). Nevertheless, the potential in efficiency improvement was almost exhausted by the 1990s and then gave way to the development of new technology.

1995 prices. Openness is measured as the ratio of the sum of exports and imports to real GDP deflated at 1995 constant prices. Infrastructure is represented in terms of transportation, measured by the railway, road and inland navigable water network length per square kilometers. (c) θ is used to capture the unobserved province specific effects. We use one-period lagged values of human capital variables to control for the possible endogeneity running from TFP growth to human capital variables. We apply the same procedure to other control variables to deal with the possible reverse causality from productivity growth. FDI is argued to be strongly endogenous, since FDI tends to earn higher returns in locations with higher TFP (Li and Liu, 2005). We thereby follow Fleisher et al. (2008) and use the two-period lagged values of FDI in estimations to mitigate this effect. This lagged procedure is to some degree an appropriate way to handle the endogeneity issue, as the lagged values of variables are measured before TFP growth has occurred. We restrict our attention to estimations using the fixed-effects model. It is because the omitted individual effects, for example, province-specific geographic factors, are mostly likely to be correlated with other regressors such as FDI and openness in the case of China. Note that we do not include capital variables as in Fleisher et al. (2008) and Fleisher and Chen (1997). This is because the TFP growth rate we measured includes changes in the technical efficiency term, which has been assumed to be independently identically distributed and uncorrelated with explanatory variables. If capital variables had been included as determinants of TFP growth, the orthogonal assumption of the technical efficiency term would no longer have been valid. The measurement of our main variables of interest, namely, the human capital variables deserves some detailed explanation. The aggregate measure of human capital is often represented by the average years of schooling per capita, denoted as “schooling”. To calculate years of schooling, we use the perpetual inventory method. This method, initially proposed by Barro and Lee (2001), has been widely applied to measure the average years of schooling in the Chinese case (e.g. Démurger, 2001; Wang and Yao, 2003; Liu and Li, 2006). We follow Démurger (2001) and measure years of schooling accumulated at three broad levels of schooling, namely, the primary, secondary (comprising junior secondary, senior secondary and specialized secondary) and university education. The calculation is carried out in two steps. First, we calculate the respective human capital stock accumulated at three schooling levels using the perpetual inventory method specified as follows: H j, i, t = Grad j, i, t + (1- δ i, t) H j, i, t
where H j, i, t is the number of accumulated graduates who have completed at least level j of schooling in province i at time t; Grad j, i, t is the annual number of net graduates with schooling at level j in province i at time t; δ i, t is the depreciation rate represented by the mortality rate of the population; j denotes the level of schooling, specifically, j=1 indicating primary education, j=2 secondary education, and j=3 university education. To obtain the initial values of accumulated human capital stock, we use the data from the 1982 population census that is carried out by sampling 1‰ of the population in 28 provinces.

The initial values of human capital stock at the three schooling levels (H0,i,t) are defined as: H 1, i, 0 = Pri i, 0 + Sec i, 0 + Uni i, 0
H 2, i, 0 = Sec i, 0 + Uni i, 0
H 3, i, 0 = Uni i, 0
in which Pri i,0 , Sec i,0 and Uni i,0 are the initial values of the number of graduates from the respective levels of schooling. They are derived through multiplying the 1‰ sampling number of people who have completed their primary, secondary and university education in province i by the total population in that province in 1982, Popi, 0. The second step is to take the weighted average of the accumulated human capital stock at different levels of schooling. The weights are usually defined as the length of respective schooling cycles. Following Demurger (2001), we assign the weights for primary, secondary and university schoolings at 5, 10 and 14.5 years respectively. After dividing by the total population Pop i, t, we obtain the aggregate stock of human capital per capita, specified as Schooling i, t = (5 H 1, i, t + 10 H 2, i, t +14.5 H 3, i, t) / Pop i, t To measure the composition of human capital, we employ the rates of enrolment to primary school, secondary school and university, denoted as “pri_enrol”, “sec_enrol” and “uni_enrol” respectively. The enrolment rate at a specific level of education is often used to measure human capital in the literature (e.g. Barro, 1991; Mankiw et al., 1992; Chen and Fleisher, 1996). Note that the enrolment rates we applied here are different from the standard enrolment ratios. The standard enrolment rate is usually defined as the total number of students enrolled in a given level of schooling divided by the number of children in the official age range for that level of schooling (Emily et al., 2008). However, in China, the data for the number of people in the official age range for that level of schooling is not available for a continuous time period. To provide a consistent data series for school enrolment rates over a long time period, we opt to calculate the enrolment rate by dividing the total number of students enrolled in a given level of schooling by the total population. This way of calculating China’s enrolment rates is often seen in the literature (e.g. Chen and Fleisher, 1996; Wei et al., 2001; Chi, 2008). Compared to the standard enrolment rate, our computed school enrolment rates may underestimate the actual enrolment rates because of dividing by a large denominator. Nevertheless, this is largely restricted by data unavailability. The inclusion of enrolment rates at all three levels of schooling may help alleviate the underestimation problem to some extent. Moreover, as pointed by many studies such as Wobmann (2003) and Hanushek and Kimko (2000), however, the standard enrolment rate may not accurately reflect changes in the human capital stock, especially during the rapid demographic transition. However, our computed enrolment rates may get away from this problem, since the denominator used, namely the total population, is relatively less affected by the demographic transition that is driven by fertility declines and thereby results in substantial falls mainly in the young dependents. In addition to quantitative measures, we also introduce quality measures of human capital. The quality of aggregate human capital is measured by the share of education expenditure in
local government fiscal expenditure, denoted as “ed_exp”, or by the share of expenditure on culture, education, science and health in local government general budgetary expenditure, denoted as “culture_exp”. We measure the quality of human capital components by teacher-student ratios at different education levels, denoted as “pri_teas”, “sec_teas” and “uni_teas” respectively. Increases in teacher-student ratios indicate improvements in education quality which may promote TFP growth. Hence, the teacher-student ratio is expected to be positively related to TFP growth. Also note that the quality measures applied here are input-based. It would be interesting to also apply output-based measures of education quality like national assessments of student achievement to our estimations. Unfortunately, these data are not available cross all provinces and over time. Furthermore, we introduce an alternative measure of education quality at the three levels of schooling, that is, interaction terms between enrolment rates and teacher-student ratios. They are denoted as “pri_enrol*pri_stea”, “sec_enrol*sec_stea” and “uni_enrol*uni_stea” respectively. The use of interactions may help alleviate possible multi-collinearities among enrolment rates and teacher-student ratios at three levels of education. Thus, we can capture the effects on TFP growth made by both changes in education quantity, represented by enrolment rates, and changes in education quality, represented by interaction terms. Note that the signs of estimated interactions are expected to be as positive as the teacher-student ratio does in estimations. Our data are mainly sourced from the Comprehensive Statistical Data and Materials on 55 Years of New China (NBS, 2005) and China Statistical Yearbooks (NBS, various issues). The sample period, 1985-2004, is largely constrained by data availability of FDI, which only becomes available from 1985. The sample size differs with human capital variables applied in the estimations. When human capital is measured by years of schooling, the sample size covers only 28 provinces, excluding Tibet and Hainan provinces. For estimations using enrolment rates, the sample includes 30 Chinese provinces. In either case, the data for Chongqing, which has become a municipal city since 1997, have been combined into those for the Sichuan province. The data for the Hong Kong and Macao Special Administrative Regions and the Taiwan province are not included in our study. Definitions of variables and descriptive statistics are displayed in Appendix 2. 5.2 The impact of aggregate human capital on TFP growth We start by estimating the impact of aggregate human capital, represented by years of schooling, on China’s TFP growth using panel data for 28 Chinese provinces in 1985-2004. The estimation results are reported in Table 3. The incremental F-test suggests the OLS estimates displayed in column (1) are biased due to neglect of province specific effects. Instead, the fixed-effects models are preferred, as shown in columns (2), (3) and (4). In column (2), the average years of schooling have a significant and positive impact on TFP growth, though the magnitudes are rather small. The results suggest that an extra year of schooling can increase TFP growth by 0.1 percent on average.
(Table 3 here) In columns (3) and (4), we further introduce quality measures of aggregate human capital into the regressions, represented by the share of education expenditure and the share of culture expenditure respectively. However, both estimated coefficients for the quality of aggregate human capital are negative, though statistically insignificant. This may be due to two reasons. First, the negative estimated coefficients on education quality may relate to the declining role of government in education investment. As we have shown in Figure 4 and Table 1, the share of government expenditure on education has been declining over time, although the level has increased. Increased tuition fees and miscellaneous fees largely aggravate individual’s education expenses. This may lower school enrolment rates or raise dropout rates especially in poor regions. It may also undermine the quality of education because of insufficient funding and quality control. In this sense, the negative estimates may indicate that TFP growth is adversely, albeit insignificantly, affected by the decline in human capital quality. Second, measuring human capital quality is difficult and controversial. As argued in many studies (e.g. Hanushek and Kimko, 2000), education expenditure may not be an adequate proxy for the quality of human capital. For other controls, the estimated coefficients are all positive and significant as expected. FDI acts as an important factor in promoting technology diffusion in China. It provides China with needed capital and helps alleviate unemployment pressure. More importantly, FDI brings forward advanced machines, equipment and better managerial skills. The technology diffusion brought by FDI has benefited a wide spectrum of Chinese industries, from labor-intensive clothing and toy making to technology-intensive pharmaceuticals and electronics manufacture (Liu, 2000). Not only have domestic partners received benefits from FDI but also domestic firms through technology imitation and learning. Openness to international trade is an important means of facilitating technology creation and transfer. It promotes across-the-board learning in product design, facilitates technology diffusion and imitation, and helps generate technological innovations (Wei et al., 2001). In addition, it increases international competition and spurs technical efficiency improvements. Infrastructure can promote productivity growth by reducing the delivery costs of new equipment and machines and also by facilitating the rapid diffusion of advanced technology. 5.3 The impact of human capital composition on TFP growth Estimations using years of schooling reveal the aggregate impact of human capital on productivity growth, whereas the respective effects of human capital composition are not distinguishable. In this section, we examine their respective impact by including enrolment rates at different levels of schooling in estimations. The results are reported in Table 4. Again, the large F-statistics are in favor of the fixed-effects model. In column (2), three levels of schooling are found to have significantly positive impacts on productivity growth. The magnitude of their contributions increases with the level of schooling. University education, the highest level of schooling, has the largest impact on TFP growth. All other control variables remain significant and positive.
(Table 4 here) However, the inclusion of quantitative measures of education alone may generate misleading information (Behrman and Birdsall, 1983). We further include education quality measures, represented by teacher-student ratios, in the estimations. The results are reported in column (3). The estimates of the three levels of school enrolment rates are still positive and significant at the 5 percent level. Nevertheless, the ranking of their contributions change. Specifically, the primary enrolment rate has a larger and more significant estimated coefficient, whereas the estimated coefficients for the secondary and university enrolments are smaller and less significant. Moreover, the estimated coefficients for teacher-student ratios are positive and significant for primary and secondary schools. This indicates that improvements in primary and secondary education quality have significantly enhanced China’s TFP growth. Unexpectedly, the estimated coefficient for the university teacher-student ratio is found to be significantly negative. Similar results are observed in Barro (1991). He includes enrolment rates and student-teacher ratios at primary and secondary schools in convergence regressions. His estimation results show a negative and significant estimate for primary school student-teacher ratios while a positive albeit insignificant estimate for secondary school student-teacher ratios. We conjecture that the unexpected result is to a large extent attributable to multi-collinearity that may occur to teacher-student ratios at the three levels of schooling. For example, the teacher-student ratio for universities is significantly correlated with that for primary and secondary schools by 0.933 and 0.970 respectively. As a rule of thumb, multi-collinearity is likely to occur when the correlation coefficient of explanatory variables is higher than 0.9 (Asteriou, 2006, p.96). As a consequence of multi-collinearity, estimates may be biased, t-statistics may be wrong, and the signs of estimated coefficients may even turn to be the opposite of those expected. Alternatively, we can capture education quality by interaction terms, which appear to have lower correlations8 and thereby are less likely to result in multi-collinearity. The estimation results are displayed in column (4) of Table 4. We find that the three levels of school enrolments are still positive and significant as in column (2); quality improvements in primary education have significantly enhancing effects on productivity growth, while the effects of quality changes in secondary and university education appears to be insignificant. These may relate to the decreasing number of teachers relative to the enlarging number of students enrolled particularly in universities, as shown in Figure 3. Furthermore, to address the possible endogeneity of human capital, we employ the instrumental variable and fixed effects estimator (IV-FE). We use the lagged values of explanatory variables to instrument their levels. The results are displayed in columns (5) and (6). Results of the Sargan test suggest the validity of instruments. The null hypothesis of variable exogeneity in the Wu-Hausman test can be rejected at the 1 percent level in both columns. This confirms our preceding presumption that human capital variables and other
8 Multicollinearity does not seem to exist among interaction terms between enrolment rates and teacher-student ratios. The correlation coefficients for the three interactions are 0.880, 0.303, and 0.552 respectively.
controls are likely to be endogenous. The estimation results are similar to those in columns (2) and (4), suggesting that our findings are robust to different estimation methods. In short, the results we obtained from different estimation methods are consistent with each other. We find that China’s TFP growth has been significantly promoted by increases in enrolment rates at all levels of schooling, among which university education has the largest role. However, when education quality is controlled for, TFP growth is still significantly driven by all levels of school enrolments but insignificantly affected by quality changes in secondary and university education. 5.4 Regional impact of human capital composition on TFP growth As suggested by Vandenbussche et al. (2006), human capital composition may have different impacts on TFP growth in economies at different levels of development. It is generally recognized that the three regions of China are roughly distinguished as three levels of economic development. The eastern region has grown more rapidly and is better developed than the other two regions, while the western region has been lagged far behind due largely to its disadvantaged geographic location. Human capital composition may have different effects on TFP growth in these three regions. We examine the regional impact of human capital composition by splitting the sample according to three regions. The results are reported in Table 5. (Table 5 here) As shown in columns (1), (4) and (7) in which enrolment rates are included in estimations, TFP growth in the eastern region is largely driven by secondary and university education. In the central region, it is mainly driven by university education and marginally driven by secondary education. In the western region, TFP growth is promoted by primary and university education. Moreover, a cross-region comparison shows that secondary education has the largest and most significant role in promoting eastern regional productivity growth. University education has the largest and most significant role in the central region; whereas the estimated coefficient for primary education is the largest and most significant in the western region. For other controls, FDI enhances productivity growth mainly in the eastern and central regions. Exposure to international trade has a significant impact on eastern regional productivity growth. Infrastructure benefits TFP growth in all regions of China. We then introduce education quality, represented by the interaction terms, in the estimation. The results are shown in columns (2), (3), (5), (6), (8) and (9). We find that when education quality is controlled for, productivity growth in the eastern region is only significantly affected by secondary education via both enrolment rates and quality. In contrast to column (1), university education loses its significance owning to its decreasing teacher-student ratios. The results are robust to the alternative estimator, IV-FE. In the central region, primary and university education significantly contribute to TFP growth, both quantitatively and qualitatively. However, secondary education is found to have negative and significant

estimated coefficients for its enrolment rates and education quality. Even after controlling for the possible endogeneity by the instrumental variable, we find that secondary education quality is still significantly negative, albeit enrolment rates become insignificant. This is hard to interpret. In the western region, the estimated coefficients, by the fixed-effects estimator, for all three levels of schooling enrolments and quality are significant and positive, as shown in column (8). Nonetheless, the magnitude of estimated coefficient for university enrolments is surprisingly large. After correcting it by the instrumental variable estimator, we find that the abnormally large coefficient for university enrolments disappears and becomes insignificant. However, TFP growth in the western region turns to be significantly attributed to enrolment expansion and quality improvements of primary education only. The aforementioned results about the regional effects of human capital on TFP growth are summarized in Table 6. In general, we find that human capital composition affects productivity growth differently with respect to the three regions of China. TFP growth of the eastern region benefits mostly from secondary education, while in the central region, productivity growth is significantly attributable to primary and university education. Primary education has significantly enhancing effects on productivity growth of the western region. This finding appears to be roughly in line with those by Vandenbussche et al. (2006). They argue that TFP growth in developed economies is mainly attributable to skilled human capital, while in less developed economies, it is largely driven by unskilled human capital. (Table 6 here) Note that despite the compelling results we obtain, our interpretation is highly tentative, especially given the unsatisfied Sargan test of over-identification and the Wu-Hausman test of variable exogeneity in the IV-FE estimations of the central and western regions. Also note that our human capital measures do not take into account vast amounts of internal labor migration which may substantially affect our investigated regional impacts of human capital on TFP growth. For instance, rapid economic growth of the eastern region has attracted a large amount of rural migrants who may only have secondary education. However, this caveat is hard to be filled due largely to the shortage of time-consistent data for inter-provincial labor migration. In sum, our estimated results, despite tentative, yield interesting findings for the regional effects of human capital on productivity growth, whereas they should be carefully evaluated and qualitatively justified. 6. Conclusion and recommendations In this paper, we empirically investigate the role of human capital, especially the role of human capital composition in China’s TFP growth over 1985-2004. We firstly generate measures of productivity growth for China using the Malmquist TFP index based on the production frontier estimation. We then assess the relationship between human capital and TFP growth by taking into account the quality of human capital and controlling for the possible endogeneity. Our results show that human capital has a significant and positive impact on China’s TFP growth. Increases in student enrolments at all levels of schooling
significantly contribute to the overall productivity growth. However, when education quality is controlled for, productivity growth is still attributable to three levels of school enrolment rates but is only significantly affected by quality improvements in primary education. The regional impact on TFP growth is different with various levels of schooling. Secondary education significantly enhances productivity growth in the eastern region, while TFP growth in the central region is mainly promoted by primary and university education; while primary education plays a pivotal role in promoting TFP growth in the western region. Our empirical study delivers some tentative policy suggestions. Firstly, to continue enhancing productivity growth, China should further improve its educational attainment at all levels of schooling. Secondly, more teachers particularly at universities should be trained and employed so as to increase the teacher-student ratio and improve education quality. Thirdly, the government should increase educational expenditure to ameliorate inequality in the access to education. Finally, primary education should be largely implemented and invested particularly in the western region. This could make the most of the largest contribution of primary education to productivity growth and may also help alleviate China’s regional income inequality.
Acknowledgements
We would like to thank Professor Shujie Yao, Professor Somnath Sen, Professor Anindya
Banerjee and Professor John Fender and Dr. Marco Ercolani for helpful comments.
References Aigner, Dennis. J.; C. A. Knox Lovell; and Peter Schmidt. 1977. “Formulation and estimation of stochastic frontier production function models.” Journal of Econometrics 6, no. 1: 21-37. Aghion, Philippe, and Peter Howitt. 1998. Endogenous Growth Theory. Cambridge, MA: MIT Press. Barro, Robert J. 1991. “Economic growth in a cross section of countries.” Quarterly Journal of Economics 106: 407-44. Barro, Robert J., and Jong-Wha Lee. 2001. “International data on educational attainment: Updates and implications.” Oxford Economic Papers 53, no. 3: 541-563. Battese, George E., and Timothy J. Coelli. 1992. “Frontier production functions, technical efficiency and panel data: With application to paddy farmers in India.” Journal of Productivity Analysis 3, no. 1-2: 153-169. Behrman, Jere R., and Nancy Birdsall. 1983. “The quality of schooling: quantity alone is misleading.” American Economic Review 73, no. 5: 928-946. Benhabib, Jess, and Mark M. Spiegel. 1994. “The role of human capital in economic
development: Evidence from aggregate cross-country data.” Journal of Monetary Economics 34: 143-173. Bils, Mark, and Peter J. Klenow. 2000. “Does schooling cause growth?” American Economic Review 90, no. 5: 1160-1183. Borensztein, Eduardo, and Jonathan D. Ostry. 1996. “Accounting for China's Growth Performance.” American Economic Review 3, no. 1: 34 -56. Bosworth, Barry P., and Susan M. Collins. 2003. “The empirics of growth: An update.” Brookings Papers on Economic Activity 2: 113-179. Chen, Jian, and Belton M. Fleisher. 1996. “Regional Income Inequality and Economic Growth in China.” Journal of Comparative Economics 22, no. 2: 141—164. Chow, Gregory C. 1993. “Capital formation and economic growth in China.” Quarterly Journal of Economics 108, no. 3: 809-842. Chow, Gregory C. and Kui-Wai Li. 2002. “China’s economic growth: 1952-2010.” Economic Development and Cultural Change 51, no. 1: 247-256. Coelli, Timothy J.; D. S. Prasada Rao; and George E. Battese. 1997. An Introduction to Efficiency and Productivity Analysis, Kluwer Academic Publishers. Coelli, Timothy J.; D. S. Prasada Rao; Christopher J. O'Donnell; and George E. Battese. 2005. An Introduction to Efficiency and Productivity Analysis, 2nd ed., Springer, New York. Démurger, Sylvie. 2001. “Infrastructure development and economic growth: An explanation for regional disparities in China?” Journal of Comparative Economics 29, no. 1: 95-117. Easterly, William, and Ross Levine. 2001. “It's not factor accumulation: Stylized facts and growth models.” World Bank Economic Review 15, no. 2: 177-219. Emily, C. Hannum; Jere Behrman; Meiyan Wang; and Jihong Liu. 2008. “Education in the reform era. In China's Great Economic Transformation.” ed. Loren Brandt and Thomas G. Rawski. Cambridge University Press. Emily, C. Hannum, and Meiyan Wang. 2006. “Geography and educational inequality in China.” China Economic Review 17, no. 3: 253-265. Färe, Rolf; Shawna Grosskopf; Mary Norris; and Zhongyang Zhang. 1994. “Productivity growth, technical progress, and efficiency change in industrialized countries.” American Economic Review 84, no. 1: 66-83. Felipe, Jesus. 1999. “Total Factor Productivity growth in East Asia: A critical survey.” Journal of Development Studies 35, no. 4: 1-41. Fleisher, Belton; Haizheng Li; and Minqiang Zhao. 2008. “Human capital, economic growth, and regional inequality in China.” IZA Discussion Paper No. 3576, Bonn, Germany. Fleisher, Belton, and Jian Chen. 1997. “The coast-noncoast income gap, productivity, and regional economic policy in China.” Journal of Comparative Economics 25, no. 2: 220-236. Tsu-Tan Fu; Cliff J. Huang; and C. A. Know Lovell. 1999. Economic efficiency and productivity growth in the Asia-Pacific region. Cheltenham: Edward Elgar. Grifell-Tatje, Emili, and C. A. Know Lovell. 1995. “A note on the Malmquist productivity index.” Economics Letters 47: 169-175. Sylviane Guillaumont Jeanneney; Ping Hua; and Zhicheng Liang. 2006. “Financial Development, Economic Efficiency, And Productivity Growth: Evidence From China.” The Developing Economies, Institute of Developing Economies 44, no. 1: pp. 27-52. Hanushek, Eric A., and Dennis D. Kimko. 2000. “Schooling, labor-force quality, and the growth
of nations.” American Economic Review 90, no. 5: 1184-1208. Hao, Rui. 2007. “Efficience technique, croissance économique et égalité régionale en Chine: Une approche de frontières stochastiques.” L’Actualité économique 83, no. 3 : 297-320. Heckman, James J. 2005. “China's human capital investment.” China Economic Review 16, no. 1: 50-70. Henderson, Daniel J., and Robert R. Russell. 2005. “Human capital and convergence: A production-frontier approach.” International Economic Review 46, no. 4: 1167-1205. Islam, Nazrul; Erbiao Dai; and Hiroshi Sakamoto. 2006. “Role of TFP in China's growth.” Asian Economic Journal 20, no. 2: 127-159. Kodde, David A., and Franz C. Palm. 1986. “Wald Criteria for Jointly Testing Equality and Inequality Restrictions.” Econometrica 54: 1243-1249. Krueger, Alan B., and Michael Lindahl. 2001. “Education for growth: Why and for whom?” Journal of Economic Literature 39, no. 4: 1101-1136. Knight, John B., and Richard H. Sabot. (1987). Educational policy and labor productivity: An output accounting exercise, Economic Journal, 97, pp.199-214. Lau, Lawrence J., and Jungsoo Park. 2003. “The sources of East Asian economic growth revisited.” Paper presented at the Conference on International and Development Economics in Honor Henry Y. Wan, Jr., Cornell University, Ithaca, September 6-7, 2003. Li, Xiaoying, and Xiaming Liu. 2005. “Foreign Direct Investment and Economic Growth: An Increasingly Endogenous Relationship.” World Development 33, no. 3: 393-407. Liu, Tung, and Kui-Wai Li. 2006. “Disparity in factor contributions between coastal and inner provinces in post-reform China.” China Economic Review 17, no. 4: 449-470. Liu, Zhiqiang. 2000. “The nature of china’s economic growth in the past two decades.” Post-Communist Economies 12, no. 2: 201-214. Mankiw, N. Gregory; David Romer; and David N. Weil. 1992. “A contribution to the empirics of economic growth.” Quarterly Journal of Economics 107, no. 2: 407-37. Miller, Stephen M., and Mukti Upadhyay. 2000. “The effects of openness, trade orientation, and human capital on total factor productivity.” Journal of Development Economics 63, no.2: 399-423. Meeusen, Wim, and Julien van den Broeck. 1977. “Efficiency estimation from Cobb-Douglas production functions with composed error.” International Economic Review 18, no. 2: 435-444. National Bureau of Statistics of China. various issues. China Statistical Yearbook. Beijing: China Statistical Press. National Bureau of Statistics of China. 2005. Comprehensive Statistical Data and Materials on 55 years of New China, Beijing: China Statistics Press. Nelson, Richard R., and Edmond S. Phelps. 1966. “Investment in humans, technological diffusion, and economic growth.” American Economic Review 56, no. 2: 69-75. Nishimizu, Mieko, and John Page. 1982. “Total factor productivity growth, technological progress and technical efficiency change: Dimensions of productivity change in Yugoslavia, 1965–1978.” Economic Journal 92: 920–936. Pritchett, Lant. 2001. “Where has all the education gone?” The World Bank Economic Review 15, no. 3: 367-391. Orea, Luis. (2002). “Parametric decomposition of a generalized Malmquist productivity

index.” Journal of Productivity Analysis 18: 5-22. Romer, Paul M. 1990a. “Endogenous Technological Change.” Journal of Political Economy 98, no. 5: S71-102. Romer, Paul M. 1990b. “Human capital and growth: theory and evidence.” Carnegie Rochester Conference Series on Public Policy 32, no. 1: 251-86. Temple, Jonathan R.W. 1999. “A positive effect of human capital on growth.” Economics Letters, 65, no. 1: 131-134. Temple, Jonathan .R.W., and Hans-Joachim Voth. 1998. “Human capital, equipment investment, and industrialization.” European Economic Review 42, no. 7: 1343-1362. Vandenbussche, Jérôme; Philippe Aghion; and Costas Meghir. 2006. “Growth, distance to frontier and composition of human capital.” Journal of Economic Growth 11, no. 2: 97-127. Wang, Yan, and Yudong Yao. 2003. “Sources of China's economic growth 1952–1999: Incorporating human capital accumulation.” China Economic Review 14, no. 1: 32-52. Wei, Yingqi; Xiaming Liu; Haiyan Song; and Peter Romilly. 2001. “Endogenous Innovation Growth Theory and Regional Income Convergence in China.” Journal of International Development 13, no. 2: 153-168. Wobmann, Ludger. 2003. “Specifying human capital.” Journal of Economic Surveys 17, no. 3: 239-270. Woo, Wing T. 1998. “Chinese economic growth: Sources and prospects.” In The Chinese Economy, ed. Michel Fouquin and Françoise Lemoine, Economica. Word Bank. 1997. China 2020: Development Challenges in the New Century. Washington. D.C: The World Bank, Washington. Wu, Yanrui. 2000. “Is China’s economic growth sustainable? A productivity analysis.” China Economic Review 11, no. 3: 278-296. Wu, Yanrui. 2008. “The role of productivity in China’s growth: New estimates.” Journal of Chinese Economics and Business Studies 6, no. 2: 141-156. Yao Shujie; Genfu Feng; and Chunxia Jiang. 2004. “Efficiency analysis of the Chinese commercial banks.” Economic Research Journal 39, no. 8: 4-15. Young, Alwyn. 2003. “Gold into base metals: Productivity growth in the People’s Republic of China during the reform period.” Journal of Political Economy 111, no. 1: 1220-1261. Zheng, Jinghai; Xiaxuan Liu; and Arne Bigsten. 2003. “Efficiency, technical progress, and best practice in Chinese state enterprises (1980-1994).” Journal of Comparative Economics 31, no. 1: 134-152. Zhu, Shunjin; Mingyong Lai; and Xiaolan Fu. 2008. “Spatial characteristics and dynamics of provincial total factor productivity in China.” Journal of Chinese Economic and Business Studies 6, no. 2: 197-217.
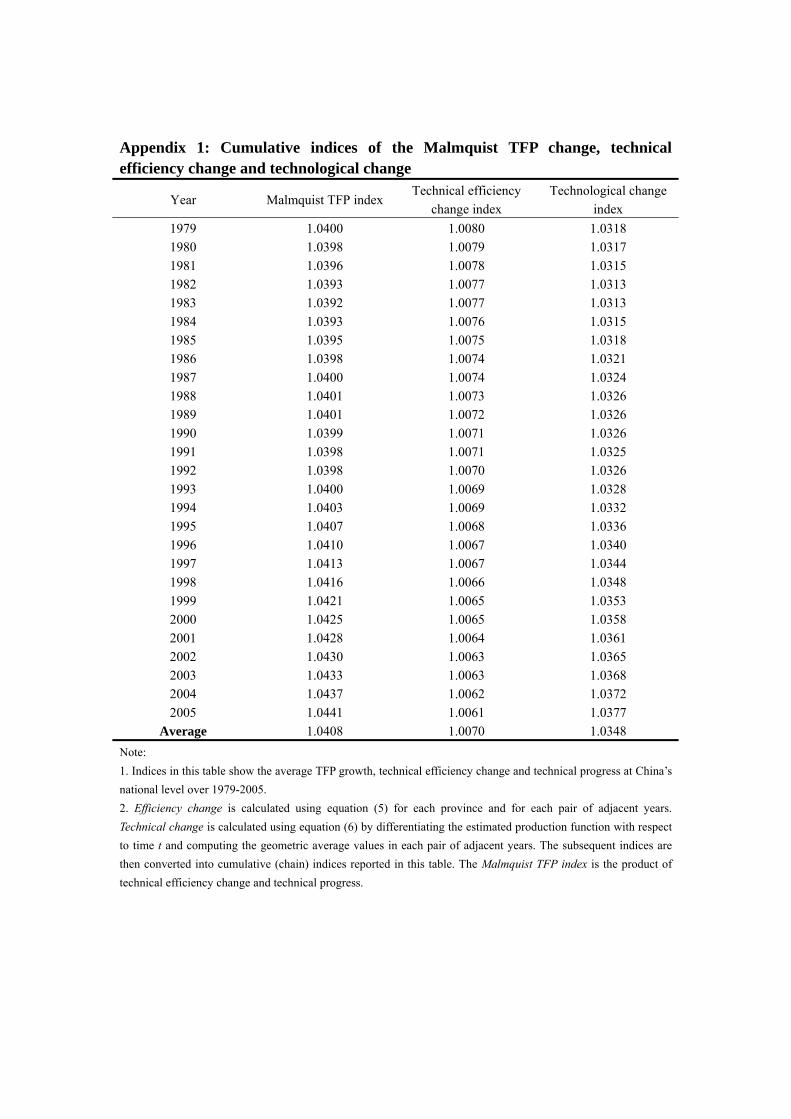
Appendix 1: Cumulative indices of the Malmquist TFP change, technical efficiency change and technological change
Year Malmquist TFP index Technical efficiency
change index Technological change
index 1979 1.0400 1.0080 1.0318 1980 1.0398 1.0079 1.0317 1981 1.0396 1.0078 1.0315 1982 1.0393 1.0077 1.0313 1983 1.0392 1.0077 1.0313 1984 1.0393 1.0076 1.0315 1985 1.0395 1.0075 1.0318 1986 1.0398 1.0074 1.0321 1987 1.0400 1.0074 1.0324 1988 1.0401 1.0073 1.0326 1989 1.0401 1.0072 1.0326 1990 1.0399 1.0071 1.0326 1991 1.0398 1.0071 1.0325 1992 1.0398 1.0070 1.0326 1993 1.0400 1.0069 1.0328 1994 1.0403 1.0069 1.0332 1995 1.0407 1.0068 1.0336 1996 1.0410 1.0067 1.0340 1997 1.0413 1.0067 1.0344 1998 1.0416 1.0066 1.0348 1999 1.0421 1.0065 1.0353 2000 1.0425 1.0065 1.0358 2001 1.0428 1.0064 1.0361 2002 1.0430 1.0063 1.0365 2003 1.0433 1.0063 1.0368 2004 1.0437 1.0062 1.0372 2005 1.0441 1.0061 1.0377
Average 1.0408 1.0070 1.0348 Note: 1. Indices in this table show the average TFP growth, technical efficiency change and technical progress at China’s national level over 1979-2005. 2. Efficiency change is calculated using equation (5) for each province and for each pair of adjacent years. Technical change is calculated using equation (6) by differentiating the estimated production function with respect to time t and computing the geometric average values in each pair of adjacent years. The subsequent indices are then converted into cumulative (chain) indices reported in this table. The Malmquist TFP index is the product of technical efficiency change and technical progress.
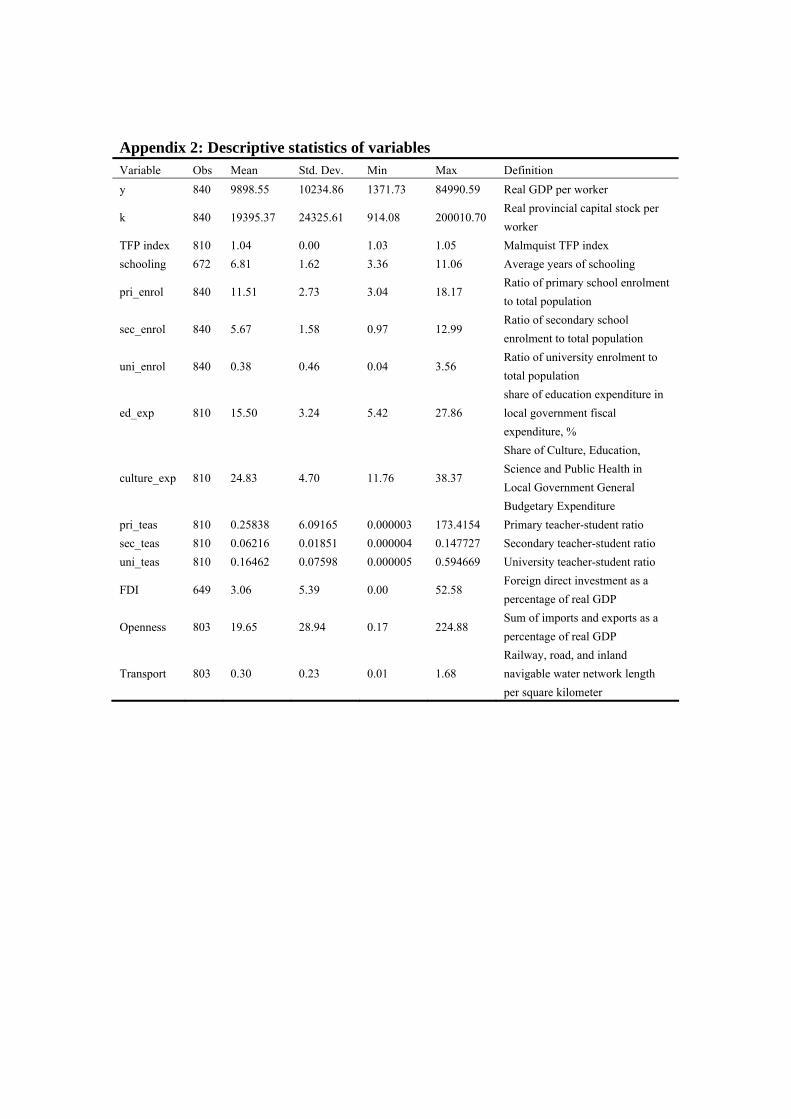
Appendix 2: Descriptive statistics of variables Variable Obs Mean Std. Dev. Min Max Definition y 840 9898.55 10234.86 1371.73 84990.59 Real GDP per worker
k 840 19395.37 24325.61 914.08 200010.70 Real provincial capital stock per worker
TFP index 810 1.04 0.00 1.03 1.05 Malmquist TFP index schooling 672 6.81 1.62 3.36 11.06 Average years of schooling
pri_enrol 840 11.51 2.73 3.04 18.17 Ratio of primary school enrolment to total population
sec_enrol 840 5.67 1.58 0.97 12.99 Ratio of secondary school enrolment to total population
uni_enrol 840 0.38 0.46 0.04 3.56 Ratio of university enrolment to total population
ed_exp 810 15.50 3.24 5.42 27.86 share of education expenditure in local government fiscal expenditure, %
culture_exp 810 24.83 4.70 11.76 38.37
Share of Culture, Education, Science and Public Health in Local Government General Budgetary Expenditure
pri_teas 810 0.25838 6.09165 0.000003 173.4154 Primary teacher-student ratio sec_teas 810 0.06216 0.01851 0.000004 0.147727 Secondary teacher-student ratio uni_teas 810 0.16462 0.07598 0.000005 0.594669 University teacher-student ratio
FDI 649 3.06 5.39 0.00 52.58 Foreign direct investment as a percentage of real GDP
Openness 803 19.65 28.94 0.17 224.88 Sum of imports and exports as a percentage of real GDP
Transport 803 0.30 0.23 0.01 1.68 Railway, road, and inland navigable water network length per square kilometer

Table 1: Sources of education expenditure
Year
Total education expenditure (100
million RMB Yuan)
Share of total education
expenditure in GDP (%)
Government appropriation for education
(%)
Social funds for education
(%)
Tuition and miscellaneous
fees (%)
1992 867.0 3.22 84.0 10.9 5.1 1993 1059.9 3.00 81.9 9.9 8.2 1994 1488.8 3.09 78.9 11.2 9.9 1995 1878.0 3.09 75.2 14.1 10.7 1996 2262.3 3.18 73.9 14.6 11.5 1997 2531.7 3.21 73.6 13.6 12.9 1998 2949.1 3.49 68.9 18.5 12.5 1999 3349.0 3.73 68.3 17.9 13.8 2000 3849.1 3.88 66.6 18.0 15.5 2001 4637.7 4.23 65.9 18.0 16.1 2002 5480.0 4.55 63.7 19.4 16.8 2003 6208.3 4.57 62.0 19.9 18.1 2004 7242.6 4.53 61.7 19.7 18.6 2005 8418.8 4.58 61.3 20.2 18.4
Notes: Social funds for education include funds from social organisations and citizens for running schools, donations and fund raising for running schools and other educational funds. Source: Authors’ calculation based on China Statistical Yearbook (NBS, 2007).

Table 2: Estimation results of the stochastic frontier production function Dependent variables: log of annual GDP per worker (lny) Variables Coefficient Reg 1 Reg 2 Reg 3 Reg 4 Reg 5
Constant β0 0.838 (1.19)
1.292*** (25.09)
0.677*** (15.51)
1.02*** (23.09)
1.191*** (23.31)
lnk βK 0.301 (0.37)
0.319*** (16.99)
0.503*** (14.62)
0.42*** (24.27)
0.325*** (16.36)
t βt 0.036 (0.46)
0.022*** (9.40)
0.025*** (3.34)
0.040*** (15.33)
0.029*** (7.81)
(lnk)2 βKK 0.054 (0.19)
(lnk) t βKt -0.009 (-0.18)
0.007*** (7.74)
0.002** (2.41)
0.005*** (4.34)
t2 βtt 0.001 (0.37)
-0.0002** (-2.16)
-0.000 (-0.71)
mu μ 0.037 (0.04)
0.545*** (6.86)
-0.405* (-1.75)
0.586*** (9.05)
eta η 0.004 (0.09)
0.009*** (5.38)
0.009 (1.01)
0.001 (0.36)
0.004 (1.30)
Parameters
Sigma-squared 0.136
(0.26) 0.084***
(7.09) 0.160***
(2.82) 0.097***
(9.95) 0.497***
(3.33)
Gamma (γ) 0.920
(1.29) 0.882*** (81.54)
0.925*** (17.26)
0.888*** (121.48)
0.979*** (155.33)
log likelihood 608.87 653.25 582.20 619.77 648.21 No. of observation 840 840 840 840 840 Tests Tests for technical inefficiency effects a H0: γ=0 1.11 -5.31 -32.00 -48.366 -5.31 H0: γ>0 1215.51 1317.12 1228.41 1336.279 1307.03 No. of restrictions 3 3 3 3 2 LR test statistics # 2428.78*** 2644.85*** 2520.83*** 2769.29*** 2624.67*** Result of test Reject H0 Reject H0 Reject H0 Reject H0 Reject H0 Tests for model specification b H0 Reg 3 Reg 4 Reg 5 H1 Reg 2 Reg 2 Reg 2 No. of restrictions 1 2 1 LR test statistics 142.09*** 66.96*** 10.09*** Result of test Reject H0 Reject H0 Reject H0 In support of Reg 2 Reg 2 Reg 2
Notes: Figures in parentheses are t-statistics. Variable definitions are displayed in Appendix 2. *** significance at the 1% level, ** significant at the 5% level, * significant at the 10% level. a : This test is to test for the existence of the technical inefficiency effect in the model. # : The LR test applied is the one-sided generalised likelihood-ratio test with its statistic asymptotically distributed as a mixture of chi-square distributions. The critical values can be found in Table 1 of Kodde and Palm (1986). b : This test is used to select the suitable specification of the model. The LR statistic follows the standard chi-square distributions.
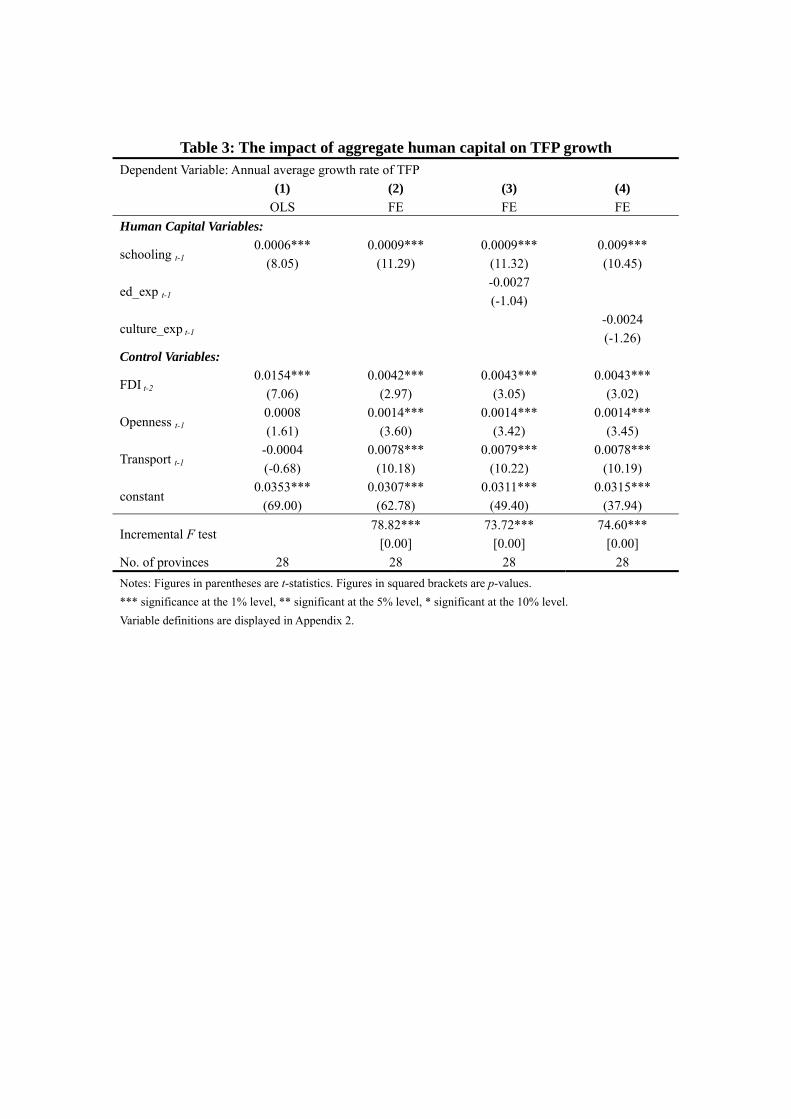
Table 3: The impact of aggregate human capital on TFP growth Dependent Variable: Annual average growth rate of TFP (1) (2) (3) (4)
OLS FE FE FE Human Capital Variables:
schooling t-1 0.0006***
(8.05) 0.0009***
(11.29) 0.0009***
(11.32) 0.009*** (10.45)
ed_exp t-1
-0.0027 (-1.04)
culture_exp t-1
-0.0024 (-1.26)
Control Variables:
FDI t-2 0.0154***
(7.06) 0.0042***
(2.97) 0.0043***
(3.05) 0.0043***
(3.02)
Openness t-1 0.0008 (1.61)
0.0014*** (3.60)
0.0014*** (3.42)
0.0014*** (3.45)
Transport t-1 -0.0004 (-0.68)
0.0078*** (10.18)
0.0079*** (10.22)
0.0078*** (10.19)
constant 0.0353***
(69.00) 0.0307***
(62.78) 0.0311***
(49.40) 0.0315***
(37.94)
Incremental F test 78.82***
[0.00] 73.72***
[0.00] 74.60***
[0.00] No. of provinces 28 28 28 28 Notes: Figures in parentheses are t-statistics. Figures in squared brackets are p-values. *** significance at the 1% level, ** significant at the 5% level, * significant at the 10% level. Variable definitions are displayed in Appendix 2.
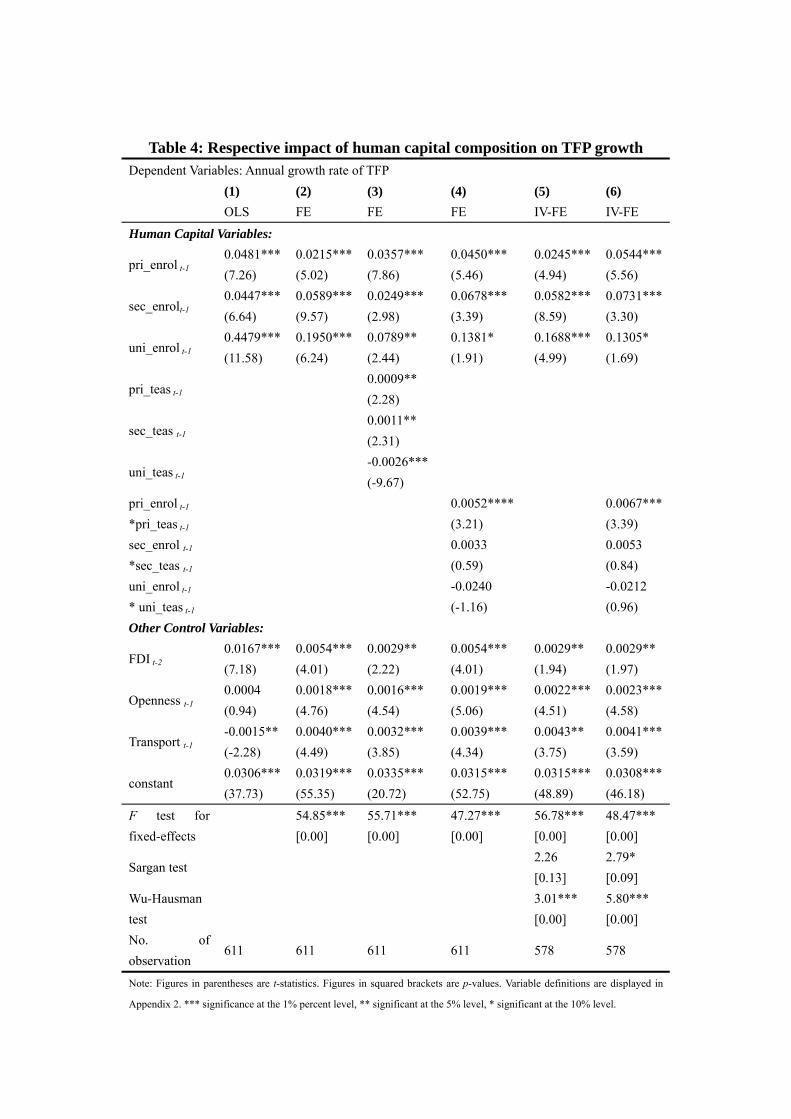
Table 4: Respective impact of human capital composition on TFP growth Dependent Variables: Annual growth rate of TFP (1) (2) (3) (4) (5) (6) OLS FE FE FE IV-FE IV-FE
Human Capital Variables:
pri_enrol t-1 0.0481*** (7.26)
0.0215***(5.02)
0.0357*** (7.86)
0.0450*** (5.46)
0.0245*** (4.94)
0.0544***(5.56)
sec_enrolt-1 0.0447*** (6.64)
0.0589***(9.57)
0.0249*** (2.98)
0.0678*** (3.39)
0.0582*** (8.59)
0.0731***(3.30)
uni_enrol t-1 0.4479*** (11.58)
0.1950***(6.24)
0.0789** (2.44)
0.1381* (1.91)
0.1688*** (4.99)
0.1305* (1.69)
pri_teas t-1 0.0009** (2.28)
sec_teas t-1 0.0011** (2.31)
uni_teas t-1 -0.0026*** (-9.67)
pri_enrol t-1
*pri_teas t-1
0.0052**** (3.21)
0.0067***(3.39)
sec_enrol t-1 *sec_teas t-1
0.0033 (0.59)
0.0053 (0.84)
uni_enrol t-1 * uni_teas t-1
-0.0240 (-1.16)
-0.0212 (0.96)
Other Control Variables:
FDI t-2 0.0167*** (7.18)
0.0054***(4.01)
0.0029** (2.22)
0.0054*** (4.01)
0.0029** (1.94)
0.0029** (1.97)
Openness t-1 0.0004 (0.94)
0.0018***(4.76)
0.0016*** (4.54)
0.0019*** (5.06)
0.0022*** (4.51)
0.0023***(4.58)
Transport t-1 -0.0015** (-2.28)
0.0040***(4.49)
0.0032*** (3.85)
0.0039*** (4.34)
0.0043** (3.75)
0.0041***(3.59)
constant 0.0306*** (37.73)
0.0319***(55.35)
0.0335*** (20.72)
0.0315*** (52.75)
0.0315*** (48.89)
0.0308***(46.18)
F test for fixed-effects
54.85*** [0.00]
55.71*** [0.00]
47.27*** [0.00]
56.78*** [0.00]
48.47*** [0.00]
Sargan test 2.26 [0.13]
2.79* [0.09]
Wu-Hausman test
3.01*** [0.00]
5.80*** [0.00]
No. of observation
611 611 611 611 578 578
Note: Figures in parentheses are t-statistics. Figures in squared brackets are p-values. Variable definitions are displayed in
Appendix 2. *** significance at the 1% percent level, ** significant at the 5% level, * significant at the 10% level.
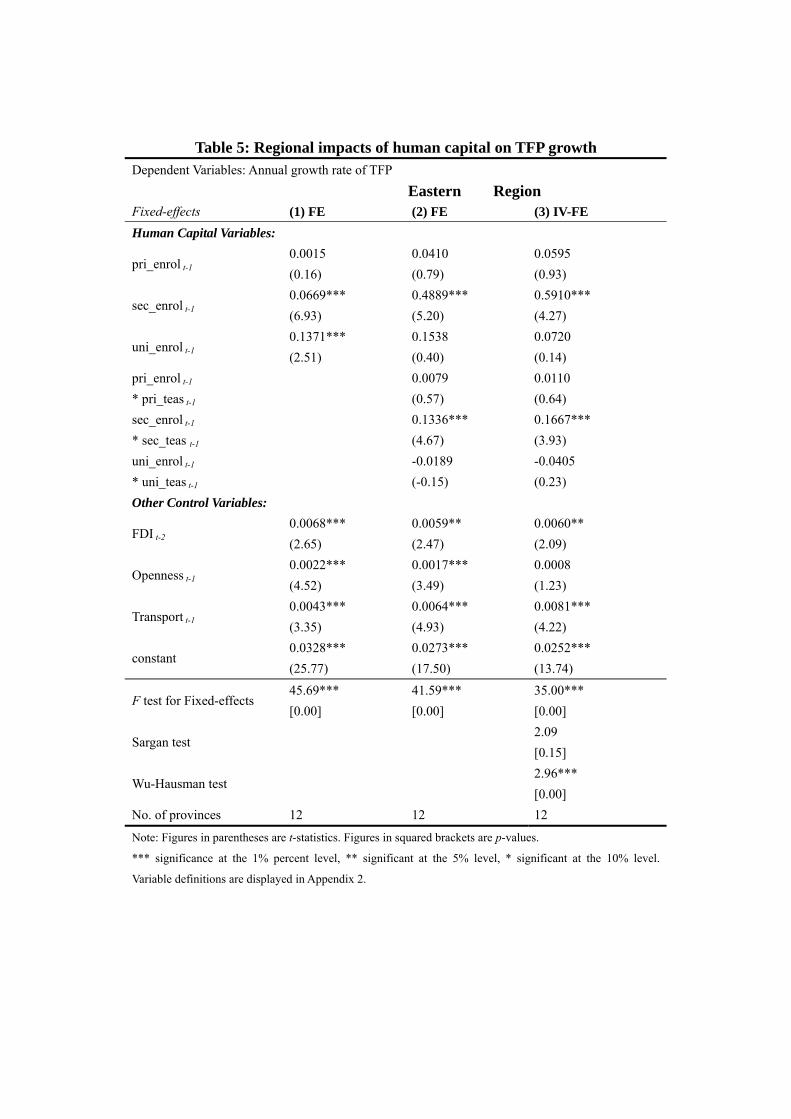
Table 5: Regional impacts of human capital on TFP growth Dependent Variables: Annual growth rate of TFP Eastern Region Fixed-effects (1) FE (2) FE (3) IV-FE Human Capital Variables:
pri_enrol t-1 0.0015 (0.16)
0.0410 (0.79)
0.0595 (0.93)
sec_enrol t-1 0.0669*** (6.93)
0.4889*** (5.20)
0.5910*** (4.27)
uni_enrol t-1 0.1371*** (2.51)
0.1538 (0.40)
0.0720 (0.14)
pri_enrol t-1
* pri_teas t-1
0.0079 (0.57)
0.0110 (0.64)
sec_enrol t-1
* sec_teas t-1
0.1336*** (4.67)
0.1667*** (3.93)
uni_enrol t-1
* uni_teas t-1
-0.0189 (-0.15)
-0.0405 (0.23)
Other Control Variables:
FDI t-2 0.0068*** (2.65)
0.0059** (2.47)
0.0060** (2.09)
Openness t-1 0.0022*** (4.52)
0.0017*** (3.49)
0.0008 (1.23)
Transport t-1 0.0043*** (3.35)
0.0064*** (4.93)
0.0081*** (4.22)
constant 0.0328*** (25.77)
0.0273*** (17.50)
0.0252*** (13.74)
F test for Fixed-effects 45.69*** [0.00]
41.59*** [0.00]
35.00*** [0.00]
Sargan test 2.09 [0.15]
Wu-Hausman test 2.96*** [0.00]
No. of provinces 12 12 12
Note: Figures in parentheses are t-statistics. Figures in squared brackets are p-values.
*** significance at the 1% percent level, ** significant at the 5% level, * significant at the 10% level.
Variable definitions are displayed in Appendix 2.
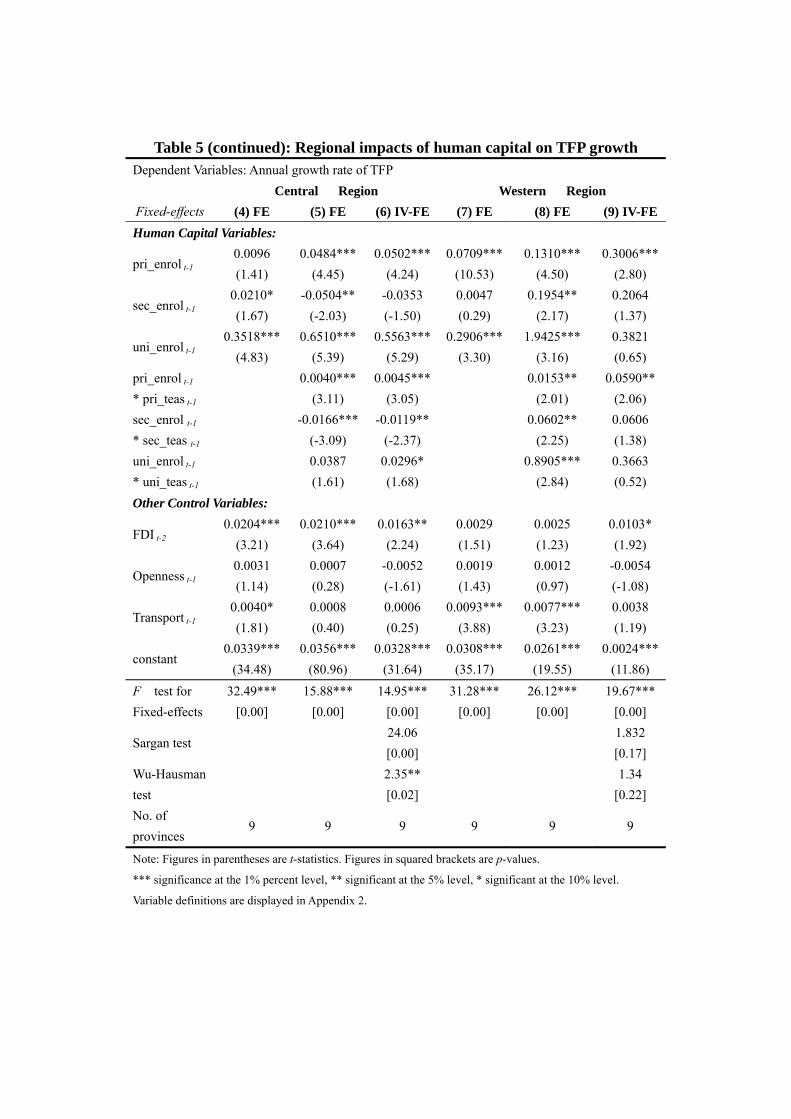
Table 5 (continued): Regional impacts of human capital on TFP growth Dependent Variables: Annual growth rate of TFP Central Region Western Region Fixed-effects (4) FE (5) FE (6) IV-FE (7) FE (8) FE (9) IV-FEHuman Capital Variables:
pri_enrol t-1 0.0096 (1.41)
0.0484***(4.45)
0.0502***(4.24)
0.0709***(10.53)
0.1310*** (4.50)
0.3006***(2.80)
sec_enrol t-1 0.0210* (1.67)
-0.0504**(-2.03)
-0.0353 (-1.50)
0.0047 (0.29)
0.1954** (2.17)
0.2064 (1.37)
uni_enrol t-1 0.3518***
(4.83) 0.6510***
(5.39) 0.5563***
(5.29) 0.2906***
(3.30) 1.9425***
(3.16) 0.3821 (0.65)
pri_enrol t-1
* pri_teas t-1
0.0040***(3.11)
0.0045***(3.05)
0.0153**
(2.01) 0.0590**
(2.06) sec_enrol t-1
* sec_teas t-1
-0.0166***(-3.09)
-0.0119**(-2.37)
0.0602**
(2.25) 0.0606 (1.38)
uni_enrol t-1
* uni_teas t-1
0.0387 (1.61)
0.0296* (1.68)
0.8905***
(2.84) 0.3663 (0.52)
Other Control Variables:
FDI t-2 0.0204***
(3.21) 0.0210***
(3.64) 0.0163**
(2.24) 0.0029 (1.51)
0.0025 (1.23)
0.0103* (1.92)
Openness t-1 0.0031 (1.14)
0.0007 (0.28)
-0.0052 (-1.61)
0.0019 (1.43)
0.0012 (0.97)
-0.0054 (-1.08)
Transport t-1 0.0040* (1.81)
0.0008 (0.40)
0.0006 (0.25)
0.0093***(3.88)
0.0077*** (3.23)
0.0038 (1.19)
constant 0.0339***
(34.48) 0.0356***
(80.96) 0.0328***
(31.64) 0.0308***
(35.17) 0.0261***
(19.55) 0.0024***
(11.86) F test for Fixed-effects
32.49*** [0.00]
15.88*** [0.00]
14.95***[0.00]
31.28***[0.00]
26.12*** [0.00]
19.67***[0.00]
Sargan test 24.06 [0.00]
1.832 [0.17]
Wu-Hausman test
2.35** [0.02]
1.34
[0.22] No. of provinces
9 9 9 9 9 9
Note: Figures in parentheses are t-statistics. Figures in squared brackets are p-values.
*** significance at the 1% percent level, ** significant at the 5% level, * significant at the 10% level.
Variable definitions are displayed in Appendix 2.

Table 6: Summary of estimated results of Table 5 when enrolment ratios are included in estimations
when education quality is also included in estimations
columns (1), (4), (7) columns (2) (3), (5) (6), (8) (9) Regions enrolment rates enrolment rates education qualityEastern Region secondary (+)*
university (+)* secondary (+)* secondary (+)*
Central Region secondary (+)* university (+)*
primary (+)* university (+)* secondary (-)*
in IV-FE: secondary (-)*
primary (+)*university (+)*secondary (-)*
in IV-FE: secondary (-)*
Western Region primary (+)* university (+)*
primary (+)* university (+)* secondary (+)*
in IV-FE: primary (+)*
primary (+)*university (+)*secondary (+)*
in IV-FE: primary (+)*
National (Table 4)
primary (+)* university (+)* secondary (+)*
primary (+)* university (+)* secondary (+)*
primary (+)*
Note: * denotes the significance of the variable at least at 10% level.
(+) indicates the estimated coefficient is positive, while (-) indicates the estimated coefficient is negative.
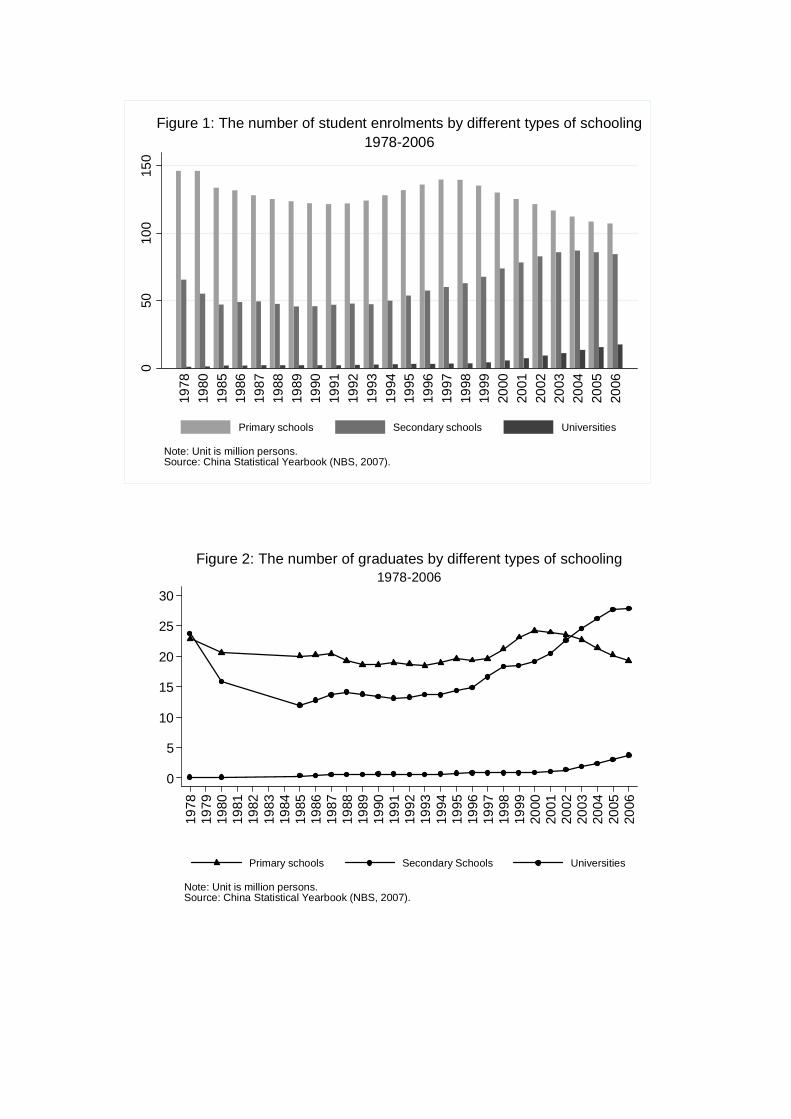
050
100
150
1978
1980
1985
1986
1987
1988
1989
1990
1991
1992
1993
1994
1995
1996
1997
1998
1999
2000
2001
2002
2003
2004
2005
2006
Note: Unit is million persons.Source: China Statistical Yearbook (NBS, 2007).
1978-2006Figure 1: The number of student enrolments by different types of schooling
Primary schools Secondary schools Universities
0
5
10
15
20
25
30
1978
1979
1980
1981
1982
1983
1984
1985
1986
1987
1988
1989
1990
1991
1992
1993
1994
1995
1996
1997
1998
1999
2000
2001
2002
2003
2004
2005
2006
Primary schools Secondary Schools Universities
Note: Unit is million persons.Source: China Statistical Yearbook (NBS, 2007).
1978-2006Figure 2: The number of graduates by different types of schooling

0.0
5.1
.15
.2.2
5
1978
1980
1985
1986
1987
1988
1989
1990
1991
1992
1993
1994
1995
1996
1997
1998
1999
2000
2001
2002
2003
2004
2005
2006
Source: China Statistical Yearbook (NBS, 2007).
1978-2006Figure 3: Teacher-student ratios by different types of schooling
Teacher-student ratios of primary schools
Teacher-student ratios of secondary schools
Teacher-student ratios of universities
020
040
060
080
0
1978
1980
1982
1984
1986
1988
1990
1992
1994
1996
1998
2000
2002
2004
2006
Nominal termReal terms
Government expenditure on cultural,education, science and public health
020
040
060
080
0
1978
1980
1982
1984
1986
1988
1990
1992
1994
1996
1998
2000
2002
2004
2006
Nominal termReal terms
Government appropriationfor education
Note: Unit is billion RMB. Price deflator is Consumer Price Index (base year = 1995)Source: China Statistical Yearbook (NBS, 2007).
1978-2006Figure 4: Government expenditure and appropriation on education

1
1.01
1.02
1.03
1.04
1.05
1979
1981
1983
1985
1987
1989
1991
1993
1995
1997
1999
2001
2003
2005
Malmquist TFP index Technical efficiency change index
Technological change index
Source: Author's calculation.
1979-2005Figure 5: The Malmquist TFP index for China
1.034
1.036
1.038
1.04
1.042
1.044
1.046
1979
1981
1983
1985
1987
1989
1991
1993
1995
1997
1999
2001
2003
2005
National TFP index Coastal TFP index
Central TFP index Western TFP index
Source: Author's calculation.
1979-2005Figure 6: The Malmquist TFP index for China's regions


![clImBInG cHIna’s GReat Wall of WoRRy …[2] clImBInG cHIna’s GReat Wall of WoRRy Summary China’s economic growth model is looking out of date, debt is piling up and capital outflows](https://img.pdfslide.net/doc/110x75/5f7c80fd2692473c592e2f3e/climbing-chinaas-great-wall-of-worry-2-climbing-chinaas-great-wall-of-worry.jpg)